Embed Size (px)
Citation preview

VOLUNTEERISM:The Spark for Sustainable Social
Impact
Maren SymondsMarch 8, 2013
Topics for Discussion
What is happening with Oregon’s young children?
What can we expect in the future?
Why does volunteerism matter?
Why should we care about Boomers?
Oregon’s Young Children
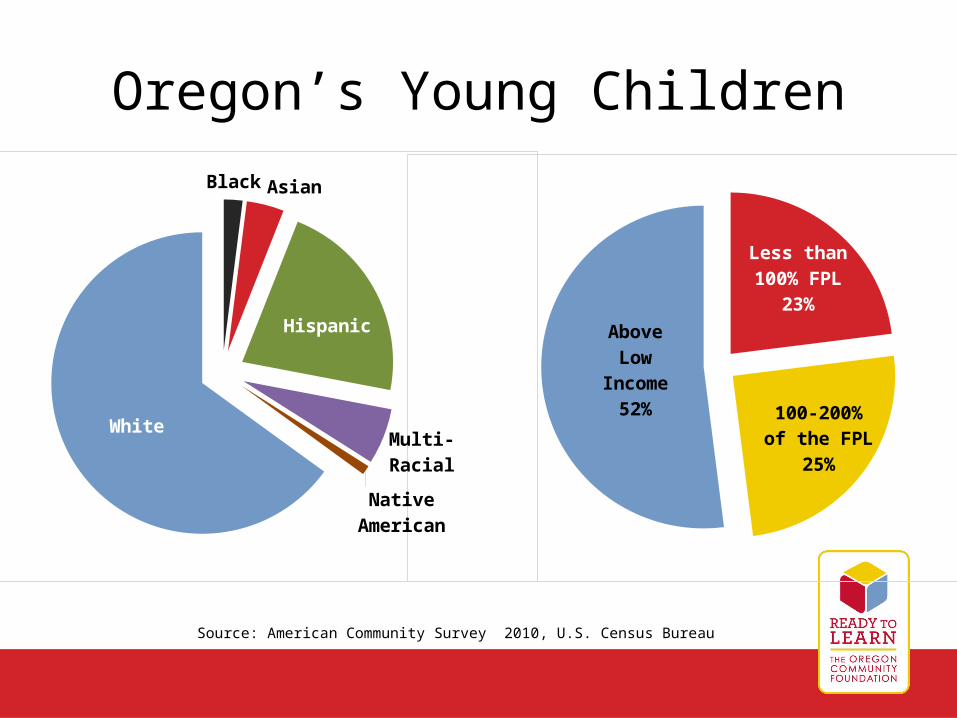
Oregon’s Young Children
Less than100% FPL
23%
100-200%of the FPL
25%
AboveLow
Income52%
Black Asian
Hispanic
Multi-Racial
Native American
White
Source: American Community Survey 2010, U.S. Census Bureau

Oregon’s Young Children at Risk
• 239K children under age 5– 143K have risk factors– 95K may face challenges
with school readiness*
• 5,600+ confirmed reports of child abuse, age 0-5– 10 fatalities
• 5,025 young children placed in foster care
Exposure to Risk Factors AmongYoung Children in Oregon
Source: National Center forChildren in Poverty, 2010
0 Risks40%
3+ Risks18%
1-2 Risks42%
* Source: Oregon Early Learning Council
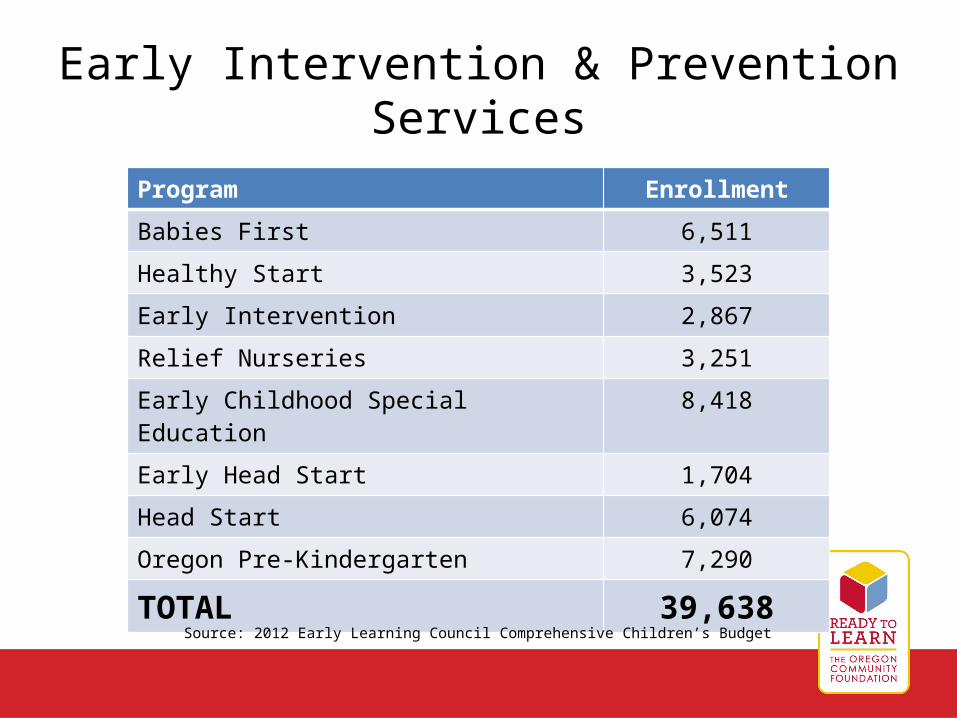
Early Intervention & Prevention Services
Program Enrollment
Babies First 6,511
Healthy Start 3,523
Early Intervention 2,867
Relief Nurseries 3,251
Early Childhood Special Education 8,418
Early Head Start 1,704
Head Start 6,074
Oregon Pre-Kindergarten 7,290
TOTAL 39,638
Source: 2012 Early Learning Council Comprehensive Children’s Budget
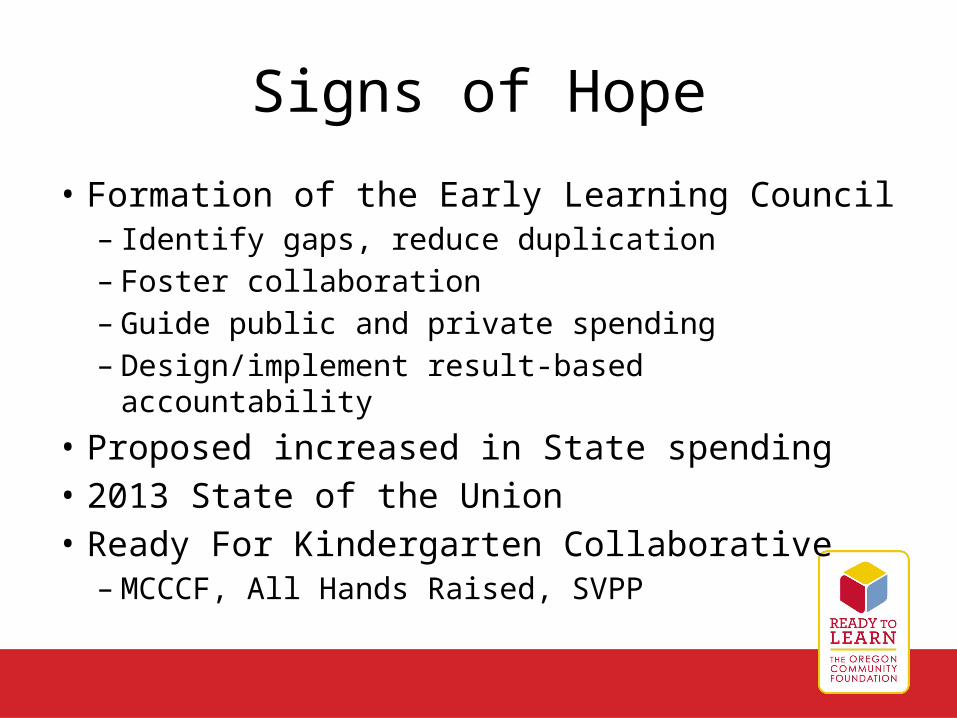
Signs of Hope
• Formation of the Early Learning Council– Identify gaps, reduce duplication– Foster collaboration– Guide public and private spending– Design/implement result-based accountability
• Proposed increased in State spending• 2013 State of the Union• Ready For Kindergarten Collaborative
– MCCCF, All Hands Raised, SVPP
The Future

Modest Population Growth: Ages 0-17
2000
2001
2002
2003
2004
2005
2006
2007
2008
2009
2010
2011
2012
2013
2014
2015
2016
2017
2018
2019
2020
0
200,000
400,000
600,000
800,000
1,000,000
Ages 0-4 Ages 5-17
Source: State of Oregon, Office of Economic Analysis
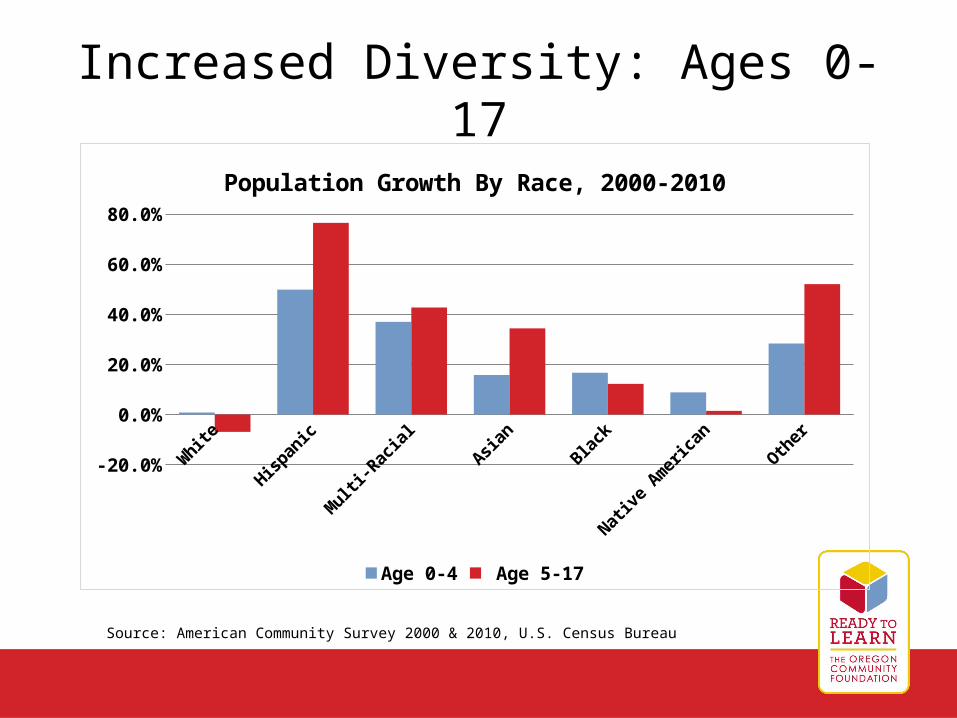
Increased Diversity: Ages 0-17
Source: American Community Survey 2000 & 2010, U.S. Census Bureau
Whi
te
Hispa
nic
Mul
ti-Rac
ial
Asian
Black
Native
Amer
ican
Other
-20.0%
0.0%
20.0%
40.0%
60.0%
80.0%
Population Growth By Race, 2000-2010
Age 0-4 Age 5-17
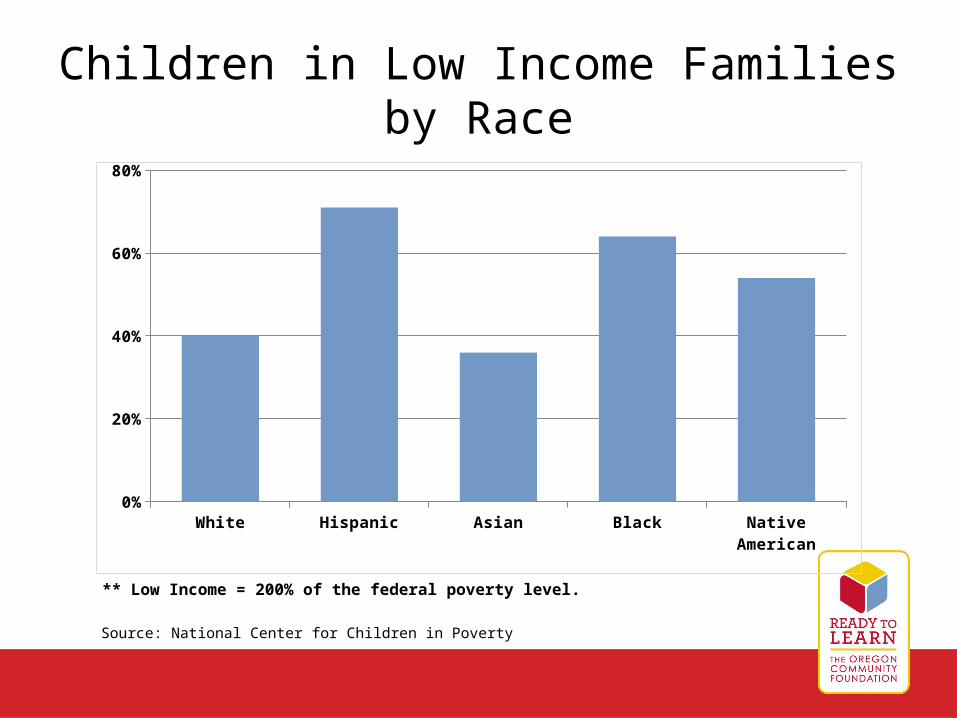
Children in Low Income Families by Race
White Hispanic Asian Black Native American0%
20%
40%
60%
80%
Source: National Center for Children in Poverty
** Low Income = 200% of the federal poverty level.
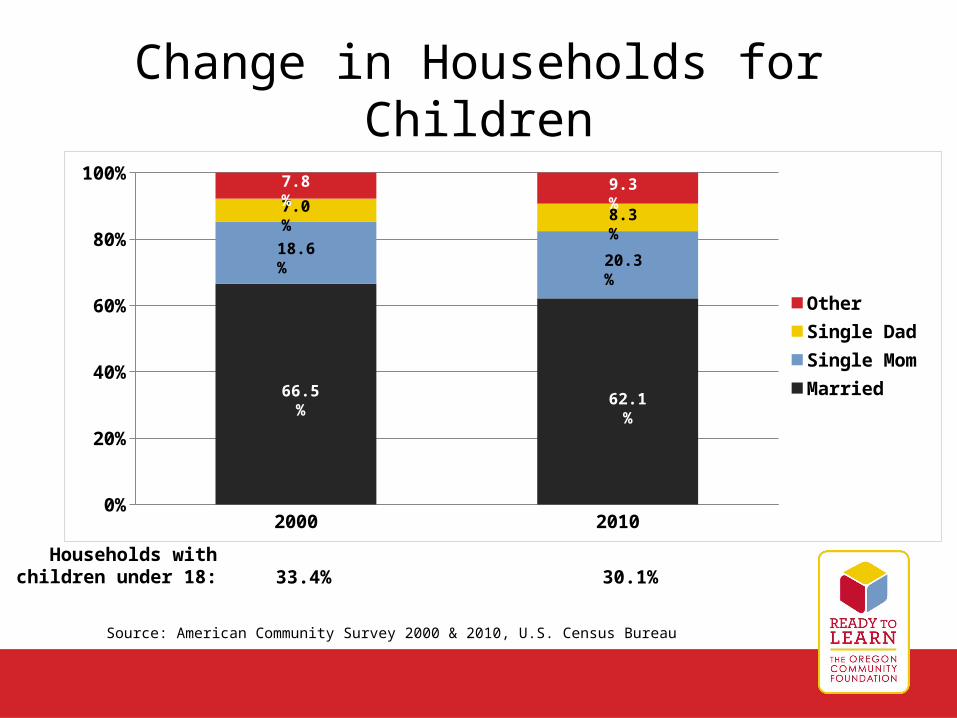
Change in Households for Children
2000 20100%
20%
40%
60%
80%
100%
OtherSingle DadSingle Mom66.5%
18.6%
7.0%
7.8%
62.1%
20.3%
8.3%
9.3%
Source: American Community Survey 2000 & 2010, U.S. Census Bureau
33.4% 30.1%Households with
children under 18:
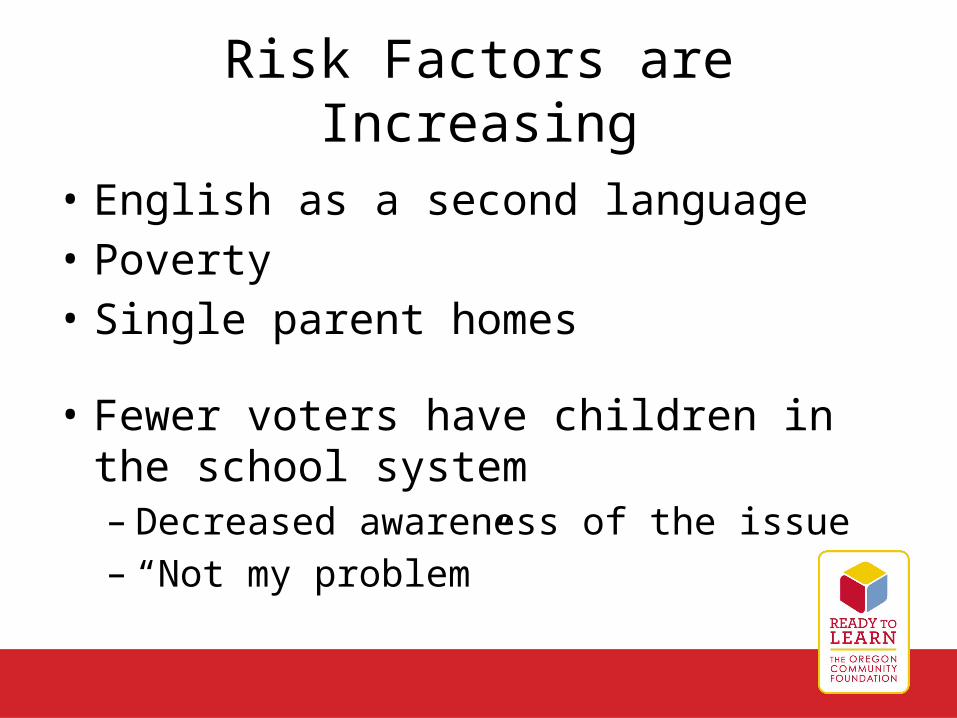
Risk Factors are Increasing
• English as a second language• Poverty• Single parent homes
• Fewer voters have children in the school system– Decreased awareness of the issue– “Not my problem”
Why Volunteerism Matters
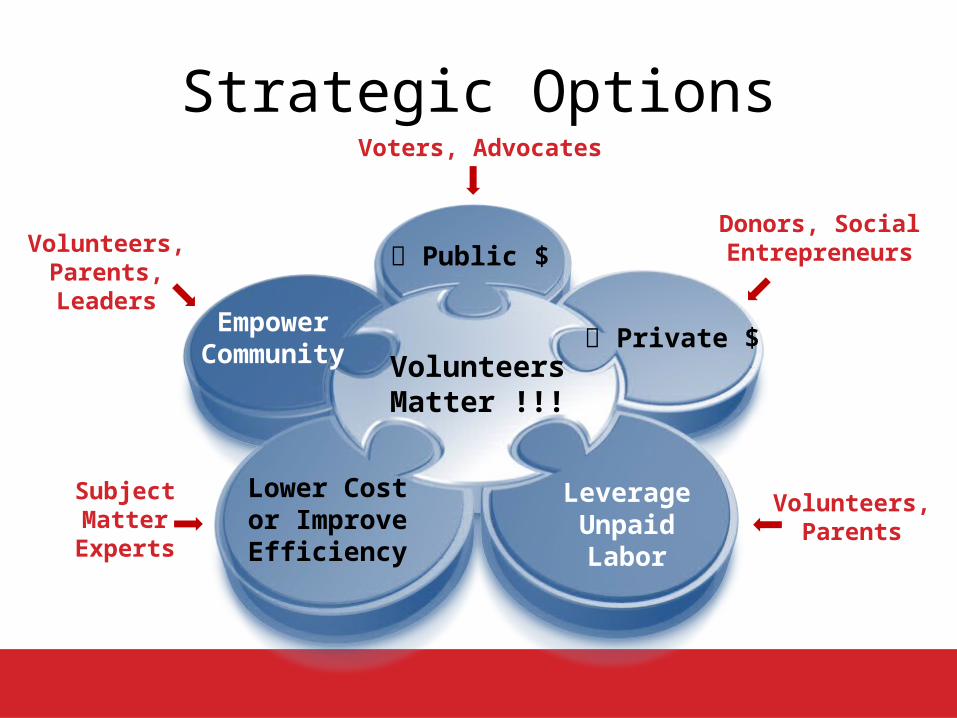
Strategic Options
VolunteersMatter !!!
LeverageUnpaidLabor
Lower Costor ImproveEfficiency
Private $Empower
Community
Public $
Voters, Advocates
Donors, SocialEntrepreneursVolunteers,
Parents,Leaders
SubjectMatter
Experts
Volunteers,Parents

Case Study: Public $
• Washington County– Large population of children; 40% in
poverty– Explored potential for children’s levy,
but…• May 2011: PDX as only ESD of 10 to pass levy• Nov 2011: BSD local option levy failed
• Parent advocacy is NOT enough– Only 36% of Washington County
households have children under 18

Case Study: Private $
Family Building Blocksvolunteer-supported fundraising• 3 major events
– October luncheon– March luncheon– May wine auction
• Reruns for Kids• Auxiliary• Net contribution
= $600,000+
Federal
State
Private
Sources of Funding
contri
butes
to

Case Study: Volunteerism
FAMILY BUILDING BLOCKS(excluding fundraising)
ACTIVITY MARKET VALUATION
Classrooms* $ 116,406
College & Graduate Student Interns* $ 65,633
Administrative Support $ 10,630
Work Crews $ 5,016
High School Interns $ 3,406
TOTAL (excluding fundraising) $ 201,091
* $36,299 of these amounts was applied to a matching fund requirement for FBB’s Early Head Start grant.

Volunteer-SupportedFundraising
VolunteerManagement
Cost
VolunteerLabor
(Operations)
Case Study: Volunteerism
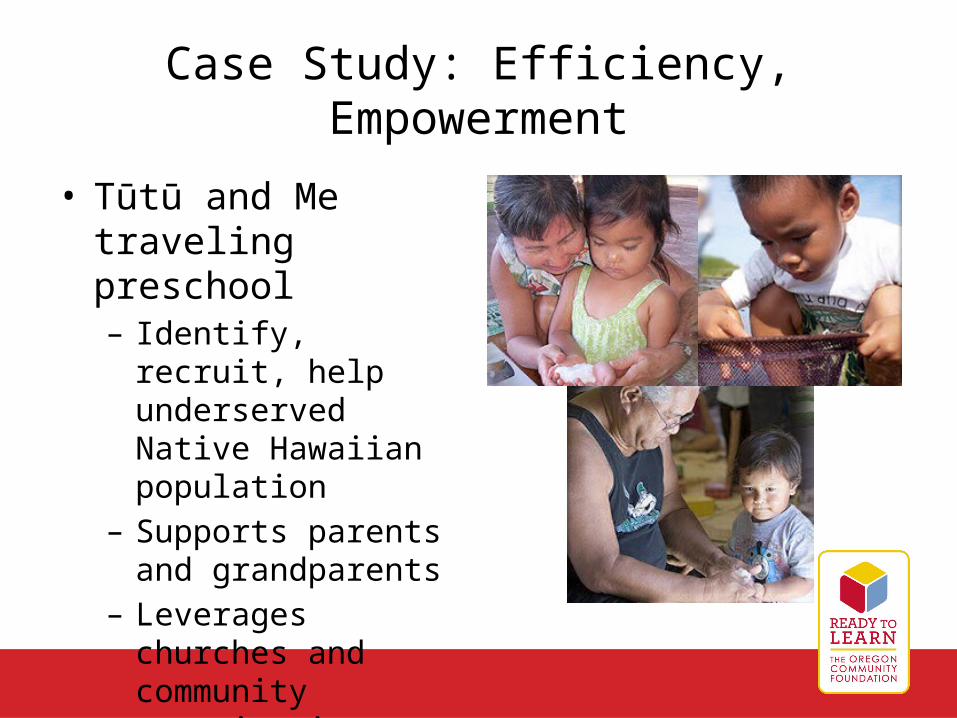
Case Study: Efficiency, Empowerment
• Tūtū and Me traveling preschool– Identify, recruit, help
underserved Native Hawaiian population
– Supports parents and grandparents
– Leverages churches and community organizations
Why Boomers Matter
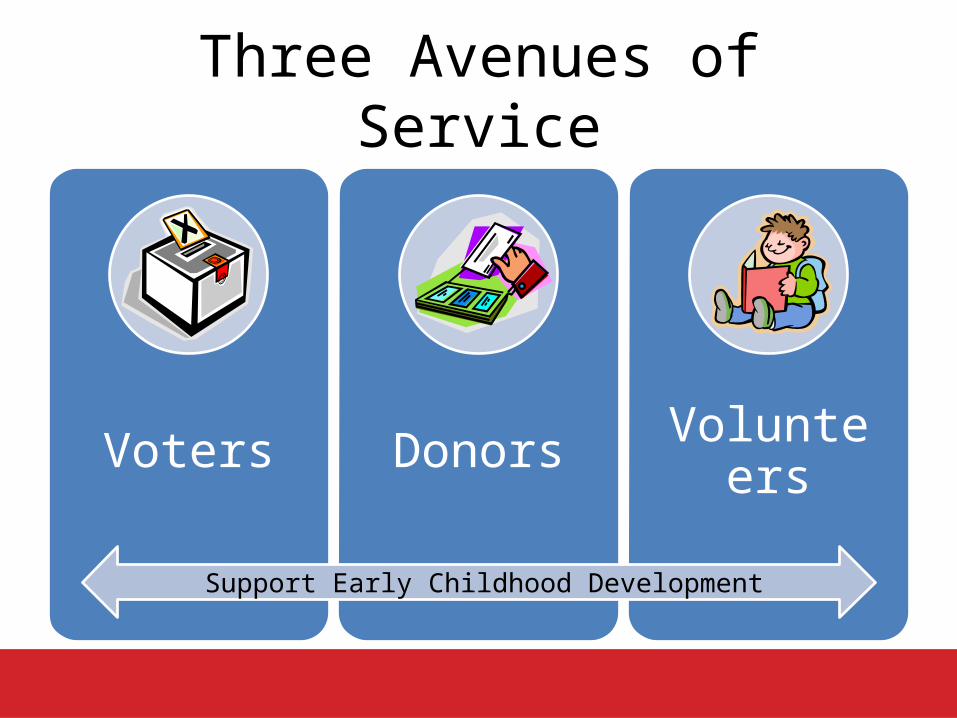
Three Avenues of Service
Voters Donors Volunteers
Support Early Childhood Development
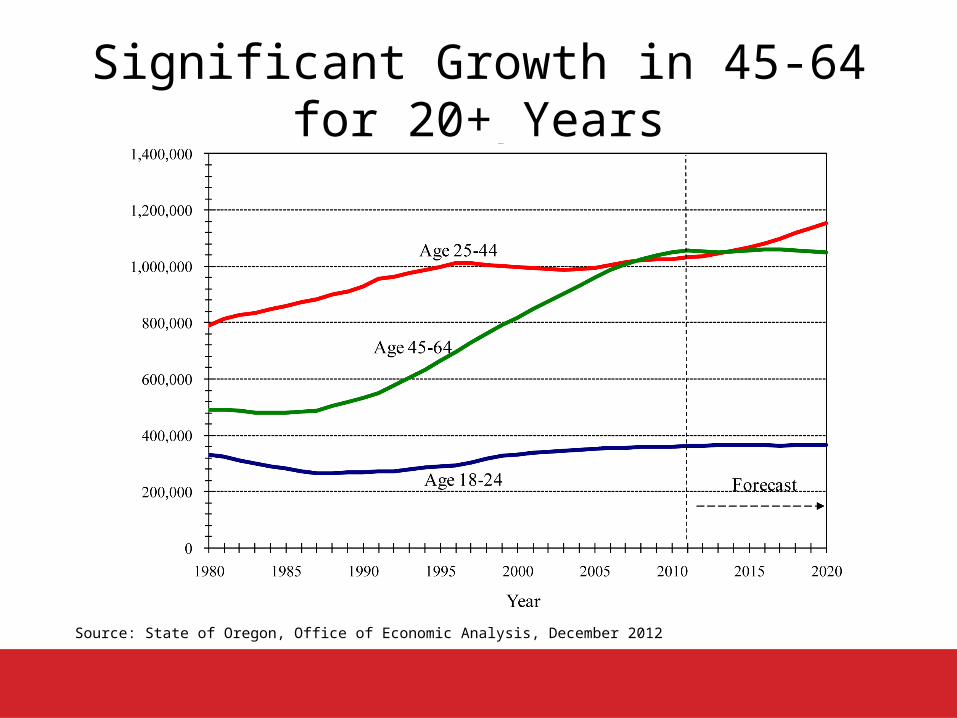
Significant Growth in 45-64 for 20+ Years
Source: State of Oregon, Office of Economic Analysis, December 2012
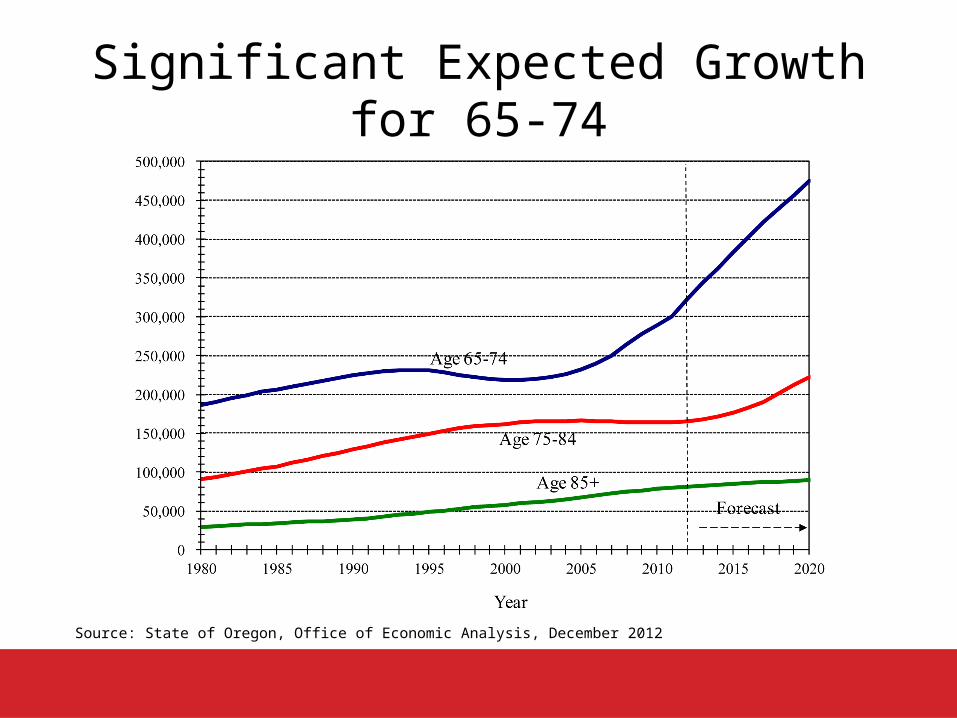
Significant Expected Growth for 65-74
Source: State of Oregon, Office of Economic Analysis, December 2012

Promote Grass Roots Advocacy
• Develop messaging for each generational cohort
• Educate and engage community leaders
• Equip employees, donors, volunteers to serve as advocates
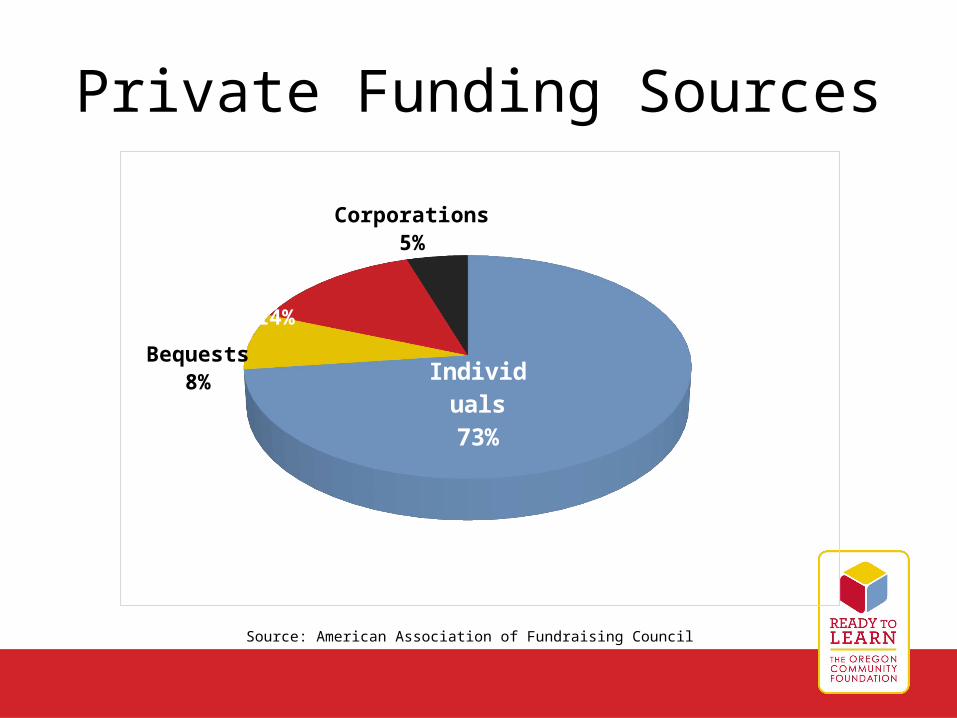
Private Funding Sources
Indi-viduals
73%
Bequests8%
Foun-dations
14%
Corporations5%
Source: American Association of Fundraising Council
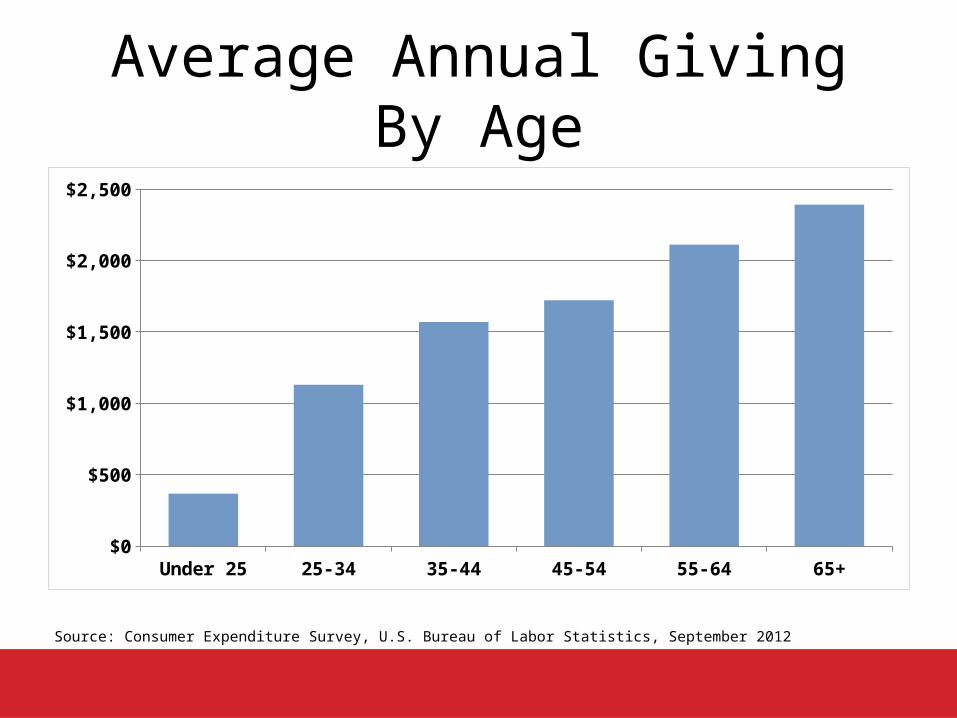
Average Annual Giving By Age
Under 25 25-34 35-44 45-54 55-64 65+$0
$500
$1,000
$1,500
$2,000
$2,500
Source: Consumer Expenditure Survey, U.S. Bureau of Labor Statistics, September 2012
Volunteerism and Charitable Giving
• 2009 Survey of 1,005 individuals– Participants
• Average age: 45• Average household income: $60,000
– Findings• Volunteerism increases with age, education,
and income• Active volunteers gave 10x more to charities
that non-volunteers• Two-thirds of active volunteers donate where
they volunteer

Mean Inheritance for All Boomers(by wealth decile)
1 2 3 4 5 6 7 8 9 100
200
400
600
800
1000
1200
Average lifetime inheritance
60%
50%
40%
30%
20%
10%
0%
Inheritance as a percent of wealth
Source: MetLife Mature Market Institute, December 2010
Th
ou
sa
nd
s o
f (2
00
9)
do
lla
rs
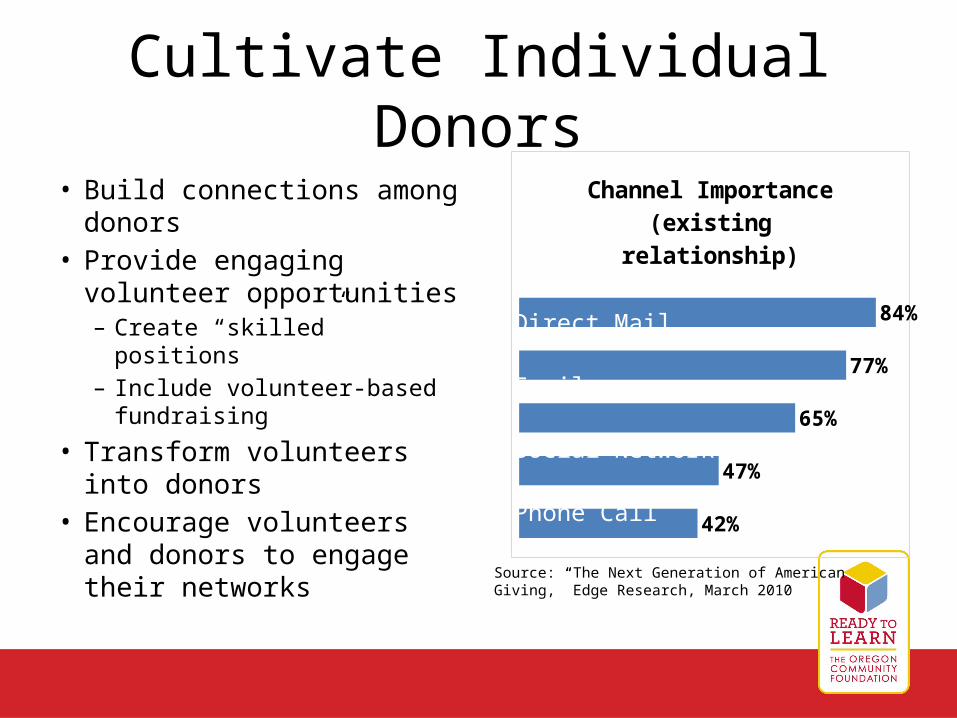
Cultivate Individual Donors
• Build connections among donors
• Provide engaging volunteer opportunities– Create “skilled” positions– Include volunteer-based
fundraising
• Transform volunteers into donors
• Encourage volunteers and donors to engage their networks
Source: “The Next Generation of AmericanGiving,” Edge Research, March 2010
42%
47%
65%
77%
84%
Channel Importance(existing relationship)
Friend
Direct Mail
Social Network
Phone Call
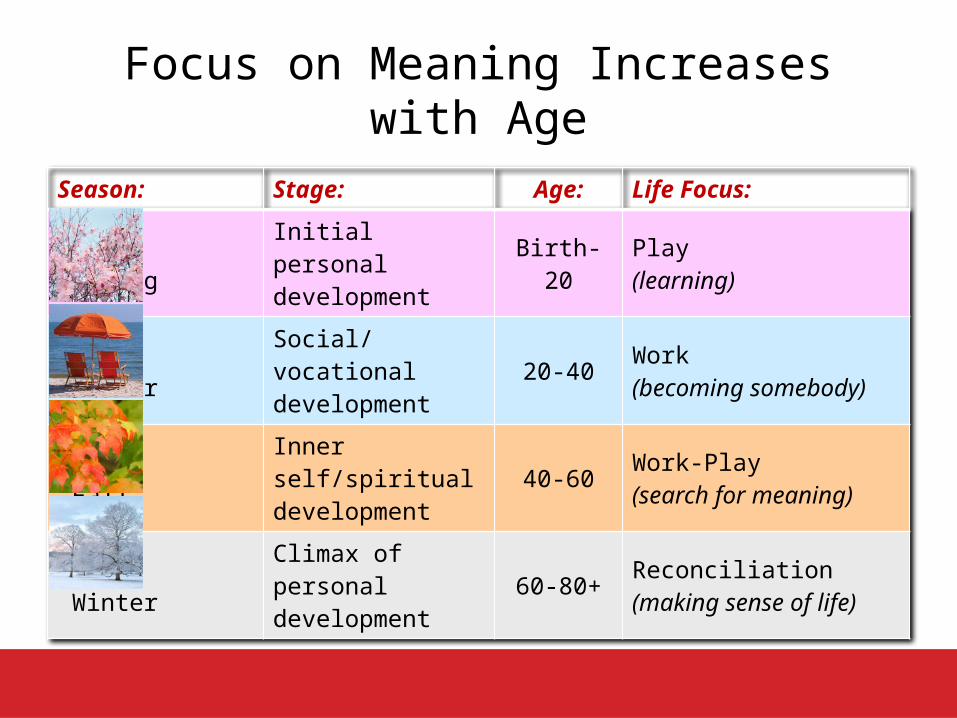
Focus on Meaning Increases with Age
Season: Stage: Age: Life Focus:
Spring Initial personal development Birth-20 Play
(learning)
Summer
Social/vocational development 20-40
Work(becoming somebody)
FallInner self/spiritual development
40-60 Work-Play(search for meaning)
WinterClimax of personal development
60-80+ Reconciliation(making sense of life)

Help others, make a difference
Contribute to a cause I care about
Use my skills in a productive way
Meet people, make friends
Be involved in my community
Develop new skills, experience
Top Reasons to Volunteer
4%
8%
18%
18%
28%
40%
Source: Peter D Hart Research Associates Survey of Aged 55+ Non-Volunteers
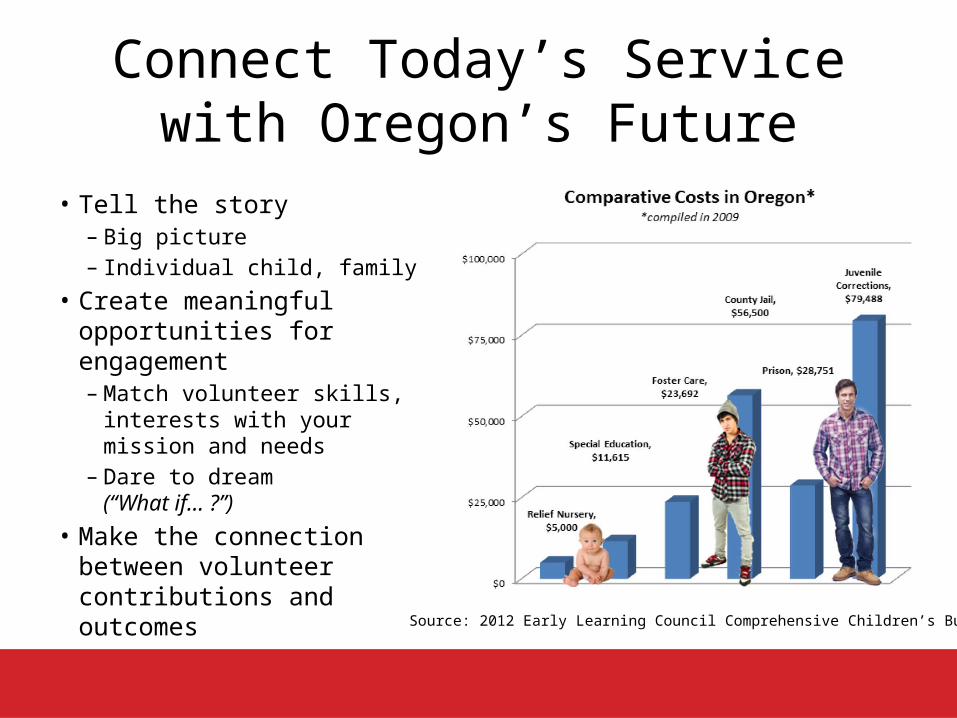
Connect Today’s Servicewith Oregon’s Future
Source: 2012 Early Learning Council Comprehensive Children’s Budget
• Tell the story– Big picture– Individual child, family
• Create meaningful opportunities for engagement– Match volunteer skills,
interests with your mission and needs
– Dare to dream(“What if… ?”)
• Make the connection between volunteer contributions and outcomes

They’re Counting on Us!