Embed Size (px)
Citation preview
0
Voluntary & Economics Incentives Working Group Report
Voluntary and economic incentives to reduce littering of drinks containers and promote recycling
February 2018
1
VOLUNTARY & ECONOMICS INCENTIVES WORKING GROUP REPORT
Contents Executive Summary and recommendations .................................................................................... 2
Deposit Return Schemes (DRSs) ................................................................................................... 2
Alternative measures ................................................................................................................... 4
Wider recommendations ............................................................................................................. 5
Overview .......................................................................................................................................... 7
Introduction ................................................................................................................................. 8
Context – Rationale for intervention ......................................................................................... 10
Evidence on deposit and return and reward schemes .............................................................. 17
Potential consequences of introducing any DRS ....................................................................... 20
Costs associated with a DRS ....................................................................................................... 27
Minimising the potential for adverse effects ............................................................................. 34
Other potential measures to reduce littering of drinks containers and promote recycling ..... 40
Conclusions and recommendations ............................................................................................... 42
Deposit Return Schemes ............................................................................................................ 42
Alternative measures ................................................................................................................. 45
Wider recommendations ........................................................................................................... 46
Annex A ...................................................................................................................................... 48
Annex B ....................................................................................................................................... 49
Annex Ca ..................................................................................................................................... 59
Annex Cb ..................................................................................................................................... 64
Annex Cc ..................................................................................................................................... 66
Annex D ...................................................................................................................................... 71
Annex E ....................................................................................................................................... 74
2
VOLUNTARY & ECONOMICS INCENTIVES WORKING GROUP REPORT
Voluntary and economic incentives to reduce littering of drinks containers and promote recycling
Executive Summary and recommendations
As part of the government’s commitment to deliver its Litter Strategy for England1, the independent Voluntary and Economic Incentives Working Group was asked by Defra Ministers to look at regulatory and voluntary measures to reduce littering and/or improve the recycling of drinks containers. This included considering the advantages and disadvantages of different types of deposit and reward and return schemes for drinks containers.
Based on responses from the call for evidence that ran from 2 October to 20 November
2017 (including wider reports submitted or referenced) and through our own personal experiences and expertise, the Working Group has concluded and recommends the following:
Deposit Return Schemes (DRSs)
1. There is some evidence from other countries that well-designed and well-run deposit return schemes can deliver an estimated increase of around 20% in the reported amount of beverage containers collected for recycling, and deliver a better quality of captured material (i.e., less contamination) than is currently estimated as happening in the UK for beverage packaging. However, there are also existing DRS models where the collection and recycling rates for containers, particularly plastic ones, are comparable with those currently estimated for the UK. There are differing opinions on exactly how much we can read across from international models to England/the UK, due to the differences in the design of the DRS systems, the time and context in which they were introduced, what the reported data on collection/recycling rates actually represents, the exact way in which wider waste management systems work, and the cultural differences between countries.
2. Evidence received in the call for evidence suggests that drinks containers, and especially plastic bottles, form a high enough proportion of litter on land and beaches in England to warrant action to address it. However, there is still little direct evidence on the impacts of DRSs on litter and we did not receive significant new data or information through the call for evidence; the evidence submitted on this tended to be anecdotal. The general assumption appears to be that receiving a monetary or other reward will encourage consumers to deposit containers at a collection point instead of littering, and/or
1 Litter Strategy for England (2017): https://www.gov.uk/government/publications/litter-strategy-for-england
3
VOLUNTARY & ECONOMICS INCENTIVES WORKING GROUP REPORT
individuals/groups will be incentivised to collect ‘in-scope’ litter to claim the refund. Introduction of a DRS is thought likely to reduce costs to local authorities associated with clearing litter.
3. Data received in the call for evidence responses suggests that there is scope for increasing collection of high-quality material from drinks containers consumed outside the home, to complement that currently being collected through kerbside and other bring-back systems. A DRS could be a mechanism to deliver additional collection of high-quality material for recycling from consumers outside their homes, particularly in areas of high consumer traffic. Focusing on drinks containers not currently collected at kerbside could reduce the risk of high-value material being diverted out of the well-established kerbside collection for recycling system and improve the potential for increasing recycling. Changing behaviour in relation to recycling outside the home is also an area that, arguably, could have a large impact on reducing litter.
4. More work needs to be done to assess the implications and impacts of a DRS before one is introduced. No new comprehensive assessment of the costs and benefits of a DRS for England/the UK was put forward and what was received varied greatly in scope, definitions and estimates, making an aggregate assessment impossible. What was clear from the responses was that the costs of implementing a DRS, and the benefits that could outweigh them, will very much depend on the exact DRS model that is developed and the outcomes that it is seeking to achieve. For example, will it compliment or replace the current household system of collecting drinks containers and what proportion of focus should be put on reducing litter? The responses to the call for evidence have given a large number of suggestions for areas that need to be considered in a well-designed DRS, covering financial, operational, logistical and communications issues. These responses will provide a good starting point for comparative comprehensive cost-benefit analyses on various DRS designs.
5. Therefore, we recommend:
a. that Defra further investigates the potential for using a well-designed DRS to encourage increased collection and recycling of drinks containers. We also suggest that particular attention be paid to considering how to capture material that is consumed outside the home.
b. that any potential scheme must be designed in consultation with businesses, consumers, local governments and other interested parties, to ensure that it is well-designed, that the costs and benefits of the specific design have been fully assessed and that the risks of potential unintended consequences are minimal;
c. that design of a DRS should seek to avoid diverting high-value material from existing kerbside and household collections where that is possible; and
4
VOLUNTARY & ECONOMICS INCENTIVES WORKING GROUP REPORT
d. that particular attention be given to the characteristics that make some overseas DRS schemes more effective than others and whether they can be applied to the UK’s situation.
6. A few months after the Working Group started its work, the Scottish Government announced its intention to introduce a deposit return scheme for Scotland2. Zero Waste Scotland have been consulting extensively with stakeholders, including most members of this Working Group, in developing potential models. A Scotland-only deposit return scheme raises the risk that relevant businesses could face differing policies – and therefore having to manufacture different drinks containers - in Scotland than in other UK nations. This issue was raised by respondents to the call for evidence, along with concerns over the potential for cross-border fraudulent activity. To avoid unintended consequences and potential additional burdens on consumers and producers, we recommend that:
a. any DRS that government may consider implementing is developed for the UK or GB, if possible, and not England in isolation;
b. to avoid unnecessary duplication of effort for all involved, Defra should work with the Devolved Governments to ensure that a comprehensive impact assessment for any proposed DRS is done on a UK or GB-wide basis;
c. Defra and Devolved Governments consider a joint consultation on a UK or GB-wide DRS.
Alternative measures
7. A number of suggestions were put forward for alternative measures to tackle litter and increase recycling, including reforming the current packaging waste regulations, introducing other financial incentives to change behaviour (such as increased taxes or new levies on hard to recycle materials, council tax discounts for increased household recycling), better information campaigns and consistent recycling collections. Few respondents gave details of how such alternative measures might work or be implemented and none suggested comprehensive, costed potential models.
8. Our view is that reforming current packaging waste legislation to introduce extended producer responsibility principles has the potential to meet similar outcomes as a deposit
2 Zero Waste Scotland news article (5 September 2017): http://www.zerowastescotland.org.uk/news-article/depositreturn-scheme-scotland 3 Clean Growth Strategy (2017): https://www.gov.uk/government/publications/clean-growth-strategy 4 25 Year Environment Plan (2018): https://www.gov.uk/government/publications/25-year-environment-plan
5
VOLUNTARY & ECONOMICS INCENTIVES WORKING GROUP REPORT
return scheme, in terms of increasing collection and recycling of drinks containers, depending on how that legislation is designed. For example, funds raised from producer obligation fees could be used to provide wider investment in waste material collection and recycling as well as help fund activities to reduce littering. We recognise that communications campaigns and bin provision may not be enough to encourage consumers to avoid littering and increase recycling. A deposit return scheme that was focused on incentivising consumers to recycle their drinks containers while outside their home could work as part of the waste material collection system for a reformed packaging waste producer responsibility system. We note that the government has announced its intention to reform producer responsibility waste management systems to drive resource efficiency and increase recycling, particularly for plastics packaging, in both the Clean Growth Strategy3 and the 25 Year Environment Plan4 . We recommend that the government considers the role of a well-designed and well-run DRS alongside a reformed packaging waste producer responsibility system, especially when agreeing the aims and outcomes intended from the latter.
9. On other suggested measures: we note that government has either already committed to or is already taking some of these forward as part of the Litter Strategy for England and now also the 25 Year Environment Plan. Where suggested measures are not already in train or being considered, we recommend Defra considers these suggestions where relevant and realistic, as part of future policy development.
Wider recommendations
10. As well as the work of this working group and the recent announcements on commitments to reform producer responsibility systems for better resources and waste management, we note that HM Treasury have announced their intention to explore the potential for taxes or charges on single-use plastics and Defra has announced the intention to develop a Resources and Waste Strategy as part of the 25 Year Environment Plan. These government commitments are yet to be fully scoped out or consulted on. Therefore, we have not had the time or opportunity to consider how these might interact with a potential deposit return scheme or other initiatives for reducing litter or increasing recycling. However, we would like to raise our concern that, depending on how all these government commitments and policies are taken forward, there is a real risk that producers of drinks containers – particularly plastic ones – could face repeated financial obligations from piecemeal policies that are, broadly, aimed at the same outcome; namely to reduce litter and increase resource efficiency. These duplicated costs would also impact on consumers. Alternatively, government would need to consider whether some producers were exempted from certain initiatives, if they are already captured by another or consider how initiatives might be designed to work together. The government also needs to take a wider view on other potential impacts of new waste management measures – for example, on employment.
6
VOLUNTARY & ECONOMICS INCENTIVES WORKING GROUP REPORT
Waste and resource management is a complex policy area and it is important that government is clear about what it is trying to achieve overall. We recommend that, before final decisions are made on introducing mandatory financial incentives for waste and litter management, such as DRS, producer responsibility schemes or tax incentives/charges in relation to single use plastics, they are considered as part of developing the wider Resources and Waste Strategy. This will ensure that policies relating to plastic and other wastes are developed holistically and complement one another, thereby avoiding unintended consequences in other areas. We also recommend that Defra ensures that it works closely with other government departments, particularly HM Treasury, to ensure that initiatives developed to manage resources and waste are considered in the round.
11. If systems are designed to increase collection of waste material for recycling without a guarantee for a market to buy the recycled material, it will likely increase local authority collection costs as income will be lost, the collected material will end up stockpiled, in landfill or going for energy from waste. This not only goes against the principles of the waste hierarchy3 but will lead, rightly, to public and media concerns about wasted efforts in separating materials for recycling. We recommend that mechanisms for supporting existing end markets and creating new ones, ideally based in the UK, are also considered as part of the design of any new waste management and collection policies.
12. Finally, responses to the call for evidence have shown that there is a lack of consistent, comparable, good quality data on materials, product and waste stocks and flows. This makes decision-making or suggestions for changes to existing systems very difficult. It also makes modelling of the costs and benefits of possible DRS designs difficult. We are pleased to see that Defra has already committed to working with industry to explore options for making waste tracking data universally digitised. We recommend that Defra also considers the need for good data for monitoring/enforcement in the design of any new waste management/recycling systems, including DRS. Monitoring litter before and after the introduction of any measure/DRS would also provide a better analysis of the impact of such a measure.
3 Guidance on applying the waste hierarchy (2011): https://www.gov.uk/government/publications/guidanceon-applying-the-waste-hierarchy
7
VOLUNTARY & ECONOMICS INCENTIVES WORKING GROUP REPORT
Overview
As part of the government’s commitment to deliver its Litter Strategy for England4, Defra established the independent Voluntary and Economic Incentives Working Group in July 2017 to help advise government on targeted approaches to tackling litter and also, where possible, to increasing recycling and resource efficiency in England.
Defra Ministers asked the Working Group to look at regulatory or voluntary measures to reduce littering and/or improve the recycling of drinks containers. This included considering the advantages and disadvantages of different types of well-designed and well-run deposit and reward and return schemes for drinks containers. The Working Group’s membership was based on expertise needed for this inquiry5.
This report has been based on information received in response to a call for evidence6 that ran from 2 October to 20 November 2017, and which was aimed at potentially closing gaps in our knowledge and understanding. It is important to note that this was not a consultation on policy options. The Working Group has also, where possible and relevant, taken into account the headline findings from similar, recent calls for evidence on deposit return schemes by Zero Waste Scotland7 and recommendations to reduce plastic bottle waste from the Environmental Audit Committee (EAC)8. We have also applied our own personal knowledge and experience.
Under the chairmanship of Defra officials, the Working Group has met a number of times in developing the call for evidence, considering the responses and developing this report. We have been supported in this process by:
• The Campaign to Protect Rural England (CPRE) who have acted as the independent secretariat and analysed responses to the call for evidence.
• The Waste and Resources Action Programme (WRAP) who, as well as being a Working Group member, also analysed responses to the call for evidence. Those working on analysing call for evidence responses were separate from those representing WRAP on the working group.
• Defra officials, who managed the analysis process, helped draft the report and have maintained overall oversight of Working Group’s work.
4 Litter Strategy for England (2017): https://www.gov.uk/government/publications/litter-strategy-for-england 5 See Annex A. 6 Call for evidence on voluntary and economic incentives to reduce littering of drinks containers and promote recycling: https://consult.defra.gov.uk/waste-and-recycling/call-for-evidence-drinks-containers/ The questions can be seen in Annex C. 7 See Zero Waste Scotland website: http://www.zerowastescotland.org.uk/ 8 Environmental Audit Committee (2017) Report: Plastic Bottles: Turning Back the Plastic Tide. Available for download at: https://www.parliament.uk/business/committees/committees-a-z/commonsselect/environmental-audit-committee/inquiries/parliament-2017/inquiry/
8
VOLUNTARY & ECONOMICS INCENTIVES WORKING GROUP REPORT
The recommendations in this report reflect the consensus view of the Working Group members.
Introduction
The Litter Strategy for England9 outlined the problems that littering causes and the need to avoid the inappropriate disposal of waste material to reduce the amount of debris getting into the open environment. It estimated that 80% of man-made debris in the marine environment originated on land before being thrown, blown or washed into rivers, canals and the sea10. Disposable drinks containers and their component parts regularly feature in the Top 10 items found on UK beaches as part of the Marine Conservation Society’s Great British Beach Clean11. The importance of encouraging behaviour change to stop littering at source and, ideally, also promote the capture of valuable resources that can be recycled is clear.
It was in this context that the Voluntary and Economic Incentives Working Group was asked to look at regulatory or voluntary measures to reduce littering and/or improve the recycling of drinks containers. We were also specifically asked to consider the advantages and disadvantages of different types of well-designed and well-run deposit and reward and return schemes for drinks containers.
Call for evidence and scope
To help with our work, we developed a call for evidence12 that was published on Defra’s CitizenSpace website and ran from 2 October to 20 November 2017.
We decided to focus our investigation on rigid and flexible plastic, glass or metal drinks containers that are sold sealed, and used for the sale of alcoholic or non-alcoholic beverages, often for consumption ‘on-the-go’ (i.e., consumed outside the home). This scope was agreed because England already has good infrastructure for household kerbside recycling collection, with 88% of local authorities collecting glass, aluminium and plastic
9 Litter Strategy for England (2017): https://www.gov.uk/government/publications/litter-strategy-for-england 10 Litter Strategy for England (2017): https://www.gov.uk/government/publications/litter-strategy-for-england 11 Marine Conservation Society, Great British Beach Clean 2017 Report: https://www.mcsuk.org/media/GBBC_2017_Report.pdf ; Great British Beach Clean 2016 Report: https://www.mcsuk.org/media/cleanseas/GBBC_2016_Report.pdf 12 Call for evidence on voluntary and economic incentives to reduce littering of drinks containers and promote recycling: https://consult.defra.gov.uk/waste-and-recycling/call-for-evidence-drinks-containers/ The questions can be seen in Annex C.
9
VOLUNTARY & ECONOMICS INCENTIVES WORKING GROUP REPORT
drinks containers as part of their recycling services13. Surveys of commonly littered items frequently feature food and drink packaging, amongst other products. Increasingly, many products are consumed outside the home. The latest results from the Marine Conservation Society’s Great British Beach Clean found that ‘on-the-go’ litter made up 20% of all the rubbish found on UK beaches14. Containers made of metal, plastics and glass also have a relatively high inherent value as recyclable material resources, which are lost to the economy when containers are disposed of improperly.
By deposit return schemes (DRSs), we mean those where consumers pay an up-front deposit on an item – such as a sealed drink – at point of purchase, which is redeemed on return of the empty drink container. Reward and return schemes describe a similar but broader concept, not necessarily involving an up-front deposit, in which consumers are rewarded for return of the empty container. Rewards can be monetary, but can also include vouchers, loyalty points, prize draws, credits, and so on.
We received over 270 responses to the call for evidence from international and UK based respondents, ranging from businesses in the drinks supply chain, industry trade associations, environmental groups, local authorities, DRS system operators in other countries and members of the public. Further details of the respondents and the questions asked in the call for evidence are in Annexes B and C, respectively.
Where respondents had submitted multiple responses to the call for evidence (for example by completing the online form more than once, or completing the online form and sending a response via email) these were amalgamated into a single response. Any responses which contained commercially sensitive information were initially withheld from the working group in their entirety, and then later shared with the group once the commercially sensitive information had been redacted. Some commercially sensitive information was then anonymised so it was unidentifiable, and subsequently shared with the working group. Other commercially sensitive information was not able to be anonymised and remained within Defra.
As well as direct answers to each of the call for evidence questions and separate, standalone summarised responses from organisations and individuals, we received many additional references and links to further reports. In the time available to us, the Working Group did not have the opportunity to study all the details of each of these additional references submitted. We focused on those that potentially provided new and emerging evidence from sources which could be checked for accuracy and those which were mentioned multiple times by different respondents. For reports relating to DRSs, we focussed on those from
13 WRAP data 2016/17 14 Marine Conservation Society, Great British Beach Clean 2017 Report: https://www.mcsuk.org/media/GBBC_2017_Report.pdf
10
VOLUNTARY & ECONOMICS INCENTIVES WORKING GROUP REPORT
countries with similarities to the UK (either culturally, with a similar population size or with kerbside collection for recycling).
Responses were of variable quality. Some included uncited assertions, anecdotes, or were based on supposition and guesswork, rather than detailed, verifiable evidence. This was particularly the case in response to questions on the relative potential benefits or costs of introducing a DRS in England. Where evidence for statements was provided, it was not always given with a thorough citation, but may have been accepted due to the respondent being known to have direct expertise – for example local authorities, DRS operators or trade associations. Some responses, particularly those from non-government organisations and trade associations, were well-referenced and offered critiques of some of the studies they cited. During analysis, we noted that some respondents misquoted and misinterpreted primary sources, and so we checked key primary sources directly. Where the methodology or quality of primary sources referenced in response to the call for evidence was contested by respondents and the working group, they were not included in the analysis.
The analysis included in Annexes Ca-Cd offers the full range of perspectives presented for desire for change to the current recycling systems, elements of the current systems that were thought useful to keep and potential design considerations if a DRS were to be introduced. These tables also highlight whether the suggestions made are evidence-based, anecdotal or supposition.
The ‘context’ section below outlines information provided on placed on the market figures for drinks containers, latest available recycling and littering rates, and where gaps in the evidence still lie. Some new and useful information was submitted by local authorities regarding on-street recycling infrastructure and businesses reflecting on models of DRSs operating internationally.
Context – Rationale for intervention
In order to better understand the potential impacts of any proposed changes to the current system, and the potential need for intervention, it is important to establish an accurate picture of the current situation – in other words, a ‘baseline’ of best-available information. Therefore, the call for evidence asked for the latest available/current information on the numbers of drinks containers placed on the market, drinks container collection and recycling rates for kerbside and recycling systems outside the home and questions relating to litter and its impacts. Data submitted relating to these questions was often patchy (i.e. did not give a picture of the whole market/country) and various respondents used different definitions/measures. This has led to some difficulties in aggregating the data.
11
VOLUNTARY & ECONOMICS INCENTIVES WORKING GROUP REPORT
Number of drinks containers placed on the market
Some data was supplied for placed on the market units for beverage cartons and paper cups, however these were outside the scope of this inquiry. The focus for this call for evidence was rigid and flexible plastic, glass or metal drinks containers that are sold sealed, and used for the sale of alcoholic or non-alcoholic beverages, often for consumption ‘on-the-go’ (outside the home) in England.
For placed on the market data, more evidence was provided for the UK as a whole than for England only, therefore the analysis has been based on UK figures. Different sources provided quite different data in response to the same placed on the market categories (some of which may partially be accounted for by using different reporting years), data was reported as a mixture of units/volumes/weights, not all sources included dates for their figures and it was not always clear for plastic bottle figures whether these were solely for drinks bottles and if this included milk bottles. Milk is more likely to be consumed in premises, rather than outside, ‘on-the-go’ and the bottles are often made from HDPE plastic. Typical soft drinks, including water, are usually sold in bottles made from PET plastic. It has not been possible from the data to differentiate out figures for drinks consumption outside the home. This may be because there isn’t a formal definition for ‘on-the-go’ (outside the home) consumption that we are aware of, and we did not suggest one in the scope for the call for evidence. It is not possible to pre-determine with certainty where a drink will be consumed, regardless of where it is purchased. For example, multi-pack drinks purchases may be taken home initially but then be consumed outside the home - in the office, school or elsewhere.
GlobalData figures for soft drinks sold in the UK in 201615 (end consumer consumption numbers) were submitted by a few respondents. However this dataset encompasses all container sizes from 11cl to 5L, which includes sizes usually consumed both inside and outside the home. Defra was provided with figures relating to the UK beer market in 2016 which assumed average glass bottle sizes of 310ml, can sizes of 460ml and PET bottle sizes of 310ml16. To gain a more accurate picture of the market in 2016, covering soft drinks and alcohol, these figures can be combined, however alcohol which is not beer is missing from these figures. Draught figures have been excluded from beer market figures, however ‘on-trade’ sales (for consumption in pubs for example) have been included (unless otherwise stated) as the detailed scope of capture for any potential DRS was not outlined in the call for evidence.
Valpak provided ‘consumer’ and ‘non-consumer’ figures for placed on the market data. ‘Non-consumer’ figures here are hospitality placed on the market data, including food service, schools, hospitals and offices, plus vending machines and cafes/restaurants/canteens where it is possible to take away a drink. It may also include some industrial/other situations. As ‘non-consumer’ figures include consumption outside 15 These figures were submitted by various respondents including the British Soft Drinks Association. 16 Data supplied by the British Beer and Pub Association.
12
VOLUNTARY & ECONOMICS INCENTIVES WORKING GROUP REPORT
the home, we have used these with ‘consumer’ figures added (Valpak’s estimated ‘full market’ figures) (unless otherwise stated).
Glass
We estimate the UK market for glass bottle drinks containers to be between 4.31billion (bn) units (soft drinks and beer sales only in 2016) and 5.6bn units (Valpak placed on the market 2016) per annum. If off-trade beer figures are used (i.e. sales for consumption in pubs are excluded) the lower estimate becomes 3.88bn.
Plastic
It has not been possible to separately quantify the various plastic types used in drinks bottle containers from some of the evidence received. RECOUP estimate over 13bn plastic bottles are used each year in the UK (this includes all household bottles including shampoo, bleach, etc. – not just drink bottles)17, whereas Valpak estimate 14.3bn plastic drinks bottles were placed on the market in 2016.
Soft drinks and beer PET bottle sales in 2016 equalled 8.62bn units, made up of approximately 0.02bn units of beer bottles (of which almost all were ‘on-trade’ – sold for consumption in pubs) and 8.6bn units of soft drinks. Valpak estimate that 9.2bn PET drinks bottles and 5.1bn HDPE and other drinks bottles were placed on the market in 2016. In 2016 0.27bn HDPE soft drinks bottles were sold in the UK18. We estimate that 2.76bn plastic bottles containing milk are placed on the GB market per annum, and it is likely that most of this plastic is HDPE19.
Cans
We were provided with figures for steel and aluminium cans, however Alupro forecasts that 100% of drinks cans will be aluminium in 2018. Considering cans as a whole, we estimate the UK market per annum to be between 8.1bn (soft drinks and beer only sales in 2016) and 9.6bn cans (Beverage Can Makers Europe (BCME) cans filled in 2015). Valpak estimate 9.1bn cans were placed on the UK market in 2016.
17 UK Household Plastics Collection Survey 2017, RECOUP, available for download at: http://www.recoup.org/p/229/uk-household-plastics-collection-survey-2016 18 GlobalData figures submitted by various respondents including the British Soft Drinks Association. 19 Latest available data and estimates provided by DairyUK, and used with Defra calculations.
13
VOLUNTARY & ECONOMICS INCENTIVES WORKING GROUP REPORT
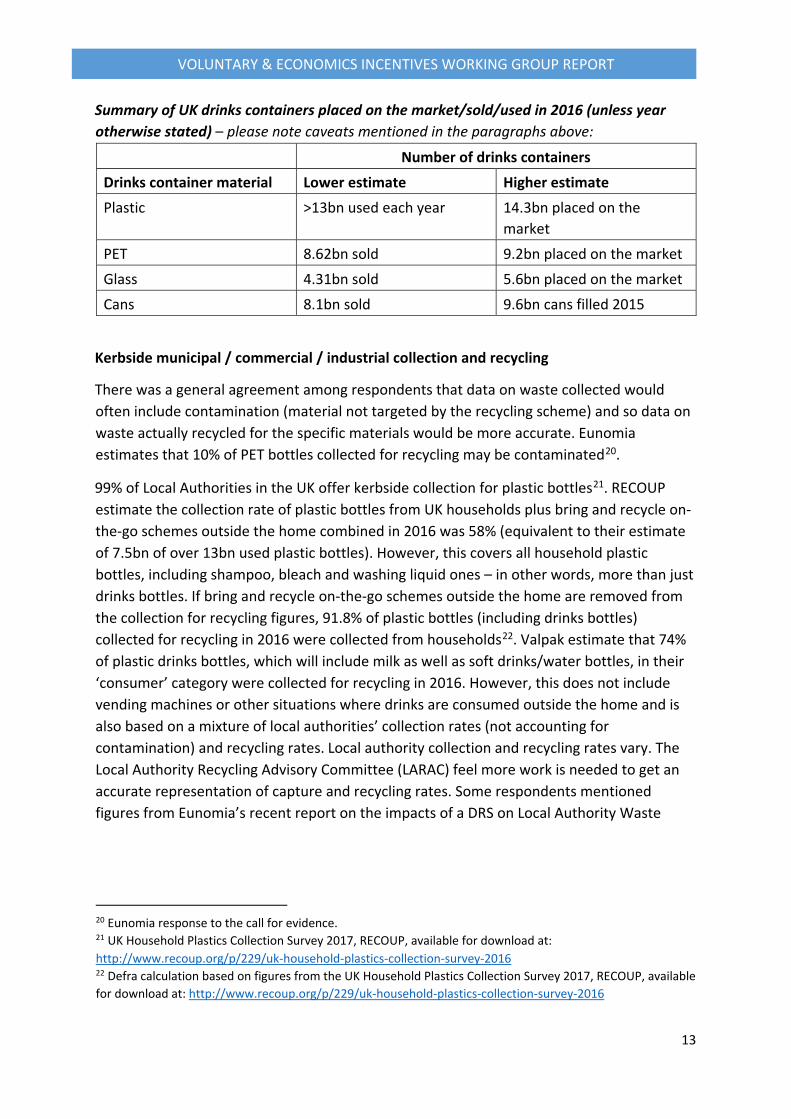
Summary of UK drinks containers placed on the market/sold/used in 2016 (unless year otherwise stated) – please note caveats mentioned in the paragraphs above:
Number of drinks containers
Drinks container material Lower estimate Higher estimate Plastic >13bn used each year 14.3bn placed on the
market PET 8.62bn sold 9.2bn placed on the market
Glass 4.31bn sold 5.6bn placed on the market
Cans 8.1bn sold 9.6bn cans filled 2015
Kerbside municipal / commercial / industrial collection and recycling
There was a general agreement among respondents that data on waste collected would often include contamination (material not targeted by the recycling scheme) and so data on waste actually recycled for the specific materials would be more accurate. Eunomia estimates that 10% of PET bottles collected for recycling may be contaminated20.
99% of Local Authorities in the UK offer kerbside collection for plastic bottles21. RECOUP estimate the collection rate of plastic bottles from UK households plus bring and recycle on-the-go schemes outside the home combined in 2016 was 58% (equivalent to their estimate of 7.5bn of over 13bn used plastic bottles). However, this covers all household plastic bottles, including shampoo, bleach and washing liquid ones – in other words, more than just drinks bottles. If bring and recycle on-the-go schemes outside the home are removed from the collection for recycling figures, 91.8% of plastic bottles (including drinks bottles) collected for recycling in 2016 were collected from households22. Valpak estimate that 74% of plastic drinks bottles, which will include milk as well as soft drinks/water bottles, in their ‘consumer’ category were collected for recycling in 2016. However, this does not include vending machines or other situations where drinks are consumed outside the home and is also based on a mixture of local authorities’ collection rates (not accounting for contamination) and recycling rates. Local authority collection and recycling rates vary. The Local Authority Recycling Advisory Committee (LARAC) feel more work is needed to get an accurate representation of capture and recycling rates. Some respondents mentioned figures from Eunomia’s recent report on the impacts of a DRS on Local Authority Waste
20 Eunomia response to the call for evidence. 21 UK Household Plastics Collection Survey 2017, RECOUP, available for download at: http://www.recoup.org/p/229/uk-household-plastics-collection-survey-2016 22 Defra calculation based on figures from the UK Household Plastics Collection Survey 2017, RECOUP, available for download at: http://www.recoup.org/p/229/uk-household-plastics-collection-survey-2016
14
VOLUNTARY & ECONOMICS INCENTIVES WORKING GROUP REPORT
Services23. However, the estimated capture rates are based on four of the highest performing Local Authorities in England. Local Authorities report figures but not at a detailed level, so they cannot provide the data for drinks containers specifically, just overall figures of material collected. From the relatively few local authorities that responded to the call for evidence, we have not attempted to scale these figures up to represent the UK as a whole. We do not feel that mentioning individual local authorities here is helpful as they are not representative of the UK as a whole. The National Packaging Waste Database24 estimates that in 2016 67% of glass packaging placed on the market was collected for recycling25. The European Container Glass Federation estimates 67% of glass containers consumed in the UK are recycled26. Valpak estimate that UK consumer collection for recycling rates for glass drinks bottles in 2016 (excluding hospitality and vending machines) was 70%.
Alupro state UK collection and recycling of aluminium drinks cans was 70% and steel drinks cans was 70% plus in 2016 (and has grown steadily year on year). Valpak agree with the Alupro figures of 70% collection for recycling of aluminium and steel cans in 2016, adding that this includes hospitality and vending machines on-top of their ‘consumer’ category, but that there is a chance that this figure may change if any collection for recycling occurs in industrial situations, for example.
No significant, representative data on recycling rates for commercial and industrial sources was submitted in response to the call for evidence.
All of the recycling rate figures for drinks containers above show scope for improvement, especially when compared with the recycling rates of some other countries who have well-designed DRSs.
23 Impacts of a Deposit Refund System for One-way Beverage Packaging on Local Authority Waste Services, Eunomia, October 2017, available for download at: http://www.eunomia.co.uk/reports-tools/impacts-of-adeposit-refund-system-for-one-way-beverage-packaging-on-local-authority-waste-services/ 24 The National Packaging Waste Database (NPWD) is a web-based database supported by the Environment Agency, the Scottish Environment Protection Agency (SEPA), the Northern Ireland Environment Protection Agency, the Department for Environment, Food and Rural Affairs, the Department for Business, Energy and Industrial Strategy, the Advisory Committee on Packaging, companies obligated by the packaging and battery regulations, reprocessors, exporters and compliance schemes. 25 Figure stated by the British Glass Manufacturers’ Confederation in response to the call for evidence. The respondent attributed this figure to the National Packaging Waste Database. 26 Figure stated by Greenpeace UK in response to the call for evidence. The respondent attributed this figure to the European Container Glass Federation.
15
VOLUNTARY & ECONOMICS INCENTIVES WORKING GROUP REPORT
‘On-the-go’ (outside the home) collection and recycling
An Alupro commissioned study in 2017 found that within the sample population, 47% of can consumption occurred outside the home27. In 2013 Zero Waste Scotland estimated that 21.7% by weight of street/on-the-go bins in Scotland related to drinks containers, which was further broken down into glass 9.1%, plastic bottles 8.6%, and metal cans 4.0%30. One audit of litter bin waste (as an indication of on-the-go collection of drinks containers) in 2016 in an English Local Authority showed by weight as a percentage that plastic bottles were 4.4%, glass bottles 8.6%, steel cans 0.7% and aluminium cans 1.4%28. Focussing on weight as a metric for litter can overemphasise the proportion of glass, for example. However, there is a current scarcity of evidence from ‘on-the-go’ litter bin studies. Although waste composition studies are quite common at Local Authority level, ‘on-the-go’ recycling bins and litter collections/street sweepings are not often included in scope.
RECOUP found that of the local authorities that answered the specific question in the 2017 Household Plastics Collection Survey, 54% did not offer a recycle ‘on-the-go’ service29. LARAC has commented that local authorities operate very few ‘on-the-go’ or street bin recycling schemes and that the quality of material from these types of these containers is very low, and not at a level the processing industry can deal with. A number of LARAC members mentioned that they had a nil return for the percentage of litter bin waste that is recycled. One district council mentioned that they had discontinued recycling ‘on-the-go’ bins within the town centre area due to contamination.
RECOUP estimates that 28,000 tonnes of plastic bottles collected for recycling in 2016 were collected via bring and recycle on-the-go schemes, which is equivalent to 8.16% of their estimation of those collected for recycling30.
Evidence from placed on the market figures compared with collection/recycling data suggests that there is more material that could be gained for recycling from better collection of drinks containers, especially those consumed outside the home. It is important to ensure that any additional material collected is of high quality (minimal contamination). It has been difficult to draw very specific conclusions as the data cannot be broken down sufficiently.
27 Alupro response to the call for evidence, explaining a study carried out by a third party in 2017. 30 Zero Waste Scotland (2013) Scotland’s Litter Problem: Quantifying the Scale and Cost of Litter and Fly-tipping: https://www.zerowastescotland.org.uk/sites/default/files/Scotland%27s%20Litter%20Problem%20%20Full%20Final%20Report.pdf 28 WRAP data 29 UK Household Plastics Collection Survey 2017, RECOUP, available for download at: http://www.recoup.org/p/229/uk-household-plastics-collection-survey-2016 30 Defra calculation based on figures from the UK Household Plastics Collection Survey 2017, RECOUP, available for download at: http://www.recoup.org/p/229/uk-household-plastics-collection-survey-2016
16
VOLUNTARY & ECONOMICS INCENTIVES WORKING GROUP REPORT
Littering and its impacts
The Industry Council for Research on Packaging and the Environment (INCPEN) have cited a recent Office for National Statistics (ONS) Annual Crime Survey where 30% of people felt there was a ‘very/fairly big problem of litter in their area’31.
The Local Environmental Quality Survey of England 2014/15 found non-alcoholic drinks litter was the third most common category of litter, found on 52.4% of the sites surveyed and that alcoholic drinks litter was found on 18.6% of sites32. In addition, the raw survey data provided specific data for plastic bottles - of the 7,200 sites surveyed, 24% of these (1,727 sites) contained plastic bottle litter33. Plastic drinks bottles were the tenth most common type of litter in the Great British Beach Clean 2016, with an average of 12.5 found per 100m of beach34. Results from categories in the 2017 report which may include drinks container litter were; ‘plastic / polystyrene pieces 0-50cm’ was highest at 225.3 pieces/100m; glass was 3rd at 40.4 pieces/100m; and ‘caps and lids’ was 5th at 32.9 pieces/100m38. The Litter Composition Survey of England (2014) showed that by item count 6% of litter was alcoholic and non-alcoholic cans and bottles, when tops are included this becomes 9.2%39. When cigarette ends, chewing gum staining and solid gum were excluded (as they together totalled 53.9% of the overall total), cans become 7.7% of litter by unit and bottles 5.4%, together making up 13.1% (if tops are included this rises to 19.9%)35. The British Glass Manufacturers’ Confederation commented that glass is a very small proportion of litter in the UK.
Keep Britain Tidy (KBT) asserts that the presence of litter on the ground encourages other people to litter also, and state that while plastic bottles are not the most littered items in the country, they are one of the most visible items littered, with instantly recognisable branding, and their presence creates disproportionately more littering as a result. This is supported by their ‘Beacons of Litter’ research which suggested that the presence of large, salient litter items (such as plastic bottles) increases the likelihood of additional litter being dropped and that reducing the amount of these litter items on the ground could potentially reduce overall littering rates in an area36.
31 Figure stated by INCPEN in response to the call for evidence. The respondent attributed this figure to the Office for National Statistics (ONS) Crime Survey for England and Wales. 32 Keep Britain Tidy, Local Environmental Quality Survey of England (LEQSE) 2014/15: http://www.keepbritaintidy.org/sites/default/files/resources/KBT_How_Clean_Is_England_LEQSE_Report_201 5.pdf 33 Keep Britain Tidy response to the call for evidence. 34 Marine Conservation Society, Great British Beach Clean 2016 Report: https://www.mcsuk.org/media/cleanseas/GBBC_2016_Report.pdf 35 Ibid 36 Keep Britain Tidy, Beacons of Litter – A social experiment to understand how the presence of certain litter items influences rates of littering, November 2016. http://www.keepbritaintidy.org/sites/default/files/KBT_CFSI_Beacons_Of_Litter_2017.PDF
17
VOLUNTARY & ECONOMICS INCENTIVES WORKING GROUP REPORT
Local Authorities have commented that littered drinks containers have a number of negative impacts including: reducing local environmental quality making areas unattractive and less pleasant to live in; increasing the pollution risk (for example plastics pollution of marine and fresh water bodies); potentially reducing the health and wellbeing of residents; increasing costs on local authorities and government agencies for litter clearance, street sweeping and highway maintenance which diverts resources from other public services; and causing areas to become unattractive to potential investors, businesses and for tourism.
A recycling company commented that litter represents a lost revenue stream to waste collectors and processors. One business told us that costs from clearing litter are higher at sites where they have recycling facilities, and that these facilities attract fly-tipping. A large supermarket commented that litter can have a negative effect on public perception of a business or brand.
It is difficult to find comprehensive data on the effect of littering on society. LARAC has commented that the cost to local authorities of keeping amenity spaces clean is around £800 million per year.
In summary, the evidence suggests that drinks containers, and especially plastic bottles, form a high enough proportion of litter on land and beaches in England to warrant action to address this.
Evidence on deposit and return and reward schemes
Support for a ‘carry on as normal’ approach
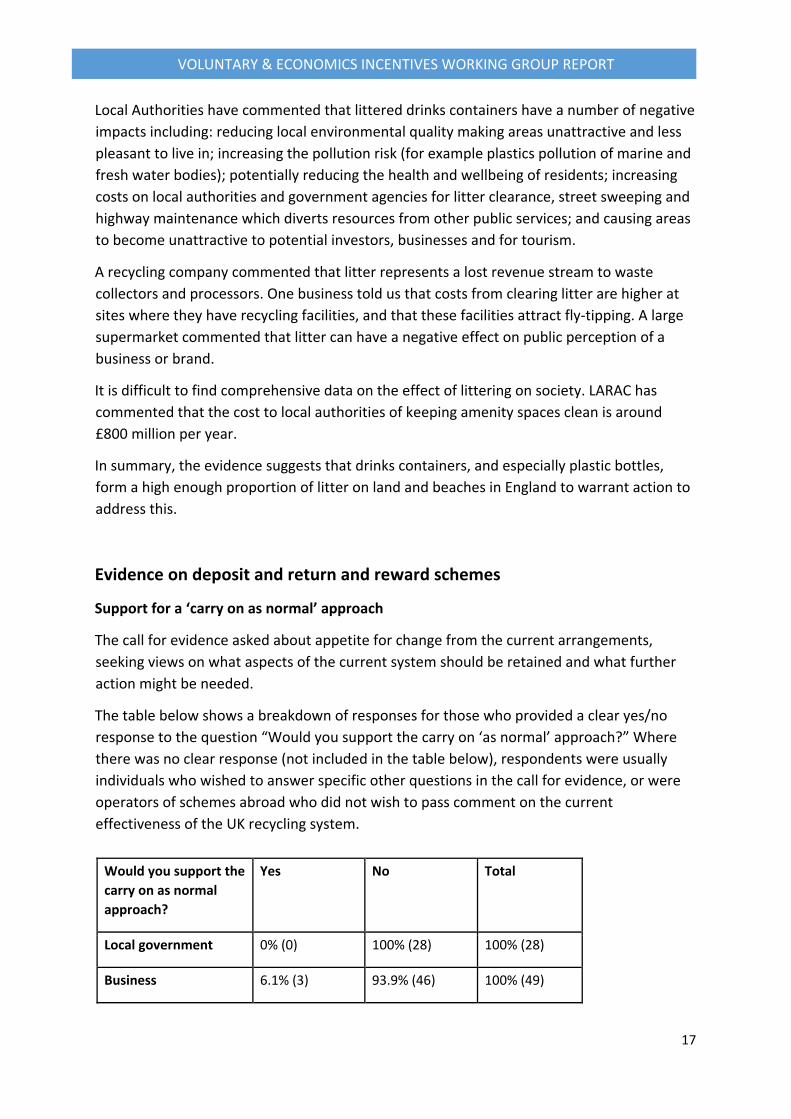
The call for evidence asked about appetite for change from the current arrangements, seeking views on what aspects of the current system should be retained and what further action might be needed.
The table below shows a breakdown of responses for those who provided a clear yes/no response to the question “Would you support the carry on ‘as normal’ approach?” Where there was no clear response (not included in the table below), respondents were usually individuals who wished to answer specific other questions in the call for evidence, or were operators of schemes abroad who did not wish to pass comment on the current effectiveness of the UK recycling system.
Would you support the carry on as normal approach?
Yes No Total
Local government 0% (0) 100% (28) 100% (28)
Business 6.1% (3) 93.9% (46) 100% (49)
18
VOLUNTARY & ECONOMICS INCENTIVES WORKING GROUP REPORT
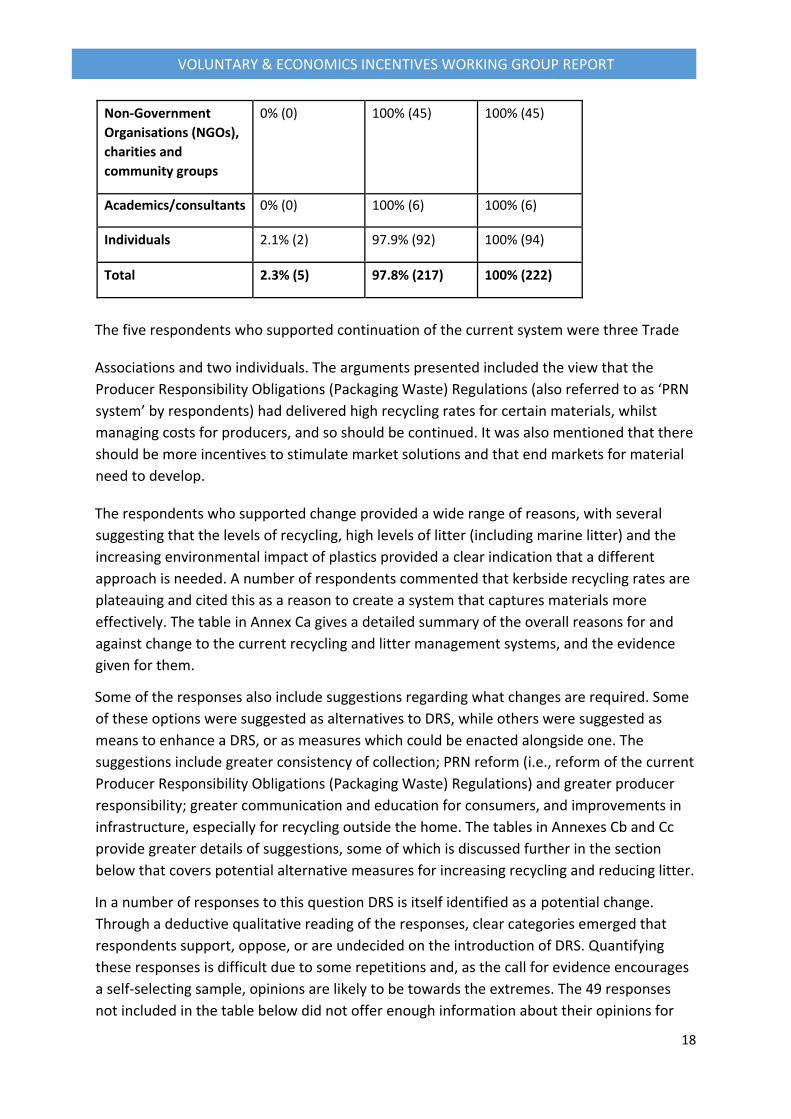
Non-Government Organisations (NGOs), charities and community groups
0% (0) 100% (45) 100% (45)
Academics/consultants 0% (0) 100% (6) 100% (6)
Individuals 2.1% (2) 97.9% (92) 100% (94)
Total 2.3% (5) 97.8% (217) 100% (222)
The five respondents who supported continuation of the current system were three Trade
Associations and two individuals. The arguments presented included the view that the Producer Responsibility Obligations (Packaging Waste) Regulations (also referred to as ‘PRN system’ by respondents) had delivered high recycling rates for certain materials, whilst managing costs for producers, and so should be continued. It was also mentioned that there should be more incentives to stimulate market solutions and that end markets for material need to develop.
The respondents who supported change provided a wide range of reasons, with several suggesting that the levels of recycling, high levels of litter (including marine litter) and the increasing environmental impact of plastics provided a clear indication that a different approach is needed. A number of respondents commented that kerbside recycling rates are plateauing and cited this as a reason to create a system that captures materials more effectively. The table in Annex Ca gives a detailed summary of the overall reasons for and against change to the current recycling and litter management systems, and the evidence given for them.
Some of the responses also include suggestions regarding what changes are required. Some of these options were suggested as alternatives to DRS, while others were suggested as means to enhance a DRS, or as measures which could be enacted alongside one. The suggestions include greater consistency of collection; PRN reform (i.e., reform of the current Producer Responsibility Obligations (Packaging Waste) Regulations) and greater producer responsibility; greater communication and education for consumers, and improvements in infrastructure, especially for recycling outside the home. The tables in Annexes Cb and Cc provide greater details of suggestions, some of which is discussed further in the section below that covers potential alternative measures for increasing recycling and reducing litter.
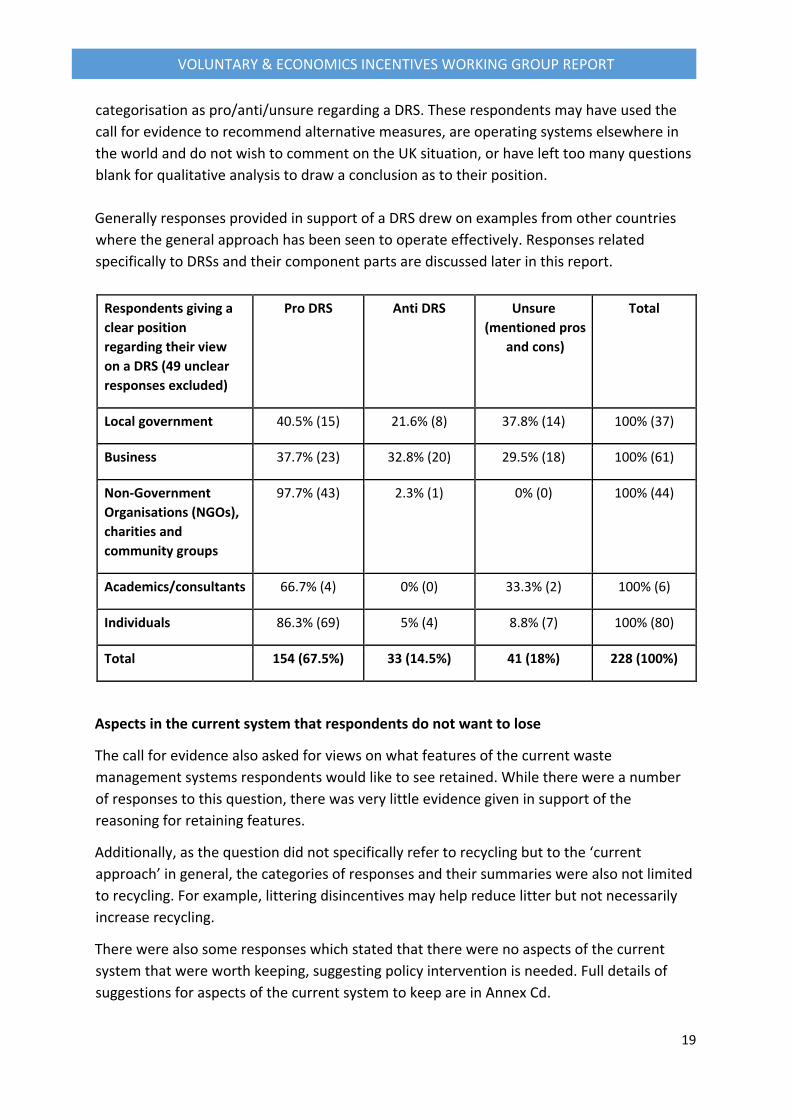
In a number of responses to this question DRS is itself identified as a potential change. Through a deductive qualitative reading of the responses, clear categories emerged that respondents support, oppose, or are undecided on the introduction of DRS. Quantifying these responses is difficult due to some repetitions and, as the call for evidence encourages a self-selecting sample, opinions are likely to be towards the extremes. The 49 responses not included in the table below did not offer enough information about their opinions for
19
VOLUNTARY & ECONOMICS INCENTIVES WORKING GROUP REPORT
categorisation as pro/anti/unsure regarding a DRS. These respondents may have used the call for evidence to recommend alternative measures, are operating systems elsewhere in the world and do not wish to comment on the UK situation, or have left too many questions blank for qualitative analysis to draw a conclusion as to their position. Generally responses provided in support of a DRS drew on examples from other countries where the general approach has been seen to operate effectively. Responses related specifically to DRSs and their component parts are discussed later in this report.
Respondents giving a clear position regarding their view on a DRS (49 unclear responses excluded)
Pro DRS Anti DRS Unsure (mentioned pros
and cons)
Total
Local government 40.5% (15) 21.6% (8) 37.8% (14) 100% (37)
Business 37.7% (23) 32.8% (20) 29.5% (18) 100% (61)
Non-Government Organisations (NGOs), charities and community groups
97.7% (43) 2.3% (1) 0% (0) 100% (44)
Academics/consultants 66.7% (4) 0% (0) 33.3% (2) 100% (6)
Individuals 86.3% (69) 5% (4) 8.8% (7) 100% (80)
Total 154 (67.5%) 33 (14.5%) 41 (18%) 228 (100%)
Aspects in the current system that respondents do not want to lose
The call for evidence also asked for views on what features of the current waste management systems respondents would like to see retained. While there were a number of responses to this question, there was very little evidence given in support of the reasoning for retaining features.
Additionally, as the question did not specifically refer to recycling but to the ‘current approach’ in general, the categories of responses and their summaries were also not limited to recycling. For example, littering disincentives may help reduce litter but not necessarily increase recycling.
There were also some responses which stated that there were no aspects of the current system that were worth keeping, suggesting policy intervention is needed. Full details of suggestions for aspects of the current system to keep are in Annex Cd.
20
VOLUNTARY & ECONOMICS INCENTIVES WORKING GROUP REPORT
Potential consequences of introducing any DRS
Effect of DRSs on litter, collection and recycling rates and the quality of materials sent for recycling
There is a general consensus among respondents that, in theory, if a well-designed DRS was introduced, litter rates would be expected to fall, recycling rates of targeted materials would be expected to rise and the quality of collected material would be expected to increase (due to less contamination). Available evidence is explored below.
Studies on the effect of a DRS on litter mentioned by respondents were limited, and as such many of the views expressed on this in response to the call for evidence were based on supposition. Respondents mentioned the Keep Australia Beautiful National Litter Index37, which showed that in 2015/16 the jurisdictions with a DRS had a lower rate of beverage container litter (2.8% in the Northern Territory and 2.9% in South Australia), compared to four other jurisdictions without a DRS (rates of 5.7%, 7.4%, 8.7%, 13.0% (not including Tasmania and Australian Capital Territory)), indicating a DRS could reduce littering of beverage containers38. Some local authorities mentioned that alongside an anticipated reduction in litter with a DRS, they would expect people to collect littered containers for a financial return, as occurred in the past. They also mentioned the Zero Waste Scotland work on the evidence for a DRS concluding that there would be expected direct savings on litter clearance and wider cost reductions from the effect of litter pollution on society. In a recent report, Eunomia suggested that introduction of a DRS would create the opportunity to remove some litter bins in specific areas and a reduced need for manual litter pickers39. Some respondents are concerned about ‘bin mining’ for any materials in-scope of a DRS, thus increasing litter in the proximity of affected bins. As discussed above, not all materials in litter would be covered by any potential DRS, so further approaches would be needed to target this material. There is the possibility that introduction of a DRS could lead to consumers becoming more aware of littering and changing their behaviour related to items outside of the scope of any DRS.
Recycling rates in countries which operate a DRS for various materials vary (see Annex D). Germany, Norway and the Netherlands have some of the highest reported rates of plastic drinks bottle collection/recycling in Europe at 98%, 95% and 95%, respectively40. All have a DRS and also have some form of kerbside or household recycling collections. This is
37 Keep Australia Beautiful, National Litter Index 2015-2016: https://issuu.com/keepaustraliabeautiful/docs/nli_15-16_surveys_states_and_territ 38 See: http://www.epa.sa.gov.au/environmental_info/container_deposit 39 Impacts of a Deposit Refund System for One-way Beverage Packaging on Local Authority Waste Services, Eunomia, October 2017, available for download at: http://www.eunomia.co.uk/reports-tools/impacts-of-adeposit-refund-system-for-one-way-beverage-packaging-on-local-authority-waste-services/ 40 See Annex D
21
VOLUNTARY & ECONOMICS INCENTIVES WORKING GROUP REPORT
compared with an estimated 74% of all consumer plastic drinks bottles collected for recycling in the UK in 2016 (Valpak). The rates of collection/recycling of aluminium, steel and glass containers in the UK were also all quoted as currently around 70%, with the highest performing DRS systems for these drinks containers, usually in Europe, having collection/recycling rates of between 87-97%41. However, there are also existing DRS models where the collection and recycling rates for containers, particularly plastic ones, are comparable with those currently estimated for the UK, and where there is also some form of kerbside or household collection, such as California (75%) and South Australia (70%)42. These collection/recycling rates are dependent on various factors including the takeback/collection mechanism and the level of deposit. Following the introduction of the German DRS system, recycling rates for materials covered by the DRS increased and overall recycling rates temporarily dropped but then recovered43. British Glass argue that in countries where a DRS covers glass the overall recycling rate of glass has not improved. SUEZ feel that that the weight of evidence supports the view that take-back requirements and recycled content standards reduce waste and increase recycling, but that the majority of studies on Extended Producer Responsibility (EPR) policies such as DRS point to increased recycling rates of the target material. They mention that US states without a DRS have considerably lower recycling rates than those with one irrespective of the deposit level.
It has been stated that it may be difficult to predict the overall recycling rate (for target materials) that introducing a DRS could lead to, and any impact on the recycling rate of drinks containers via kerbside collection. Introduction of a DRS could lead to some material being directed away from kerbside collection for recycling, but would cause a nil increase in nationwide recycling if the same amount diverted ended in a DRS, unless material entering a DRS was higher quality (less lost from recycling due to contamination). The number of ‘on-the-go’ drinks containers people take home to recycle at kerbside is unknown, as is the number of smaller drinks containers people may buy with their supermarket shopping and then take out to consume outside the home. The potential impact of potentially diverting material away from kerbside needs to be considered, as it could threaten recycling of non-target DRS materials, due to the revenue that plastic bottles, cans and glass material currently generates for local authorities. The aim of any DRS should be to increase overall recycling rates of the target materials and at least not harm the recycling rates for non-target materials. However, if the existing kerbside provision for recycling at home was improved, this would still not address the increasing need for recycling outside the home faced by society.
41 See Annex D 42 See Annex D 43 Mentioned in response to the call for evidence. See: http://ec.europa.eu/eurostat/tgm/refreshTableAction.do?tab=table&plugin=1&pcode=ten00063&language=e n
22
VOLUNTARY & ECONOMICS INCENTIVES WORKING GROUP REPORT
Experience from other countries/states with a DRS shows that they often improve the quality of material collected, as containers are generally cleaner and there is less contamination with non-target materials. Examples include:
• South Australia, where containers collected through the DRS receive a premium price when sold as recyclate to manufacturers over those collected via kerbside in other Australian states44.
• Alberta Canada, where containers from DRS’ are cleaner, typically derive a premium and are often sellable during the downside of market cycles when kerbside material is not45.
• Lithuania, where recyclers tend to pay a significantly higher price for DRS materials46. • Scandinavia and the Baltic region, where used beverage cans collected through DRS’ are
on average 5% better quality (less contaminated, by weight) than used beverage cans currently collected in the UK47.
British Glass feel that although a DRS would not increase the overall amount of glass collected for recycling, a well-designed DRS might improve the quality of glass that is collected. This could mean that a higher percentage of what is collected could be recycled back to glass bottles (closed loop recycling), instead of being used in ‘down cycled’ applications such as road building. Alongside evidence submitted to the call for evidence that using Reverse Vending Machines (RVMs) can prevent contamination and therefore reduce further processing costs, it was mentioned that manual DRS systems may not be as efficient at this.
A plastics reprocessor highlighted that UK Materials Recycling Facilities (MRFs) are designed to cope with current collection methods including contamination and that the MRF code has led to an improvement of materials through the supply chain (quality standards). However, we note that further improvements to kerbside collection and MRF processes would not address the gap in provision associated with recycling away from the home.
The view that a DRS could increase the quality, competition for, and therefore price of recycled material, was shared by many respondents. Coca-Cola European Partners (CCEP) mention that recycled material from countries with a DRS is not always more expensive (although it typically is), and that DRS material is not always better value for reprocessors as some are equipped to create high quality recycled material from non DRS derived sources. Respondents mentioned a can recycling facility in the UK which is able to accept used beverage cans of variable quality due to its investment in pre-treatment facilities. Particular concern was raised that a potential price increase of plastic sourced from a DRS could have an adverse effect on the UK plastics market. However, if businesses are willing to pay the
44 Boomerang Alliance response to the call for evidence. 45 Beverage Container Management Board (BCMB) response to the call for evidence (regulator for the Beverage Container recovery system in Alberta Canada). 46 Užstato Sistemos Administratorius (USAD) response to the call for evidence (management organisation of the DRS in Lithuania). 47 Ball Corporation response to the call for evidence.
23
VOLUNTARY & ECONOMICS INCENTIVES WORKING GROUP REPORT
premium for higher quality material then this could be because they can reduce costs elsewhere / make greater profits from the onward sale of a product (e.g. reduced sorting costs, less need for ‘dilution’ with virgin materials etc.). There was also concern raised that, depending on the design of a DRS, it could remove high quality material from kerbside collection, which could threaten the financial and operational viability of schemes. The Environmental Services Association (ESA) noted that a well-designed system that increases the quality of material could lead to an increase in recycled content used by UK packaging manufacturers. One large food and drink company mentioned that if we cannot collect, sort, process and recycle drinks bottles or other packaging at an appropriate and stable market rate, it will be very difficult for all manufacturers to increase the amount of recycled plastic in their packaging.
Other potential environmental impacts of a DRS
A number of respondents mentioned carbon emissions and the impact a DRS may have on these. Some highlighted that recycling single use drinks containers leads to reduced carbon dioxide emissions compared with manufacture of single use containers from virgin materials, or hypothesised that pollution associated with the use of virgin materials would be reduced through introduction of a DRS. Others felt returning containers to claim back deposits could lead to additional journeys or that there would be additional carbon use from collecting drinks containers from RVMs and transporting them to processing centres. This is dependent on the design of any potential DRS alongside consumer behaviour. CCEP modelling related to Scotland showed that if a DRS which improved the capture and recycling of packaging with high embedded carbon (the carbon impact of manufacture) were to be introduced in Scotland, then the carbon impacts from collection, shipping and counting related to a DRS could be offset.
Another concern raised by respondents was the hygiene impact of retailers potentially handling returned drinks containers (especially in proximity to food) either through stores or delivery of online shopping (if these delivery vans could accept material covered by any potential DRS). The use of resources (energy and water) for potentially cleaning returned containers was also mentioned. Again whether these concerns materialise depends on the design of any potential DRS; there was no evidence submitted alongside these concerns.
Individuals and organisations mentioned the potential reduction in marine pollution (especially from plastic) with introduction of a DRS, due to increased capture of material that would otherwise be littered.
DRS alongside kerbside collection for recycling
Overall it was felt that local authority costs for household collections for recycling and associated costs would fall if a DRS was introduced (including the assumed reduction in
24
VOLUNTARY & ECONOMICS INCENTIVES WORKING GROUP REPORT
residual waste), but that income would also fall from the loss of revenue and fall in value of remaining material collected for recycling. There would be local variation with this depending on local authority structures (two tier authorities or not), contracts and citizen behaviours amongst other things. Modelling and studies discussed below suggest that there could be overall savings to local authorities from the introduction of a DRS.
A recent study by Eunomia on the impacts of a DRS on local authorities indicated savings for local authorities overall, but less so for currently higher performing local authorities48. Eunomia scaled up the mean average estimate of cost savings over 4 high performing local authorities to give an estimated net saving to local authorities over England as a whole close to £35million per annum49. However, a number of respondents claimed the methodology used by Eunomia was invalid and therefore that the figures should be discounted. Eunomia undertook some modelling work in Scotland where they estimated that a DRS could save local authorities £4.6million per annum from kerbside costs and £0.78million from costs associated with household waste recycling centres50. A Reloop assessment compiling municipality impacts of existing and proposed/potential DRSs across the globe mentions 20 cases studied or modelled where municipalities showed or would be expected to achieve net cost savings related to a DRS51.
Consideration would need to be given to two tier authorities where waste collection authorities and waste disposal authorities would face different potential costs/savings. More detailed modelling on specific UK wide DRS designs would be needed to better understand the potential impacts on local authorities.
Effect of a DRS on local authority litter costs
Overall, introduction of a DRS is thought likely to reduce costs associated with clearing litter, supported by a number of international studies/models. Although costs cannot be directly compared to the UK, international examples of studies supporting this include one from New South Wales (NSW) Australia (stating costs to state and local governments would reduce by 40%)57, and a Dutch study which showed expanding the current DRS could reduce
48 Impacts of a Deposit Refund System for One-way Beverage Packaging on Local Authority Waste Services, Eunomia, October 2017, available for download at: http://www.eunomia.co.uk/reports-tools/impacts-of-adeposit-refund-system-for-one-way-beverage-packaging-on-local-authority-waste-services/ 49 Ibid 50 Eunomia, A Scottish Deposit Refund System, May 2015: http://www.zerowastescotland.org.uk/sites/default/files/ZWS%20DRS%20Report_MAIN%20REPORT_Final_v2 .pdf 51 Reloop and CM Consulting, Studies confirm that Container Deposit Systems show big net savings to municipal budgets: http://reloopplatform.eu/wp-content/uploads/2016/06/Summaryof-studies_impact-of-DRS-on-munis-FINAL-31May2016.pdf 57 Boomerang Alliance response to the call for evidence.
25
VOLUNTARY & ECONOMICS INCENTIVES WORKING GROUP REPORT
litter related costs by up to 80 million Euros per year52. Zero Waste Scotland think that direct savings to local authorities on litter clearance from introduction of a DRS in Scotland would probably be between £3-6million53. A recent Eunomia report on the impacts of a DRS on local authority waste services in England suggested that cost savings could be realised on street scene services, such as removing litter bins and reducing the need for manual litter pickers54. LARAC believes that if a DRS is introduced in the UK then local authorities should be able to realise savings from street cleaning and park cleaning activities. However they feel it is unlikely that savings from pure mechanical street sweeping will occur as drink containers are not a large part of the material they collect. LARAC also state savings may be possible in terms of costs associated with litter bin provision and emptying and litter picking (such as operations in pedestrianised areas), and that it is likely that there is more potential for savings in urban areas compared to rural. One waste partnership mentioned that they use a recycling facility to process street sweepings and that a DRS should see less contamination in these sweepings, which would in theory reduce the cost of treatment/disposal marginally.
Some respondents, however, felt that collection costs for littered materials were not likely to reduce, and mentioned the small proportion of drinks containers in litter (by item count, discussed above). Local authorities mentioned the potential for people looking for drinks containers in others’ kerbside bins/boxes or people potentially leaving drinks containers by bins for others to collect and redeem deposits from, both of which could cause further litter. A number of respondents also mentioned potential ‘bin mining’ (people looking through street bins for deposit bearing drinks containers) and that this may increase litter.
There are evidence gaps in litter data, and further modelling would be needed, based on specific DRS designs, in order to better understand the potential relationship between any proposed DRS and local authority costs associated with litter clearance.
52 Recycling Netwerk Benelux response to the call for evidence. CE Delft, Kosten en effecten van statiegeld op kleine flesjes en blikjes, August 2017. Available for download: https://www.rijksoverheid.nl/documenten/rapporten/2017/08/31/kosten-en-effecten-van-statiegeld-opkleine-flesjes-en-blikjes 53 Zero Waste Scotland, Deposit Return Evidence Summary, June 2017: https://www.zerowastescotland.org.uk/sites/default/files/Deposit%20Return%20Evidence%20Summary.pdf 54 Impacts of a Deposit Refund System for One-way Beverage Packaging on Local Authority Waste Services, Eunomia, October 2017, available for download at: http://www.eunomia.co.uk/reports-tools/impacts-of-adeposit-refund-system-for-one-way-beverage-packaging-on-local-authority-waste-services/

26
VOLUNTARY & ECONOMICS INCENTIVES WORKING GROUP REPORT
Other potential benefits of a well-designed and well-run DRS
Other potential benefits of a DRS mentioned by respondents included:
• Culture change: containers will have a visible value attached to them and may potentially not be seen by consumers just as waste, therefore fewer people may think it is acceptable to litter.
• Positive media and public response to the introduction of a DRS, which could positively influence customer participation with the scheme.
• Employment: some respondents felt that employment opportunities would be created by introduction of a DRS, this included in collection, administration and business opportunities for recyclers. A Eunomia report from 2011 estimated the net employment benefit from a UK wide DRS at around 3,000 – 4,300 full-time equivalents55.
• Benefits to community groups: It was mentioned that depending on the level of deposit in a DRS, this could incentivise local community groups to do collections as a means for fund raising. An example was provided of the Scouts of South Australia who received over 90 million containers through their collection centres in 2015 which created in excess of $9 million in refunds for the community56.
• Life cycle benefits and producer responsibility: respondents felt that increased innovation in design would be driven by a DRS (mostly individuals) and that a wider range of potential end markets for recycled materials could open up. However, the current lack of domestic recycling infrastructure for reprocessing any material which would potentially be covered by a DRS was mentioned by respondents alongside the current drivers to export material for recycling. Some thought that a DRS run by producers with them meeting its cost would lead to greater producer responsibility and an incentive to operate the DRS efficiently (a good design).
• Increased footfall at retail sites with collection facilities: the National Federation of Retail Newsagents (NFRN) commented that customers returning bottles may increase footfall in shops and lead to extra sales if people spent the refunded cash/voucher in store. One RVM provider also stated that customers who enter stores to use RVMs have a higher average spend than ‘regular customers’.
The potential benefits and costs of a DRS and extent of these depends on the design features of the system.
55 Dr Dominic Hogg, Dr Debbie Fletcher, Maxine von Eye, Kate Mulcahy, Timothy Elliott; From waste to work: the potential for a deposit refund system to create jobs in the UK, 2011. Report prepared for Campaign to Protect Rural England: https://www.cpre.org.uk/resources/energy-and-waste/litter-and-flytipping/item/download/865 56 Boomerang Alliance response to the call for evidence. See also: http://www.epa.sa.gov.au/environmental_info/container_deposit/testimonials
27
VOLUNTARY & ECONOMICS INCENTIVES WORKING GROUP REPORT
Costs associated with a DRS
There are various costs associated with the setup of any DRS and its subsequent ongoing operation. These vary depending on the model/type of DRS considered.
Reverse Vending Machines (RVMs): Unless a completely manual DRS collection system is used (where someone hands back their drinks container to a member of staff in a shop for return of a deposit - which respondents generally do not mention or appear to support), RVMs will be needed. Respondents quoted a range of costs for these machines. The range for purchase costs of RVMs was quoted by the British Retail Consortium at 15,000 Euros for a 1 metre square machine (more labour intensive) to up to 80,000 Euros for a more advanced machine, all other RVM purchase costs quoted by other respondents fall within this range. A German study mentioned the average RVM purchase cost to be 30,000 Euros, with installation at 3,500 Euros57. Eunomia estimates £30,000 for purchase of a small RVM, with £2,000 installation fees and £2,700 annual operating costs58. The Packaging Federation estimate RVMs cost circa £15,000 – 30,000 each, and that up to 30,000 of various types would be needed making a total cost of between £450 to £650m for a DRS in England. Alupro / The Metal Packaging Manufacturers Association / Valpak estimate 400-900m Euros for all RVMs which would be needed to setup a DRS in England. An alternative would be leasing RVMs. The Food Packaging Association quote RVM leasing to be £5,500 (it is unclear whether this is per annum), which is comparable to figures mentioned by respondents for the DRS in Lithuania, where 1000 machines were leased at 5.7million Euros per annum (5,700 Euros per machine) on a 5 year agreement. Please see the section below on handling fees for further discussion on these costs.
Setup and Operation: The setup costs for a DRS varied widely amongst respondents. CocaCola European Partners estimate the cost for Great Britain (GB) between £200-400m depending on design, and the British Plastics Federation estimate 750m Euros for the UK. The range of annual operation costs for a DRS in England was estimated by respondents at £700million plus to £1billion annually.
One large supermarket estimated that if each of their stores had one small RVM, their initial costs would be over £20million, but if they increased RVM numbers to a figure they feel is more realistic their initial costs for a UK wide DRS would rise to over £100m for small RVMs alone. One retailer estimated the costs of installing machines across the UK at £90 million in its own stores.
57 The Packaging Federation response to the call for evidence. See: Roland Berger and AGVU, European Packaging Policy, The consequences of a deposit system for disposable packaging based on the German example, June 2007. 58 Eunomia, A Scottish Deposit Refund System, Appendix to the Final Report for Zero Waste Scotland, May 2015: http://www.eunomia.co.uk/wp-content/uploads/2015/05/ZWS-DRS-Report_APPENDIX_Final.pdf based on discussions between Eunomia and TOMRA.
28
VOLUNTARY & ECONOMICS INCENTIVES WORKING GROUP REPORT
Alupro’s own modelling indicates that an English wide scheme would have a turnover of between £3 – 4bn per year, at a deposit charge of £0.15 to £0.20 per container59.
Setup costs for any DRS would not need to simply cover RVMs. Depending on DRS models costs could also need to cover:
• Staff costs: training and potentially extra staff to oversee the operation of RVMs (including dealing with customer complaints and machine failure), and potentially call centres to manage customer queries.
• Infrastructure changes: to accommodate RVM installation, such as power cables under carparks, store remodelling, storage, and Wi-Fi if machines are connected to one another.
• Clearing centres for processing returned containers. • Setup of a Deposit Management Company.
• IT, administration and communications.
Operational Costs include:
• Transport: haulage, road usage, carbon emissions and operations at each RVM site. • Floor space: some respondents are concerned that RVMs in stores may reduce sales
profit/square metre. The Association of Convenience Stores (ACS) estimate this loss at £7,689 to £38,445 per year for each convenience store60. However it is unclear whether an RVM may encourage increased footfall in such stores.
• Various respondents mentioned DRS models in operation in other countries where ‘handling fees’ are paid to retailers/stores where RVMs are located (see below).
• Ongoing costs for each of the areas mentioned in setup costs above.
No full impact assessment of the costs and benefits of a DRS for England/the UK was put forward in response to the call for evidence, and what was received varied greatly in scope, definitions and estimates, making an aggregate assessment impossible. However, the information provided will be helpful for any further work on this.
Models for a well-designed DRS:
Respondents mentioned elements which they felt were included in well-designed DRSs in other countries, or which could optimise the effectiveness or cost-benefit of a DRS in England, under various questions in the call for evidence, and so we have decided to consider these together here.
There are a diverse range of DRSs operating in other countries. Respondents have cautioned against drawing direct comparisons with the UK due to its particular and well established
59 Alupro response to the call for evidence. 60 Association of Convenience Stores (ACS) response to the call for evidence.
29
VOLUNTARY & ECONOMICS INCENTIVES WORKING GROUP REPORT
kerbside collection system, this is discussed further later in the report. Respondents also mentioned that a UK wide scheme, rather than England only, would be ideal. This would avoid different systems in Devolved Administrations, cross border issues, and provide consistency for producers and retailers, for example.
Most respondents agreed that to optimise effectiveness of a DRS there needs to be a legal basis, i.e. legislation/regulation, for any system chosen. Some respondents mentioned prescribed targets, some Trade Associations feel participation must be mandatory, whereas ACS mentioned Norway and Sweden’s retailer opt-in systems. It was highlighted as important that no organisation should be able to gain a competitive advantage from not engaging in a DRS. Some respondents mentioned they felt the entire supply chain should be involved in the development and running of a DRS, though did not always specify further what this would mean in practice (see below). Transparency and a promotional obligation for a potential scheme were identified as important elements.
The following potential elements for a DRS model were taken from the DRSs respondents described which operate in other countries, or were model components that respondents suggested (also see Annex Cc):
• Deposit Management Organisation (DMO): the system operator which government could legislate for the establishment of. It was suggested that this be not-for-profit. Respondents mention these organisations are typically owned by companies with the obligations to demonstrate agreed levels of recovery (normally beverage companies and with potentially retailer input). Obligated parties (producers, importers and retailers) can be mandated to own or join these. The DMO could be responsible for the detailed design, implementation, funding and governance of a DRS. This DMO was also described as the ‘operational board’.
• Independent non-profit steering board: Some respondents stated this could include all stakeholders in the DRS across all parts of the supply chain including producers, waste managers, local authorities and retailers. Others suggested the make-up of the board would be dependent on the proposed scope of any future DRS. For example, CCEP highlight that because a range of competing waste management companies and Reverse Vending Machine suppliers may be contracted by the DMO to provide services they should have no, or a limited, role in the DMO’s management. It was suggested by respondents that this board be apolitical. This could have separate management and staff from the DMO. This steering board was also described as the ‘primary board’. It was suggested that a DRS could undergo yearly reporting/reviews and there could be the option to evaluate deposit levels if the incentive was not effective enough.
• A decision would need to be made over whether a potential DRS would have a single provider or multiple providers (for the latter it was suggested there could be interface burdens and duplication of cost, however multiple providers may generate competition). CCEP feel that there should only be a single provider in any potential DRS.
30
VOLUNTARY & ECONOMICS INCENTIVES WORKING GROUP REPORT
• Handling fees (which are in effect payments) – these are paid to ‘collectors’ who typically have an RVM in their store, but can also be paid for manual collection (in Estonia the manual collection handling fee is approx. 3 times lower than the RVM handling fee to incentivise retailers to use a more cost effective RVM). CCEP explain this is to cover the costs of funding, installing, maintaining and operating the collection point. Boomerang Alliance61, who have been involved in the development of DRSs in various Australian States explain “handling fees paid to collectors include estimates for capital investment and other set-up costs; typically, the collection centre has a return on investment that sees the capital investment paid off in less than 5 years while the equipment’s life span is closer to 20 years.” NFRN supports a DRS model where retailers could choose to use RVMs / manual collection systems. ACS explains anecdotally that in the Netherlands retailers have called for container collection points to be relocated from stores because the processing cost associated with the DRS significantly outweighs the handling fee. The level of handling fees and how they would be set and controlled should be considered in any detailed modelling that is carried out on possible DRS designs to ensure that RVM hosts are not adversely affected and cannot be exploited by collectors.
• National logistics, regional counting/processing centres, a software system to administer the system and monitor container movements.
• Financing: Some respondents stated that a scheme should be self-financing, however it is unclear precisely what respondents meant for the scope of this. o CCEP states that typically the set-up costs of a scheme are covered by a Deposit
Management Organisation, either by issuing shares to its owners or taking loans from its members.
o The costs of the provision of the Reverse Vending Machines are either borne by the Retailers or the Deposit Management Organisation in CCEP’s experience.
o The annual running costs are met by a combination of the unredeemed deposits (though the aim of a DRS is to encourage return of containers), the value of collected materials and the shortfall covered by obligated companies (an industry/producer fee). The industry/producer fee is impacted by the value of unredeemed deposits and the value of materials collected. Where obligated companies manage the Deposit Management Organisation, they are therefore incentivised to do this in the most cost-effective way to minimise their fees, whilst also ensuring there is no incentive to allow high levels of unredeemed deposits to fund the system (though it was also suggested by some respondents that there should be no vested interests in the daily operation tied to the needs of a scheme). Some respondents felt that producers should be mandated to participate in a DRS.
• Designed to make it easy for consumers to participate.
61 A community organisation involved in the development of schemes in New South Wales (NSW), Queensland (QLD), Northern Territory (NT), Australian Capital Territory (ACT) and Western Australia (WA) Australia. Sit on the Ministerial Advisory Committees on Container Deposit Schemes in NSW, QLD and WA.
31
VOLUNTARY & ECONOMICS INCENTIVES WORKING GROUP REPORT
• Be subject to good governance and fraud control.
• Not be subject to VAT.
Some local authorities mentioned in their responses that if a DRS was introduced they should receive deposits for any containers collected in kerbside recycling. It was also mentioned in response to the call for evidence that the revenue from unredeemed deposits could hypothetically be used to finance other environmental programs, such as household recycling, however this contrasts other feeling amongst respondents that the financing of any potential DRS should be ring-fenced.
A number of respondents are concerned about ‘registration/joining/entrance fees’ which operate in Germany and Finland’s systems and are paid by retailers collecting containers. In Germany this fee increases if retailers process over a certain number of containers. ACS estimate that if England was to replicate a joining fee, like in Germany, the convenience sector would pay over £39million. These fees would be something for further consideration if a decision is taken to investigate potential DRS designs further.
NFRN feel that the economic burden of the scheme should be apportioned fairly between container type to reflect the real system costs and value applicable to the different types of containers and that no cross-subsidising between materials should take place. One Canadian Regulator adds a container recycling fee to each container at point of purchase, alongside the deposit value, with only the deposit value being refundable.
It was suggested that pubs/bars could benefit through participation in a DRS through receipt of a handling fee and some of their recyclable material being collected through a DRS, rather than through a waste management contract. The British Beer and Pub Association is concerned about adverse effects they feel may occur if the pub industry were to be in scope of a potential DRS, and has urged that businesses in the beer and pub sector be considered for an exemption. Their concerns include resourcing, staffing, financial pressures and collection of drinks containers and refunding deposits for those not purchased on-site. Some of these would depend on the design of a potential DRS.
All the European DRS schemes mentioned in the responses to the call for evidence and in Annex D focus on rigid beverage packaging. Members of the Working Group note that many schemes in North America which include flexible packaging (e.g., drinks cartons/Tetra-Pak) tend to have lower overall reported collection/recycling performance. These systems would also likely need more manual collection points or more sophisticated RVMs.
As a group, we feel that the design of any DRS should minimise the potential adverse effects on the kerbside collection system for recycling and should not threaten viability of kerbside schemes. Further analysis would be needed to calculate the likely impact of various DRSs on local authorities.
32
VOLUNTARY & ECONOMICS INCENTIVES WORKING GROUP REPORT
Consumer responsiveness to DRSs
Many respondents to the call for evidence thought that the general public would be supportive of a DRS. Reloop commented that from North America to Australia and across Europe, deposit return legislation has historically enjoyed widespread public support.
Evidence from other countries suggests that the level of return rate achieved by DRSs depends on the design of the system, including factors such as the deposit rate, the siting of the collection points and the ease and convenience of the system for consumers. Public education was also mentioned as something which could directly affect the performance of a DRS. A large supermarket chain flagged that even modest price changes can alter customer behaviour. One respondent suggested that visibly separating the cost of the deposit from that of the bottle may minimise the risk of increased price negatively affecting sales.
There is no evidence of how consumers in England would respond to any potential DRS. There is also evidence that, if asked, citizens will tend to over-claim any behaviours that are widely acknowledged to be ‘good’ such as recycling62. One large drinks company mentioned that many DRSs around the world experience a deficit in the amounts claimed back versus the amounts deposited. This could be viewed as a source of funding for a DRS and align with the ‘polluter pays’ principle, or as in the drinks company’s view, a de facto tax on consumers who do not have the time, ability and/or inclination to find a convenient return centre. Consumers who are not able to return bottles may be unfairly penalised. The Behavioural Insights Team cautioned that poorly designed incentives can have adverse or unintended consequences on behaviours. For example, a deposit rate which is too high could signal that the behaviour of returning a container deserves ‘being paid for’, which implies customers are being asked to participate in an undesirable behaviour. Effectively a balance must be struck between a deposit rate that incentivises return (we know that charges, payments and rewards can give positive signals that reinforce the desired behaviour) whilst not going against people's existing intrinsic motivation. There is the possibility that introduction of a DRS could lead to consumers developing more pro-environmental identities, and positively changing their behaviour in areas outside the scope of any DRS, such as littering or recycling69. However, sometimes increased positive behaviours in some areas can be offset by reductions in other behaviours, for example people may view their participation in returning containers via a DRS as ‘doing enough’ for the environment and could therefore reduce other environmental behaviours63. This would need monitoring if a DRS were to be introduced.
62 This is known as ‘social desirability bias’ and is widely acknowledged as a problem in social research surveys. For further information see: Grimm, P. 2010. Social Desirability Bias. Wiley International Encyclopedia of Marketing. 2. : http://onlinelibrary.wiley.com/doi/10.1002/9781444316568.wiem02057/abstract 69 Journal of Economic Psychology, Volume 47, April 2015, Pages 1-16; Like ripples on a pond: Behavioral spillovers and their implications for research and policy, Paul Dolan, Matteo M. Galizzi. 63 Ibid
33
VOLUNTARY & ECONOMICS INCENTIVES WORKING GROUP REPORT
Tesco previously ran a return and reward scheme across 101 of their stores, which gave loyalty points to customers returning plastic, glass and cardboard (launched in 2007). The business felt that the level of incentive was not enough to persuade customers to use the machines despite being only a cost to the business and not the consumer. Tesco also mentioned that litter and fly-tipping increased at these sites and the machines were vandalised. One respondent, an RVM provider, mentioned a 2013 Scottish pilot (the IKEA recycle and reward project) where RVMs were present at IKEA stores in Edinburgh and Glasgow and accepted return of plastic bottles, drinks cans and glass bottles purchased in store for either a discount voucher to use in store or a donation to charity. 94% of IKEA Edinburgh customers and 91% of IKEA Glasgow customers reportedly wanted the pilot to continue.
When looking at Europe and US states with DRSs, the average return rate for schemes with deposits of less than $0.10USD is 71%, whereas for schemes with a deposit value of more than or equal to $0.10USD the average return rate is 86.7%64. These DRSs were not all introduced at the same time. There is a tendency with all economic incentives for their success rates to gradually decrease over time, as the relative value of the incentive becomes lower for individuals. The location of the take-back facilities, whether they are ‘return to depot’ or ‘return to retail’, is also different across these schemes. It is essential that any potential DRS model incorporates a convenient return system for consumers and an appropriate deposit to encourage participation.
Respondents to the call for evidence feel that evidence supports ‘return to retail’ collection having a higher return rate for drinks containers (such as DRSs in Norway and Germany) than ‘return to depot’ collection (such as parts of the USA and Australia). However, ‘return to retail’ was felt to be more costly to those hosting the return points. Other potential locations for a DRS could include transport hubs (such as Beijing where inserting a plastic bottle into an RVM rewards commuters with credit for their travel pass or mobile phone65), town centres, sports/entertainment venues or workplaces.
In December 2015, A G Barr stopped accepting returnable glass bottles (for a refund of 30p) due to the improvement in kerbside recycling and the reduction in bottles they were seeing returned as people used the kerbside system66. It is also important to note that the A G Barr system was for glass drinks containers, and since its introduction there has been a considerable rise in PET use for drinks containers. Consumers in England are accustomed to using the kerbside collection for recycling system, bring sites and household waste sites, and so any potential DRS would have to build on and complement these systems without threatening their viability.
64 CM Consulting and Reloop, Deposit Systems for One-Way Beverage Containers: Global Overview 2016: http://www.cmconsultinginc.com/wp-content/uploads/2017/05/BOOK-Deposit-Global-24May2017-forWebsite.pdf 65 INCOM Recycle Co. Ltd. See: http://www.incomrecycle.com/en/ 66 A. G. Barr. See: https://www.agbarr.co.uk/about-us/faqs/
34
VOLUNTARY & ECONOMICS INCENTIVES WORKING GROUP REPORT
Minimising the potential for adverse effects
Businesses including retailers
• Various cost concerns were raised, these included the cost of purchasing/leasing RVMs (which would depend on the potential design of any DRS), concern that RVMs taking up space in stores would lead to a loss of revenue from less space to stock/sell product and hence reduced consumer choice (ACS felt this could be between £7,689 and £38,445 annually for each convenience store) and that the crediting of the deposit and any handling fee needs to be quick, accurate and reliable so as not to disrupt the cash flow of small businesses. A large drinks company noted recent pressures on business: inflation and devaluation of the pound, the Soft Drinks Industry Levy (April 2018) and the upcoming Treasury call for evidence on single-use plastics. Respondents state it is important that government considers litter and recycling policies in a co-ordinated manner.
• The general consensus among respondents to the call for evidence seems to be that manual collection would put various pressures on retailers. However, CCEP highlight that in the most effective schemes they are aware of, manual solutions have a role to play in smaller outlets, and that obligating RVMs where they are not needed can significantly increase the set-up and running costs. Reloop have suggested that the majority of European schemes are automated (including Sweden, Norway, Finland and Estonia) and that around 95% of collection points are automated67. Respondents’ concerns about manual collection include increased time to process customers (reduced speed of service) which may drive away custom and could reduce staff productivity – it has been suggested that the cost of physically managing returns (potentially needing extra staff, needing an IT system to update a central database, needing to purchase sacks to store containers for example) could be higher than the value of the potential deposit. However, further work would be needed on various designs for any potential DRS and the costs involved, including who would cover these.
• Storage concerns for collected materials at small retailers were mentioned alongside the need for collections from shops for processing being regular and reliable. It was suggested that an exemption could apply to smaller retailers with limited storage space. Community RVMs at, for example, a parade of shops, in a food court, in a park or at a shopping centre were all mentioned as solutions. The question was raised over whether physically located companies would have to provide the collection service for online companies. The design considerations for any potential DRS would need to address this, as, for example, a bottle purchased online could be consumed outside the home.
67 Reloop response to the call for evidence. Also: CM Consulting and Reloop, Deposit Systems for One-Way Beverage Containers: Global Overview 2016: http://www.cmconsultinginc.com/wpcontent/uploads/2017/05/BOOK-Deposit-Global-24May2017-for-Website.pdf
35
VOLUNTARY & ECONOMICS INCENTIVES WORKING GROUP REPORT
• It was mentioned that the hospitality sector is diverse and includes many small and medium sized enterprises (SMEs) and that operational models would need to consider this. The British Beer and Pub Association (BBPA) has a particular concern about the impacts on the pub industry (mainly small businesses), as they may not have the resources to deal with a DRS. They argue that their members should be exempt if the focus is drinks containers consumed outside the home or other premises. Consideration would need to be given as to how the hospitality sector and pubs may or may not be involved in any potential DRS.
• There was also concern that a DRS could induce a shift in custom from convenience stores to larger retailers/discounters.
Local authorities’ kerbside recycling
Respondents advocated under various questions that kerbside recycling schemes should be protected from potential adverse effects with the introduction of any DRS. Some respondents to the call for evidence thought there would be the potential for increased kerbside recycling costs for local authorities if a DRS were introduced, and suggested that producers should compensate local authorities if it were to occur. As described earlier, others suggest that local authorities’ costs may decrease with introduction of DRS due to reduced street clean-up costs, for example. Further analysis on the potential positive or negative cost impacts of DRS designs on local authorities is needed.
Consumers
Respondents felt that a public communications campaign would be needed to explain the introduction of any potential DRS. It was felt that if consumers viewed a deposit on a drinks container as a tax, and did not understand that the deposit could be reclaimed upon return of the container, it could be seen as a regressive measure. The idea that consumers may alter their buying behaviour due to the perception that drinks in scope of a DRS are not value for money could also be partially addressed by a communications campaign. There is a commercial risk that consumers may alter their purchasing choices as a result of a DRS.
The Food and Drink Federation mentioned that paying back of deposits on return of empty drinks containers could lead to a perception amongst consumers that recycling should be financially rewarded, and hence could negatively affect participation in kerbside recycling schemes. Other respondents suggested that a DRS could lead to people stockpiling in scope containers at home and returning these in bulk to collect deposits, which could lead to disruption in stores, alongside potential increases in traffic (however this may not be the case if people were to return containers before doing their usual shopping).
It is important that any potential DRS is easily accessible for all consumers.
36
VOLUNTARY & ECONOMICS INCENTIVES WORKING GROUP REPORT
Economic indicators and macroeconomics
Respondents highlighted that the cost effectiveness of recycling plastic bottles back to food grade plastic pellet is affected by energy costs and crude oil prices. If minimum standards for recycled content in packaging were set, this would send a strong market signal for investment in the infrastructure required to support recycled materials over virgin-source materials, and would mitigate some risk to potential re-processors caused by uncertainty in feedstock68.
Respondents felt that there should be no VAT on the deposit value of any containers covered by a DRS. It was also mentioned that government would need to consider whether it would need to adjust how it calculated inflation, as it was perceived that implementation of a new system would need this, however, if the whole price increase on drinks containers is from the deposit which is then returned to the consumer this may not be an issue.
A large drinks company mentioned that it was important that any potential new scheme does not discriminate against certain companies or distort competition in the market. They mentioned that the portfolios of UK soft drinks manufacturers differed radically, with some more focussed on products usually consumed outside the home or using certain materials more than others. They therefore feel that if any ‘reward and return’ scheme was mandatory and applied to all drinks container materials across all channels (alcoholic and non-alcoholic), this could negate these concerns.
Another consideration is that if containers of various sizes had the same deposit value, this could influence purchase patterns and disproportionally affect smaller container sizes69.
Fraud and enforcement
Respondents noted that a UK wide scheme would be preferable, rather than a scheme just for England, as this would prevent cross-border fraud between Devolved Administrations and England. This issue of how to address potential fraud if a DRS were to be introduced in Northern Ireland but not the Republic of Ireland was raised.
A number of respondents mentioned use of barcodes, security labelling for ‘in-scope’ products (which would be read and confirmed at return) and the destruction/labelling of collected material as ‘spent’ (once returned) as measures to address potential fraud in any DRS system. This can be simpler with an RVM than with manual collection. It was felt that a
68 Greater London Authority response to the call for evidence. 69 The Packaging Federation and Industry Council for Packaging and the Environment (INCPEN) responses to the call for evidence.
37
VOLUNTARY & ECONOMICS INCENTIVES WORKING GROUP REPORT
barcode alone on a container may not be sufficient to prevent fraud, and that manual collection could lead to payment of deposits on containers not ‘in-scope’ if a collection point does not have technology to read an electronic security label. Compaction/shredding of returned containers was described as a further method to prevent fraud, which it was thought could also reduce transport and handling costs in a potential DRS.
Random inspections and audits were suggested to minimise fraud.
Depending on the ‘in-scope’ drinks containers in any potential DRS, some people may take containers from others’ kerbside collections, bring banks and public litter bins in order to claim income. There are instances of people returning containers they did not pay the deposits on in other countries, and so consideration would need to be given to this and any associated potential adverse effects on litter.
Health and safety
Health and safety concerns were mentioned especially in respect to manual collection of returned drinks containers. It was felt that any potential DRS would need to be assessed in the context of existing Health and Safety Regulations, for example with manual collection (if this was to be involved in any potential DRS), operational standards addressing collection and storage in relation to food hygiene, broken containers and the potential for attracting pests would need to be addressed.
DRS alongside England’s existing waste management systems and regulations, and examples of other countries - with household and town centre recycling systems similar to England – where successful deposit return or reward and return schemes currently operate
This was asked in the call for evidence as two separate questions, however responses were broadly similar. Perhaps this is because concrete evidence of how a DRS could work in England has not been established, or as some respondents mentioned, they feel that England’s existing packaging waste management systems and infrastructure for recycling need reform before a potential DRS is introduced. Respondents pointed out that in a number of countries, a DRS was introduced before a comprehensive kerbside collection for recycling system, or other producer responsibility waste management systems, so the impact on local authority collections may not be comparable with the UK situation.
Annex D contains a table summarising details of other countries with a DRS, whether or not kerbside recycling is offered and reported rates of recycling ‘in-scope’ materials. This is for basic cross-comparison purposes. We recognise that the social, economic, infrastructural and demographic contexts are different in each country or state.
38
VOLUNTARY & ECONOMICS INCENTIVES WORKING GROUP REPORT
Norway, Finland and Germany all successfully operate a combination of DRS and kerbside systems and have been highlighted by respondents. Reported recycling rates for PET packaging in these three countries range from 92-98%, for cans the rate is 96-97% and for glass Finland reports a rate of 89% (all considerably higher than current UK estimates)70.
Respondents suggested New South Wales in Australia had some similarities to England due to an existing advanced kerbside recycling service, a municipal recycling rate close to England, and some cultural similarities. This state introduced a DRS in December 2017 which covers most 150ml – 3L PET, HDPE, glass (but not wines and spirits), aluminium, steel, and liquid paperboard drinks containers. It aims to reduce the volume of litter in the state by 40% by 202071. Return can be via an RVM and may also include local shops (with potential for over-the-counter collection), depot sites and recycling centres. Other return options are donation to local charities, schools or community groups or via continuing to use the existing kerbside system. It is too soon at this point to assess the success of the scheme.
Queensland Australia is due to implement a DRS later this year. They have indicated in their discussion paper for this that experience from other jurisdictions shows many households continue to use the kerbside recycling scheme72. One proposed model for not adversely impacting material recovery facilities upon introduction of the scheme is that they could sort containers and claim back the deposits for those eligible, or receive a container refund based on an estimate of the number of containers they receive73.
In December 2017 a report was published for Repak Ltd (undertaken by PMCA Economic Consulting) which concluded that a DRS would adversely affect Ireland’s existing packaging recycling system, would not increase recycling rates for packaging, would be complex and would involve high costs for producers and retailers (with some costs passed on to consumers)74. It is worth noting that Ireland ranks highly against other EU countries in packaging recycling performance, with the overall recycling rate for all packaging waste at 67.5% in 201575. The quantitative analysis also revealed that beverage containers (including beverage cans and bottles for both alcoholic and non-alcoholic drinks, but excluding drinks cartons) had a share of just 3% of all litter pieces in Ireland in 201676. Two major reviews of
70 See Annex D 71 See http://www.epa.nsw.gov.au/your-environment/recycling-and-reuse/return-and-earn 72 Queensland Government, Department of Environment and Heritage Protection, Implementing Queensland’s Container Refund Scheme, Discussion Paper, July 2016: https://www.ehp.qld.gov.au/waste/pdf/qld-containerrefund-scheme-discussion-paper.pdf 73 Ibid 74 PMCA Economic Consulting, Dr Pat McCloughan, Report on the proposed deposit and return system for beverage containers in Ireland, December 2017: https://www.repak.ie/wp-content/uploads/2017/12/PMCAReport-on-Deposit-and-Return-Scheme-in-Ireland-041217-FINAL.pdf prepared for Repak Limited. 75 Ibid 76 Ibid
39
VOLUNTARY & ECONOMICS INCENTIVES WORKING GROUP REPORT
waste policy commissioned by the Irish Government (in 2009 and 2014) both came out against introducing a DRS, concluding that the projected costs of establishing and operating a DRS were too high relative to the anticipated benefits77.
In 2017 a study was undertaken on the potential introduction of a mandatory DRS for packaging in Spain78. When the current EPR system was compared against a DRS for some drinks containers and an EPR scheme for other packaging, it was concluded that the introduction of a DRS would cause environmental harm in comparison to the current system when environmental indices and system processes were assessed79. The environmental indices measured in the detailed study were: acidification, global warming, eutrophication, ozone layer impact, impact of photochemical oxidizers, and depletion of resources80. The processes that were assessed were sorting, use of equipment, collection and transport, recycling, and landfilling/incineration81. The study concluded that the increased recycling rate of the DRS ‘in-scope’ material would rely on processes that entailed more pollution, primarily associated with the need for more equipment (machinery, bags and boxes) and the less efficient transport of the DRS ‘in-scope’ material that would be collected manually and un-compacted (54% of DRS ‘in-scope’ material by weight) involving a vast network of small establishments82. There are considerable differences between this and DRSs in operation in northern Europe. The Spanish study also concluded that the cost of management of DRS ‘in-scope’ packaging and other packaging would increase if a DRS were to be introduced in Spain alongside the current EPR system83.
Further information needed on DRS
The working group agree with respondents who suggested that further analysis is needed on the potential costs and benefits which would be associated with the potential introduction of any proposed DRSs. Further work respondents suggested included:
• Collection of more comprehensive data on existing material flows, including the proportion of residual waste, dry mixed recycling and litter which is made up of drinks containers.
• Full cost-benefit analyses of various DRS design options.
77 Ibid 78 UNESCO Chair on Life Cycle and Climate Change, ARIADNA Project, Sustainability study on the introduction of a mandatory DRS for packaging in Spain: comparative environmental, social and financial analysis versus current situation, June 2017: http://www.unescochair.esci.upf.edu/es/contratos-de-investigacion/526-ariadna 79 Ibid 80 Ibid 81 Ibid 82 Ibid 83 Ibid
40
VOLUNTARY & ECONOMICS INCENTIVES WORKING GROUP REPORT
• Further work estimating the impact of a DRS on local authorities (including the viability of kerbside recycling schemes and cost implications) and business for various DRS design options.
• Assessment of different design options for a DRS with a particular focus on maximising consumer participation, including the level of deposit and locations for collection points.
• Work to consider un-intended consequences of any DRS model. • Whether proposed schemes in different countries of the UK are compatible.
• Respondents suggested pilots of proposed DRS models, however CCEP notes that piloting a full DRS would be very challenging.
Other potential measures to reduce littering of drinks containers and promote recycling
The call for evidence asked respondents for their ideas for measures that could be used alongside or instead of a DRS in order to achieve the same outcomes. Most respondents did not answer all of the specific questions posed, but instead gave a brief summary of an alternative measure for further investigation. There was a significant difference in the level of detail provided, with some responses including suggested costs and benefits, whereas others simply proposed other mechanisms.
There are a number of themes within the responses received, which could be implemented alongside, or instead of, a DRS in order to achieve the same environmental goals in terms of increased recycling and decreased incidences of litter (see Annex E). There were general calls for reform of the ‘Packaging waste Recovery Note (PRN) system’; as mentioned previously, this is part of the mechanism for implementing the current packaging waste producer responsibility regulations. These proposed reforms were mainly in relation to the transparency of how producer funding, PRN costs, are used by reprocessors and exporters to ‘build capacity’ within the system. There were also calls for reforming the packaging waste regulations more widely, to address issues around the perceived imbalance between PRNs and Packaging waste Export Recovery Notes (PERNs), and the spread of costs across the waste supply chain (such as changes to the current exemption threshold for small businesses). We are aware that both the Clean Growth Strategy84 and the 25 Year Environment Plan85 already set out the government’s intention to review producer responsibility policies to encourage more resource efficiency as part of its forthcoming Resources and Waste Strategy.
84 Clean Growth Strategy (2017): https://www.gov.uk/government/publications/clean-growth-strategy 85 Year Environment Plan (2018): https://www.gov.uk/government/publications/25-year-environment-plan
41
VOLUNTARY & ECONOMICS INCENTIVES WORKING GROUP REPORT
A change to the tax system to encourage or discourage certain behaviours was also suggested. The proposals tended to focus on levies for certain types of packaging or specific materials to promote the use of packaging formats that are easy to deal with at end of life. The proposals also included a change to council tax to encourage increased recycling from businesses or to VAT to promote the use of certain materials. A call for evidence to be held in 2018, seeking views on how the tax system or charges could reduce the amount of single use plastics waste, has already been announced by the government.
The need for increased consistency was raised in a number of contexts by a number of respondents. The term has been used to refer to consistency of collection, either by local authorities or from businesses, but also in terms of packaging design and composition to aid recycling at end of life. The need to influence manufacture was also seen as important, whether through outright bans (either of specific materials going onto the market or going to landfill) or incentives to choose more sustainable materials.
There were also some suggestions to specifically deal with litter, which could be used in conjunction with a DRS, such as increased penalties for littering. We are aware that the majority of these proposals are already being addressed as part of the Litter Strategy for England86 published last year.
A table summarising all the potential alternative measures suggested is at Annex E.
86 Litter Strategy for England (2017): https://www.gov.uk/government/publications/litter-strategy-for-england
42
VOLUNTARY & ECONOMICS INCENTIVES WORKING GROUP REPORT
Conclusions and recommendations
Based on the responses we have seen to the call for evidence, including wider reports submitted, and through our own personal experiences and expertise, the Working Group has concluded and recommends the following:
Deposit Return Schemes
1. There is some evidence from other countries that well-designed and well-run deposit return schemes can deliver increased amounts of beverage containers collected for recycling and deliver a better quality of captured material (i.e. less contamination) than is currently estimated as happening in the UK for beverage packaging. For example, Germany, Norway and the Netherlands have some of the highest reported rates of plastic drinks bottle collection/recycling in Europe at 98%, 95% and 95%, respectively87. All have a DRS and also have some form of kerbside or household recycling collections. This is compared with an estimated 74% of all consumer plastic drinks bottles collected for recycling in the UK in 201688. The rates of collection/recycling of aluminium, steel and glass containers in the UK were also all quoted as currently around 70%89, with the highest performing DRS systems for these drinks containers, usually in Europe, having collection/recycling rates of between 87-97%90. However, there are also existing DRS models where the collection and recycling rates for containers, particularly plastic ones, are comparable with those currently estimated for the UK, and where there is also some form of kerbside or household collection, such as California (75%) and South Australia (70%)91. There are differing opinions on exactly how much we can read across from international models to England/the UK, due to the differences in the design of the DRS systems, the time and context in which they were introduced, what the reported data on collection/recycling rates actually represents, the exact way in which wider waste management systems (e.g., local authority delivery and kerbside collections) work, and the cultural differences between countries.
2. Support for a DRS is clear among the responses to the call for evidence from individuals and environmental groups. However, some organisations raised their concerns around DRSs, or particular potential design elements of a DRS.
87 See Annex D 88 Valpak response to the call for evidence. 89 See section above ‘Kerbside municipal / commercial / industrial collection and recycling’ 90 See Annex D 91 See Annex D
43
VOLUNTARY & ECONOMICS INCENTIVES WORKING GROUP REPORT
3. Plastic, glass and metal drinks containers and their component parts regularly feature in litter surveys, and are included in the top 10 most commonly-littered items found on UK beaches92. Evidence received in the call for evidence suggests that drinks containers, and especially plastic bottles, form a high enough proportion of litter on land and beaches in England to warrant action to address it. However, there is little direct evidence on the impacts of DRSs on litter. Unfortunately, we did not receive significant new data or information through the call for evidence regarding litter. Much of what we did receive was anecdotal or referred to existing studies where the robustness of methodologies has been questioned or was not considered sufficient for inclusion in this report. The general assumption appears to be that receiving a monetary or other reward will encourage consumers to deposit containers at a collection point instead of littering, and/or individuals/groups will be incentivised to collect litter to claim the refund.
4. Introduction of a DRS is thought likely to reduce costs to local authorities associated with clearing litter. This is supported by some international studies.
5. Data received in the call for evidence responses suggests that there is scope for increasing collection of high-quality material from drinks containers consumed outside the home, to complement that currently being collected through kerbside and other bring-back systems. One survey suggested that over half of local authorities do not offer recycling facilities on streets, and problems with contamination within systems that are offered was also mentioned. There was little data on the composition of street bins in England submitted in response to the call for evidence. In our view, a deposit return scheme could be a mechanism to deliver additional collection of high-quality material for recycling from consumers outside their homes, particularly in areas of high consumer traffic. Responses from the call for evidence, particularly in relation to behaviour change – suggest that particular consideration needs to be given to maximising the frequency and distribution of places where drinks containers (plastic and glass bottles and cans) can be deposited in order to encourage consumers to return them and particularly to encourage recycling outside the home. Innovative solutions have been found in relation to this; for example, in Beijing, commuters can deposit their plastic drinks bottle into a reverse vending machine to receive a small discount on their subway fare93. Focusing on drinks containers not currently collected at kerbside could reduce the risk of high-value material being diverted out of the well-established kerbside collection for recycling system and improve the potential for increasing recycling. This may occur if a nationwide, retail model was to be introduced and was a concern that was raised by a number of respondents. Therefore, design of a DRS should seek to avoid this potential impact where possible. For example, the scope of a DRS could focus on smaller drinks containers more likely to be used outside the home. Changing behaviour in relation to recycling outside the home is also an area that, arguably, could have
92 Great British Beach Clean Surveys and other litter surveys. See section above ‘Littering and its impacts’ 93 INCOM Recycle Co. Ltd. See: http://www.incomrecycle.com/en/
44
VOLUNTARY & ECONOMICS INCENTIVES WORKING GROUP REPORT
a large impact on reducing litter. Government is already working with WRAP and business to improve kerbside collection for recycling.
6. More work needs to be done to assess the implications and impacts of a DRS before one is introduced. No new comprehensive assessment of the costs and benefits of a DRS for England/UK was put forward, and what was received varied greatly in scope, definitions and estimates, making an aggregate assessment impossible. Unfortunately, there was also little or no evidence received from the commercial, hospitality or transport sectors, who might also benefit or be impacted by a DRS, depending on the design of the scheme. This reinforces the need for a comprehensive assessment. What was clear from the responses was that the costs of implementing a DRS, and the benefits that could outweigh them, will very much depend on the exact DRS model that is developed. For example, what minimum cost would the entire DRS have to be to achieve the benefit from the potential 10-20% additional rise in collection of plastic, metal and glass drinks containers seen in other countries? In our view, more work also needs to be done on the potential benefit that could be gained from using DRS to encourage recycling outside the home, including consumer responsiveness in relation to potential locations of collection points. The design and scope of any DRS is important for assessing the potential for increasing recycling and reducing litter in England/the UK, determining the exact costs/benefits and establishing who the potential ‘winners’ and ‘losers’ would be. The responses to the call for evidence have given a large number of suggestions for areas that need to be considered in a well-designed DRS, covering financial, operational, logistical and communications issues. They included being clear what the overall outcome to be achieved by a DRS is (reducing litter or increasing recycling) as that will potentially be a main driver in the system’s design, being clear on what drinks containers are in scope for collection (material, size, where they are bought), the coverage of a system (GB, UK or just within devolved nations) and whether regulation would be needed to achieve successful delivery of a DRS. These responses will provide a good starting point for comparative comprehensive cost-benefit analyses on various DRS designs.
7. Therefore, we recommend:
a. that Defra further investigates the potential for using a well-designed DRS to encourage collection and recycling of drinks containers. We also suggest that particular attention be paid to considering how to capture material that is consumed outside the home.
b. that any potential scheme must be designed in consultation with businesses, consumers, local governments and other interested parties, to ensure that it is well-designed, that the costs and benefits of the specific design have been fully assessed and that the risks of potential unintended consequences are minimal;
45
VOLUNTARY & ECONOMICS INCENTIVES WORKING GROUP REPORT
c. that design of a DRS should seek to avoid diverting high-value material from existing kerbside and household collections where that is possible; and
d. that particular attention be given to the characteristics that make some overseas DRS schemes more effective than others and whether they can be applied to the UK’s situation.
8. A few months after the Working Group started its work, the Scottish Government announced its intention to introduce a deposit return scheme for Scotland94, and Zero Waste Scotland have been consulting extensively with stakeholders, including most members of this Working Group, in developing potential models. A Scotland-only deposit return scheme raises the risk that relevant businesses could face differing policies in England than in other UK nations. This means that drinks container producers could face developing different formats for products sold in Scotland than elsewhere in the UK. This issue was raised by respondents to the call for evidence, along with concerns over potential for cross-border fraudulent activity. To avoid these unintended consequences and potential additional burdens on consumers and producers, we recommend that:
a. any DRS that government may consider implementing is developed for the UK or GB, if possible, and not England in isolation;
b. to avoid unnecessary duplication of effort for all involved, Defra should work with the Devolved Governments to ensure that a comprehensive impact assessment for any proposed DRS is done on a UK or GB-wide basis; and
c. Defra and Devolved Governments consider a joint consultation on a UK or GB-wide DRS.
Alternative measures
9. A number of suggestions were put forward for alternative measures to tackle litter and increase recycling, including reforming the current packaging waste regulations, introducing other financial incentives to change behaviour (such as increased taxes or new levies on hard to recycle materials, council tax discounts for increased household recycling), better information campaigns and consistent recycling collections. Few respondents gave details of how such alternative measures might work or be implemented and none suggested comprehensive, costed potential models.
10. Our view is that reforming current packaging waste legislation to introduce extended producer responsibility principles has the potential to meet similar outcomes from a deposit return scheme, in terms of increasing collection and recycling of drinks containers, depending on how that legislation is designed. For example, funds raised from producer obligation fees could be used to provide wider investment in waste material collection and recycling as well as help fund activities to reduce littering. We recognise that 94 Zero Waste Scotland news article (5 September 2017): http://www.zerowastescotland.org.uk/news-article/depositreturn-scheme-scotland
46
VOLUNTARY & ECONOMICS INCENTIVES WORKING GROUP REPORT
communications campaigns and bin provision may not be enough to encourage consumers to avoid littering and increase recycling. A DRS that was focused on incentivising consumers to recycle their drinks containers while outside the home could work as part of the waste material collection system for a reformed packaging waste producer responsibility system. We note that the government has announced its intention to reform producer responsibility waste management systems to drive resource efficiency and increase recycling, particularly for plastics packaging, in both the Clean Growth Strategy95 and the 25 Year Environment Plan96 . We recommend that government considers the role of a well-designed and well-run DRS alongside a reformed packaging waste producer responsibility system, especially when agreeing the aims and outcomes intended from the latter.
11. On other suggested measures: we note that government has either already committed to or is already taking some of these forward as part of the Litter Strategy for England97 and now also the 25 Environment Year Plan98. Where suggested measures are not already in train or being considered, we recommend Defra considers these suggestions where relevant and realistic, as part of future policy development.
Wider recommendations
12. As well as the work of this working group and the recent announcements on commitments to reform producer responsibility systems for better resources and waste management, we note that HM Treasury have announced their intention to explore the potential for taxes or charges on single-use plastics and Defra has announced the intention to develop a
Resources and Waste Strategy as part of the 25 Year Environment Plan99. These government commitments are yet to be fully scoped out or consulted on. Therefore, we have not had the time or opportunity to consider how these might interact with a potential deposit return scheme or other initiatives for reducing litter or increasing recycling. However, we would like to raise our concern that, depending on how all these government commitments and policies are taken forward, there is a real risk that producers of drinks containers – particularly plastic ones – could face repeated financial obligations from piecemeal policies that are, broadly, aimed at the same outcome; namely to reduce litter and increase resource efficiency. These duplicated costs would also impact on consumers. Alternatively, government would need to consider whether some producers were exempted from certain initiatives, if they are already captured by another, or consider how initiatives might be designed to work together. The government also needs to take a wider view on other potential impacts of new waste management measures – for example, on employment. Waste and resource management is a complex policy area and it is important that 95 Clean Growth Strategy (2017): https://www.gov.uk/government/publications/clean-growth-strategy 96 25 Year Environment Plan (2018): https://www.gov.uk/government/publications/25-year-environment-plan 97 Litter Strategy for England (2017): https://www.gov.uk/government/publications/litter-strategy-forengland 98 25 Year Environment Plan (2018): https://www.gov.uk/government/publications/25-year-environment-plan 99 Ibid
47
VOLUNTARY & ECONOMICS INCENTIVES WORKING GROUP REPORT
government is clear about what it is trying to achieve overall. We recommend that, before final decisions are made on introducing mandatory financial incentives for waste and litter management, introducing a deposit return scheme, producer responsibility schemes or tax incentives/charges in relation to single use plastics, they are considered as part of developing the wider Resources and Waste Strategy. This will ensure that policies relating to plastic and other wastes are developed holistically and complement one another, thereby avoiding unintended consequences in other areas. We also recommend that Defra ensures that it works closely with other government departments, particularly HM Treasury, to ensure that initiatives developed to manage resources and waste are considered in the round.
13. If systems are designed to increase collection of waste material for recycling without a guarantee for a market to buy the recycled material, it will likely end up stockpiled, in landfill or going for energy from waste. This not only goes against the principles of the waste hierarchy100 but will lead, rightly, to public and media concerns about wasted efforts in separating materials for recycling. We recommend that mechanisms for supporting existing end markets and creating new ones, ideally based in the UK, are also considered as part of the design of any new waste management and collection policies.
14. Finally, responses to the call for evidence have shown that there is a lack of consistent, comparable, good quality data on materials, product and waste stocks and flows. This makes decision-making or suggestions for changes to existing systems very difficult. It also makes modelling of the costs and benefits of possible DRS designs difficult. We are pleased to see that Defra has already committed to working with industry to explore options for making waste tracking data universally digitised. We recommend that Defra also considers the need for good data for monitoring/enforcement in the design of any new waste management/recycling systems, including DRS. Monitoring litter before and after the introduction of any measure/DRS would also provide a better analysis of the impact of such a measure.
100 Guidance on applying the waste hierarchy (2011): https://www.gov.uk/government/publications/guidanceon-applying-the-waste-hierarchy
48
VOLUNTARY & ECONOMICS INCENTIVES WORKING GROUP REPORT
Annex A
Voluntary and Economic Incentives Working Group
Members for this investigation:
British Soft Drinks Association
Cambridge Institute for Sustainability Leadership
Coca-Cola European Partners
Environmental Services Association
Local Authority Recycling Advisory Committee
Policy Exchange
Tesco PLC
Warwick Business School
WRAP (Waste & Resources Action Programme)
Secretariat: Campaign to Protect Rural England
Chair: Defra
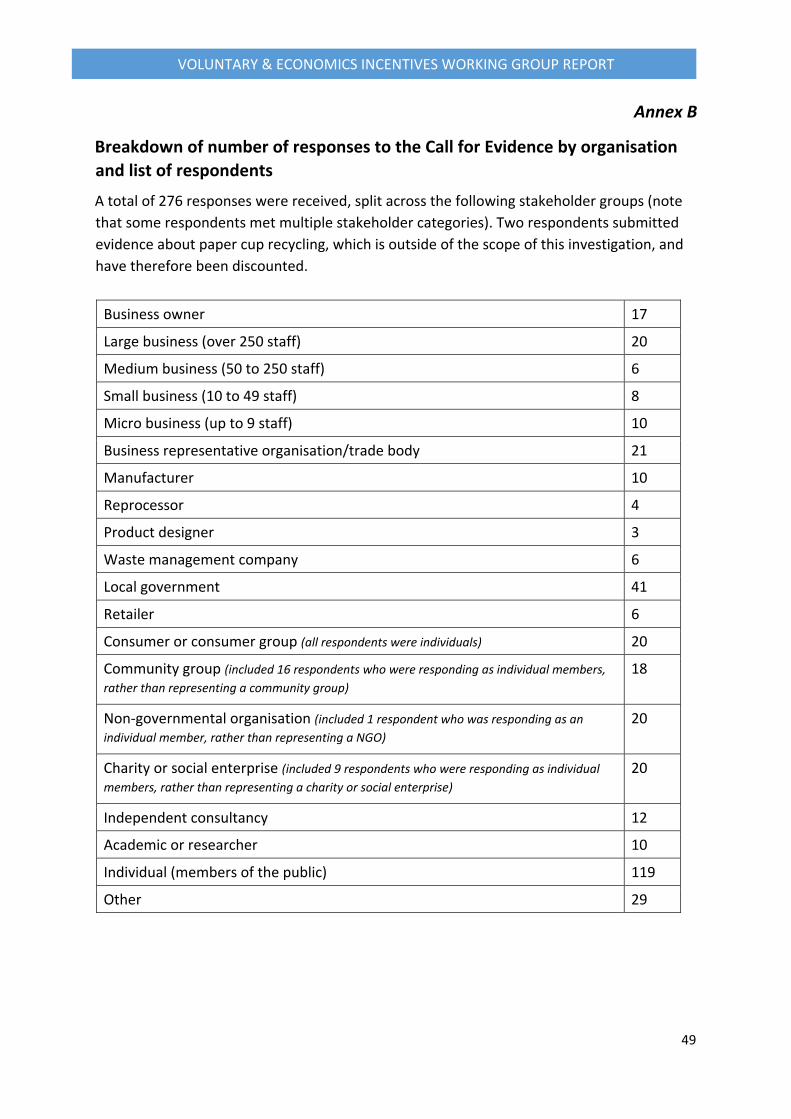
49
VOLUNTARY & ECONOMICS INCENTIVES WORKING GROUP REPORT
Annex B
Breakdown of number of responses to the Call for Evidence by organisation and list of respondents
A total of 276 responses were received, split across the following stakeholder groups (note that some respondents met multiple stakeholder categories). Two respondents submitted evidence about paper cup recycling, which is outside of the scope of this investigation, and have therefore been discounted.
Business owner 17
Large business (over 250 staff) 20
Medium business (50 to 250 staff) 6
Small business (10 to 49 staff) 8
Micro business (up to 9 staff) 10
Business representative organisation/trade body 21
Manufacturer 10
Reprocessor 4
Product designer 3
Waste management company 6
Local government 41
Retailer 6
Consumer or consumer group (all respondents were individuals) 20
Community group (included 16 respondents who were responding as individual members, rather than representing a community group)
18
Non-governmental organisation (included 1 respondent who was responding as an individual member, rather than representing a NGO)
20
Charity or social enterprise (included 9 respondents who were responding as individual members, rather than representing a charity or social enterprise)
20
Independent consultancy 12
Academic or researcher 10
Individual (members of the public) 119
Other 29
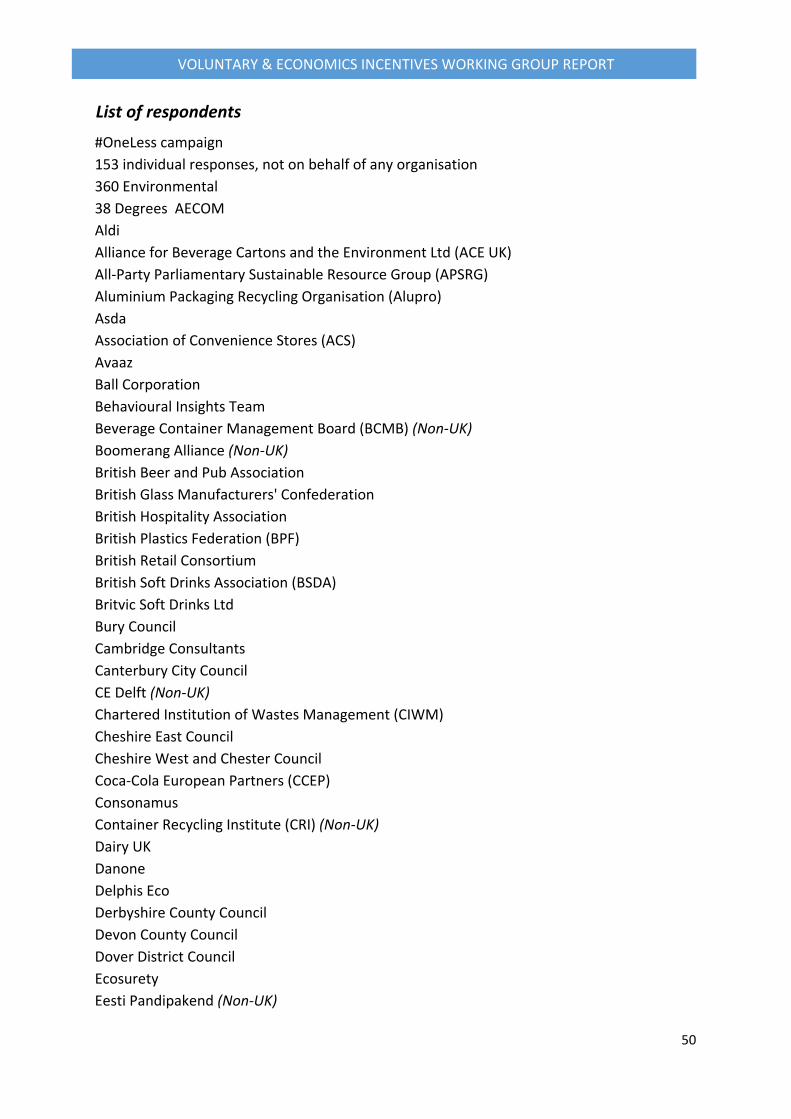
50
VOLUNTARY & ECONOMICS INCENTIVES WORKING GROUP REPORT
List of respondents
#OneLess campaign 153 individual responses, not on behalf of any organisation 360 Environmental 38 Degrees AECOM Aldi Alliance for Beverage Cartons and the Environment Ltd (ACE UK) All-Party Parliamentary Sustainable Resource Group (APSRG) Aluminium Packaging Recycling Organisation (Alupro) Asda Association of Convenience Stores (ACS) Avaaz Ball Corporation Behavioural Insights Team Beverage Container Management Board (BCMB) (Non-UK) Boomerang Alliance (Non-UK) British Beer and Pub Association British Glass Manufacturers' Confederation British Hospitality Association British Plastics Federation (BPF) British Retail Consortium British Soft Drinks Association (BSDA) Britvic Soft Drinks Ltd Bury Council Cambridge Consultants Canterbury City Council CE Delft (Non-UK) Chartered Institution of Wastes Management (CIWM) Cheshire East Council Cheshire West and Chester Council Coca-Cola European Partners (CCEP) Consonamus Container Recycling Institute (CRI) (Non-UK) Dairy UK Danone Delphis Eco Derbyshire County Council Devon County Council Dover District Council Ecosurety Eesti Pandipakend (Non-UK)
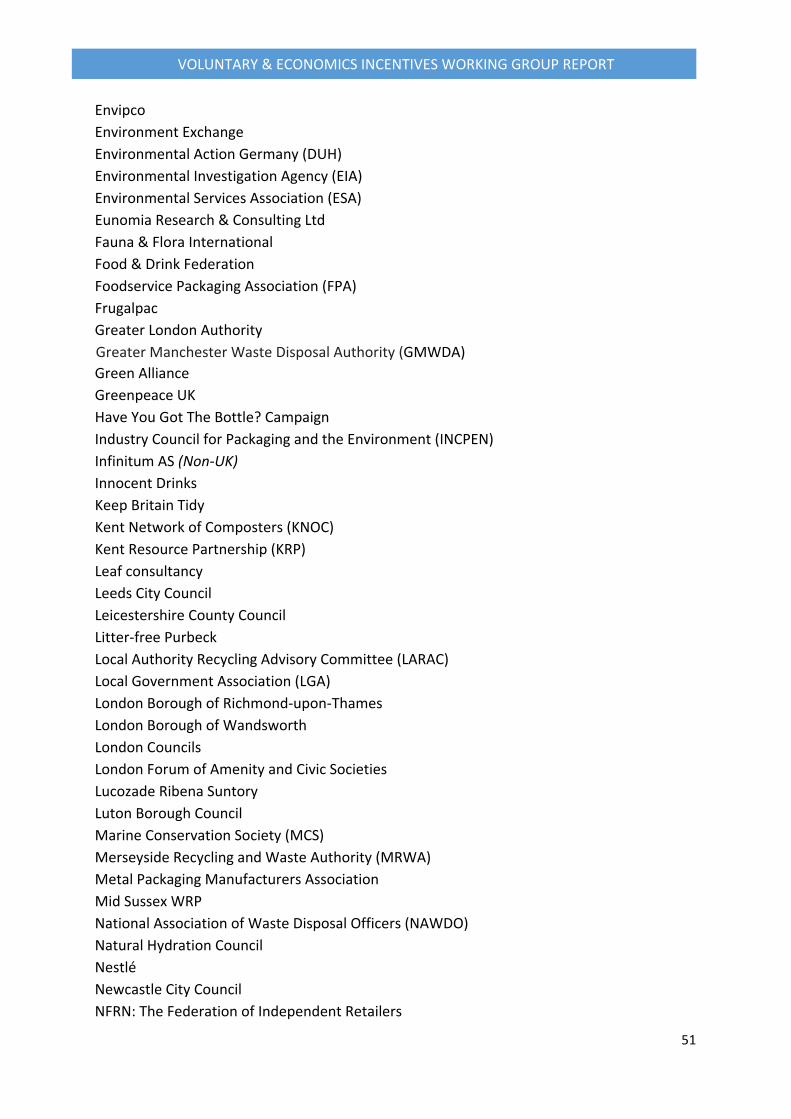
51
VOLUNTARY & ECONOMICS INCENTIVES WORKING GROUP REPORT
Envipco Environment Exchange Environmental Action Germany (DUH) Environmental Investigation Agency (EIA) Environmental Services Association (ESA) Eunomia Research & Consulting Ltd Fauna & Flora International Food & Drink Federation Foodservice Packaging Association (FPA) Frugalpac Greater London Authority Greater Manchester Waste Disposal Authority (GMWDA) Green Alliance Greenpeace UK Have You Got The Bottle? Campaign Industry Council for Packaging and the Environment (INCPEN) Infinitum AS (Non-UK) Innocent Drinks Keep Britain Tidy Kent Network of Composters (KNOC) Kent Resource Partnership (KRP) Leaf consultancy Leeds City Council Leicestershire County Council Litter-free Purbeck Local Authority Recycling Advisory Committee (LARAC) Local Government Association (LGA) London Borough of Richmond-upon-Thames London Borough of Wandsworth London Councils London Forum of Amenity and Civic Societies Lucozade Ribena Suntory Luton Borough Council Marine Conservation Society (MCS) Merseyside Recycling and Waste Authority (MRWA) Metal Packaging Manufacturers Association Mid Sussex WRP National Association of Waste Disposal Officers (NAWDO) Natural Hydration Council Nestlé Newcastle City Council NFRN: The Federation of Independent Retailers
52
VOLUNTARY & ECONOMICS INCENTIVES WORKING GROUP REPORT
North East Derbyshire District Council North London Waste Authority Novelis Recycling Packaging Federation PepsiCo UK & Ireland Plastipak UK Ltd & Clean Tech UK Ltd Project Integra, Hampshire County Council Recycling Netwerk Benelux (Non-UK) Recycling Options Ltd Reloop Retorna (Non-UK) Retourette (Non-UK) Reverse Vending Systems Rotherham Metropolitan Borough Council Rushcliffe Borough Council Sevenoaks District Council Sheffield City Council SHS Drinks Sky Ocean Rescue Team Society of Independent Brewers (SIBA) Spar Stratford-upon-Avon District Council SUEZ Surfers Against Sewage Surrey Waste Partnership Tata Steel UK Ltd Tesco PLC Thames21 Thanet District Council Thurrock Council TOMRA Tonbridge and Malling Borough Council Tunbridge Wells Borough Council USAD (Non-UK) Valpak Limited Viridor West London Waste Authority (WLWA) West Sussex Waste Partnership Western Riverside Waste Authority Wildlife and Countryside Link Wine and Spirit Trade Association (WSTA)
53
VOLUNTARY & ECONOMICS INCENTIVES WORKING GROUP REPORT
Annex C
List of questions asked in the Call for Evidence Section 1 – Introduction: about you
1. What is your name?
2. What is your email address?
3. Which best describes you? (Tick all boxes that apply) (Required)
Business owner Large business (over 250 staff) Medium business (50 to 250 staff) Small business (10 to 49 staff) Micro business (up to 9 staff) Business representative organisation/trade body Manufacturer Reprocessor Product designer Waste management company Local government Retailer Consumer or consumer group Community group Non-governmental organisation Charity or social enterprise Independent consultancy Academic or researcher Individual Other (please describe) If you answered Other above, please provide details
4. What specific involvement do you or your organisation have with drinks containers? For instance, are you
involved in their design and manufacture, sale, use, collection, reprocessing, manufacture or reprocessing, or another specialist area?
5. Please provide any further information about your organisation or business activities that you think might
help us put your answers in context. 6. Would you like your response to be confidential? Yes No If you answered Yes above, please give your reason Section 2 – Baseline information In order to assess the potential impacts of any changes to the current system, it is important to establish an accurate baseline of best-available information.
We recognise that not all respondents will have evidence relating to all questions and may only have evidence for part of a question, relating to a specific area of expertise. If so, please clarify the scope of your answer in
54
VOLUNTARY & ECONOMICS INCENTIVES WORKING GROUP REPORT
your response (e.g., if you are a Local Authority providing data and information relevant to your area, then please specify that this is the case).
Please provide any evidence you have, including its source, on the following questions:
7. How many drinks containers are placed onto the UK market each year?
Please breakdown into UK and England figures. Please specify by container type and whether you are reporting numbers/units or tonnages. Additionally, if you are a business which sells drinks containers directly to consumers, how many units/tonnes of these containers do you sell annually?
8. What percentage (%) of these drinks containers are collected (overall) via kerbside municipal waste, or commercial or industrial collection arrangements?
Percentage (%) of drinks containers collected (please specify by container type and whether number or tonnages). Please breakdown into UK and England figures if possible.
9. What percentage (%) of these drinks containers are recycled following kerbside/municipal or commercial collections?
Percentage (%) of drinks containers recycled (please specify container type and whether number or tonnages). Please breakdown into UK and England figures if possible.
10. What percentage (%) of materials collected from street or other ‘on-the-go’ bins relate to drinks containers?
Composition of street bin contents - what percentage (%) of materials collected from outdoor bins relate to drinks containers. (Please specify by container type, whether number or tonnages, and whether figures relate to UK or England).
11. Of the total drinks containers recycled, what percentage (%) would have been collected via street or other ‘on-the-go’ bins?
Percentage (%) of drinks containers recycled, of those collected via street or other on-the-go bins. (Please specify by container type, whether number or tonnages, and whether figures relate to UK or England).
12. What percentage (%) of drinks containers placed on the market annually in England are littered?
Percentage (%) of drinks containers littered in England (please specify type and whether number or tonnages).
13. What are the key environmental and/or social impacts of littered drinks containers, and how would you measure these?
Environmental and social impacts of littered containers. If you already have a monetised impact assessment, please provide details.
14. How would you suggest quantifying, in economic terms, the value of the ‘disamenity’ (unpleasant qualities) presented by such littered items in England? Do you have any evidence to illustrate this?
Section 3 – Current situation
This investigation is looking at what regulatory or voluntary interventions, if any, could improve how England deals with drinks containers; namely to prevent littering and increase recycling.
One approach could be to carry on ‘as normal’, without making any changes to existing systems and processes.
15. Would you support the carry on 'as normal' approach? If so, what elements of continuing 'as normal' make you think this is the best approach?
Would you support the carry on 'as normal' approach?
55
VOLUNTARY & ECONOMICS INCENTIVES WORKING GROUP REPORT
If you answered no to the question above, why do you feel further action is needed?
16. What aspects do you value in the current approach that you would not want to lose?
Section 4 – Evidence on well-designed and well-run deposit and reward and return schemes
In the wider context of reducing litter and improving recycling, Ministers have asked the group to consider the advantages and disadvantages of different types of deposit and reward and return schemes for drinks containers.
There are many varieties of schemes; there are mandatory national schemes, industry-run schemes, schemes involving rewards and no deposits, local-level schemes run jointly by businesses and councils, and so on. We need to consider the full picture of costs and benefits of such schemes, including on wider society and economics.
We need to build on existing evidence and potentially close gaps in our knowledge and understanding. We are particularly interested in receiving new and emerging evidence on costs impacts and/or benefits analysis.
17. What impacts might a deposit or reward and return scheme have on:
Littering rates? Recycling rates? Local Authority household collections and associated costs (and revenues)? Street sweeping and park cleaning costs (and revenues)? Wider environmental impacts? For instance, as evidenced through Life Cycle Assessments (energy, carbon, water, etc.)?
18. What evidence is there that a deposit return or reward and return scheme may enhance or otherwise affect the value or quality of materials sent for recycling?
Evidence on impacts of deposit return or reward and return scheme on the value or quality of materials sent for recycling.
19. What other benefits may accrue from a well-designed and well run deposit system?
20. Have you any knowledge or direct experience that would give an indication of the set-up costs or the subsequent administrative and operational costs of a deposit or reward and return scheme?
Evidence on set-up, administrative and operational costs of deposit or reward and return schemes (please reference any examples)
21. What evidence exists on the best funding and management mechanisms of well-designed and well run deposit or reward and return schemes?
Evidence on funding and management mechanisms for deposit or reward and return schemes
22. What evidence is there on the responsiveness of consumers in returning containers, in relation to the level of any up-front deposit? How do such incentives impact on wider littering and recycling?
Evidence on the responsiveness of consumers in returning containers, in relation to the level of any up-front deposit
What evidence is there on the locations in which consumers are most likely to return their empty containers? What does this tell us about the optimal location or distribution of collection points as part of any deposit or reward and return scheme?
23. What measures or regulations might be needed to minimise the potential for adverse effects of any deposit or reward and return scheme on:
Small businesses, such as retail outlets
56
VOLUNTARY & ECONOMICS INCENTIVES WORKING GROUP REPORT
Larger retailers Consumers and their behaviour (e.g. on product prices, on proper use of kerbside recycling) Competition Other wider macro-economic indicators, such as inflation Fraud and enforcement Health and safety
Please check all that apply and explain your response in the box below
What other adverse effects may occur with a poorly designed and run deposit system, and how might they be minimised?
24. What evidence is there that a deposit or reward and return scheme could sit successfully alongside existing waste management systems and regulations?
For instance, what evidence is there that such schemes could sit successfully alongside Local Authority waste collection arrangements, Packaging regulations and the Packaging Waste Recovery Note (PRN) system, etc.?
What mitigating arrangements would be needed to ensure such schemes would not reduce the effectiveness or increase the costs of existing waste management systems and regulations in England?
25. Do you have examples of other countries – with household and town centre recycling systems similar to England – where successful deposit return or reward and return schemes currently operate?
26. If a well-designed and well run deposit system were to be introduced how do you think this intervention should be introduced in England to optimise its effectiveness and cost / benefit (e.g. direct regulation, coregulation, voluntary agreement, etc.)?
a. Who would the key players be in implementing the intervention? What governance arrangements would need to be in place?
b. Who would be responsible for the costs, management and collection aspects of the scheme to make it self-sustaining? If relevant, please list known examples in other countries where your suggested operational model is in use.
c. What commercial arrangements would need to be in place to ensure the financial viability of the scheme, as well as ensuring value for money for the public?
27. What evidence, if any, is missing in order to understand the full impact on your business, sector or society?
Section 5 – Exploring other potential measures
Note: If you do not wish to comment on or propose suggestions for alternatives to deposit or reward and return schemes, then you may skip this section and conclude the call for evidence here.
There may be new ways of approaching the problem of reducing littering and/or increasing recycling of drinks containers, outside of deposit or reward and return schemes, which are not widely known or have not already been trialled in England, including on a local scale.
There are many possible approaches to the problem – be they voluntary, economic or regulatory – and this question aims to capture alternative or complementary ideas on potential interventions.
The following are examples for illustration only, based on measures suggested in Figure 1 and detailed in the Defra Guidance on Instrument Selection[1]. These are by no means exhaustive.
• Information-based instruments (e.g., labelling or certification, naming and faming – league table of best / worst performers). • Support and Capacity Building (e.g., demonstration projects, trials and network building between partners).
57
VOLUNTARY & ECONOMICS INCENTIVES WORKING GROUP REPORT
• Co-Regulation (e.g., covenant between industry and/or Local Authorities, supported by government. For example, agreements to co-invest in and promote on-the-go recycling schemes for drinks containers, or special schemes for events or hospitality venues). • Voluntary or civic self-regulation (e.g., Industry pledges, community-industry campaigns and recycling-drives, consumer education, development and verification of environmental standards). • Economic incentives (e.g., payments or rewards to incentivise collection and recycling / re-use) • Direct Regulation (e.g., mandatory local/business recycling targets, environmental and design standards, technology requirements for businesses or retailers).
[1] Defra (2016) Better policy design Choosing instruments to influence businesses and individuals. See Defra 2013 Instrument Selection Guidance
28. What measure(s), other than deposit or reward and return schemes, would you put forward for consideration on how to reduce the volume of drinks containers that are littered, and, where possible, to recapture these containers for recycling?
Please describe your proposed alternative measure
29. What impacts might your proposed measure have on:
Littering rates? Recycling rates? Local Authority household collections and associated costs (and revenues)? Street sweeping and park cleaning costs (and revenues)? Wider environmental impacts? For instance, as evidenced through Life Cycle Assessments (energy, carbon, water, etc.)
30. What evidence is there that your proposed measure would enhance or otherwise affect the value or quality of materials sent for recycling?
31. What other benefits may accrue from your proposed measure?
32. Have you any knowledge or direct experience that would give an indication of the set-up costs or the subsequent administrative and operational costs or requirements of your proposed measure?
33. What evidence exists on the responsiveness of consumers to your proposed measure? How might such incentives impact on wider littering and recycling behaviours?
34. What measures or regulations might be needed to minimise the potential for adverse effects resulting from your proposed measure on:
Small businesses, such as retail outlets Larger retailers Consumers and their behaviour (e.g. on product prices, on proper use of kerbside recycling) Competition Other wider macro-economic indicators, such as inflation Fraud and enforcement Health and safety
Please check all that apply, and explain your answer in the box below
35. What evidence is there that your proposed measure could sit successfully alongside existing waste management systems and regulations?
For instance, what evidence is there that such schemes could sit successfully alongside Local Authority waste collection arrangements, Packaging Regulations and the Packaging Waste Recovery Note (PRN) system, etc.)?
36. What mitigating arrangements would be needed to ensure such schemes would not reduce the effectiveness or increase the costs of existing waste management systems and regulations in England?
58
VOLUNTARY & ECONOMICS INCENTIVES WORKING GROUP REPORT
What other adverse effects may occur as a result of your proposed measure, and how might they be minimised?
37. Can you provide any examples of other countries or locations – with household and town centre recycling systems similar to England – where this measure currently operates?
a. Who would the key players be in implementing the intervention? What governance arrangements would need to be in place?
b. Who would be responsible for the costs, management and collection aspects of the scheme to make it self-sustaining?
c. What commercial arrangements would need to be in place to ensure the financial viability of the scheme, as well as ensuring value for money for the public?
38. What evidence, if any, is missing in order to understand the full impact of your proposal on business, sector or society?
39. Would you like to propose and provide evidence for any further measures or incentives?
Yes, I would like to suggest another measure (you will be returned to the top of Section 5 to fill out the details)
No
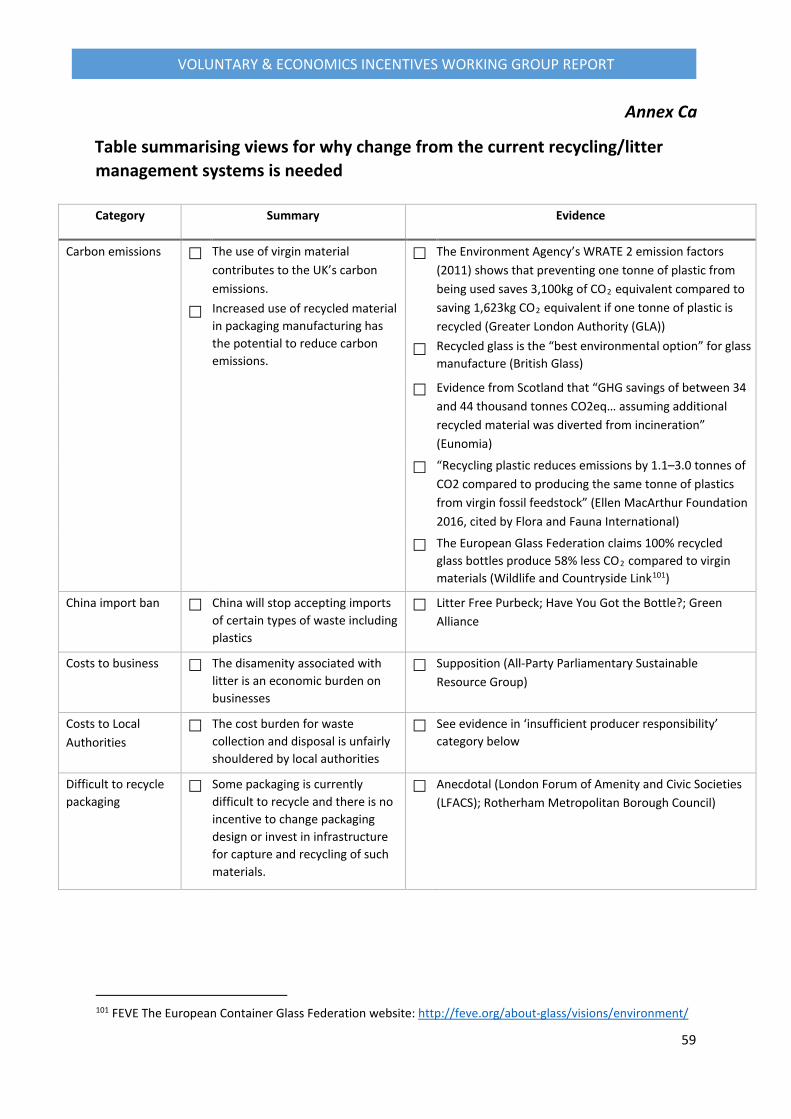
59
VOLUNTARY & ECONOMICS INCENTIVES WORKING GROUP REPORT
Annex Ca
Table summarising views for why change from the current recycling/litter management systems is needed Category Summary Evidence
Carbon emissions
The use of virgin material contributes to the UK’s carbon emissions. Increased use of recycled material in packaging manufacturing has the potential to reduce carbon emissions.
The Environment Agency’s WRATE 2 emission factors (2011) shows that preventing one tonne of plastic from being used saves 3,100kg of CO2 equivalent compared to saving 1,623kg CO2 equivalent if one tonne of plastic is recycled (Greater London Authority (GLA)) Recycled glass is the “best environmental option” for glass manufacture (British Glass)
Evidence from Scotland that “GHG savings of between 34 and 44 thousand tonnes CO2eq… assuming additional recycled material was diverted from incineration” (Eunomia)
“Recycling plastic reduces emissions by 1.1–3.0 tonnes of CO2 compared to producing the same tonne of plastics from virgin fossil feedstock” (Ellen MacArthur Foundation 2016, cited by Flora and Fauna International)
The European Glass Federation claims 100% recycled glass bottles produce 58% less CO2 compared to virgin materials (Wildlife and Countryside Link101)
China import ban China will stop accepting imports of certain types of waste including plastics
Litter Free Purbeck; Have You Got the Bottle?; Green Alliance
Costs to business The disamenity associated with litter is an economic burden on businesses
Supposition (All-Party Parliamentary Sustainable Resource Group)
Costs to Local Authorities
The cost burden for waste collection and disposal is unfairly shouldered by local authorities
See evidence in ‘insufficient producer responsibility’ category below
Difficult to recycle packaging
Some packaging is currently difficult to recycle and there is no incentive to change packaging design or invest in infrastructure for capture and recycling of such materials.
Anecdotal (London Forum of Amenity and Civic Societies (LFACS); Rotherham Metropolitan Borough Council)
101 FEVE The European Container Glass Federation website: http://feve.org/about-glass/visions/environment/
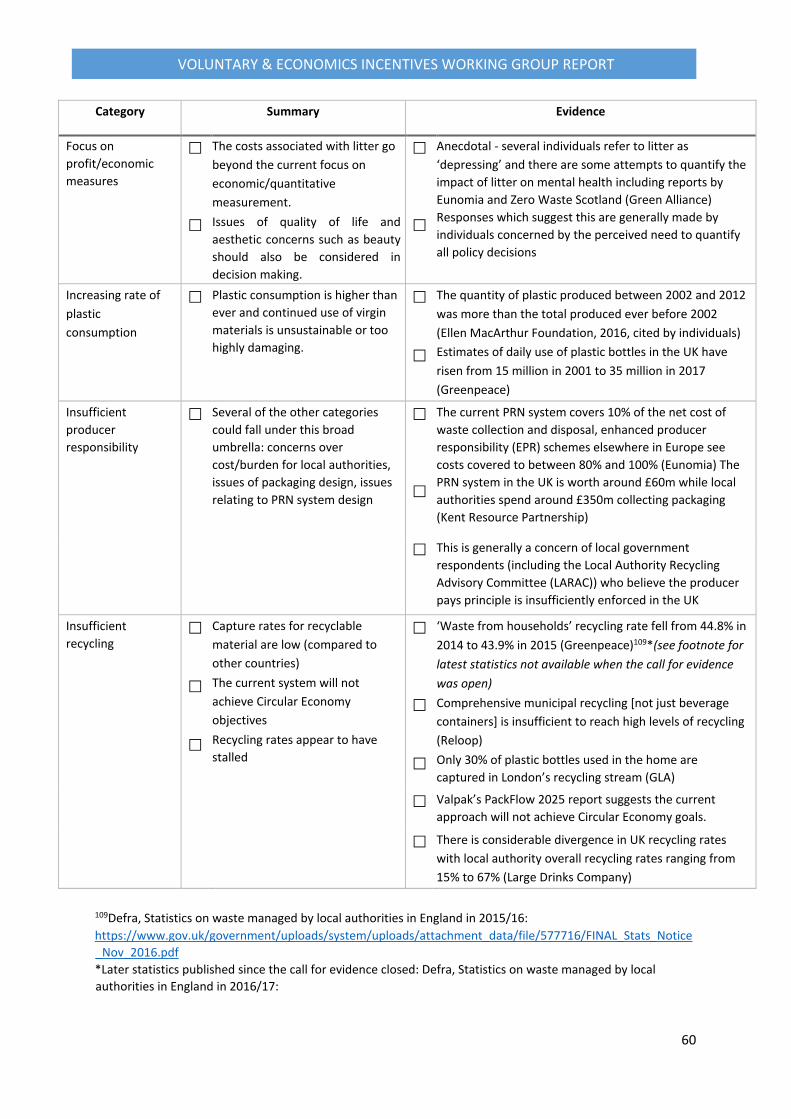
60
VOLUNTARY & ECONOMICS INCENTIVES WORKING GROUP REPORT
Category Summary Evidence
Focus on profit/economic measures
The costs associated with litter go beyond the current focus on economic/quantitative measurement. Issues of quality of life and aesthetic concerns such as beauty should also be considered in decision making.
Anecdotal - several individuals refer to litter as ‘depressing’ and there are some attempts to quantify the impact of litter on mental health including reports by Eunomia and Zero Waste Scotland (Green Alliance) Responses which suggest this are generally made by individuals concerned by the perceived need to quantify all policy decisions
Increasing rate of plastic consumption
Plastic consumption is higher than ever and continued use of virgin materials is unsustainable or too highly damaging.
The quantity of plastic produced between 2002 and 2012 was more than the total produced ever before 2002 (Ellen MacArthur Foundation, 2016, cited by individuals) Estimates of daily use of plastic bottles in the UK have risen from 15 million in 2001 to 35 million in 2017 (Greenpeace)
Insufficient producer responsibility
Several of the other categories could fall under this broad umbrella: concerns over cost/burden for local authorities, issues of packaging design, issues relating to PRN system design
The current PRN system covers 10% of the net cost of waste collection and disposal, enhanced producer responsibility (EPR) schemes elsewhere in Europe see costs covered to between 80% and 100% (Eunomia) The PRN system in the UK is worth around £60m while local authorities spend around £350m collecting packaging (Kent Resource Partnership)
This is generally a concern of local government respondents (including the Local Authority Recycling Advisory Committee (LARAC)) who believe the producer pays principle is insufficiently enforced in the UK
Insufficient recycling
Capture rates for recyclable material are low (compared to other countries) The current system will not achieve Circular Economy objectives Recycling rates appear to have stalled
‘Waste from households’ recycling rate fell from 44.8% in 2014 to 43.9% in 2015 (Greenpeace)109*(see footnote for latest statistics not available when the call for evidence was open) Comprehensive municipal recycling [not just beverage containers] is insufficient to reach high levels of recycling (Reloop) Only 30% of plastic bottles used in the home are captured in London’s recycling stream (GLA)
Valpak’s PackFlow 2025 report suggests the current approach will not achieve Circular Economy goals.
There is considerable divergence in UK recycling rates with local authority overall recycling rates ranging from 15% to 67% (Large Drinks Company)
109Defra, Statistics on waste managed by local authorities in England in 2015/16: https://www.gov.uk/government/uploads/system/uploads/attachment_data/file/577716/FINAL_Stats_Notice _Nov_2016.pdf *Later statistics published since the call for evidence closed: Defra, Statistics on waste managed by local authorities in England in 2016/17:
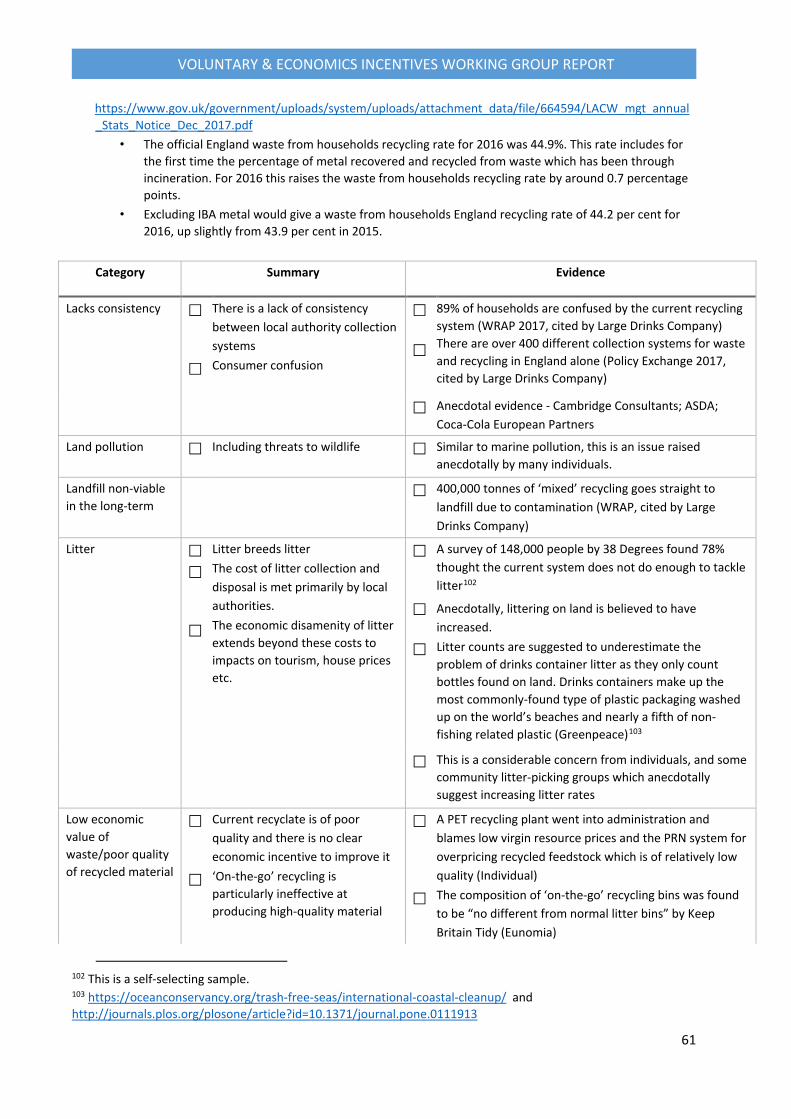
61
VOLUNTARY & ECONOMICS INCENTIVES WORKING GROUP REPORT
https://www.gov.uk/government/uploads/system/uploads/attachment_data/file/664594/LACW_mgt_annual _Stats_Notice_Dec_2017.pdf
• The official England waste from households recycling rate for 2016 was 44.9%. This rate includes for the first time the percentage of metal recovered and recycled from waste which has been through incineration. For 2016 this raises the waste from households recycling rate by around 0.7 percentage points.
• Excluding IBA metal would give a waste from households England recycling rate of 44.2 per cent for 2016, up slightly from 43.9 per cent in 2015.
Category Summary Evidence
Lacks consistency
There is a lack of consistency between local authority collection systems Consumer confusion
89% of households are confused by the current recycling system (WRAP 2017, cited by Large Drinks Company) There are over 400 different collection systems for waste and recycling in England alone (Policy Exchange 2017, cited by Large Drinks Company)
Anecdotal evidence - Cambridge Consultants; ASDA; Coca-Cola European Partners
Land pollution Including threats to wildlife Similar to marine pollution, this is an issue raised anecdotally by many individuals.
Landfill non-viable in the long-term
400,000 tonnes of ‘mixed’ recycling goes straight to landfill due to contamination (WRAP, cited by Large Drinks Company)
Litter
Litter breeds litter The cost of litter collection and disposal is met primarily by local authorities. The economic disamenity of litter extends beyond these costs to impacts on tourism, house prices etc.
A survey of 148,000 people by 38 Degrees found 78% thought the current system does not do enough to tackle litter102 Anecdotally, littering on land is believed to have increased. Litter counts are suggested to underestimate the problem of drinks container litter as they only count bottles found on land. Drinks containers make up the most commonly-found type of plastic packaging washed up on the world’s beaches and nearly a fifth of non-fishing related plastic (Greenpeace)103
This is a considerable concern from individuals, and some community litter-picking groups which anecdotally suggest increasing litter rates
Low economic value of waste/poor quality of recycled material
Current recyclate is of poor quality and there is no clear economic incentive to improve it ‘On-the-go’ recycling is particularly ineffective at producing high-quality material
A PET recycling plant went into administration and blames low virgin resource prices and the PRN system for overpricing recycled feedstock which is of relatively low quality (Individual) The composition of ‘on-the-go’ recycling bins was found to be “no different from normal litter bins” by Keep Britain Tidy (Eunomia)
102 This is a self-selecting sample. 103 https://oceanconservancy.org/trash-free-seas/international-coastal-cleanup/ and http://journals.plos.org/plosone/article?id=10.1371/journal.pone.0111913
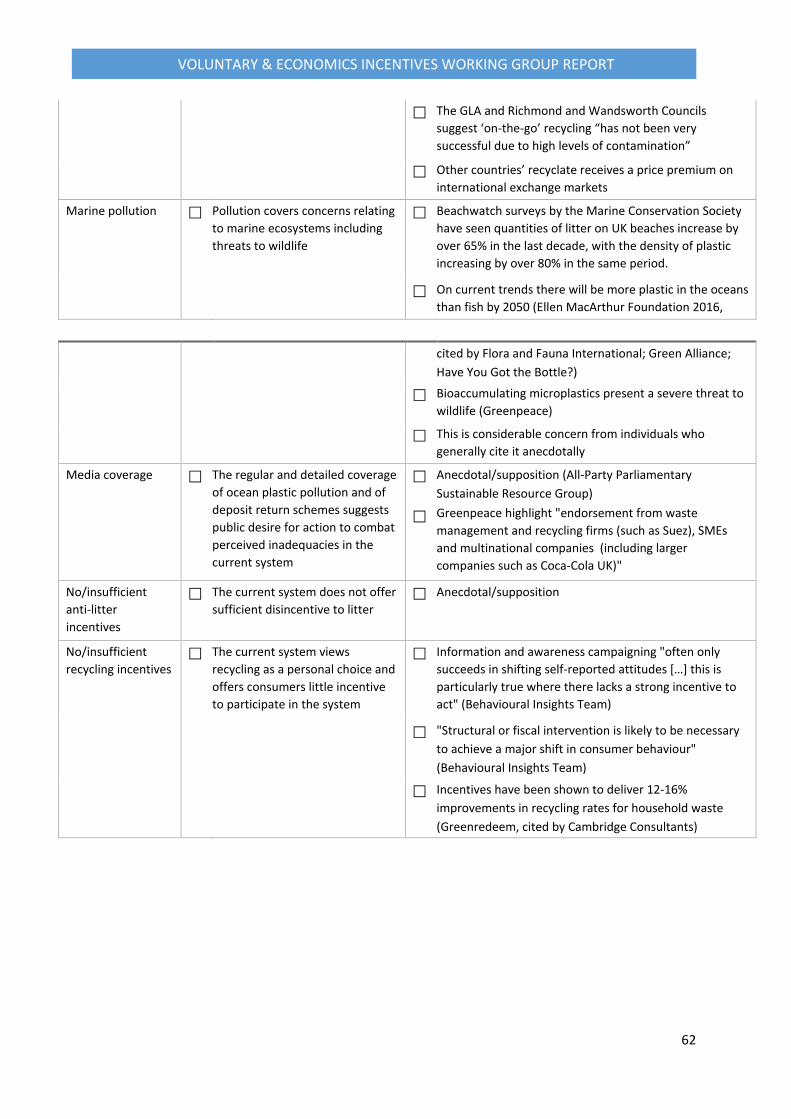
62
VOLUNTARY & ECONOMICS INCENTIVES WORKING GROUP REPORT
The GLA and Richmond and Wandsworth Councils suggest ‘on-the-go’ recycling “has not been very successful due to high levels of contamination”
Other countries’ recyclate receives a price premium on international exchange markets
Marine pollution Pollution covers concerns relating to marine ecosystems including threats to wildlife
Beachwatch surveys by the Marine Conservation Society have seen quantities of litter on UK beaches increase by over 65% in the last decade, with the density of plastic increasing by over 80% in the same period.
On current trends there will be more plastic in the oceans than fish by 2050 (Ellen MacArthur Foundation 2016,
cited by Flora and Fauna International; Green Alliance; Have You Got the Bottle?)
Bioaccumulating microplastics present a severe threat to wildlife (Greenpeace)
This is considerable concern from individuals who generally cite it anecdotally
Media coverage The regular and detailed coverage of ocean plastic pollution and of deposit return schemes suggests public desire for action to combat perceived inadequacies in the current system
Anecdotal/supposition (All-Party Parliamentary Sustainable Resource Group) Greenpeace highlight "endorsement from waste management and recycling firms (such as Suez), SMEs and multinational companies (including larger companies such as Coca-Cola UK)"
No/insufficient anti-litter incentives
The current system does not offer sufficient disincentive to litter
Anecdotal/supposition
No/insufficient recycling incentives
The current system views recycling as a personal choice and offers consumers little incentive to participate in the system
Information and awareness campaigning "often only succeeds in shifting self-reported attitudes […] this is particularly true where there lacks a strong incentive to act" (Behavioural Insights Team)
"Structural or fiscal intervention is likely to be necessary to achieve a major shift in consumer behaviour" (Behavioural Insights Team)
Incentives have been shown to deliver 12-16% improvements in recycling rates for household waste (Greenredeem, cited by Cambridge Consultants)
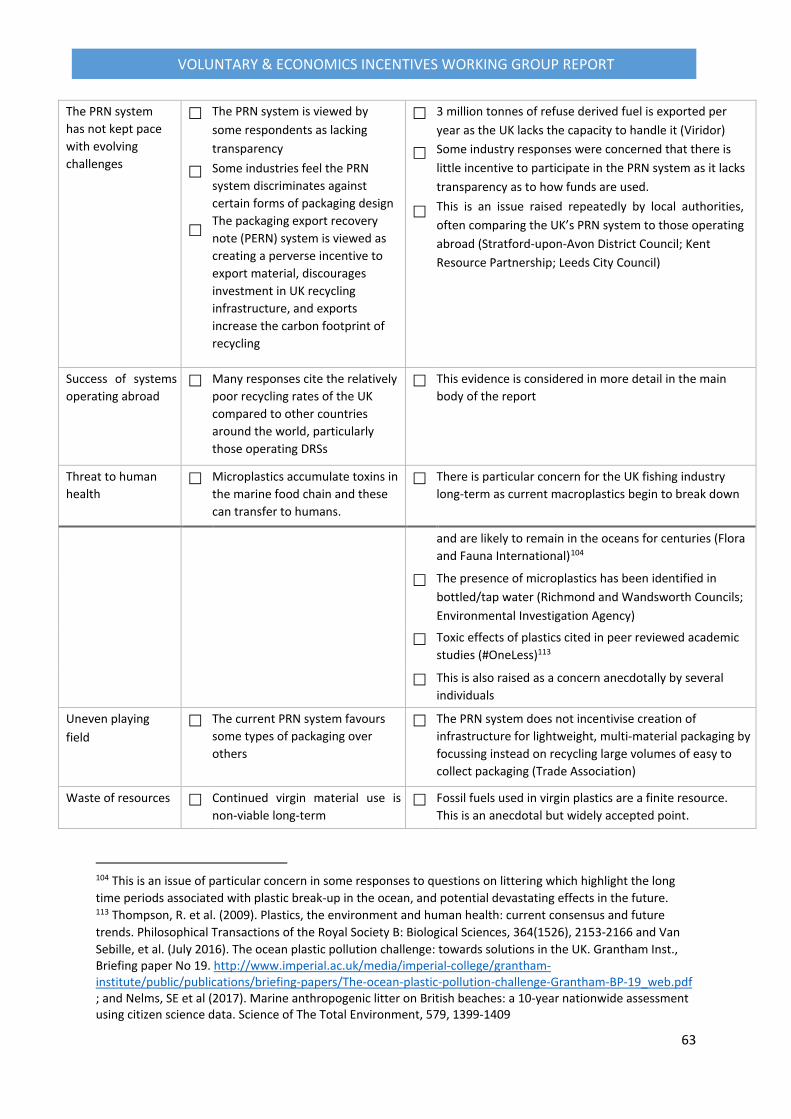
63
VOLUNTARY & ECONOMICS INCENTIVES WORKING GROUP REPORT
The PRN system has not kept pace with evolving challenges
The PRN system is viewed by some respondents as lacking transparency Some industries feel the PRN system discriminates against certain forms of packaging design The packaging export recovery note (PERN) system is viewed as creating a perverse incentive to export material, discourages investment in UK recycling infrastructure, and exports increase the carbon footprint of recycling
3 million tonnes of refuse derived fuel is exported per year as the UK lacks the capacity to handle it (Viridor) Some industry responses were concerned that there is little incentive to participate in the PRN system as it lacks transparency as to how funds are used. This is an issue raised repeatedly by local authorities, often comparing the UK’s PRN system to those operating abroad (Stratford-upon-Avon District Council; Kent Resource Partnership; Leeds City Council)
Success of systems operating abroad
Many responses cite the relatively poor recycling rates of the UK compared to other countries around the world, particularly those operating DRSs
This evidence is considered in more detail in the main body of the report
Threat to human health
Microplastics accumulate toxins in the marine food chain and these can transfer to humans.
There is particular concern for the UK fishing industry long-term as current macroplastics begin to break down
and are likely to remain in the oceans for centuries (Flora and Fauna International)104
The presence of microplastics has been identified in bottled/tap water (Richmond and Wandsworth Councils; Environmental Investigation Agency)
Toxic effects of plastics cited in peer reviewed academic studies (#OneLess)113
This is also raised as a concern anecdotally by several individuals
Uneven playing field
The current PRN system favours some types of packaging over others
The PRN system does not incentivise creation of infrastructure for lightweight, multi-material packaging by focussing instead on recycling large volumes of easy to collect packaging (Trade Association)
Waste of resources Continued virgin material use is non-viable long-term
Fossil fuels used in virgin plastics are a finite resource. This is an anecdotal but widely accepted point.
104 This is an issue of particular concern in some responses to questions on littering which highlight the long time periods associated with plastic break-up in the ocean, and potential devastating effects in the future. 113 Thompson, R. et al. (2009). Plastics, the environment and human health: current consensus and future trends. Philosophical Transactions of the Royal Society B: Biological Sciences, 364(1526), 2153-2166 and Van Sebille, et al. (July 2016). The ocean plastic pollution challenge: towards solutions in the UK. Grantham Inst., Briefing paper No 19. http://www.imperial.ac.uk/media/imperial-college/grantham- institute/public/publications/briefing-papers/The-ocean-plastic-pollution-challenge-Grantham-BP-19_web.pdf ; and Nelms, SE et al (2017). Marine anthropogenic litter on British beaches: a 10-year nationwide assessment using citizen science data. Science of The Total Environment, 579, 1399-1409
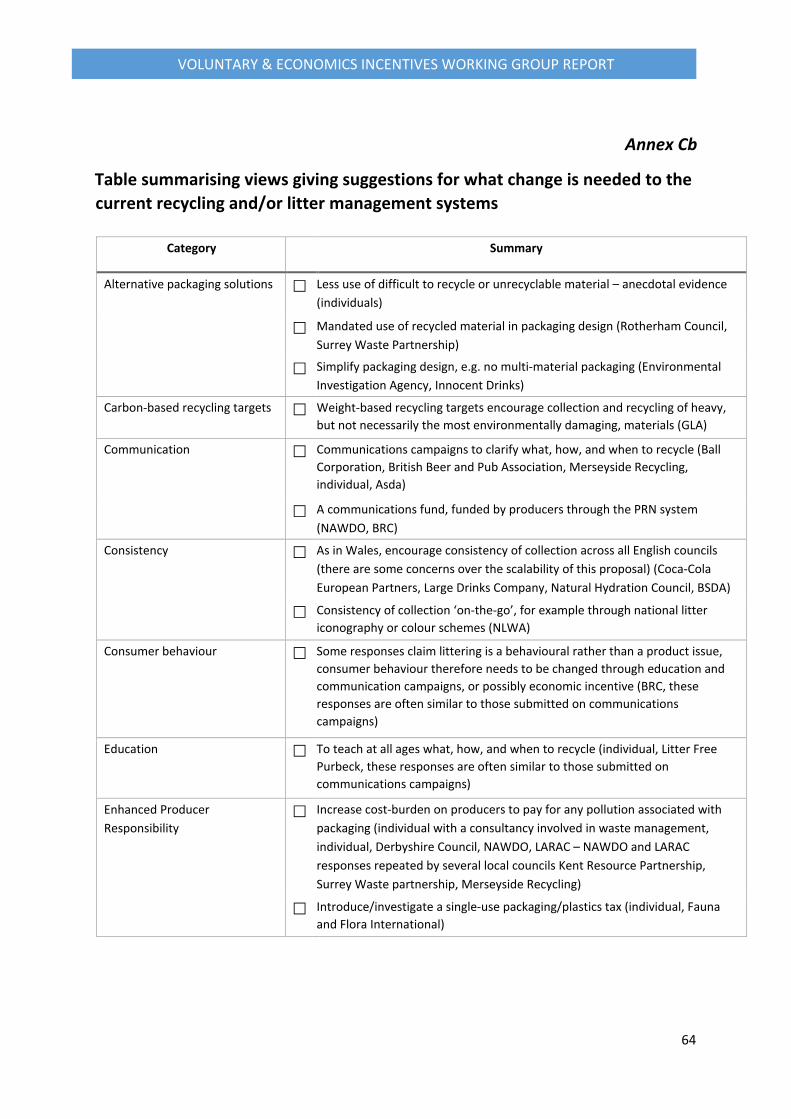
64
VOLUNTARY & ECONOMICS INCENTIVES WORKING GROUP REPORT
Annex Cb
Table summarising views giving suggestions for what change is needed to the current recycling and/or litter management systems
Category Summary
Alternative packaging solutions Less use of difficult to recycle or unrecyclable material – anecdotal evidence (individuals)
Mandated use of recycled material in packaging design (Rotherham Council, Surrey Waste Partnership)
Simplify packaging design, e.g. no multi-material packaging (Environmental Investigation Agency, Innocent Drinks)
Carbon-based recycling targets Weight-based recycling targets encourage collection and recycling of heavy, but not necessarily the most environmentally damaging, materials (GLA)
Communication Communications campaigns to clarify what, how, and when to recycle (Ball Corporation, British Beer and Pub Association, Merseyside Recycling, individual, Asda)
A communications fund, funded by producers through the PRN system (NAWDO, BRC)
Consistency As in Wales, encourage consistency of collection across all English councils (there are some concerns over the scalability of this proposal) (Coca-Cola European Partners, Large Drinks Company, Natural Hydration Council, BSDA)
Consistency of collection ‘on-the-go’, for example through national litter iconography or colour schemes (NLWA)
Consumer behaviour Some responses claim littering is a behavioural rather than a product issue, consumer behaviour therefore needs to be changed through education and communication campaigns, or possibly economic incentive (BRC, these responses are often similar to those submitted on communications campaigns)
Education To teach at all ages what, how, and when to recycle (individual, Litter Free Purbeck, these responses are often similar to those submitted on communications campaigns)
Enhanced Producer Responsibility
Increase cost-burden on producers to pay for any pollution associated with packaging (individual with a consultancy involved in waste management, individual, Derbyshire Council, NAWDO, LARAC – NAWDO and LARAC responses repeated by several local councils Kent Resource Partnership, Surrey Waste partnership, Merseyside Recycling)
Introduce/investigate a single-use packaging/plastics tax (individual, Fauna and Flora International)
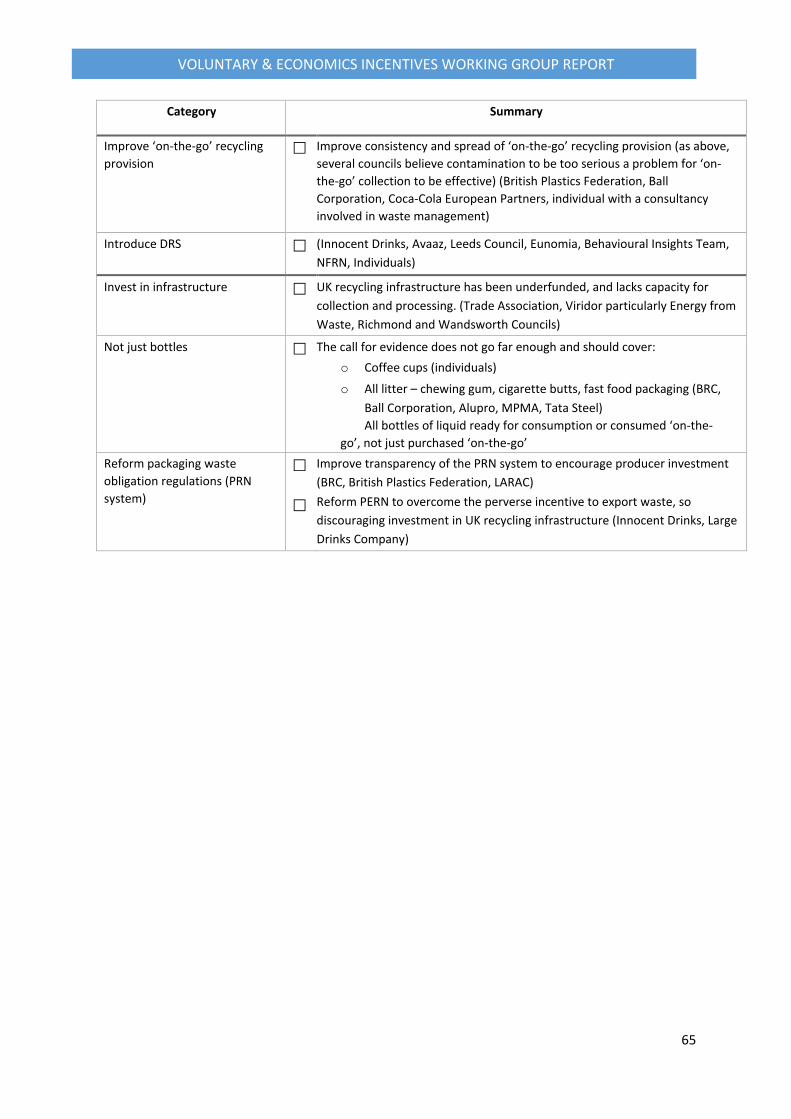
65
VOLUNTARY & ECONOMICS INCENTIVES WORKING GROUP REPORT
Category Summary
Improve ‘on-the-go’ recycling provision
Improve consistency and spread of ‘on-the-go’ recycling provision (as above, several councils believe contamination to be too serious a problem for ‘on-the-go’ collection to be effective) (British Plastics Federation, Ball Corporation, Coca-Cola European Partners, individual with a consultancy involved in waste management)
Introduce DRS (Innocent Drinks, Avaaz, Leeds Council, Eunomia, Behavioural Insights Team, NFRN, Individuals)
Invest in infrastructure UK recycling infrastructure has been underfunded, and lacks capacity for collection and processing. (Trade Association, Viridor particularly Energy from Waste, Richmond and Wandsworth Councils)
Not just bottles The call for evidence does not go far enough and should cover: o Coffee cups (individuals) o All litter – chewing gum, cigarette butts, fast food packaging (BRC,
Ball Corporation, Alupro, MPMA, Tata Steel) All bottles of liquid ready for consumption or consumed ‘on-the-
go’, not just purchased ‘on-the-go’ Reform packaging waste obligation regulations (PRN system)
Improve transparency of the PRN system to encourage producer investment (BRC, British Plastics Federation, LARAC) Reform PERN to overcome the perverse incentive to export waste, so discouraging investment in UK recycling infrastructure (Innocent Drinks, Large Drinks Company)
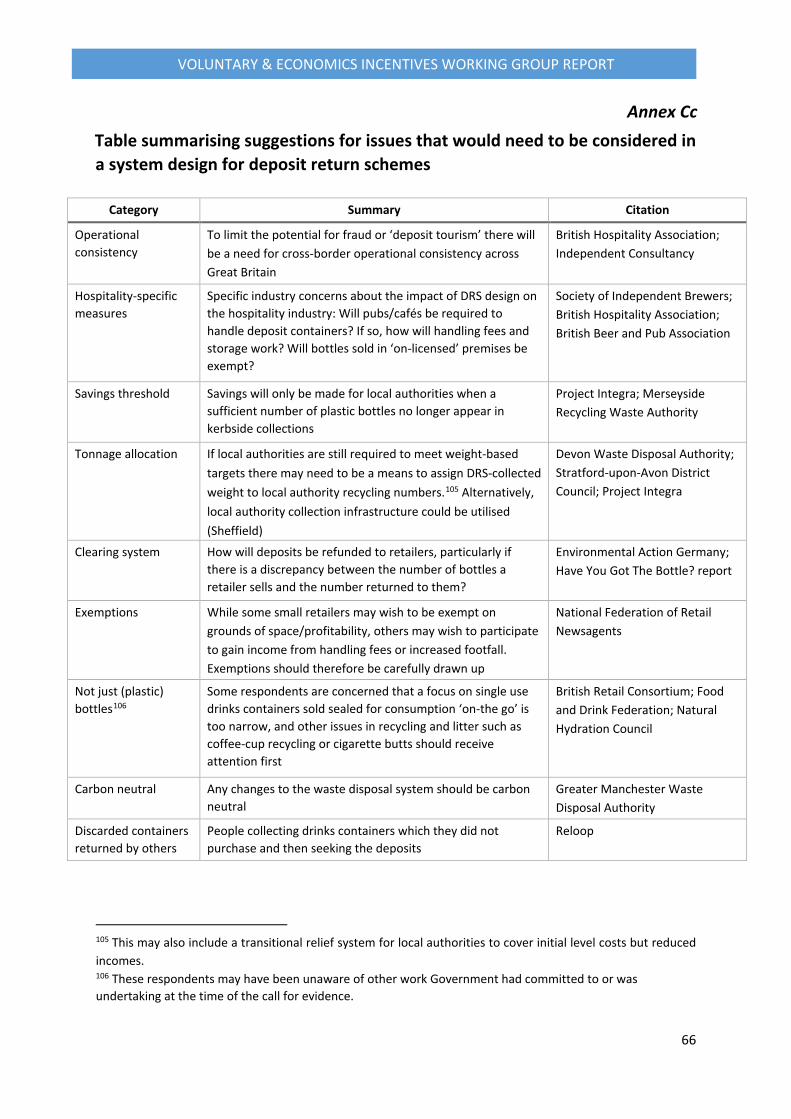
66
VOLUNTARY & ECONOMICS INCENTIVES WORKING GROUP REPORT
Annex Cc Table summarising suggestions for issues that would need to be considered in a system design for deposit return schemes
Category Summary Citation Operational consistency
To limit the potential for fraud or ‘deposit tourism’ there will be a need for cross-border operational consistency across Great Britain
British Hospitality Association; Independent Consultancy
Hospitality-specific measures
Specific industry concerns about the impact of DRS design on the hospitality industry: Will pubs/cafés be required to handle deposit containers? If so, how will handling fees and storage work? Will bottles sold in ‘on-licensed’ premises be exempt?
Society of Independent Brewers; British Hospitality Association; British Beer and Pub Association
Savings threshold Savings will only be made for local authorities when a sufficient number of plastic bottles no longer appear in kerbside collections
Project Integra; Merseyside Recycling Waste Authority
Tonnage allocation If local authorities are still required to meet weight-based targets there may need to be a means to assign DRS-collected weight to local authority recycling numbers.105 Alternatively, local authority collection infrastructure could be utilised (Sheffield)
Devon Waste Disposal Authority; Stratford-upon-Avon District Council; Project Integra
Clearing system How will deposits be refunded to retailers, particularly if there is a discrepancy between the number of bottles a retailer sells and the number returned to them?
Environmental Action Germany; Have You Got The Bottle? report
Exemptions While some small retailers may wish to be exempt on grounds of space/profitability, others may wish to participate to gain income from handling fees or increased footfall. Exemptions should therefore be carefully drawn up
National Federation of Retail Newsagents
Not just (plastic) bottles106
Some respondents are concerned that a focus on single use drinks containers sold sealed for consumption ‘on-the go’ is too narrow, and other issues in recycling and litter such as coffee-cup recycling or cigarette butts should receive attention first
British Retail Consortium; Food and Drink Federation; Natural Hydration Council
Carbon neutral Any changes to the waste disposal system should be carbon neutral
Greater Manchester Waste Disposal Authority
Discarded containers returned by others
People collecting drinks containers which they did not purchase and then seeking the deposits
Reloop
105 This may also include a transitional relief system for local authorities to cover initial level costs but reduced incomes. 106 These respondents may have been unaware of other work Government had committed to or was undertaking at the time of the call for evidence.

67
VOLUNTARY & ECONOMICS INCENTIVES WORKING GROUP REPORT
Category Summary Citation DRS detailed design necessary to understand full impact on different parties
This could help establish potential costs and benefits to all parties of a specific proposal, and should harmonise with other measures being considered in Westminster and the Devolved Administrations
Coca-Cola European Partners
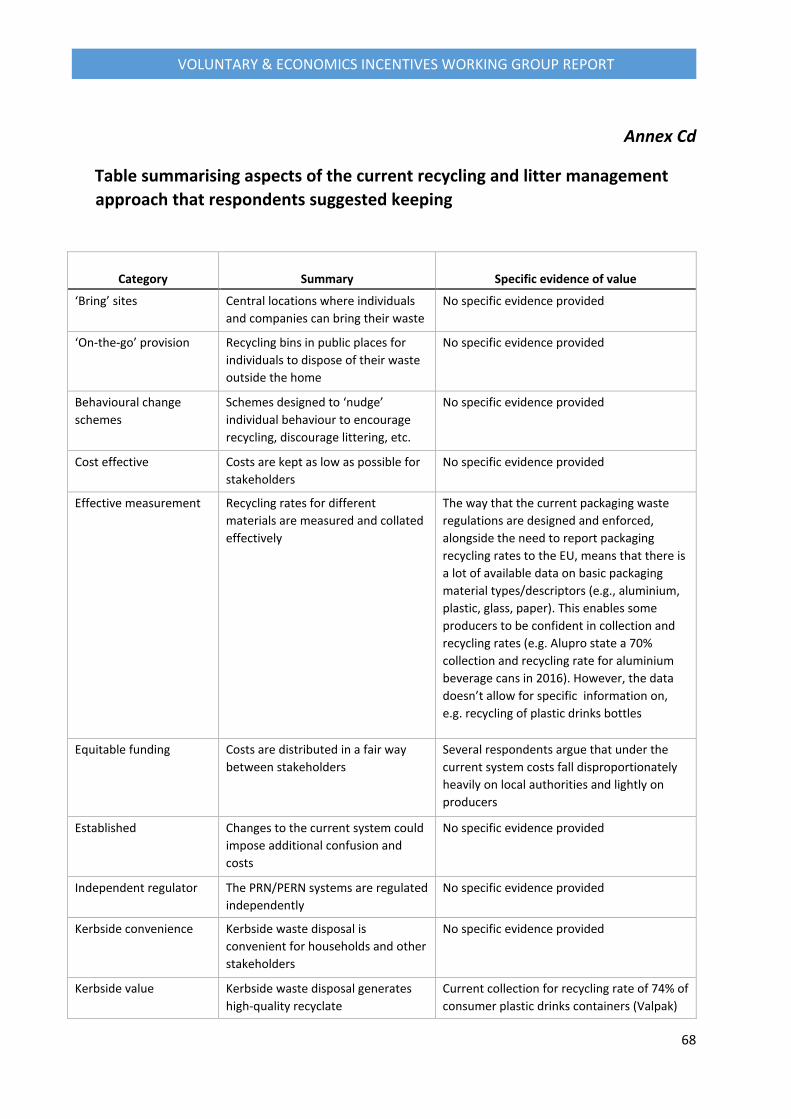
68
VOLUNTARY & ECONOMICS INCENTIVES WORKING GROUP REPORT
Annex Cd
Table summarising aspects of the current recycling and litter management approach that respondents suggested keeping
Category Summary Specific evidence of value ‘Bring’ sites Central locations where individuals
and companies can bring their waste No specific evidence provided
‘On-the-go’ provision Recycling bins in public places for individuals to dispose of their waste outside the home
No specific evidence provided
Behavioural change schemes
Schemes designed to ‘nudge’ individual behaviour to encourage recycling, discourage littering, etc.
No specific evidence provided
Cost effective Costs are kept as low as possible for stakeholders
No specific evidence provided
Effective measurement Recycling rates for different materials are measured and collated effectively
The way that the current packaging waste regulations are designed and enforced, alongside the need to report packaging recycling rates to the EU, means that there is a lot of available data on basic packaging material types/descriptors (e.g., aluminium, plastic, glass, paper). This enables some producers to be confident in collection and recycling rates (e.g. Alupro state a 70% collection and recycling rate for aluminium beverage cans in 2016). However, the data doesn’t allow for specific information on, e.g. recycling of plastic drinks bottles
Equitable funding Costs are distributed in a fair way between stakeholders
Several respondents argue that under the current system costs fall disproportionately heavily on local authorities and lightly on producers
Established Changes to the current system could impose additional confusion and costs
No specific evidence provided
Independent regulator The PRN/PERN systems are regulated independently
No specific evidence provided
Kerbside convenience Kerbside waste disposal is convenient for households and other stakeholders
No specific evidence provided
Kerbside value Kerbside waste disposal generates high-quality recyclate
Current collection for recycling rate of 74% of consumer plastic drinks containers (Valpak)
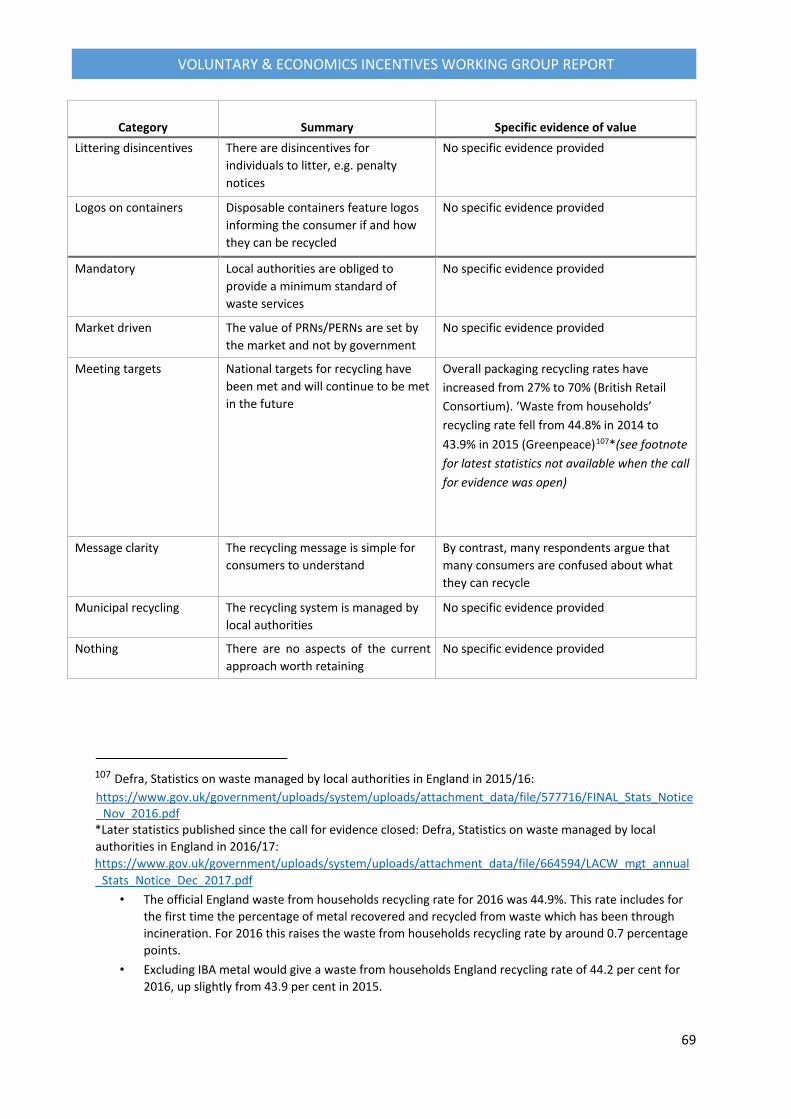
69
VOLUNTARY & ECONOMICS INCENTIVES WORKING GROUP REPORT
Category Summary Specific evidence of value Littering disincentives There are disincentives for
individuals to litter, e.g. penalty notices
No specific evidence provided
Logos on containers Disposable containers feature logos informing the consumer if and how they can be recycled
No specific evidence provided
Mandatory Local authorities are obliged to provide a minimum standard of waste services
No specific evidence provided
Market driven The value of PRNs/PERNs are set by the market and not by government
No specific evidence provided
Meeting targets National targets for recycling have been met and will continue to be met in the future
Overall packaging recycling rates have increased from 27% to 70% (British Retail Consortium). ‘Waste from households’ recycling rate fell from 44.8% in 2014 to 43.9% in 2015 (Greenpeace)107*(see footnote for latest statistics not available when the call for evidence was open)
Message clarity The recycling message is simple for consumers to understand
By contrast, many respondents argue that many consumers are confused about what they can recycle
Municipal recycling The recycling system is managed by local authorities
No specific evidence provided
Nothing There are no aspects of the current approach worth retaining
No specific evidence provided
107 Defra, Statistics on waste managed by local authorities in England in 2015/16: https://www.gov.uk/government/uploads/system/uploads/attachment_data/file/577716/FINAL_Stats_Notice _Nov_2016.pdf *Later statistics published since the call for evidence closed: Defra, Statistics on waste managed by local authorities in England in 2016/17: https://www.gov.uk/government/uploads/system/uploads/attachment_data/file/664594/LACW_mgt_annual _Stats_Notice_Dec_2017.pdf
• The official England waste from households recycling rate for 2016 was 44.9%. This rate includes for the first time the percentage of metal recovered and recycled from waste which has been through incineration. For 2016 this raises the waste from households recycling rate by around 0.7 percentage points.
• Excluding IBA metal would give a waste from households England recycling rate of 44.2 per cent for 2016, up slightly from 43.9 per cent in 2015.
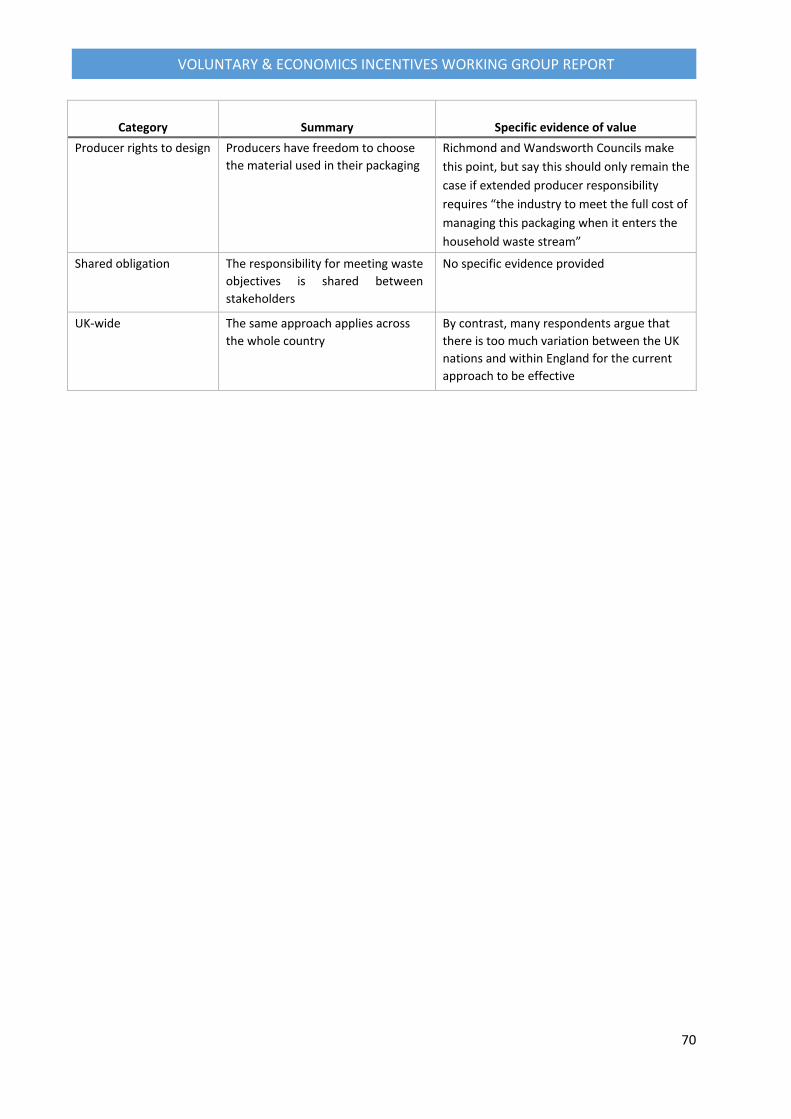
70
VOLUNTARY & ECONOMICS INCENTIVES WORKING GROUP REPORT
Category Summary Specific evidence of value Producer rights to design Producers have freedom to choose
the material used in their packaging Richmond and Wandsworth Councils make this point, but say this should only remain the case if extended producer responsibility requires “the industry to meet the full cost of managing this packaging when it enters the household waste stream”
Shared obligation The responsibility for meeting waste objectives is shared between stakeholders
No specific evidence provided
UK-wide The same approach applies across the whole country
By contrast, many respondents argue that there is too much variation between the UK nations and within England for the current approach to be effective
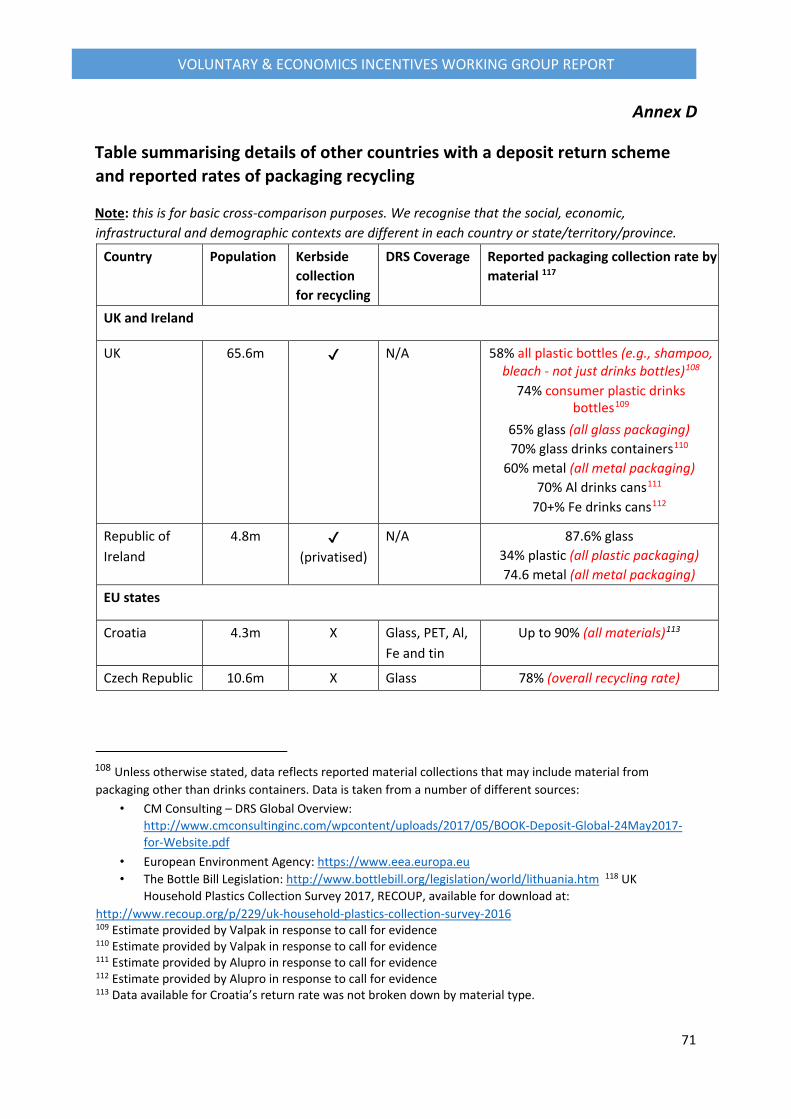
71
VOLUNTARY & ECONOMICS INCENTIVES WORKING GROUP REPORT
Annex D
Table summarising details of other countries with a deposit return scheme and reported rates of packaging recycling
Note: this is for basic cross-comparison purposes. We recognise that the social, economic, infrastructural and demographic contexts are different in each country or state/territory/province.
Country Population Kerbside collection for recycling
DRS Coverage Reported packaging collection rate by material 117
UK and Ireland
UK 65.6m ✔ N/A 58% all plastic bottles (e.g., shampoo, bleach - not just drinks bottles)108
74% consumer plastic drinks bottles109
65% glass (all glass packaging) 70% glass drinks containers110
60% metal (all metal packaging) 70% Al drinks cans111
70+% Fe drinks cans112
Republic of Ireland
4.8m ✔ (privatised)
N/A 87.6% glass 34% plastic (all plastic packaging) 74.6 metal (all metal packaging)
EU states
Croatia 4.3m X Glass, PET, Al, Fe and tin
Up to 90% (all materials)113
Czech Republic 10.6m X Glass 78% (overall recycling rate)
108 Unless otherwise stated, data reflects reported material collections that may include material from packaging other than drinks containers. Data is taken from a number of different sources:
• CM Consulting – DRS Global Overview: http://www.cmconsultinginc.com/wpcontent/uploads/2017/05/BOOK-Deposit-Global-24May2017-for-Website.pdf
• European Environment Agency: https://www.eea.europa.eu • The Bottle Bill Legislation: http://www.bottlebill.org/legislation/world/lithuania.htm 118 UK
Household Plastics Collection Survey 2017, RECOUP, available for download at: http://www.recoup.org/p/229/uk-household-plastics-collection-survey-2016 109 Estimate provided by Valpak in response to call for evidence 110 Estimate provided by Valpak in response to call for evidence 111 Estimate provided by Alupro in response to call for evidence 112 Estimate provided by Alupro in response to call for evidence 113 Data available for Croatia’s return rate was not broken down by material type.
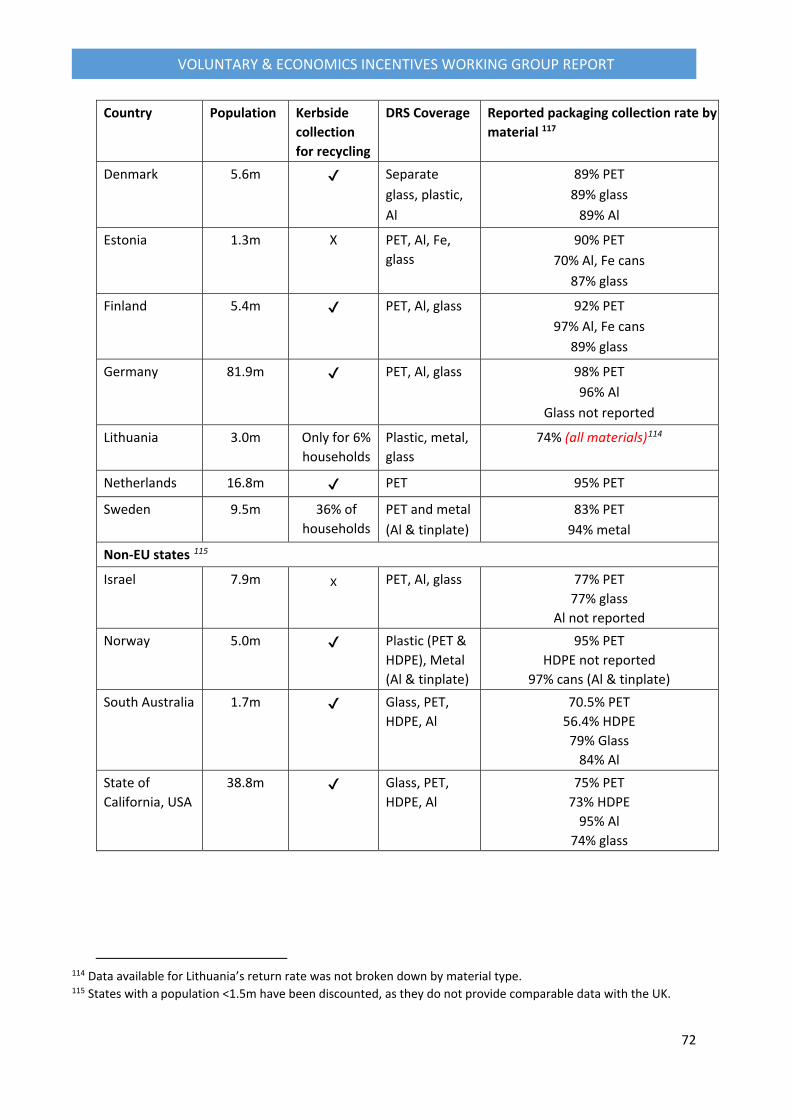
72
VOLUNTARY & ECONOMICS INCENTIVES WORKING GROUP REPORT
Country Population Kerbside collection for recycling
DRS Coverage Reported packaging collection rate by material 117
Denmark 5.6m ✔ Separate glass, plastic, Al
89% PET 89% glass
89% Al Estonia 1.3m X PET, Al, Fe,
glass 90% PET
70% Al, Fe cans 87% glass
Finland 5.4m ✔ PET, Al, glass 92% PET 97% Al, Fe cans
89% glass Germany 81.9m ✔ PET, Al, glass 98% PET
96% Al Glass not reported
Lithuania 3.0m Only for 6% households
Plastic, metal, glass
74% (all materials)114
Netherlands 16.8m ✔ PET 95% PET
Sweden 9.5m 36% of households
PET and metal (Al & tinplate)
83% PET 94% metal
Non-EU states 115 Israel 7.9m x PET, Al, glass 77% PET
77% glass Al not reported
Norway 5.0m ✔ Plastic (PET & HDPE), Metal (Al & tinplate)
95% PET HDPE not reported
97% cans (Al & tinplate) South Australia 1.7m ✔ Glass, PET,
HDPE, Al 70.5% PET
56.4% HDPE 79% Glass
84% Al State of California, USA
38.8m ✔ Glass, PET, HDPE, Al
75% PET 73% HDPE
95% Al 74% glass
114 Data available for Lithuania’s return rate was not broken down by material type. 115 States with a population <1.5m have been discounted, as they do not provide comparable data with the UK.
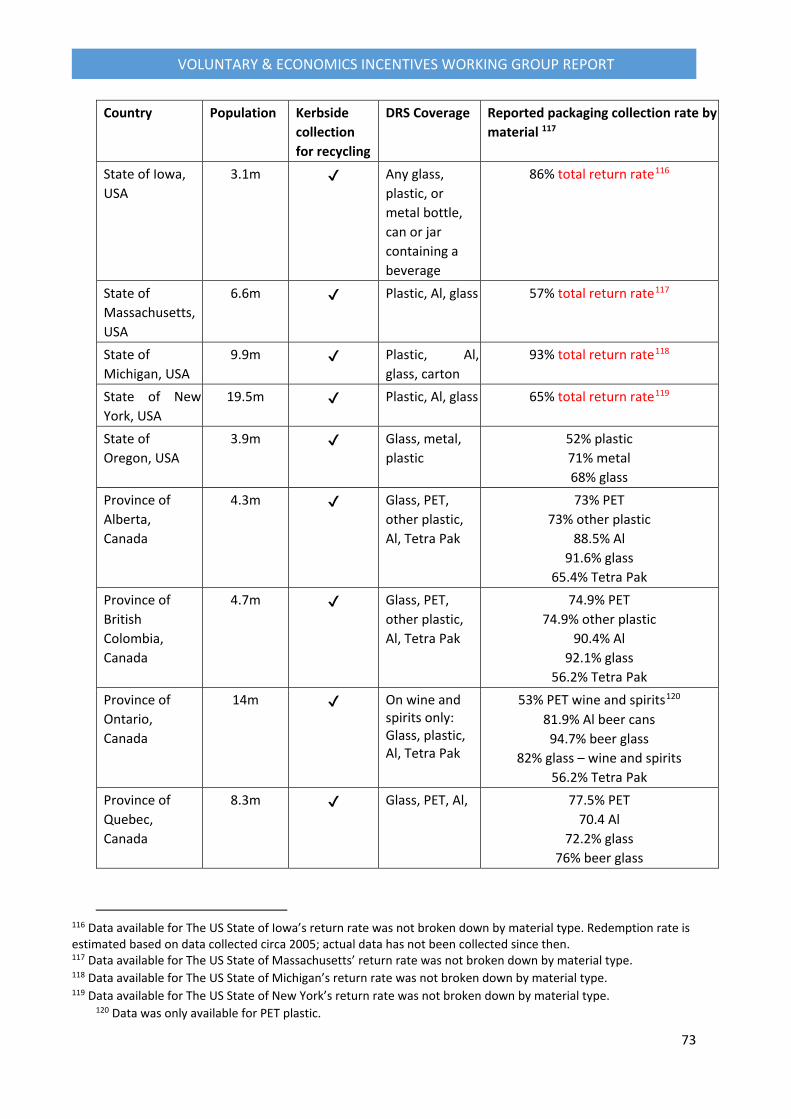
73
VOLUNTARY & ECONOMICS INCENTIVES WORKING GROUP REPORT
Country Population Kerbside collection for recycling
DRS Coverage Reported packaging collection rate by material 117
State of Iowa, USA
3.1m ✔ Any glass, plastic, or metal bottle, can or jar containing a beverage
86% total return rate116
State of Massachusetts, USA
6.6m ✔ Plastic, Al, glass 57% total return rate117
State of Michigan, USA
9.9m ✔ Plastic, Al, glass, carton
93% total return rate118
State of New York, USA
19.5m ✔ Plastic, Al, glass 65% total return rate119
State of Oregon, USA
3.9m ✔ Glass, metal, plastic
52% plastic 71% metal 68% glass
Province of Alberta, Canada
4.3m ✔ Glass, PET, other plastic, Al, Tetra Pak
73% PET 73% other plastic
88.5% Al 91.6% glass
65.4% Tetra Pak Province of British Colombia, Canada
4.7m ✔ Glass, PET, other plastic, Al, Tetra Pak
74.9% PET 74.9% other plastic
90.4% Al 92.1% glass
56.2% Tetra Pak Province of Ontario, Canada
14m ✔ On wine and spirits only: Glass, plastic, Al, Tetra Pak
53% PET wine and spirits120 81.9% Al beer cans 94.7% beer glass
82% glass – wine and spirits 56.2% Tetra Pak
Province of Quebec, Canada
8.3m ✔ Glass, PET, Al, 77.5% PET 70.4 Al
72.2% glass 76% beer glass
116 Data available for The US State of Iowa’s return rate was not broken down by material type. Redemption rate is estimated based on data collected circa 2005; actual data has not been collected since then. 117 Data available for The US State of Massachusetts’ return rate was not broken down by material type. 118 Data available for The US State of Michigan’s return rate was not broken down by material type. 119 Data available for The US State of New York’s return rate was not broken down by material type.
120 Data was only available for PET plastic.
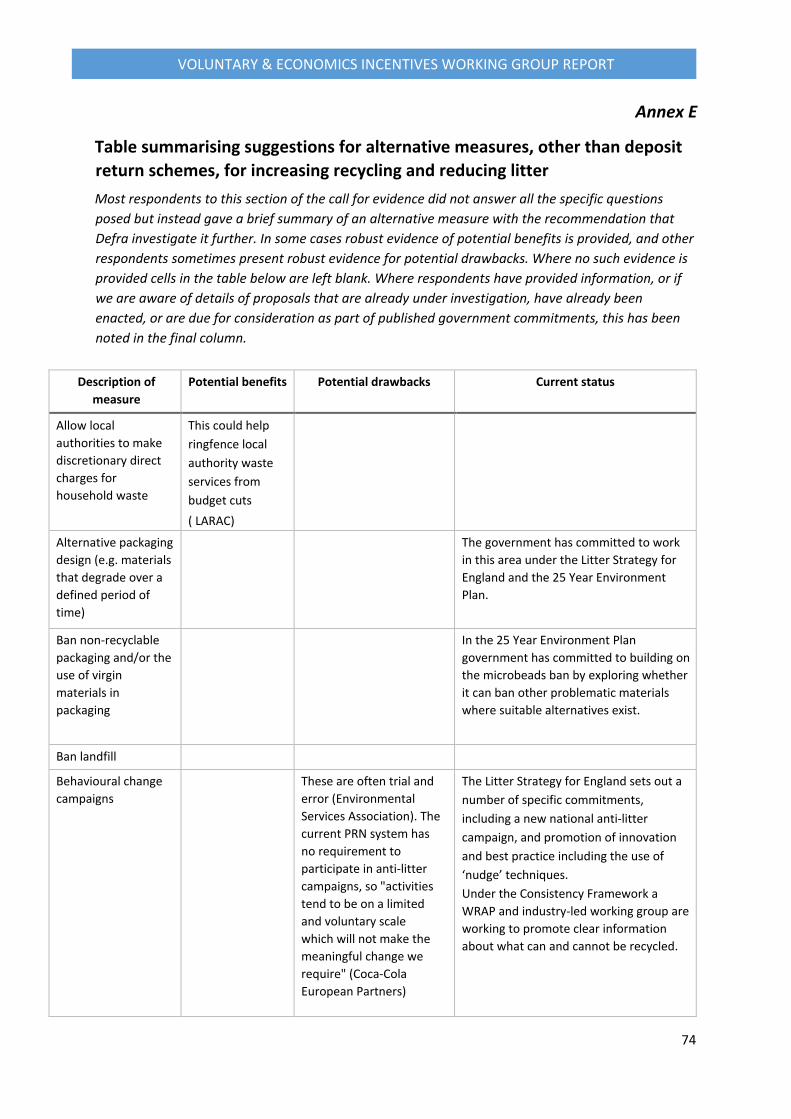
74
VOLUNTARY & ECONOMICS INCENTIVES WORKING GROUP REPORT
Annex E
Table summarising suggestions for alternative measures, other than deposit return schemes, for increasing recycling and reducing litter Most respondents to this section of the call for evidence did not answer all the specific questions posed but instead gave a brief summary of an alternative measure with the recommendation that Defra investigate it further. In some cases robust evidence of potential benefits is provided, and other respondents sometimes present robust evidence for potential drawbacks. Where no such evidence is provided cells in the table below are left blank. Where respondents have provided information, or if we are aware of details of proposals that are already under investigation, have already been enacted, or are due for consideration as part of published government commitments, this has been noted in the final column.
Description of measure
Potential benefits Potential drawbacks Current status
Allow local authorities to make discretionary direct charges for household waste
This could help ringfence local authority waste services from budget cuts ( LARAC)
Alternative packaging design (e.g. materials that degrade over a defined period of time)
The government has committed to work in this area under the Litter Strategy for England and the 25 Year Environment Plan.
Ban non-recyclable packaging and/or the use of virgin materials in packaging
In the 25 Year Environment Plan government has committed to building on the microbeads ban by exploring whether it can ban other problematic materials where suitable alternatives exist.
Ban landfill Behavioural change campaigns
These are often trial and error (Environmental Services Association). The current PRN system has no requirement to participate in anti-litter campaigns, so "activities tend to be on a limited and voluntary scale which will not make the meaningful change we require" (Coca-Cola European Partners)
The Litter Strategy for England sets out a number of specific commitments, including a new national anti-litter campaign, and promotion of innovation and best practice including the use of ‘nudge’ techniques. Under the Consistency Framework a WRAP and industry-led working group are working to promote clear information about what can and cannot be recycled.
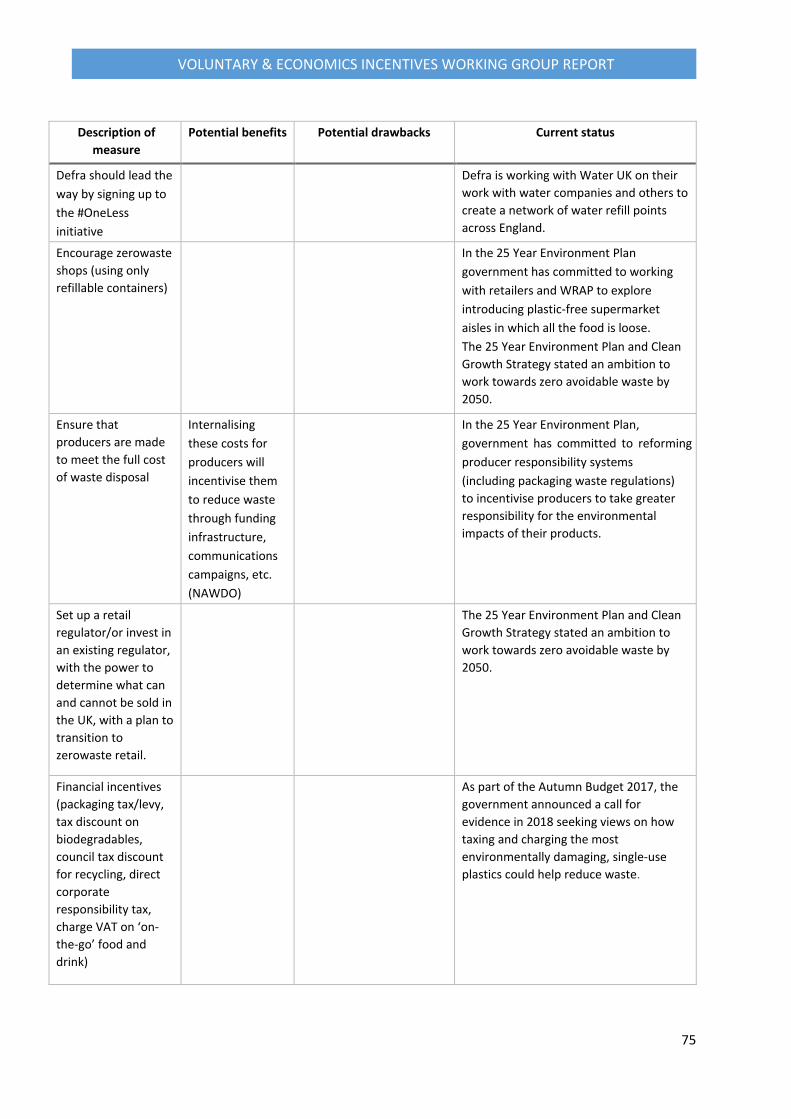
75
VOLUNTARY & ECONOMICS INCENTIVES WORKING GROUP REPORT
Description of
measure Potential benefits Potential drawbacks Current status
Defra should lead the way by signing up to the #OneLess initiative
Defra is working with Water UK on their work with water companies and others to create a network of water refill points across England.
Encourage zerowaste shops (using only refillable containers)
In the 25 Year Environment Plan government has committed to working with retailers and WRAP to explore introducing plastic-free supermarket aisles in which all the food is loose. The 25 Year Environment Plan and Clean Growth Strategy stated an ambition to work towards zero avoidable waste by 2050.
Ensure that producers are made to meet the full cost of waste disposal
Internalising these costs for producers will incentivise them to reduce waste through funding infrastructure, communications campaigns, etc. (NAWDO)
In the 25 Year Environment Plan, government has committed to reforming producer responsibility systems (including packaging waste regulations) to incentivise producers to take greater responsibility for the environmental impacts of their products.
Set up a retail regulator/or invest in an existing regulator, with the power to determine what can and cannot be sold in the UK, with a plan to transition to zerowaste retail.
The 25 Year Environment Plan and Clean Growth Strategy stated an ambition to work towards zero avoidable waste by 2050.
Financial incentives (packaging tax/levy, tax discount on biodegradables, council tax discount for recycling, direct corporate responsibility tax, charge VAT on ‘on-the-go’ food and drink)
As part of the Autumn Budget 2017, the government announced a call for evidence in 2018 seeking views on how taxing and charging the most environmentally damaging, single-use plastics could help reduce waste.
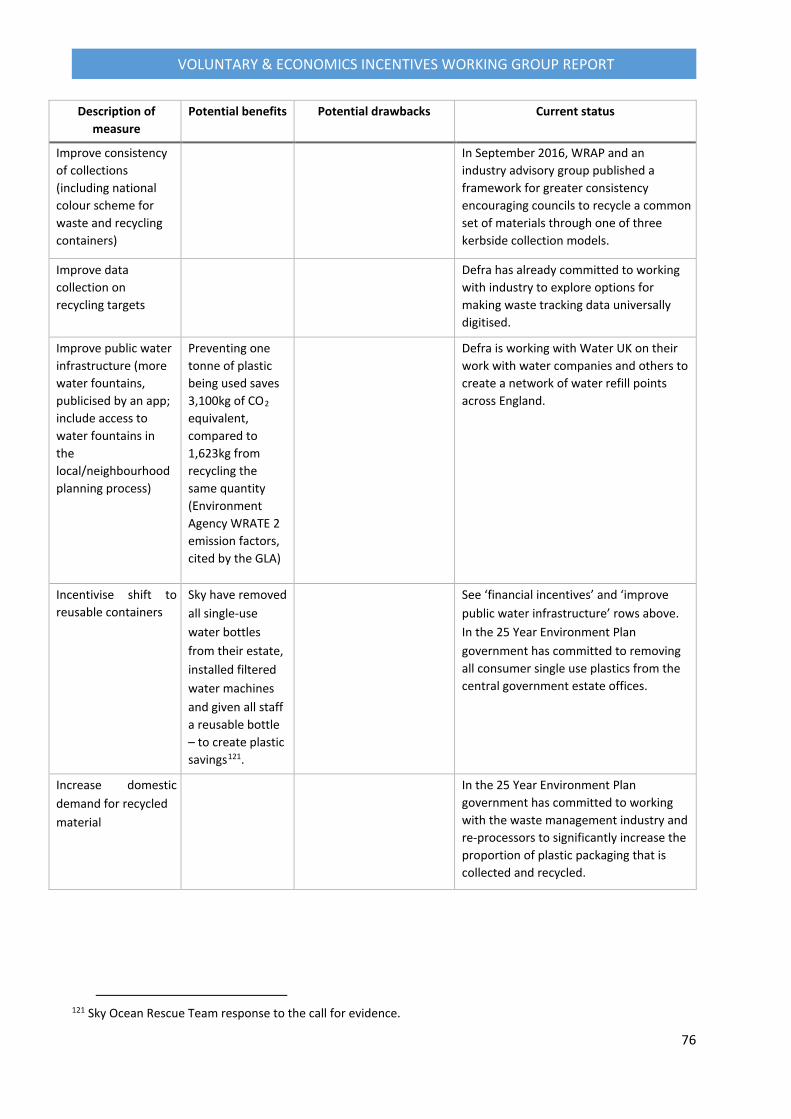
76
VOLUNTARY & ECONOMICS INCENTIVES WORKING GROUP REPORT
Description of measure
Potential benefits Potential drawbacks Current status
Improve consistency of collections (including national colour scheme for waste and recycling containers)
In September 2016, WRAP and an industry advisory group published a framework for greater consistency encouraging councils to recycle a common set of materials through one of three kerbside collection models.
Improve data collection on recycling targets
Defra has already committed to working with industry to explore options for making waste tracking data universally digitised.
Improve public water infrastructure (more water fountains, publicised by an app; include access to water fountains in the local/neighbourhood planning process)
Preventing one tonne of plastic being used saves 3,100kg of CO2 equivalent, compared to 1,623kg from recycling the same quantity (Environment Agency WRATE 2 emission factors, cited by the GLA)
Defra is working with Water UK on their work with water companies and others to create a network of water refill points across England.
Incentivise shift to reusable containers
Sky have removed all single-use water bottles from their estate, installed filtered water machines and given all staff a reusable bottle – to create plastic savings121.
See ‘financial incentives’ and ‘improve public water infrastructure’ rows above. In the 25 Year Environment Plan government has committed to removing all consumer single use plastics from the central government estate offices.
Increase domestic demand for recycled material
In the 25 Year Environment Plan government has committed to working with the waste management industry and re-processors to significantly increase the proportion of plastic packaging that is collected and recycled.
121 Sky Ocean Rescue Team response to the call for evidence.
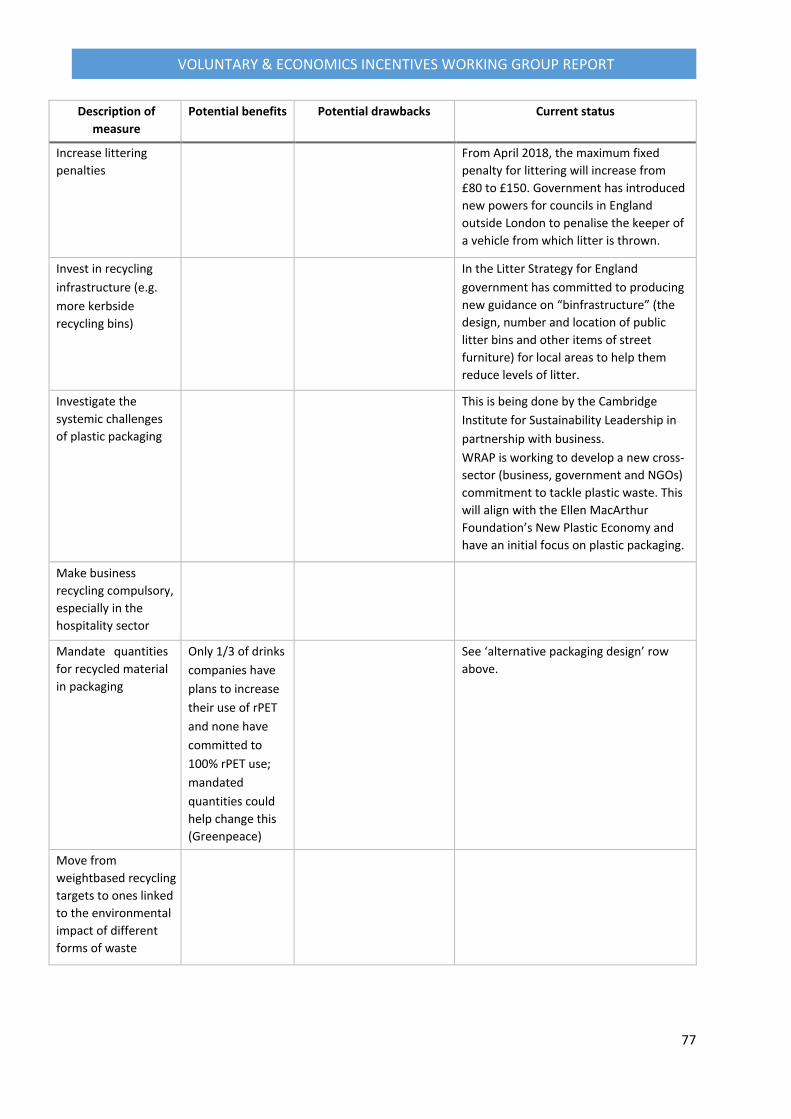
77
VOLUNTARY & ECONOMICS INCENTIVES WORKING GROUP REPORT
Description of measure
Potential benefits Potential drawbacks Current status
Increase littering penalties
From April 2018, the maximum fixed penalty for littering will increase from £80 to £150. Government has introduced new powers for councils in England outside London to penalise the keeper of a vehicle from which litter is thrown.
Invest in recycling infrastructure (e.g. more kerbside recycling bins)
In the Litter Strategy for England government has committed to producing new guidance on “binfrastructure” (the design, number and location of public litter bins and other items of street furniture) for local areas to help them reduce levels of litter.
Investigate the systemic challenges of plastic packaging
This is being done by the Cambridge Institute for Sustainability Leadership in partnership with business. WRAP is working to develop a new cross-sector (business, government and NGOs) commitment to tackle plastic waste. This will align with the Ellen MacArthur Foundation’s New Plastic Economy and have an initial focus on plastic packaging.
Make business recycling compulsory, especially in the hospitality sector
Mandate quantities for recycled material in packaging
Only 1/3 of drinks companies have plans to increase their use of rPET and none have committed to 100% rPET use; mandated quantities could help change this (Greenpeace)
See ‘alternative packaging design’ row above.
Move from weightbased recycling targets to ones linked to the environmental impact of different forms of waste
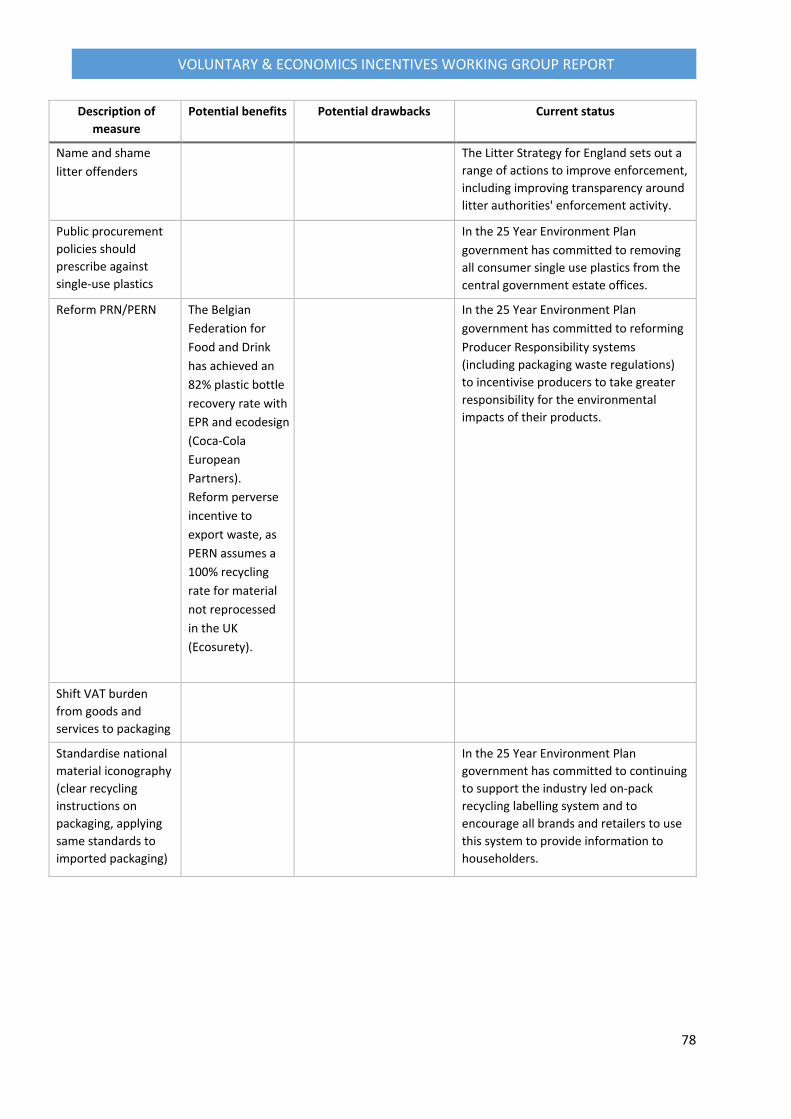
78
VOLUNTARY & ECONOMICS INCENTIVES WORKING GROUP REPORT
Description of measure
Potential benefits Potential drawbacks Current status
Name and shame litter offenders
The Litter Strategy for England sets out a range of actions to improve enforcement, including improving transparency around litter authorities' enforcement activity.
Public procurement policies should prescribe against single-use plastics
In the 25 Year Environment Plan government has committed to removing all consumer single use plastics from the central government estate offices.
Reform PRN/PERN The Belgian Federation for Food and Drink has achieved an 82% plastic bottle recovery rate with EPR and ecodesign (Coca-Cola European Partners). Reform perverse incentive to export waste, as PERN assumes a 100% recycling rate for material not reprocessed in the UK (Ecosurety).
In the 25 Year Environment Plan government has committed to reforming Producer Responsibility systems (including packaging waste regulations) to incentivise producers to take greater responsibility for the environmental impacts of their products.
Shift VAT burden from goods and services to packaging
Standardise national material iconography (clear recycling instructions on packaging, applying same standards to imported packaging)
In the 25 Year Environment Plan government has committed to continuing to support the industry led on-pack recycling labelling system and to encourage all brands and retailers to use this system to provide information to householders.
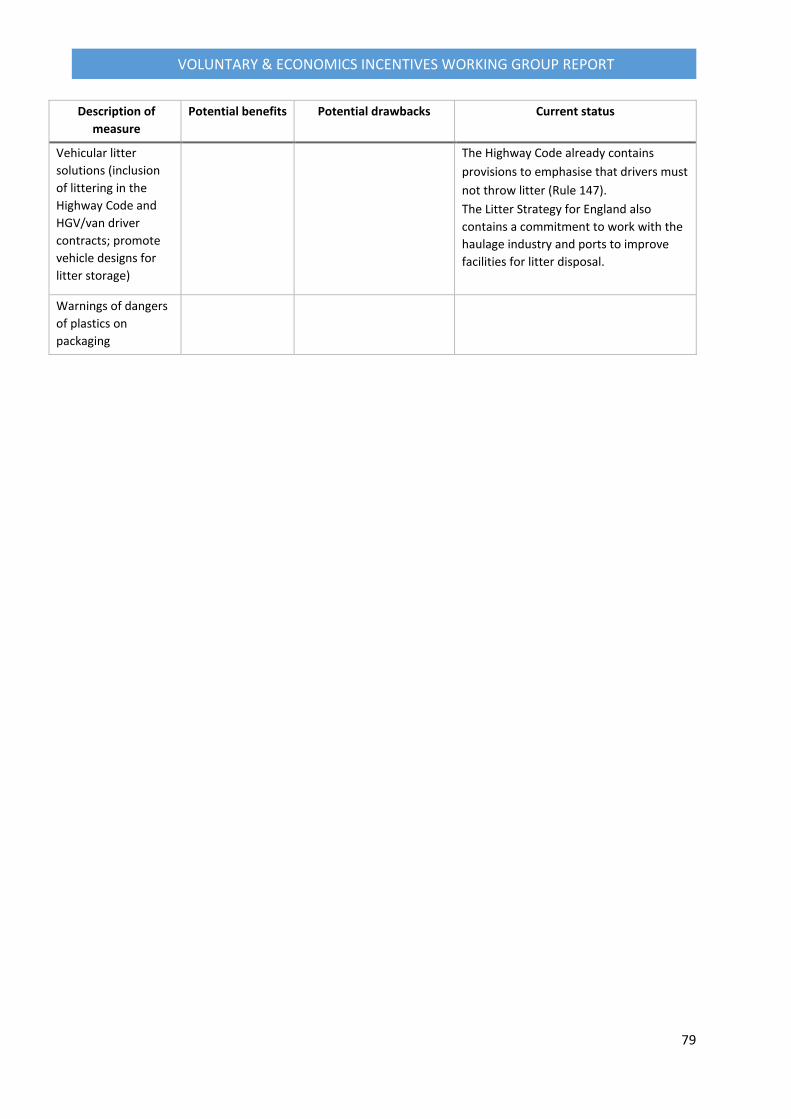
79
VOLUNTARY & ECONOMICS INCENTIVES WORKING GROUP REPORT
Description of measure
Potential benefits Potential drawbacks Current status
Vehicular litter solutions (inclusion of littering in the Highway Code and HGV/van driver contracts; promote vehicle designs for litter storage)
The Highway Code already contains provisions to emphasise that drivers must not throw litter (Rule 147). The Litter Strategy for England also contains a commitment to work with the haulage industry and ports to improve facilities for litter disposal.
Warnings of dangers of plastics on packaging
![Welcome [learning.acm.org] · Public-sector mechanisms • Procurement regulations • Tax and other financial incentives • Public recognition • Voluntary standards setting by](https://img.pdfslide.us/doc/110x75/5f02b2d57e708231d40590a9/welcome-public-sector-mechanisms-a-procurement-regulations-a-tax-and-other.jpg)