Embed Size (px)
Citation preview
‘‘Voluntary’ Business Environmental Voluntary’ Business Environmental ManagementManagement
David Ervin
Professor, Environmental Studies
Coordinator, Academic Sustainability Programs
Portland State University
© 2006 Portland State University
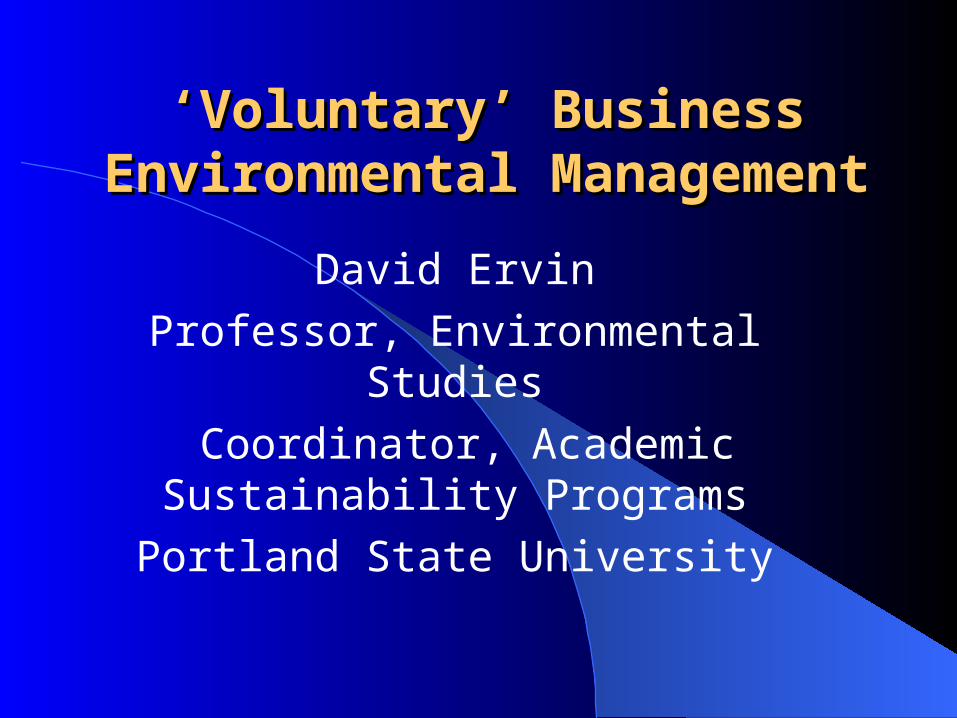
OutlineOutline
Why is ‘green business’ growing?What are the motivations?
– Preliminary results from Oregon survey
What are the costs of going green?What roles can the public sector play to
foster ‘voluntary’ environmental action? Take home messages
© 2006 Portland State University
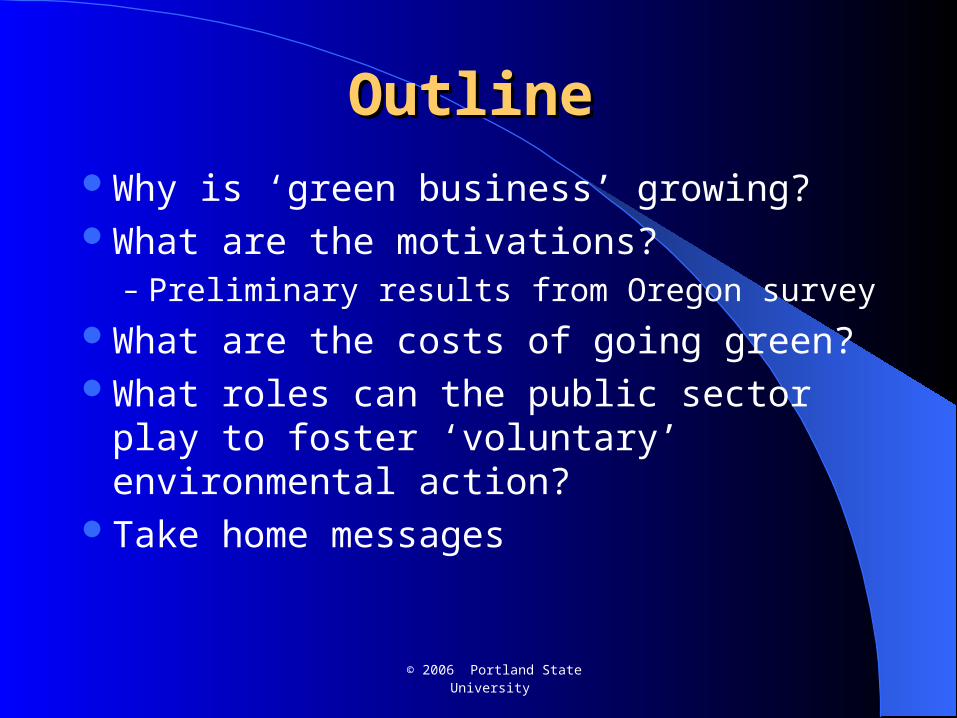
Why is ‘green business’ Why is ‘green business’ growing? growing?
Pollution problems persist and the public generally wants a cleaner environment.
Government ‘command-and-control’ and ‘technology-design’ approaches are not solving some problems, e.g., nonpoint.
Business compliance and government enforcement costs have increased sharply and have the potential to go much higher.
© 2006 Portland State University
Why is ‘green business’ Why is ‘green business’ growing?growing?
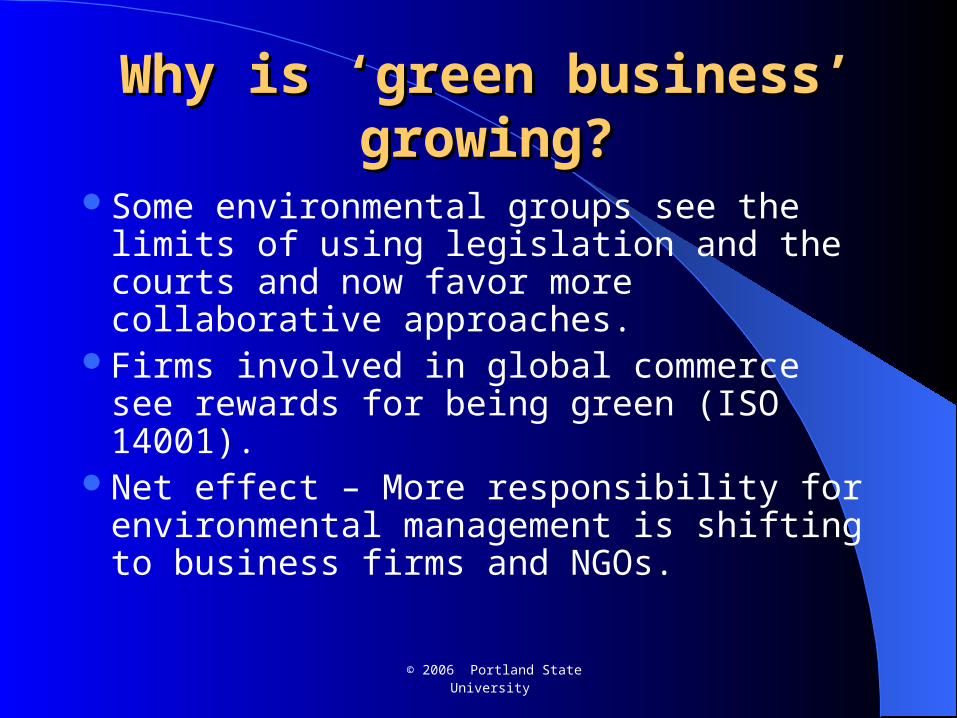
Some environmental groups see the limits of using legislation and the courts and now favor more collaborative approaches.
Firms involved in global commerce see rewards for being green (ISO 14001).
Net effect – More responsibility for environmental management is shifting to business firms and NGOs.
© 2006 Portland State University
1. Mitigate and preempt 1. Mitigate and preempt environmental regulationsenvironmental regulations
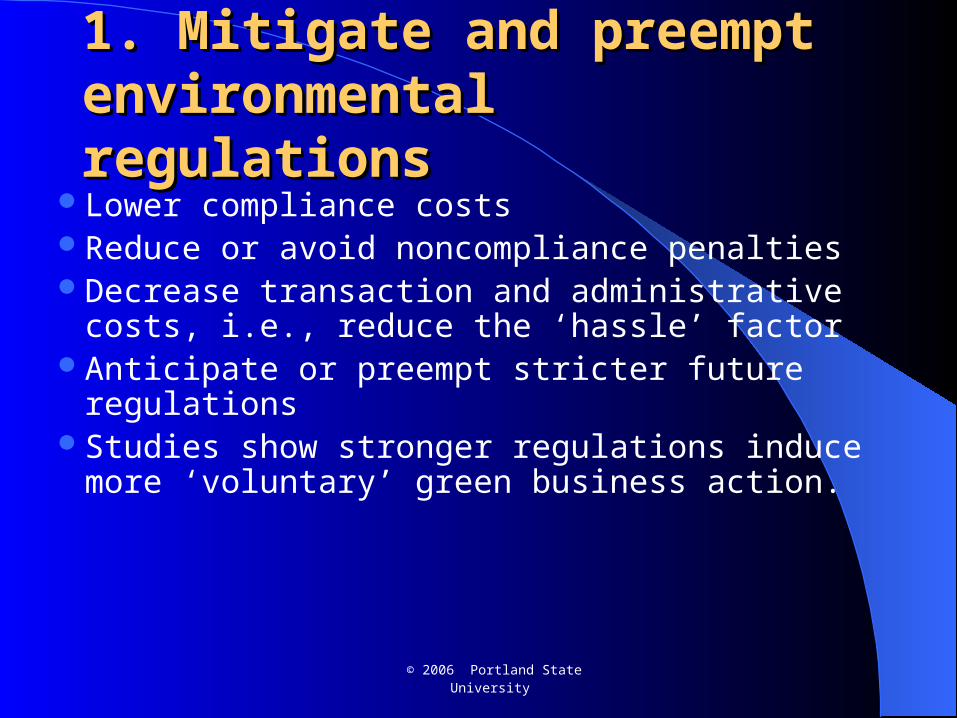
Lower compliance costsReduce or avoid noncompliance penaltiesDecrease transaction and administrative costs,
i.e., reduce the ‘hassle’ factorAnticipate or preempt stricter future regulationsStudies show stronger regulations induce more
‘voluntary’ green business action.
© 2006 Portland State University
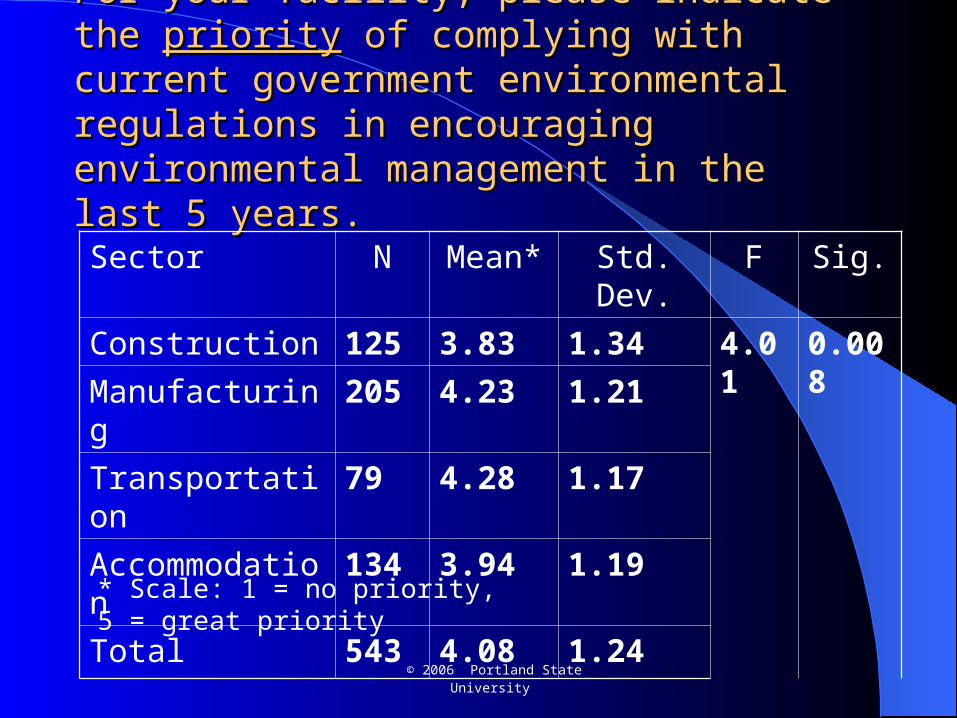
For your facility, please indicate the For your facility, please indicate the prioritypriority of of complying with current government environmental complying with current government environmental regulations in encouraging environmental regulations in encouraging environmental management in the last 5 years.management in the last 5 years.
Sector N Mean* Std. Dev. F Sig.
Construction 125 3.83 1.34 4.01 0.008
Manufacturing 205 4.23 1.21
Transportation 79 4.28 1.17
Accommodation 134 3.94 1.19
Total 543 4.08 1.24
* Scale: 1 = no priority, 5 = great priority
© 2006 Portland State University
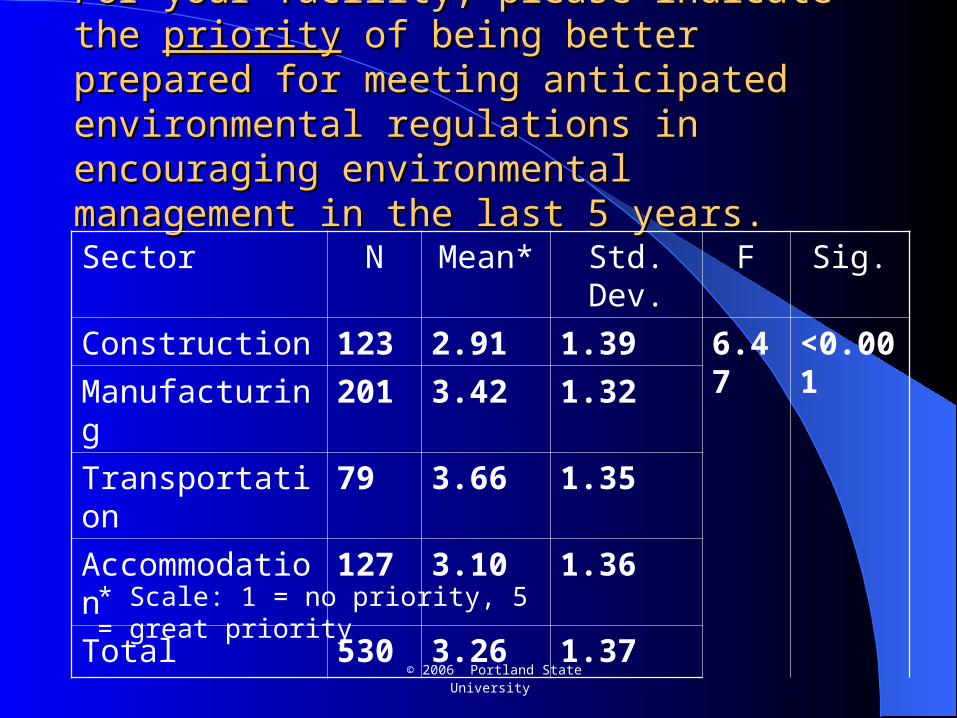
For your facility, please indicate the For your facility, please indicate the prioritypriority of being of being better prepared for meeting anticipated better prepared for meeting anticipated environmental regulations in encouraging environmental regulations in encouraging environmental management in the last 5 years.environmental management in the last 5 years.
Sector N Mean* Std. Dev. F Sig.
Construction 123 2.91 1.39 6.47 <0.001
Manufacturing 201 3.42 1.32
Transportation 79 3.66 1.35
Accommodation 127 3.10 1.36
Total 530 3.26 1.37
* Scale: 1 = no priority, 5 = great priority
© 2006 Portland State University
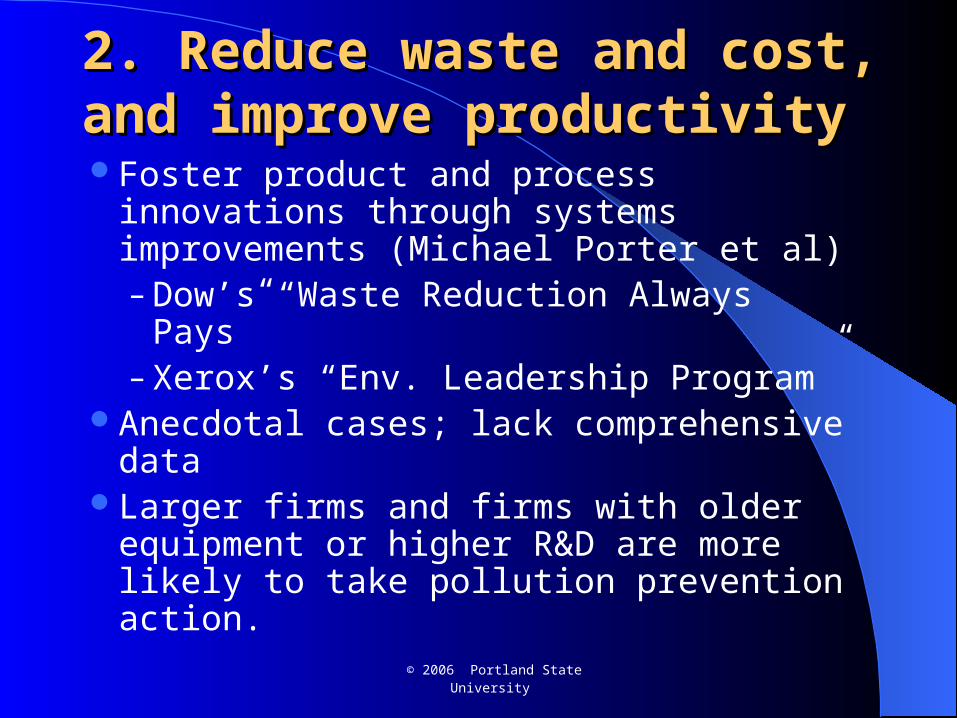
2. Reduce waste and cost, and 2. Reduce waste and cost, and improve productivityimprove productivityFoster product and process innovations
through systems improvements (Michael Porter et al)– Dow’s “Waste Reduction Always Pays”– Xerox’s “Env. Leadership Program”
Anecdotal cases; lack comprehensive dataLarger firms and firms with older
equipment or higher R&D are more likely to take pollution prevention action.
© 2006 Portland State University
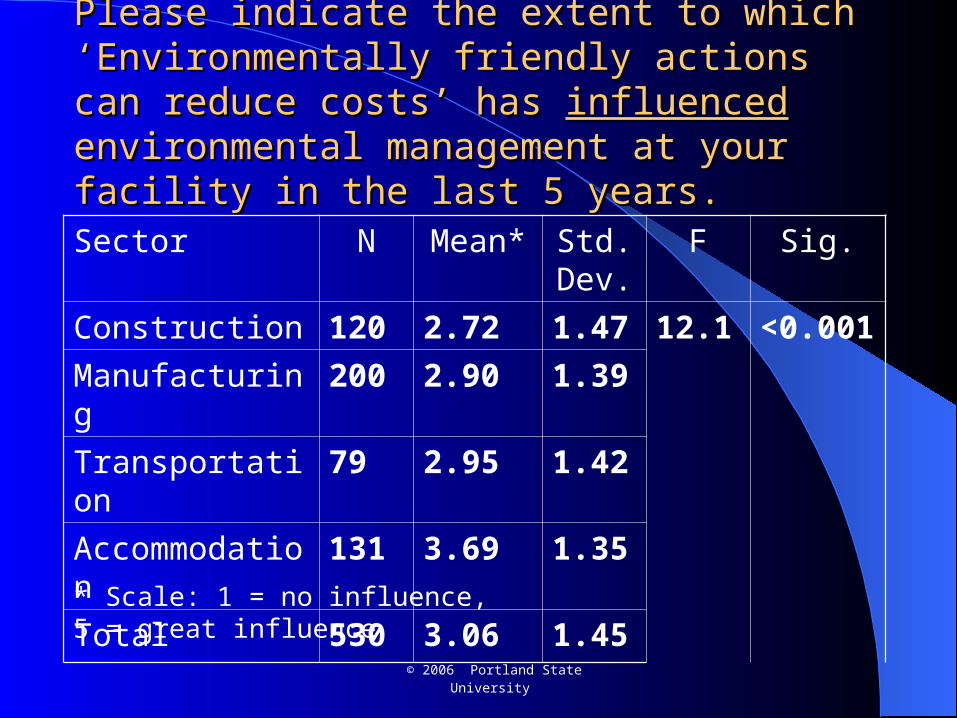
Please indicate the extent to which ‘Environmentally Please indicate the extent to which ‘Environmentally friendly actions can reduce costs’ has friendly actions can reduce costs’ has influencedinfluenced environmental management at your facility in the environmental management at your facility in the last 5 years.last 5 years.
Sector N Mean* Std. Dev.
F Sig.
Construction 120 2.72 1.47 12.1 <0.001
Manufacturing 200 2.90 1.39
Transportation 79 2.95 1.42
Accommodation 131 3.69 1.35
Total 530 3.06 1.45
* Scale: 1 = no influence, 5 = great influence
© 2006 Portland State University
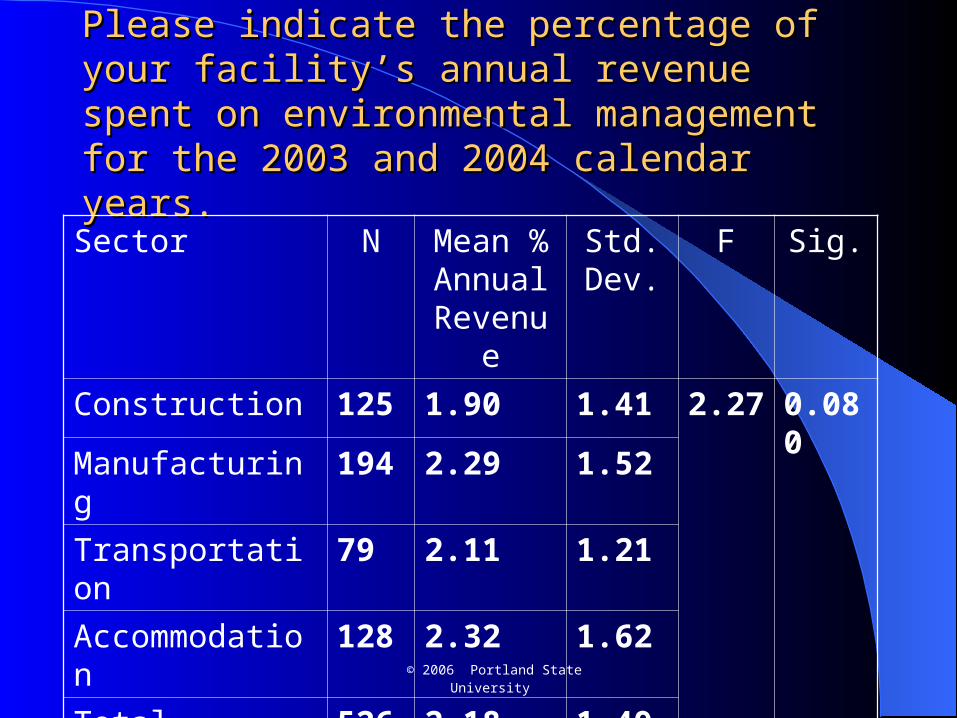
Please indicate the percentage of your facility’s Please indicate the percentage of your facility’s annual revenue spent on environmental management annual revenue spent on environmental management for the 2003 and 2004 calendar years.for the 2003 and 2004 calendar years.
Sector N Mean % Annual
Revenue
Std. Dev.
F Sig.
Construction 125 1.90 1.41 2.27 0.080
Manufacturing 194 2.29 1.52
Transportation 79 2.11 1.21
Accommodation 128 2.32 1.62
Total 526 2.18 1.49
© 2006 Portland State University
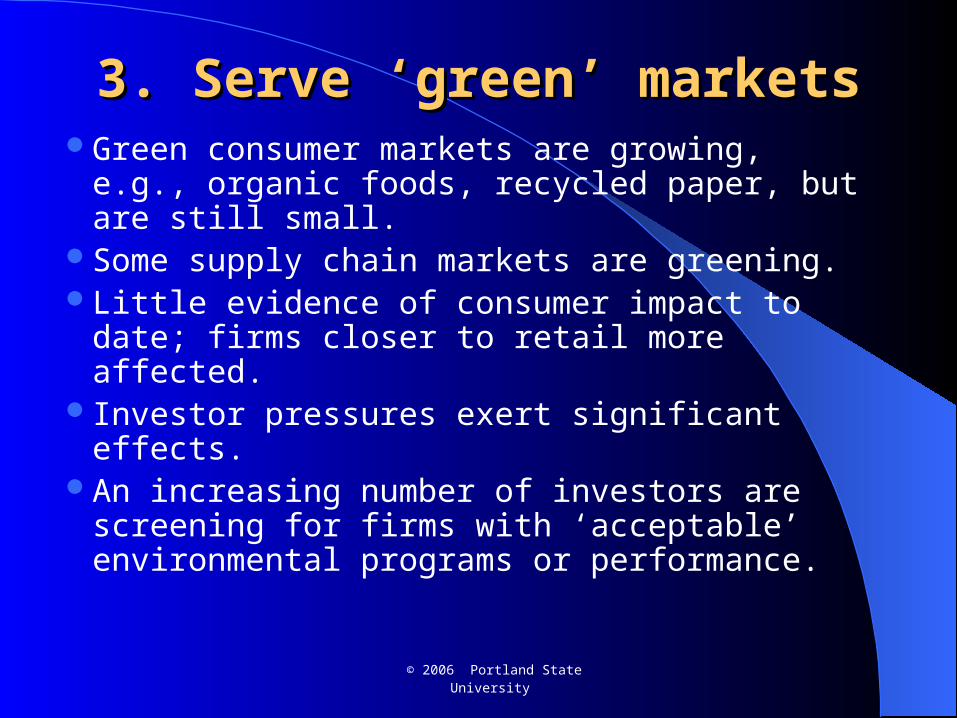
3. Serve ‘green’ markets3. Serve ‘green’ marketsGreen consumer markets are growing, e.g.,
organic foods, recycled paper, but are still small.
Some supply chain markets are greening. Little evidence of consumer impact to date;
firms closer to retail more affected.Investor pressures exert significant effects.An increasing number of investors are screening
for firms with ‘acceptable’ environmental programs or performance.
© 2006 Portland State University
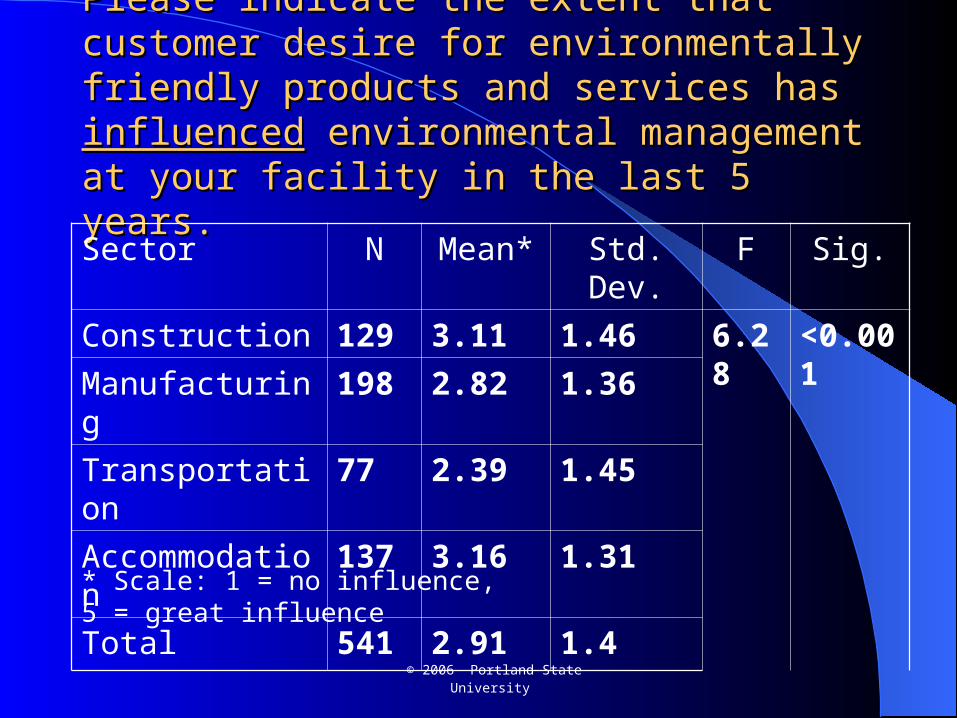
Please indicate the extent that customer desire for Please indicate the extent that customer desire for environmentally friendly products and services has environmentally friendly products and services has influencedinfluenced environmental management at your environmental management at your facility in the last 5 years.facility in the last 5 years.
Sector N Mean* Std. Dev. F Sig.
Construction 129 3.11 1.46 6.28 <0.001
Manufacturing 198 2.82 1.36
Transportation 77 2.39 1.45
Accommodation 137 3.16 1.31
Total 541 2.91 1.4
* Scale: 1 = no influence, 5 = great influence
© 2006 Portland State University
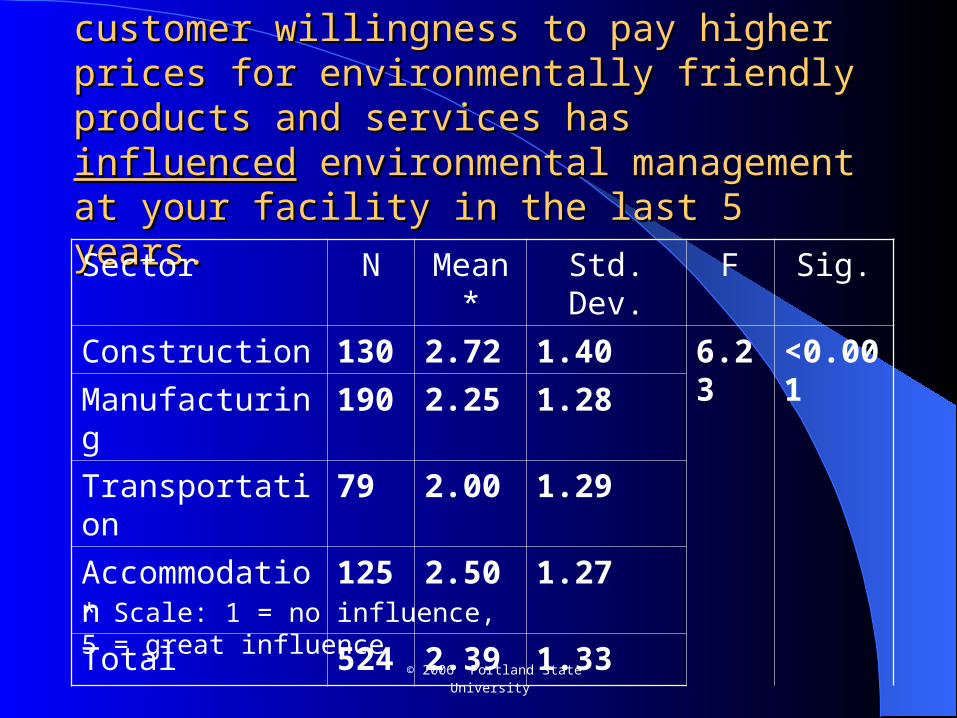
Please indicate the extent that customer willingness Please indicate the extent that customer willingness to pay higher prices for environmentally friendly to pay higher prices for environmentally friendly products and services has products and services has influencedinfluenced environmental environmental management at your facility in the last 5 years.management at your facility in the last 5 years.
Sector N Mean* Std. Dev. F Sig.
Construction 130 2.72 1.40 6.23 <0.001
Manufacturing 190 2.25 1.28
Transportation 79 2.00 1.29
Accommodation 125 2.50 1.27
Total 524 2.39 1.33
* Scale: 1 = no influence, 5 = great influence
© 2006 Portland State University
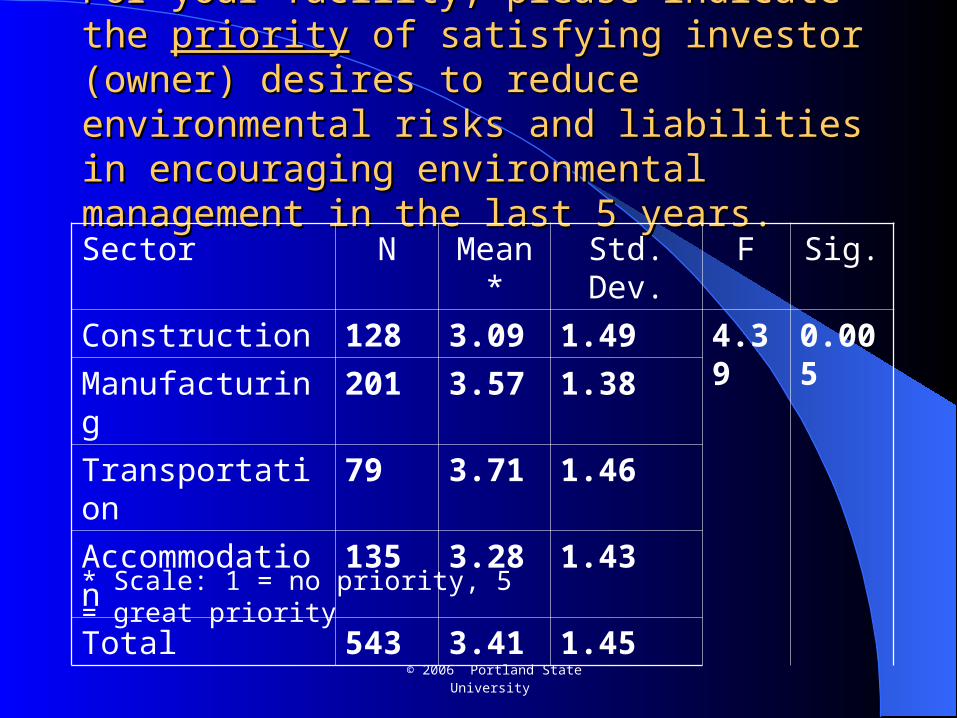
For your facility, please indicate the For your facility, please indicate the prioritypriority of of satisfying investor (owner) desires to reduce satisfying investor (owner) desires to reduce environmental risks and liabilities in encouraging environmental risks and liabilities in encouraging environmental management in the last 5 years.environmental management in the last 5 years.
Sector N Mean* Std. Dev. F Sig.
Construction 128 3.09 1.49 4.39 0.005
Manufacturing 201 3.57 1.38
Transportation 79 3.71 1.46
Accommodation 135 3.28 1.43
Total 543 3.41 1.45
* Scale: 1 = no priority, 5 = great priority

© 2006 Portland State University
4. Improved stakeholder risk 4. Improved stakeholder risk managementmanagement
Financial, e.g., lending institutionsStakeholders, e.g., labor, local groups,
NGOs interested in siting and operations.Legislative, e.g., maintaining ‘maximum
social license’ to operate.Some evidence that firms are responsive to
community stakeholder pressures.
© 2006 Portland State University
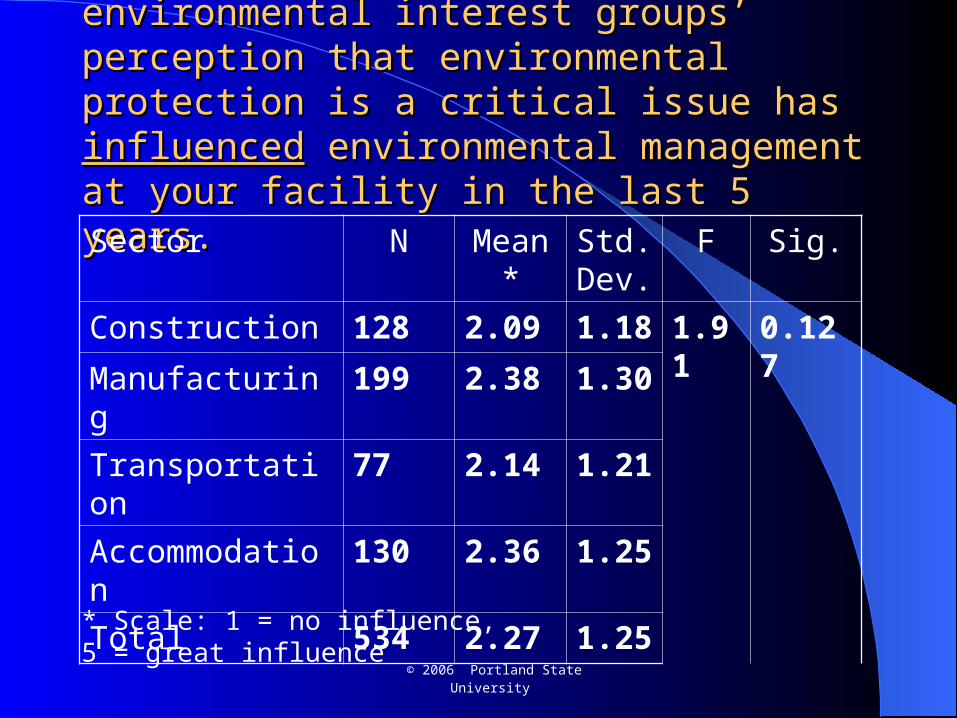
Please indicate the extent that environmental interest Please indicate the extent that environmental interest groups’ perception that environmental protection is a groups’ perception that environmental protection is a critical issue has critical issue has influencedinfluenced environmental environmental management at your facility in the last 5 years.management at your facility in the last 5 years.
Sector N Mean* Std. Dev.
F Sig.
Construction 128 2.09 1.18 1.91 0.127
Manufacturing 199 2.38 1.30
Transportation 77 2.14 1.21
Accommodation 130 2.36 1.25
Total 534 2.27 1.25
* Scale: 1 = no influence, 5 = great influence
© 2006 Portland State University
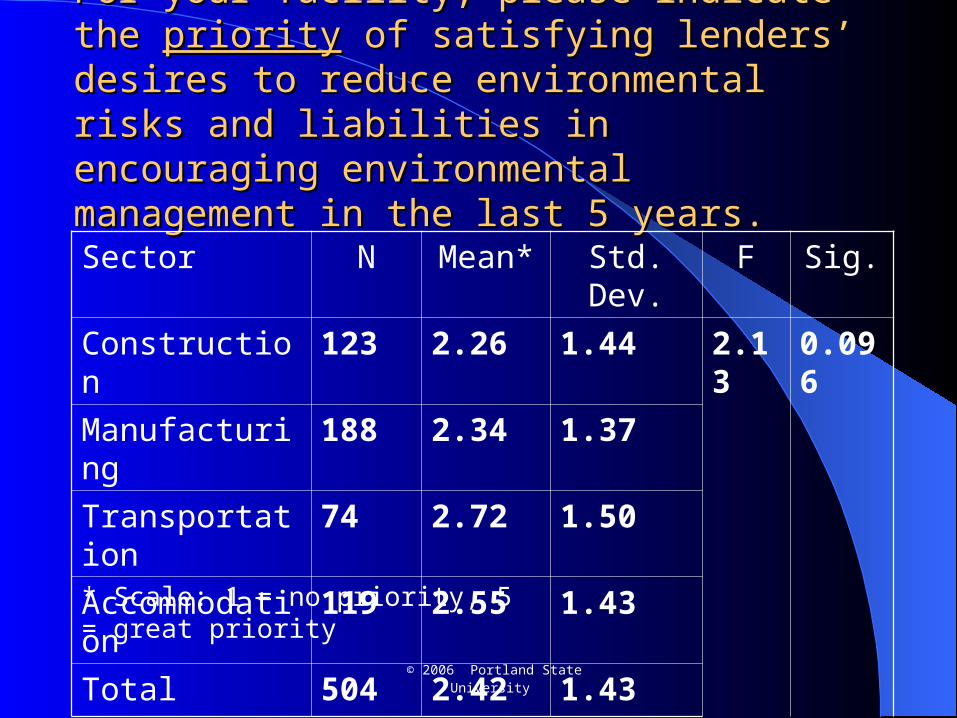
For your facility, please indicate the For your facility, please indicate the prioritypriority of of satisfying lenders’ desires to reduce environmental satisfying lenders’ desires to reduce environmental risks and liabilities in encouraging environmental risks and liabilities in encouraging environmental management in the last 5 years.management in the last 5 years.
Sector N Mean* Std. Dev. F Sig.
Construction 123 2.26 1.44 2.13 0.096
Manufacturing 188 2.34 1.37
Transportation 74 2.72 1.50
Accommodation 119 2.55 1.43
Total 504 2.42 1.43
* Scale: 1 = no priority, 5 = great priority

© 2006 Portland State University
5. Respond to technical or 5. Respond to technical or financial assistancefinancial assistance
Public agencies and private organizations offer funds, training, information, etc.
Examples: EPA Performance Track, Oregon Dept. of Energy, Zero Waste Alliance
Could become a dominant approach for nonpoint pollution problems because of the difficulty of monitoring sources.
Evidence shows significant effects for agriculture if targeted appropriately.

© 2006 Portland State University
6. Manage competitors6. Manage competitors‘First-mover’ firms gain a competitive
advantage when public environmental standards rise.– Dupont gained advantage in phasing out CFC’s
and offering new substitute. Innovative companies redefine markets in
ways that disadvantage competitors– Xerox’s toner cartridge takeback program.
Little formal analysis
© 2006 Portland State University
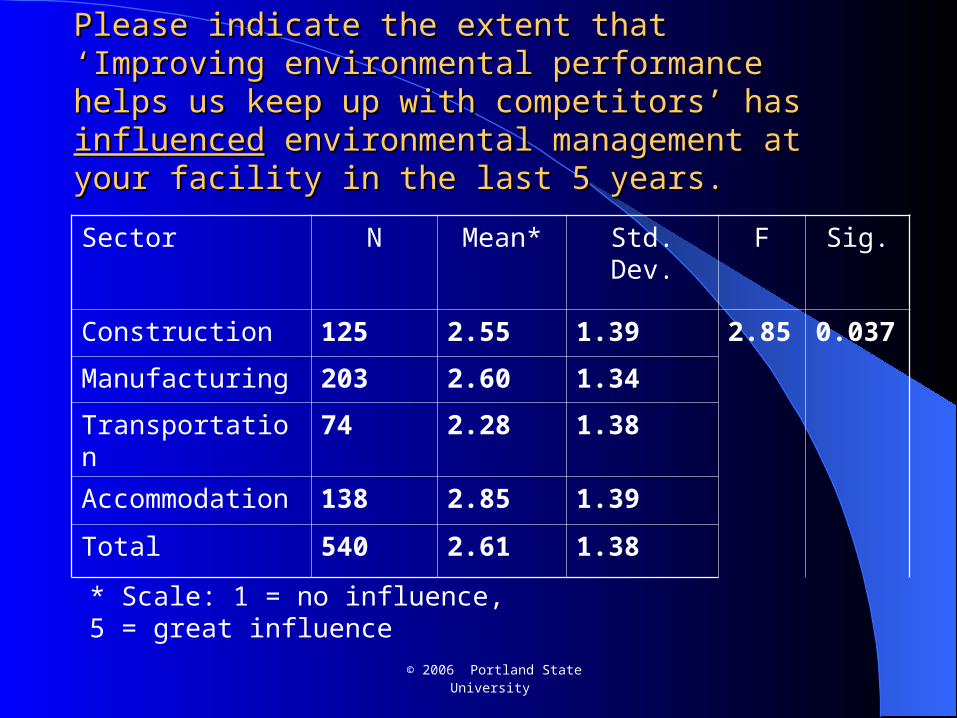
Please indicate the extent that ‘Improving environmental Please indicate the extent that ‘Improving environmental performance helps us keep up with competitors’ has performance helps us keep up with competitors’ has influencedinfluenced environmental management at your facility in the environmental management at your facility in the last 5 years. last 5 years.
Sector N Mean* Std. Dev. F Sig.
Construction 125 2.55 1.39 2.85 0.037
Manufacturing 203 2.60 1.34
Transportation 74 2.28 1.38
Accommodation 138 2.85 1.39
Total 540 2.61 1.38
* Scale: 1 = no influence, 5 = great influence
© 2006 Portland State University
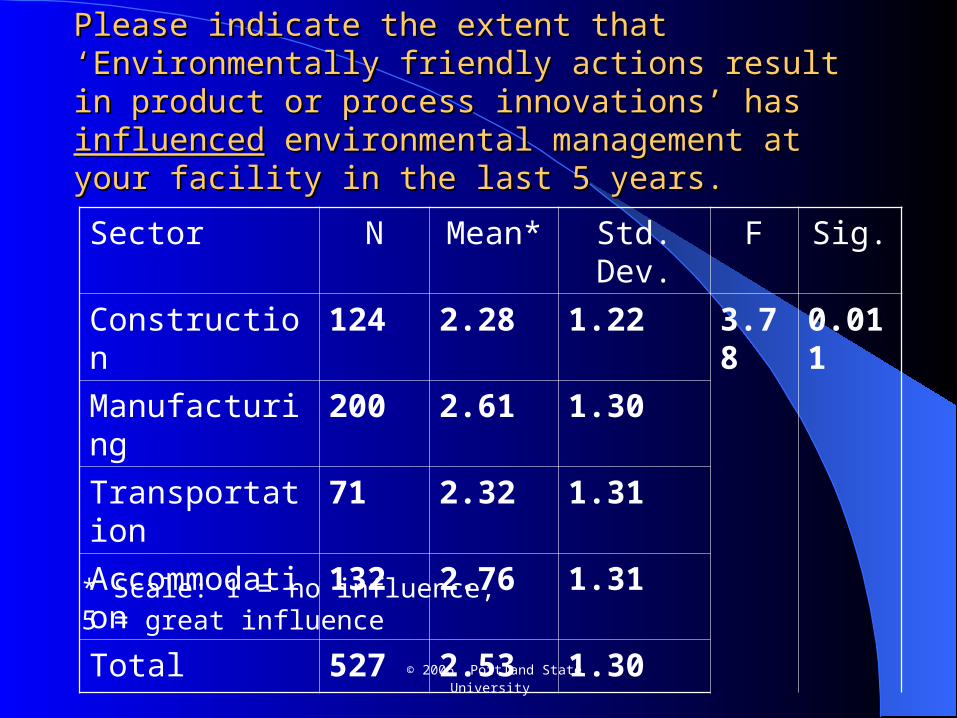
Please indicate the extent that ‘Environmentally friendly Please indicate the extent that ‘Environmentally friendly actions result in product or process innovations’ has actions result in product or process innovations’ has influencedinfluenced environmental management at your facility in the environmental management at your facility in the last 5 years. last 5 years.
Sector N Mean* Std. Dev. F Sig.
Construction 124 2.28 1.22 3.78 0.011
Manufacturing 200 2.61 1.30
Transportation 71 2.32 1.31
Accommodation 132 2.76 1.31
Total 527 2.53 1.30
* Scale: 1 = no influence, 5 = great influence
© 2006 Portland State University
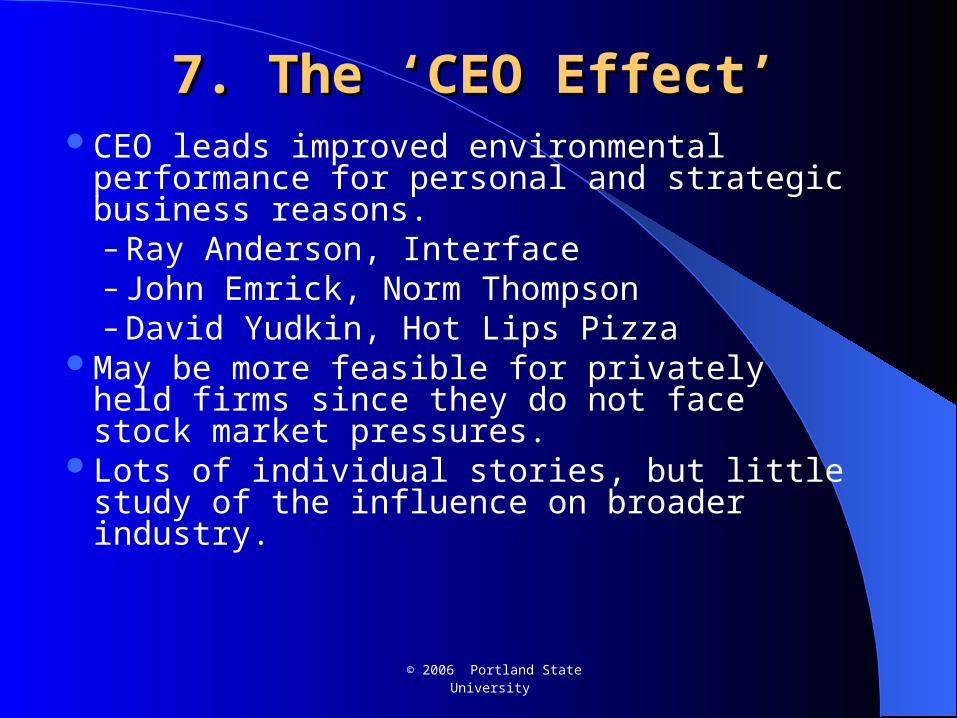
7. The ‘CEO Effect’7. The ‘CEO Effect’CEO leads improved environmental
performance for personal and strategic business reasons.– Ray Anderson, Interface– John Emrick, Norm Thompson– David Yudkin, Hot Lips Pizza
May be more feasible for privately held firms since they do not face stock market pressures.
Lots of individual stories, but little study of the influence on broader industry.
© 2006 Portland State University
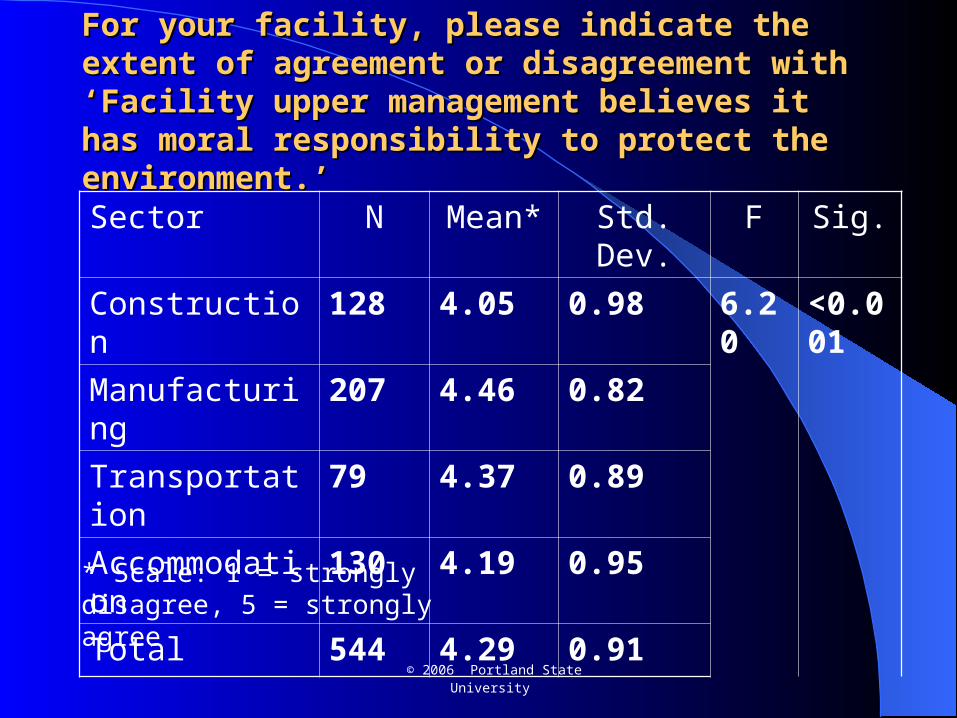
For your facility, please indicate the extent of agreement For your facility, please indicate the extent of agreement or disagreement with ‘Facility upper management or disagreement with ‘Facility upper management believes it has moral responsibility to protect the believes it has moral responsibility to protect the environment.’environment.’
Sector N Mean* Std. Dev. F Sig.
Construction 128 4.05 0.98 6.20 <0.001Manufacturing 207 4.46 0.82
Transportation 79 4.37 0.89
Accommodation 130 4.19 0.95
Total 544 4.29 0.91
* Scale: 1 = strongly disagree, 5 = strongly agree

© 2006 Portland State University
For your facility, please indicate the extent of agreement or For your facility, please indicate the extent of agreement or disagreement with ‘Facility upper management supports disagreement with ‘Facility upper management supports protecting the environment even if substantial costs are protecting the environment even if substantial costs are incurred .’incurred .’
Sector N Mean* Std. Dev. F Sig.
Construction 127 3.03 1.22 9.93 <0.001
Manufacturing 208 3.72 1.07
Transportation 75 3.45 1.11
Accommodation 130 3.34 1.17
Total 540 3.43 1.16
* Scale: 1 = strongly disagree, 5 = strongly agree
© 2006 Portland State University
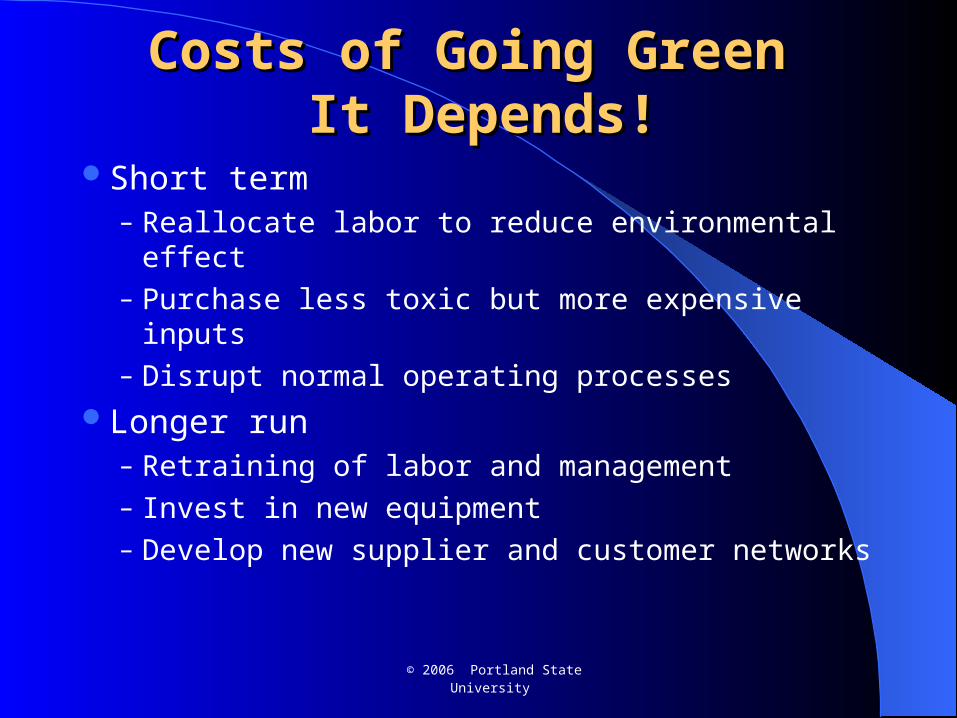
Costs of Going Green Costs of Going Green It Depends!It Depends!
Short term– Reallocate labor to reduce environmental effect– Purchase less toxic but more expensive inputs– Disrupt normal operating processes
Longer run– Retraining of labor and management– Invest in new equipment– Develop new supplier and customer networks
© 2006 Portland State University
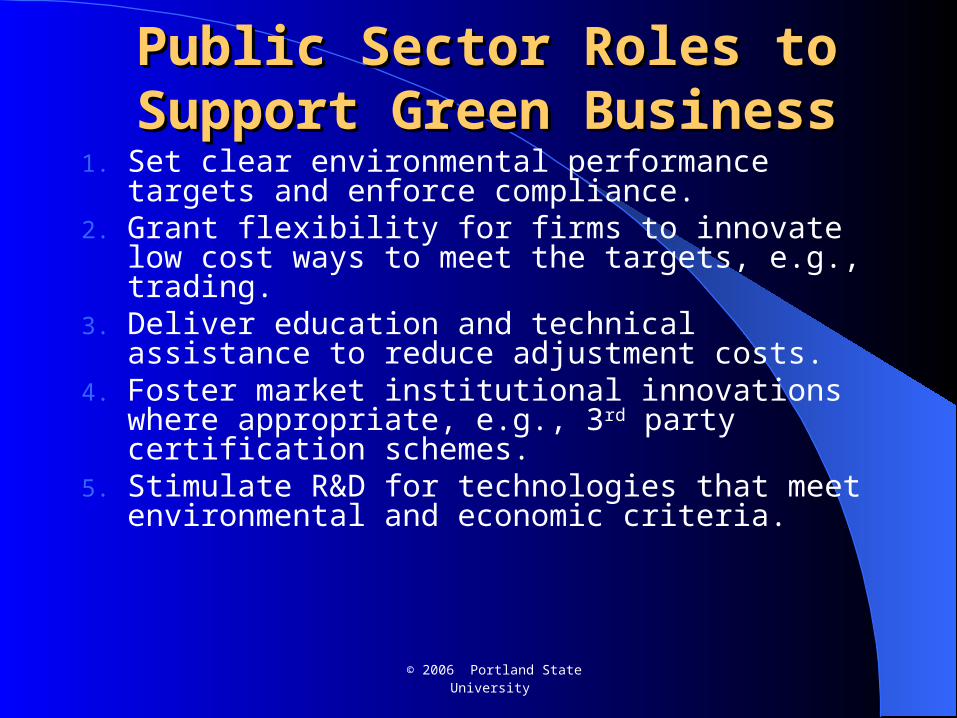
Public Sector Roles to Support Public Sector Roles to Support Green BusinessGreen Business
1. Set clear environmental performance targets and enforce compliance.
2. Grant flexibility for firms to innovate low cost ways to meet the targets, e.g., trading.
3. Deliver education and technical assistance to reduce adjustment costs.
4. Foster market institutional innovations where appropriate, e.g., 3rd party certification schemes.
5. Stimulate R&D for technologies that meet environmental and economic criteria.
© 2006 Portland State University
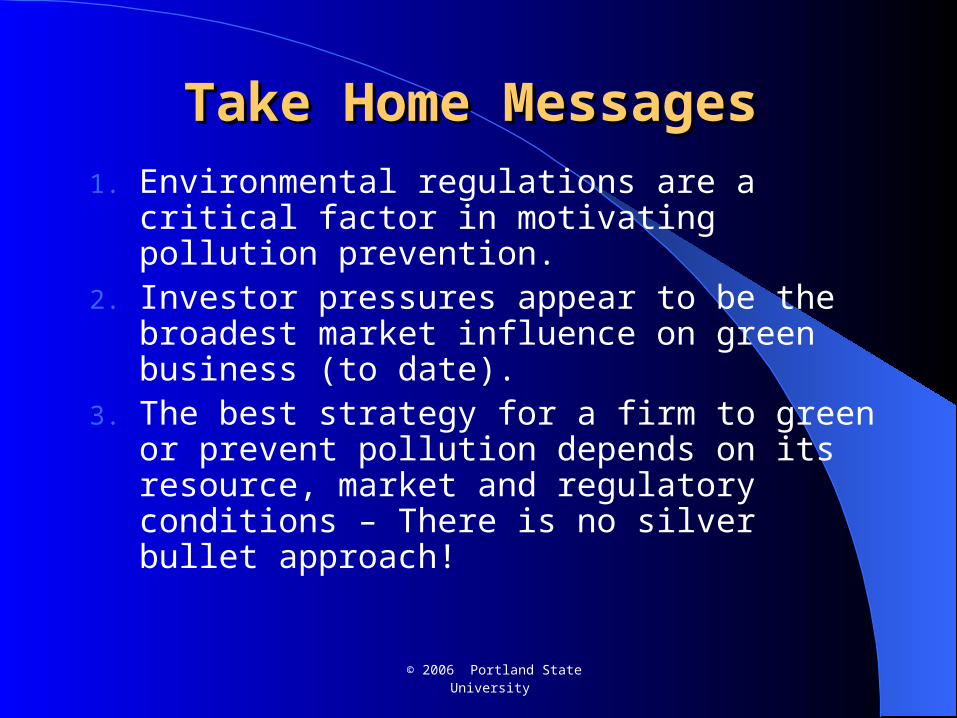
Take Home MessagesTake Home Messages
1. Environmental regulations are a critical factor in motivating pollution prevention.
2. Investor pressures appear to be the broadest market influence on green business (to date).
3. The best strategy for a firm to green or prevent pollution depends on its resource, market and regulatory conditions – There is no silver bullet approach!

© 2006 Portland State University
© 2006 Portland State University
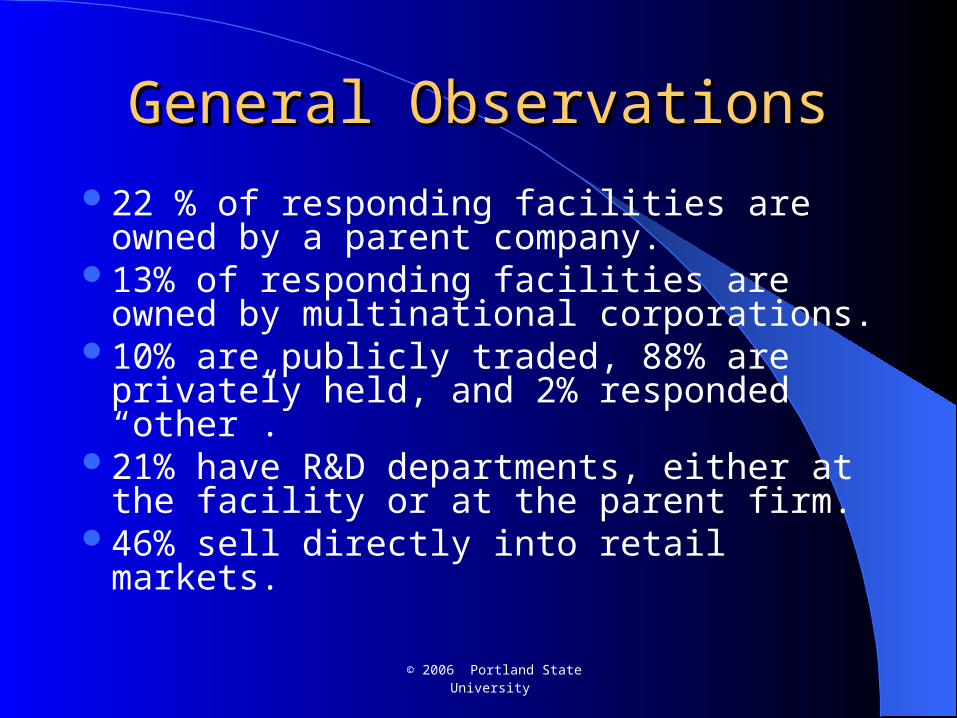
General ObservationsGeneral Observations
22 % of responding facilities are owned by a parent company.
13% of responding facilities are owned by multinational corporations.
10% are publicly traded, 88% are privately held, and 2% responded “other”.
21% have R&D departments, either at the facility or at the parent firm.
46% sell directly into retail markets.
© 2006 Portland State University
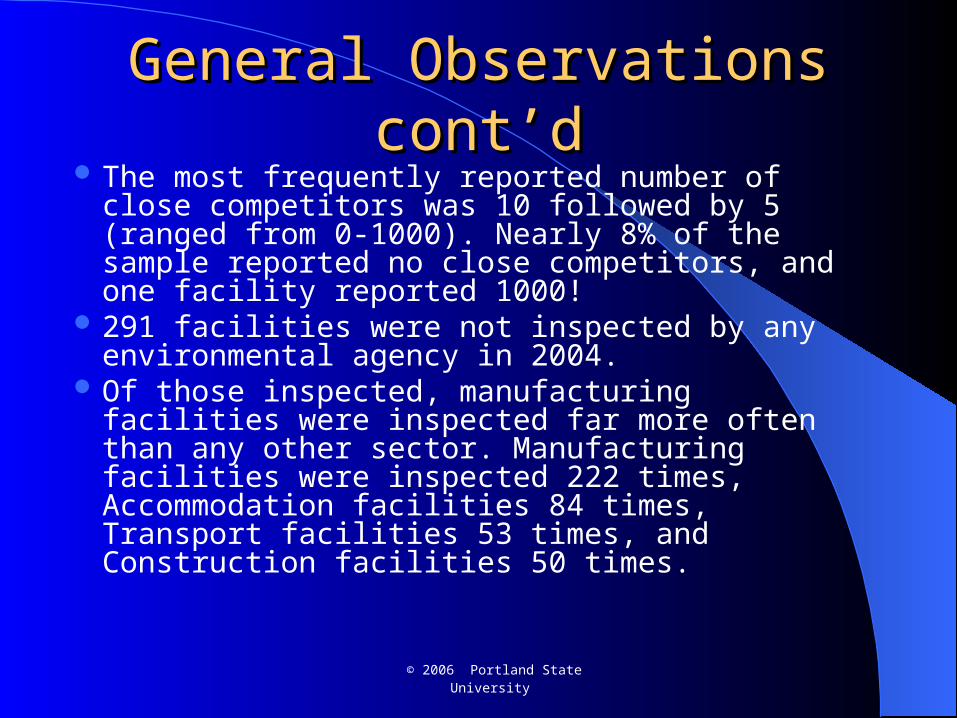
General Observations cont’dGeneral Observations cont’d The most frequently reported number of close
competitors was 10 followed by 5 (ranged from 0-1000). Nearly 8% of the sample reported no close competitors, and one facility reported 1000!
291 facilities were not inspected by any environmental agency in 2004.
Of those inspected, manufacturing facilities were inspected far more often than any other sector. Manufacturing facilities were inspected 222 times, Accommodation facilities 84 times, Transport facilities 53 times, and Construction facilities 50 times.
© 2006 Portland State University
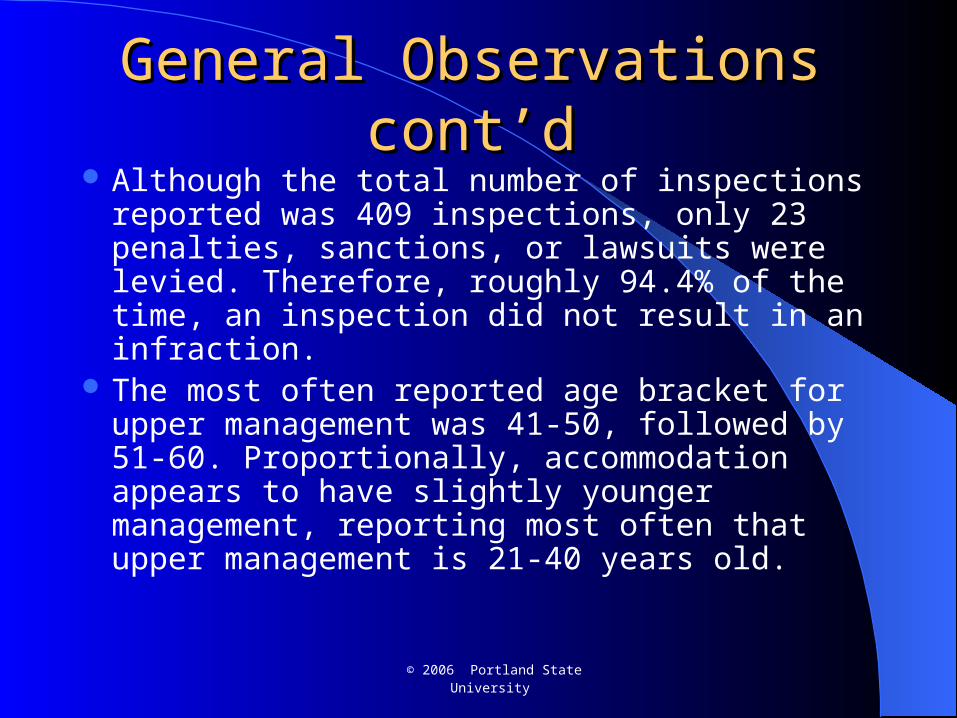
General Observations cont’dGeneral Observations cont’d Although the total number of inspections reported
was 409 inspections, only 23 penalties, sanctions, or lawsuits were levied. Therefore, roughly 94.4% of the time, an inspection did not result in an infraction.
The most often reported age bracket for upper management was 41-50, followed by 51-60. Proportionally, accommodation appears to have slightly younger management, reporting most often that upper management is 21-40 years old.


![[Ervin b. podgorsak]_compendium_to_radiation_physics](https://img.pdfslide.us/doc/110x75/55d0778ebb61eb53318b4593/ervin-b-podgorsakcompendiumtoradiationphysics.jpg)