Embed Size (px)
Citation preview
Volumetric analysis
Chemistry 321, Summer 2014
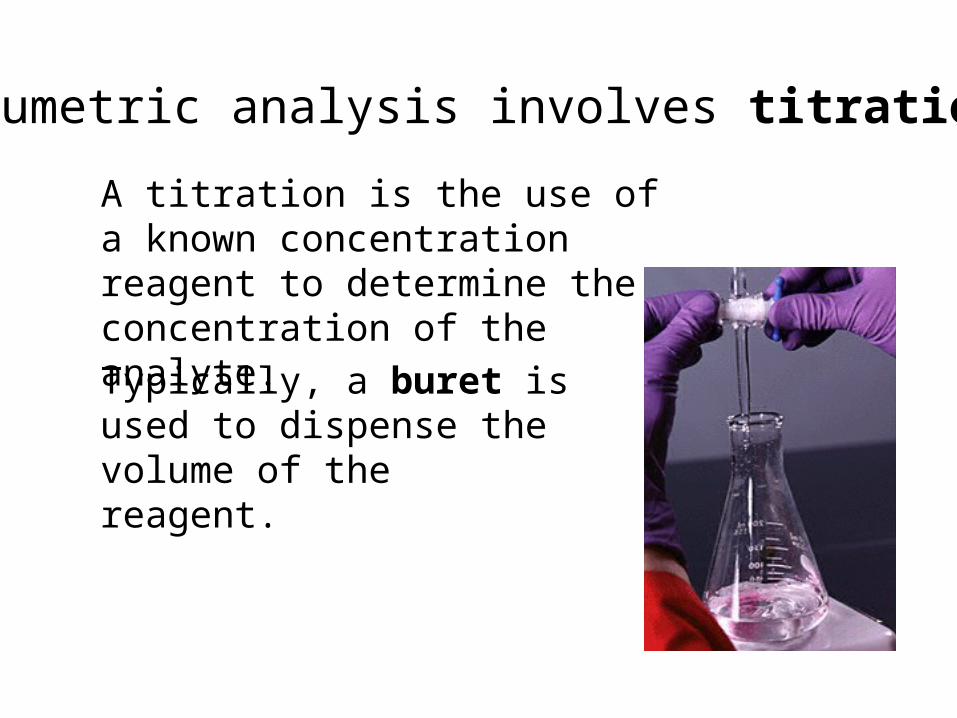
Volumetric analysis involves titrations
A titration is the use of a known concentration reagent to determine the concentration of the analyte.
Typically, a buret is used to dispense the volume of the reagent.
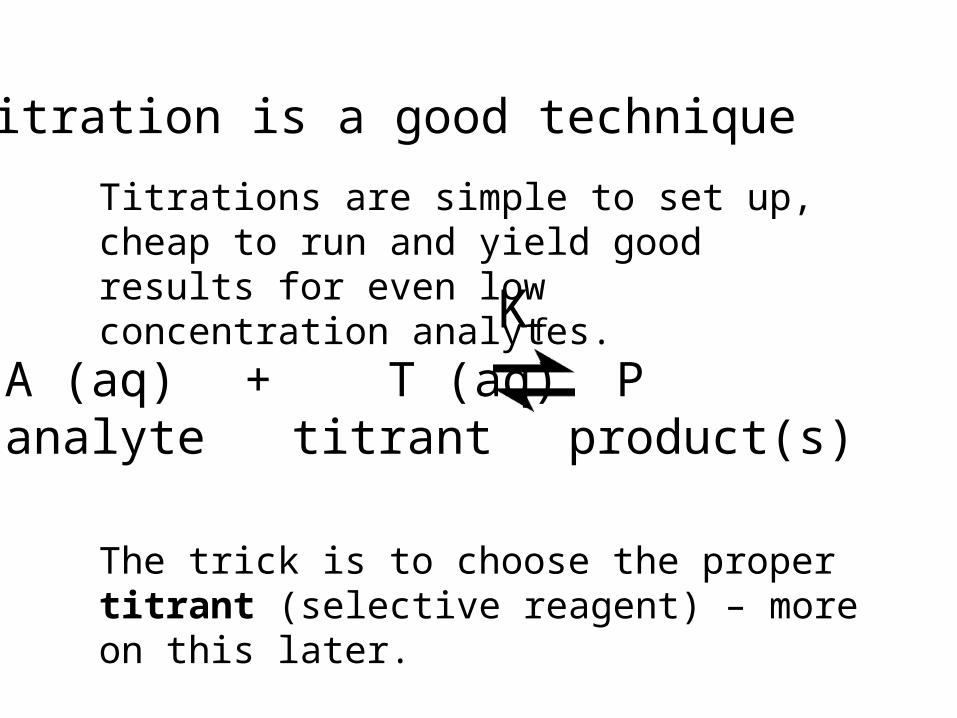
Titration is a good technique
Titrations are simple to set up, cheap to run and yield good results for even low concentration analytes.
The trick is to choose the proper titrant (selective reagent) – more on this later.
A (aq) + T (aq)analyte titrant
Pproduct(s)
Kf
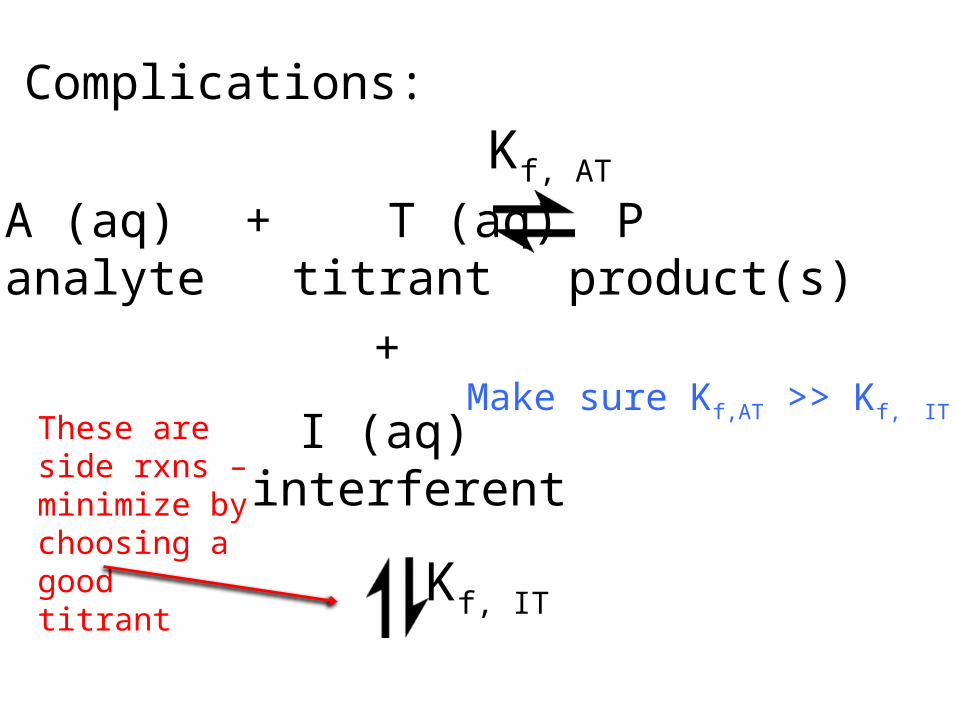
A (aq) + T (aq)analyte titrant
Pproduct(s)
Kf, AT
+
I (aq)interferent
Kf, IT
These are side rxns – minimize by choosing a good titrant
Complications:
Make sure Kf,AT >> Kf, IT

Requirements for a good titration
1. A well-defined (stoichiometry known) chemical reaction
2. A quantitative reaction – proceeds forward easily (large Kf)
3. A rapid reaction – fast kinetics so measurements can be made quickly after mixing analyte and titrant
4. Little to no side reactions – minimize interference of other reactions by choosing a selective titrant
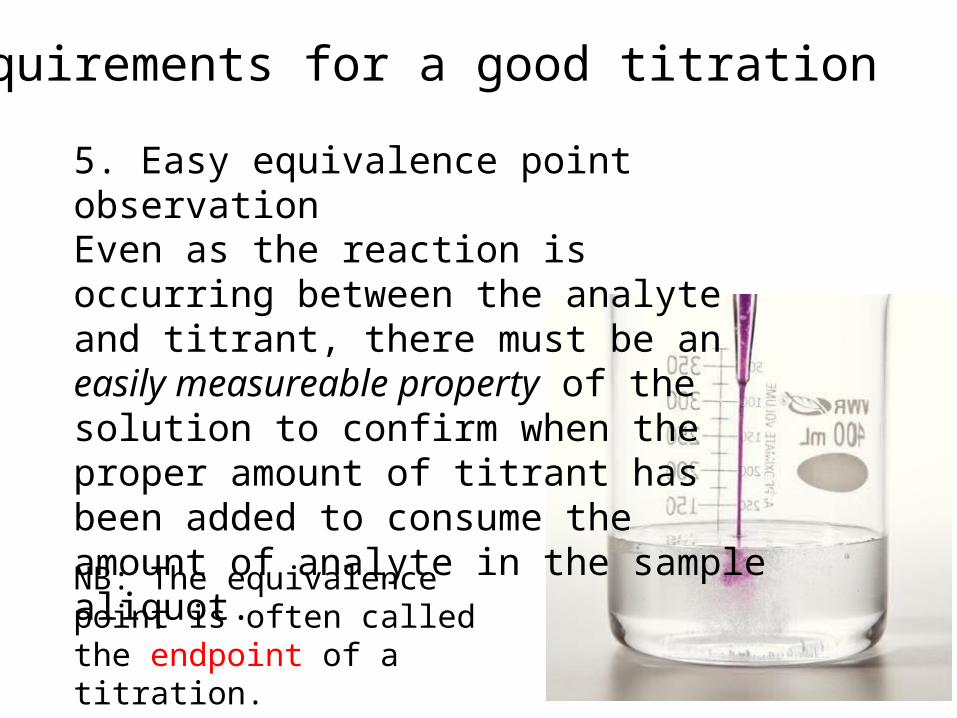
5. Easy equivalence point observation
Requirements for a good titration
Even as the reaction is occurring between the analyte and titrant, there must be an easily measureable property of the solution to confirm when the proper amount of titrant has been added to consume the amount of analyte in the sample aliquot.
NB: The equivalence point is often called the endpoint of a titration.
Quantitative titration – Equivalence
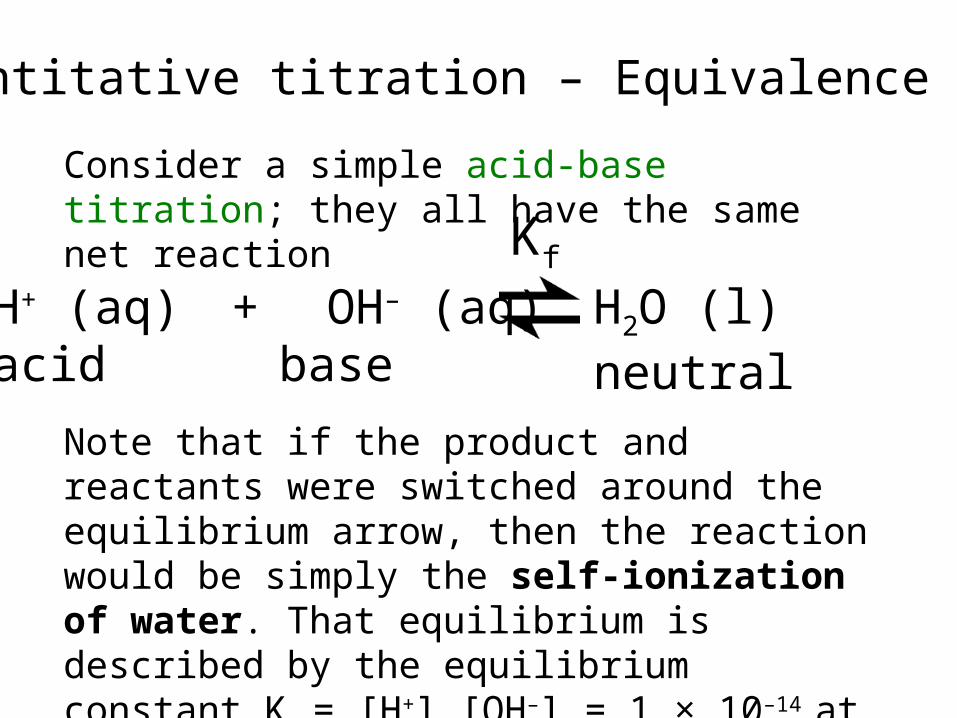
H+ (aq) + OH– (aq)acid base
H2O (l)neutral
Consider a simple acid-base titration; they all have the same net reaction
Kf
Note that if the product and reactants were switched around the equilibrium arrow, then the reaction would be simply the self-ionization of water. That equilibrium is described by the equilibrium constant Kw = [H+] [OH–] = 1 × 10–14 at 25°C
Quantitative titration – Equivalence
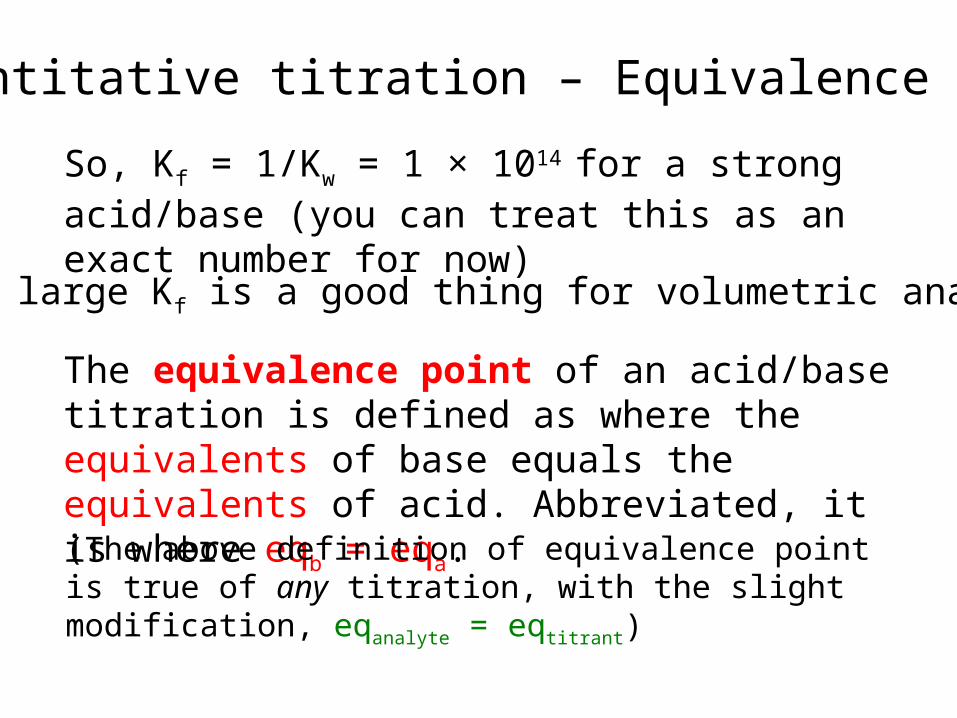
So, Kf = 1/Kw = 1 × 10¹⁴ for a strong acid/base (you can treat this as an exact number for now)
Recall, large Kf is a good thing for volumetric analysis.
The equivalence point of an acid/base titration is defined as where the equivalents of base equals the equivalents of acid. Abbreviated, it is where eqb = eqa.
(The above definition of equivalence point is true of any titration, with the slight modification, eqanalyte = eqtitrant)
So what is an “equivalent”?
An equivalent (eq) is the effective reactive quantity of a species in solution, and is calculated by multiplying the number of moles of the species by the number of reacting units per mole of the species.
More often, the normality of a solution (N), measured in eq/L (equivalents per liter), is calculated for solutions.
Calculating normalities
For 1.0 M H2SO4, assuming a base strong enough to dissociate both H+ on the acid, the number of reacting units per mole of sulfuric acid is 2 eq/mol (exact number).
The normality of that solution is:1.0 mol/L × 2 eq/mol = 2.0 eq/L
Practice problem: Barium hydroxide (Ba(OH)2) is a strong diprotic base. Calculate the normality of a 0.50 M solution of barium hydroxide.
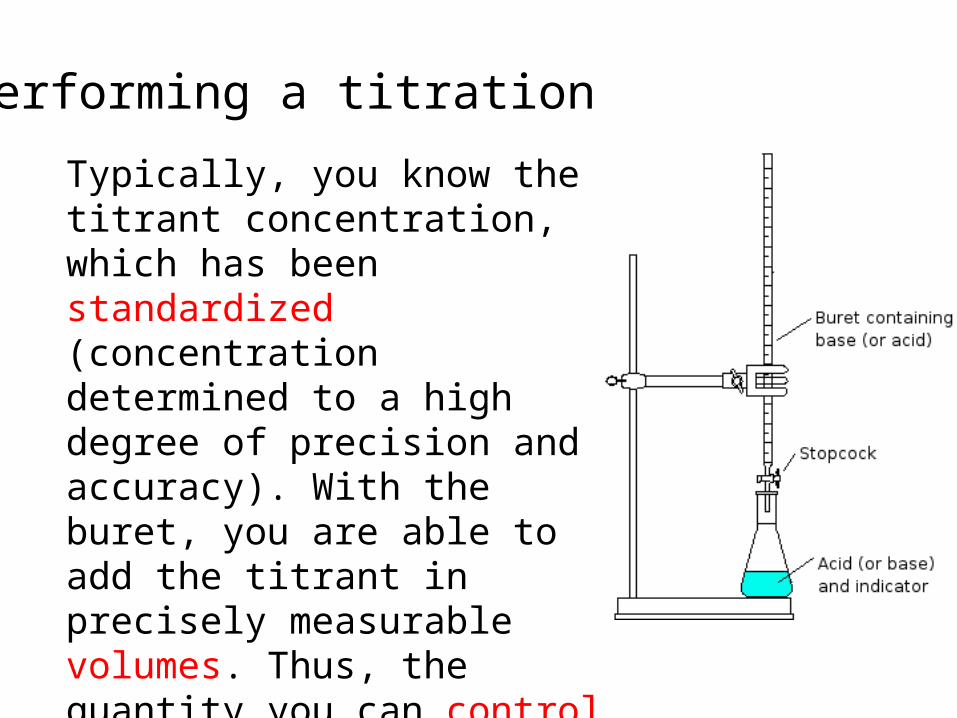
Performing a titration
Typically, you know the titrant concentration, which has been standardized (concentration determined to a high degree of precision and accuracy). With the buret, you are able to add the titrant in precisely measurable volumes. Thus, the quantity you can control throughout the experiment is the volume of titrant.
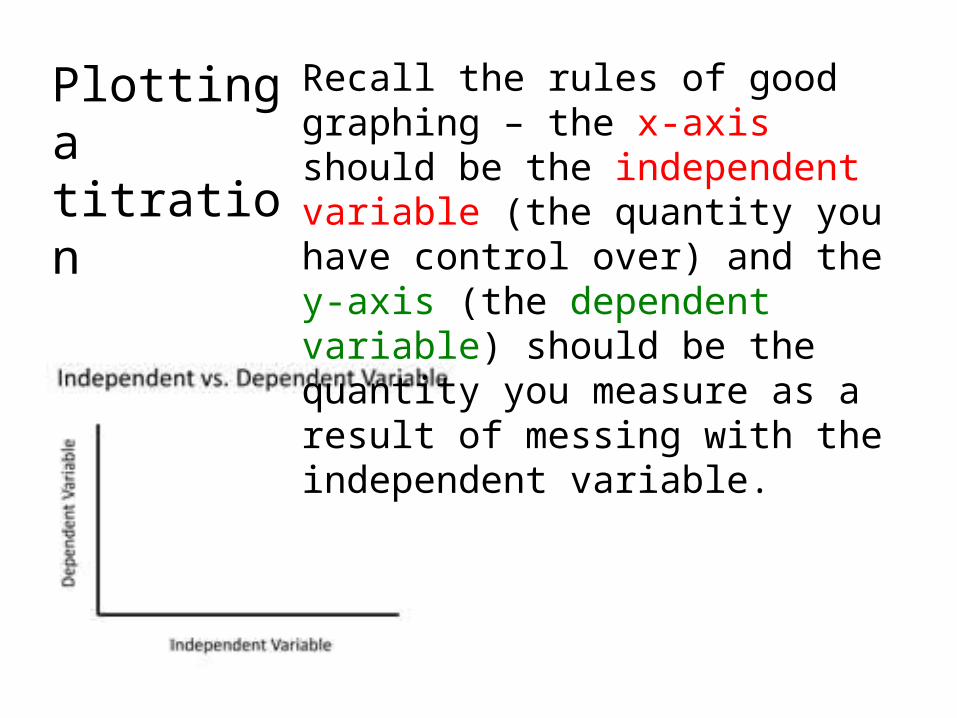
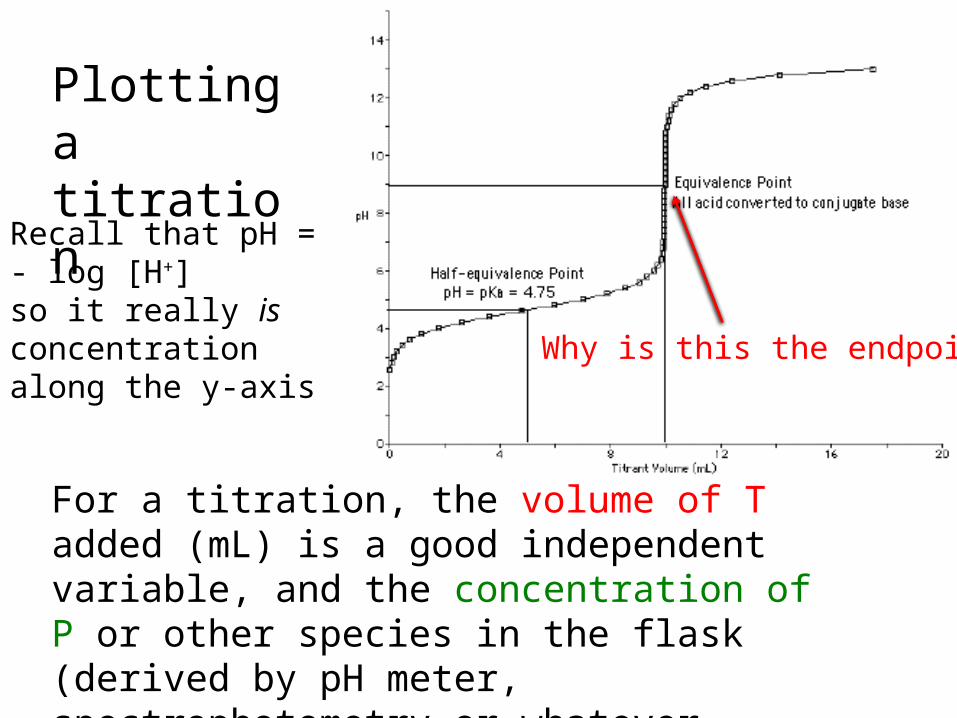
Plotting a titration
Recall the rules of good graphing – the x-axis should be the independent variable (the quantity you have control over) and the y-axis (the dependent variable) should be the quantity you measure as a result of messing with the independent variable.
Plotting a titration
For a titration, the volume of T added (mL) is a good independent variable, and the concentration of P or other species in the flask (derived by pH meter, spectrophotometry or whatever technique) is a good dependent variable.
Recall that pH = - log [H+]so it really is concentration along the y-axis Why is this the endpoint?
Finding an endpoint on the titration graphOn simple acid/base systems, the endpoint may be estimated from the inflection point of the graph, but this may prove to be inexact. In fact, in multiple pKa systems, this may prove to be impossible.
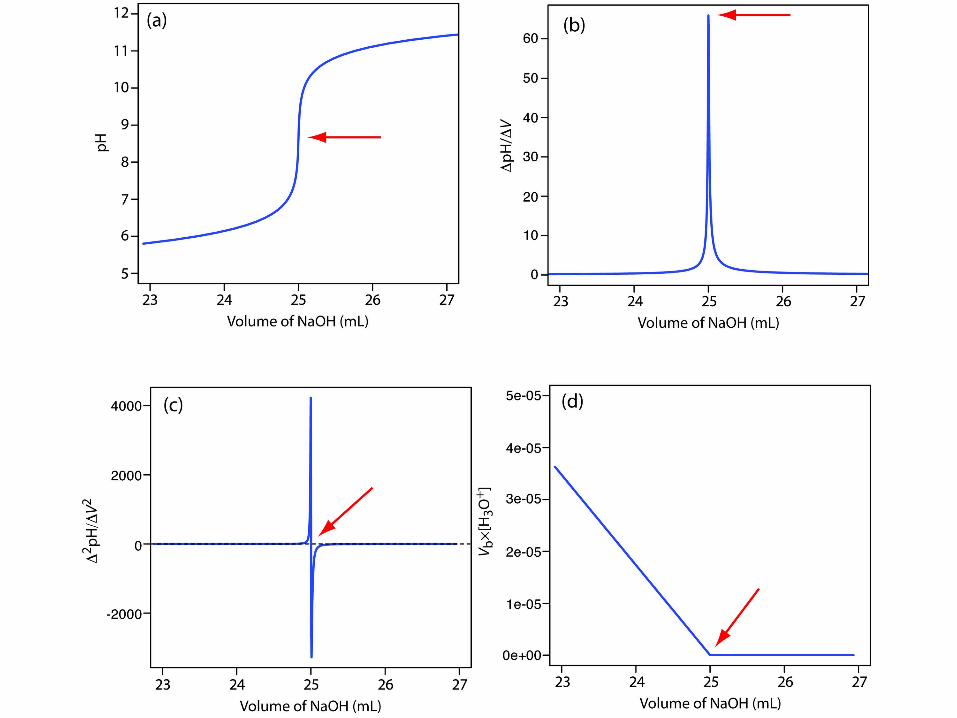
On the next page is a set of graphs; the upper left is the standard titration graph of a weak acid with a strong base. The upper right graph shows the first derivative of the first graph (note the y-axis units are now ΔpH/ΔV). The lower left graph shows the second derivative of the first graph (Δ2pH/ΔV2).
The inflection point of the titration graph will be the maximum on the first derivative graph, and a zero of the second derivative graph.
You have received an e-mail with Excel spreadsheets to help calculate these derivatives, and plot them.
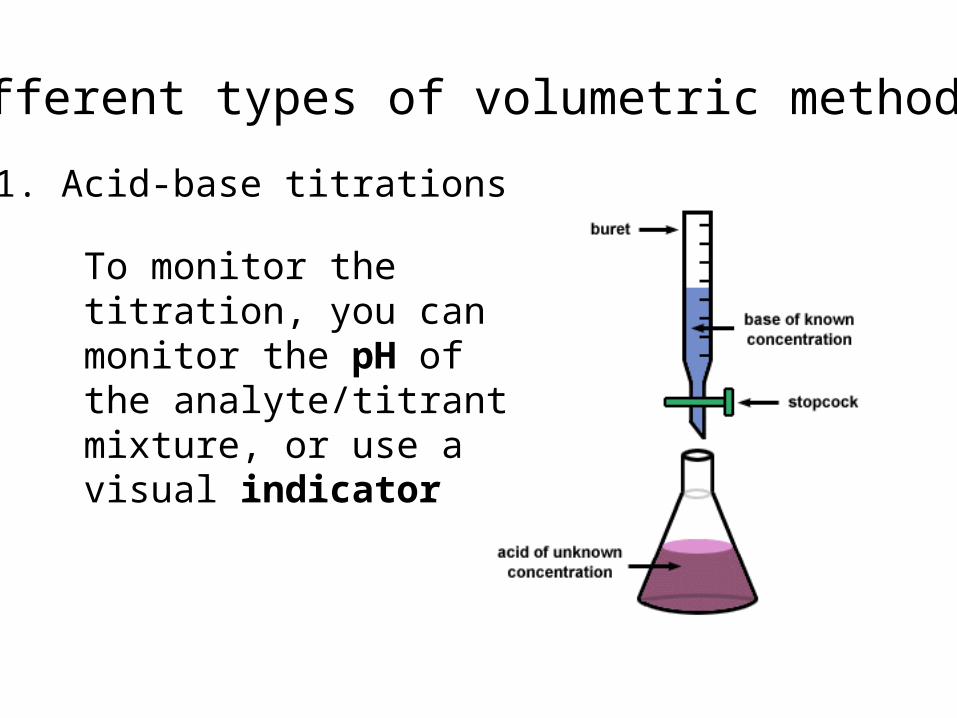
Different types of volumetric methods
1. Acid-base titrations
To monitor the titration, you can monitor the pH of the analyte/titrant mixture, or use a visual indicator
Different types of volumetric methods
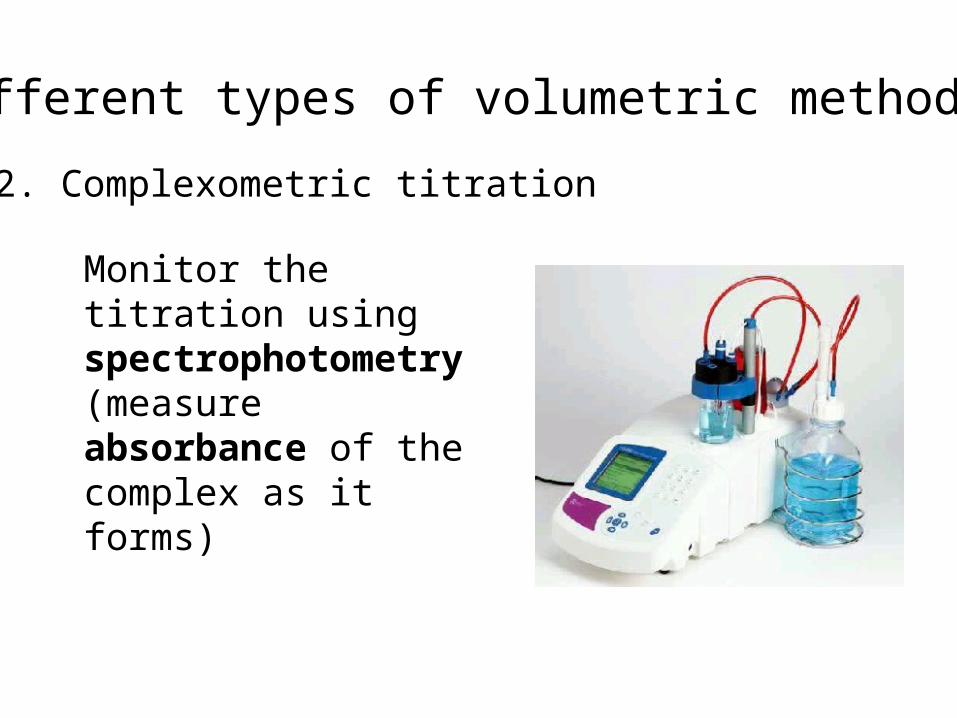
2. Complexometric titration
Monitor the titration using spectrophotometry (measure absorbance of the complex as it forms)
Different types of volumetric methods
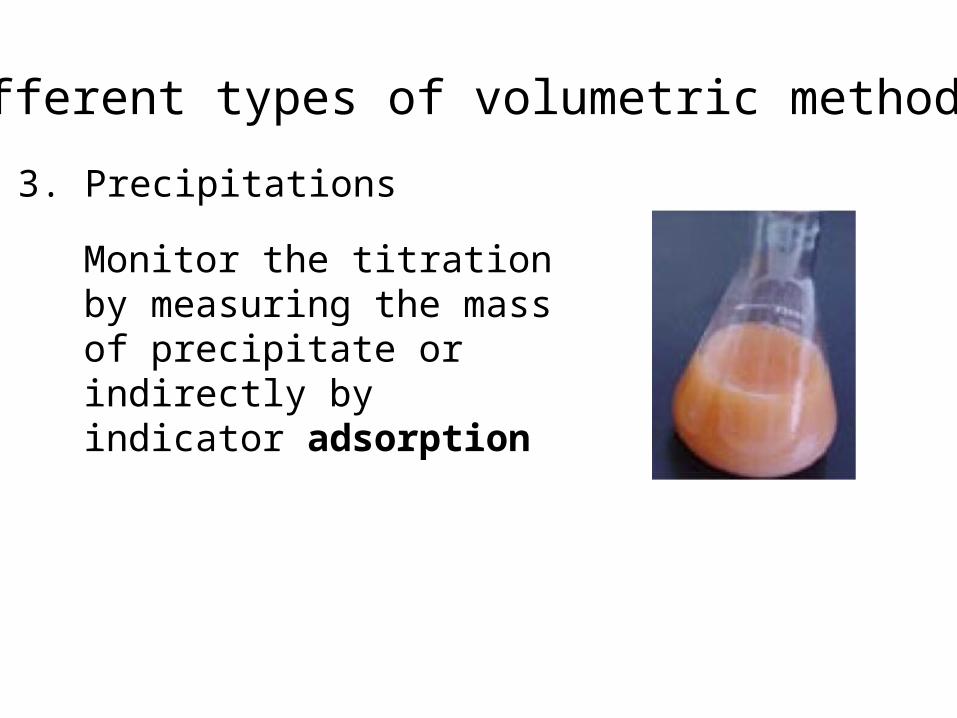
3. Precipitations
Monitor the titration by measuring the mass of precipitate or indirectly by indicator adsorption
Different types of volumetric methods
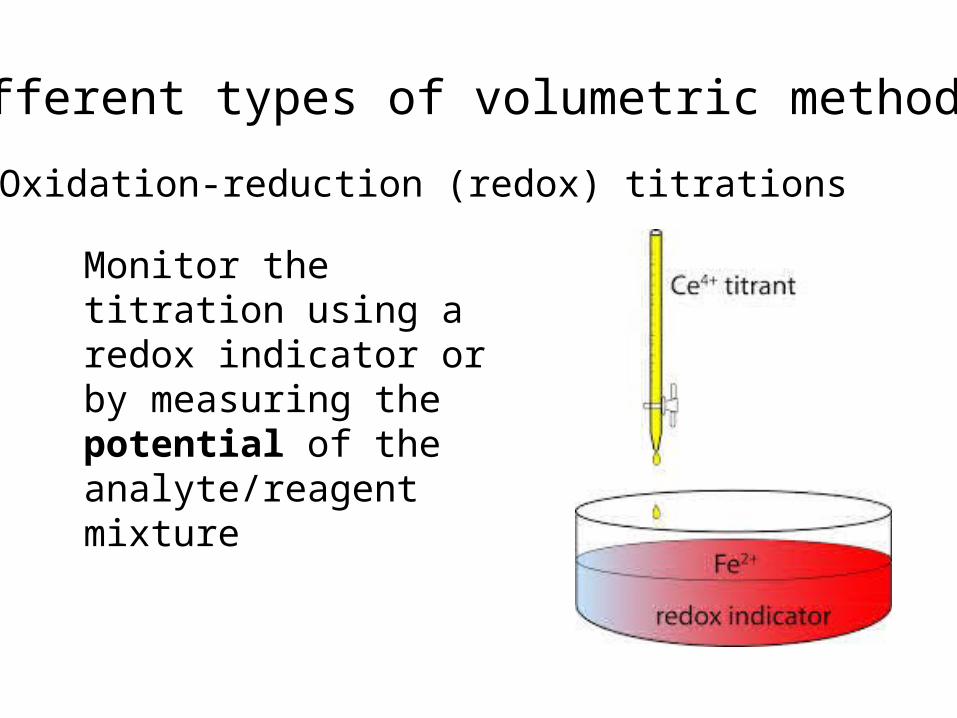
4. Oxidation-reduction (redox) titrations
Monitor the titration using a redox indicator or by measuring the potential of the analyte/reagent mixture
Challenge problem
A titration has the following general reaction:
Analyte + Titrant Product or A + T P
Imagine you have a sensor that is monitoring the progress of a titration, providing a signal that relates to the chemical reactions occurring in the titration flask. Additionally, the sensor responds to (i.e., is sensitive to) the concentration of analyte (A) and titrant (T) with signal that is linear with the concentration of each but does not provide any signal for the product (P).
Challenge problem (cont’d)
Sketch a plot of the titration data one would obtain (in general terms), with the sensor signal as a function of titrant volume (neglecting the effect of dilution).
Clearly label both axes.
Clearly label the equivalence point.
Assume that the reaction equilibrium constant (Kf) is large (e.g., ≥ 106)


![AGC Book 20% CyanBasics of Titration · 2020-02-24 · Non-aqueous acid/base titrations: ... titration curves obtained from acid/ base titrations. E [pH or mV] V [mL] E [mV] V [mL]](https://img.pdfslide.us/doc/110x75/5f501a6dd95989003f6ec9e5/agc-book-20-cyanbasics-of-titration-2020-02-24-non-aqueous-acidbase-titrations.jpg)