Embed Size (px)
Citation preview
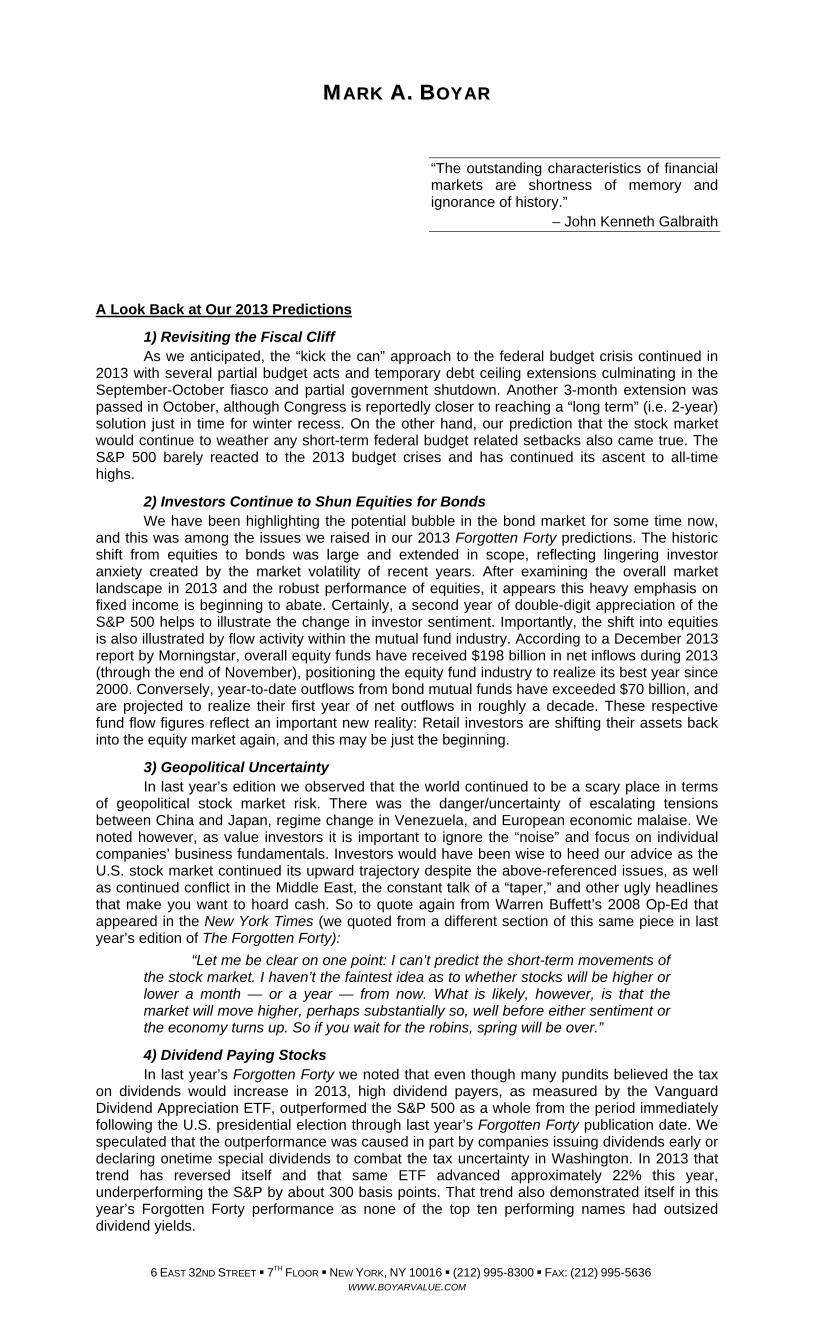
ASSET ANALYSIS FOCUS FORGOTTEN FORTY FACT SHEETS
Volume XXXIX, Issue XI & XII – Winter 2013
TABLE OF CONTENTS
Letter to Subscribers ........................................................................................ pp. i - vii
Company Symbol Price Page AMC Networks Inc. AMCX $ 65.04 1 Bank of America Corporation BAC $ 15.25 2 The Bank of New York Mellon Corporation BK $ 32.84 3 Bed Bath & Beyond Inc. BBBY $ 76.52 4 Callaway Golf Company ELY $ 7.50 5 Carnival Corporation CCL $ 35.34 6 The Charles Schwab Corporation SCHW $ 24.80 7 Coach, Inc. COH $ 55.52 8 Comcast Corporation CMCSK $ 47.22 9 Constellation Brands, Inc. STZ $ 70.09 10 Crocs, Inc. CROX $ 12.71 11 Devon Energy Corporation DVN $ 59.42 12 DIRECTV DTV $ 67.02 13 Discover Financial Services DFS $ 52.59 14 Hanesbrands Inc. HBI $ 67.20 15 International Speedway Corporation ISCA $ 33.16 16 JPMorgan Chase & Co. JPM $ 56.31 17 Kohl's Corporation KSS $ 54.97 18 Laboratory Corporation Of America Holdings LH $ 87.75 19 Legg Mason, Inc. LM $ 40.63 20 Liberty Interactive Corporation LINTA $ 27.30 21 Liberty Media Corporation LMCA $ 147.43 22 Live Nation Entertainment, Inc. LYV $ 18.51 23 The Madison Square Garden Company MSG $ 54.30 24 Microsoft Corporation MSFT $ 37.22 25 Molson Coors Brewing Company TAP $ 53.42 26 Regal Entertainment Group RGC $ 19.40 27 The Scotts Miracle-Gro Company SMG $ 59.89 28 SLM Corporation SLM $ 25.58 29 Staples, Inc. SPLS $ 15.51 30 Starz STRZA $ 27.71 31 Time Warner Inc. TWX $ 65.82 32 The Travelers Companies, Inc. TRV $ 86.63 33 Vivendi S.A. VIV.PA € 17.92 34 Vulcan Materials Company VMC $ 54.41 35 W.R. Berkley Corporation WRB $ 42.44 36 Weight Watchers International, Inc. WTW $ 31.42 37 The Wendy’s Company WEN $ 8.20 38 The Western Union Company WU $ 16.64 39 Whistler Blackcomb Holdings Inc. WB.TO $ 16.12 40
Appendix – Share Ownership A-1
Published by: BOYAR'S INTRINSIC VALUE RESEARCH LLC
6 East 32 Street • 7th Floor • New York, NY • 10016 • Tel: 212-995-8300 • Fax: 212-995-5636
www.BoyarValueGroup.com Asset Analysis Focus is not an investment advisory bulletin, recommending the purchase or sale of any security. Rather it should be used as a guide in aiding the investment community to better understand the intrinsic worth of a corporation. The service is not intended to replace fundamental research, but should be used in conjunction with it. Additional information is available on request. The statistical and other information contained in this document has been obtained from official reports, current manuals and other sources which we believe reliable. While we cannot guarantee its entire accuracy or completeness, we believe it may be accepted as substantially correct. Boyar's Intrinsic Value Research LLC its officers, directors and employees may at times have a position in any security mentioned herein.
Boyar's Intrinsic Value Research LLC Copyright 2013.
MMAARRKK AA.. BBOOYYAARR
6 EAST 32ND STREET 7TH FLOOR NEW YORK, NY 10016 (212) 995-8300 FAX: (212) 995-5636
WWW.BOYARVALUE.COM
“The outstanding characteristics of financial markets are shortness of memory and ignorance of history.”
– John Kenneth Galbraith
A Look Back at Our 2013 Predictions
1) Revisiting the Fiscal Cliff As we anticipated, the “kick the can” approach to the federal budget crisis continued in
2013 with several partial budget acts and temporary debt ceiling extensions culminating in the September-October fiasco and partial government shutdown. Another 3-month extension was passed in October, although Congress is reportedly closer to reaching a “long term” (i.e. 2-year) solution just in time for winter recess. On the other hand, our prediction that the stock market would continue to weather any short-term federal budget related setbacks also came true. The S&P 500 barely reacted to the 2013 budget crises and has continued its ascent to all-time highs.
2) Investors Continue to Shun Equities for Bonds We have been highlighting the potential bubble in the bond market for some time now,
and this was among the issues we raised in our 2013 Forgotten Forty predictions. The historic shift from equities to bonds was large and extended in scope, reflecting lingering investor anxiety created by the market volatility of recent years. After examining the overall market landscape in 2013 and the robust performance of equities, it appears this heavy emphasis on fixed income is beginning to abate. Certainly, a second year of double-digit appreciation of the S&P 500 helps to illustrate the change in investor sentiment. Importantly, the shift into equities is also illustrated by flow activity within the mutual fund industry. According to a December 2013 report by Morningstar, overall equity funds have received $198 billion in net inflows during 2013 (through the end of November), positioning the equity fund industry to realize its best year since 2000. Conversely, year-to-date outflows from bond mutual funds have exceeded $70 billion, and are projected to realize their first year of net outflows in roughly a decade. These respective fund flow figures reflect an important new reality: Retail investors are shifting their assets back into the equity market again, and this may be just the beginning.
3) Geopolitical Uncertainty In last year’s edition we observed that the world continued to be a scary place in terms
of geopolitical stock market risk. There was the danger/uncertainty of escalating tensions between China and Japan, regime change in Venezuela, and European economic malaise. We noted however, as value investors it is important to ignore the “noise” and focus on individual companies’ business fundamentals. Investors would have been wise to heed our advice as the U.S. stock market continued its upward trajectory despite the above-referenced issues, as well as continued conflict in the Middle East, the constant talk of a “taper,” and other ugly headlines that make you want to hoard cash. So to quote again from Warren Buffett’s 2008 Op-Ed that appeared in the New York Times (we quoted from a different section of this same piece in last year’s edition of The Forgotten Forty):
“Let me be clear on one point: I can’t predict the short-term movements of the stock market. I haven’t the faintest idea as to whether stocks will be higher or lower a month — or a year — from now. What is likely, however, is that the market will move higher, perhaps substantially so, well before either sentiment or the economy turns up. So if you wait for the robins, spring will be over.”
4) Dividend Paying Stocks In last year’s Forgotten Forty we noted that even though many pundits believed the tax
on dividends would increase in 2013, high dividend payers, as measured by the Vanguard Dividend Appreciation ETF, outperformed the S&P 500 as a whole from the period immediately following the U.S. presidential election through last year’s Forgotten Forty publication date. We speculated that the outperformance was caused in part by companies issuing dividends early or declaring onetime special dividends to combat the tax uncertainty in Washington. In 2013 that trend has reversed itself and that same ETF advanced approximately 22% this year, underperforming the S&P by about 300 basis points. That trend also demonstrated itself in this year’s Forgotten Forty performance as none of the top ten performing names had outsized dividend yields.
ii
5) First Year Market Performance of an Incumbent President As we mentioned in the last edition of the Forgotten Forty, market performance for the
first year of an incumbent president has been mixed from a historical perspective. Market movements were positive following the re-elections of Presidents Reagan, Clinton, and Bush (up 20% on average), while returns following the re-elections of Presidents Eisenhower and Nixon were decidedly weaker (average declines of approximately 15%). Clearly, many other factors can impact returns outside of presidential elections, but the past year has been a robust one within this political context. With a likely appreciation of well over 20% for the S&P 500 during 2013, the market performance during President Obama’s first year of his incumbency will rival some of his best performing peers of the past 50 years.
6) Where Have All the Housing Names Gone? In last year’s Forgotten Forty, we noted that while we still found the housing sector to be
somewhat inexpensive from a valuation perspective, we did not include any of the names featured in our 2011 Summer Issue detailing how to profit from an eventual U.S. housing recovery. We reasoned that while some of those names were still somewhat inexpensive, we saw better opportunities in names in ancillary sectors that would benefit from a U.S. housing recovery. We said companies like JPM, BAC, BRK, CVC, and CMCSA would be beneficiaries of a housing rebound and in our opinion were the more attractive way to participate in this particular trend. Clearly we were wrong. You would have been much better off investing in names we highlighted in our 2011 housing issue such as Whirlpool, or Mohawk that had more direct exposure to U.S. housing than the ancillary names we featured.
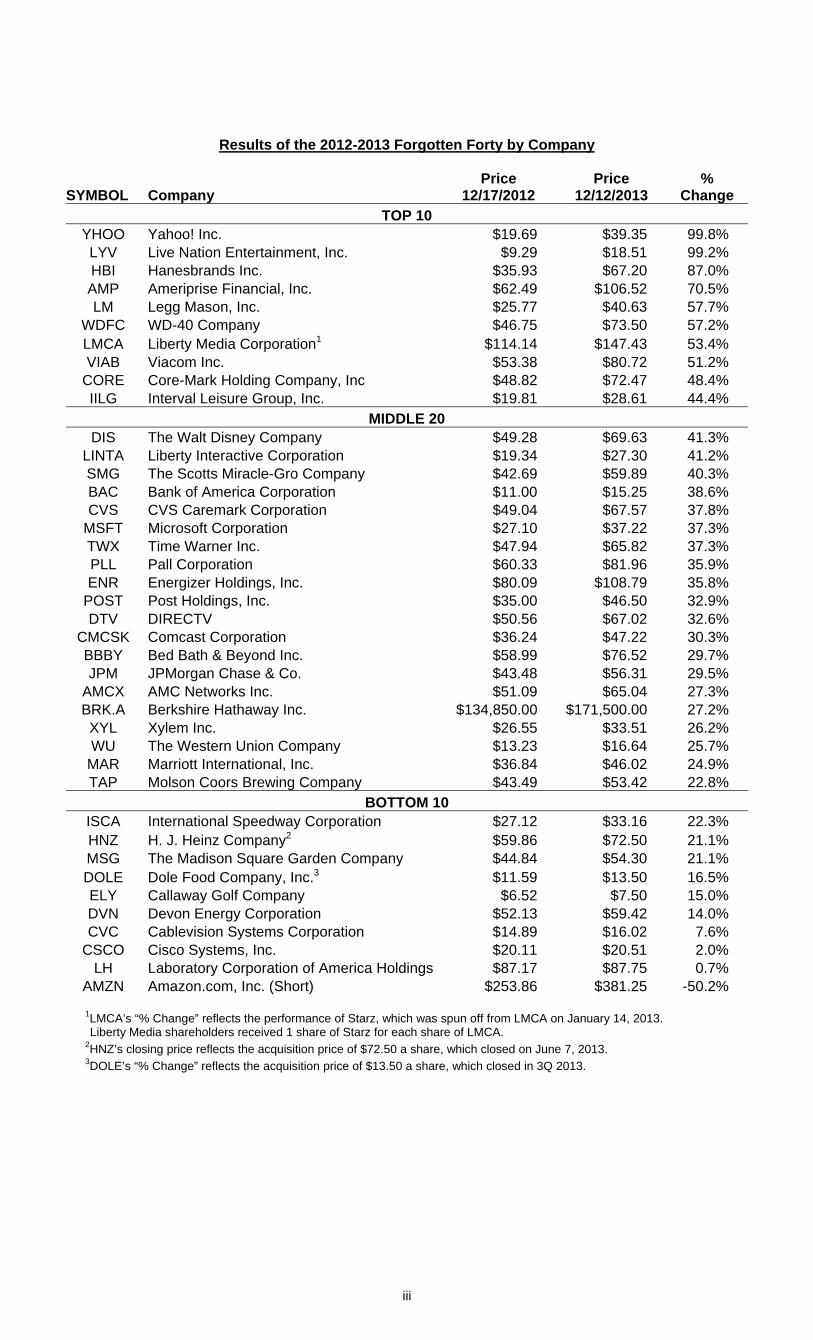
A Closer Look at the Performance of the 2013 Forgotten Forty Although not quite up to the 2012 relative performance, when the Forgotten Forty
outperformed by over 1,350 bps, the performance of the 2013 Forgotten Forty (+34.84%) was even stronger on an absolute basis and again outperformed the S&P (+24.13%) by more than 1,000 basis points. Twenty-nine of the stocks in the 2012 Forgotten Forty outperformed the S&P 500, with two stocks posting returns just shy of 100%, including Yahoo +99.8% and Live Nation +99.2%. Two of the underperforming stocks, Heinz and Dole, were acquired during the year, and their relative performances vs. the S&P 500 would be much improved if we dated to the acquisition close. Round two of our Amazon short (-50.2%; we also included the short in 2006) also shaved nearly 200 bps off the 2013 Forgotten Forty’s relative performance. Fool me once, shame on you. Fool me twice, shame on me …
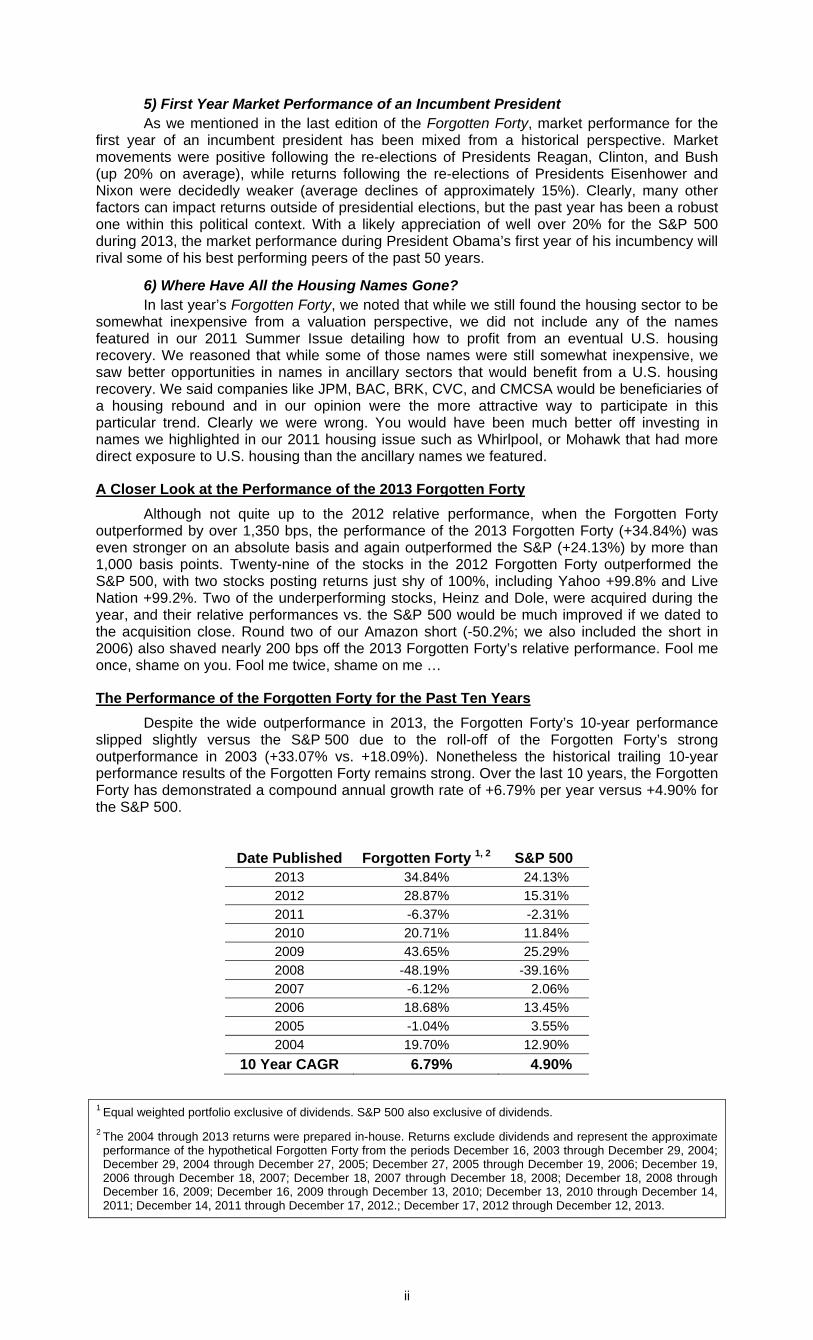
The Performance of the Forgotten Forty for the Past Ten Years Despite the wide outperformance in 2013, the Forgotten Forty’s 10-year performance
slipped slightly versus the S&P 500 due to the roll-off of the Forgotten Forty’s strong outperformance in 2003 (+33.07% vs. +18.09%). Nonetheless the historical trailing 10-year performance results of the Forgotten Forty remains strong. Over the last 10 years, the Forgotten Forty has demonstrated a compound annual growth rate of +6.79% per year versus +4.90% for the S&P 500.
Date Published Forgotten Forty 1, 2 S&P 500 2013 34.84% 24.13% 2012 28.87% 15.31% 2011 -6.37% -2.31% 2010 20.71% 11.84% 2009 43.65% 25.29% 2008 -48.19% -39.16% 2007 -6.12% 2.06% 2006 18.68% 13.45% 2005 -1.04% 3.55% 2004 19.70% 12.90%
10 Year CAGR 6.79% 4.90%
1 Equal weighted portfolio exclusive of dividends. S&P 500 also exclusive of dividends. 2 The 2004 through 2013 returns were prepared in-house. Returns exclude dividends and represent the approximate
performance of the hypothetical Forgotten Forty from the periods December 16, 2003 through December 29, 2004; December 29, 2004 through December 27, 2005; December 27, 2005 through December 19, 2006; December 19, 2006 through December 18, 2007; December 18, 2007 through December 18, 2008; December 18, 2008 through December 16, 2009; December 16, 2009 through December 13, 2010; December 13, 2010 through December 14, 2011; December 14, 2011 through December 17, 2012.; December 17, 2012 through December 12, 2013.
iii
Results of the 2012-2013 Forgotten Forty by Company
SYMBOL Company Price
12/17/2012 Price
12/12/2013 %
Change TOP 10
YHOO Yahoo! Inc. $19.69 $39.35 99.8% LYV Live Nation Entertainment, Inc. $9.29 $18.51 99.2% HBI Hanesbrands Inc. $35.93 $67.20 87.0% AMP Ameriprise Financial, Inc. $62.49 $106.52 70.5% LM Legg Mason, Inc. $25.77 $40.63 57.7%
WDFC WD-40 Company $46.75 $73.50 57.2% LMCA Liberty Media Corporation1 $114.14 $147.43 53.4% VIAB Viacom Inc. $53.38 $80.72 51.2%
CORE Core-Mark Holding Company, Inc $48.82 $72.47 48.4% IILG Interval Leisure Group, Inc. $19.81 $28.61 44.4%
MIDDLE 20 DIS The Walt Disney Company $49.28 $69.63 41.3%
LINTA Liberty Interactive Corporation $19.34 $27.30 41.2% SMG The Scotts Miracle-Gro Company $42.69 $59.89 40.3% BAC Bank of America Corporation $11.00 $15.25 38.6% CVS CVS Caremark Corporation $49.04 $67.57 37.8%
MSFT Microsoft Corporation $27.10 $37.22 37.3% TWX Time Warner Inc. $47.94 $65.82 37.3% PLL Pall Corporation $60.33 $81.96 35.9% ENR Energizer Holdings, Inc. $80.09 $108.79 35.8%
POST Post Holdings, Inc. $35.00 $46.50 32.9% DTV DIRECTV $50.56 $67.02 32.6%
CMCSK Comcast Corporation $36.24 $47.22 30.3% BBBY Bed Bath & Beyond Inc. $58.99 $76.52 29.7% JPM JPMorgan Chase & Co. $43.48 $56.31 29.5%
AMCX AMC Networks Inc. $51.09 $65.04 27.3% BRK.A Berkshire Hathaway Inc. $134,850.00 $171,500.00 27.2% XYL Xylem Inc. $26.55 $33.51 26.2% WU The Western Union Company $13.23 $16.64 25.7%
MAR Marriott International, Inc. $36.84 $46.02 24.9% TAP Molson Coors Brewing Company $43.49 $53.42 22.8%
BOTTOM 10 ISCA International Speedway Corporation $27.12 $33.16 22.3% HNZ H. J. Heinz Company2 $59.86 $72.50 21.1% MSG The Madison Square Garden Company $44.84 $54.30 21.1% DOLE Dole Food Company, Inc.3 $11.59 $13.50 16.5% ELY Callaway Golf Company $6.52 $7.50 15.0% DVN Devon Energy Corporation $52.13 $59.42 14.0% CVC Cablevision Systems Corporation $14.89 $16.02 7.6%
CSCO Cisco Systems, Inc. $20.11 $20.51 2.0% LH Laboratory Corporation of America Holdings $87.17 $87.75 0.7%
AMZN Amazon.com, Inc. (Short) $253.86 $381.25 -50.2%
1LMCA’s “% Change” reflects the performance of Starz, which was spun off from LMCA on January 14, 2013. Liberty Media shareholders received 1 share of Starz for each share of LMCA.
2HNZ’s closing price reflects the acquisition price of $72.50 a share, which closed on June 7, 2013. 3DOLE’s “% Change” reflects the acquisition price of $13.50 a share, which closed in 3Q 2013.
iv
A Look Ahead
1) Where Do We Go From Here? It is hard to believe but it has been over 5 years since the collapse of Lehman Brothers.
Stocks certainly have had quite a run since that period, advancing by approximately 162%, as measured by the S&P 500 from its March 2009 lows.
Time has a way of dulling the pain from traumatic shocks such as the most recent financial crisis (making investors more risk averse, and allowing new speculative bubbles to emerge). It is clearly more difficult to find bargains today than when stocks like CBS traded for $6 per share (current price $58.17), or when Saks was trading at a $1.85 per share (recently acquired for $16 per share). For the moment (at least in our opinion), the days of six or seven baggers are over. So where do we go from here?
• The current bull market is ~57 months long; the average bull market since 1921 lasted 29 months.
• The average price increase from the bottom in the past 17 bull markets has been ~153% vs. the ~162% jump in the S&P 500 from March 9, 2009.
• The longest and strongest bull market which ended with the bursting of the tech bubble lasted 113 months and climbed 417%.
• Two of the four bull markets since 1982 have seen significantly better stock market advances than the one we are currently experiencing. As mentioned above, one bull market saw a 417% advance, and the bull market from 1982 to 1987 saw an advance of 229%.
• The average price to earnings ratio since 1999 has approximated 16.6x. The projected 2014 P/E of the S&P 500 is currently around 14.6x.
Typically bull markets come to an end following a period of extraordinary performance. As Mark Hulbert in Barron’s observed, “some of a bull market’s best returns occur right before it dies.” Remember the NASDAQ’s performance in the 4th quarter of 1999 when it advanced ~48%? The NASDAQ hit its all-time high four months later, just before the party ended. In the months leading to market tops there are striking similarities that often occur. Growth stocks outperform value stocks and small capitalization stocks outperform their larger brethren. There are early signs today that such a trend has commenced.
So let us revisit the grand daddy of all bull markets, the Internet craze and NASDAQ 5000 to see if there are any similarities with today’s richest companies in terms of stock market valuations and the leaders of that era. Bill Gates aptly once stated:
“I think the multiples of technology stocks should be quite a bit lower than the multiples of stocks like Coke and Gillette, because we are subject to complete changes in the rules. I know very well that in the next ten years, if Microsoft is still a leader, we will have to weather at least three crises.”
The magnitude of Internet stocks’ price increases and market valuations in the late 1990s dwarfed what longtime market watchers recall in previous speculative frenzies like that for biotechnology stocks in 1991. Compared with AOL’s P/E of 418, the 95x earnings Polaroid sold for in the late 1960s was a model of value investing.
Currently there are a number of companies that have captured Wall Street’s fancy, each with multiples of 100x or more. They include names like Netflix, Zillow and LinkedIn. Tesla is another example of a high multiple stock (with no current earnings). The company delivered just 1400 cars in July or about 1% of Ford Motor Company’s sales for the same month. Today Tesla commands a market valuation of ~ $18 billion. This is about 30% of Ford’s market capitalization.
Before the dot com bubble imploded, Yahoo! commanded a price multiple of more than 400x earnings. So when it purchased Mark Cuban’s fledgling Broadcast.com for $5.9 billion, the acquisition price, based on future potential, was not widely criticized. This site is now defunct and redirects to Yahoo!’s home page. Yahoo! also purchased GeoCities during that era, paying $3.65 billion for a company that is no longer in business. Did Yahoo! make the same mistake yet again? Just recently it purchased blogging site Tumblr ($13 million in sales last year) for $1.3 billion.
Although there are some early indications that the U.S. equity market is getting somewhat frothy, it could still have some more room to run. Yes, it is true the more speculative technology-laden NASDAQ and the small capitalization Russell 2000 have become the market leaders. Momentum stocks, such as Tesla (even with the recent pullback and based on forward earnings) and Netflix, each with triple-digit P/E ratios, have also become market darlings.
On the other hand during the 1990s large capitalization stocks such as Microsoft, Pfizer, Cisco and Intel commanded outsized price/earnings multiples of 40x to 150x. Today, the P/E ratios of these same companies average approximately 12x, well below the multiples of most of
v
the companies within the S&P 500. These companies also yield 3% or more, with the capability of multiple dividend increases during the next five years.
There are a number of other factors that could help continue the stock market’s advance for at least a while longer. While this report was going to press the Federal Reserve announced that it will begin a modest taper of $10 billion per month and stated it will continue to taper even more if the economy shows sustained improvement. However even after the initial tapering begins, the amount of bonds the government is buying each month is still massive. In addition, it appears as if the Federal Reserve intends to keep short-term rates low for an extended period of time. So for now it appears as if the green light is still flashing to purchase riskier assets such as stocks, but we do not know when the light will change. What gives us great concern is the violent reaction in terms of both interest rates and stock market performance that occurred in May of this year (the S&P declined by 6.3% while long-term government bonds lost approximately 6%) when the market thought the Fed would begin to taper in earnest. We do not know what will happen when the market believes the Fed is close to a significant, and what would appear to be a permanent, wind down in purchasing securities.
Until recently, individual investors had not taken the Fed’s bait. And who can blame them? Over the last decade or so they have been badly bruised by three financial bubbles bursting: First came the Internet bubble, followed by a real estate collapse of monumental proportion and finally the financial meltdown which almost destroyed the entire economic system.
Individual investors usually show up late for the party, but they usually do show up. As a result of both individual and institutional investors fleeing the equity markets en masse during the 2007-2009 period, common stocks are currently under-owned, while bonds have a much higher weighting than normally is the case. A higher asset allocation into stocks could prolong the stock market advance.
To summarize, the overall stock market is probably fairly valued. Stocks are not on the bargain basement table as they were in 2008-2009. Temper your expectations in terms of expected future returns, and be wary of momentum stocks with triple-digit P/E ratios (or no current earnings at all). A higher cash balance might also be appropriate.
2) Where to Look For Opportunities in Current Market This has certainly (at least in our view) turned into a stock picker’s market. The broad
market is not blatantly overvalued, but is close to being fairly valued. This is the hardest time to be in the investment business, as you really do not know whether you should be playing offense or defense. While the overall market may be somewhat picked over, that does not mean there are not opportunities for good old fashioned stock picking. We think turnarounds that are starting to show signs of progress (such as Callaway, which is regaining market share) are interesting places to search for investment ideas. Other potential turnarounds such as Weight Watchers that have not yet shown signs of progress, but have a significant margin of safety in terms of valuation, a great consumer franchise, and an identifiable catalyst are worth looking further into. Another example of a company that we believe presents an attractive opportunity is Carnival Cruise Lines. The Company has not participated in the broad stock market advance, is hated by Wall Street, has problems that we believe can be remedied and is looking to cut costs after being run by the son of the Company’s founder for more than three decades.
Spinoffs continue to be a fertile ground to find investment ideas. Recent spinoffs that were featured in last year’s Forgotten Forty such as LMC/Starz, AMC, and Post Holdings, significantly outperformed the market and were among the best performers in the 2012-2013 Forgotten Forty class. In 2014, we will continue to scour the market for spinoff opportunities, such as reviewing the upcoming Time Inc. spinout. Time Warner has enhanced shareholder value under Jeff Bewkes tremendously by spinning out both AOL and Time Warner Cable and repurchasing a significant amount of stock at attractive prices. Look for TWX to possibly sell their valuable NYC headquarters in 2014. It would be our “dream” that TWX will continue its spin-out spree and take advantage of the high value that the market is currently placing on Netflix and spin-out HBO. While we know of no plans for them to do this, we believe that the market would assign a premium valuation to HBO as a standalone entity.
3) IPOs and Insiders Signaling Bubbly Conditions In recent months, The Boyar Value Group has made several mentions of the sky-high
valuations attached to a certain group of new technology stocks and recent IPOs. We think it is particularly noteworthy that even the CEOs of some of these companies have recently voiced concerns with the exuberance attached to their stocks. In his 3Q 2013 letter to investors, Netflix CEO Reed Hastings compared Netflix shares’ recent performance to 2003 when “momentum-fueled investor euphoria” made Netflix the top NASDAQ performer during the year. Netflix shares went on to decline by 77% in 2004. This October, Tesla CEO Elon Musk also went so far as to say about his shares, “The stock price that we have is more than we have any right to deserve.” While long-term shareholders of some of the current high-flyers may be rewarded, we fear the ride will be too bumpy for many to stomach.
vi
In another sign of the times, there were 222 IPOs in 2013 to date, the highest number since the year 2000. This partially reflects the end result of the pre-crisis LBO boom, and IPOs are still far below the 400-500 annual count reached during the tech bubble, but recent IPO performance gives us pause. IPOs averaged a remarkable 17% first-day rise in 2013 and the Renaissance IPO Composite Index is up 59% YTD or well over 2x the S&P 500. IPOs tend to come in waves, and the recent performance could spur even more issuers next year. But while IPOs historically exhibited positive abnormal short-term returns, they also exhibit negative abnormal long-term returns. Given their unusually strong outperformance in 2013, we would remain on the sidelines with the current batch of IPOs.
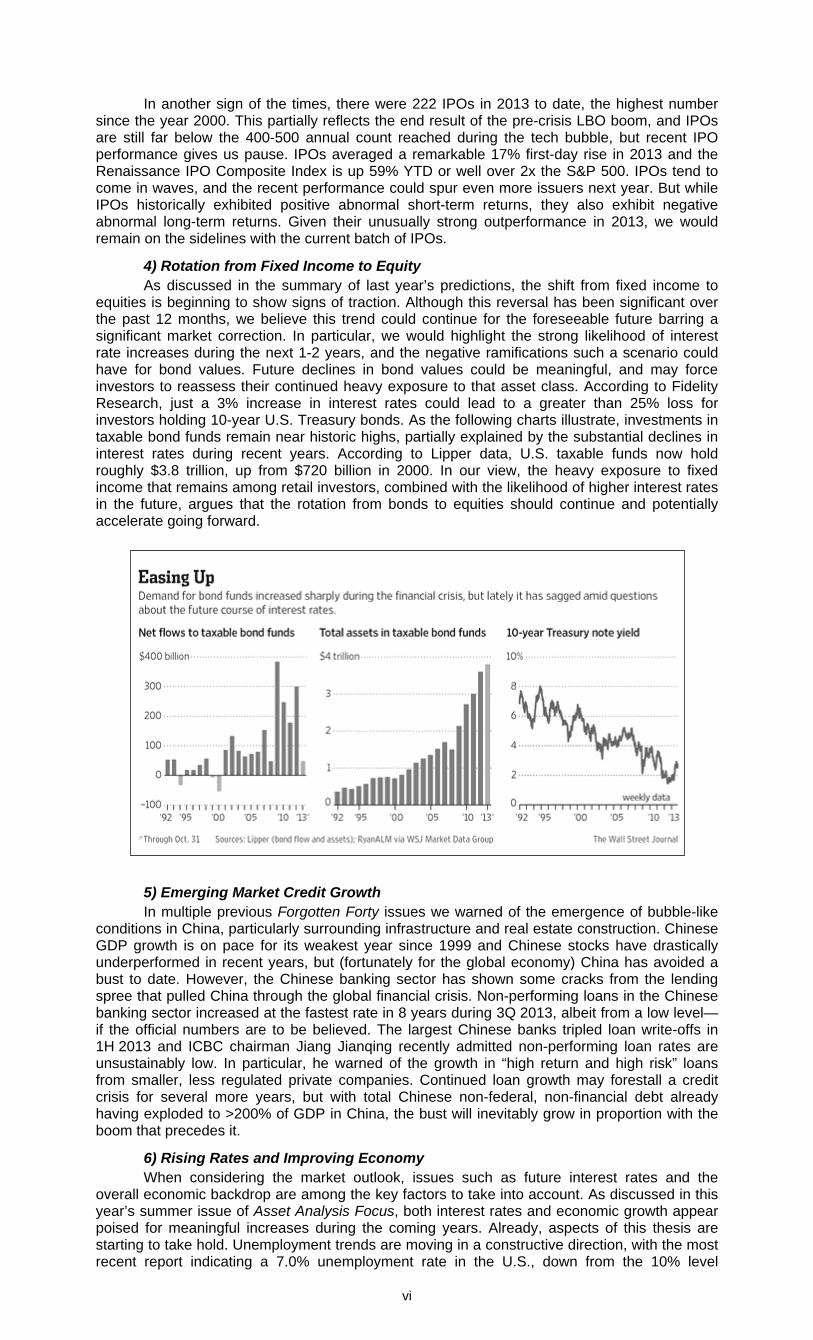
4) Rotation from Fixed Income to Equity As discussed in the summary of last year’s predictions, the shift from fixed income to
equities is beginning to show signs of traction. Although this reversal has been significant over the past 12 months, we believe this trend could continue for the foreseeable future barring a significant market correction. In particular, we would highlight the strong likelihood of interest rate increases during the next 1-2 years, and the negative ramifications such a scenario could have for bond values. Future declines in bond values could be meaningful, and may force investors to reassess their continued heavy exposure to that asset class. According to Fidelity Research, just a 3% increase in interest rates could lead to a greater than 25% loss for investors holding 10-year U.S. Treasury bonds. As the following charts illustrate, investments in taxable bond funds remain near historic highs, partially explained by the substantial declines in interest rates during recent years. According to Lipper data, U.S. taxable funds now hold roughly $3.8 trillion, up from $720 billion in 2000. In our view, the heavy exposure to fixed income that remains among retail investors, combined with the likelihood of higher interest rates in the future, argues that the rotation from bonds to equities should continue and potentially accelerate going forward.
5) Emerging Market Credit Growth In multiple previous Forgotten Forty issues we warned of the emergence of bubble-like
conditions in China, particularly surrounding infrastructure and real estate construction. Chinese GDP growth is on pace for its weakest year since 1999 and Chinese stocks have drastically underperformed in recent years, but (fortunately for the global economy) China has avoided a bust to date. However, the Chinese banking sector has shown some cracks from the lending spree that pulled China through the global financial crisis. Non-performing loans in the Chinese banking sector increased at the fastest rate in 8 years during 3Q 2013, albeit from a low level—if the official numbers are to be believed. The largest Chinese banks tripled loan write-offs in 1H 2013 and ICBC chairman Jiang Jianqing recently admitted non-performing loan rates are unsustainably low. In particular, he warned of the growth in “high return and high risk” loans from smaller, less regulated private companies. Continued loan growth may forestall a credit crisis for several more years, but with total Chinese non-federal, non-financial debt already having exploded to >200% of GDP in China, the bust will inevitably grow in proportion with the boom that precedes it.
6) Rising Rates and Improving Economy When considering the market outlook, issues such as future interest rates and the
overall economic backdrop are among the key factors to take into account. As discussed in this year’s summer issue of Asset Analysis Focus, both interest rates and economic growth appear poised for meaningful increases during the coming years. Already, aspects of this thesis are starting to take hold. Unemployment trends are moving in a constructive direction, with the most recent report indicating a 7.0% unemployment rate in the U.S., down from the 10% level
vii
experienced during the 2009-2010 period. Labor participation remains depressed from a historical perspective, but this metric should show gradual improvement as the labor market recovers. Other metrics such as GDP growth have shown steady advances during recent quarters, further suggesting that Federal Reserve monetary policy will likely be less accommodative going forward. We believe this scenario could have multiple beneficiaries from an investment perspective. Certainly, financial institutions with significant exposures to net interest income are among the prime examples (Forgotten Forty stocks such as Charles Schwab, Bank of New York, and Sallie Mae to name a few). Additionally, companies that provide economically sensitive commodities such as Devon Energy (oil and gas) and Vulcan Materials (construction aggregates) represent other ways for investors to capitalize on improving growth. Conversely, higher rates could create potential challenges. Several years of historically low interest rates have allowed firms to issue or refinance debt at very attractive levels. Going forward, higher rates could have negative ramifications for company balance sheets and cash flow, potentially diminishing the return of capital to shareholders via dividends and share repurchases. Moreover, companies that possess elevated levels of debt could face increased risk of financial distress.
We welcome your feedback at any time, and wish you a Happy, Healthy and Prosperous New Year.
Sincerely yours, Mark A. Boyar Chief Investment Officer
INVESTMENT RESEARCH SUMMARY PRICED DECEMBER 12, 2013
- 1 -
AMC Networks Inc.
Balance Sheet Data Catalysts/Highlights
(in millions) 9/30/2013 2012 2011 • Favorable renegotiation of affiliate fees and advertising growth should continue in 2014
• Building value in underpenetrated IFC and Sundance channels
• Pending Chellomedia acquisition introduces a large-scale platform for international distribution
• AMC is an attractive acquisition candidate for a larger cable network
Cash $ 510 $ 611 $ 216 Current Assets 1,205 1,347 566 TOTAL ASSETS $ 2,525 $ 2,596 $ 870 Current Liabilities $ 414 $ 813 $ 344 Long Term Debt 2,155 2,153 2,291 Shareholders Equity (613) (882) (1,037) TOTAL LIABILITIES AND SHAREHOLDERS EQUITY
$ 2,525 $ 2,596 $ 2,184
Fiscal Year Ending December 31
P&L Analysis ($ in millions except per share items)
2012 2011 2010 2009 Revenues 1,353 1,188 1,078 974 Net Income 137 126 118 89 Earnings Per Share 1.89 1.79 1.71 1.28 Dividends Per Share NA NA NA NA Price Range 53.00-35.55 43.50-30.28 NA NA
INVESTMENT RATIONALE
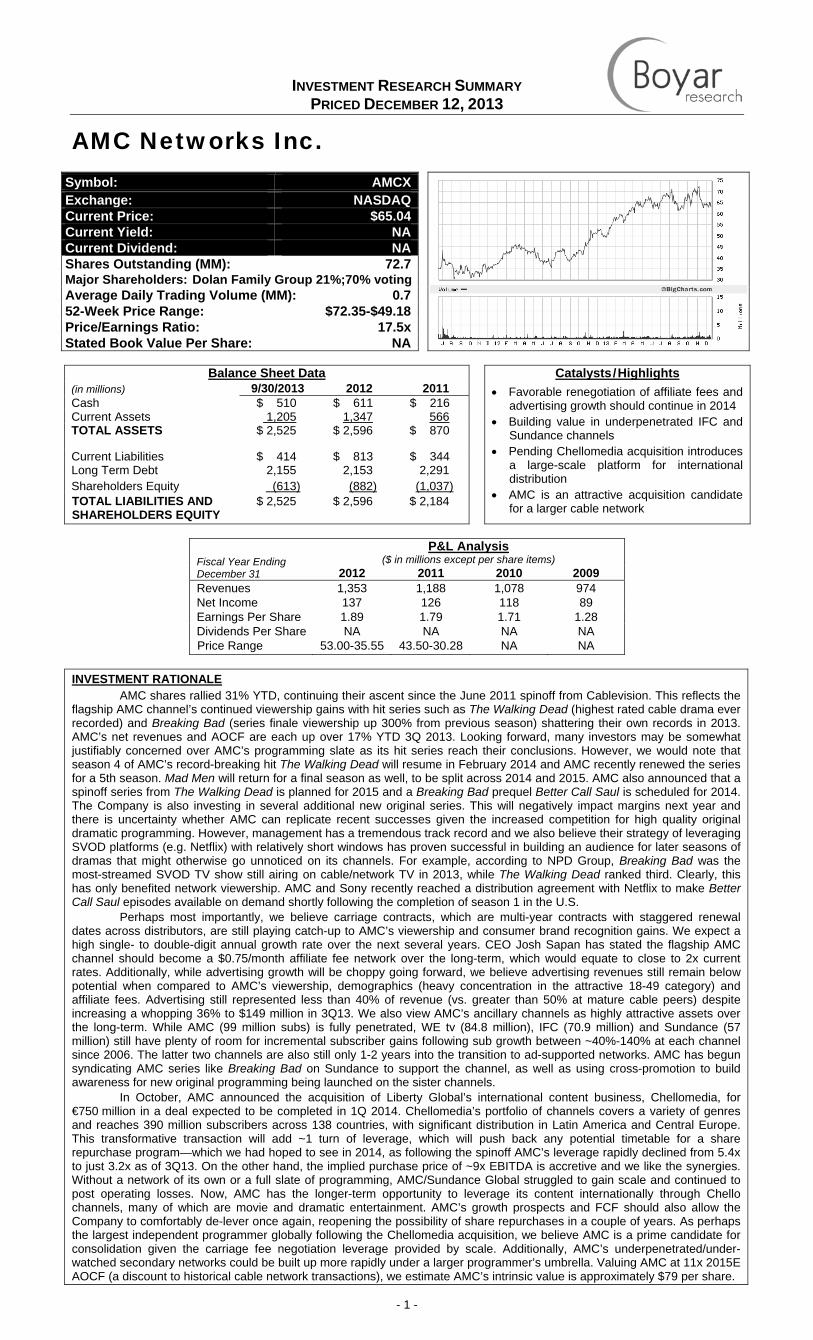
AMC shares rallied 31% YTD, continuing their ascent since the June 2011 spinoff from Cablevision. This reflects the flagship AMC channel’s continued viewership gains with hit series such as The Walking Dead (highest rated cable drama ever recorded) and Breaking Bad (series finale viewership up 300% from previous season) shattering their own records in 2013. AMC’s net revenues and AOCF are each up over 17% YTD 3Q 2013. Looking forward, many investors may be somewhat justifiably concerned over AMC’s programming slate as its hit series reach their conclusions. However, we would note that season 4 of AMC’s record-breaking hit The Walking Dead will resume in February 2014 and AMC recently renewed the series for a 5th season. Mad Men will return for a final season as well, to be split across 2014 and 2015. AMC also announced that a spinoff series from The Walking Dead is planned for 2015 and a Breaking Bad prequel Better Call Saul is scheduled for 2014. The Company is also investing in several additional new original series. This will negatively impact margins next year and there is uncertainty whether AMC can replicate recent successes given the increased competition for high quality original dramatic programming. However, management has a tremendous track record and we also believe their strategy of leveraging SVOD platforms (e.g. Netflix) with relatively short windows has proven successful in building an audience for later seasons of dramas that might otherwise go unnoticed on its channels. For example, according to NPD Group, Breaking Bad was the most-streamed SVOD TV show still airing on cable/network TV in 2013, while The Walking Dead ranked third. Clearly, this has only benefited network viewership. AMC and Sony recently reached a distribution agreement with Netflix to make Better Call Saul episodes available on demand shortly following the completion of season 1 in the U.S.
Perhaps most importantly, we believe carriage contracts, which are multi-year contracts with staggered renewal dates across distributors, are still playing catch-up to AMC’s viewership and consumer brand recognition gains. We expect a high single- to double-digit annual growth rate over the next several years. CEO Josh Sapan has stated the flagship AMC channel should become a $0.75/month affiliate fee network over the long-term, which would equate to close to 2x current rates. Additionally, while advertising growth will be choppy going forward, we believe advertising revenues still remain below potential when compared to AMC’s viewership, demographics (heavy concentration in the attractive 18-49 category) and affiliate fees. Advertising still represented less than 40% of revenue (vs. greater than 50% at mature cable peers) despite increasing a whopping 36% to $149 million in 3Q13. We also view AMC’s ancillary channels as highly attractive assets over the long-term. While AMC (99 million subs) is fully penetrated, WE tv (84.8 million), IFC (70.9 million) and Sundance (57 million) still have plenty of room for incremental subscriber gains following sub growth between ~40%-140% at each channel since 2006. The latter two channels are also still only 1-2 years into the transition to ad-supported networks. AMC has begun syndicating AMC series like Breaking Bad on Sundance to support the channel, as well as using cross-promotion to build awareness for new original programming being launched on the sister channels.
In October, AMC announced the acquisition of Liberty Global’s international content business, Chellomedia, for €750 million in a deal expected to be completed in 1Q 2014. Chellomedia’s portfolio of channels covers a variety of genres and reaches 390 million subscribers across 138 countries, with significant distribution in Latin America and Central Europe. This transformative transaction will add ~1 turn of leverage, which will push back any potential timetable for a share repurchase program—which we had hoped to see in 2014, as following the spinoff AMC’s leverage rapidly declined from 5.4x to just 3.2x as of 3Q13. On the other hand, the implied purchase price of ~9x EBITDA is accretive and we like the synergies. Without a network of its own or a full slate of programming, AMC/Sundance Global struggled to gain scale and continued to post operating losses. Now, AMC has the longer-term opportunity to leverage its content internationally through Chello channels, many of which are movie and dramatic entertainment. AMC’s growth prospects and FCF should also allow the Company to comfortably de-lever once again, reopening the possibility of share repurchases in a couple of years. As perhaps the largest independent programmer globally following the Chellomedia acquisition, we believe AMC is a prime candidate for consolidation given the carriage fee negotiation leverage provided by scale. Additionally, AMC’s underpenetrated/under-watched secondary networks could be built up more rapidly under a larger programmer’s umbrella. Valuing AMC at 11x 2015E AOCF (a discount to historical cable network transactions), we estimate AMC’s intrinsic value is approximately $79 per share.
Symbol: AMCX
Exchange: NASDAQCurrent Price: $65.04Current Yield: NACurrent Dividend: NAShares Outstanding (MM): 72.7Major Shareholders: Dolan Family Group 21%;70% votingAverage Daily Trading Volume (MM): 0.752-Week Price Range: $72.35-$49.18Price/Earnings Ratio: 17.5xStated Book Value Per Share: NA
INVESTMENT RESEARCH SUMMARY PRICED DECEMBER 12, 2013
- 2 -
Bank of America Corporation
Balance Sheet Data Catalysts/Highlights
(in millions) 09/30/13 2012 2011 Loan and deposit growth coupled with New BAC expense reductions accelerate earnings growth
Strong regulatory capital ratios drive increasing return of capital to shareholders
Continued settlements of mortgage claims reduces uncertainty and expands BAC valuation
Cash $ 121,233 $ 110,752 $ 120,102
Total Securities 320,998 360,331 311,416
TOTAL ASSETS $ 2,126,653 $ 2,209,974 $ 2,129,046
Total Deposits $ 1,110,118 $ 1,105,261 $ 1,033,041
Long Term Debt 255,331 275,585 372,265
Shareholders Equity 232,282 236,956 230,101
TOTAL LIABILITIES AND SHAREHOLDERS EQUITY
$ 2,126,653 $ 2,209,974 $ 2,129,046
Fiscal Year Ending December 31
P&L Analysis ($ in millions except per share items)
2012 2011 2010 2009
Revenues 83,334 93,454 110,220 119,643
Net Income 4,188 1,446 (3,595) (2,204)
Earnings Per Share 0.25 0.01 (0.37) (0.29)
Dividends Per Share 0.04 0.04 0.04 0.04
Price Range 11.61-5.80 15.25-4.99 19.86-12.96 18.59-3.14
INVESTMENT RATIONALE
Bank of America, once again, remains one of our Forgotten Forty. Despite surging by greater than 100% from our 2011 Forgotten Forty to our 2012 edition and another 39% this past year, we believe BAC shares still present significant upside. The past gains rewarded investors who were able to see through the myriad of challenges BAC faced, while upcoming gains should be based more on positive operating results. While still having a long way to resolution, the Bank’s mortgage representations and warranties exposure has seen significant progress in 2013 and has become more of a quantifiable risk as opposed to a litigation “black hole.”
During the first nine months of 2013, BAC delivered significant operational positives, which support our belief that the Company’s earnings will continue to accelerate. Total deposits grew by 4.4% YTD (and now total $1.1 trillion) while, more importantly, total loans and leases grew even faster at a 4.6% clip (5th consecutive quarter of growth) led by commercial and non-residential consumer loans. Consumer loans experienced a second consecutive quarter of growth after 4 years of decline. BAC’s adjusted net interest margin (NIM) had its first increase in 4 quarters in 3Q 2013 – jumping 8 basis points to 2.44% led by reduced funding costs. Full-time employees fell ~9% YOY and 3.6% sequentially led by a reduction in consumer real estate services (the entire residential mortgage industry slowed as refinancings fell). Total non-interest expenses (ex-litigation and legacy assets and servicing) for 3Q 2013 were basically flat YOY aided by the New BAC expense reduction initiative, which included a 5% decline in the number of banking centers. Finally, improving credit quality remains a major positive for BAC and bodes well for coming quarters. Annualized net charge-offs were 0.73% of average loans and leases for the current quarter versus 1.86% in 3Q 2012 – the lowest since 2005. Non-performing loans were 2.10% of loans and leases outstanding as of 9/30/13, down from 2.68% at the end of 3Q 2012, and the allowance for loan losses/annualized charge-offs stood at a healthy 2.9x versus 1.6x. BAC expects further credit improvement before stabilization during 2014.
The Bank has done an excellent job of building regulatory capital over the past few years although regulators receive partial credit (reducing BAC’s annual dividend to its current $0.04 per share and blocking share repurchases). At the end of 3Q 2013, BAC is in full compliance with all currently proposed regulatory capital requirements, including the Basel III Tier 1 common ratio minimum of somewhere between 7%-9.5% (BAC=9.9%). The strength in BAC’s capital position is evidenced by the Fed’s approval in March 2013 of the Company’s request to buyback $5 billion of common stock and retire $5.5 billion of high cost preferred stock (8.20% and 8.625% stated dividend rates). During the first nine months of 2013, BAC retired the preferred stock, bought back $1.9 billion of common stock and reduced long-term debt by over $20 billion. Looking ahead to 2014, we anticipate that the Company’s capital plan will include a dividend increase, but will still favor share repurchases. Due to the Fed’s rejection of a dividend increase in the Company’s 2011 capital plan, management remains fairly mum about the issue. We look for an increased dividend rate resulting in a below-market dividend yield of approximately 1.0%-1.5%.
With operations on the upswing, the remaining dark cloud hanging over BAC is its mortgage rep’s and warranties exposure although recent progress is encouraging. During 2013, the Bank has settled significant claims by MBIA and FNMA, and currently awaits the outcome (expected by year end) of a just concluded trial contesting a 2011 $8.5 billion settlement agreement with BNY Mellon as trustee for numerous Countrywide mortgage securitizations. As almost 60% of the original objectors have dropped out, we believe BAC will likely prevail in the outcome. The Bank’s 3Q 2013 reserve for future settlements totaled $14.1 billion although BAC has estimated that settlements could amount to $4 billion over its reserve (down from a $5 billion estimate at 12/31/2011). Overall, BAC has already paid $21.7 billion in claims. The improved housing market has helped with respect to estimated losses by claimants and should continue to do so.
With significant exposures to volatile capital markets, the mortgage financing environment and unsettled litigation, BAC’s earnings will remain choppy. However, we estimate the Bank will earn close to a combined $3 per share over the next two fiscal years as loan growth, expense controls and a slowly increasing NIM all take hold. Furthermore, we also believe BAC will gradually be rewarded by the marketplace via multiple expansion for having rebuilt capital levels, reducing outstanding mortgage litigation claims and continuing increases in the return of excess capital to shareholders. Utilizing our 2015E tangible book value per share of ~$16.50 and a 1.3x multiple (currently ~1.1x), we derive an estimated intrinsic value per share of $21.50, representing over 40% upside from current price levels.
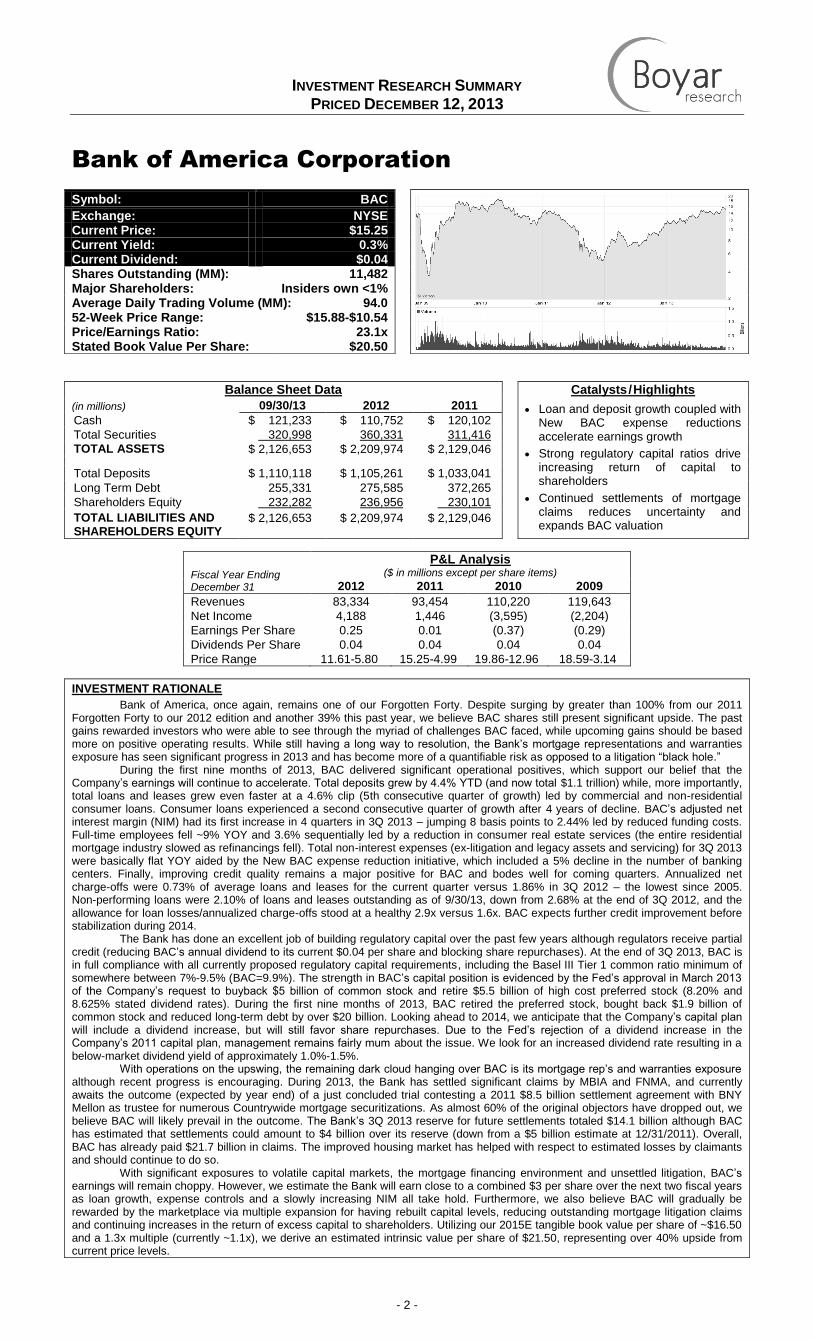
Symbol: BAC
Exchange: NYSE Current Price: $15.25 Current Yield: 0.3% Current Dividend: $0.04 Shares Outstanding (MM): 11,482 Major Shareholders: Insiders own <1% Average Daily Trading Volume (MM): 94.0 52-Week Price Range: $15.88-$10.54 Price/Earnings Ratio: 23.1x Stated Book Value Per Share: $20.50
INVESTMENT RESEARCH SUMMARY PRICED DECEMBER 12, 2013
- 3 -
The Bank of New York Mellon Corporation
Balance Sheet Data Catalysts/Highlights (in millions) 09/30/13 2012 2011 • Investment Management segment
undervalued within bank structure • Increased net interest margin (NIM) and
reduced money market fee waivers will significantly benefit earnings when short-term rates rise
• Significant 2 year cost saving initiative ($700 MM) to be reached by the end of 2013
Cash $ 102,823 $ 94,837 $ 94,418 Total Securities 97,457 100,824 81,988 TOTAL ASSETS $ 371,952 $ 358,990 $ 325,266
Total Deposits $ 255,560 $ 246,095 $ 219,094 Long Term Debt 18,889 18,530 19,933 Shareholders Equity 36,959 36,431 33,417 TOTAL LIABILITIES AND SHAREHOLDERS EQUITY
$ 371,952 $ 358,990 $ 325,266
Fiscal Year Ending December 31
P&L Analysis ($ in millions except per share items)
2012 2011 2010 2009 Revenues 14,555 14,730 13,875 7,654 Net Income 2,445 2,516 2,518 (1,367) Earnings Per Share 2.03 2.03 2.11 (0.93) Dividends Per Share 0.52 0.48 0.36 0.51 Price Range 26.25-19.30 32.50-17.10 32.65-23.78 33.62-15.44
INVESTMENT RATIONALE
The Bank of New York Mellon Corporation is a world leader in Investment Services (includes custody, clearing, securities lending, etc.) and Investment Management. The Bank’s Investment Services (IS) segment represents ~72% of revenues and pre-tax income with Investment Management (IM) representing the balance. Of note, nearly 80% of the Bank’s revenue is fee-based whereas traditional banks generate the majority of their revenue from net interest income. At the end of 3Q 2013, the Bank was well-capitalized in advance of the implementation of Basel III capital requirements (estimated Basel III Tier 1 common equity ratio of 10.1% or 11.1% under the ‘advanced’ approach versus preliminarily estimates of a 7%-9.5% requirement. Despite 3 years of “flattish” financial results (see above) due to the lingering effects of the 2008/2009 financial crisis, the Bank has improved capital ratios, reduced shares outstanding (~8% reduction since YE 2010), enhanced technologies and attacked its cost structure.
The IM segment currently has in excess of $1.5 trillion of assets under management (AUM), making it one of the largest in the world. The Bank has a multi-boutique stable of managers, which includes many well-respected firms such as Dreyfus, The Boston Company, EACM, Insight, Standish and Walter Scott. AUM breakdown by asset class as of 3Q 2013 was: Equities – 35%, Fixed Income – 39%, Money Markets – 19% and Alternative Investments – 7%. With ~58% of AUM in fixed income and money markets and institutional clientele representing 68% of AUM, the segment’s average management fee of ~23 basis points is relatively low compared to other managers. We believe the low fee levels and an operating margin that is approximately equal to the rest of the Company (resulting in no apparent need to value the segments differently) have obfuscated the intrinsic value of the IM segment. We believe a full or partial spin-off of IM would be beneficial to shareholders and result in a more focused Company. Additionally, we speculate the spinoff would result in a lower cost structure as regulatory and compliance costs would be reduced since the segment would no longer be part of a highly-regulated bank holding company. Opportunities for the segment include adding more passive strategies (especially in the fast-growing ETF marketplace) versus the current focus on active management.
We value IM by using a multiple of fee revenue as the metric eliminates the need to account for AUM asset class differences, differing levels of management fees and varying expense structures. Looking across the spectrum of large publicly-traded asset managers, the range of fee revenue multiples is 1.8x-5.0x. The removal of outliers leaves the majority of firms in the 3.4x-4.0x range. Utilizing a 3.7x revenue multiple on our 2015E fee revenues, our estimate of intrinsic value per share of the IM segment is approximately $14.25.
The IS segment appears to be in the beginning of a positive turn in operations, which should accelerate by 2015. We see continued slow, steady growth in IS fee income and profitability as the lack of pricing power keeps a lid on growth. However, the Company remains focused on lowering its expense structure. The real pressure on earnings has been due to the Fed’s zero interest rate policy and a relatively flat 0-2 year yield curve that have combined to crush the Company’s net interest margin (NIM). Prior to 2009, the Bank’s NIM averaged approximately 2%, but it has steadily declined and currently stands at a near record low 1.16%. We calculate that a “normalized” Fed Funds (FF) to 2-year US treasury notes yield curve would add at least 30 bps to the segment’s NIM and result in a $0.17 increase in EPS for every 10 bps increase in the yield curve. While not expecting a rise in FF’s in the near-term, it is probable that the tapering of QEIII will result in curve steepening and positively affect the segment’s earnings in 2015.
Another result of the Fed’s policies is the Company’s waiver of money market fund fees in order to keep yields positive. During 3Q 2013, fee waivers reached their highest level yet and cost the Bank ~$0.06 per share (evenly split between IS and IM). Equivalent to ~10% of adjusted EPS for the quarter, the eventual removal of this cost will provide a meaningful boost to normalized earnings. However, while we believe the Fed will begin to taper QEIII in the not-too-distant future, a Fed Funds Rate rise is seen as less certain with speculation ranging from late 2014 to early 2016.
We estimate IS continues to grow revenues at 2% per year and slowly expands margins through 2015. Importantly, we believe NIM expansion will take hold in 2015 and conservatively forecast a 10% improvement in net interest revenue (yield curve changes take time to affect the NIM). Using the Bank’s 10 year average P/E multiple of 13.5x and our 2015E EPS, our estimate of IS intrinsic value is approximately $29.15 per share. Combining our estimates of intrinsic value per share for IM ($14.25) and IS ($29.15), we derive an estimated intrinsic value per share of the Company of $43.40, representing 32% upside from current price levels.
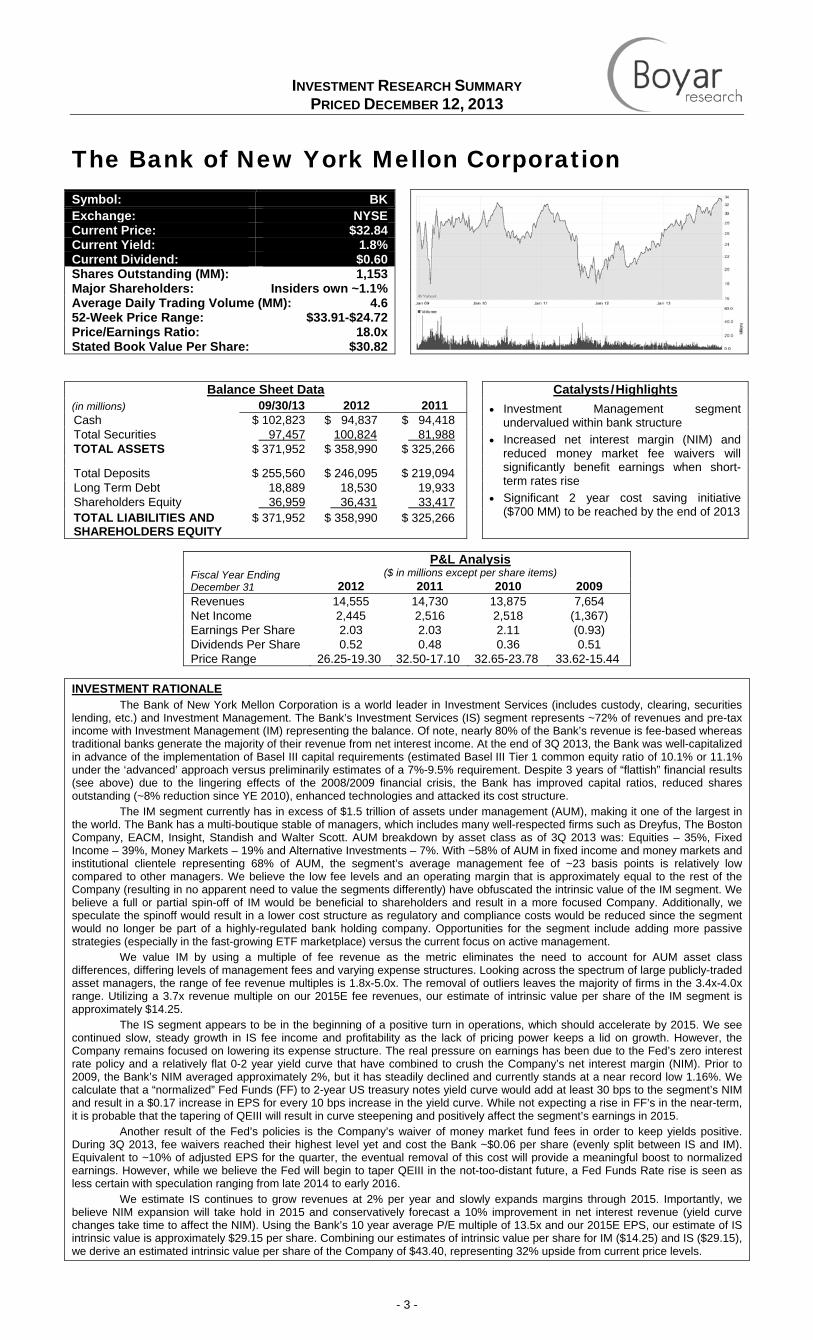
Symbol: BK Exchange: NYSECurrent Price: $32.84Current Yield: 1.8%Current Dividend: $0.60 Shares Outstanding (MM): 1,153Major Shareholders: Insiders own ~1.1%Average Daily Trading Volume (MM): 4.652-Week Price Range: $33.91-$24.72Price/Earnings Ratio: 18.0xStated Book Value Per Share: $30.82

INVESTMENT RESEARCH SUMMARY PRICED DECEMBER 12, 2013
- 4 -
Bed Bath & Beyond Inc.
Balance Sheet Data Catalysts/Highlights
(in millions) 8/31/13 2012 2011 • BBBY possesses an attractive set of growth opportunities; sales of $13 billion and EBITDA of $2.3 billion could be achievable by FY 2015.
• Normalization of economic conditions and continued strength in U.S. real estate could provide additional tailwinds for profits.
• BBBY has reduced its share base by 17% since 2011, and buybacks should remain a recurring theme.
Cash $ 839 $ 1,015 $ 1,789 Goodwill 486 484 199 TOTAL ASSETS $ 6,308 $ 6,280 $ 5,646 Long Term Debt $ 0 $ 0 $ 0 Shareholders Equity 4,027 4,080 3,932 TOTAL LIABILITIES AND SHAREHOLDERS EQUITY
$ 6,308 $ 6,280 $ 5,646
Fiscal Year Ending February 28
P&L Analysis ($ in millions except per share items)
2012 2011 2010 2009 Revenues 10,915 9,500 8,759 7,829 Net Income 1,038 990 791 600 Earnings Per Share 4.56 4.06 3.07 2.30 Dividends Per Share NA NA NA NA Price Range 72.75-57.58 63.83-44.79 50.95-26.50 40.23-19.11
INVESTMENT RATIONALE
Bed Bath & Beyond Inc. is a major operator within the retail sector. BBBY operates over 1,400 stores throughout North America. The stores are primarily located in the U.S., and consist of the following brands: Bed Bath & Beyond, Christmas Tree Shops, Harmon, buybuy BABY, and Cost Plus. BBBY’s product line includes a wide range of domestic merchandise and home furnishings. The firm’s multiple store concepts provide a means of accessing several geographic markets, industry niches, and customer segments. BBBY has achieved a track record of impressive growth over its history. Although its past level of growth is unlikely to be repeated given the Company’s increased store base, we believe the firm continues to possess an attractive set of opportunities for both growth and margin expansion during the coming years.
BBBY continues to hold a strong competitive position, with a strategy that emphasizes factors such as product assortment, customer service, and competitive pricing. Much of this competitive position can be attributed to strategic execution by its experienced management team. BBBY’s management team boasts an impressive roster of executives, who have accumulated a significant amount of experience. These executives include co-founders Warren Eisenberg (age 82) and Leonard Feinstein (age 76), who possess a combined total of over 80 years of experience, and remain actively involved with the Company they founded. CEO Steven Temares has held his current position for about a decade, and has been with BBBY for about 20 years.
Looking ahead, we believe BBBY retains an attractive set of opportunities for growth and margin expansion. In BBBY’s current geographic footprint, areas such as the Mountain West and West Coast are relatively under-penetrated relative to other regions (especially true for the Bed Bath & Beyond concept), and BBBY has been gradually ramping up its market presence in Canada. There are roughly 1,000 Bed Bath & Beyond stores across the U.S. and Canada, and management believes this marketplace can support at least 1,300 stores. Moreover, some of its smaller concepts such as buybuy BABY and Harmon have much lower market penetration, and will likely offer significant expansion opportunities for many years to come. The Company also launched a revamped web site earlier this year that should allow BBBY to better respond to demand within the e-commerce channel, an area that had been a source of investor concern in past years.
We have been encouraged by the Company’s recent financial results, and believe the firm can carry its positive operational momentum into the foreseeable future. During fiscal 2Q-2013 (reported in September), BBBY achieved overall sales growth of 9%, and same store sales growth of nearly 4%, while EPS increased 18% year over year. Assuming general economic conditions remain within a relatively normalized range during the coming years, BBBY should be well positioned for continued profit growth. Moreover, a continued recovery in U.S. residential real estate fundamentals should provide an additional tailwind for store traffic and sales. Utilizing fairly conservative assumptions, we believe sales of $13 billion and EBITDA of $2.3 billion could be attainable by FY 2015 (year ending February 2016).
In our view, BBBY manages itself in a manner that reflects a long-term shareholder mindset. The Company’s strong balance sheet and consistent return of capital to shareholders helps to illustrate this approach. The firm has no debt, and it held over $900 million in cash and investments as of the most recent quarter. BBBY generates a steady level of free cash flow (6% free cash flow yield), and the firm has consistently repurchased a significant amount of its own shares during recent years. The Company has reduced its shares outstanding by approximately 17% since 2011, and BBBY bought back $257 million of its own shares just during the recent quarter (BBBY’s remaining repurchase authorization stood at $1.8 billion). It is conceivable that management could use BBBY’s financial position to finance potential M&A opportunities, but we would expect potential transactions to be relatively small, and bolt-on in nature (consistent with the firm’s past history).
The stock is currently trading at an EV/EBITDA multiple of about 6.5x, a modest multiple for BBBY from our perspective. We have assumed that BBBY can trade at 8.5x FY 2015 on an EV/EBITDA basis (consistent with its historical range and industry averages). These assumptions produce an estimate of intrinsic value of $100 for BBBY shares, about 30% above the current valuation. In our view, this estimate of intrinsic value could prove conservative if BBBY’s profitability exceeds our expectations, or if the firm potentially attracts the interest of private equity investors.
Symbol: BBBY Exchange: NASDAQCurrent Price: $76.52Current Yield: NACurrent Dividend: NAShares Outstanding (MM): 214.7Major Shareholders: Insiders own 3%Average Daily Trading Volume (MM): 1,49952-Week Price Range: $78.94-$54.33Price/Earnings Ratio: 13.6xStated Book Value Per Share: $18.76
INVESTMENT RESEARCH SUMMARY PRICED DECEMBER 12, 2013
- 5 -
Callaway Golf Company
Balance Sheet Data Catalysts/Highlights
(in millions) 9/30/13 2012 2011 • Ongoing market share gains are translating into improved top and bottom line performance
• As profitability improves, ELY should generate an outsized amount of FCF due to significant operating loss carryforwards
• Elimination of high cost preferred stock should remove valuation overhang
Cash $ 38 $ 43 $ 43 Current Assets 410 387 419 TOTAL ASSETS $ 651 $ 638 $ 727
Current Liabilities $ 163 $ 162 $ 68 Long Term Debt 108 107 0 Shareholders Equity 335 322 513 TOTAL LIABILITIES AND SHAREHOLDERS EQUITY
$ 651 $ 638 $ 727
Fiscal Year Ending December 31
P&L Analysis ($ in millions except per share items)
2012 2011 2010 2009 Revenues 834 887 968 951 Net Income (123) (172) (19) (15) Earnings Per Share (1.96) (2.82) (0.46) (0.33) Dividends Per Share 0.04 0.04 0.04 0.10 Price Range 7.29-5.17 8.37-4.70 10.19-5.80 10.31-4.66
INVESTMENT RATIONALE We believe that Callaway is in the early stages of executing a successful turnaround as the Company is regaining market
share, which is translating into significantly improved top and bottom line results. Between 2007 and 2012, Callaway’s hard goods (woods, irons, putters, wedges and balls) market share in the U.S. steadily declined from 19.6% in 2007 to 13.9% in 2012. However, Callaway has begun to recapture share thanks to its strong new product development and improved marketing initiatives intended to revitalize the iconic Callaway brand. Year-to-date (August 2013), Callaway’s hard goods market share stood at 15.1%, up 110 basis points on a Y-o-Y basis and management has noted that its fairway wood market share in the U.S. doubled in 2013, which has contributed to a 26% increase in Callaway’s total woods sales (~32% of ELY’s total sales). It is worth noting that the Company’s market share gains are not confined to the U.S. market with the Company recording share gains in key markets including Japan (18% of ELY’s sales) and the U.K, which is Callaway’ largest market in Europe (15% of total). Notably, the Company’s YTD market share gains in Japan of 350 basis points represented the highest share gain for any golf brand in that country helping to drive 31% local currency growth through the first 9 months of 2013.
A key component of Callaway’s turnaround plan has been improving the image of its iconic brand. As part of its plan to make the Callaway brand more relevant, especially with avid golfers, Callaway has invested heavily in signing tour players to endorse its brand with an emphasis on attracting “long-hitting, young dynamic professionals.” New Callaway staff members for 2013 included Gary Woodland, Ryo Ishikawa, Nicolas Colsaerts and Chris Kirk. Notably, Callaway had two of its endorsers in the top ten in driving distance on each of the PGA and European tour at the end of the 2013 season. The Company’s initiatives to make the brand resonate with consumers are showing success with ELY experiencing brand strength for the first time in many years according to a recent Attitude and Usage survey conducted by industry researcher Golf Datatech.
Callaway’s 3Q 2013 results suggest that not only is a turnaround unfolding, but it is actually gaining momentum with quarterly and YTD revenues increasing by 38% (constant currency) and 13%, respectively. Results in both time periods imply that Callaway is outpacing the industry as conditions in the U.S. and Europe, two of the Company’s largest markets accounting for 64% of sales, continue to be soft. The strong results prompted the Company to increase its full year outlook (the first boost in many years) for revenue with the Company now expecting to generate $836 million up from a prior outlook of $810-$820 million, which would represent a 13% increase on a pro forma basis. The Company’s improved top line, aided by less discounting and new product success, coupled with ongoing cost reduction and manufacturing efficiency initiatives to further streamline the organization are also translating into significantly enhanced profitability. For the first nine months of 2013, Callaway’s gross margins on a pro forma basis were 41%, up 350 basis points while operating expenses on a pro forma basis declined by 11% to $248 million compared with $279 million. As a result of Callaway’s progress this year, the Company expects to post positive net income on a pro forma basis during 2013, which would be ELY’s first annual profit since 2008.
In addition to its operational improvements, Callaway has made significant progress with its capital structure, which should help reduce expenses and bolster the Company’s financial flexibility. During 2013, Callaway redeemed the remainder of its high cost (7.5%) convertible preferred stock. In our view the convertible preferred security has served as a valuation overhang on the shares in recent years. While the Company still has $108 million of preferred stock outstanding, it carries a much lower coupon (3.5%) than the convertible stock that was recently redeemed. In addition, as the Company’s profitability continues to improve, ELY is likely to generate an outsized amount of free cash flow thanks to $273 million in operating loss carryforwards at the end of 2012. With future tax payments likely to be minimal, ELY should be well positioned to further improve its capital structure and have the ability to begin returning value to shareholders via higher dividends or share buybacks.
We believe Callaway’s operating momentum should continue under the auspices of CEO Chip Brewer, who appears to be leading Callaway in the right direction and successfully orchestrated a prior golf industry turnaround while at Adams Golf. The pace of new product introductions is set to accelerate under Brewer (the Big Bertha is back), which should help the Company sustain its recent operating momentum. Our estimate of Callaway’s intrinsic value is $12 a share, which is derived by applying discounted multiples (relative to recent golf industry transactions) to our estimate of 2016 sales and profitability. We note that CEO Brewer is heavily incentivized to see through a successful turnaround as he is in possession of 800k ELY stock options (avg. exercise price: $6.48 a share) and 300k restricted stock units that he received upon joining the Company as part of “make-whole” agreement for incentives he was forfeiting at his prior employer.
Symbol: ELY Exchange: NYSECurrent Price: $7.50Current Yield: 0.5%Current Dividend: $0.04Shares Outstanding (MM): 72.6Major Shareholders: Insiders 2.3%Average Daily Trading Volume (MM): 0.852-Week Price Range: $8.97-$6.15Price/Earnings Ratio: N/AStated Book Value Per Share: $4.61

INVESTMENT RESEARCH SUMMARY PRICED DECEMBER 12, 2013
- 6 -
Carnival Corporation
Balance Sheet Data Catalysts/Highlights
(in millions) 8/31/2013 2012 2011 • The Company is in the early stages of undergoing a complete transformation with regard to its operating philosophy.
• In our opinion, profits are well below potential relative to its own historic pricing as well as that of its competitors.
• We believe CCL’s private market value is at least 40% above its current market price.
Cash $ 981 $ 465 $ 450 Current Assets 2,634 1,821 1,312 TOTAL ASSETS $ 40,393 $ 39,161 $ 38,637 Current Liabilities $ 7,488 $ 7,340 $ 6,105 Long Term Debt 7,792 7,168 8,053 Shareholders Equity 24,260 23,929 23,832 TOTAL LIABILITIES AND SHAREHOLDERS EQUITY
$ 40,393 $ 39,161 $ 38,637
Fiscal Year Ending November 30
P&L Analysis ($ in millions except per share items)
2012 2011 2010 2009 Revenues 15,382 15,793 14,469 13,157 Net Income 1,298 1,912 1,978 1,790 Earnings Per Share 1.67 2.42 2.47 2.23 Dividends Per Share 1.00 1.00 0.40 Nil Price Range 39.95-29.15 48.14-28.52 47.22-29.68 34.95-16.80
INVESTMENT RATIONALE Investing in turnaround situations is not only complicated, but in the vast majority of instances requires
significant amounts of patience. However, once an underachieving company finally fesses up to its past sins by cutting costs, paying down debt, eliminating unprofitable or non-core businesses, and intelligently articulates a new business plan, the result is often a rapid rise in its share price (Home Depot and McDonald’s are relatively recent examples of this phenomenon). Furthermore, if the plan is orchestrated by a newly appointed CEO, the common shares tend to advance even sooner.
Carnival, the world’s largest cruise operator, was clearly in crisis mode throughout 2012 and 2013. Its Costa Concordia vessel ran aground near the Italian coast in 2012, killing 32 people and generating an immense amount of bad media coverage. That was followed by more negative incidents in 2013, including a fire aboard the Carnival Triumph in February that further tarnished the Company’s image.
As a result of the aforementioned, Micky Arison, the son of the Company's founder and the Company’s chief executive officer for 34 years, resigned and was replaced by Arnold Donald. Donald, who has been a Carnival board member for 12 years, is a highly regarded entrepreneur and has resigned all of his private equity positions so he can devote his energy to literally “righting the ship.”
In the past CCL’s key growth drivers have been adding new vessels and penetrating new markets. CCL started with a few ships, grew to a fleet, and now has an armada. The Company is in the early stages of undergoing a complete transformation with regard to its operating philosophy. One in which it is transitioning from focusing on unit growth in favor of significant cost cutting and retrofitting existing ships. As the Company adds fewer new ships in the future, revenue growth will emanate from adding new cabins and innovative dining and bar concepts to existing vessels. Retrofitting will only be done if a satisfactory return on capital can be attained.
Other initiatives being implemented by Donald include focusing on collaboration between the many brands under the Carnival umbrella, something that was lacking in the past. Redundancies will be eliminated, and cross marketing will be initiated. Donald has already met with travel agents to repair relations that have frayed in recent years. CCL has simplified its fare structure and incentivized those agents. A more aggressive campaign to win over more travelers (currently about 35% who have never cruised before) has begun, as well as one intended to revitalize its tarnished brand.
Carnival will continue to discount prices throughout a good part of 2014 in order to fill its ships. As credibility is restored a more aggressive pricing policy will be implemented. Investor expectations in terms of earnings and stock price have been sufficiently diminished to create a margin of safety. In our opinion, profits are well below potential relative to its own historic pricing as well as that of its competitors. By fiscal 2015 EPS could reach $2.70 versus street estimates of $1.60 for the fiscal year ended Nov 30, 2013. Potential earning power based on CCL’s peak 2008 net yield to its current fleet and expense structure is over $4.50 and even higher if compared to competitors.
We believe CCL’s private market value is at least 40% above its current market price. We reach this number by projecting future profit potential, as well as taking into consideration the difficult barriers to entry, and the unique consumer franchise that has been created over multiple decades.
Symbol: CCL Exchange: NYSECurrent Price: $35.34Current Yield: 2.8%Current Dividend: $1.00Shares Outstanding (MM): 776Major Shareholders: Micky Arison~22%Average Daily Trading Volume (MM): 4.852-Week Price Range: $39.95-31.44Price/Earnings Ratio: 22.3xStated Book Value Per Share: $31.26
INVESTMENT RESEARCH SUMMARY PRICED DECEMBER 12, 2013
- 7 -
The Charles Schwab Corporation
Balance Sheet Data Catalysts/Highlights
(in millions) 9/30/2013 2012 2011 • Increased short term interest rates will have favorable impact on SCHW’s spread-based businesses and eliminate MMF fee waivers
• Traction with new platforms including Schwab Index Advantage, Schwab ETF OneSource and the upcoming/pending launch of Schwab’s ETF 401 (k) plans
• SCHW is well capitalized, which should allow it to repurchase shares and increase its dividend
Cash $ 7,362 $ 12,663 $ 8,679 Total Securities 80,566 64,953 49,666 TOTAL ASSETS $ 140,211 $ 133,637 $ 108,553 Total Deposits $ 91,187 $ 79,377 $ 60,854 Long Term Debt 1,904 1,632 2,001 Shareholders Equity 10,053 9,589 7,714 TOTAL LIABILITIES AND SHAREHOLDERS EQUITY
$ 140,211 $ 133,637 $ 108,553
Fiscal Year Ending December 30
P&L Analysis ($ in millions except per share items)
2012 2011 2010 2009 Revenues 4,883 4,691 4,248 4,193 Net Income 928 864 454 787 Earnings Per Share 0.69 0.70 0.38 0.68 Dividends Per Share N/A N/A N/A N/A Price Range 15.38-11.61 19.45-10.75 19.88-12.76 19.49-11.34
INVESTMENT RATIONALE The Charles Schwab Corporation provides its clients a number of services including securities brokerage, banking, money
management and financial advisory. Over the past two decades, Schwab has successfully transformed its business model from commission dependent to one that derives the vast majority of its revenues and profitability from either fee based or spread based businesses. At 3Q 2013, asset management and administration fees (42% of 3Q 2013 net revenues) and net interest revenue (37%) accounted for nearly 80% of SCHW’s total net revenues. Meanwhile, transactional based revenues (commissions, etc.) now represent just 16% of total net revenues, down from 60% as recently as 1998.
By all accounts, the current Charles Schwab bears little resemblance to the upstart brokerage firm that successfully challenged the full service model during the early 1970s. New assets entering Schwab’s various platforms are increasingly generating fees for the Company based on asset levels rather than commissions. Between 2009 and 2012, the Company’s asset management and administration fees (excluding money market fund fees) increased to $1.7 billion from $1.1 billion, representing a 17% CAGR. It should also be noted that nearly half of Schwab’s total client assets ($1 trillion out of $2.2 trillion) at 3Q 2013 were receiving some type of ongoing advice and hence generating an ongoing revenue stream for the Company.
We believe Charles Schwab will be a primary beneficiary of what we view as a rising interest rate environment. Persistently low rates have been particularly challenging for Schwab and have masked its true earnings power. Approximately 75% of SCHW’s interest-earning assets are currently tied to short-term rates. In addition to the pressure on net interest revenue, low interest rates have forced the Company to provide fee waivers for its money market funds in order for investors in these products to earn a positive return. During 2012, fee waivers totaled a whopping $587 million, representing nearly 30% of SCHW’s asset management and administration fees. As a result, as short term rates begin to increase this revenue component should experience a significant acceleration and have a disproportionate impact on SCHW’s overall profitability.
In the wake of the financial crisis with its competitors struggling, Schwab made a strategic decision to continue to invest in its client capabilities. It’s hard to argue that this was not the right decision. Between 2008 and 2012, Schwab attracted $500 billion in assets, which is $200 billion more than its top four publicly traded competitors combined. While expenses continued to remain elevated, tracking in line with revenue growth in recent years, management recently stated that expense growth during 2014 should be “muted” and trail revenue growth by ~300 to 500 bps. We believe this outlook is realistic reflecting Schwab’s asset gathering progress (YTD-3Q 2013, SCHW’s core net new assets of $108.8 billion represent an annualized growth rate of approximately 7.4%), the prospect for higher rates, and the Company’s disciplined expense management.
Schwab has recently embarked on a number of initiatives to further accelerate its fee based revenues. During 2012, the Company launched Schwab Index Advantage to become a much greater participant in the $5 trillion 401 (k) market by offering low cost mutual funds as well as professional advice. Recent results have been encouraging as Schwab was able to attract $4 billion from 50 employers in just its first year. An ETF only 401 (k) program is also scheduled to launch shortly that should allow Schwab to make further inroads in the 401 (k) market. Schwab’s recent decision to offer a marketplace of commission-free ETFs should also help accelerate fee based revenues. While Schwab foregoes a commission payment, it now generates an attractive long-term recurring revenue stream tied to asset levels. According to Schwab management, early indications are that the flows into the ETF OneSource platform are coming out of commission oriented ETFs or commission equities rather than cannibalizing Schwab’s profitable Mutual Fund OneSource program.
Schwab is well capitalized and is poised to return a significant amount of value to shareholders in our view. At September 30, 2013, Schwab Bank boasted a Tier 1 Risk-Based Capital ratio of 18.5%, well above the 6% level deemed to be well capitalized. While the current interest rate environment has created its share of headwinds, SCHW has taken advantage of historically low rates to secure capital at attractive rates. As earnings growth accelerates, we would not be surprised if Schwab boosts its dividend and begins repurchasing shares as soon as the Company receives more clarity on future capital requirements.
Utilizing a sum-of-the-parts valuation, our estimate of Schwab’s intrinsic value is $32 a share, representing 29% upside from current levels. We would not be surprised if this proves conservative, especially as SCHW’s true earnings power emerges. In addition, don’t rule out the potential for a takeout. Company founder Charles Schwab is 75 years old and controls over 14% of the stock. We believe that SCHW’s fee based business would be attractive for a number of large financial institutions.
Symbol: SCHW Exchange: NYSECurrent Price: $24.80Current Yield: N/ACurrent Dividend: N/AShares Outstanding (MM): 1,296Major Shareholders: Charles Schwab: 14.1%Average Daily Trading Volume (MM): 8.852-Week Price Range: $25.36-$14.00Price/Earnings Ratio: 35.4Stated Book Value Per Share: $7.76
INVESTMENT RESEARCH SUMMARY PRICED DECEMBER 12, 2013
- 8 -
Coach, Inc.
Balance Sheet Data Catalysts/Highlights
(in millions) 9/30/13 2012 2011 • Despite a slowdown in growth, COH continues to possess a strong market position, attractive margins, and solid cash flow.
• Recent sales weakness in North America has penalized share performance, serving to overshadow future growth opportunities.
• We believe COH is approaching an inflection point in terms of growth expectations and valuation, creating a very favorable risk/reward scenario for long-term investors.
Cash $ 855 $ 1,135 $ 917 Goodwill 373 345 376 TOTAL ASSETS $ 3,487 $ 3,532 $ 3,104 Long Term Debt $ 0 $ 1 $ 1 Shareholders Equity 2,379 2,409 1,993 TOTAL LIABILITIES AND SHAREHOLDERS EQUITY
$ 3,487 $ 3,532 $ 3,104
Fiscal Year Ending June 30
P&L Analysis ($ in millions except per share items)
2013 2012 2011 2010 Revenues 5,075 4,763 4,159 3,608 Net Income 1,034 1,039 881 735 Earnings Per Share 3.61 3.53 2.92 2.33 Dividends Per Share 1.24 0.98 0.68 0.38 Price Range 61.94-45.87 79.70-48.24 69.20-45.70 58.55-32.96
INVESTMENT RATIONALE
Coach Inc. is a well established provider of high-end accessories and gifts for men and women, such as leather handbags, travel accessories, shoes, watches, jewelry and other related items. Much of Coach’s notable track record has been characterized by robust growth and profitability. However, COH’s stock performance and operational trajectory have significantly moderated during more recent years due to investor concerns about slowing growth and increased competition in the North American market (69% of total sales). Although past growth rates are unlikely to be repeated (EBIT CAGRs over 20%), we believe the Company’s competitive position and future growth outlook are being overlooked. Moreover, the stock’s weak recent performance (down over 10% since early 2013) has created an opportunity to own an attractive business at a very reasonable price.
Just within the past 10-20 years, new competitors such as Kate Spade, Michael Kors, and Tory Burch have established themselves as successful operators within the U.S. market for luxury handbags and accessories. However, it is important to recognize that COH has faced its share of challenges in the past, and it has a record of successfully adapting to a changing environment. COH’s current strategy is designed to provide customers with innovative and unique products through its well established distribution channels (both direct and wholesale), that are consistent with COH’s well known market identity. The Company has an industry presence characterized by both a leading market share and global reach (about a third of sales are derived from overseas). The firm continues to hold #1 share in the U.S. luxury handbag market, and is the leading foreign firm in Japan.
Looking ahead, a combination of international opportunities and product line expansion will likely be the Company’s primary growth drivers. We would highlight the Asian market as an area of particular interest that will likely attract continued attention. The overall size of the market for premium handbags and accessories in Asia now stands at approximately $12 billion, and the growth rates in many of the region’s emerging markets remain in the double-digits.The Chinese market is an especially important growth driver, and COH has been building its presence there for several years. The number of COH stores in China has more than doubled since just FY 2010, and longer-term prospects in other emerging markets such as Latin America are also promising.
In addition, COH has expanded its product line to increasingly cater to male customers. This category is often underappreciated by investors. This segment is estimated to be a $5 billion market, and it is particularly prominent in overseas regions such as Asia and Europe, and is continuing to gain traction in North America. Overall demand growth for Men’s accessories is generally expected to remain in the double-digits for the foreseeable future. The Company’s global presence and overall reach is also enhanced by its growing e-commerce presence. E-commerce has been a growing distribution channel, with industry sales increasing 25% annually, creating a total market size of approximately $10 billion.
Despite a less robust growth profile, profitability at COH has remained impressive. Over the past 5 years, COH has achieved an average ROE of 49% (47% during FY13) with little or no leverage, while maintaining an operating margin of over 30%. The firm continues to hold a solid financial position, illustrated by its net cash position of over $850 million (about $3.00 per share). COH also generates a healthy level of cash flow; the Company’s annual free cash flow has exceeded $1 billion during recent years, and we expect at least $1 billion of annual free cash flow to be sustainable over the long-term (implying a free cash flow yield of over 6%). The firm returns capital to shareholders via a combination of dividends and opportunistic stock buybacks.
Barring a significant deterioration in overall economic conditions, we believe COH is approaching an inflection point in terms of growth expectations and valuation. In our view, the stock’s decline and corresponding reduction in future expectations have created an attractive risk/reward scenario for contrarian, long-term investors. Assuming the low end of COH’s historical valuation range (9.0x EV/EBITDA), and applying that to our projections for FY 2015 EBITDA produces an estimated intrinsic value of about $75 per share, suggesting total return potential of over 35% from the current price. Moreover, the firm’s well established brand and stellar financial profile could potentially attract private equity investors. In our view, either internal or external catalysts could eventually translate to an intrinsic value of at least $80-$90 per share over the long-term.
Symbol: COH Exchange: NYSECurrent Price: $55.52Current Yield: 2.4%Current Dividend: $1.35Shares Outstanding (MM): 284.5Major Shareholders: Insiders own 1%Average Daily Trading Volume (MM): 3,76652-Week Price Range: $61.94-$45.87Price/Earnings Ratio: 14.5xStated Book Value Per Share: $8.47

INVESTMENT RESEARCH SUMMARY PRICED DECEMBER 12, 2013
- 9 -
Comcast Corporation
Balance Sheet Data Catalysts/Highlights
(in millions) 9/30/2012 2012 2011 Roll out of entertainment platform X1 should be completed by year-end 2013 and should help increase customer loyalty and attract new customers
Accelerated share repurchases and higher dividends with leverage migrating to low end of range following NBCU transaction
Cash $ 5,735 $ 12,415 $ 1,674 Current Assets 13,407 19,991 8,573 TOTAL ASSETS $ 156,595 $ 164,791 $ 157,818
Current Liabilities $ 18,666 $ 16,714 $ 13,241 Long Term Debt 46,525 40,458 39,309
Shareholders Equity 50,134 49,796 47,274
TOTAL LIABILITIES AND SHAREHOLDERS EQUITY
$ 156,595 $ 164,971 $ 157,818
Fiscal Year Ending December 31
P&L Analysis ($ in millions except per share items)
2012 2011 2010 2009
Revenues 62,570 55,842 37,937 35,756
Net Income
6,203 4,160 3,635 3,638
Earnings Per Share 2.28 1.50 1.29 1.26
Dividends Per Share 0.65 0.45 0.378 0.297
Price Range 36.91-23.97 25.40-18.74 21.17-14.28 17.35-10.33
INVESTMENT RATIONALE
Comcast’s cable business (65% of consolidated revenues) continues to fire on all cylinders with revenues and operating cash flows increasing 5.2% and 6.2%, respectively, during 3Q 2013. The decline in video subs (loss of 129k subs vs. 117k loss in the year-ago quarter) was the only item to really quibble over. We would note that these subscriber losses are being more than offset by continued strength in higher margin products such as High-Speed Internet (297k vs. 287k) and voice customers (169k vs. 123k). As we have noted previously, growth in these non-video products has a favorable impact on profitability given the absence of programming expenses. In addition, Comcast continues to experience an increase in the number of customers (now 12.1 million) taking advanced services HD, DVRs, etc., with these subscribers representing 56% of CMCK’s video customer base. It is also worth noting the increased number of customers subscribing to at least two products now stands at 78%, up from 70% just two years ago (43% take all three vs. 36% 3 years ago). As a reminder, subscribers to multiple products tend to be more loyal and hence churn less. Another factor that should increase customer loyalty, and potentially aid in new customer growth is the Company’s X1 platform, which is an entertainment operating system platform. X1 had been deployed to over 90% of its footprint at 3Q 2013 and the Company expects the rollout to be complete by the end of 2013. Further, Comcast has noted that a number of MSOs have expressed interest in licensing the platform, which would create a whole new revenue stream for the Company.
In early 2013, Comcast completed the acquisition of GE’s remaining stake in NBC Universal (35% of revenues). We have previously expressed our enthusiasm for the deal, which was struck at an attractive valuation and on favorable terms. Comcast ended up acquiring the remaining stake about 5 years early given the future opportunities it continues to see with improving its business. The Company has significantly improved the profitability of the theme parks business with EBITDA for the division growing from ~$400 million (annually) at the time of the acquisition to ~$1 billion on a current run rate basis. Progress has been also made with the broadcast operations that are generating approximately $200 million in high-margin retransmission revenues, from virtually nothing when Comcast completed the acquisition. Perhaps a bigger opportunity is yet to come with improvement in the Cable Networks business (68% of NBCU EBITDA), where management has noted that there is a ~20%-25% monetization gap on the affiliate side (based on ratings of comparable cable networks). In addition, management believes that the NBCU’s portfolio of cable networks are also not being appropriately compensated in terms of advertising dollars given their strong ratings.
While returns to shareholders have been strong in recent years, including $8 billion in share repurchases since 2009 and a meaningful increase in the Company’s dividend (up ~2.5x to $0.78 a share: 1.7% yield), we would not be surprised if returns accelerated in the coming years. Comcast experienced a modest increase in leverage associated with the NBCU purchase (a majority of the purchase had been self-funded with NBCU’s cash flow), but leverage is now approaching Company’s targeted range of 2.0x. Barring Comcast acquiring Time Warner Cable outright (we believe there would be regulatory issues if this were to occur), we believe that the Company’s large and growing stream of free cash flow will be increasingly returned to shareholders via higher dividends and share buybacks. We note that the Company’s payout ratio in the low 30% range provides plenty of room for further increases.
We believe that investors are applying a conglomerate discount to Comcast and not ascribing an appropriate multiple for its first rate cable properties and attractive portfolio of content assets with good growth opportunities. Our estimate of Comcast’s intrinsic value is $64 a share, which is derived by applying an 8x and 10x multiple to our estimates of 2015E EBITDA for the Cable and NBCU segments, respectively. In our view, the multiples we have applied are conservative and represent a discount to industry precedent transactions. We believe that further upside is possible and could be achieved if Comcast is able to participate in the latest rumored cable industry consolidation or a greater than expected improvement in NBCU’s performance.
Symbol: CMCSK/CMCSA
Exchange: NASDAQ Current Price: $47.22 Current Yield: 1.7% Current Dividend: $0.78 Shares Outstanding (MM): 2,658 Major Shareholders: Brian Roberts: 33% voting
Average Daily Trading Volume (MM): 1.9 52-Week Price Range: $48.78-$34.95 Price/Earnings Ratio: 19.7x Stated Book Value Per Share: $18.86
INVESTMENT RESEARCH SUMMARY PRICED DECEMBER 12, 2013
- 10 -
Constellation Brands, Inc.
Balance Sheet Data Catalysts/Highlights
(in millions) 8/31/2013 2/28/2013 2/29/2012 • Transformative June 2013 transaction obtained perpetual rights to Grupo Modelo’s brands in the U.S. (includes Corona beer) and a Mexican brewery
• Beer operating margin expansion due to vertical integration
• Beer and Wine product line-ups well positioned due to demographic trends
• Focus on faster growing and more profitable premium wines & spirits brands
Cash $ 117 $ 332 $ 86 Current Assets 2,670 2,471 2,034 TOTAL ASSETS $ 14,123 $ 7,638 $ 7,110 Current Liabilities $ 1,811 $ 678 $ 1,200 Long Term Debt 7,028 3,305 2,752 Shareholders Equity 4,510 2,860 2,676 TOTAL LIABILITIES AND SHAREHOLDERS EQUITY
$ 14,123 $ 7,638 $ 7,110
Fiscal Year Ending
P&L Analysis ($ in millions except per share items)
2/28/2013 2/29/2012 2/28/2011 2/28/2010 Revenues 2,796 2,654 3,332 3,365 Net Income 388 445 560 99 Earnings Per Share 2.04 2.13 2.62 0.45 Dividends Per Share N/A N/A N/A N/A Price Range 23.19-16.42 22.52-14.97 17.56-10.72 23.48-10.66
INVESTMENT RATIONALE
Constellation Brands is an international producer and marketer of wine, beer and distilled spirits. The Company’s well known brands include Clos du Bois, Estancia, Robert Mondavi, SVEDKA Vodka and Black Velvet Canadian Whisky. Constellation is also the exclusive US distributor and marketer of Grupo Modelo’s beer brands, which include Corona and Modelo Especial. STZ has two operating segments: beer, and wine & spirits. On a pro-forma basis due to the recent transaction with Anheuser-Busch InBev (BUD), the Company estimates the beer segment generated 48% of sales and 53% of operating profit, with wine & spirits responsible for 52% and 47%, respectively.
In June 2013, Constellation completed a transformational deal with BUD to acquire the remaining 50% interest in their Crown Imports joint venture that it did not own. Constellation also acquired a Mexican brewery and the perpetual rights to market and distribute Modelo’s beer brands in the U.S. These transactions were necessary for BUD to gain US anti-trust approval to complete their acquisition of Grupo Modelo, which resulted in a favorable blended purchase price of $4.75 billion (principally financed with debt) or ~9x EBITDA compared to the current market valuation range of ~11x-22x EBITDA for publicly-traded beer competitors.
Over the next few years, Constellation will become a standalone vertical beer operation as the purchased state-of-the-art Mexican brewery is undergoing an extensive expansion, which will eventually result in the Company being able to produce all of its beer needs. Due to the efficiencies of the brewery and its proximity to the U.S. versus previous production sites (saving transportation costs), we expect the beer segment operating margin to rise from under 30% to ~35% during FY 2017.
Due to steady growth, Crown is currently the 3rd largest beer company in the U.S. and a U.S. imported beer market leader with a 49% share. While total US beer consumption is flat to down over the past 10 years, Crown has continued to grow except for the recession years of 2008/2009. We believe its sales momentum will continue as the Modelo Especial brand continues its strong growth (over 20% in 2012 with only 65% of the availability of Corona), new brands and brand extensions are introduced (STZ obtained the rights to develop brand extensions with the BUD deal) and its high brand popularity continues with Hispanic consumers-the fastest growing segment of the U.S. population.
The Company’s wine & spirits segment is also well-positioned for growth. Unlike beer, wine sales have shown steady growth in the U.S., expanding at a 3% CAGR over the past 10 years. While many studies and data confirm a shift from U.S. beer consumption to wine, the outlook for wine sales is further enhanced by the growth in consumption by younger generations that should help sustain the momentum. In 2009, the Company divested a number of low-growth, low-margin wine & spirit brands to focus on the high-margin premium segment. These “focus brands” provide ~70% of the segment’s profitability and grew at nearly twice the industry growth rate in FY 2013 (ends 02/28/2014). Recently, Constellation consolidated its U.S. distribution network resulting in exclusivity for some key distribution partners, and introduced incentives for distributors to grow sales faster than the industry. We also believe the Company will continue to actively manage its wine & spirits portfolio as it has done in the past, however, the BUD transaction and related debt-load should limit the Company’s acquisition capabilities over the next couple of years.
While Constellation currently carries a significant net debt load (~$7.2 billion as of August 31, 2013), we estimate that net debt/EBITDA would have been ~4.5x utilizing our estimated pro-forma for 2014 EBITDA (assumes a full year of the acquisition versus 9 actual months). Assuming the Company concentrates on using free cash flow for deleveraging, we estimate that net debt/EBITDA will return to under 4.0x by the end of fiscal 2015 and within the Company’s targeted leverage ratio range of 3.0x-4.0x.
From a valuation perspective, we utilized a sum-of-the-parts analysis to derive our estimate of intrinsic value for Constellation Brands. We utilized our FY 2017E EBITDA (year ending February 2017) for our valuation as we believe this represents the first year of fully realized benefits of the BUD transaction. We believe the Company deserves a premium valuation due to its strong position in premium wines & spirits, its attractive fast growing beer brands and its strong cash flow generating capability. Nevertheless, we conservatively valued the Company at or below the low end of the valuation ranges of its publicly traded competitors by applying an 11.0x multiple to our fiscal 2017E EBITDA for the beer segment and utilizing a 12.0x multiple to our fiscal 2017E EBITDA for the wine & spirits segment. Our estimate of intrinsic value per share for Constellation Brands is approximately $83.25, implying roughly 20% upside from current price levels.
Symbol: STZ Exchange: NYSECurrent Price: $70.09Current Yield: N/ACurrent Dividend: NilShares Outstanding (MM): 196.8Major Shareholders: Sands Family-16% econ, 59% votingAverage Daily Trading Volume (MM): 1.652-Week Price Range: $71.62-$28.37Price/Earnings Ratio: 18.5Stated Book Value Per Share: $23.84
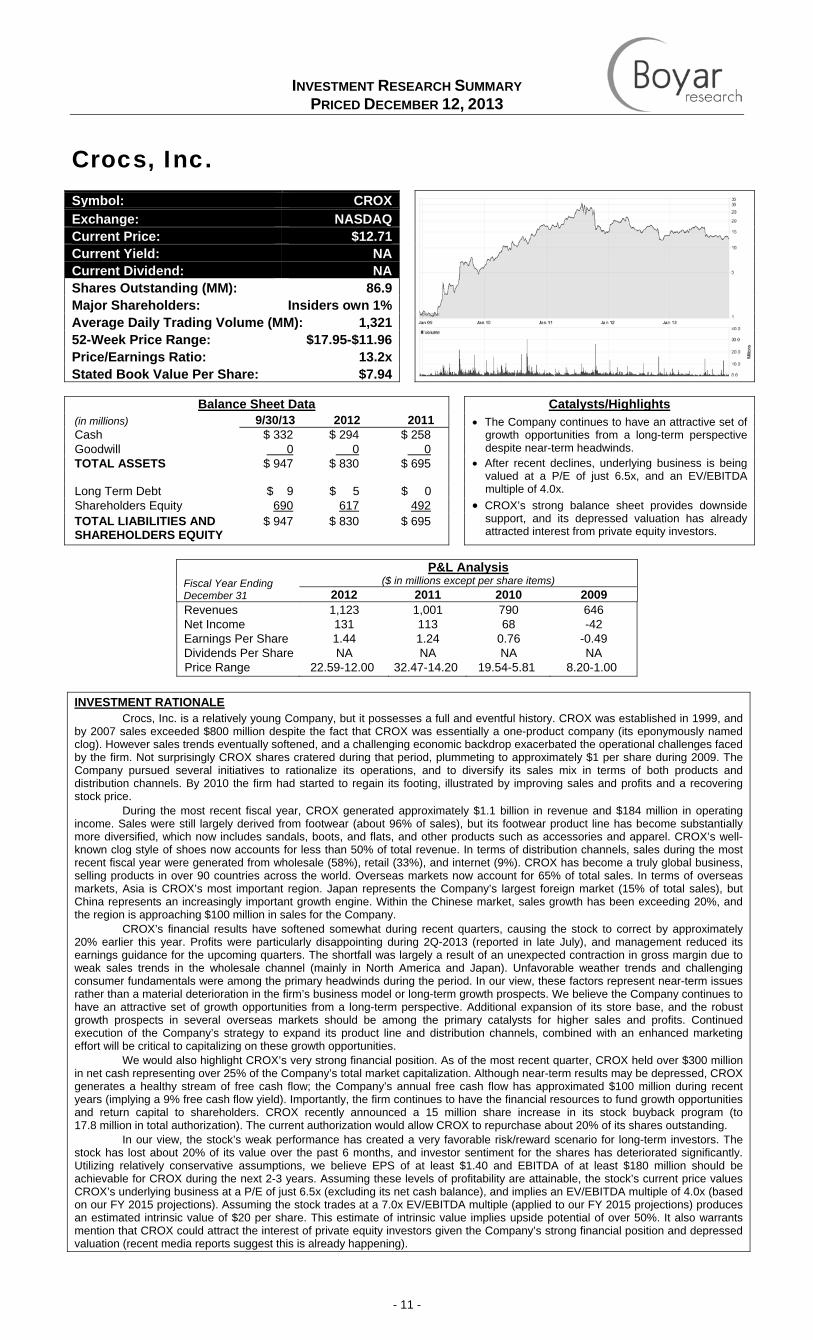
INVESTMENT RESEARCH SUMMARY PRICED DECEMBER 12, 2013
- 11 -
Crocs, Inc.
Balance Sheet Data Catalysts/Highlights
(in millions) 9/30/13 2012 2011 • The Company continues to have an attractive set of growth opportunities from a long-term perspective despite near-term headwinds.
• After recent declines, underlying business is being valued at a P/E of just 6.5x, and an EV/EBITDA multiple of 4.0x.
• CROX’s strong balance sheet provides downside support, and its depressed valuation has already attracted interest from private equity investors.
Cash $ 332 $ 294 $ 258 Goodwill 0 0 0 TOTAL ASSETS $ 947 $ 830 $ 695 Long Term Debt $ 9 $ 5 $ 0 Shareholders Equity 690 617 492 TOTAL LIABILITIES AND SHAREHOLDERS EQUITY
$ 947 $ 830 $ 695
Fiscal Year Ending December 31
P&L Analysis ($ in millions except per share items)
2012 2011 2010 2009 Revenues 1,123 1,001 790 646 Net Income 131 113 68 -42 Earnings Per Share 1.44 1.24 0.76 -0.49 Dividends Per Share NA NA NA NA Price Range 22.59-12.00 32.47-14.20 19.54-5.81 8.20-1.00
INVESTMENT RATIONALE
Crocs, Inc. is a relatively young Company, but it possesses a full and eventful history. CROX was established in 1999, and by 2007 sales exceeded $800 million despite the fact that CROX was essentially a one-product company (its eponymously named clog). However sales trends eventually softened, and a challenging economic backdrop exacerbated the operational challenges faced by the firm. Not surprisingly CROX shares cratered during that period, plummeting to approximately $1 per share during 2009. The Company pursued several initiatives to rationalize its operations, and to diversify its sales mix in terms of both products and distribution channels. By 2010 the firm had started to regain its footing, illustrated by improving sales and profits and a recovering stock price.
During the most recent fiscal year, CROX generated approximately $1.1 billion in revenue and $184 million in operating income. Sales were still largely derived from footwear (about 96% of sales), but its footwear product line has become substantially more diversified, which now includes sandals, boots, and flats, and other products such as accessories and apparel. CROX’s well-known clog style of shoes now accounts for less than 50% of total revenue. In terms of distribution channels, sales during the most recent fiscal year were generated from wholesale (58%), retail (33%), and internet (9%). CROX has become a truly global business, selling products in over 90 countries across the world. Overseas markets now account for 65% of total sales. In terms of overseas markets, Asia is CROX’s most important region. Japan represents the Company’s largest foreign market (15% of total sales), but China represents an increasingly important growth engine. Within the Chinese market, sales growth has been exceeding 20%, and the region is approaching $100 million in sales for the Company.
CROX’s financial results have softened somewhat during recent quarters, causing the stock to correct by approximately 20% earlier this year. Profits were particularly disappointing during 2Q-2013 (reported in late July), and management reduced its earnings guidance for the upcoming quarters. The shortfall was largely a result of an unexpected contraction in gross margin due to weak sales trends in the wholesale channel (mainly in North America and Japan). Unfavorable weather trends and challenging consumer fundamentals were among the primary headwinds during the period. In our view, these factors represent near-term issues rather than a material deterioration in the firm’s business model or long-term growth prospects. We believe the Company continues to have an attractive set of growth opportunities from a long-term perspective. Additional expansion of its store base, and the robust growth prospects in several overseas markets should be among the primary catalysts for higher sales and profits. Continued execution of the Company’s strategy to expand its product line and distribution channels, combined with an enhanced marketing effort will be critical to capitalizing on these growth opportunities.
We would also highlight CROX’s very strong financial position. As of the most recent quarter, CROX held over $300 million in net cash representing over 25% of the Company’s total market capitalization. Although near-term results may be depressed, CROX generates a healthy stream of free cash flow; the Company’s annual free cash flow has approximated $100 million during recent years (implying a 9% free cash flow yield). Importantly, the firm continues to have the financial resources to fund growth opportunities and return capital to shareholders. CROX recently announced a 15 million share increase in its stock buyback program (to 17.8 million in total authorization). The current authorization would allow CROX to repurchase about 20% of its shares outstanding.
In our view, the stock’s weak performance has created a very favorable risk/reward scenario for long-term investors. The stock has lost about 20% of its value over the past 6 months, and investor sentiment for the shares has deteriorated significantly. Utilizing relatively conservative assumptions, we believe EPS of at least $1.40 and EBITDA of at least $180 million should be achievable for CROX during the next 2-3 years. Assuming these levels of profitability are attainable, the stock’s current price values CROX’s underlying business at a P/E of just 6.5x (excluding its net cash balance), and implies an EV/EBITDA multiple of 4.0x (based on our FY 2015 projections). Assuming the stock trades at a 7.0x EV/EBITDA multiple (applied to our FY 2015 projections) produces an estimated intrinsic value of $20 per share. This estimate of intrinsic value implies upside potential of over 50%. It also warrants mention that CROX could attract the interest of private equity investors given the Company’s strong financial position and depressed valuation (recent media reports suggest this is already happening).
Symbol: CROX Exchange: NASDAQCurrent Price: $12.71Current Yield: NACurrent Dividend: NAShares Outstanding (MM): 86.9Major Shareholders: Insiders own 1%Average Daily Trading Volume (MM): 1,32152-Week Price Range: $17.95-$11.96Price/Earnings Ratio: 13.2xStated Book Value Per Share: $7.94
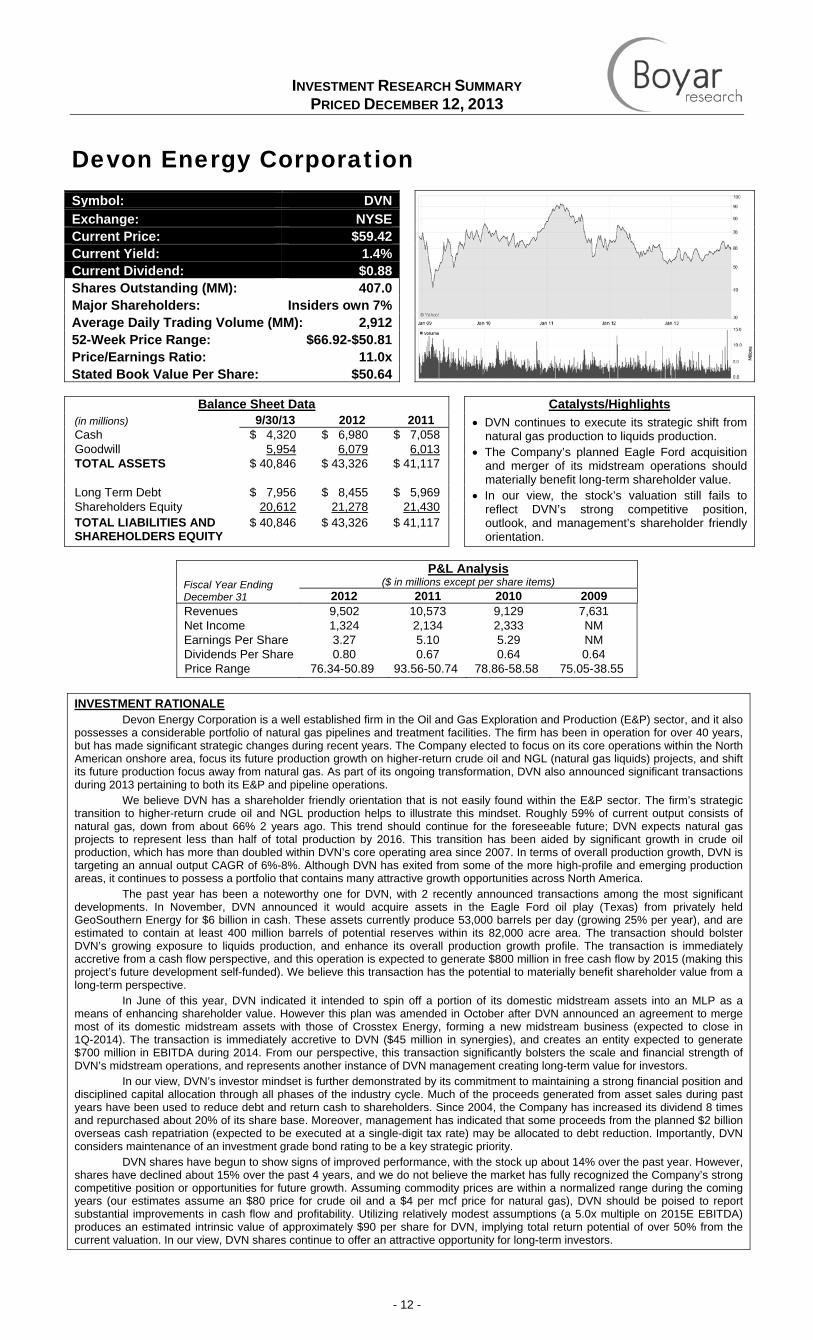
INVESTMENT RESEARCH SUMMARY PRICED DECEMBER 12, 2013
- 12 -
Devon Energy Corporation
Balance Sheet Data Catalysts/Highlights
(in millions) 9/30/13 2012 2011 • DVN continues to execute its strategic shift from natural gas production to liquids production.
• The Company’s planned Eagle Ford acquisition and merger of its midstream operations should materially benefit long-term shareholder value.
• In our view, the stock’s valuation still fails to reflect DVN’s strong competitive position, outlook, and management’s shareholder friendly orientation.
Cash $ 4,320 $ 6,980 $ 7,058 Goodwill 5,954 6,079 6,013 TOTAL ASSETS $ 40,846 $ 43,326 $ 41,117 Long Term Debt $ 7,956 $ 8,455 $ 5,969 Shareholders Equity 20,612 21,278 21,430 TOTAL LIABILITIES AND SHAREHOLDERS EQUITY
$ 40,846 $ 43,326 $ 41,117
Fiscal Year Ending December 31
P&L Analysis ($ in millions except per share items)
2012 2011 2010 2009 Revenues 9,502 10,573 9,129 7,631 Net Income 1,324 2,134 2,333 NM Earnings Per Share 3.27 5.10 5.29 NM Dividends Per Share 0.80 0.67 0.64 0.64 Price Range 76.34-50.89 93.56-50.74 78.86-58.58 75.05-38.55
INVESTMENT RATIONALE
Devon Energy Corporation is a well established firm in the Oil and Gas Exploration and Production (E&P) sector, and it also possesses a considerable portfolio of natural gas pipelines and treatment facilities. The firm has been in operation for over 40 years, but has made significant strategic changes during recent years. The Company elected to focus on its core operations within the North American onshore area, focus its future production growth on higher-return crude oil and NGL (natural gas liquids) projects, and shift its future production focus away from natural gas. As part of its ongoing transformation, DVN also announced significant transactions during 2013 pertaining to both its E&P and pipeline operations.
We believe DVN has a shareholder friendly orientation that is not easily found within the E&P sector. The firm’s strategic transition to higher-return crude oil and NGL production helps to illustrate this mindset. Roughly 59% of current output consists of natural gas, down from about 66% 2 years ago. This trend should continue for the foreseeable future; DVN expects natural gas projects to represent less than half of total production by 2016. This transition has been aided by significant growth in crude oil production, which has more than doubled within DVN’s core operating area since 2007. In terms of overall production growth, DVN is targeting an annual output CAGR of 6%-8%. Although DVN has exited from some of the more high-profile and emerging production areas, it continues to possess a portfolio that contains many attractive growth opportunities across North America.
The past year has been a noteworthy one for DVN, with 2 recently announced transactions among the most significant developments. In November, DVN announced it would acquire assets in the Eagle Ford oil play (Texas) from privately held GeoSouthern Energy for $6 billion in cash. These assets currently produce 53,000 barrels per day (growing 25% per year), and are estimated to contain at least 400 million barrels of potential reserves within its 82,000 acre area. The transaction should bolster DVN’s growing exposure to liquids production, and enhance its overall production growth profile. The transaction is immediately accretive from a cash flow perspective, and this operation is expected to generate $800 million in free cash flow by 2015 (making this project’s future development self-funded). We believe this transaction has the potential to materially benefit shareholder value from a long-term perspective.
In June of this year, DVN indicated it intended to spin off a portion of its domestic midstream assets into an MLP as a means of enhancing shareholder value. However this plan was amended in October after DVN announced an agreement to merge most of its domestic midstream assets with those of Crosstex Energy, forming a new midstream business (expected to close in 1Q-2014). The transaction is immediately accretive to DVN ($45 million in synergies), and creates an entity expected to generate $700 million in EBITDA during 2014. From our perspective, this transaction significantly bolsters the scale and financial strength of DVN’s midstream operations, and represents another instance of DVN management creating long-term value for investors.
In our view, DVN’s investor mindset is further demonstrated by its commitment to maintaining a strong financial position and disciplined capital allocation through all phases of the industry cycle. Much of the proceeds generated from asset sales during past years have been used to reduce debt and return cash to shareholders. Since 2004, the Company has increased its dividend 8 times and repurchased about 20% of its share base. Moreover, management has indicated that some proceeds from the planned $2 billion overseas cash repatriation (expected to be executed at a single-digit tax rate) may be allocated to debt reduction. Importantly, DVN considers maintenance of an investment grade bond rating to be a key strategic priority.
DVN shares have begun to show signs of improved performance, with the stock up about 14% over the past year. However, shares have declined about 15% over the past 4 years, and we do not believe the market has fully recognized the Company’s strong competitive position or opportunities for future growth. Assuming commodity prices are within a normalized range during the coming years (our estimates assume an $80 price for crude oil and a $4 per mcf price for natural gas), DVN should be poised to report substantial improvements in cash flow and profitability. Utilizing relatively modest assumptions (a 5.0x multiple on 2015E EBITDA) produces an estimated intrinsic value of approximately $90 per share for DVN, implying total return potential of over 50% from the current valuation. In our view, DVN shares continue to offer an attractive opportunity for long-term investors.
Symbol: DVN Exchange: NYSECurrent Price: $59.42Current Yield: 1.4%Current Dividend: $0.88Shares Outstanding (MM): 407.0Major Shareholders: Insiders own 7%Average Daily Trading Volume (MM): 2,91252-Week Price Range: $66.92-$50.81Price/Earnings Ratio: 11.0xStated Book Value Per Share: $50.64
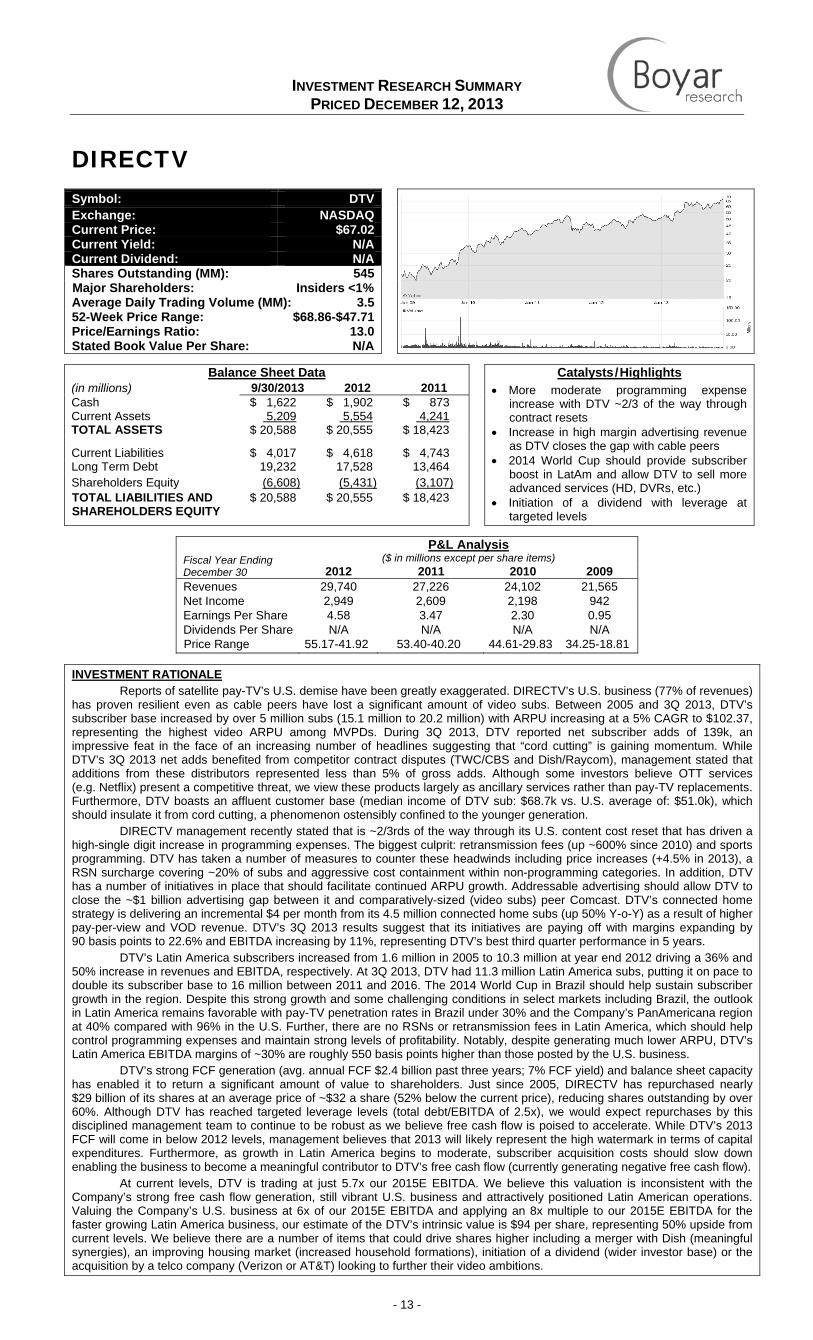
INVESTMENT RESEARCH SUMMARY PRICED DECEMBER 12, 2013
- 13 -
DIRECTV
Balance Sheet Data Catalysts/Highlights
(in millions) 9/30/2013 2012 2011 • More moderate programming expense increase with DTV ~2/3 of the way through contract resets
• Increase in high margin advertising revenue as DTV closes the gap with cable peers
• 2014 World Cup should provide subscriber boost in LatAm and allow DTV to sell more advanced services (HD, DVRs, etc.)
• Initiation of a dividend with leverage at targeted levels
Cash $ 1,622 $ 1,902 $ 873 Current Assets 5,209 5,554 4,241 TOTAL ASSETS $ 20,588 $ 20,555 $ 18,423 Current Liabilities $ 4,017 $ 4,618 $ 4,743 Long Term Debt 19,232 17,528 13,464 Shareholders Equity (6,608) (5,431) (3,107) TOTAL LIABILITIES AND SHAREHOLDERS EQUITY
$ 20,588 $ 20,555 $ 18,423
Fiscal Year Ending December 30
P&L Analysis ($ in millions except per share items)
2012 2011 2010 2009 Revenues 29,740 27,226 24,102 21,565 Net Income 2,949 2,609 2,198 942 Earnings Per Share 4.58 3.47 2.30 0.95 Dividends Per Share N/A N/A N/A N/A Price Range 55.17-41.92 53.40-40.20 44.61-29.83 34.25-18.81
INVESTMENT RATIONALE Reports of satellite pay-TV’s U.S. demise have been greatly exaggerated. DIRECTV’s U.S. business (77% of revenues)
has proven resilient even as cable peers have lost a significant amount of video subs. Between 2005 and 3Q 2013, DTV’s subscriber base increased by over 5 million subs (15.1 million to 20.2 million) with ARPU increasing at a 5% CAGR to $102.37, representing the highest video ARPU among MVPDs. During 3Q 2013, DTV reported net subscriber adds of 139k, an impressive feat in the face of an increasing number of headlines suggesting that “cord cutting” is gaining momentum. While DTV’s 3Q 2013 net adds benefited from competitor contract disputes (TWC/CBS and Dish/Raycom), management stated that additions from these distributors represented less than 5% of gross adds. Although some investors believe OTT services (e.g. Netflix) present a competitive threat, we view these products largely as ancillary services rather than pay-TV replacements. Furthermore, DTV boasts an affluent customer base (median income of DTV sub: $68.7k vs. U.S. average of: $51.0k), which should insulate it from cord cutting, a phenomenon ostensibly confined to the younger generation.
DIRECTV management recently stated that is ~2/3rds of the way through its U.S. content cost reset that has driven a high-single digit increase in programming expenses. The biggest culprit: retransmission fees (up ~600% since 2010) and sports programming. DTV has taken a number of measures to counter these headwinds including price increases (+4.5% in 2013), a RSN surcharge covering ~20% of subs and aggressive cost containment within non-programming categories. In addition, DTV has a number of initiatives in place that should facilitate continued ARPU growth. Addressable advertising should allow DTV to close the ~$1 billion advertising gap between it and comparatively-sized (video subs) peer Comcast. DTV’s connected home strategy is delivering an incremental $4 per month from its 4.5 million connected home subs (up 50% Y-o-Y) as a result of higher pay-per-view and VOD revenue. DTV’s 3Q 2013 results suggest that its initiatives are paying off with margins expanding by 90 basis points to 22.6% and EBITDA increasing by 11%, representing DTV’s best third quarter performance in 5 years.
DTV’s Latin America subscribers increased from 1.6 million in 2005 to 10.3 million at year end 2012 driving a 36% and 50% increase in revenues and EBITDA, respectively. At 3Q 2013, DTV had 11.3 million Latin America subs, putting it on pace to double its subscriber base to 16 million between 2011 and 2016. The 2014 World Cup in Brazil should help sustain subscriber growth in the region. Despite this strong growth and some challenging conditions in select markets including Brazil, the outlook in Latin America remains favorable with pay-TV penetration rates in Brazil under 30% and the Company’s PanAmericana region at 40% compared with 96% in the U.S. Further, there are no RSNs or retransmission fees in Latin America, which should help control programming expenses and maintain strong levels of profitability. Notably, despite generating much lower ARPU, DTV’s Latin America EBITDA margins of ~30% are roughly 550 basis points higher than those posted by the U.S. business.
DTV’s strong FCF generation (avg. annual FCF $2.4 billion past three years; 7% FCF yield) and balance sheet capacity has enabled it to return a significant amount of value to shareholders. Just since 2005, DIRECTV has repurchased nearly $29 billion of its shares at an average price of ~$32 a share (52% below the current price), reducing shares outstanding by over 60%. Although DTV has reached targeted leverage levels (total debt/EBITDA of 2.5x), we would expect repurchases by this disciplined management team to continue to be robust as we believe free cash flow is poised to accelerate. While DTV’s 2013 FCF will come in below 2012 levels, management believes that 2013 will likely represent the high watermark in terms of capital expenditures. Furthermore, as growth in Latin America begins to moderate, subscriber acquisition costs should slow down enabling the business to become a meaningful contributor to DTV’s free cash flow (currently generating negative free cash flow).
At current levels, DTV is trading at just 5.7x our 2015E EBITDA. We believe this valuation is inconsistent with the Company’s strong free cash flow generation, still vibrant U.S. business and attractively positioned Latin American operations. Valuing the Company’s U.S. business at 6x of our 2015E EBITDA and applying an 8x multiple to our 2015E EBITDA for the faster growing Latin America business, our estimate of the DTV’s intrinsic value is $94 per share, representing 50% upside from current levels. We believe there are a number of items that could drive shares higher including a merger with Dish (meaningful synergies), an improving housing market (increased household formations), initiation of a dividend (wider investor base) or the acquisition by a telco company (Verizon or AT&T) looking to further their video ambitions.
Symbol: DTV Exchange: NASDAQCurrent Price: $67.02Current Yield: N/ACurrent Dividend: N/AShares Outstanding (MM): 545Major Shareholders: Insiders <1% Average Daily Trading Volume (MM): 3.552-Week Price Range: $68.86-$47.71Price/Earnings Ratio: 13.0Stated Book Value Per Share: N/A
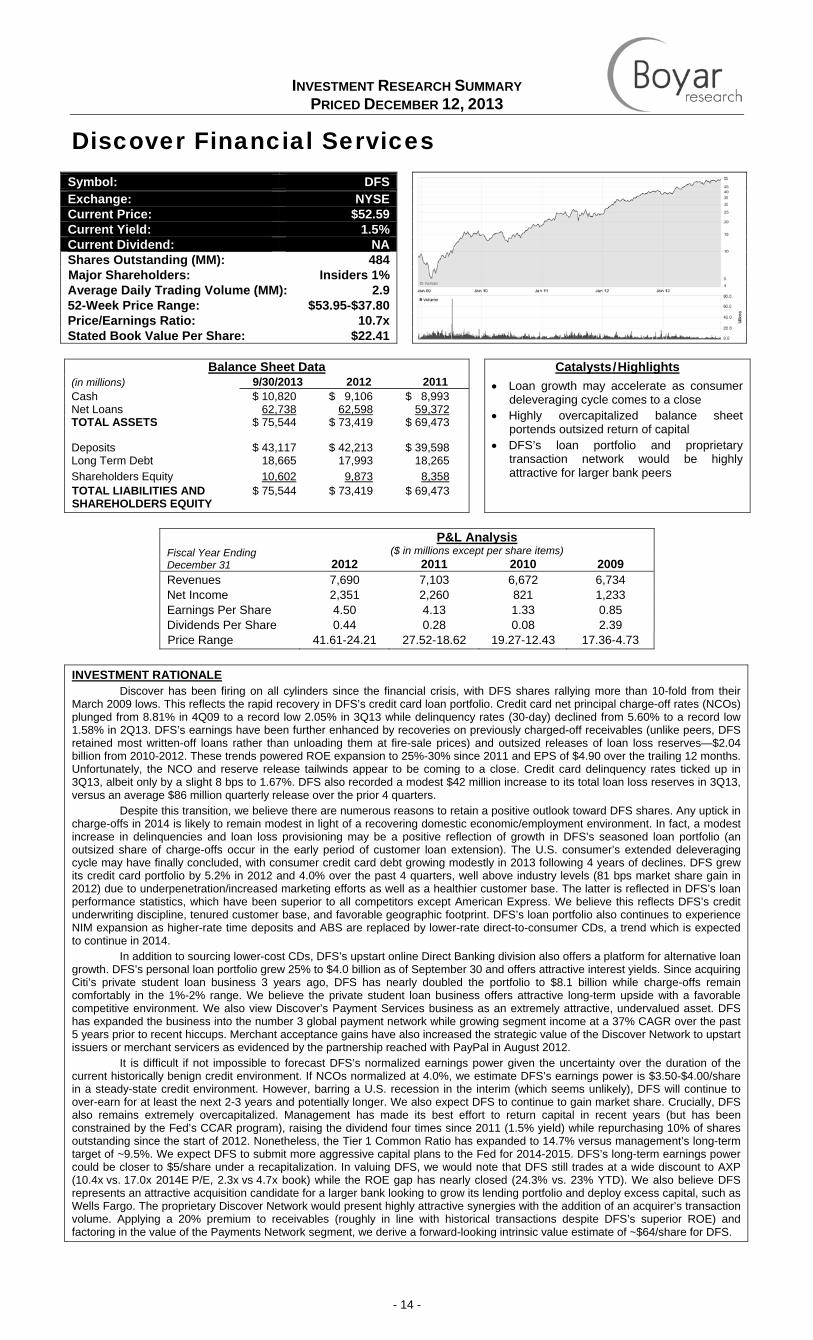
INVESTMENT RESEARCH SUMMARY PRICED DECEMBER 12, 2013
- 14 -
Discover Financial Services
Balance Sheet Data Catalysts/Highlights
(in millions) 9/30/2013 2012 2011 • Loan growth may accelerate as consumer deleveraging cycle comes to a close
• Highly overcapitalized balance sheet portends outsized return of capital
• DFS’s loan portfolio and proprietary transaction network would be highly attractive for larger bank peers
Cash $ 10,820 $ 9,106 $ 8,993 Net Loans 62,738 62,598 59,372 TOTAL ASSETS $ 75,544 $ 73,419 $ 69,473 Deposits $ 43,117 $ 42,213 $ 39,598 Long Term Debt 18,665 17,993 18,265 Shareholders Equity 10,602 9,873 8,358 TOTAL LIABILITIES AND SHAREHOLDERS EQUITY
$ 75,544 $ 73,419 $ 69,473
Fiscal Year Ending December 31
P&L Analysis ($ in millions except per share items)
2012 2011 2010 2009 Revenues 7,690 7,103 6,672 6,734 Net Income 2,351 2,260 821 1,233 Earnings Per Share 4.50 4.13 1.33 0.85 Dividends Per Share 0.44 0.28 0.08 2.39 Price Range 41.61-24.21 27.52-18.62 19.27-12.43 17.36-4.73
INVESTMENT RATIONALE
Discover has been firing on all cylinders since the financial crisis, with DFS shares rallying more than 10-fold from their March 2009 lows. This reflects the rapid recovery in DFS’s credit card loan portfolio. Credit card net principal charge-off rates (NCOs) plunged from 8.81% in 4Q09 to a record low 2.05% in 3Q13 while delinquency rates (30-day) declined from 5.60% to a record low 1.58% in 2Q13. DFS’s earnings have been further enhanced by recoveries on previously charged-off receivables (unlike peers, DFS retained most written-off loans rather than unloading them at fire-sale prices) and outsized releases of loan loss reserves—$2.04 billion from 2010-2012. These trends powered ROE expansion to 25%-30% since 2011 and EPS of $4.90 over the trailing 12 months. Unfortunately, the NCO and reserve release tailwinds appear to be coming to a close. Credit card delinquency rates ticked up in 3Q13, albeit only by a slight 8 bps to 1.67%. DFS also recorded a modest $42 million increase to its total loan loss reserves in 3Q13, versus an average $86 million quarterly release over the prior 4 quarters.
Despite this transition, we believe there are numerous reasons to retain a positive outlook toward DFS shares. Any uptick in charge-offs in 2014 is likely to remain modest in light of a recovering domestic economic/employment environment. In fact, a modest increase in delinquencies and loan loss provisioning may be a positive reflection of growth in DFS’s seasoned loan portfolio (an outsized share of charge-offs occur in the early period of customer loan extension). The U.S. consumer’s extended deleveraging cycle may have finally concluded, with consumer credit card debt growing modestly in 2013 following 4 years of declines. DFS grew its credit card portfolio by 5.2% in 2012 and 4.0% over the past 4 quarters, well above industry levels (81 bps market share gain in 2012) due to underpenetration/increased marketing efforts as well as a healthier customer base. The latter is reflected in DFS’s loan performance statistics, which have been superior to all competitors except American Express. We believe this reflects DFS’s credit underwriting discipline, tenured customer base, and favorable geographic footprint. DFS’s loan portfolio also continues to experience NIM expansion as higher-rate time deposits and ABS are replaced by lower-rate direct-to-consumer CDs, a trend which is expected to continue in 2014.
In addition to sourcing lower-cost CDs, DFS’s upstart online Direct Banking division also offers a platform for alternative loan growth. DFS’s personal loan portfolio grew 25% to $4.0 billion as of September 30 and offers attractive interest yields. Since acquiring Citi’s private student loan business 3 years ago, DFS has nearly doubled the portfolio to $8.1 billion while charge-offs remain comfortably in the 1%-2% range. We believe the private student loan business offers attractive long-term upside with a favorable competitive environment. We also view Discover’s Payment Services business as an extremely attractive, undervalued asset. DFS has expanded the business into the number 3 global payment network while growing segment income at a 37% CAGR over the past 5 years prior to recent hiccups. Merchant acceptance gains have also increased the strategic value of the Discover Network to upstart issuers or merchant servicers as evidenced by the partnership reached with PayPal in August 2012.
It is difficult if not impossible to forecast DFS’s normalized earnings power given the uncertainty over the duration of the current historically benign credit environment. If NCOs normalized at 4.0%, we estimate DFS’s earnings power is $3.50-$4.00/share in a steady-state credit environment. However, barring a U.S. recession in the interim (which seems unlikely), DFS will continue to over-earn for at least the next 2-3 years and potentially longer. We also expect DFS to continue to gain market share. Crucially, DFS also remains extremely overcapitalized. Management has made its best effort to return capital in recent years (but has been constrained by the Fed’s CCAR program), raising the dividend four times since 2011 (1.5% yield) while repurchasing 10% of shares outstanding since the start of 2012. Nonetheless, the Tier 1 Common Ratio has expanded to 14.7% versus management’s long-term target of ~9.5%. We expect DFS to submit more aggressive capital plans to the Fed for 2014-2015. DFS’s long-term earnings power could be closer to $5/share under a recapitalization. In valuing DFS, we would note that DFS still trades at a wide discount to AXP (10.4x vs. 17.0x 2014E P/E, 2.3x vs 4.7x book) while the ROE gap has nearly closed (24.3% vs. 23% YTD). We also believe DFS represents an attractive acquisition candidate for a larger bank looking to grow its lending portfolio and deploy excess capital, such as Wells Fargo. The proprietary Discover Network would present highly attractive synergies with the addition of an acquirer’s transaction volume. Applying a 20% premium to receivables (roughly in line with historical transactions despite DFS’s superior ROE) and factoring in the value of the Payments Network segment, we derive a forward-looking intrinsic value estimate of ~$64/share for DFS.
Symbol: DFS Exchange: NYSECurrent Price: $52.59Current Yield: 1.5%Current Dividend: NAShares Outstanding (MM): 484Major Shareholders: Insiders 1% Average Daily Trading Volume (MM): 2.952-Week Price Range: $53.95-$37.80Price/Earnings Ratio: 10.7xStated Book Value Per Share: $22.41

INVESTMENT RESEARCH SUMMARY PRICED DECEMBER 12, 2013
- 15 -
Hanesbrands Inc.
Balance Sheet Data Catalysts/Highlights
(in millions) 9/30/13 2012 2011 Realization of synergies from recently completed Maidenform Brands acquisition
Increased returns to shareholders via dividends and share buybacks with leverage within targeted range
Ongoing beneficiary of low cost supply chain, new product introductions, lower commodity prices which should continue to aid profitability and FCF generation
Cash $ 132 $ 43 $ 35
Current Assets 2,257 2,028 2,331
TOTAL ASSETS $ 3,835 $ 3,632 $ 4,035
Current Liabilities $ 914 $ 876 $ 934
Long Term Debt 1,250 1,318 1,808
Shareholders Equity 1,152 887 681
TOTAL LIABILITIES AND SHAREHOLDERS EQUITY
$ 3,835 $ 3,632 $ 4,035
Fiscal Year Ending December 31
P&L Analysis ($ in millions except per share items)
2012 2011 2010 2009
Revenues 4,526 4,434 4,146 3,746
Net Income 165 267 211 51
Earnings Per Share 2.32 2.44 1.97 0.45
Dividends Per Share NA NA NA NA
Price Range 37.04-21.96 33.36-21.74 31.45-20.95 26.61-5.14
INVESTMENT RATIONALE
Hanesbrands was one of the top performers (+87%) in last year’s Forgotten Forty. Despite the strong performance, we believe that there are a number of factors that support its inclusion again. HBI’s valuation remains attractive with shares currently trading at a reasonable 13x this year’s projected FCF. In addition, we see a number of near-term catalysts including ongoing benefits as HBI leverages its new low-cost global supply chain, realization of synergies from the recent acquisition of Maidenform Brands (MB), further traction with innovative new products, an improved commodity price environment, and the prospect for not only increased, but outsized, returns to shareholders with leverage at targeted levels.
HBI’s results are just now starting to reflect the benefits of its low cost global supply chain, created subsequent to its 2006 spinoff. While elevated cotton costs masked HBI’s progress in recent years, the retreat of cotton costs (average cotton costs in 2Q 2013 were $0.93 vs. $1.84 in the year-ago quarter) has enabled the HBI’s profitability to expand markedly even in the face of a still-challenging U.S. retailing environment. HBI boosted its full year 2013 outlook twice in 2013, with its current expectation for EPS of $3.75 to $3.85, well up from its initial EPS projection ($3.25 to $3.40). Notably, HBI should achieve its 12%-14% annual operating margin target in 2013 about a year earlier than expected. Thanks to improved profitability, HBI projects its 2013 FCF will be between $475-$525 million (+7% FCF yield) vs. its initial $350-$450 million target. It should be noted that HBI’s FCF includes $38 million in pension contributions and $30-$40 million of unplanned MB acquisition expenses.
Successful recent innovations including ComfortBlend, Smart Size, and X-Temp have also aided profitability. HBI’s new products, which command premium pricing, have been strong contributors to HBI’s margin expansion. For example, X-Temp (technology that automatically adjusts cooling and moisture control in socks and underwear) products carry a 50% premium at retail vs. HBI’s core cotton products and a ~20% premium over HBI’s ComfortBlend products. Early results of its X-Temp underwear and socks have exceeded HBI’s expectations.
During 2013, HBI acquired MB, a marketer of intimate apparel (bras, shapewear, panties, etc.) for ~$583 million. While the deal does not look inexpensive on the surface (9.5x EBITDA), management believes that factoring in potential synergies, the transaction multiple declines to less than 7.0x EBITDA. We wouldn’t be surprised if these synergy projections ultimately proved conservative as MB becomes fully integrated within HBI’s supply chain. As HBI CEO Noll recently stated, “The simplest way to conceptualize this integration is that we bought the brand and the business, but we are going to close the company.” MB’s business complements HBI’s portfolio nicely as users of its average figure products tend to skew younger than HBI’s full figured Playtex and Bali brands. Given MB’s outsourced business model, synergies will not be immediately realized. Nevertheless, the deal is expected to deliver an after-tax rate of return in the mid-teens and be accretive in 2014. Once synergies are fully realized (~3 years) the transaction is expected to add $0.60 to EPS and $65 million to FCF. HBI intends to finance the transaction with its 2013 FCF and revolver capacity, which the Company expects to fully pay down within 18 months. The MB transaction also diversifies HBI away from volatile cotton.
Hanesbrands has made significant progress reducing leverage subsequent to the financial crisis, when the Company’s debt (total debt/EBITDA) was over 5x. Despite additional debt taken on to fund the MB acquisition, HBI expects to end 2013 with long-term debt of ~$1.4-$1.5 billion implying a total debt/EBITDA ratio of ~2.1x, well within the Company’s 1.5x-2.5x targeted levels. HBI’s improved financial flexibility has not only allowed the Company to pursue attractive bolt on acquisitions (MB and Gear for Sports), but also allowed it to begin returning excess capital to shareholders. During 2013, the Company initiated a dividend (as we previously speculated), though we would not be surprised if it were increased from the current payout ratio of just 25%. In addition, we believe that the Company could institute a meaningful share buyback program, and recent comments by CEO Noll give us comfort this could become a reality.
Over the next couple of years, we believe HBI’s true earnings power will emerge as it continues to leverage its unrivaled supply chain, derives benefits from new product innovation and realizes full synergies from its acquisition of MB. Accordingly, we estimate that the Company’s EPS could approach, if not exceed, $5.25. Assuming no multiple expansion from current levels, our estimate of HBI’s intrinsic value is $89 a share, 32% above the current stock price.
Symbol: HBI
Exchange: NYSE Current Price: $67.20 Current Yield: 1.2% Current Dividend: $0.80 Shares Outstanding (MM): 102.0 Major Shareholders: Insiders: 4.6% Average Daily Trading Volume (MM): 0.7 52-Week Price Range: $71.80-$34.74 Price/Earnings Ratio: 18.0x Stated Book Value Per Share: $11.29

INVESTMENT RESEARCH SUMMARY PRICED DECEMBER 12, 2013
- 16 -
International Speedway Corporation
Balance Sheet Data Catalysts/Highlights
(in millions) 8/31/13 2012 2011 • NASCAR recently signed 10-year contracts (beginning in 2015) with NBC and Fox on extremely favorable terms providing revenue visibility through 2024
• Ongoing stabilization and the potential return to growth in attendance revenues due to ongoing economic improvement
• Further traction with Hollywood Casino at Kansas Speedway, which generated $21.5 million in cash for ISCA during FY 2013
Cash $ 164 $ 78 $ 110 Current Assets 255 128 165 TOTAL ASSETS $ 2,029 $ 1,942 $ 1,945
Current Liabilities $ 119 $ 77 $ 87 Long Term Debt 274 274 313 Shareholders Equity 1,269 1,249 1,212 TOTAL LIABILITIES AND SHAREHOLDERS EQUITY
$ 2,029 $ 1,942 $ 1,945
Fiscal Year Ending November 30
P&L Analysis ($ in millions except per share items)
2012 2011 2010 2009 Revenues 612 630 645 693 Net Income 55 69 55 91 Earnings Per Share 1.18 1.46 1.13 1.87 Dividends Per Share 0.20 0.18 0.16 0.14 Price Range 29.30-23.18 32.32-20.08 31.12-22.34 30.95-16.49
INVESTMENT RATIONALE
International Speedway owns or operates 13 of the nation’s premier motorsports entertainment facilities and generates more than 90% of its sales from NASCAR sanctioned racing events. NASCAR is the #1 rated spectator sport (in terms of attendees) and the #2 rated sport on television (after the NFL). ISCA operates an attractive business model with approximately 62% of its revenue (media rights and corporate sponsorships) secured under long-term contracts with annual escalators providing it with a predictable and recurring source of revenue and cash flow. In addition, the barriers to entry to the business are enormous with the Company’s unsuccessful foray into NYC during the last decade supporting our view (ISCA had to abandoned its plan to build a stadium on Staten Island due to a community uproar).
While there had been investor concerns surrounding NASCAR’s media rights (~50% of ISCA’s revenues) renewal due to ratings pressure, those fears proved to be unfounded. In July 2013, NASCAR announced that NBC had secured the majority of NASCAR’s annual rights under a 10-year contract (2015-2024) reported to be 54% above ($440 million average annual value vs. $270 million) the prior agreement with ESPN. The NBC agreement followed on the heels of Fox’s 8-year renewal (amended to 10-years) in 2012 that represented a ~36% increase over the prior deal. We had previously speculated that interest in NASCAR’s media rights was likely to be strong, especially given both Fox and NBC’s ambitions to rival ESPN’s sports programming. ISCA/NASCAR’s ability to command large live audiences is becoming increasingly attractive to advertisers in today’s fragmented media landscape. Given the favorable renewals, we believe ISCA could receive a one-time step up in rights fees in 2015 since the new media contract will likely increase at a low low-mid single digit rate over its term.
In our view, the favorable media rights renewal is being overshadowed by the Company’s revitalization of the iconic Daytona International Speedway and initiatives to increase its utilization. In July 2013, ISCA announced a plan to modernize the Daytona facility ($375-$400 million expected costs) that is expected to generate incremental revenue ($20 million) and provide a $15 million boost to EBITDA with a mid single-digit growth rate within the first year after its 2016 completion. While some investors may be wary of the endeavor dubbed Daytona Rising, we would expect ISCA to follow the playbook of MSG, which recently completed a successful renovation of its eponymous arena. We believe the Daytona renovation will allow the Company to attract meaningfully higher revenues from increased luxury suite sales and increased sponsorships, among other items. ISCA has strong liquidity to fund the project with $164 million of cash and total debt to capitalization of just 17.9%. While ISCA will likely utilize its revolver ($300 million that is currently undrawn) on a short-term basis to fund the project, ISCA does not expect to incur any long-term debt. In addition to Daytona Rising, the Company recently entered into a JV intended to monetize and increase the utilization of its Daytona property. The project currently under consideration is a mixed-use and entertainment destination (think Disneyland for NASCAR fans) directly across from the famed Daytona Speedway.
ISCA has been disproportionately impacted by the weak economy and this fact is apparent in the over 50% decline in the Company’s attendance/admissions revenues (22% of ISCA’s 2012 total revenues) from their peak in 2007. While the attendance declines have been discouraging and have had an outsized impact on profitability, prospects for a recovery are encouraging. ISCA’s attendance revenues appear to be stabilizing with attendance revenues declining by just 1% on a comparable race basis during 3Q 2013. The ongoing improvement, albeit slow, in the housing industry and resurgent auto industry, two areas of the economy that employ a large base of NASCAR fans, should bode well for future attendance. Corporations are also beginning to increase spending on sponsorship/hospitality following a pull back in the wake of the financial crisis. In response to attendance pressures, ISCA has taken approximately $46 million out of its cost structure since 2009, which should provide nice leverage as attendance/admission revenues begin to recover.
At current levels, ISCA trades for 7.4x our projected 2015E EBITDA. Adjusting for the ~$117 million benefit that ISCA will receive from its recent Staten Island transaction, the current forward valuation drops to just 6.8x. In our view, this valuation is inconsistent with the ISCA’s strong business model including a highly visible revenue/cash flow stream, robust profitability (2012 EBITDA margins: 30%), and unique assets. ISCA’s Hollywood Casino JV with Penn Gaming ($21.5 million cash contribution in FY 2013) continues to gain traction and should serve as an additional source of value creation. If ISCA’s shares continue to languish, we would not rule out the potential that the France Family considers taking the Company private.
Symbol: ISCA Exchange: NASDAQCurrent Price: $33.16Current Yield: 0.7%Current Dividend: $0.22Shares Outstanding (MM): 46.2Major Shareholders: France Family 40% Econ, 70% VotingAverage Daily Trading Volume (MM): 0.1052-Week Price Range: $35.77-$26.02Price/Earnings Ratio: 29.1xStated Book Value Per Share: $27.47
INVESTMENT RESEARCH SUMMARY PRICED DECEMBER 12, 2013
- 17 -
JPMorgan Chase & Co.
Balance Sheet Data Catalysts/Highlights
(in billions) 9/30/13 2012 2011 • JPM continues to strengthen its capital position, enabling it to return capital to investors via dividends and share repurchase.
• Recent $13 billion settlement helps to alleviate regulatory uncertainty.
• Company EPS could approach $6.00-$7.00 during the next 2-3 years, representing 50% growth from current levels.
Cash $ 30.7 $ 53.7 $ 59.6 Goodwill 48.1 48.2 48.2 TOTAL ASSETS $ 2,463.3 $ 2,359.1 $ 2,265.8 Long Term Debt $ 263.4 $ 249.0 $ 256.8 Shareholders Equity 206.7 204.1 183.6 TOTAL LIABILITIES AND SHAREHOLDERS EQUITY
$ 2,463.3 $ 2,359.1 $ 2,265.8
Fiscal Year Ending December 31
P&L Analysis ($ in billions except per share items)
2012 2011 2010 2009 Revenues 97.0 97.3 102.7 100.4 Net Income 21.3 19.0 17.4 11.7 Earnings Per Share 5.20 4.48 3.96 2.25 Dividends Per Share 1.15 0.80 0.20 0.20 Price Range 46.49-30.83 48.36-27.85 48.20-35.16 47.47-14.96
INVESTMENT RATIONALE
JPMorgan is a leading financial services firm with over $2.4 trillion in assets and a worldwide presence. The firm has operations with significant scale and market share in businesses such as banking, credit cards, investment banking, asset management, private equity, and transaction processing. JPM’s client base includes a wide range of consumers, corporations, governments, and small businesses. The Company possesses the banking sector’s largest ATM network and second largest branch network. The firm is also the largest credit card issuer in the U.S., the second largest mortgage originator, and holds #1 share in global investment banking fees.
JPM has been reporting solid operating results, and share performance has begun to reflect the Company’s strong fundamentals (shares are up over 30% during the past year). However, we continue to believe that the firm’s long-term earnings power is still not fully reflected in the stock’s valuation. During the most recent quarter (3Q-13), JPM reported core EPS of $1.42 excluding special items, up about 2% from a year over year perspective. The most pronounced revenue growth originated from investment banking (up 6%), reflecting a substantial increase in equity underwriting fees via improved industry fundamentals and Company market share gains. The firm’s overall net interest margin was basically unchanged at 2.2%. Credit quality metrics were materially improved during the period; overall non-performing assets declined 6% sequentially and 18% year over year. Loan growth was relatively modest (up 1%), largely a result of increased demand for commercial loans. The firm achieved a ROE of 16% during the quarter.
Like many of its industry peers, JPM has experienced a significant contraction in its net interest margin during recent years as a result of historically low interest rates. Although JPM has a diverse range of businesses with a significant exposure to non-interest income, net interest income still accounts for over 40% of overall revenue. As discussed in this year’s summer issue of Asset Analysis Focus, interest rate increases appear to be a likely scenario during the coming years. Such an increase in future interest rates could have meaningful implications for JPM’s net interest margin and overall earnings power. According to management estimates, a 200 basis point increase in the federal funds rate could benefit net interest income by up to $4 billion (pre-tax), implying an EPS benefit of over $0.70 relative to current levels of profitability. In our view, long-term EPS power of $6.00-$7.00 could be attainable within the next 2-3 years. This would represent EPS growth of roughly 50% relative to expectations for the current fiscal year.
The firm’s balance sheet continues to be very strong and well-capitalized. JPM’s Tier 1 common ratio was 10.5% in 3Q-2013, slightly above year-ago levels. The firm’s financial strength has allowed it to increasingly return capital to shareholders. The annual dividend now stands at $1.52 per share (implying a 2.7% yield), nearly double the annual dividend paid by JPM just 2 years ago. The firm also repurchased over $10 billion of its shares during the 2011-2012 time frame. The Federal Reserve approved JPM’s 2013 capital plan earlier this year, which included an additional repurchase authorization of $6 billion ($4.5 billion completed during the first 3 quarters of 2013). JPM continues to make progress with various regulatory issues. In November of 2013, JPM announced a $13 billion settlement with the Department of Justice and other government agencies, mainly related to penalties and compensation for MBS-related (mortgage backed securities) losses. The firm had established reserves to cover such considerations, and the firm continues to have several billion dollars in reserves for other potential settlements. Continued resolution of these regulatory issues should be a positive for JPM shares, removing an overhang on the stock and providing greater visibility to the firm’s financial outlook.
Although share performance has been strong over the past year, we still do not believe JPM’s long-term earnings power and strong competitive position are fully appreciated by most investors. Moreover, we continue to view JPM’s Chairman and CEO Jamie Dimon as a highly capable bank executive who can help create shareholder value over the long-term. The potential for better than expected profits, reduced litigation uncertainty, combined with additional return of capital to shareholders via dividends and share repurchase should provide several catalysts for future stock appreciation. Our blended estimate of intrinsic value for JPM shares is $70, suggesting total return potential of over 25% relative to the current share price. This estimate assumes the stock can trade at 1.3x tangible book value and 11x EPS based on 2015 projections.
Symbol: JPM Exchange: NYSE Current Price: $56.31 Current Yield: 2.7% Current Dividend: $1.52 Shares Outstanding (MM): 3,760Major Shareholders: Insiders own < 1%Average Daily Trading Volume (MM): 20.352-Week Price Range: $58.14-$42.71Price/Earnings Ratio: 9.4xStated Book Value Per Share: $52.02
INVESTMENT RESEARCH SUMMARY PRICED DECEMBER 12, 2013
- 18 -
Kohl’s Corporation
Balance Sheet Data Catalysts/Highlights
(in millions) 10/30/13 2012 2011 • KSS continues to hold a strong competitive position, supported by an evolving merchandising mix and improving store experience.
• Management exhibits a strong shareholder orientation illustrated by significant return of capital via dividends and stock buybacks.
• We believe the firm’s strong position, solid financial footing, and attractive valuation could attract the attention of private equity investors.
Cash $ 598 $ 537 $ 1.205 Goodwill 0 0 0 TOTAL ASSETS $ 15,245 $ 13,905 $ 14,094 Long Term Debt $ 2,792 $ 2,492 $ 2,141 Shareholders Equity 5,924 6,048 6,508 TOTAL LIABILITIES AND SHAREHOLDERS EQUITY
$ 15,245 $ 13,905 $ 14,094
Fiscal Year Ending January 31
P&L Analysis ($ in millions except per share items)
2013 2012 2011 2010 Revenues 19,279 18,804 18,391 17,178 Net Income 986 1,167 1,114 991 Earnings Per Share 4.17 4.30 3.66 3.17 Dividends Per Share 1.28 1.00 NA NA Price Range 55.25-42.04 57.39-42.14 58.99-44.07 60.89-32.50
INVESTMENT RATIONALE
Kohl’s Corporation is a major operator within the retail sector, consisting of over 1,100 stores throughout the United States. The firm generates annual revenue of over $18 billion, derived from the following merchandise categories: Women’s (31%), Men’s (19%), Home (19%), Children’s (13%), Accessories (10%), and Footwear (8%). Kohl’s apparel and home fashions are designed to reflect the tastes of classic, modern classic and contemporary consumers. KSS offers both nationally recognized brands, and a growing assortment of private and exclusive brands within its product line. The typical KSS customer is female, married, and 25-54 years old.
KSS has an impressive record of store expansion over its history. Since KSS’ IPO in 1992, the firm has increased sales and net income at CAGRs of 16% and 22%, respectively. Yet, it must also be acknowledged that the firm is undergoing somewhat of a transitional phase at this stage in its history. In recent years, growth rates have moderated due to the firm’s increasing size and maturing store base. However, key metrics such as sales growth, gross margins, operating margins, and ROE have remained at strong levels.
KSS operates within a highly competitive industry consisting of both conventional “bricks and mortar” retailers as well as prominent Internet-based retailers. In our view, management recognizes the challenges that are being faced, and has outlined a coherent strategy for maintaining the Company’s competitive position over the long-term. A key aspect of this strategy for KSS is knowing its customer base, and developing a product line that effectively reflects the tastes and price points of its consumers, while maintaining a strong brand identity. As part of its efforts to differentiate Kohl’s from its competitors, the Company has developed an increasingly important set of private and proprietary brands that are unique to Kohl’s stores. Just during the 2009-2012 period, KSS increased the sales contribution from its private and exclusive brands from 42% to 50% of total revenue, and this figure reached 52% during the most recent fiscal year.
Management also considers a leading in-store experience to be a strategic imperative. Factors such as store location and store layout can have a significant impact on the overall consumer experience. During recent years, over half of KSS’ total capital expenditures have been allocated to new stores and store remodeling. As a result, approximately 50% of the Company’s total store base has either been opened or remodeled within the past 5 years. Importantly KSS owns approximately 36% of its stores, in addition to owning its corporate headquarters and the majority of its distribution centers. The owned stores by themselves could be worth over $6.5 billion (assuming $200 per square foot, toward the low end of transactions for retail space), which by itself represents over 50% of the Company’s total market capitalization, providing an additional margin of safety.
KSS has a solid financial profile, illustrated by relatively low leverage and strong cash flow generation. As of the most recent quarter, KSS possessed a net debt: capital ratio of approximately 23%. KSS has historically generated ample free cash flow, and free cash flow levels have approached $1 billion during recent years (implying an 8% free cash flow yield relative to its current market capitalization). KSS’ cash generation has allowed it to return significant capital to investors via dividends and share repurchases. KSS has a share repurchase authorization of $3.5 billion (to be completed within 3 years), representing about 30% of the firm’s current market value. KSS also initiated its first ever dividend in 2011, (originally set at an annual rate of $1.00 per share). In our view, management’s capital allocation decisions have exhibited a shareholder-oriented mindset that enhances value for its investors over the long-term.
Assuming valuation multiples of 14x EPS and 6.0x EV/EBITDA (applied to our FY 2015 projections) produces a blended estimate of intrinsic value of roughly $72 per share. This estimate of intrinsic value implies total return potential of over 30% using a multi-year time frame, and could prove to be conservative. In our view, the primary catalysts for the stock should be improving financial results and the continued return of capital to shareholders via its growing dividend and share repurchase program. In addition, KSS could attract the attention of private equity investors given the Company’s low valuation, solid competitive position, owned real estate, and strong financial footing.
Symbol: KSS Exchange: NYSECurrent Price: $54.97Current Yield: 2.5%Current Dividend: $1.40Shares Outstanding (MM): 235.0Major Shareholders: T.Rowe Price 11%Average Daily Trading Volume (MM): 2.752-Week Price Range: $58.47-$41.35Price/Earnings Ratio: 12.0Stated Book Value Per Share: $25.98

INVESTMENT RESEARCH SUMMARY PRICED DECEMBER 12, 2013
- 19 -
Laboratory Corporation of America Holdings
Balance Sheet Data Catalysts/Highlights (in millions) 9/30/13 2012 2011 • LH possesses a strong competitive position
in an industry with attractive long-term growth prospects.
• The Company continues to be a solid free cash flow generator, financing share repurchases, debt reduction, and bolt-on M&A.
• Recent pull-back is an attractive buying opportunity, stock offers upside potential of at least 45%.
Cash $ 174 $ 467 $ 159 Current Assets 1,213 1,392 1,085 TOTAL ASSETS $ 6,687 $ 6,795 $ 6,137 Current Liabilities $ 681 $ 1,029 $ 797 Long Term Debt 2,554 2,175 2,086 Shareholders Equity 2,566 2,717 2,504 TOTAL LIABILITIES AND SHAREHOLDERS EQUITY
$ 6,687 $ 6,795 $ 6,137
Fiscal Year Ending December 31
P&L Analysis (in millions except per share items)
2012 2011 2010 2009 Revenues 5,671 5,542 5,004 4,695 Net Income 583 520 585 543 Earnings Per Share 5.99 5.11 5.29 4.98 Dividends Per Share Nil Nil Nil Nil Price Range 95.30-81.56 100.94-74.57 89.48-69.49 76.74-53.25
INVESTMENT RATIONALE Laboratory Corporation of America is the second largest independent clinical laboratory in the $60 billion U.S. lab market,
providing laboratory testing services primarily to physicians, hospitals and managed care organizations. LH has far-reaching operational scale, with a national infrastructure that serves patients in all 50 states (consisting of 50 primary labs and over 1,800 patient service centers). The firm generates over $5 billion in annual revenue, and it serves a relatively diverse range of customers (no individual customer accounts for more than 10% of sales). LH has an impressive record of growth during recent years, increasing sales and EPS at 5-year CAGRs of 7% and 10% respectively. However, more recent comparisons have been less robust due to a mix of industry and economic factors. Although near-term results may remain somewhat muted, we continue to regard LH as a well positioned operator in the U.S. lab industry with meaningful long-term growth opportunities.
The reduced prospects for strong near-term growth for LH have become apparent as the Company has reported its results and provided future financial guidance to investors. In October 2013, LH reported 3Q EPS of $1.80, in-line with investor expectations, but representing year-over-year growth of only 2%. Overall revenue growth for the period was 3%, and LH’s operating margin came in at 17% (down 120 basis points relative to 3Q-2012), reflecting a challenging pricing environment. Management has continued to reiterate its 2013 guidance of 3% revenue growth and EPS in the $6.90-$7.15 range, but a December announcement detailing initial guidance for 2014 caused the stock to decline over 10%, reflecting investor disappointment. For 2014, the Company expects 2% revenue growth and EPS of roughly $6.50 (about $1.00 short of general expectations). The guidance illustrates management’s continued concerns regarding near-term industry conditions and the ramifications for the Company’s sales and margins.
The overall sector backdrop has been less conducive to LH achieving the impressive growth of the past. Near-term uncertainty related to issues such as government reimbursements (related to scheduled cuts in Medicare reimbursement fees) and general implementation of healthcare reforms have been among the primary concerns cited by management. Additionally, the weakness of the U.S. economy has negatively impacted consumer demand for some types of healthcare services, as individuals delay or forgo medical visits due to concerns related to potential costs. Yet this trend should abate as economic conditions improve. Moreover the prospect of healthcare reform in the U.S. market, combined with an aging population, should provide long-term tailwinds for volume growth during the coming years as a larger number of customers access the healthcare system. We would also highlight a continued opportunity for consolidation for LH within this highly fragmented industry (consisting of 5,000 independent labs), which should be a potential source of growth and enhanced profitability over the long-term. Much of LH’s consolidation will likely be focused on the continued growth of its specialty testing businesses such as genomic and esoteric, which enjoy superior pricing and margins relative to other areas. Specialty now accounts for over 35% of revenue.
Despite challenging market conditions, LabCorp continues to possess a solid financial position. As of the most recent quarter, the Company had about $2.5 billion in net debt and it has been generating over $700 million in annual free cash flow during recent years (implying a free cash flow yield of 9%). LH does not pay a dividend, but it does return capital to shareholders via a stock repurchase program. LH has reduced its share count by approximately 20% since 2008, and it had a remaining authorization of $1.3 billion as of the most recent quarter (representing 17% of the current market capitalization). Historically, LH has allocated a comparable level of capital to M&A activity. Given the fragmented nature of the lab sector, we would expect this to remain a recurring theme going forward (likely bolt-on in nature). Debt reduction will be another ongoing initiative. The firm’s Debt/EBITDA stands at roughly 2.0x, toward the upper end of its targeted range.
We believe the near-term headwinds being faced by LH do not undermine the Company’s long-term outlook or competitive position, and we regard the stock’s recent pull-back as an attractive entry point for patient, value-oriented investors. Moreover, as the year progresses we believe investors may increasingly start to focus on LH’s long-term earnings power instead of 2014’s challenging environment. In the near term, the Company’s ongoing share repurchase activity should provide meaningful valuation support. Our estimate of intrinsic value assumes the stock can trade at an EV/EBITDA multiple of 9.0x, consistent with its historical range. Applying this multiple to 2015 projections produces an intrinsic value of $130 per share, implying return potential of over 45% from the current price. This estimate could prove to be conservative over the long term, and potential profit enhancements from future M&A could be a source of upside as this industry continues to consolidate.
Symbol: LH Exchange: NYSECurrent Price: $87.75Current Yield: N/ACurrent Dividend: NilShares Outstanding (MM): 87.4Major Shareholders: Insiders < 1.0%Average Daily Trading Volume (MM): 0.6752-Week Price Range: $108.00-$84.91Price/Earnings Ratio: 13.3xStated Book Value Per Share: $29.22
INVESTMENT RESEARCH SUMMARY PRICED DECEMBER 12, 2013
- 20 -
Legg Mason, Inc.
Balance Sheet Data Catalysts/Highlights
(in millions) 9/30/13 2012 2011 • LM’s turnaround efforts are beginning to yield results, illustrated by stabilizing AUM and better than expected profits.
• Market backdrop for equity investing is showing signs of improvement, representing a potential tailwind for future results.
• LM continues to return significant capital to shareholders via its increasing dividend and $1 billion share buyback program.
Cash $ 712 $ 1,382 $ 1,376 Goodwill 1,251 1,275 1,312 TOTAL ASSETS $ 6,911 $ 8,556 $ 8,708 Long Term Debt $ 1,045 $ 1,136 $ 1,201 Shareholders Equity 4,761 5,667 5,770 TOTAL LIABILITIES AND SHAREHOLDERS EQUITY
$ 6,911 $ 8,556 $ 8,708
Fiscal Year Ending March 31
P&L Analysis ($ in millions except per share items)
2013 2012 2011 2010 Revenues 2,613 2,663 2,784 2,635 Net Income 156 221 254 204 Earnings Per Share 1.17 1.54 1.63 1.32 Dividends Per Share 0.44 0.32 0.20 0.12 Price Range 29.48-22.36 37.82-22.61 37.72-24.00 33.70-10.35
INVESTMENT RATIONALE
Legg Mason, Inc. is a well established operator within the asset management industry, possessing a wide range of investment products and capabilities. LM achieved impressive growth during much of its history, but Company trends related to both growth and profitability deteriorated significantly after 2007. The Company has embarked on a series of restructuring and capital management initiatives in order to improve profitability and enhance shareholder value. As part of this turnaround effort, LM has made significant changes to its management team. Joseph Sullivan was named interim CEO of LM in September 2012, and was appointed to the position on a permanent basis in early 2013. We regard Sullivan as a sound choice for the position, given his previous experience with Legg Mason and familiarity with its past challenges. It warrants mention that activist investor Nelson Peltz continues to be on the Company’s board of directors, and his firm remains LM’s second largest shareholder.
We believe LM’s operations have begun to show some signs of improvement, illustrated by stabilization in Assets Under Management and meaningful profit growth. During its most recent quarter, LM reported a better than expected 17% increase in EPS. The firm’s profit improvement was a function of both higher revenue and well managed expenses, translating to a meaningful expansion in its operating margin. Total AUM was higher for the period on both a sequential and year over year basis. In addition to benefiting from its operational turnaround, the overall industry backdrop is beginning to show signs of improvement. Fund flow trends within the industry have begun to show some signs of a shift from fixed income to equities during recent quarters. According to ICI, equity funds gained over $100 billion in net flows over the last 12 months (as of September 2013), compared to an outflow of $77 billion for the previous 1-year period (ending September 2012). LM now has approximately $670 billion in AUM (54% Fixed Income, 26% Equities, 20% Money Market).
LM has also remained committed to enhancing shareholder value by returning capital to shareholders. Despite operational challenges, LM has been generating roughly $400 million in average annual free cash flow during recent years. The firm commenced a $1 billion share buyback program as part of the capital plan announced in 2012 which is expected to be completed within three years. LM’s shares outstanding have declined 19% since 2010, and management expects total reduction in share count to reach over 30% by 2015. Importantly, LM is also committed to maintaining a strong balance sheet. In order to address both leverage and borrowing costs, LM has retired or refinanced a significant portion of its debt during recent years, and debt reduction remains an ongoing priority. During the most recent quarter, the Company reported a 32% decline in interest expense, and net debt stood at $388 million.
Looking ahead, we believe LM continues to be well positioned to report improving results that exceed current investor expectations. The Company’s well established product distribution capabilities, improving fund performance profile, and its launches of new products (closed end funds, etc.) offer several potential growth drivers. Moreover, an improved market environment for equity funds could provide another tailwind for growth in AUM and profitability. Assuming AUM just achieves modest growth going forward (low single-digits) via a combination of inflows and normalizing market conditions, this could translate to EPS of $3.00-$3.50 by FY 2016 (implying about a 40% improvement relative to expectations for current fiscal year 2014).
Although share performance has shown significant improvement over the past year (appreciation of over 50%), we believe the stock continues to offer attractive upside potential. Our estimate of intrinsic value assumes a multiple of only 1% of AUM for LM shares. This 1% assumption is a blended multiple based on LM’s current AUM mix (2% of AUM for Equity, 1% of AUM for Fixed Income, no value assigned to Money Market). Based on its current AUM level (and assuming no future improvements), a 1% of AUM multiple for LM produces an intrinsic value of approximately $53 per LM share, implying total return potential of over 30%. From our perspective, investors still fail to appreciate the firm’s underlying intrinsic value and potential for future improvement, and our estimate of intrinsic value may prove to be conservative over the long-term. These considerations, combined with a strong balance sheet, solid cash flow, and significant share repurchase program should provide near-term support for the stock, and create a very favorable risk/reward trade-off during the coming years.
Symbol: LM Exchange: NYSECurrent Price: $40.63Current Yield: 1.3%Current Dividend: $0.52Shares Outstanding (MM): 123.2Major Shareholders: Trian 10%Average Daily Trading Volume (MM): 1.252-Week Price Range: $41.34-$24.98Price/Earnings Ratio: 15.3xStated Book Value Per Share: $32.00
INVESTMENT RESEARCH SUMMARY PRICED DECEMBER 12, 2013
- 21 -
Liberty Interactive Corporation
Balance Sheet Data Catalysts/Highlights
(in millions) 9/30/13 2012 2011 • Creation of QVC Group tracking stock should allow investors to ascribe an appropriate multiple to crown jewel QVC
• Further traction in newly launched markets (Italy and China) and additional international expansion
• Ongoing share buybacks given QVC’s attractive valuation, strong FCF and balance sheet capacity
Cash $ 981 $ 2,660 $ 847 TOTAL ASSETS $ 24,370 $ 26,255 $ 17,339 Long Term Debt $ 7,034 $ 7,884 $ 6,039 TOTAL LIABILITIES AND SHAREHOLDERS EQUITY
$ 24,370 $ 26,255 $ 17,339
Fiscal Year Ending December 31
P&L Analysis ($ in millions except per share items)
2012 2011 2010 2009 LINTA Revenues 10,018 9,616 8,932 8,305 LINTA EBITDA 1,897 1,827 1,679 1,607 Dividends Per Share NA NA NA NA Price Range 20.95-15.93 18.65-12.44 16.71-10.23 12.22-2.46
INVESTMENT RATIONALE In October 2013, Liberty announced that it intends to recapitalize its Liberty Interactive Group tracking stock into two
new tracking stocks as part of its ongoing initiatives to unlock shareholder value. The current LINTA tracker will be renamed QVC Group and consist of subsidiary QVC and its ~38% interest in rival HSN, Inc. The new Liberty Digital Commerce tracker will contain a collection of eCommerce businesses (Provide Commerce, Bodybuilding.com, CommerceHub, etc.). While some investors may be uneasy with tracking stocks, Liberty has a proven track record of successfully utilizing the structure to create an enormous amount of shareholder value. Just since August 2012 when Liberty Interactive began trading as two tracking stocks (Liberty Interactive and Liberty Ventures), the shares of LINTA and LVNTA have increased by 56% and 155%, respectively compared with an 24% increase for the S&P 500.
QVC, which accounts for nearly 90% of LINTA’s revenues, has come a long way since its early days when it was often associated with hawking shower radios. Today, QVC is a preeminent retailer with industry leading margins (2012 EBITDA margin: 21.5%) and robust FCF conversion (EBITDA-capex margin: 18.6%). QVC’s strong results stem, in part, from its often misperceived customer base that has above average income and household wealth and is extremely loyal (~90% retention). We believe QVC boasts a number of advantages compared with both “brick and mortar” and online competitors. The absence of a physical presence provides QVC with an enormous amount of flexibility from both a financial (no long-term leases) and operational (ability to adapt quickly to consumers’ tastes preferences) perspective. While Amazon presents a formidable competitor, it should be noted that approximately 75% of QVC’s merchandise is unique to the company (exclusive products or non-exclusive items with certain features or colors only available through QVC).
We believe QVC’s more mature U.S. operations (~67% of QVC revenues) continue to offer an attractive growth avenue. Our view is reinforced by QVC’s 3Q 2013 results where revenues and adjusted EBITDA increased by 5% and 9%, respectively. QVC’s U.S. consumers continue to embrace online purchases with 41% of QVC’s U.S. revenues derived from QVC.com in the latest quarter (vs. 20% in 2006) including 32% of orders via mobile devices. The ongoing shift to online purchases has a number of benefits including broadening the customer base (QVC’s online/mobile consumers tend to skew younger), increasing customer loyalty (customers transacting on multiple platforms spend more) and improved profitability (lower processing costs). We believe there are a number of items that will likely drive future growth including the recent launch of a second channel (QVC Plus), increased HD distribution (20 million HD homes added during 3Q 2013) and enhanced social integration thanks to the recent launch of toGather (a rich commerce experience with deep social network integration capabilities). While the U.S. remains an important region for QVC, we would expect a disproportionate amount of future growth to come from international expansion. QVC has experienced early success with the 2010 expansion into Italy (first new market in 9 years) and China, which QVC entered during 2012 via a JV with China Broadcasting Corporation. Management is currently exploring expansion in a number of international markets including France, Spain and Brazil.
LINTA is led by a shareholder friendly management team (Malone and Maffei) that has a significant amount of their net worth represented by LINTA shares. Since the creation of the LINTA tracking stock in May 2006, LINTA has repurchased 222 million shares for $4.3 billion at an average cost of $19.65 a share, reducing shares outstanding by over 30%. With the implied valuation of QVC at just 7.5x 2015E EBITDA, representing a level inconsistent with its strong fundamentals and business outlook, we believe share repurchases will continue to be an excellent use of excess capital and LINTA has plenty of capacity to do so. In addition to QVC’s strong cash flow, LINTA has plenty of balance sheet capacity to continue repurchasing shares with QVC total debt to adjusted EBITDA standing at just 2.1x at 3Q 2013. Furthermore, the frothy credit markets have allowed Liberty to increase QVC’s financial flexibility. Refinancing during the first half of 2013 reduced QVC’s weighted average interest rate to 4.2% from 4.7% and weighted average term to 8.2 years from 5.1 years.
Applying a discounted (relative to precedent industry transactions) 8.0x multiple to our estimate of 2015 EBITDA for QVC and valuing HSN at its current market value and applying an 8.0x multiple to our 2015E for the Company’s eCommerce businesses, we derive an intrinsic value of $34 a share, representing 25% upside from current levels. Although the proposed recap will allow investors to better value QVC, LINTA’s crown jewel, we believe the latest move is just a prelude to the ultimate separation of QVC Group from the other LINTA trackers. If such an event should occur, our estimate of LINTA’s current intrinsic value is likely to prove conservative. A combination with peer HSN (meaningful synergies) presents additional upside.
Symbol: LINTA Exchange: NASDAQCurrent Price: $27.30Current Yield: NACurrent Dividend: NAShares Outstanding (MM): 523.0Major Shareholders: John Malone ~34.5% (voting)Average Daily Trading Volume (MM): 2.452-Week Price Range: $28.65 -$18.87Price/Earnings Ratio: 27.9xStated Book Value Per Share: $22.10

INVESTMENT RESEARCH SUMMARY PRICED DECEMBER 12, 2013
- 22 -
Liberty Media Corporation
Balance Sheet Data Catalysts/Highlights
(in millions) 9/30/2013 2012 2011 • Accretive capital deployment at holding company level as LMC rebuilds liquidity
• LMC could participate in cable industry consolidation by providing debt and/or equity financing
• Sirius investment should eventually be separated in a tax-efficient spinoff
Cash $ 1,171 $ 603 $ 2,070 Current Assets 2,481 2,211 3,914 TOTAL ASSETS $ 33,943 $ 8,325 $ 7,723 Current Liabilities $ 2,760 $ 385 $ 1,230 Long Term Debt 4,385 NA 541 Shareholders Equity 14,419 6,440 5,251 TOTAL LIABILITIES AND SHAREHOLDERS EQUITY
$ 33,943 $ 8,325 $ 7,723
Fiscal Year Ending December 31
P&L Analysis ($ in millions except per share items)
2012 2011 2010 2009 Revenues 1,999 3,024 2,050 1,853 Net Income 1,414 607 794 127 Earnings Per Share 11.40 6.90 8.54 1.31 Dividends Per Share NA NA NA NA Price Range 116.01-78.31 91.14-61.11 63.32-23.75 24.85-4.49
INVESTMENT RATIONALE
Liberty Media’s transformation continued at a torrid pace in 2013. The spinoff of premium pay TV programmer Starz was completed in January. LMC also put its cash hoard to work, with remarkably quick success. In May, LMC acquired a 27% equity stake and 4 board seats at #4 U.S. cable operator Charter Communications for $2.6 billion ($95.50/share); CHTR shares are already 38% above LMCA’s entry point. LMC increased its stake in Live Nation to 27% during the year, and Liberty CEO Greg Maffei became LYV’s chairman in March. LMC has also repurchased 8.3 million shares (7%) since last November, including the CNBC/Comcast transaction announced in October 2013. LMC transferred to Comcast its CNBC revenue sharing arrangement, its Leisure Arts subsidiary and $417 million in exchange for 6.3 million LMC shares, effectively monetizing the CNBC agreement at a lofty 13x EBITDA and repurchasing 5.2% of LMC in a tax free transaction.
Operationally, we believe all of LMC’s primary investments are in attractive, highly competitively advantaged businesses that generate free cash flow far in excess of GAAP net income. Sirius is LMC’s largest investment, with its 52% (pro forma) stake publicly valued at $11 billion or 64% of LMC’s current market cap. We believe SIRI’s monopoly position in the satellite radio market will remain unimpeded by Internet radio/streaming alternatives for the foreseeable future given the combination of Sirius’s vast and exclusive or curated content; economically superior subscription model and music royalty contracts; satellite data delivery cost and network coverage advantages versus cellular; and OEM barriers given the long hardware upgrade cycle plus automakers’ beneficial economic relationships with SIRI. Sirius should continue to see outsized margin expansion and FCF growth powered by higher auto sales and pre-owned car penetration. Formerly under-penetrated and un-marketed, the addressable market of Sirius-equipped but unsubscribed pre-owned cars is ~32 million and growing. SIRI is on pace to add ~1.5 million pre-owned car subscribers in 2013 and this should only accelerate. With the $530 million acquisition of Agero’s connected vehicle services business in August, Sirius also recently acquired a growing connected car platform that could offer meaningful OEM relationship synergies over the long term.
At Charter, under the leadership of highly-regarded CEO Tom Rutledge, the company has a great opportunity to aggressively market its upgraded digital network to increase subscriber penetration (currently only ~25% residential and <10% commercial) and premium service bundles (currently only 32% triple play penetration) across its expansive footprint. With Malone and Liberty publicly stumping for large-scale cable industry consolidation, a highly synergistic merger with Time Warner Cable (in whole or in part) is also possible in 2014. Absent a TWC merger, Rutledge still sees plenty of growth organically and from smaller acquisitions (like the recent Bresnan deal). At Live Nation, we believe the Company is well positioned to continue to execute in year two of its 3-year, 30%-35% AOI growth strategy, driven by the ticketing platform upgrade, a recovery in economically sensitive concert segment financial performance, and international and festival growth.
LMC shares, which have compounded at a 35% annual rate since issuance in 2006, continued their extreme outperformance in 2013, returning 53.4% (inclusive of the Starz spinoff) since last year’s Forgotten Forty. Our previously-mentioned strategy of hedging out LMC’s SIRI position would have returned a staggering 114.9% against net exposure, reflecting the almost complete elimination of LMC’s holding company discount (which once reached 50%). We would attribute this to a combination of continued asset sales/spinoffs, share repurchases and other accretive investment of excess capital, and belated investor recognition of Malone/Maffei’s commitment to shrink the historical discount via corporate action. Nonetheless, we retain a positive outlook toward LMC shares. We continue to view LMC shares as a prime beneficiary of the current historically attractive interest rate environment for borrowers given Malone’s mantra of leveraged return on equity. Continued FCF growth and attractive capital deployment opportunities (including large-scale share repurchases and/or acquisitions) should drive shareholder value creation at SIRI, CHTR, and LYV in 2014. Meanwhile, at the holding company level LMC should have plenty of funding flexibility to pursue additional investments in 2014; liquidity sources include participation in SIRI share repurchases, potential proceeds from the long-running lawsuit against Vivendi ($956 million judgment under appeal), and $1.3 billion of other non-core investments that could be monetized. Potential outlets include equity and/or debt investments in Charter/in support of a CHTR/TWC merger, additional investments in LYV, or other opportunities. Otherwise LMC, which has repurchased 51% of shares outstanding since 2008, may resume large-scale share repurchase activity. Although unlikely to occur in 2014, LMC will almost certainly spin off its SIRI stake via a tax-free Reverse Morris Trust.
Symbol: LMCA Exchange: NASDAQCurrent Price: $147.43Current Yield: NACurrent Dividend: NAShares Outstanding (MM): 122Major Shareholders: John Malone 9%; 41% votingAverage Daily Trading Volume (MM): 0.752-Week Price Range: $157.73-$106.42Price/Earnings Ratio: NAStated Book Value Per Share: $118.18

INVESTMENT RESEARCH SUMMARY PRICED DECEMBER 12, 2013
- 23 -
Live Nation Entertainment, Inc.
Balance Sheet Data Catalysts/Highlights
(in millions) 9/30/2013 2012 2011 • Ticketing projects and Concerts growth could produce double-digit AOI gains
• FCF acceleration and deleveraging portends possible initiation of share repurchases
• Liberty Media may increase its stake in LYV or seek alternatives for the Company
Cash $ 1,303 $ 1,001 $ 844 Current Assets 2,365 1,813 566 TOTAL ASSETS $ 5,776 $ 5,291 $ 5,077 Current Liabilities $ 2,234 $ 1,768 $ 1,493 Long Term Debt 1,804 1,740 1,705 Shareholders Equity 1,489 1,355 1,616 TOTAL LIABILITIES AND SHAREHOLDERS EQUITY
$ 5,776 $ 5,291 $ 5,077
Fiscal Year Ending December 31
P&L Analysis ($ in millions except per share items)
2012 2011 2010 2009 Revenues 5,819 5,384 5,064 4,181 Net Income (163) (83) (228) (60) Earnings Per Share (0.87) (0.46) (1.36) (1.65) Dividends Per Share NA NA NA NA Price Range 10.88-8.21 12.26-7.33 16.70-8.42 8.90-2.52
INVESTMENT RATIONALE
Live Nation was a top performer from last year’s Forgotten Forty, advancing 99% on the heels of a reacceleration in concert demand and strong execution in the first year of the Company’s 3-year, 30-35% AOI growth strategic plan (AOI up 9% YTD 3Q 2013). As we have discussed previously, concert attendance is a highly discretionary consumer expense. Weak consumer demand globally as well as burdensome contracts kept AOI contribution margins below 1% between 2009-2012 in LYV’s key Concerts division (67% of revenue in 2012). However, there have been real signs of improvement in 2013 YTD with LYV recording a 17% increase in global concert attendance to 44.7 million. This was achieved without significant discounting; LYV recorded a corresponding 16% increase in Concerts segment revenue to $3.4 billion YTD 3Q13. Amphitheatres have driven the majority of attendance growth in 2013, but the Company has also grown its festival business to over 4 million attendees across 61 festivals globally YTD. Most encouragingly, Concerts AOI increased 66% to $100.2 million YTD and management expects AOI to double for the full year. This also translates into Sponsorship and Advertising demand, with segment revenue up 15% and AOI up 12% to $154.3 million YTD.
Despite the stock performance, we believe LYV is still in the early stage of recognizing its potential as envisioned at the time of the Ticketmaster merger in January 2010. The Ticketing division has been a laggard in 2013, with 2% top-line growth and a 4% decline in AOI to $217.4 million YTD. However, we expect to see a reacceleration in profitability growth next year as the Company completes the Ticketmaster platform upgrade. The upgrade is expected to generate $0.35/ticket in cost savings, which would translate to upwards of $50 million annually. Ticketmaster also recently beta-launched its new secondary ticketing platform across 50 sports teams and over 100 concert venues. The new platform integrates primary and secondary tickets on the same website/search results. This enables LYV to capitalize on traffic generated at the venue/Ticketmaster website that previously might have been lost when no primary tickets were available. With only ~$25 million in AOI from the secondary market versus an estimated $4 billion in annual sales industry-wide, the upside from market share gains is meaningful. Additionally, LYV is seeing increased demand for primary tickets under the new system by highlighting their value vs. marked-up secondary tickets. According to the Company, preliminary results showed a 10% increase in primary ticket volume and a 60% increase in total ticket sales under the new system.
There have also been several recent corporate events at Live Nation that we generally view favorably. A year ago, LYV investors received a New Year’s Eve surprise when Chairman Irving Azoff announced his immediate resignation. While Mr. Azoff is well-regarded in the industry, we generally viewed the departure favorably as it portended the more aggressive ticketing re-platform as well as an increased role for Liberty Media. LMC increased its LYV ownership to 27% in repurchase transactions with Mr. Azoff and MSG, and LMC CEO Greg Maffei replaced Mr. Azoff as chairman in March 2013. In June, LYV prevailed in arbitration against CTS Eventim related to Live Nation’s decision to abandon a ticketing software contract following the Ticketmaster merger. LYV shares immediately surged 16.8% in response to the removal of a major overhang. LYV also refinanced its debt in August, which will generate ~$12 million in annual cash interest savings. The completion of the ticketing platform upgrade and related growth capital expenditures could add up to another ~$60 million in free cash flow on an annual basis by late 2014. Although LYV has historically recorded annual GAAP net losses due to excess D&A and other non-cash charges, FCF growth has accelerated to reach $228.6 million ($1.16/share) TTM 3Q 2013 vs. just $155.4 million in 2011 excluding working capital swings. If LYV can reach the midpoint of its 2015 AOI growth target, combined with the aforementioned benefits, we believe free cash flow could reach ~$385 million by 2015. At 13x 2015E FCF, we estimate LYV’s intrinsic value approaches $24/share, implying nearly 30% upside from current levels. Importantly, barring any incremental capital deployment, net leverage could fall from 2.5x to below 1x by the close of 2015. Historically LYV’s free cash flow has primarily been applied toward debt reduction and acquisitions. While smaller-scale acquisitions of festivals/promoters and/or upstart ticketing competitors are possible, we believe LYV may be on the precipice of initiating its first return of capital program since the merger. We are particularly optimistic LYV could become a large-scale repurchaser of shares over the next 1-2 years under the stewardship of LMC and its mantra of leveraged ROE. Finally, we would not dismiss the possibility LMC continues to increase its stake and/or pushes LYV to explore strategic alternatives at some point down the road.
Symbol: LYV Exchange: NYSECurrent Price: $18.51Current Yield: NACurrent Dividend: NAShares Outstanding (MM): 202.1Major Shareholders: Liberty Media 25%Average Daily Trading Volume (MM): 1.252-Week Price Range: $19.62-$8.98Price/Earnings Ratio: NAStated Book Value Per Share: $7.37
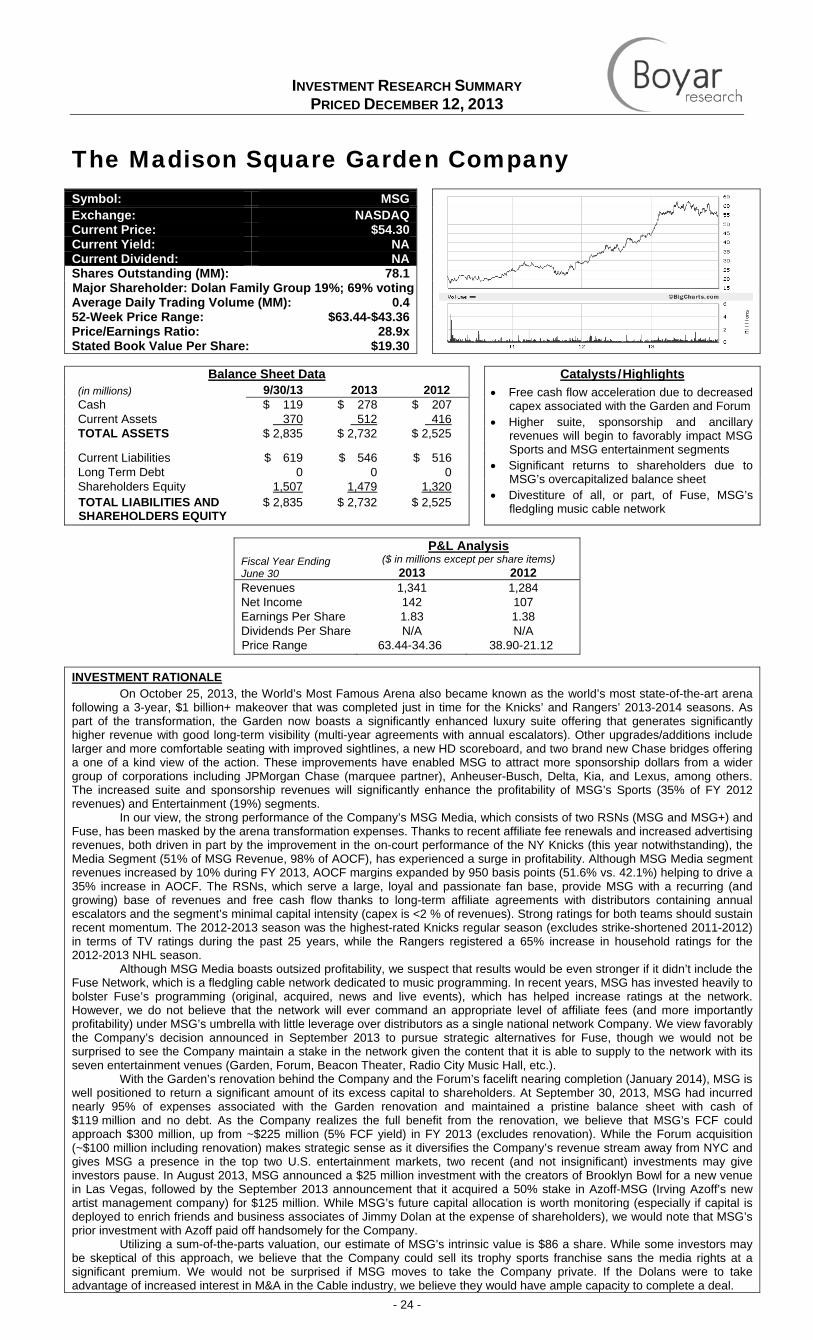
INVESTMENT RESEARCH SUMMARY PRICED DECEMBER 12, 2013
- 24 -
The Madison Square Garden Company
Balance Sheet Data Catalysts/Highlights
(in millions) 9/30/13 2013 2012 • Free cash flow acceleration due to decreased capex associated with the Garden and Forum
• Higher suite, sponsorship and ancillary revenues will begin to favorably impact MSG Sports and MSG entertainment segments
• Significant returns to shareholders due to MSG’s overcapitalized balance sheet
• Divestiture of all, or part, of Fuse, MSG’s fledgling music cable network
Cash $ 119 $ 278 $ 207 Current Assets 370 512 416 TOTAL ASSETS $ 2,835 $ 2,732 $ 2,525
Current Liabilities $ 619 $ 546 $ 516 Long Term Debt 0 0 0 Shareholders Equity 1,507 1,479 1,320 TOTAL LIABILITIES AND SHAREHOLDERS EQUITY
$ 2,835 $ 2,732 $ 2,525
Fiscal Year Ending June 30
P&L Analysis ($ in millions except per share items)
2013 2012Revenues 1,341 1,284 Net Income 142 107 Earnings Per Share 1.83 1.38 Dividends Per Share N/A N/A Price Range 63.44-34.36 38.90-21.12
INVESTMENT RATIONALE
On October 25, 2013, the World’s Most Famous Arena also became known as the world’s most state-of-the-art arena following a 3-year, $1 billion+ makeover that was completed just in time for the Knicks’ and Rangers’ 2013-2014 seasons. As part of the transformation, the Garden now boasts a significantly enhanced luxury suite offering that generates significantly higher revenue with good long-term visibility (multi-year agreements with annual escalators). Other upgrades/additions include larger and more comfortable seating with improved sightlines, a new HD scoreboard, and two brand new Chase bridges offering a one of a kind view of the action. These improvements have enabled MSG to attract more sponsorship dollars from a wider group of corporations including JPMorgan Chase (marquee partner), Anheuser-Busch, Delta, Kia, and Lexus, among others. The increased suite and sponsorship revenues will significantly enhance the profitability of MSG’s Sports (35% of FY 2012 revenues) and Entertainment (19%) segments.
In our view, the strong performance of the Company’s MSG Media, which consists of two RSNs (MSG and MSG+) and Fuse, has been masked by the arena transformation expenses. Thanks to recent affiliate fee renewals and increased advertising revenues, both driven in part by the improvement in the on-court performance of the NY Knicks (this year notwithstanding), the Media Segment (51% of MSG Revenue, 98% of AOCF), has experienced a surge in profitability. Although MSG Media segment revenues increased by 10% during FY 2013, AOCF margins expanded by 950 basis points (51.6% vs. 42.1%) helping to drive a 35% increase in AOCF. The RSNs, which serve a large, loyal and passionate fan base, provide MSG with a recurring (and growing) base of revenues and free cash flow thanks to long-term affiliate agreements with distributors containing annual escalators and the segment’s minimal capital intensity (capex is <2 % of revenues). Strong ratings for both teams should sustain recent momentum. The 2012-2013 season was the highest-rated Knicks regular season (excludes strike-shortened 2011-2012) in terms of TV ratings during the past 25 years, while the Rangers registered a 65% increase in household ratings for the 2012-2013 NHL season.
Although MSG Media boasts outsized profitability, we suspect that results would be even stronger if it didn’t include the Fuse Network, which is a fledgling cable network dedicated to music programming. In recent years, MSG has invested heavily to bolster Fuse’s programming (original, acquired, news and live events), which has helped increase ratings at the network. However, we do not believe that the network will ever command an appropriate level of affiliate fees (and more importantly profitability) under MSG’s umbrella with little leverage over distributors as a single national network Company. We view favorably the Company’s decision announced in September 2013 to pursue strategic alternatives for Fuse, though we would not be surprised to see the Company maintain a stake in the network given the content that it is able to supply to the network with its seven entertainment venues (Garden, Forum, Beacon Theater, Radio City Music Hall, etc.).
With the Garden’s renovation behind the Company and the Forum’s facelift nearing completion (January 2014), MSG is well positioned to return a significant amount of its excess capital to shareholders. At September 30, 2013, MSG had incurred nearly 95% of expenses associated with the Garden renovation and maintained a pristine balance sheet with cash of $119 million and no debt. As the Company realizes the full benefit from the renovation, we believe that MSG’s FCF could approach $300 million, up from ~$225 million (5% FCF yield) in FY 2013 (excludes renovation). While the Forum acquisition (~$100 million including renovation) makes strategic sense as it diversifies the Company’s revenue stream away from NYC and gives MSG a presence in the top two U.S. entertainment markets, two recent (and not insignificant) investments may give investors pause. In August 2013, MSG announced a $25 million investment with the creators of Brooklyn Bowl for a new venue in Las Vegas, followed by the September 2013 announcement that it acquired a 50% stake in Azoff-MSG (Irving Azoff’s new artist management company) for $125 million. While MSG’s future capital allocation is worth monitoring (especially if capital is deployed to enrich friends and business associates of Jimmy Dolan at the expense of shareholders), we would note that MSG’s prior investment with Azoff paid off handsomely for the Company.
Utilizing a sum-of-the-parts valuation, our estimate of MSG’s intrinsic value is $86 a share. While some investors may be skeptical of this approach, we believe that the Company could sell its trophy sports franchise sans the media rights at a significant premium. We would not be surprised if MSG moves to take the Company private. If the Dolans were to take advantage of increased interest in M&A in the Cable industry, we believe they would have ample capacity to complete a deal.
Symbol: MSG Exchange: NASDAQCurrent Price: $54.30Current Yield: NACurrent Dividend: NAShares Outstanding (MM): 78.1Major Shareholder: Dolan Family Group 19%; 69% votingAverage Daily Trading Volume (MM): 0.452-Week Price Range: $63.44-$43.36Price/Earnings Ratio: 28.9xStated Book Value Per Share: $19.30
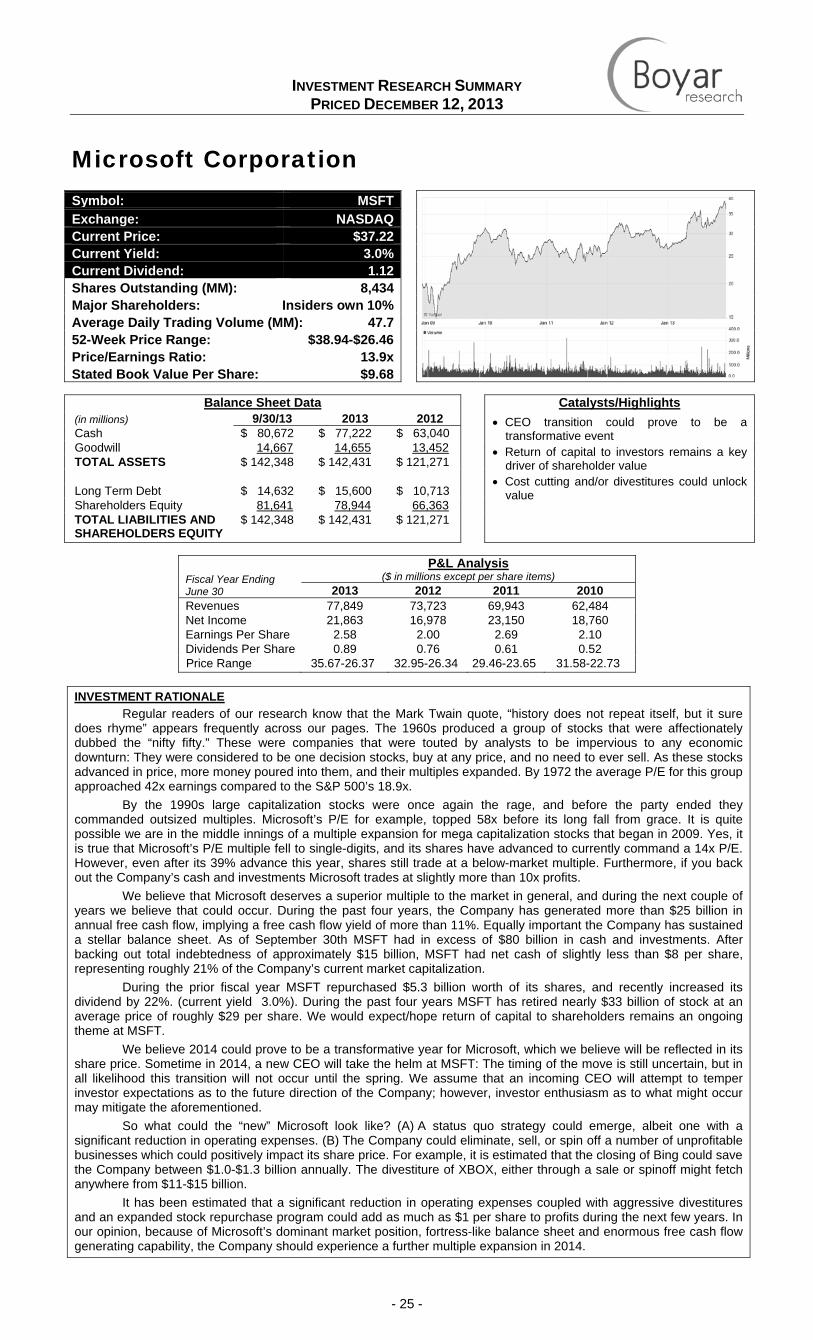
INVESTMENT RESEARCH SUMMARY PRICED DECEMBER 12, 2013
- 25 -
Microsoft Corporation
Balance Sheet Data Catalysts/Highlights
(in millions) 9/30/13 2013 2012 • CEO transition could prove to be a transformative event
• Return of capital to investors remains a key driver of shareholder value
• Cost cutting and/or divestitures could unlock value
Cash $ 80,672 $ 77,222 $ 63,040 Goodwill 14,667 14,655 13,452 TOTAL ASSETS $ 142,348 $ 142,431 $ 121,271 Long Term Debt $ 14,632 $ 15,600 $ 10,713 Shareholders Equity 81,641 78,944 66,363 TOTAL LIABILITIES AND SHAREHOLDERS EQUITY
$ 142,348 $ 142,431 $ 121,271
Fiscal Year Ending June 30
P&L Analysis ($ in millions except per share items)
2013 2012 2011 2010 Revenues 77,849 73,723 69,943 62,484 Net Income 21,863 16,978 23,150 18,760 Earnings Per Share 2.58 2.00 2.69 2.10 Dividends Per Share 0.89 0.76 0.61 0.52 Price Range 35.67-26.37 32.95-26.34 29.46-23.65 31.58-22.73
INVESTMENT RATIONALE
Regular readers of our research know that the Mark Twain quote, “history does not repeat itself, but it sure does rhyme” appears frequently across our pages. The 1960s produced a group of stocks that were affectionately dubbed the “nifty fifty.” These were companies that were touted by analysts to be impervious to any economic downturn: They were considered to be one decision stocks, buy at any price, and no need to ever sell. As these stocks advanced in price, more money poured into them, and their multiples expanded. By 1972 the average P/E for this group approached 42x earnings compared to the S&P 500’s 18.9x.
By the 1990s large capitalization stocks were once again the rage, and before the party ended they commanded outsized multiples. Microsoft’s P/E for example, topped 58x before its long fall from grace. It is quite possible we are in the middle innings of a multiple expansion for mega capitalization stocks that began in 2009. Yes, it is true that Microsoft’s P/E multiple fell to single-digits, and its shares have advanced to currently command a 14x P/E. However, even after its 39% advance this year, shares still trade at a below-market multiple. Furthermore, if you back out the Company’s cash and investments Microsoft trades at slightly more than 10x profits.
We believe that Microsoft deserves a superior multiple to the market in general, and during the next couple of years we believe that could occur. During the past four years, the Company has generated more than $25 billion in annual free cash flow, implying a free cash flow yield of more than 11%. Equally important the Company has sustained a stellar balance sheet. As of September 30th MSFT had in excess of $80 billion in cash and investments. After backing out total indebtedness of approximately $15 billion, MSFT had net cash of slightly less than $8 per share, representing roughly 21% of the Company’s current market capitalization.
During the prior fiscal year MSFT repurchased $5.3 billion worth of its shares, and recently increased its dividend by 22%. (current yield 3.0%). During the past four years MSFT has retired nearly $33 billion of stock at an average price of roughly $29 per share. We would expect/hope return of capital to shareholders remains an ongoing theme at MSFT.
We believe 2014 could prove to be a transformative year for Microsoft, which we believe will be reflected in its share price. Sometime in 2014, a new CEO will take the helm at MSFT: The timing of the move is still uncertain, but in all likelihood this transition will not occur until the spring. We assume that an incoming CEO will attempt to temper investor expectations as to the future direction of the Company; however, investor enthusiasm as to what might occur may mitigate the aforementioned.
So what could the “new” Microsoft look like? (A) A status quo strategy could emerge, albeit one with a significant reduction in operating expenses. (B) The Company could eliminate, sell, or spin off a number of unprofitable businesses which could positively impact its share price. For example, it is estimated that the closing of Bing could save the Company between $1.0-$1.3 billion annually. The divestiture of XBOX, either through a sale or spinoff might fetch anywhere from $11-$15 billion.
It has been estimated that a significant reduction in operating expenses coupled with aggressive divestitures and an expanded stock repurchase program could add as much as $1 per share to profits during the next few years. In our opinion, because of Microsoft’s dominant market position, fortress-like balance sheet and enormous free cash flow generating capability, the Company should experience a further multiple expansion in 2014.
Symbol: MSFT Exchange: NASDAQCurrent Price: $37.22Current Yield: 3.0%Current Dividend: 1.12Shares Outstanding (MM): 8,434Major Shareholders: Insiders own 10%Average Daily Trading Volume (MM): 47.752-Week Price Range: $38.94-$26.46Price/Earnings Ratio: 13.9xStated Book Value Per Share: $9.68
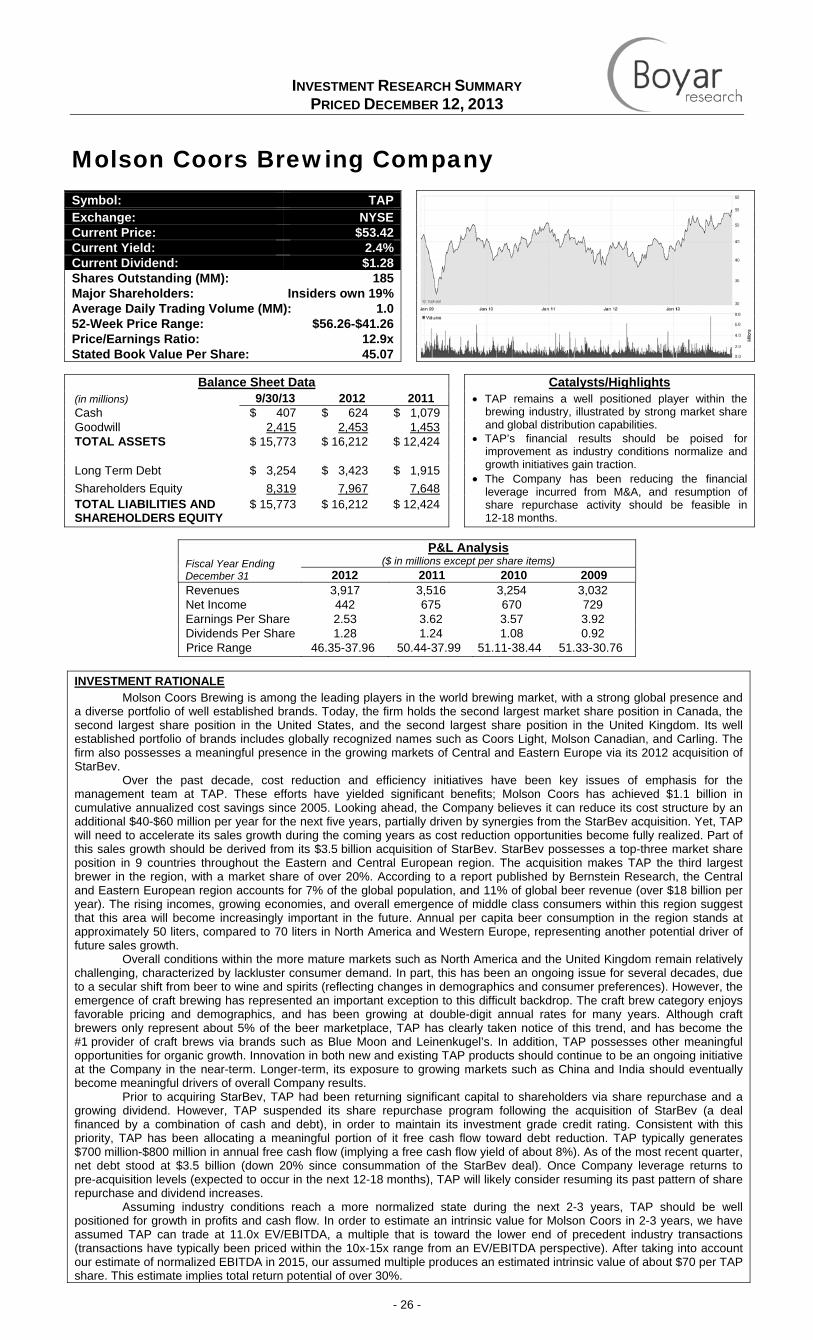
INVESTMENT RESEARCH SUMMARY PRICED DECEMBER 12, 2013
- 26 -
Molson Coors Brewing Company
Balance Sheet Data Catalysts/Highlights
(in millions) 9/30/13 2012 2011 • TAP remains a well positioned player within the brewing industry, illustrated by strong market share and global distribution capabilities.
• TAP’s financial results should be poised for improvement as industry conditions normalize and growth initiatives gain traction.
• The Company has been reducing the financial leverage incurred from M&A, and resumption of share repurchase activity should be feasible in 12-18 months.
Cash $ 407 $ 624 $ 1,079 Goodwill 2,415 2,453 1,453 TOTAL ASSETS $ 15,773 $ 16,212 $ 12,424 Long Term Debt $ 3,254 $ 3,423 $ 1,915 Shareholders Equity 8,319 7,967 7,648 TOTAL LIABILITIES AND SHAREHOLDERS EQUITY
$ 15,773 $ 16,212 $ 12,424
Fiscal Year Ending December 31
P&L Analysis ($ in millions except per share items)
2012 2011 2010 2009 Revenues 3,917 3,516 3,254 3,032 Net Income 442 675 670 729 Earnings Per Share 2.53 3.62 3.57 3.92 Dividends Per Share 1.28 1.24 1.08 0.92 Price Range 46.35-37.96 50.44-37.99 51.11-38.44 51.33-30.76
INVESTMENT RATIONALE
Molson Coors Brewing is among the leading players in the world brewing market, with a strong global presence and a diverse portfolio of well established brands. Today, the firm holds the second largest market share position in Canada, the second largest share position in the United States, and the second largest share position in the United Kingdom. Its well established portfolio of brands includes globally recognized names such as Coors Light, Molson Canadian, and Carling. The firm also possesses a meaningful presence in the growing markets of Central and Eastern Europe via its 2012 acquisition of StarBev.
Over the past decade, cost reduction and efficiency initiatives have been key issues of emphasis for the management team at TAP. These efforts have yielded significant benefits; Molson Coors has achieved $1.1 billion in cumulative annualized cost savings since 2005. Looking ahead, the Company believes it can reduce its cost structure by an additional $40-$60 million per year for the next five years, partially driven by synergies from the StarBev acquisition. Yet, TAP will need to accelerate its sales growth during the coming years as cost reduction opportunities become fully realized. Part of this sales growth should be derived from its $3.5 billion acquisition of StarBev. StarBev possesses a top-three market share position in 9 countries throughout the Eastern and Central European region. The acquisition makes TAP the third largest brewer in the region, with a market share of over 20%. According to a report published by Bernstein Research, the Central and Eastern European region accounts for 7% of the global population, and 11% of global beer revenue (over $18 billion per year). The rising incomes, growing economies, and overall emergence of middle class consumers within this region suggest that this area will become increasingly important in the future. Annual per capita beer consumption in the region stands at approximately 50 liters, compared to 70 liters in North America and Western Europe, representing another potential driver of future sales growth.
Overall conditions within the more mature markets such as North America and the United Kingdom remain relatively challenging, characterized by lackluster consumer demand. In part, this has been an ongoing issue for several decades, due to a secular shift from beer to wine and spirits (reflecting changes in demographics and consumer preferences). However, the emergence of craft brewing has represented an important exception to this difficult backdrop. The craft brew category enjoys favorable pricing and demographics, and has been growing at double-digit annual rates for many years. Although craft brewers only represent about 5% of the beer marketplace, TAP has clearly taken notice of this trend, and has become the #1 provider of craft brews via brands such as Blue Moon and Leinenkugel’s. In addition, TAP possesses other meaningful opportunities for organic growth. Innovation in both new and existing TAP products should continue to be an ongoing initiative at the Company in the near-term. Longer-term, its exposure to growing markets such as China and India should eventually become meaningful drivers of overall Company results.
Prior to acquiring StarBev, TAP had been returning significant capital to shareholders via share repurchase and a growing dividend. However, TAP suspended its share repurchase program following the acquisition of StarBev (a deal financed by a combination of cash and debt), in order to maintain its investment grade credit rating. Consistent with this priority, TAP has been allocating a meaningful portion of it free cash flow toward debt reduction. TAP typically generates $700 million-$800 million in annual free cash flow (implying a free cash flow yield of about 8%). As of the most recent quarter, net debt stood at $3.5 billion (down 20% since consummation of the StarBev deal). Once Company leverage returns to pre-acquisition levels (expected to occur in the next 12-18 months), TAP will likely consider resuming its past pattern of share repurchase and dividend increases.
Assuming industry conditions reach a more normalized state during the next 2-3 years, TAP should be well positioned for growth in profits and cash flow. In order to estimate an intrinsic value for Molson Coors in 2-3 years, we have assumed TAP can trade at 11.0x EV/EBITDA, a multiple that is toward the lower end of precedent industry transactions (transactions have typically been priced within the 10x-15x range from an EV/EBITDA perspective). After taking into account our estimate of normalized EBITDA in 2015, our assumed multiple produces an estimated intrinsic value of about $70 per TAP share. This estimate implies total return potential of over 30%.
Symbol: TAP Exchange: NYSECurrent Price: $53.42Current Yield: 2.4%Current Dividend: $1.28Shares Outstanding (MM): 185Major Shareholders: Insiders own 19%Average Daily Trading Volume (MM): 1.052-Week Price Range: $56.26-$41.26Price/Earnings Ratio: 12.9xStated Book Value Per Share: 45.07

INVESTMENT RESEARCH SUMMARY PRICED DECEMBER 12, 2013
- 27 -
Regal Entertainment Group
Balance Sheet Data Catalysts/Highlights
(in millions) 9/26/2013 2012 2011 • Industry box office revenues continue to grow with refocus on proven franchises, more balanced release schedule, 3D and premium large format
• Regal continues to consolidate at accretive multiples
• Outsized free cash flow and cash buildup could spur special dividends
Cash $ 270 $ 110 $ 253 Current Assets 367 258 404 TOTAL ASSETS $ 2,508 $ 2,209 $ 2,341 Current Liabilities $ 313 $ 388 $ 401 Long Term Debt 2,211 1,934 1,946 Shareholders Equity (657) (697) (571) TOTAL LIABILITIES AND SHAREHOLDERS EQUITY
$ 2,508 $ 2,209 $ 2,341
52 Weeks Ending December 27
P&L Analysis ($ in millions except per share items)
2012 2011 2010 2009 Revenues 2,824 2,682 2,808 2,894 Net Income 145 40 78 96 Earnings Per Share 0.93 0.26 0.50 0.62 Dividends Per Share 1.84 0.84 2.12 0.72 Price Range 15.84-11.58 14.94-11.23 18.28-11.74 14.69-9.29
INVESTMENT RATIONALE
Regal is the largest movie theatre exhibitor in the U.S., operating 575 theatres and 7,334 screens in 43 of the top 50 U.S. DMAs. As AAF discussed more fully in our January 2013 initiation report, we believe investors have long been deterred from Regal shares due to the popular misconception that the movie theatre industry is in a permanent state of decline. In reality, Regal is best-positioned (largest and highest quality theatre circuit) in a consolidating industry featuring local pricing power and stable margins. Although domestic movie theatre attendance has been stagnant over the past decade, Regal has managed to increase average ticket prices at a 4% CAGR, including through the recession. Following record industry-wide box office revenues in 2012 (up 6%), revenues are up another 1.5% YTD through mid-October. Despite concerns over a shrinking theatre release window and continued VOD growth, we expect movie studios to continue to support the theatrical window given its superior economics and essential showcasing/marketing role.
Additional long-term growth should come from further popularization of premium screen (IMAX, RPX, etc.) movie viewing, which generate greater than $5 in incremental average ticket price. Regal expects to operate 165-170 premium screens by the close of 2014. The Company is also seeing early success with an expanded food menu featuring premium items. With only ~145 theatres currently offering the menu, further conversion could provide a meaningful boost to concessions revenue as the menu is introduced over time. Management also recently reiterated their commitment to experimenting with various premium theatre models (e.g. luxury amenities, alcohol, etc.). RGC’s financial results are also beginning to benefit from the Open Roads Films film distribution JV with AMC, launched in 2012. The JV reversed from an operating loss of $32.4 million in 2012 to $19.3 million in operating income on $125.8 million revenue YTD 3Q 2013.
We are most attracted by Regal’s consistent annual free cash flow generation and capital allocation policy. RGC generated $336 million ($2.16/share) in FCF over the past 4 quarters and has averaged an impressive $272 million in FCF over the past 10 years. RGC’s consistent FCF generation also enables the Company to comfortably maintain a leveraged balance sheet. Under Anschutz Company’s control, RGC has an enviable record of utilizing FCF generation and prudent leverage for the benefit of shareholders. Regal has paid in excess of $24/share in dividends (both quarterly and special dividends) since completing an IPO in 2002. At the same time, Regal continues to be an acquirer in an industry rapidly undergoing consolidation as independents and regional chains struggle to compete. With only a small number of strategic buyers and virtually zero competition from financial buyers (who cannot generate the same purchase synergies), this enables RGC to pursue acquisitions while maintaining a disciplined 5x-7x EBITDA multiple hurdle. On top of this, Regal can extract purchasing synergies that typically add ~0.5x-1.0x EBITDA turn in incremental value. As of 3Q 2013, Regal’s pro forma net leverage stood at 3.2x EBITDA, well within historical levels. The Company has begun to take advantage of the ultra-low interest rate environment to retire high-cost debt and extend its maturities, issuing $500 million in senior notes due between 2013-2015 at sub-6% interest rates. With $270 million in cash already on the balance sheet plus continued FCF generation, RGC is well positioned to return excess capital to shareholders via increasing the quarterly dividend rate and/or issuing special dividends in the coming years while continuing to opportunistically pursue acquisitions.
Despite RGC shares’ 46% total return in 2013, RGC still trades at only 9.0x TTM FCF. At 12x 2014E FCF, we estimate RGC’s intrinsic value could reach $26 per share over the coming year. This is in line with the FCF multiple paid by Wanda Group to acquire RGC’s largest competitor, AMC Entertainment, in September 2012. We would also note that our intrinsic value gives no additional value for Regal’s large real estate holdings. In addition to a possible special dividend, we would not exclude the possibility that a change of ownership could serve as a catalyst for shareholder value creation over the coming year. We view Regal as a prime acquisition candidate for private equity given the Company’s stable free cash flow and room for significantly higher leverage. Anschutz Corporation maintains control of RGC and has made no indications of interest in disposing of its stake, but we would note that Mr. Anschutz (turning 74 in 2013) recently explored a sale of another of his privately held companies, AEG, before calling it off due to unsatisfactory bids.
Symbol: RGC Exchange: NYSECurrent Price: $19.40Current Yield: 4.3%Current Dividend: 0.84Shares Outstanding (MM): 155.8Major Shareholders: Anschutz Co. 48%; 78% votingAverage Daily Trading Volume (MM): 0.852-Week Price Range: $19.72-$13.45Price/Earnings Ratio: 17.6xStated Book Value Per Share: NA
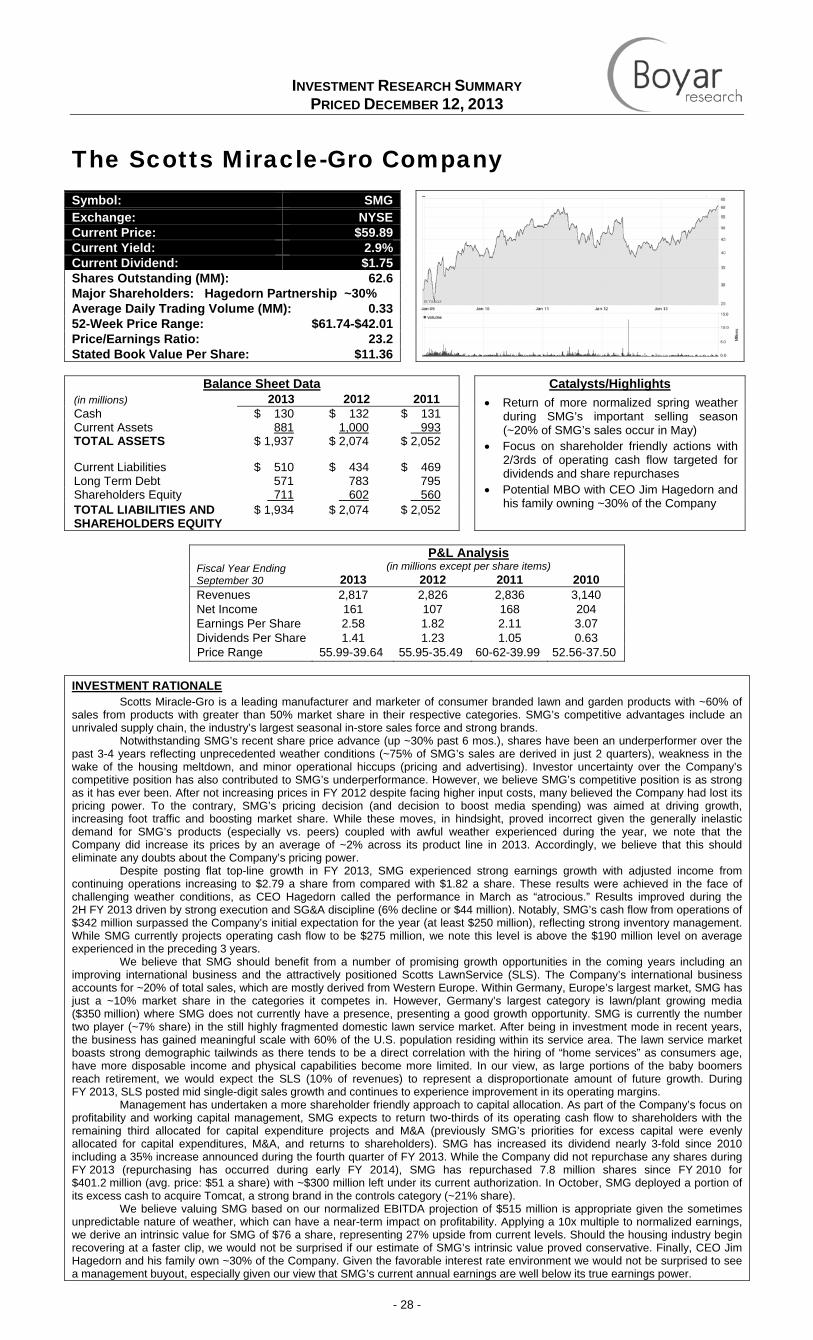
INVESTMENT RESEARCH SUMMARY PRICED DECEMBER 12, 2013
- 28 -
The Scotts Miracle-Gro Company
Balance Sheet Data Catalysts/Highlights
(in millions) 2013 2012 2011 • Return of more normalized spring weather during SMG’s important selling season (~20% of SMG’s sales occur in May)
• Focus on shareholder friendly actions with 2/3rds of operating cash flow targeted for dividends and share repurchases
• Potential MBO with CEO Jim Hagedorn and his family owning ~30% of the Company
Cash $ 130 $ 132 $ 131 Current Assets 881 1,000 993 TOTAL ASSETS $ 1,937 $ 2,074 $ 2,052 Current Liabilities $ 510 $ 434 $ 469 Long Term Debt 571 783 795 Shareholders Equity 711 602 560 TOTAL LIABILITIES AND SHAREHOLDERS EQUITY
$ 1,934 $ 2,074 $ 2,052
Fiscal Year Ending September 30
P&L Analysis (in millions except per share items)
2013 2012 2011 2010 Revenues 2,817 2,826 2,836 3,140 Net Income 161 107 168 204 Earnings Per Share 2.58 1.82 2.11 3.07 Dividends Per Share 1.41 1.23 1.05 0.63 Price Range 55.99-39.64 55.95-35.49 60-62-39.99 52.56-37.50
INVESTMENT RATIONALE
Scotts Miracle-Gro is a leading manufacturer and marketer of consumer branded lawn and garden products with ~60% of sales from products with greater than 50% market share in their respective categories. SMG’s competitive advantages include an unrivaled supply chain, the industry’s largest seasonal in-store sales force and strong brands.
Notwithstanding SMG’s recent share price advance (up ~30% past 6 mos.), shares have been an underperformer over the past 3-4 years reflecting unprecedented weather conditions (~75% of SMG’s sales are derived in just 2 quarters), weakness in the wake of the housing meltdown, and minor operational hiccups (pricing and advertising). Investor uncertainty over the Company’s competitive position has also contributed to SMG’s underperformance. However, we believe SMG’s competitive position is as strong as it has ever been. After not increasing prices in FY 2012 despite facing higher input costs, many believed the Company had lost its pricing power. To the contrary, SMG’s pricing decision (and decision to boost media spending) was aimed at driving growth, increasing foot traffic and boosting market share. While these moves, in hindsight, proved incorrect given the generally inelastic demand for SMG’s products (especially vs. peers) coupled with awful weather experienced during the year, we note that the Company did increase its prices by an average of ~2% across its product line in 2013. Accordingly, we believe that this should eliminate any doubts about the Company’s pricing power.
Despite posting flat top-line growth in FY 2013, SMG experienced strong earnings growth with adjusted income from continuing operations increasing to $2.79 a share from compared with $1.82 a share. These results were achieved in the face of challenging weather conditions, as CEO Hagedorn called the performance in March as “atrocious.” Results improved during the 2H FY 2013 driven by strong execution and SG&A discipline (6% decline or $44 million). Notably, SMG’s cash flow from operations of $342 million surpassed the Company’s initial expectation for the year (at least $250 million), reflecting strong inventory management. While SMG currently projects operating cash flow to be $275 million, we note this level is above the $190 million level on average experienced in the preceding 3 years.
We believe that SMG should benefit from a number of promising growth opportunities in the coming years including an improving international business and the attractively positioned Scotts LawnService (SLS). The Company’s international business accounts for ~20% of total sales, which are mostly derived from Western Europe. Within Germany, Europe’s largest market, SMG has just a ~10% market share in the categories it competes in. However, Germany’s largest category is lawn/plant growing media ($350 million) where SMG does not currently have a presence, presenting a good growth opportunity. SMG is currently the number two player (~7% share) in the still highly fragmented domestic lawn service market. After being in investment mode in recent years, the business has gained meaningful scale with 60% of the U.S. population residing within its service area. The lawn service market boasts strong demographic tailwinds as there tends to be a direct correlation with the hiring of “home services” as consumers age, have more disposable income and physical capabilities become more limited. In our view, as large portions of the baby boomers reach retirement, we would expect the SLS (10% of revenues) to represent a disproportionate amount of future growth. During FY 2013, SLS posted mid single-digit sales growth and continues to experience improvement in its operating margins.
Management has undertaken a more shareholder friendly approach to capital allocation. As part of the Company’s focus on profitability and working capital management, SMG expects to return two-thirds of its operating cash flow to shareholders with the remaining third allocated for capital expenditure projects and M&A (previously SMG’s priorities for excess capital were evenly allocated for capital expenditures, M&A, and returns to shareholders). SMG has increased its dividend nearly 3-fold since 2010 including a 35% increase announced during the fourth quarter of FY 2013. While the Company did not repurchase any shares during FY 2013 (repurchasing has occurred during early FY 2014), SMG has repurchased 7.8 million shares since FY 2010 for $401.2 million (avg. price: $51 a share) with ~$300 million left under its current authorization. In October, SMG deployed a portion of its excess cash to acquire Tomcat, a strong brand in the controls category (~21% share).
We believe valuing SMG based on our normalized EBITDA projection of $515 million is appropriate given the sometimes unpredictable nature of weather, which can have a near-term impact on profitability. Applying a 10x multiple to normalized earnings, we derive an intrinsic value for SMG of $76 a share, representing 27% upside from current levels. Should the housing industry begin recovering at a faster clip, we would not be surprised if our estimate of SMG’s intrinsic value proved conservative. Finally, CEO Jim Hagedorn and his family own ~30% of the Company. Given the favorable interest rate environment we would not be surprised to see a management buyout, especially given our view that SMG’s current annual earnings are well below its true earnings power.
Symbol: SMG Exchange: NYSECurrent Price: $59.89Current Yield: 2.9%Current Dividend: $1.75Shares Outstanding (MM): 62.6Major Shareholders: Hagedorn Partnership ~30% Average Daily Trading Volume (MM): 0.3352-Week Price Range: $61.74-$42.01Price/Earnings Ratio: 23.2Stated Book Value Per Share: $11.36
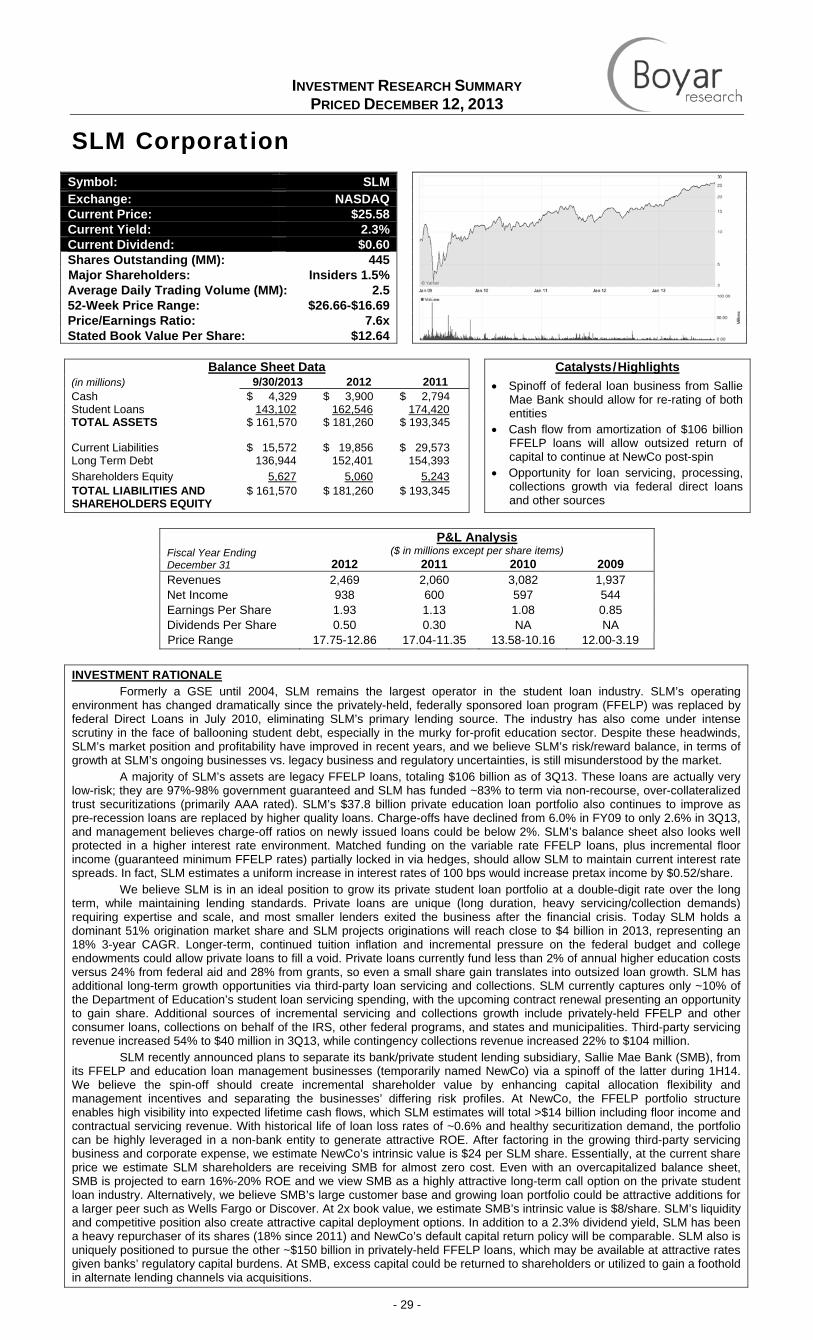
INVESTMENT RESEARCH SUMMARY PRICED DECEMBER 12, 2013
- 29 -
SLM Corporation
Balance Sheet Data Catalysts/Highlights
(in millions) 9/30/2013 2012 2011 • Spinoff of federal loan business from Sallie Mae Bank should allow for re-rating of both entities
• Cash flow from amortization of $106 billion FFELP loans will allow outsized return of capital to continue at NewCo post-spin
• Opportunity for loan servicing, processing, collections growth via federal direct loans and other sources
Cash $ 4,329 $ 3,900 $ 2,794 Student Loans 143,102 162,546 174,420 TOTAL ASSETS $ 161,570 $ 181,260 $ 193,345 Current Liabilities $ 15,572 $ 19,856 $ 29,573 Long Term Debt 136,944 152,401 154,393 Shareholders Equity 5,627 5,060 5,243 TOTAL LIABILITIES AND SHAREHOLDERS EQUITY
$ 161,570 $ 181,260 $ 193,345
Fiscal Year Ending December 31
P&L Analysis ($ in millions except per share items)
2012 2011 2010 2009 Revenues 2,469 2,060 3,082 1,937 Net Income 938 600 597 544 Earnings Per Share 1.93 1.13 1.08 0.85 Dividends Per Share 0.50 0.30 NA NA Price Range 17.75-12.86 17.04-11.35 13.58-10.16 12.00-3.19
INVESTMENT RATIONALE
Formerly a GSE until 2004, SLM remains the largest operator in the student loan industry. SLM’s operating environment has changed dramatically since the privately-held, federally sponsored loan program (FFELP) was replaced by federal Direct Loans in July 2010, eliminating SLM’s primary lending source. The industry has also come under intense scrutiny in the face of ballooning student debt, especially in the murky for-profit education sector. Despite these headwinds, SLM’s market position and profitability have improved in recent years, and we believe SLM’s risk/reward balance, in terms of growth at SLM’s ongoing businesses vs. legacy business and regulatory uncertainties, is still misunderstood by the market.
A majority of SLM’s assets are legacy FFELP loans, totaling $106 billion as of 3Q13. These loans are actually very low-risk; they are 97%-98% government guaranteed and SLM has funded ~83% to term via non-recourse, over-collateralized trust securitizations (primarily AAA rated). SLM’s $37.8 billion private education loan portfolio also continues to improve as pre-recession loans are replaced by higher quality loans. Charge-offs have declined from 6.0% in FY09 to only 2.6% in 3Q13, and management believes charge-off ratios on newly issued loans could be below 2%. SLM’s balance sheet also looks well protected in a higher interest rate environment. Matched funding on the variable rate FFELP loans, plus incremental floor income (guaranteed minimum FFELP rates) partially locked in via hedges, should allow SLM to maintain current interest rate spreads. In fact, SLM estimates a uniform increase in interest rates of 100 bps would increase pretax income by $0.52/share.
We believe SLM is in an ideal position to grow its private student loan portfolio at a double-digit rate over the long term, while maintaining lending standards. Private loans are unique (long duration, heavy servicing/collection demands) requiring expertise and scale, and most smaller lenders exited the business after the financial crisis. Today SLM holds a dominant 51% origination market share and SLM projects originations will reach close to $4 billion in 2013, representing an 18% 3-year CAGR. Longer-term, continued tuition inflation and incremental pressure on the federal budget and college endowments could allow private loans to fill a void. Private loans currently fund less than 2% of annual higher education costs versus 24% from federal aid and 28% from grants, so even a small share gain translates into outsized loan growth. SLM has additional long-term growth opportunities via third-party loan servicing and collections. SLM currently captures only ~10% of the Department of Education’s student loan servicing spending, with the upcoming contract renewal presenting an opportunity to gain share. Additional sources of incremental servicing and collections growth include privately-held FFELP and other consumer loans, collections on behalf of the IRS, other federal programs, and states and municipalities. Third-party servicing revenue increased 54% to $40 million in 3Q13, while contingency collections revenue increased 22% to $104 million.
SLM recently announced plans to separate its bank/private student lending subsidiary, Sallie Mae Bank (SMB), from its FFELP and education loan management businesses (temporarily named NewCo) via a spinoff of the latter during 1H14. We believe the spin-off should create incremental shareholder value by enhancing capital allocation flexibility and management incentives and separating the businesses’ differing risk profiles. At NewCo, the FFELP portfolio structure enables high visibility into expected lifetime cash flows, which SLM estimates will total >$14 billion including floor income and contractual servicing revenue. With historical life of loan loss rates of ~0.6% and healthy securitization demand, the portfolio can be highly leveraged in a non-bank entity to generate attractive ROE. After factoring in the growing third-party servicing business and corporate expense, we estimate NewCo’s intrinsic value is $24 per SLM share. Essentially, at the current share price we estimate SLM shareholders are receiving SMB for almost zero cost. Even with an overcapitalized balance sheet, SMB is projected to earn 16%-20% ROE and we view SMB as a highly attractive long-term call option on the private student loan industry. Alternatively, we believe SMB’s large customer base and growing loan portfolio could be attractive additions for a larger peer such as Wells Fargo or Discover. At 2x book value, we estimate SMB’s intrinsic value is $8/share. SLM’s liquidity and competitive position also create attractive capital deployment options. In addition to a 2.3% dividend yield, SLM has been a heavy repurchaser of its shares (18% since 2011) and NewCo’s default capital return policy will be comparable. SLM also is uniquely positioned to pursue the other ~$150 billion in privately-held FFELP loans, which may be available at attractive rates given banks’ regulatory capital burdens. At SMB, excess capital could be returned to shareholders or utilized to gain a foothold in alternate lending channels via acquisitions.
Symbol: SLM Exchange: NASDAQCurrent Price: $25.58Current Yield: 2.3%Current Dividend: $0.60Shares Outstanding (MM): 445Major Shareholders: Insiders 1.5%Average Daily Trading Volume (MM): 2.552-Week Price Range: $26.66-$16.69Price/Earnings Ratio: 7.6xStated Book Value Per Share: $12.64
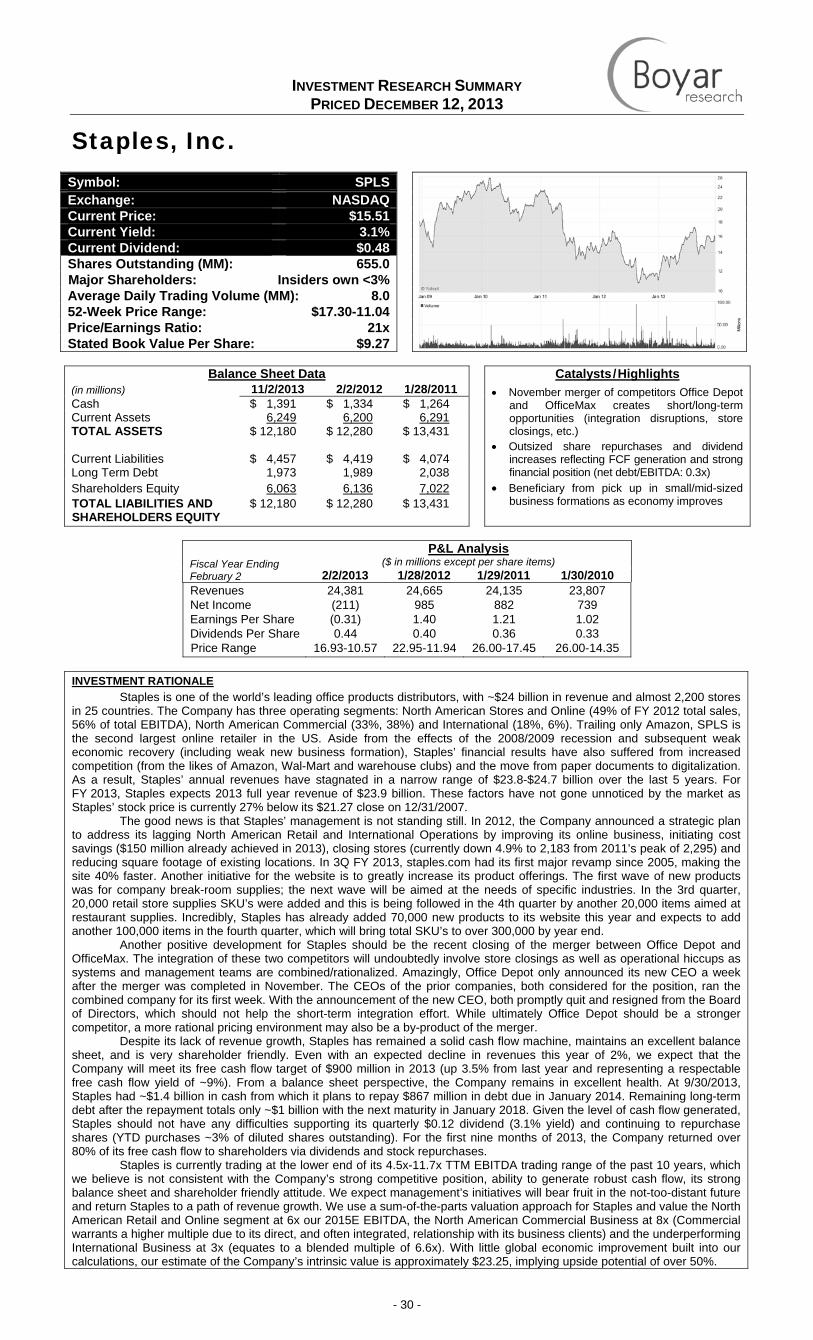
INVESTMENT RESEARCH SUMMARY PRICED DECEMBER 12, 2013
- 30 -
Staples, Inc.
Balance Sheet Data Catalysts/Highlights
(in millions) 11/2/2013 2/2/2012 1/28/2011 • November merger of competitors Office Depot and OfficeMax creates short/long-term opportunities (integration disruptions, store closings, etc.)
• Outsized share repurchases and dividend increases reflecting FCF generation and strong financial position (net debt/EBITDA: 0.3x)
• Beneficiary from pick up in small/mid-sized business formations as economy improves
Cash $ 1,391 $ 1,334 $ 1,264 Current Assets 6,249 6,200 6,291 TOTAL ASSETS $ 12,180 $ 12,280 $ 13,431 Current Liabilities $ 4,457 $ 4,419 $ 4,074 Long Term Debt 1,973 1,989 2,038 Shareholders Equity 6,063 6,136 7,022 TOTAL LIABILITIES AND SHAREHOLDERS EQUITY
$ 12,180 $ 12,280 $ 13,431
Fiscal Year Ending February 2
P&L Analysis ($ in millions except per share items)
2/2/2013 1/28/2012 1/29/2011 1/30/2010 Revenues 24,381 24,665 24,135 23,807 Net Income (211) 985 882 739 Earnings Per Share (0.31) 1.40 1.21 1.02 Dividends Per Share 0.44 0.40 0.36 0.33 Price Range 16.93-10.57 22.95-11.94 26.00-17.45 26.00-14.35
INVESTMENT RATIONALE
Staples is one of the world’s leading office products distributors, with ~$24 billion in revenue and almost 2,200 stores in 25 countries. The Company has three operating segments: North American Stores and Online (49% of FY 2012 total sales, 56% of total EBITDA), North American Commercial (33%, 38%) and International (18%, 6%). Trailing only Amazon, SPLS is the second largest online retailer in the US. Aside from the effects of the 2008/2009 recession and subsequent weak economic recovery (including weak new business formation), Staples’ financial results have also suffered from increased competition (from the likes of Amazon, Wal-Mart and warehouse clubs) and the move from paper documents to digitalization. As a result, Staples’ annual revenues have stagnated in a narrow range of $23.8-$24.7 billion over the last 5 years. For FY 2013, Staples expects 2013 full year revenue of $23.9 billion. These factors have not gone unnoticed by the market as Staples’ stock price is currently 27% below its $21.27 close on 12/31/2007.
The good news is that Staples’ management is not standing still. In 2012, the Company announced a strategic plan to address its lagging North American Retail and International Operations by improving its online business, initiating cost savings ($150 million already achieved in 2013), closing stores (currently down 4.9% to 2,183 from 2011’s peak of 2,295) and reducing square footage of existing locations. In 3Q FY 2013, staples.com had its first major revamp since 2005, making the site 40% faster. Another initiative for the website is to greatly increase its product offerings. The first wave of new products was for company break-room supplies; the next wave will be aimed at the needs of specific industries. In the 3rd quarter, 20,000 retail store supplies SKU’s were added and this is being followed in the 4th quarter by another 20,000 items aimed at restaurant supplies. Incredibly, Staples has already added 70,000 new products to its website this year and expects to add another 100,000 items in the fourth quarter, which will bring total SKU’s to over 300,000 by year end.
Another positive development for Staples should be the recent closing of the merger between Office Depot and OfficeMax. The integration of these two competitors will undoubtedly involve store closings as well as operational hiccups as systems and management teams are combined/rationalized. Amazingly, Office Depot only announced its new CEO a week after the merger was completed in November. The CEOs of the prior companies, both considered for the position, ran the combined company for its first week. With the announcement of the new CEO, both promptly quit and resigned from the Board of Directors, which should not help the short-term integration effort. While ultimately Office Depot should be a stronger competitor, a more rational pricing environment may also be a by-product of the merger.
Despite its lack of revenue growth, Staples has remained a solid cash flow machine, maintains an excellent balance sheet, and is very shareholder friendly. Even with an expected decline in revenues this year of 2%, we expect that the Company will meet its free cash flow target of $900 million in 2013 (up 3.5% from last year and representing a respectable free cash flow yield of ~9%). From a balance sheet perspective, the Company remains in excellent health. At 9/30/2013, Staples had ~$1.4 billion in cash from which it plans to repay $867 million in debt due in January 2014. Remaining long-term debt after the repayment totals only ~$1 billion with the next maturity in January 2018. Given the level of cash flow generated, Staples should not have any difficulties supporting its quarterly $0.12 dividend (3.1% yield) and continuing to repurchase shares (YTD purchases ~3% of diluted shares outstanding). For the first nine months of 2013, the Company returned over 80% of its free cash flow to shareholders via dividends and stock repurchases.
Staples is currently trading at the lower end of its 4.5x-11.7x TTM EBITDA trading range of the past 10 years, which we believe is not consistent with the Company’s strong competitive position, ability to generate robust cash flow, its strong balance sheet and shareholder friendly attitude. We expect management’s initiatives will bear fruit in the not-too-distant future and return Staples to a path of revenue growth. We use a sum-of-the-parts valuation approach for Staples and value the North American Retail and Online segment at 6x our 2015E EBITDA, the North American Commercial Business at 8x (Commercial warrants a higher multiple due to its direct, and often integrated, relationship with its business clients) and the underperforming International Business at 3x (equates to a blended multiple of 6.6x). With little global economic improvement built into our calculations, our estimate of the Company’s intrinsic value is approximately $23.25, implying upside potential of over 50%.
Symbol: SPLS Exchange: NASDAQCurrent Price: $15.51Current Yield: 3.1%Current Dividend: $0.48Shares Outstanding (MM): 655.0Major Shareholders: Insiders own <3%Average Daily Trading Volume (MM): 8.052-Week Price Range: $17.30-11.04Price/Earnings Ratio: 21xStated Book Value Per Share: $9.27
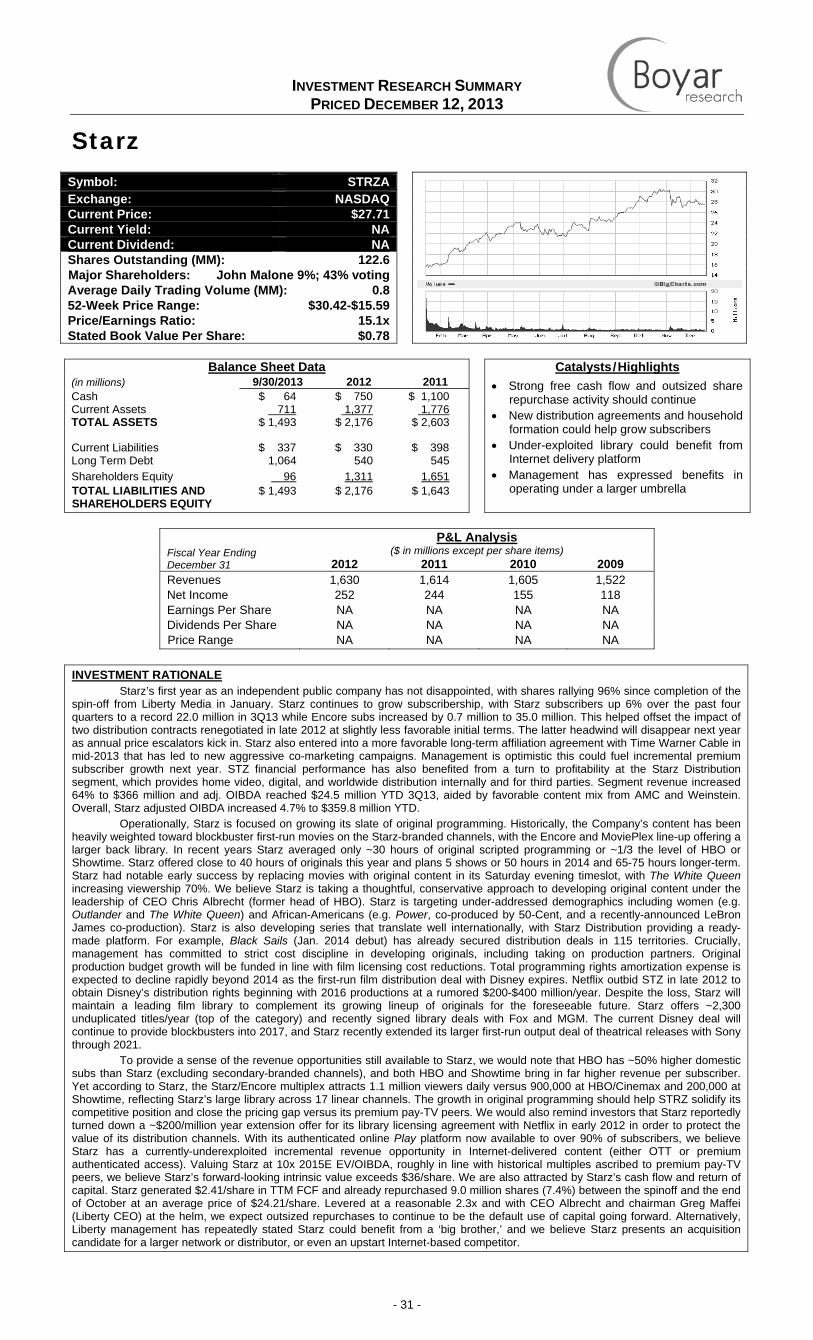
INVESTMENT RESEARCH SUMMARY PRICED DECEMBER 12, 2013
- 31 -
Starz
Balance Sheet Data Catalysts/Highlights
(in millions) 9/30/2013 2012 2011 • Strong free cash flow and outsized share repurchase activity should continue
• New distribution agreements and household formation could help grow subscribers
• Under-exploited library could benefit from Internet delivery platform
• Management has expressed benefits in operating under a larger umbrella
Cash $ 64 $ 750 $ 1,100 Current Assets 711 1,377 1,776 TOTAL ASSETS $ 1,493 $ 2,176 $ 2,603 Current Liabilities $ 337 $ 330 $ 398 Long Term Debt 1,064 540 545 Shareholders Equity 96 1,311 1,651 TOTAL LIABILITIES AND SHAREHOLDERS EQUITY
$ 1,493 $ 2,176 $ 1,643
Fiscal Year Ending December 31
P&L Analysis ($ in millions except per share items)
2012 2011 2010 2009 Revenues 1,630 1,614 1,605 1,522 Net Income 252 244 155 118 Earnings Per Share NA NA NA NA Dividends Per Share NA NA NA NA Price Range NA NA NA NA
INVESTMENT RATIONALE
Starz’s first year as an independent public company has not disappointed, with shares rallying 96% since completion of the spin-off from Liberty Media in January. Starz continues to grow subscribership, with Starz subscribers up 6% over the past four quarters to a record 22.0 million in 3Q13 while Encore subs increased by 0.7 million to 35.0 million. This helped offset the impact of two distribution contracts renegotiated in late 2012 at slightly less favorable initial terms. The latter headwind will disappear next year as annual price escalators kick in. Starz also entered into a more favorable long-term affiliation agreement with Time Warner Cable in mid-2013 that has led to new aggressive co-marketing campaigns. Management is optimistic this could fuel incremental premium subscriber growth next year. STZ financial performance has also benefited from a turn to profitability at the Starz Distribution segment, which provides home video, digital, and worldwide distribution internally and for third parties. Segment revenue increased 64% to $366 million and adj. OIBDA reached $24.5 million YTD 3Q13, aided by favorable content mix from AMC and Weinstein. Overall, Starz adjusted OIBDA increased 4.7% to $359.8 million YTD.
Operationally, Starz is focused on growing its slate of original programming. Historically, the Company’s content has been heavily weighted toward blockbuster first-run movies on the Starz-branded channels, with the Encore and MoviePlex line-up offering a larger back library. In recent years Starz averaged only ~30 hours of original scripted programming or ~1/3 the level of HBO or Showtime. Starz offered close to 40 hours of originals this year and plans 5 shows or 50 hours in 2014 and 65-75 hours longer-term. Starz had notable early success by replacing movies with original content in its Saturday evening timeslot, with The White Queen increasing viewership 70%. We believe Starz is taking a thoughtful, conservative approach to developing original content under the leadership of CEO Chris Albrecht (former head of HBO). Starz is targeting under-addressed demographics including women (e.g. Outlander and The White Queen) and African-Americans (e.g. Power, co-produced by 50-Cent, and a recently-announced LeBron James co-production). Starz is also developing series that translate well internationally, with Starz Distribution providing a ready-made platform. For example, Black Sails (Jan. 2014 debut) has already secured distribution deals in 115 territories. Crucially, management has committed to strict cost discipline in developing originals, including taking on production partners. Original production budget growth will be funded in line with film licensing cost reductions. Total programming rights amortization expense is expected to decline rapidly beyond 2014 as the first-run film distribution deal with Disney expires. Netflix outbid STZ in late 2012 to obtain Disney’s distribution rights beginning with 2016 productions at a rumored $200-$400 million/year. Despite the loss, Starz will maintain a leading film library to complement its growing lineup of originals for the foreseeable future. Starz offers ~2,300 unduplicated titles/year (top of the category) and recently signed library deals with Fox and MGM. The current Disney deal will continue to provide blockbusters into 2017, and Starz recently extended its larger first-run output deal of theatrical releases with Sony through 2021.
To provide a sense of the revenue opportunities still available to Starz, we would note that HBO has ~50% higher domestic subs than Starz (excluding secondary-branded channels), and both HBO and Showtime bring in far higher revenue per subscriber. Yet according to Starz, the Starz/Encore multiplex attracts 1.1 million viewers daily versus 900,000 at HBO/Cinemax and 200,000 at Showtime, reflecting Starz’s large library across 17 linear channels. The growth in original programming should help STRZ solidify its competitive position and close the pricing gap versus its premium pay-TV peers. We would also remind investors that Starz reportedly turned down a ~$200/million year extension offer for its library licensing agreement with Netflix in early 2012 in order to protect the value of its distribution channels. With its authenticated online Play platform now available to over 90% of subscribers, we believe Starz has a currently-underexploited incremental revenue opportunity in Internet-delivered content (either OTT or premium authenticated access). Valuing Starz at 10x 2015E EV/OIBDA, roughly in line with historical multiples ascribed to premium pay-TV peers, we believe Starz’s forward-looking intrinsic value exceeds $36/share. We are also attracted by Starz’s cash flow and return of capital. Starz generated $2.41/share in TTM FCF and already repurchased 9.0 million shares (7.4%) between the spinoff and the end of October at an average price of $24.21/share. Levered at a reasonable 2.3x and with CEO Albrecht and chairman Greg Maffei (Liberty CEO) at the helm, we expect outsized repurchases to continue to be the default use of capital going forward. Alternatively, Liberty management has repeatedly stated Starz could benefit from a ‘big brother,’ and we believe Starz presents an acquisition candidate for a larger network or distributor, or even an upstart Internet-based competitor.
Symbol: STRZA Exchange: NASDAQCurrent Price: $27.71Current Yield: NACurrent Dividend: NAShares Outstanding (MM): 122.6Major Shareholders: John Malone 9%; 43% votingAverage Daily Trading Volume (MM): 0.852-Week Price Range: $30.42-$15.59Price/Earnings Ratio: 15.1xStated Book Value Per Share: $0.78
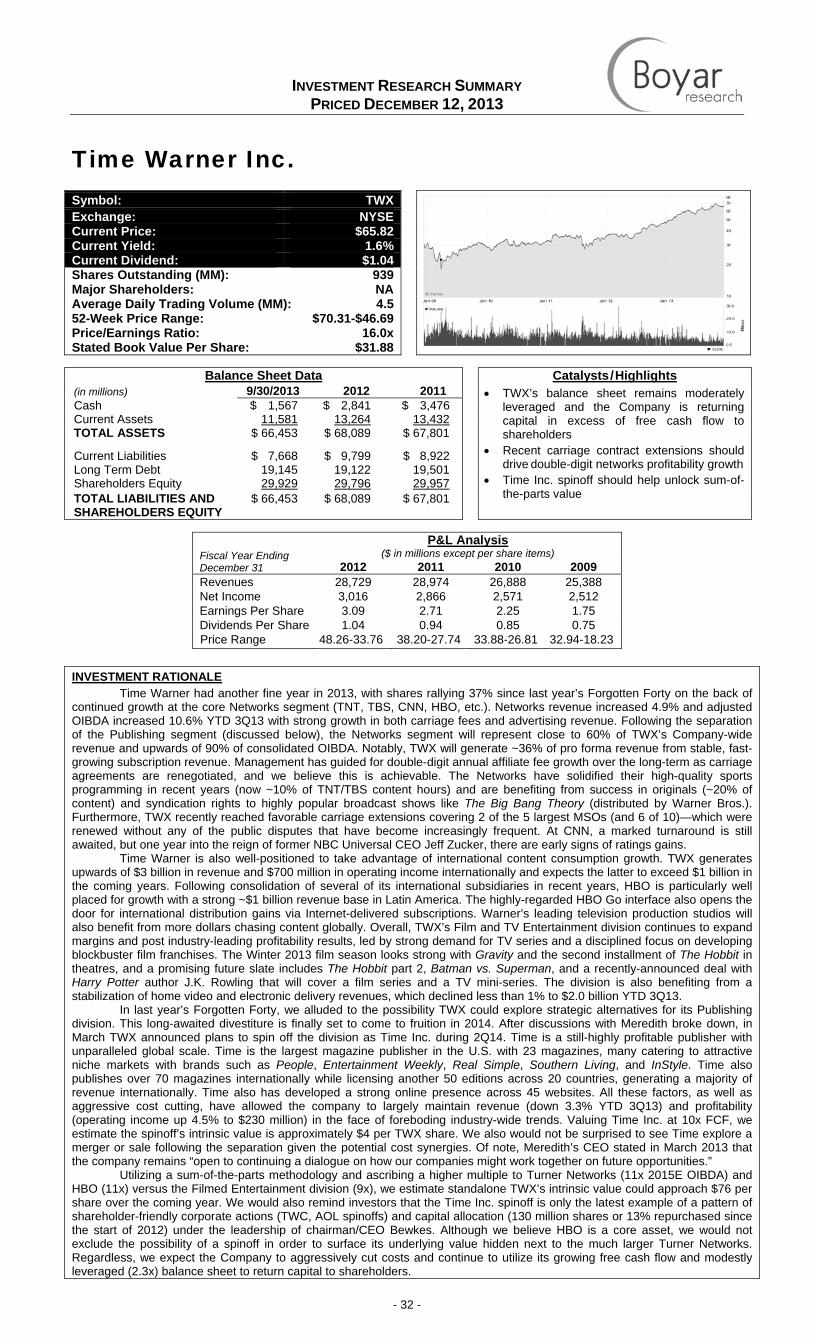
INVESTMENT RESEARCH SUMMARY PRICED DECEMBER 12, 2013
- 32 -
Time Warner Inc.
Balance Sheet Data Catalysts/Highlights
(in millions) 9/30/2013 2012 2011 • TWX’s balance sheet remains moderately leveraged and the Company is returning capital in excess of free cash flow to shareholders
• Recent carriage contract extensions should drive double-digit networks profitability growth
• Time Inc. spinoff should help unlock sum-of-the-parts value
Cash $ 1,567 $ 2,841 $ 3,476 Current Assets 11,581 13,264 13,432 TOTAL ASSETS $ 66,453 $ 68,089 $ 67,801 Current Liabilities $ 7,668 $ 9,799 $ 8,922 Long Term Debt 19,145 19,122 19,501 Shareholders Equity 29,929 29,796 29,957 TOTAL LIABILITIES AND SHAREHOLDERS EQUITY
$ 66,453 $ 68,089 $ 67,801
Fiscal Year Ending December 31
P&L Analysis ($ in millions except per share items)
2012 2011 2010 2009 Revenues 28,729 28,974 26,888 25,388 Net Income 3,016 2,866 2,571 2,512 Earnings Per Share 3.09 2.71 2.25 1.75 Dividends Per Share 1.04 0.94 0.85 0.75 Price Range 48.26-33.76 38.20-27.74 33.88-26.81 32.94-18.23
INVESTMENT RATIONALE Time Warner had another fine year in 2013, with shares rallying 37% since last year’s Forgotten Forty on the back of
continued growth at the core Networks segment (TNT, TBS, CNN, HBO, etc.). Networks revenue increased 4.9% and adjusted OIBDA increased 10.6% YTD 3Q13 with strong growth in both carriage fees and advertising revenue. Following the separation of the Publishing segment (discussed below), the Networks segment will represent close to 60% of TWX’s Company-wide revenue and upwards of 90% of consolidated OIBDA. Notably, TWX will generate ~36% of pro forma revenue from stable, fast-growing subscription revenue. Management has guided for double-digit annual affiliate fee growth over the long-term as carriage agreements are renegotiated, and we believe this is achievable. The Networks have solidified their high-quality sports programming in recent years (now ~10% of TNT/TBS content hours) and are benefiting from success in originals (~20% of content) and syndication rights to highly popular broadcast shows like The Big Bang Theory (distributed by Warner Bros.). Furthermore, TWX recently reached favorable carriage extensions covering 2 of the 5 largest MSOs (and 6 of 10)—which were renewed without any of the public disputes that have become increasingly frequent. At CNN, a marked turnaround is still awaited, but one year into the reign of former NBC Universal CEO Jeff Zucker, there are early signs of ratings gains.
Time Warner is also well-positioned to take advantage of international content consumption growth. TWX generates upwards of $3 billion in revenue and $700 million in operating income internationally and expects the latter to exceed $1 billion in the coming years. Following consolidation of several of its international subsidiaries in recent years, HBO is particularly well placed for growth with a strong ~$1 billion revenue base in Latin America. The highly-regarded HBO Go interface also opens the door for international distribution gains via Internet-delivered subscriptions. Warner’s leading television production studios will also benefit from more dollars chasing content globally. Overall, TWX’s Film and TV Entertainment division continues to expand margins and post industry-leading profitability results, led by strong demand for TV series and a disciplined focus on developing blockbuster film franchises. The Winter 2013 film season looks strong with Gravity and the second installment of The Hobbit in theatres, and a promising future slate includes The Hobbit part 2, Batman vs. Superman, and a recently-announced deal with Harry Potter author J.K. Rowling that will cover a film series and a TV mini-series. The division is also benefiting from a stabilization of home video and electronic delivery revenues, which declined less than 1% to $2.0 billion YTD 3Q13.
In last year’s Forgotten Forty, we alluded to the possibility TWX could explore strategic alternatives for its Publishing division. This long-awaited divestiture is finally set to come to fruition in 2014. After discussions with Meredith broke down, in March TWX announced plans to spin off the division as Time Inc. during 2Q14. Time is a still-highly profitable publisher with unparalleled global scale. Time is the largest magazine publisher in the U.S. with 23 magazines, many catering to attractive niche markets with brands such as People, Entertainment Weekly, Real Simple, Southern Living, and InStyle. Time also publishes over 70 magazines internationally while licensing another 50 editions across 20 countries, generating a majority of revenue internationally. Time also has developed a strong online presence across 45 websites. All these factors, as well as aggressive cost cutting, have allowed the company to largely maintain revenue (down 3.3% YTD 3Q13) and profitability (operating income up 4.5% to $230 million) in the face of foreboding industry-wide trends. Valuing Time Inc. at 10x FCF, we estimate the spinoff’s intrinsic value is approximately $4 per TWX share. We also would not be surprised to see Time explore a merger or sale following the separation given the potential cost synergies. Of note, Meredith’s CEO stated in March 2013 that the company remains “open to continuing a dialogue on how our companies might work together on future opportunities.”
Utilizing a sum-of-the-parts methodology and ascribing a higher multiple to Turner Networks (11x 2015E OIBDA) and HBO (11x) versus the Filmed Entertainment division (9x), we estimate standalone TWX’s intrinsic value could approach $76 per share over the coming year. We would also remind investors that the Time Inc. spinoff is only the latest example of a pattern of shareholder-friendly corporate actions (TWC, AOL spinoffs) and capital allocation (130 million shares or 13% repurchased since the start of 2012) under the leadership of chairman/CEO Bewkes. Although we believe HBO is a core asset, we would not exclude the possibility of a spinoff in order to surface its underlying value hidden next to the much larger Turner Networks. Regardless, we expect the Company to aggressively cut costs and continue to utilize its growing free cash flow and modestly leveraged (2.3x) balance sheet to return capital to shareholders.
Symbol: TWX Exchange: NYSECurrent Price: $65.82Current Yield: 1.6%Current Dividend: $1.04Shares Outstanding (MM): 939Major Shareholders: NAAverage Daily Trading Volume (MM): 4.552-Week Price Range: $70.31-$46.69Price/Earnings Ratio: 16.0xStated Book Value Per Share: $31.88

INVESTMENT RESEARCH SUMMARY PRICED DECEMBER 12, 2013
- 33 -
The Travelers Companies, Inc.
Balance Sheet Data Catalysts/Highlights
(in millions) 9/30/13 2012 2011 • TRV has increased book value per share at a 10% CAGR since 2004, and comparable gains should be attainable going forward.
• Management is returning significant capital to shareholders via dividends and share repurchase.
• Underwriting results should remain solid given favorable trends for pricing and losses.
Investments & Advances $ 72,531 $ 73,838 $ 72,701 TOTAL ASSETS $ 102,685 $ 104,938 $ 104,575 Long Term Debt $ 6,346 $ 6,350 $ 6,605 Shareholders Equity 24,811 25,405 24,477 TOTAL LIABILITIES AND SHAREHOLDERS EQUITY $ 102,685 $ 104,938 $ 104,575
Fiscal Year Ending December 31
P&L Analysis ($ in millions except per share items)
2012 2011 2010 2009 Revenues 25,740 25,446 25,112 24,680 Net Income 2,473 1,426 3,216 3,622 Earnings Per Share 6.30 3.36 6.62 6.33 Dividends Per Share 1.79 1.59 1.41 1.26 Price Range 74.70-55.86 64.17-45.97 57.55-47.35 54.47-33.07
INVESTMENT RATIONALE
The Travelers Companies, Inc. is a leading provider of property casualty insurance for auto, home, and business. The Company had $22.4 billion in net written premiums during 2012, derived from the following areas: business insurance (53%), personal lines (34%), and financial, professional, and international lines (13%). The firm was formed in 2004 as a result of the acquisition of Travelers by the Saint Paul Companies. The Company has earned a well-regarded reputation within the industry due to its underwriting capabilities, operational efficiency, and strong balance sheet.
TRV’s strong competitive position is clearly illustrated by its solid market share and history of profitability. The Company is the second largest writer of commercial property casualty insurance in the United States, with a top-3 market share position in 37 states. TRV is also the third largest writer of U.S personal insurance. The firm differentiates itself through its well established distribution network, solid underwriting capabilities, and diverse product line. TRV is regularly ranked among the top-5 providers of commercial insurance in surveys of independent agents, and the firm employs multiple distribution channels (independent agents, exclusive agents, direct marketing, etc.). TRV’s underwriting capabilities are supported by significant investments in technology and risk management infrastructure, allowing TRV to better price its policies. During the last 5 years, TRV’s average combined ratio has been a solid 95%. This is particularly impressive given the above average occurrence of extreme weather events during recent years. TRV’s diverse product line allows the firm to access a wide range of market segments and to establish and retain strong agent relationships. Approximately 60% of its commercial customers purchase 4 or more lines of insurance coverage, a key driver of customer retention.
The Company’s strong financial position is a key factor that benefits both its competitive position and its ability to deliver long-term shareholder value. TRV has senior debt ratings of A at both A.M. Best and Standard & Poor’s. As of the most recent quarter, TRV’s debt to capital ratio stood at 21%. TRV has consistently returned capital to shareholder via share repurchase activity and dividends. Through the first 9 months of 2013, overall repurchases and dividends paid totaled approximately $2.0 billion. Moreover, TRV has increased its book value per share by a 10% CAGR since 2004, and the firm targets a mid-teens ROE over the long-term. TRV maintains a high quality investment portfolio of over $70 billion, with 93% of the portfolio allocated to fixed maturity and short-term investments. The weighted average credit rating of the fixed maturity portfolio is Aa2 (Standard & Poor’s). TRV generates over $2 billion in annual after-tax investment income, and this figure could rise substantially if interest rates increase during the coming years.
Overall underwriting trends have been favorable for the Company during recent quarters. During 3Q-2013, TRV’s combined ratio improved about 200 basis points to approximately 90%, helped by solid pricing and premium comparisons, a reduction in losses, and relatively stable renewal trends. These factors were partially offset by an 8% reduction in net investment income, reflecting lower reinvestment rates. The Company repurchased $800 million of stock during the quarter, and a new buyback authorization of $5.0 billion was announced (representing about 15% of the current market capitalization). TRV also announced the acquisition of The Dominion of Canada General Insurance Company in June of 2013 for $1.1 billion in cash. The transaction is expected to be modestly accretive to TRV’s 2014 EPS, and it significantly bolsters the firm’s exposure to the personal and commercial insurance markets in Canada.
TRV shares have been good performers, appreciating by about 20% over the past year and by roughly 50% during the past 2 years. However, we believe the stock continues to offer investors attractive total return potential. In our view, TRV is well positioned to continue to grow its book value during the coming years, while also enhancing shareholder value via dividends and stock repurchases. Assuming the stock can trade at 1.4 times our 2015 estimate of book value (year-end) and 13 times 2015E EPS, the intrinsic value for the stock should be at least $110 per share. After accounting for the stock’s 2.3% dividend yield, total return potential should be over 25% relative to the current price.
Symbol: TRV Exchange: NYSECurrent Price: $86.63Current Yield: 2.3%Current Dividend: $2.00 Shares Outstanding (MM): 364Major Shareholders: StateStreet ~5.9%Average Daily Trading Volume (MM): 2.052-Week Price Range: $91.68-$70.73Price/Earnings Ratio: 10.6xBook Value Per Share: $68.14
INVESTMENT RESEARCH SUMMARY PRICED DECEMBER 12, 2013
- 34 -
Vivendi S.A.
Balance Sheet Data Catalysts/Highlights
(in millions) 9/30/2013 2012 2011 • Separation of SFR from media/content company planned for 2014
• De-levered balance sheet following divestitures opens door for share repurchase program
• Vincent Bollore set to assume control of supervisory board and replace management
Cash € 871 € 3,894 € 3,304 Current Assets 23,508 14,113 12,925 TOTAL ASSETS € 59,956 € 59,514 € 55,719 Current Liabilities € 24,644 € 20,324 € 18,079 Long Term Debt 8,899 12,667 12,409 Shareholders Equity 18,314 18,465 19,447 TOTAL LIABILITIES AND SHAREHOLDERS EQUITY
€ 59,956 € 59,514 € 55,719
Fiscal Year Ending December 31
P&L Analysis (€ in millions except per share items)
2012 2011 2010 2009 Revenues 28,994 28,813 28,878 27,132 Net Income 164 2,681 2,198 830 Earnings Per Share 1.96 2.38 2.19 2.15 Dividends Per Share 1.00 1.00 1.40 1.40 Price Range 17.32-12.01 21.23-14.22 20.72-15.76 23.13-15.87
INVESTMENT RATIONALE
Encouragingly, the potential reorganization plans which led AAF to initially profile media and telecom conglomerate Vivendi in January 2013 have advanced more rapidly than anticipated. In early 2013, UMG completed, at attractive prices, the divestitures necessary to satisfy anti-trust conditions for the EMI merger, netting ~€684 million in proceeds. In July, Vivendi announced an agreement with Activision Blizzard to sell the lion’s share of its majority stake in ATVI for $8.2 billion or $13.60/share. We believe ATVI shareholders and the other participating investors got the better end of the deal; it was priced at a 10% discount and ATVI shares immediately surged 15%, or 25% above the transaction price, upon the announcement. Nonetheless, the agreement ended a long stalemate over excess capital at ATVI and further advanced VIV’s deleveraging plans. VIV also recently signed a definitive agreement with Etisalat to sell its majority stake in Maroc Telecom for €4.2 billion.
Most notably, in November 2013, Vivendi’s board formally validated a planned de-merger into two companies: SFR (#2 French telecom operator) and a global media and content company. Management’s stated goal is to submit a SFR spinoff/IPO proposal at the June 2014 shareholders’ meeting, and management stated the initial review identified no potential roadblocks to completing the de-merger. Vivendi’s recent moves have not only involved divestitures. In May, Vivendi called off the sales process for its Brazilian telecom unit GVT after bids failed to reach Vivendi’s lofty minimum (reportedly €8 billion). Then in November, following years of back-and-forth wrangling, VIV agreed to acquire Lagardere’s 20% interest in Canal+ France for €1.02 billion. The transaction was struck at a highly attractive 6.2x 2014 EV/EBITDA multiple.
In our view the recent actions (absent the ATVI transaction) represent a step away from the Company’s frustratingly long record of too often choosing the wrong assets, or the wrong prices, to divest versus to acquire or consolidate (e.g. SFR/Vodafone transaction in 2011). We believe the recent strategic actions reflect in large part the positive influence of industrialist and activist investor Vincent Bollore. Mr. Bollore was recently named vice chairman and will become chairman of the new Vivendi following the SFR spinoff, and in the meantime he is supervising the appointment of a new CEO and CFO. Mr. Bollore’s presence also gives us optimism that Vivendi will utilize its de-levered balance sheet for shareholder-friendly actions going forward. Pro forma for the pending acquisitions/divestitures, Vivendi’s net debt is approximately €7.2 billion or <1.5x EBITDA, down from €13.4 billion at the end of 2012. Vivendi already offers an attractive 5.3% dividend yield (based on the 2013 payout rate), but the recent deleveraging opens up the opportunity for a large-scale share repurchase program.
Operationally, Vivendi posted mixed results YTD. SFR continues to experience double-digit profitability declines due to price wars following the entry of a fourth telecom competitor. However, revenue declines moderated in 3Q13 and management believes SFR’s re-pricing is now ~80% complete. Any additional pricing impact should be moderated by cost cutting progress and broadband growth. Expansion of 4G coverage and a potential network sharing agreement with Bouygues Telecom (under discussion) should also bolster SFR’s long-term competitive position. At GVT, customers and constant-currency revenue continue to grow at mid-teens rates and the business turned (EBITDA less capex) positive in 3Q13. In October, GVT and EchoStar entered negotiations to form a pay-TV joint venture in Brazil. GVT already generates ~10% of revenue from pay-TV after launching services little more than a year ago, but with only 567,000 video subs, there is plenty of room for additional growth and a JV could hasten the process. UMG has recorded modest organic revenue growth and margin expansion in 2013, and the £100 EMI cost synergy target remains on track. At Canal+, 2013 results have been negatively impacted by VAT and content cost increases, but the recently acquired free-to-air channels (D8 audience share up 110 bps) as well as emerging market pay-TV businesses (overseas profits up 13% YTD) continue to grow.
After lagging through the summer, VIV shares recently moved sharply higher following progress with the strategic realignment and an improving outlook for the European economy. Nonetheless, we believe VIV shares are still receiving a meaningful holding company discount. Valuing SFR at a modest 5.5x 2015E EV/EBITDA and UMG, GVT, and Canal+ at 7x, 8x and 8.5x 2015E EBITDA, respectively, we derive a forward-looking intrinsic value estimate above €23 per VIV share. This represents a reasonable ~13x pretax FCF for SFR, which as an independent company may re-evaluate a synergistic merger with recently-IPO’d cable operator Numericable, whose management recently reiterated their interest in a combination. We also assume a discount to Softbank’s reported $8.5 billion offer for UMG, and a discount to peers for the media assets. The pending de-merger and capital return plans could serve as catalysts for closing VIV’s discount over the coming year.
Symbol: VIV.PA Exchange: Euronext Paris Current Price: €17.92Current Yield: €1.00Current Dividend: 5.3%Shares Outstanding (MM): 1,340Major Shareholders: Bollore Groupe 5%Average Daily Trading Volume (MM): 4.652-Week Price Range: €19.33-€14.13Price/Earnings Ratio: NAStated Book Value Per Share: €13.71
INVESTMENT RESEARCH SUMMARY PRICED DECEMBER 12, 2013
- 35 -
Vulcan Materials Company
Balance Sheet Data Catalysts/Highlights
(in millions) 9/30/13 2012 2011 • After several years of challenging conditions, fundamentals within VMC’s industry are showing meaningful improvement, illustrated by favorable trends for demand and pricing.
• VMC has also made expense management and debt reduction key areas of focus, further contributing to improved financial performance.
• The Company’s high degree of operating leverage should cause profits to improve substantially, and results will likely exceed investor expectations.
Cash $ 246 $ 275 $ 156 Goodwill 3,082 3,087 3,087 TOTAL ASSETS $ 8,310 $ 8,127 $ 8,229 Long Term Debt $ 2,523 $ 2,526 $ 2,681 Shareholders Equity 3,863 3,761 3,792 TOTAL LIABILITIES AND SHAREHOLDERS EQUITY
$ 8,310 $ 8,127 $ 8,229
Fiscal Year Ending December 31
P&L Analysis ($ in millions except per share items)
2012 2011 2010 2009 Revenues 2,567 2,565 2,559 2,690 Net Income -54 -75 -103 19 Earnings Per Share -0.42 -0.58 -0.80 0.16 Dividends Per Share 0.04 0.76 1.00 1.48 Price Range 53.85-32.31 47.18-25.06 59.90-35.40 71.26-34.30
INVESTMENT RATIONALE
Vulcan Materials Company is the nation’s largest provider of construction aggregates, primarily consisting of crushed stone, sand, and gravel, and it also provides other products such as asphalt mix and cement. The Company has 341 aggregates facilities currently in operation, and it possesses a reserve base of aggregates of roughly 15 billion tons. Revenue is derived from Aggregates (66%), Concrete (17%), Asphalt Mix (15%) and Cement (2%). VMC has a mix of public and private customers who use VMC’s aggregates and related materials for construction and maintenance projects.
VMC operates in an industry with high barriers to entry, characterized by relatively high capital requirements and fixed costs. These considerations add to the industry’s significant barriers to entry, and create a business model that has a high degree of operating leverage. However, its financial results have not been insulated from challenges associated with weak economic activity, leading to poor profit comparisons and stock performance during recent years. Despite the tumultuous market environment faced by VMC, the firm has retained its strong competitive position within the industry. It is the nation’s largest provider of construction aggregates (measured by reserves), and it possesses 341 aggregates facilities, primarily located in the United States. Given the relatively high costs associated with transporting aggregates, possessing a local operational presence is a key competitive advantage within a local market. VMC has a geographic footprint that spans a large swath of the U.S. South, a region that generally possesses superior economic growth trends relative to other U.S. areas.
VMC should be well positioned to benefit from several potential catalysts for improved profits and cash flow. In particular, VMC’s exposure to U.S. markets with superior growth characteristics should remain an essential driver of VMC’s long-term growth potential. Continued improvements in the U.S. private construction market (driven by real estate and other factors) should remain an important factor. Moreover, investment in U.S. infrastructure within the public sector should provide another meaningful tailwind for financial results, which is likely not fully appreciated by investors at this stage. Assuming a relatively normalized economic environment during the coming years, we believe EBITDA of $1.0 billion or more could be attainable, representing a substantial increase relative to recent levels (we expect EBITDA to be roughly $480 million during the current year).
The significant operating leverage within VMC’s business should allow profits to improve significantly and to exceed investor expectations. This scenario already began to materialize during the Company’s most recently reported quarter (3Q-2013). VMC’s 3Q EPS more than doubled year over year due to improved pricing and volumes for aggregates, reflective of favorable demand trends. Gross profit per aggregate ton reached a 4-year high, and management expressed confidence about continued price strength during the coming quarters. In addition, management has been focused on expense management during recent years. SG&A was flat during 3Q-2013 despite a 13% increase in revenue.
Management has also highlighted debt reduction as a high priority, evidenced by an 11% reduction in net debt during the most recent quarter. VMC has divested several non-core assets during recent quarters, and much of these funds have been allocated to debt reduction. However, VMC still possesses a significant level of financial leverage. As of the most recent quarter, the Company had net debt of approximately $2.3 billion (net debt: capital stood at 37%). As VMC further reduces its financial leverage, management will likely consider returning capital to shareholders via dividend increases or share repurchase.
Assuming market conditions gradually return to a more normalized state, VMC should be poised for continued profit growth and multiple expansion. Based on our 2015 projections, VMC is currently trading at approximately 8.0x EV/EBITDA, toward the lower end of the stock’s historical trading range. Applying a 10x EV/EBITDA multiple (consistent with VMC’s historical range) to our normalized 2015 projection produces an estimated intrinsic value of $71 per share, implying potential upside of 30% relative to VMC’s current price. Ultimately, we view VMC as an attractive investment opportunity with multiple catalysts for appreciation. Moreover, the industry’s high barriers to entry serve to further bolster VMC’s competitive position, and help to provide a superior level of long-term visibility for the business. These considerations should give VMC ample opportunities to reward shareholders during the coming years.
Symbol: VMC Exchange: NYSECurrent Price: $54.41Current Yield: $0.04Current Dividend: 0.10%Shares Outstanding (MM): 131.3Major Shareholders: Insiders own 2%Average Daily Trading Volume (MM): 66452-Week Price Range: $60.14-$45.42Price/Earnings Ratio: NMStated Book Value Per Share: $29.42
INVESTMENT RESEARCH SUMMARY PRICED DECEMBER 12, 2013
- 36 -
W. R. Berkley Corporation
Balance Sheet Data Catalysts/Highlights
(in millions) 9/30/2013 2012 2011 Company rapidly growing “Net Premiums Written” in favorable pricing environment
Favorable industry pricing tailwinds seen continuing
Decentralized management results in excellent risk underwriting
Eventual rise in interest rates should substantially increase earnings
Cash $ 966 $ 906 $ 912 Total Investments 14,504 14,467 13,440 TOTAL ASSETS $ 20,524 $ 20,156 $ 18,404 Loss Reserves $ 10,061 $ 9,751 $ 9,337 Long Term Debt 2,036 2,115 1,744
Shareholders Equity 4,367 4,306 3,954
TOTAL LIABILITIES AND SHAREHOLDERS EQUITY
$ 20,524 $ 20,156 $ 18,404
Fiscal Year Ending December 31
P&L Analysis ($ in millions except per share items)
2012 2011 2010 2009
Revenues 5,824 5,156 4,724 4,431
Net Income
511 391 446 308
Earnings Per Share 3.56 2.69 2.88 1.85
Dividends Per Share 1.35 0.31 0.27 0.24
Price Range 40.39-33.34 36.05-26.52 28.83-23.89 31.07-18.59
INVESTMENT RATIONALE
W.R. Berkley (“Berkley”) is one of the largest commercial insurers in the US. In 2012, net premiums written by segment were: Specialty–36%, Regional–23%, Alternative Markets–14%, Reinsurance–10% and International–17%. The Company specializes in niche oriented risks that tend to produce higher returns and less exposure to catastrophic events. WRB has outsized insider ownership of 21%, which includes 18.9% by the founder and CEO, William R. Berkley. We believe this allows the Company to operate more opportunistically than many of its larger, more widely-owned Property & Casualty (P&C) competitors.
An example is Berkley’s activity in the current environment of rising insurance rates and the prior “soft” market (declining rates). According to the Insurance Information Institute (our source for industry data), prices for commercial insurance rose in the second quarter of 2011 (and are still rising) after decreasing the previous thirty quarters. During the soft market, Berkley strategically allowed “Net Premiums Written” (NPW) to stagnate/fall as pricing at times was too low to achieve targeted returns. In fact, Berkley’s NPW fell in each of the years 2007-2009. With the return of price increases in 2011, Berkley has taken advantage of the “hardening” market by growing NPW well in excess of many of its competitors by expanding its business lines and increasing prices. The Company’s NPW increased 12.9% in 2011 and 12.4% in 2012 versus estimated growth rates in industry wide NPW of 3.3% and 4.3%, respectively. This trend has continued as Berkley’s NPW increased 12.9% for the first nine months of 2013. We believe, along with many industry analysts, that prices will continue to increase through the end of 2014.
Recent price increases have come amid a time of record capital surplus for the industry (higher surplus levels allow insurers to write more insurance) when measured in absolute dollar terms. On a relative basis, there was $0.77 of NPW for every $1 of surplus as of June, 2013 – close to the record low. Excess capital has a way of finding new business resulting in price competition. However, the low interest rate environment has dictated pricing discipline since underwriting profits are needed to supplement reduced investment income. Also helping to maintain pricing discipline is the ongoing reassessment of risk. The elevated frequency and increasing severity of catastrophic events (such as Hurricane Sandy and the 2011 Japanese earthquake and tsunami) have been making their way into risk models resulting in higher premiums. Of note, Berkley, as a specialty niche insurer serving small/mid-sized businesses, should be less affected should pricing discipline start to break down since surplus capital is easier and less expensive to deploy in the large company standard commercial market.
With interest rates expected to remain relatively low in the near-term, Berkley’s excellent underwriting skills are a valuable asset. Commercial insurers have only had underwriting profits (a combined ratio of less than 100%) in three of the past 11 calendar years whereas Berkley consistently produced annual underwriting profits. We believe this is a testament to the Company’s decentralized management, which allows risk managers to be close to the customer. However, even excellent underwriting has limitations when it comes to profitability. Berkley estimates that, depending on the line of business, it takes a 4%-7% improvement in the combined ratio to equal the additional investment income from a 1% rise in interest rates. With that in mind, Berkley’s bond portfolio has a “short-ish” 3.2 year duration, which should allow the Company to take advantage of rising rates when the opportunity presents itself.
How important is investment income to insurers? Very. In the case of Berkley, net investment income (excluding gains and losses) as a percentage of pre-tax income was 84% in 2012 and over 100% in 2011, which is not uncommon in the industry. Therefore, the eventual rise in interest rates will have a significantly positive effect on P&C insurers’ earnings.
With cumulative price increases since 2011 of ~18%, we believe that Berkley will see a sustained reduction in its combined ratio as those premiums are earned. This trend has already started as the Company’s combined ratio for Q3 2013 was 93.9% versus 98.5% for 2011. With expected price increases in the 6.5%-7.5% range for the near-term, we forecast a combined ratio of ~90% for 2015. We believe the increase in revenues and the 90% combined ratio will be enough to raise ROE to the Company’s targeted 15%. Due to the Company’s excellent underwriting track record, historically high returns on equity and strong management team, we believe W.R. Berkley should command a premium valuation to its peers. Valuing W.R. Berkley at 1.6x (within the lower half of its historical 1.1x-2.4x range) 2015E book value, we derive an estimated intrinsic value per share of $66.84, representing 57% upside from current price levels.
Symbol: WRB
Exchange: NYSE
Current Price: $42.44
Current Yield: 1.0%
Current Dividend: $0.40
Shares Outstanding (MM): 140.8
Major Shareholders: W. Berkley (CEO) 18.9%
Average Daily Trading Volume (MM): 0.5
52-Week Price Range: $45.59-$37.29
Price/Earnings Ratio: 13.1x
Stated Book Value Per Share: $32.32
INVESTMENT RESEARCH SUMMARY PRICED DECEMBER 12, 2013
- 37 -
Weight Watchers International, Inc.
Balance Sheet Data Catalysts/Highlights
(in millions) 9/30/2013 2012 2011 • Recent creation of Weight Watchers Health Solutions should allow Company to gain traction in corporate/healthcare market
• Revitalization of the WTW meetings and online business by new management
• Provisions of Obamacare provide strong incentive to cover recommended preventative services such as wellness programs
Cash $ 181 $ 70 $ 53 Current Assets 304 218 39 TOTAL ASSETS $ 1,408 $ 1,209 $ 1,122 Current Liabilities $ 384 $ 448 $ 494 Long Term Debt 2,394 2,407 1,052 Shareholders Equity (1,509) (1,665) (410) TOTAL LIABILITIES AND SHAREHOLDERS EQUITY
$ 1,408 $ 1,219 $ 1,122
Fiscal Year Ending December 30
P&L Analysis ($ in millions except per share items)
2012 2011 2010 2009 Revenues 1,827 1,819 1,452 1,399 Net Income 257 305 194 177 Earnings Per Share 4.23 4.11 2.56 2.30 Dividends Per Share 0.70 0.70 0.70 0.70 Price Range 82.91-40.60 86.97-36.63 37.89-24.39 30.20-16.41
INVESTMENT RATIONALE Weight Watchers shares have declined by 40% in 2013 (through mid-December) and are over 60% below an ill-timed
debt financed tender at $82 a share in 2012 reflecting recent adverse enrollment trends. While WTW’s latest program launch proved effective in retaining members, it failed to attract new members in the face of free apps offering calorie counting and activity monitoring. The Company’s subscription-based business model coupled with declining enrollment have accelerated the impact with revenue declining 3% during 1Q 2013, 4% in 2Q 2013 and 8.5% in 3Q 2013. Based on current trends, Weight Watchers projects that revenues could decline at a low teens percentage rate during 2014 due to a lower beginning membership base. In response to the Company’s disappointing results, WTW replaced its long-time CEO in August with Jim Chambers, a veteran of the consumer products industry, who joined WTW in early 2013 as the Company’s COO.
While free apps have presented near term challenges, we believe that they will ultimately prove to be little match for Weight Watchers’ proven program that boasts a 50-year track record and more than 80 peer reviewed publications that demonstrate its efficacy. The Weight Watchers approach takes a holistic view of weight loss and encompasses a range of nutritional, exercise and behavioral tools. In our view, the competitive pressure from free alternatives will abate in the coming years just as diet fads (Atkins, South, Beach, etc.) and weight loss drugs have historically. While we are not dismissing the benefits that technology can play in a weight loss program (utilizing multiple access points does help Weight Watchers members lose more weight), results of a recent Baylor College study suggest that those trying to lose weight on their own with free resources are unlikely to have the same success as those following the Weight Watchers approach.
In August 2013, Weight Watchers announced the creation of a separate business unit called Weight Watchers Health Solutions to capitalize on the B2B marketplace. The corporate market (~10% of WTW revenues) presents an attractive opportunity for WTW as recent health care legislation (“Obamacare”) provides a strong incentive to cover recommended preventive services such as wellness programs. According to the Journal of Health Economics, obesity raises annual medical costs by $2,741 per adult. Further, according to WTW, the incremental cost for someone with Type 2 diabetes is $10,000 to $12,000 a year. With ~80% of obesity cases attributed to diabetes, we expect that wellness programs targeting weight loss will become increasingly sought after by consumers, corporations, health plans and the government. We believe the Weight Watchers well-known brand gives it a significant competitive advantage when it tries to win business in the B2B marketplace as large corporations will likely be reluctant to retain unproven firms. WTW currently derives just $75 million from the corporate market, but management expects its initiatives targeting this market segment to generate over $300 million in revenues by 2018.
We acknowledge that Weight Watchers’ outsized debt load (net debt/EBITDA: 4.2x) could create some unease. However, we believe that there are a number of factors that should instill comfort as a turnaround unfolds. These items include WTW’s still robust cash flow, recent debt refinancing, aggressive cost reductions, and dividend elimination. While earnings will be pressured in 2014, we still expect the Company to generate between $150 to $200 million in free cash flow (~10% FCF yield). In April 2013, WTW refinanced and extended the maturity of its debt with nearly 90% now maturing in 2020. The new term loans are “covenant-lite” and do not require WTW to maintain any specific financial ratios. In response to the weak results WTW instituted an aggressive cost reduction program to eliminate the excesses that had built up under prior management. WTW expects to achieve $75 million of cost savings ($90 million annualized) during 2013 and recently boosted its gross annualized savings it expects to realize between 2013 and 2015 to $150 million. While the dividend elimination is discouraging, the move is expected to save the Company $40 million on an annual basis, savings which can be used towards growth initiatives and debt reduction. We would not be surprised if it were re-instituted as leverage migrates to the Company’s targeted level of 3.0x.
Projecting the exact cadence of a WTW turnaround is a challenging endeavor. However, we believe new management has a credible plan to revitalize the business and are encouraged to see them investing in promising opportunities including the corporate market, which ostensibly was not a high priority under the prior administration. At current levels, WTW trades at 11x depressed 2014 EPS projections and just 7.4x its peak (2012) earnings per share of $4.23. We believe this valuation is not consistent with WTW’s strong brand, attractive business model and good growth opportunities. If new management is only modestly successful in executing a turnaround, we wouldn’t be surprised if shares doubled over the next 2-3 years.
Symbol: WTW Exchange: NYSECurrent Price: $31.42Current Yield: N/ACurrent Dividend: N/AShares Outstanding (MM): 56.5Major Shareholders: Artal: 52%Average Daily Trading Volume (MM): 0.852-Week Price Range: $60.30-$31.24Price/Earnings Ratio: 7.6xStated Book Value Per Share: N/A

INVESTMENT RESEARCH SUMMARY PRICED DECEMBER 12, 2013
- 38 -
The Wendy’s Company
Balance Sheet Data Catalysts/Highlights
(in millions) 3Q 2013 2012 2011 Company-owned store refranchising strategy presents a more compelling structure
Re-imaged stores and new menu items could drive sales growth
Trian may orchestrate higher return of capital or a sale of Wendy’s
Cash $ 513 $ 453 $ 475 Current Assets 859 710 735 TOTAL ASSETS $ 4,324 $ 4,303 $ 4,289
Current Liabilities $ 353 $ 287 $ 337 Long Term Debt 1,482 1,458 1,357 Shareholders Equity 1,924 1,986 1,996
TOTAL LIABILITIES AND SHAREHOLDERS EQUITY
$ 4,324 $ 4,303 $ 4,289
Fiscal Year Ending December 30
P&L Analysis ($ in millions except per share items)
2012 2011 2010 2009
Revenues 2,505 2,431 2,375 2,437
Net Income 7 10 (4) 5
Earnings Per Share 0.02 0.04 0.04 0.01
Dividends Per Share 0.10 0.08 0.07 0.06
Price Range 5.43-4.14 5.59-4.42 5.52-3.89 5.72-3.63
INVESTMENT RATIONALE
Wendy’s opened its first location in Columbus Ohio approximately 44 years ago. Today it has 6,539 restaurants in operation. Although its common shares have appreciated ~74% during the current year, a number of events could transpire during 2014 that could drive its equity price even higher.
Activist investor Trian, owns approximately 27% of Wendy’s outstanding common equity. Two of its senior partners, Nelson Peltz and Peter May, have assumed the roles of Chairman and Vice Chairman of the Company. Trian’s mission is to invest in high quality, but undervalued and under-performing public companies, and to work constructively with the management and boards of these companies to significantly enhance value for all shareholders. Since Trian’s involvement, a number of initiatives have taken place. Trian believed that there was significantly more upside potential in Wendy’s than continuing to invest in Arby’s. They thought by selling Arby’s and investing the proceeds in Wendy’s operations, and buying back stock the Company could garner a higher ROI than continuing to operate Arby’s. So on July 4, 2011, Wendy’s sold an 81.5% stake in Arby’s to Roark Capital Group, retaining 18.5% equity with a fair value of $19.0 million. Wendy’s received $130 million cash. The buyer assumed $190 million of Arby’s debt and agreed to invest $180 million in Arby’s. Roark’s investment portfolio includes such well-known brands as Carvel Ice Cream, Cinnabon and Schlotsky’s, among others. It appears that Arby’s 3,600 units have been turned around, and in all likelihood Wendy’s stake has increased in value.
In addition, Wendy’s is on its way to becoming a franchise operation, with few if any company-owned stores in its quiver. There are currently 1,369 company-owned stores and 5,170 franchised. It currently has the highest share of company-owned stores, 20%, compared to fewer than 11% for MCD, 9.9% YUM USA, and under 1% for BKW U.S. & Canada. It appears that the completion of the recently announced sale of 425 units should occur by the end of Q2 2014. It is quite possible that Wendy’s could sell an additional 400 stores to franchisees over the next 12-18 months at around $375,000 per store, reducing Company-owned stores to ~10%. A continuation of the refranchising effort will earn an additional stream of royalties and potential opportunities to reduce expenses (such as G&A) and improve profitability.
In addition, Wendy’s is in the midst of an “image activation” program. Initially, the Company planned on spending up to one $1 million per unit to alter a store’s appearance. However that cost has been reduced to $500,000, and could be lowered even further. It is Wendy’s intention to have 50% of Company restaurants “image activated” by the end of 2014, and 20% of franchised restaurants (approximately 1,300) upgraded by 2015. If volume increases can be sustained due to upgrades, a 15% revenue increase is attainable for each remodeled location. Assuming volume increases due to “image activation” remodels are sustainable, returns on investment to franchisees will appear to be quite compelling, and Wendy’s should be able to meet reimaging goals. ROIC could be as much as 18% if sales increases per unit can be sustained at 15%.
Another key driver of Wendy’s recent success and future success is product innovation. In 2013 for example, the Company benefited from substantially better product innovation versus its peers. The introduction of the Pretzel Bacon Cheeseburger in July clearly helped bolster sales.
With virtually no international exposure, adding international store count via joint ventures and/or franchising could add substantially to future growth. In December 2011 the Company opened its first joint venture Wendy’s restaurant in Japan. Wendy’s joint venture partner is Ernest Higa, who successfully owned and operated 180 Domino’s Pizza stores in Japan before selling this business in 2010. Wendy’s Japan plans to open approximately 100 locations during the next few years, and estimates the long term market potential to be about 700 restaurants. In 2012 Wendy’s announced an agreement with the Wissol Group to develop 25 restaurants in Georgia and the Republic of Azerbaijan over the next ten years. Wissol is one of the largest business groups in Georgia.
As a result of Wendy’s stellar stock market performance in 2013, its share performance in 2014 will in all likelihood not be nearly as robust. However, it is possible for its common equity to advance by as much as 20% assuming its product innovations continue to outdistance its competitors, it announces significant additional store sales to franchisees, and its image activation program continues to prove successful. The real wild card is: What is Trian’s exit strategy? The most likely scenario would be an outright sale. The timing of such an event is obviously difficult to predict. Look for another dividend increase in 2014 as well as a possible acceleration in its stock repurchase program.
Symbol: WEN
Exchange: NASDAQ Current Price: $8.20 Current Yield: 2.4% Current Dividend: $0.20 Shares Outstanding (MM): 398 Major Shareholders: Trian Partners 27% Average Daily Trading Volume (MM): 6.8 52-Week Price Range: $9.21-$4.70 Price/Earnings Ratio: NM Stated Book Value Per Share: $4.83
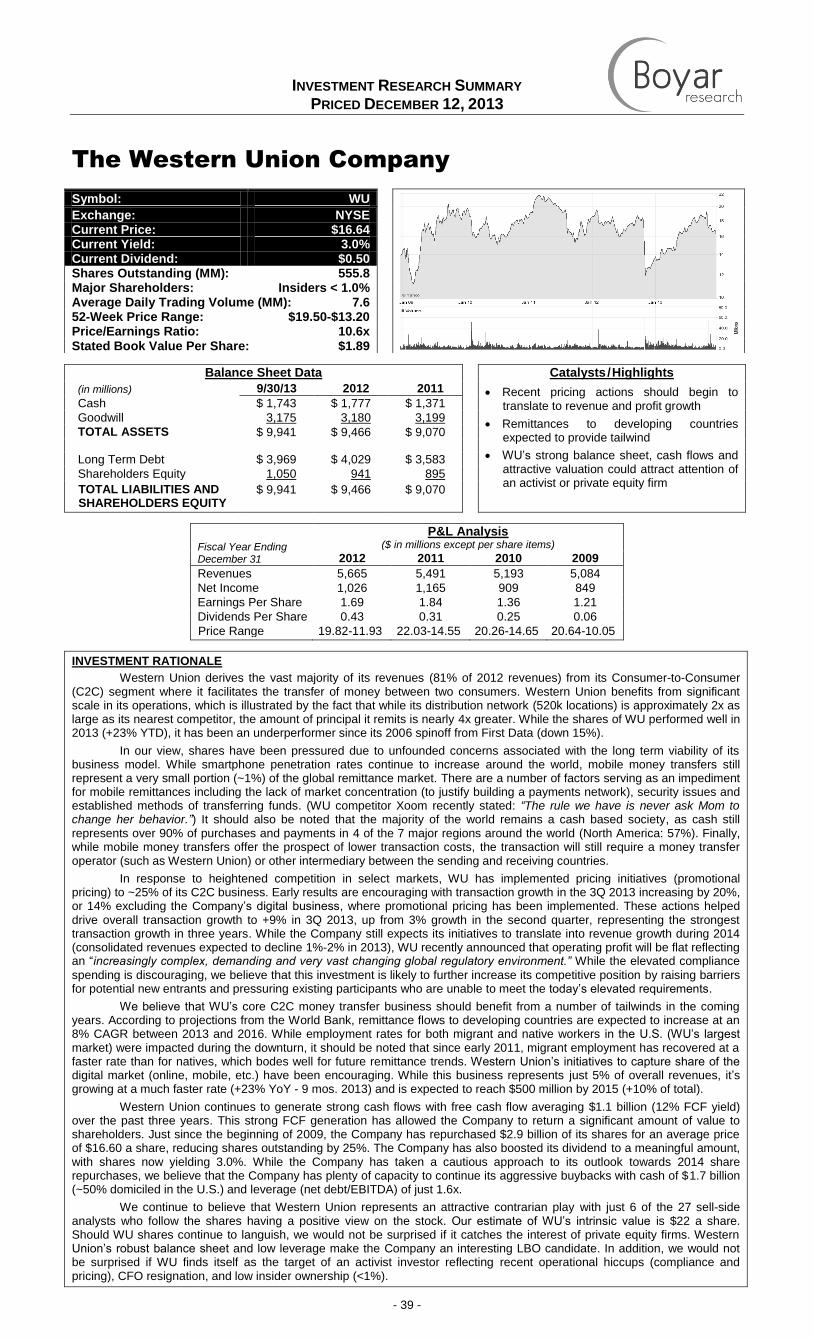
INVESTMENT RESEARCH SUMMARY PRICED DECEMBER 12, 2013
- 39 -
The Western Union Company
Balance Sheet Data Catalysts/Highlights
(in millions) 9/30/13 2012 2011 Recent pricing actions should begin to translate to revenue and profit growth
Remittances to developing countries expected to provide tailwind
WU’s strong balance sheet, cash flows and attractive valuation could attract attention of an activist or private equity firm
Cash $ 1,743 $ 1,777 $ 1,371
Goodwill 3,175 3,180 3,199
TOTAL ASSETS $ 9,941 $ 9,466 $ 9,070
Long Term Debt $ 3,969 $ 4,029 $ 3,583
Shareholders Equity 1,050 941 895
TOTAL LIABILITIES AND SHAREHOLDERS EQUITY
$ 9,941 $ 9,466 $ 9,070
Fiscal Year Ending December 31
P&L Analysis ($ in millions except per share items)
2012 2011 2010 2009
Revenues 5,665 5,491 5,193 5,084
Net Income 1,026 1,165 909 849
Earnings Per Share 1.69 1.84 1.36 1.21
Dividends Per Share 0.43 0.31 0.25 0.06
Price Range 19.82-11.93 22.03-14.55 20.26-14.65 20.64-10.05
INVESTMENT RATIONALE
Western Union derives the vast majority of its revenues (81% of 2012 revenues) from its Consumer-to-Consumer (C2C) segment where it facilitates the transfer of money between two consumers. Western Union benefits from significant scale in its operations, which is illustrated by the fact that while its distribution network (520k locations) is approximately 2x as large as its nearest competitor, the amount of principal it remits is nearly 4x greater. While the shares of WU performed well in 2013 (+23% YTD), it has been an underperformer since its 2006 spinoff from First Data (down 15%).
In our view, shares have been pressured due to unfounded concerns associated with the long term viability of its business model. While smartphone penetration rates continue to increase around the world, mobile money transfers still represent a very small portion (~1%) of the global remittance market. There are a number of factors serving as an impediment for mobile remittances including the lack of market concentration (to justify building a payments network), security issues and established methods of transferring funds. (WU competitor Xoom recently stated: “The rule we have is never ask Mom to change her behavior.”) It should also be noted that the majority of the world remains a cash based society, as cash still represents over 90% of purchases and payments in 4 of the 7 major regions around the world (North America: 57%). Finally, while mobile money transfers offer the prospect of lower transaction costs, the transaction will still require a money transfer operator (such as Western Union) or other intermediary between the sending and receiving countries.
In response to heightened competition in select markets, WU has implemented pricing initiatives (promotional pricing) to ~25% of its C2C business. Early results are encouraging with transaction growth in the 3Q 2013 increasing by 20%, or 14% excluding the Company’s digital business, where promotional pricing has been implemented. These actions helped drive overall transaction growth to +9% in 3Q 2013, up from 3% growth in the second quarter, representing the strongest transaction growth in three years. While the Company still expects its initiatives to translate into revenue growth during 2014 (consolidated revenues expected to decline 1%-2% in 2013), WU recently announced that operating profit will be flat reflecting an “increasingly complex, demanding and very vast changing global regulatory environment.” While the elevated compliance
spending is discouraging, we believe that this investment is likely to further increase its competitive position by raising barriers for potential new entrants and pressuring existing participants who are unable to meet the today’s elevated requirements.
We believe that WU’s core C2C money transfer business should benefit from a number of tailwinds in the coming years. According to projections from the World Bank, remittance flows to developing countries are expected to increase at an 8% CAGR between 2013 and 2016. While employment rates for both migrant and native workers in the U.S. (WU’s largest market) were impacted during the downturn, it should be noted that since early 2011, migrant employment has recovered at a faster rate than for natives, which bodes well for future remittance trends. Western Union’s initiatives to capture share of the digital market (online, mobile, etc.) have been encouraging. While this business represents just 5% of overall revenues, it’s growing at a much faster rate (+23% YoY - 9 mos. 2013) and is expected to reach $500 million by 2015 (+10% of total).
Western Union continues to generate strong cash flows with free cash flow averaging $1.1 billion (12% FCF yield) over the past three years. This strong FCF generation has allowed the Company to return a significant amount of value to shareholders. Just since the beginning of 2009, the Company has repurchased $2.9 billion of its shares for an average price of $16.60 a share, reducing shares outstanding by 25%. The Company has also boosted its dividend to a meaningful amount, with shares now yielding 3.0%. While the Company has taken a cautious approach to its outlook towards 2014 share repurchases, we believe that the Company has plenty of capacity to continue its aggressive buybacks with cash of $1.7 billion (~50% domiciled in the U.S.) and leverage (net debt/EBITDA) of just 1.6x.
We continue to believe that Western Union represents an attractive contrarian play with just 6 of the 27 sell-side analysts who follow the shares having a positive view on the stock. Our estimate of WU’s intrinsic value is $22 a share. Should WU shares continue to languish, we would not be surprised if it catches the interest of private equity firms. Western Union’s robust balance sheet and low leverage make the Company an interesting LBO candidate. In addition, we would not be surprised if WU finds itself as the target of an activist investor reflecting recent operational hiccups (compliance and pricing), CFO resignation, and low insider ownership (<1%).
Symbol: WU
Exchange: NYSE Current Price: $16.64 Current Yield: 3.0% Current Dividend: $0.50 Shares Outstanding (MM): 555.8 Major Shareholders: Insiders < 1.0% Average Daily Trading Volume (MM): 7.6 52-Week Price Range: $19.50-$13.20 Price/Earnings Ratio: 10.6x Stated Book Value Per Share: $1.89
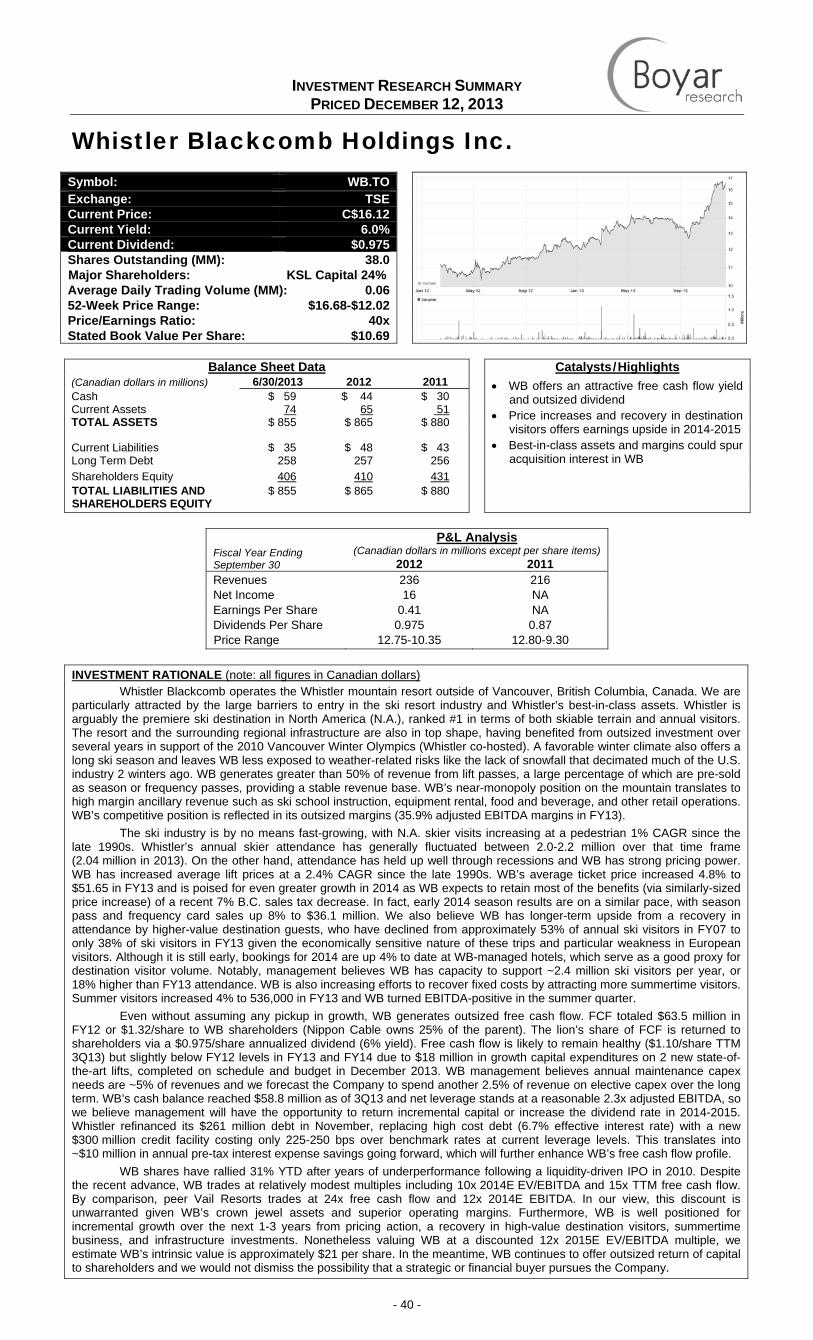
INVESTMENT RESEARCH SUMMARY PRICED DECEMBER 12, 2013
- 40 -
Whistler Blackcomb Holdings Inc.
Balance Sheet Data Catalysts/Highlights
(Canadian dollars in millions) 6/30/2013 2012 2011 • WB offers an attractive free cash flow yield and outsized dividend
• Price increases and recovery in destination visitors offers earnings upside in 2014-2015
• Best-in-class assets and margins could spur acquisition interest in WB
Cash $ 59 $ 44 $ 30 Current Assets 74 65 51 TOTAL ASSETS $ 855 $ 865 $ 880 Current Liabilities $ 35 $ 48 $ 43 Long Term Debt 258 257 256 Shareholders Equity 406 410 431 TOTAL LIABILITIES AND SHAREHOLDERS EQUITY
$ 855 $ 865 $ 880
Fiscal Year Ending September 30
P&L Analysis (Canadian dollars in millions except per share items)
2012 2011Revenues 236 216 Net Income 16 NA Earnings Per Share 0.41 NA Dividends Per Share 0.975 0.87 Price Range 12.75-10.35 12.80-9.30
INVESTMENT RATIONALE (note: all figures in Canadian dollars)
Whistler Blackcomb operates the Whistler mountain resort outside of Vancouver, British Columbia, Canada. We are particularly attracted by the large barriers to entry in the ski resort industry and Whistler’s best-in-class assets. Whistler is arguably the premiere ski destination in North America (N.A.), ranked #1 in terms of both skiable terrain and annual visitors. The resort and the surrounding regional infrastructure are also in top shape, having benefited from outsized investment over several years in support of the 2010 Vancouver Winter Olympics (Whistler co-hosted). A favorable winter climate also offers a long ski season and leaves WB less exposed to weather-related risks like the lack of snowfall that decimated much of the U.S. industry 2 winters ago. WB generates greater than 50% of revenue from lift passes, a large percentage of which are pre-sold as season or frequency passes, providing a stable revenue base. WB’s near-monopoly position on the mountain translates to high margin ancillary revenue such as ski school instruction, equipment rental, food and beverage, and other retail operations. WB’s competitive position is reflected in its outsized margins (35.9% adjusted EBITDA margins in FY13).
The ski industry is by no means fast-growing, with N.A. skier visits increasing at a pedestrian 1% CAGR since the late 1990s. Whistler’s annual skier attendance has generally fluctuated between 2.0-2.2 million over that time frame (2.04 million in 2013). On the other hand, attendance has held up well through recessions and WB has strong pricing power. WB has increased average lift prices at a 2.4% CAGR since the late 1990s. WB’s average ticket price increased 4.8% to $51.65 in FY13 and is poised for even greater growth in 2014 as WB expects to retain most of the benefits (via similarly-sized price increase) of a recent 7% B.C. sales tax decrease. In fact, early 2014 season results are on a similar pace, with season pass and frequency card sales up 8% to $36.1 million. We also believe WB has longer-term upside from a recovery in attendance by higher-value destination guests, who have declined from approximately 53% of annual ski visitors in FY07 to only 38% of ski visitors in FY13 given the economically sensitive nature of these trips and particular weakness in European visitors. Although it is still early, bookings for 2014 are up 4% to date at WB-managed hotels, which serve as a good proxy for destination visitor volume. Notably, management believes WB has capacity to support ~2.4 million ski visitors per year, or 18% higher than FY13 attendance. WB is also increasing efforts to recover fixed costs by attracting more summertime visitors. Summer visitors increased 4% to 536,000 in FY13 and WB turned EBITDA-positive in the summer quarter.
Even without assuming any pickup in growth, WB generates outsized free cash flow. FCF totaled $63.5 million in FY12 or $1.32/share to WB shareholders (Nippon Cable owns 25% of the parent). The lion’s share of FCF is returned to shareholders via a $0.975/share annualized dividend (6% yield). Free cash flow is likely to remain healthy ($1.10/share TTM 3Q13) but slightly below FY12 levels in FY13 and FY14 due to $18 million in growth capital expenditures on 2 new state-of-the-art lifts, completed on schedule and budget in December 2013. WB management believes annual maintenance capex needs are ~5% of revenues and we forecast the Company to spend another 2.5% of revenue on elective capex over the long term. WB’s cash balance reached $58.8 million as of 3Q13 and net leverage stands at a reasonable 2.3x adjusted EBITDA, so we believe management will have the opportunity to return incremental capital or increase the dividend rate in 2014-2015. Whistler refinanced its $261 million debt in November, replacing high cost debt (6.7% effective interest rate) with a new $300 million credit facility costing only 225-250 bps over benchmark rates at current leverage levels. This translates into ~$10 million in annual pre-tax interest expense savings going forward, which will further enhance WB’s free cash flow profile.
WB shares have rallied 31% YTD after years of underperformance following a liquidity-driven IPO in 2010. Despite the recent advance, WB trades at relatively modest multiples including 10x 2014E EV/EBITDA and 15x TTM free cash flow. By comparison, peer Vail Resorts trades at 24x free cash flow and 12x 2014E EBITDA. In our view, this discount is unwarranted given WB’s crown jewel assets and superior operating margins. Furthermore, WB is well positioned for incremental growth over the next 1-3 years from pricing action, a recovery in high-value destination visitors, summertime business, and infrastructure investments. Nonetheless valuing WB at a discounted 12x 2015E EV/EBITDA multiple, we estimate WB’s intrinsic value is approximately $21 per share. In the meantime, WB continues to offer outsized return of capital to shareholders and we would not dismiss the possibility that a strategic or financial buyer pursues the Company.
Symbol: WB.TO Exchange: TSECurrent Price: C$16.12Current Yield: 6.0%Current Dividend: $0.975Shares Outstanding (MM): 38.0Major Shareholders: KSL Capital 24% Average Daily Trading Volume (MM): 0.0652-Week Price Range: $16.68-$12.02Price/Earnings Ratio: 40xStated Book Value Per Share: $10.69
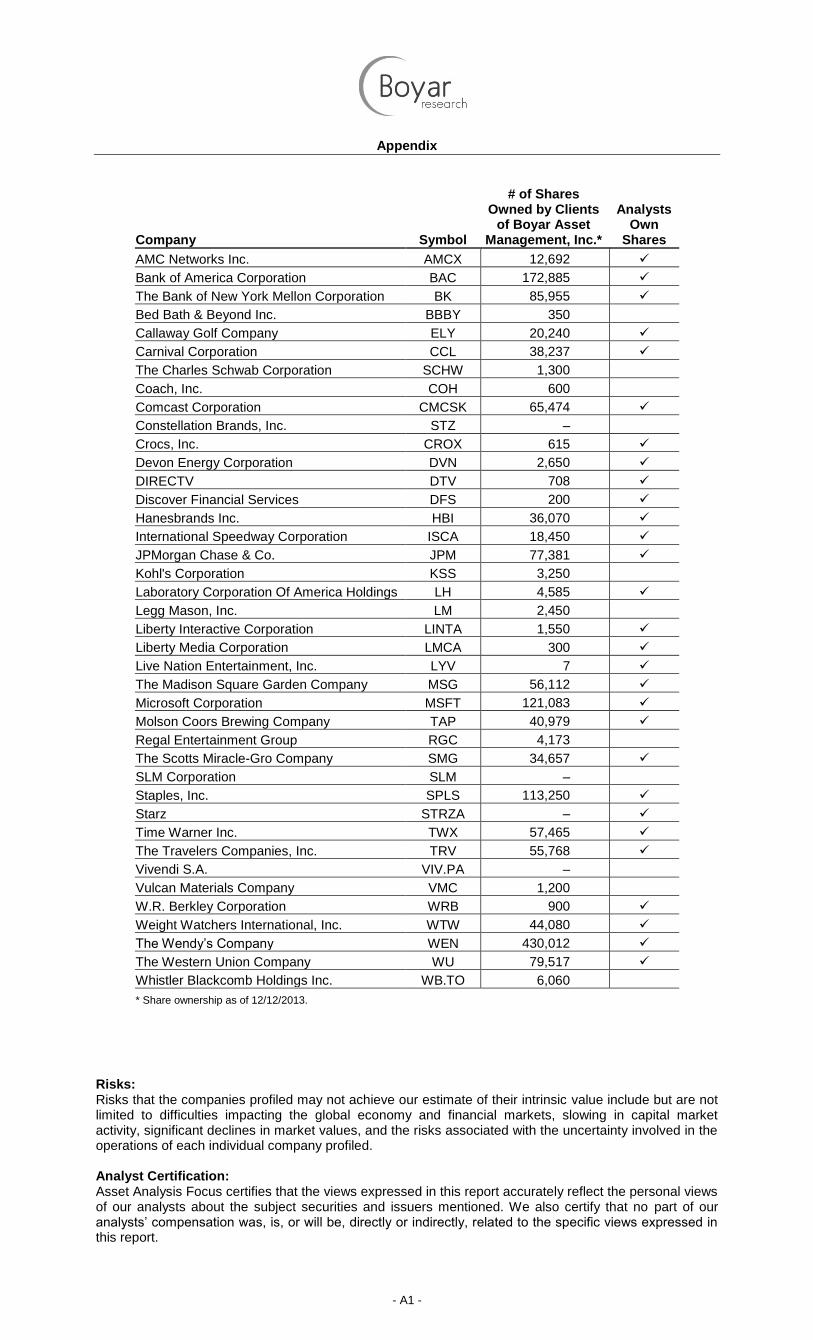
- A1 -
Appendix
Company Symbol
# of Shares Owned by Clients
of Boyar Asset Management, Inc.*
Analysts Own
Shares
AMC Networks Inc. AMCX 12,692
Bank of America Corporation BAC 172,885
The Bank of New York Mellon Corporation BK 85,955
Bed Bath & Beyond Inc. BBBY 350
Callaway Golf Company ELY 20,240
Carnival Corporation CCL 38,237
The Charles Schwab Corporation SCHW 1,300
Coach, Inc. COH 600
Comcast Corporation CMCSK 65,474
Constellation Brands, Inc. STZ –
Crocs, Inc. CROX 615
Devon Energy Corporation DVN 2,650
DIRECTV DTV 708
Discover Financial Services DFS 200
Hanesbrands Inc. HBI 36,070
International Speedway Corporation ISCA 18,450
JPMorgan Chase & Co. JPM 77,381
Kohl's Corporation KSS 3,250
Laboratory Corporation Of America Holdings LH 4,585
Legg Mason, Inc. LM 2,450
Liberty Interactive Corporation LINTA 1,550
Liberty Media Corporation LMCA 300
Live Nation Entertainment, Inc. LYV 7
The Madison Square Garden Company MSG 56,112
Microsoft Corporation MSFT 121,083
Molson Coors Brewing Company TAP 40,979
Regal Entertainment Group RGC 4,173
The Scotts Miracle-Gro Company SMG 34,657
SLM Corporation SLM –
Staples, Inc. SPLS 113,250
Starz STRZA –
Time Warner Inc. TWX 57,465
The Travelers Companies, Inc. TRV 55,768
Vivendi S.A. VIV.PA –
Vulcan Materials Company VMC 1,200
W.R. Berkley Corporation WRB 900
Weight Watchers International, Inc. WTW 44,080
The Wendy’s Company WEN 430,012
The Western Union Company WU 79,517
Whistler Blackcomb Holdings Inc. WB.TO 6,060
* Share ownership as of 12/12/2013.
Risks: Risks that the companies profiled may not achieve our estimate of their intrinsic value include but are not limited to difficulties impacting the global economy and financial markets, slowing in capital market activity, significant declines in market values, and the risks associated with the uncertainty involved in the operations of each individual company profiled. Analyst Certification: Asset Analysis Focus certifies that the views expressed in this report accurately reflect the personal views of our analysts about the subject securities and issuers mentioned. We also certify that no part of our analysts’ compensation was, is, or will be, directly or indirectly, related to the specific views expressed in this report.