Embed Size (px)
Citation preview
Volume XVI, Issue 1 April 2017
Volume XVI, Issue 1 April 2017
Economic Policy Group
Monetary Authority of Singapore
ISSN 0219-8908
Published in April 2017
Economic Policy Group Monetary Authority of Singapore
http://www.mas.gov.sg
All rights reserved. No part of this publication may be reproduced, stored in a retrieval system or transmitted in any form or by any means, electronic, mechanised, photocopying, recording or otherwise, without the prior written permission of the copyright owner except in accordance with the provisions of the Copyright Act (Cap. 63). Application for the copyright owner's written permission to reproduce any part of this publication should be addressed to:
Economic Policy Group Monetary Authority of Singapore 10 Shenton Way MAS Building Singapore 079117
Printed by Xpress Print Singapore
Monetary Authority of Singapore Economic Policy Group
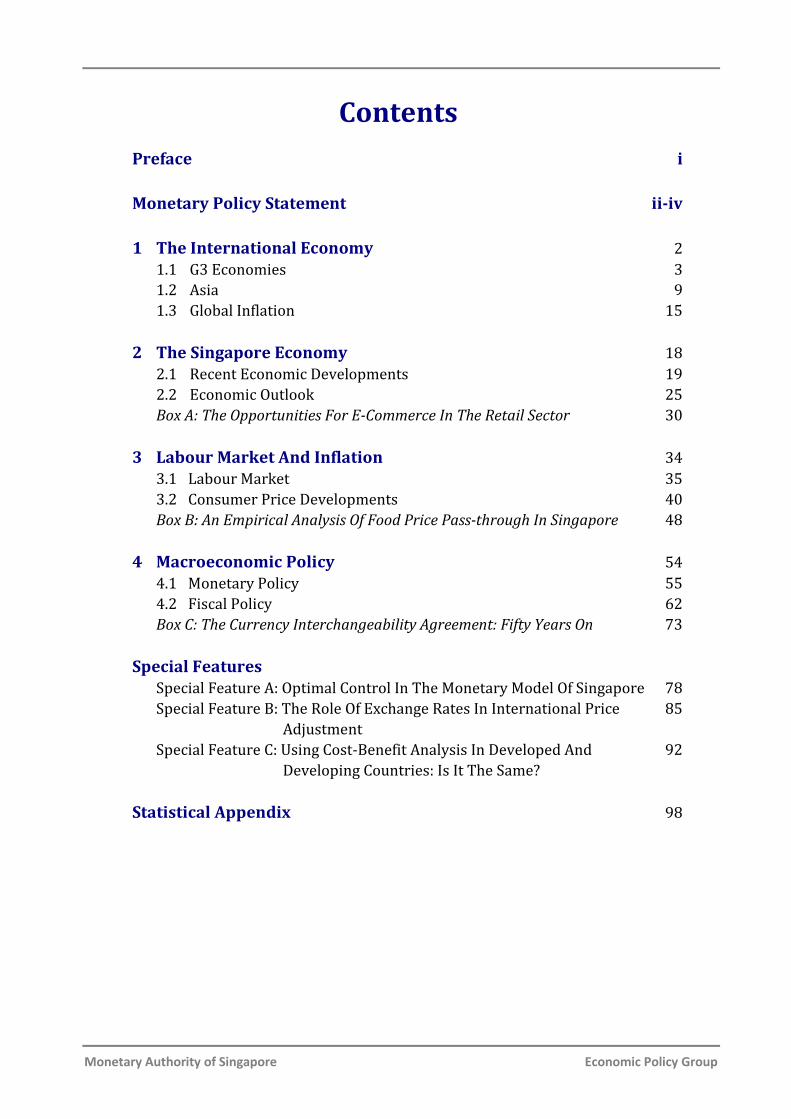
Contents Preface i Monetary Policy Statement ii-iv 1 The International Economy 2 1.1 G3 Economies 3 1.2 Asia 9 1.3 Global Inflation 15 2 The Singapore Economy 18 2.1 Recent Economic Developments 19 2.2 Economic Outlook 25 Box A: The Opportunities For E-Commerce In The Retail Sector 30 3 Labour Market And Inflation 34 3.1 Labour Market 35 3.2 Consumer Price Developments 40
Box B: An Empirical Analysis Of Food Price Pass-through In Singapore 48
4 Macroeconomic Policy 54 4.1 Monetary Policy 55 4.2 Fiscal Policy 62
Box C: The Currency Interchangeability Agreement: Fifty Years On 73 Special Features
Special Feature A: Optimal Control In The Monetary Model Of Singapore 78 Special Feature B: The Role Of Exchange Rates In International Price 85 Adjustment Special Feature C: Using Cost-Benefit Analysis In Developed And 92 Developing Countries: Is It The Same?
Statistical Appendix 98
Macroeconomic Review, April 2017
Monetary Authority of Singapore Economic Policy Group
LIST OF ABBREVIATIONS
3MMA three-month moving average ACU Asian Currency Unit AE advanced economies ASEAN Association of Southeast Asian Nations BOJ Bank of Japan CFE Committee on the Future Economy COE Certificate of Entitlement CPF Central Provident Fund CPI consumer price index DBU Domestic Banking Unit ECB European Central Bank EIA Energy Information Administration EPG Economic Policy Group FI Fiscal Impulse FOMC Federal Open Market Committee GFC Global Financial Crisis GFCF gross fixed capital formation GOS gross operating surplus GST Goods and Services Tax ICT information and communications technology IMF International Monetary Fund IT information technology LIBOR London interbank offered rate MMS Monetary Model of Singapore MNC multinational corporation m-o-m month-on-month NEA Northeast Asian economies NEER nominal effective exchange rate NODX Non-oil Domestic Exports OECD Organisation for Economic Cooperation and Development OPEC Organisation of the Petroleum Exporting Countries PBOC People’s Bank of China PMET professionals, managers, executives and technicians PMI Purchasing Managers’ Index PPI producer price index q-o-q quarter-on-quarter REER real effective exchange rate SA seasonally adjusted SAAR seasonally adjusted annualised rate SIBOR Singapore interbank offered rate SME small and medium enterprise UBC unit business cost ULC unit labour cost WTO World Trade Organisation y-o-y year-on-year

Preface i
Monetary Authority of Singapore Economic Policy Group
Preface The Macroeconomic Review is published twice a year in conjunction with the release of the MAS Monetary Policy Statement. The Review documents the Economic Policy Group’s (EPG) analysis and assessment of macroeconomic developments in the Singapore economy, and shares with market participants, analysts and the wider public, the basis for the policy decisions conveyed in the Monetary Policy Statement. It also features in-depth studies undertaken by EPG on important economic issues facing Singapore. To mark the 50th anniversary of the Currency Interchangeability Agreement between Singapore and Brunei Darussalam, EPG and the Autoriti Monetari Brunei Darussalam (AMBD) collaborated on a commemorative article. Box C presents a historical narrative of the currency arrangements in both territories that led to the Agreement, and explains why currency interchangeability has worked well for Singapore and Brunei. We would like to thank Mr Freddy Orchard for his comments on the article. Also in this issue of the Review, Special Feature A presents the newly incorporated optimal control capability in EPG’s flagship model, the Monetary Model of Singapore. As in past editions, we are pleased to highlight the research of visiting MAS Term Professors, and in this issue we are grateful to Professor Charles Engel from the University of Wisconsin–Madison for contributing Special Feature B on the role of exchange rates in international price adjustment. Our appreciation goes to Professor Euston Quah of the Nanyang Technological University for Special Feature C, which examines the pitfalls of applying cost-benefit analysis to developing countries. Finally, we would like to thank Associate Professor Peter Wilson for editing the Review. The data used in the Review was drawn from the following government agencies, unless otherwise stated: BCA, CAAS, CPF Board, DOS, EDB, IE Singapore, LTA, MOF, MOM, MND, MPA, MTI, STB and URA. The Review can be accessed in PDF format on the MAS website: http://www.mas.gov.sg/Monetary-Policy-and-Economics/Monetary- Policy/Macroeconomic-Review. Hard copies of the Review may also be purchased at major bookstores or ordered online (http://www.marketasiabooks.com).
ii Macroeconomic Review, April 2017
Monetary Authority of Singapore Economic Policy Group
13 April 2017
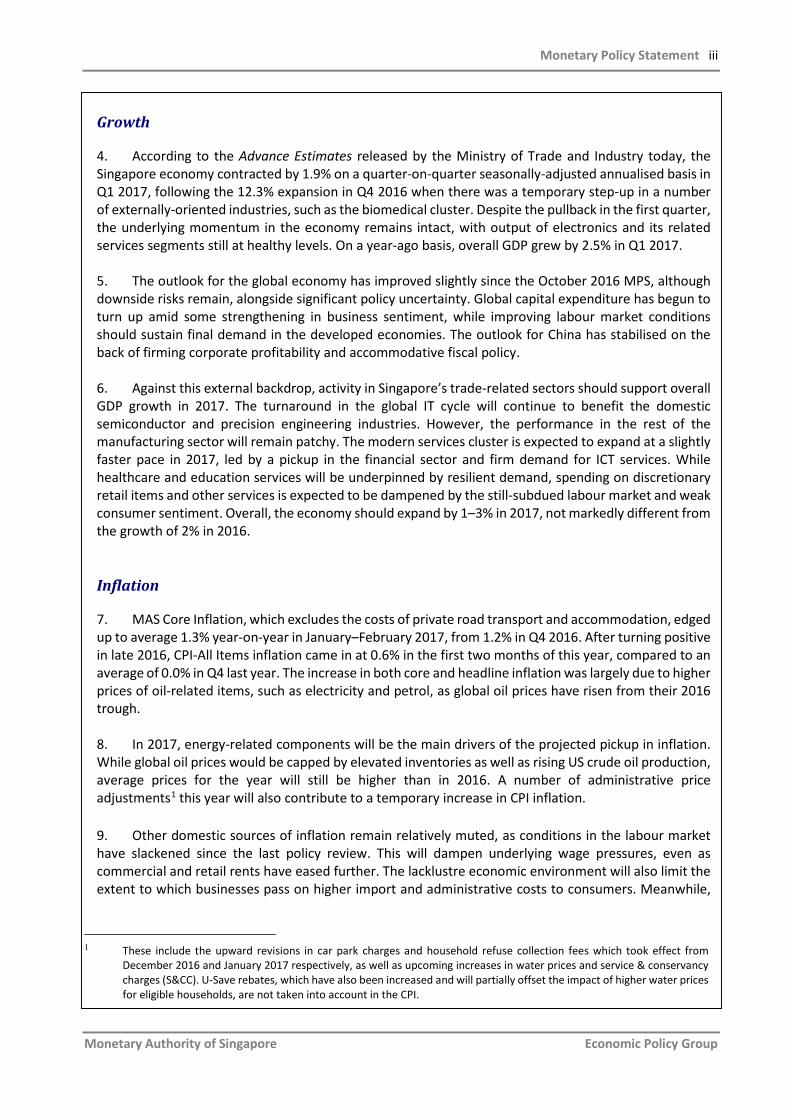
Monetary Policy Statement INTRODUCTION 1. In the October 2016 Monetary Policy Statement (MPS), MAS kept the slope of the Singapore dollar nominal effective exchange rate (S$NEER) policy band at zero percent, with no change to the width of the policy band or the level at which it was centred. This policy stance was assessed to be appropriate given the subdued outlook for growth and inflation.
Chart 1 S$ Nominal Effective Exchange Rate (S$NEER)
2. Following the October 2016 MPS, the S$NEER has fluctuated around a strengthening trend, appreciating from below the mid-point of the policy band to the upper half of the band. The appreciation from late February 2017 reflected, in part, broad-based US dollar weakness. Meanwhile, the three-month S$ SIBOR rose from 0.87% as at end-October 2016 to 0.95% by end-March 2017. OUTLOOK
3. Over the last six months, the global economy has picked up and should continue to support Singapore’s trade-related sectors. However, activity across the broader domestic economy is likely to be uneven, and overall GDP growth in 2017 will remain modest. MAS Core Inflation will rise from 0.9% in 2016 to average 1–2% in 2017 due to increases in global oil prices, as well as the temporary effects of administrative price hikes. Over the medium term, core inflation is expected to trend towards but average slightly below 2%.
98
100
102
104
106
Apr Jul Oct Jan Apr Jul Oct Jan Apr Jul Oct Jan Apr Jul Oct Jan Apr
Inde
x (1
–5 A
pr 2
013
Ave
rage
= 1
00)
2013
Appreciation
Depreciation
indicates release of Monetary Policy Statement
2014 2015 2016 2017
Monetary Policy Statement iii
Monetary Authority of Singapore Economic Policy Group
Growth
4. According to the Advance Estimates released by the Ministry of Trade and Industry today, the Singapore economy contracted by 1.9% on a quarter-on-quarter seasonally-adjusted annualised basis in Q1 2017, following the 12.3% expansion in Q4 2016 when there was a temporary step-up in a number of externally-oriented industries, such as the biomedical cluster. Despite the pullback in the first quarter, the underlying momentum in the economy remains intact, with output of electronics and its related services segments still at healthy levels. On a year-ago basis, overall GDP grew by 2.5% in Q1 2017. 5. The outlook for the global economy has improved slightly since the October 2016 MPS, although downside risks remain, alongside significant policy uncertainty. Global capital expenditure has begun to turn up amid some strengthening in business sentiment, while improving labour market conditions should sustain final demand in the developed economies. The outlook for China has stabilised on the back of firming corporate profitability and accommodative fiscal policy. 6. Against this external backdrop, activity in Singapore’s trade-related sectors should support overall GDP growth in 2017. The turnaround in the global IT cycle will continue to benefit the domestic semiconductor and precision engineering industries. However, the performance in the rest of the manufacturing sector will remain patchy. The modern services cluster is expected to expand at a slightly faster pace in 2017, led by a pickup in the financial sector and firm demand for ICT services. While healthcare and education services will be underpinned by resilient demand, spending on discretionary retail items and other services is expected to be dampened by the still-subdued labour market and weak consumer sentiment. Overall, the economy should expand by 1–3% in 2017, not markedly different from the growth of 2% in 2016.
Inflation
7. MAS Core Inflation, which excludes the costs of private road transport and accommodation, edged up to average 1.3% year-on-year in January–February 2017, from 1.2% in Q4 2016. After turning positive in late 2016, CPI-All Items inflation came in at 0.6% in the first two months of this year, compared to an average of 0.0% in Q4 last year. The increase in both core and headline inflation was largely due to higher prices of oil-related items, such as electricity and petrol, as global oil prices have risen from their 2016 trough. 8. In 2017, energy-related components will be the main drivers of the projected pickup in inflation. While global oil prices would be capped by elevated inventories as well as rising US crude oil production, average prices for the year will still be higher than in 2016. A number of administrative price adjustments1 this year will also contribute to a temporary increase in CPI inflation.
9. Other domestic sources of inflation remain relatively muted, as conditions in the labour market have slackened since the last policy review. This will dampen underlying wage pressures, even as commercial and retail rents have eased further. The lacklustre economic environment will also limit the extent to which businesses pass on higher import and administrative costs to consumers. Meanwhile,
1 These include the upward revisions in car park charges and household refuse collection fees which took effect from
December 2016 and January 2017 respectively, as well as upcoming increases in water prices and service & conservancy charges (S&CC). U-Save rebates, which have also been increased and will partially offset the impact of higher water prices for eligible households, are not taken into account in the CPI.
iv Macroeconomic Review, April 2017
Monetary Authority of Singapore Economic Policy Group
housing rents are likely to continue declining this year, given the elevated vacancy rate in the residential property market. 10. MAS’ inflation forecasts for 2017 remain unchanged from the October 2016 MPS. MAS Core Inflation is projected to average 1–2%, compared to 0.9% in 2016, while CPI-All Items inflation is expected to rise to 0.5–1.5% from −0.5% last year. MONETARY POLICY 11. The Singapore economy will continue to expand at a modest pace in 2017. MAS Core Inflation is envisaged to rise gradually, largely on account of higher global oil prices. However, demand-driven inflationary pressures will likely be restrained. Over the medium term, core inflation is expected to trend towards but average slightly below 2%. 12. MAS will therefore maintain the rate of appreciation of the S$NEER policy band at zero percent. The width of the policy band and the level at which it is centred will be unchanged. As indicated in the October 2016 MPS, a neutral policy stance is appropriate for an extended period and should ensure medium-term price stability.

Chapter1TheInternationalEconomy
2 Macroeconomic Review, April 2017
Monetary Authority of Singapore Economic Policy Group
1 The International Economy
Some Improvement In Global Growth
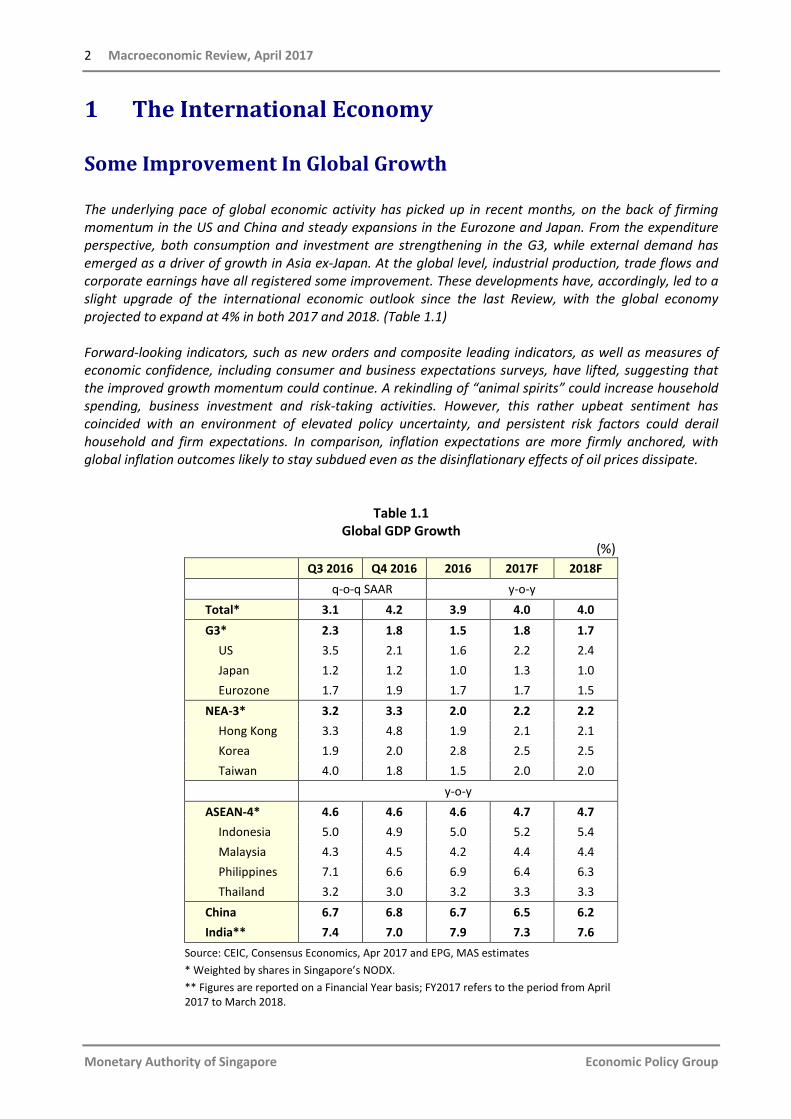
The underlying pace of global economic activity has picked up in recent months, on the back of firming momentum in the US and China and steady expansions in the Eurozone and Japan. From the expenditure perspective, both consumption and investment are strengthening in the G3, while external demand has emerged as a driver of growth in Asia ex-Japan. At the global level, industrial production, trade flows and corporate earnings have all registered some improvement. These developments have, accordingly, led to a slight upgrade of the international economic outlook since the last Review, with the global economy projected to expand at 4% in both 2017 and 2018. (Table 1.1) Forward-looking indicators, such as new orders and composite leading indicators, as well as measures of economic confidence, including consumer and business expectations surveys, have lifted, suggesting that the improved growth momentum could continue. A rekindling of “animal spirits” could increase household spending, business investment and risk-taking activities. However, this rather upbeat sentiment has coincided with an environment of elevated policy uncertainty, and persistent risk factors could derail household and firm expectations. In comparison, inflation expectations are more firmly anchored, with global inflation outcomes likely to stay subdued even as the disinflationary effects of oil prices dissipate.
Table 1.1 Global GDP Growth
(%) Q3 2016 Q4 2016 2016 2017F 2018F
q-o-q SAAR y-o-y Total* 3.1 4.2 3.9 4.0 4.0 G3* 2.3 1.8 1.5 1.8 1.7
US 3.5 2.1 1.6 2.2 2.4 Japan 1.2 1.2 1.0 1.3 1.0 Eurozone 1.7 1.9 1.7 1.7 1.5
NEA-3* 3.2 3.3 2.0 2.2 2.2 Hong Kong 3.3 4.8 1.9 2.1 2.1 Korea 1.9 2.0 2.8 2.5 2.5 Taiwan 4.0 1.8 1.5 2.0 2.0
y-o-y ASEAN-4* 4.6 4.6 4.6 4.7 4.7
Indonesia 5.0 4.9 5.0 5.2 5.4 Malaysia 4.3 4.5 4.2 4.4 4.4 Philippines 7.1 6.6 6.9 6.4 6.3 Thailand 3.2 3.0 3.2 3.3 3.3
China 6.7 6.8 6.7 6.5 6.2 India** 7.4 7.0 7.9 7.3 7.6
Source: CEIC, Consensus Economics, Apr 2017 and EPG, MAS estimates * Weighted by shares in Singapore’s NODX. ** Figures are reported on a Financial Year basis; FY2017 refers to the period from April 2017 to March 2018.
The International Economy 3
Monetary Authority of Singapore Economic Policy Group
1.1 G3 Economies
Consumption And Investment Have Picked Up
Although G3 GDP growth declined to 1.8% q-o-q SAAR in Q4 2016, from 2.3% in Q3, this was mainly on account of a pullback in the US economy after a one-off export-led surge. Abstracting from quarterly fluctuations, average G3 growth in H2 2016 (2.1%) was higher than in H1 (1.6%). Led by the US, the G3 as a whole has experienced a strengthening of domestic demand in Q4, compared to Q3, as labour markets continued to recover and economic sentiment picked up. Moreover, forward-looking indicators, such as PMIs, suggest that G3 activity is likely to stay firm this year. Positive business sentiment and higher corporate earnings could also support a more decisive upturn in private investment. On the downside, shifts in the domestic and foreign policies of the US administration remain a risk, and the political uncertainty arising from key elections in Europe has further clouded the outlook. Global economic policy uncertainty has reached unprecedented levels in recent periods, and a downward adjustment of growth expectations, should pro-growth policies not materialise, cannot be ruled out. As a baseline, the G3 economies are expected to grow by 1.8% in 2017 and 1.7% in 2018, up from 1.5% last year.
Domestic demand firmly underpinned US growth.
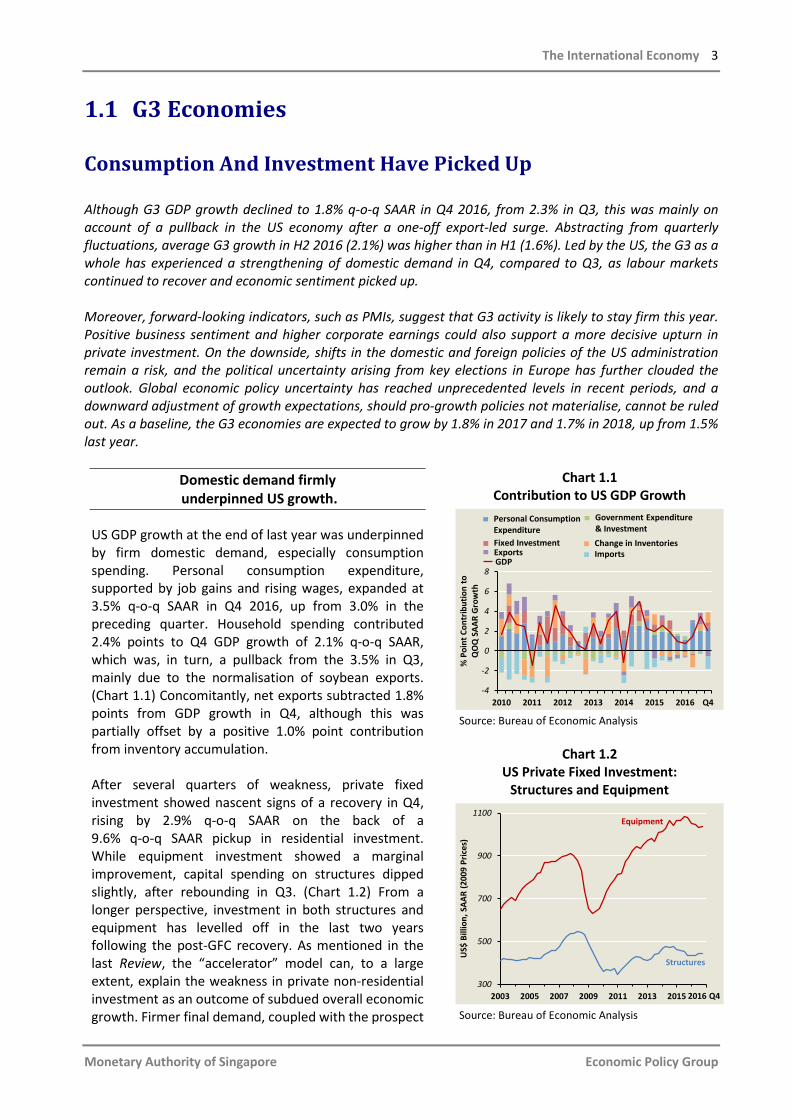
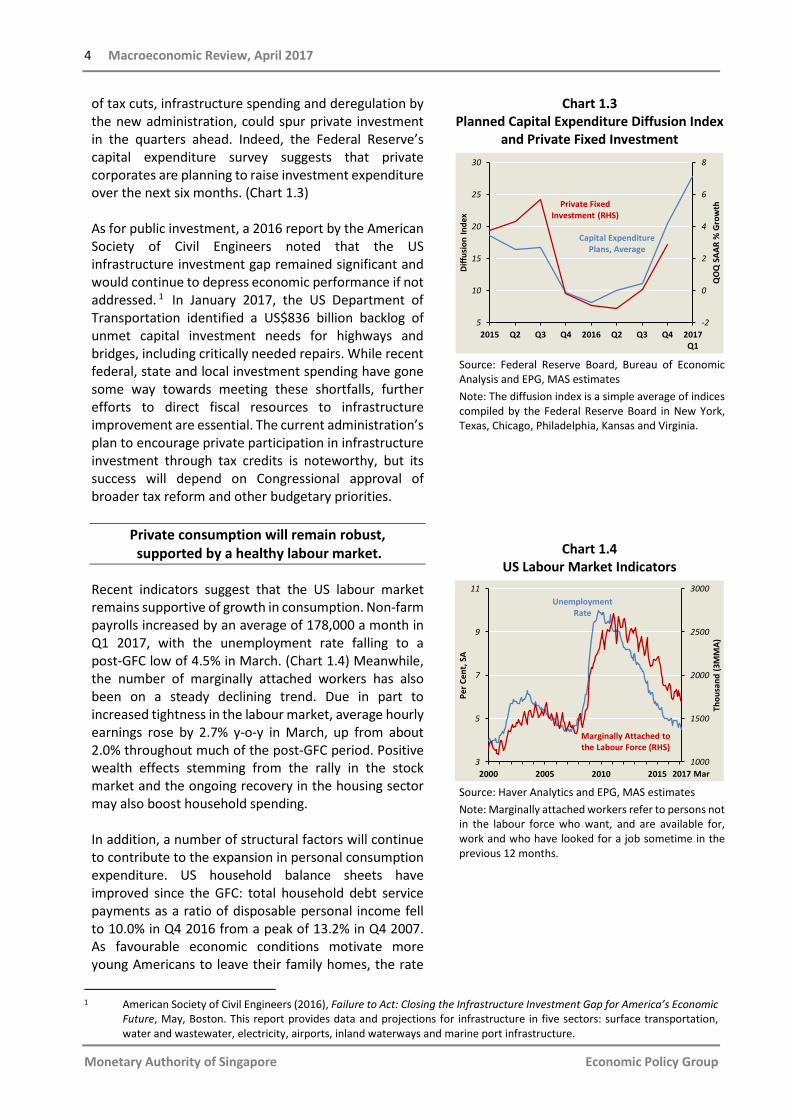
US GDP growth at the end of last year was underpinned by firm domestic demand, especially consumption spending. Personal consumption expenditure, supported by job gains and rising wages, expanded at 3.5% q-o-q SAAR in Q4 2016, up from 3.0% in the preceding quarter. Household spending contributed 2.4% points to Q4 GDP growth of 2.1% q-o-q SAAR, which was, in turn, a pullback from the 3.5% in Q3, mainly due to the normalisation of soybean exports. (Chart 1.1) Concomitantly, net exports subtracted 1.8% points from GDP growth in Q4, although this was partially offset by a positive 1.0% point contribution from inventory accumulation. After several quarters of weakness, private fixed investment showed nascent signs of a recovery in Q4, rising by 2.9% q-o-q SAAR on the back of a 9.6% q-o-q SAAR pickup in residential investment. While equipment investment showed a marginal improvement, capital spending on structures dipped slightly, after rebounding in Q3. (Chart 1.2) From a longer perspective, investment in both structures and equipment has levelled off in the last two years following the post-GFC recovery. As mentioned in the last Review, the “accelerator” model can, to a large extent, explain the weakness in private non-residential investment as an outcome of subdued overall economic growth. Firmer final demand, coupled with the prospect
Chart 1.1 Contribution to US GDP Growth
Source: Bureau of Economic Analysis
Chart 1.2 US Private Fixed Investment:
Structures and Equipment
Source: Bureau of Economic Analysis
-4
-2
0
2
4
6
8
2010 2011 2012 2013 2014 2015 2016 Q4
% P
oint
Con
trib
utio
n to
QO
Q S
AAR
Gro
wth
ImportsChange in InventoriesFixed Investment
Exports
Government Expenditure & Investment
Personal ConsumptionExpenditure
GDP
300
500
700
900
1100
2003 2005 2007 2009 2011 2013 2015 2017
US$
Bill
ion,
SAA
R (2
009
Pric
es)
Structures
Equipment
2016 Q4
4 Macroeconomic Review, April 2017
Monetary Authority of Singapore Economic Policy Group
of tax cuts, infrastructure spending and deregulation by the new administration, could spur private investment in the quarters ahead. Indeed, the Federal Reserve’s capital expenditure survey suggests that private corporates are planning to raise investment expenditure over the next six months. (Chart 1.3) As for public investment, a 2016 report by the American Society of Civil Engineers noted that the US infrastructure investment gap remained significant and would continue to depress economic performance if not addressed. 1 In January 2017, the US Department of Transportation identified a US$836 billion backlog of unmet capital investment needs for highways and bridges, including critically needed repairs. While recent federal, state and local investment spending have gone some way towards meeting these shortfalls, further efforts to direct fiscal resources to infrastructure improvement are essential. The current administration’s plan to encourage private participation in infrastructure investment through tax credits is noteworthy, but its success will depend on Congressional approval of broader tax reform and other budgetary priorities.
Private consumption will remain robust, supported by a healthy labour market.
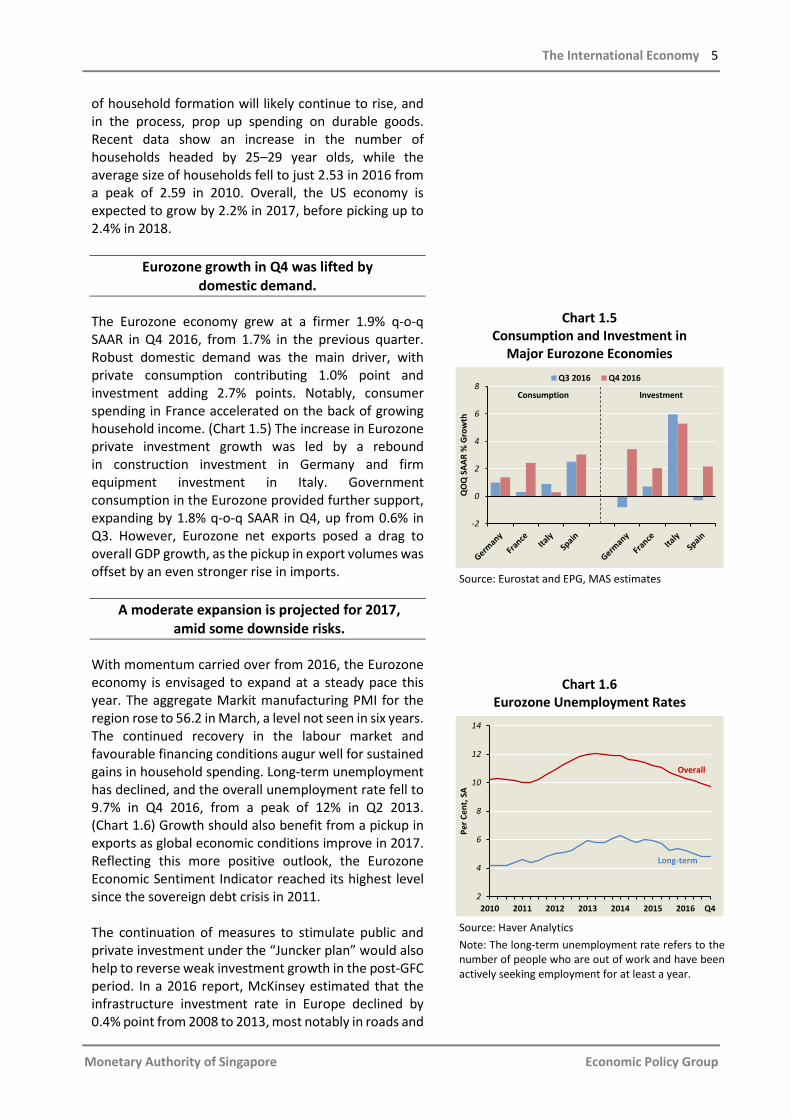
Recent indicators suggest that the US labour market remains supportive of growth in consumption. Non-farm payrolls increased by an average of 178,000 a month in Q1 2017, with the unemployment rate falling to a post-GFC low of 4.5% in March. (Chart 1.4) Meanwhile, the number of marginally attached workers has also been on a steady declining trend. Due in part to increased tightness in the labour market, average hourly earnings rose by 2.7% y-o-y in March, up from about 2.0% throughout much of the post-GFC period. Positive wealth effects stemming from the rally in the stock market and the ongoing recovery in the housing sector may also boost household spending. In addition, a number of structural factors will continue to contribute to the expansion in personal consumption expenditure. US household balance sheets have improved since the GFC: total household debt service payments as a ratio of disposable personal income fell to 10.0% in Q4 2016 from a peak of 13.2% in Q4 2007. As favourable economic conditions motivate more young Americans to leave their family homes, the rate
Chart 1.3 Planned Capital Expenditure Diffusion Index
and Private Fixed Investment
Source: Federal Reserve Board, Bureau of Economic Analysis and EPG, MAS estimates Note: The diffusion index is a simple average of indices compiled by the Federal Reserve Board in New York, Texas, Chicago, Philadelphia, Kansas and Virginia.
Chart 1.4 US Labour Market Indicators
Source: Haver Analytics and EPG, MAS estimates Note: Marginally attached workers refer to persons not in the labour force who want, and are available for, work and who have looked for a job sometime in the previous 12 months.
1 American Society of Civil Engineers (2016), Failure to Act: Closing the Infrastructure Investment Gap for America’s Economic
Future, May, Boston. This report provides data and projections for infrastructure in five sectors: surface transportation, water and wastewater, electricity, airports, inland waterways and marine port infrastructure.
-2
0
2
4
6
8
5
10
15
20
25
30
2015 Q2 Q3 Q4 2016 Q2 Q3 Q4 2017Q1
QO
Q S
AAR
% G
row
th
Diff
usio
n In
dex
Capital Expenditure Plans, Average
Private Fixed Investment (RHS)
1000
1500
2000
2500
3000
3
5
7
9
11
2000 2005 2010 2015
Thou
sand
(3M
MA)
Per C
ent,
SA
Marginally Attached to the Labour Force (RHS)
Unemployment Rate
2017 Mar
The International Economy 5
Monetary Authority of Singapore Economic Policy Group
of household formation will likely continue to rise, and in the process, prop up spending on durable goods. Recent data show an increase in the number of households headed by 25–29 year olds, while the average size of households fell to just 2.53 in 2016 from a peak of 2.59 in 2010. Overall, the US economy is expected to grow by 2.2% in 2017, before picking up to 2.4% in 2018.
Eurozone growth in Q4 was lifted by domestic demand.
The Eurozone economy grew at a firmer 1.9% q-o-q SAAR in Q4 2016, from 1.7% in the previous quarter. Robust domestic demand was the main driver, with private consumption contributing 1.0% point and investment adding 2.7% points. Notably, consumer spending in France accelerated on the back of growing household income. (Chart 1.5) The increase in Eurozone private investment growth was led by a rebound in construction investment in Germany and firm equipment investment in Italy. Government consumption in the Eurozone provided further support, expanding by 1.8% q-o-q SAAR in Q4, up from 0.6% in Q3. However, Eurozone net exports posed a drag to overall GDP growth, as the pickup in export volumes was offset by an even stronger rise in imports.
A moderate expansion is projected for 2017, amid some downside risks.
With momentum carried over from 2016, the Eurozone economy is envisaged to expand at a steady pace this year. The aggregate Markit manufacturing PMI for the region rose to 56.2 in March, a level not seen in six years. The continued recovery in the labour market and favourable financing conditions augur well for sustained gains in household spending. Long-term unemployment has declined, and the overall unemployment rate fell to 9.7% in Q4 2016, from a peak of 12% in Q2 2013. (Chart 1.6) Growth should also benefit from a pickup in exports as global economic conditions improve in 2017. Reflecting this more positive outlook, the Eurozone Economic Sentiment Indicator reached its highest level since the sovereign debt crisis in 2011. The continuation of measures to stimulate public and private investment under the “Juncker plan” would also help to reverse weak investment growth in the post-GFC period. In a 2016 report, McKinsey estimated that the infrastructure investment rate in Europe declined by 0.4% point from 2008 to 2013, most notably in roads and
Chart 1.5 Consumption and Investment in
Major Eurozone Economies
Source: Eurostat and EPG, MAS estimates
Chart 1.6 Eurozone Unemployment Rates
Source: Haver Analytics Note: The long-term unemployment rate refers to the number of people who are out of work and have been actively seeking employment for at least a year.
-2
0
2
4
6
8
QO
Q S
AAR
% G
row
th
Q3 2016 Q4 2016
Consumption Investment
2
4
6
8
10
12
14
2010 2011 2012 2013 2014 2015 2016 Q4
Per C
ent,
SA
Long-term
Overall
6 Macroeconomic Review, April 2017
Monetary Authority of Singapore Economic Policy Group
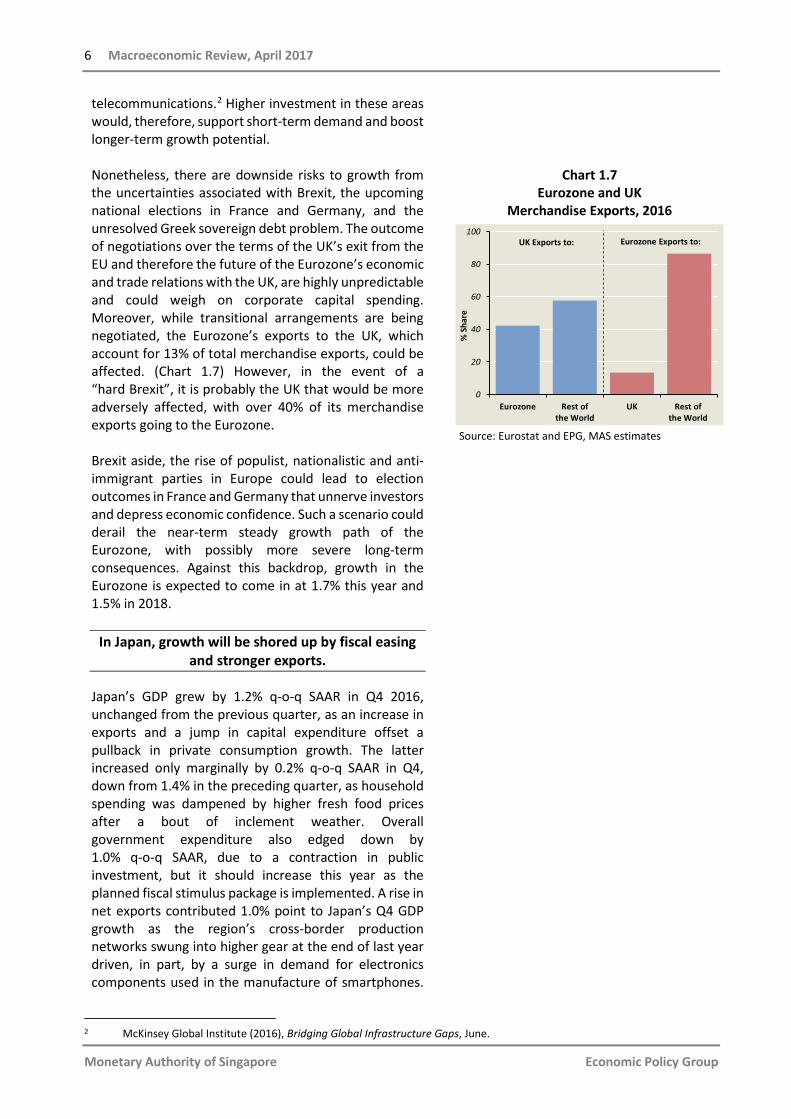
telecommunications.2 Higher investment in these areas would, therefore, support short-term demand and boost longer-term growth potential. Nonetheless, there are downside risks to growth from the uncertainties associated with Brexit, the upcoming national elections in France and Germany, and the unresolved Greek sovereign debt problem. The outcome of negotiations over the terms of the UK’s exit from the EU and therefore the future of the Eurozone’s economic and trade relations with the UK, are highly unpredictable and could weigh on corporate capital spending. Moreover, while transitional arrangements are being negotiated, the Eurozone’s exports to the UK, which account for 13% of total merchandise exports, could be affected. (Chart 1.7) However, in the event of a “hard Brexit”, it is probably the UK that would be more adversely affected, with over 40% of its merchandise exports going to the Eurozone. Brexit aside, the rise of populist, nationalistic and anti-immigrant parties in Europe could lead to election outcomes in France and Germany that unnerve investors and depress economic confidence. Such a scenario could derail the near-term steady growth path of the Eurozone, with possibly more severe long-term consequences. Against this backdrop, growth in the Eurozone is expected to come in at 1.7% this year and 1.5% in 2018.
In Japan, growth will be shored up by fiscal easing and stronger exports.
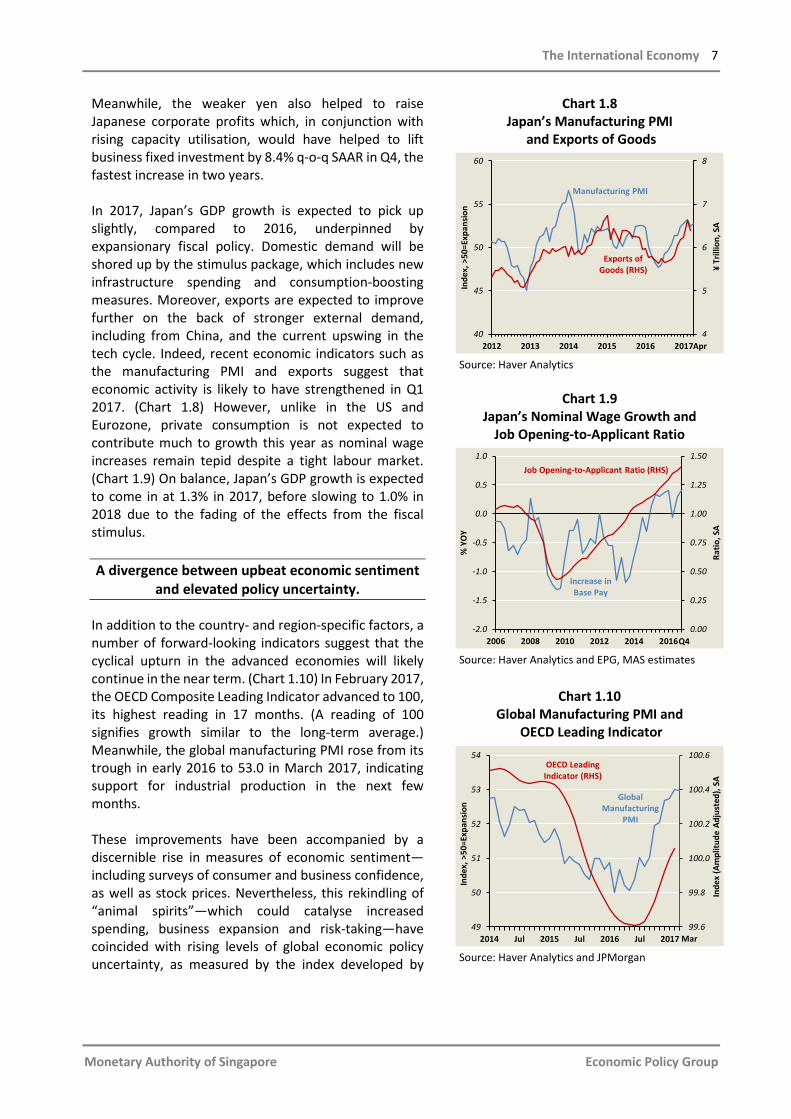
Japan’s GDP grew by 1.2% q-o-q SAAR in Q4 2016, unchanged from the previous quarter, as an increase in exports and a jump in capital expenditure offset a pullback in private consumption growth. The latter increased only marginally by 0.2% q-o-q SAAR in Q4, down from 1.4% in the preceding quarter, as household spending was dampened by higher fresh food prices after a bout of inclement weather. Overall government expenditure also edged down by 1.0% q-o-q SAAR, due to a contraction in public investment, but it should increase this year as the planned fiscal stimulus package is implemented. A rise in net exports contributed 1.0% point to Japan’s Q4 GDP growth as the region’s cross-border production networks swung into higher gear at the end of last year driven, in part, by a surge in demand for electronics components used in the manufacture of smartphones.
Chart 1.7 Eurozone and UK
Merchandise Exports, 2016
Source: Eurostat and EPG, MAS estimates
2 McKinsey Global Institute (2016), Bridging Global Infrastructure Gaps, June.
0
20
40
60
80
100
Eurozone Rest ofthe World
UK Rest ofthe World
% S
hare
UK Exports to: Eurozone Exports to:
The International Economy 7
Monetary Authority of Singapore Economic Policy Group
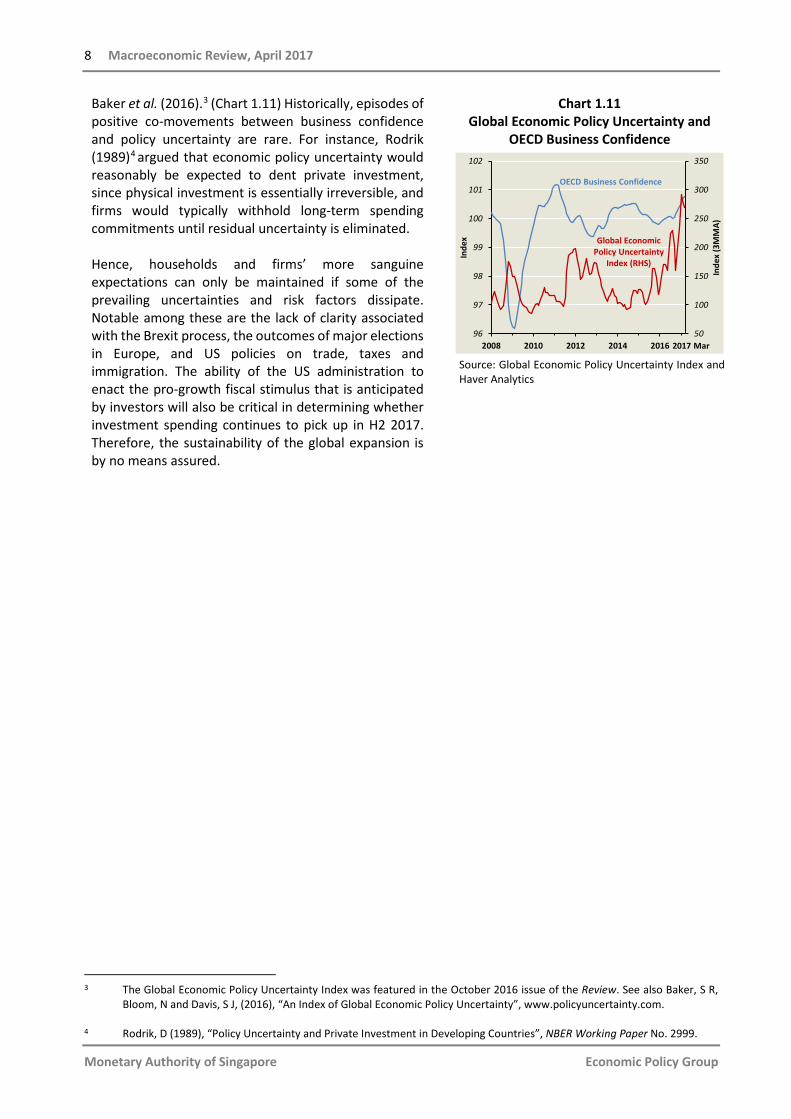
Meanwhile, the weaker yen also helped to raise Japanese corporate profits which, in conjunction with rising capacity utilisation, would have helped to lift business fixed investment by 8.4% q-o-q SAAR in Q4, the fastest increase in two years. In 2017, Japan’s GDP growth is expected to pick up slightly, compared to 2016, underpinned by expansionary fiscal policy. Domestic demand will be shored up by the stimulus package, which includes new infrastructure spending and consumption-boosting measures. Moreover, exports are expected to improve further on the back of stronger external demand, including from China, and the current upswing in the tech cycle. Indeed, recent economic indicators such as the manufacturing PMI and exports suggest that economic activity is likely to have strengthened in Q1 2017. (Chart 1.8) However, unlike in the US and Eurozone, private consumption is not expected to contribute much to growth this year as nominal wage increases remain tepid despite a tight labour market. (Chart 1.9) On balance, Japan’s GDP growth is expected to come in at 1.3% in 2017, before slowing to 1.0% in 2018 due to the fading of the effects from the fiscal stimulus. A divergence between upbeat economic sentiment
and elevated policy uncertainty.
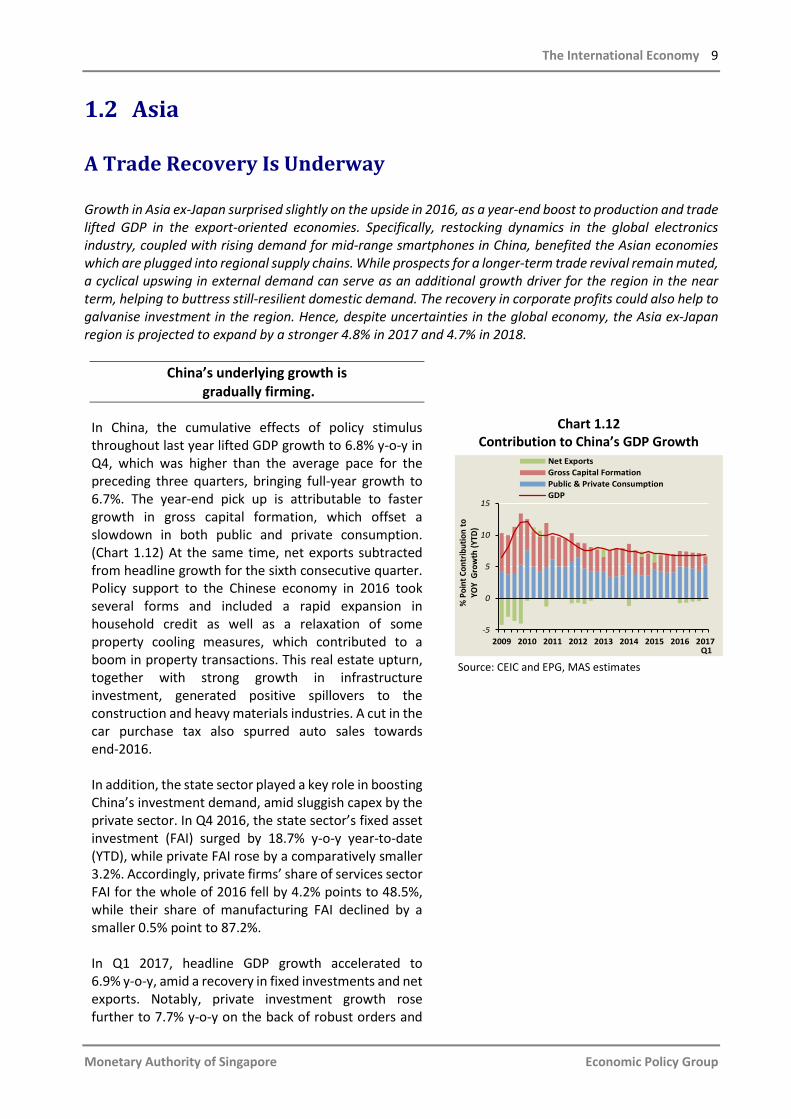
In addition to the country- and region-specific factors, a number of forward-looking indicators suggest that the cyclical upturn in the advanced economies will likely continue in the near term. (Chart 1.10) In February 2017, the OECD Composite Leading Indicator advanced to 100, its highest reading in 17 months. (A reading of 100 signifies growth similar to the long-term average.) Meanwhile, the global manufacturing PMI rose from its trough in early 2016 to 53.0 in March 2017, indicating support for industrial production in the next few months. These improvements have been accompanied by a discernible rise in measures of economic sentiment—including surveys of consumer and business confidence, as well as stock prices. Nevertheless, this rekindling of “animal spirits”—which could catalyse increased spending, business expansion and risk-taking—have coincided with rising levels of global economic policy uncertainty, as measured by the index developed by
Chart 1.8 Japan’s Manufacturing PMI
and Exports of Goods
Source: Haver Analytics
Chart 1.9
Japan’s Nominal Wage Growth and Job Opening-to-Applicant Ratio
Source: Haver Analytics and EPG, MAS estimates
Chart 1.10
Global Manufacturing PMI and OECD Leading Indicator
Source: Haver Analytics and JPMorgan
4
5
6
7
8
40
45
50
55
60
2012 2013 2014 2015 2016 2017
¥ Tr
illio
n, S
A
Inde
x, >
50=E
xpan
sion
Exports of Goods (RHS)
Manufacturing PMI
Apr
2006 2008 2010 2012 2014 20160.00
0.25
0.50
0.75
1.00
1.25
1.50
-2.0
-1.5
-1.0
-0.5
0.0
0.5
1.0
Ratio
, SA
% Y
OY
Job Opening-to-Applicant Ratio (RHS)
Increase in Base Pay
Q4
99.6
99.8
100.0
100.2
100.4
100.6
49
50
51
52
53
54
2014 Jul 2015 Jul 2016 Jul 2017
Inde
x (A
mpl
itude
Adj
uste
d), S
A
Inde
x, >
50=E
xpan
sion
Global Manufacturing
PMI
Mar
OECD Leading Indicator (RHS)
8 Macroeconomic Review, April 2017
Monetary Authority of Singapore Economic Policy Group
Baker et al. (2016).3 (Chart 1.11) Historically, episodes of positive co-movements between business confidence and policy uncertainty are rare. For instance, Rodrik (1989)4 argued that economic policy uncertainty would reasonably be expected to dent private investment, since physical investment is essentially irreversible, and firms would typically withhold long-term spending commitments until residual uncertainty is eliminated. Hence, households and firms’ more sanguine expectations can only be maintained if some of the prevailing uncertainties and risk factors dissipate. Notable among these are the lack of clarity associated with the Brexit process, the outcomes of major elections in Europe, and US policies on trade, taxes and immigration. The ability of the US administration to enact the pro-growth fiscal stimulus that is anticipated by investors will also be critical in determining whether investment spending continues to pick up in H2 2017. Therefore, the sustainability of the global expansion is by no means assured.
Chart 1.11 Global Economic Policy Uncertainty and
OECD Business Confidence
Source: Global Economic Policy Uncertainty Index and Haver Analytics
3 The Global Economic Policy Uncertainty Index was featured in the October 2016 issue of the Review. See also Baker, S R,
Bloom, N and Davis, S J, (2016), “An Index of Global Economic Policy Uncertainty”, www.policyuncertainty.com. 4 Rodrik, D (1989), “Policy Uncertainty and Private Investment in Developing Countries”, NBER Working Paper No. 2999.
50
100
150
200
250
300
350
96
97
98
99
100
101
102
2008 2010 2012 2014 2016
Inde
x (3
MM
A)
Inde
x
2017 Mar
OECD Business Confidence
Global Economic Policy Uncertainty
Index (RHS)
The International Economy 9
Monetary Authority of Singapore Economic Policy Group
1.2 Asia
A Trade Recovery Is Underway
Growth in Asia ex-Japan surprised slightly on the upside in 2016, as a year-end boost to production and trade lifted GDP in the export-oriented economies. Specifically, restocking dynamics in the global electronics industry, coupled with rising demand for mid-range smartphones in China, benefited the Asian economies which are plugged into regional supply chains. While prospects for a longer-term trade revival remain muted, a cyclical upswing in external demand can serve as an additional growth driver for the region in the near term, helping to buttress still-resilient domestic demand. The recovery in corporate profits could also help to galvanise investment in the region. Hence, despite uncertainties in the global economy, the Asia ex-Japan region is projected to expand by a stronger 4.8% in 2017 and 4.7% in 2018.
China’s underlying growth is gradually firming.
In China, the cumulative effects of policy stimulus throughout last year lifted GDP growth to 6.8% y-o-y in Q4, which was higher than the average pace for the preceding three quarters, bringing full-year growth to 6.7%. The year-end pick up is attributable to faster growth in gross capital formation, which offset a slowdown in both public and private consumption. (Chart 1.12) At the same time, net exports subtracted from headline growth for the sixth consecutive quarter. Policy support to the Chinese economy in 2016 took several forms and included a rapid expansion in household credit as well as a relaxation of some property cooling measures, which contributed to a boom in property transactions. This real estate upturn, together with strong growth in infrastructure investment, generated positive spillovers to the construction and heavy materials industries. A cut in the car purchase tax also spurred auto sales towards end-2016. In addition, the state sector played a key role in boosting China’s investment demand, amid sluggish capex by the private sector. In Q4 2016, the state sector’s fixed asset investment (FAI) surged by 18.7% y-o-y year-to-date (YTD), while private FAI rose by a comparatively smaller 3.2%. Accordingly, private firms’ share of services sector FAI for the whole of 2016 fell by 4.2% points to 48.5%, while their share of manufacturing FAI declined by a smaller 0.5% point to 87.2%. In Q1 2017, headline GDP growth accelerated to 6.9% y-o-y, amid a recovery in fixed investments and net exports. Notably, private investment growth rose further to 7.7% y-o-y on the back of robust orders and
Chart 1.12 Contribution to China’s GDP Growth
Source: CEIC and EPG, MAS estimates
2009 2010 2011 2012 2013 2014 2015 2016 2017-5
0
5
10
15
% P
oint
Con
trib
utio
n to
YO
Y G
row
th (Y
TD)
Net ExportsGross Capital FormationPublic & Private ConsumptionGDP
Q1
10 Macroeconomic Review, April 2017
Monetary Authority of Singapore Economic Policy Group
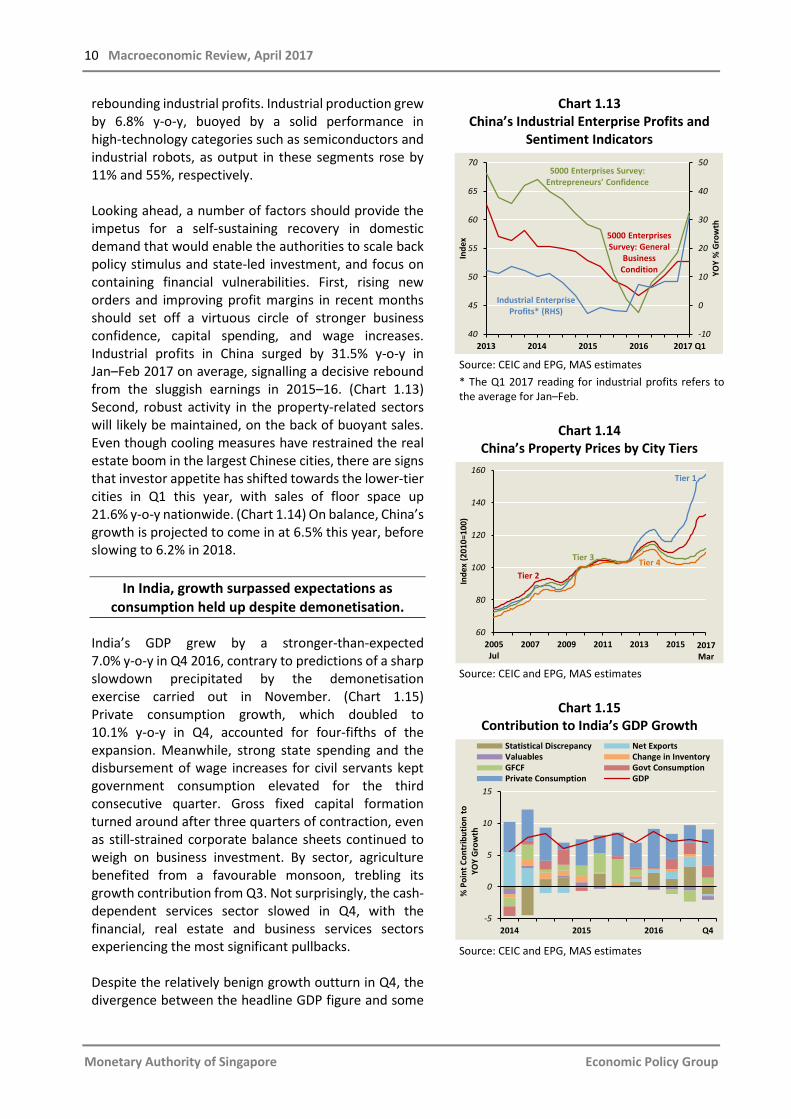
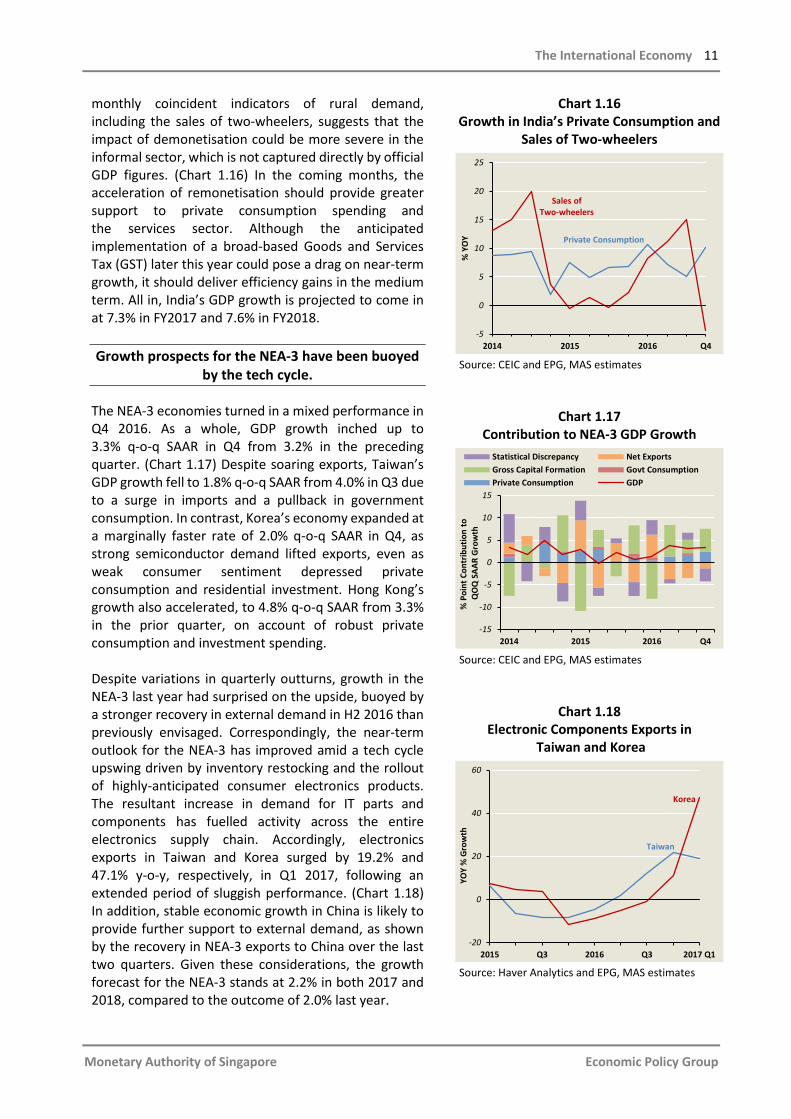
rebounding industrial profits. Industrial production grew by 6.8% y-o-y, buoyed by a solid performance in high-technology categories such as semiconductors and industrial robots, as output in these segments rose by 11% and 55%, respectively. Looking ahead, a number of factors should provide the impetus for a self-sustaining recovery in domestic demand that would enable the authorities to scale back policy stimulus and state-led investment, and focus on containing financial vulnerabilities. First, rising new orders and improving profit margins in recent months should set off a virtuous circle of stronger business confidence, capital spending, and wage increases. Industrial profits in China surged by 31.5% y-o-y in Jan–Feb 2017 on average, signalling a decisive rebound from the sluggish earnings in 2015–16. (Chart 1.13) Second, robust activity in the property-related sectors will likely be maintained, on the back of buoyant sales. Even though cooling measures have restrained the real estate boom in the largest Chinese cities, there are signs that investor appetite has shifted towards the lower-tier cities in Q1 this year, with sales of floor space up 21.6% y-o-y nationwide. (Chart 1.14) On balance, China’s growth is projected to come in at 6.5% this year, before slowing to 6.2% in 2018.
In India, growth surpassed expectations as consumption held up despite demonetisation.
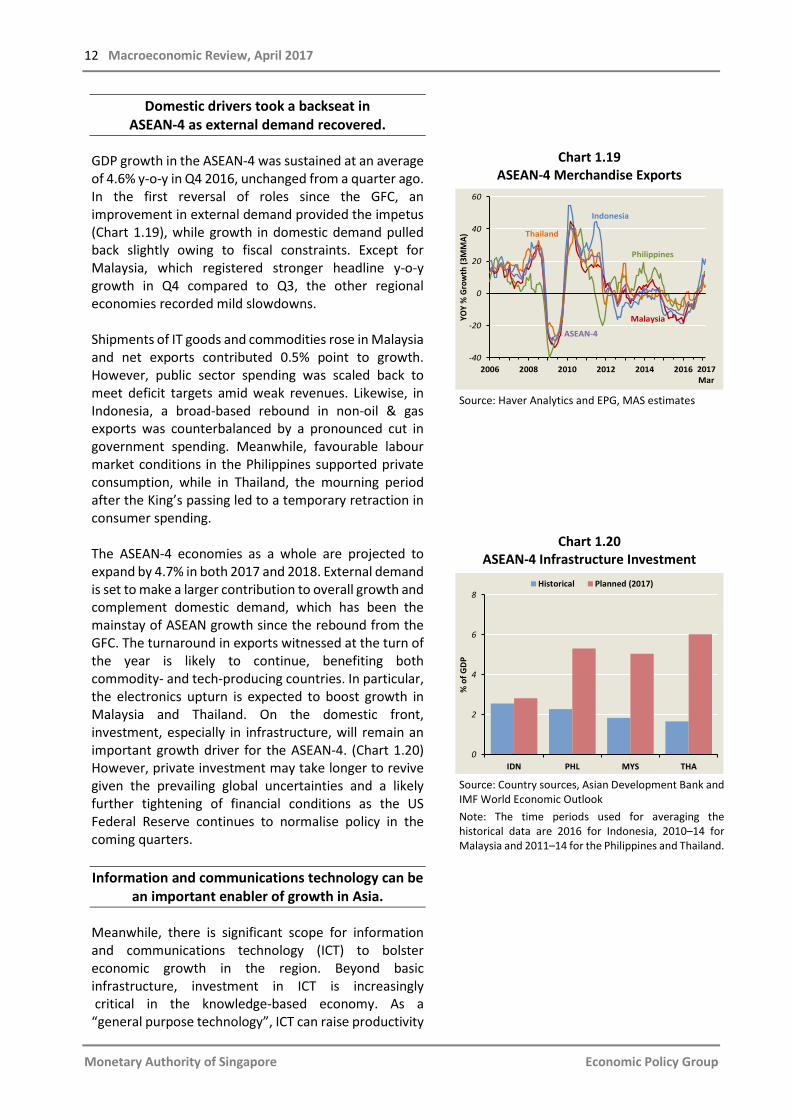
India’s GDP grew by a stronger-than-expected 7.0% y-o-y in Q4 2016, contrary to predictions of a sharp slowdown precipitated by the demonetisation exercise carried out in November. (Chart 1.15) Private consumption growth, which doubled to 10.1% y-o-y in Q4, accounted for four-fifths of the expansion. Meanwhile, strong state spending and the disbursement of wage increases for civil servants kept government consumption elevated for the third consecutive quarter. Gross fixed capital formation turned around after three quarters of contraction, even as still-strained corporate balance sheets continued to weigh on business investment. By sector, agriculture benefited from a favourable monsoon, trebling its growth contribution from Q3. Not surprisingly, the cash-dependent services sector slowed in Q4, with the financial, real estate and business services sectors experiencing the most significant pullbacks. Despite the relatively benign growth outturn in Q4, the divergence between the headline GDP figure and some
Chart 1.13 China’s Industrial Enterprise Profits and
Sentiment Indicators
Source: CEIC and EPG, MAS estimates * The Q1 2017 reading for industrial profits refers to the average for Jan–Feb.
Chart 1.14
China’s Property Prices by City Tiers
Source: CEIC and EPG, MAS estimates
Chart 1.15
Contribution to India’s GDP Growth
Source: CEIC and EPG, MAS estimates
-10
0
10
20
30
40
50
40
45
50
55
60
65
70
2013 2014 2015 2016 2017 Q1
YOY
% G
row
th
Inde
x 5000 Enterprises Survey: General
Business Condition
5000 Enterprises Survey:Entrepreneurs' Confidence
Industrial Enterprise Profits* (RHS)
60
80
100
120
140
160
2005Jul
2007 2009 2011 2013 2015
Inde
x (2
010=
100)
2017Mar
Tier 1
Tier 2
Tier 3 Tier 4
2014 2015 2016 Q4-5
0
5
10
15
% P
oint
Con
trib
utio
n to
YO
Y G
row
th
Statistical Discrepancy Net ExportsValuables Change in InventoryGFCF Govt ConsumptionPrivate Consumption GDP
The International Economy 11
Monetary Authority of Singapore Economic Policy Group
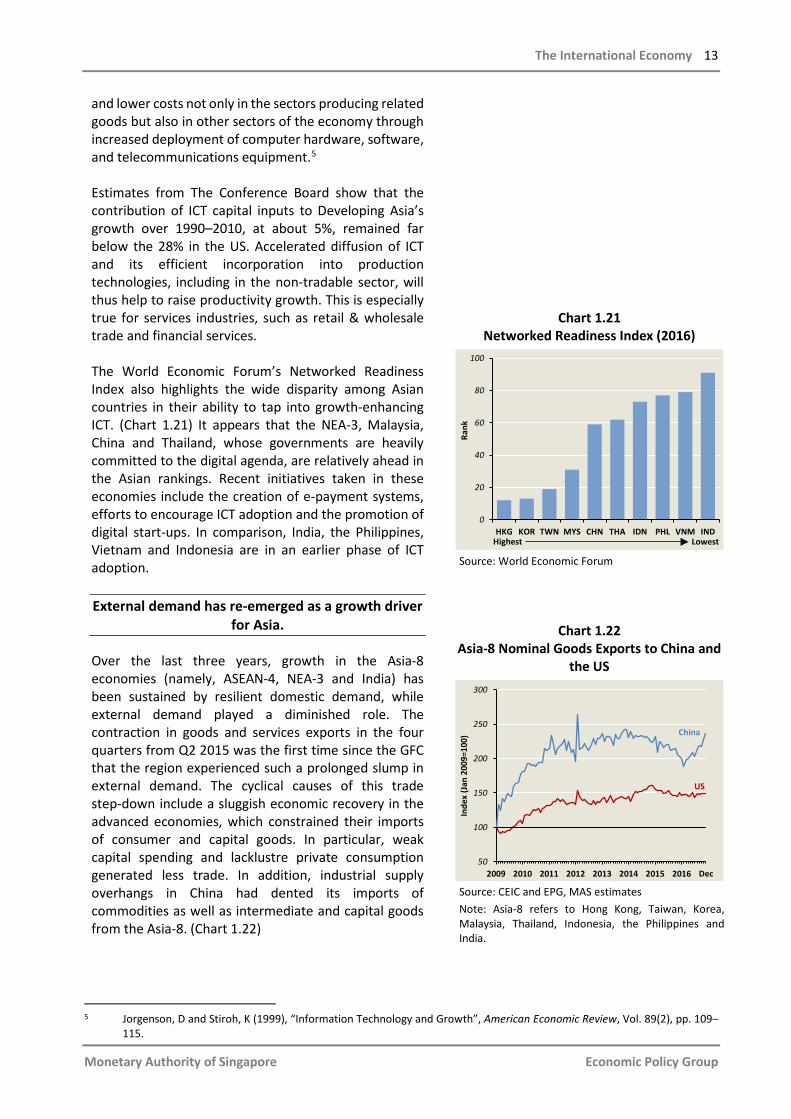
monthly coincident indicators of rural demand, including the sales of two-wheelers, suggests that the impact of demonetisation could be more severe in the informal sector, which is not captured directly by official GDP figures. (Chart 1.16) In the coming months, the acceleration of remonetisation should provide greater support to private consumption spending and the services sector. Although the anticipated implementation of a broad-based Goods and Services Tax (GST) later this year could pose a drag on near-term growth, it should deliver efficiency gains in the medium term. All in, India’s GDP growth is projected to come in at 7.3% in FY2017 and 7.6% in FY2018. Growth prospects for the NEA-3 have been buoyed
by the tech cycle.
The NEA-3 economies turned in a mixed performance in Q4 2016. As a whole, GDP growth inched up to 3.3% q-o-q SAAR in Q4 from 3.2% in the preceding quarter. (Chart 1.17) Despite soaring exports, Taiwan’s GDP growth fell to 1.8% q-o-q SAAR from 4.0% in Q3 due to a surge in imports and a pullback in government consumption. In contrast, Korea’s economy expanded at a marginally faster rate of 2.0% q-o-q SAAR in Q4, as strong semiconductor demand lifted exports, even as weak consumer sentiment depressed private consumption and residential investment. Hong Kong’s growth also accelerated, to 4.8% q-o-q SAAR from 3.3% in the prior quarter, on account of robust private consumption and investment spending. Despite variations in quarterly outturns, growth in the NEA-3 last year had surprised on the upside, buoyed by a stronger recovery in external demand in H2 2016 than previously envisaged. Correspondingly, the near-term outlook for the NEA-3 has improved amid a tech cycle upswing driven by inventory restocking and the rollout of highly-anticipated consumer electronics products. The resultant increase in demand for IT parts and components has fuelled activity across the entire electronics supply chain. Accordingly, electronics exports in Taiwan and Korea surged by 19.2% and 47.1% y-o-y, respectively, in Q1 2017, following an extended period of sluggish performance. (Chart 1.18) In addition, stable economic growth in China is likely to provide further support to external demand, as shown by the recovery in NEA-3 exports to China over the last two quarters. Given these considerations, the growth forecast for the NEA-3 stands at 2.2% in both 2017 and 2018, compared to the outcome of 2.0% last year.
Chart 1.16 Growth in India’s Private Consumption and
Sales of Two-wheelers
Source: CEIC and EPG, MAS estimates
Chart 1.17 Contribution to NEA-3 GDP Growth
Source: CEIC and EPG, MAS estimates
Chart 1.18 Electronic Components Exports in
Taiwan and Korea
Source: Haver Analytics and EPG, MAS estimates
-5
0
5
10
15
20
25
2014 2015 2016 Q4
% Y
OY Private Consumption
Sales of Two-wheelers
-15
-10
-5
0
5
10
15
2014 2015 2016 Q4
% P
oint
Con
trib
utio
n to
QO
Q S
AAR
Gro
wth
Statistical Discrepancy Net ExportsGross Capital Formation Govt ConsumptionPrivate Consumption GDP
-20
0
20
40
60
2015 Q3 2016 Q3 2017 Q1
YOY
% G
row
th
Taiwan
Korea
12 Macroeconomic Review, April 2017
Monetary Authority of Singapore Economic Policy Group
Domestic drivers took a backseat in ASEAN-4 as external demand recovered.
GDP growth in the ASEAN-4 was sustained at an average of 4.6% y-o-y in Q4 2016, unchanged from a quarter ago. In the first reversal of roles since the GFC, an improvement in external demand provided the impetus (Chart 1.19), while growth in domestic demand pulled back slightly owing to fiscal constraints. Except for Malaysia, which registered stronger headline y-o-y growth in Q4 compared to Q3, the other regional economies recorded mild slowdowns. Shipments of IT goods and commodities rose in Malaysia and net exports contributed 0.5% point to growth. However, public sector spending was scaled back to meet deficit targets amid weak revenues. Likewise, in Indonesia, a broad-based rebound in non-oil & gas exports was counterbalanced by a pronounced cut in government spending. Meanwhile, favourable labour market conditions in the Philippines supported private consumption, while in Thailand, the mourning period after the King’s passing led to a temporary retraction in consumer spending. The ASEAN-4 economies as a whole are projected to expand by 4.7% in both 2017 and 2018. External demand is set to make a larger contribution to overall growth and complement domestic demand, which has been the mainstay of ASEAN growth since the rebound from the GFC. The turnaround in exports witnessed at the turn of the year is likely to continue, benefiting both commodity- and tech-producing countries. In particular, the electronics upturn is expected to boost growth in Malaysia and Thailand. On the domestic front, investment, especially in infrastructure, will remain an important growth driver for the ASEAN-4. (Chart 1.20) However, private investment may take longer to revive given the prevailing global uncertainties and a likely further tightening of financial conditions as the US Federal Reserve continues to normalise policy in the coming quarters. Information and communications technology can be
an important enabler of growth in Asia.
Meanwhile, there is significant scope for information and communications technology (ICT) to bolster economic growth in the region. Beyond basic infrastructure, investment in ICT is increasingly critical in the knowledge-based economy. As a “general purpose technology”, ICT can raise productivity
Chart 1.19 ASEAN-4 Merchandise Exports
Source: Haver Analytics and EPG, MAS estimates
Chart 1.20 ASEAN-4 Infrastructure Investment
Source: Country sources, Asian Development Bank and IMF World Economic Outlook Note: The time periods used for averaging the historical data are 2016 for Indonesia, 2010–14 for Malaysia and 2011–14 for the Philippines and Thailand.
-40
-20
0
20
40
60
2006 2008 2010 2012 2014 2016
YOY
% G
row
th (3
MM
A)
Indonesia
Malaysia
Philippines
Thailand
ASEAN-4
2017Mar
0
2
4
6
8
IDN PHL MYS THA
% o
f GD
P
Historical Planned (2017)
The International Economy 13
Monetary Authority of Singapore Economic Policy Group
and lower costs not only in the sectors producing related goods but also in other sectors of the economy through increased deployment of computer hardware, software, and telecommunications equipment.5 Estimates from The Conference Board show that the contribution of ICT capital inputs to Developing Asia’s growth over 1990–2010, at about 5%, remained far below the 28% in the US. Accelerated diffusion of ICT and its efficient incorporation into production technologies, including in the non-tradable sector, will thus help to raise productivity growth. This is especially true for services industries, such as retail & wholesale trade and financial services. The World Economic Forum’s Networked Readiness Index also highlights the wide disparity among Asian countries in their ability to tap into growth-enhancing ICT. (Chart 1.21) It appears that the NEA-3, Malaysia, China and Thailand, whose governments are heavily committed to the digital agenda, are relatively ahead in the Asian rankings. Recent initiatives taken in these economies include the creation of e-payment systems, efforts to encourage ICT adoption and the promotion of digital start-ups. In comparison, India, the Philippines, Vietnam and Indonesia are in an earlier phase of ICT adoption. External demand has re-emerged as a growth driver
for Asia.
Over the last three years, growth in the Asia-8 economies (namely, ASEAN-4, NEA-3 and India) has been sustained by resilient domestic demand, while external demand played a diminished role. The contraction in goods and services exports in the four quarters from Q2 2015 was the first time since the GFC that the region experienced such a prolonged slump in external demand. The cyclical causes of this trade step-down include a sluggish economic recovery in the advanced economies, which constrained their imports of consumer and capital goods. In particular, weak capital spending and lacklustre private consumption generated less trade. In addition, industrial supply overhangs in China had dented its imports of commodities as well as intermediate and capital goods from the Asia-8. (Chart 1.22)
Chart 1.21 Networked Readiness Index (2016)
Source: World Economic Forum
Chart 1.22 Asia-8 Nominal Goods Exports to China and
the US
Source: CEIC and EPG, MAS estimates Note: Asia-8 refers to Hong Kong, Taiwan, Korea, Malaysia, Thailand, Indonesia, the Philippines and India.
5 Jorgenson, D and Stiroh, K (1999), “Information Technology and Growth”, American Economic Review, Vol. 89(2), pp. 109–
115.
0
20
40
60
80
100
HKG KOR TWN MYS CHN THA IDN PHL VNM IND
Rank
Highest Lowest
50
100
150
200
250
300
2009 2010 2011 2012 2013 2014 2015 2016
Inde
x (J
an 2
009=
100)
China
US
Dec
14 Macroeconomic Review, April 2017
Monetary Authority of Singapore Economic Policy Group
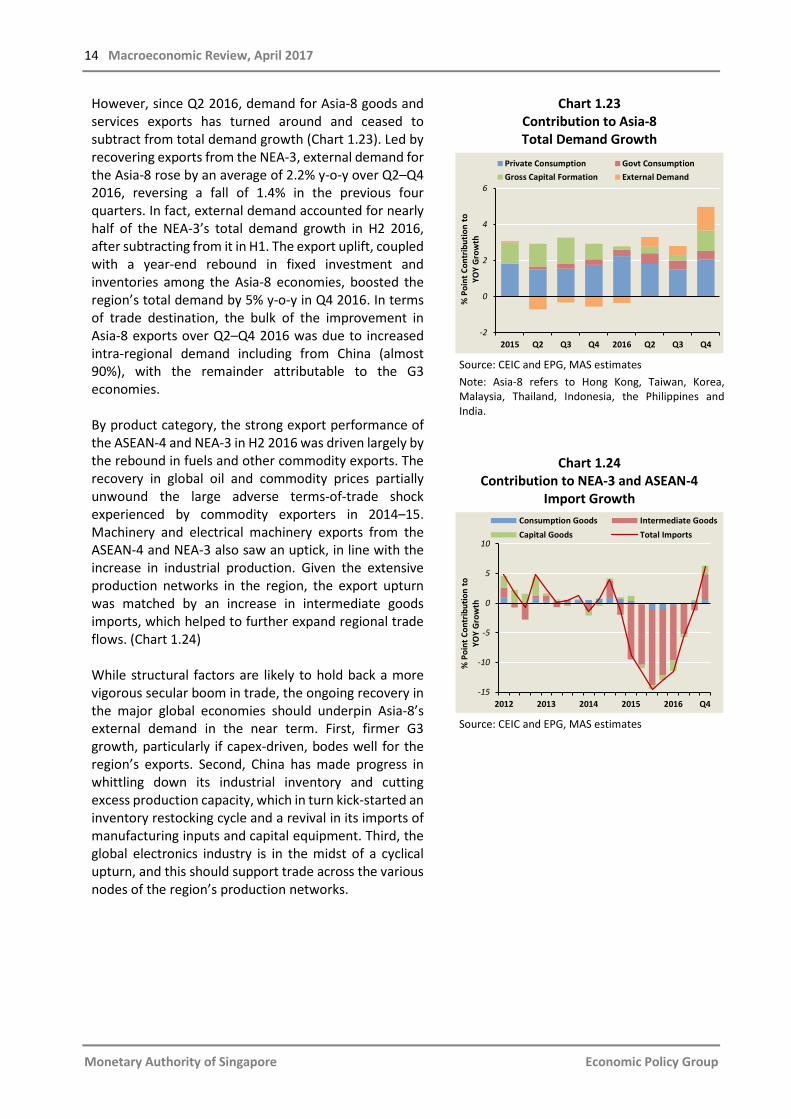
However, since Q2 2016, demand for Asia-8 goods and services exports has turned around and ceased to subtract from total demand growth (Chart 1.23). Led by recovering exports from the NEA-3, external demand for the Asia-8 rose by an average of 2.2% y-o-y over Q2–Q4 2016, reversing a fall of 1.4% in the previous four quarters. In fact, external demand accounted for nearly half of the NEA-3’s total demand growth in H2 2016, after subtracting from it in H1. The export uplift, coupled with a year-end rebound in fixed investment and inventories among the Asia-8 economies, boosted the region’s total demand by 5% y-o-y in Q4 2016. In terms of trade destination, the bulk of the improvement in Asia-8 exports over Q2–Q4 2016 was due to increased intra-regional demand including from China (almost 90%), with the remainder attributable to the G3 economies. By product category, the strong export performance of the ASEAN-4 and NEA-3 in H2 2016 was driven largely by the rebound in fuels and other commodity exports. The recovery in global oil and commodity prices partially unwound the large adverse terms-of-trade shock experienced by commodity exporters in 2014–15. Machinery and electrical machinery exports from the ASEAN-4 and NEA-3 also saw an uptick, in line with the increase in industrial production. Given the extensive production networks in the region, the export upturn was matched by an increase in intermediate goods imports, which helped to further expand regional trade flows. (Chart 1.24) While structural factors are likely to hold back a more vigorous secular boom in trade, the ongoing recovery in the major global economies should underpin Asia-8’s external demand in the near term. First, firmer G3 growth, particularly if capex-driven, bodes well for the region’s exports. Second, China has made progress in whittling down its industrial inventory and cutting excess production capacity, which in turn kick-started an inventory restocking cycle and a revival in its imports of manufacturing inputs and capital equipment. Third, the global electronics industry is in the midst of a cyclical upturn, and this should support trade across the various nodes of the region’s production networks.
Chart 1.23 Contribution to Asia-8 Total Demand Growth
Source: CEIC and EPG, MAS estimates Note: Asia-8 refers to Hong Kong, Taiwan, Korea, Malaysia, Thailand, Indonesia, the Philippines and India.
Chart 1.24 Contribution to NEA-3 and ASEAN-4
Import Growth
Source: CEIC and EPG, MAS estimates
-2
0
2
4
6
2015 Q2 Q3 Q4 2016 Q2 Q3 Q4
% P
oint
Con
trib
utio
n to
YO
Y G
row
th
Private Consumption Govt ConsumptionGross Capital Formation External Demand
-15
-10
-5
0
5
10
2012 2013 2014 2015 2016 Q4
% P
oint
Con
trib
utio
n to
YO
Y G
row
th
Consumption Goods Intermediate GoodsCapital Goods Total Imports
The International Economy 15
Monetary Authority of Singapore Economic Policy Group
1.3 Global Inflation
Commodity Reflation Lifts Consumer Prices
Global headline inflation has been on an upward trajectory, as the prices of food, energy and metals recovered from their troughs in early 2016. (Chart 1.25) The rise in CPI inflation was more apparent in the G3 economies, where inflation rates picked up discernibly in Q4 2016. In Asia ex-Japan, idiosyncratic factors, such as favourable monsoons, capped food cost increases, limiting the rise in headline inflation even as broader producer prices surged. Looking ahead, global CPI inflation is expected to climb to 2.3% in 2017 from 1.3% last year, owing mainly to base effects from the oil price increase. Nevertheless, it will remain anchored by stable inflation expectations and continuing slack in the global economy.
G3 inflation rose mainly on account of higher global oil prices.
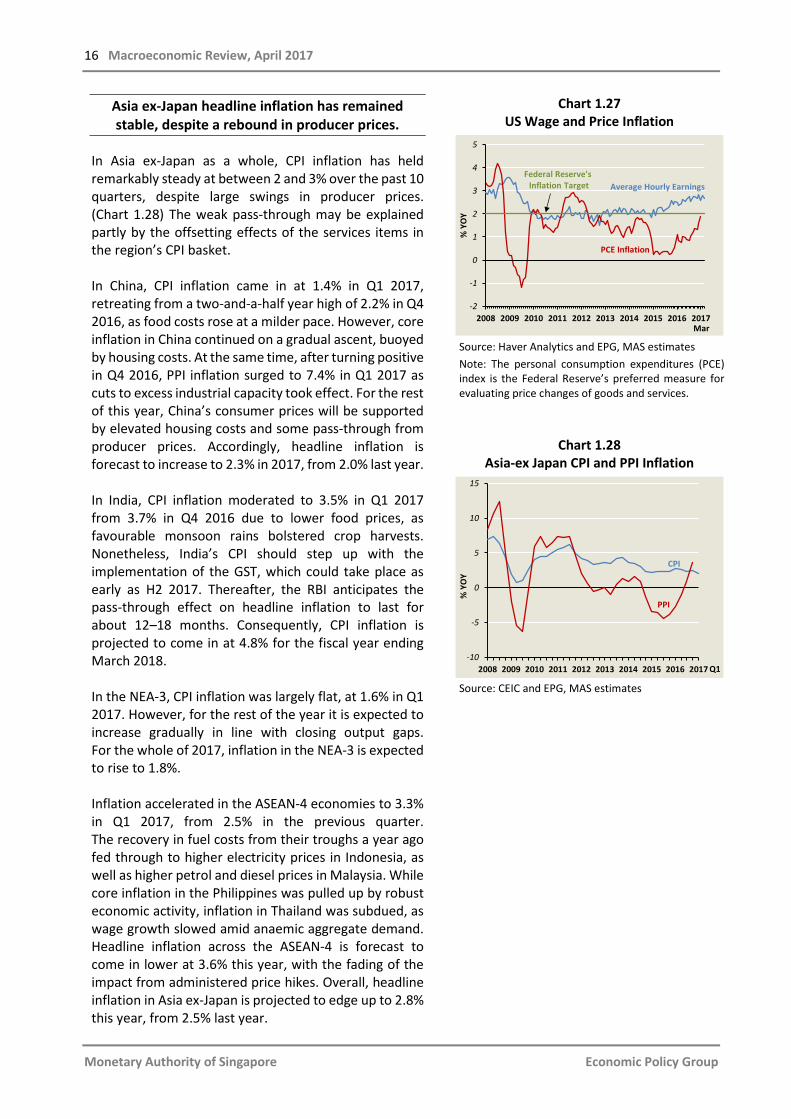
In the G3 economies, CPI inflation has risen steadily from being flat in 2015 to 2% in Jan–Feb 2017, primarily due to an uptick in energy prices, as global crude oil prices were around 60% higher than a year ago. (Chart 1.26) In contrast, core inflation has edged up at a milder pace, due to lingering industrial slack in the Eurozone and Japan. On average, G3 inflation is projected to rise to 1.9% in 2017, from 0.7% last year. In the US, headline CPI inflation surged to 2.5% y-o-y in Q1 2017 from 1.8% in Q4 2016, reflecting the turnaround in energy prices. Core CPI inflation, however, remained broadly stable at 2.2%. Nonetheless, as labour market conditions continue to tighten in 2017, higher wage inflation is expected to impart a stronger impetus to underlying price pressures. (Chart 1.27) In the Eurozone, headline CPI inflation picked up to 1.8% y-o-y in Q1 2017 from 0.7% in Q4 2016, and is projected to rise further this year, due mainly to increases in energy and, to a lesser extent, food prices. Meanwhile, core inflation remained unchanged at 0.8% in Q1 2017. In the medium term, core inflation is expected to rise gradually as the economic recovery gathers pace. In Japan, headline inflation rose to 0.3% y-o-y in Q4 2016, from −0.5% in Q3, largely due to a weather-related spike in fresh food prices. In Jan–Feb this year, core inflation declined to 0.0% y-o-y, but the inflation rate excluding fresh food ticked up to 0.2% y-o-y, the first positive reading since Q4 2015. Nonetheless, the BOJ’s policy to control the yield curve could exert further downward pressure on the yen, in turn pushing up core inflation.
Chart 1.25 World Food, Energy and Metals Prices
Source: IMF, UN Food and Agriculture Organisation and EPG, MAS estimates
Chart 1.26
G3 CPI Inflation
Source: CEIC and EPG, MAS estimates
0
20
40
60
80
100
120
2013 Q3 2014 Q3 2015 Q3 2016 Q3 2017 Q1
Inde
x (Q
1 20
13=1
00)
Metals
Energy
Food
2008 2009 2010 2011 2012 2013 2014 2015 2016 2017-4
-2
0
2
4
6
% Y
OY G3
US
JapanEurozone
Q1
16 Macroeconomic Review, April 2017
Monetary Authority of Singapore Economic Policy Group
Asia ex-Japan headline inflation has remained stable, despite a rebound in producer prices.
In Asia ex-Japan as a whole, CPI inflation has held remarkably steady at between 2 and 3% over the past 10 quarters, despite large swings in producer prices. (Chart 1.28) The weak pass-through may be explained partly by the offsetting effects of the services items in the region’s CPI basket. In China, CPI inflation came in at 1.4% in Q1 2017, retreating from a two-and-a-half year high of 2.2% in Q4 2016, as food costs rose at a milder pace. However, core inflation in China continued on a gradual ascent, buoyed by housing costs. At the same time, after turning positive in Q4 2016, PPI inflation surged to 7.4% in Q1 2017 as cuts to excess industrial capacity took effect. For the rest of this year, China’s consumer prices will be supported by elevated housing costs and some pass-through from producer prices. Accordingly, headline inflation is forecast to increase to 2.3% in 2017, from 2.0% last year. In India, CPI inflation moderated to 3.5% in Q1 2017 from 3.7% in Q4 2016 due to lower food prices, as favourable monsoon rains bolstered crop harvests. Nonetheless, India’s CPI should step up with the implementation of the GST, which could take place as early as H2 2017. Thereafter, the RBI anticipates the pass-through effect on headline inflation to last for about 12–18 months. Consequently, CPI inflation is projected to come in at 4.8% for the fiscal year ending March 2018. In the NEA-3, CPI inflation was largely flat, at 1.6% in Q1 2017. However, for the rest of the year it is expected to increase gradually in line with closing output gaps. For the whole of 2017, inflation in the NEA-3 is expected to rise to 1.8%. Inflation accelerated in the ASEAN-4 economies to 3.3% in Q1 2017, from 2.5% in the previous quarter. The recovery in fuel costs from their troughs a year ago fed through to higher electricity prices in Indonesia, as well as higher petrol and diesel prices in Malaysia. While core inflation in the Philippines was pulled up by robust economic activity, inflation in Thailand was subdued, as wage growth slowed amid anaemic aggregate demand. Headline inflation across the ASEAN-4 is forecast to come in lower at 3.6% this year, with the fading of the impact from administered price hikes. Overall, headline inflation in Asia ex-Japan is projected to edge up to 2.8% this year, from 2.5% last year.
Chart 1.27 US Wage and Price Inflation
Source: Haver Analytics and EPG, MAS estimates Note: The personal consumption expenditures (PCE) index is the Federal Reserve’s preferred measure for evaluating price changes of goods and services.
Chart 1.28 Asia-ex Japan CPI and PPI Inflation
Source: CEIC and EPG, MAS estimates
-2
-1
0
1
2
3
4
5
2008 2009 2010 2011 2012 2013 2014 2015 2016 2017
% Y
OY
Average Hourly Earnings
PCE Inflation
Mar
Federal Reserve's Inflation Target
2008 2009 2010 2011 2012 2013 2014 2015 2016 2017-10
-5
0
5
10
15
% Y
OY
CPI
PPI
Q1

Chapter2TheSingaporeEconomy
18 Macroeconomic Review, April 2017
Monetary Authority of Singapore Economic Policy Group
2 The Singapore Economy
Cyclical Impulses And Structural Trends
Following relatively sluggish growth outturns in the first three quarters of 2016, domestic economic activity improved over the subsequent two quarters. Notwithstanding this pickup, there was some unevenness in the sectoral outcomes. While the trade-related sectors and modern services recorded a step-up, growth of the domestic-oriented cluster was relatively weaker, as it had to contend with a contraction in private construction and lacklustre consumer spending. Overall, the economy should expand by 1–3% in 2017, not markedly different from the 2% recorded in 2016. Growth this year will be anchored by the trade-related sectors, particularly the IT-associated segments. On the global front, new mobile phone product launches, together with increasing semiconductor intensity in electronics products, will provide support for the domestic electronics industry. However, while firm external demand will continue to benefit the semiconductor and precision engineering industries, recovery in the rest of the manufacturing sector would remain patchy, at least in the near term. Meanwhile, the underlying demographic and technological trends driving financial and ICT services, respectively, should continue to bolster the modern services cluster. In contrast, spending on discretionary retail items and other services is expected to be dampened by the subdued labour market. Apart from cyclical developments, the retail sector has had to adjust to structural factors, including the rise of e-commerce. Nevertheless, domestic retailers can tap on new and growing opportunities in the region through the digital channel.
The Singapore Economy 19
Monetary Authority of Singapore Economic Policy Group
2.1 Recent Economic Developments
An Uneven Growth Outcome
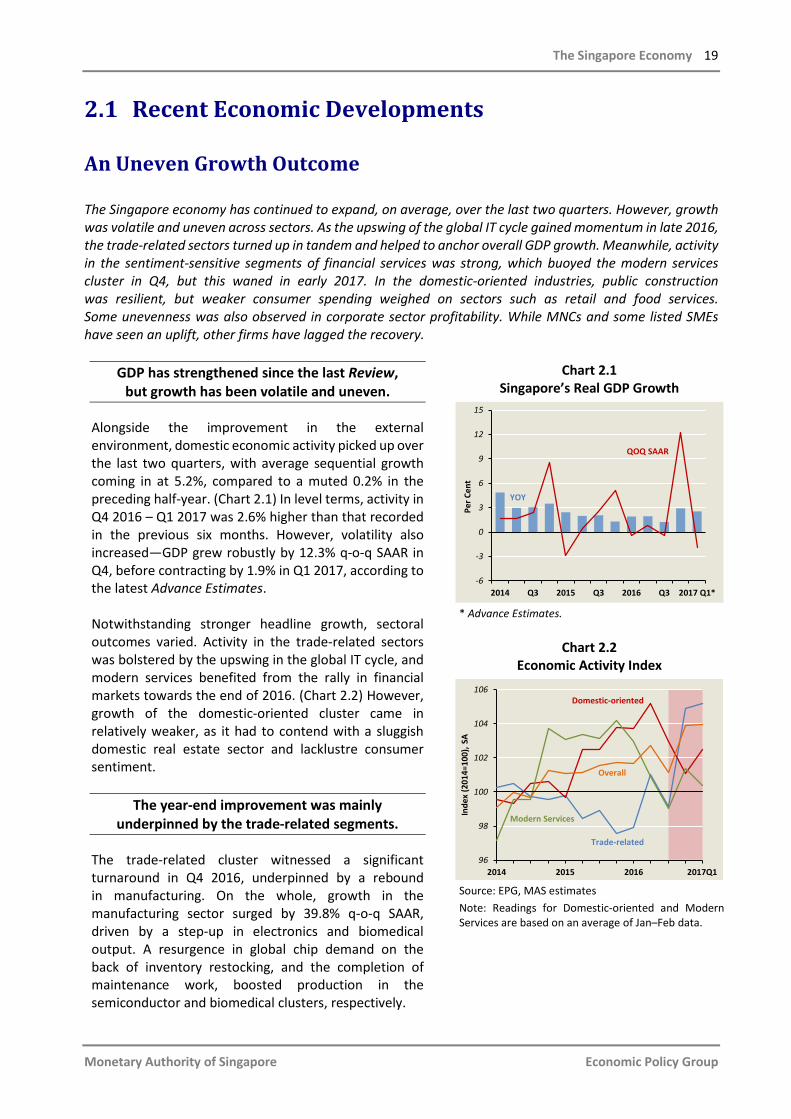
The Singapore economy has continued to expand, on average, over the last two quarters. However, growth was volatile and uneven across sectors. As the upswing of the global IT cycle gained momentum in late 2016, the trade-related sectors turned up in tandem and helped to anchor overall GDP growth. Meanwhile, activity in the sentiment-sensitive segments of financial services was strong, which buoyed the modern services cluster in Q4, but this waned in early 2017. In the domestic-oriented industries, public construction was resilient, but weaker consumer spending weighed on sectors such as retail and food services. Some unevenness was also observed in corporate sector profitability. While MNCs and some listed SMEs have seen an uplift, other firms have lagged the recovery.
GDP has strengthened since the last Review, but growth has been volatile and uneven.
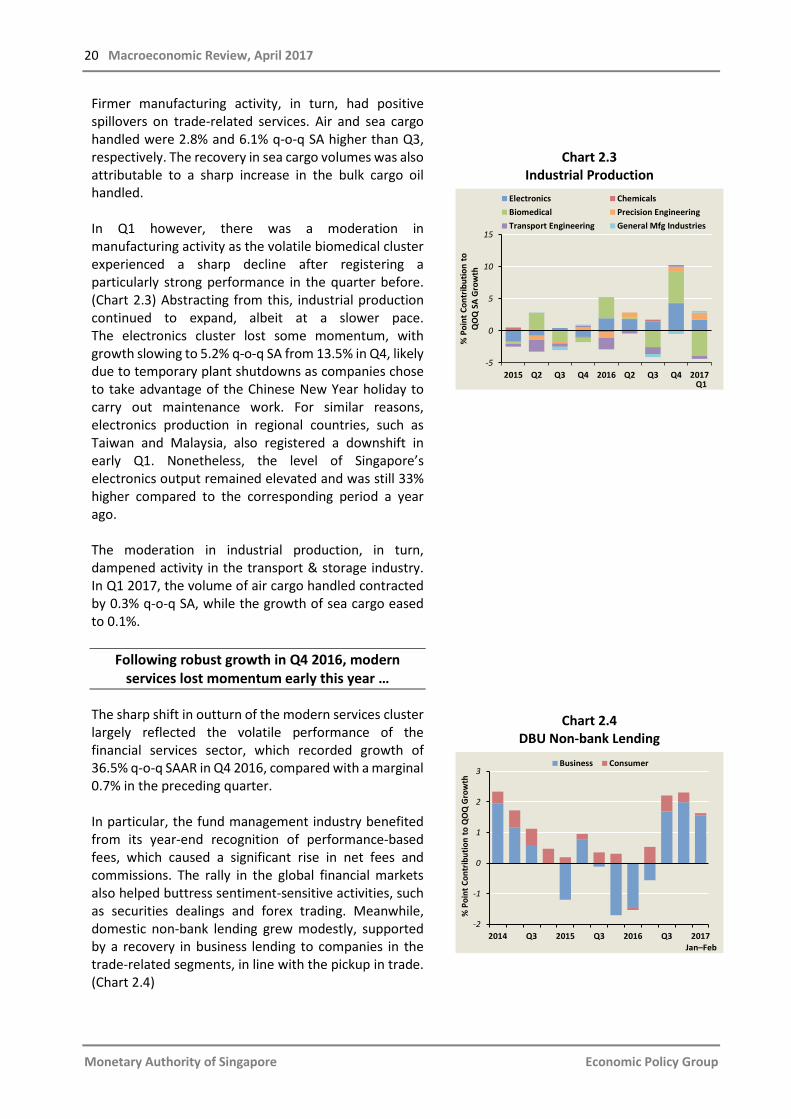
Alongside the improvement in the external environment, domestic economic activity picked up over the last two quarters, with average sequential growth coming in at 5.2%, compared to a muted 0.2% in the preceding half-year. (Chart 2.1) In level terms, activity in Q4 2016 – Q1 2017 was 2.6% higher than that recorded in the previous six months. However, volatility also increased—GDP grew robustly by 12.3% q-o-q SAAR in Q4, before contracting by 1.9% in Q1 2017, according to the latest Advance Estimates. Notwithstanding stronger headline growth, sectoral outcomes varied. Activity in the trade-related sectors was bolstered by the upswing in the global IT cycle, and modern services benefited from the rally in financial markets towards the end of 2016. (Chart 2.2) However, growth of the domestic-oriented cluster came in relatively weaker, as it had to contend with a sluggish domestic real estate sector and lacklustre consumer sentiment.
The year-end improvement was mainly underpinned by the trade-related segments.
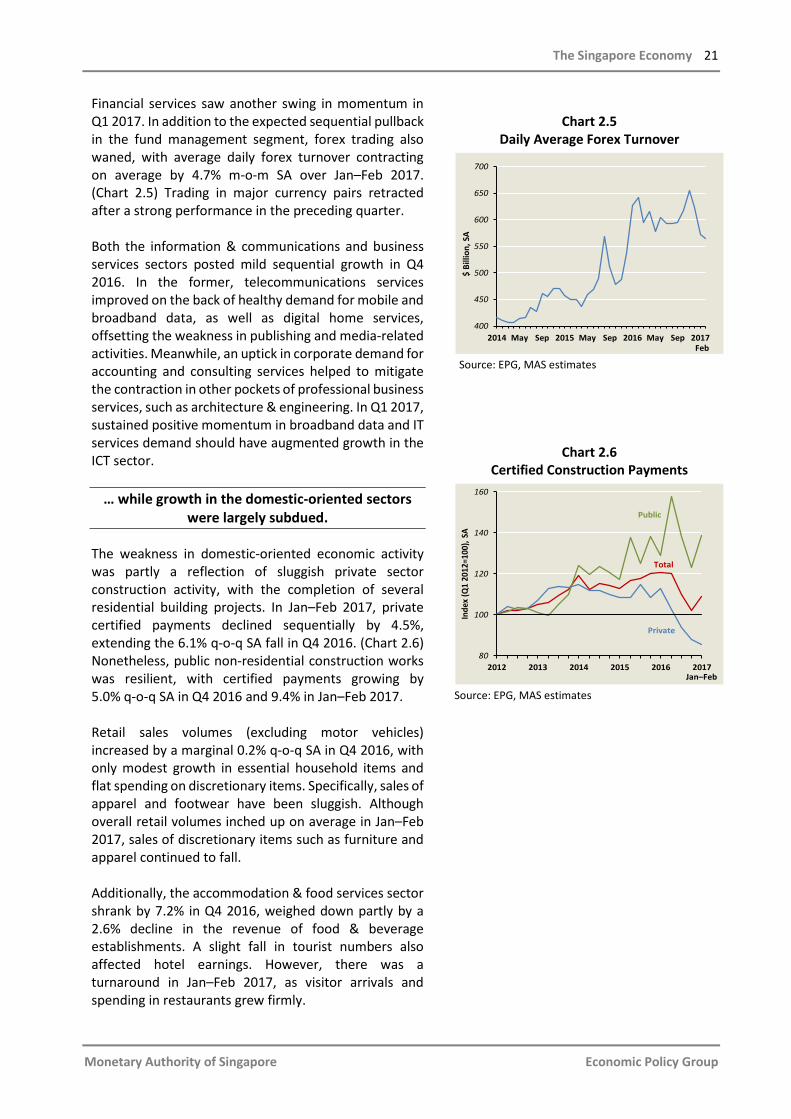
The trade-related cluster witnessed a significant turnaround in Q4 2016, underpinned by a rebound in manufacturing. On the whole, growth in the manufacturing sector surged by 39.8% q-o-q SAAR, driven by a step-up in electronics and biomedical output. A resurgence in global chip demand on the back of inventory restocking, and the completion of maintenance work, boosted production in the semiconductor and biomedical clusters, respectively.
Chart 2.1 Singapore’s Real GDP Growth
* Advance Estimates.
Chart 2.2
Economic Activity Index
Source: EPG, MAS estimates Note: Readings for Domestic-oriented and Modern Services are based on an average of Jan–Feb data.
2014 Q3 2015 Q3 2016 Q3 2017 Q1*-6
-3
0
3
6
9
12
15
Per C
ent
QOQ SAAR
YOY
96
98
100
102
104
106
2014 2015 2016 2017Q1
Inde
x (2
014=
100)
, SA
Modern Services
Trade-related
Domestic-oriented
Overall
20 Macroeconomic Review, April 2017
Monetary Authority of Singapore Economic Policy Group
Firmer manufacturing activity, in turn, had positive spillovers on trade-related services. Air and sea cargo handled were 2.8% and 6.1% q-o-q SA higher than Q3, respectively. The recovery in sea cargo volumes was also attributable to a sharp increase in the bulk cargo oil handled. In Q1 however, there was a moderation in manufacturing activity as the volatile biomedical cluster experienced a sharp decline after registering a particularly strong performance in the quarter before. (Chart 2.3) Abstracting from this, industrial production continued to expand, albeit at a slower pace. The electronics cluster lost some momentum, with growth slowing to 5.2% q-o-q SA from 13.5% in Q4, likely due to temporary plant shutdowns as companies chose to take advantage of the Chinese New Year holiday to carry out maintenance work. For similar reasons, electronics production in regional countries, such as Taiwan and Malaysia, also registered a downshift in early Q1. Nonetheless, the level of Singapore’s electronics output remained elevated and was still 33% higher compared to the corresponding period a year ago. The moderation in industrial production, in turn, dampened activity in the transport & storage industry. In Q1 2017, the volume of air cargo handled contracted by 0.3% q-o-q SA, while the growth of sea cargo eased to 0.1%.
Following robust growth in Q4 2016, modern services lost momentum early this year …
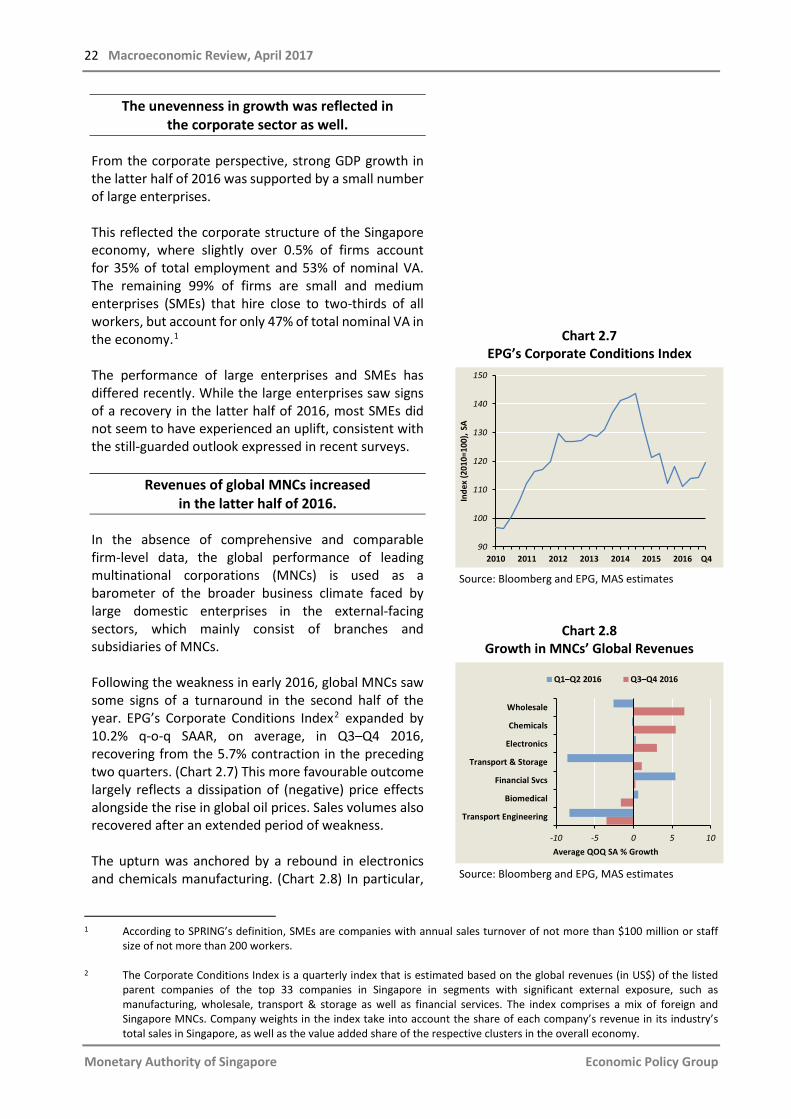
The sharp shift in outturn of the modern services cluster largely reflected the volatile performance of the financial services sector, which recorded growth of 36.5% q-o-q SAAR in Q4 2016, compared with a marginal 0.7% in the preceding quarter. In particular, the fund management industry benefited from its year-end recognition of performance-based fees, which caused a significant rise in net fees and commissions. The rally in the global financial markets also helped buttress sentiment-sensitive activities, such as securities dealings and forex trading. Meanwhile, domestic non-bank lending grew modestly, supported by a recovery in business lending to companies in the trade-related segments, in line with the pickup in trade. (Chart 2.4)
Chart 2.3 Industrial Production
Chart 2.4 DBU Non-bank Lending
2015 Q2 Q3 Q4 2016 Q2 Q3 Q4 2017-5
0
5
10
15
% P
oint
Con
trib
utio
n to
QO
Q S
A G
row
th
Electronics ChemicalsBiomedical Precision EngineeringTransport Engineering General Mfg Industries
Q1
2014 Q3 2015 Q3 2016 Q3 2017-2
-1
0
1
2
3
% P
oint
Con
trib
utio
n to
QO
Q G
row
th
Business Consumer
Jan–Feb
The Singapore Economy 21
Monetary Authority of Singapore Economic Policy Group
Financial services saw another swing in momentum in Q1 2017. In addition to the expected sequential pullback in the fund management segment, forex trading also waned, with average daily forex turnover contracting on average by 4.7% m-o-m SA over Jan–Feb 2017. (Chart 2.5) Trading in major currency pairs retracted after a strong performance in the preceding quarter. Both the information & communications and business services sectors posted mild sequential growth in Q4 2016. In the former, telecommunications services improved on the back of healthy demand for mobile and broadband data, as well as digital home services, offsetting the weakness in publishing and media-related activities. Meanwhile, an uptick in corporate demand for accounting and consulting services helped to mitigate the contraction in other pockets of professional business services, such as architecture & engineering. In Q1 2017, sustained positive momentum in broadband data and IT services demand should have augmented growth in the ICT sector.
… while growth in the domestic-oriented sectors were largely subdued.
The weakness in domestic-oriented economic activity was partly a reflection of sluggish private sector construction activity, with the completion of several residential building projects. In Jan–Feb 2017, private certified payments declined sequentially by 4.5%, extending the 6.1% q-o-q SA fall in Q4 2016. (Chart 2.6) Nonetheless, public non-residential construction works was resilient, with certified payments growing by 5.0% q-o-q SA in Q4 2016 and 9.4% in Jan–Feb 2017. Retail sales volumes (excluding motor vehicles) increased by a marginal 0.2% q-o-q SA in Q4 2016, with only modest growth in essential household items and flat spending on discretionary items. Specifically, sales of apparel and footwear have been sluggish. Although overall retail volumes inched up on average in Jan–Feb 2017, sales of discretionary items such as furniture and apparel continued to fall. Additionally, the accommodation & food services sector shrank by 7.2% in Q4 2016, weighed down partly by a 2.6% decline in the revenue of food & beverage establishments. A slight fall in tourist numbers also affected hotel earnings. However, there was a turnaround in Jan–Feb 2017, as visitor arrivals and spending in restaurants grew firmly.
Chart 2.5
Daily Average Forex Turnover
Source: EPG, MAS estimates
Chart 2.6 Certified Construction Payments
Source: EPG, MAS estimates
400
450
500
550
600
650
700
2014 May Sep 2015 May Sep 2016 May Sep 2017
$ Bi
llion
, SA
Feb
80
100
120
140
160
2012 2013 2014 2015 2016 2017
Inde
x (Q
1 20
12=1
00),
SA
Jan–Feb
Public
Private
Total
22 Macroeconomic Review, April 2017
Monetary Authority of Singapore Economic Policy Group
The unevenness in growth was reflected in the corporate sector as well.
From the corporate perspective, strong GDP growth in the latter half of 2016 was supported by a small number of large enterprises. This reflected the corporate structure of the Singapore economy, where slightly over 0.5% of firms account for 35% of total employment and 53% of nominal VA. The remaining 99% of firms are small and medium enterprises (SMEs) that hire close to two-thirds of all workers, but account for only 47% of total nominal VA in the economy.1 The performance of large enterprises and SMEs has differed recently. While the large enterprises saw signs of a recovery in the latter half of 2016, most SMEs did not seem to have experienced an uplift, consistent with the still-guarded outlook expressed in recent surveys.
Revenues of global MNCs increased in the latter half of 2016.
In the absence of comprehensive and comparable firm-level data, the global performance of leading multinational corporations (MNCs) is used as a barometer of the broader business climate faced by large domestic enterprises in the external-facing sectors, which mainly consist of branches and subsidiaries of MNCs. Following the weakness in early 2016, global MNCs saw some signs of a turnaround in the second half of the year. EPG’s Corporate Conditions Index2 expanded by 10.2% q-o-q SAAR, on average, in Q3–Q4 2016, recovering from the 5.7% contraction in the preceding two quarters. (Chart 2.7) This more favourable outcome largely reflects a dissipation of (negative) price effects alongside the rise in global oil prices. Sales volumes also recovered after an extended period of weakness. The upturn was anchored by a rebound in electronics and chemicals manufacturing. (Chart 2.8) In particular,
Chart 2.7 EPG’s Corporate Conditions Index
Source: Bloomberg and EPG, MAS estimates
Chart 2.8 Growth in MNCs’ Global Revenues
Source: Bloomberg and EPG, MAS estimates
1 According to SPRING’s definition, SMEs are companies with annual sales turnover of not more than $100 million or staff
size of not more than 200 workers. 2 The Corporate Conditions Index is a quarterly index that is estimated based on the global revenues (in US$) of the listed
parent companies of the top 33 companies in Singapore in segments with significant external exposure, such as manufacturing, wholesale, transport & storage as well as financial services. The index comprises a mix of foreign and Singapore MNCs. Company weights in the index take into account the share of each company’s revenue in its industry’s total sales in Singapore, as well as the value added share of the respective clusters in the overall economy.
2010 2011 2012 2013 2014 2015 201690
100
110
120
130
140
150
Inde
x (2
010=
100)
, SA
Q4
Wholesale
Chemicals
Electronics
Transport & Storage
Financial Svcs
Biomedical
Transport Engineering
-10 -5 0 5 10Average QOQ SA % Growth
Q1–Q2 2016 Q3–Q4 2016
The Singapore Economy 23
Monetary Authority of Singapore Economic Policy Group
worldwide semiconductor revenues grew robustly on the back of healthier end demand for consumer electronics and inventory restocking among suppliers. In addition to higher oil prices, integrated oil majors, such as Shell and BP, also benefited from stronger demand for petrochemicals used in the manufacture of products such as consumer plastics. The subsequent improvement in trade also gave a modest boost to wholesale and transport & storage activities towards the end of the year. However, local SMEs remained relatively cautious …
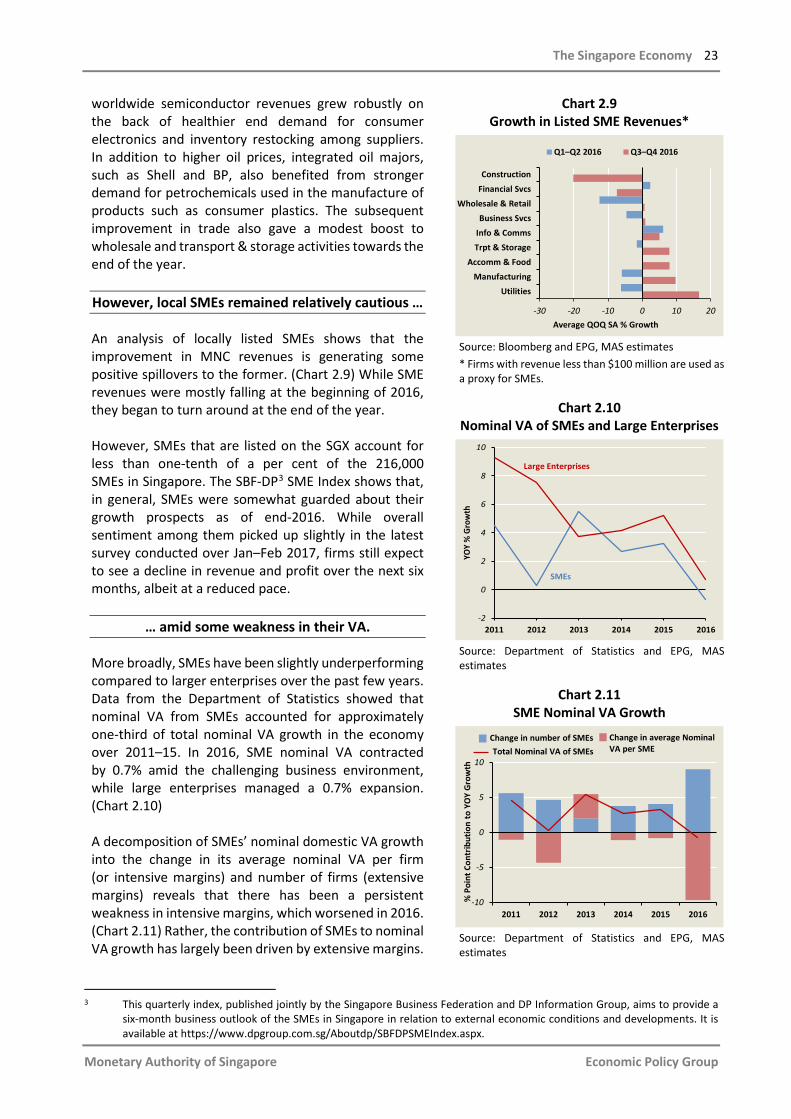
An analysis of locally listed SMEs shows that the improvement in MNC revenues is generating some positive spillovers to the former. (Chart 2.9) While SME revenues were mostly falling at the beginning of 2016, they began to turn around at the end of the year. However, SMEs that are listed on the SGX account for less than one-tenth of a per cent of the 216,000 SMEs in Singapore. The SBF-DP3 SME Index shows that, in general, SMEs were somewhat guarded about their growth prospects as of end-2016. While overall sentiment among them picked up slightly in the latest survey conducted over Jan–Feb 2017, firms still expect to see a decline in revenue and profit over the next six months, albeit at a reduced pace.
… amid some weakness in their VA.
More broadly, SMEs have been slightly underperforming compared to larger enterprises over the past few years. Data from the Department of Statistics showed that nominal VA from SMEs accounted for approximately one-third of total nominal VA growth in the economy over 2011–15. In 2016, SME nominal VA contracted by 0.7% amid the challenging business environment, while large enterprises managed a 0.7% expansion. (Chart 2.10) A decomposition of SMEs’ nominal domestic VA growth into the change in its average nominal VA per firm (or intensive margins) and number of firms (extensive margins) reveals that there has been a persistent weakness in intensive margins, which worsened in 2016. (Chart 2.11) Rather, the contribution of SMEs to nominal VA growth has largely been driven by extensive margins.
Chart 2.9 Growth in Listed SME Revenues*
Source: Bloomberg and EPG, MAS estimates * Firms with revenue less than $100 million are used as a proxy for SMEs.
Chart 2.10
Nominal VA of SMEs and Large Enterprises
Source: Department of Statistics and EPG, MAS estimates
Chart 2.11
SME Nominal VA Growth
Source: Department of Statistics and EPG, MAS estimates
3 This quarterly index, published jointly by the Singapore Business Federation and DP Information Group, aims to provide a
six-month business outlook of the SMEs in Singapore in relation to external economic conditions and developments. It is available at https://www.dpgroup.com.sg/Aboutdp/SBFDPSMEIndex.aspx.
ConstructionFinancial Svcs
Wholesale & RetailBusiness Svcs
Info & CommsTrpt & Storage
Accomm & FoodManufacturing
Utilities
-30 -20 -10 0 10 20Average QOQ SA % Growth
Q1–Q2 2016 Q3–Q4 2016
2011 2012 2013 2014 2015 2016-2
0
2
4
6
8
10
YOY
% G
row
th
SMEs
Large Enterprises
2011 2012 2013 2014 2015 2016-10
-5
0
5
10
% P
oint
Con
trib
utio
n to
YO
Y G
row
th
Change in average NominalVA per SME
Change in number of SMEsTotal Nominal VA of SMEs
24 Macroeconomic Review, April 2017
Monetary Authority of Singapore Economic Policy Group
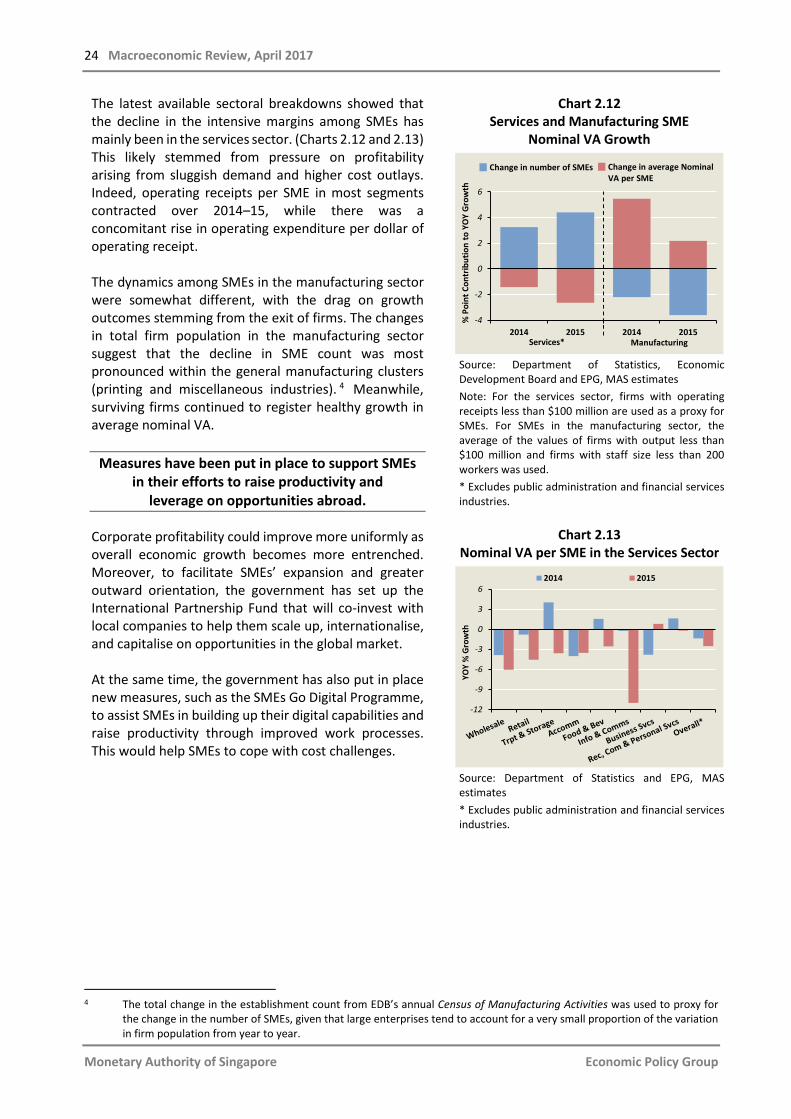
The latest available sectoral breakdowns showed that the decline in the intensive margins among SMEs has mainly been in the services sector. (Charts 2.12 and 2.13) This likely stemmed from pressure on profitability arising from sluggish demand and higher cost outlays. Indeed, operating receipts per SME in most segments contracted over 2014–15, while there was a concomitant rise in operating expenditure per dollar of operating receipt. The dynamics among SMEs in the manufacturing sector were somewhat different, with the drag on growth outcomes stemming from the exit of firms. The changes in total firm population in the manufacturing sector suggest that the decline in SME count was most pronounced within the general manufacturing clusters (printing and miscellaneous industries). 4 Meanwhile, surviving firms continued to register healthy growth in average nominal VA.
Measures have been put in place to support SMEs in their efforts to raise productivity and
leverage on opportunities abroad.
Corporate profitability could improve more uniformly as overall economic growth becomes more entrenched. Moreover, to facilitate SMEs’ expansion and greater outward orientation, the government has set up the International Partnership Fund that will co-invest with local companies to help them scale up, internationalise, and capitalise on opportunities in the global market. At the same time, the government has also put in place new measures, such as the SMEs Go Digital Programme, to assist SMEs in building up their digital capabilities and raise productivity through improved work processes. This would help SMEs to cope with cost challenges.
Chart 2.12 Services and Manufacturing SME
Nominal VA Growth
Source: Department of Statistics, Economic Development Board and EPG, MAS estimates Note: For the services sector, firms with operating receipts less than $100 million are used as a proxy for SMEs. For SMEs in the manufacturing sector, the average of the values of firms with output less than $100 million and firms with staff size less than 200 workers was used. * Excludes public administration and financial services industries.
Chart 2.13 Nominal VA per SME in the Services Sector
Source: Department of Statistics and EPG, MAS estimates * Excludes public administration and financial services industries.
4 The total change in the establishment count from EDB’s annual Census of Manufacturing Activities was used to proxy for
the change in the number of SMEs, given that large enterprises tend to account for a very small proportion of the variation in firm population from year to year.
2014 2015 2014 2015-4
-2
0
2
4
6
% P
oint
Con
trib
utio
n to
YO
Y G
row
th
Services* Manufacturing
Change in average NominalVA per SME
Change in number of SMEs
-12
-9
-6
-3
0
3
6
YOY
% G
row
th
2014 2015
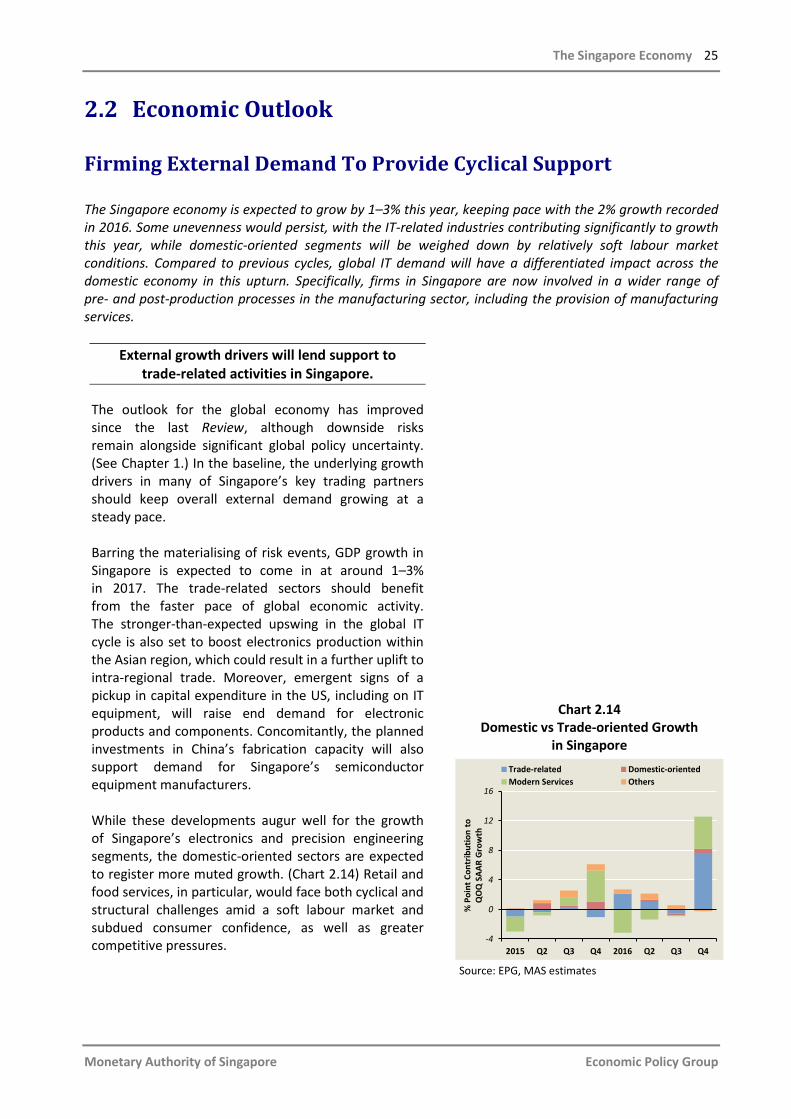
The Singapore Economy 25
Monetary Authority of Singapore Economic Policy Group
2.2 Economic Outlook
Firming External Demand To Provide Cyclical Support
The Singapore economy is expected to grow by 1–3% this year, keeping pace with the 2% growth recorded in 2016. Some unevenness would persist, with the IT-related industries contributing significantly to growth this year, while domestic-oriented segments will be weighed down by relatively soft labour market conditions. Compared to previous cycles, global IT demand will have a differentiated impact across the domestic economy in this upturn. Specifically, firms in Singapore are now involved in a wider range of pre- and post-production processes in the manufacturing sector, including the provision of manufacturing services.
External growth drivers will lend support to trade-related activities in Singapore.
The outlook for the global economy has improved since the last Review, although downside risks remain alongside significant global policy uncertainty. (See Chapter 1.) In the baseline, the underlying growth drivers in many of Singapore’s key trading partners should keep overall external demand growing at a steady pace. Barring the materialising of risk events, GDP growth in Singapore is expected to come in at around 1–3% in 2017. The trade-related sectors should benefit from the faster pace of global economic activity. The stronger-than-expected upswing in the global IT cycle is also set to boost electronics production within the Asian region, which could result in a further uplift to intra-regional trade. Moreover, emergent signs of a pickup in capital expenditure in the US, including on IT equipment, will raise end demand for electronic products and components. Concomitantly, the planned investments in China’s fabrication capacity will also support demand for Singapore’s semiconductor equipment manufacturers. While these developments augur well for the growth of Singapore’s electronics and precision engineering segments, the domestic-oriented sectors are expected to register more muted growth. (Chart 2.14) Retail and food services, in particular, would face both cyclical and structural challenges amid a soft labour market and subdued consumer confidence, as well as greater competitive pressures.
Chart 2.14 Domestic vs Trade-oriented Growth
in Singapore
Source: EPG, MAS estimates
2015 Q2 Q3 Q4 2016 Q2 Q3 Q4-4
0
4
8
12
16
% P
oint
Con
trib
utio
n to
Q
OQ
SAA
R G
row
th
Trade-related Domestic-orientedModern Services Others
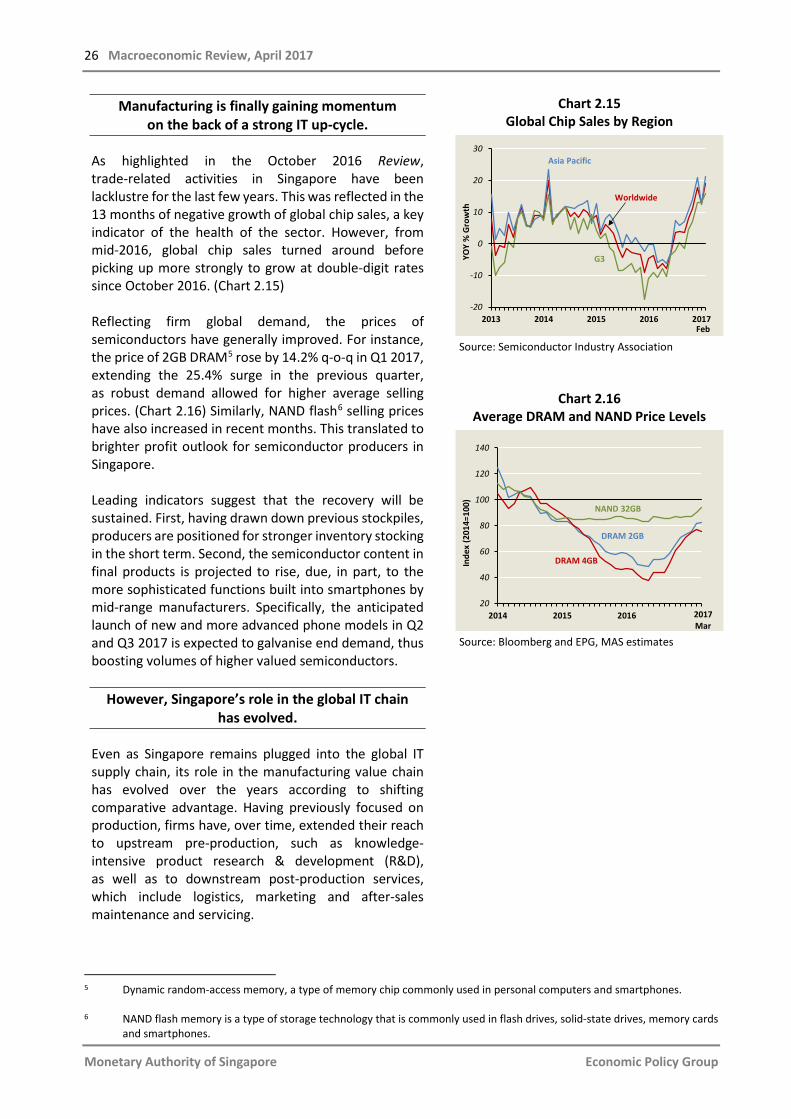
26 Macroeconomic Review, April 2017
Monetary Authority of Singapore Economic Policy Group
Manufacturing is finally gaining momentum on the back of a strong IT up-cycle.
As highlighted in the October 2016 Review, trade-related activities in Singapore have been lacklustre for the last few years. This was reflected in the 13 months of negative growth of global chip sales, a key indicator of the health of the sector. However, from mid-2016, global chip sales turned around before picking up more strongly to grow at double-digit rates since October 2016. (Chart 2.15) Reflecting firm global demand, the prices of semiconductors have generally improved. For instance, the price of 2GB DRAM5 rose by 14.2% q-o-q in Q1 2017, extending the 25.4% surge in the previous quarter, as robust demand allowed for higher average selling prices. (Chart 2.16) Similarly, NAND flash6 selling prices have also increased in recent months. This translated to brighter profit outlook for semiconductor producers in Singapore. Leading indicators suggest that the recovery will be sustained. First, having drawn down previous stockpiles, producers are positioned for stronger inventory stocking in the short term. Second, the semiconductor content in final products is projected to rise, due, in part, to the more sophisticated functions built into smartphones by mid-range manufacturers. Specifically, the anticipated launch of new and more advanced phone models in Q2 and Q3 2017 is expected to galvanise end demand, thus boosting volumes of higher valued semiconductors.
However, Singapore’s role in the global IT chain has evolved.
Even as Singapore remains plugged into the global IT supply chain, its role in the manufacturing value chain has evolved over the years according to shifting comparative advantage. Having previously focused on production, firms have, over time, extended their reach to upstream pre-production, such as knowledge-intensive product research & development (R&D), as well as to downstream post-production services, which include logistics, marketing and after-sales maintenance and servicing.
Chart 2.15 Global Chip Sales by Region
Source: Semiconductor Industry Association
Chart 2.16 Average DRAM and NAND Price Levels
Source: Bloomberg and EPG, MAS estimates
5 Dynamic random-access memory, a type of memory chip commonly used in personal computers and smartphones. 6 NAND flash memory is a type of storage technology that is commonly used in flash drives, solid-state drives, memory cards
and smartphones.
-20
-10
0
10
20
30
2013 2014 2015 2016 2017
YOY
% G
row
th
Feb
Worldwide
Asia Pacific
G3
20
40
60
80
100
120
140
2014 2015 2016
Inde
x (2
014=
100)
2017Mar
DRAM 2GB
DRAM 4GB
NAND 32GB
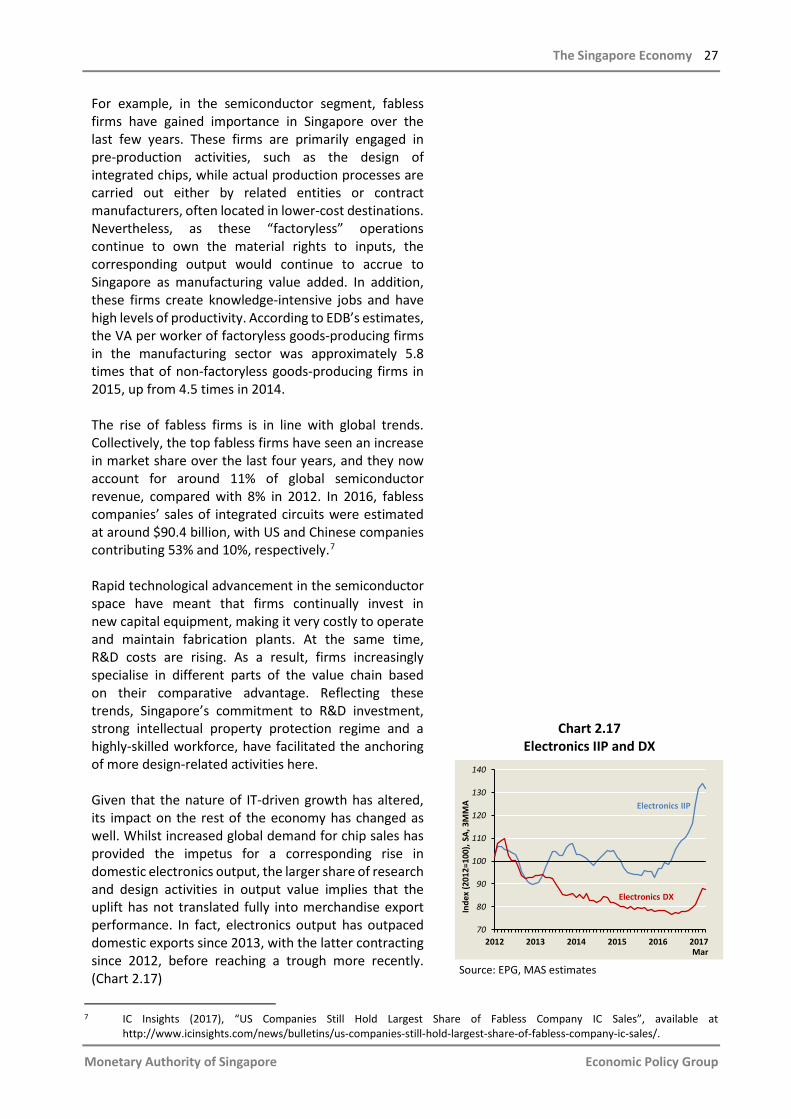
The Singapore Economy 27
Monetary Authority of Singapore Economic Policy Group
For example, in the semiconductor segment, fabless firms have gained importance in Singapore over the last few years. These firms are primarily engaged in pre-production activities, such as the design of integrated chips, while actual production processes are carried out either by related entities or contract manufacturers, often located in lower-cost destinations. Nevertheless, as these “factoryless” operations continue to own the material rights to inputs, the corresponding output would continue to accrue to Singapore as manufacturing value added. In addition, these firms create knowledge-intensive jobs and have high levels of productivity. According to EDB’s estimates, the VA per worker of factoryless goods-producing firms in the manufacturing sector was approximately 5.8 times that of non-factoryless goods-producing firms in 2015, up from 4.5 times in 2014. The rise of fabless firms is in line with global trends. Collectively, the top fabless firms have seen an increase in market share over the last four years, and they now account for around 11% of global semiconductor revenue, compared with 8% in 2012. In 2016, fabless companies’ sales of integrated circuits were estimated at around $90.4 billion, with US and Chinese companies contributing 53% and 10%, respectively.7 Rapid technological advancement in the semiconductor space have meant that firms continually invest in new capital equipment, making it very costly to operate and maintain fabrication plants. At the same time, R&D costs are rising. As a result, firms increasingly specialise in different parts of the value chain based on their comparative advantage. Reflecting these trends, Singapore’s commitment to R&D investment, strong intellectual property protection regime and a highly-skilled workforce, have facilitated the anchoring of more design-related activities here. Given that the nature of IT-driven growth has altered, its impact on the rest of the economy has changed as well. Whilst increased global demand for chip sales has provided the impetus for a corresponding rise in domestic electronics output, the larger share of research and design activities in output value implies that the uplift has not translated fully into merchandise export performance. In fact, electronics output has outpaced domestic exports since 2013, with the latter contracting since 2012, before reaching a trough more recently. (Chart 2.17)
Chart 2.17 Electronics IIP and DX
Source: EPG, MAS estimates
7 IC Insights (2017), “US Companies Still Hold Largest Share of Fabless Company IC Sales”, available at
http://www.icinsights.com/news/bulletins/us-companies-still-hold-largest-share-of-fabless-company-ic-sales/.
70
80
90
100
110
120
130
140
2012 2013 2014 2015 2016 2017
Inde
x (2
012=
100)
, SA,
3M
MA
Mar
Electronics IIP
Electronics DX
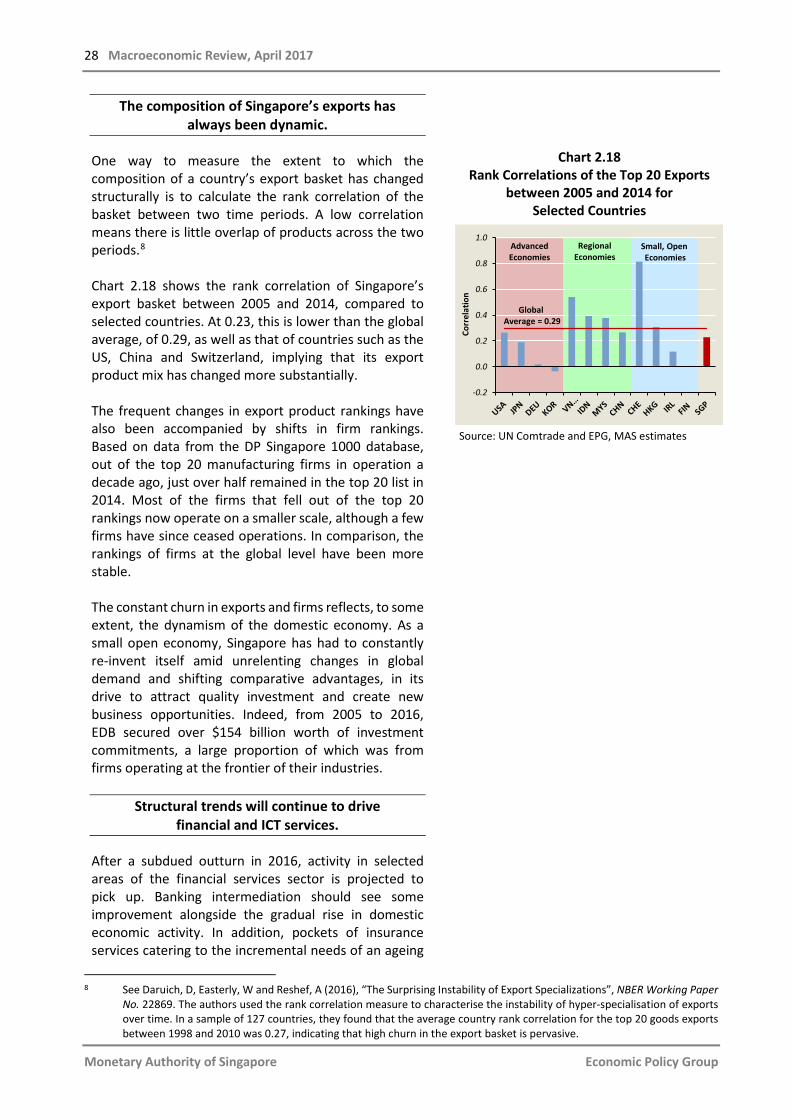
28 Macroeconomic Review, April 2017
Monetary Authority of Singapore Economic Policy Group
The composition of Singapore’s exports has always been dynamic.
One way to measure the extent to which the composition of a country’s export basket has changed structurally is to calculate the rank correlation of the basket between two time periods. A low correlation means there is little overlap of products across the two periods.8 Chart 2.18 shows the rank correlation of Singapore’s export basket between 2005 and 2014, compared to selected countries. At 0.23, this is lower than the global average, of 0.29, as well as that of countries such as the US, China and Switzerland, implying that its export product mix has changed more substantially. The frequent changes in export product rankings have also been accompanied by shifts in firm rankings. Based on data from the DP Singapore 1000 database, out of the top 20 manufacturing firms in operation a decade ago, just over half remained in the top 20 list in 2014. Most of the firms that fell out of the top 20 rankings now operate on a smaller scale, although a few firms have since ceased operations. In comparison, the rankings of firms at the global level have been more stable. The constant churn in exports and firms reflects, to some extent, the dynamism of the domestic economy. As a small open economy, Singapore has had to constantly re-invent itself amid unrelenting changes in global demand and shifting comparative advantages, in its drive to attract quality investment and create new business opportunities. Indeed, from 2005 to 2016, EDB secured over $154 billion worth of investment commitments, a large proportion of which was from firms operating at the frontier of their industries.
Structural trends will continue to drive financial and ICT services.
After a subdued outturn in 2016, activity in selected areas of the financial services sector is projected to pick up. Banking intermediation should see some improvement alongside the gradual rise in domestic economic activity. In addition, pockets of insurance services catering to the incremental needs of an ageing
Chart 2.18 Rank Correlations of the Top 20 Exports
between 2005 and 2014 for Selected Countries
Source: UN Comtrade and EPG, MAS estimates
8 See Daruich, D, Easterly, W and Reshef, A (2016), “The Surprising Instability of Export Specializations”, NBER Working Paper
No. 22869. The authors used the rank correlation measure to characterise the instability of hyper-specialisation of exports over time. In a sample of 127 countries, they found that the average country rank correlation for the top 20 goods exports between 1998 and 2010 was 0.27, indicating that high churn in the export basket is pervasive.
-0.2
0.0
0.2
0.4
0.6
0.8
1.0
Corr
elat
ion
AdvancedEconomies
Small, Open Economies
Global Average = 0.29
RegionalEconomies
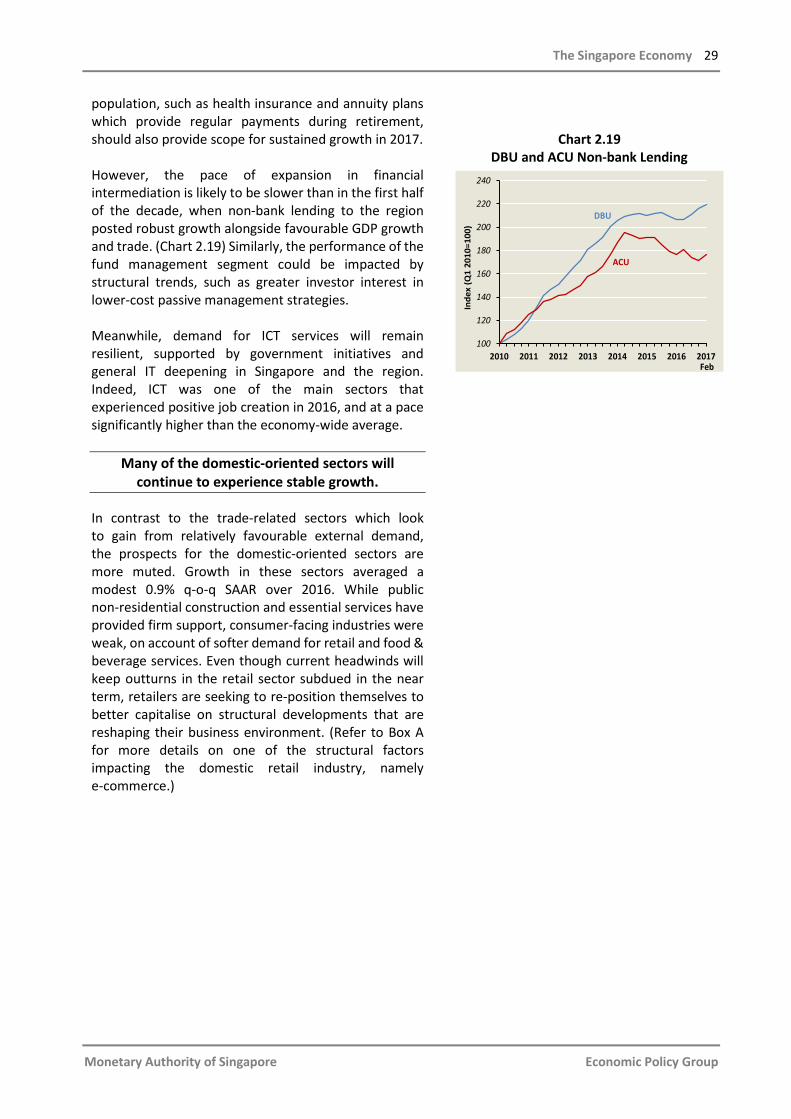
The Singapore Economy 29
Monetary Authority of Singapore Economic Policy Group
population, such as health insurance and annuity plans which provide regular payments during retirement, should also provide scope for sustained growth in 2017. However, the pace of expansion in financial intermediation is likely to be slower than in the first half of the decade, when non-bank lending to the region posted robust growth alongside favourable GDP growth and trade. (Chart 2.19) Similarly, the performance of the fund management segment could be impacted by structural trends, such as greater investor interest in lower-cost passive management strategies. Meanwhile, demand for ICT services will remain resilient, supported by government initiatives and general IT deepening in Singapore and the region. Indeed, ICT was one of the main sectors that experienced positive job creation in 2016, and at a pace significantly higher than the economy-wide average.
Many of the domestic-oriented sectors will continue to experience stable growth.
In contrast to the trade-related sectors which look to gain from relatively favourable external demand, the prospects for the domestic-oriented sectors are more muted. Growth in these sectors averaged a modest 0.9% q-o-q SAAR over 2016. While public non-residential construction and essential services have provided firm support, consumer-facing industries were weak, on account of softer demand for retail and food & beverage services. Even though current headwinds will keep outturns in the retail sector subdued in the near term, retailers are seeking to re-position themselves to better capitalise on structural developments that are reshaping their business environment. (Refer to Box A for more details on one of the structural factors impacting the domestic retail industry, namely e-commerce.)
Chart 2.19 DBU and ACU Non-bank Lending
100
120
140
160
180
200
220
240
2010 2011 2012 2013 2014 2015 2016 2017
Inde
x (Q
1 20
10=1
00)
Feb
DBU
ACU
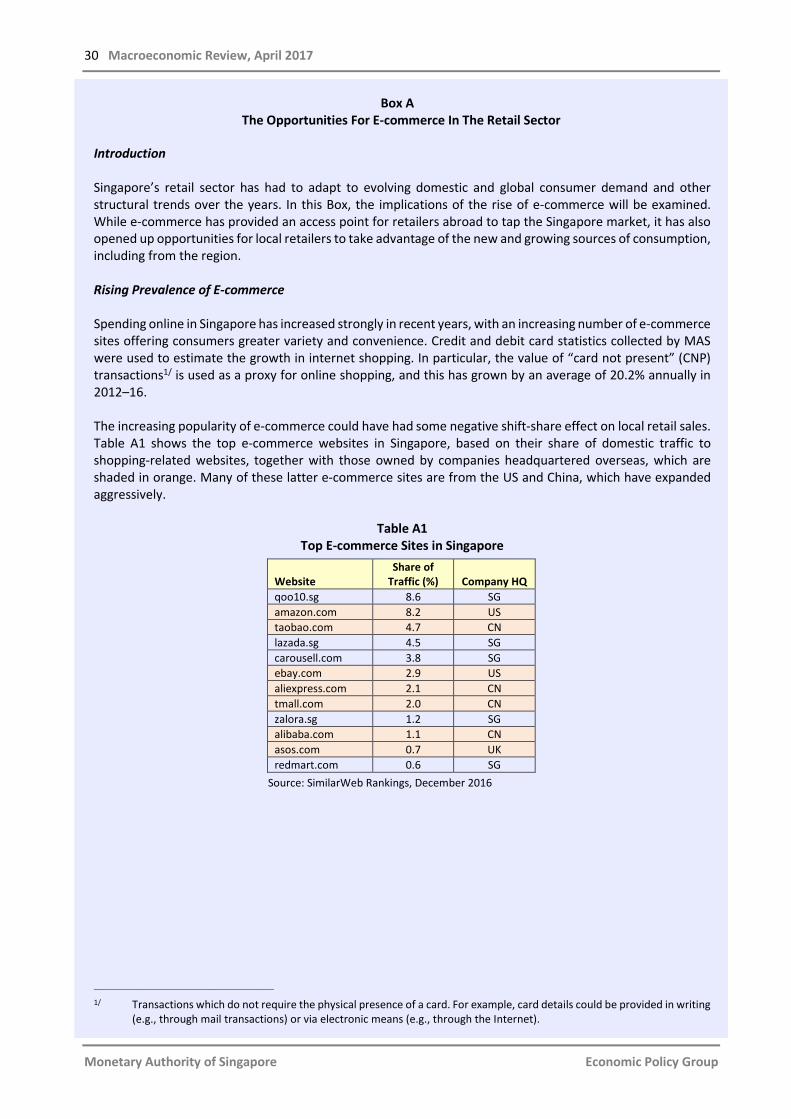
30 Macroeconomic Review, April 2017
Monetary Authority of Singapore Economic Policy Group
Box A
The Opportunities For E-commerce In The Retail Sector Introduction Singapore’s retail sector has had to adapt to evolving domestic and global consumer demand and other structural trends over the years. In this Box, the implications of the rise of e-commerce will be examined. While e-commerce has provided an access point for retailers abroad to tap the Singapore market, it has also opened up opportunities for local retailers to take advantage of the new and growing sources of consumption, including from the region. Rising Prevalence of E-commerce Spending online in Singapore has increased strongly in recent years, with an increasing number of e-commerce sites offering consumers greater variety and convenience. Credit and debit card statistics collected by MAS were used to estimate the growth in internet shopping. In particular, the value of “card not present” (CNP) transactions1/ is used as a proxy for online shopping, and this has grown by an average of 20.2% annually in 2012–16. The increasing popularity of e-commerce could have had some negative shift-share effect on local retail sales. Table A1 shows the top e-commerce websites in Singapore, based on their share of domestic traffic to shopping-related websites, together with those owned by companies headquartered overseas, which are shaded in orange. Many of these latter e-commerce sites are from the US and China, which have expanded aggressively.
Table A1 Top E-commerce Sites in Singapore
Website Share of
Traffic (%) Company HQ qoo10.sg 8.6 SG amazon.com 8.2 US taobao.com 4.7 CN lazada.sg 4.5 SG carousell.com 3.8 SG ebay.com 2.9 US aliexpress.com 2.1 CN tmall.com 2.0 CN zalora.sg 1.2 SG alibaba.com 1.1 CN asos.com 0.7 UK redmart.com 0.6 SG
Source: SimilarWeb Rankings, December 2016 ____________________________________________________________________
1/ Transactions which do not require the physical presence of a card. For example, card details could be provided in writing (e.g., through mail transactions) or via electronic means (e.g., through the Internet).
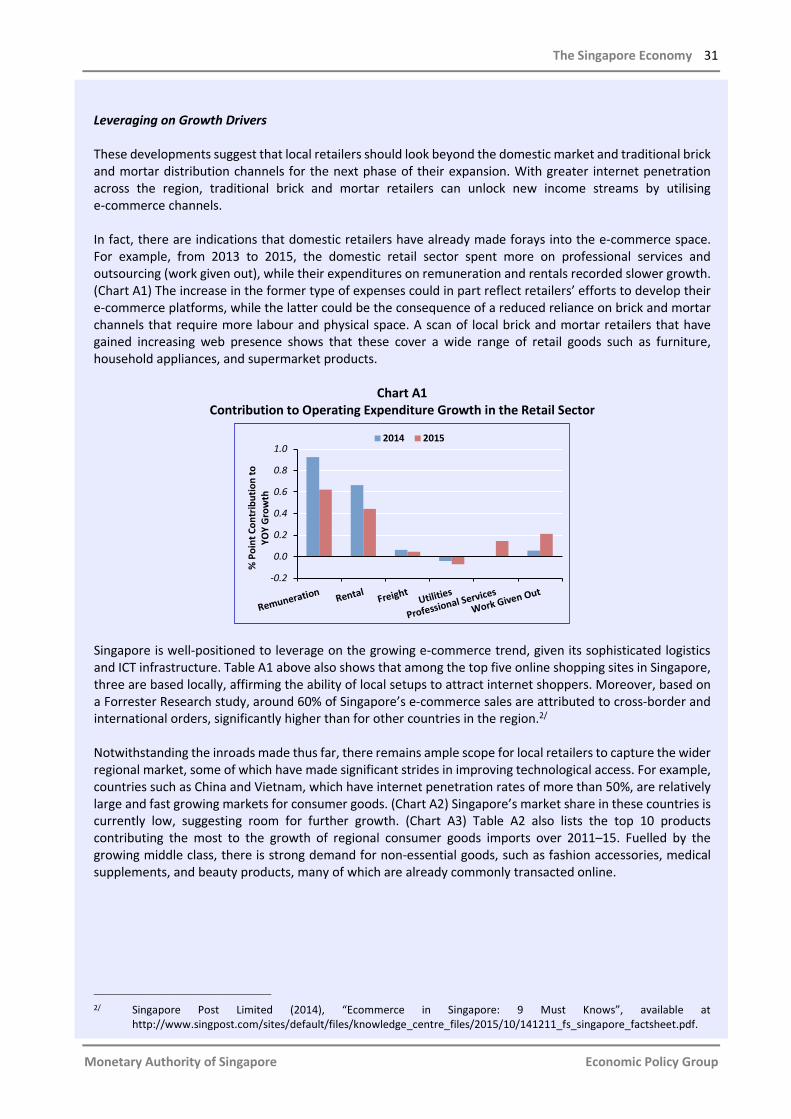
The Singapore Economy 31
Monetary Authority of Singapore Economic Policy Group
Leveraging on Growth Drivers These developments suggest that local retailers should look beyond the domestic market and traditional brick and mortar distribution channels for the next phase of their expansion. With greater internet penetration across the region, traditional brick and mortar retailers can unlock new income streams by utilising e-commerce channels. In fact, there are indications that domestic retailers have already made forays into the e-commerce space. For example, from 2013 to 2015, the domestic retail sector spent more on professional services and outsourcing (work given out), while their expenditures on remuneration and rentals recorded slower growth. (Chart A1) The increase in the former type of expenses could in part reflect retailers’ efforts to develop their e-commerce platforms, while the latter could be the consequence of a reduced reliance on brick and mortar channels that require more labour and physical space. A scan of local brick and mortar retailers that have gained increasing web presence shows that these cover a wide range of retail goods such as furniture, household appliances, and supermarket products.
Chart A1 Contribution to Operating Expenditure Growth in the Retail Sector
Singapore is well-positioned to leverage on the growing e-commerce trend, given its sophisticated logistics and ICT infrastructure. Table A1 above also shows that among the top five online shopping sites in Singapore, three are based locally, affirming the ability of local setups to attract internet shoppers. Moreover, based on a Forrester Research study, around 60% of Singapore’s e-commerce sales are attributed to cross-border and international orders, significantly higher than for other countries in the region.2/ Notwithstanding the inroads made thus far, there remains ample scope for local retailers to capture the wider regional market, some of which have made significant strides in improving technological access. For example, countries such as China and Vietnam, which have internet penetration rates of more than 50%, are relatively large and fast growing markets for consumer goods. (Chart A2) Singapore’s market share in these countries is currently low, suggesting room for further growth. (Chart A3) Table A2 also lists the top 10 products contributing the most to the growth of regional consumer goods imports over 2011–15. Fuelled by the growing middle class, there is strong demand for non-essential goods, such as fashion accessories, medical supplements, and beauty products, many of which are already commonly transacted online. ___________________________________________________________________
2/ Singapore Post Limited (2014), “Ecommerce in Singapore: 9 Must Knows”, available at http://www.singpost.com/sites/default/files/knowledge_centre_files/2015/10/141211_fs_singapore_factsheet.pdf.
-0.2
0.0
0.2
0.4
0.6
0.8
1.0
% P
oint
Con
trib
utio
n to
YOY
Gro
wth
2014 2015
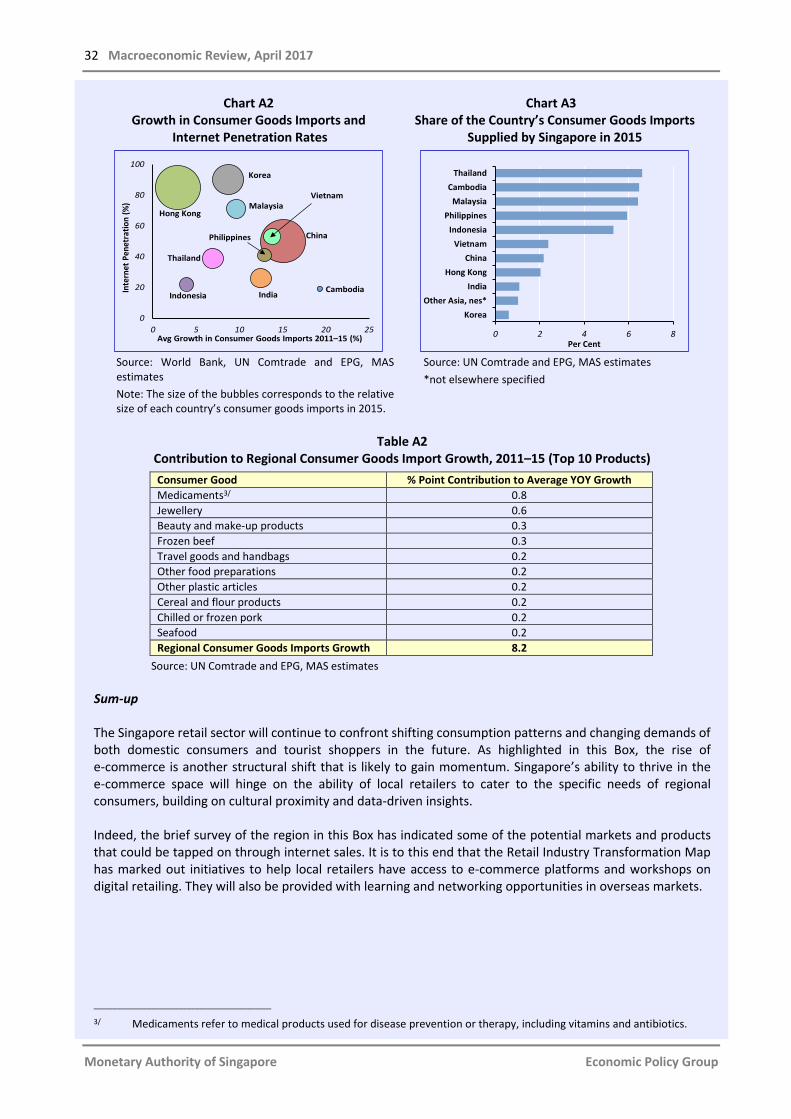
32 Macroeconomic Review, April 2017
Monetary Authority of Singapore Economic Policy Group
Chart A2 Growth in Consumer Goods Imports and
Internet Penetration Rates
Chart A3 Share of the Country’s Consumer Goods Imports
Supplied by Singapore in 2015
Source: World Bank, UN Comtrade and EPG, MAS estimates Note: The size of the bubbles corresponds to the relative size of each country’s consumer goods imports in 2015.
Source: UN Comtrade and EPG, MAS estimates *not elsewhere specified
Table A2
Contribution to Regional Consumer Goods Import Growth, 2011–15 (Top 10 Products)
Consumer Good % Point Contribution to Average YOY Growth Medicaments3/ 0.8 Jewellery 0.6 Beauty and make-up products 0.3 Frozen beef 0.3 Travel goods and handbags 0.2 Other food preparations 0.2 Other plastic articles 0.2 Cereal and flour products 0.2 Chilled or frozen pork 0.2 Seafood 0.2 Regional Consumer Goods Imports Growth 8.2
Source: UN Comtrade and EPG, MAS estimates Sum-up The Singapore retail sector will continue to confront shifting consumption patterns and changing demands of both domestic consumers and tourist shoppers in the future. As highlighted in this Box, the rise of e-commerce is another structural shift that is likely to gain momentum. Singapore’s ability to thrive in the e-commerce space will hinge on the ability of local retailers to cater to the specific needs of regional consumers, building on cultural proximity and data-driven insights. Indeed, the brief survey of the region in this Box has indicated some of the potential markets and products that could be tapped on through internet sales. It is to this end that the Retail Industry Transformation Map has marked out initiatives to help local retailers have access to e-commerce platforms and workshops on digital retailing. They will also be provided with learning and networking opportunities in overseas markets. ___________________________________________________________________
3/ Medicaments refer to medical products used for disease prevention or therapy, including vitamins and antibiotics.
0
20
40
60
80
100
0 5 10 15 20 25
Inte
rnet
Pen
etra
tion
(%)
Avg Growth in Consumer Goods Imports 2011–15 (%)
China
Cambodia
Hong Kong
IndiaIndonesia
Korea
Malaysia
Thailand
Philippines
Vietnam
0 2 4 6 8
KoreaOther Asia, nes*
IndiaHong Kong
ChinaVietnam
IndonesiaPhilippines
MalaysiaCambodia
Thailand
Per Cent
Chapter 3 Labour Market and
Inflation
34 Macroeconomic Review, April 2017
Monetary Authority of Singapore Economic Policy Group
3 Labour Market And Inflation
Demand-side Inflationary Pressures Remain Muted
Overall net employment growth was flat in H2 2016, as resident employment gains were offset by a contraction in foreign headcount. Amid subdued labour demand and an increase in net entrants to the local labour force in the last quarter of the year, both the overall and resident unemployment rates picked up, while the ratio of vacancies to unemployed persons fell further. The employment outlook for 2017 is not expected to be significantly different from last year. Modest manpower demand should dampen underlying wage pressures. Headline consumer price inflation in Singapore had turned positive since late last year, and continued to rise to 0.6% in the first quarter of 2017. This was driven by the sharp turnaround in the prices of oil-related items, such as petrol and electricity. Meanwhile, MAS Core Inflation edged up to 1.3% in Q1 2017 from 1.2% in Q4 2016. Following the recovery in global commodity markets, imported inflationary pressures have picked up in recent quarters. Most of these price pressures have been concentrated in energy-related items following the increase in global oil prices, but there are some indications of rising inflation in food commodities as well. For the whole of 2017, energy-related items will be the main driver of the projected rise in the CPI. While global oil prices should be capped by elevated inventories as well as rising US crude oil production, average prices for the year will still be higher than in 2016. Other domestic business costs are also likely to rise modestly in 2017, partly reflecting the impact of administrative price increases, such as the hike in water prices, although their effective contribution to the increase in overall CPI inflation is relatively small. At this point, there are no indications of generalised demand-induced price pressures, especially for discretionary consumer goods and services. Amid the still-soft economic environment and labour market, the pass-through of higher external and domestic costs to consumer prices should be muted. For the year as a whole, CPI-All Items inflation is forecast to come in at 0.5–1.5%, while MAS Core Inflation is projected to be 1–2%, unchanged from the forecasts in the October Review.
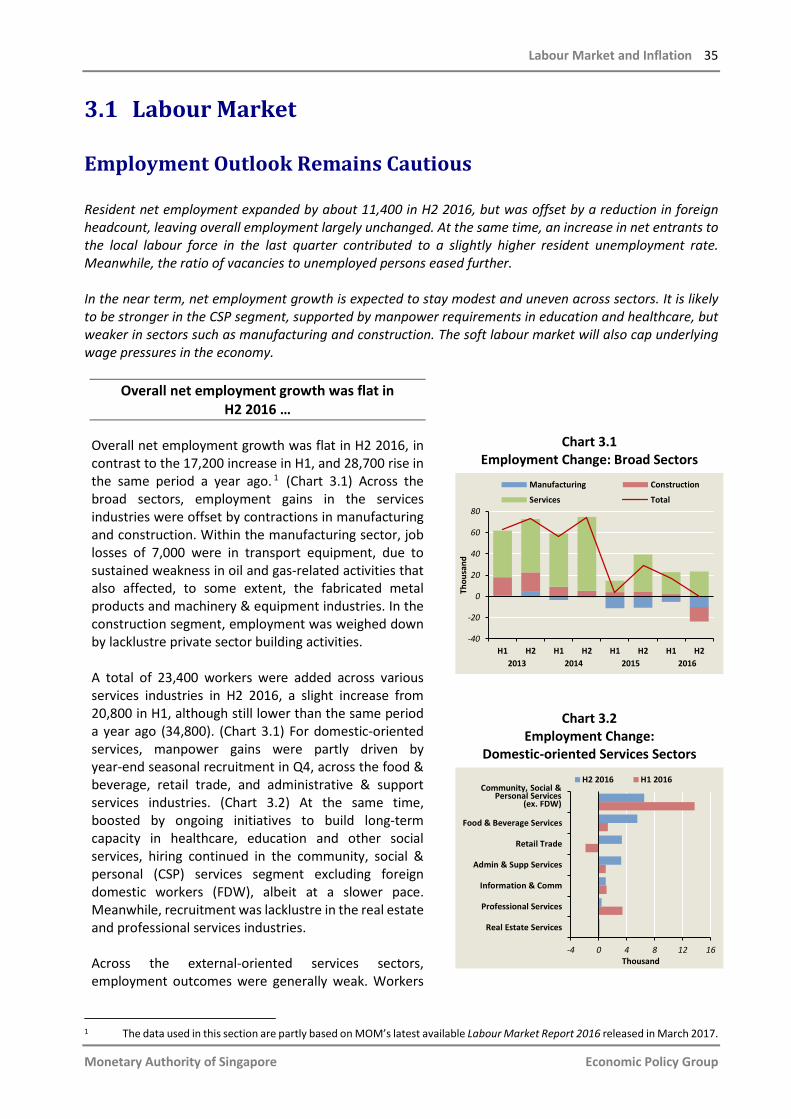
Labour Market and Inflation 35
Monetary Authority of Singapore Economic Policy Group
3.1 Labour Market
Employment Outlook Remains Cautious
Resident net employment expanded by about 11,400 in H2 2016, but was offset by a reduction in foreign headcount, leaving overall employment largely unchanged. At the same time, an increase in net entrants to the local labour force in the last quarter contributed to a slightly higher resident unemployment rate. Meanwhile, the ratio of vacancies to unemployed persons eased further. In the near term, net employment growth is expected to stay modest and uneven across sectors. It is likely to be stronger in the CSP segment, supported by manpower requirements in education and healthcare, but weaker in sectors such as manufacturing and construction. The soft labour market will also cap underlying wage pressures in the economy.
Overall net employment growth was flat in H2 2016 …
Overall net employment growth was flat in H2 2016, in contrast to the 17,200 increase in H1, and 28,700 rise in the same period a year ago. 1 (Chart 3.1) Across the broad sectors, employment gains in the services industries were offset by contractions in manufacturing and construction. Within the manufacturing sector, job losses of 7,000 were in transport equipment, due to sustained weakness in oil and gas-related activities that also affected, to some extent, the fabricated metal products and machinery & equipment industries. In the construction segment, employment was weighed down by lacklustre private sector building activities. A total of 23,400 workers were added across various services industries in H2 2016, a slight increase from 20,800 in H1, although still lower than the same period a year ago (34,800). (Chart 3.1) For domestic-oriented services, manpower gains were partly driven by year-end seasonal recruitment in Q4, across the food & beverage, retail trade, and administrative & support services industries. (Chart 3.2) At the same time, boosted by ongoing initiatives to build long-term capacity in healthcare, education and other social services, hiring continued in the community, social & personal (CSP) services segment excluding foreign domestic workers (FDW), albeit at a slower pace. Meanwhile, recruitment was lacklustre in the real estate and professional services industries. Across the external-oriented services sectors, employment outcomes were generally weak. Workers
Chart 3.1 Employment Change: Broad Sectors
Chart 3.2 Employment Change:
Domestic-oriented Services Sectors
1 The data used in this section are partly based on MOM’s latest available Labour Market Report 2016 released in March 2017.
H1 H2 H1 H2 H1 H2 H1 H2-40
-20
0
20
40
60
80
Thou
sand
Manufacturing Construction
Services Total
2013 2014 2015 2016
Real Estate Services
Professional Services
Information & Comm
Admin & Supp Services
Retail Trade
Food & Beverage Services
-4 0 4 8 12 16Thousand
H2 2016 H1 2016Community, Social &
Personal Services(ex. FDW)
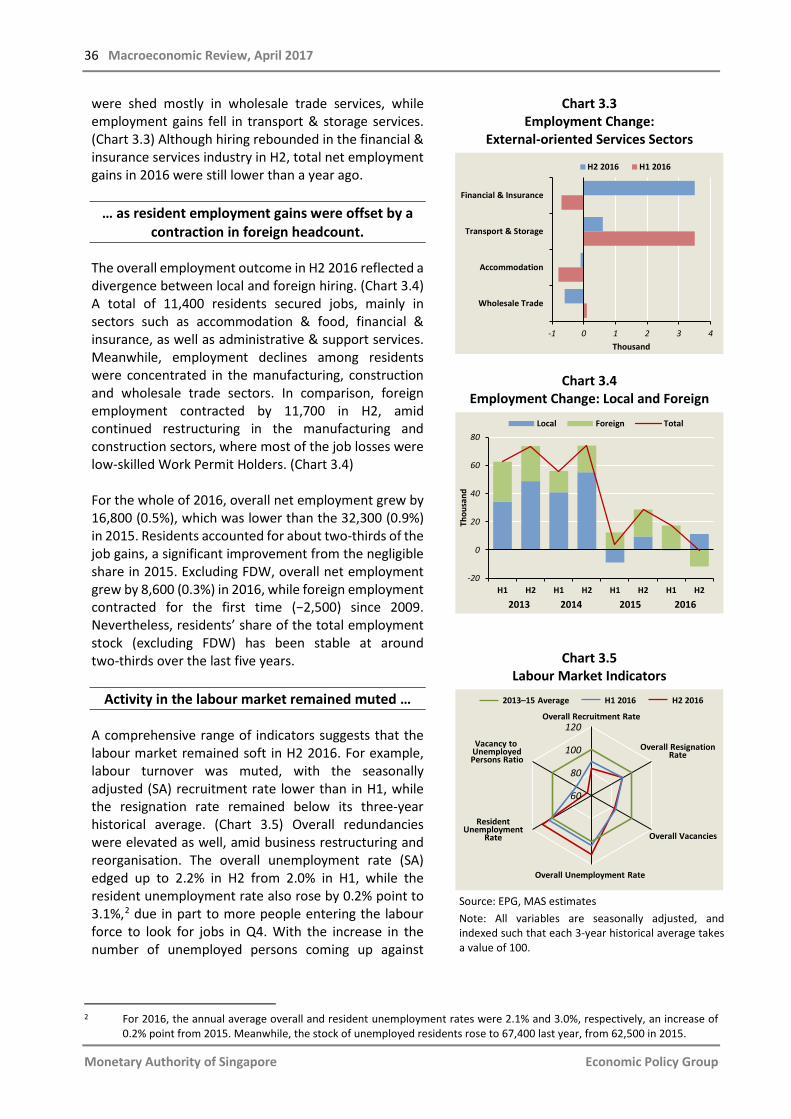
36 Macroeconomic Review, April 2017
Monetary Authority of Singapore Economic Policy Group
were shed mostly in wholesale trade services, while employment gains fell in transport & storage services. (Chart 3.3) Although hiring rebounded in the financial & insurance services industry in H2, total net employment gains in 2016 were still lower than a year ago.
… as resident employment gains were offset by a contraction in foreign headcount.
The overall employment outcome in H2 2016 reflected a divergence between local and foreign hiring. (Chart 3.4) A total of 11,400 residents secured jobs, mainly in sectors such as accommodation & food, financial & insurance, as well as administrative & support services. Meanwhile, employment declines among residents were concentrated in the manufacturing, construction and wholesale trade sectors. In comparison, foreign employment contracted by 11,700 in H2, amid continued restructuring in the manufacturing and construction sectors, where most of the job losses were low-skilled Work Permit Holders. (Chart 3.4) For the whole of 2016, overall net employment grew by 16,800 (0.5%), which was lower than the 32,300 (0.9%) in 2015. Residents accounted for about two-thirds of the job gains, a significant improvement from the negligible share in 2015. Excluding FDW, overall net employment grew by 8,600 (0.3%) in 2016, while foreign employment contracted for the first time (−2,500) since 2009. Nevertheless, residents’ share of the total employment stock (excluding FDW) has been stable at around two-thirds over the last five years.
Activity in the labour market remained muted …
A comprehensive range of indicators suggests that the labour market remained soft in H2 2016. For example, labour turnover was muted, with the seasonally adjusted (SA) recruitment rate lower than in H1, while the resignation rate remained below its three-year historical average. (Chart 3.5) Overall redundancies were elevated as well, amid business restructuring and reorganisation. The overall unemployment rate (SA) edged up to 2.2% in H2 from 2.0% in H1, while the resident unemployment rate also rose by 0.2% point to 3.1%,2 due in part to more people entering the labour force to look for jobs in Q4. With the increase in the number of unemployed persons coming up against
Chart 3.3 Employment Change:
External-oriented Services Sectors
Chart 3.4 Employment Change: Local and Foreign
Chart 3.5
Labour Market Indicators
Source: EPG, MAS estimates Note: All variables are seasonally adjusted, and indexed such that each 3-year historical average takes a value of 100.
2 For 2016, the annual average overall and resident unemployment rates were 2.1% and 3.0%, respectively, an increase of
0.2% point from 2015. Meanwhile, the stock of unemployed residents rose to 67,400 last year, from 62,500 in 2015.
Wholesale Trade
Accommodation
Transport & Storage
Financial & Insurance
-1 0 1 2 3 4Thousand
H2 2016 H1 2016
H1 H2 H1 H2 H1 H2 H1 H2-20
0
20
40
60
80
Thou
sand
Local Foreign Total
2013 2014 2015 2016
60
80
100
120Vacancy to
UnemployedPersons Ratio
ResidentUnemployment
Rate
Overall Unemployment Rate
Overall Vacancies
H1 20162013–15 Average H2 2016
Overall Recruitment Rate
Overall Resignation Rate
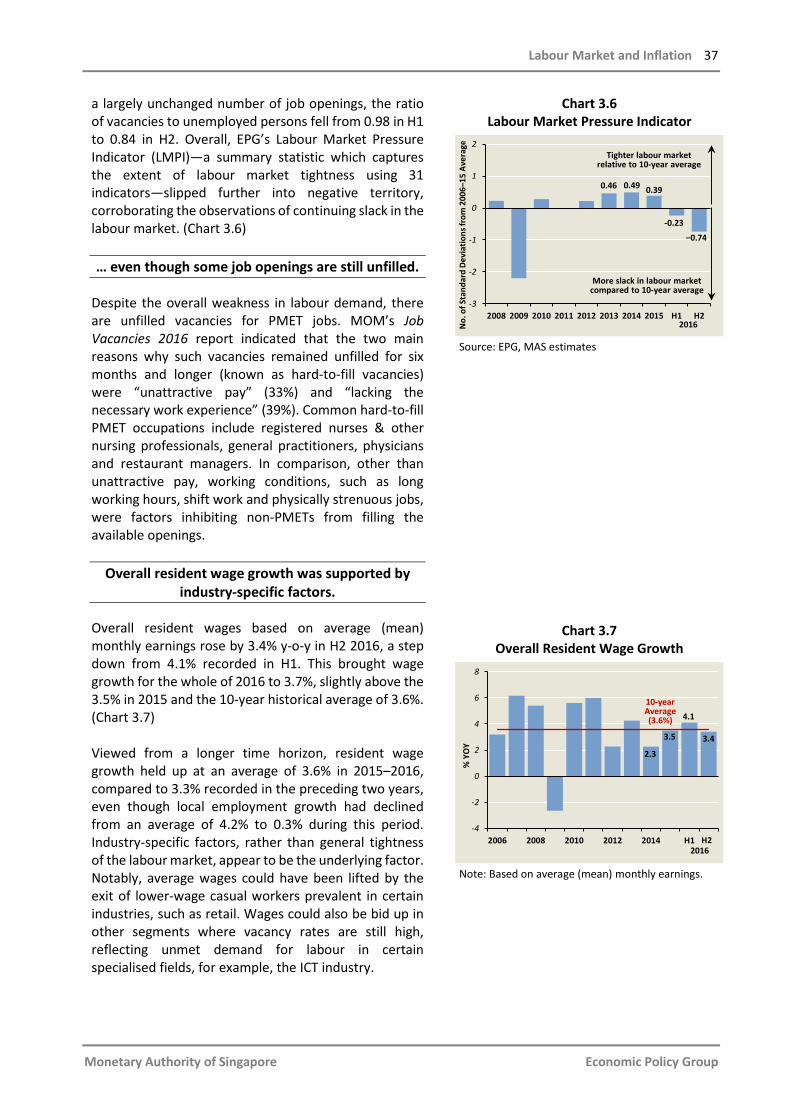
Labour Market and Inflation 37
Monetary Authority of Singapore Economic Policy Group
a largely unchanged number of job openings, the ratio of vacancies to unemployed persons fell from 0.98 in H1 to 0.84 in H2. Overall, EPG’s Labour Market Pressure Indicator (LMPI)—a summary statistic which captures the extent of labour market tightness using 31 indicators—slipped further into negative territory, corroborating the observations of continuing slack in the labour market. (Chart 3.6) … even though some job openings are still unfilled.
Despite the overall weakness in labour demand, there are unfilled vacancies for PMET jobs. MOM’s Job Vacancies 2016 report indicated that the two main reasons why such vacancies remained unfilled for six months and longer (known as hard-to-fill vacancies) were “unattractive pay” (33%) and “lacking the necessary work experience” (39%). Common hard-to-fill PMET occupations include registered nurses & other nursing professionals, general practitioners, physicians and restaurant managers. In comparison, other than unattractive pay, working conditions, such as long working hours, shift work and physically strenuous jobs, were factors inhibiting non-PMETs from filling the available openings.
Overall resident wage growth was supported by industry-specific factors.
Overall resident wages based on average (mean) monthly earnings rose by 3.4% y-o-y in H2 2016, a step down from 4.1% recorded in H1. This brought wage growth for the whole of 2016 to 3.7%, slightly above the 3.5% in 2015 and the 10-year historical average of 3.6%. (Chart 3.7) Viewed from a longer time horizon, resident wage growth held up at an average of 3.6% in 2015–2016, compared to 3.3% recorded in the preceding two years, even though local employment growth had declined from an average of 4.2% to 0.3% during this period. Industry-specific factors, rather than general tightness of the labour market, appear to be the underlying factor. Notably, average wages could have been lifted by the exit of lower-wage casual workers prevalent in certain industries, such as retail. Wages could also be bid up in other segments where vacancy rates are still high, reflecting unmet demand for labour in certain specialised fields, for example, the ICT industry.
Chart 3.6 Labour Market Pressure Indicator
Source: EPG, MAS estimates
Chart 3.7 Overall Resident Wage Growth
Note: Based on average (mean) monthly earnings.
2008 2009 2010 2011 2012 2013 2014 2015 H1 H2-3
-2
-1
0
1
2Tighter labour market
relative to 10-year average
More slack in labour market compared to 10-year average
0.46 0.49 0.39
-0.23
2016
−0.74
No.
of S
tand
ard
Dev
iatio
ns fr
om 2
006–
15 A
vera
ge
2006 2008 2010 2012 2014 H1-4
-2
0
2
4
6
8
% Y
OY
10-year Average(3.6%)
H22016
2.3
3.5
4.1
3.4
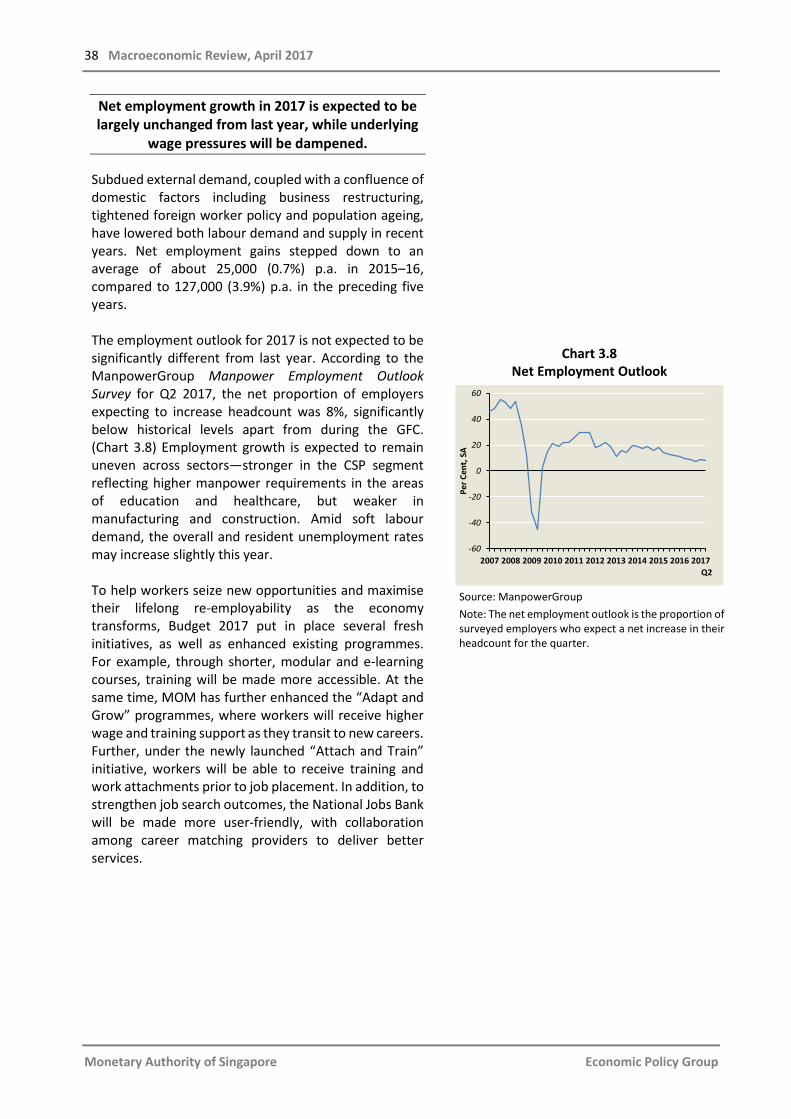
38 Macroeconomic Review, April 2017
Monetary Authority of Singapore Economic Policy Group
Net employment growth in 2017 is expected to be largely unchanged from last year, while underlying
wage pressures will be dampened.
Subdued external demand, coupled with a confluence of domestic factors including business restructuring, tightened foreign worker policy and population ageing, have lowered both labour demand and supply in recent years. Net employment gains stepped down to an average of about 25,000 (0.7%) p.a. in 2015–16, compared to 127,000 (3.9%) p.a. in the preceding five years. The employment outlook for 2017 is not expected to be significantly different from last year. According to the ManpowerGroup Manpower Employment Outlook Survey for Q2 2017, the net proportion of employers expecting to increase headcount was 8%, significantly below historical levels apart from during the GFC. (Chart 3.8) Employment growth is expected to remain uneven across sectors—stronger in the CSP segment reflecting higher manpower requirements in the areas of education and healthcare, but weaker in manufacturing and construction. Amid soft labour demand, the overall and resident unemployment rates may increase slightly this year. To help workers seize new opportunities and maximise their lifelong re-employability as the economy transforms, Budget 2017 put in place several fresh initiatives, as well as enhanced existing programmes. For example, through shorter, modular and e-learning courses, training will be made more accessible. At the same time, MOM has further enhanced the “Adapt and Grow” programmes, where workers will receive higher wage and training support as they transit to new careers. Further, under the newly launched “Attach and Train” initiative, workers will be able to receive training and work attachments prior to job placement. In addition, to strengthen job search outcomes, the National Jobs Bank will be made more user-friendly, with collaboration among career matching providers to deliver better services.
Chart 3.8 Net Employment Outlook
Source: ManpowerGroup Note: The net employment outlook is the proportion of surveyed employers who expect a net increase in their headcount for the quarter.
2007 2008 2009 2010 2011 2012 2013 2014 2015 2016 2017-60
-40
-20
0
20
40
60
Per C
ent,
SA
Q2

Labour Market and Inflation 39
Monetary Authority of Singapore Economic Policy Group
Overall, modest manpower demand and the soft labour market will dampen underlying wage pressures through the year. Resident wage growth could average closer to 3% in 2017, compared to 3.7% last year. Meanwhile, economy-wide labour productivity growth rebounded from −0.2% in 2015 to 1% last year, and is likely to improve further to 1.5–2% in 2017, largely driven by productivity gains in manufacturing. Accordingly, overall unit labour cost is projected to increase more gradually compared to the 2.4% in 2016.
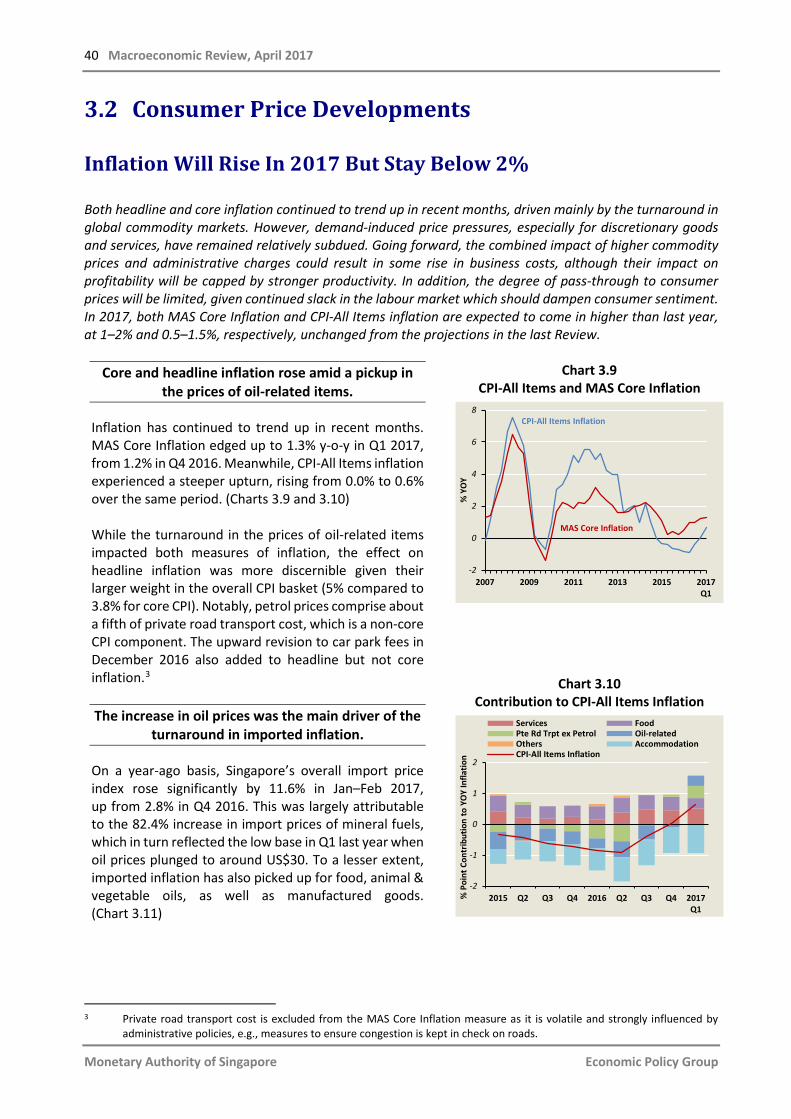
40 Macroeconomic Review, April 2017
Monetary Authority of Singapore Economic Policy Group
3.2 Consumer Price Developments
Inflation Will Rise In 2017 But Stay Below 2%
Both headline and core inflation continued to trend up in recent months, driven mainly by the turnaround in global commodity markets. However, demand-induced price pressures, especially for discretionary goods and services, have remained relatively subdued. Going forward, the combined impact of higher commodity prices and administrative charges could result in some rise in business costs, although their impact on profitability will be capped by stronger productivity. In addition, the degree of pass-through to consumer prices will be limited, given continued slack in the labour market which should dampen consumer sentiment. In 2017, both MAS Core Inflation and CPI-All Items inflation are expected to come in higher than last year, at 1–2% and 0.5–1.5%, respectively, unchanged from the projections in the last Review.
Core and headline inflation rose amid a pickup in the prices of oil-related items.
Inflation has continued to trend up in recent months. MAS Core Inflation edged up to 1.3% y-o-y in Q1 2017, from 1.2% in Q4 2016. Meanwhile, CPI-All Items inflation experienced a steeper upturn, rising from 0.0% to 0.6% over the same period. (Charts 3.9 and 3.10) While the turnaround in the prices of oil-related items impacted both measures of inflation, the effect on headline inflation was more discernible given their larger weight in the overall CPI basket (5% compared to 3.8% for core CPI). Notably, petrol prices comprise about a fifth of private road transport cost, which is a non-core CPI component. The upward revision to car park fees in December 2016 also added to headline but not core inflation.3 The increase in oil prices was the main driver of the
turnaround in imported inflation.
On a year-ago basis, Singapore’s overall import price index rose significantly by 11.6% in Jan–Feb 2017, up from 2.8% in Q4 2016. This was largely attributable to the 82.4% increase in import prices of mineral fuels, which in turn reflected the low base in Q1 last year when oil prices plunged to around US$30. To a lesser extent, imported inflation has also picked up for food, animal & vegetable oils, as well as manufactured goods. (Chart 3.11)
Chart 3.9 CPI-All Items and MAS Core Inflation
Chart 3.10 Contribution to CPI-All Items Inflation
3 Private road transport cost is excluded from the MAS Core Inflation measure as it is volatile and strongly influenced by
administrative policies, e.g., measures to ensure congestion is kept in check on roads.
2007 2009 2011 2013 2015 2017Q1
-2
0
2
4
6
8
% Y
OY
CPI-All Items Inflation
MAS Core Inflation
2015 Q2 Q3 Q4 2016 Q2 Q3 Q4 2017Q1
-2
-1
0
1
2
% P
oint
Con
trib
utio
n to
YO
Y In
flatio
n
Services FoodPte Rd Trpt ex Petrol Oil-relatedOthers AccommodationCPI-All Items Inflation
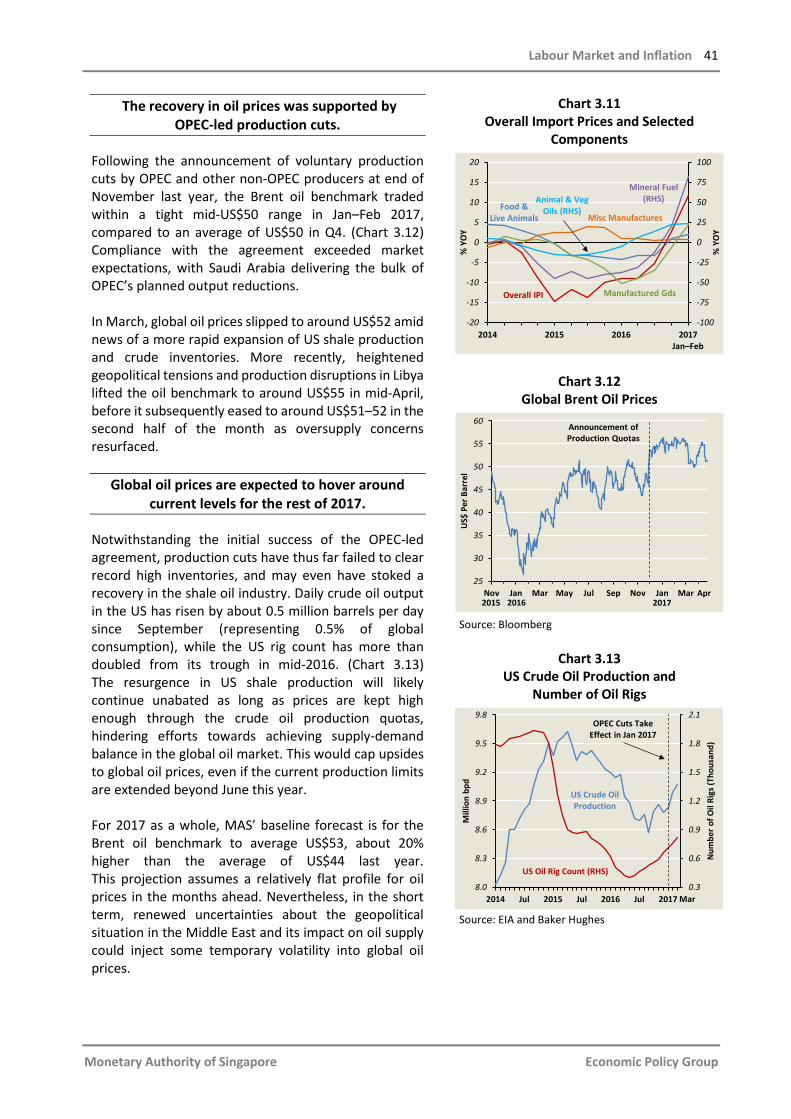
Labour Market and Inflation 41
Monetary Authority of Singapore Economic Policy Group
The recovery in oil prices was supported by OPEC-led production cuts.
Following the announcement of voluntary production cuts by OPEC and other non-OPEC producers at end of November last year, the Brent oil benchmark traded within a tight mid-US$50 range in Jan–Feb 2017, compared to an average of US$50 in Q4. (Chart 3.12) Compliance with the agreement exceeded market expectations, with Saudi Arabia delivering the bulk of OPEC’s planned output reductions. In March, global oil prices slipped to around US$52 amid news of a more rapid expansion of US shale production and crude inventories. More recently, heightened geopolitical tensions and production disruptions in Libya lifted the oil benchmark to around US$55 in mid-April, before it subsequently eased to around US$51–52 in the second half of the month as oversupply concerns resurfaced.
Global oil prices are expected to hover around current levels for the rest of 2017.
Notwithstanding the initial success of the OPEC-led agreement, production cuts have thus far failed to clear record high inventories, and may even have stoked a recovery in the shale oil industry. Daily crude oil output in the US has risen by about 0.5 million barrels per day since September (representing 0.5% of global consumption), while the US rig count has more than doubled from its trough in mid-2016. (Chart 3.13) The resurgence in US shale production will likely continue unabated as long as prices are kept high enough through the crude oil production quotas, hindering efforts towards achieving supply-demand balance in the global oil market. This would cap upsides to global oil prices, even if the current production limits are extended beyond June this year. For 2017 as a whole, MAS’ baseline forecast is for the Brent oil benchmark to average US$53, about 20% higher than the average of US$44 last year. This projection assumes a relatively flat profile for oil prices in the months ahead. Nevertheless, in the short term, renewed uncertainties about the geopolitical situation in the Middle East and its impact on oil supply could inject some temporary volatility into global oil prices.
Chart 3.11 Overall Import Prices and Selected
Components
Chart 3.12 Global Brent Oil Prices
Source: Bloomberg
Chart 3.13
US Crude Oil Production and Number of Oil Rigs
Source: EIA and Baker Hughes
-100
-75
-50
-25
0
25
50
75
100
-20
-15
-10
-5
0
5
10
15
20
2014 2015 2016 2017Jan–Feb
% Y
OY
% Y
OY
Food &Live Animals
Overall IPI
Mineral Fuel (RHS)Animal & Veg
Oils (RHS)Misc Manufactures
Manufactured Gds
25
30
35
40
45
50
55
60
Nov Jan Mar May Jul Sep Nov Jan Mar
US$
Per
Bar
rel
Announcement of Production Quotas
2015 2016 2017Apr
0.3
0.6
0.9
1.2
1.5
1.8
2.1
8.0
8.3
8.6
8.9
9.2
9.5
9.8
2014 Jul 2015 Jul 2016 Jul 2017
Num
ber o
f Oil
Rigs
(Tho
usan
d)
Mill
ion
bpd
Mar
US Crude Oil Production
US Oil Rig Count (RHS)
OPEC Cuts Take Effect in Jan 2017
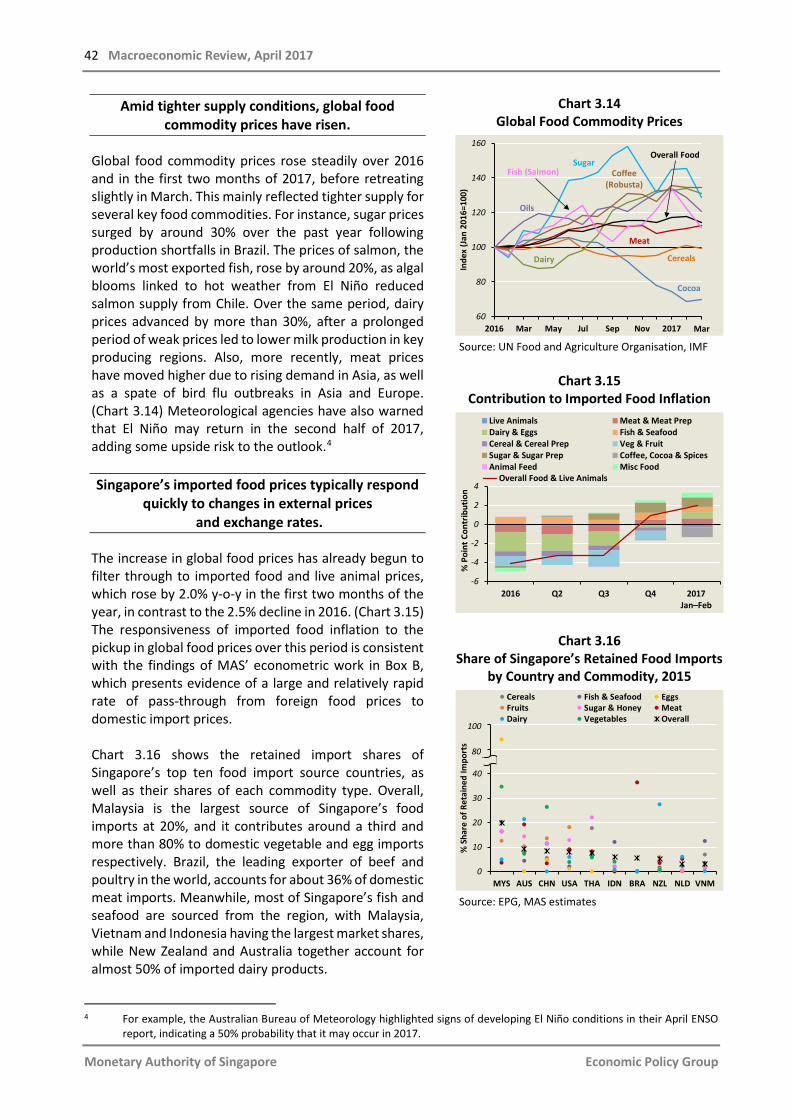
42 Macroeconomic Review, April 2017
Monetary Authority of Singapore Economic Policy Group
Amid tighter supply conditions, global food commodity prices have risen.
Global food commodity prices rose steadily over 2016 and in the first two months of 2017, before retreating slightly in March. This mainly reflected tighter supply for several key food commodities. For instance, sugar prices surged by around 30% over the past year following production shortfalls in Brazil. The prices of salmon, the world’s most exported fish, rose by around 20%, as algal blooms linked to hot weather from El Niño reduced salmon supply from Chile. Over the same period, dairy prices advanced by more than 30%, after a prolonged period of weak prices led to lower milk production in key producing regions. Also, more recently, meat prices have moved higher due to rising demand in Asia, as well as a spate of bird flu outbreaks in Asia and Europe. (Chart 3.14) Meteorological agencies have also warned that El Niño may return in the second half of 2017, adding some upside risk to the outlook.4 Singapore’s imported food prices typically respond
quickly to changes in external prices and exchange rates.
The increase in global food prices has already begun to filter through to imported food and live animal prices, which rose by 2.0% y-o-y in the first two months of the year, in contrast to the 2.5% decline in 2016. (Chart 3.15) The responsiveness of imported food inflation to the pickup in global food prices over this period is consistent with the findings of MAS’ econometric work in Box B, which presents evidence of a large and relatively rapid rate of pass-through from foreign food prices to domestic import prices. Chart 3.16 shows the retained import shares of Singapore’s top ten food import source countries, as well as their shares of each commodity type. Overall, Malaysia is the largest source of Singapore’s food imports at 20%, and it contributes around a third and more than 80% to domestic vegetable and egg imports respectively. Brazil, the leading exporter of beef and poultry in the world, accounts for about 36% of domestic meat imports. Meanwhile, most of Singapore’s fish and seafood are sourced from the region, with Malaysia, Vietnam and Indonesia having the largest market shares, while New Zealand and Australia together account for almost 50% of imported dairy products.
Chart 3.14 Global Food Commodity Prices
Source: UN Food and Agriculture Organisation, IMF
Chart 3.15
Contribution to Imported Food Inflation
Chart 3.16 Share of Singapore’s Retained Food Imports
by Country and Commodity, 2015
Source: EPG, MAS estimates
4 For example, the Australian Bureau of Meteorology highlighted signs of developing El Niño conditions in their April ENSO
report, indicating a 50% probability that it may occur in 2017.
2016 Mar May Jul Sep Nov 201760
80
100
120
140
160
Inde
x (J
an 2
016=
100)
Cocoa
Meat
Dairy Cereals
Oils
SugarOverall Food
Coffee(Robusta)
Fish (Salmon)
Mar
2016 Q2 Q3 Q4 2017Jan–Feb
-6
-4
-2
0
2
4
% P
oint
Con
trib
utio
n
Live Animals Meat & Meat PrepDairy & Eggs Fish & SeafoodCereal & Cereal Prep Veg & FruitSugar & Sugar Prep Coffee, Cocoa & SpicesAnimal Feed Misc Food
Overall Food & Live Animals
0
10
20
30
40
50
60
MYS AUS CHN USA THA IDN BRA NZL NLD VNM
% S
hare
of R
etai
ned
Impo
rts
Cereals Fish & Seafood EggsFruits Sugar & Honey MeatDairy Vegetables Overall
100
80
Labour Market and Inflation 43
Monetary Authority of Singapore Economic Policy Group
Since Q2 2016, import prices of sugar, fish and seafood, meat and dairy and eggs have increased significantly (Chart 3.17). Chart 3.18 shows the changes in food prices in various countries, as well as their bilateral currency movements against the S$. As can be seen from the first four bars, the price increase of the items above likely reflected a combination of strong price increases in Singapore’s main import sources, such as Brazil (meat), New Zealand (dairy), Indonesia (fish & seafood), and Australia (meat, dairy, sugar), as well as the depreciation of the S$ against their currencies. In comparison, the strengthening of the S$ against the Malaysian ringgit would have offset the increase in the country’s food prices.
However, higher import costs are passed on to consumer food prices more gradually.
Despite higher imported food prices, consumer prices for food items and services have been relatively benign over the past few months. Non-cooked food inflation moderated to 1.3% y-o-y in Q1 2017 from 2.3% in Q4 2016, reflecting a milder-than-usual seasonal pickup in food prices during the Chinese New Year festive period this year, as well as a high base in the previous year due to weather-related disruptions to the supply of perishable food items. Price increases of prepared meals also eased to 1.6% in Q1 2017, from 1.8% in Q4 2016, mainly reflecting the decline in sentiment-sensitive restaurant food inflation. Meanwhile, price increases for hawker food remained stable at 1.7%. (Chart 3.19) Based on the findings presented in Box B, the transmission of a change in imported food prices to consumer prices tends to be fairly drawn-out, with the adjustment process taking place over several years. The extent of pass-through to consumer prices is also found to be cyclical, with retailers more likely to delay passing on an increase in costs when demand conditions are less robust. This may explain why food inflation has been relatively stable so far despite higher import costs. However, consumer prices of food could pick up in the coming quarters, especially if demand conditions improve. For 2017 as a whole, overall food inflation is forecast to average around 2% y-o-y, compared to 2.1% in 2016, with the lower year-ago increase largely reflecting the high base in the previous year.
Chart 3.17 Components of Imported Food Prices
Chart 3.18 Changes in Foreign Food Prices in Foreign and Domestic Currency and S$ Bilateral
Exchange Rates
Source: Haver Analytics and EPG, MAS estimates Note: Foreign prices for food items refer to food export prices, where available. In the absence of export data, producer or wholesale price indices were used instead.
Chart 3.19
Components of Food Inflation
Veg & Fruit
2015 Q2 Q3 Q4 2016 Q2 Q3 Q4 201780
90
100
110
120
Inde
x (Q
1 20
15=1
00)
Dairy & Eggs
Meat
Sugar & Sugar Prep
Fish & Seafood Coffee, Cocoa& Spices
Overall Food & Live Animals
Cereal & Cereal Prep
Jan–Feb
BRA NZL IDN AUS NLD VNM THA USA CHN MYR-4
0
4
8
12
16
20%
Cha
nge
(Q2
2016
–Q
4 20
16)
Bilateral Exchange Rate (S$ per Foreign Currency)Foreign Food Prices (Foreign Currency)Foreign Food Prices (S$)
0.0
0.5
1.0
1.5
2.0
2.5
3.0
3.5
4.0
2016 Mar May Jul Sep Nov 2017 Mar
% Y
OY
Non-cooked Food
Fast Food
Hawker Food Restaurant Food
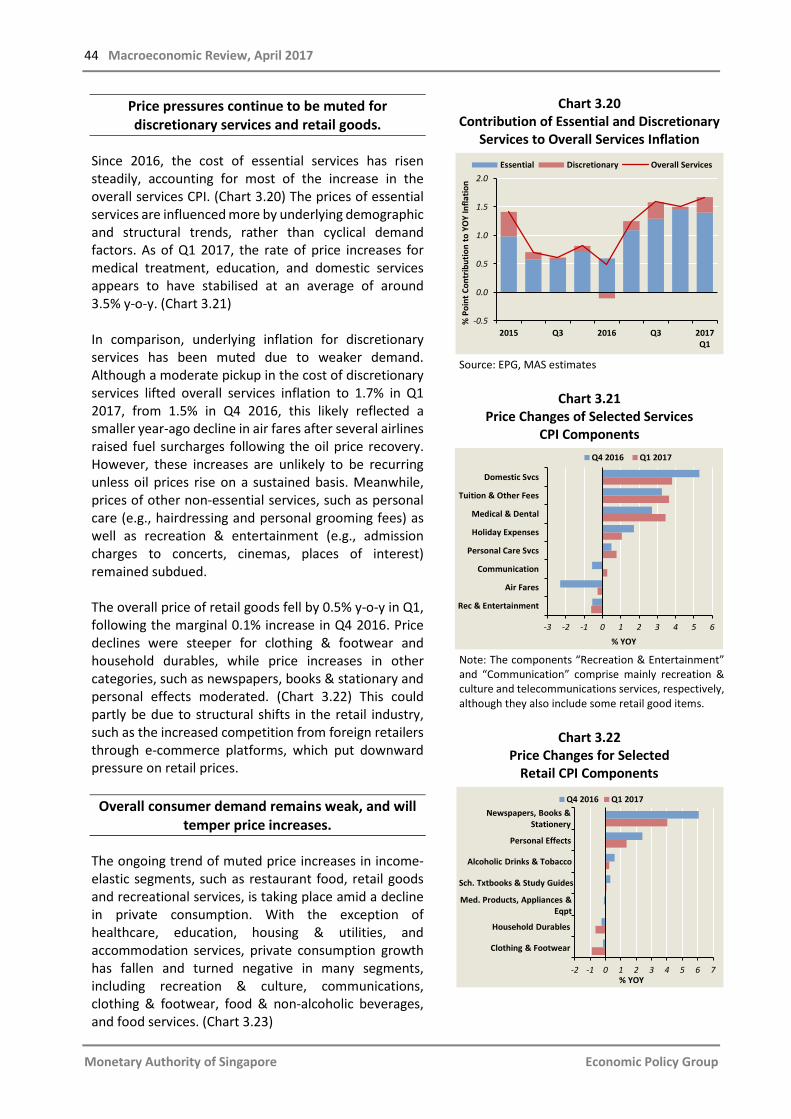
44 Macroeconomic Review, April 2017
Monetary Authority of Singapore Economic Policy Group
Price pressures continue to be muted for discretionary services and retail goods.
Since 2016, the cost of essential services has risen steadily, accounting for most of the increase in the overall services CPI. (Chart 3.20) The prices of essential services are influenced more by underlying demographic and structural trends, rather than cyclical demand factors. As of Q1 2017, the rate of price increases for medical treatment, education, and domestic services appears to have stabilised at an average of around 3.5% y-o-y. (Chart 3.21) In comparison, underlying inflation for discretionary services has been muted due to weaker demand. Although a moderate pickup in the cost of discretionary services lifted overall services inflation to 1.7% in Q1 2017, from 1.5% in Q4 2016, this likely reflected a smaller year-ago decline in air fares after several airlines raised fuel surcharges following the oil price recovery. However, these increases are unlikely to be recurring unless oil prices rise on a sustained basis. Meanwhile, prices of other non-essential services, such as personal care (e.g., hairdressing and personal grooming fees) as well as recreation & entertainment (e.g., admission charges to concerts, cinemas, places of interest) remained subdued. The overall price of retail goods fell by 0.5% y-o-y in Q1, following the marginal 0.1% increase in Q4 2016. Price declines were steeper for clothing & footwear and household durables, while price increases in other categories, such as newspapers, books & stationary and personal effects moderated. (Chart 3.22) This could partly be due to structural shifts in the retail industry, such as the increased competition from foreign retailers through e-commerce platforms, which put downward pressure on retail prices.
Overall consumer demand remains weak, and will temper price increases.
The ongoing trend of muted price increases in income-elastic segments, such as restaurant food, retail goods and recreational services, is taking place amid a decline in private consumption. With the exception of healthcare, education, housing & utilities, and accommodation services, private consumption growth has fallen and turned negative in many segments, including recreation & culture, communications, clothing & footwear, food & non-alcoholic beverages, and food services. (Chart 3.23)
Chart 3.20 Contribution of Essential and Discretionary
Services to Overall Services Inflation
Source: EPG, MAS estimates
Chart 3.21
Price Changes of Selected Services CPI Components
Note: The components “Recreation & Entertainment” and “Communication” comprise mainly recreation & culture and telecommunications services, respectively, although they also include some retail good items.
Chart 3.22
Price Changes for Selected Retail CPI Components
2015 Q3 2016 Q3 2017Q1
-0.5
0.0
0.5
1.0
1.5
2.0
% P
oint
Con
trib
utio
n to
YO
Y In
flatio
n
Essential Discretionary Overall Services
Rec & Entertainment
Air Fares
Communication
Personal Care Svcs
Holiday Expenses
Medical & Dental
Tuition & Other Fees
Domestic Svcs
-3 -2 -1 0 1 2 3 4 5 6% YOY
Q4 2016 Q1 2017
-2 -1 0 1 2 3 4 5 6 7% YOY
Q4 2016 Q1 2017Newspapers, Books &
Stationery
Personal Effects
Alcoholic Drinks & Tobacco
Sch. Txtbooks & Study Guides
Clothing & Footwear
Med. Products, Appliances & Eqpt
Household Durables
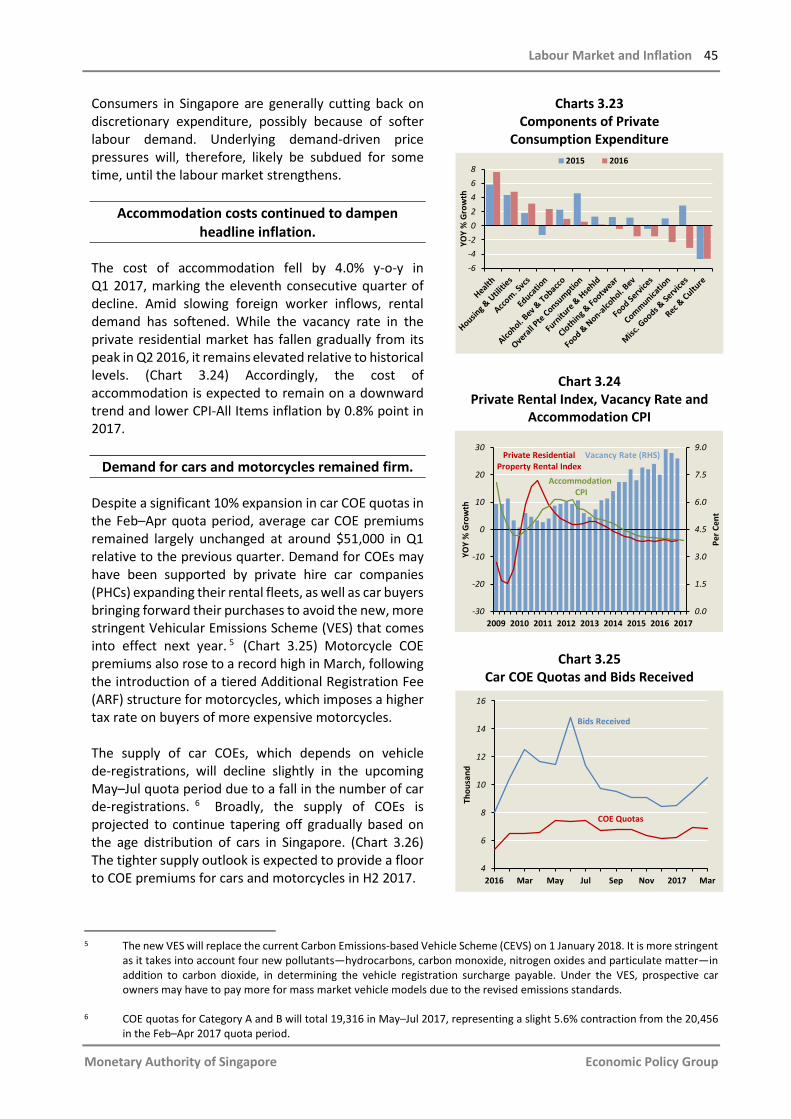
Labour Market and Inflation 45
Monetary Authority of Singapore Economic Policy Group
Consumers in Singapore are generally cutting back on discretionary expenditure, possibly because of softer labour demand. Underlying demand-driven price pressures will, therefore, likely be subdued for some time, until the labour market strengthens.
Accommodation costs continued to dampen headline inflation.
The cost of accommodation fell by 4.0% y-o-y in Q1 2017, marking the eleventh consecutive quarter of decline. Amid slowing foreign worker inflows, rental demand has softened. While the vacancy rate in the private residential market has fallen gradually from its peak in Q2 2016, it remains elevated relative to historical levels. (Chart 3.24) Accordingly, the cost of accommodation is expected to remain on a downward trend and lower CPI-All Items inflation by 0.8% point in 2017.
Demand for cars and motorcycles remained firm.
Despite a significant 10% expansion in car COE quotas in the Feb–Apr quota period, average car COE premiums remained largely unchanged at around $51,000 in Q1 relative to the previous quarter. Demand for COEs may have been supported by private hire car companies (PHCs) expanding their rental fleets, as well as car buyers bringing forward their purchases to avoid the new, more stringent Vehicular Emissions Scheme (VES) that comes into effect next year. 5 (Chart 3.25) Motorcycle COE premiums also rose to a record high in March, following the introduction of a tiered Additional Registration Fee (ARF) structure for motorcycles, which imposes a higher tax rate on buyers of more expensive motorcycles. The supply of car COEs, which depends on vehicle de-registrations, will decline slightly in the upcoming May–Jul quota period due to a fall in the number of car de-registrations. 6 Broadly, the supply of COEs is projected to continue tapering off gradually based on the age distribution of cars in Singapore. (Chart 3.26) The tighter supply outlook is expected to provide a floor to COE premiums for cars and motorcycles in H2 2017.
Charts 3.23 Components of Private
Consumption Expenditure
Chart 3.24 Private Rental Index, Vacancy Rate and
Accommodation CPI
Chart 3.25 Car COE Quotas and Bids Received
5 The new VES will replace the current Carbon Emissions-based Vehicle Scheme (CEVS) on 1 January 2018. It is more stringent
as it takes into account four new pollutants—hydrocarbons, carbon monoxide, nitrogen oxides and particulate matter—in addition to carbon dioxide, in determining the vehicle registration surcharge payable. Under the VES, prospective car owners may have to pay more for mass market vehicle models due to the revised emissions standards.
6 COE quotas for Category A and B will total 19,316 in May–Jul 2017, representing a slight 5.6% contraction from the 20,456
in the Feb–Apr 2017 quota period.
-6-4-202468
YOY
% G
row
th
2015 2016
2009 2010 2011 2012 2013 2014 2015 2016 20170.0
1.5
3.0
4.5
6.0
7.5
9.0
-30
-20
-10
0
10
20
30
Per C
ent
YOY
% G
row
thPrivate Residential
Property Rental IndexAccommodation
CPI
Vacancy Rate (RHS)
2016 Mar May Jul Sep Nov 2017 Mar4
6
8
10
12
14
16
Thou
sand
Bids Received
COE Quotas
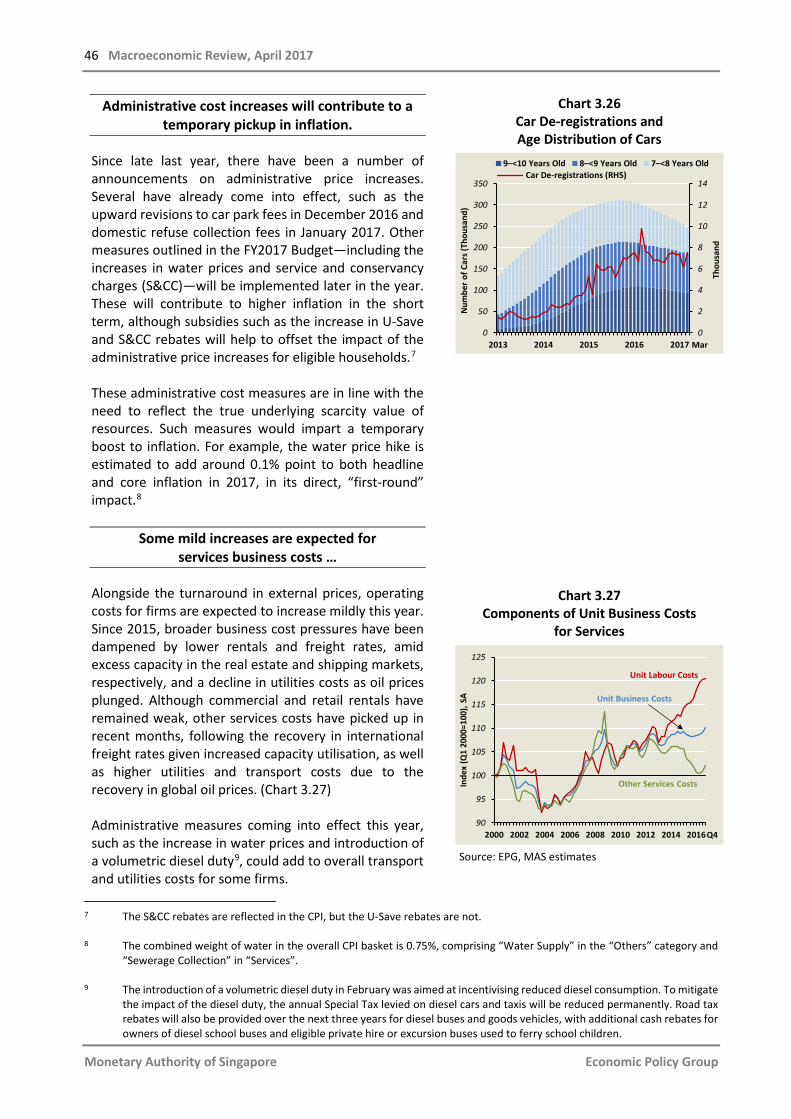
46 Macroeconomic Review, April 2017
Monetary Authority of Singapore Economic Policy Group
Administrative cost increases will contribute to a temporary pickup in inflation.
Since late last year, there have been a number of announcements on administrative price increases. Several have already come into effect, such as the upward revisions to car park fees in December 2016 and domestic refuse collection fees in January 2017. Other measures outlined in the FY2017 Budget—including the increases in water prices and service and conservancy charges (S&CC)—will be implemented later in the year. These will contribute to higher inflation in the short term, although subsidies such as the increase in U-Save and S&CC rebates will help to offset the impact of the administrative price increases for eligible households.7 These administrative cost measures are in line with the need to reflect the true underlying scarcity value of resources. Such measures would impart a temporary boost to inflation. For example, the water price hike is estimated to add around 0.1% point to both headline and core inflation in 2017, in its direct, “first-round” impact.8
Some mild increases are expected for services business costs …
Alongside the turnaround in external prices, operating costs for firms are expected to increase mildly this year. Since 2015, broader business cost pressures have been dampened by lower rentals and freight rates, amid excess capacity in the real estate and shipping markets, respectively, and a decline in utilities costs as oil prices plunged. Although commercial and retail rentals have remained weak, other services costs have picked up in recent months, following the recovery in international freight rates given increased capacity utilisation, as well as higher utilities and transport costs due to the recovery in global oil prices. (Chart 3.27) Administrative measures coming into effect this year, such as the increase in water prices and introduction of a volumetric diesel duty9, could add to overall transport and utilities costs for some firms.
Chart 3.26 Car De-registrations and Age Distribution of Cars
Chart 3.27
Components of Unit Business Costs for Services
Source: EPG, MAS estimates
7 The S&CC rebates are reflected in the CPI, but the U-Save rebates are not. 8 The combined weight of water in the overall CPI basket is 0.75%, comprising “Water Supply” in the “Others” category and
“Sewerage Collection” in “Services”. 9 The introduction of a volumetric diesel duty in February was aimed at incentivising reduced diesel consumption. To mitigate
the impact of the diesel duty, the annual Special Tax levied on diesel cars and taxis will be reduced permanently. Road tax rebates will also be provided over the next three years for diesel buses and goods vehicles, with additional cash rebates for owners of diesel school buses and eligible private hire or excursion buses used to ferry school children.
0
2
4
6
8
10
12
14
0
50
100
150
200
250
300
350
2013 2014 2015 2016 2017
Thou
sand
Num
ber o
f Car
s (Th
ousa
nd)
Mar
9–<10 Years Old 8–<9 Years Old 7–<8 Years OldCar De-registrations (RHS)
90
95
100
105
110
115
120
125
2000 2002 2004 2006 2008 2010 2012 2014 2016
Inde
x (Q
1 20
00=1
00),
SA Unit Business Costs
Unit Labour Costs
Other Services Costs
Q4
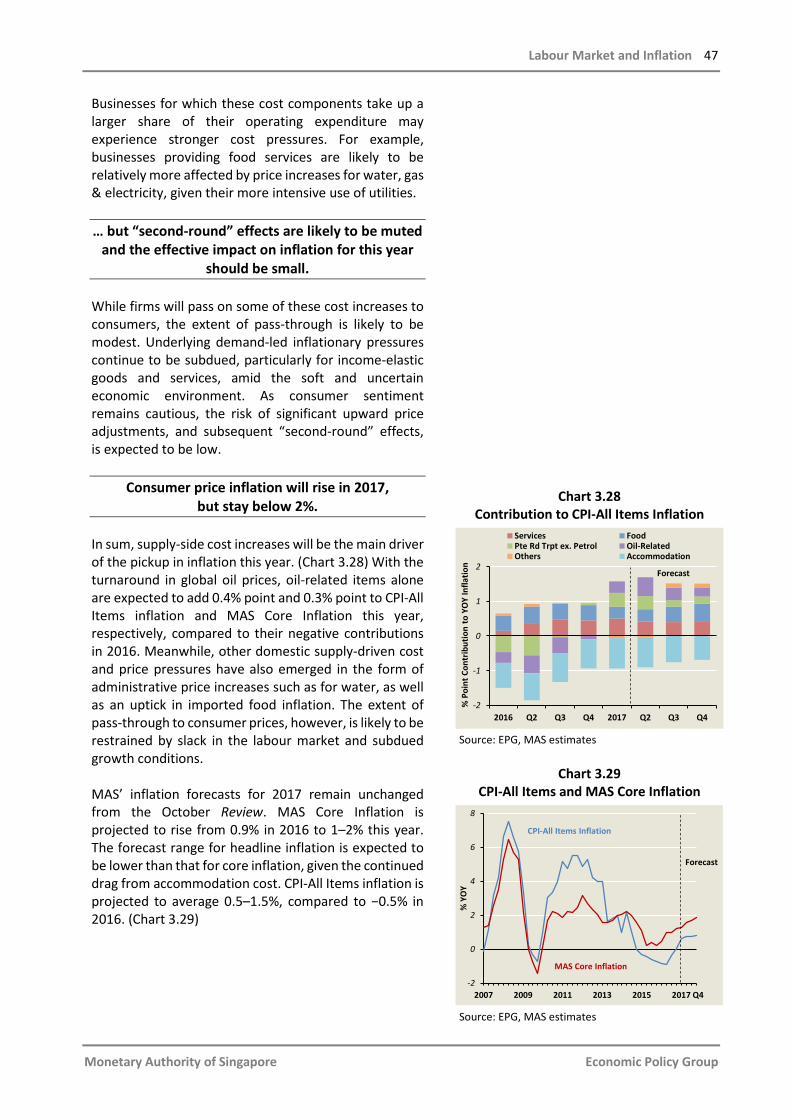
Labour Market and Inflation 47
Monetary Authority of Singapore Economic Policy Group
Businesses for which these cost components take up a larger share of their operating expenditure may experience stronger cost pressures. For example, businesses providing food services are likely to be relatively more affected by price increases for water, gas & electricity, given their more intensive use of utilities. … but “second-round” effects are likely to be muted
and the effective impact on inflation for this year should be small.
While firms will pass on some of these cost increases to consumers, the extent of pass-through is likely to be modest. Underlying demand-led inflationary pressures continue to be subdued, particularly for income-elastic goods and services, amid the soft and uncertain economic environment. As consumer sentiment remains cautious, the risk of significant upward price adjustments, and subsequent “second-round” effects, is expected to be low.
Consumer price inflation will rise in 2017, but stay below 2%.
In sum, supply-side cost increases will be the main driver of the pickup in inflation this year. (Chart 3.28) With the turnaround in global oil prices, oil-related items alone are expected to add 0.4% point and 0.3% point to CPI-All Items inflation and MAS Core Inflation this year, respectively, compared to their negative contributions in 2016. Meanwhile, other domestic supply-driven cost and price pressures have also emerged in the form of administrative price increases such as for water, as well as an uptick in imported food inflation. The extent of pass-through to consumer prices, however, is likely to be restrained by slack in the labour market and subdued growth conditions. MAS’ inflation forecasts for 2017 remain unchanged from the October Review. MAS Core Inflation is projected to rise from 0.9% in 2016 to 1–2% this year. The forecast range for headline inflation is expected to be lower than that for core inflation, given the continued drag from accommodation cost. CPI-All Items inflation is projected to average 0.5–1.5%, compared to −0.5% in 2016. (Chart 3.29)
Chart 3.28 Contribution to CPI-All Items Inflation
Source: EPG, MAS estimates
Chart 3.29
CPI-All Items and MAS Core Inflation
Source: EPG, MAS estimates
2016 Q2 Q3 Q4 2017 Q2 Q3 Q4-2
-1
0
1
2
% P
oint
Con
trib
utio
n to
YO
Y In
flatio
n
Services FoodPte Rd Trpt ex. Petrol Oil-RelatedOthers Accommodation
Forecast
2007 2009 2011 2013 2015 2017-2
0
2
4
6
8
% Y
OY
CPI-All Items Inflation
MAS Core Inflation
Q4
Forecast
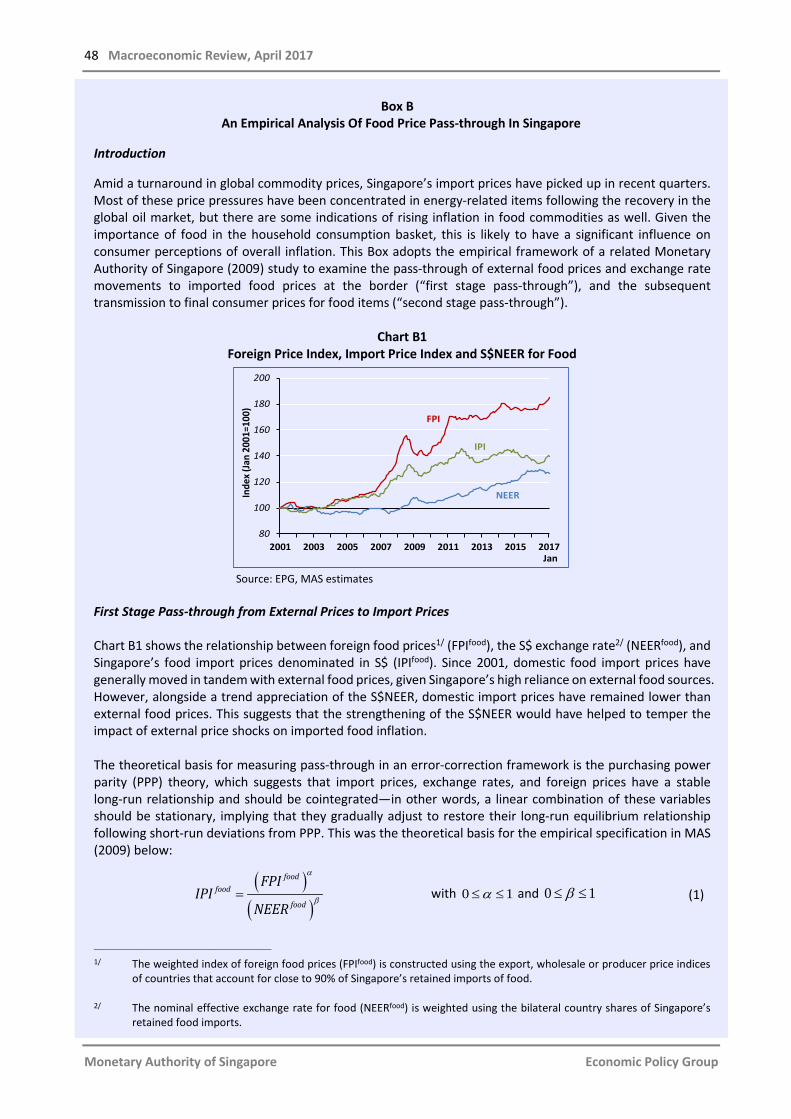
48 Macroeconomic Review, April 2017
Monetary Authority of Singapore Economic Policy Group
Box B An Empirical Analysis Of Food Price Pass-through In Singapore
Introduction Amid a turnaround in global commodity prices, Singapore’s import prices have picked up in recent quarters. Most of these price pressures have been concentrated in energy-related items following the recovery in the global oil market, but there are some indications of rising inflation in food commodities as well. Given the importance of food in the household consumption basket, this is likely to have a significant influence on consumer perceptions of overall inflation. This Box adopts the empirical framework of a related Monetary Authority of Singapore (2009) study to examine the pass-through of external food prices and exchange rate movements to imported food prices at the border (“first stage pass-through”), and the subsequent transmission to final consumer prices for food items (“second stage pass-through”).
Chart B1 Foreign Price Index, Import Price Index and S$NEER for Food
Source: EPG, MAS estimates
First Stage Pass-through from External Prices to Import Prices Chart B1 shows the relationship between foreign food prices1/ (FPIfood), the S$ exchange rate2/ (NEERfood), and Singapore’s food import prices denominated in S$ (IPIfood). Since 2001, domestic food import prices have generally moved in tandem with external food prices, given Singapore’s high reliance on external food sources. However, alongside a trend appreciation of the S$NEER, domestic import prices have remained lower than external food prices. This suggests that the strengthening of the S$NEER would have helped to temper the impact of external price shocks on imported food inflation. The theoretical basis for measuring pass-through in an error-correction framework is the purchasing power parity (PPP) theory, which suggests that import prices, exchange rates, and foreign prices have a stable long-run relationship and should be cointegrated—in other words, a linear combination of these variables should be stationary, implying that they gradually adjust to restore their long-run equilibrium relationship following short-run deviations from PPP. This was the theoretical basis for the empirical specification in MAS (2009) below:
( )( )
α
β=food
food
food
FPIIPI
NEER with 0 1α≤ ≤ and 0 1β≤ ≤ (1)
___________________________________________________________________
1/ The weighted index of foreign food prices (FPIfood) is constructed using the export, wholesale or producer price indices of countries that account for close to 90% of Singapore’s retained imports of food.
2/ The nominal effective exchange rate for food (NEERfood) is weighted using the bilateral country shares of Singapore’s
retained food imports.
2001 2003 2005 2007 2009 2011 2013 2015 201780
100
120
140
160
180
200
Inde
x (Ja
n 20
01=1
00)
Jan
IPI
NEER
FPI
Labour Market and Inflation 49
Monetary Authority of Singapore Economic Policy Group
A logarithmic transformation can be applied to equation (1) to obtain:
φ α λ= + +food food foodt t tipi fpi neer
with λ β= − , 0 1α≤ ≤ and 0 1β≤ ≤
(2)
where variables in lowercase denote logarithms, and α and 𝜆𝜆 refer to the elasticities of import prices with respect to foreign food prices and the exchange rate, respectively. A markup in percentage terms for the exporting firm, 𝜙𝜙 , is also added. Specifically, the analysis seeks to determine if the pass-through from movements in foreign food prices and the exchange rate into domestic food import prices is complete in the long run, i.e., 𝛼𝛼 = 1 and 𝜆𝜆 = −1. After statistical tests confirmed the presence of a cointegrating relationship, an error-correction model was specified to capture both the rate of long-run pass-through and the short-run adjustment dynamics of the three variables. The results show that the pass-through from exchange rates to food import prices is significant, but incomplete in the long run. An appreciation of the S$NEER by 1% was found to reduce food import prices by 0.63% in the long run, implying only partial exchange rate pass-through to food import prices, compared to the complete pass-through for overall import prices found in MAS (2009).3/ One possible explanation is the prevalence of local currency pricing, whereby exporters set prices based on the currencies and prevailing conditions in their respective export markets. Given that the invoicing currency is likely to be a good proxy for the currency in which exports are priced, Gopinath (2016) shows that goods invoiced in a foreign currency tend to have higher pass-through to domestic currency prices as compared to goods invoiced in the home currency. Although there is no available data on the currency of invoicing of Singapore’s imports to empirically estimate this effect, anecdotal feedback from food wholesalers indicates that they trade mainly in the Singapore dollar as it is a stronger and more stable currency vis-à-vis other regional currencies.4/ In addition, incomplete pass-through of exchange rate movements to import prices at the border may also result from long-term hedging contracts by importers. This helps firms reduce exposure to fluctuations in the exchange rate, which may allow firms to delay—and possibly avoid—passing on exchange rate movements to prices. Similarly, the pass-through of foreign food prices to domestic import prices for food was also incomplete in the long run. However, the estimated long-run coefficient was larger than that for the exchange rate pass-through. For a 1% increase in foreign food prices, food import prices increase by 0.86%, with the relatively large coefficient likely reflecting Singapore’s role as a price-taker for food in international markets. Incomplete pass-through of foreign food prices could arguably reflect compositional differences between the baskets of goods captured in the foreign price index and each source country’s exports to Singapore. The estimated long-run equation (2) was then embedded within an error-correction model to capture the short-run dynamics of domestic import prices. The estimation results indicate that the effects of changes in the exchange rate and foreign prices are fully passed on to domestic import prices within a year. A 1% appreciation in the exchange rate filters through fairly rapidly to domestic food import prices—import prices fall by 0.32% in the initial quarter, with the full 0.63% achieved by the end of the first year. In comparison, a 1% increase in foreign food prices causes domestic food import prices to rise by 0.18% in the initial quarter, and the long-run impact of 0.86% is achieved by the fourth quarter.
___________________________________________________________________
3/ The magnitude of pass-through from exchange rate movements to food import prices is comparable to other estimates in the literature. For example, Campa and Goldberg (2005) estimate the extent of exchange rate pass-through into the food import prices of 23 OECD countries using an autoregressive distributed lag (ARDL) model. The average long-run pass-through elasticity across countries is 0.65, similar to our estimates.
4/ For example, in a Straits Times article published on 27 June 2015, several wholesalers were quoted as saying that they
traded mainly in the Singapore dollar due to its strength and stability relative to the Malaysian ringgit.
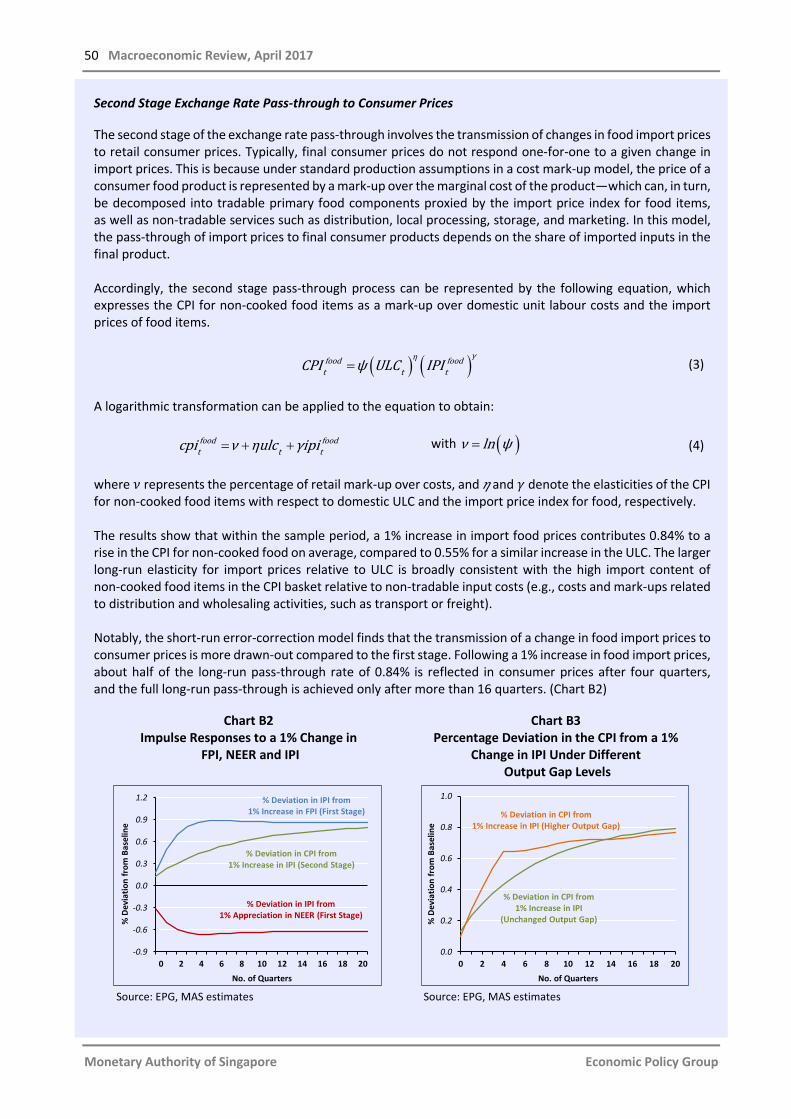
50 Macroeconomic Review, April 2017
Monetary Authority of Singapore Economic Policy Group
Second Stage Exchange Rate Pass-through to Consumer Prices The second stage of the exchange rate pass-through involves the transmission of changes in food import prices to retail consumer prices. Typically, final consumer prices do not respond one-for-one to a given change in import prices. This is because under standard production assumptions in a cost mark-up model, the price of a consumer food product is represented by a mark-up over the marginal cost of the product—which can, in turn, be decomposed into tradable primary food components proxied by the import price index for food items, as well as non-tradable services such as distribution, local processing, storage, and marketing. In this model, the pass-through of import prices to final consumer products depends on the share of imported inputs in the final product. Accordingly, the second stage pass-through process can be represented by the following equation, which expresses the CPI for non-cooked food items as a mark-up over domestic unit labour costs and the import prices of food items.
( ) ( )=γηfood food
t t tCPI ψ ULC IPI (3)
A logarithmic transformation can be applied to the equation to obtain:
= + +food foodt t tcpi ν ηulc γipi with ( )=ν ln ψ (4)
where 𝜈𝜈 represents the percentage of retail mark-up over costs, and 𝜂𝜂 and 𝛾𝛾 denote the elasticities of the CPI for non-cooked food items with respect to domestic ULC and the import price index for food, respectively. The results show that within the sample period, a 1% increase in import food prices contributes 0.84% to a rise in the CPI for non-cooked food on average, compared to 0.55% for a similar increase in the ULC. The larger long-run elasticity for import prices relative to ULC is broadly consistent with the high import content of non-cooked food items in the CPI basket relative to non-tradable input costs (e.g., costs and mark-ups related to distribution and wholesaling activities, such as transport or freight). Notably, the short-run error-correction model finds that the transmission of a change in food import prices to consumer prices is more drawn-out compared to the first stage. Following a 1% increase in food import prices, about half of the long-run pass-through rate of 0.84% is reflected in consumer prices after four quarters, and the full long-run pass-through is achieved only after more than 16 quarters. (Chart B2)
Chart B2 Impulse Responses to a 1% Change in
FPI, NEER and IPI
Chart B3 Percentage Deviation in the CPI from a 1%
Change in IPI Under Different Output Gap Levels
Source: EPG, MAS estimates Source: EPG, MAS estimates
0 2 4 6 8 10 12 14 16 18 20-0.9
-0.6
-0.3
0.0
0.3
0.6
0.9
1.2
% D
evia
tion
from
Bas
elin
e
No. of Quarters
% Deviation in IPI from1% Increase in FPI (First Stage)
% Deviation in IPI from 1% Appreciation in NEER (First Stage)
% Deviation in CPI from 1% Increase in IPI (Second Stage)
0.0
0.2
0.4
0.6
0.8
1.0
0 2 4 6 8 10 12 14 16 18 20
% D
evia
tion
from
Bas
elin
e
No. of Quarters
% Deviation in CPI from 1% Increase in IPI (Higher Output Gap)
% Deviation in CPI from 1% Increase in IPI
(Unchanged Output Gap)
Labour Market and Inflation 51
Monetary Authority of Singapore Economic Policy Group
One possible explanation for the slow adjustment of consumer prices to changes in food import prices could be the extended distribution network. Imports are first purchased by wholesalers who, in turn, distribute them to other wholesalers or retailers. At each level of the supply chain, firms face different competitive conditions which, in turn, affects their mark-ups and pricing decisions.5/ Strategic interactions between firms could lower cost pass-through as firms are unwilling to adjust prices immediately in response to a cost shock for fear of losing market share, and may instead opt to adjust their profit margins. Other possible reasons include frictions associated with changing prices, as well as fixed-term contracts which insulate retailers from short-run fluctuations in import prices, or limit their ability to immediately pass on an increase in costs. Collectively, these factors are likely to attenuate the speed of pass-through at the second stage. To capture the cyclical behaviour of pass-through to consumer prices, the output gap and changes in its level were included in the set of explanatory variables in the short-run error correction model. There is evidence that both the level and change in the output gap affect domestic inflation outcomes for non-cooked food items, with the signs of the estimated coefficients suggesting that retailers appear to pass on import cost increases more quickly to consumers when economic growth is strong. However, this is slightly more muted for food items, as compared to the aggregate estimates published in MAS (2009). Chart B3 shows the simulated path of adjustment, when a similar 1% increase in the IPI coincides with a higher output gap level in the first year (of +1% of potential GDP). Sum-up An appreciation of the S$NEER helps to temper external food price pressures at the borders, by lowering food import prices by close to 30% in the immediate period, and 63% in the long run. Meanwhile, given Singapore’s role as a price taker for food, the pass-through of global food price changes to import prices is relatively high, at about 86% in the long run. However, local currency pricing for certain food imports from the region may imply that some import prices are relatively insensitive to an appreciation of the S$NEER. In view of the high import content of non-cooked food items in the CPI basket, the long-run elasticity of final consumer food prices to a change in imported food prices is higher than for non-tradable labour costs. In the long run, a 1% rise in import prices of food would result in a 0.84% increase in the non-cooked food CPI. However, changes in import prices filter to consumer prices with a delay, and the full pass-through is achieved only after several years. The speed of pass-through is also found to depend on demand conditions, with retailers less likely to fully pass on cost increases when there is greater slack in the economy. References Campa, J and Goldberg, L (2005), “Exchange Rate Pass-through into Import Prices”, Review of Economics and Statistics, Vol. 87(4), pp. 679–690. Gopinath, G (2016), “The International Price System.” Jackson Hole Symposium Proceedings, NBER Digest, January 2016. Hong, G H, and Li, N (2017), "Market Structure and Cost Pass-through in Retail", Review of Economics and Statistics, Vol. 99(1), pp. 151–166. Monetary Authority of Singapore (2009), “An Empirical Analysis of Exchange Rate Pass-Through in Singapore”, by Chew, J, Ouliaris, S and Tan, S M, MAS Staff Paper No. 50.
___________________________________________________________________
5/ A recent paper by Hong and Li (2017) examines pass-through from commodity to retail prices in the US using product-level scanner data. The authors find evidence that vertical integration contributes to higher cost pass-through as it reduces the incidence of double-marginalisation, i.e., how firms across different stages of the supply chain apply their own mark-ups to their output.

Chapter4MacroeconomicPolicy
54 Macroeconomic Review, April 2017
Monetary Authority of Singapore Economic Policy Group
4 Macroeconomic Policy
Keeping The Economy On An Even Keel
In April 2017, MAS kept the slope of the S$NEER policy band at 0%. Amid the pickup in global demand, Singapore’s GDP growth in 2017 as a whole is not expected to be markedly different from 2016. Although core inflation is projected to rise this year, its increase will be restrained and it is still expected to average slightly below 2% in the outer years. MAS has thus assessed that maintaining a neutral policy stance for an extended period is appropriate to ensure medium-term price stability. As in last year’s Budget, Budget 2017 continued to provide near-term relief measures for households and firms, but did so in a targeted fashion to provide the necessary support to the most vulnerable. At the same time, a large number of measures included in the Budget were aimed at implementing the recommendations of the Committee on the Future Economy (CFE) to enable Singapore’s next phase of development. Overall, the fiscal policy stance is estimated to be mildly positive for CY2017. Overall, this macroeconomic policy mix is assessed to be appropriate and in line with a continued, steady, expansion of the economy towards its potential growth rate.
Macroeconomic Policy 55
Monetary Authority of Singapore Economic Policy Group
4.1 Monetary Policy
Maintaining The Neutral Policy Stance
Global economic activity has improved since the last policy review, on the back of a gradual recovery in global trade and investment. This will provide some support to Singapore’s trade-related clusters in 2017, although the spillover to other sectors in the economy is expected to be uneven. Overall, GDP growth this year will be modest, and not markedly different from that in 2016. Continued slack in the labour market, declining business rents, as well as weak economic sentiment, indicate that demand-driven inflationary pressures will be restrained. While inflation will rise in 2017 because of higher oil prices and the temporary effects of domestic administrative price adjustments, MAS Core Inflation is still projected to average slightly below 2% in the medium term. Accordingly, in April 2017, MAS maintained the slope of the S$NEER policy band at 0%, with no change to the width of the band or the level at which it was centred. A neutral policy stance for an extended period was assessed to be appropriate for ensuring medium-term price stability, as indicated in the October 2016 review. Maintaining the 0% slope of the S$NEER policy
band is appropriate for an extended period.
In the October 2016 policy review, the global economy was envisaged to grow at a stable and moderate pace, even as uncertainty over Brexit and the US presidential election mounted. Global investment demand, which had hitherto been muted, was expected to remain tepid while the prospects for regional trade were subdued. Accordingly, Singapore’s externally-oriented sectors, which are more closely linked to the investment cycle and therefore more exposed to the underperforming industries in global manufacturing, were expected to weigh on the domestic economy. Projections then suggested that GDP growth was unlikely to pick up significantly in 2017. However, since the October review, the underlying growth momentum in Singapore’s major trading partners has firmed. In particular, the troughing of oil prices, a turnaround in the IT cycle, and an incipient investment upswing have paved the way for a nascent recovery in global manufacturing and trade. Manufacturing PMIs in the G3 and China are at their highest levels since 2011 and 2014, respectively, while world trade volumes have risen since last November. The outlook for the global economy has therefore improved, even as downside risks remain due to elevated policy uncertainty and the threat of trade protectionism. In the US, the robust labour market
will undergird household demand and GDP growth, while economic activity in the other major economies, such as the Eurozone and China, will be supported by domestic spending. These factors should provide the impetus for a more self-sustaining global recovery for the rest of this year, with positive spillovers to the export-oriented Asian economies, including Singapore. Against this backdrop, activity in Singapore’s externally-oriented sectors saw a step-up in Q4 2016, driven by financial services and the manufacturing sector—principally the electronics, precision engineering, and biomedical clusters. In Q1 2017, Advance Estimates indicated that GDP eased slightly by 1.9% q-o-q SAAR after rising by 12.3% in Q4 2016. On a y-o-y basis, growth came in at 2.5%, compared to 2.9%. High-frequency data showed that there was a pullback in biomedical production, but electronics output continued to rise, albeit at a slower pace, and the level of overall manufacturing activity remained elevated. For 2017 as a whole, the performance of different sectors across the Singapore economy is likely to remain uneven, reflecting in part the still narrowly-based drivers of external demand. Parts of manufacturing remain weak: for example, the marine & offshore engineering cluster continues to contract, albeit at a slower pace. While the global IT recovery is firmly underway and will bolster the electronics and trade-related industries in Singapore, ongoing reconfigurations are altering the nature of production and its attendant
56 Macroeconomic Review, April 2017
Monetary Authority of Singapore Economic Policy Group
multiplier effects. Specifically, electronics manufacturing is increasingly moving into pre- and post-production services, such as R&D and marketing & sales. Accordingly, the spillovers from rising global demand are expected to be smaller than in previous upturns. The modern services (finance and ICT) and essential services (healthcare and education) sectors will bolster GDP growth, but other consumer-facing sectors, such as retail trade, are likely to remain soft, on account of the subdued domestic labour market. All in, GDP growth in the Singapore economy is likely to remain modest at 1–3% in 2017, not markedly different from the 2% growth in 2016. There is continuing slack in the labour market as shown by EPG’s Labour Market Pressure Indicator, which eased for a third consecutive quarter in Q4 2016. Although wage growth has exceeded 3% in recent quarters, this likely reflected the exit of lower-paid casual workers and still-high vacancy rates in certain industries, rather than general tightness in the labour market. Inflation has largely evolved as anticipated since the October 2016 policy review. CPI-All Items inflation turned positive in November 2016, averaging 0.0% in Q4 before rising to 0.6% y-o-y in the first quarter of this year. Meanwhile, MAS Core Inflation edged up to average 1.3% in Q1 2017, from 1.2% in Q4 2016. These increases were largely due to higher prices of oil-related items, such as electricity and petrol, following the recovery of global oil prices from their 2016 trough. Imported inflation is likely to rise moderately in 2017. The price of Brent crude oil averaged US$55 in Q1, and while it is not projected to rise by much more for the rest of this year, it will still be about 20% higher than in 2016, on average. Global food prices have also increased amid tighter supply conditions. At the same time, administrative price increases implemented at the end of 2016 and forthcoming adjustments in 2017 will give a temporary boost to inflation this year. However, the pass-through from higher import and administrative costs to consumer prices will be dampened for several reasons. First, changes in domestic imported food prices are only partially
captured in consumer prices in the short term, with EPG’s econometric estimates suggesting that a full pass-through requires several years. Second, other business costs are moderating, as the soft labour market caps overall wage growth, while retail, commercial and industrial property rents have declined for two consecutive years. Third, weak economic sentiment will constrain the extent of cost pass-through from businesses to consumers. Weighing all these factors, MAS’ inflation forecasts for 2017 are unchanged from the October 2016 review. CPI-All Items inflation is expected to rise to 0.5–1.5% from −0.5% in 2016, while MAS Core Inflation is projected to average 1–2%, compared to 0.9% last year. Meanwhile, inflation expectations remain well anchored, as observed in inflation forecasts from the MAS Survey of Professional Forecasters. The outlook for the Singapore economy has improved slightly, but GDP growth is expected to remain modest and uneven across different sectors. Conditions in the labour market this year are not expected to be significantly different from 2016, given that any turnaround due to mildly improving economic conditions will only come with a lag. Inflation will rise in 2017, but this is largely driven by supply factors, such as higher oil prices and administrative price increases. As such, the domestic economy is unlikely to see a strong build-up of demand pressures over the short term. In the medium term, MAS Core Inflation is expected to trend towards but average slightly below 2%. Accordingly, at the April 2017 policy review, MAS maintained the rate of appreciation of the S$NEER policy band at 0%, with no change to the width of the band or the level at which it was centred. MAS also reaffirmed the appropriateness of maintaining a neutral policy stance for an extended period, as was conveyed in the October 2016 Monetary Policy Statement (MPS). Further, EPG’s econometric analysis suggests that nearly half of the cumulative impact from MAS’ past policy easing moves since January 2015 will continue to filter through to the economy. Together with the maintenance of the neutral policy stance, these effects will help to keep
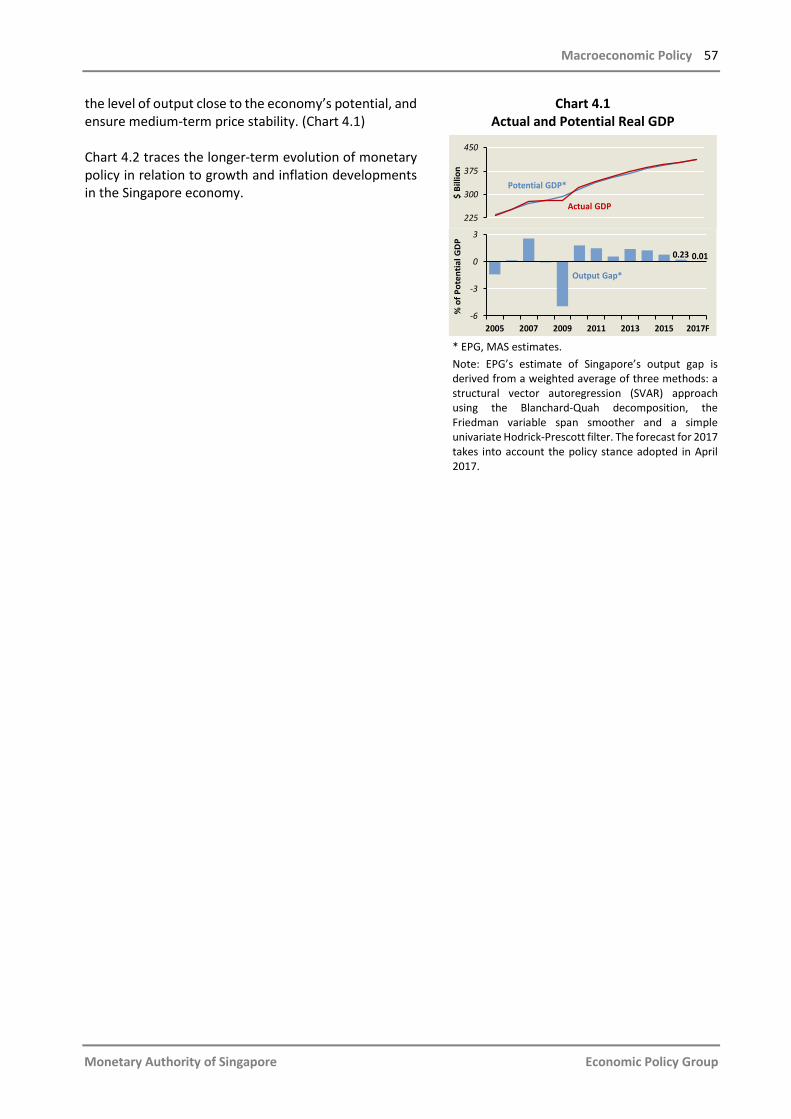
Macroeconomic Policy 57
Monetary Authority of Singapore Economic Policy Group
the level of output close to the economy’s potential, and ensure medium-term price stability. (Chart 4.1) Chart 4.2 traces the longer-term evolution of monetary policy in relation to growth and inflation developments in the Singapore economy.
Chart 4.1 Actual and Potential Real GDP
* EPG, MAS estimates. Note: EPG’s estimate of Singapore’s output gap is derived from a weighted average of three methods: a structural vector autoregression (SVAR) approach using the Blanchard-Quah decomposition, the Friedman variable span smoother and a simple univariate Hodrick-Prescott filter. The forecast for 2017 takes into account the policy stance adopted in April 2017.
225
300
375
450
$ Bi
llion
2005 2007 2009 2011 2013 2015 2017F-6
-3
0
3
% o
f Pot
entia
l GD
P
Output Gap*
Potential GDP*
Actual GDP
0.010.23
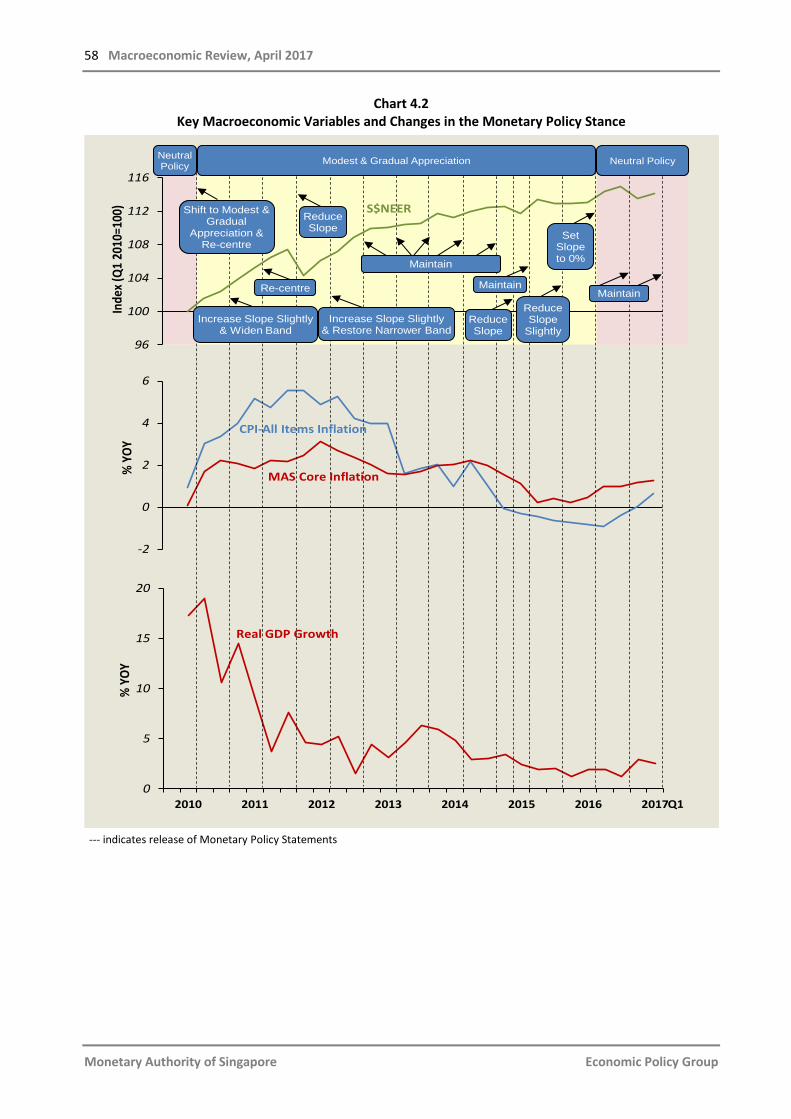
58 Macroeconomic Review, April 2017
Monetary Authority of Singapore Economic Policy Group
Chart 4.2 Key Macroeconomic Variables and Changes in the Monetary Policy Stance
--- indicates release of Monetary Policy Statements
0
5
10
15
20
2010 2011 2012 2013 2014 2015 2016 2017
% Y
OY
-2
0
2
4
6
% Y
OY
Q1
Real GDP Growth
CPI-All Items Inflation
MAS Core Inflation
Neutral Policy
96
100
104
108
112
116
Inde
x (Q1
201
0=10
0)
Modest & Gradual Appreciation
S$NEERShift to Modest & Gradual
Appreciation & Re-centre
Re-centre
Increase Slope Slightly& Widen Band
Increase Slope Slightly& Restore Narrower Band
Reduce Slope
Maintain
Reduce Slope
Maintain
Reduce Slope
Slightly
SetSlope to 0%
Maintain
Neutral Policy
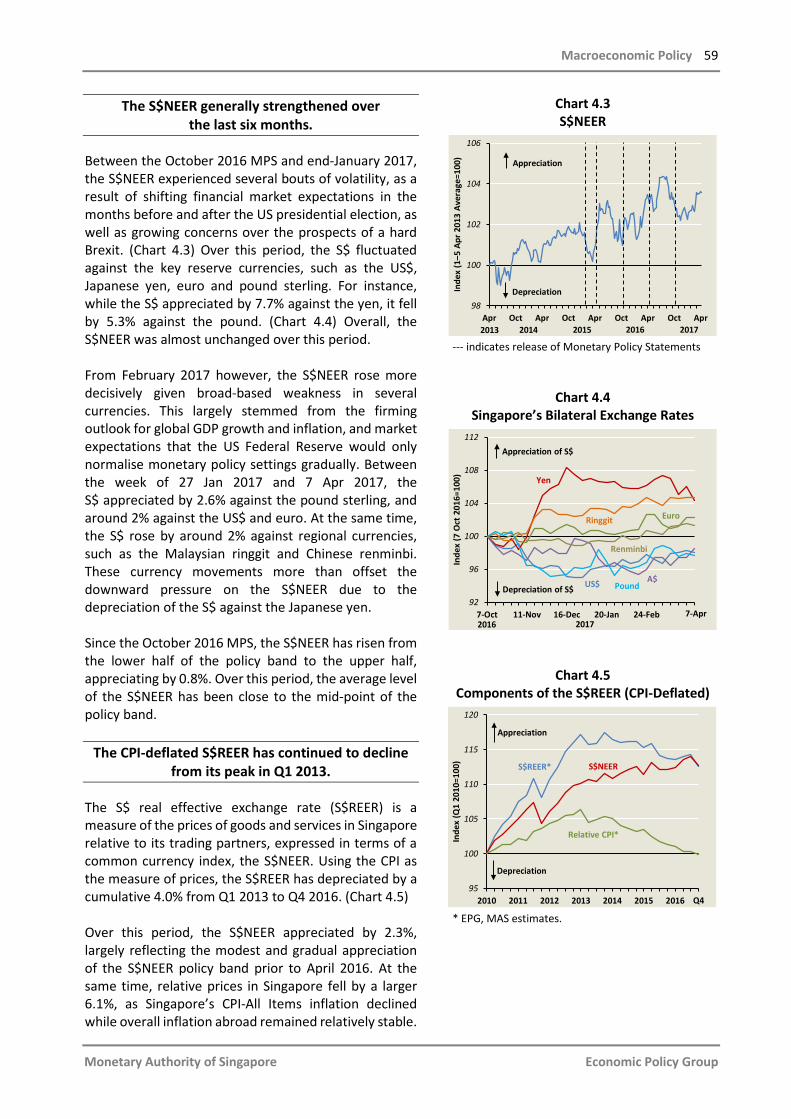
Macroeconomic Policy 59
Monetary Authority of Singapore Economic Policy Group
The S$NEER generally strengthened over the last six months.
Between the October 2016 MPS and end-January 2017, the S$NEER experienced several bouts of volatility, as a result of shifting financial market expectations in the months before and after the US presidential election, as well as growing concerns over the prospects of a hard Brexit. (Chart 4.3) Over this period, the S$ fluctuated against the key reserve currencies, such as the US$, Japanese yen, euro and pound sterling. For instance, while the S$ appreciated by 7.7% against the yen, it fell by 5.3% against the pound. (Chart 4.4) Overall, the S$NEER was almost unchanged over this period. From February 2017 however, the S$NEER rose more decisively given broad-based weakness in several currencies. This largely stemmed from the firming outlook for global GDP growth and inflation, and market expectations that the US Federal Reserve would only normalise monetary policy settings gradually. Between the week of 27 Jan 2017 and 7 Apr 2017, the S$ appreciated by 2.6% against the pound sterling, and around 2% against the US$ and euro. At the same time, the S$ rose by around 2% against regional currencies, such as the Malaysian ringgit and Chinese renminbi. These currency movements more than offset the downward pressure on the S$NEER due to the depreciation of the S$ against the Japanese yen. Since the October 2016 MPS, the S$NEER has risen from the lower half of the policy band to the upper half, appreciating by 0.8%. Over this period, the average level of the S$NEER has been close to the mid-point of the policy band.
The CPI-deflated S$REER has continued to decline from its peak in Q1 2013.
The S$ real effective exchange rate (S$REER) is a measure of the prices of goods and services in Singapore relative to its trading partners, expressed in terms of a common currency index, the S$NEER. Using the CPI as the measure of prices, the S$REER has depreciated by a cumulative 4.0% from Q1 2013 to Q4 2016. (Chart 4.5) Over this period, the S$NEER appreciated by 2.3%, largely reflecting the modest and gradual appreciation of the S$NEER policy band prior to April 2016. At the same time, relative prices in Singapore fell by a larger 6.1%, as Singapore’s CPI-All Items inflation declined while overall inflation abroad remained relatively stable.
Chart 4.3 S$NEER
--- indicates release of Monetary Policy Statements
Chart 4.4 Singapore’s Bilateral Exchange Rates
Chart 4.5 Components of the S$REER (CPI-Deflated)
* EPG, MAS estimates.
Apr Oct Apr Oct Apr Oct Apr Oct Apr98
100
102
104
106
Inde
x (1
–5 A
pr 2
013
Aver
age=
100)
2013 2015 2016
Appreciation
Depreciation
2014 2017
7-Oct 11-Nov 16-Dec 20-Jan 24-Feb 31-Mar92
96
100
104
108
112
Inde
x (7
Oct
201
6=10
0)
2016 2017
Depreciation of S$ US$
Yen
Euro
Appreciation of S$
7-Apr
Ringgit
Renminbi
A$Pound
2010 2011 2012 2013 2014 2015 201695
100
105
110
115
120
Inde
x (Q
1 20
10=1
00)
Q4
S$REER* S$NEER
Relative CPI*
Appreciation
Depreciation
60 Macroeconomic Review, April 2017
Monetary Authority of Singapore Economic Policy Group
Domestic liquidity conditions have been driven by movements in the S$NEER.
Since October 2016, overall liquidity conditions in the domestic economy, as measured by changes in the Domestic Liquidity Indicator (DLI)1, have been primarily driven by changes in the nominal exchange rate. (Chart 4.6) Although domestic liquidity eased in Oct–Dec 2016 due to the depreciating S$NEER, it began to tighten from January 2017 as the trade-weighted index started to rise, particularly in the more recent months. Domestic interbank rates have been at a discount to
US rates since October 2016.
The three-month S$ SIBOR had previously been at a premium over the US$ LIBOR between September 2012 and September 2016. (Chart 4.7) However, in October 2016, the US$ interbank rate rose above the S$ SIBOR. From October 2016 to March 2017, the S$ SIBOR increased from 0.87% to 0.97% in December, before easing to 0.95% in March 2017. In the same six-month period, the US$ LIBOR rose more rapidly from 0.88% to 1.15%. As a result, the discount between the S$ SIBOR and US$ LIBOR widened from 1 bps to 20 bps over this period. The three-month S$ Swap Offer Rate (SOR) has been more volatile than the S$ SIBOR. Between October and end-2016, the SOR rose by 34 bps to 1.01%, but it subsequently fell 14 bps to 0.88% in March 2017. The savings deposit rate has adjusted as well, albeit with a lag. It was stable at 0.14% throughout 2016, but increased to 0.18% in Jan–Feb 2017, before inching down by 2 bps in March. (Chart 4.8) In comparison, the 12-month fixed deposit rate remained unchanged at 0.35% throughout 2016 but fell to 0.33% in early 2017. Nevertheless, despite low board rates, a number of banks have continued to offer higher promotional rates on fixed deposit accounts.
Chart 4.6 Domestic Liquidity Indicator
* EPG, MAS estimates.
Chart 4.7
Interbank Rates and Swap Offer Rate
Source: ABS Benchmarks Administration Co Pte Ltd and ICE Benchmark Administration Ltd
Chart 4.8
Deposit Rates
Note: Each line represents the simple average of the top 10 banks’ deposit rates.
1 The DLI captures movements in the S$NEER and the three-month S$ SIBOR.
Oct Jan Apr Jul Oct Jan-0.6
-0.4
-0.2
0.0
0.2
0.4
0.6
Chan
ge fr
om T
hree
Mon
ths
Ago
2015 2016 2017Mar
Exchange Rate Changes
DLI*
Interest Rate Changes
Tightening
Easing
0.0
0.4
0.8
1.2
1.6
2.0
2013 2014 2015 2016 2017
% P
er A
nnum
End of Month
3-month S$ SIBOR
3-month US$ LIBOR
3-month S$Swap Offer Rate
Mar
0.0
0.1
0.2
0.3
0.4
2013 2014 2015 2016 2017
% P
er A
nnum
End of Month Mar
12-month Fixed Deposit Rate
Savings Deposit Rate
Macroeconomic Policy 61
Monetary Authority of Singapore Economic Policy Group
Money supply growth continued to rise in recent months before moderating in February 2017.
Growth in money aggregates rose between October 2016 and January 2017 before slowing in February. (Chart 4.9) M1 growth stepped up from 7.4% y-o-y in October 2016 to 8.9% in January 2017 as the stock of demand deposits and currency in active circulation (CIAC) expanded at a more rapid pace. (Chart 4.10) In February, however, M1 growth slowed to 8.4% alongside the moderation in CIAC growth. This, in turn, likely reflected the fact that the Lunar New Year festive period occurred in January this year, but February last year. Meanwhile, the growth trajectories of M2 and M3 mirrored that of M1, although there was a compositional shift. Savings deposits growth continued to rise throughout 2016 to 10.9% y-o-y in February 2017, while fixed deposit growth slowed in the first two months of this year, in line with lower fixed deposit rates.
DBU non-bank loan growth picked up amid rising business loans.
As a result of the stronger growth outturn in Q4 2016, the stock of outstanding DBU non-bank loans began to expand in y-o-y terms in October 2016 after twelve consecutive months of decline. (Chart 4.11) The pace of credit growth continued to rise in February 2017, reaching 5.2% y-o-y. This was due to the recovery in business loans, which took place amid a broad-based turnaround in lending to sectors such as building and construction, general commerce, business services, as well as transport, storage and communications services. In comparison, consumer loan growth remained steady at around 3.2% between October 2016 and February 2017.
Chart 4.9 Money Supply
Chart 4.10 Components of Money Supply
Chart 4.11 DBU Non-bank Loans
2013 2014 2015 2016 2017-5
0
5
10
15
20
YOY
% G
row
th
Feb
M2 M3
M1
2013 2014 2015 2016 2017-10
0
10
20
30
YOY
% G
row
th
Feb
Savings and other Deposits
Currency In Active Circulation
Fixed Deposits Demand Deposits
Net Deposits with Non-bank Financial Institutions
2013 2014 2015 2016 2017-10
0
10
20
30
YOY
% G
row
th
Feb
Consumer Loans
Total DBU Non-bank Loans
Business Loans

62 Macroeconomic Review, April 2017
Monetary Authority of Singapore Economic Policy Group
4.2 Fiscal Policy
A More Targeted Fiscal Approach
Budget 2017 continued the shift towards a more targeted fiscal policy approach. This was evident in the relief measures that were calibrated to specific sectors and firms facing cyclical headwinds, and the funding support for the initiatives to implement the recommendations of the CFE. A large number of the structural measures contained in the Budget also aimed to leverage on the government’s capabilities to help industries and firms in the areas of digitalisation, innovation and internationalisation. In addition, the Budget enhanced Singapore’s support for vulnerable groups in society and sought to ensure that the country would retain its high-quality living environment in the longer term. Against the backdrop of modestly improving but uneven growth, the fiscal policy stance for CY2017 is projected to be mildly expansionary.
Budget 2017 was forward-looking even as it addressed cyclical challenges.
Budget 2017 was delivered against the backdrop of lingering cyclical headwinds and structural challenges confronting the domestic economy. GDP growth was expected to be modest and uneven across the various sectors of the economy, while labour market conditions were likely to remain subdued. It was, therefore, appropriate that the Budget was mildly accommodative as a whole, and targeted at the pressure points in the economy. Certain sectors, firms and workers impacted by cyclical and transitional challenges were provided with calibrated support, but the focus of Budget 2017 was facilitating the Singapore economy’s progress in line with the recommendations of the CFE. Given that the economy has entered a more advanced phase of restructuring, Budget 2017 shifted towards a more targeted, micro-based approach to fiscal policy. The economic measures in this Budget were directed at specific segments of the economy and the fine-tuning of previously introduced initiatives. On the whole, Budget 2017 was appropriately calibrated to meet both cyclical and structural objectives, while keeping an eye on long-term fiscal sustainability. The key measures in Budget 2017 are summarised in Table 4.1.
Relief measures for sectors, firms and households were targeted to the current stage
of the business cycle.
Budget 2017 continued and extended some of the transitional measures introduced in previous Budgets to address lingering cyclical weakness. For instance, the Additional Special Employment Credit 2 (ASEC) and Corporate Income Tax (CIT) rebate were extended to end-2019 and YA2018, respectively. For YA2017, the cap on the CIT rebate was raised from $20,000 to $25,000, following the increase in the rebate quantum to 50% of tax payable last year. In YA2018, the CIT rebate will fall to 20% of tax payable and be capped at $10,000. At the same time, Budget 2017 provided specific assistance for sectors facing near-term difficulties. For example, the hike in the foreign worker levy for the Marine and Process sectors was delayed for another year in light of the still-subdued outlook for the oil & gas industry. Similarly, a bridging loan scheme for the Marine & Offshore Engineering cluster had been introduced to alleviate short-term credit constraints. To support the construction sector, the Budget brought forward around $700 million worth of public infrastructure projects to 2017 and 2018. These measures should help tide these sectors over soft patches in the near term.
2 The ASEC provides wage offsets of up to 3% to employers hiring older Singaporean workers earning up to $4,000 a month,
who are above the new re-employment age of 67 years. This is on top of the Special Employment Credit (SEC) of up to 8% for eligible Singaporean workers aged 55 and above.
Macroeconomic Policy 63
Monetary Authority of Singapore Economic Policy Group
Meanwhile, the SME Working Capital Loan scheme3 introduced in Budget 2016 will remain in place for another two years, thereby facilitating SMEs’ access to financing amid rising global interest rates. Together with the enhancement and extension of the CIT and SEC, which should be of relatively greater benefit to SMEs than to larger enterprises given the fixed caps on the corporate tax rebate and employment credit, these measures will provide support to SMEs facing cash flow constraints. Budget 2017 also provided targeted near-term relief measures for households and individuals. For example, eligible individuals will receive a personal income tax rebate equivalent to 20% of tax payable, capped at $500 for YA2017, while lower-income Singaporeans will receive the one-off GST Voucher–Cash Special Payment of up to $200. The S&CC rebates were also tiered such that households in smaller HDB flats received a larger quantum of financial assistance. Otherwise, the Budget’s measures focused on helping unemployed workers to re-skill and find jobs, thereby seeking to alleviate structural mismatches in the domestic labour market. For unemployed residents, the enhanced National Jobs Bank and new “Attach and Train” scheme provided more avenues to search for suitable jobs and new careers. Budget 2017 also boosted financial support for wages and training provided under the Career Support, Professional Conversion and Work Trial Programmes, so as to speed-up residents’ re-employment across industries and occupations.
Budget 2017 leveraged on the Government’s resources for the next phase of restructuring.
The bulk of the Budget’s measures were structural in nature, thereby setting in motion the CFE’s broad recommendations. The main thrusts of the CFE report emphasised the need for industries and firms to digitalise, innovate, and internationalise, and for workers to deepen their skills. It also stressed the importance of Singapore remaining connected with the rest of the world, and open to the movement of goods and services, people and
ideas. The report highlighted the role of the Government in supporting these strategies by investing in Singapore’s physical and social infrastructure, and by playing a key coordinating role through the Industry Transformation Maps, to ensure that strategies were executed in a mutually reinforcing way. In addition, the Government could also work with the private sector more closely to facilitate growth and innovation. In this vein, Budget 2017 presented several initiatives that leverage on the Government’s know-how, networks, and risk-bearing capacity to partner firms and workers in the next leg of the economy’s transformation. First, Budget 2017 introduced programmes in which the public sector would play the role of a proximate enabler of innovation. Indeed, the aim is to catalyse new industries and businesses, and provide an environment conducive to private sector-driven innovation. For instance, the CFE proposal to allow the Government to be a lead purveyor of more innovative and, therefore, more risky solutions would lend smaller firms and start-ups a helping hand. In the construction sector, Budget 2017 introduced a Public Sector Construction Productivity Fund to procure innovative and productive construction solutions for public sector projects. Meanwhile, the introduction of regulatory “sandboxes” in various sectors, such as financial services, will also allow firms to experiment at a lower cost and thereby facilitate the development of new, innovative solutions. Second, government agencies have re-oriented their focus to help businesses more directly with innovation and technology adoption. For instance, the Government has sought to reduce firms’ search costs by tasking A*STAR with the identification of technology solutions for 400 firms over four years (Operation and Technology Road-mapping). In addition, A*STAR will provide access to its advanced machine tools to enable prototyping and testing (Tech Access Initiative), and also train firms in the use of these tools. Budget 2017 complemented this initiative by enhancing the Headstart programme whereby SMEs could enjoy
3 Under this scheme, the Government co-shares 50% of the default risk for loans of up to $300,000 per SME.
64 Macroeconomic Review, April 2017
Monetary Authority of Singapore Economic Policy Group
royalty-free exclusive licenses for three years for Intellectual Property (IP) co-developed with A*STAR. The “Headstart Programme” would thus increase the returns to innovation for firms developing IP with A*STAR, even as the cost of R&D would be subsidised for others through the Tech Access Initiative. Third, Budget 2017 actively sought to leverage on government capabilities to provide targeted, human capital support and, where necessary, financial support to help firms scale up and internationalise. The former is most evident in the renewed push to help SMEs digitalise under the SMEs Go Digital Programme. Recognising that SMEs faced multiple hurdles to digitalisation, the Budget went beyond providing financial incentives to enlisting the expertise of IMDA to help guide SMEs through the process of IT adoption. Under the Go Digital Programme, IMDA and SPRING will also help firms identify digitalisation strategies most appropriate for their level of development and skills. This programme thus emphasised the in-person help available at SME Centres and the new SME Digital Technology Hub for specialist advice. Meanwhile, under a new $600 million International Partnership Fund, the Government will also co-invest with Singapore-based firms that aim to expand overseas. This recognises that local firms face constraints, owing, in part, to the lack of scale in the domestic market. Fourth, the Budget sought to tap on the Government’s networks to reduce international search costs and promote global connectivity. As part of a new Global Innovation Alliance, three new programmes were introduced to help students, businesses and industries connect to the world’s marketplaces and ideas. Innovation Launchpads, for instance, would facilitate networking opportunities for local entrepreneurs to link up with overseas mentors, service providers and investors. Meanwhile, Innovators Academy will aim to help students build international connections and entrepreneurship capabilities. These initiatives draw on the Government’s extensive international network and a successful existing initiative by the National University of Singapore.
Budget 2017 also contained explicit measures to correct for environmental externalities and
distortions …
Budget 2017 recognised that certain market outcomes produced negative environmental externalities. Accordingly, it sought to partially internalise these spillovers through the introduction of a new Vehicular Emission Scheme and a carbon tax from 2018 and 2019, respectively, and by restructuring diesel taxes. These changes were made to ensure that Singapore retains its high-quality living environment, which the CFE had identified as a key source of the country’s competitive advantage. In the case of the increase in water prices, the objective is to continue to align prices to marginal costs, in recognition of the scarcity value of a basic resource. The Government would provide assistance to households through a permanent increase in GST Voucher–U-Save. After the increase, households in 1- and 2-room HDB flats would not experience any water price increase on average, while monthly water bills of other HDB households would only go up by $2 to $11 a month on average.
… and enhanced support for persons with
disabilities.
Budget 2017 enhanced support for persons with disabilities and people with mental health conditions. Under the Third Enabling Masterplan, a Disability Caregiver Support Centre will be set up to provide information, respite care, training, and peer support groups to caregivers. Including existing initiatives, around $400 million a year is expected to be spent on supporting persons with disabilities, while an additional $160 million over the next five years is expected to be spent on community mental health initiatives. The latter is particularly pertinent as it seeks to integrate persons with mental health issues into society and the workplace, and will also be timely as the population ages and the incidence of elderly-related mental health conditions, such as dementia, increases.
Macroeconomic Policy 65
Monetary Authority of Singapore Economic Policy Group
Budget 2017 signalled the need to ensure fiscal sustainability.
Budget 2017 highlighted that Singapore’s expenditure needs would rise significantly over time, particularly in the areas of healthcare and infrastructure. The Budget recognised that it was necessary for the Government to continue to use fiscal resources judiciously, while considering new revenue streams early so as to ensure fiscal sustainability for the longer term. On the expenditure front, Budget 2017 announced that the budget caps of Ministries and Organs of State would be reduced by 2% permanently from FY2017. The freed-up funds could instead be used for higher priority requirements and cross-agency projects, such as the initiatives by the Municipal Services Office. This should encourage the civil service to be more efficient in its spending and work across agencies to minimise gaps in public service delivery. The Budget also pre-emptively signalled that the Government would have to raise revenues in the longer term through new taxes or higher tax rates, in order to ensure that future generations remain on a sustainable fiscal footing. Nevertheless, the Government was cognisant that growing the economy was the most sustainable way to generate revenues. Accordingly, the strengthening of the revenue base would be effected in a pro-growth manner even as the tax structure would remain progressive.
Budget 2017 aimed to facilitate the next phase of restructuring in a fiscally judicious manner.
In sum, Budget 2017 emphasised the need for the Government to act as enablers and partners to businesses and workers, rather than as the main driver of the economy’s restructuring. It built on the CFE’s premise that the Government could play an important role in bringing together stakeholders and internalising positive externalities by providing “horizontals” that help firms, especially SMEs, and whole industries overcome information asymmetries. At the same time, the Budget re-oriented the broad fiscal approach from a focus on economy-wide targets and relative prices, to measures at the level of the sector, industry, firm, and worker. This shift away from broad-based pecuniary measures to targeted, micro assistance leveraging on existing government capabilities was appropriate in the context of the stable, albeit modest, pace of expansion, and as economic restructuring proceeds into its more advanced phase. In addition, there was the need to be judicious in spending today. Accordingly Budget 2017 preserved the long-standing principle of ensuring fiscal prudence, even as it implemented the CFE recommendations aimed at enabling firms and workers to flourish and reach their full potential.
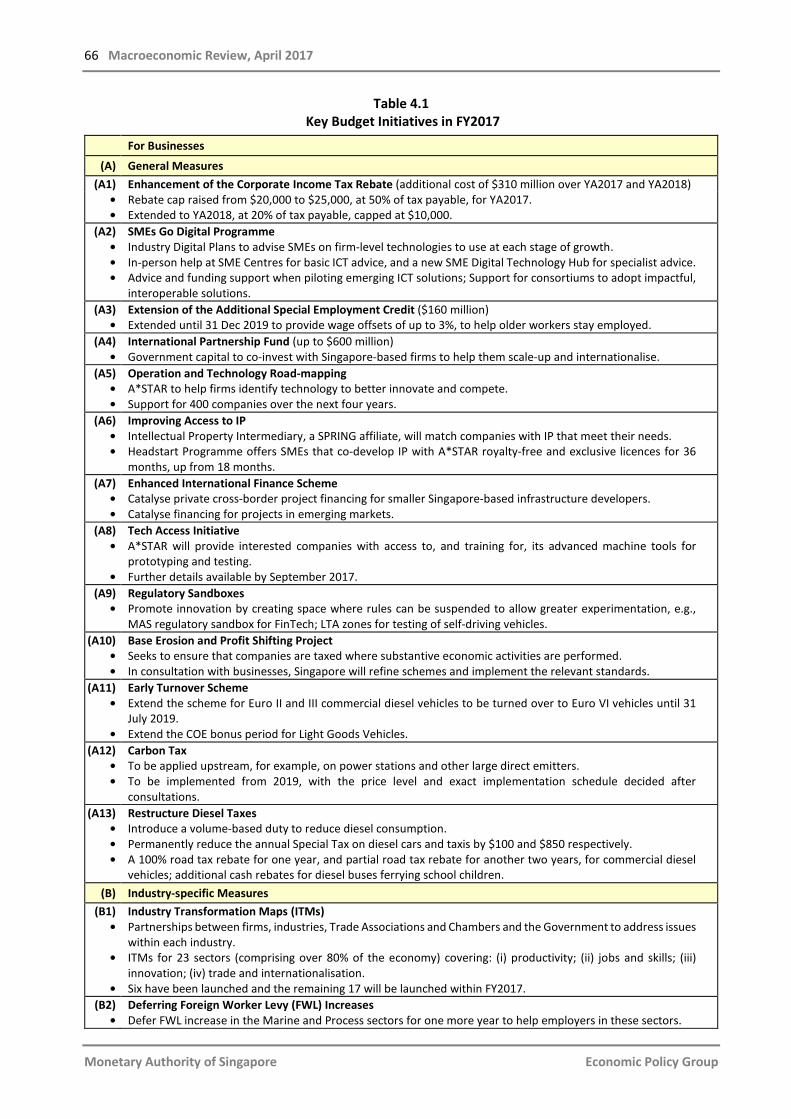
66 Macroeconomic Review, April 2017
Monetary Authority of Singapore Economic Policy Group
Table 4.1 Key Budget Initiatives in FY2017
For Businesses
(A) General Measures (A1) Enhancement of the Corporate Income Tax Rebate (additional cost of $310 million over YA2017 and YA2018)
• •
Rebate cap raised from $20,000 to $25,000, at 50% of tax payable, for YA2017. Extended to YA2018, at 20% of tax payable, capped at $10,000.
(A2) • • •
SMEs Go Digital Programme Industry Digital Plans to advise SMEs on firm-level technologies to use at each stage of growth. In-person help at SME Centres for basic ICT advice, and a new SME Digital Technology Hub for specialist advice. Advice and funding support when piloting emerging ICT solutions; Support for consortiums to adopt impactful, interoperable solutions.
(A3) •
Extension of the Additional Special Employment Credit ($160 million) Extended until 31 Dec 2019 to provide wage offsets of up to 3%, to help older workers stay employed.
(A4) •
International Partnership Fund (up to $600 million) Government capital to co-invest with Singapore-based firms to help them scale-up and internationalise.
(A5) • •
Operation and Technology Road-mapping A*STAR to help firms identify technology to better innovate and compete. Support for 400 companies over the next four years.
(A6) • •
Improving Access to IP Intellectual Property Intermediary, a SPRING affiliate, will match companies with IP that meet their needs. Headstart Programme offers SMEs that co-develop IP with A*STAR royalty-free and exclusive licences for 36 months, up from 18 months.
(A7) • •
Enhanced International Finance Scheme Catalyse private cross-border project financing for smaller Singapore-based infrastructure developers. Catalyse financing for projects in emerging markets.
(A8) •
•
Tech Access Initiative A*STAR will provide interested companies with access to, and training for, its advanced machine tools for prototyping and testing. Further details available by September 2017.
(A9) •
Regulatory Sandboxes Promote innovation by creating space where rules can be suspended to allow greater experimentation, e.g., MAS regulatory sandbox for FinTech; LTA zones for testing of self-driving vehicles.
(A10) • •
Base Erosion and Profit Shifting Project Seeks to ensure that companies are taxed where substantive economic activities are performed. In consultation with businesses, Singapore will refine schemes and implement the relevant standards.
(A11) •
•
Early Turnover Scheme Extend the scheme for Euro II and III commercial diesel vehicles to be turned over to Euro VI vehicles until 31 July 2019. Extend the COE bonus period for Light Goods Vehicles.
(A12) • •
Carbon Tax To be applied upstream, for example, on power stations and other large direct emitters. To be implemented from 2019, with the price level and exact implementation schedule decided after consultations.
(A13) • • •
Restructure Diesel Taxes Introduce a volume-based duty to reduce diesel consumption. Permanently reduce the annual Special Tax on diesel cars and taxis by $100 and $850 respectively. A 100% road tax rebate for one year, and partial road tax rebate for another two years, for commercial diesel vehicles; additional cash rebates for diesel buses ferrying school children.
(B) Industry-specific Measures (B1)
•
•
•
Industry Transformation Maps (ITMs) Partnerships between firms, industries, Trade Associations and Chambers and the Government to address issues within each industry. ITMs for 23 sectors (comprising over 80% of the economy) covering: (i) productivity; (ii) jobs and skills; (iii) innovation; (iv) trade and internationalisation. Six have been launched and the remaining 17 will be launched within FY2017.
(B2) •
Deferring Foreign Worker Levy (FWL) Increases Defer FWL increase in the Marine and Process sectors for one more year to help employers in these sectors.
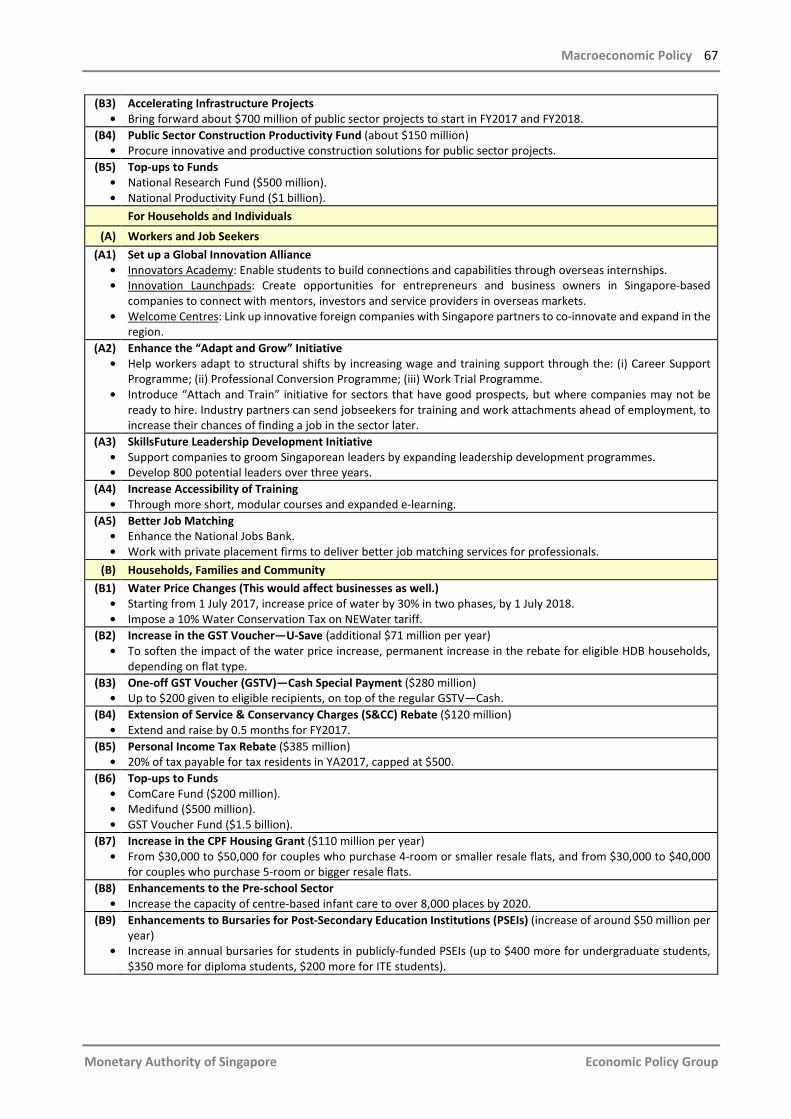
Macroeconomic Policy 67
Monetary Authority of Singapore Economic Policy Group
(B3) •
Accelerating Infrastructure Projects Bring forward about $700 million of public sector projects to start in FY2017 and FY2018.
(B4) •
Public Sector Construction Productivity Fund (about $150 million) Procure innovative and productive construction solutions for public sector projects.
(B5) • •
Top-ups to Funds National Research Fund ($500 million). National Productivity Fund ($1 billion).
For Households and Individuals
(A) Workers and Job Seekers (A1)
• •
•
Set up a Global Innovation Alliance Innovators Academy: Enable students to build connections and capabilities through overseas internships. Innovation Launchpads: Create opportunities for entrepreneurs and business owners in Singapore-based companies to connect with mentors, investors and service providers in overseas markets. Welcome Centres: Link up innovative foreign companies with Singapore partners to co-innovate and expand in the region.
(A2) •
•
Enhance the “Adapt and Grow” Initiative Help workers adapt to structural shifts by increasing wage and training support through the: (i) Career Support Programme; (ii) Professional Conversion Programme; (iii) Work Trial Programme. Introduce “Attach and Train” initiative for sectors that have good prospects, but where companies may not be ready to hire. Industry partners can send jobseekers for training and work attachments ahead of employment, to increase their chances of finding a job in the sector later.
(A3) • •
SkillsFuture Leadership Development Initiative Support companies to groom Singaporean leaders by expanding leadership development programmes. Develop 800 potential leaders over three years.
(A4) •
Increase Accessibility of Training Through more short, modular courses and expanded e-learning.
(A5) • •
Better Job Matching Enhance the National Jobs Bank. Work with private placement firms to deliver better job matching services for professionals.
(B) Households, Families and Community (B1)
• •
Water Price Changes (This would affect businesses as well.) Starting from 1 July 2017, increase price of water by 30% in two phases, by 1 July 2018. Impose a 10% Water Conservation Tax on NEWater tariff.
(B2) •
Increase in the GST Voucher—U-Save (additional $71 million per year) To soften the impact of the water price increase, permanent increase in the rebate for eligible HDB households, depending on flat type.
(B3) •
One-off GST Voucher (GSTV)—Cash Special Payment ($280 million) Up to $200 given to eligible recipients, on top of the regular GSTV—Cash.
(B4) •
Extension of Service & Conservancy Charges (S&CC) Rebate ($120 million) Extend and raise by 0.5 months for FY2017.
(B5) •
Personal Income Tax Rebate ($385 million) 20% of tax payable for tax residents in YA2017, capped at $500.
(B6) • • •
Top-ups to Funds ComCare Fund ($200 million). Medifund ($500 million). GST Voucher Fund ($1.5 billion).
(B7) •
Increase in the CPF Housing Grant ($110 million per year) From $30,000 to $50,000 for couples who purchase 4-room or smaller resale flats, and from $30,000 to $40,000 for couples who purchase 5-room or bigger resale flats.
(B8) •
Enhancements to the Pre-school Sector Increase the capacity of centre-based infant care to over 8,000 places by 2020.
(B9)
•
Enhancements to Bursaries for Post-Secondary Education Institutions (PSEIs) (increase of around $50 million per year) Increase in annual bursaries for students in publicly-funded PSEIs (up to $400 more for undergraduate students, $350 more for diploma students, $200 more for ITE students).
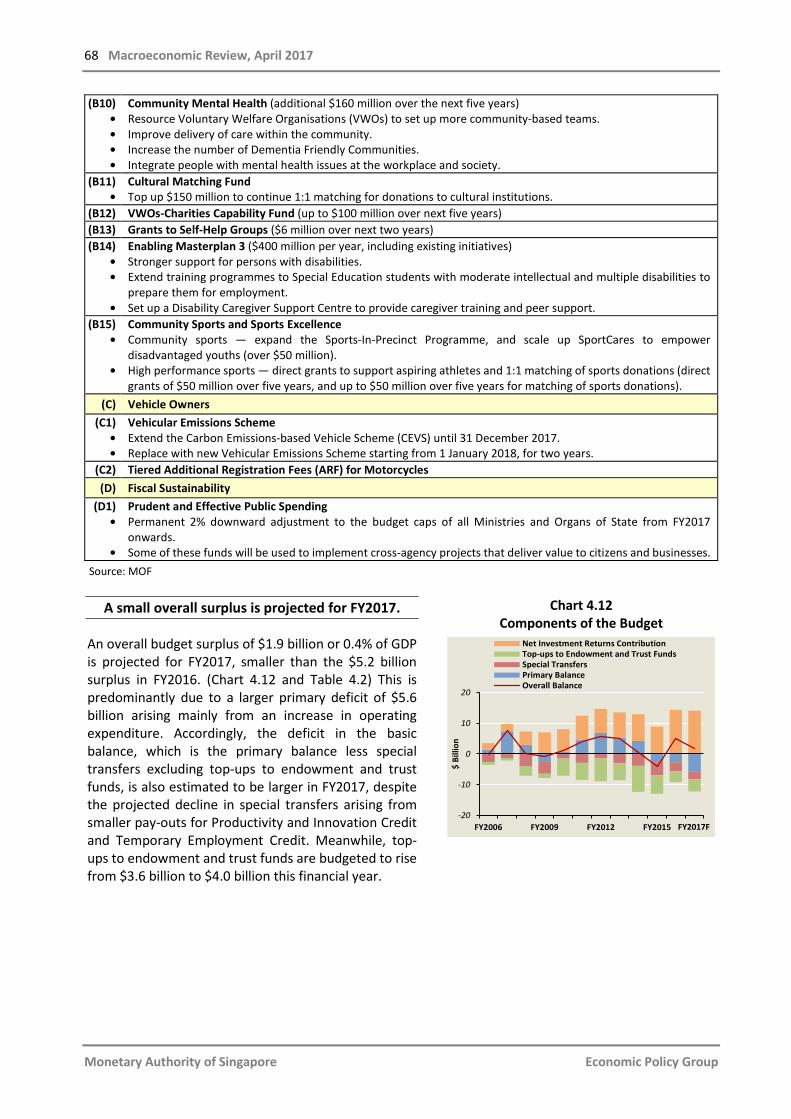
68 Macroeconomic Review, April 2017
Monetary Authority of Singapore Economic Policy Group
(B10) • • • •
Community Mental Health (additional $160 million over the next five years) Resource Voluntary Welfare Organisations (VWOs) to set up more community-based teams. Improve delivery of care within the community. Increase the number of Dementia Friendly Communities. Integrate people with mental health issues at the workplace and society.
(B11) •
Cultural Matching Fund Top up $150 million to continue 1:1 matching for donations to cultural institutions.
(B12) VWOs-Charities Capability Fund (up to $100 million over next five years) (B13) Grants to Self-Help Groups ($6 million over next two years) (B14)
• •
•
Enabling Masterplan 3 ($400 million per year, including existing initiatives) Stronger support for persons with disabilities. Extend training programmes to Special Education students with moderate intellectual and multiple disabilities to prepare them for employment. Set up a Disability Caregiver Support Centre to provide caregiver training and peer support.
(B15) •
•
Community Sports and Sports Excellence Community sports — expand the Sports-In-Precinct Programme, and scale up SportCares to empower disadvantaged youths (over $50 million). High performance sports — direct grants to support aspiring athletes and 1:1 matching of sports donations (direct grants of $50 million over five years, and up to $50 million over five years for matching of sports donations).
(C) Vehicle Owners (C1)
• •
Vehicular Emissions Scheme Extend the Carbon Emissions-based Vehicle Scheme (CEVS) until 31 December 2017. Replace with new Vehicular Emissions Scheme starting from 1 January 2018, for two years.
(C2) Tiered Additional Registration Fees (ARF) for Motorcycles (D) Fiscal Sustainability
(D1) •
•
Prudent and Effective Public Spending Permanent 2% downward adjustment to the budget caps of all Ministries and Organs of State from FY2017 onwards. Some of these funds will be used to implement cross-agency projects that deliver value to citizens and businesses.
Source: MOF
A small overall surplus is projected for FY2017.
An overall budget surplus of $1.9 billion or 0.4% of GDP is projected for FY2017, smaller than the $5.2 billion surplus in FY2016. (Chart 4.12 and Table 4.2) This is predominantly due to a larger primary deficit of $5.6 billion arising mainly from an increase in operating expenditure. Accordingly, the deficit in the basic balance, which is the primary balance less special transfers excluding top-ups to endowment and trust funds, is also estimated to be larger in FY2017, despite the projected decline in special transfers arising from smaller pay-outs for Productivity and Innovation Credit and Temporary Employment Credit. Meanwhile, top-ups to endowment and trust funds are budgeted to rise from $3.6 billion to $4.0 billion this financial year.
Chart 4.12 Components of the Budget
FY2006 FY2009 FY2012 FY2015-20
-10
0
10
20
$ Bi
llion
Net Investment Returns ContributionTop-ups to Endowment and Trust FundsSpecial TransfersPrimary BalanceOverall Balance
FY2017F
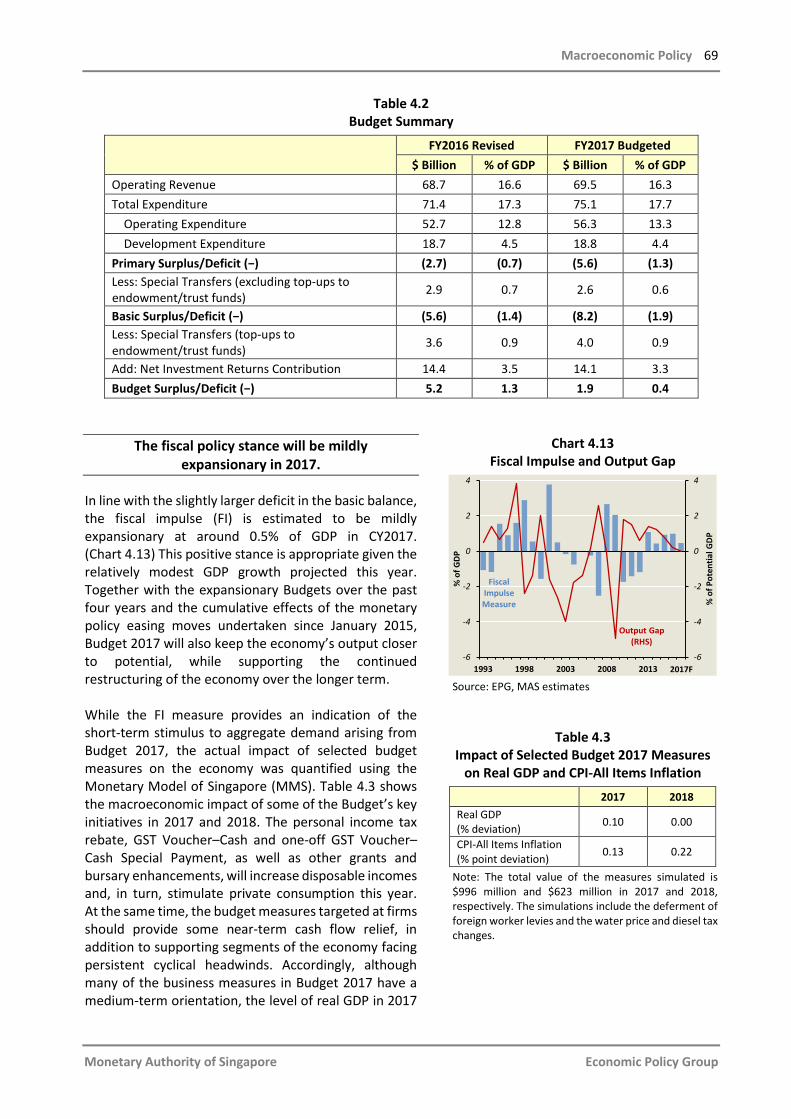
Macroeconomic Policy 69
Monetary Authority of Singapore Economic Policy Group
Table 4.2 Budget Summary
FY2016 Revised FY2017 Budgeted
$ Billion % of GDP $ Billion % of GDP Operating Revenue 68.7 16.6 69.5 16.3 Total Expenditure 71.4 17.3 75.1 17.7 Operating Expenditure 52.7 12.8 56.3 13.3 Development Expenditure 18.7 4.5 18.8 4.4 Primary Surplus/Deficit (−) (2.7) (0.7) (5.6) (1.3) Less: Special Transfers (excluding top-ups to endowment/trust funds) 2.9 0.7 2.6 0.6
Basic Surplus/Deficit (−) (5.6) (1.4) (8.2) (1.9) Less: Special Transfers (top-ups to endowment/trust funds) 3.6 0.9 4.0 0.9
Add: Net Investment Returns Contribution 14.4 3.5 14.1 3.3 Budget Surplus/Deficit (−) 5.2 1.3 1.9 0.4
The fiscal policy stance will be mildly expansionary in 2017.
In line with the slightly larger deficit in the basic balance, the fiscal impulse (FI) is estimated to be mildly expansionary at around 0.5% of GDP in CY2017. (Chart 4.13) This positive stance is appropriate given the relatively modest GDP growth projected this year. Together with the expansionary Budgets over the past four years and the cumulative effects of the monetary policy easing moves undertaken since January 2015, Budget 2017 will also keep the economy’s output closer to potential, while supporting the continued restructuring of the economy over the longer term. While the FI measure provides an indication of the short-term stimulus to aggregate demand arising from Budget 2017, the actual impact of selected budget measures on the economy was quantified using the Monetary Model of Singapore (MMS). Table 4.3 shows the macroeconomic impact of some of the Budget’s key initiatives in 2017 and 2018. The personal income tax rebate, GST Voucher–Cash and one-off GST Voucher–Cash Special Payment, as well as other grants and bursary enhancements, will increase disposable incomes and, in turn, stimulate private consumption this year. At the same time, the budget measures targeted at firms should provide some near-term cash flow relief, in addition to supporting segments of the economy facing persistent cyclical headwinds. Accordingly, although many of the business measures in Budget 2017 have a medium-term orientation, the level of real GDP in 2017
Chart 4.13 Fiscal Impulse and Output Gap
Source: EPG, MAS estimates
Table 4.3 Impact of Selected Budget 2017 Measures
on Real GDP and CPI-All Items Inflation
2017 2018 Real GDP (% deviation) 0.10 0.00
CPI-All Items Inflation (% point deviation) 0.13 0.22
Note: The total value of the measures simulated is $996 million and $623 million in 2017 and 2018, respectively. The simulations include the deferment of foreign worker levies and the water price and diesel tax changes.
1993 1998 2003 2008 2013-6
-4
-2
0
2
4
-6
-4
-2
0
2
4
% o
f Pot
entia
l GD
P
% o
f GD
P
FiscalImpulse Measure
Output Gap (RHS)
2017F
70 Macroeconomic Review, April 2017
Monetary Authority of Singapore Economic Policy Group
will be boosted by 0.1% from the baseline, with this effect fading in 2018. The impact of the budget measures on CPI inflation will mainly be felt in 2018, primarily due to lags in the price transmission mechanism, and in view of the fact that some administrative price adjustments will only be fully phased in next year. It is important to assess the macroeconomic impact of Budget 2017 in the context of the continued fiscal support from past as well as ongoing budget measures undertaken since 2013. These include the measures previously announced that will take effect in 2017, such as extending the SEC; the multi-year nature of some budget initiatives, including the Workfare Income Supplement Scheme and Silver Support Scheme; as well as the typical lags associated with government spending multiplier effects. EPG thus separately simulated the impact of these measures on the Singapore economy. The results show that the continued pass-through of fiscal stimulus since 2013 will boost the level of GDP by about 0.6% in 2017, and continue to provide some support in 2018. The stimulus from Budget 2017 is thus appropriately calibrated in this broader context.
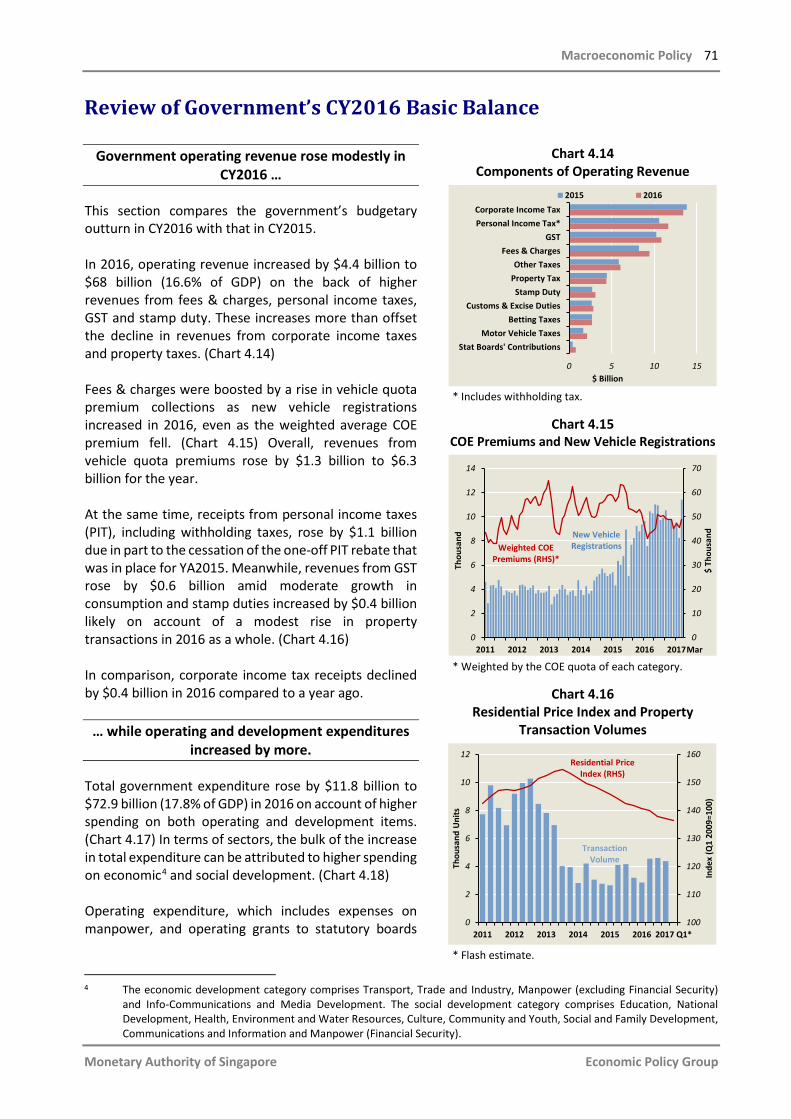
Macroeconomic Policy 71
Monetary Authority of Singapore Economic Policy Group
Review of Government’s CY2016 Basic Balance
Government operating revenue rose modestly in CY2016 …
This section compares the government’s budgetary outturn in CY2016 with that in CY2015. In 2016, operating revenue increased by $4.4 billion to $68 billion (16.6% of GDP) on the back of higher revenues from fees & charges, personal income taxes, GST and stamp duty. These increases more than offset the decline in revenues from corporate income taxes and property taxes. (Chart 4.14) Fees & charges were boosted by a rise in vehicle quota premium collections as new vehicle registrations increased in 2016, even as the weighted average COE premium fell. (Chart 4.15) Overall, revenues from vehicle quota premiums rose by $1.3 billion to $6.3 billion for the year. At the same time, receipts from personal income taxes (PIT), including withholding taxes, rose by $1.1 billion due in part to the cessation of the one-off PIT rebate that was in place for YA2015. Meanwhile, revenues from GST rose by $0.6 billion amid moderate growth in consumption and stamp duties increased by $0.4 billion likely on account of a modest rise in property transactions in 2016 as a whole. (Chart 4.16) In comparison, corporate income tax receipts declined by $0.4 billion in 2016 compared to a year ago.
… while operating and development expenditures increased by more.
Total government expenditure rose by $11.8 billion to $72.9 billion (17.8% of GDP) in 2016 on account of higher spending on both operating and development items. (Chart 4.17) In terms of sectors, the bulk of the increase in total expenditure can be attributed to higher spending on economic4 and social development. (Chart 4.18) Operating expenditure, which includes expenses on manpower, and operating grants to statutory boards
Chart 4.14 Components of Operating Revenue
* Includes withholding tax.
Chart 4.15 COE Premiums and New Vehicle Registrations
* Weighted by the COE quota of each category.
Chart 4.16 Residential Price Index and Property
Transaction Volumes
* Flash estimate.
4 The economic development category comprises Transport, Trade and Industry, Manpower (excluding Financial Security)
and Info-Communications and Media Development. The social development category comprises Education, National Development, Health, Environment and Water Resources, Culture, Community and Youth, Social and Family Development, Communications and Information and Manpower (Financial Security).
0 5 10 15
Corporate Income TaxPersonal Income Tax*
GSTFees & Charges
Other TaxesProperty TaxStamp Duty
Customs & Excise DutiesBetting Taxes
Motor Vehicle TaxesStat Boards' Contributions
$ Billion
2015 2016
0
10
20
30
40
50
60
70
0
2
4
6
8
10
12
14
2011 2012 2013 2014 2015 2016 2017
$ Th
ousa
nd
Thou
sand
Mar
Weighted COE Premiums (RHS)*
New Vehicle Registrations
100
110
120
130
140
150
160
0
2
4
6
8
10
12
2011 2012 2013 2014 2015 2016 2017 Q1*
Inde
x (Q
1 20
09=1
00)
Thou
sand
Uni
ts
TransactionVolume
Residential Price Index (RHS)
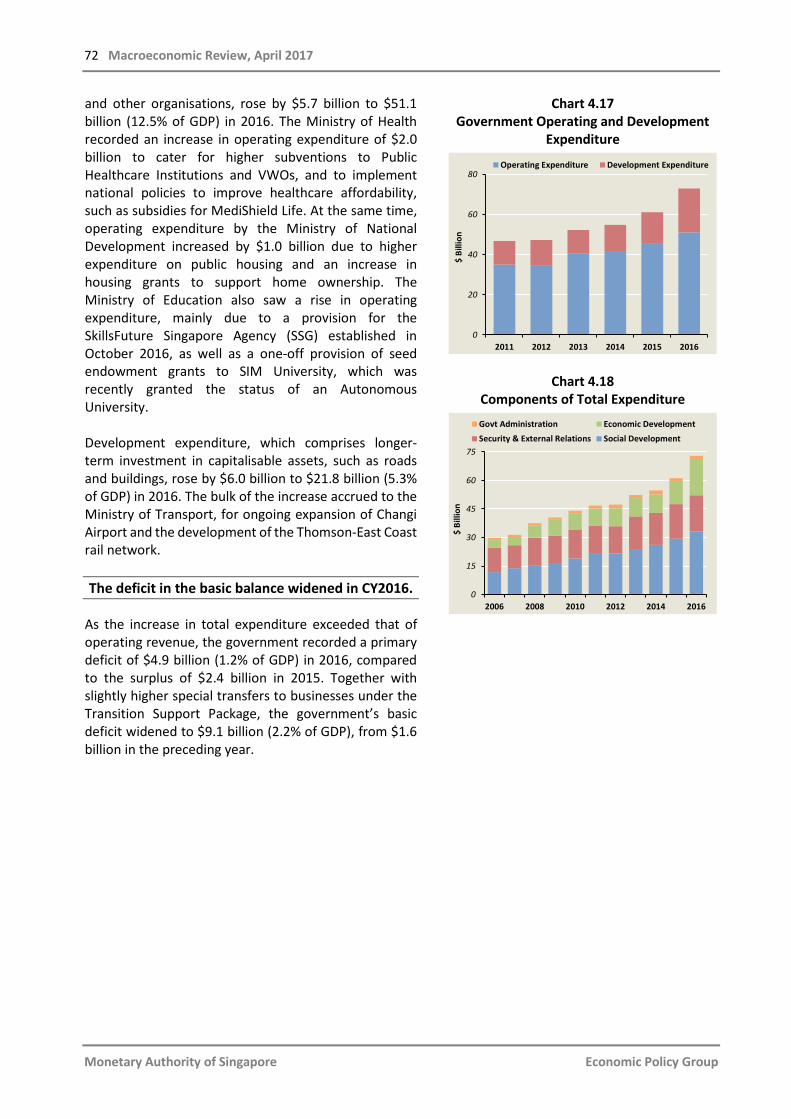
72 Macroeconomic Review, April 2017
Monetary Authority of Singapore Economic Policy Group
and other organisations, rose by $5.7 billion to $51.1 billion (12.5% of GDP) in 2016. The Ministry of Health recorded an increase in operating expenditure of $2.0 billion to cater for higher subventions to Public Healthcare Institutions and VWOs, and to implement national policies to improve healthcare affordability, such as subsidies for MediShield Life. At the same time, operating expenditure by the Ministry of National Development increased by $1.0 billion due to higher expenditure on public housing and an increase in housing grants to support home ownership. The Ministry of Education also saw a rise in operating expenditure, mainly due to a provision for the SkillsFuture Singapore Agency (SSG) established in October 2016, as well as a one-off provision of seed endowment grants to SIM University, which was recently granted the status of an Autonomous University. Development expenditure, which comprises longer-term investment in capitalisable assets, such as roads and buildings, rose by $6.0 billion to $21.8 billion (5.3% of GDP) in 2016. The bulk of the increase accrued to the Ministry of Transport, for ongoing expansion of Changi Airport and the development of the Thomson-East Coast rail network. The deficit in the basic balance widened in CY2016.
As the increase in total expenditure exceeded that of operating revenue, the government recorded a primary deficit of $4.9 billion (1.2% of GDP) in 2016, compared to the surplus of $2.4 billion in 2015. Together with slightly higher special transfers to businesses under the Transition Support Package, the government’s basic deficit widened to $9.1 billion (2.2% of GDP), from $1.6 billion in the preceding year.
Chart 4.17 Government Operating and Development
Expenditure
Chart 4.18 Components of Total Expenditure
0
20
40
60
80
2011 2012 2013 2014 2015 2016
$ Bi
llion
Operating Expenditure Development Expenditure
0
15
30
45
60
75
2006 2008 2010 2012 2014 2016
$ Bi
llion
Govt Administration Economic DevelopmentSecurity & External Relations Social Development

Macroeconomic Policy 73
Monetary Authority of Singapore Economic Policy Group
Box C
The Currency Interchangeability Agreement: Fifty Years On1/
Introduction On 12 June 1967, Malaysia, Singapore, and Brunei Darussalam (Brunei) began issuing their own currencies—the Malaysian dollar2/, Singapore dollar, and Brunei dollar—in place of the Malaya and British Borneo dollar that previously circulated in these territories. At the same time, each country signed a Currency Interchangeability Agreement with the other two, undertaking to accept each other’s currency and to exchange it at par, without charge, into its own currency. In other words, the three currencies would not be legal tender when circulating in the other participating countries but they would be “customary tender” and would be repatriated to the issuing country periodically. This Box reviews the historical background to the Agreement and the subsequent developments that led to Singapore and Brunei maintaining interchangeability to the present day. It also explores how the Agreement has remained relevant for both countries over the years despite significant economic challenges as well as changes to each country's institutional arrangements for currency issuance. From Straits Dollarisation to Malayan Currency Area (1897–1967) The historical roots of the Currency Interchangeability Agreement can be traced to the turn of the last century, when the Board of Commissioners of Currency for the Straits Settlements (comprising Singapore, Penang and Malacca) was established in 1897. By the early 20th century, the Board was issuing Straits Settlements currency notes and minting Straits Settlements silver dollars. Singapore and the other Straits ports had, therefore, acquired a uniform and unified domestic currency, as well as a unit of account. In actual fact, however, the currency of the Straits Settlements also circulated widely in the rest of the Malay Peninsula, British North Borneo (Sabah), Sarawak and Brunei, alongside the British North Borneo dollar and the Sarawak dollar, which were exchangeable at par with the Straits dollar. Brunei had become a British Protectorate in 1888, and its colonial and economic links with the Straits Settlements led to the Straits dollar becoming the currency of choice. There was thus de facto “Straits dollarisation” in Brunei by virtue of the latter’s use of the Straits dollar. In 1933, the Blackett Report recommended the creation of a common currency encompassing the Straits Settlements, the Malay States, and Brunei through joint participation in a pan-Malayan currency board. This recommendation was motivated by the desire for the Malay states, which had hitherto utilised the Straits dollar for free, to bear the costs of note issuance as well as share in the profits3/ from the operation of a currency board (Drake, 1981). The Currency Ordinance of 1938 put into effect these recommendations, and Singapore and Brunei were thus formally linked through a common currency—the Malayan dollar—with the Malay states. These arrangements were disrupted by the outbreak of World War II, but subsequently revived and expanded to include North Borneo and Sarawak in 1950. The Malayan Currency Board was renamed the Board of Commissioners of Currency Malaya and British Borneo, and it began to issue the Malaya and British Borneo dollar from 1953. With this development, Singapore and Brunei had moved from sharing a “Pan-Malayan Currency” to being officially part of a wider “Malayan Currency Area” (Lee, 1990). ____________________________________________________________________
1/ This Box is written in collaboration with the Autoriti Monetari Brunei Darussalam. It has benefited from comments by Mr Freddy Orchard and Associate Professor Peter Wilson.
2/ The Malaysian dollar was renamed the Malaysian ringgit in August 1975. 3/ The Straits Settlements would receive, and bear, 37% of the profits and liabilities associated with currency issuance.
Brunei’s share was 0.75% (Straits Settlements Legislative Council Proceedings, 1934, as cited in Lee, 1990).
74 Macroeconomic Review, April 2017
Monetary Authority of Singapore Economic Policy Group
The Currency Interchangeability Agreements of 1967 In 1957, Malaya obtained independence and following that, a central bank, Bank Negara Tanah Melayu (Central Bank of Malaya), was established in 1959. Bank Negara’s statutes included a provision for the Bank to extend its operations to Singapore, Sabah and Sarawak, since these states were expected to eventually merge with Malaya. In the event, the union of the four territories in the new political entity of Malaysia was completed in September 1963. However, as currency issuance still resided with the Currency Board, the renamed Bank Negara Malaysia’s (BNM) autonomy in the conduct of monetary policy through discretionary changes in the money supply was circumscribed. Malaysia lodged a “notice of replacement” to the Currency Board in 1964 to inform the latter that it would issue its own currency beginning from December 1966. Accordingly, Malaysia worked towards dismantling the Currency Board and allowing BNM to take on the sole responsibility of issuing a new Malaysian dollar. Brunei, which had remained under British administration, was still reconsidering the currency issuance arrangements. On 9 August 1965, Singapore became a sovereign nation, but initially worked towards sharing a common currency with Malaysia. After all, the extensive business and trade linkages between the two economies, as well as their complementary economic relationship, meant that there was a compelling case to be made for a currency union to reduce the frictions and transactions costs associated with foreign exchange and payments. Despite multiple discussions between the two governments involving technical inputs from the IMF, negotiations for a common currency collapsed and each of the parties decided to take the route of monetary separation. It was in this context that on 12 June 1967, the BNM, as well as the newly-formed Board of Commissioners of Currency, Singapore (BCCS) and Brunei Currency Board (BCB), issued three separate currencies to replace the Malaya and British Borneo dollar: the Malaysian dollar, the Singapore dollar, and the Brunei dollar. These new currencies were de facto pegged through their link to the pound sterling, which helped to minimise disruptions in the commercial and banking sectors in these countries following the issuance of the new currencies. In addition, Malaysia, Singapore and Brunei signed Currency Interchangeability Agreements with each other, undertaking to accept one another’s currency and to exchange it at par, and without charge, with its own currency. These arrangements could be considered a pragmatic approach that acknowledged the depth of the economic links between their economies. They passed their first test when all three countries decided not to follow Britain’s move to devalue the pound sterling in November 1967.
Continued Currency Cooperation between Singapore and Brunei The interchangeability agreements faced another major challenge with the tumultuous events that shook the international monetary system in the early 1970s. In August 1971, US President Nixon closed the gold window and devalued the US dollar against gold, which automatically meant a revaluation of these currencies against the US dollar. Two years later, the post-war Bretton Woods system of fixed exchange rates broke down when all the major currencies decided to float against the US dollar. Against this external backdrop, and given its domestic development imperatives, the Malaysian government terminated its agreement with Singapore on 8 May 1973 and two weeks later, the interchangeability agreement between Brunei and Malaysia also ceased. Singapore and Brunei have continued with the Agreement ever since, despite significant structural changes to their economies as well as domestic monetary institutions and arrangements. Indeed, the Currency Interchangeability Arrangement has stood the test of time, having been resilient in the face of economic challenges such as the Asian Financial Crisis and Global Financial Crisis. There are several reasons why the Agreement has worked well for Singapore and Brunei over the years. First, the Agreement initially operated within the traditional currency board system, with the BCCS and BCB taking on the responsibility of currency issuance. This boosted investor confidence in both the Singapore and Brunei dollars. Subsequently, the BCCS retained the currency issuance function even after the Monetary Authority of Singapore (MAS) was established in 1971. Such an institutional configuration was novel, with the
Macroeconomic Policy 75
Monetary Authority of Singapore Economic Policy Group
IMF’s 1971 mission to Singapore noting that “the combination of a monetary authority together with an autonomous currency board is an interesting innovation which marks a departure from the conventional wisdom of central banking in the emergent countries.”4/ This sent a further signal to financial markets that the fledging monetary authority would not be able to print money to finance government deficits, thus helping to maintain confidence in the value of the Singapore dollar. While the institutional framework behind currency issuance in Singapore and Brunei continued to evolve over the latter half of the 20th century, the credibility and discipline necessary for the smooth functioning of the Agreement was preserved. Strictly speaking, Singapore had ceased to operate a currency board system from 1973 as the Singapore dollar was allowed to float against the US dollar, and could no longer be exchanged on demand for foreign currency at a fixed rate. However, the spirit of the currency board system remained. Thus, in 2002 when the BCCS was merged with MAS, Singapore continued to back currency issuance with external assets in the Currency Fund. Similarly, the Brunei Currency Board continued to manage currency issuance, even as it was renamed the Brunei Currency and Monetary Board in 2004, and reconstituted as the Autoriti Monetari Brunei Darussalam (AMBD) in 2011. Today, Brunei still operates a currency board system with the Brunei dollar anchored to the Singapore dollar at par. Second, the Currency Interchangeability Agreement is supported by Singapore and Brunei’s underlying economic fundamentals such as their strong external balance positions, including their foreign reserve holdings. The flexibility in both domestic economies have negated the need for asymmetric monetary policy, while Singapore and Brunei’s current account surpluses have accorded long-run support to their real effective exchange rates. Third, the Agreement has been compatible with macroeconomic stability in both Singapore and Brunei. In 1981, Singapore adopted an exchange rate-centred monetary policy framework, aimed at achieving low and stable inflation. From Singapore’s perspective, the nominal exchange rate was a relatively more effective anti-inflation instrument in the context of the small and very open Singapore economy (MAS, 1981/82). An appreciation of the trade-weighted Singapore dollar could be used, where necessary, to directly offset imported inflation and indirectly dampen demand for Singapore’s exports, and hence, factor inputs and costs. At the same time, the framework has also served as a credible nominal anchor (MAS, 2016). The exchange rate-centred monetary policy framework has undoubtedly been successful, since Singapore’s average CPI inflation rate moderated from 6.1% in 1970–80 to 1.9% over 1981–2016, well below a weighted average for OECD countries. Insofar as Brunei is also a small, open economy with a significant pass-through from import prices to domestic prices, it would benefit from the exchange rate-centred monetary policy framework. At the same time, it could be challenging for small, open economies with relatively less deep forex markets to adopt freely floating exchange rates. Singapore and Brunei’s cooperation on currency and exchange rates resolved this issue through a de facto peg of the Brunei dollar to the Singapore dollar. This has allowed both countries to share in the benefits of the strong nominal anchorage provided by an exchange rate-centred monetary policy framework. Indeed, CPI inflation in Brunei has been low and stable, averaging 1.6% over 1981–2016. It is noteworthy that the IMF has lauded the currency board arrangement with the Singapore dollar as having served Brunei well by providing a credible nominal anchor (IMF, 2016). Fourth, the Agreement has contributed to preserving and deepening the existing economic and financial linkages between Singapore and Brunei. The peg effectively eliminates foreign exchange rate risks between the two currencies while minimising transaction costs, thereby facilitating tourism, trade and investment between the countries. To the extent that Singapore is a major FX trading centre, these arrangements have also facilitated the convertibility of the Brunei dollar into other currencies. Indeed, in the years since the signing of the agreement, trade between the two countries has grown steadily from under US$20 million in 1968 to US$822 million in 2016. Despite the rapid growth in each country’s total trade with the rest of the ____________________________________________________________________
4/ Source: Orchard (2016), quoting the concluding statement of the IMF Article VIII Consultation, 1971.
76 Macroeconomic Review, April 2017
Monetary Authority of Singapore Economic Policy Group
world, Singapore has remained one of Brunei’s top 10 trading partners. In 2000–16, Singapore accounted for approximately 18% of Brunei’s total imports on average, up from 16% in 1967–80. Over the two time periods, Singapore’s share in Brunei’s total exports has remained stable at around 3%. Singapore’s trade in services with Brunei has risen from US$76 million in 2000 to US$400 million in 2015, and has expanded more rapidly than Singapore’s trade in services with the world. Conclusion Over the last fifty years, the Currency Interchangeability Agreement has been mutually beneficial for both Singapore and Brunei, and it has remained intact despite significant economic challenges faced by both countries over the years. The monetary arrangements prevailing in the two economies have evolved, but the essential spirit of cooperation has stayed the same. The domestic and international purchasing power of the Singapore dollar is anchored by the credibility of MAS’ exchange rate-centred monetary policy in keeping inflation low and stable, and this has been extended to Brunei via the Agreement and the Brunei dollar’s peg to the Singapore dollar. These arrangements have also enabled both countries to benefit from stronger trade and investment flows, and the Agreement remains as relevant and valuable today as it did fifty years ago. At the same time, it stands as a solid testament to the strong historical links between the two countries and the close relationship enjoyed by AMBD and MAS. References Drake, P J (1981), “The Evolution of Money in Singapore since 1819”, Papers on Monetary Economics, Monetary Authority of Singapore 10th Anniversary Publication. International Monetary Fund (2016), “IMF Executive Board Concludes 2016 Article IV Consultation with Brunei Darussalam”, Press Release No. 16/247. Lee, S (1990), The Monetary and Banking Development of Singapore and Malaysia, Singapore University Press, Third Edition. Monetary Authority of Singapore (1981/82), Annual Report. Monetary Authority of Singapore (2016), “Singapore’s Monetary History: The Quest for a Nominal Anchor”, Macroeconomic Review, Vol. XV (2), pp. 78–86. Orchard, F (2016), Safeguarding the Future: the Story of How Singapore Has Managed its Reserves and the Founding of GIC, e-book available at gichistory.gic.com.sg

Special Features
78 Macroeconomic Review, April 2017
Monetary Authority of Singapore Economic Policy Group
Optimal Control In The Monetary Model Of Singapore1 Introduction
In the last three decades, central banks have focused primarily on achieving price stability, while balancing other policy objectives such as output and employment stabilisation. Optimal monetary policy was seen as a choice of how best to manage the short-run trade-off between these goals while ensuring that the long-run objective of price stability was met. This endeavour has been reflected in the way monetary policy is incorporated into macroeconomic models, either by specifying a target path for the policy instrument or through simple feedback rules, such as the well-known Taylor rule. Another method that has stood the test of time, and gained renewed prominence recently, is optimal control policy. 2 Optimal control techniques are regularly deployed in both the physical and social sciences to solve for the trajectories of control variables in dynamic systems, in order to achieve pre-specified goals. In the monetary policy arena, the optimal control approach entails solving a large-scale macroeconomic model to find the path of the policy instrument that would achieve macroeconomic stability. In this case, the goals are typically the minimisation of deviations of inflation and unemployment from their respective targets.
The aim of this Special Feature is to describe and illustrate the use of an optimal control facility that was recently added to the Monetary Model of Singapore (MMS). Launched in 2000, the MMS is the flagship model used by the Economic Policy Group (EPG) at MAS for the purpose of monetary policy analysis. 3 The model is routinely used to generate economic forecasts, conduct scenario analysis, and perform policy simulations. Hence, the incorporation of an optimal control feature into the MMS is part of EPG’s ongoing efforts to enhance its quantitative economic toolkit. The feature begins with a succinct exposition of the optimal control methodology introduced into the MMS and relates it to the discussion of loss functions in the central banking literature. The optimal control policy is then applied in a retrospective historical setting, and the implied macroeconomic consequences are compared with actual outcomes. Finally, the sensitivity of the results to alternative prioritisations of policy objectives is examined.
1 This feature was done in collaboration with Christopher Murphy, Director of Independent Economics and a Visiting Fellow
at the Australian National University. Mr Murphy is a consultant to EPG, MAS. 2 Janet Yellen gave prominence to the Federal Reserve’s use of optimal control methods in her 2012 speech, when she
compared an optimal control policy path with the Taylor rule, and showed that the optimal path would only raise the Federal Funds Rate around early 2016 in order to lower unemployment more quickly and allow inflation to overshoot its target for some time. In a subsequent speech in October 2016, Yellen suggested that hysteresis—the adverse impact on the supply-side of the economy due to persistent shortfalls in aggregate demand—could potentially be reversed by temporarily running a “high-pressure economy” with robust aggregate demand and a tight labour market. See Yellen (2012), Yellen (2016) and Brayton, Laubach and Reifschneider (2014).
3 MAS (2014a) provides a description of EPG’s suite of models.
Special Feature A
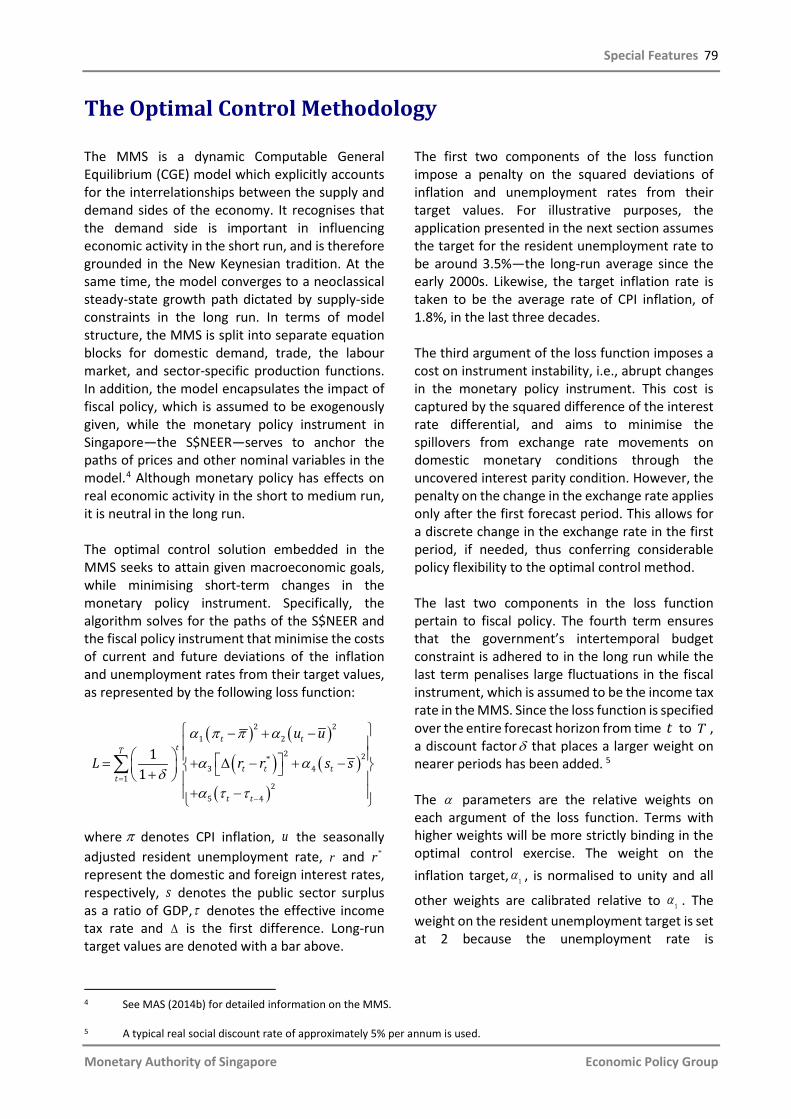
Special Features 79
Monetary Authority of Singapore Economic Policy Group
The Optimal Control Methodology
The MMS is a dynamic Computable General Equilibrium (CGE) model which explicitly accounts for the interrelationships between the supply and demand sides of the economy. It recognises that the demand side is important in influencing economic activity in the short run, and is therefore grounded in the New Keynesian tradition. At the same time, the model converges to a neoclassical steady-state growth path dictated by supply-side constraints in the long run. In terms of model structure, the MMS is split into separate equation blocks for domestic demand, trade, the labour market, and sector-specific production functions. In addition, the model encapsulates the impact of fiscal policy, which is assumed to be exogenously given, while the monetary policy instrument in Singapore—the S$NEER—serves to anchor the paths of prices and other nominal variables in the model.4 Although monetary policy has effects on real economic activity in the short to medium run, it is neutral in the long run. The optimal control solution embedded in the MMS seeks to attain given macroeconomic goals, while minimising short-term changes in the monetary policy instrument. Specifically, the algorithm solves for the paths of the S$NEER and the fiscal policy instrument that minimise the costs of current and future deviations of the inflation and unemployment rates from their target values, as represented by the following loss function:
( ) ( )
( ) ( )
( )
*
α π π α
τ τ
α αδ
α=
−
+ ∆ − + −
− + − = +
− +
∑t
t tT
t
t t
t
tt
r r s s
u u
L2
2 21 2
12
5 4
23 4
11
where π denotes CPI inflation, u the seasonally adjusted resident unemployment rate, r and *rrepresent the domestic and foreign interest rates, respectively, s denotes the public sector surplus as a ratio of GDP,τ denotes the effective income tax rate and ∆ is the first difference. Long-run target values are denoted with a bar above.
The first two components of the loss function impose a penalty on the squared deviations of inflation and unemployment rates from their target values. For illustrative purposes, the application presented in the next section assumes the target for the resident unemployment rate to be around 3.5%—the long-run average since the early 2000s. Likewise, the target inflation rate is taken to be the average rate of CPI inflation, of 1.8%, in the last three decades. The third argument of the loss function imposes a cost on instrument instability, i.e., abrupt changes in the monetary policy instrument. This cost is captured by the squared difference of the interest rate differential, and aims to minimise the spillovers from exchange rate movements on domestic monetary conditions through the uncovered interest parity condition. However, the penalty on the change in the exchange rate applies only after the first forecast period. This allows for a discrete change in the exchange rate in the first period, if needed, thus conferring considerable policy flexibility to the optimal control method. The last two components in the loss function pertain to fiscal policy. The fourth term ensures that the government’s intertemporal budget constraint is adhered to in the long run while the last term penalises large fluctuations in the fiscal instrument, which is assumed to be the income tax rate in the MMS. Since the loss function is specified over the entire forecast horizon from time t to T , a discount factorδ that places a larger weight on nearer periods has been added. 5 The α parameters are the relative weights on each argument of the loss function. Terms with higher weights will be more strictly binding in the optimal control exercise. The weight on the inflation target, 1α , is normalised to unity and all
other weights are calibrated relative to 1α . The weight on the resident unemployment target is set at 2 because the unemployment rate is
4 See MAS (2014b) for detailed information on the MMS. 5 A typical real social discount rate of approximately 5% per annum is used.
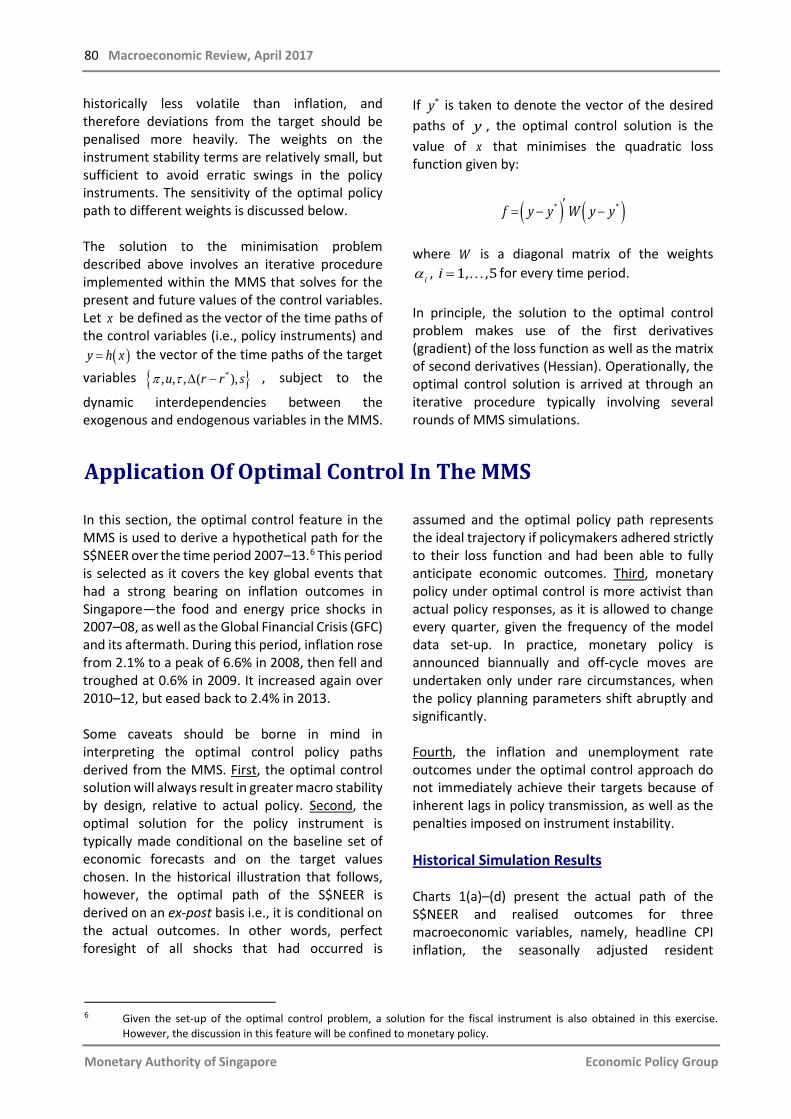
80 Macroeconomic Review, April 2017
Monetary Authority of Singapore Economic Policy Group
historically less volatile than inflation, and therefore deviations from the target should be penalised more heavily. The weights on the instrument stability terms are relatively small, but sufficient to avoid erratic swings in the policy instruments. The sensitivity of the optimal policy path to different weights is discussed below. The solution to the minimisation problem described above involves an iterative procedure implemented within the MMS that solves for the present and future values of the control variables. Let x be defined as the vector of the time paths of the control variables (i.e., policy instruments) and
( )=y h x the vector of the time paths of the target variables { }*, , , ( ),π τ ∆ −u r r s , subject to the
dynamic interdependencies between the exogenous and endogenous variables in the MMS.
If *y is taken to denote the vector of the desired paths of y , the optimal control solution is the value of x that minimises the quadratic loss function given by:
( ) ( )′= − −f y y W y y* *
where W is a diagonal matrix of the weights α = i i, 1, ,5 for every time period. In principle, the solution to the optimal control problem makes use of the first derivatives (gradient) of the loss function as well as the matrix of second derivatives (Hessian). Operationally, the optimal control solution is arrived at through an iterative procedure typically involving several rounds of MMS simulations.
Application Of Optimal Control In The MMS
In this section, the optimal control feature in the MMS is used to derive a hypothetical path for the S$NEER over the time period 2007–13.6 This period is selected as it covers the key global events that had a strong bearing on inflation outcomes in Singapore—the food and energy price shocks in 2007–08, as well as the Global Financial Crisis (GFC) and its aftermath. During this period, inflation rose from 2.1% to a peak of 6.6% in 2008, then fell and troughed at 0.6% in 2009. It increased again over 2010–12, but eased back to 2.4% in 2013. Some caveats should be borne in mind in interpreting the optimal control policy paths derived from the MMS. First, the optimal control solution will always result in greater macro stability by design, relative to actual policy. Second, the optimal solution for the policy instrument is typically made conditional on the baseline set of economic forecasts and on the target values chosen. In the historical illustration that follows, however, the optimal path of the S$NEER is derived on an ex-post basis i.e., it is conditional on the actual outcomes. In other words, perfect foresight of all shocks that had occurred is
assumed and the optimal policy path represents the ideal trajectory if policymakers adhered strictly to their loss function and had been able to fully anticipate economic outcomes. Third, monetary policy under optimal control is more activist than actual policy responses, as it is allowed to change every quarter, given the frequency of the model data set-up. In practice, monetary policy is announced biannually and off-cycle moves are undertaken only under rare circumstances, when the policy planning parameters shift abruptly and significantly. Fourth, the inflation and unemployment rate outcomes under the optimal control approach do not immediately achieve their targets because of inherent lags in policy transmission, as well as the penalties imposed on instrument instability. Historical Simulation Results Charts 1(a)–(d) present the actual path of the S$NEER and realised outcomes for three macroeconomic variables, namely, headline CPI inflation, the seasonally adjusted resident
6 Given the set-up of the optimal control problem, a solution for the fiscal instrument is also obtained in this exercise.
However, the discussion in this feature will be confined to monetary policy.
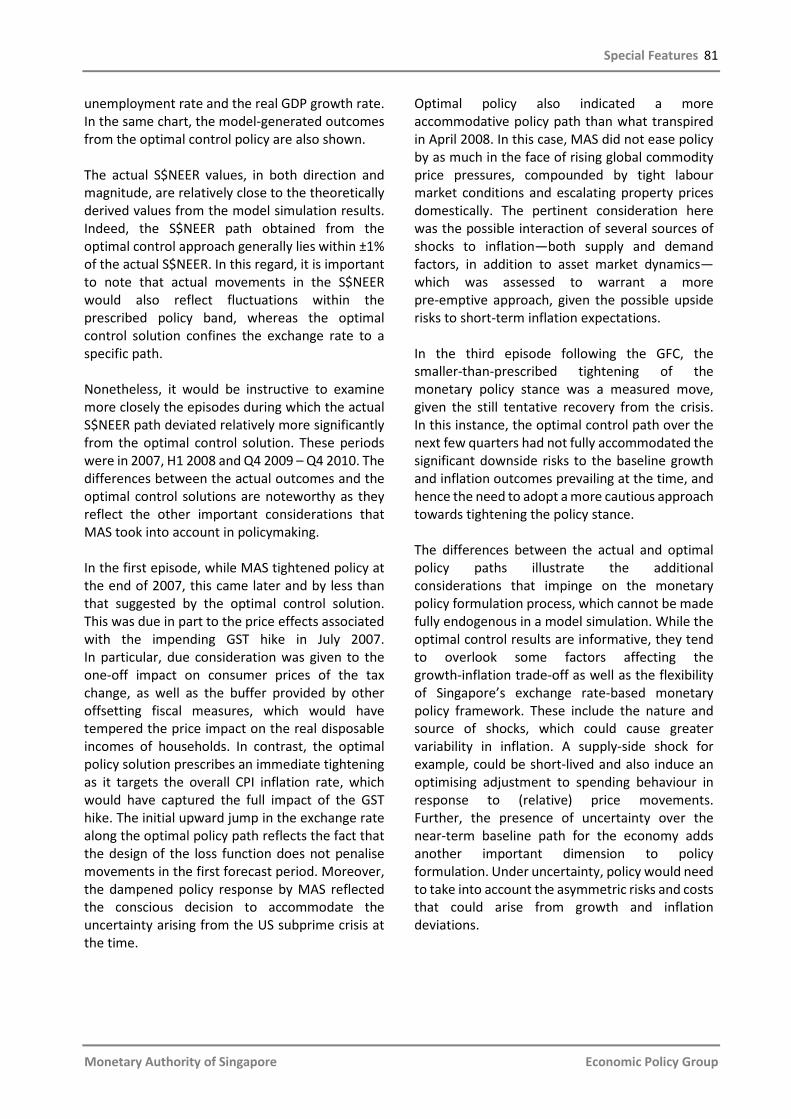
Special Features 81
Monetary Authority of Singapore Economic Policy Group
unemployment rate and the real GDP growth rate. In the same chart, the model-generated outcomes from the optimal control policy are also shown. The actual S$NEER values, in both direction and magnitude, are relatively close to the theoretically derived values from the model simulation results. Indeed, the S$NEER path obtained from the optimal control approach generally lies within ±1% of the actual S$NEER. In this regard, it is important to note that actual movements in the S$NEER would also reflect fluctuations within the prescribed policy band, whereas the optimal control solution confines the exchange rate to a specific path. Nonetheless, it would be instructive to examine more closely the episodes during which the actual S$NEER path deviated relatively more significantly from the optimal control solution. These periods were in 2007, H1 2008 and Q4 2009 – Q4 2010. The differences between the actual outcomes and the optimal control solutions are noteworthy as they reflect the other important considerations that MAS took into account in policymaking. In the first episode, while MAS tightened policy at the end of 2007, this came later and by less than that suggested by the optimal control solution. This was due in part to the price effects associated with the impending GST hike in July 2007. In particular, due consideration was given to the one-off impact on consumer prices of the tax change, as well as the buffer provided by other offsetting fiscal measures, which would have tempered the price impact on the real disposable incomes of households. In contrast, the optimal policy solution prescribes an immediate tightening as it targets the overall CPI inflation rate, which would have captured the full impact of the GST hike. The initial upward jump in the exchange rate along the optimal policy path reflects the fact that the design of the loss function does not penalise movements in the first forecast period. Moreover, the dampened policy response by MAS reflected the conscious decision to accommodate the uncertainty arising from the US subprime crisis at the time.
Optimal policy also indicated a more accommodative policy path than what transpired in April 2008. In this case, MAS did not ease policy by as much in the face of rising global commodity price pressures, compounded by tight labour market conditions and escalating property prices domestically. The pertinent consideration here was the possible interaction of several sources of shocks to inflation—both supply and demand factors, in addition to asset market dynamics—which was assessed to warrant a more pre-emptive approach, given the possible upside risks to short-term inflation expectations. In the third episode following the GFC, the smaller-than-prescribed tightening of the monetary policy stance was a measured move, given the still tentative recovery from the crisis. In this instance, the optimal control path over the next few quarters had not fully accommodated the significant downside risks to the baseline growth and inflation outcomes prevailing at the time, and hence the need to adopt a more cautious approach towards tightening the policy stance. The differences between the actual and optimal policy paths illustrate the additional considerations that impinge on the monetary policy formulation process, which cannot be made fully endogenous in a model simulation. While the optimal control results are informative, they tend to overlook some factors affecting the growth-inflation trade-off as well as the flexibility of Singapore’s exchange rate-based monetary policy framework. These include the nature and source of shocks, which could cause greater variability in inflation. A supply-side shock for example, could be short-lived and also induce an optimising adjustment to spending behaviour in response to (relative) price movements. Further, the presence of uncertainty over the near-term baseline path for the economy adds another important dimension to policy formulation. Under uncertainty, policy would need to take into account the asymmetric risks and costs that could arise from growth and inflation deviations.
.
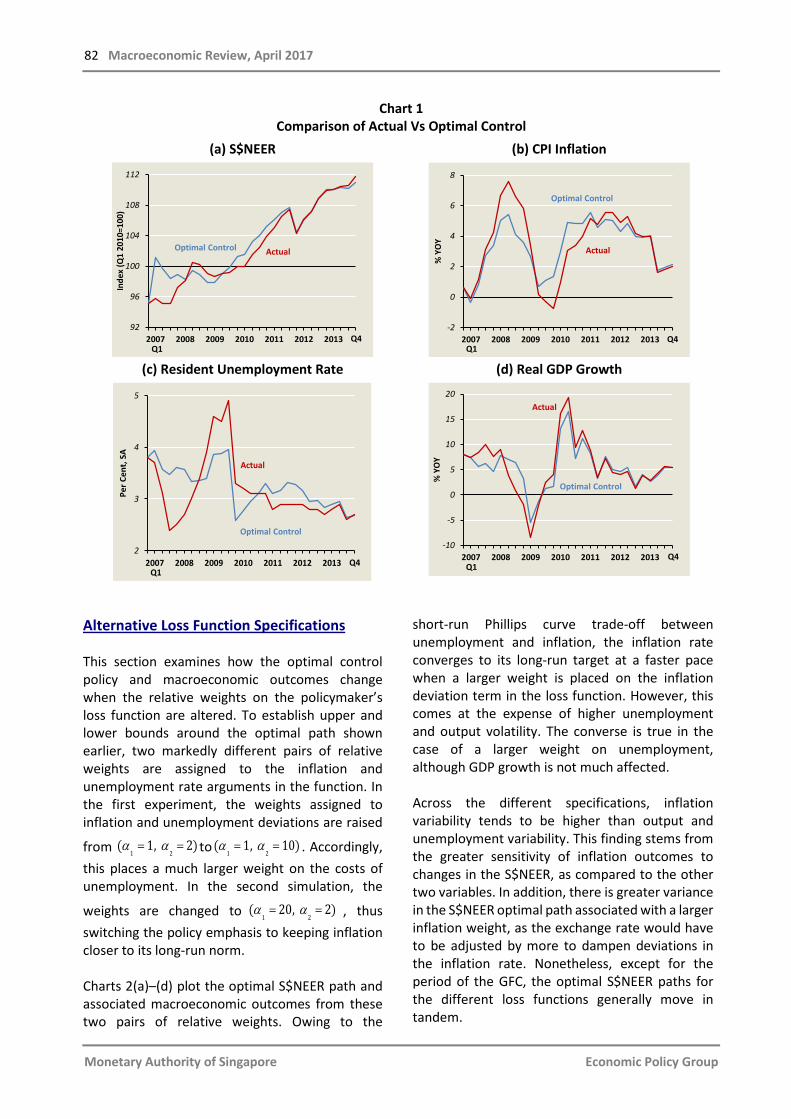
82 Macroeconomic Review, April 2017
Monetary Authority of Singapore Economic Policy Group
Chart 1 Comparison of Actual Vs Optimal Control
(a) S$NEER
(b) CPI Inflation
(c) Resident Unemployment Rate
(d) Real GDP Growth
Alternative Loss Function Specifications This section examines how the optimal control policy and macroeconomic outcomes change when the relative weights on the policymaker’s loss function are altered. To establish upper and lower bounds around the optimal path shown earlier, two markedly different pairs of relative weights are assigned to the inflation and unemployment rate arguments in the function. In the first experiment, the weights assigned to inflation and unemployment deviations are raised
from α α= =1 2
( 1, 2) to α α= =1 2
( 1, 10) . Accordingly, this places a much larger weight on the costs of unemployment. In the second simulation, the
weights are changed to α α= =1 2
( 20, 2) , thus switching the policy emphasis to keeping inflation closer to its long-run norm. Charts 2(a)–(d) plot the optimal S$NEER path and associated macroeconomic outcomes from these two pairs of relative weights. Owing to the
short-run Phillips curve trade-off between unemployment and inflation, the inflation rate converges to its long-run target at a faster pace when a larger weight is placed on the inflation deviation term in the loss function. However, this comes at the expense of higher unemployment and output volatility. The converse is true in the case of a larger weight on unemployment, although GDP growth is not much affected. Across the different specifications, inflation variability tends to be higher than output and unemployment variability. This finding stems from the greater sensitivity of inflation outcomes to changes in the S$NEER, as compared to the other two variables. In addition, there is greater variance in the S$NEER optimal path associated with a larger inflation weight, as the exchange rate would have to be adjusted by more to dampen deviations in the inflation rate. Nonetheless, except for the period of the GFC, the optimal S$NEER paths for the different loss functions generally move in tandem.
2007 2008 2009 2010 2011 2012 201392
96
100
104
108
112
Inde
x (Q
1 20
10=1
00)
Q4Q1
Optimal Control Actual
2007 2008 2009 2010 2011 2012 2013-2
0
2
4
6
8
% Y
OY
Q1Q4
Optimal Control
Actual
2007 2008 2009 2010 2011 2012 20132
3
4
5
Per C
ent,
SA
Q1Q4
Optimal Control
Actual
2007 2008 2009 2010 2011 2012 2013-10
-5
0
5
10
15
20
% Y
OY
Q1Q4
Optimal Control
Actual
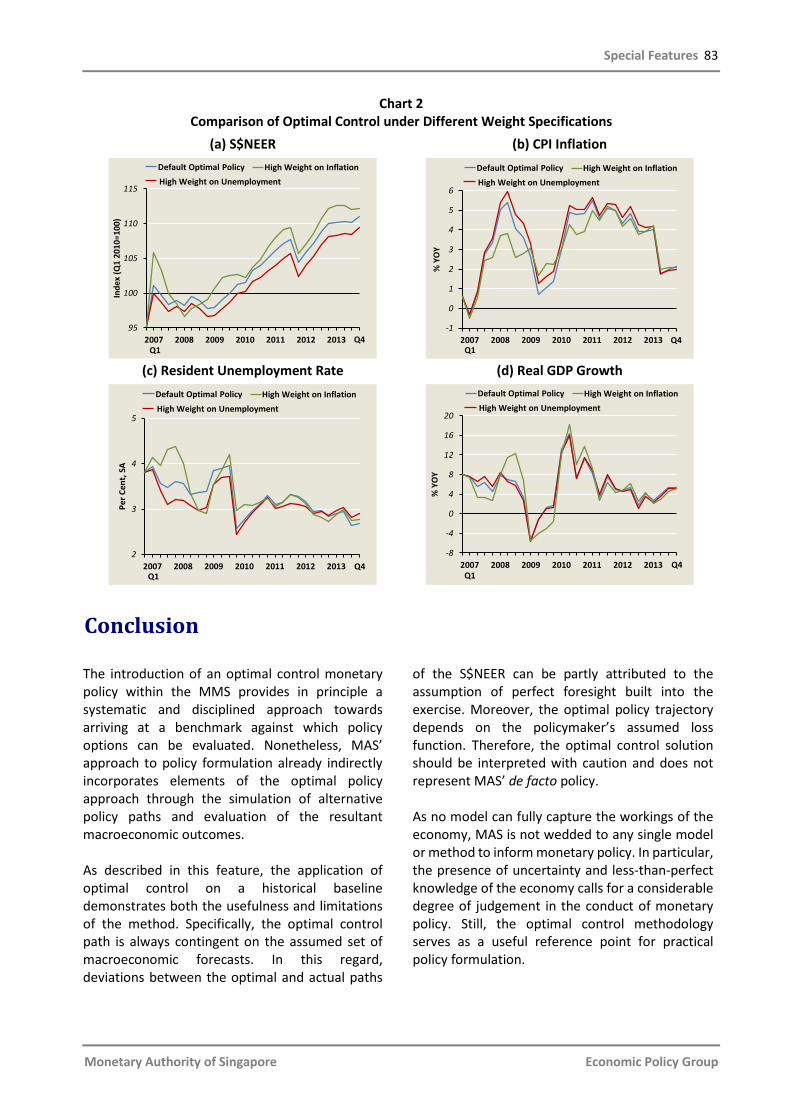
Special Features 83
Monetary Authority of Singapore Economic Policy Group
Chart 2 Comparison of Optimal Control under Different Weight Specifications
(a) S$NEER
(b) CPI Inflation
(c) Resident Unemployment Rate (d) Real GDP Growth
Conclusion
The introduction of an optimal control monetary policy within the MMS provides in principle a systematic and disciplined approach towards arriving at a benchmark against which policy options can be evaluated. Nonetheless, MAS’ approach to policy formulation already indirectly incorporates elements of the optimal policy approach through the simulation of alternative policy paths and evaluation of the resultant macroeconomic outcomes. As described in this feature, the application of optimal control on a historical baseline demonstrates both the usefulness and limitations of the method. Specifically, the optimal control path is always contingent on the assumed set of macroeconomic forecasts. In this regard, deviations between the optimal and actual paths
of the S$NEER can be partly attributed to the assumption of perfect foresight built into the exercise. Moreover, the optimal policy trajectory depends on the policymaker’s assumed loss function. Therefore, the optimal control solution should be interpreted with caution and does not represent MAS’ de facto policy. As no model can fully capture the workings of the economy, MAS is not wedded to any single model or method to inform monetary policy. In particular, the presence of uncertainty and less-than-perfect knowledge of the economy calls for a considerable degree of judgement in the conduct of monetary policy. Still, the optimal control methodology serves as a useful reference point for practical policy formulation.
2007 2008 2009 2010 2011 2012 201395
100
105
110
115
Inde
x (Q
1 20
10=1
00)
Q4Q1
Default Optimal PolicyHigh Weight on Unemployment
High Weight on Inflation
2007 2008 2009 2010 2011 2012 2013-1
0
1
2
3
4
5
6
% Y
OY
Q1Q4
Default Optimal PolicyHigh Weight on Unemployment
High Weight on Inflation
2007 2008 2009 2010 2011 2012 20132
3
4
5
Per C
ent,
SA
Default Optimal PolicyHigh Weight on Unemployment
High Weight on Inflation
Q1Q4 2007 2008 2009 2010 2011 2012 2013
-8
-4
0
4
8
12
16
20
% Y
OY
Default Optimal PolicyHigh Weight on Unemployment
High Weight on Inflation
Q1Q4
84 Macroeconomic Review, April 2017
Monetary Authority of Singapore Economic Policy Group
References Brayton, F, Laubach, T, and Reifschneider, D (2014), “Optimal-Control Monetary Policy in the FRB/US Model”, FEDS Notes. Monetary Authority of Singapore (2014a), “MAS Macroeconomic Modelling Workshop 2014”, Macroeconomic Review, Vol. XIII(2), pp. 76–85. Monetary Authority of Singapore (2014b), “The Monetary Model of Singapore (MMS): A Technical Overview” available at http://www.mas.gov.sg/~/media/MAS/Monetary%20Policy%20and%20Economics/Education%20and%20Research/Education/Macroeconometric%20Models/The%20Monetary%20Model%20of%20Singapore%20MMS%20A%20Technical%20Overview.pdf Yellen, J L (2012), “Perspectives on Monetary Policy”, speech at the Boston Economic Club Dinner available at https://www.federalreserve.gov/newsevents/speech/yellen20120606a.htm Yellen, J L (2016), “Macroeconomic Research after the Crisis”, speech at the 60th annual economic conference sponsored by the Federal Reserve Bank of Boston available at https://www.federalreserve.gov/newsevents/speech/yellen20161014a.htm
Special Features 85
Monetary Authority of Singapore Economic Policy Group
The Role Of Exchange Rates In International Price Adjustment by Charles Engel1
Introduction
There has been a great deal of attention recently focused on exchange rates and their role in determining competitiveness. For example, in September 2010, Guido Mantega, the Brazilian finance minister, commented that “we are in the middle of a currency war”, referring to the depreciation of the major currencies against those of Brazil and other emerging markets. In April 2014, Raghuram Rajan, then Governor of the Reserve Bank of India, complained about the “initiation of unconventional policy as well as an exit whose pace is driven solely by conditions in the source country,” specifically aiming his remarks at monetary policy in the US and other industrial countries that “hold interest rates near zero for long, as well as balance sheet policies such as quantitative easing or exchange intervention, that involve altering central bank balance sheets in order to affect certain market prices”. 2 More recently, in February 2017, US President Donald Trump called China “the grand champions at manipulation of currency”. In all of these instances, the policymakers believe that a change in the exchange rate—specifically, the nominal exchange rate—influences their respective country’s competitiveness. By “nominal” exchange rate, I am referring to the price of one currency in units of another country’s currency, such as the US dollar price of Chinese renminbi. Curiously, while many policymakers place primary responsibility on the nominal exchange rate for determination of international
price competitiveness, many academic studies assign no role at all to the nominal exchange rate. That is, in the academic studies, relative international prices are determined independently of the determination of nominal exchange rates. I believe that this disconnect between the beliefs of policymakers and the approach taken by many academic studies represents a failure by both parties. In short, the policymakers and politicians give insufficient attention to the price mechanism—the role that firms play in setting the prices of goods and services, and the role of supply and demand in determining prices. In contrast, the academic studies put too much faith in the price system, and fail to take into account the factors that lead to sluggish adjustment of prices and wages. I will argue here that nominal exchange rates do play a role in determining international prices and international competitiveness. The academic literature that recognises the importance of price and wage stickiness allows us to understand the part that nominal exchange rates play in determining international relative prices. On the other hand, it is important to emphasise that there is also a role for price adjustments, so that competitiveness is by no means determined only by the currency price.
1 Charles Engel is Hester Professor of Economics at the University of Wisconsin–Madison. Professor Engel visited MAS in
January 2017 as the MAS–NUS Term Professor in Economics and Finance. The views in this article are solely those of the author and should not be attributed to MAS.
2 See Rajan (2014).
Special Feature B
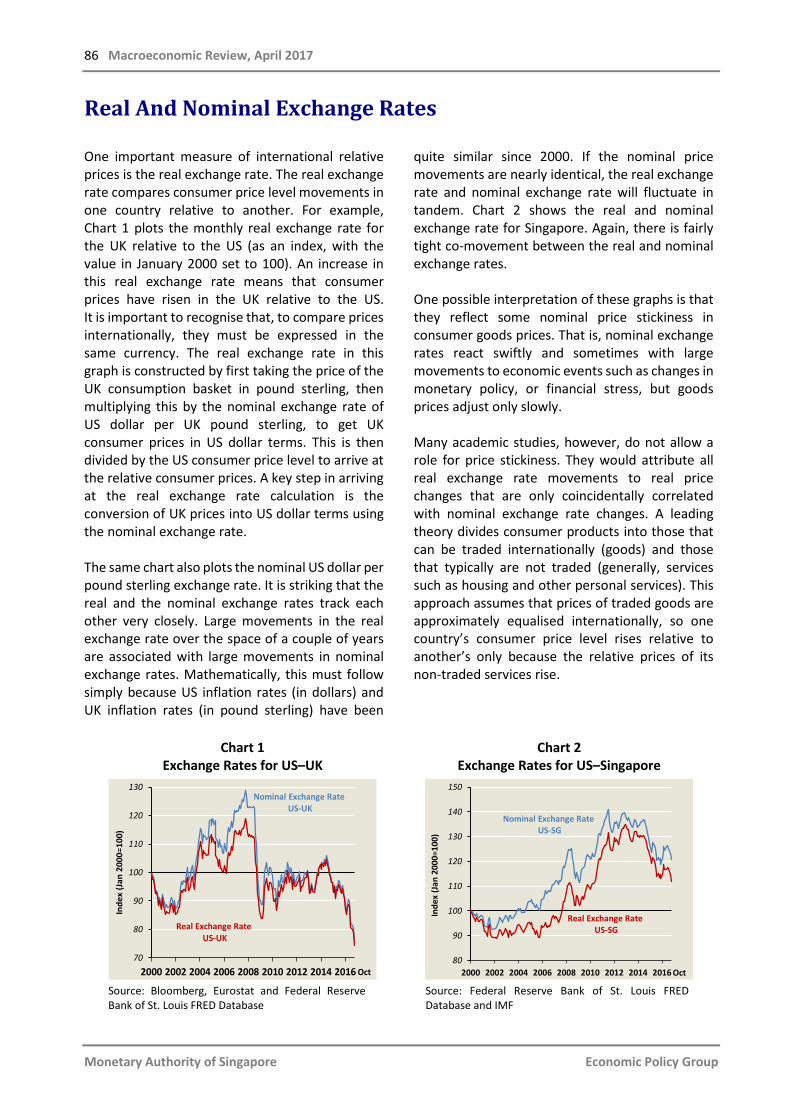
86 Macroeconomic Review, April 2017
Monetary Authority of Singapore Economic Policy Group
Real And Nominal Exchange Rates
One important measure of international relative prices is the real exchange rate. The real exchange rate compares consumer price level movements in one country relative to another. For example, Chart 1 plots the monthly real exchange rate for the UK relative to the US (as an index, with the value in January 2000 set to 100). An increase in this real exchange rate means that consumer prices have risen in the UK relative to the US. It is important to recognise that, to compare prices internationally, they must be expressed in the same currency. The real exchange rate in this graph is constructed by first taking the price of the UK consumption basket in pound sterling, then multiplying this by the nominal exchange rate of US dollar per UK pound sterling, to get UK consumer prices in US dollar terms. This is then divided by the US consumer price level to arrive at the relative consumer prices. A key step in arriving at the real exchange rate calculation is the conversion of UK prices into US dollar terms using the nominal exchange rate. The same chart also plots the nominal US dollar per pound sterling exchange rate. It is striking that the real and the nominal exchange rates track each other very closely. Large movements in the real exchange rate over the space of a couple of years are associated with large movements in nominal exchange rates. Mathematically, this must follow simply because US inflation rates (in dollars) and UK inflation rates (in pound sterling) have been
quite similar since 2000. If the nominal price movements are nearly identical, the real exchange rate and nominal exchange rate will fluctuate in tandem. Chart 2 shows the real and nominal exchange rate for Singapore. Again, there is fairly tight co-movement between the real and nominal exchange rates. One possible interpretation of these graphs is that they reflect some nominal price stickiness in consumer goods prices. That is, nominal exchange rates react swiftly and sometimes with large movements to economic events such as changes in monetary policy, or financial stress, but goods prices adjust only slowly. Many academic studies, however, do not allow a role for price stickiness. They would attribute all real exchange rate movements to real price changes that are only coincidentally correlated with nominal exchange rate changes. A leading theory divides consumer products into those that can be traded internationally (goods) and those that typically are not traded (generally, services such as housing and other personal services). This approach assumes that prices of traded goods are approximately equalised internationally, so one country’s consumer price level rises relative to another’s only because the relative prices of its non-traded services rise.
Chart 1
Exchange Rates for US–UK
Chart 2 Exchange Rates for US–Singapore
Source: Bloomberg, Eurostat and Federal Reserve Bank of St. Louis FRED Database
Source: Federal Reserve Bank of St. Louis FRED Database and IMF
2000 2002 2004 2006 2008 2010 2012 2014 201670
80
90
100
110
120
130
Inde
x (J
an 2
000=
100)
Nominal Exchange RateUS-UK
Real Exchange RateUS-UK
Oct 2000 2002 2004 2006 2008 2010 2012 2014 201680
90
100
110
120
130
140
150
Inde
x (J
an 2
000=
100)
Nominal Exchange RateUS-SG
Real Exchange RateUS-SG
Oct
Special Features 87
Monetary Authority of Singapore Economic Policy Group
Here is an example. Suppose that in the UK, prices of non-traded services (denominated in pound sterling) rise at an annual rate of 4%, and traded goods prices have no inflation. Assume each has a weight of one-half in the overall consumer price level, so the consumer price inflation in the UK is 2%. Now, assume in the US, the configuration is the opposite. Traded goods prices in the US rise by 4% per year in dollar terms, but prices of non-traded services have no inflation. If, again, each has a weight of one-half in the overall consumer price basket, the US inflation is also 2%. But if traded goods prices are equalised across countries, the US dollar price of pound sterling must increase by 4% (in order to equate the 4% dollar inflation in the US for traded goods to the 0% inflation of traded goods in the UK). In this example, the inflation rates in each country, expressed in their own currencies, are 2%. The relative price of UK consumer goods to US consumer goods rises by 4%. Mathematically, that is seen as a 4% increase in the nominal exchange rate. But underneath the surface, dramatic differences are occurring in these economies—services prices in the UK are rising relative to traded goods prices by 4%, while in the US services prices are falling relative to traded goods prices by 4%. Far from there being price stickiness, there are large relative price swings happening within these economies, so that the price of non-traded services in the UK relative to the US rises by 8%. While this example is representative of many academic models, is it realistic? There are at least two reasons to think it is not. First, if this were the mechanism at work—large relative price swings within countries—and there were no nominal price stickiness, we should see the same sort of forces at work whether the country has a fixed nominal exchange rate or a floating nominal exchange rate. It is the relative price swings that matter, not the nominal exchange rate adjustment. Mussa’s (1986) classic empirical study belies this claim. He documented extensively that real exchange rate movements are much less volatile when the nominal exchange rate is fixed. Indeed, consider Chart 3, which plots the real exchange rates for France relative to Germany. These countries have a nominal exchange rate that is fixed and equal to one, because they use the same currency. This real exchange rate shows considerably less volatility
than the US–UK real exchange rate. This is evidence that the volatility of the nominal exchange rate does indeed matter for the volatility of the real exchange rate. The second piece of evidence comes from Engel (1999). In that paper, I extensively examined the behaviour of the relative prices of non-traded to traded consumer prices within countries. I found that those relative price movements were always quite small, at least when we look at low-inflation, high-income countries. Instead, it appears that, contrary to the theory above, consumer prices of traded goods are not equalised across countries. Even as nominal exchange rates swing wildly, there is relatively little movement in consumer prices of tradable goods, when those are expressed in the consumers’ currencies. We often see, for example, annual changes in the dollar per pound sterling exchange rate in the range of 15–20% or more, but inflation rates of traded goods are very similar across the two countries. It seems clear that nominal prices of consumer goods do not respond to the same forces that drive nominal exchange rates, so that the “pass-through” of nominal exchange rates to consumer prices is quite small. Why do consumer prices adjust sluggishly? A rough summary of the empirical evidence points to two factors. First, it is somewhat costly for firms to change prices constantly. Firms need to assess the demand for their product, and the cost of producing the product, before setting a price. Market conditions change all the time, even within a day, but it is too costly for firms to reset prices constantly. They only occasionally recalculate the optimal price and change the price they charge to consumers. The second consideration is that there is a “coordination failure” among firms. For example, all producers of a particular product—say, knit cotton shirts—might recognise that a price increase would be optimal, perhaps because their costs have risen. Each firm, however, is reluctant to be the first to raise its price. By doing so, it will lose market share, at least temporarily, to the firms that change prices later. And, the firm could also lose customer loyalty if it is seen to be the first to pass along cost increases to its customers.
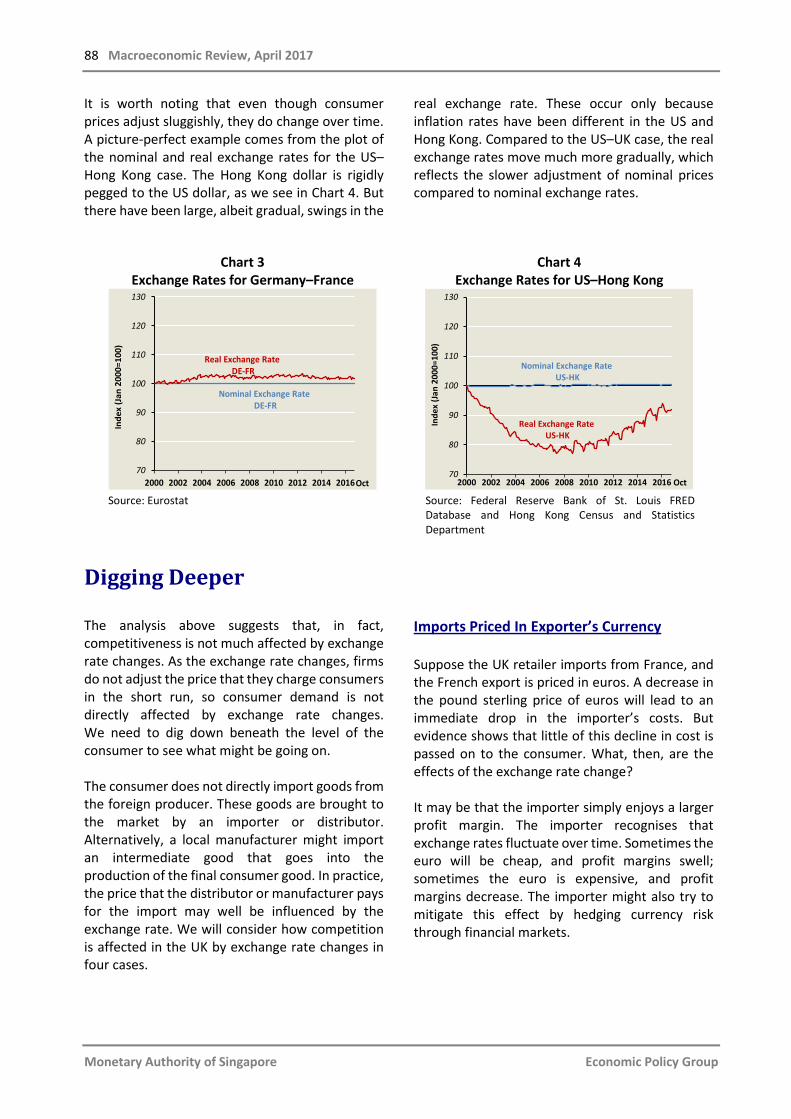
88 Macroeconomic Review, April 2017
Monetary Authority of Singapore Economic Policy Group
It is worth noting that even though consumer prices adjust sluggishly, they do change over time. A picture-perfect example comes from the plot of the nominal and real exchange rates for the US–Hong Kong case. The Hong Kong dollar is rigidly pegged to the US dollar, as we see in Chart 4. But there have been large, albeit gradual, swings in the
real exchange rate. These occur only because inflation rates have been different in the US and Hong Kong. Compared to the US–UK case, the real exchange rates move much more gradually, which reflects the slower adjustment of nominal prices compared to nominal exchange rates.
Chart 3
Exchange Rates for Germany–France Chart 4
Exchange Rates for US–Hong Kong
Source: Eurostat Source: Federal Reserve Bank of St. Louis FRED
Database and Hong Kong Census and Statistics Department
Digging Deeper
The analysis above suggests that, in fact, competitiveness is not much affected by exchange rate changes. As the exchange rate changes, firms do not adjust the price that they charge consumers in the short run, so consumer demand is not directly affected by exchange rate changes. We need to dig down beneath the level of the consumer to see what might be going on. The consumer does not directly import goods from the foreign producer. These goods are brought to the market by an importer or distributor. Alternatively, a local manufacturer might import an intermediate good that goes into the production of the final consumer good. In practice, the price that the distributor or manufacturer pays for the import may well be influenced by the exchange rate. We will consider how competition is affected in the UK by exchange rate changes in four cases.
Imports Priced In Exporter’s Currency
Suppose the UK retailer imports from France, and the French export is priced in euros. A decrease in the pound sterling price of euros will lead to an immediate drop in the importer’s costs. But evidence shows that little of this decline in cost is passed on to the consumer. What, then, are the effects of the exchange rate change? It may be that the importer simply enjoys a larger profit margin. The importer recognises that exchange rates fluctuate over time. Sometimes the euro will be cheap, and profit margins swell; sometimes the euro is expensive, and profit margins decrease. The importer might also try to mitigate this effect by hedging currency risk through financial markets.
2000 2002 2004 2006 2008 2010 2012 2014 201670
80
90
100
110
120
130
Inde
x (J
an 2
000=
100)
Real Exchange RateDE-FR
Nominal Exchange RateDE-FR
Oct 2000 2002 2004 2006 2008 2010 2012 2014 201670
80
90
100
110
120
130
Inde
x (J
an 2
000=
100)
Real Exchange RateUS-HK
Nominal Exchange RateUS-HK
Oct
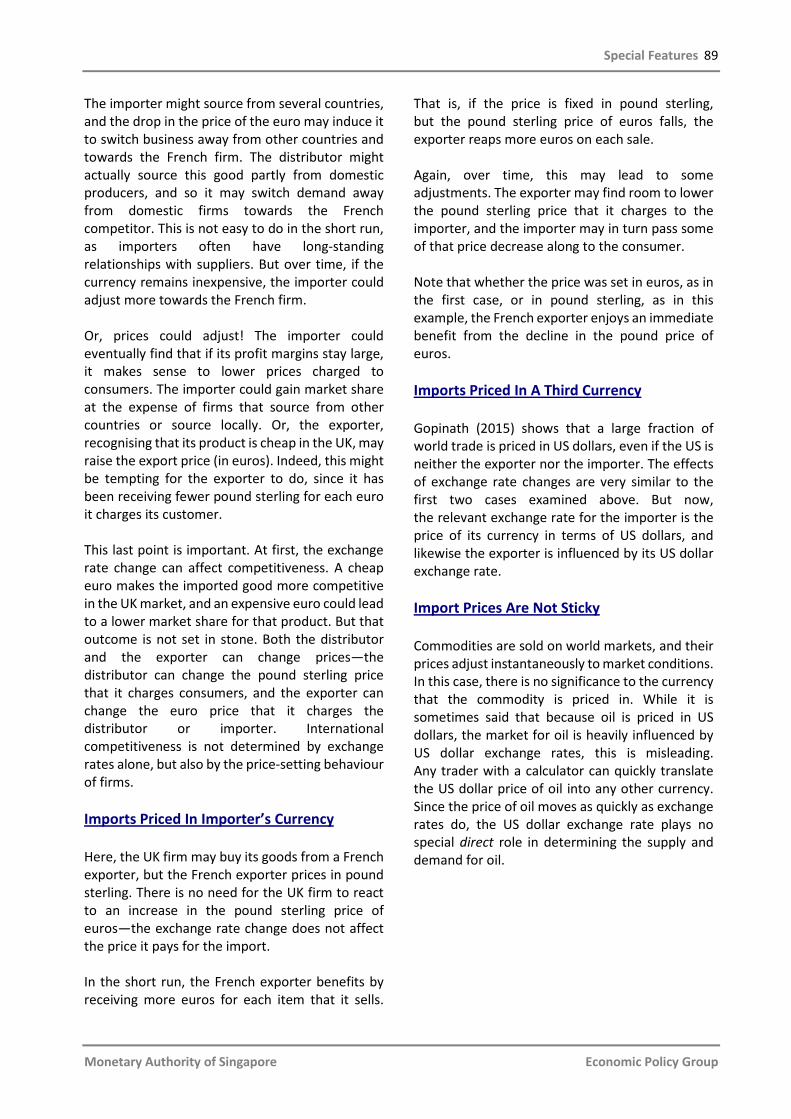
Special Features 89
Monetary Authority of Singapore Economic Policy Group
The importer might source from several countries, and the drop in the price of the euro may induce it to switch business away from other countries and towards the French firm. The distributor might actually source this good partly from domestic producers, and so it may switch demand away from domestic firms towards the French competitor. This is not easy to do in the short run, as importers often have long-standing relationships with suppliers. But over time, if the currency remains inexpensive, the importer could adjust more towards the French firm. Or, prices could adjust! The importer could eventually find that if its profit margins stay large, it makes sense to lower prices charged to consumers. The importer could gain market share at the expense of firms that source from other countries or source locally. Or, the exporter, recognising that its product is cheap in the UK, may raise the export price (in euros). Indeed, this might be tempting for the exporter to do, since it has been receiving fewer pound sterling for each euro it charges its customer. This last point is important. At first, the exchange rate change can affect competitiveness. A cheap euro makes the imported good more competitive in the UK market, and an expensive euro could lead to a lower market share for that product. But that outcome is not set in stone. Both the distributor and the exporter can change prices—the distributor can change the pound sterling price that it charges consumers, and the exporter can change the euro price that it charges the distributor or importer. International competitiveness is not determined by exchange rates alone, but also by the price-setting behaviour of firms. Imports Priced In Importer’s Currency
Here, the UK firm may buy its goods from a French exporter, but the French exporter prices in pound sterling. There is no need for the UK firm to react to an increase in the pound sterling price of euros—the exchange rate change does not affect the price it pays for the import. In the short run, the French exporter benefits by receiving more euros for each item that it sells.
That is, if the price is fixed in pound sterling, but the pound sterling price of euros falls, the exporter reaps more euros on each sale. Again, over time, this may lead to some adjustments. The exporter may find room to lower the pound sterling price that it charges to the importer, and the importer may in turn pass some of that price decrease along to the consumer. Note that whether the price was set in euros, as in the first case, or in pound sterling, as in this example, the French exporter enjoys an immediate benefit from the decline in the pound price of euros. Imports Priced In A Third Currency
Gopinath (2015) shows that a large fraction of world trade is priced in US dollars, even if the US is neither the exporter nor the importer. The effects of exchange rate changes are very similar to the first two cases examined above. But now, the relevant exchange rate for the importer is the price of its currency in terms of US dollars, and likewise the exporter is influenced by its US dollar exchange rate. Import Prices Are Not Sticky
Commodities are sold on world markets, and their prices adjust instantaneously to market conditions. In this case, there is no significance to the currency that the commodity is priced in. While it is sometimes said that because oil is priced in US dollars, the market for oil is heavily influenced by US dollar exchange rates, this is misleading. Any trader with a calculator can quickly translate the US dollar price of oil into any other currency. Since the price of oil moves as quickly as exchange rates do, the US dollar exchange rate plays no special direct role in determining the supply and demand for oil.
90 Macroeconomic Review, April 2017
Monetary Authority of Singapore Economic Policy Group
Other Considerations
Our analysis so far has assumed that the imported good is either an intermediate input, or a final consumer good, which has a price that is sticky in the consumers’ currency. However, a very large part of international trade is in goods that are either final investment goods, or intermediate goods that go into the production of final investment goods. There is much less evidence of final goods price stickiness for investment goods. The pass-through of exchange rates to final prices, even in the short run, is much higher than zero. The exchange rate can have an immediate effect on the demand for the imported good, if the import is priced in foreign currency. As Amiti et al. (2014) document, large exporting firms also tend to be firms that import a lot of intermediate goods. The effect of an exchange rate change on those firms may be counterintuitive. In some cases, firms that are large exporters actually have import costs that exceed their export revenues. That is because these firms also have a large domestic market, and the imported inputs are intermediate goods not only in the exports of the firm, but also in the final product sold
domestically. If all goods are priced in the producer’s currency, an increase in the price of foreign currency could hurt these firms. While their revenue from exports rises (because they earn more domestic currency for each unit sold abroad), that could be more than offset by the increase in their import bill. Finally, it is important to recognise that another potential margin of adjustment for firms is in domestic costs—specifically labour costs. Suppose that the renminbi appreciated relative to the US dollar, meaning that the US dollar price of renminbi rises. That might tend to harm Chinese exporters. If their prices were set in renminbi, they would see a decline in the demand for their goods, as the US dollar price rises. In the more likely case that the price is set in US dollars, the Chinese firm is squeezed by lower renminbi earnings for each product sold. But if this effect is widespread among Chinese exporters, there may be a general tendency for wages to fall in China. The Chinese firms would have more cushion to lower their US dollar prices because their costs decline.
Conclusion
The really striking thing about the relative price movements that are induced by swings in the exchange rate are their size. Nominal exchange rates move, sometimes, violently like other asset prices. Nominal exchange rates react to actual monetary policy changes, and anticipation of future monetary policy changes. They react to financial market uncertainty and political uncertainty. Because of nominal price stickiness, these extreme movements in nominal exchange rates are reflected, at least temporarily, in international relative prices. While there is a long tradition that has argued that freely floating exchange rates improve the efficiency of markets, the evidence seems to point the other direction. That is, these large movements in exchange rates lead to relative price changes that are not indicative of underlying changes in
costs or demand. It may be optimal for monetary policy to aim to control large swings in the exchange rate in order to mitigate these distortions, as I have argued formally in Engel (2011). What does price adjustment look like when there are no fluctuations in nominal exchange rates? Recent work that I have co-authored (Berka et al., 2017) finds that real exchange rates within the Eurozone—the set of countries that share the euro—adjust much like traditional theories tell us they should. The relative price levels are influenced by sectoral productivity levels, and by movements in unit labour cost. Interestingly, these fundamental factors that influence costs have not been found to play a major role in the determination of real exchange rates among high-income, low-inflation countries with floating
Special Features 91
Monetary Authority of Singapore Economic Policy Group
nominal exchange rates. While perhaps the real exchange rates in the Eurozone adapt more slowly than is ideal, because adjustment relies entirely on differences in inflation, the real exchange rates are free from the sharp bounces that occur in floating rate countries with volatile nominal exchange rates. We might conclude that, first, nominal exchange rates do influence relative international prices in the short run. The channels of influence depend on the currency of export pricing, and on how importing firms adapt to the exchange rate movements. Sharp swings in nominal exchange rates may induce temporary changes in
competitiveness that are not justified by underlying demand or cost shocks. An ideal exchange rate policy that smooths the adjustment of nominal exchange rates, but moves them in a direction such that international prices reflect underlying costs, might lead to more efficient outcomes than a purely laissez-faire free market for foreign exchange. But exchange rates are also subject to manipulation by policymakers, so that the implementation of the policy—the extent to which policymakers act to mitigate the effects of sluggish price adjustment when targeting nominal exchange rates—determines whether exchange-rate policies improve the efficiency of international price-setting.
References
Amiti, M, Itskhoki, O, and Konings, J (2014), “Importers, Exporters and Exchange Rate Disconnect”, American Economic Review, Vol. 104(7), pp. 1942–1978. Berka, M, Devereux, M B, and Engel, C (2017), “Real Exchange Rates and Sectoral Productivity in the Eurozone”, University of Wisconsin Working Paper. Engel, C (1999), “Accounting for US Real Exchange Rate Changes”, Journal of Political Economy, Vol. 107(3), pp. 507–538. Engel, C (2011), “Currency Misalignments and Optimal Monetary Policy: A Reexamination”, American Economic Review, Vol. 101(6), pp. 2796–2822. Gopinath, G (2015), “The International Price System”, NBER Working Paper No. 21646. Mussa, M (1986), “Nominal Exchange Rate Regimes and the Behavior of Real Exchange Rates: Evidence and Implications”, Carnegie-Rochester Conference Series on Public Policy, Vol. 25, pp. 117–214. Rajan, R (2014), “Competitive Monetary Easing: Is It Yesterday Once More?”, speech at the Brookings Institution available at https://www.rbi.org.in/scripts/BS_SpeechesView.aspx?Id=886
92 Macroeconomic Review, April 2017
Monetary Authority of Singapore Economic Policy Group
Using Cost-Benefit Analysis In Developed And Developing Countries: Is It The Same? by Euston Quah1
Introduction
Nobel laureate and economist Simon Kuznets put forth the concept of gross domestic product (GDP) in response to a need for good data in public policy planning in the 1930s. Since then, policymakers have increasingly relied upon GDP and other national income indicators. If only one macro indicator is available in any given country, chances are the indicator is the country’s GDP. However, as Kuznets himself and other critics of GDP have pointed out, national income statistics are not ideal measures of welfare (Kuznets, 1934). Of the many criticisms, two of the more prominent are the lack of consideration of equity and the fact that these statistics only measure economic activity and do not account for non-economic costs of growth (Kuznets, 1962).
It is a fact that costs of economic growth are often non-market in nature, often resulting in environmental harm or loss to psychological well-being. To properly account for the full costs of growth, all such items should be quantified and any changes to their levels should be meticulously recorded. Additionally, to utilise the data for trade-off analysis, it is necessary to assign monetary values to them. However, to maintain a complete record of changes in the levels of all non-market goods requires large costs which may prove too high for developing countries. Often, developing nations account for these costs by conducting the analysis at a micro level when considering public projects, differing from their developed counterparts in this respect. As such, there is a need to approach cost-benefit analysis in developing nations differently to account for both behavioral and executional differences.
The Need For Cost-Benefit Analysis In Developing Countries
There are three reasons why the need for cost-benefit analysis is especially pressing for developing countries. First, to catch up to developed economies, developing economies need to grow even faster. The shorter the time frame for convergence, the faster developing countries need to grow. The OECD estimates that 60 years could be shaved off the catch-up process if least developed countries grew at a rate just one percentage point faster. Second, most of the
world’s natural resources are concentrated in developing countries. International pressure on developing economies to take on greater responsibility for sustainable development and for these nations to bear future responsibility for reducing their carbon emissions is growing. Lastly, governments of developing economies face significantly greater budgetary constraints than their developed world counterparts. Therefore,
1 Euston Quah is Professor of Economics and Head, Division of Economics at the Nanyang Technological University, as well as
an Adjunct Principal Research Fellow of the Institute of Policy Studies at the National University of Singapore. The views in this article are solely those of the author and should not be attributed to MAS.
Special Feature C
Special Features 93
Monetary Authority of Singapore Economic Policy Group
given these reasons, developing countries have to be extremely prudent about their choices of projects and face the need for optimal
decision-making. Thus, there is a great need for developing nations to adopt cost-benefit analysis to ascertain the net benefits of proposed projects.
Differences Between Developed And Developing Countries
It is also essential to note the need for a different approach to cost-benefit analysis for both developed and developing economies. Cost-benefit analysis must account for all benefits and costs of direct and indirect effects, including externalities, with valuation being as accurate as possible, reflecting the true social costs and benefits. Distortions in prices due to taxes and subsidies, as well as opportunity costs, must be accounted for while transfer payments should be ignored. However, in applying principles, certain valuation techniques commonly used in developed countries are not appropriate for developing countries and these differences may result in erroneous cost-benefit analysis. Labour Markets
One example of this difference is within labour markets. Unlike developed nations, the majority of the workforce in developing nations is employed in agriculture. Though this will not necessarily distort a cost-benefit analysis, a significant portion of these agricultural workers are employed in name only and paid a token wage despite making no marginal contribution to the production process. Cost-benefit analysis requires that items be valued at their opportunity costs. Traditionally, any project that results in a labourer moving to another position paying the same wage would see the new wage being counted as the cost for a project. In this instance, there is no opportunity cost associated with that labourer’s prior position and hence, the cost is overestimated. Additionally, levels of household production in developing nations are higher than in developed nations. In developed economies, household production can be priced because labour markets are generally efficient and reflect opportunity or market replacement costs but in developing economies, labour markets are largely incomplete and households undertake most household
production. This creates a valuation problem as techniques that rely on market behaviour will be inadequate due to the incomplete market for hired help. Moreover, higher household production also means that cost-benefit analysis, which does not incorporate this production, is biased and inaccurate, skewing the accuracy of cost-benefit analysis in valuing non-market work. The same argument can be made with the underground economy. Goods Markets
Another major difference is that the goods markets in developing economies are likely to be less efficient than those of developed economies because of information asymmetry. Also, distortions brought about by taxation, subsidies or other forms of governmental intervention mean that prices do not reflect the true values of goods. Therefore, using prices to value input items would likely result in an inaccurate cost-benefit analysis in a developing country. Apart from directly calculating the costs, inefficiencies and distortions, goods markets also create issues with the valuation of intangibles and externalities. Typically, in developed economies, intangibles and externalities are valued in relation to consumption through a revealed preference approach. However, the credibility of such revealed preference techniques breaks down when a goods market does not produce prices that reflect the true value of a good, leading to distorted demand curves and the inability to properly use cost-benefit analysis. Nevertheless, there has been a general consensus on using shadow prices when accounting for market distortions. However, a problem arises as exchange rates are required in the calculation of shadow prices for tradable goods and the rates for developing economies often fluctuate widely and
94 Macroeconomic Review, April 2017
Monetary Authority of Singapore Economic Policy Group
may not be appropriate. This exacerbates the issue of accuracy when using cost-benefit analysis, especially the technique of shadow price calculation. Financial Markets
Financial markets in developing economies are also weaker than those in developed economies, with private banks often wielding considerable monopolistic power. As a result, interest rates are usually higher than what a free market would produce (Yildirim and Philippatos, 2007), giving rise to the issue of discounting. As social discount rates take into account both the opportunity cost of capital and a society’s time preference, the artificially higher interest rates result in a higher social discount rate than is appropriate for measurement. Consequently, both future benefits and costs are then heavily discounted, causing bias in favour of projects that yield short-term benefits and incur long-term costs.
Due to shorter lifespans and lower incomes, which are social and economic characteristics of developing economies, populations from developing nations often have a higher preference for current, rather than future, consumption when compared to the preference of populations in developed countries. This difference in preference further raises social discount rates, albeit not as a result of some inefficiency in the market, but more reflective of genuine differences in individual preferences. However, where interest rates are inefficiently high because of the market power exercised by local banks, use of the market discount rate will bias results against projects with long-term benefits as well. Thus, both the opportunity cost rate and the social time preference rate used as discount rates in most cost-benefit studies need adjustment downwards.
Behavioural Economics And Cost-Benefit Analysis
In addition to fundamental differences between developed and developing countries with regards to discount rates, differences in behaviours also affect experimental design and results. This difference in behaviour detracts from traditional cost-benefit analysis, suggesting that both gains and losses have to account for psychological as well as physical attributes. Loss Aversion
In practice, the study of loss aversion is the most common example which alters measurement values in cost-benefit analysis. Theoretically, gains and losses should be identical in nature and hold the same valuation when it comes to measurement. In the case of gains, it is the maximum amount that a person is willing to pay while losses account for the maximum payment that a person is willing to accept for the loss. Results of cost-benefit analysis should then be a summation of the respective valuations of gains and losses, with the end results being similar (Henderson, 1941; Mishan and Quah, 2007).
Yet, there is a significant disparity when measured, with values that accounted for a person’s willingness to accept being far larger than his willingness to pay (Putler, 1992; Knetsch and Sinden, 1984). Knowing that differences do arise when considering people’s valuations of losses and gains, failing to account for this will create inefficient and often biased decision-making. This is especially the case when analysing developing countries where the majority of the population is often poor, making them more risk-averse since their margin for error is lower as compared to individuals in developed countries. The Choice Of Measurement
Another debate would be the use of appropriate methods of measurement. Due to loss aversion, the use of the willingness to pay criterion, a method of measurement in cost-benefit analysis, may sometimes not be appropriate for situations where willingness to accept measures should have been implemented instead, leading to systematic undervaluation of the actual costs (Knetsch, 2013).
Special Features 95
Monetary Authority of Singapore Economic Policy Group
This presents a danger in policymaking in developing countries as policies that aim to counter actions that have negative externalities such as pollution are likely to be under-weighted and there may be an undue encouragement of activities that have negative consequences. This explains lax environmental standards especially since the benefits of economic growth are quantitative while the costs are subject to measurement bias. Sunk Costs Or No Sunk Costs
Another behavioural oddity is that of sunk costs. It appears that behavioural economics shows that many people consider such costs while conventional neoclassical economics does not.
This has serious implications for the evaluation of infrastructure expansion. For example, should an old ferry’s capital cost be included when deciding a new ferry or alternative transport mode? Behavioural economics, in considering sunk costs, may seem to say so whereas standard economics may not. In developed economies, this may not pose a major problem with a larger budget but in poorer developing countries, it makes a big difference as to whether the old ferry is kept or scrapped. The correct decision based on cost-benefit analysis is that as long as the old ferry can still cover its operating cost, the decision to have the new ferry should not be affected by this. In other words, cost-benefit analysis does not consider sunk costs.
Challenges In Applying Valuation Techniques In Developing Countries
Valuation techniques in cost-benefit analysis may be broadly classified into two categories: revealed preference approaches and stated preference approaches. Revealed preference approaches are indirect methods that attempt to discern the values of items by observing how people behave in the market. Hedonic pricing and travel cost methods are the prototypical examples of the revealed preference approach whereas the contingent valuation approach dominates the stated preference approach. Still, most revealed preference approaches require strong assumptions of rationality, perfect information, and perfect mobility to be valid (Quah and Ong, 2009), while stated preference approaches, including the contingent valuation method, are susceptible to a large number of behavioural effects (Kahneman and Knetsch, 1992; Carson et al., 2001) and methodological biases. The lack of trained interviewers in developing nations worsens the bias as well (Hanley and Barbier, 2009), with the inability of both interviewers and interviewees to differentiate between willingness to pay and ability to pay. Misunderstandings are further exacerbated by cultural and linguistic differences while the capacity for proper experimental design is limited
given cash-strapped governments. Thus, particularly for developing nations, these two valuation techniques have obvious pitfalls which may render results dubious. A third valuation technique, the paired comparison approach, avoids the obvious flaws of the other two methodological classes (Quah et al., 2006). The paired comparison approach uses a survey to elicit individual preferences for public and environmental goods. It avoids the need for the strong assumptions required by revealed preference methods and also overcomes the key behavioural effect that plagues contingent valuation methods. However, it is argued that this method does not provide a measure of the net benefits derived from a project though this concern can be addressed by including monetary items in the paired comparison choice set. Nonetheless, in conducting cost-benefit analysis, caution is still needed when choosing the most appropriate valuation method in order to avoid distortions.
96 Macroeconomic Review, April 2017
Monetary Authority of Singapore Economic Policy Group
Limitations Of Cost-Benefit Analysis For Developing Countries
A serious criticism of cost-benefit analysis is that it may result in foregoing equity in the pursuit of efficiency. In a typical cost-benefit analysis, the value of a dollar does not reflect who receives the benefits of a project or who pays its costs. In a developed nation, governmental channels such as progressive taxation redistribute wealth and prevent the income gap from widening too much or too quickly. Developing nations lack such channels, finding themselves a victim of prevalent corruption, which results in most of the benefits accruing to the rich and costs being borne by the poor, thus worsening inequity. Still, the argument in support of cost-benefit analysis suggests that weights should be applied to reflect the relative importance of monetary values
to different social classes. While this principle is basically sound, the application of this weighting is highly problematic. For instance, there is the technical issue of determining what weights should be employed to adequately address inequity. While it is clear that the greater the importance attached to inequity issues, the larger the weights should be, the appropriate calibration is often difficult. Also, there is the possibility of abuse, with equity weighting being manipulated to produce any desired result simply by adjusting the weights attached to a particular group’s welfare. This is made worse in developing countries due to prevalent corruption, thus reducing the ability of cost-benefit analysis to take into account equity issues in these economies.
Conclusion
As this discussion indicates, there are both similarities and differences between cost-benefit analyses conducted in developed and in developing countries. While the fundamental principles underlying cost-benefit analysis remain unchanged, the methodologies that are most appropriate in each context may differ due to behavioral and economic characteristics. In addition, the overall merits and limitations of cost-benefit analysis shift depending on the state of economic advancement, though the need for cost-benefit analysis is more pressing for developing economies, especially since they must contend with a number of conflicting and yet critically important goals. On the whole, cost-benefit analysis can only fulfill its potential if three important issues are taken into account. First, cost-benefit analysis is only meant as a guide and should not be the final or
only arbiter of project proposals. Second, in conducting cost-benefit analysis, the appropriate valuation techniques must be selected. Finally, potential equity issues must be independently considered and treated as an imperative complement to a robust cost-benefit analysis. This feature has argued that cost-benefit analysis can, and should, be used by the developing world. However, conducting the analysis requires one to consider several aspects such as proper measurement techniques, the end-users and stakeholders, what the appropriate investment decision criteria are, and whether there are constraints on the results. The need for systematic decisions that make use of consistent and transparent methodologies will be deemed valuable in formulating public policy in both developed and developing countries.
Special Features 97
Monetary Authority of Singapore Economic Policy Group
References
Carson, R T, Flores, N E, and Meade, N F (2001), “Contingent Valuation: Controversies and Evidence”, Environmental and Resource Economics, Vol. 19, pp. 173–210. Hanley, N and Barbier, E B (2009), Pricing Nature: Cost-Benefit Analysis and Environmental Policy, Edward Elgar Publishing. Henderson, A M (1941), “Consumer’s Surplus and the Compensation Variation”, Review of Economic Studies, Vol. 8(2), pp. 117–121. Kahneman, D and Knetsch, J L (1992), “Valuing Public Goods: The Purchase of Moral Satisfaction”, Journal of Environmental Economics and Management, Vol. 22, pp. 57–70. Knetsch, J L (2013), “Behavioural Effects and Cost-Benefit Analysis: Lessons from Behavioural Economics”, pp. 84–98, in Quah, E and Toh, R, Cost-Benefit Analysis: Cases and Materials, Routledge, Taylor & Francis Group. Knetsch, J L and Sinden, J A (1984), “Willingness to Pay and Compensation Demanded: Experimental Evidence of an Unexpected Disparity in Measure of Value”, Quarterly Journal of Economics, Vol. 99(3), pp. 507–521. Kuznets, S (1934), “National Income, 1929–1932”, NBER Bulletin 49, pp. 1–12. Kuznets, S (1962), “How to Judge Quality”, The New Republic, Vol. 147(16), pp. 29–31. Mishan, E J and Quah, E (2007), Cost Benefit Analysis, Routledge, Taylor & Francis Group. Putler, D S (1992), “Incorporating Reference Price Effects into a Theory of Consumer Choice”, Marketing Science, Vol. 11(3), pp. 287–309. Quah, E and Ong, Q (2009), “Cities and Happiness in Environmental Goods”, pp. 277–298, in Ooi G L and Yuen B (eds.), World Cities: Achieving Livability and Vibrancy, World Scientific. Quah, E, Choa, E and Tan, K C (2006), “Use of Damage Schedules in Environmental Valuation: The Case of Urban Singapore”, Applied Economics, Vol. 38(13), pp. 1501–1512. Yildirim, H S and Philippatos, G (2007), “Efficiency of Banks: Recent Evidence from the Transition Economies of Europe 1993–2000”, European Journal of Finance, Vol. 13(2), pp. 123–143.
98 Macroeconomic Review, April 2017
Monetary Authority of Singapore Economic Policy Group
Statistical Appendix Table 1: Real GDP Growth by Sector Table 2: Real GDP Growth by Expenditure Table 3: Labour Market (I) Table 4: Labour Market (II) Table 5: External Trade Table 6: Non-oil Domestic Exports by Selected Countries Table 7: Consumer Price Index Table 8: MAS Core Inflation Table 9: Balance of Payments – Current Account Table 10: Balance of Payments – Capital & Financial Accounts Table 11: Exchange Rates Table 12: Singapore Dollar Nominal Effective Exchange Rate Index Table 13: Domestic Liquidity Indicator Table 14: Monetary Table 15: Fiscal
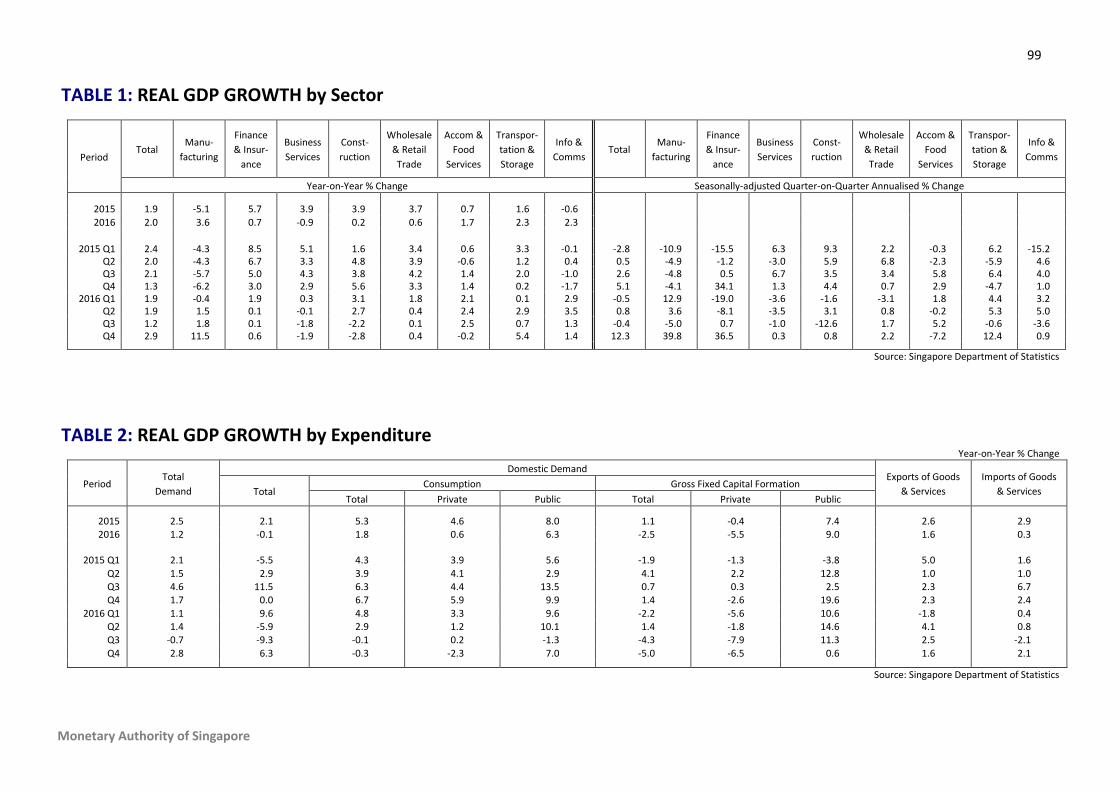
99
Monetary Authority of Singapore
TABLE 1: REAL GDP GROWTH by Sector
Period Total
Manu-facturing
Finance & Insur-
ance
Business Services
Const- ruction
Wholesale & Retail Trade
Accom & Food
Services
Transpor-tation & Storage
Info & Comms
Total Manu-
facturing
Finance & Insur-
ance
Business Services
Const- ruction
Wholesale & Retail Trade
Accom & Food
Services
Transpor-tation & Storage
Info & Comms
Year-on-Year % Change Seasonally-adjusted Quarter-on-Quarter Annualised % Change
2015 1.9 -5.1 5.7 3.9 3.9 3.7 0.7 1.6 -0.6 2016 2.0 3.6 0.7 -0.9 0.2 0.6 1.7 2.3 2.3
2015 Q1 2.4 -4.3 8.5 5.1 1.6 3.4 0.6 3.3 -0.1 -2.8 -10.9 -15.5 6.3 9.3 2.2 -0.3 6.2 -15.2
Q2 2.0 -4.3 6.7 3.3 4.8 3.9 -0.6 1.2 0.4 0.5 -4.9 -1.2 -3.0 5.9 6.8 -2.3 -5.9 4.6 Q3 2.1 -5.7 5.0 4.3 3.8 4.2 1.4 2.0 -1.0 2.6 -4.8 0.5 6.7 3.5 3.4 5.8 6.4 4.0 Q4 1.3 -6.2 3.0 2.9 5.6 3.3 1.4 0.2 -1.7 5.1 -4.1 34.1 1.3 4.4 0.7 2.9 -4.7 1.0
2016 Q1 1.9 -0.4 1.9 0.3 3.1 1.8 2.1 0.1 2.9 -0.5 12.9 -19.0 -3.6 -1.6 -3.1 1.8 4.4 3.2 Q2 1.9 1.5 0.1 -0.1 2.7 0.4 2.4 2.9 3.5 0.8 3.6 -8.1 -3.5 3.1 0.8 -0.2 5.3 5.0 Q3 1.2 1.8 0.1 -1.8 -2.2 0.1 2.5 0.7 1.3 -0.4 -5.0 0.7 -1.0 -12.6 1.7 5.2 -0.6 -3.6 Q4 2.9 11.5 0.6 -1.9 -2.8 0.4 -0.2 5.4 1.4 12.3 39.8 36.5 0.3 0.8 2.2 -7.2 12.4 0.9
Source: Singapore Department of Statistics
TABLE 2: REAL GDP GROWTH by Expenditure
Year-on-Year % Change
Period Total
Demand
Domestic Demand Exports of Goods
& Services Imports of Goods
& Services Total Consumption Gross Fixed Capital Formation
Total Private Public Total Private Public
2015 2.5 2.1 5.3 4.6 8.0 1.1 -0.4 7.4 2.6 2.9 2016 1.2 -0.1 1.8 0.6 6.3 -2.5 -5.5 9.0 1.6 0.3
2015 Q1 2.1 -5.5 4.3 3.9 5.6 -1.9 -1.3 -3.8 5.0 1.6
Q2 1.5 2.9 3.9 4.1 2.9 4.1 2.2 12.8 1.0 1.0 Q3 4.6 11.5 6.3 4.4 13.5 0.7 0.3 2.5 2.3 6.7 Q4 1.7 0.0 6.7 5.9 9.9 1.4 -2.6 19.6 2.3 2.4
2016 Q1 1.1 9.6 4.8 3.3 9.6 -2.2 -5.6 10.6 -1.8 0.4 Q2 1.4 -5.9 2.9 1.2 10.1 1.4 -1.8 14.6 4.1 0.8 Q3 -0.7 -9.3 -0.1 0.2 -1.3 -4.3 -7.9 11.3 2.5 -2.1 Q4 2.8 6.3 -0.3 -2.3 7.0 -5.0 -6.5 0.6 1.6 2.1
Source: Singapore Department of Statistics
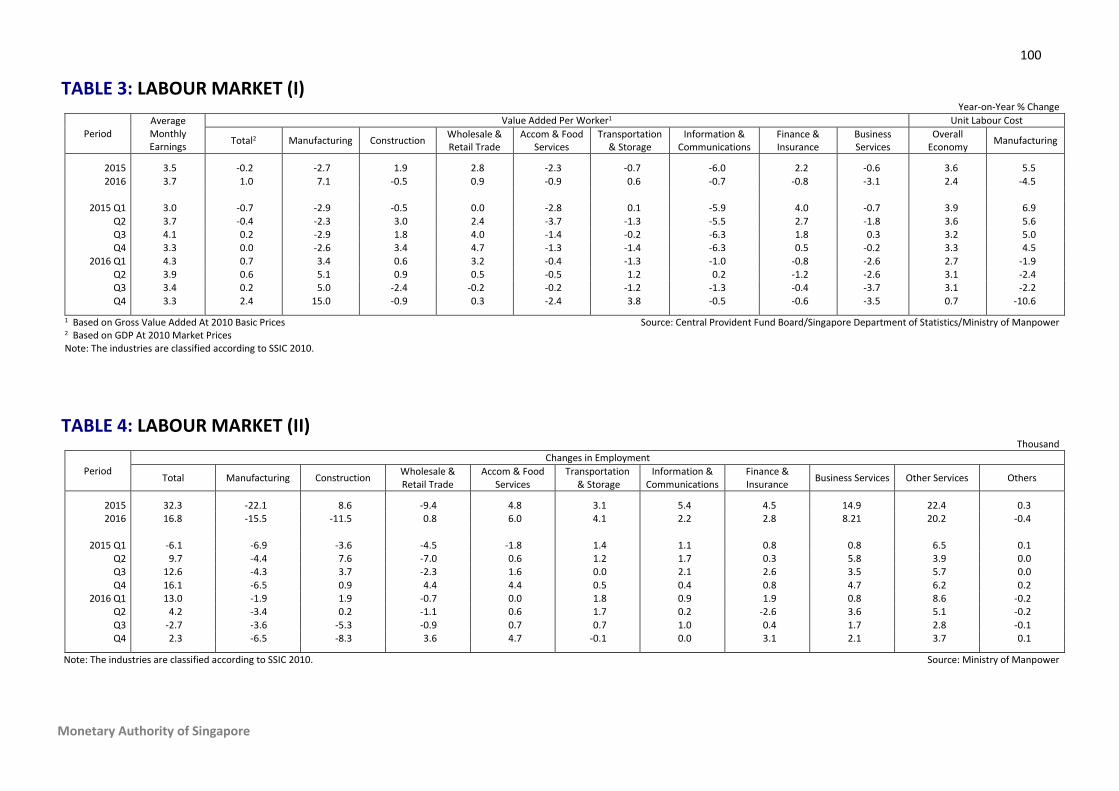
100
Monetary Authority of Singapore
TABLE 3: LABOUR MARKET (I) Year-on-Year % Change
Period Average Monthly Earnings
Value Added Per Worker1 Unit Labour Cost
Total2 Manufacturing Construction Wholesale & Retail Trade
Accom & Food Services
Transportation & Storage
Information & Communications
Finance & Insurance
Business Services
Overall Economy Manufacturing
2015 3.5 -0.2 -2.7 1.9 2.8 -2.3 -0.7 -6.0 2.2 -0.6 3.6 5.5 2016 3.7 1.0 7.1 -0.5 0.9 -0.9 0.6 -0.7 -0.8 -3.1 2.4 -4.5
2015 Q1 3.0 -0.7 -2.9 -0.5 0.0 -2.8 0.1 -5.9 4.0 -0.7 3.9 6.9
Q2 3.7 -0.4 -2.3 3.0 2.4 -3.7 -1.3 -5.5 2.7 -1.8 3.6 5.6 Q3 4.1 0.2 -2.9 1.8 4.0 -1.4 -0.2 -6.3 1.8 0.3 3.2 5.0 Q4 3.3 0.0 -2.6 3.4 4.7 -1.3 -1.4 -6.3 0.5 -0.2 3.3 4.5
2016 Q1 4.3 0.7 3.4 0.6 3.2 -0.4 -1.3 -1.0 -0.8 -2.6 2.7 -1.9 Q2 3.9 0.6 5.1 0.9 0.5 -0.5 1.2 0.2 -1.2 -2.6 3.1 -2.4 Q3 3.4 0.2 5.0 -2.4 -0.2 -0.2 -1.2 -1.3 -0.4 -3.7 3.1 -2.2 Q4 3.3 2.4 15.0 -0.9 0.3 -2.4 3.8 -0.5 -0.6 -3.5 0.7 -10.6
1 Based on Gross Value Added At 2010 Basic Prices Source: Central Provident Fund Board/Singapore Department of Statistics/Ministry of Manpower 2 Based on GDP At 2010 Market Prices Note: The industries are classified according to SSIC 2010. TABLE 4: LABOUR MARKET (II) Thousand
Period Changes in Employment
Total Manufacturing Construction Wholesale & Retail Trade
Accom & Food Services
Transportation & Storage
Information & Communications
Finance & Insurance Business Services Other Services Others
2015 32.3 -22.1 8.6 -9.4 4.8 3.1 5.4 4.5 14.9 22.4 0.3 2016 16.8 -15.5 -11.5 0.8 6.0 4.1 2.2 2.8 8.21 20.2 -0.4
2015 Q1 -6.1 -6.9 -3.6 -4.5 -1.8 1.4 1.1 0.8 0.8 6.5 0.1
Q2 9.7 -4.4 7.6 -7.0 0.6 1.2 1.7 0.3 5.8 3.9 0.0 Q3 12.6 -4.3 3.7 -2.3 1.6 0.0 2.1 2.6 3.5 5.7 0.0 Q4 16.1 -6.5 0.9 4.4 4.4 0.5 0.4 0.8 4.7 6.2 0.2
2016 Q1 13.0 -1.9 1.9 -0.7 0.0 1.8 0.9 1.9 0.8 8.6 -0.2 Q2 4.2 -3.4 0.2 -1.1 0.6 1.7 0.2 -2.6 3.6 5.1 -0.2 Q3 -2.7 -3.6 -5.3 -0.9 0.7 0.7 1.0 0.4 1.7 2.8 -0.1 Q4 2.3 -6.5 -8.3 3.6 4.7 -0.1 0.0 3.1 2.1 3.7 0.1
Note: The industries are classified according to SSIC 2010. Source: Ministry of Manpower
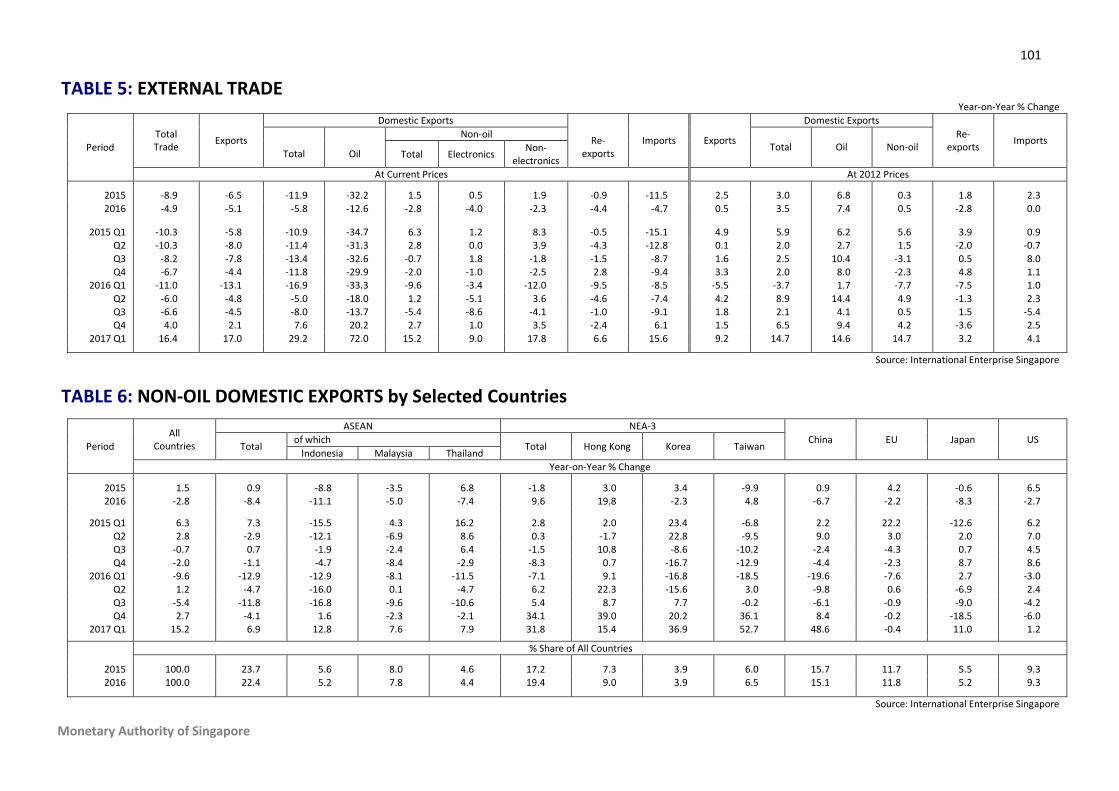
101
Monetary Authority of Singapore
TABLE 5: EXTERNAL TRADE Year-on-Year % Change
Period Total Trade Exports
Domestic Exports
Re- exports
Imports Exports
Domestic Exports Re-
exports Imports Total
Oil
Non-oil Total
Oil
Non-oil
Total Electronics Non- electronics
At Current Prices At 2012 Prices
2015 -8.9 -6.5 -11.9 -32.2 1.5 0.5 1.9 -0.9 -11.5 2.5 3.0 6.8 0.3 1.8 2.3 2016 -4.9 -5.1 -5.8 -12.6 -2.8 -4.0 -2.3 -4.4 -4.7 0.5 3.5 7.4 0.5 -2.8 0.0
2015 Q1 -10.3 -5.8 -10.9 -34.7 6.3 1.2 8.3 -0.5 -15.1 4.9 5.9 6.2 5.6 3.9 0.9
Q2 -10.3 -8.0 -11.4 -31.3 2.8 0.0 3.9 -4.3 -12.8 0.1 2.0 2.7 1.5 -2.0 -0.7 Q3 -8.2 -7.8 -13.4 -32.6 -0.7 1.8 -1.8 -1.5 -8.7 1.6 2.5 10.4 -3.1 0.5 8.0 Q4 -6.7 -4.4 -11.8 -29.9 -2.0 -1.0 -2.5 2.8 -9.4 3.3 2.0 8.0 -2.3 4.8 1.1
2016 Q1 -11.0 -13.1 -16.9 -33.3 -9.6 -3.4 -12.0 -9.5 -8.5 -5.5 -3.7 1.7 -7.7 -7.5 1.0 Q2 -6.0 -4.8 -5.0 -18.0 1.2 -5.1 3.6 -4.6 -7.4 4.2 8.9 14.4 4.9 -1.3 2.3 Q3 -6.6 -4.5 -8.0 -13.7 -5.4 -8.6 -4.1 -1.0 -9.1 1.8 2.1 4.1 0.5 1.5 -5.4 Q4 4.0 2.1 7.6 20.2 2.7 1.0 3.5 -2.4 6.1 1.5 6.5 9.4 4.2 -3.6 2.5
2017 Q1 16.4 17.0 29.2 72.0 15.2 9.0 17.8 6.6 15.6 9.2 14.7 14.6 14.7 3.2 4.1
Source: International Enterprise Singapore
TABLE 6: NON-OIL DOMESTIC EXPORTS by Selected Countries
Period All
Countries
ASEAN NEA-3 China EU Japan US
Total of which
Total Hong Kong Korea Taiwan Indonesia Malaysia Thailand
Year-on-Year % Change
2015 1.5 0.9 -8.8 -3.5 6.8 -1.8 3.0 3.4 -9.9 0.9 4.2 -0.6 6.5 2016 -2.8 -8.4 -11.1 -5.0 -7.4 9.6 19.8 -2.3 4.8 -6.7 -2.2 -8.3 -2.7
2015 Q1 6.3 7.3 -15.5 4.3 16.2 2.8 2.0 23.4 -6.8 2.2 22.2 -12.6 6.2
Q2 2.8 -2.9 -12.1 -6.9 8.6 0.3 -1.7 22.8 -9.5 9.0 3.0 2.0 7.0 Q3 -0.7 0.7 -1.9 -2.4 6.4 -1.5 10.8 -8.6 -10.2 -2.4 -4.3 0.7 4.5 Q4 -2.0 -1.1 -4.7 -8.4 -2.9 -8.3 0.7 -16.7 -12.9 -4.4 -2.3 8.7 8.6
2016 Q1 -9.6 -12.9 -12.9 -8.1 -11.5 -7.1 9.1 -16.8 -18.5 -19.6 -7.6 2.7 -3.0 Q2 1.2 -4.7 -16.0 0.1 -4.7 6.2 22.3 -15.6 3.0 -9.8 0.6 -6.9 2.4 Q3 -5.4 -11.8 -16.8 -9.6 -10.6 5.4 8.7 7.7 -0.2 -6.1 -0.9 -9.0 -4.2 Q4 2.7 -4.1 1.6 -2.3 -2.1 34.1 39.0 20.2 36.1 8.4 -0.2 -18.5 -6.0
2017 Q1 15.2 6.9 12.8 7.6 7.9 31.8 15.4 36.9 52.7 48.6 -0.4 11.0 1.2 % Share of All Countries
2015 100.0 23.7 5.6 8.0 4.6 17.2 7.3 3.9 6.0 15.7 11.7 5.5 9.3 2016 100.0 22.4 5.2 7.8 4.4 19.4 9.0 3.9 6.5 15.1 11.8 5.2 9.3
Source: International Enterprise Singapore
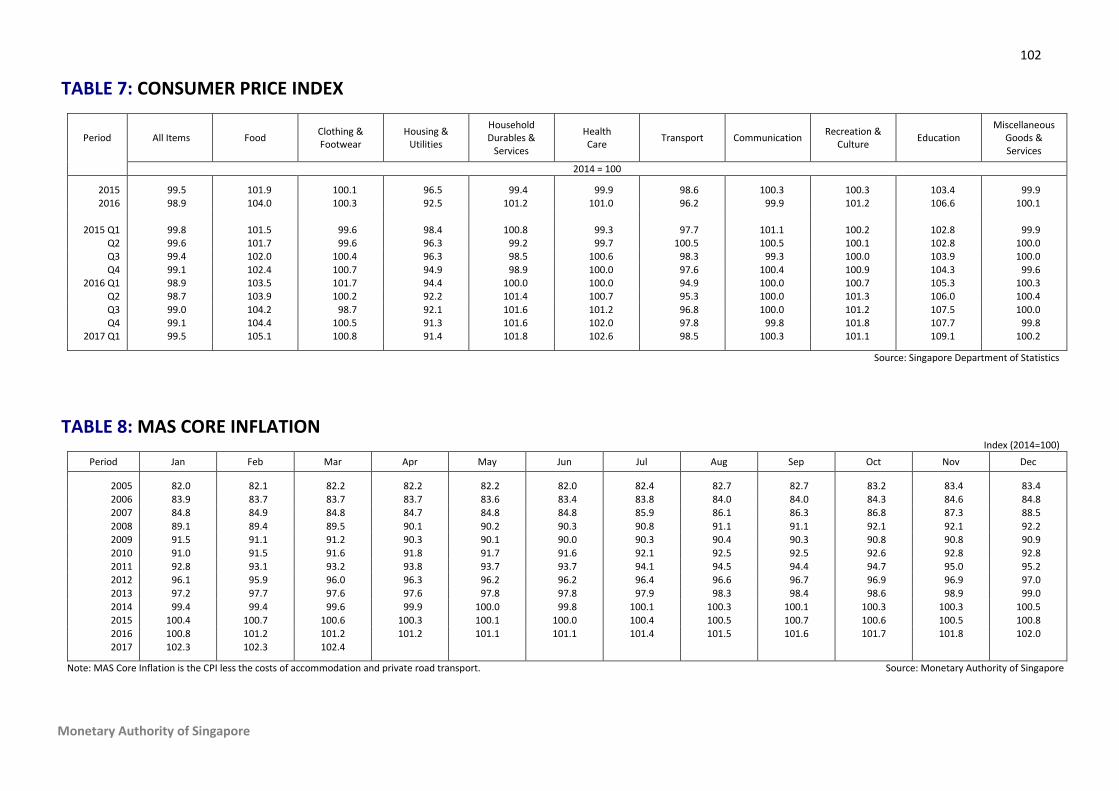
102
Monetary Authority of Singapore
TABLE 7: CONSUMER PRICE INDEX
Period All Items Food Clothing & Footwear
Housing & Utilities
Household Durables &
Services
Health Care Transport Communication Recreation &
Culture Education Miscellaneous
Goods & Services
2014 = 100
2015 99.5 101.9 100.1 96.5 99.4 99.9 98.6 100.3 100.3 103.4 99.9 2016 98.9 104.0 100.3 92.5 101.2 101.0 96.2 99.9 101.2 106.6 100.1
2015 Q1 99.8 101.5 99.6 98.4 100.8 99.3 97.7 101.1 100.2 102.8 99.9
Q2 99.6 101.7 99.6 96.3 99.2 99.7 100.5 100.5 100.1 102.8 100.0 Q3 99.4 102.0 100.4 96.3 98.5 100.6 98.3 99.3 100.0 103.9 100.0 Q4 99.1 102.4 100.7 94.9 98.9 100.0 97.6 100.4 100.9 104.3 99.6
2016 Q1 98.9 103.5 101.7 94.4 100.0 100.0 94.9 100.0 100.7 105.3 100.3 Q2 98.7 103.9 100.2 92.2 101.4 100.7 95.3 100.0 101.3 106.0 100.4 Q3 99.0 104.2 98.7 92.1 101.6 101.2 96.8 100.0 101.2 107.5 100.0 Q4 99.1 104.4 100.5 91.3 101.6 102.0 97.8 99.8 101.8 107.7 99.8
2017 Q1 99.5 105.1 100.8 91.4 101.8 102.6 98.5 100.3 101.1 109.1 100.2
Source: Singapore Department of Statistics
TABLE 8: MAS CORE INFLATION Index (2014=100)
Period Jan Feb Mar Apr May Jun Jul Aug Sep Oct Nov Dec
2005 82.0 82.1 82.2 82.2 82.2 82.0 82.4 82.7 82.7 83.2 83.4 83.4 2006 83.9 83.7 83.7 83.7 83.6 83.4 83.8 84.0 84.0 84.3 84.6 84.8 2007 84.8 84.9 84.8 84.7 84.8 84.8 85.9 86.1 86.3 86.8 87.3 88.5 2008 89.1 89.4 89.5 90.1 90.2 90.3 90.8 91.1 91.1 92.1 92.1 92.2 2009 91.5 91.1 91.2 90.3 90.1 90.0 90.3 90.4 90.3 90.8 90.8 90.9 2010 91.0 91.5 91.6 91.8 91.7 91.6 92.1 92.5 92.5 92.6 92.8 92.8 2011 92.8 93.1 93.2 93.8 93.7 93.7 94.1 94.5 94.4 94.7 95.0 95.2 2012 96.1 95.9 96.0 96.3 96.2 96.2 96.4 96.6 96.7 96.9 96.9 97.0 2013 97.2 97.7 97.6 97.6 97.8 97.8 97.9 98.3 98.4 98.6 98.9 99.0 2014 99.4 99.4 99.6 99.9 100.0 99.8 100.1 100.3 100.1 100.3 100.3 100.5 2015 100.4 100.7 100.6 100.3 100.1 100.0 100.4 100.5 100.7 100.6 100.5 100.8 2016 100.8 101.2 101.2 101.2 101.1 101.1 101.4 101.5 101.6 101.7 101.8 102.0 2017 102.3 102.3 102.4
Note: MAS Core Inflation is the CPI less the costs of accommodation and private road transport. Source: Monetary Authority of Singapore
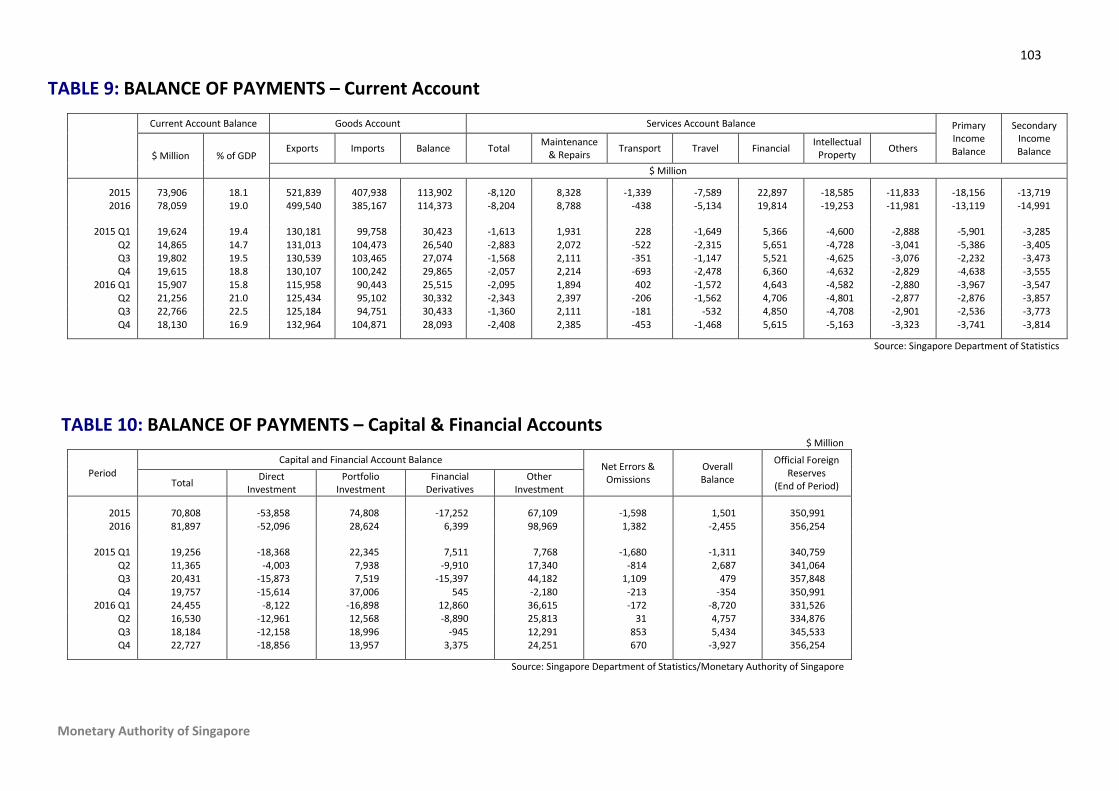
103
Monetary Authority of Singapore
TABLE 9: BALANCE OF PAYMENTS – Current Account
Current Account Balance Goods Account Services Account Balance Primary Income Balance
Secondary Income Balance $ Million % of GDP
Exports Imports Balance Total Maintenance & Repairs Transport Travel Financial Intellectual
Property Others
$ Million
2015 73,906 18.1 521,839 407,938 113,902 -8,120 8,328 -1,339 -7,589 22,897 -18,585 -11,833 -18,156 -13,719 2016 78,059 19.0 499,540 385,167 114,373 -8,204 8,788 -438 -5,134 19,814 -19,253 -11,981 -13,119 -14,991
2015 Q1 19,624 19.4 130,181 99,758 30,423 -1,613 1,931 228 -1,649 5,366 -4,600 -2,888 -5,901 -3,285
Q2 14,865 14.7 131,013 104,473 26,540 -2,883 2,072 -522 -2,315 5,651 -4,728 -3,041 -5,386 -3,405 Q3 19,802 19.5 130,539 103,465 27,074 -1,568 2,111 -351 -1,147 5,521 -4,625 -3,076 -2,232 -3,473 Q4 19,615 18.8 130,107 100,242 29,865 -2,057 2,214 -693 -2,478 6,360 -4,632 -2,829 -4,638 -3,555
2016 Q1 15,907 15.8 115,958 90,443 25,515 -2,095 1,894 402 -1,572 4,643 -4,582 -2,880 -3,967 -3,547 Q2 21,256 21.0 125,434 95,102 30,332 -2,343 2,397 -206 -1,562 4,706 -4,801 -2,877 -2,876 -3,857 Q3 22,766 22.5 125,184 94,751 30,433 -1,360 2,111 -181 -532 4,850 -4,708 -2,901 -2,536 -3,773 Q4 18,130 16.9 132,964 104,871 28,093 -2,408 2,385 -453 -1,468 5,615 -5,163 -3,323 -3,741 -3,814
Source: Singapore Department of Statistics
TABLE 10: BALANCE OF PAYMENTS – Capital & Financial Accounts
$ Million
Period Capital and Financial Account Balance
Net Errors & Omissions
Overall Balance
Official Foreign Reserves
(End of Period) Total Direct Investment
Portfolio Investment
Financial Derivatives
Other Investment
2015 70,808 -53,858 74,808 -17,252 67,109 -1,598 1,501 350,991 2016 81,897 -52,096 28,624 6,399 98,969 1,382 -2,455 356,254
2015 Q1 19,256 -18,368 22,345 7,511 7,768 -1,680 -1,311 340,759
Q2 11,365 -4,003 7,938 -9,910 17,340 -814 2,687 341,064 Q3 20,431 -15,873 7,519 -15,397 44,182 1,109 479 357,848 Q4 19,757 -15,614 37,006 545 -2,180 -213 -354 350,991
2016 Q1 24,455 -8,122 -16,898 12,860 36,615 -172 -8,720 331,526 Q2 16,530 -12,961 12,568 -8,890 25,813 31 4,757 334,876 Q3 18,184 -12,158 18,996 -945 12,291 853 5,434 345,533 Q4 22,727 -18,856 13,957 3,375 24,251 670 -3,927 356,254
Source: Singapore Department of Statistics/Monetary Authority of Singapore
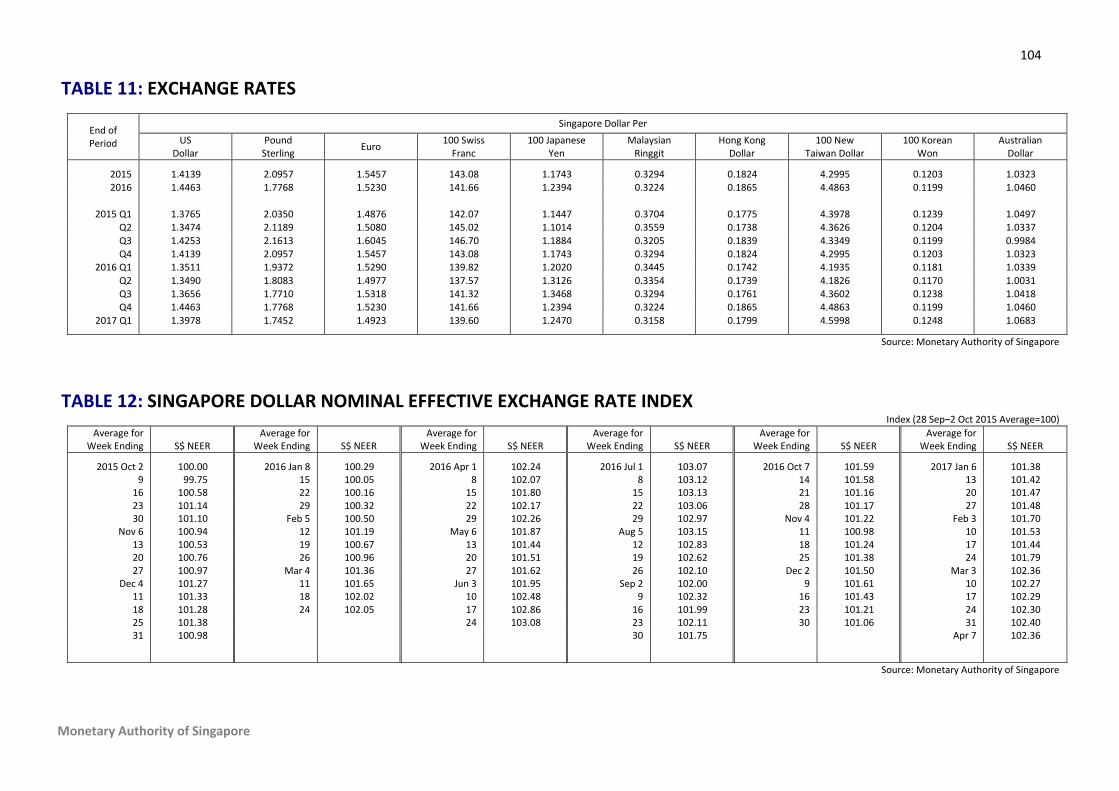
104
Monetary Authority of Singapore
TABLE 11: EXCHANGE RATES
End of Period
Singapore Dollar Per US
Dollar Pound
Sterling Euro 100 Swiss Franc
100 Japanese Yen
Malaysian Ringgit
Hong Kong Dollar
100 New Taiwan Dollar
100 Korean Won
Australian Dollar
2015 1.4139 2.0957 1.5457 143.08 1.1743 0.3294 0.1824 4.2995 0.1203 1.0323 2016 1.4463 1.7768 1.5230 141.66 1.2394 0.3224 0.1865 4.4863 0.1199 1.0460
2015 Q1 1.3765 2.0350 1.4876 142.07 1.1447 0.3704 0.1775 4.3978 0.1239 1.0497
Q2 1.3474 2.1189 1.5080 145.02 1.1014 0.3559 0.1738 4.3626 0.1204 1.0337 Q3 1.4253 2.1613 1.6045 146.70 1.1884 0.3205 0.1839 4.3349 0.1199 0.9984 Q4 1.4139 2.0957 1.5457 143.08 1.1743 0.3294 0.1824 4.2995 0.1203 1.0323
2016 Q1 1.3511 1.9372 1.5290 139.82 1.2020 0.3445 0.1742 4.1935 0.1181 1.0339 Q2 1.3490 1.8083 1.4977 137.57 1.3126 0.3354 0.1739 4.1826 0.1170 1.0031 Q3 1.3656 1.7710 1.5318 141.32 1.3468 0.3294 0.1761 4.3602 0.1238 1.0418 Q4 1.4463 1.7768 1.5230 141.66 1.2394 0.3224 0.1865 4.4863 0.1199 1.0460
2017 Q1 1.3978 1.7452 1.4923 139.60 1.2470 0.3158 0.1799 4.5998 0.1248 1.0683
Source: Monetary Authority of Singapore
TABLE 12: SINGAPORE DOLLAR NOMINAL EFFECTIVE EXCHANGE RATE INDEX Index (28 Sep–2 Oct 2015 Average=100)
Average for Week Ending S$ NEER
Average for Week Ending S$ NEER
Average for Week Ending S$ NEER
Average for Week Ending S$ NEER
Average for Week Ending S$ NEER
Average for Week Ending S$ NEER
2015 Oct 2 100.00 2016 Jan 8 100.29 2016 Apr 1 102.24 2016 Jul 1 103.07 2016 Oct 7 101.59 2017 Jan 6 101.38 9 99.75 15 100.05 8 102.07 8 103.12 14 101.58 13 101.42
16 100.58 22 100.16 15 101.80 15 103.13 21 101.16 20 101.47 23 101.14 29 100.32 22 102.17 22 103.06 28 101.17 27 101.48 30 101.10 Feb 5 100.50 29 102.26 29 102.97 Nov 4 101.22 Feb 3 101.70
Nov 6 100.94 12 101.19 May 6 101.87 Aug 5 103.15 11 100.98 10 101.53 13 100.53 19 100.67 13 101.44 12 102.83 18 101.24 17 101.44 20 100.76 26 100.96 20 101.51 19 102.62 25 101.38 24 101.79 27 100.97 Mar 4 101.36 27 101.62 26 102.10 Dec 2 101.50 Mar 3 102.36
Dec 4 101.27 11 101.65 Jun 3 101.95 Sep 2 102.00 9 101.61 10 102.27 11 101.33 18 102.02 10 102.48 9 102.32 16 101.43 17 102.29 18 101.28 24 102.05 17 102.86 16 101.99 23 101.21 24 102.30 25 101.38 24 103.08 23 102.11 30 101.06 31 102.40 31 100.98 30 101.75 Apr 7 102.36
Source: Monetary Authority of Singapore
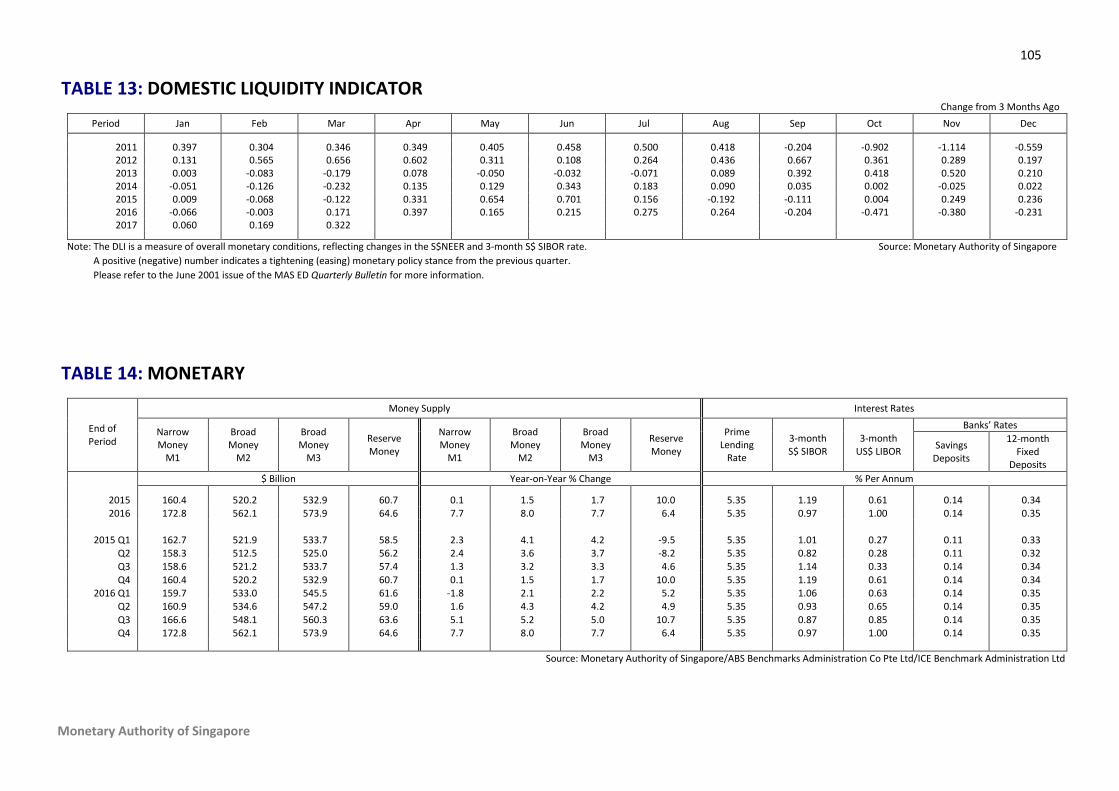
105
Monetary Authority of Singapore
TABLE 13: DOMESTIC LIQUIDITY INDICATOR Change from 3 Months Ago
Period Jan Feb Mar Apr May Jun Jul Aug Sep Oct Nov Dec
2011 0.397 0.304 0.346 0.349 0.405 0.458 0.500 0.418 -0.204 -0.902 -1.114 -0.559 2012 0.131 0.565 0.656 0.602 0.311 0.108 0.264 0.436 0.667 0.361 0.289 0.197 2013 0.003 -0.083 -0.179 0.078 -0.050 -0.032 -0.071 0.089 0.392 0.418 0.520 0.210 2014 -0.051 -0.126 -0.232 0.135 0.129 0.343 0.183 0.090 0.035 0.002 -0.025 0.022 2015 0.009 -0.068 -0.122 0.331 0.654 0.701 0.156 -0.192 -0.111 0.004 0.249 0.236 2016 -0.066 -0.003 0.171 0.397 0.165 0.215 0.275 0.264 -0.204 -0.471 -0.380 -0.231 2017 0.060 0.169 0.322
Note: The DLI is a measure of overall monetary conditions, reflecting changes in the S$NEER and 3-month S$ SIBOR rate. Source: Monetary Authority of Singapore
A positive (negative) number indicates a tightening (easing) monetary policy stance from the previous quarter. Please refer to the June 2001 issue of the MAS ED Quarterly Bulletin for more information.
TABLE 14: MONETARY
End of Period
Money Supply Interest Rates
Narrow Money
M1
Broad Money
M2
Broad Money
M3
Reserve Money
Narrow Money
M1
Broad Money
M2
Broad Money
M3
Reserve Money
Prime Lending
Rate
3-month S$ SIBOR
3-month US$ LIBOR
Banks’ Rates
Savings Deposits
12-month Fixed
Deposits $ Billion Year-on-Year % Change % Per Annum
2015 160.4 520.2 532.9 60.7 0.1 1.5 1.7 10.0 5.35 1.19 0.61 0.14 0.34 2016 172.8 562.1 573.9 64.6 7.7 8.0 7.7 6.4 5.35 0.97 1.00 0.14 0.35
2015 Q1 162.7 521.9 533.7 58.5 2.3 4.1 4.2 -9.5 5.35 1.01 0.27 0.11 0.33
Q2 158.3 512.5 525.0 56.2 2.4 3.6 3.7 -8.2 5.35 0.82 0.28 0.11 0.32 Q3 158.6 521.2 533.7 57.4 1.3 3.2 3.3 4.6 5.35 1.14 0.33 0.14 0.34 Q4 160.4 520.2 532.9 60.7 0.1 1.5 1.7 10.0 5.35 1.19 0.61 0.14 0.34
2016 Q1 159.7 533.0 545.5 61.6 -1.8 2.1 2.2 5.2 5.35 1.06 0.63 0.14 0.35 Q2 160.9 534.6 547.2 59.0 1.6 4.3 4.2 4.9 5.35 0.93 0.65 0.14 0.35 Q3 166.6 548.1 560.3 63.6 5.1 5.2 5.0 10.7 5.35 0.87 0.85 0.14 0.35 Q4 172.8 562.1 573.9 64.6 7.7 8.0 7.7 6.4 5.35 0.97 1.00 0.14 0.35
Source: Monetary Authority of Singapore/ABS Benchmarks Administration Co Pte Ltd/ICE Benchmark Administration Ltd
106
Monetary Authority of Singapore
TABLE 15: FISCAL
Period
Operating Revenue Expenditure Primary
Surplus (+)/ Deficit (−)
Less:
Special Transfers
Add: Net
Investment Returns
Contribution
Overall Budget
Surplus (+)/ Deficit (−)
Total
Tax Revenue Non-tax Revenue
Total
Operating
Development Total
of which Income
Tax Assets Taxes
Stamp Duty GST
$ Million
FY2014 60,838 54,110 23,940 4,341 2,784 10,215 6,728 56,648 42,685 13,963 4,190 12,356 8,738 571 FY2015 64,823 55,647 24,890 4,455 2,769 10,345 9,176 67,447 48,090 19,357 -2,624 10,369 8,943 -4,050
FY2016 (Revised) 68,667 58,173 26,163 4,365 2,940 10,852 10,494 71,388 52,682 18,706 -2,722 6,467 14,368 5,180 FY2017 (Budgeted) 69,450 59,376 25,924 4,410 2,730 11,252 10,074 75,072 56,305 18,768 -5,622 6,582 14,110 1,906
% of Nominal GDP
FY2014 15.4 13.7 6.1 1.1 0.7 2.6 1.7 14.3 10.8 3.5 1.1 3.1 2.2 0.1 FY2015 15.9 13.6 6.1 1.1 0.7 2.5 2.2 16.5 11.8 4.7 -0.6 2.5 2.2 -1.0
FY2016 (Revised) 16.6 14.1 6.3 1.1 0.7 2.6 2.5 17.3 12.8 4.5 -0.7 1.6 3.5 1.3 FY2017 (Budgeted) 16.3 14.0 6.1 1.0 0.6 2.6 2.4 17.7 13.3 4.4 -1.3 1.5 3.3 0.4
Source: Ministry of Finance