Embed Size (px)
Citation preview

Volume XV, Issue 1
April 2016

Volume XV, Issue 1 April 2016
Economic Policy Group
Monetary Authority of Singapore

ISSN 0219-8908
Published in April 2016
Economic Policy Group Monetary Authority of Singapore
http://www.mas.gov.sg
All rights reserved. No part of this publication may be reproduced, stored in a retrieval system or transmitted in any form or by any means, electronic, mechanised, photocopying, recording or otherwise, without the prior written permission of the copyright owner except in accordance with the provisions of the Copyright Act (Cap. 63). Application for the copyright owner's written permission to reproduce any part of this publication should be addressed to:
Economic Policy Group Monetary Authority of Singapore 10 Shenton Way MAS Building Singapore 079117
Printed by Xpress Print Singapore

Monetary Authority of Singapore Economic Policy Group
Contents
Preface i
Monetary Policy Statement ii-iv
1 The International Economy 2 1.1 G3 Economies 3
1.2 Asia 8
1.3 Global Inflation 13
Box A: China And The Global Export Slowdown 15
2 The Singapore Economy 18 2.1 Recent Economic Developments 19
2.2 Economic Outlook 28
Box B: Evaluating Probability Forecasts From The 34
MAS Survey Of Professional Forecasters
3 Labour Market And Inflation 42 3.1 Labour Market 43
3.2 Consumer Price Developments 49
4 Macroeconomic Policy 58 4.1 Monetary Policy 59
4.2 Fiscal Policy 67
Special Features Special Feature A: Singapore’s Monetary History: The Quest 78
For A Nominal Anchor
Box C: A Model-based Ex-post Evaluation Of 84
Singapore’s Monetary Policy
Special Feature B: The Great Recession: Earthquake For Macroeconomics 87
Special Feature C: Corporate Governance And The Finance Sector: 97
An Asian Perspective
Statistical Appendix 112
Macroeconomic Review, April 2016
Monetary Authority of Singapore Economic Policy Group
LIST OF ABBREVIATIONS
3MMA three-month moving average
ACU Asian Currency Unit
AE advanced economies
ASEAN Association of Southeast Asian Nations
BOJ Bank of Japan
COE Certificate of Entitlement
CPF Central Provident Fund
CPI consumer price index
DBU Domestic Banking Unit
ECB European Central Bank
EIA Energy Information Administration
EPG Economic Policy Group
FI Fiscal Impulse
FOMC Federal Open Market Committee
GFC Global Financial Crisis
GFCF gross fixed capital formation
GOS gross operating surplus
GST Goods and Services Tax
ICT information and communications technology
IMF International Monetary Fund
IT information technology
ITP Industry Transformation Programme
LIBOR London interbank offered rate
MMS Monetary Model of Singapore
MNC multinational corporation
m-o-m month-on-month
NEA Northeast Asian economies
NEER nominal effective exchange rate
OECD Organisation for Economic Cooperation and Development
OPEC Organisation of the Petroleum Exporting Countries
PBOC People’s Bank of China
PMET professionals, managers, executives and technicians
PMI Purchasing Managers’ Index
PPI producer price index
q-o-q quarter-on-quarter
REER real effective exchange rate
SA seasonally adjusted
SAAR seasonally adjusted annualised rate
SIBOR Singapore interbank offered rate
SME small and medium enterprise
SPF Survey of Professional Forecasters
TFP total factor productivity
UBC unit business cost
ULC unit labour cost
WTO World Trade Organisation
y-o-y year-on-year

Preface i
Monetary Authority of Singapore Economic Policy Group
Preface The Macroeconomic Review is published twice a year in conjunction with the release of the MAS Monetary Policy Statement. The Review documents the Economic Policy Group’s (EPG) analysis and assessment of macroeconomic developments in the Singapore economy, and shares with market participants, analysts and the wider public, the basis for the policy decisions conveyed in the Monetary Policy Statement. It also features in-depth studies undertaken by EPG on important economic issues facing Singapore. In this 45th year of the MAS, Special Feature A provides a broad historical narrative of Singapore’s search for a nominal anchor from the early 19th century up to the present, including the considerations leading to the adoption of the unique exchange-rate centred monetary policy framework. We are pleased to have Professor Lawrence Christiano of Northwestern University write Special Feature B in this issue, titled “The Great Recession: Earthquake for Macroeconomics”. We are also grateful to Professor Randall Morck of University of Alberta Business School and Professor Bernard Yeung of NUS Business School for contributing Special Feature C, which provides an Asian perspective on corporate governance with some focus on the role of the financial sector. The Review was edited by Associate Professor Peter Wilson. The data used in the Review was drawn from the following government agencies, unless otherwise stated: BCA, CAAS, CPF Board, DOS, EDB, IDA, IE Singapore, LTA, MOF, MOM, MND, MPA, MTI, STB and URA. The Review can be accessed in PDF format on the MAS website: http://www.mas.gov.sg/Monetary-Policy-and-Economics/Monetary- Policy/Macroeconomic-Review. Hard copies of the Review may also be purchased at major bookstores, ordered online (http://www.marketasiabooks.com), or on an annual subscription basis (details can be found on the last page).

ii Macroeconomic Review, April 2016
Monetary Authority of Singapore Economic Policy Group
14 April 2016
Monetary Policy Statement
INTRODUCTION 1. In October 2015, MAS kept the Singapore dollar nominal effective exchange rate (S$NEER) policy band on a modest and gradual appreciation path, but reduced its rate of appreciation slightly. There was no change to the width of the policy band or the level at which it was centred. This policy stance was assessed to be supportive of economic growth into 2016, while ensuring price stability over the medium term.
Chart 1
S$ Nominal Effective Exchange Rate (S$NEER)
2. Since October 2015, the S$NEER has fluctuated around a strengthening trend, appreciating from below the mid-point of the policy band to the upper half of the band. Following a bout of depreciation pressures in January 2016 amid heightened global risk aversion, the S$NEER strengthened on broad-based US$ weakness, as financial markets revised downwards their expectations of the US Federal Reserve’s pace of interest rate normalisation. However, the average level of the S$NEER over the last six months as a whole has been unchanged compared to the six months prior to October 2015. 3. The three-month S$ SIBOR rose from 1.07% as at end-October 2015 to 1.25% by end-January 2016, before edging down to 1.06% as at end-March 2016.
OUTLOOK
4. Compared to expectations in October 2015, the Singapore economy is now projected to expand at a more modest pace this year, against the backdrop of a less favourable external environment. MAS Core Inflation is likely to pick up gradually over 2016 as the disinflationary effects of Budgetary and
98
100
102
104
106
108
Apr Jul Oct Jan Apr Jul Oct Jan Apr Jul Oct Jan Apr Jul Oct Jan Apr
Ind
ex (
2–5
Ap
r 2
01
2 A
vera
ge =
100
)
2012
Appreciation
Depreciation
indicates release of Monetary Policy Statement
20142013 2015 2016

Monetary Policy Statement iii
Monetary Authority of Singapore Economic Policy Group
other one-off measures fade. However, the increase in core inflation will be milder than earlier expected, on account of a downward revision in the outlook for global oil prices, a reduction in labour market tightness, and weaker consumer sentiment. CPI-All Items inflation will remain negative throughout 2016. Over the medium term, core inflation is expected to average slightly below 2%.
Growth
5. According to the Advance Estimates released by the Ministry of Trade and Industry today, the Singapore economy registered 0% growth on a quarter-on-quarter seasonally adjusted annualised basis in Q1 2016, following the 6.2% expansion in Q4 2015. While output in the manufacturing sector increased after six quarters of contraction, this largely reflected a temporary ramp-up in pharmaceutical production in January. The performance of the rest of manufacturing and the trade-related services sectors continued to be held down by sluggish external conditions. Re-export volumes registered sequential contraction on average over the first two months of 2016. There was also a pullback in financial services activity from the previous quarter, amid the slowdown in bank lending to the region. 6. The outlook for the global economy has dimmed since October. The pace of expansion in the US economy is expected to be more modest than earlier anticipated on account of weakening investment and exports, even as the strengthening labour market continues to underpin private consumption. In the Eurozone and Japan, economic activity will be dampened by their appreciating currencies and weak external demand, notwithstanding recent efforts to boost growth through more accommodative monetary policy. China’s growth momentum is likely to moderate, as its services sector expansion is unlikely to be sufficiently strong to offset faltering industrial activity, amid supply gluts and weak global demand. The slower pace of growth in the G3 and China will in turn weigh on trade-related activity in the rest of Asia. 7. In the quarters ahead, subdued growth in Singapore’s major trading partners will continue to pose cyclical headwinds to the external-oriented sectors. Within manufacturing, the transport engineering and some precision engineering clusters will be hampered by the cutback in oil exploration activities, while the weakness in IT production and its supporting industries will also persist due to tepid final demand and ongoing corporate restructuring. In comparison, the domestic-oriented sectors should continue to provide some support to the economy, underpinned by sustained demand for healthcare and education services, as well as public infrastructure spending. The retail and real estate segments, however, are likely to soften as economic sentiment weakens. Overall, the Singapore economy is likely to grow at a modest pace of 1–3% in 2016, and the level of activity will be slightly below potential.
Inflation
8. MAS Core Inflation, which excludes the costs of private road transport and accommodation, has been subdued. The slight uptick in core inflation to 0.4% y-o-y in January–February 2016 from 0.2% in Q4 2015 was largely due to the smaller decline in the prices of oil-related items on a year-ago basis, as well as the dissipation of temporary disinflationary effects from Budgetary and other one-off measures, such as the enhanced medication subsidies introduced at the beginning of 2015. Meanwhile, CPI-All Items inflation remained muted at −0.7% y-o-y in January–February, as housing rentals and car prices fell further.

iv Macroeconomic Review, April 2016
Monetary Authority of Singapore Economic Policy Group
9. External sources of inflation will stay benign given ample supply buffers in the commodity markets and weak global demand conditions. Since October 2015, global oil prices have fallen considerably and despite the recent pickup, are likely to average lower for the whole of 2016 compared to last year. Domestic cost pressures are also expected to moderate in line with emerging slack in the economy. The domestic labour market is expected to see slightly reduced tightness, with wage growth projected to slow further over the course of 2016 amid softer employment conditions. While the resident unemployment rate has been fairly stable in recent quarters, it could increase slightly in the period ahead alongside a gradual rise in redundancies and declining job vacancies. At the same time, the pass-through of business costs to consumer prices will be constrained by the subdued growth environment. All in, MAS Core Inflation will rise over the course of this year at a milder pace than earlier anticipated. For the whole of 2016, it should come in within the lower half of the 0.5–1.5% forecast range, barring upside surprises to global oil prices. Over the medium term, core inflation is likely to average slightly below 2%. 10. Car prices and housing rentals will continue to dampen overall inflation amid the expected increase in the supply of COEs and newly-completed housing units, respectively. The 2016 forecast for CPI-All Items inflation was revised down to −1.0–0% in February, taking into account the step-down in global oil prices in late 2015 and the sharp decline in COE premiums at the beginning of this year. This forecast for headline inflation remains unchanged.
MONETARY POLICY
11. The Singapore economy is projected to expand at a more modest pace in 2016 than envisaged in the October policy review. MAS Core Inflation should also pick up more gradually over the course of 2016 than previously anticipated, and is now likely to fall below 2% on average over the medium term. 12. MAS will therefore set the rate of appreciation of the S$NEER policy band at zero percent, beginning 14 April 2016. This is not a policy to depreciate the domestic currency, and only removes the modest and gradual appreciation path of the S$NEER policy band that was in place. 13. The width of the policy band and the level at which it is centred will be unchanged. 14. This move to a neutral policy stance of zero percent appreciation follows the measured steps that MAS has taken to reduce the rate of appreciation of the policy band in January and October 2015 respectively.1 The actual outcome of S$NEER movements over the six months since October 2015 has in fact been a zero percent appreciation compared to the preceding six-month period. The cumulative effects of past S$NEER movements and the new policy path will continue to ensure price stability over the medium term.
1 MAS had adopted a modest and gradual appreciation path for the S$NEER policy band since April 2010.

Chapter1TheInternationalEconomy

2 Macroeconomic Review, April 2016
Monetary Authority of Singapore Economic Policy Group
1 The International Economy
Global Growth To Remain Subdued In 2016
The global economy slowed in Q4 2015, as growth decelerated in the advanced economies while remaining below trend in Asia ex-Japan. Economic activity in the US and Japan was dampened, in part, by weather-related factors, even as the Eurozone maintained a steady pace of growth. Meanwhile, China’s ongoing restructuring has put its economy on a weakening growth trajectory, with a pullback in industrial output only partially compensated by a better-performing services sector. Elsewhere in the region, economic activity was weighed down by the turning of the financial, credit and commodity cycles. Nevertheless, generally resilient domestic demand has helped to support growth, with policy stimulus providing a further boost in some countries. In 2016, the outlook is lacklustre growth and low inflation globally. The post-GFC years have been characterised by low nominal GDP growth in many advanced economies. Confronted with weak demand from these economies, as well as China, growth in the rest of emerging Asia is expected to stay tepid. Moreover, with the tightening of global financial conditions, domestic demand growth in the region will be impeded by rising debt service burdens. The softness in emerging Asia’s growth will, in turn, spill back into activity in the advanced economies. Consequently, the prospects for the global economy have dimmed, as compared to the last Review. Growth is projected at 3.8% in 2016, slightly below the 3.9% recorded last year, before edging up marginally to 4.0% in 2017. (Table 1.1) Meanwhile, global inflation is likely to stay muted in 2016, but may rise further next year, alongside the mild pickup in economic activity.
Table 1.1 Global GDP Growth
(%)
Q3 2015 Q4 2015 2015 2016F 2017F
q-o-q SAAR y-o-y
Total* 4.0 3.7 3.9 3.8 4.0
G3* 1.5 0.8 1.6 1.5 1.7 US 2.0 1.4 2.4 2.0 2.4 Japan 1.4 −1.1 0.5 0.6 0.5 Eurozone 1.2 1.3 1.5 1.5 1.6
NEA-3* 2.1 1.7 1.9 1.8 2.3 Hong Kong 2.2 0.9 2.4 1.7 2.0 Korea 5.0 2.7 2.6 2.6 2.8 Taiwan −0.2 2.2 0.7 1.4 2.3
y-o-y
ASEAN-4* 4.5 4.6 4.6 4.4 4.7 Indonesia 4.7 5.0 4.8 5.0 5.3 Malaysia 4.7 4.5 5.0 4.2 4.4 Philippines 6.1 6.3 5.8 6.0 5.9 Thailand 2.9 2.8 2.8 2.9 3.3
China 6.9 6.8 6.9 6.5 6.3 India** 7.7 7.3 7.2 7.6 7.7
Source: CEIC, Consensus Economics, Apr 2016 and EPG, MAS estimates
* Weighted by shares in Singapore’s NODX.
** Figures are reported on a Financial Year basis; FY2017 refers to the period from April
2016 to March 2017.

The International Economy 3
Monetary Authority of Singapore Economic Policy Group
1.1 G3 Economies
Low Inflation Amid Growth Underperformance
The G3 economies ended 2015 on a subdued note, with weaker-than-expected GDP outturns in Q4. This reflected, to some extent, the impact of one-off factors such as unusual weather, which held back spending on warm clothing and utilities in the US and Japan. Nonetheless, expectations are for the US to expand at a moderate pace this year, on the back of a strong labour market and modest income growth. Concerns over the strength of the recovery in Japan remain, given tentative signs that the pullback in economic activity has carried over into Q1 this year. In the Eurozone, domestic demand will be supported by additional monetary easing measures, but external demand will be adversely impacted by the slowdown in emerging markets. On the whole, GDP growth in the G3 is projected to come in at 1.5% in 2016 and tick up slightly to 1.7% in 2017. This sub-par expansion in output, coupled with below-target inflation, implies that nominal GDP growth in the G3 will stay low in the near term, thus necessitating concerted policy responses.
Growth in the US eased towards the end of 2015 …
US GDP growth slackened to 1.4% q-o-q SAAR in Q4 2015, from 2.0% in the preceding quarter. The slowdown in economic activity was broad-based, with a moderation in personal consumption expenditure growth, a sharper pullback in fixed investment spending, and weaker exports. Consumer spending, which had been the lynchpin of growth through most of 2015, rose by a softer 2.4% q-o-q SAAR in Q4, from 3.0% in the previous quarter. This was partly due to transitory factors, such as unusually warm weather, which lowered utilities spending. Meanwhile, non-residential fixed investment contracted for the first time since Q3 2012, by 2.1% q-o-q SAAR in Q4, as a pullback in oil drilling caused structures and equipment expenditure to decline sharply by 5.1% and 2.1%, respectively. (Chart 1.1) Moreover, the strength of the US dollar, alongside soft global demand, continued to weigh on net exports in Q4, which subtracted 0.1% point from GDP growth.
… but the core strengths of the economy should reassert themselves as the year progresses.
Economic indicators point to modest growth in Q1 2016, with a stronger pickup expected only later this year. There have been sustained improvements in the labour market in the early months of 2016, with employment growth averaging 209,000 jobs per month over Jan–Mar. This strength in hiring has, in turn, drawn more people back into the workforce, resulting in a rise in the labour force participation rate to 63.0% in March this year. (Chart 1.2) Indeed, the participation
Chart 1.1
Decomposition of US Non-residential Fixed Investment Growth in 2015
Source: Haver Analytics and EPG, MAS estimates
Chart 1.2 Change in US Non-farm Payrolls and
Labour Force Participation Rate
Source: Haver Analytics and EPG, MAS estimates
-3
-2
-1
0
1
2
3
4
Ave Q1–Q3 Q4
% P
oin
t C
on
trib
uti
on
to
QO
Q S
AA
R G
row
th
Equipment
Intellectual Property
-3-2-101234
Ave Q1-Q3 2015 Q4
% P
oin
t C
on
trib
uti
on
to
QO
Q S
AA
R
Gro
wth
Equipment
Intellectual Property
Structures
Non-residential Fixed Investments
50
150
250
350
62
63
64
65
2012 2013 2014 2015 2016
Pe
rso
ns
(Th
ou
san
d, 3
MM
A)
Pe
r C
ent
Mar
Labour Force Participation Rate
Change in Non-farmPayrolls (RHS)

4 Macroeconomic Review, April 2016
Monetary Authority of Singapore Economic Policy Group
rate has been increasing steadily since September 2015, after being on a downtrend following the GFC. Nevertheless, wage growth has been relatively weak, indicating the presence of residual slack in the labour market. On the whole, consumer spending is likely to maintain a moderate pace of expansion and provide the key support to GDP growth in 2016. In comparison, sectors of the US economy that are sensitive to external demand or energy prices will continue to weigh on growth. Net exports will likely be a drag on account of the substantial appreciation of the US dollar in real trade-weighted terms since mid-2014, accentuated by weak foreign demand. Notably, with the exception of the Eurozone, demand for US exports from all other regions, especially China and ASEAN-4, deteriorated further in Q4 2015. (Chart 1.3) In December 2015, the US Federal Reserve raised the Federal funds rate, after maintaining it at near-zero for seven years. The median expectation among FOMC members at that time was for another four rate hikes, amounting to a cumulative 100 bps increase, over the course of 2016. However, at the latest policy meeting in March, the FOMC members slightly lowered their growth and inflation forecasts for 2016 and cut back on the projected number of rate hikes to just two this year. Although core inflation has picked up more recently, the strength of the US dollar is anticipated to help keep inflation in check and there appears to be room for further employment growth before marked increases in labour costs are triggered. All in, US GDP growth is expected to come in at 2.0% in 2016, before rising to 2.4% in 2017.
Eurozone growth was steady in Q4.
Eurozone GDP expanded by 1.3% q-o-q SAAR in Q4 2015, similar to the outturn in the previous quarter. Although this was marginally higher than the average of 1.2% since the recovery from the sovereign debt crisis in Q2 2013, growth momentum decelerated through the course of 2015, from an average of 1.9% in H1 to 1.2% in H2. In terms of expenditure, robust domestic demand continued to be offset by the negative effect from trade, although there was a discernible shift in the former’s underlying composition. Private consumption growth—the main driver of the recovery thus far—eased across the four major Eurozone economies, in spite of a pickup in wage
Chart 1.3 Growth in US Exports by Region
Source: Haver Analytics and EPG, MAS estimates
* North America refers to Canada and Mexico.
2015 Q2 Q3 Q4
-40
-30
-20
-10
0
10
20
30
% Q
OQ
SA
AR
ASEAN-4 NEA-3 China Eurozone North America*

The International Economy 5
Monetary Authority of Singapore Economic Policy Group
growth and lower oil prices. (Chart 1.4) Notably, consumer spending in France fell into outright contraction in the aftermath of the Paris terror attacks in November. In contrast, investment spending in the Eurozone, which has been subdued over the past two years, rebounded strongly (except in Spain), to 5.4% in Q4, from 1.7% in the previous quarter. This was due to a rise in construction-related activity, albeit from a low base, as well as a tentative pickup in machinery and equipment investment across the region as business confidence improved.
A challenging external environment will pose a drag on Eurozone growth.
The Eurozone economy should expand at a modest pace in 2016, with growth underpinned by private consumption and a slightly expansionary fiscal impulse. Notwithstanding the recent dent in consumer confidence caused by elevated financial volatility earlier this year, household spending should continue to be supported by moderate wage growth, low oil prices and steady employment gains. Moreover, the fiscal stance will be fairly accommodative, in view of refugee-related spending in Germany, alongside some easing of fiscal tightening measures in Italy and Spain. Nonetheless, the region faces a challenging external environment. Exports from the Eurozone to large emerging markets, such as China and Russia, as well as shipments to advanced economies such as the US, may continue to underperform. The ECB had noted that risks to growth are tilted to the downside, which could exacerbate deflationary pressures. In response, the ECB eased monetary policy further in March 2016: interest rates were lowered, including the rate on the deposit facility, which was cut by 10 bps to an unprecedented −0.4% (Chart 1.5); the asset purchase programme was expanded to €80 billion per month and will include purchases of investment-grade bonds issued by non-bank corporations; and a series of four targeted longer-term refinancing operations (TLTRO II) was launched. In order to spur economic activity and raise the inflation rate back to target, ECB President Draghi has committed to keep interest rates “very low, for a long period of time”. On balance, growth projections for the Eurozone are 1.5% this year and 1.6% in 2017.
Chart 1.4
Eurozone Private Consumption and Investment
Source: Eurostat
Chart 1.5 Eurozone’s Key Policy Rates and
Asset Purchase Programme
Source: ECB
-2
0
2
4
6
8
QO
Q S
AA
R %
Gro
wth
Q3 2015 Q4 2015
Consumption Investment
2014 May Sep 2015 May Sep 2016
0
400
800
1200
-0.5
0.0
0.5
1.0€
Bill
ion
% P
er
An
nu
m
Holdings under Asset Purchase Programme (RHS)Deposit RateRefinancing RateMarginal Lending Rate
Mar

6 Macroeconomic Review, April 2016
Monetary Authority of Singapore Economic Policy Group
Growth prospects for Japan have been downgraded.
Following an expansion of 1.4% q-o-q SAAR in Q3 2015, Japan’s economy contracted by 1.1% in Q4 due to a pullback in private consumption, with unusually warm weather dampening spending on winter goods and heating. (Charts 1.6 and 1.7) Meanwhile, aggregate investment spending increased by 0.8% q-o-q SAAR in Q4, supported mainly by the non-residential segment, while residential investment contracted by 4.7%, following three quarters of increase. Overall exports fell by 3.3%, as a decline in shipments to Asian markets more than offset a pickup in volumes to the advanced economies. Private spending has been lacklustre in Japan, especially after the consumption tax hike in April 2014. Slower wage growth and higher food prices have also curtailed real household expenditure on non-food consumption items, as more spending was channelled to food expenses. (Chart 1.7) Against this backdrop of flagging domestic demand and lower-than-expected inflation outcomes, the Bank of Japan (BOJ) enhanced its Quantitative and Qualitative Monetary Easing (QQE) policy in October 2014 with higher asset purchases. This was followed by a further move in January 2016 to introduce a negative interest rate policy, which will apply to financial institutions’ funds in excess of average outstanding balances at the central bank in 2015 and selected portions of reserves. Working in tandem with asset purchases, the policy aims to further reduce rates across the entire yield curve and spur spending by firms and households. Looking ahead, domestic demand is projected to recover, albeit gradually, on the back of healthy corporate profits as well as a modest pickup in wage growth. The further loosening of financial conditions through negative interest rates is also expected to have some stimulative effects, especially on investment. However, risks to Japan’s growth outlook include heightened uncertainty in the global economy and the recent appreciation of the yen, which could adversely affect firms’ profits and hold back the pace of capital expenditure and wage increases. All in, the Japanese economy is projected to grow by 0.6% in 2016, before easing to 0.5% in 2017, mainly due to the effects of the planned consumption tax hike.
Chart 1.6
Contribution to Japan’s GDP Growth
Source: CEIC
Chart 1.7
Real Household Expenditure in Japan
Source: CEIC
-15
-10
-5
0
5
10
2012 2013 2014 2015 Q4
% P
oin
t C
on
trib
uti
on
to
Q
OQ
SA
AR
Gro
wth
Private Consumption Govt Consumption
Investment Net Exports
GDP
85
90
95
100
105
110
2010 2011 2012 2013 2014 2015
Ind
ex
(20
10
=10
0),
SA
Q4
Total Expenditure
FoodExpenses
Fuel Charges
Clothes

The International Economy 7
Monetary Authority of Singapore Economic Policy Group
Slow growth and low inflation necessitate concerted policy responses by
the advanced economies.
More than seven years after the collapse of Lehman Brothers, a strong recovery has yet to materialise in the advanced economies. In the aftermath of the GFC, debt overhang, sluggish investment and hysteresis effects associated with increases in long-term unemployment have contributed to a reduction in trend real GDP growth, as well as a notable decline in nominal GDP growth rates in the G3. (Chart 1.8) The deceleration in nominal growth, reflecting both low growth and muted inflation, is of particular concern given the elevated stock of private and public sector debt in these economies. (Chart 1.9) With nominal interest rates largely constrained by the zero lower bound, low (and at times negative) inflation implies that the real rate of interest remains too high. Apart from restraining current spending, high real interest rates also raise debt servicing and repayment obligations, especially with a slowdown in nominal GDP growth depressing corporate revenues. Going forward, more needs to be done by the G3 economies on the policy front to raise growth prospects over the longer term. While monetary policy has shouldered most of the burden in supporting aggregate demand in the short term, there is insufficient progress on improving supply-side growth drivers, without which sustained long-term growth will not be achievable. A concerted and coordinated package of measures that includes monetary accommodation, fiscal stimulus and structural reforms, aimed at enhancing economic efficiency and removing impediments to growth (such as labour and product market rigidities), will have a better chance of lifting investment and economic growth.
Chart 1.8
G3 Nominal GDP Growth
Source: CEIC and EPG, MAS estimates
Note: The slight uptick in nominal GDP growth in Japan in 2014 and 2015 was due, in large part, to the 3% points hike in the consumption tax to 8% in April 2014, which led to a one-off increase in the price level.
Chart 1.9
G3 Non-financial Private Sector Debt
Source: Institute of International Finance
-10
-5
0
5
10
15
1980 1985 1990 1995 2000 2005 2010 2015
% Y
OY
US
Japan
Eurozone
40
60
80
100
120
140
2000 2005 2010 2015
% o
f G
DP US Households
Eurozone Households
Japan Non-financial Corporates
Japan Households
US Non-financial Corporates
Eurozone Non-financial Corporates
Q4

8 Macroeconomic Review, April 2016
Monetary Authority of Singapore Economic Policy Group
1.2 Asia
Growth Outlook Dims With Rising Financial Headwinds
In Asia ex-Japan, growth was underpinned by relatively resilient domestic demand in Q4 2015, which provided some buffer against lacklustre export performance. Although further pump-priming measures should help to put a floor on China’s growth in 2016, the economy’s rebalancing continues to impact the region through lower import demand. In the coming quarters, Asia ex-Japan is expected to register tepid growth, given further moderation in the Chinese economy and muted imports of investment goods from the advanced economies. However, the weakness in the export sector will be partly offset by a revival of public investment in most ASEAN economies and India. The outlook for private investment is much less sanguine. First, the turn in the global financial cycle, triggered by the US interest rate hike in December 2015, will raise the debt-servicing burden of corporates which had borrowed heavily during the upswing of the cycle amid low global interest rates. Second, credit growth has waned alongside intermittent capital outflows and tightening financial conditions. Third, the end of the commodity super-cycle has crimped corporate and fiscal revenues in a number of economies. This confluence of events has intensified the challenges facing the region, and growth in Asia ex-Japan is projected to slow to 4.6% in 2016 from 4.7% last year, before picking back up mildly to 4.7% in 2017.
China’s growth will be cushioned by policy easing.
The Chinese economy experienced a gradual slowdown over the course of 2015, as the divergence between its goods-producing and services industries widened. In Q4 2015, China’s GDP decelerated to 6.8% on a y-o-y basis and to 1.5% on a q-o-q SA basis, from 6.9% and 1.8% in Q3, respectively. (Chart 1.10) For the year as a whole, the manufacturing and construction sectors grew on average by a tepid 6.0%, weighed down by excess industrial capacity and sluggish demand. In comparison, growth in the services sector came in at 8.3% y-o-y, spurred by capital market-driven activity in the financial services sector.
China’s economy slowed further in Q1 2016 to 6.7% y-o-y, with sequential growth momentum easing to 1.1% q-o-q SA. Nonetheless, investment in fixed assets grew by 10.7% y-o-y in Q1, up from 10% in 2015, on the back of a property market recovery and faster infrastructure construction. Meanwhile, retail sales rose at a slightly slower pace of 10.3% y-o-y compared to 10.7% in 2015, alongside sluggish consumer confidence and a softer labour market. (Chart 1.11)
In the quarters ahead, the Chinese authorities are expected to continue to apply monetary and fiscal stimuli to the economy in a measured manner, to ease the adjustment costs arising from structural reforms and industrial layoffs. Besides successively lowering the
Chart 1.10 China’s GDP Growth
Source: CEIC and EPG, MAS estimates
Chart 1.11
Change in Employment in China by Sector
Source: CEIC
2012 2013 2014 2015 2016Q1
0.5
1.0
1.5
2.0
2.5
6.5
7.0
7.5
8.0
8.5
Pe
r C
en
t
Pe
r C
en
t
YOY
QOQ SA (RHS)
2009 2010 2011 2012 2013 2014 2015
-20
-15
-10
-5
0
5
10
15
20
Mill
ion
Tertiary Secondary Primary

The International Economy 9
Monetary Authority of Singapore Economic Policy Group
benchmark lending rate and the reserve requirement ratio for banks over the past year, the central government recently announced a more expansionary fiscal stance for 2016 by targeting a budget deficit amounting to 3% of its GDP. In addition, direct fiscal spending will be complemented by off-budget measures, such as local government bond issuances, the proceeds from which can be used to fund infrastructure works. Nonetheless, given weak domestic and external demand, the industrial sector faces continuing overcapacity in heavy industries and electronics. The hitherto robust expansion of the overall services sector will not be sufficient to offset the effects of sluggish exports and manufacturing output, as services are not fully insulated from the industrial weakness. Activities that move in sync with manufacturing, such as transportation and wholesale trade services, will be adversely affected. Increased layoffs in the heavy industries will also dampen wage growth and weigh on private consumption. Taking these factors into account, China’s growth is expected to come in at 6.5% this year, before slowing further to 6.3% in 2017. The deceleration in the Chinese economy has been a contributor to the weakness in global trade in the last few quarters, dampening the growth outcomes of key trading partners across the world. Box A highlights the differential impact of this development on various countries and regions.
India is the bright spot in the region.
India’s GDP expanded at a firm 7.3% y-o-y in Q4 2015, though this was a slight moderation from the 7.7% in the previous quarter. Household expenditure growth rose to 6.4% y-o-y from 5.6% over the same period, as higher urban discretionary spending more than compensated for weak rural demand. However, the investment recovery seen earlier faltered somewhat, as gross fixed capital formation growth slipped to 2.8% y-o-y in Q4 2015 from 7.6% in the preceding quarter, largely on account of weak private investment. (Chart 1.12) In the near term, the Indian economy will remain on a modest expansion path, despite a weak external environment. Economic activity will continue to be driven by private consumption, which has received a fillip from lower energy prices and higher real wages.
Chart 1.12
India’s Outstanding Investment by Ownership
Source: Centre for Monitoring Indian Economy
0
30
60
90
120
150
180
2011 2012 2013 2014 2015 Q4
INR
Tri
llio
n
Indian Private Sector Foreign Private Sector Government

10 Macroeconomic Review, April 2016
Monetary Authority of Singapore Economic Policy Group
Looking ahead, an increase in public infrastructure spending and official efforts to improve the business environment should gradually crowd in private investment. Encouragingly, foreign direct investment hit a record high of US$39 billion in 2015, a 37% surge from the previous year. Nonetheless, weakness in both corporate financial and public bank balance sheets will constrain a sharper pickup in growth. To date, Indian banks have passed on less than half of the Reserve Bank of India’s (RBI) cumulative 150 bps reduction in the policy rate since the beginning of 2015, with median base lending rates having fallen by only 60 bps. (Chart 1.13) Notwithstanding a challenging global growth environment, GDP growth is projected to come in at a solid 7.6% in FY2016 and rise further to 7.7% in the following year.
Growth projections for the NEA-3 have been revised down sharply.
The NEA-3 region as a whole grew by 1.7% q-o-q SAAR in Q4 2015, down from a 2.1% expansion in the preceding quarter. Weak external demand was behind the slowdown. In Korea and Taiwan, the weakness in shipments of capital goods and heavy equipment has extended to electronics, as industrial upgrading in China’s electronics industry reduced the mainland’s reliance on imported Korean and Taiwanese components. As a result, Korea’s growth decelerated to 2.7% q-o-q SAAR in Q4 from 5.0% in Q3. However, Taiwan’s GDP expansion picked up to 2.2% q-o-q SAAR on the back of stimulus-driven private consumption expenditure. Hong Kong’s growth eased to 0.9% q-o-q SAAR in Q4 from 2.2% in the previous quarter, owing to falling retail sales and shrinking tourist numbers, particularly from mainland China.
The persistently weak export performance of Korea and Taiwan is beginning to weigh on domestic economic activity, as shown by signs of softness in their manufacturing sectors and labour markets. Hong Kong, which has been a popular destination for mainland tourists and an important transhipment hub for China, is also likely to face challenges. The latest PMI reading for Hong Kong deteriorated further in March 2016, although those for Korea and Taiwan saw some improvement. (Chart 1.14) Overall, the short-term outlook for the NEA-3 has dimmed progressively, resulting in successive downgrades in growth projections for the region. (Chart 1.15) Accordingly, consensus growth forecasts for 2016 and 2017 have been lowered to 1.8% and 2.3%, respectively, from 2.2% and 2.5% in January.
Chart 1.13
India Interest Rates
Source: CEIC and EPG, MAS estimates
Chart 1.14 NEA-3 Manufacturing PMIs
Source: Markit
* Whole economy.
Chart 1.15 NEA-3 GDP Growth Projections for 2016
Source: Consensus Economics
1.0
1.5
2.0
2.5
3.0
3.5
5
7
9
11
13
15
2012 2013 2014 2015 2016
Pe
r C
ent
Pe
r C
ent
Spread between the Two Rates (RHS)
RBI Repo Rate
Five Major Bank Base Rate
Mar
44
46
48
50
52
54
2015 Mar May Jul Sep Nov 2016 Mar
Ind
ex,
>5
0=E
xpan
sio
n
Korea
Taiwan
Hong Kong*
0
1
2
3
4
Korea Hong Kong Taiwan
% Y
OY
Apr 15 Oct 15 Apr 16Projection as of:

The International Economy 11
Monetary Authority of Singapore Economic Policy Group
P
ASEAN-4 will deliver below-trend growth.
GDP growth in the ASEAN-4 held steady at 4.6% y-o-y in Q4 2015, as a pickup in domestic demand alleviated the negative impact of a slowdown in exports. Across the region, private consumption growth held firm or strengthened, supported by resilient labour markets and the boost to real incomes from a renewed decline in oil prices. In Malaysia and Thailand, household spending was also lifted by the frontloading of vehicle purchases ahead of tax revisions in 2016. Bolstered by robust growth in government development expenditure, investment surged in Indonesia and Thailand, and rose at a creditable pace in the Philippines. (Chart 1.16) Trade performance, however, diverged across the region, largely reflecting variations in the composition of exports. Goods exports from Malaysia and the Philippines expanded in the past two quarters, supported by firmer demand for high-tech products. (Chart 1.17) In comparison, goods exports declined in Indonesia and Thailand, weighed down by falling shipments of mining and agricultural products, respectively, while exports of lower value-added manufactured goods stayed weak. The Philippines benefited from solid growth in services exports, due to higher tourism receipts and business services earnings. In comparison, the surge in Thailand’s services exports faded in Q4 2015 as tourist arrivals slowed following the rebound in Q1–Q3. Economic growth in the ASEAN-4 region is expected to ease further this year, given the downbeat global outlook and slowing domestic demand in some economies. Increased government outlays on infrastructure, however, will provide some support in the near term. Malaysia and Thailand will be the most affected by continued softness in external demand, given their greater external orientation and exposure to China’s slowing economy. Meanwhile, Indonesia and the Philippines face firmer growth prospects, with domestic demand underpinned by improving consumer and investor sentiments. In addition, the monetary easing undertaken by Indonesia early this year will provide support to economic activity, while growth in the Philippines will be bolstered by additional fiscal expenditures in the run-up to the presidential election in May. Overall, GDP growth in the ASEAN-4 is projected to slow from 4.6% last year to 4.4% in 2016, before rising to 4.7% in 2017.
Chart 1.16 Growth in ASEAN-4 Public
Capital Expenditure in 2015
Source: CEIC and EPG, MAS estimates
Chart 1.17 Growth in ASEAN-4 Real Exports in 2015
Source: CEIC and EPG, MAS estimates
* Malaysia’s national accounts data does not have a quarterly breakdown into goods and services exports.
Indonesia Malaysia Philippines Thailand
-10
0
10
20
30
40
50
60
70
% Y
OY
Q2 Q3 Q4
Q3 Q4 Q3 Q4 Q3 Q4 Q3 Q4
Indonesia Malaysia* Philippines Thailand
-4
-2
0
2
4
-8
-4
0
4
8
% P
oin
t C
on
trib
uti
on
to
GD
P G
row
th
% Y
OY
Goods Exports Services Exports
Goods & Services Exports Total Export Growth (RHS)

12 Macroeconomic Review, April 2016
Monetary Authority of Singapore Economic Policy Group
Growth in Asia ex-Japan will be hampered by the sharp run-up in debt post-GFC.
The Asia ex-Japan region as a whole is presently adjusting to the turn in the global financial, credit and commodity cycles. For several years following the GFC, low interest rates in the advanced economies, accompanied by quantitative easing and large capital outflows, led to a rapid escalation in debt accumulation in parts of Asia. While the flood of global liquidity helped to fuel growth, the resultant debt build-up is now unravelling at a time when commodity prices have slumped and global interest rates are set to rise. This deleveraging process, combined with slowing activity, could result in a period of weak investment and consumption growth. The increase in leverage is most pronounced in China, where debt rose largely because of a rapid build-up of non-financial corporate borrowing. This reflected, in part, the Chinese government’s efforts to support growth in the aftermath of the GFC through monetary easing. (Chart 1.18) In Korea, Thailand, and Malaysia, household debt has also climbed significantly, to around 70–90% of GDP. In these, and some other Asia ex-Japan countries, debt service ratios in the private non-financial sectors have trended up over the past several years to above pre-GFC levels. (Chart 1.19) Further, countries with a significant proportion of US dollar-denominated debt may face some refinancing difficulties ahead, given the ongoing trend appreciation in the US dollar. (Chart 1.20) In sum, the tightening of global financial conditions in the aftermath of a credit boom in the region could pose a significant drag on growth, although the impact would vary across countries.
Chart 1.18 Asian Debt by Sector
Source: Institute of International Finance and EPG, MAS estimates
Chart 1.19
Selected Asian Debt Service Ratios
Source: Bank for International Settlements
Chart 1.20
US Dollar-denominated Debt in Asia
Source: Haver Analytics, Institute of International Finance, World Bank and EPG, MAS estimates
0
50
100
150
200
250
300
350
% o
f G
DP
050
100150200250300
China Indonesia Korea Malaysia Thailand
% o
f G
DP
HouseholdNon-financial CorporatesGovernmentFinancial Corporates
HouseholdNon-financial CorporatesGovernment
Q3 2007
Financial Corporates
050
100150200250300350
China Indonesia Korea Malaysia Thailand
% o
f G
DP
HouseholdNon-financial CorporatesGovernmentFinancial Corporates
HouseholdNon-financial CorporatesGovernment
Q4 2015
Financial Corporates
China Indonesia Korea Malaysia Thailand
0
5
10
15
20
25
30
2005 2007 2009 2011 2013 2015
Pe
r C
en
t
Malaysia
Thailand
Hong Kong
India
Korea
Q3
0
2
4
6
8
10
12
14
16
China India Indonesia Malaysia Thailand
% o
f G
DP
Public and Publicly Guaranteed Non-financial Corporates

The International Economy 13
Monetary Authority of Singapore Economic Policy Group
1.3 Global Inflation
Weak Global Demand Will Keep Inflation Low
Global inflation has been muted in the last two years, with low oil prices exerting a strong dampening effect and sluggish aggregate demand restraining price pressures. In 2016, headline global inflation is expected to rise slightly to 1.4%, after coming in at 0.9% last year. While underlying price pressures are likely to stay weak on account of subdued growth, the energy-related drag should dissipate with the anticipated stabilisation of oil prices. However, in India and the ASEAN economies, where food forms a larger proportion of the CPI basket, a pickup in food prices due to the El Niño weather phenomenon may contribute to some inflationary pressures. In 2017, global inflation is projected to increase further to 2.1%, as economic activity strengthens and the direct and indirect impact of low energy prices fade.
Inflation remains below target in the G3.
Inflation has begun to rise slightly in the US, while staying muted in the Eurozone and Japan. (Chart 1.21) US headline inflation rose to 1.1% in Q1 2016 from 0.5% in the previous quarter, as the disinflationary effects from energy prices eased further. Core inflation was also higher at 2.2% in Q1 2016, up from 2.0% in the previous quarter, reflecting continued improvements in labour and housing market conditions. In the Eurozone, headline inflation eased, coming in flat in Q1, from 0.2% the quarter before. Despite the recent turnaround in oil prices early this year, muted core inflation prints of 1.0% y-o-y over the past two quarters suggest that the unwinding of excess capacity in the region remains incomplete. Meanwhile, Japan’s headline CPI inflation came in at 0.3% y-o-y in Q4 2015, slightly higher than the 0.2% recorded in the preceding quarter. Lingering downward pressure from low oil prices will continue to depress inflation in 2016, alongside slow GDP growth. Overall, G3 inflation is projected to rise from 0.2% in 2015 to 0.8% in 2016.
Asia ex-Japan inflation is not expected to rise significantly in 2016.
Inflation in Asia ex-Japan is likely to remain muted in the quarters ahead. Energy prices are still low despite some pickup since the beginning of this year (Chart 1.22), which will offset higher import prices caused by the depreciation of some Asian currencies, as well as higher food prices owing to the El Niño weather phenomenon. Accordingly, inflation in Asia ex-Japan is
Chart 1.21
G3 CPI Inflation
Source: CEIC and EPG, MAS estimates
Chart 1.22 Global Oil and Food Price Indices
Source: IMF
* Average of UK Brent, Dubai and West Texas Intermediate oil prices.
2008 2010 2012 2014 2016Q1
-4
-2
0
2
4
6
% Y
OY G3
US
JapanEurozone
2014 Apr Jul Oct 2015 Apr Jul Oct 2016
20
40
60
80
100
120
Ind
ex (
2014
Jan
=100
) Food & Beverages
Oil*
Mar

14 Macroeconomic Review, April 2016
Monetary Authority of Singapore Economic Policy Group
expected to come in at 2.5% this year, close to the 2.4% recorded in 2015. (Chart 1.23) In China, headline inflation tapered alongside falling core inflation, from 1.7% y-o-y in Q3 2015 to 1.5% in Q4, due to a milder rise in food prices. However, in Q1 this year, pork prices surged anew by an average of 24.2%, lifting headline inflation to 2.1%. After worsening to 5.9% in Q4 2015, Chinese PPI deflation slowed in Q1 2016, with the index declining by 4.8% y-o-y. For 2016, China’s headline CPI inflation is projected to average 1.9%. India’s CPI inflation rose to 5.3% y-o-y in Q4 2015 from 3.9% in Q3, largely on account of higher cost of food items. Nonetheless, headline inflation remained unchanged in Q1 2016 as food price inflation held steady. High food prices have been reined in over the past two years, aided by improved food management policies by the government. Consequently, CPI inflation in India is expected to decline further to 5.2% in FY2017. In the NEA-3, inflation ticked up to 1.5% y-o-y in Q1 2016 from 1.1% in the preceding quarter. A cold spell at the turn of the year pushed food prices higher even as low energy prices continued to suppress inflation in the region. Consequently, food price inflation edged up in Korea, Taiwan and Hong Kong in Q1 2016. On the whole, inflation in the NEA-3 is expected to increase to 1.3% in 2016 as the base effect from low oil prices dissipates. Headline inflation in the ASEAN-4 region stayed low in Q1 2016, at 3.0% y-o-y, partly due to weak energy prices, especially in Indonesia. Inflation in Thailand was in negative territory for the fifth consecutive quarter, as sub-par growth depressed underlying price pressures, and energy costs continued to fall sharply. In the Philippines, inflationary pressures stayed weak, held down by low food prices. Meanwhile, Malaysia saw a surge in inflation in Q1, due to the implementation of the Goods and Services Tax (GST) in April 2015, and upward adjustments to administrative prices. For the ASEAN-4 region as a whole, inflation is forecast to come in at 3.2% this year.
Chart 1.23
Asia ex-Japan Inflation
Source: CEIC and EPG, MAS estimates
2008 2010 2012 2014 2016Q1
-4
0
4
8
12
16
% Y
OY
ASEAN-4
NEA-3
China
India

The International Economy 15
Monetary Authority of Singapore Economic Policy Group
Box A
China And The Global Export Slowdown
Introduction
Global trade growth slowed markedly in 2015, with emerging economies recording their first year of contraction in merchandise trade volumes since the GFC. A slowdown in China’s imports, particularly in commodities, has been widely regarded as a key factor behind the trade slowdown. This Box examines developments in China’s imports in recent years and the impact of the deceleration in the country’s growth on the global economy, including across different countries and regions.
Decomposing China’s Import Demand
Despite perceptions that sharply falling Chinese demand was responsible for the plunging prices of commodities, such as oil, the country’s total merchandise import volume contracted only marginally in 2015. After stripping out price effects, imports in real terms fell by 0.7% last year after rising by 3.7% in 2014. (Chart A1) This suggests that other factors, including structural shifts, were also important in explaining the deceleration in global trade growth.
Chart A1 China’s Merchandise Import Growth:
Volume and Price Effects, 2007–15
Chart A2 China’s Import Growth by Selected Products:
Volume and Price Effects in 2015
Source: CEIC, IMF and EPG, MAS estimates
Source: China General Administration of Customs and EPG, MAS estimates
Chart A3 China’s Nominal Merchandise
Import Growth by Country
Chart A4 Exposure to China’s Import
Demand in 2011
Source: CEIC and EPG, MAS estimates
* Asia-9 comprises Hong Kong, Indonesia, Korea, Malaysia, the Philippines, Singapore, Taiwan, Thailand and Vietnam.
Source: OECD-TiVA Database and EPG, MAS estimates
-20
-10
0
10
20
30
40
2007 2008 2009 2010 2011 2012 2013 2014 2015
% P
oin
t C
on
trib
uti
on
to
Im
po
rt G
row
th
Volume Effect Price Effect Total Imports
-60
-40
-20
0
20
% P
oin
t C
on
trib
uti
on
to
Im
po
rt G
row
th
Volume Effect Price Effect Import Value
-15
-10
-5
0
5
10
2013 2014 2015
% P
oin
t C
on
trib
uti
on
to
Im
po
rt G
row
th
Asia-9*
Africa, Middle East & Latin America
G3
ROW
Total Imports
0
2
4
6
8
NEA-3& SGP
ASEAN-4 Japan Eurozone UK US
% o
f D
om
est
ic N
om
ina
l G
DP
Goods Services
16 Macroeconomic Review, April 2016
Monetary Authority of Singapore Economic Policy Group
China’s customs trade data show that trends in import volumes and values varied considerably across major products in 2015. Although the country imported larger quantities of crude oil, LPG, and iron ore, their unit prices fell by around 40%, resulting in lower import values for these products. (Chart A2) Conversely, China imported smaller quantities of manufactured products such as computers, display screens and cars, which contributed, in part, to the slump in intra-regional trade since early 2015. Meanwhile, Chinese imports of coal fell in both volume and price terms. In terms of geographical impact, the bulk of the decline in China’s nominal imports last year was due to goods shipped from the Middle East, Latin America and Africa combined, while Asia-9 and the G3 accounted for smaller proportions. (Chart A3)
Estimating Country Exposure to China’s Final Demand
A slowdown in Chinese demand will have the largest impact on the NEA-3 and ASEAN economies, given the strong economic linkages within the region and the large volumes of intra-regional trade. Applying the OECD-WTO Trade in Value-added (TiVA) dataset to obtain estimates of country exposure, in the form of domestic value-added embodied in China’s final demand, the country’s import demand for goods and services accounted for 7.7% of the combined nominal GDP of NEA-3 and Singapore, and 4.5% of ASEAN-4 in 2011. (Chart A4) The main channels of transmission are through the electronics industry, as well as the tourism-related industries of restaurants & hotels and retail trade. In comparison, the advanced economies are less exposed, with China’s import demand averaging just 1% of G3 nominal GDP.
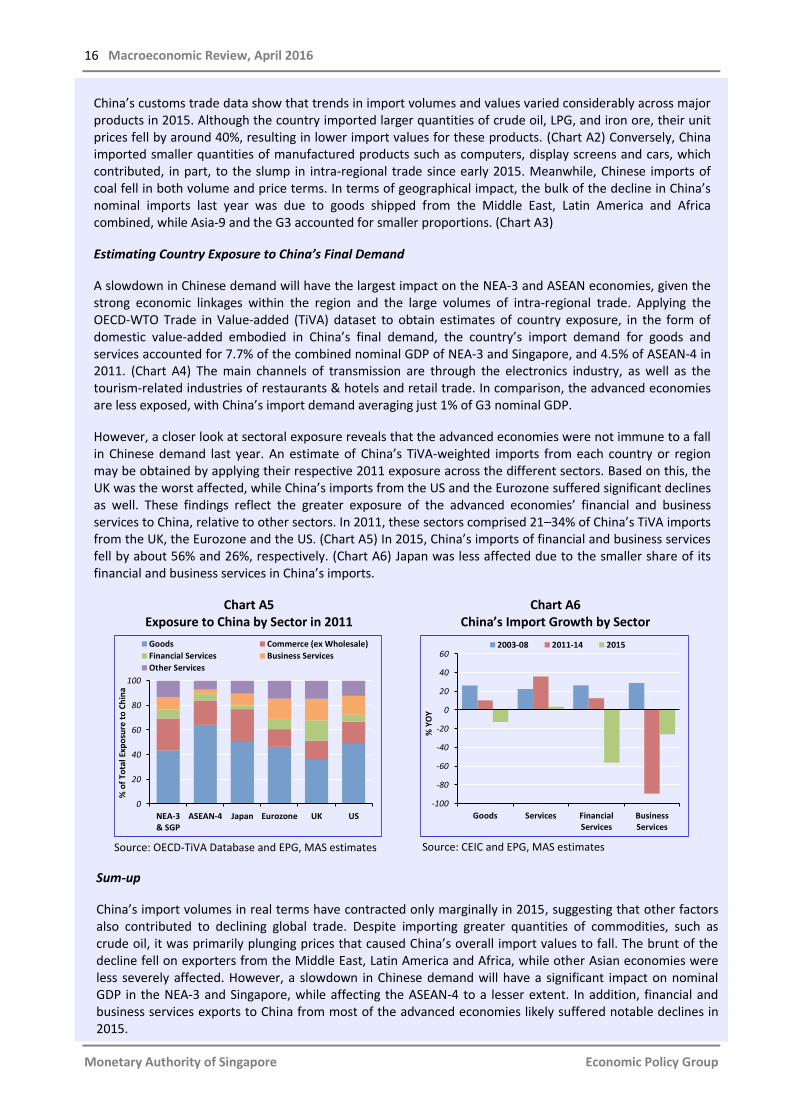
However, a closer look at sectoral exposure reveals that the advanced economies were not immune to a fall in Chinese demand last year. An estimate of China’s TiVA-weighted imports from each country or region may be obtained by applying their respective 2011 exposure across the different sectors. Based on this, the UK was the worst affected, while China’s imports from the US and the Eurozone suffered significant declines as well. These findings reflect the greater exposure of the advanced economies’ financial and business services to China, relative to other sectors. In 2011, these sectors comprised 21–34% of China’s TiVA imports from the UK, the Eurozone and the US. (Chart A5) In 2015, China’s imports of financial and business services fell by about 56% and 26%, respectively. (Chart A6) Japan was less affected due to the smaller share of its financial and business services in China’s imports.
Chart A5 Exposure to China by Sector in 2011
Chart A6 China’s Import Growth by Sector
Source: OECD-TiVA Database and EPG, MAS estimates
Source: CEIC and EPG, MAS estimates
Sum-up
China’s import volumes in real terms have contracted only marginally in 2015, suggesting that other factors also contributed to declining global trade. Despite importing greater quantities of commodities, such as crude oil, it was primarily plunging prices that caused China’s overall import values to fall. The brunt of the decline fell on exporters from the Middle East, Latin America and Africa, while other Asian economies were less severely affected. However, a slowdown in Chinese demand will have a significant impact on nominal GDP in the NEA-3 and Singapore, while affecting the ASEAN-4 to a lesser extent. In addition, financial and business services exports to China from most of the advanced economies likely suffered notable declines in 2015.
0
20
40
60
80
100
NEA-3& SGP
ASEAN-4 Japan Eurozone UK US
% o
f T
ota
l Exp
osu
re t
o C
hin
a
Goods Commerce (ex Wholesale)
Financial Services Business Services
Other Services
Goods Services FinancialServices
BusinessServices
-100
-80
-60
-40
-20
0
20
40
60
% Y
OY
2003-08 2011-14 2015

Chapter2TheSingaporeEconomy
18 Macroeconomic Review, April 2016
Monetary Authority of Singapore Economic Policy Group
2 The Singapore Economy
Cyclical Factors Weigh On Near-term Growth
The Singapore economy grew by an average of 3.1% q-o-q SAAR in Q4 2015 and Q1 2016. However, the underlying sectoral growth profile was uneven over the past six months. Against the downshift in the external environment and volatile financial markets early this year, economic activity appears to have weakened across more sectors into Q1. Besides pockets of the trade-related industries, the modern services and consumer-facing services sectors also turned in a muted performance. For the rest of the year, the softening of growth prospects across a number of Singapore’s key trading partners is expected to dampen activity in the external-oriented sectors. Notably, growth of capital formation in the G3 is likely to be lower than last year. This is expected to have a negative impact on pockets of trade-related industries, such as precision engineering, which have a relatively high exposure to the global investment cycle. Further, some signs of weakness have emerged in the domestic corporate landscape, with forward-looking business expectations pointing to softer conditions in H1 2016. Alongside the deterioration in activity, firms have responded by consolidating their operations, as evident in the step-down in business loan growth as well as the uptick in redundancies. Nonetheless, these corporate adjustments appear to be contained within specific clusters of firms at this stage. Given the subdued outlook, the Singapore economy is expected to see modest gains in the quarters ahead, culminating in 1–3% growth for this year as a whole.

The Singapore Economy 19
Monetary Authority of Singapore Economic Policy Group
2.1 Recent Economic Developments
Economic Activity Weakened Across More Sectors
The Singapore economy continued to chart a volatile growth profile over the past two quarters. A strong showing by modern services and the domestic-oriented cluster boosted GDP in Q4 2015, although the trade-related industries were buffeted by cyclical headwinds. In early 2016, the weakness widened to more industries. The pullback was most evident within the modern services cluster, with financial sector activity hit by falling credit demand and lower fee income from fund management after a surge at year-end. The more subdued economic environment also dampened pockets of domestic-oriented activity, although the cluster remained relatively resilient as a whole.
The Singapore economy has been on a three-speed trajectory in recent years, although the differences have narrowed more recently.
The performance of the domestic economy over the past six months or so has been modest and uneven, as in recent years. Economic activity picked up in the final quarter of 2015, with GDP rising by a stronger-than-expected 6.2% q-o-q SAAR to bring the year to a close on a high note. (Chart 2.1) However, this was transitory, with the latest Advance Estimates pointing to a flat growth outturn in early 2016. The underlying drivers in the economy can be related to developments in three distinct clusters: (i) modern services, which consist of finance & insurance, information & communications and business services; (ii) the trade-related cluster, comprising manufacturing, transportation & storage, and wholesale trade; and (iii) the domestic cluster, made up of construction, retail trade, utilities, other goods industries, and other services. Over the last few years, the modern services cluster has expanded strongly while trade-related industries stagnated. Meanwhile, domestic-oriented activities have been on a relatively slow, but steady, uptrend. (Chart 2.2) This three-speed trajectory was most evident in Q4 last year. Overall growth was supported by a buoyant modern services cluster and steady expansion in the domestic-oriented sectors, offsetting the deterioration in the trade-related industries.
Modern services was the main pillar of support in Q4 2015.
Following a relatively muted performance in Q3 2015, the modern services sectors experienced a broad-based
Chart 2.1
Singapore’s GDP Growth
* Advance Estimates.
Chart 2.2 Growth Drivers by Cluster
Source: EPG, MAS estimates
2013 2014 2015 2016 Q1*
-2
0
2
4
6
8
10
Pe
r C
en
t
QOQ SAAR
YOY
95
100
105
110
115
120
125
2012 2013 2014 2015
Ind
ex (
2012
=100
), S
A
Domestic
Trade-related
Modern Services
Q4

20 Macroeconomic Review, April 2016
Monetary Authority of Singapore Economic Policy Group
strengthening in Q4. The financial sector turned in a strong performance, with growth surging by 34.1% q-o-q SAAR. Notably, the fund management segment registered a strong increase in net fees and commissions towards the end of the year, while the insurance industry posted healthy gains from an uptick in life insurance sales. (Chart 2.3) The strength of these activities helped to offset the sluggishness in the financial intermediation segments, where domestic and offshore non-bank loan volumes contracted by 1.4% and 3.3% q-o-q, respectively, in Q4. Softer trade and economic growth in the region, as well as concerns over rising interest rates, led to a moderate decline in loan demand. Concomitantly, the information & communications sector expanded firmly by 6.4% q-o-q SAAR in Q4. This was partly due to a rebound in the telecommunications segment as the number of wireless broadband subscriptions increased. Stronger corporate demand for professional services, such as accounting and consultancy, provided a fillip to the business services sector.
A step-up in domestic-oriented activities gave further impetus to growth.
The domestic-oriented sectors also saw an increase in growth momentum in Q4 2015. This was underpinned in part by construction activity that grew robustly by 6.0% q-o-q SAAR, supported by a steady stream of civil engineering projects, including Changi Airport Terminal 5. (Chart 2.4) At the same time, supply-side developments in the healthcare industry, including the opening of Yishun Community Hospital, provided a boost to growth. Indeed, the health & social services segment added 1,600 jobs during the quarter, accounting for 10% of employment gains in the economy in Q4.
The trade-related industries were buffeted by lacklustre external demand.
In contrast, the trade-related industries languished amid persistent weakness in the external environment. In particular, the manufacturing sector shrank by 4.9% q-o-q SAAR in its fourth consecutive quarter of decline, mainly weighed down by dismal outturns in the electronics and biomedical segments.
Chart 2.3 New Business of Life Insurance Companies
Chart 2.4 Certified Construction Payments
Source: EPG, MAS estimates
80
100
120
140
160
180
200
2013 Q3 2014 Q3 2015
Ind
ex
(Q1
20
13
=1
00
)
Q4
Total Premiums
Individual Policies
2014 Q2 Q3 Q4 2015 Q2 Q3 Q4
-6
-4
-2
0
2
4
6
8
% P
oin
t C
on
trib
uti
on
to
Q
OQ
SA
Gro
wth
Residential Non-residential
Civil Engineering Overall
The Singapore Economy 21
Monetary Authority of Singapore Economic Policy Group
Amid sluggish end demand for personal computers and consumer electronics, the global IT industry remained in a slump. Global chip sales contracted by 0.7% q-o-q SA in Q4, its fourth sequential quarter of contraction. This cyclical downswing, in turn, impacted demand for Singapore’s semiconductor output. Correspondingly, the volume of domestic exports of electronics fell by 2.7% q-o-q SA in Q4, alongside a similar downtrend in some of the regional economies’ IT-related trade flows. Meanwhile, pharmaceuticals output was hit by temporary plant shutdowns. The slowdown in regional growth and trade flows also took its toll on trade-related services, with sea cargo volumes handled at Singapore’s port contracting by 3.5% q-o-q SA in Q4 2015.
These weaknesses broadened to other sectors in early 2016, leading to a downshift in growth.
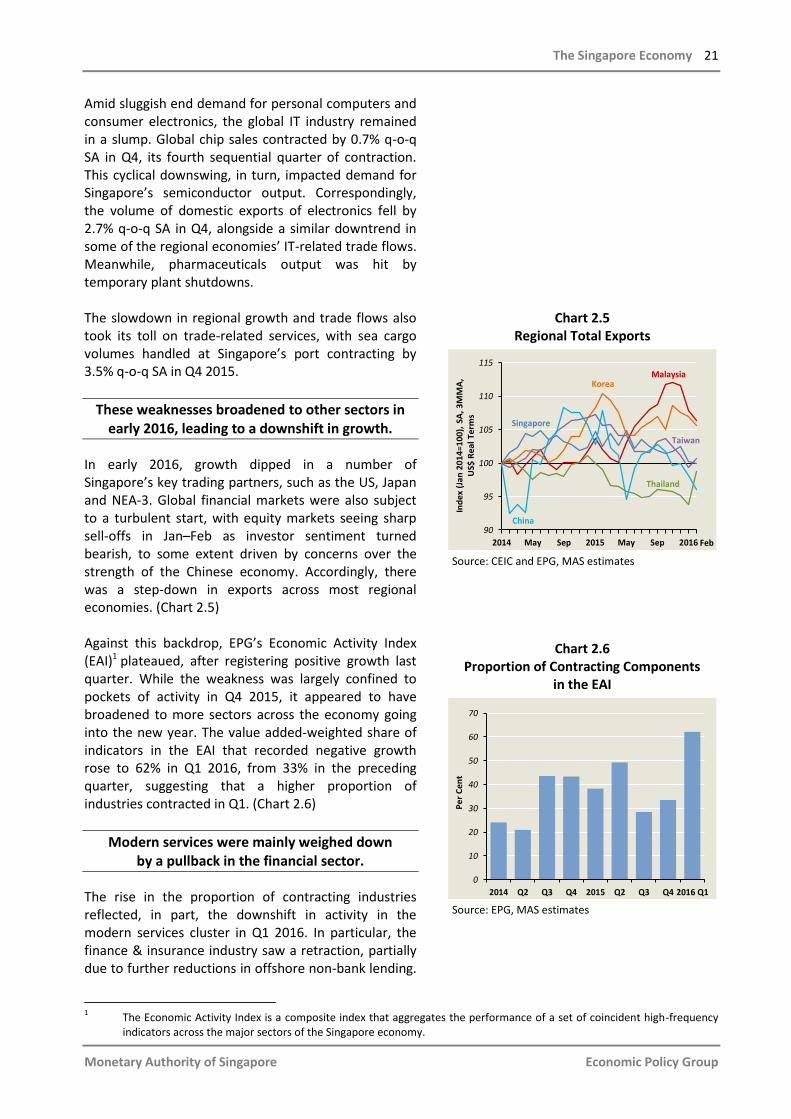
In early 2016, growth dipped in a number of Singapore’s key trading partners, such as the US, Japan and NEA-3. Global financial markets were also subject to a turbulent start, with equity markets seeing sharp sell-offs in Jan–Feb as investor sentiment turned bearish, to some extent driven by concerns over the strength of the Chinese economy. Accordingly, there was a step-down in exports across most regional economies. (Chart 2.5) Against this backdrop, EPG’s Economic Activity Index (EAI)1 plateaued, after registering positive growth last quarter. While the weakness was largely confined to pockets of activity in Q4 2015, it appeared to have broadened to more sectors across the economy going into the new year. The value added-weighted share of indicators in the EAI that recorded negative growth rose to 62% in Q1 2016, from 33% in the preceding quarter, suggesting that a higher proportion of industries contracted in Q1. (Chart 2.6)
Modern services were mainly weighed down by a pullback in the financial sector.
The rise in the proportion of contracting industries reflected, in part, the downshift in activity in the modern services cluster in Q1 2016. In particular, the finance & insurance industry saw a retraction, partially due to further reductions in offshore non-bank lending.
Chart 2.5 Regional Total Exports
Source: CEIC and EPG, MAS estimates
Chart 2.6 Proportion of Contracting Components
in the EAI
Source: EPG, MAS estimates
1 The Economic Activity Index is a composite index that aggregates the performance of a set of coincident high-frequency
indicators across the major sectors of the Singapore economy.
2014 May Sep 2015 May Sep 2016
90
95
100
105
110
115
Ind
ex
(Ja
n 2
01
4=
10
0),
SA
, 3
MM
A,
US$
Re
al T
erm
s
Feb
China
Thailand
Singapore
MalaysiaKorea
Taiwan
0
10
20
30
40
50
60
70
2014 Q2 Q3 Q4 2015 Q2 Q3 Q4 2016 Q1
Pe
r C
en
t

22 Macroeconomic Review, April 2016
Monetary Authority of Singapore Economic Policy Group
Total ACU non-bank loan volumes fell by an average of 1.3% m-o-m in Jan–Feb 2016, extending the 1.1% decline recorded in the preceding quarter. From a geographical perspective, this stemmed primarily from a continued contraction in loans extended to East Asia, as the regional growth and trade slowdown constrained demand for credit, including trade financing. (Chart 2.7) The volatility in the earnings of fund managers also played a role. Following the lump-sum recognition of performance bonuses at the end of last year, which had contributed to a surge in value added, the fund management industry is likely to see a sequential moderation in Q1 2016. Meanwhile, the subdued business sentiment impacted corporate demand for ICT and business services, such as rental & leasing and consultancy.
Likewise, the domestic-oriented cluster lost some momentum ...
The domestic-oriented cluster remained a relatively stable source of support for the overall economy, despite a softening of aggregate growth. This was largely because of the construction industry, which saw a sequential step-up in certified progress payments for non-residential developments in Jan–Feb, including Project Jewel, a large-scale commercial project consisting of a new retail and lifestyle complex at Changi Airport. However, consumer-facing services, such as domestic retail trade, were affected by tepid consumer sentiment. According to the MasterCard Index of Consumer Confidence, there was a significant deterioration in the outlook for H1 2016 in Singapore. (Chart 2.8) In Jan–Feb, the volume of discretionary items sold, such as watches and jewellery, contracted. (Chart 2.9) Nevertheless, the magnitude of the decline was milder than during previous periods of heightened macroeconomic uncertainty.
… but idiosyncratic factors lifted the performance of the trade-related sector.
The trade-related cluster posted a surprising upturn in Q1, largely as a result of idiosyncratic events in the manufacturing sector, as external demand remained soft. After six consecutive quarters of contraction, manufacturing output rose by 2.6% q-o-q SA in Q1 2016. The typically volatile pharmaceuticals segment
Chart 2.7 ACU Non-bank Lending
Chart 2.8 MasterCard Index of Consumer Confidence
(Outlook for the Next Six Months)
Source: MasterCard
Note: A value of 0 represents maximum pessimism, while 100 represents maximum optimism and 50 represents neutrality.
* H2 2015 reading represents outlook for H1 2016.
Chart 2.9 Retail Sales Volumes
Source: EPG, MAS estimates
2014 Q2 Q3 Q4 2015 Q2 Q3 Q4 2016
-4
-2
0
2
4
6
% P
oin
t C
on
trib
uti
on
to
QO
Q G
row
th
East Asia Europe Americas
Jan–Feb
40
45
50
55
60
65
70
2012 H2 2013 H2 2014 H2 2015 H2*
Ind
ex
More Optimistic
80
85
90
95
100
105
2008 2009 2010 2011 2012 2013 2014 2015 2016
Ind
ex
(Q1
20
14
=1
00
), S
A
Discretionary
Non-discretionary
Jan–Feb
Overall excluding Motor Vehicle Sales

The Singapore Economy 23
Monetary Authority of Singapore Economic Policy Group
saw a 20.8% q-o-q SA surge in output over the quarter as firms switched to a more favourable product mix. Trade-related services continued to turn in a muted performance, with Singapore’s total export volume shrinking by 3.0% q-o-q SA in Q1.
2015 In Perspective: Further Growth Moderation
The domestic economy slowed in 2015 …
The Singapore economy grew by 2.0% in 2015, a step-down from the 3.3% in 2014 and lower than the average of 3.9% over 2012–14. At the same time, there was a higher proportion of industries (38% of the 58 industry segments) experiencing negative growth in 2015, compared with 24% the year before. (Chart 2.10)
… continuing the moderating growth trend since 2011.
Since 2011, the domestic economy has gradually settled on a more modest growth path, reflecting a confluence of cyclical and structural factors. Notably, Singapore’s underlying trend GDP2 growth has been moderating over 2011–15. (Chart 2.11) Part of this decline was due to the manufacturing sector, with the electronics, precision engineering and general manufacturing clusters facing the most intense structural challenges. MNCs have been rationalising their global operations in the post-GFC era, with electronics firms in particular scaling back on mass manufacturing in Singapore, while at the same time shifting towards higher local value-added niche production as well as manufacturing-related services, such as design and marketing. The consolidation process, in turn, has had spillover effects on supporting industries, such as precision engineering. These secular trends have been highlighted in previous issues of the Review. Growth in some services sectors has also eased, with business services and other services registering reduced contributions to the expansion of the overall economy. (Chart 2.11) In comparison, the support from wholesale & retail and financial services has held
Chart 2.10
Distribution of Industry VA Growth*
Source: EPG, MAS estimates
* Estimated using a kernel smoother.
Chart 2.11 Sectoral Contribution to
Estimated Trend GDP Growth
Source: EPG, MAS estimates
2 Singapore’s underlying trend GDP is estimated from a weighted average of three methods—a structural vector
autoregression (SVAR) approach using the Blanchard-Quah decomposition, the Friedman variable span smoother and a simple univariate Hodrick-Prescott filter. The sectoral contributions were estimated using an average of the Christiano-Fitzgerald, Hodrick-Prescott and Butterworth filters.
0
0.02
0.04
0.06
0.08
-30 -20 -10 0 10 20 30 40 50
De
nsi
ty
% YOY
2015
2014
0
2
4
6
8
2009 2010 2011 2012 2013 2014 2015
% P
oin
t C
on
trib
uti
on
Manufacturing ConstructionBusiness Services Other ServicesWholesale & Retail FinancialOthers Trend

24 Macroeconomic Review, April 2016
Monetary Authority of Singapore Economic Policy Group
relatively firm. Foreign wholesale trading3 has grown at a rate of 6.5% per annum over the last five years, supported by the telecommunications and computers segment in the initial three years, and by oil trading in 2015. The former reflected the smartphone boom in the region, while the latter was due to arbitrage opportunities that arose from the sharp fall in global oil prices. The expansion of fund management activities and insurance services also provided strong support to the financial sector. The Singapore economy continued to face external headwinds in 2015, with trade-weighted foreign GDP recording growth of 3.9%, one of the weakest annual readings in the post-GFC period. In line with this moderation in external demand, EPG’s estimates suggest that the cyclical component subtracted 0.4% point from domestic GDP growth last year. (Chart 2.12) A decomposition of GDP growth from various perspectives provides further insights into the characteristics of growth in 2015.
There were strong gains in trade-related and modern services in 2015.
In the face of a more challenging global environment and ongoing consolidation in some segments, manufacturing contracted by 5.2% in 2015. (Chart 2.13) In particular, the marine & offshore engineering segment was severely impacted by the widespread cutback in global oil & gas capital expenditure, while the electronics cluster was buffeted by tepid worldwide IT demand. In comparison, wholesale trade turned in a solid performance, growing by 6.3% in 2015, compared with just 2.3% in 2014, as the trading of petroleum and petroleum products was boosted by strategic stockpiling and arbitrage opportunities in the global oil market. Meanwhile, the domestic-oriented and modern services sectors stayed relatively resilient. Modern services have risen in prominence in recent years and accounted for almost a third of nominal GDP in 2015. Despite the subdued growth environment over the past few years, modern services firms registered the largest improvement in profit margins over 2011–14, supported by rising demand domestically and in key markets abroad. (Chart 2.14) However, these
Chart 2.12
Contribution to Overall GDP Growth
Source: EPG, MAS estimates
Chart 2.13
Contribution to GDP Growth (Production)
Source: EPG, MAS estimates
Chart 2.14 Change in Profit Margins
Source: EPG, MAS estimates
* Electronics and biomedical clusters. The other manufacturing clusters are classified under “trade-related”.
3 Foreign wholesale trade refers to wholesale sales outside Singapore, which comprises domestic exports, re-exports,
transhipment cargo and offshore merchandise.
2010 2011 2012 2013 2014 2015
-4
0
4
8
12
16
% P
oin
t C
on
trib
uti
on
Trend Cycle Overall GDP
2014 2015
-2
-1
0
1
2
3
4
% P
oin
t C
on
trib
uti
on
to
YO
Y G
row
th
Trade-related (Mfg) Trade-related (Services)
Modern Services Domestic-oriented
Others Overall
ModernServices
High-techMfg*
Trade-related
DomesticServices
-1.5
-1.0
-0.5
0.0
0.5
1.0
1.5
% P
oin
t C
han
ge (
2011
–14)

The Singapore Economy 25
Monetary Authority of Singapore Economic Policy Group
firms are on average much smaller in scale, measured by average profit or revenue, compared to firms involved in production activities. (Table 2.1) Thus, the robust growth in modern services has not been able to fully offset the weakness in the manufacturing sector.
Consumption supported GDP growth, and the drag from investment diminished.
From an expenditure perspective, the step-down in overall growth can be attributed to a drag from inventories and a smaller contribution from net exports, in line with the softness in the trade-related manufacturing sector. (Chart 2.15) Mirroring the findings of the production approach, exports of services outperformed goods, with modern services, such as financial, insurance, and ICT, registering particularly solid growth. Domestically, consumption was boosted by the 4.0% growth in real wages4 and a pickup in government consumption expenditure. The decline in COE prices also lifted motor vehicle sales, providing a fillip to retail sales volume, which grew by 4.6% in 2015, the strongest since 2006. Meanwhile, the drag from investment was reduced as GFCF contracted by a smaller 1.0% in 2015 compared to −2.6% in 2014, largely due to a surge in private-sector investment in transport equipment. Investment in machinery and equipment, however, fell for the third consecutive year. Although overall labour productivity growth5 was flat in 2015, this was an improvement from the decline of 0.5% in 2014. (Chart 2.16) A decomposition of productivity growth, based on Nomura and Amano (2012) 6 , shows that the contribution of capital deepening to productivity growth improved significantly from 0.6% point in 2014 to 1.1% point in 2015. (Chart 2.17) Nevertheless, TFP declines continued to offset the gains in labour quality and capital per worker.
Table 2.1 Average Firm Size by Cluster
(S$ million)
Cluster Average
Profit Average Revenue
High-tech Manufacturing
66.1 272.8
Trade-related 1.4 44.7
Modern Services 1.2 6.9
Domestic Services 0.2 1.5
Source: EPG, MAS estimates
Chart 2.15 Contribution to GDP Growth (Expenditure)
* Includes changes in inventories and statistical discrepancy.
Chart 2.16 Contribution to GDP Growth (Supply-side)
Source: EPG, MAS estimates
4 Real wages was proxied by the average monthly earnings (AME) of resident workers, deflated by CPI-All Items. The AME
refers to a resident worker’s average monthly remuneration received and comprises basic wages, overtime pay, commissions, allowances and bonuses, but excludes employer CPF contributions.
5 Labour productivity is measured by real value-added per worker.
6 Nomura, K and Amano, T (2012), “Labor Productivity and Quality Change in Singapore: Achievements in 1974–2011 and
Prospects for the Next Two Decades”, KEO Discussion Paper No. 129.
2014 2015
-2
-1
0
1
2
3
4
5
% P
oin
t C
on
trib
uti
on
to
YO
Y G
row
th
Consumption Investment Net Exports Others*
2014 2015
-1
0
1
2
3
4
% P
oin
t C
on
trib
uti
on
to
YO
Y G
row
th
Employment Productivity

26 Macroeconomic Review, April 2016
Monetary Authority of Singapore Economic Policy Group
Firms benefited from lower oil prices, alongside some increase in the labour share.
Notwithstanding the moderation in real GDP growth, nominal GDP growth increased from 3.3% in 2014 to 3.7% in 2015. From the income perspective, the slight improvement in nominal GDP was due to the increase in the contribution from Gross Operating Surplus (GOS), which rebounded by 3.5% in 2015 and contributed 1.7% points to nominal GDP growth compared to just 0.1% point in 2014. (Chart 2.18) This was almost entirely due to the manufacturing sector, where GOS increased by 15%, as material costs fell alongside lower oil prices. The chemicals cluster, which refines crude oil into higher-grade fuels and petrochemicals, benefited the most, with nominal value added excluding remuneration, a proxy for profits, rising by almost 150%. Apart from cheaper feedstock prices, there was some evidence of a shift towards higher value-added activities in the domestic manufacturing sector. Notably, the semiconductor, data storage, medical technology, as well as pharmaceuticals segments, saw double-digit growth in their nominal value added. EPG’s computations of the unit export price index7 suggest that the electronics cluster exported higher valued circuit boards and processing units, while there was also a boost from the pharmaceuticals segment as firms shifted their product mix towards higher priced drugs. Despite the rebound in GOS, the labour share of GDP continued to increase for the fifth consecutive year, to 43% in 2015. The rise was due largely to the 3.2% increase in the average wage of all employees, which more than offset the decline in overall employment growth. In sum, the domestic economy saw a further moderation in growth in 2015 due to both a continued fall in potential growth and cyclical headwinds which intensified during the course of the year. From the production perspective, the manufacturing sector was the most affected, which was mirrored in the fall in the contribution of net exports. Nonetheless, there was an improvement in nominal GDP due to the turnaround in corporate profits in the manufacturing sector.
Chart 2.17 Decomposition of Productivity Growth
Source: EPG, MAS estimates
Chart 2.18 Contribution to Nominal GDP
Growth (Income)
* Includes taxes and statistical discrepancy.
7 The unit export price index is based on export value and quantity at the SITC-7 digit level.
2014 2015
-2
-1
0
1
2
% P
oin
t C
on
trib
uti
on
to
YO
Y G
row
th
Labour Quality Capital per Worker TFP
2014 2015
-1
0
1
2
3
4
5
% P
oin
t C
on
trib
uti
on
to
YO
Y G
row
th
Wage Bill Gross Operating Surplus Others*

The Singapore Economy 27
Monetary Authority of Singapore Economic Policy Group
Apart from the oil and petrochemical industries which benefited from cheaper feedstock prices, there was also some evidence of a shift towards higher value-added activities, particularly in the IT and pharmaceuticals segments.
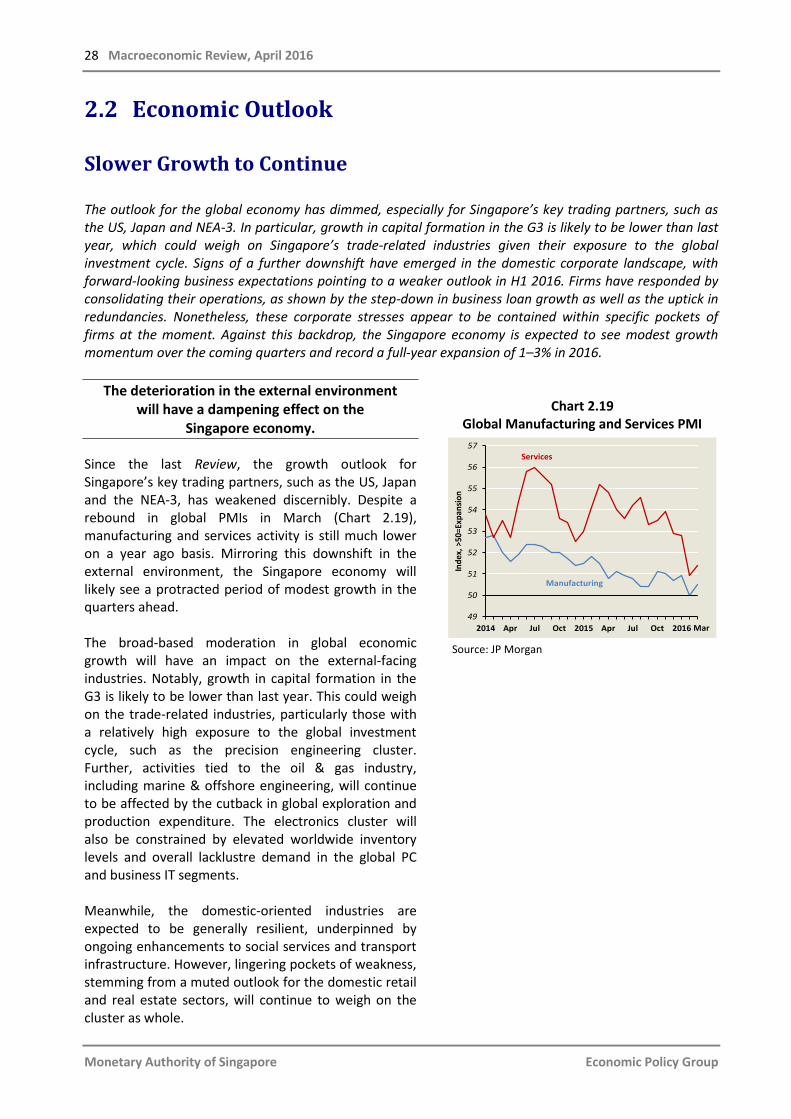
28 Macroeconomic Review, April 2016
Monetary Authority of Singapore Economic Policy Group
2.2 Economic Outlook
Slower Growth to Continue
The outlook for the global economy has dimmed, especially for Singapore’s key trading partners, such as the US, Japan and NEA-3. In particular, growth in capital formation in the G3 is likely to be lower than last year, which could weigh on Singapore’s trade-related industries given their exposure to the global investment cycle. Signs of a further downshift have emerged in the domestic corporate landscape, with forward-looking business expectations pointing to a weaker outlook in H1 2016. Firms have responded by consolidating their operations, as shown by the step-down in business loan growth as well as the uptick in redundancies. Nonetheless, these corporate stresses appear to be contained within specific pockets of firms at the moment. Against this backdrop, the Singapore economy is expected to see modest growth momentum over the coming quarters and record a full-year expansion of 1–3% in 2016.
The deterioration in the external environment will have a dampening effect on the
Singapore economy.
Since the last Review, the growth outlook for Singapore’s key trading partners, such as the US, Japan and the NEA-3, has weakened discernibly. Despite a rebound in global PMIs in March (Chart 2.19), manufacturing and services activity is still much lower on a year ago basis. Mirroring this downshift in the external environment, the Singapore economy will likely see a protracted period of modest growth in the quarters ahead. The broad-based moderation in global economic growth will have an impact on the external-facing industries. Notably, growth in capital formation in the G3 is likely to be lower than last year. This could weigh on the trade-related industries, particularly those with a relatively high exposure to the global investment cycle, such as the precision engineering cluster. Further, activities tied to the oil & gas industry, including marine & offshore engineering, will continue to be affected by the cutback in global exploration and production expenditure. The electronics cluster will also be constrained by elevated worldwide inventory levels and overall lacklustre demand in the global PC and business IT segments. Meanwhile, the domestic-oriented industries are expected to be generally resilient, underpinned by ongoing enhancements to social services and transport infrastructure. However, lingering pockets of weakness, stemming from a muted outlook for the domestic retail and real estate sectors, will continue to weigh on the cluster as whole.
Chart 2.19
Global Manufacturing and Services PMI
Source: JP Morgan
49
50
51
52
53
54
55
56
57
2014 Apr Jul Oct 2015 Apr Jul Oct 2016
Ind
ex, >
50=E
xpan
sio
n
Mar
Manufacturing
Services

The Singapore Economy 29
Monetary Authority of Singapore Economic Policy Group
Signs of a further downshift have emerged in the domestic corporate landscape, with forward-looking business expectations pointing to softening conditions in H1 2016. Alongside the deterioration in activity across a range of industries, firms have responded by consolidating their operations, as seen by the fall in business loan growth as well as the uptick in redundancies. Nonetheless, these corporate stresses and adjustments appear to be less severe compared to those seen during past periods of outright recessions, and have been confined to specific pockets of industries thus far. On balance, the domestic economy should record modest gains this year, with GDP growth likely to be in the range of 1–3%.
Persistent weakness in global investment will have a more significant impact on
specific manufacturing industries.
The sluggish external environment reflects, in part, continued weakness in global investment spending. In particular, Chinese fixed asset investment will continue to decelerate as the economy restructures towards a relatively capital-light services sector, with attendant spillovers on other Asian economies that have substantial linkages to China. Growth in capital formation in the US and the Eurozone in 2016 is also set to be lower than last year. The domestic economy is expected to be weighed down by this prolonged slump in global investment growth. According to OECD estimates, final demand from Singapore’s key trading partners accounts for 46.7% of its GDP, a third of which comprises investment demand.8 This proportion is significantly higher than the global share of just over 20%. A more detailed analysis suggests that Singapore’s electronics and precision engineering industries (as captured by the product categories of machinery & equipment, electrical & optical equipment, and metals & metal products) are the most vulnerable to a pullback in foreign investment. Chart 2.20 shows that some 40–50% of these clusters’ value added is exposed to foreign investment demand. If domestic investment demand is included, the exposure increases to over 50%.
Chart 2.20 Sectoral Exposure to Foreign and
Domestic Final Demand
Source: OECD-TiVA Database (2011) and EPG, MAS estimates
8 Source: OECD-TiVA Database (2011). Singapore’s key trading partners are the US, Eurozone, UK, Japan, China, ASEAN-4,
NEA-3, India and Australia. Singapore’s total exposure to final demand from the whole world is estimated to be 62.5% of GDP. The remaining 37.5% is contributed by domestic demand.
Mac
h &
Eq
pt
Elec
& O
pt
Eqp
t
Met
als
& P
dts
Trsp
t Eq
pt
Ret
ail;
H&
R
Wh
ole
sale
Trsp
t &
Sto
rage
Ch
em &
Min
Ove
rall
Oth
er M
fg
Po
st &
Tel
eco
m
Bu
sin
ess
Svs
Fin
anci
al
Co
nst
ruct
ion
Oth
er S
ervi
ces
0
25
50
75
100
% o
f V
alu
e A
dd
ed
Domestic Consumption Foreign Consumption
Domestic GFCF Foreign GFCF
Total GFCF

30 Macroeconomic Review, April 2016
Monetary Authority of Singapore Economic Policy Group
The sluggish investment climate stems in part from the global manufacturing malaise that has persisted in the post-GFC era.
Since the GFC, economic growth has slowed across the world, with most developed and emerging economies9 registering lower average growth rates in the period 2011–14 compared to 2004–07. This slowdown was largely due to the developed economies, whose contribution to global GDP growth halved across the two periods. Within the developed markets, capital formation contracted by almost 20% over 2008–09. (Chart 2.21) Although it has rebounded in recent years, the level of investment is still some 4% below the pre-GFC peak, as of 2014. With little confidence of a strong and sustained recovery, corporates have been cutting back sharply on their long-term capital expenditures. In comparison, private consumption has fared much better. Similarly in emerging markets, economic growth has also moderated on the back of a marked slowdown in investment growth. This is especially noticeable in China, where fixed asset investment has been on a secular downtrend in recent years. From a sectoral perspective, the global growth pullback post-GFC was most pronounced in manufacturing, which grew at only half the average rate seen during 2004 to 2007. (Chart 2.22) This growth malaise was evident in both developed and emerging economies, with the Asian economies of China, Japan, Korea and India recording the largest stepdown. (Chart 2.23)
Firms have been adjusting to the subdued environment by slowing down hiring
and other expansion plans.
Alongside sluggish external conditions, as well as ongoing domestic supply-side constraints, signs of vulnerability have emerged more clearly in the corporate landscape in the latter half of last year. EPG’s Corporate Conditions Index (CCI)—which tracks the global revenue performance of the top globally traded firms that have significant operations in Singapore—plunged by about 19% in 2015. A decomposition of price and volume effects shows that, while downward price pressures were significant (principally the result of the decline in oil prices on a
Chart 2.21 Consumption and Investment in
Developed Economies
Source: UN National Accounts
Chart 2.22
Global GDP Growth by Sector
Source: UN National Accounts
Chart 2.23
Change in Manufacturing Growth for Top 10 Largest Markets
Source: UN National Accounts
Note: Size of bubbles denotes the absolute size of each country’s manufacturing GDP in 2014 at constant 2005 prices in US dollars.
9 The country classification is in accordance with the IMF’s World Economic Outlook.
90
100
110
120
130
2000 2002 2004 2006 2008 2010 2012 2014
Ind
ex (
2000
=100
)
PrivateConsumption
Government Consumption
Gross Capital Formation
0 2 4 6
Primary & Utilities
Construction
W&R Trade; Rest. & Hotels
Other Activities
Manufacturing
Trspt, Storage & Comms
Global GDP Growth
Average YOY % Growth
Pre-GFC (2004–07) Post-GFC (2011–14)
-8
-6
-4
-2
0
2
0 2 4 6 8 10
% C
han
ge in
Ave
rage
Gro
wth
(201
1–14
vs
2004
–07)
Ranking by Size of Manufacturing Sector
Mexico
China
US
Japan
Germany
Korea
India
France
Italy
UK
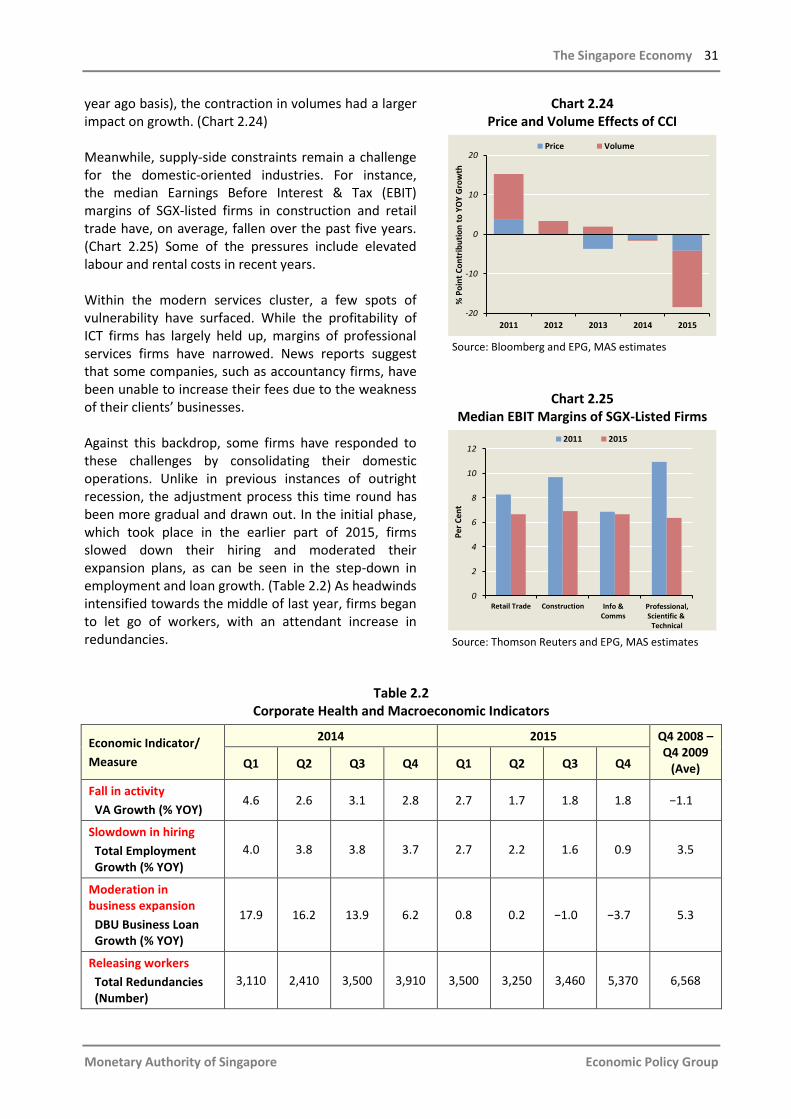
The Singapore Economy 31
Monetary Authority of Singapore Economic Policy Group
year ago basis), the contraction in volumes had a larger impact on growth. (Chart 2.24) Meanwhile, supply-side constraints remain a challenge for the domestic-oriented industries. For instance, the median Earnings Before Interest & Tax (EBIT) margins of SGX-listed firms in construction and retail trade have, on average, fallen over the past five years. (Chart 2.25) Some of the pressures include elevated labour and rental costs in recent years. Within the modern services cluster, a few spots of vulnerability have surfaced. While the profitability of ICT firms has largely held up, margins of professional services firms have narrowed. News reports suggest that some companies, such as accountancy firms, have been unable to increase their fees due to the weakness of their clients’ businesses. Against this backdrop, some firms have responded to these challenges by consolidating their domestic operations. Unlike in previous instances of outright recession, the adjustment process this time round has been more gradual and drawn out. In the initial phase, which took place in the earlier part of 2015, firms slowed down their hiring and moderated their expansion plans, as can be seen in the step-down in employment and loan growth. (Table 2.2) As headwinds intensified towards the middle of last year, firms began to let go of workers, with an attendant increase in redundancies.
Chart 2.24 Price and Volume Effects of CCI
Source: Bloomberg and EPG, MAS estimates
Chart 2.25 Median EBIT Margins of SGX-Listed Firms
Source: Thomson Reuters and EPG, MAS estimates
Table 2.2
Corporate Health and Macroeconomic Indicators
Economic Indicator/
Measure
2014 2015 Q4 2008 – Q4 2009
(Ave) Q1 Q2 Q3 Q4 Q1 Q2 Q3 Q4
Fall in activity
VA Growth (% YOY) 4.6 2.6 3.1 2.8 2.7 1.7 1.8 1.8 −1.1
Slowdown in hiring
Total Employment Growth (% YOY)
4.0 3.8 3.8 3.7 2.7 2.2 1.6 0.9 3.5
Moderation in business expansion
DBU Business Loan Growth (% YOY)
17.9 16.2 13.9 6.2 0.8 0.2 −1.0 −3.7 5.3
Releasing workers
Total Redundancies (Number)
3,110 2,410 3,500 3,910 3,500 3,250 3,460 5,370 6,568
2011 2012 2013 2014 2015
-20
-10
0
10
20
% P
oin
t C
on
trib
uti
on
to
YO
Y G
row
th
Price Volume
0
2
4
6
8
10
12
Retail Trade Construction
Per
Cen
t
2011 2015
Professional,Scientific &
Technical
Info &Comms
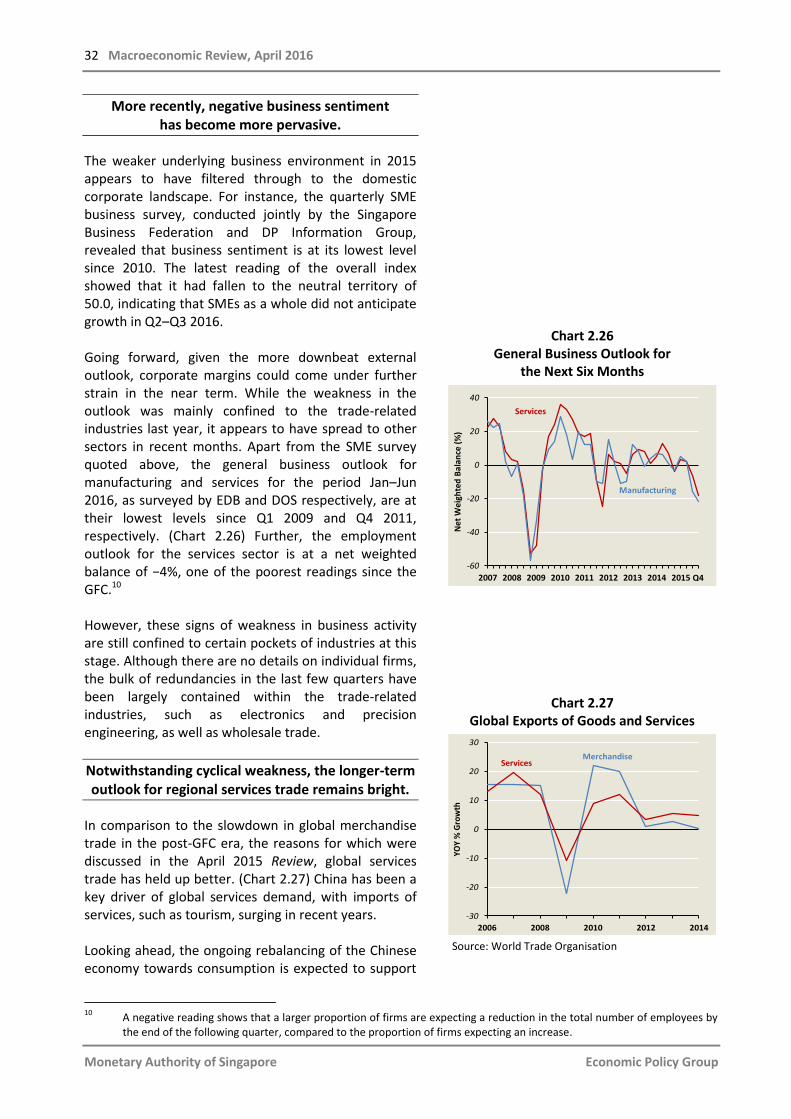
32 Macroeconomic Review, April 2016
Monetary Authority of Singapore Economic Policy Group
More recently, negative business sentiment has become more pervasive.
The weaker underlying business environment in 2015 appears to have filtered through to the domestic corporate landscape. For instance, the quarterly SME business survey, conducted jointly by the Singapore Business Federation and DP Information Group, revealed that business sentiment is at its lowest level since 2010. The latest reading of the overall index showed that it had fallen to the neutral territory of 50.0, indicating that SMEs as a whole did not anticipate growth in Q2–Q3 2016. Going forward, given the more downbeat external outlook, corporate margins could come under further strain in the near term. While the weakness in the outlook was mainly confined to the trade-related industries last year, it appears to have spread to other sectors in recent months. Apart from the SME survey quoted above, the general business outlook for manufacturing and services for the period Jan–Jun 2016, as surveyed by EDB and DOS respectively, are at their lowest levels since Q1 2009 and Q4 2011, respectively. (Chart 2.26) Further, the employment outlook for the services sector is at a net weighted balance of −4%, one of the poorest readings since the GFC.10 However, these signs of weakness in business activity are still confined to certain pockets of industries at this stage. Although there are no details on individual firms, the bulk of redundancies in the last few quarters have been largely contained within the trade-related industries, such as electronics and precision engineering, as well as wholesale trade.
Notwithstanding cyclical weakness, the longer-term outlook for regional services trade remains bright.
In comparison to the slowdown in global merchandise trade in the post-GFC era, the reasons for which were discussed in the April 2015 Review, global services trade has held up better. (Chart 2.27) China has been a key driver of global services demand, with imports of services, such as tourism, surging in recent years. Looking ahead, the ongoing rebalancing of the Chinese economy towards consumption is expected to support
Chart 2.26 General Business Outlook for
the Next Six Months
Chart 2.27 Global Exports of Goods and Services
Source: World Trade Organisation
10
A negative reading shows that a larger proportion of firms are expecting a reduction in the total number of employees by the end of the following quarter, compared to the proportion of firms expecting an increase.
2007 2008 2009 2010 2011 2012 2013 2014 2015
-60
-40
-20
0
20
40
Net
Wei
ghte
d B
alan
ce (
%)
Manufacturing
Services
Q4
2006 2008 2010 2012 2014
-30
-20
-10
0
10
20
30
YO
Y %
Gro
wth
MerchandiseServices

The Singapore Economy 33
Monetary Authority of Singapore Economic Policy Group
demand for imported services. As household affluence increases, the consumption of services is likely to increase in tandem. Chart 2.28 shows that between 1995 and 2012, both rural and urban households in China had devoted a larger proportion of their expenditures to services such as transport & communications, and healthcare & medical. As much of China’s services sector remains underdeveloped, the country has been relying on imports to meet its increasing demand. Indeed, the services trade deficit has widened significantly in recent years and was at around 2% of GDP in 2015. This switch in China’s footprint from global merchandise trade to services trade could provide significant opportunities for the region. Singapore’s exports of services to China have been growing at an average pace of 15.2% p.a. in 2012–14, about 1.8 times faster than Singapore’s services exports to the world. In particular, transport services as well as financial and insurance services have contributed most significantly to the strong growth rates in recent years.
Chart 2.28
Compositional Change in Chinese Household Consumption in 1995–2012
Source: National Bureau of Statistics of China
Food
Clothing
Household Facilities & Articles
Others
Residence
Education, Culture & Recreation
Healthcare & Medical Services
Transport & Communications
-20 -15 -10 -5 0 5 10% Change in Share of
Household Consumption
Rural Urban

34 Macroeconomic Review, April 2016
Monetary Authority of Singapore Economic Policy Group
Box B
Evaluating Probability Forecasts From The MAS Survey of Professional Forecasters
Introduction
In the previous issue of the Review, Tay (2015) highlighted that one of the difficulties of point forecasts is that they do not convey forecast uncertainty, which is why many forecasters have issued density forecasts instead (examples are the “fan charts” produced by the Bank of England and the IMF). Density forecasts allow forecasters to calibrate the uncertainty surrounding economic projections by providing a complete probabilistic description of likely future outcomes. These forecasts also provide additional useful information in situations where the distribution of upside and downside risks are skewed. Given this increased emphasis on density forecasting, a recent study by Kenny et al. (2015) examined whether the density forecasts contained in the Survey of Professional Forecasters conducted by the ECB (ECB-SPF) provided useful insights on the likelihood of occurrence of ‘risky’ macroeconomic events. In particular, they focused on outcomes where GDP growth and inflation exceeded certain high or low thresholds. In this Box, a similar approach is used to assess the GDP growth density forecasts collated in the MAS Survey of Professional Forecasters (MAS-SPF). The next two sections explain the key concepts underlying density forecast evaluation and the econometric tests employed. This is followed by an empirical analysis of the density forecasts from the MAS-SPF and a sum-up of the key findings. Density Forecast Evaluation
As in the case of point forecasts, density (or probability) forecasts are evaluated according to how closely they correspond to the actual outcomes of interest. Nonetheless, the nature of density forecasts implies that the evaluation cannot be conducted in terms of the standard root mean square error (RMSE) and mean absolute error (MAE) measures. Instead, a mean squared error (MSE)-type scoring function referred to as the quadratic probability score (QPS) has to be employed. Conceptually, the QPS is analogous to the MSE of a point forecast, except that the outcome variable (𝑥𝑡+𝜏) is a binary random variable that takes a value of unity when the event occurs, and is zero otherwise (Brier, 1950). The QPS is defined as follows:
2
t t t tQPS f , E f (1)
Equation (1) provides a scoring rule that penalises probability forecasts (𝑓𝑡+𝜏) which are low (high) when the event occurs (does not occur). Murphy (1973) extended this idea by suggesting the following decomposition of the QPS:
2 22
t t f \f f \fQPS f , E f E (2)
This decomposition brings out two important attributes of the forecast, namely, calibration and resolution.1/
Calibration, represented by the first term on the RHS of equation (2), measures the deviation from a perfect match between the forecast probability (𝑓) and the expected frequency of occurrence when a given forecast is made (𝜇𝑥|𝑓). All other things being equal, miscalibrated forecasts tend to have a larger QPS. Resolution,
the second term on the RHS of equation (2), measures the ability of forecasts to distinguish between relatively high-probability and relatively low-probability outcomes. If resolution is high, the conditional expectation of the outcome will differ significantly from its unconditional mean, signalling that the forecasts are successfully identifying occurrences in which the probability of the event is unusually high or low. The measure of resolution enters negatively into the QPS function, such that higher resolution lowers the QPS.
___________________________________________________________________
1/ The last term on the RHS of the equation (𝜎𝑥2) measures the unconditional variance of the binary outcome variable.
It essentially captures the difficulty of the specific forecasting situation.

The Singapore Economy 35
Monetary Authority of Singapore Economic Policy Group
Econometric Tests of Calibration and Resolution
To implement the calibration and resolution criteria for density forecasts, studies in the literature have typically used regression-based tests, which are a generalisation of the approach pioneered by Mincer and Zarnowitz (1969) to the case of probability forecasts (see Murphy and Winkler, 1992; Galbraith and van Norden, 2012). Accordingly, the approach to testing for “perfect” calibration and “zero” resolution relies on a regression of the outcome variable, (𝑥𝑡+𝜏) for a given forecasting horizon (𝜏) in period (𝑡) on a constant and the probability forecasts (𝑓𝑡+𝜏) for the same period, namely:
t t tf (3)
Murphy and Winkler (1992) showed that the fitted values from equation (3) provide an estimate of 𝜇𝑥|𝑓, the
expected probability of the outcome conditional on observing the forecast. This is used in the test for “perfect” calibration which requires that the forecasts do not systematically deviate from 𝜇𝑥|𝑓 .
In equation (3), this amounts to testing the joint restrictions that 𝛼 = 0 and 𝛽 = 1.2/ As an alternative, Holden and Peel (1990) suggested testing the “forecast error” directly, given that joint hypothesis tests may suffer from low power, particularly in small samples. Hence, a further test for a zero mean in the probability forecast error (𝑥𝑡+𝜏 − 𝑓𝑡+𝜏) is conducted, and implemented as a t-test of 𝛼 = 0, conditional on the assumption that 𝛽 = 1. In Galbraith and van Norden (2012), “zero” resolution, as defined in equation (2), requires that 𝛽 = 0. Under this restriction, the outcome’s occurrence and its probability forecasts are uncorrelated. This implies that the forecasts do not provide any signal on the event’s likelihood of occurrence, and that 𝜇𝑥|𝑓 = 𝜇𝑥 in
equation (2). Kenny et al. (2015) modified the Galbraith and van Norden (2012) test of zero resolution as a one-sided t-test based on the null hypothesis that 𝛽 ≤ 0. A rejection of the null hypothesis suggests that the forecasts are useful, as they combine positive resolution with the non-negative correlation between the forecasts and event occurrences. Pesaran and Timmermann (2009) however suggest that tests of the correlation between the forecasts and event occurrences are potentially distorted due to clustering and serial correlation in the observed values of 𝑥, and have proposed a corrected test, which is used here as an additional robustness check on the results.3/ Probability Forecasts from the MAS-SPF The MAS-SPF, which started in 1999, collates short-term projections of Singapore’s key macroeconomic variables made by professional forecasters based in Singapore. It is conducted on a quarterly basis following the release of the Quarterly Economic Survey by the Ministry of Trade and Industry, and seeks to establish a regular and consistent benchmark on private sector expectations of key economic variables that are relevant to the Singapore economy. As part of the MAS-SPF, survey respondents also provide a probability distribution of the possible outcomes for GDP growth at 1- and 2-year forecast horizons. These probability forecasts were introduced in the third quarter of 2001, with MAS setting the intervals each round, and they could vary to take into account prevailing economic conditions.4/
____________________________________________________________________
2/ The test is implemented as a Wald test of the joint restrictions with two degrees of freedom. The values of 𝜇𝑥|𝑓 are
used to compute the forecast calibration and resolution in equation (2). 3/
This correction is implemented by a regression of (𝜌𝑓,𝑥 𝜎𝑥2⁄ )𝑥 on 𝑓, augmented by lagged values of the dependent and
independent variable, where 𝜌𝑓,𝑥 is the correlation between probability forecasts and outcomes.
4/
MAS-SPF respondents submit a probability distribution of predicted outcomes in the form of discrete histograms assigning probabilities to a set of intervals representing possible outcome ranges for GDP growth. The cumulative probability corresponding to the particular event in question for each respondent is computed, assuming that the probabilities within each of the intervals are uniformly distributed.

36 Macroeconomic Review, April 2016
Monetary Authority of Singapore Economic Policy Group
Accordingly, the density forecast performance of MAS-SPF participants is evaluated by considering the following three types of events: (1) annual real GDP growth exceeds a threshold of 3%; (2) real GDP growth falls below a threshold of 2%; and (3) real GDP growth rises over the forecasting horizon (known as a direction-of-change event). The analysis covers the period from Q1 2002 to Q4 2015, with 20 to 30 professional forecasters being involved in more recent years.5/ Table B1 presents some summary statistics on the relative frequency of occurrences of these events, as well as their forecast probabilities for each of the two forecasting horizons. The results show that in 28 of the 56 periods analysed, GDP growth was above 3%, implying that this event occurred exactly half of the time when measured over the one-year horizon (𝜇𝑥 = 0.5). The corresponding average probability assigned by the MAS-SPF was 62%. This result, together with the findings from the other two events over the 1-year horizon, suggests that the probability assessments from the MAS-SPF are generally well-calibrated over the shorter horizon. In comparison, the results for the 2-year horizon provide tentative evidence that the MAS-SPF forecasters might have underestimated the probability of GDP growth falling below 2%, as they assigned an average probability of 10%, while this event actually occurred 31% of the time. Table B1 also shows that the correlation between the binary outcomes for an event and the probability of its occurrence was comparatively higher at the 1-year horizon, again suggesting that resolution was sharper for near-term forecasts. Notably, relatively high correlations were observed for the direction-of-change event.
Table B1 Summary Statistics for Events and Probabilities
Event 𝑻 ∑𝒙𝒕 𝝁𝒙 𝝁𝒚 𝝆𝒇,𝒙
1-year horizon
GDP growth > 3% 56 28 0.50 0.62 0.66
GDP growth < 2% 56 16 0.29 0.23 0.67
Higher GDP growth 56 20 0.36 0.39 0.90
2-year horizon
GDP growth > 3% 52 28 0.54 0.80 0.24
GDP growth < 2% 52 16 0.31 0.10 0.10
Higher GDP growth 52 28 0.54 0.47 0.81
Note: 𝑇 refers to the number of observations (quarters); ∑𝑥 refers to the number of quarters for which the event in question occurs; 𝜇𝑥 is the unconditional mean of the outcome variable of the binary event; 𝜇𝑦 refers to the average probability assigned by SPF forecasters; and 𝜌𝑓,𝑥 is the
correlation between probability forecasts and outcomes.
Chart B1 shows the probability forecasts for the three GDP growth events over the 1- and 2-year horizons. The aggregate probability (red lines) is depicted together with the 10th and 90th percentiles from the cross-section of the forecast probabilities of individual respondents (dashed lines).6/ Also shaded in each chart are periods during which the respective events occurred. The charts confirm that the direction-of-change event (Charts B1e and B1f) and the high/low growth threshold events over the 1-year horizon (Charts B1a and B1c) generally correlate better with the actual occurrences of these events. ____________________________________________________________________
5/ The dataset of individual responses is coded with an identification number for each forecaster. In principle, this
identifier allows one to track the individual responses over time, where the identifiers for the forecasters represent individual institutions. At times, when an individual economist changes his place of employment, MAS continues to use the identification number associated with the firm and not with the economist making the forecast.
6/ The forecast probability extracted from the median MAS-SPF density is generally close to the aggregate density.
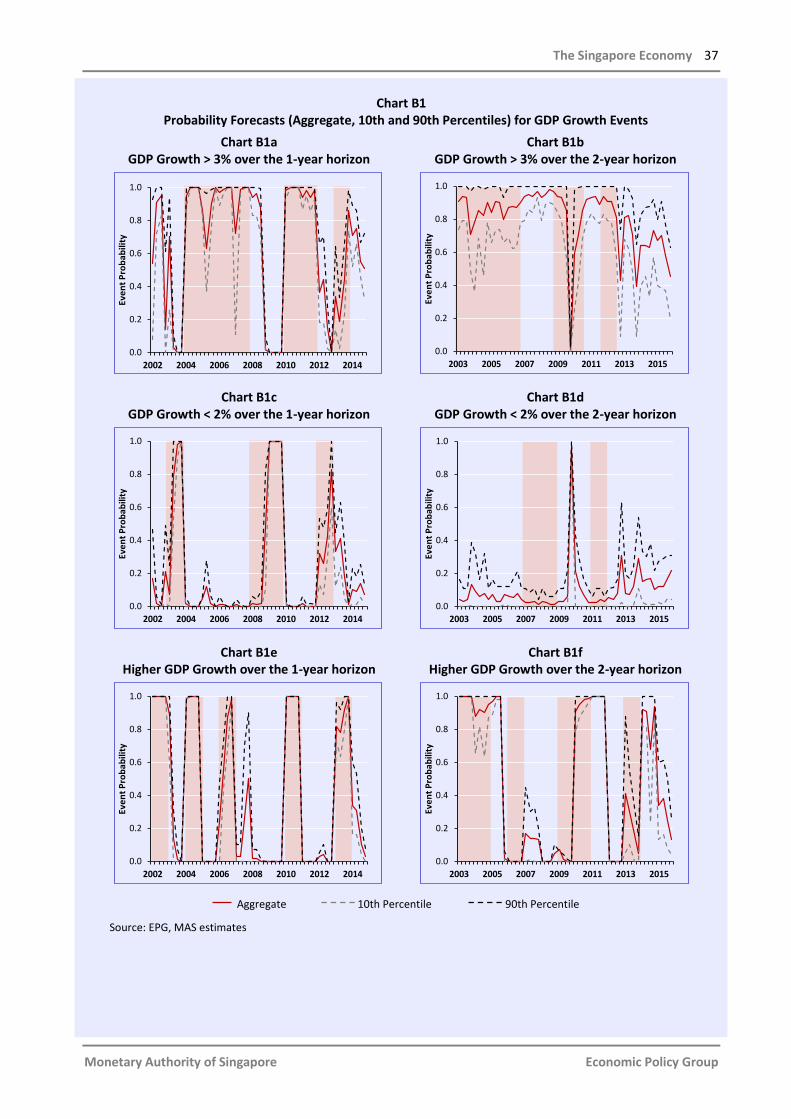
The Singapore Economy 37
Monetary Authority of Singapore Economic Policy Group
Chart B1
Probability Forecasts (Aggregate, 10th and 90th Percentiles) for GDP Growth Events
Chart B1a GDP Growth > 3% over the 1-year horizon
Chart B1b GDP Growth > 3% over the 2-year horizon
Chart B1c GDP Growth < 2% over the 1-year horizon
Chart B1d GDP Growth < 2% over the 2-year horizon
Chart B1e Higher GDP Growth over the 1-year horizon
Chart B1f Higher GDP Growth over the 2-year horizon
Source: EPG, MAS estimates
0.0
0.2
0.4
0.6
0.8
1.0
2002 2004 2006 2008 2010 2012 2014
Eve
nt
Pro
ba
bili
ty
0.0
0.2
0.4
0.6
0.8
1.0
2003 2005 2007 2009 2011 2013 2015
Eve
nt
Pro
ba
bili
ty
0.0
0.2
0.4
0.6
0.8
1.0
2002 2004 2006 2008 2010 2012 2014
Eve
nt
Pro
ba
bili
ty
0.0
0.2
0.4
0.6
0.8
1.0
2003 2005 2007 2009 2011 2013 2015
Eve
nt
Pro
ba
bili
ty
0.0
0.2
0.4
0.6
0.8
1.0
2002 2004 2006 2008 2010 2012 2014
Eve
nt
Pro
ba
bili
ty
0.0
0.2
0.4
0.6
0.8
1.0
2003 2005 2007 2009 2011 2013 2015
Eve
nt
Pro
ba
bili
ty
Aggregate 10th Percentile 90th Percentile

38 Macroeconomic Review, April 2016
Monetary Authority of Singapore Economic Policy Group
However, the correspondence between the MAS-SPF probability assessments for the high/low-growth threshold events and actual outcomes at the 2-year horizon is less clear. (Charts B1b and B1d) This is confirmed by the lower correlation between the aggregate probability forecasts and the observed outturns shown in Table B1. Another notable observation is that, while the probabilities for the low-growth outcome (Chart B1c) for the 1-year horizon correlates well in general with observed occurrences, they were found to be lagging and only started to rise after the event had occurred. Empirical Results Table B2 reports the QPS decomposition for each of the three events based on their aggregate probabilities. As mentioned earlier, better forecasts are associated with lower values of the QPS. The empirical results show that MAS-SPF respondents performed less well at predicting threshold events but better in anticipating the direction-of-change event over both forecast horizons. Nonetheless, the MAS-SPF probability forecasts appear close to being perfectly calibrated, especially over the 1-year horizon, as indicated by very small calibration errors. As for resolution, where a more negative score signals good performance, it is seen that the gains come predominantly at the 1-year horizon, except for the direction-of-change event at the 2-year horizon.
Table B2 Decomposition of the QPS
Event QPS Calibration
Error Resolution Uncertainty
1-year horizon
GDP growth > 3% 0.16 0.02 −0.11 0.25
GDP growth < 2% 0.11 0.00 −0.09 0.20
Higher GDP growth 0.04 0.00 −0.20 0.24
2-year horizon
GDP growth > 3% 0.31 0.07 −0.01 0.25
GDP growth < 2% 0.21 0.05 −0.00 0.16
Higher GDP growth 0.08 0.01 −0.16 0.24
Table B3 shows the test results based on equation (3), presented as p-values in columns (4) to (7). At the 1-year horizon, the hypothesis of perfect calibration, namely, 𝛼 = 0 and 𝛽 = 1, is not rejected, with all three events having p-values greater than 0.05. Notably, the regression estimates for the low-growth and direction-of-change events are either close, or exactly equal, to their hypothesised values. The test of negative or zero signalling power, namely, 𝛽 ≤ 0, is also strongly rejected at the 10% significance level in all cases. The additional tests for calibration (Holden and Peel, 1990) and resolution (Pesaran and Timmermann, 2009) given in columns (6) and (7), respectively, confirm that the MAS-SPF probability forecasts performed well on the QPS criteria. At the 2-year horizon, while the null hypothesis of perfect calibration is not rejected for both threshold events, the additional test for calibration in column (6) is rejected for the high-growth event. Furthermore, the test for zero or negative signalling power is also not rejected for both threshold events. In comparison, the direction-of-change forecasts pass the test for perfect calibration while also rejecting the hypothesis of zero or negative signalling power. These results reiterate the conclusion that the MAS-SPF probability forecasts for threshold events are less accurately calibrated and have poorer resolution over the longer forecasting horizon of two years.

The Singapore Economy 39
Monetary Authority of Singapore Economic Policy Group
Table B3
Test of GDP Growth Events
Event
Regression Estimates Null Hypotheses
(1) (2) (3) (4) (5) (6) (7)
𝑻 𝜶 𝜷 𝜶 = 𝟎,𝜷 = 𝟏 𝜷 ≤ 𝟎 𝜶 = 𝟎|𝜷 = 𝟏 𝜸 ≤ 𝟎
1-year forecast horizon
GDP growth > 3% 56 −0.03 0.85*** 0.244 0.000*** 0.114 0.002***
(−0.30) (6.20)
GDP growth < 2% 56 0.08 0.91*** 0.561 0.000*** 0.402 0.000***
(1.00) (8.80)
Higher GDP growth 56 −0.03 1.00*** 0.650 0.000*** 0.403 0.000***
(−0.93) (20.65)
2-year forecast horizon
GDP growth > 3% 52 0.02 0.65 0.071* 0.056 0.020** 0.013**
(0.05) (1.60)
GDP growth < 2% 52 0.27** 0.35 0.095* 0.206 0.057* 0.064
(2.19) (0.82)
Higher GDP growth 52 0.10 0.92*** 0.476 0.000*** 0.291 0.000***
(0.96) (9.26)
Note: 𝑇 refers to the number of observations (quarters) and 𝛼 and 𝛽 are the regression estimates from equation (3). Values in parentheses are t-statistics, while all values reported in columns (4) to (7) are p-values. * Statistically significant at the 10% level. ** Statistically significant at the 5% level. *** Statistically significant at the 1% level.
Sum-up
The results reported in this Box suggest that the probability forecasts in the MAS-SPF provide useful insights on the likelihood of occurrence of high- or low-growth GDP outcomes in Singapore, especially within a 1-year timeframe. However, density forecasts are less informative at the longer 2-year horizon, except with reference to predicting that GDP growth will come in stronger. These findings reflect the difficulties faced by professional forecasters in accurately forecasting GDP growth at longer forecasting horizons, due to greater uncertainty and the higher incidence of unexpected shocks. References Brier, G W (1950), “Verification of Forecasts Expressed in Terms of Probability”, Monthly Weather Review, Vol. 78(1), pp. 1–3. Galbraith, J W and van Norden, S (2012), “Assessing Gross Domestic Product and Inflation Probability Forecasts Derived from Bank of England Fan Charts”, Journal of the Royal Statistical Society: Series A, Vol. 175(3), pp. 713–727. Holden, K and Peel, D A (1990), “On Testing for Unbiasedness and Efficiency of Forecasts”, The Manchester School, Vol. 58(2), pp. 120–127. Kenny, G, Kostka, T and Masera, F (2015), “Can Macroeconomists Forecast Risk? Event-Based Evidence from the Euro-Area SPF”, International Journal of Central Banking, Vol. 11(4), pp. 1–46. Mincer, J, and Zarnowitz, V (1969), “The Evaluation of Economic Forecasts”, in Mincer, J (eds.), Economic Forecasts and Expectations: Analysis of Forecasting Behaviour and Performance, National Bureau of Economic Research.

40 Macroeconomic Review, April 2016
Monetary Authority of Singapore Economic Policy Group
Murphy, A H (1973), “A New Vector Partition of the Probability Score”, Journal of Applied Meteorology, Vol. 12(4), pp. 595–600. Murphy, A H and Winkler, R L (1992), “Diagnostic Verification of Probability Forecasts”, International Journal of Forecasting, Vol. 7(4), pp. 435–455. Pesaran, H M and Timmermann, A (2009), “Testing Dependence among Serially Correlated Multicategory
Variables”, Journal of the American Statistical Association, Vol. 104(485), pp. 325–337. Tay, A (2015), “A Brief Survey of Density Forecasting in Macroeconomics”, Macroeconomic Review,
Vol. XIV(2), pp. 92–97.

Chapter 3 Labour Market and
Inflation

42 Macroeconomic Review, April 2016
Monetary Authority of Singapore Economic Policy Group
3 Labour Market And Inflation
Core Inflation To Rise At A More Gradual Pace
Core and overall inflation have diverged in recent months. On a y-o-y basis, MAS Core Inflation picked up to 0.5% in Q1 2016 from 0.2% in Q4 2015, as temporary disinflationary influences abated. In comparison, CPI-All Items inflation fell further, from −0.7% in Q4 2015 to −0.8% in Q1 2016, amid larger declines in housing rentals and car prices. Going forward, external sources of inflation should stay generally benign. Notwithstanding the recent recovery in global oil prices from their January trough, the upside is likely to be capped in the near term, given the underlying supply overhang. For the whole of 2016, global oil prices are expected to average lower than last year. Accordingly, oil-related items will continue to contribute negatively to CPI inflation in 2016, albeit to a smaller extent compared to 2015. Meanwhile, imported food inflation could pick up from presently subdued rates, as the prolonged period of low prices and adverse weather conditions lead to a decline in world food production. Nevertheless, current elevated inventory levels will temper the extent of this increase. On the domestic front, labour market tightness is expected to ease further. Labour supply will continue to moderate amid demographic changes in the resident workforce and reduced foreign worker inflows. However, labour demand will also ebb, stemming from cyclical weakness in the external environment, as well as ongoing industry restructuring, which has led to some skills mismatches. Consequently, wage growth is expected to soften from 3.5% in 2015 to about 2.5–3.0% in 2016, although it will continue to be uneven across sectors. Together with a modest increase in productivity gains, aggregate unit labour cost (ULC) growth is expected to moderate this year. The overall pass-through of domestic costs to consumer prices will continue to be constrained by subdued economic activity. As a result of the diminishing drag from oil prices, as well as from budgetary and one-off measures, MAS Core Inflation is expected to pick up gradually over the course of this year. Barring a sharp rise in global oil prices, MAS Core Inflation for 2016 is likely to fall in the lower half of the 0.5–1.5% forecast range, after coming in at 0.5% in 2015. Meanwhile, the downward pressure on CPI-All Items inflation from non-core components of the CPI basket is expected to be larger this year, as more car COEs and residential units come on-stream. For the whole of 2016, CPI-All Items inflation is projected to be −1.0−0%, compared to −0.5% in the previous year.

Labour Market and Inflation 43
Monetary Authority of Singapore Economic Policy Group
3.1 Labour Market
Labour Demand Will Remain Modest
Job creation stayed subdued and aggregate labour market tightness eased further in H2 2015 as cyclical and structural factors continued to weigh on hiring. Looking ahead, overall headcount gains will remain modest, alongside a weak cyclical environment, intensifying industry reconfigurations in some sectors and increasing skills mismatches within the resident workforce. Accordingly, the resident unemployment rate is likely to rise slightly in 2016 and overall wage pressures will moderate.
Employment gains were subdued in H2 2015.
Total employment expanded by 28,700 in H2 2015. This was an increase from 3,600 in the first half of last year, but substantially below the 74,100 jobs added in the corresponding period a year ago. (Chart 3.1) For 2015 as a whole, overall job gains fell to 32,300 from 130,100 in the preceding year, as a result of a confluence of cyclical and structural factors. Headcount in the external-oriented sectors has been declining since H1 2015, buffeted by both weak external demand and industry restructuring. (Chart 3.1) This was most evident in manufacturing, where employment contracted by a further 10,800 in H2 2015, following the 11,300 job losses in H1. (Chart 3.2) In particular, the electronics industry was affected by ongoing restructuring, while activity and hiring in the marine & offshore engineering segment was pulled down by lower oil prices. Meanwhile, a contraction in sea cargo handled lowered job creation in the transport & storage sector. The rest of the external-facing sectors recorded slight improvements in job gains in the second half of 2015 compared to the first half. The wholesale trade sector added 900 workers in H2 last year, reversing the job losses seen in H1. This was, however, still lower than the headcount gains of 6,600 a year ago, as hiring was affected by the lacklustre performance in regional trade. Similarly, employment gains in financial services were fairly modest, reflecting consolidation among major global financial institutions. Hiring in the domestic-oriented sectors more than doubled to 33,600 workers in H2 2015, relative to the first half of the year. This was most apparent in retail trade and food & beverage services. (Chart 3.3)
Chart 3.1
Employment Change: External and Domestic-oriented Sectors
Source: EPG, MAS estimates
Chart 3.2 Employment Change:
External-oriented Sectors
Source: EPG, MAS estimates
H1 H2 H1 H2 H1 H2 H1 H2
-20
0
20
40
60
80
Tho
usa
nd
External-orientedDomestic-orientedTotal
2013 2014 20152012
Manufacturing
Transport & Storage
Wholesale Trade
Accommodation
Financial & Insurance
-15 -10 -5 0 5 10Thousand
H2 2014 H1 2015 H2 2015

44 Macroeconomic Review, April 2016
Monetary Authority of Singapore Economic Policy Group
However, these two sectors typically record higher seasonal employment growth in the last quarter of the year to meet increased demand during the year-end festivities. Compared to the same period a year ago, headcount gains in H2 2015 for retail trade and food & beverage services were in fact considerably lower, reflecting generally weak economic sentiment and consumer demand. Firms in the real estate industry started to hire again, after cutting 5,300 jobs in H1 2015. However, the number of jobs added was small (around 200). Meanwhile, job creation remained resilient in the community, social & personal (CSP) services sector, owing to ongoing initiatives to expand capacity in healthcare and education. The sector recruited 11,900 workers in H2 2015, slightly higher than the 10,400 in the previous period, although still below the 16,000 jobs created a year ago. Other domestic-oriented sectors, such as professional services and construction, also registered a modest pickup in hiring in H2, supported by demand for legal, accounting & management services, and ongoing public sector building activity, respectively. Headcount gains in information & communications remained largely unchanged, underpinned by firms’ continued need for enhanced data security and the adoption of new technologies. Meanwhile, employment gains in administrative & support services moderated in H2 2015, following strong hiring in the cleaning & landscaping segment in the previous period.
Employment gains for residents improved slightly in H2 2015.
Resident employment rose in H2 2015, with net gains of 9,600 compared to the 8,900 net job losses in the first half of the year. (Chart 3.4) The majority of the local employment gains in H2 were concentrated in industries where temporary hires are prevalent, such as accommodation & food services, administrative & support and retail trade. Some of these resident workers are thus likely to exit the labour market in subsequent quarters.
Chart 3.3 Employment Change:
Domestic-oriented Sectors
Source: EPG, MAS estimates
Chart 3.4 Employment Change: Resident and Foreign
Real Estate Services
Retail Trade
Information & Comm
Admin & Supp Services
Construction
Professional Services
Food & Beverage Services
-10 -5 0 5 10 15 20Thousand
H2 2014 H1 2015 H2 2015
Community, Social & Personal Services
H1 H2 H1 H2 H1 H2 H1 H2
-20
0
20
40
60
80
Tho
usa
nd
Resident Foreign
2013 2014 20152012

Labour Market and Inflation 45
Monetary Authority of Singapore Economic Policy Group
Overall labour market tightness eased further …
In line with weak employment demand, labour market tightness at the economy-wide level eased further. While the seasonally adjusted resident unemployment rate has been fairly stable in recent quarters, the number of unfilled job openings declined to 53,700 in December 2015, from 55,600 three months ago. Even as the number of job openings continued to exceed job seekers, the seasonally adjusted ratio of job vacancies to unemployed persons inched down to 1.13 in December 2015, from 1.21 in June. The incidence of redundancy (number of redundancies per 1,000 workers) also rose sharply to 2.6 in Q4 last year, from 1.6 in the previous quarter, suggesting that firms have been more willing to lay off workers. EPG’s Labour Market Pressure Indicator—a summary statistic which captures the extent of labour market tightness using 31 indicators—continued to decline in H2 2015. (Chart 3.5)
Residents who have been laid off are finding it increasingly difficult to re-enter the workforce within six months, with the re-entry rate falling steadily since March 2015 to 51% as of December. 1 This was particularly the case for PMETs. While about half the job openings in Q4 2015 were PMET-related, only 48% of resident PMETs made redundant re-entered the workforce within six months, much lower than clerical, sales & service workers (63%) and production & transport operators, cleaners & labourers (53%). This could be due to various reasons, including skills mismatches in the resident labour market and inadequate remuneration. Indeed, based on the Job Vacancies 2015 report, the top two reasons cited by employers for hard-to-fill vacancies for local PMET jobs are “Lack the necessary work experience” (36.4%) and “Find pay unattractive” (30.9%).
The problem of skills mismatch is, in fact, an increasingly widespread global issue, as suggested by the Talent Shortage Survey conducted by ManpowerGroup in 2015.2 The findings from the survey revealed that talent shortages were on the rise globally, with 38% of employers facing difficulty filling jobs last year. This was the highest figure reported since 2008–09.
Chart 3.5 Labour Market Pressure Indicator
Source: EPG, MAS estimates
1 The re-entry rate is defined as the proportion of residents made redundant who managed to re-enter employment. The
rate within six months of redundancy for a given quarter refers to the end of quarter re-entry rate for residents made redundant in the previous quarter.
2 ManpowerGroup surveyed hiring managers in 42 countries to identify the proportion of employers who have difficulty
filling positions and the jobs which are difficult to fill.
2008 2009 2010 2011 2012 2013 2014 H1 H2
-3
-2
-1
0
1
2Tighter labour market
relative to 10-year average
More slack in the labour market compared to 10-year average
0.46 0.49
No
. o
f St
and
ard
Dev
iati
on
s fr
om
200
5–1
4 A
vera
ge
0.44
20152015
0.33

46 Macroeconomic Review, April 2016
Monetary Authority of Singapore Economic Policy Group
… leading to lower wage growth.
Reflecting the easing labour crunch at the aggregate level, overall resident wage growth moderated to 3.3% y-o-y in Q4 2015, from 4.1% and 3.7% in Q3 and Q2, respectively. This brought full-year wage growth to 3.5% in 2015, slightly below the 10-year historical average of 3.6%. (Chart 3.6) Wage gains have remained uneven across sectors. Lower salary increments were evident in the external-oriented sectors, such as manufacturing, financial & insurance and wholesale trade. In comparison, wage gains were higher in the domestic-oriented sectors facing more acute labour shortages, such as CSP services. Meanwhile, labour productivity rose by 0.5% y-o-y in Q4 2015, after recording no growth in the preceding quarter. (Chart 3.7) This was the first quarter of positive productivity growth since Q1 2014, and it brought the full-year to −0.1% in 2015. Adjusting for actual hours worked, labour productivity growth was 1.0% in 2015, largely unchanged from 1.1% in 2014.3 Alongside the moderation in resident wage gains, overall ULC increased at a slower pace of 1.5% y-o-y in Q4 2015, compared to 2.7% in the previous quarter, and eased to 2.8% in 2015, from 3.3% in the preceding year.
Job creation will remain sluggish due to cyclical headwinds and reduced support from trend factors.
Both labour demand and supply in the economy are settling at permanently lower levels, in line with the moderation in Singapore’s trend GDP growth and ageing population. A decomposition of total employment growth into its cyclical, trend and other idiosyncratic factors 4 suggests that there has been some cyclical drag on employment growth over the last few years.5 Concomitantly, the support from trend factors has gradually waned, reflecting ongoing restructuring and consolidation in some sectors, such as manufacturing and retail trade, as well as increasingly binding labour supply constraints confronting the Singapore economy. (Chart 3.8)
Chart 3.6
Overall Resident Wage Growth
Chart 3.7 Productivity and ULC Growth
Chart 3.8 Contribution to Employment Growth,
2011–15
Source: EPG, MAS estimates
3 This is calculated using real value added per actual hour worked.
4 Such factors include the stronger-than-usual entry and exit of casual workers.
5 In determining the magnitude of the cyclical factor, a modified Okun’s equation was used to estimate the elasticity of
total employment growth with respect to real GDP growth.
2005 2008 2011 2014
-4
-2
0
2
4
6
8
% Y
OY
10-year Average(3.6%)
Q2
3.0
2015
3.3
2015Q4
2.3
3.7 4.1
2013 Q3 2014 Q3 2015 Q3
-2
-1
0
1
2
3
4
5
% Y
OY
Q4
Productivity
Unit Labour Cost
2011 2012 2013 2014 2015
-8
-4
0
4
8
12
% P
oin
t C
on
trib
uti
on
Trend Factors Cyclical FactorsIdiosyncratic Factors Overall Employment

Labour Market and Inflation 47
Monetary Authority of Singapore Economic Policy Group
Alongside the fall in labour demand, there has been a reduction in foreign labour supply growth amid the tightening of foreign worker policies. Meanwhile, the supply of resident workers grew at a fairly stable pace, despite an increase in the entry of part-time workers into the workforce. Going forward, structural headwinds and demographic ageing could intensify and further moderate the trend component of employment growth. In the near term, labour demand will continue to hinge heavily on cyclical conditions and is expected to remain subdued. Latest results from the ManpowerGroup Manpower Employment Outlook Survey show the proportion of employers expecting to expand headcount falling to 10% in Q2 2016, from 14% in the same period a year ago. (Chart 3.9) With lower labour demand and supply, total job creation this year is expected to stay modest. As such, overall and resident unemployment rates are likely to rise slightly in 2016 alongside the weak cyclical conditions, intensifying industry reconfigurations in some sectors, as well as increasing skills mismatches within the resident workforce. Redundancies could continue to rise in sectors facing weak external demand and undergoing restructuring.
Wage pressures are likely to ease in 2016.
In line with subdued employment demand and reduced tightness in the labour market, wage pressures are likely to ease in 2016. Overall resident wage growth is expected to moderate to about 2.5–3.0%, from 3.5% in 2015. Salary increments will, however, be stronger in sectors such as CSP where vacancy rates are higher, and weaker in sectors with greater slack, such as manufacturing. With more muted wage growth and a projected slight improvement in productivity, the pace of increase in ULC should slow in 2016.
Chart 3.9 Net Employment Outlook
Source: ManpowerGroup
2007 2008 2009 2010 2011 2012 2013 2014 2015 2016
-60
-40
-20
0
20
40
60
Pe
r C
en
t, S
A
Q2

48 Macroeconomic Review, April 2016
Monetary Authority of Singapore Economic Policy Group
Workers need to invest in the right skills to enhance their employability and enjoy higher wage gains.
As the Singapore economy continues to restructure, workers will need to be equipped with the right skills to remain employable and enjoy higher wages. Among various critical skillsets, ICT skills are becoming increasingly central in modern knowledge-based economies, especially as structural and technological changes raise the demand for expertise in ICT-related tasks.6 To cater to the rising demand for ICT professionals, the government introduced the TechSkills Accelerator scheme in Budget 2016, to enable and encourage individuals to acquire relevant expertise and skills to engage in the fast growing ICT sector. This programme aims to: (i) identify specific skills in demand and work with specialised training providers to offer relevant courses; (ii) develop industry-recognised skills standards and certification to guide ICT professionals and employers; and (iii) work with employers to commit to hire and remunerate based on certified skills proficiency, rather than solely relying on academic results. Since the launch of SkillsFuture in November 2014, many initiatives have been put in place, such as the SkillsFuture Study Awards as well as Earn and Learn, for workers to acquire new skills or deepen their knowledge in their respective fields. Singaporeans have also started to utilise their SkillsFuture Credit to enrol in courses to equip themselves with the relevant skills that the economy needs going forward.
6 Using data for 19 countries from the Programme for the International Assessment of Adult Competencies, Falck, Heimisch
and Wiederhold (2016) showed that a one standard deviation increase in ICT skills raised wages by almost 8 percent. See Falck O, Heimisch, A and Wiederhold, S (2016), “Returns to ICT Skills”, CESifo Working Paper Series 5720.

Labour Market and Inflation 49
Monetary Authority of Singapore Economic Policy Group
3.2 Consumer Price Developments
Underlying Price Pressures Remain Muted
Core and overall inflation diverged in the first quarter of 2016. While core inflation picked up as some temporary disinflationary influences abated, CPI-All Items inflation remained negative on account of continued declines in housing rentals and car prices. Going forward, external price influences are likely to remain muted given current elevated inventory levels in key commodity markets, including oil and food. Alongside slower wage growth and subdued economic conditions, the pass-through of domestic costs to consumer prices will be modest. MAS Core Inflation is expected to rise gradually for the rest of the year, reflecting the diminishing drag from oil prices, as well as from budgetary and one-off measures. However, this increase will be milder than earlier anticipated, with core inflation in 2016 likely to come in at the lower half of the forecast range of 0.5–1.5%, well below its historical average for the second consecutive year. Meanwhile, the downward pressure on CPI-All Items inflation from non-core components of the CPI basket is expected to intensify this year, given the large supply of car COEs and residential units.
Core inflation picked up in early 2016, while CPI-All Items inflation remained subdued ...
MAS Core Inflation rose to 0.5% y-o-y in Q1 2016 from 0.2% in Q4 2015, on account of a smaller decline in the prices of oil-related items and the dissipation of disinflationary influences from budgetary and other one-off measures. 7 In comparison, CPI-All Items inflation remained on a downtrend, falling to −0.8% in Q1 from −0.7% in the previous quarter, as a result of larger declines in housing rentals and car prices. (Charts 3.10 and 3.11) These outcomes were mirrored in sequential terms as well. The overall price of core items in the CPI basket increased by 0.4% q-o-q in Q1 2016, after remaining largely flat in the previous quarter. This was primarily due to higher non-cooked food inflation, which more than offset the moderation in services inflation from reduced public transport fares and newly-introduced subsidies for pre-school education. Meanwhile, overall consumer prices declined for the sixth consecutive quarter in Q1, reflecting continued weakness in car prices and housing rentals. (Chart 3.12)
Chart 3.10
CPI-All Items and MAS Core Inflation
Chart 3.11 Contribution to Y-O-Y CPI-All Items Inflation
7 The cost of healthcare services rose in January as the disinflationary effect of enhanced medication subsidies introduced
at the beginning of 2015 dissipated, while the expiry of some supermarket discounts also contributed to a pickup in non-cooked food inflation.
2007 2008 2009 2010 2011 2012 2013 2014 2015 2016
-2
0
2
4
6
8
% Y
OY
CPI-All Items Inflation
MAS Core Inflation
Q1
2013 Q3 2014 Q3 2015 Q3 2016
-2
-1
0
1
2
3
4
% P
oin
t C
on
trib
uti
on
to
YO
Y G
row
th
Food ServicesAccommodation Pte Rd Trpt ex-PetrolOil-related Others
Q1
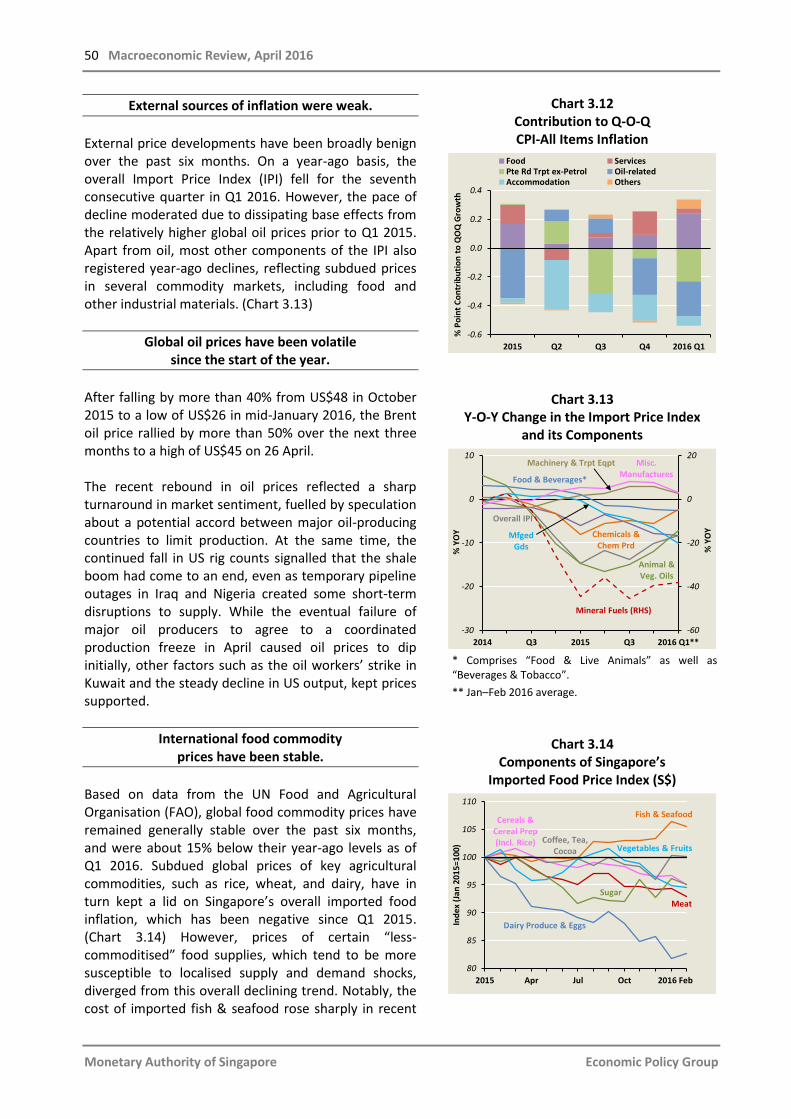
50 Macroeconomic Review, April 2016
Monetary Authority of Singapore Economic Policy Group
External sources of inflation were weak.
External price developments have been broadly benign over the past six months. On a year-ago basis, the overall Import Price Index (IPI) fell for the seventh consecutive quarter in Q1 2016. However, the pace of decline moderated due to dissipating base effects from the relatively higher global oil prices prior to Q1 2015. Apart from oil, most other components of the IPI also registered year-ago declines, reflecting subdued prices in several commodity markets, including food and other industrial materials. (Chart 3.13)
Global oil prices have been volatile since the start of the year.
After falling by more than 40% from US$48 in October 2015 to a low of US$26 in mid-January 2016, the Brent oil price rallied by more than 50% over the next three months to a high of US$45 on 26 April. The recent rebound in oil prices reflected a sharp turnaround in market sentiment, fuelled by speculation about a potential accord between major oil-producing countries to limit production. At the same time, the continued fall in US rig counts signalled that the shale boom had come to an end, even as temporary pipeline outages in Iraq and Nigeria created some short-term disruptions to supply. While the eventual failure of major oil producers to agree to a coordinated production freeze in April caused oil prices to dip initially, other factors such as the oil workers’ strike in Kuwait and the steady decline in US output, kept prices supported.
International food commodity prices have been stable.
Based on data from the UN Food and Agricultural Organisation (FAO), global food commodity prices have remained generally stable over the past six months, and were about 15% below their year-ago levels as of Q1 2016. Subdued global prices of key agricultural commodities, such as rice, wheat, and dairy, have in turn kept a lid on Singapore’s overall imported food inflation, which has been negative since Q1 2015. (Chart 3.14) However, prices of certain “less-commoditised” food supplies, which tend to be more susceptible to localised supply and demand shocks, diverged from this overall declining trend. Notably, the cost of imported fish & seafood rose sharply in recent
Chart 3.12 Contribution to Q-O-Q CPI-All Items Inflation
Chart 3.13 Y-O-Y Change in the Import Price Index
and its Components
* Comprises “Food & Live Animals” as well as “Beverages & Tobacco”.
** Jan–Feb 2016 average.
Chart 3.14 Components of Singapore’s
Imported Food Price Index (S$)
2015 Q2 Q3 Q4 2016 Q1
-0.6
-0.4
-0.2
0.0
0.2
0.4
% P
oin
t C
on
trib
uti
on
to
QO
Q G
row
th
Food ServicesPte Rd Trpt ex-Petrol Oil-relatedAccommodation Others
-60
-40
-20
0
20
-30
-20
-10
0
10
2014 Q3 2015 Q3 2016 Q1**
% Y
OY
% Y
OY
Food & Beverages*
Mineral Fuels (RHS)
Misc. Manufactures
Overall IPI
Chemicals & Chem Prd
Mfged Gds
Animal & Veg. Oils
Machinery & Trpt Eqpt
80
85
90
95
100
105
110
2015 Apr Jul Oct 2016 Feb
Ind
ex (
Jan
201
5=1
00)
Dairy Produce & Eggs
Cereals & Cereal Prep (Incl. Rice)
Meat
Coffee, Tea, Cocoa
Sugar
Vegetables & Fruits
Fish & Seafood

Labour Market and Inflation 51
Monetary Authority of Singapore Economic Policy Group
months due to increased seasonal demand during the Chinese New Year period. (Chart 3.14) The stronger-than-usual seasonal spike, together with the expiry of temporary supermarket discounts, pushed up domestic non-cooked food inflation in Q1 2016.
Domestic cost pass-through to consumer prices remained tempered by the
soft economic environment.
Labour cost pressures in the economy have eased, given the moderation in wage growth and slight productivity improvement. Lower rentals and utility fees have also alleviated the pace of increase in firms’ overall operating costs. (Chart 3.15) Alongside subdued domestic demand, this has tempered the extent to which firms pass on higher domestic costs to consumers. In particular, over the past five months, price increases for some discretionary services, including restaurant food and other educational course fees, have moderated relative to the same period a year ago. (Chart 3.16) Lower oil prices have also filtered through to a reduction in public transport fares. However, price increases have picked up for essential services, which continue to be driven by firm demand and are less susceptible to the current weakness in consumer sentiment. For example, private insurance companies have started to charge higher premiums for private health insurance plans (including riders), while the cost of domestic services has also risen after the imposition of tighter regulations by the countries supplying foreign domestic workers. In addition, several food court operators have recently raised the prices of drinks, citing higher labour costs as one of the key reasons.
Price declines persisted for non-core CPI items.
The cost of accommodation continued to decline as the significant number of new residential units in the market put further downward pressure on rentals. Indeed, the vacancy rate in the private residential property market remained elevated at 7.5% in Q1 2016. (Chart 3.17) Correspondingly, the drag from actual and imputed rentals on headline inflation increased to −0.8% point in Q1 2016, compared to −0.7% point in the preceding quarter.
Chart 3.15 Measures of Domestic Costs
Source: EPG, MAS estimates
* Consists of sub-components such as rentals, utilities, etc.
Chart 3.16
Price Changes for Selected CPI Items
Chart 3.17
Property Rental Index, Accommodation CPI and Vacancy Rate
ResidentWage
ULC -Overall
UBC -Services
ULC -Services
Other UnitServices*
-2
0
2
4
6
YO
Y %
Gro
wth
Q3 2015 Q4 2015 2005–14 Average
-2
0
2
4
6
% C
han
ge
Oct 2014 – Mar 2015 Oct 2015 – Mar 2016
2009 2010 2011 2012 2013 2014 2015 2016
0
2
4
6
8
10
-30
-20
-10
0
10
20
Pe
r c
ent
% Y
OY
Q1
Accommodation CPI
Private Residential Property Rental
Index
Vacancy Rate (RHS)

52 Macroeconomic Review, April 2016
Monetary Authority of Singapore Economic Policy Group
Meanwhile, average car COE premiums in Q1 were around 19% (or approximately S$11,000) lower compared to Q4 last year. This mostly reflected bidders’ lower willingness-to-pay, possibly due to the subdued economic climate and expectations of further downside to premiums given the recent expansions in COE quotas.8 (Chart 3.18) Consequently, the private road transport (excluding petrol) component reduced overall inflation by 0.5% point in Q1 2016, compared to 0.2% point in Q4 2015.
Upside to global oil prices will likely be capped as the underlying supply
overhang remains significant.
Notwithstanding the recent rebound in global oil prices from the January trough, the underlying supply overhang will likely limit any sustained upward price movements in the near term. Indeed, global oil production continues to outstrip demand at a rate of 1.5–2 million barrels per day, even as inventory levels remain at a record 440 million barrels higher than the 2010–14 average. (Chart 3.19) For the whole of 2016, EPG expects global oil prices, based on the Brent benchmark, to average around US$40, lower than the US$52 recorded last year 9 . Accordingly, oil-related items are expected to reduce CPI-All Items inflation by around 0.4% point in 2016, compared to 0.5% point in the previous year.
Prices of global food commodities could rise gradually due to unfavourable weather conditions.
Meanwhile, upside risks to food prices arising from adverse weather conditions remain. Even as the lingering effects of the hotter and drier climate associated with El Niño continue to impair global food supply, the increasing risk of a La Niña event in the latter half of 2016 could put renewed upward pressure on global food prices.10 The prolonged period of weak prices and poor weather conditions appears to have reduced forecasts for food production. For example, global production of cereals is estimated to remain
Chart 3.18
Distribution of Successful Bids in December 2015 and March 2016 Bidding Exercises
Chart 3.19 OECD End-of-period Oil Inventory
Source: EIA
8 Car COE quotas for Feb–Apr 2016 amounted to 19,422, a 21% increase from the 16,086 for Nov 2015 to Jan 2016.
9 The EIA currently expects the Brent crude oil price to average US$35 for the whole of 2016, while futures markets are
expecting it to average US$43. 10
According to the US National Oceanic and Atmospheric Administration, the chances of a La Niña event in the autumn of 2016, following the 2015–16 El Niño occurrence, has increased to 65%, compared to 32% for a neutral outcome.
0 10 20 30 40 50 60 70
>20
15 to<20
10 to<15
5 to10
<5
Percentage of Successful Bids
Bid
Va
lue
(P
erc
en
t A
bo
ve
Qu
alif
yin
g C
OE
Pre
miu
m)
Mar 2016 Ave. (Cat A)
Mar 2016 Ave. (Cat B)
Dec 2015 Ave. (Cat A)
Dec 2015 Ave. (Cat B)
2.5
2.7
2.9
3.1
3.3
Jan Feb Mar Apr May Jun Jul Aug Sep Oct Nov Dec
Bill
ion
Bp
d
2010–14 range
2016F
2015
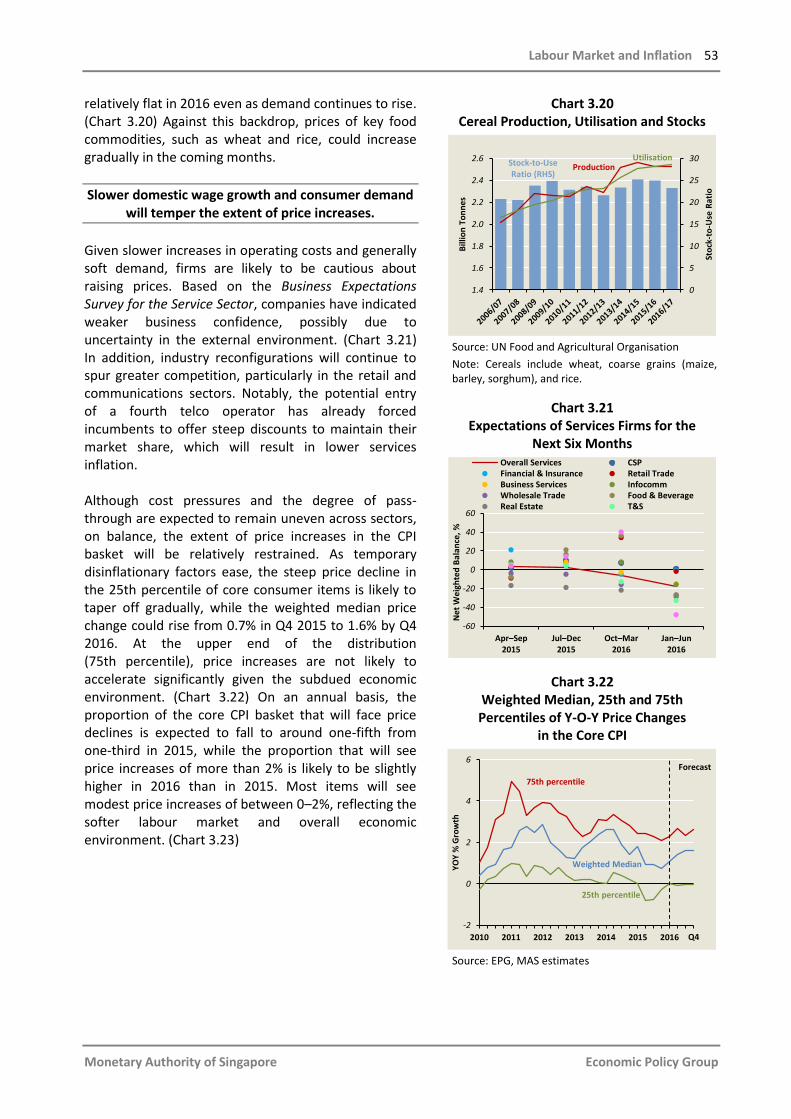
Labour Market and Inflation 53
Monetary Authority of Singapore Economic Policy Group
relatively flat in 2016 even as demand continues to rise. (Chart 3.20) Against this backdrop, prices of key food commodities, such as wheat and rice, could increase gradually in the coming months.
Slower domestic wage growth and consumer demand will temper the extent of price increases.
Given slower increases in operating costs and generally soft demand, firms are likely to be cautious about raising prices. Based on the Business Expectations Survey for the Service Sector, companies have indicated weaker business confidence, possibly due to uncertainty in the external environment. (Chart 3.21) In addition, industry reconfigurations will continue to spur greater competition, particularly in the retail and communications sectors. Notably, the potential entry of a fourth telco operator has already forced incumbents to offer steep discounts to maintain their market share, which will result in lower services inflation. Although cost pressures and the degree of pass-through are expected to remain uneven across sectors, on balance, the extent of price increases in the CPI basket will be relatively restrained. As temporary disinflationary factors ease, the steep price decline in the 25th percentile of core consumer items is likely to taper off gradually, while the weighted median price change could rise from 0.7% in Q4 2015 to 1.6% by Q4 2016. At the upper end of the distribution (75th percentile), price increases are not likely to accelerate significantly given the subdued economic environment. (Chart 3.22) On an annual basis, the proportion of the core CPI basket that will face price declines is expected to fall to around one-fifth from one-third in 2015, while the proportion that will see price increases of more than 2% is likely to be slightly higher in 2016 than in 2015. Most items will see modest price increases of between 0–2%, reflecting the softer labour market and overall economic environment. (Chart 3.23)
Chart 3.20 Cereal Production, Utilisation and Stocks
Source: UN Food and Agricultural Organisation
Note: Cereals include wheat, coarse grains (maize, barley, sorghum), and rice.
Chart 3.21 Expectations of Services Firms for the
Next Six Months
Chart 3.22 Weighted Median, 25th and 75th Percentiles of Y-O-Y Price Changes
in the Core CPI
Source: EPG, MAS estimates
0
5
10
15
20
25
30
1.4
1.6
1.8
2.0
2.2
2.4
2.6
Sto
ck-t
o-U
se R
atio
Bill
ion
To
nn
es
Production Utilisation
Stock-to-Use Ratio (RHS)
Apr–Sep2015
Jul–Dec2015
Oct–Mar2016
Jan–Jun2016
-60
-40
-20
0
20
40
60
Net
Wei
ghte
d B
alan
ce, %
Overall Services CSPFinancial & Insurance Retail TradeBusiness Services InfocommWholesale Trade Food & BeverageReal Estate T&S
2010 2011 2012 2013 2014 2015 2016
-2
0
2
4
6
YO
Y %
Gro
wth
75th percentile
Weighted Median
25th percentile
Forecast
Q4

54 Macroeconomic Review, April 2016
Monetary Authority of Singapore Economic Policy Group
Housing rentals and car prices will continue to dampen headline inflation.
Based on current supply pipeline projections, a significant number of housing units are likely to come on-stream this year, which will keep the vacancy rate for private residential properties elevated. Alongside reduced foreign worker inflows, residential property rentals are projected to decline further. Meanwhile, given the substantial expansion in the number of COE quotas and the generally weak economic environment, COE prices will likely come under downward pressure over the course of the year. Together, car prices and accommodation costs are expected to pull down CPI-All Items inflation in 2016 by more than 1% point.
MAS Core Inflation is expected to rise more gradually in 2016 than previously anticipated, while CPI-All Items inflation will stay negative.
In sum, MAS Core Inflation is expected to be on a mild uptrend over the course of this year. This reflects the diminishing occurrence and smaller magnitude of price declines in the CPI basket, rather than a broadening of price increases, as the dampening effects of oil prices, together with budgetary and other one-off measures, ease. Nevertheless, the upward trajectory is expected to be flatter than envisaged in October 2015, due to the weaker external inflation outlook, subdued GDP growth prospects, and reduced tightness in the labour market. Taking these factors into account, MAS Core Inflation in 2016 is likely to be in the lower half of the 0.5–1.5% forecast range, barring a sharp rise in global oil prices. This would be the second consecutive year that core inflation is well below its historical average. Meanwhile, CPI-All Items inflation will continue to be dampened by further declines in COE premiums and housing rentals, and remain negative throughout 2016. As a result of a more pronounced decline in housing rentals and car prices since the start of the year, the forecast for CPI-All Items inflation for the whole of 2016 was revised down to −1.0–0% in February, from −0.5–0.5% previously. (Charts 3.24 and 3.25)
Chart 3.23
Distribution of Annual Price Changes in the Core CPI Basket
Source: EPG, MAS estimates
Chart 3.24 Y-O-Y CPI-All Items Inflation and
MAS Core Inflation Forecasts
Source: EPG, MAS estimates
Chart 3.25 Contribution to Y-O-Y CPI-All Items Inflation
Source: EPG, MAS estimates
0
10
20
30
40
50
<2 2 to <0 0 to 2 >2
% o
f C
ore
CP
I B
aske
t
YOY % Growth
2015 2016
2007 2010 2013 2016 Q4
-2
0
2
4
6
8
% Y
OY
CPI-All Items Inflation
MAS Core Inflation
Forecast
2013 2014 2015 2016 Q4
-2
-1
0
1
2
3
4
% P
oin
t C
on
trib
uti
on
to
YO
Y G
row
th
Food Services
Accommodation Pte Rd Trpt ex-Petrol
Oil-related Others
Forecast

Labour Market and Inflation 55
Monetary Authority of Singapore Economic Policy Group
Beyond this year and into the medium term, external price pressures facing Singapore should be contained, as global inflationary pressures are likely to remain muted. The upside to commodity prices should be tempered by the greater flexibility of oil production from the shale industry, as well as the general supply overhang affecting commodity markets. An extended period of subdued global growth could also suppress price pressures and weigh on longer-term inflation expectations. Accordingly, core inflation in Singapore could average slightly below 2% over the medium term.


Chapter4MacroeconomicPolicy

58 Macroeconomic Review, April 2016
Monetary Authority of Singapore Economic Policy Group
4 Macroeconomic Policy
Ensuring Price Stability And Sustainable Growth
In April 2016, MAS set the S$NEER policy band to a zero percent rate of appreciation. This measured adjustment was deemed appropriate as MAS Core Inflation was expected to pick up more gradually than previously anticipated, and could now fall below 2% on average over the medium term. Singapore’s GDP growth outlook for 2016 has also moderated, compared to the last Review, against a less favourable external environment. On the fiscal front, Budget 2016 offered some targeted relief measures to help businesses and households cope with near-term stresses arising from the confluence of the cyclical downturn and economic restructuring. Beyond that, the Budget built on the themes of previous Budgets, namely, facilitating economic restructuring and building a caring and inclusive society. In this vein, specific schemes were introduced to advance the process of economic restructuring, by helping firms and industries retool, as well as to minimise structural unemployment among workers. The Budget also provided support for the economically vulnerable as well as measures to ensure inter-generational social mobility. Overall, the more accommodative monetary policy setting together with the mildly expansionary fiscal policy stance, constitute an appropriate and complementary macroeconomic mix to ensure medium-term price stability and sustainable growth.

Macroeconomic Policy 59
Monetary Authority of Singapore Economic Policy Group
4.1 Monetary Policy
A Zero Percent Rate Of Appreciation For The S$NEER Policy Band
In 2016, Singapore’s GDP is likely to expand at a weaker-than-anticipated pace compared with the assessment in the October 2015 Review. Amid external cyclical headwinds, there are emerging signs of slack in the economy and labour market tightness has been reduced. Imported inflation is also likely to remain benign and the pass-through of wage and other business costs to consumer prices will be constrained by subdued economic sentiment. Consequently, core inflation should rise over the course of this year at a milder pace than earlier forecast, and continue to average below 2% over the medium term. MAS therefore set the S$NEER policy band to a zero percent rate of appreciation to safeguard medium-term price stability.
The rate of appreciation of the S$NEER policy band was reduced to zero.
Since the last policy review in October 2015, the outlook for the global economy has dimmed, with recent economic data indicating that growth momentum in the major economies has been slower than earlier anticipated. In the US, the headwinds posed by low oil prices, a strong US dollar and soft global demand have dampened capital expenditures and exports, and will continue to limit the strength of any upturn. In the Eurozone and Japan, the strengthening of their currencies will also adversely impact exports and investment, even though more aggressive monetary easing could provide some offset. In addition, the Japanese economy is hobbled by low wage increases and a hesitant recovery in domestic demand. Meanwhile, China’s growth will continue to moderate, with stronger activity in the services sectors unable to fully compensate for the weakness in industrial production. The slower expansion in the G3 and China will in turn weigh on trade-related activities in the rest of Asia. Already, the externally-oriented NEA-3 economies, as well as Malaysia and Thailand, have been affected by the slowdown in external demand. Moreover, demand in the US and China is increasingly being driven by consumption rather than investment, and services instead of manufacturing. Global trade volumes have thus persistently expanded at a below-trend pace over the last four years, and are unlikely to recover strongly in the near term. Moreover, some economies in Asia are contending with rising financial headwinds stemming from elevated debt
levels and higher loan-servicing burdens, which could restrain spending. These developments in the global economy have weighed on domestic GDP growth. The Advance Estimates indicated that the Singapore economy slowed in Q1 2016, with weakness in the trade-related sectors spilling over into supporting services segments. Demand for modern services and sentiment-sensitive activities also eased amid the slowdown in regional demand. The growth outlook for the Singapore economy has, therefore, moderated compared to the October Review, in tandem with the weaker external outlook. In EPG’s assessment, even though an outright recession remains unlikely—barring significant shocks—the confluence of negative cyclical and structural factors will result in a second consecutive year of modest expansion, of 1–3% for 2016 as a whole. On the inflation front, CPI-All Items inflation fell to −0.8% y-o-y in Q1 2016 from −0.7% in the previous quarter, due to lower car prices and housing rentals. In comparison, MAS Core Inflation rose from 0.2% y-o-y in Q4 2015 to 0.5% in Q1 2016 as the disinflationary effects of oil, budgetary and other one-off measures dissipated. In February 2016, the forecast range for CPI-All Items inflation was downgraded to −1.0–0% from −0.5–0.5% on account of the significant step-down in global oil prices since October 2015, and the larger-than-expected decline in COE premiums at the start of the year. In y-o-y terms, CPI-All Items inflation is now expected to remain negative throughout this year.

60 Macroeconomic Review, April 2016
Monetary Authority of Singapore Economic Policy Group
In comparison, the forecast range for MAS Core Inflation in 2016 was kept unchanged at 0.5–1.5%, reflecting its smaller weight of oil-related items and the exclusion of private road transport costs. While MAS Core Inflation is still expected to pick up gradually over the course of 2016 as the transitory factors fade, the upturn in core prices is now expected to be milder than previously anticipated. In y-o-y terms, MAS Core Inflation will likely remain below its historical average even by end-2016 and for the full year, should come in at the lower half of the forecast range, barring upside surprises to oil prices. The expected slower rise in underlying inflation assumes that external sources of inflation will continue to be benign, amid an ample supply of oil and food, as well as weak global demand. At the same time, domestic wage growth is likely to ease this year to around 2.5–3.0%, from 3.5% in 2015, given softening labour demand. Indeed, the resident unemployment rate could increase slightly in the period ahead alongside a gradual rise in redundancies and declining job vacancies. A softening labour market and the generally sluggish growth outlook will likely weigh on economic sentiment and restrain the extent to which businesses are able to raise prices. Other business cost pressures such as rentals and utilities have also subsided as vacancies in commercial properties rose and lower oil prices filtered through to the economy. The projected pickup in MAS Core Inflation in 2016 thus largely reflects smaller price declines in certain components of the CPI basket, rather than an acceleration of price increases arising from strengthening aggregate demand. While the Singapore economy is not expected to experience a recession or widespread price declines in 2016, MAS’ medium-term projection for the path of inflation has downshifted. Core inflation is likely to average slightly below 2% in view of the possibility of an extended period of low inflation in the global economy. At the same time, the anticipated pickup in core inflation beyond 2016 is unlikely to stem from stronger or more widespread price increases associated with resurgent aggregate demand.
A slight easing of the monetary policy stance is therefore warranted to secure medium-term price stability. Accordingly, MAS reduced the rate of appreciation of the S$NEER policy band to zero percent

Macroeconomic Policy 61
Monetary Authority of Singapore Economic Policy Group
in April 2016. The level at which the policy band is centred was kept unchanged, as it was deemed appropriate for the projected trajectories of inflation and growth in the economy. The width of the policy band was also kept unchanged. This measured adjustment to the policy stance followed the gradual reductions in the slope of the policy band adopted in January and October 2015. Cumulatively, these policy recalibrations will help keep the level of real GDP close to its potential in 2016 and 2017. (Charts 4.1 and 4.2) These moves will also ensure price stability over the medium term by providing a partial offset to disinflationary pressures, boosting CPI-All Items inflation by an average of 0.7% point p.a. over the next two years. Chart 4.3 traces the evolution of monetary policy in relation to growth and inflation developments in the Singapore economy.
Chart 4.1
Actual and Potential Real GDP
* EPG, MAS estimates.
Chart 4.2 Output Gap
Source: EPG, MAS estimates
Note: EPG’s estimate of Singapore’s output gap is derived from a weighted average of three methods—a structural vector autoregression (SVAR) approach using the Blanchard-Quah decomposition, the Friedman variable span smoother and a simple univariate Hodrick-Prescott filter. The forecast for 2016 takes into account the policy stance adopted in April 2016.
275
300
325
350
375
400
2008 2010 2012 2014 2016
$ B
illio
n
Potential GDP*
Actual GDP
Forecast
2008 2010 2012 2014 2016
-6
-4
-2
0
2%
of
Po
ten
tial
GD
P
0.52
−0.03
Forecast

62 Macroeconomic Review, April 2016
Monetary Authority of Singapore Economic Policy Group
Chart 4.3 Key Macroeconomic Variables and Changes in the Monetary Policy Stance
0
5
10
15
20
2010 2011 2012 2013 2014 2015 2016
% Y
OY
-2
0
2
4
6
% Y
OY
Q1
Real GDP Growth
CPI-All Items Inflation
MAS Core Inflation
96
100
104
108
112
116
Ind
ex
(Q1
20
10
=10
0)
Neutral Policy
Modest & Gradual Appreciation
S$NEERShift to Modest &
GradualAppreciation &
Re-centre
Re-centre
Increase Slope Slightly& Widen Band
Increase Slope Slightly& Restore Narrower Band
Reduce Slope
Maintain
Reduce Slope
Maintain
Reduce Slope
Slightly
Neutral Policy
SetSlope to 0%

Macroeconomic Policy 63
Monetary Authority of Singapore Economic Policy Group
The S$NEER generally strengthened over October 2015 – April 2016.
Following the October 2015 MPS, the S$NEER broadly strengthened over Q4 2015, before undergoing a brief depreciation episode in January 2016. (Chart 4.4) The downward pressure on the S$ occurred amid a spike in global risk aversion precipitated by concerns about China’s economic growth as well as renewed volatility in its equity and forex markets. As a result, regional currencies, including the S$, weakened against the major reserve currencies. For example, between the weeks of 9 Oct 2015 and 15 Jan 2016, the S$ depreciated by 5.2% against the Japanese yen and 3.1% against the US$. (Chart 4.5) The S$ subsequently resumed its appreciation trend when volatility in the Chinese markets abated. In particular, the S$NEER was boosted by a series of dovish comments from senior US Federal Reserve officials in February, followed by the downward revision in the FOMC’s outlook for the US economy in March, which indicated that the Federal funds rate was likely to be raised only twice this year, rather than the four times previously projected. Accordingly, the US$ exhibited broad-based weakness and the S$ appreciated against it by 6.8% between 15 January and 8 April. Over the same period, the S$ also strengthened by 8.9% against the pound sterling and 2.1% against the euro, amid growing risks of “Brexit” and the ECB’s announcement of another round of monetary easing in March. In contrast, the S$ was volatile vis-à-vis the Japanese yen from 15 January to 8 April. It initially appreciated against the yen in late January in light of the Bank of Japan’s introduction of a negative interest rate policy, but quickly reversed its gains and depreciated through to mid-February. Subsequently the S$ strengthened against the yen until end-March, before weakening again in early April. Over the last six months (the week of 9 Oct 2015 to the week of 8 Apr 2016), the S$NEER has risen from the lower half of the policy band to the upper half, appreciating by 2.3% from point to point. However, its average level from October 2015 to April 2016 has largely been unchanged from that in the preceding six-month period.
Chart 4.4 S$NEER
---- indicates release of Monetary Policy Statements
Chart 4.5 Singapore’s Bilateral Exchange Rates
Apr Oct Apr Oct Apr Oct Apr Oct Apr
98
100
102
104
106
108
Ind
ex
(2–
5 A
pr
20
12
Ave
rage
=1
00
)
2012 2014 2015
Appreciation
Depreciation
2013 2016
9-Oct 13-Nov 18-Dec 22-Jan 26-Feb 1-Apr
92
96
100
104
108
112
116In
de
x (9
Oct
20
15
=10
0)
2015 2016
Depreciation of S$
US$
Yen
Euro
Appreciation of S$
8-Apr
Ringgit
Renminbi
A$
Pound

64 Macroeconomic Review, April 2016
Monetary Authority of Singapore Economic Policy Group
The CPI-deflated S$REER has depreciated from its peak in Q1 2013.
The S$ real effective exchange rate (S$REER) is a measure of the prices of goods and services in Singapore relative to its trading partners, expressed in terms of a common currency index, the S$NEER. Using the CPI as the measure of prices, the S$REER depreciated by 3.6% between Q1 2013 and Q4 2015. (Chart 4.6) Although the S$NEER strengthened in line with the modest and gradual appreciation stance of monetary policy, relative prices fell by a greater extent, as Singapore’s CPI-All Items inflation declined while overall inflation in its trading partners recorded a sustained increase. The fall in domestic prices was largely due to the moderation in the cost of private road transport and imputed rentals on owner-occupied accommodation, as supply conditions in the COE and housing markets loosened.
Liquidity conditions have been driven by movements in the S$NEER.
Overall liquidity conditions in the economy are captured by changes in the Domestic Liquidity Indicator (DLI), which reflects movements in the S$NEER and the three-month S$ SIBOR. Since October 2015, changes in liquidity have primarily been driven by changes in the exchange rate rather than in interest rates. Domestic liquidity tightened over October to December 2015 as the S$NEER strengthened but eased briefly in January as the depreciating S$NEER outweighed the tightening arising from higher domestic interest rates. (Chart 4.7) Thereafter, liquidity began to tighten again as the trade-weighted exchange rate resumed its appreciation path.
Domestic interbank rates have risen since the beginning of 2015.
The three-month S$ SIBOR has been at a premium over the three-month US$ LIBOR since September 2012 (Chart 4.8), but the gap narrowed over Q4 2015, as US$ LIBOR rose by more than S$ SIBOR. While the S$ SIBOR eased from a peak of 1.14% in September 2015 to 1.07% in October and November, US$ LIBOR increased by 29 bps between end-September and December 2015, in line with the US Federal Reserve’s 25 bps hike of the Federal funds rate. In all, the
Chart 4.6
Components of the S$REER Deflated by CPI
* EPG, MAS estimates.
Chart 4.7 Domestic Liquidity Indicator
* EPG, MAS estimates.
Chart 4.8 Interest Rates
Source: ABS Benchmarks Administration Co Pte Ltd and ICE Benchmark Administration Ltd
2010 2011 2012 2013 2014 2015
95
100
105
110
115
120
Ind
ex
(Q1
20
10
=1
00
)
Q4
S$REER* S$NEER
Relative CPI*
Appreciation
Depreciation
Oct Jan Apr Jul Oct Jan
-0.6
-0.4
-0.2
0.0
0.2
0.4
0.6
0.8
Ch
an
ge f
rom
Th
ree
Mo
nth
s A
go
2014 2015 2016Mar
Exchange Rate Changes
DLI*
Interest Rate Changes
Tightening
Easing
0.0
0.4
0.8
1.2
1.6
2.0
2011 2012 2013 2014 2015 2016
% P
er
An
nu
m
End of Month
3-month S$ SIBOR
3-month US$ LIBOR
3-month S$Swap Offer Rate
Mar

Macroeconomic Policy 65
Monetary Authority of Singapore Economic Policy Group
S$ SIBOR’s premium over the US$ LIBOR fell from 81 bps in September 2015 to 57 bps in December. In Q1 2016, the S$ SIBOR rose to 1.25% in January before falling to 1.06% in March, as expectations of a US$ weakening against the S$ built up. Meanwhile, US$ LIBOR inched up in February but remained unchanged in March. Over the first three months of 2016, the S$ SIBOR premium widened to an average of 56 bps. In comparison, the three-month S$ Swap Offer Rate (SOR) was more volatile over the last six months. It surged to a seven-year high of 1.7% as at end-December, and then fell by a cumulative 89 bps to reach 0.8% in March 2016, on the back of rising expectations of US$ weakness vis-à-vis the S$. Recent econometric work by EPG found evidence of a time-varying exchange rate risk premium for the S$ SIBOR. A model based on the uncovered interest parity condition, augmented with a time-varying risk premium, had significant explanatory power for S$ SIBOR rates, and was generally able to capture the movements of S$ SIBOR since 2000. Although actual and predicted rates based on the estimated model have diverged more recently, the analysis suggests this could be due to systematic forecast errors, possibly related to the episodic disruption caused by the hike in the Federal funds rate in December 2015. All in, there is no evidence to suggest that the risk premium in Singapore has settled at a permanently higher level.1 Despite the broad increase in the three-month S$ SIBOR, savings and fixed deposit rates have remained low. Savings deposit rates have been unchanged at 0.14% p.a. since August 2015, while the 12-month fixed deposit rate only inched up to 0.35% in January 2016, and has been stable ever since. (Chart 4.9) However, these board rates belie the significantly higher promotional rates that banks offered on deposit accounts.
Money supply growth slowed further into 2016.
Growth in monetary aggregates continued to decline, with M1 contracting by 2.1% y-o-y in February 2016. (Chart 4.10) This was due to weaker growth in currency in active circulation and shrinking demand deposits.
Chart 4.9 Deposit Rates
Note: Each line represents the simple average of the top 10 banks’ deposit rates.
Chart 4.10 Money Supply
1 EPG's estimate of the time-varying risk premium, using a GARCH-in-Mean model, showed that after rising since early
2014, the risk premium had fallen in H2 2015 to the stable level that prevailed before the GFC.
0.0
0.1
0.2
0.3
0.4
0.5
2011 2012 2013 2014 2015 2016
% P
er
An
nu
m
End of Month Mar
12-month Fixed Deposit Rate
Savings Deposit Rate
2011 2012 2013 2014 2015 2016
-5
0
5
10
15
20
25
YO
Y %
Gro
wth
Feb
M2
M3
M1

66 Macroeconomic Review, April 2016
Monetary Authority of Singapore Economic Policy Group
The latter fell by 3.9% in February, registering its sixth consecutive month of negative growth. (Chart 4.11) Likewise, growth in the broader monetary aggregates, M2 and M3, decelerated from above 3% y-o-y in Q3 2015 to 1.0% and 1.2%, respectively, in February 2016. Although savings deposits growth slowed from 4.5% y-o-y in Q3 to 0.7% in February, fixed deposits grew more rapidly over this period, rising from 3.5% to 4.1%, probably because households took up the promotional rates offered by banks.
The stock of outstanding credit continued to fall in February 2016.
The stock of outstanding DBU non-bank loans continued to contract in recent months, by 1.2% y-o-y in February 2016 compared to an expansion of 0.6% in Q3 2015. (Chart 4.12) Business loans shrank more rapidly in February given lacklustre demand for credit from the manufacturing and commerce sectors. At the same time, growth in consumer lending slowed further to 2.2% y-o-y in February 2016 from 3.1% in Q3 2015. Although the decline in car loans moderated over this period, credit card loans and other credit to professionals and private individuals fell more rapidly.
Chart 4.11
Components of the Money Supply
Chart 4.12 DBU Non-bank Loans
2011 2012 2013 2014 2015 2016
-10
0
10
20
30
YO
Y %
Gro
wth
Feb
Savings and other Deposits
Currency In Active Circulation
Fixed Deposits
Demand Deposits
2011 2012 2013 2014 2015 2016
-10
0
10
20
30
40
50
YO
Y %
Gro
wth
Feb
Consumer Loans
Total DBU Non-bank Loans
Business Loans

Macroeconomic Policy 67
Monetary Authority of Singapore Economic Policy Group
4.2 Fiscal Policy
Targeted Measures To Sustain Restructuring Momentum
Budget 2016 provided near-term relief measures for households and small and medium enterprises facing pressures from the economic downturn and restructuring. At the same time, it built on the longer-term themes of previous Budgets to restructure the economy and foster a more inclusive society. Business measures were largely targeted initiatives aimed at encouraging individual firms and whole sectors to innovate and scale up, while providing help to workers affected by the cyclical weakness and restructuring. The Budget also enhanced support for the economically vulnerable groups. Overall, the fiscal policy stance for CY2016 is projected to be mildly expansionary.
Budget 2016 took steps to address cyclical and structural challenges.
The Budget was delivered against the backdrop of mounting cyclical and structural headwinds facing the Singapore economy. The economy is projected to grow at a modest pace of 1–3% in 2016, with output slipping slightly below potential and the labour market seeing a reduction in tightness. At the same time, while the economy’s shift towards productivity-driven growth is proceeding apace, restructuring has likely reached a phase where resource reallocation may be intensifying. The interaction of structural challenges, exacerbated by weak cyclical demand globally could, therefore, weigh on firms and individuals in the short term. This prudently accommodative Budget therefore provided targeted measures to relieve some near-term pressures, but also laid out programmes to help industries and enterprises transform and innovate for the longer run. It further introduced new measures to help workers affected by redundancies and built on earlier social programmes to protect the economically vulnerable. Table 4.1 summarises the key measures of Budget 2016.
The Budget offered relief measures targeted at vulnerable businesses and households.
Recognising the impact of external weakness and restructuring on businesses and workers, the Budget introduced a suite of measures aimed at
relieving the cash flow of small and medium enterprises (SMEs) and households. The corporate income tax rebate was raised from 30% of tax payable to 50%, for Years of Assessment (YA) 2016 and 2017, capped at $20,000 per YA. At the same time, the scheduled hike in the foreign worker levy for the Marine and Process sectors2 was deferred by another year in view of the challenges facing the oil and gas sectors. The Budget recognised that SMEs could be concerned about credit constraints amid the turning of the credit cycle, which could hinder firms’ investment and restructuring efforts. Accordingly, the new SME Working Capital Loan was introduced to ensure that viable SMEs have continued access to funding. For households, relief was provided in the form of one-off GST Voucher special payments and Service and Conservancy Charges (S&CC) rebates, with the former targeted at helping lower-income households.
The Budget built on previous restructuring initiatives …
In 2009, the Economic Strategies Committee envisioned that restructuring would result in an economy that was more in line with Singapore’s inherent comparative advantage. Growth was expected to be driven by human capital-intensive activities and innovation, and to leverage on Singapore’s strengths in institutional quality and infrastructure, rather than the import of low-wage labour. The government had expected that
2 Activities in the Marine and Process sectors comprise the building & repairing of ships and boats, and the construction and
maintenance of plants in specific industries such as chemicals and pharmaceuticals, respectively.

68 Macroeconomic Review, April 2016
Monetary Authority of Singapore Economic Policy Group
restructuring would take several years and involve not only raising productivity levels but reshaping the economy’s fundamental macro- and micro-level characteristics. The economy’s sectoral structure, export composition, as well as firm-level processes were anticipated to evolve and transform. Since 2010, Budget measures have kept in step with the different phases of restructuring. Previous Budgets laid the groundwork for restructuring by allowing factor prices to better reflect the true underlying relative factor scarcities. Foreign worker levies and dependency ratio ceilings were progressively tightened over successive Budgets. To alleviate the transitional pains on firms and incentivise their shift towards local workers and the increased use of capital, previous Budgets introduced and expanded on schemes such as the Wage Credit Scheme (WCS) and Productivity and Innovation Credit (PIC). As the relative price of capital declined, businesses began to progressively shift reliance away from scarce labour inputs towards labour-saving modes of production. As a result, total foreign employment gains in 2015 have fallen by more than 60% from the post-GFC peak of around 85,000 in 2011. There is now widespread acceptance, especially among SMEs, of the need to raise productivity. Budget 2016 built on these themes, underscoring the labour and land resource constraints confronting businesses, despite the cyclical downturn. As such, the Budget proceeded with the scheduled hikes in the foreign worker levy for the construction and services sectors. The foreign worker levy for work permit holders in the manufacturing sector remained unchanged, as announced in Budget 2015.
… but shifted the focus to helping firms and industries grow.
Nevertheless, Budget 2016 marked a significant milestone in Singapore’s restructuring journey, as the focus shifted from dealing with economy-wide challenges, towards taking a sector-based approach to build up firms’ capabilities to leverage on new growth opportunities.
In this spirit, a more targeted approach was adopted that recognised that restructuring needed to progress at the micro level, in partnership with industry associations and government agencies. A $4.5 billion Industry Transformation Programme (ITP) was introduced to help firms and industries move into the next phase of restructuring. First, the ITP provided new measures to encourage firms and industries to adopt labour-saving techniques and new technology. The Automation Support Package and the National Robotics Programme will help companies scale up automation and support the development and deployment of robots in key sectors such as healthcare and construction. Second, the ITP made provisions to encourage companies to increase scale and internationalise. For example, there were financing and tax incentives to help SMEs scale up through mergers & acquisitions, and to internationalise and develop new markets. Third, the ITP sought to reduce frictions that could hinder business development and expansion. The newly-proposed Business Grants Portal will provide a one-stop location for companies seeking to access the range of government grants available. At the same time, the creation of a National Trade Platform would serve as one-stop trade information management system to support firms, particularly those in the trade finance and logistics sectors. Fourth, the ITP positioned the government as a proximate facilitator of innovation. This new role recognised that it was necessary to encourage industry to spearhead innovation, and to drive research and development of solutions that are relevant to industry needs. The government will continue to partner industry through its top-ups to the National Research Fund and the new Research, Innovation and Enterprise (RIE) 2020 Plan. To foster entrepreneurship, the ITP also launched the SG-Innovate scheme to match budding entrepreneurs with skilled mentors, as well as funding and business opportunities.

Macroeconomic Policy 69
Monetary Authority of Singapore Economic Policy Group
EPG used the Monetary Model of Singapore (MMS) to simulate the effects of the ITP, which, in essence, can be regarded as a “supply-side” measure. The results show that the funding provided under the ITP to support firms’ innovation and investment would boost GDP in level terms by 0.2%, as compared to the baseline level, by 2020. However, as the spending will be phased in over several years, there would be no significant inflationary effect.
The Budget also focused on workers who are at risk of structural unemployment …
One of Singapore’s core strengths is its stock of human capital. In recognition of this, earlier Budgets had introduced several initiatives to expand paths to tertiary and advanced technical education. Budget 2015, in particular, had established the SkillsFuture programme to cultivate lifelong learning, and encourage Singaporeans to develop mastery in growing fields. Budget 2016 noted that an extended period of restructuring could result in a rise in frictional unemployment as workers moved across sectors and activities. With the restructuring process entering a more intensive phase of resource reallocation, some workers who lack the requisite skills risk becoming structurally unemployed. To mitigate the consequences, the Budget launched the “Adapt and Grow” initiative, to enable affected workers, especially PMETs, to adjust to industry and firm changes and increase their employability. For example, “Adapt and Grow” would focus on enabling PMETs to re-skill and undertake mid-career professional conversion programmes. This was complemented by expanded wage support schemes to encourage firms to hire mature PMETs who have been made redundant, and younger long-term unemployed PMETs.
… and built on earlier social reforms to build a caring and resilient society.
As laid out in previous Budgets, the government’s primary strategy for promoting an inclusive society comprised upstream interventions aimed at ensuring equality of opportunity and preserving intra- as well as inter-generational social mobility.
There were also direct transfers to reduce inequality of outcomes and strengthen social safety nets. As the social security programmes introduced in recent years—Workfare, GST Vouchers, Pioneer Generation Package, and Silver Support Scheme—provided a firm base of support for the economically vulnerable in Singapore, there was no need for a new major plank to enhance Singapore’s social security system. Instead, Budget 2016 announced details for the implementation of the Silver Support Scheme, which was introduced in Budget 2015 and will come into effect this year. Under this scheme, the bottom 20–30% of Singaporeans aged 65 and above will receive payments of up to $750 per quarter. The social mobility measures in Budget 2016 built on the themes of previous years and enhanced support for specific vulnerable groups. There were, for example, new measures to ensure that young Singaporeans continue to have equal access to opportunities. In particular, the KidSTART and Fresh Start Housing Scheme sought to provide assistance to children from disadvantaged families, and to give low-income families living in rental flats a second chance to own their homes, respectively. In addition, to encourage employment of Persons with Disabilities (PWDs), the Workfare Training Support scheme was extended to PWDs under the age of 35. The Budget also raised the income ceiling for the Workfare Income Supplement (WIS) to $2,000 a month, while increasing the amount and frequency of payouts to eligible workers. In addition, Budget 2016 gave a boost to Corporate Social Responsibility (CSR) activities, and made it easier for employees to contribute through their workplaces. From 1 July 2016 till the end of 2018, businesses that organise employees to volunteer and provide services to Institutions of Public Character (IPCs) will receive a 250% tax deduction on the associated cost incurred, up to a yearly cap of $250,000 per business and $50,000 per IPC. The government also pledged to match dollar-for-dollar any additional donations through Community Chest’s (ComChest) SHARE over and above the FY2015 level.

70 Macroeconomic Review, April 2016
Monetary Authority of Singapore Economic Policy Group
The Budget laid a solid foundation for the next phase of restructuring.
In sum, Budget 2016 judiciously balanced near- and medium-term economic concerns and built upon previous initiatives to increase social support. It sought to alleviate short-term pressures caused by the cyclical downturn and more intensive resource reallocation, but at the same time, consolidated previous restructuring efforts and fine-tuned existing policies. By focusing the new measures at firms and households, the Budget has taken the economic restructuring process to its next crucial phase. This involves tackling the most binding constraints at the worker, firm and industry levels, thereby nudging businesses and industries to grow new activities, and helping workers to re-skill and re-train. Meanwhile, the broader considerations of Singapore’s long-term economic future are being taken up by the Committee on the Future Economy (CFE), which is due to report on its recommendations in late 2016. Through Budget 2016, the government has laid a solid foundation for the CFE to build on.

Macroeconomic Policy 71
Monetary Authority of Singapore Economic Policy Group
Table 4.1 Key Initiatives of Budget 2016: “Partnering for the Future”
Measures for Businesses
(A) Addressing Near-term Concerns
The Corporate Income Tax Rebate will be raised from 30% of tax payable to 50%, with a cap of $20,000 per YA, in YA2016 and YA2017.
The Special Employment Credit will be modified and extended until end-2019 to provide employers with a tiered wage offset for workers aged 55 and above and earning up to $4,000 per month and the fund will receive a top-up of $1.1 billion.
There will be a new SME Working Capital Loan scheme for SMEs, for loans of up to $300,000 per SME. The Government will co-share 50% of the default risk of these loans with participating financial institutions, to encourage lending to local SMEs.
HDB’s Revitalisation of Shops package will be enhanced.
Foreign Worker Levy Changes o Marine and Process Sectors: WPH levy increases for 2016 to be deferred for one year. o Manufacturing Sector: WPH levy will be unchanged as announced in Budget 2015. o Services and Construction Sectors: WPH levy to be increased as announced in Budget 2015. o S-Pass Holders: All sectors to see increase in S-Pass levy as announced in Budget 2015.
(B) Industry Transformation Programme
Transforming Enterprises o Business Grants Portal to help firms access the many grants from government agencies more easily. o The Automation Support Package will enhance funding support for companies to automate, drive productivity,
and scale up. The Package will be available for 3 years. o To encourage firms to scale up, the Mezzanine Growth Fund will be expanded from $100 million to up to $150
million. o To support more mergers and acquisitions (M&A), M&A allowance will be available on up to $40 million of
consideration paid for qualifying deals (up from the current $20 million). The upfront certainty of non-taxation of companies’ gains on disposal of equity investment will be extended until 31 May 2022.
o IE Singapore will support firms’ internationalisation efforts through the Global Company Partnership and Market Readiness Assistance programmes. The Double Tax Deduction for Internationalisation scheme will also be extended to 31 Mar 2020.
Transforming Industries o Develop a National Trade Platform as a one-stop trade information management system to support firms,
particularly those in the logistics and trade finance sectors. o Set aside $450 million over the next 3 years under the National Robotics Programme to support robotics
development and deployment across sectors such as Healthcare, Construction, Manufacturing and Logistics. o Help trade associations and chambers increase their outreach and take the lead in developing industry
solutions. Government will also second public officers to interested trade associations and chambers to improve partnership and enable the public sector to better understand business needs.
Transforming through Innovation o Up to $4 billion will be available under the RIE 2020 Plan for industry-research collaboration, to deepen
industry capabilities in innovation and R&D. $1.5 billion top-up to the National Research Fund in 2016 to support RIE 2020 initiatives.
o Businesses now have flexibility to write down the cost of acquiring IP over different periods of 5, 10 or 15 years, instead of the current 5 years only.
o SG-Innovate platform to promote start-ups in new and existing industries. o To build an industrial park of the future, the Jurong Innovation District, which will bring together learning,
research, innovation and production.
(C) Reducing Structural Unemployment
An Adapt & Grow Initiative to help Singaporeans adjust to changing job demands, develop their skills and encourage re-employment.
TechSkills Accelerator, a skills development and job placement hub to enable Singaporeans to learn ICT skills and find jobs in the sector.

72 Macroeconomic Review, April 2016
Monetary Authority of Singapore Economic Policy Group
Measures for Households
(A) Caring for Our Young
New First Step grant of $3,000 for the Child Development Account of all eligible Singaporean children.
Increased Medisave withdrawal limit for pre-delivery expenses from $450 to $900.
Pilot KidSTART initiative to provide children from disadvantaged family backgrounds with appropriate learning, developmental, and health support in their first six years.
Fresh Start Housing Scheme to provide a grant up to $35,000 to help second-timer families with young children in rental housing to own their own home.
Develop Outward Bound School campus on Coney Island.
(B) Caring for Our Low-Wage Workers and PWDs
Workfare Income Supplement (WIS) Scheme o Qualifying income ceiling raised from $1,900 to $2,000 a month. o WIS payouts for eligible workers raised, depending on age and income. o WIS will be paid for every month worked, with payouts made monthly rather than quarterly.
Workfare Training Support scheme will be extended to PWDs, who earn low wages and are below 35 years of age.
Public service to expand job opportunities for persons with disabilities.
Review of next Enabling Masterplan.
(C) Caring for Our Seniors
Silver Support Scheme will provide a supplement of $300–750 every quarter to the bottom 20–30% of
Singaporeans aged 65 years and above.
Pilot the Community Network for Seniors to form networks of community partners and coordinate local services to keep seniors active and engaged.
(D) Building a Caring Society
Business & IPC Partnership Scheme.
Dollar-for-dollar matching for additional donations to ComChest’s monthly donation programme, SHARE, over and above the FY15 level, from FY2016 to FY2018.
Our Singapore Fund.
(E) Other Measures
Increase in basic monthly allowance for persons on ComCare Long-Term Assistance.
Increase in the Singapore Allowance and monthly pension ceiling for government pensioners.
S&CC Rebate.
One-off GST Voucher Cash Special Payment of up to $200 in 2016, totaling up to $500 when combined with regular GST Voucher–Cash.
Cap on Personal Income Tax Reliefs to $80,000 per Year of Assessment. Source: MOF
An overall Budget surplus is projected for the first year of the new term of Government.
An overall Budget surplus of $3.4 billion or 0.8% of GDP is projected for FY2016, compared to the $4.9 billion deficit (1.2% of GDP) in FY2015. (Chart 4.13 and Table 4.2) The projected surplus arises mainly from an increase in Net Investment Returns Contribution (NIRC), due to the inclusion of Temasek’s expected returns into the Net Investment Returns framework in this fiscal year, as well as increases in operating revenue from one-off factors such as vehicle-related revenues. The primary balance is expected to record a larger deficit of $5.0 billion due to an increase in operating expenditure. The basic balance, which is the primary balance less special transfers excluding top-ups to endowment and trust funds, is projected to be slightly smaller in FY2016 as special transfers for
Chart 4.13 Components of the Budget
FY2005 FY2008 FY2011 FY2014
-20
-10
0
10
20
$ B
illio
n
Net Investment Returns ContributionTop-ups to Endowment and Trust FundsSpecial TransfersPrimary BalanceOverall Balance
FY2016F

Macroeconomic Policy 73
Monetary Authority of Singapore Economic Policy Group
the WCS and PIC are expected to decline relative to the last FY. Meanwhile, top-ups to endowment and trust funds will also ease to $3.6 billion this year.
Table 4.2
Budget Summary
FY2015 Revised FY2016 Budgeted
$ Billion % of GDP $ Billion % of GDP
Operating Revenue 64.2 15.9 68.4 16.7
Total Expenditure 68.4 17.0 73.4 17.9
Operating Expenditure 48.7 12.1 54.4 13.2
Development Expenditure 19.7 4.9 19.0 4.6
Primary Surplus/Deficit (−) (4.3) (1.1) (5.0) (1.2)
Less: Special Transfers (excluding top-ups to endowment/trust funds)
4.5 1.1 2.7 0.6
Basic Surplus/Deficit (−) (8.8) (2.2) (7.7) (1.9)
Less: Special Transfers (top-ups to endowment/trust funds)
6.0 1.5 3.6 0.9
Add: Net Investment Returns Contribution 9.9 2.5 14.7 3.6
Budget Surplus/Deficit (−) (4.9) (1.2) 3.4 0.8
The fiscal stance will be appropriately expansionary in 2016.
Despite the overall Budget position turning in a small surplus in FY2016, the fiscal impulse (FI) is estimated to be mildly expansionary at around 0.8% of GDP in CY2016. (Chart 4.14) The $5.0 billion increase in total expenditure this FY is supported by higher government revenues from NIRC, which are derived from returns from overseas investments and are not included in the FI computation. The positive FI captures the short-term stimulus to aggregate demand and is appropriate given the slightly negative output gap in 2016. The near-term measures and programmes to help businesses and industries transform, as well as the enhancements to existing social schemes should provide support to an economy undergoing restructuring amid cyclical headwinds. Apart from the small boost to growth imparted by the ITP, the Budget measures targeted at different household segments will also collectively raise disposable incomes and private consumption. The positive impact on GDP growth in 2016 has been estimated at about 0.2% point, while headline inflation will rise by 0.1% point in 2017.
Chart 4.14 Fiscal Impulse and Output Gap
Source: EPG, MAS estimates
1992 1997 2002 2007 2012
-6
-4
-2
0
2
4
-6
-4
-2
0
2
4
% o
f P
ote
nti
al G
DP
% o
f G
DP
FiscalImpulse Measure
Output Gap (RHS)
2016F

74 Macroeconomic Review, April 2016
Monetary Authority of Singapore Economic Policy Group
Review of Government’s CY2015 Basic Balance
Government operating revenue rose modestly in CY2015.
This section compares the government’s budgetary outturn in CY2015 to that in CY2014. In 2015, operating revenue increased by $3.6 billion to $63.6 billion (15.8% of GDP) on the back of higher revenues from fees & charges, corporate and personal income taxes, and GST. These increases more than offset the decline in revenues from statutory boards’ contributions, “other taxes” 3 and stamp duties. (Chart 4.15) In 2015, receipts from income taxes and GST rose, alongside modest growth in the economy. Personal income taxes increased by $0.9 billion, while revenue from corporate income tax rose by $0.7 billion. Meanwhile, revenues from GST recorded an increase of $0.3 billion due to muted growth in consumer spending. Fees & charges were boosted primarily by a rise in vehicle quota premium collections as new vehicle registrations increased by 55% in 2015 even as weighted COE premiums fell by 13.5%. (Chart 4.16) Overall, revenues from vehicle quota premiums rose by $1.9 billion to $5.0 billion over the year. In comparison, “other taxes” declined by $0.4 billion and stamp duties by $0.2 billion. Stamp duties decreased mostly on account of the continued decline in property transactions. (Chart 4.17)
Both operating and development expenditures increased in 2015.
Total government expenditure rose by $6.3 billion to $61.2 billion (15.2% of GDP) in 2015 on account of higher spending on both operating and development items. (Chart 4.18) In terms of sectors, the bulk of the increase can be attributed to higher expenditure on social development and economic development, which offset a slight decline in government administration spending. (Chart 4.19)
Chart 4.15
Components of Operating Revenue
* Includes withholding tax.
Chart 4.16
COE Premiums and New COE Registrations
* Weighted by the COE quota of each category.
Chart 4.17
Residential Price Index and Property Transaction Volumes
3 Other Taxes include the foreign worker levy, annual tonnage tax, water conservation tax and development charge.
0 5 10 15
Corporate Income Tax
Personal Income Tax*
GST
Fees & Charges
Other Taxes
Property Tax
Stamp Duty
Betting Taxes
Customs & Excise Duties
Motor Vehicle Taxes
Stat Boards' Contributions
$ Billion
2014 2015
0
10
20
30
40
50
60
70
0
2
4
6
8
10
12
14
2010 2011 2012 2013 2014 2015 2016
$ Th
ou
san
d
Tho
usa
nd
Mar
Weighted COE Premiums (RHS)*
New Vehicle Registrations
100
110
120
130
140
150
160
0
2
4
6
8
10
12
2010 2011 2012 2013 2014 2015 2016 Q1
Ind
ex (
Q1
200
9=1
00)
Tho
usa
nd
Un
its
TransactionVolume
Residential Price Index (RHS)
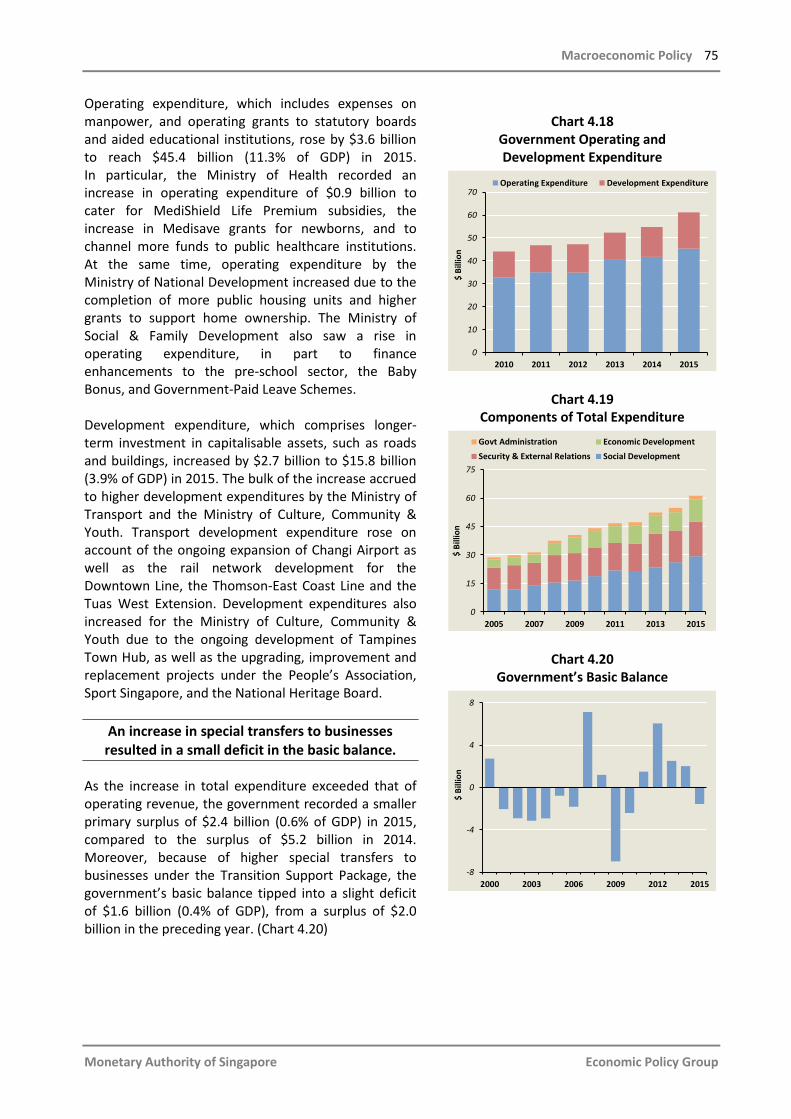
Macroeconomic Policy 75
Monetary Authority of Singapore Economic Policy Group
Operating expenditure, which includes expenses on manpower, and operating grants to statutory boards and aided educational institutions, rose by $3.6 billion to reach $45.4 billion (11.3% of GDP) in 2015. In particular, the Ministry of Health recorded an increase in operating expenditure of $0.9 billion to cater for MediShield Life Premium subsidies, the increase in Medisave grants for newborns, and to channel more funds to public healthcare institutions. At the same time, operating expenditure by the Ministry of National Development increased due to the completion of more public housing units and higher grants to support home ownership. The Ministry of Social & Family Development also saw a rise in operating expenditure, in part to finance enhancements to the pre-school sector, the Baby Bonus, and Government-Paid Leave Schemes. Development expenditure, which comprises longer-term investment in capitalisable assets, such as roads and buildings, increased by $2.7 billion to $15.8 billion (3.9% of GDP) in 2015. The bulk of the increase accrued to higher development expenditures by the Ministry of Transport and the Ministry of Culture, Community & Youth. Transport development expenditure rose on account of the ongoing expansion of Changi Airport as well as the rail network development for the Downtown Line, the Thomson-East Coast Line and the Tuas West Extension. Development expenditures also increased for the Ministry of Culture, Community & Youth due to the ongoing development of Tampines Town Hub, as well as the upgrading, improvement and replacement projects under the People’s Association, Sport Singapore, and the National Heritage Board.
An increase in special transfers to businesses resulted in a small deficit in the basic balance.
As the increase in total expenditure exceeded that of operating revenue, the government recorded a smaller primary surplus of $2.4 billion (0.6% of GDP) in 2015, compared to the surplus of $5.2 billion in 2014. Moreover, because of higher special transfers to businesses under the Transition Support Package, the government’s basic balance tipped into a slight deficit of $1.6 billion (0.4% of GDP), from a surplus of $2.0 billion in the preceding year. (Chart 4.20)
Chart 4.18
Government Operating and Development Expenditure
Chart 4.19 Components of Total Expenditure
Chart 4.20 Government’s Basic Balance
0
10
20
30
40
50
60
70
2010 2011 2012 2013 2014 2015
$ B
illio
n
Operating Expenditure Development Expenditure
0
15
30
45
60
75
2005 2007 2009 2011 2013 2015
$ B
illio
n
Govt Administration Economic Development
Security & External Relations Social Development
2000 2003 2006 2009 2012 2015
-8
-4
0
4
8
$ B
illio
n


Special Features

78 Macroeconomic Review, April 2016
Monetary Authority of Singapore Economic Policy Group
Singapore’s Monetary History: The Quest For A Nominal Anchor
Introduction
Singapore is one of the few, if not the only, country in the world that operates a monetary policy regime based on a managed float of its currency. Such a policy framework represents a notable departure from the bipolar regimes of a fixed exchange rate or a free float, as well as intermediate regimes that target domestic interest rates, while attempting to retain some influence over the exchange rate. Historically, the operation of monetary policy regimes is closely intertwined with the provision of a nominal anchor for the economy. In this context, Mishkin (1999) argues that the nominal anchor is a constraint on the value of the domestic currency. It provides the conditions that uniquely determine the price level, and therefore lays the foundation for price stability. More importantly, the nominal anchor constrains discretionary monetary policy through the adoption of a credible exchange rate peg, or the setting of targets for monetary growth or the inflation rate. Accordingly, the concept of a nominal anchor remains relevant to monetary policymaking today, even as central banks adopt ever more unconventional monetary policies such as quantitative easing and negative interest rates. Indeed, a credible commitment to a nominal anchor helps to tie down inflation expectations and stabilise aggregate output. (Mishkin, 2012) Arguably, the nominal anchor has assumed an even more critical role in the present environment, where unconventional monetary policies are prevalent, by serving as a focal point for the public to understand central banks’ actions, and as a basis for the formation of inflation expectations. A fixed exchange rate is an example of a nominal anchor. Eichengreen (1994) states that the
exchange rate is “the single most important price in the economy”, with fluctuations in the currency altering prices of domestically-produced goods relative to those abroad. In fixed rate regimes, the pegging of a domestic currency to a reserve currency effectively provides a nominal anchor for the economy, albeit at the cost of a loss in monetary autonomy, while in flexible rate regimes, the anchor is supplied by control over the money supply or interest rates. In Singapore’s case, the adoption of an exchange rate-centred monetary policy in the early 1980s raised the question of what exactly is the nominal anchor, given that the trade-weighted value of the domestic currency is not a targeted final outcome of monetary policy, but rather, the intermediate target. In this 45th year since MAS was established, this Special Feature will provide a broad sweep of Singapore’s search for a nominal anchor since the early 19th century, covering the period of its participation in the silver and gold standards, the fix to the pound sterling in 1914, and the Bretton Woods system of fixed exchange rates from 1944 until its demise in the early 1970s, followed by the unsettled period of generalised floating and finally, the introduction of Singapore’s unique exchange rate-centred policy in the early 1980s. The evolution of the system to provide the nominal anchor for price stability, in the context of a very open economy and export-driven development strategy, will be highlighted.
Special Feature A

Special Features 79
Monetary Authority of Singapore Economic Policy Group
The Nominal Anchor In Singapore’s Economic History
Before the dawn of the 20th century, the exchange rate was the de facto nominal anchor for the global economy. As most countries relied on specie-based money for the settlement of transactions, bilateral exchange rates were, for all practical purposes, fixed by the operation of the gold, silver or bimetallic standards. Coupled with free movement of capital, this meant that there was no scope for the active conduct of money supply or interest rate-based monetary policy. Instead, the price of gold or silver determined the prices of imports and constrained the value of the domestic currency by limiting money creation to the pace of growth in the supply of specie. Meanwhile, the price-specie adjustment mechanism meant that countries’ balance of payments positions were linked directly to their imports and exports of metals, with the price level being determined as a by-product of the flows of goods and specie. Beginning with Singapore’s founding as a trading outpost for the British East India Company in 1819, silver coins were the main currency in circulation. Although Britain had formally moved from the silver to the gold standard in 1821, silver coins minted in Hong Kong, Mexico, and Spain remained the currency of choice when Singapore was reconstituted as a Crown Colony in 1867. In 1897, the Board of Commissioners of Currency for the Straits Settlements (Penang, Malacca, and Singapore) was established, and two years later, it began issuing government notes redeemable against silver coins. In recognition of the importance of silver in trade, when the Straits government obtained its own currency, the Straits dollar, and began minting coins in 1903, silver rather than gold coins were struck. A specie-linked currency is unique in that it performs the functions of money and also serves as a nominal anchor. Over the 19th century and up until the early 20th century in Singapore, silver dollars played all these roles—anchoring the prices of tradables while serving as a medium of exchange, a unit of account and, critically, a store of value. Moreover, by fixing the exchange rate and constraining the value of the domestic
currency, the amount of silver dollars determined purchasing power domestically. However, the glut of silver on the world market over the latter half of the 19th century led to the value of silver declining sharply relative to gold, eventually causing the domestic value of the silver-linked Straits dollar to fall. Chiang (1978) described how the purchasing power of salaries denominated in currencies linked to silver was eroded, even as the cost of imports from economies on the gold standard increased. Drawing on the records of the Singapore Chamber of Commerce, Kemmerer (1904) observed that businesses and households in the Straits Settlements were deeply concerned about “the recent serious decline in the value of the dollar current here, the violent fluctuations in the price of silver and the extreme uncertainty as to the future of this metal, all of which are not only causing great inconvenience to the trade of the colony but constitute grave obstacles to the development of its natural resources by stopping the flow of capital from other parts of the world”. At the same time, a growing proportion of Singapore’s trade was with gold standard countries. By 1902, global superpowers and regional neighbours, such as Germany, Great Britain, India, and Japan, were on gold as well. Consequently, the Chamber was asked to examine the “feasibility and expediency of securing fixity of exchange” to gold rather than silver. Partly at the behest of local merchants, the Straits Settlements moved to a de jure gold standard in 1906. Britain was already on the standard and the change automatically implied fixity of the sterling/Straits dollar exchange rate. The Straits dollar’s link to the gold standard officially came to an end in 1914 with the outbreak of World War I, but the peg to sterling remained. Indeed, the stability of this regime facilitated Singapore’s development as a major rubber processing and trading centre during the first forty years of the 20th century (Chiang, 1978). The peg to the pound was restored in 1945 following the defeat of Japan and expanded when the Board of Commissioners of Currency, Malaya and British Borneo was established in 1952, encompassing Singapore, Malaya, Sarawak, North Borneo, Brunei and the Riau archipelago.

80 Macroeconomic Review, April 2016
Monetary Authority of Singapore Economic Policy Group
After achieving independence in 1965, Singapore began issuing her own fiat currency in 1967 when the common currency board arrangement was terminated and Singapore set up its own Board of Commissioners of Currency. MAS was established in 1971, the same year President Richard Nixon suspended the convertibility of the US dollar to gold and, in so doing, precipitated the demise of the Bretton Woods system that had existed since 1944. However, the exchange rate continued to act as the nominal anchor for the Singapore economy in the first decade of independence, through retaining the fix to sterling until June 1972, and then to the US dollar until it floated in June 1973. The motives for retaining a fixed
exchange rate remained largely the same as before: to guard against imported inflation and to maintain foreign investor confidence. In 1973, however, with the move to generalised floating by the major currencies, including the pound and the US dollar, following the first oil shock and heavy market speculation, Singapore reluctantly abandoned its exchange rate peg and began to experiment with a range of traditional monetary policy instruments, including the exchange rate. Since the formal framework for monetary policy was lacking at this time, Singapore’s quest for a new nominal anchor began.
The Transition To A New Monetary Regime
Throughout the tumultuous seventies, the intellectual understanding about monetary policy instruments and nominal anchors was evolving. The phenomenon of cost-push inflation due to the two large oil price shocks and an unfamiliar world of flexible exchange rates had caused inflation expectations to become unhinged, which brought about rapid inflation in both developed and emerging economies. Policymakers began to realise that an effective nominal anchor could enhance the conduct of monetary policy by providing a specific target for the chosen policy instrument, provided it had a stable relationship with inflation. Economic agents could then discern the monetary policy stance by referencing the nominal anchor which would, in turn, help tie down their inflation expectations. However, the experiments with money supply targets in the US and the UK in the late 1970s and early 1980s were not particularly successful. Within a few years, the US Federal Reserve and the Bank of England realised that the relationship between money supply growth and inflation had become unstable and targeting money supply growth had proven infeasible. The Federal Reserve officially stopped announcing money growth targets in 1987 and instead, focused on formalising an interest rate regime that targeted the Federal funds rate as the basis of its monetary policy; a system that it has maintained until
today. The UK belatedly joined the European Exchange Rate Mechanism in 1990, ostensibly to anchor its monetary policy to the highly credible German central bank, but after heavy speculation it was forced to float the pound in 1992 and the Bank of England moved to an interest rate-based monetary policy and a formal inflation target. Singapore’s transition from a fixed to a floating exchange rate in the 1970s mirrored these global developments. During this period, the newly- established MAS conducted monetary policy based on an eclectic checklist of indicators spanning interest rates, exchange rates, the monetary base and loan growth. However, the absence of a clear and transparent nominal anchor or monetary policy instrument during this period may have exacerbated the destabilising effect that the oil shocks of the 1970s had on inflation expectations. In light of this experience, Dr Goh Keng Swee, who went on to become Chairman of MAS and Deputy Prime Minister in 1980, saw that some degree of influence over the exchange rate would be necessary to curb external inflationary pressures, given Singapore’s ultra-open and trade-dependent economy. By 1981, MAS had formally shifted to an exchange rate-based monetary policy framework, managing the Singapore dollar against a trade-weighted basket

Special Features 81
Monetary Authority of Singapore Economic Policy Group
of the currencies of her major trade partners, or the Singapore dollar nominal effective exchange rate (S$NEER). MAS’ Annual Report for 1981–82 notes that “Underlying this shift in emphasis away from targets for interest rates and money supply growth in the conduct of monetary policy is the view that the exchange rate is a relatively more important anti-inflation instrument in the context of the small and open Singapore economy.” MAS’ decision to adopt an exchange rate-centred monetary policy framework was unprecedented, but was uniquely suited for Singapore. Under this framework, a policy-induced appreciation of the S$NEER can be used to directly offset imported inflation from abroad, as well as to ease domestic cost pressures indirectly, by dampening demand for Singapore’s exports and the derived demand for factor inputs. This turned out to be very successful as Singapore’s CPI inflation fell to an average of 2.0% over 1981–2015, compared to 4.1% over 1962–1980.1, 2
In terms of the features of the S$NEER framework, managing the Singapore dollar against a “basket” of currencies helps to balance the potentially competing needs of importers and exporters operating in different markets, taking into account the changing composition of trade over time. Whilst the system does not depend on a fix to a single currency, the “band” feature in effect constrains the extent to which the S$NEER can fluctuate, thereby providing some degree of exchange rate stability.3 At the same time, the framework incorporated a “crawl” feature into monetary policy, which allows the pace of S$NEER appreciation to be adjusted in line with changing economic fundamentals—in particular, the outlook for GDP growth and inflation. Therefore, the monetary policy settings could be altered in line with real economic fundamentals to ensure that the S$NEER does not persistently deviate from its longer-run equilibrium. This ensures that the necessary adjustments to variables such as output, employment, wages, and prices, are less severe than under a fixed exchange rate system.
The Exchange Rate-based Monetary Policy Framework As A Nominal Anchor
Singapore’s transition to an exchange rate-based framework has important implications for the country’s search for a nominal anchor. First, shifting from the currency peg and monetary growth targets meant having to redefine the characteristics of a nominal anchor within Singapore’s unique setting. Arguably, a target growth rate for the money supply could provide clarity and transparency, which the S$NEER system lacks in comparison. The level of the S$NEER is not a policy target per se, while the policy stance is defined by the parameters of the exchange rate band and not its specific level. Hence, there is no uniquely determined price level, but rather a constrained set of possible
macroeconomic outcomes. The parameters of the policy band—the slope, the width, and the level at which the band is centred, and the currencies making up the trade-weighted basket—are not disclosed. Without this information, it is not immediately apparent how daily shifts in Singapore dollar bilateral exchange rates map to changes in the level of the S$NEER and to the overall stance of monetary policy. Second, the S$NEER framework has come to play the role of the nominal anchor for the Singapore economy. In making the case that Singapore does not need a fixed currency peg, MAS (2001) notes that “the Singapore economy has diversified
1 Between 1981 and 2015, CPI inflation in Singapore has been consistently below the average annual inflation rate of the
OECD economies.
2 See also Mihov (2013), who found that for small open economies, such as Singapore, an exchange rate-based monetary
policy rule delivers lower volatility in GDP growth and inflation compared to an interest rate regime.
3 Between January 1981 and February 2016, the standard deviation of the trade-weighted S$NEER was 9.1, well below the
Bank of International Settlements’ narrow NEER indices for the US$ (17.9), Japanese yen (17.9), and pound sterling (14.6).

82 Macroeconomic Review, April 2016
Monetary Authority of Singapore Economic Policy Group
trading links, substantial fiscal surpluses, and a long track record of low inflation … There is thus little need for a nominal anchor for the SGD to manage inflationary expectations, or for the discipline imposed by the monetary policy of a foreign country—most likely the US—to which the SGD is pegged.” This statement suggests that far from abandoning all notions of a nominal anchor, it is the discipline and credibility imbued in the S$NEER framework that now serves as the nominal anchor for Singapore. Bernanke and Mishkin (1997) have argued that a nominal anchor, whether explicit or implicit, serves as “a way of reassuring the public that monetary policy would remain disciplined”. 4 The S$NEER framework imposes such discipline and helps to constrain the extent of discretion afforded to the central bank, ensuring that monetary policy is aimed at achieving price stability over the medium term. To maintain credibility, MAS cannot adopt inconsistent policies, such as expanding or contracting the domestic money supply, that cause the currency to breach the bounds of the band. Also, while the exact parameters are unknown, the broad parameters of the policy stance are clear and sufficiently transparent to financial markets and the public. MAS has issued Monetary Policy Statements bi-annually since 2001, outlining the adjustments to the policy parameters when the policy stance is changed. For example, in October 2010, when MAS announced a slight increase in the slope of the S$NEER policy band, financial markets understood that MAS’ intention was to allow the Singapore dollar to gradually appreciate against the currencies of its trading partners in order to dampen inflation. MAS is of the view that such announcements help to align the expectations of market participants with its policy and move the currency in the right direction. In recent years, MAS has also enhanced transparency about some key aspects of monetary policy formulation by publishing data on the S$NEER more frequently and by releasing the documentation on the Monetary Model of Singapore, which is used to simulate the impact of
monetary policy on the economy. These qualities help to make monetary policy decisions in Singapore “almost predictable”, as described by MAS Deputy Chairman Minister Lim Hng Kiang (MAS, 2012). Indeed, MAS’ own simulations have shown that, by and large, the monetary policy outcomes have been equivalent to those that would have occurred according to a modified Taylor-type monetary policy rule. (See Box C) The general predictability and discipline underpinning actual monetary policy responses have, therefore, clearly served to enhance the nominal anchor role provided by the exchange rate framework. Third, having a credible exchange rate framework as the nominal anchor for monetary policy means ruling out opportunistic competitive depreciations in the value of the Singapore dollar to boost exports. By managing the exchange rate to ensure medium-term price stability, MAS has effectively tied its hands and can no longer intervene to reduce the value of the Singapore dollar for competitive purposes. In any case, this would be ineffective in Singapore, given its extreme openness to trade and very high import content of exports, where out of every dollar of final demand, approximately 54 cents is “leaked” abroad in the form of imports. Fourth, the role of the S$NEER as a nominal anchor is also to provide the binding link between globally-determined prices and the signals and incentives to local firms to innovate and upgrade the value-added composition of the export basket over time. This is, in effect, how small open economies that are “price-takers” can adjust production and compete effectively in global markets. Should MAS intervene to deliberately offset any loss in cost competitiveness, it would send the wrong signal to exporters and disincentivise them from the structural adjustments necessary to make globally competitive products.
4 Mishkin (1999) describes monetary policy with implicit nominal anchors, which operate “without using an explicit nominal
anchor such as a target for the exchange rate, a monetary aggregate target, or inflation”. The US Fed’s implicit nominal anchor is “an overriding concern by the Federal Reserve to control inflation in the long run” which gives it a coherent monetary policy strategy even when no explicit strategy has been articulated.

Special Features 83
Monetary Authority of Singapore Economic Policy Group
Fifth, the S$NEER framework has allowed the Singapore dollar to appreciate at a stable pace over time, alongside the economy’s strengthening fundamentals. This emphasis on preserving confidence through a strong and stable currency has been a recurring theme in Singapore’s economic history. For example, MAS (2000) observes that “throughout history, Singapore has sought to maintain confidence in the value of its currency as a means to buttress its image as [a] regional trading centre”. In 1902, the Singapore Chamber of Commerce recognised that foreign investors would be deterred from investing in Singapore if the value of their investments were to be eroded by a depreciating currency. By the same token, a stable and predictable exchange rate enables firms to plan production and manage revenues and costs more effectively, and helps reduce the transactional costs associated with hedging against sharp exchange rate movements. A strong and stable Singapore dollar has also been a proximate enabler of financial centre development, as it testified to the credibility of government policies and bolstered the sense of integrity, soundness, and stability that are so critical to the flourishing of a financial centre. Former Prime Minister Lee Kuan Yew (2000) highlighted the role of Singapore’s strong currency, noting that “the foundations for our financial centre were the rule of law, an independent judiciary, and a stable, competent and honest government that pursued sound macroeconomic policies, with budget surpluses almost every year. This led to a strong and stable Singapore dollar, with exchange rates that dampened imported inflation.” Sixth, the exchange rate framework has been faced with challenges in recent years, but remains “fit for purpose” as a nominal anchor for monetary policy. In the years following the GFC, a number of developments have altered key relative prices in the domestic economy and shifted the structure of production. Ultra-low interest rates imported from abroad led to rising asset prices, especially for property, which was reflected in higher CPI inflation. At the same time, the policy shift towards productivity-driven growth and a reduction in the reliance on cheap foreign labour since 2010 has resulted in stronger
wage growth. Singapore has also been rapidly evolving towards the provision of higher value-added services. Despite these structural shifts, the evidence suggests that the present monetary policy remains “fit for purpose” (Menon, 2013). Empirical studies by MAS suggest that inflation would have been higher in the absence of a tighter exchange rate policy. Although inflation was driven, in large part, by rising imputed rentals on owner-occupied accommodation and the cost of private road transport, the appreciating exchange rate successfully dampened price increases in the broader consumption basket, and served to “temper but not fully offset” the inflationary pressures arising from the economic restructuring process. Moreover, although the economy had become more services-based, many of these activities are tradable and, therefore, sensitive to exchange rate movements. MAS also adopted complementary tools to buttress the role of the exchange rate as the nominal anchor. Specifically, a number of macroprudential measures have been introduced to stabilise the property market and thereby to anchor inflation expectations, despite the low-interest rate environment. For example, MAS has reduced the loan-to-valuation ratio on mortgages for non-owner occupied homes, and imposed a 60% debt service-to-income ratio for borrowers intending to take out a mortgage. These measures have been fairly successful in bringing about a soft-landing in the property market. With macroprudential measures as an “add-on”, the exchange rate-centred monetary policy framework can continue to focus on fulfilling its role as a nominal anchor for the Singapore economy.

84 Macroeconomic Review, April 2016
Monetary Authority of Singapore Economic Policy Group
Conclusion
Despite global events outside her control, pragmatism led Singapore to adopt the S$NEER-based monetary policy framework in the early 1980s, which has provided an effective nominal anchor for the economy and facilitated rapid growth, alongside low and stable inflation. Global monetary history tells us that there is nothing inherently “anchored” about the nominal anchor itself, even though in Singapore’s case, the exchange rate has performed this function for the most part of her economic history.
However, as Robinson (2001) puts it, the exchange rate system in Singapore can be viewed as “a ‘monetary overlay’ on the real economy foundations”. The past success of MAS’ exchange rate framework, and its future ability to remain fit for purpose as a nominal anchor, will depend critically on there being a firm bedrock of solid macroeconomic fundamentals, such as sound fiscal finances, a strong external position, and a steadily growing economy.
Box C
A Model-based Ex-post Evaluation Of Singapore’s Monetary Policy
This Box uses a model-based simulation methodology to evaluate Singapore’s monetary policy decisions on an ex-post basis. The approach follows the recent work by Argov et al. (2015), who utilised the Bank of Israel’s dynamic stochastic general equilibrium (DSGE) model, MOISE, to analyse the central bank’s monetary policy decisions over the period 2001–11. Specifically, they examined whether actual monetary policy decisions had led to a Pareto improvement—in terms of lower inflation and output volatility—as compared with a rules-based policy regime. The method entails generating counterfactual outcomes for inflation and output gap volatility in the model, in which the paths of policy rates are allowed to differ from their actual trajectories in a given year. Besides offering a way to assess the Pareto-efficiency of actual policy decisions, this can also provide useful insights for policymakers on an ex-post basis, even though monetary policy decisions are implemented ex-ante.
To evaluate MAS’ monetary policy decisions over the period 2002–141/, the Argov et al. (2015) method was implemented in EPG’s small-scale DSGE model, the Satellite Model of Singapore (SMS). In this model, rules-based monetary policy is specified by the following modified Taylor rule2/:
1 1 2 3 3 41 1
1NEER
t t tt t t t t t
NEER NEER NEER NEER NEER NEER Y
where NEER is defined as the logarithm of the nominal trade-weighted exchange rate index, denotes the inflation rate and Y denotes the output gap. The bar denotes the trend (unobserved) component while the dot notation refers to the growth rates of the respective terms. This specification differs slightly from the rule in Parrado (2004) in that the conduct of monetary policy takes into account the deviation of the exchange rate from its long-run equilibrium, in addition to the standard output and inflation gaps.
Specific policy decisions are evaluated by calculating the root mean squared errors (RMSE) of historical inflation and output gaps over a period of eight quarters: four quarters of actual outcomes, followed by another four quarters of model-simulated outcomes. The steps involved are as follows.
1. Estimate the historical shocks. The SMS is estimated over the period Q1 1994 to Q3 2015 using Bayesian techniques to recover the historical shocks affecting all macroeconomic variables in the model. These historical shocks include a vector of monetary shocks for all periods, which represents the discretionary component of monetary policy decisions over the estimation period.
____________________________________________________________________
1/ MAS began actively communicating its monetary policy decisions in October 2001. Since then, a Monetary Policy
Statement is released twice a year—in April and October. Hence, for the purpose of this study, the sample period begins at 2002 to take into account the shift towards greater transparency in monetary policymaking.
2/
For more details on the SMS, please refer to Monetary Authority of Singapore (2014; 2011).
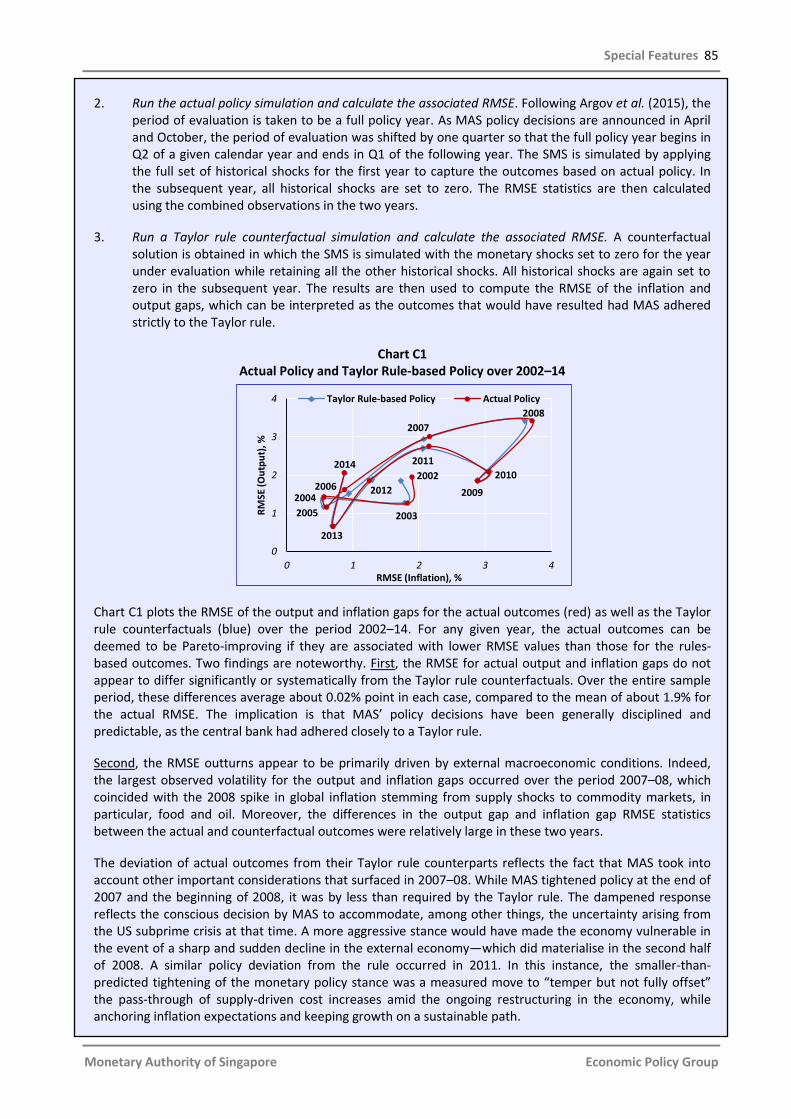
Special Features 85
Monetary Authority of Singapore Economic Policy Group
2. Run the actual policy simulation and calculate the associated RMSE. Following Argov et al. (2015), the period of evaluation is taken to be a full policy year. As MAS policy decisions are announced in April and October, the period of evaluation was shifted by one quarter so that the full policy year begins in Q2 of a given calendar year and ends in Q1 of the following year. The SMS is simulated by applying the full set of historical shocks for the first year to capture the outcomes based on actual policy. In the subsequent year, all historical shocks are set to zero. The RMSE statistics are then calculated using the combined observations in the two years.
3. Run a Taylor rule counterfactual simulation and calculate the associated RMSE. A counterfactual solution is obtained in which the SMS is simulated with the monetary shocks set to zero for the year under evaluation while retaining all the other historical shocks. All historical shocks are again set to zero in the subsequent year. The results are then used to compute the RMSE of the inflation and output gaps, which can be interpreted as the outcomes that would have resulted had MAS adhered strictly to the Taylor rule.
Chart C1 Actual Policy and Taylor Rule-based Policy over 2002–14
Chart C1 plots the RMSE of the output and inflation gaps for the actual outcomes (red) as well as the Taylor rule counterfactuals (blue) over the period 2002–14. For any given year, the actual outcomes can be deemed to be Pareto-improving if they are associated with lower RMSE values than those for the rules-based outcomes. Two findings are noteworthy. First, the RMSE for actual output and inflation gaps do not appear to differ significantly or systematically from the Taylor rule counterfactuals. Over the entire sample period, these differences average about 0.02% point in each case, compared to the mean of about 1.9% for the actual RMSE. The implication is that MAS’ policy decisions have been generally disciplined and predictable, as the central bank had adhered closely to a Taylor rule.
Second, the RMSE outturns appear to be primarily driven by external macroeconomic conditions. Indeed, the largest observed volatility for the output and inflation gaps occurred over the period 2007–08, which coincided with the 2008 spike in global inflation stemming from supply shocks to commodity markets, in particular, food and oil. Moreover, the differences in the output gap and inflation gap RMSE statistics between the actual and counterfactual outcomes were relatively large in these two years.
The deviation of actual outcomes from their Taylor rule counterparts reflects the fact that MAS took into account other important considerations that surfaced in 2007–08. While MAS tightened policy at the end of 2007 and the beginning of 2008, it was by less than required by the Taylor rule. The dampened response reflects the conscious decision by MAS to accommodate, among other things, the uncertainty arising from the US subprime crisis at that time. A more aggressive stance would have made the economy vulnerable in the event of a sharp and sudden decline in the external economy—which did materialise in the second half of 2008. A similar policy deviation from the rule occurred in 2011. In this instance, the smaller-than-predicted tightening of the monetary policy stance was a measured move to “temper but not fully offset” the pass-through of supply-driven cost increases amid the ongoing restructuring in the economy, while anchoring inflation expectations and keeping growth on a sustainable path.
0
1
2
3
4
0 1 2 3 4
RM
SE (
Ou
tpu
t), %
RMSE (Inflation), %
Taylor Rule-based Policy Actual Policy
2006
2007
2008
2009
2010
2011
2012
2013
20142002
2003
2004
2005

86 Macroeconomic Review, April 2016
Monetary Authority of Singapore Economic Policy Group
References
Argov, E, Binyamini, A, Borenstein, E, and Rozenshtrom, I (2015), “Model-Based Ex Post Evaluation of Monetary Policy”, International Journal of Central Banking, Vol. 11(4), pp. 219–254. Bernanke, B S and Mishkin, F S (1997), “Inflation Targeting: A New Framework for Monetary Policy?”, Journal of Economic Perspectives, Vol. 11(2), pp. 97–116. Chiang, H D (1978), A History of Straits Settlements Foreign Trade 1870–1915, Singapore National Museum. Eichengreen, B (1994), International Monetary Arrangements for the 21st Century, Brookings Institution. Kemmerer, E W (1904), “A Gold Standard for the Straits Settlements”, Political Science Quarterly, Vol. 19(4), pp. 636–649. Lee, K Y (2000), From Third World to First: The Singapore Story: 1965-2000, HarperCollins. Menon, R (2013), “Securing Price Stability as Singapore Restructures”, speech at Asian Bureau of Financial and Economics Research (ABFER) Opening Gala Dinner available at http://www.mas.gov.sg/news-and-publications/speeches-and-monetary-policy-statements/speeches/2013/securing-price-stability-as-singapore-restructures.aspx Mihov, I (2013), “The Exchange Rate as an Instrument of Monetary Policy”, Macroeconomic Review, Vol. XII(1), pp. 74–82. Mishkin, F S (1999), “International Experiences with Different Monetary Policy Regimes”, Journal of Monetary Economics, Vol. 43(3), pp. 579–605. Mishkin, F S (2012), Macroeconomics: Policy and Practice, Pearson. Monetary Authority of Singapore (1981–82), Annual Report. Monetary Authority of Singapore (2000), “A Survey of Singapore’s Monetary History”, MAS Occasional Paper No. 18. Monetary Authority of Singapore (2001), “Singapore’s Exchange Rate Policy”, monograph. Monetary Authority of Singapore (2011), “An Overview of the Satellite Model of Singapore”, Macroeconomic Review, Vol. X(2), pp. 68–71. Monetary Authority of Singapore (2012), Sustaining Stability, Serving Singapore, Straits Times Press. Monetary Authority of Singapore (2014), “The Satellite Model of Singapore (SMS): A Technical Overview”. Parrado, E (2004), “Singapore’s Unique Monetary Policy: How Does It Work?”, MAS Staff Paper No. 31. Robinson, E S (2001), “Discussion”, pp. 112–119, response to Williamson, J, “The Case for a Basket, Band and Crawl (BBC) Regime for East Asia”, pp. 97–111, in Gruen, D and Simon, J (eds.), Future Directions for Monetary Policies in East Asia, Reserve Bank of Australia.

Special Features 87
Monetary Authority of Singapore Economic Policy Group
The Great Recession: Earthquake For Macroeconomics by Lawrence J. Christiano1
Introduction
The Great Recession, which started in late 2007 in the United States, had a major impact on the lives of people all over the world as well as on the thinking of the academic economists who study these people. The effects, both on the economy and on macroeconomic thinking, were so large as to be comparable to an earthquake. In what follows, I describe aspects of the Great Recession. I explain the reason for the adjective, Great, and why it is called a recession and not a depression. After describing, and largely dismissing, some of
the early explanations of the Great Recession, I turn to the explanation that has survived the passage of time. In that section, I address several questions about the Great Recession. What caused it? What made it last so long? Why did so few people predict it? What impact is the Great Recession having on macroeconomics as a discipline? I argue that the impact on macroeconomics has been very large and is likely to be long-lasting.
The Great Recession
One way to assess the severity of the Great Recession is to compare it to the average recession in the period after 1945. According to the information in Table 1, the drops in output, consumption, investment, employment and hours worked were all far greater in the recent recession
than they were in the average recession since 1945. At the same time, the Great Recession was not the worst recession on record. The declines in the major economic indicators in the Great Depression were many times greater than what they were in the Great Recession.
Table 1 The 2007–09 Recession in Perspective
(% Change, Peak to Trough)
Output Consumption Investment Employment Hours
Worked
2007–09 Recession (Q4 2007 – Q3 2009)
−7.2 −5.4 −33.5 −6.7 −8.7
Average Post WWII Recessions
−4.4 −2.1 −17.8 −3.8 −3.2
US Great Depression* (1929–33)
−36 −23 −69 −27 -
* See Christiano, Motto and Rostagno (2003).
1 Lawrence J. Christiano is the Alfred W. Chase Chair in Business Institutions and Professor of Economics at Northwestern
University. Professor Christiano visited MAS in Jun–Jul 2015 as the MAS-NUS Term Professor in Economics and Finance. The views in this Special Feature are solely those of the author and should not be attributed to MAS.
Special Feature B

88 Macroeconomic Review, April 2016
Monetary Authority of Singapore Economic Policy Group
Another way to gauge the dimensions of the Great Recession is to examine Chart 1, which displays output per working-age person, adjusted for inflation.2 The shaded areas in the chart demarcate the starting and ending dates for recessions, as determined by the National Bureau of Economic Research’s (NBER) Business Cycle Dating Committee. According to the NBER, the economy began to climb out of the recession by the summer of 2009. But, note how long the economy
is taking to recover: the US economy did not return to the 2007 level of output per capita until a little over five years later, in Q1 2013.3 Usually, the economy returns more quickly to its pre-recession peak. Even now, the US economy seems not to have returned to its previous ‘normal’ level. If we take the previous ‘normal’ to be the 2007 trend growth path, then the US economy is still about 10% below normal.4
Chart 1 Real GDP per Working-age Individual (Aged 15–64) in the US
Source: Federal Reserve Bank of St. Louis FRED Database
It is not possible to evaluate the health of the US economy simply by examining per capita output. The performance of per capita output depends not only on how well labour and other markets are functioning, but also on the evolution of Total Factor Productivity (TFP). The dynamics of TFP are determined in part by the evolution of technological knowledge. The latter, in turn,
reflects the growth-enhancing impact of longer-term factors that have nothing to do with the current health of financial, labour and other markets. Thus, if the underlying growth rate of TFP had fallen significantly, then the new normal could be substantially below the old normal in 2007. In this case, US output may not be so far from trend as it may at first appear in Chart 1.5
2 The output and population data were obtained from FRED, the online database maintained by the Federal Reserve Bank
of St. Louis. The FRED mnemonic for the output measure is GDPC1 and the mnemonic for the working-age population is LFWA64TTUSQ647S.
3 The exact amount of time required for per capita output to return to its pre-recession peak depends somewhat on the
population measure used. If instead the civilian non-institutional population measure (FRED mnemonic, CNP16OV) were used, then the amount of time would have been longer, roughly seven years. The difference from the results in Chart 1 reflects demographic factors that cause the working-age population to grow less rapidly than the population as a whole.
4 For additional discussion about the trend of US economic output in 2007, see Christiano, Eichenbaum and Trabandt
(2015). The 10% number in the text was rounded after doing the following calculations. I fit a linear time trend to the natural logarithm of the output measure in Chart 1, using data from the beginning of the sample to Q3 2007, the quarter before the Great Recession began according to the NBER. I extended the trend to the end of the sample. The difference between the trend at the end of the sample and the (log of the) last data point is 0.136, which I rounded to 0.10. The 10% number reported in the text is this last number, multiplied by 100.
5 See Gordon (2016) for an elaboration of the view that the growth rate of technological progress in the US may have
slowed down significantly.
40,000
45,000
50,000
55,000
60,000
65,000
70,000
75,000
80,000
1977 1987 1997 2007
Ch
ain
ed
20
09
US$ Great Recession
2014Q4

Special Features 89
Monetary Authority of Singapore Economic Policy Group
The employment-to-population ratio, when only people between the ages of 25 and 54 are considered, appears in Chart 2. 6 Inferring the health of the US economy by looking at a labour market variable like the employment ratio has the advantage that labour markets are presumably less sensitive to assumptions about the evolution of technological knowledge. 7 The employment ratio fell by 5% points, an amount that is substantially larger than what happens in a typical recession. Not only did the ratio fall by a large amount, but it was also very slow to recover. In fact, that 5% point drop has still not been reversed, even today. But, demographic considerations inject some uncertainty into how the last observation is to be interpreted. It is well known that the employment ratio has been trending down since the early 2000s.8 This can be seen in Chart 2, by noting that the peak employment ratio before the 2001
recession is higher than the corresponding peak before the recent recession. So, although the employment ratio undoubtedly remains low, trend changes in demographic factors suggest that it may not be as far below its new normal level as Chart 2 might suggest at first glance. These and other indicators explain why the Great Recession is called Great. There was an unusually large drop in output and employment. Moreover, the recovery has been very slow. Arguably, the US economy has still not completely recovered even though seven years have passed since the start of the recession. To what extent the US economy may have completely recovered from the Great Recession is hard to assess, because that requires taking a difficult-to-quantify stand on the underlying pace of technological change and demographic developments.
Chart 2 US Employment-to-population Ratio (Aged 25–54)
Source: Federal Reserve Bank of St. Louis FRED Database
6 This variable is taken from FRED and has mnemonic, LNS12300060. I use a measure of the employment ratio that covers
only a subset of the population in order to reduce the impact of demographic factors such as the increase in the proportion of the population that is retired.
7 One way to motivate the presumption in the text is to refer to the standard (i.e., ‘divisible labour’) real business cycle
model. A well-known feature of this model is that employment is substantially less sensitive to the state of technology than output (see for example, Christiano and Eichenbaum, 1992).
8 There has been a trend decline in the employment rate for 25–54 year old males since the early 1970s (see the variable in
FRED with mnemonic, LREM25MAUSQ156N). The labour force participation of working-age females has exhibited a modest downward trend since the early 2000s (see FRED variable, LREM25FEUSQ156N).
60
65
70
75
80
85
Pe
r C
en
t
February 2013
20101950 1960 1970 1980 1990 2000 2016Mar
October 2011

90 Macroeconomic Review, April 2016
Monetary Authority of Singapore Economic Policy Group
Initial Views About The Causes Of The Great Recession
The observations about the severity of the recession raise the obvious question: what was the cause of the Great Recession?
In the initial phases of the recession, there was a lot of confusion about the answers to this question. There was a sense of anguish and fear in Washington among policymakers in late 2008, as the signs of dysfunction in financial markets became acute and the decline in economic activity accelerated. That acceleration is evident in Charts 1–2, where we see that the fall in output and employment turned into a free fall a year after the NBER declared that the recession had started. A particularly dramatic moment in the ensuing crisis occurred on 18 Sep 2008, days after the bankruptcy of the long-established and respected investment bank, Lehman Brothers. The senior leadership of the US Congress convened a meeting with the Secretary of Treasury, Hank Paulson, and the Chairman of the Federal Reserve, Ben Bernanke, to discuss their response to the unfolding events. According to Senator Christopher Dodd (Chairman of the Senate Banking Committee at the time), Hank Paulson declared, “Unless you act, the financial system of this country and the world will melt down in a matter of days.” Reportedly, Ben Bernanke followed up by saying, “If we don’t do this [i.e., pass a proposed emergency bill] tomorrow, we won’t have an economy on Monday.” Reflecting on that meeting, Senator Christopher Dodd reported that “There was literally a pause in that room where the oxygen left.”9
Various explanations for the Great Recession began to emerge. I refer to these as the skills Mismatch Hypothesis, the Government Policy Uncertainty Hypothesis and the Aggregate Demand Hypothesis. The remainder of this section considers the first two hypotheses. Although, no doubt, all three hypotheses contain some truth in them, I argue that, according to the evidence, the first two probably played only a small role.10
Mismatch Hypothesis
An exaggerated version of the mismatch hypothesis goes something like this. Many construction workers lost their jobs as a result of the collapse in the housing sector during the Great Recession. The US economy had plenty of jobs, but these were mainly in the health services industry. Bulky former construction workers were simply not good candidates to be nurses. Perhaps the most prominent advocate of the mismatch hypothesis was Narayana Kocherlakota, the President of the Federal Reserve Bank of Minneapolis, who stated in 2010 that “Firms have jobs, but can’t find appropriate workers. The workers want to work, but can’t find appropriate jobs.” This mismatch view had important policy implications. According to Kocherlakota, “Whatever the source [of this mismatch] it is hard to see how the Fed can do much to cure this problem.”
As more data came in, it became apparent that mismatch was not the major factor driving the labour market in the dynamics of the Great Recession. For example, Kocherlakota himself abandoned the mismatch view and became the leading advocate at the Federal Reserve for adopting an aggressively expansionary monetary policy.11 If mismatch had been important, the labour market would have been good to some workers and hard on others. But, in fact, workers of all types were hurt. For example, although workers with more education enjoy lower unemployment on average, workers at all education levels experienced a rise in unemployment during the Great Recession. In fact, the unemployment rate jumped across a broad range of occupation groups during the Great Recession.
Another way of looking at the mismatch issue is to examine the hours of work put in by employees. The average worker in an occupation in which there are a lot of jobs, but few workers qualified to take them, would be expected to be
9 See Public Broadcasting Service (2009).
10
My discussion in this section borrows heavily from Shierholz (2013). 11
See Appelbaum (2014).

Special Features 91
Monetary Authority of Singapore Economic Policy Group
working extra hard. That is, we should see some occupations in which average hours per worker is very high (e.g., nursing) and others in which it is low (e.g., construction). Instead, we see from the data that hours worked is down in 2012 relative to 2007 across almost all industries. The only exception is the legal occupation, but even there, hours worked is up by only around 1%. Under the mismatch hypothesis, firms were held back from hiring because of their inability to find the right type of workers. This implies that wages of some types of workers (the ‘right types’) should have risen sharply while the wages of the types of workers that were in abundant supply should have been falling. Instead, wages of all types of workers were rising at very modest rates in the Great Recession. Average worker productivity rose by 7.5% over the period from 2007 to 2012. This is a modest benchmark for wage growth and all occupations experienced even lower wage growth (after adjusting for inflation). We do not see the soaring wage growth we would expect to see in some occupations if there were significant mismatch in the labour market.
Another way to test the mismatch hypothesis is to simply ask firms why they are not hiring. Since the early 1970s, the National Federation of Independent Business (NFIB), a small business association, has surveyed its members to find out what their ‘top problem’ is. They are asked to select from among the following 10 categories: taxes, inflation, poor sales, finance & interest rates, cost of labour, government regulations & red tape, competition from large businesses, quality of labour, cost/availability of insurance, other. Under the mismatch hypothesis, a large fraction of firms should have selected ‘quality of labour’ as their top problem. Charts 3a and 3b display the time series of the fraction of firms that choose each option as their top problem. Chart 3a shows that in normal times, 20% of firms say that ‘taxes’ are their top problem. ‘Quality of labour’ is usually a smaller problem. When the Great Recession hit, first in late 2007 and then at an accelerated pace in late 2008, ‘quality of labour’ fell in importance and ‘poor sales’ surged beyond all other options as the top problem.
Chart 3a NFIB Survey: Firms’ ‘Top Problem’
Chart 3b NFIB Survey: Firms’ ‘Top Problem’
Source: National Federation of Independent Business
Source: National Federation of Independent Business
Government Policy Uncertainty Hypothesis
Under this hypothesis, it was uncertainty about how policymakers would react to the financial disturbances of 2007 and 2008 that dragged the US economy into the Great Recession. For example, some wondered if Bernanke’s ‘you won’t have an economy on Monday’ remark might be a symptom of panic among policymakers, which might lead to extreme and
unpredictable policy actions. The logic of the policy uncertainty hypothesis is that under these circumstances firms would have adopted a ‘wait-and-see’ attitude before taking a decision that would be hard to reverse later. There is at least superficial support for the policy uncertainty hypothesis. In Q4 2008, the
0
5
10
15
20
25
30
35
2000 2003 2006 2009 2012
% o
f Fi
rms
Taxes
Poor Sales
Finance & Interest Rates
Quality of Labour
2015
Poor saleshas been the big problem, not quality of labour.
0
5
10
15
20
25
30
2000 2003 2006 2009 2012
% o
f Fi
rms
Competition from Large Businesses
Cost/Availabilityof Insurance
Inflation
Government Regulation &
Red Tape
2015
'Regulation' was of lower concern than sales, until 2013.Since then, regulation has begun to exceed 'sales'.
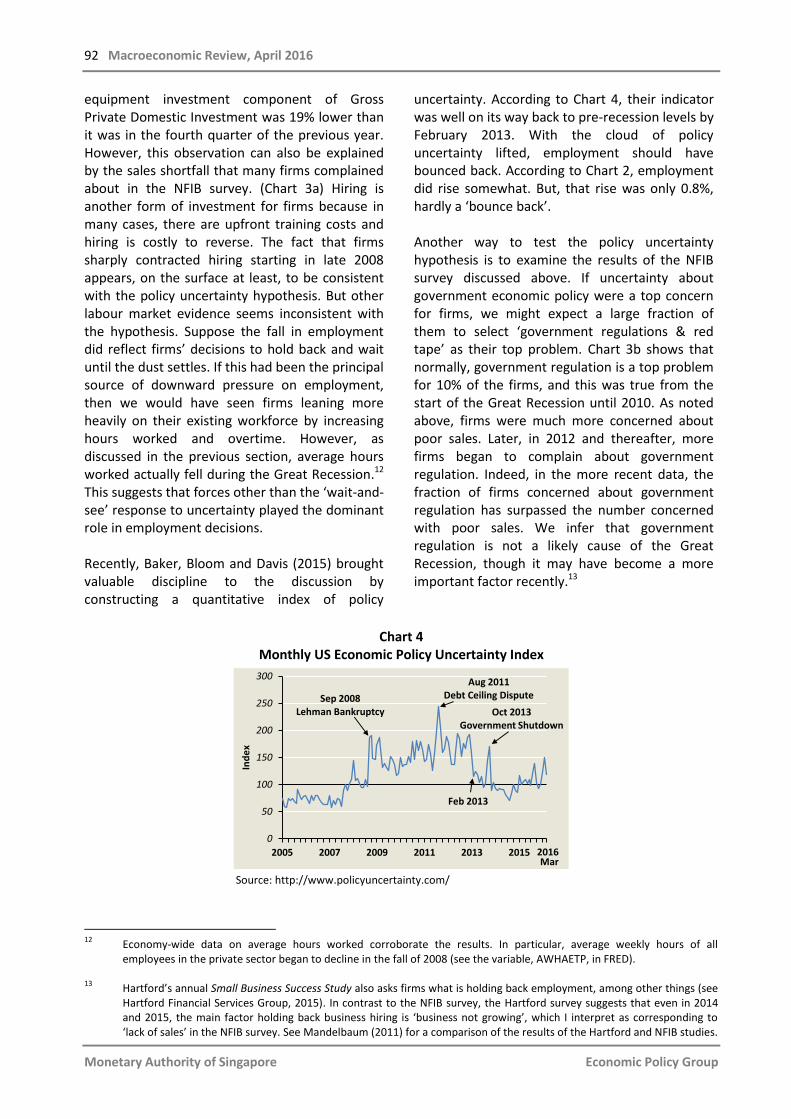
92 Macroeconomic Review, April 2016
Monetary Authority of Singapore Economic Policy Group
equipment investment component of Gross Private Domestic Investment was 19% lower than it was in the fourth quarter of the previous year. However, this observation can also be explained by the sales shortfall that many firms complained about in the NFIB survey. (Chart 3a) Hiring is another form of investment for firms because in many cases, there are upfront training costs and hiring is costly to reverse. The fact that firms sharply contracted hiring starting in late 2008 appears, on the surface at least, to be consistent with the policy uncertainty hypothesis. But other labour market evidence seems inconsistent with the hypothesis. Suppose the fall in employment did reflect firms’ decisions to hold back and wait until the dust settles. If this had been the principal source of downward pressure on employment, then we would have seen firms leaning more heavily on their existing workforce by increasing hours worked and overtime. However, as discussed in the previous section, average hours worked actually fell during the Great Recession.12 This suggests that forces other than the ‘wait-and-see’ response to uncertainty played the dominant role in employment decisions. Recently, Baker, Bloom and Davis (2015) brought valuable discipline to the discussion by constructing a quantitative index of policy
uncertainty. According to Chart 4, their indicator was well on its way back to pre-recession levels by February 2013. With the cloud of policy uncertainty lifted, employment should have bounced back. According to Chart 2, employment did rise somewhat. But, that rise was only 0.8%, hardly a ‘bounce back’. Another way to test the policy uncertainty hypothesis is to examine the results of the NFIB survey discussed above. If uncertainty about government economic policy were a top concern for firms, we might expect a large fraction of them to select ‘government regulations & red tape’ as their top problem. Chart 3b shows that normally, government regulation is a top problem for 10% of the firms, and this was true from the start of the Great Recession until 2010. As noted above, firms were much more concerned about poor sales. Later, in 2012 and thereafter, more firms began to complain about government regulation. Indeed, in the more recent data, the fraction of firms concerned about government regulation has surpassed the number concerned with poor sales. We infer that government regulation is not a likely cause of the Great Recession, though it may have become a more important factor recently.13
Chart 4
Monthly US Economic Policy Uncertainty Index
Source: http://www.policyuncertainty.com/
12
Economy-wide data on average hours worked corroborate the results. In particular, average weekly hours of all employees in the private sector began to decline in the fall of 2008 (see the variable, AWHAETP, in FRED).
13
Hartford’s annual Small Business Success Study also asks firms what is holding back employment, among other things (see Hartford Financial Services Group, 2015). In contrast to the NFIB survey, the Hartford survey suggests that even in 2014 and 2015, the main factor holding back business hiring is ‘business not growing’, which I interpret as corresponding to ‘lack of sales’ in the NFIB survey. See Mandelbaum (2011) for a comparison of the results of the Hartford and NFIB studies.
2005 2007 2009 2011 2013 2015
0
50
100
150
200
250
300
Ind
ex
Sep 2008Lehman Bankruptcy
Feb 2013
Aug 2011Debt Ceiling Dispute
Oct 2013Government Shutdown
2016Mar

Special Features 93
Monetary Authority of Singapore Economic Policy Group
The mismatch and policy uncertainty hypotheses initially loomed large in the minds of analysts. With hindsight, it now seems that they played
at best only a modest role in the dynamics of the Great Recession.14
Questions About The Great Recession
In this section, I discuss the following three questions:
(i) What caused the Great Recession and why has it lasted so long?
(ii) Why did people (including macroeconomists) not predict it?
(iii) What impact did it have on macroeconomics as a discipline? Why Did It Happen?
Conventional wisdom is now converging on a particular narrative about the cause of the Great Recession. In effect, the Great Recession was a ‘perfect storm’ created by the confluence of three factors. Each factor taken by itself would not have caused a major recession, but in combination they were explosive. The first factor was the decline in housing prices that began in the summer of 2007. Whether this was the end of a ‘bubble’ or just an ordinary fluctuation does not matter for the narrative. The second factor was that the financial system was heavily invested in housing-related assets—mortgage-backed securities. The third factor was that the part of the banking system, the shadow banking system, that was invested in housing assets was vulnerable to bank runs.15 These three factors are the essential elements in the following narrative about the Great Recession. The fall in housing prices damaged the assets of the shadow banking system and thereby created the conditions under which a run on the shadow banking system could occur. Alas, a run did occur in the summer of 2007, forcing the shadow banking system to sell its assets at fire
sale prices. This asset decline damaged the whole banking system and hindered its ability to intermediate not just house purchases but investment more generally. With reduced credit, purchases of houses declined and the fall in house prices was reinforced. By reducing household wealth, the fall in house prices induced households to cut back on spending. Seeing a fall in sales, firms pulled back on investment. All these forces reinforced each other, sending the economy into the tail-spin documented above. Why Did It Last So Long?
The conventional view on why the recession lasted so long is that the events described in the previous paragraph reinforced the desire to save, relative to the desire to invest. If markets were efficient, then the risk-adjusted real interest rate would have fallen to balance the demand and supply of savings. According to the conventional view, this required that real interest rates be substantially negative, something that could not be achieved because of the lower bound on the nominal rate of interest and the fact that inflation expectations were anchored at a low level. Because the real interest rate could not fall enough to clear the lending market, something else had to do it instead. That something else was a fall in aggregate output, which allowed lending markets to clear by reducing saving for consumption-smoothing reasons. This is essentially the logic of the Paradox of Thrift analysed in undergraduate textbooks. 16 Consistent with those textbooks, the drop in output arising from this Paradox of Thrift reasoning could in principle last for a long time.
14
I have not considered the idea that the Great Recession was caused by the Federal Reserve keeping the Federal funds rate too low, too long in the early 2000s. For a review of this hypothesis and a critique, see Bernanke (2015).
15
Technically, what happened was a rollover crisis, not a traditional bank run like the ones familiar from movies and pictures from the era of the Great Depression.
16
The Paradox of Thrift argument described in the text lies at the heart of the analysis of the interest rate lower bound in Eggertsson and Woodford (2003).

94 Macroeconomic Review, April 2016
Monetary Authority of Singapore Economic Policy Group
Why Didn't People See It Coming?
Why did people not predict the Great Recession? The emerging consensus is that policymakers were simply not aware of the third factor. They did not realise how big the shadow banking sector was nor how vulnerable it was to runs (see for example, Bernanke, 2010).17 Much of what we know about financial markets comes about as a side-effect of regulation and the shadow banking system was mostly outside the normal regulatory framework. The implication for policy is that policymakers need to be on the alert for the development of a shadow banking system. They must address the vulnerability of intermediation to runs by offering lender-of-last-resort services. The regulatory environment must be designed to address the resulting moral hazard problems. Impact On Macroeconomics
The Great Recession is having an enormous impact on macroeconomics as a discipline, in two ways. First, at its heart, the narrative I described above characterises the Great Recession as the response of the economy to a negative shock in the aggregate demand for goods. This is very much in the spirit of the traditional macroeconomic paradigm captured by the famous IS-LM model, which places demand shocks at the heart of its theory of business cycle fluctuations. Similarly, the Paradox of Thrift argument is also expressed naturally in the IS-LM model. The IS-LM paradigm, together with the Paradox of Thrift and the notion that a shock to aggregate demand could generate a welfare-reducing drop in output, had been largely discredited among professional macroeconomists since the 1980s. But, the Great Recession seems impossible to understand without invoking Paradox of Thrift logic and appealing to shocks in aggregate demand. As a consequence, the modern equivalent of the IS-LM model—the New Keynesian model—has been returned to centre
stage. To be fair, the return of the IS-LM model had already begun in the late 1990s, but the Great Recession dramatically accelerated the process.
The return of the dynamic version of the IS-LM model is revolutionary because that model is closely allied with the view that equilibrium outcomes are not necessarily efficient, so that government interventions might be desirable. The previous macroeconomic paradigm, the Real Business Cycle model, generally adopted the position that equilibria are efficient, so that government intervention is counterproductive.18
The Great Recession has had a second important effect on the practice of macroeconomics. Before it, there was a consensus among professional macroeconomists that dysfunction in the financial sector could safely be ignored in the study of macroeconomics. The idea was that what happens on Wall Street has as little impact on the economy as what happens at the slot machines in Nevada. This idea appeared to receive support from the US experiences in 1987 and the early 2000s, when the economy seemed unfazed by substantial stock market volatility. The idea that financial markets could be ignored in macroeconomics has died with the Great Recession.
Previously, macroeconomics was primarily concerned with the strategy for setting interest rates by the monetary authority, alongside similar questions. Now macroeconomists are also thinking about the financial system and how it should be regulated. This has necessitated the construction of new models. The empirically successful models have generally integrated financial factors into a version of the New Keynesian model, for the reasons discussed above. Much progress on this project has occurred and there is too much to summarise here. One particularly notable set of advances appears in Gertler and Kiyotaki (2015) and Gertler, Kiyotaki and Prestipino (2016). In these papers, banks are modelled as financing
17
That the shadow banking system was of a similar order of magnitude to the traditional banking system is discussed in Geithner (2008).
18
Although in one sense the shift from Real Business Cycles to the New Keynesian model is revolutionary, in another it is not. All the technical advances associated with Real Business Cycle analysis have been absorbed into the New Keynesian model. This includes the economic concepts of a private sector equilibrium, Ramsey equilibrium, time consistency, etc. This also includes model solution and econometric methods.

Special Features 95
Monetary Authority of Singapore Economic Policy Group
long-term assets with short-term liabilities. This mismatch between assets and liabilities captures the essential reason that real-world financial institutions are vulnerable to runs. The model represents a laboratory in which to think precisely about the sort of run narrative—described by
Bernanke (2010) and others—that launched the Great Recession in 2007. Constructing models of this kind is essential for the design of regulatory and other policies that can prevent a recurrence of a disaster like the Great Recession.
References
Appelbaum, B (2014), “A Fed Policy Maker, Changing His Mind, Urges More Stimulus”, The New York Times, January 27, available at http://www.nytimes.com/2014/01/28/business/a-federal-reserve-policy-maker-urges-it-to-do-more.html Baker, S R, Bloom, N and Davis, S J (2015), “Measuring Economic Policy Uncertainty”, NBER Working Paper No. 21633, October. Bernanke, B S (2010), “Statement by Ben S. Bernanke, Chairman, Board of Governors of the Federal Reserve System, Before the Financial Crisis Inquiry Commission, Washington, D.C.”, (URL https://www.federalreserve.gov/newsevents/testimony/bernanke20100902a.pdf). Bernanke, B S (2015), “The Taylor Rule: A Benchmark for Monetary Policy?”, Brookings Institution, (URL http://www.brookings.edu/blogs/ben-bernanke/posts/2015/04/28-taylor-rule-monetary-policy). Christiano, L J, Motto, R and Rostagno, M (2003), “The Great Depression and the Friedman-Schwartz Hypothesis”, Journal of Money, Credit, and Banking, Vol. 35(6), pp. 1119–1197. Christiano, L J and Eichenbaum, M (1992), “Current Real-Business-Cycle Theories and Aggregate Labor-Market Fluctuations”, American Economic Review, Vol. 82(3), pp. 430–450. Christiano, L J, Eichenbaum, M and Trabandt, M (2015), “Understanding the Great Recession”, American Economic Journal: Macroeconomics, Vol. 7(1), pp. 110–167. Eggertsson, G B and Woodford, M (2003), “The Zero Bound on Interest Rates and Optimal Monetary Policy”, Brookings Papers on Economic Activity, pp. 139–233. Geithner, T F (2008), “Reducing Systemic Risk in a Dynamic Financial System”, remarks at the Economic Club of New York, New York City, available at https://www.newyorkfed.org/newsevents/speeches/2008/ tfg080609.html Gertler, M and Kiyotaki, N (2015), “Banking, Liquidity, and Bank Runs in an Infinite Horizon Economy”, American Economic Review, Vol. 105(7), pp.2011–2043. Gertler, M, Kiyotaki, N and Prestipino, A (2016), “Wholesale Banking and Bank Runs in Macroeconomic Modelling of Financial Crises”, International Finance Discussion Papers No. 1156, January. Gordon, R J (2016), The Rise and Fall of American Growth: The U.S. Standard of Living Since the Civil War, Princeton University Press. Hartford Financial Services Group (2015), 2015 Small Business Success Study, December, available at https://www.thehartford.com/sites/the_hartford/files/executive-summary-2015-sbss.pdf

96 Macroeconomic Review, April 2016
Monetary Authority of Singapore Economic Policy Group
Kocherlakota, N (2010), “Inside the FOMC”, speech available at https://www.minneapolisfed.org/news-and-events/presidents-speeches/inside-the-fomc Mandelbaum, R (2011), “Do Small-Business Owners Feel Overtaxed and Overregulated? A Survey Says No”, The New York Times, November 21, available at http://boss.blogs.nytimes.com/2011/11/21/small-businesses-over-taxed-and-over-regulated-a-survey-says-no/
Public Broadcasting Service (2009), Frontline: Inside the Meltdown, documentary available at http://www.pbs.org/video/1082087546/
Shierholz, H (2013), " Is There Really a Shortage of Skilled Workers?”, pp. 143–150 in Palley, T I and Horn, G A (eds.), Restoring Shared Prosperity: A Policy Agenda from Leading Keynesian Economists, CreateSpace Independent Publishing Platform.

Special Features 97
Monetary Authority of Singapore Economic Policy Group
Corporate Governance And The Finance Sector: An Asian Perspective by Randall Morck and Bernard Yeung1
Introduction
The hallmark of a modern economy is a tightly focused specialisation of both people and firms that dramatically boosts productivity. Specialisation requires efficient markets because specialised people and firms, by definition, cannot produce everything they need themselves. They need efficient markets, in which to sell what they make and buy what they need. Efficient capital markets are especially important because revenues almost always come after investments. While a lucky few may win lotteries (including the lottery of birth) and enter the world with enough resources to set themselves up to await cash inflows to come, most need financing. An efficient capital market channels the economy’s collective savings into financing for people and firms with worthwhile investment plans. Distinguishing worthwhile investment plans from crackpot schemes and scams is hard work. Making these distinctions is what an economy’s financial sector is supposed to specialise in. If the financial sector reasonably reliably allocates people’s savings to value-creating investments, people would willingly entrust their savings to financial institutions and markets. Value-creating investments obviously include corporate outlays for productivity-enhancing technology upgrades, but also encompass financing for income-boosting education, financially sound home mortgages, and other ventures that boost the capital
recipient’s income sufficiently to repay principal plus cost of capital. The best way for the financial system to gain savers’ trust is to be trustworthy by faithfully attending to this social purpose. Savers entrust their savings to capital users through financial intermediaries and markets. Governance matters throughout this chain, from corporations which use funds to intermediaries which collect and allocate funds. Ill-governed firms can waste savings, but so can ill-governed banks, investment banks, and financial markets (by taking too big a cut themselves and by misdirecting savings into low return uses). In our view, good governance equates (or ought to equate) with fulfilling this social purpose of trustworthy allocation of funds throughout this chain; and regulators’ task is (or ought to be) designing regulations so that profit maximisation throughout this chain reliably directs the economy's capital to its highest value uses. Some two-thirds of the annual growth of developed economies comes from human capital accumulation and productivity growth, with much of the latter coming from new or rapidly growing firms debuting new technologies (Solow, 1970; King and Levine, 1993a; King and Levine, 1993b). Governments sustain economic growth by providing laws, regulations, and standards that help channel capital allocation towards such uses (Wurgler, 2000).
1 Randall Morck is Stephen A. Jarislowsky Distinguished Professor of Finance and Distinguished University Professor,
University of Alberta Business School; Research Associate, National Bureau of Economic Research; Senior Fellow and Vice President, Asia Bureau of Finance and Economic Research; and Research Fellow, Bank of Canada. Bernard Yeung is Dean and Stephen Riady Distinguished Professor, National University of Singapore Business School; President, Asia Bureau of Finance and Economic Research. The views in this Special Feature are solely those of the authors and should not be attributed to MAS.
Special Feature C

98 Macroeconomic Review, April 2016
Monetary Authority of Singapore Economic Policy Group
This can be challenging because financing has unique information asymmetry and monitoring problems (Hertzel, 2012). Perhaps because these problems are so tenacious, reputations for trustworthiness in allocating people’s savings, once established, seem extraordinarily valuable—both to the markets and institutions that develop those reputations and to the economies in which they operate (Hellmann and Murdock, 1998). Laws, regulations and standards appear to matter in building this trust; that is, in creating ways for corporations, including those in the financial sector, to bind themselves to be trustworthy (La Porta et al., 2002). Less costly and more reliable and timely information transmission appears to be an important means of engendering this trust. The low-cost, reliable and timely crucifixions of malefactors seem to be another. Much discussion of good corporate governance (notably in Asia) stresses the idea of “stewardship”: appeals to agents to serve their stakeholders faithfully and truthfully (Davis et al., 1997). A sense of stewardship is obviously laudable. But we do not rely solely on evoking a sense of stewardship to prevent other forms of malfeasance. Prospective fraudsters, purveyors of shoddy goods, polluters, oppressive employers, and others who would profit by exploiting public trust surely need to know that such things are not meritorious; but we surround them with economic incentives (avoiding fines and jail time). Exhorting people not to do such things by appealing to their better natures does not always work. Top corporate and financial decision-makers likewise need concrete incentives alongside exhortations to good behaviour. Good governance necessarily relies on laws and regulations (and their effective enforcement) to expose and weed out rascals. Sadly, the worst weeds are generally the most resistant to genteel social pressure. Governments generally lack the resources (some may also lack the will) to rake through the dirt to expose and uproot corporate and financial malefactors. Forward-thinking governments thus set up laws and regulations that provide rakes, hoes, and shovels to the investing public in the form of rights to sue malefactors in an independent and well-
functioning judicial system. This empowerment of the public frees government officials from the unpleasant task of identifying and deciding whether or not to prosecute elite corporate and financial insiders. Finally, in high-income economies (including those in Asia), information-intense efficient resource allocation both supports economic development and is supported by economic development. In much of the world (and much of Asia), the focus is the first half of this connection: getting to economic development. This can make current regulations and policies in high-income economies questionable as models. Perhaps the economic histories of high-income economies (especially in Asia) might offer better guidance. Still, policy missteps are inevitable, and governments too are well-served by being well-informed and nimble.
Good Governance
Well-governed corporations are run by specialists in spotting economic opportunities and collecting and organising the talent and capital needed to realise those opportunities. This is a kind of division of labour: individuals, called “executives”, earn their keep by being a bit better than everyone else at foreseeing what economic opportunities will arise, and preparing in advance by amassing funds and skilled people within organisations called “firms”. Middle managers, workers, and investors entrust their future well-being to these executives, who are expected to live up to their grand billing. What could possibly go wrong? Two things stand out. Untalented people could end up making financial and corporate decisions. Or, talented but self-interested people could end up making financial and corporate decisions to advance their personal interests primarily (or only). Neoclassical economics models executives as self-serving. They seek highly paid jobs whether or not they can do them or use whatever decision-making powers they acquire to advance their private interests. Economics then focuses on incentive alignment and setups so that:

Special Features 99
Monetary Authority of Singapore Economic Policy Group
People who lack the talent to be successful executives do best for themselves by finding other work; and
People who do end up making important financial and corporate decisions do best for themselves by fulfilling the trust others place in them.
The workhorse model economists use to think about this is called the principal-agent problem (Fama and Jensen, 1983a). This models laws, regulation and social conventions (including calls for stewardship) increasing or decreasing the alignment of executives’ self-interest with the interests of those who entrust their future prospects to those executives. The parties entrusting their welfare to the executives are called principals and the active, free decision-makers are called agents.2 The whole setup is called an agency problem. Mathematically articulated economic models (e.g., Jensen and Meckling, 1976) tend to focus on top executives as agents and shareholders as principals, but the framework is actually general (e.g., Jensen and Meckling, 1979). Published models also tend to focus on laws and regulations as incentive alignment mechanisms, but social pressure, such as exhortations to stewardship, are also readily incorporated into the framework. Corporate governance studies emerged first in American and British universities (Berle and Means, 1932; Cadbury, 1992) where most large firms have already become very widely held and their investors are small individual shareholders (Morck, Shleifer and Vishny, 1988). Large shareholders might own stakes as large as two or three percent, and top executives typically owned few or no shares in the firms they ran. The principals (investors) were thus relatively weak compared to the agents (CEOs). Understandably, the corporate governance mechanisms of interest were ways of aligning executives’ self-interest with small shareholders’ interests. These included increased executive stock ownership, ways of tying executive pay to growth in shareholder wealth, and hostile take-overs and shareholder rebellions (called proxy fights) as mechanisms for ousting underperforming executives.
Other mechanisms to make executives more concerned about small shareholders’ wealth included fostering the growth of powerful institutional investors that could speak for shareholders, adding more independent directors to boards (and on audit, nomination and compensation committees), enhanced disclosure requirements, independent auditors, and whistle-blower protection (Shleifer and Vishny, 1997). In subsequent years, corporate governance concerns spread to other countries. Many countries are starkly unlike America and Britain, in that most of their large firms have powerful controlling shareholders, often economically and politically powerful tycoons of business families (Morck, 2005). In some, multi-tiered holding company structures (pyramiding), cross-shareholding and super-voting shares let these powerful shareholders control huge constellations of firms by controlling a single firm that, directly or indirectly, rules all the others. In these countries, getting down to the basics of the principal-agent model means asking instead “Who has the decision-making power to subordinate others’ interests to their own?” We suggest that, in such countries, the worrisome agents are the powerful tycoons and families, and the principals needing protection are the small public float shareholders as well as creditors, providers of trade credit, employees and perhaps even professional executives (Morck, 2005; Morck, Wolfenzon and Yeung, 2005). The corporate governance mechanisms of interest are laws, regulations and social pressure that align the self-interest of the strong with the interests of the weak (Djankov et al., 2008). We therefore respectfully suggest that the following sorts of arguments might be relevant to Asia.
2 The word agent is Latin and means doer; principal, from the Latin principalis, means first or original.

100 Macroeconomic Review, April 2016
Monetary Authority of Singapore Economic Policy Group
What Good Governance Is Not
Good governance is often defined too superficially. We take issue with many of these definitions and so, begin by saying what good governance is not. Good governance is not ticking off checklists of independent directors, independent audit committees, and the like. Financial and corporate decision-making that directs the economy’s capital and other resources into their most valuable uses is good governance. Enron checked off every box on such good governance checklists and collapsed, in one of America’s greatest governance scandals. Many countries have enacted international best practice corporate governance laws and regulations, often by cutting and pasting checklists in US regulations, but then did not enforce them. This might be because of general inefficiency in the public sector, pressure from powerful business insiders, or the genuine realisation that cloned US regulations might do more harm than good in Asian economies.
Good governance is also not equivalent to agents keeping promises to use resources in specific predefined ways. Efficient decision-making requires changing course when conditions change. If good governance regulations and laws have kept away the untalented and tamed the rapacious, small investors and other stakeholders can trust agents with decision-making powers to adapt. Good governance is not equivalent to a no-holds-barred maximisation of shareholder value. Allocating the economy’s capital and other resources to their highest value uses requires paying for talent, investing in innovation, and obeying the spirit, as well as the letter, of laws and regulations that convey the government’s standards regarding the environment, human rights, and other public charges. Shareholders are due a competitive risk-adjusted return, but this in no way justifies the abuse of workers, the environment or society in general. This is an often underemphasised feature in every reasonable economic model of agency problems.
What Good Governance Is
Despite all the above arising commonly as definitions, we argue for a back to basics approach, in which good governance is fundamentally about hard-earned trust. If share prices are low and firms have difficulty raising capital, the problem is likely to be market participants’ distrust in the agents running those firms or the financial intermediaries through which they would raise capital. Financial markets are not perfectly efficient, but market sentiment usually has reasons. Investors who distrust the governance of financial institutions and firms seeking capital either demand higher returns (that is, they offer to buy only at lower securities prices, raising the cost of capital) or decline to provide funds altogether (depriving firms of access to their savings entirely). Either way, investments that would make sense in an atmosphere of
greater trust do not happen and the economy is less dynamic. Jobs are not created, raw materials not demanded, and consumers not offered goods that were never made. Corporations and investors see the benefits of establishing trust, and good firms find the means to do so. For example, well-run firms can demonstrate their trustworthiness by paying high dividends, which ill-run firms cannot afford to match (La Porta et al., 2000; Morck and Yeung, 2005). In economic jargon, this is a “stable separating equilibrium”, in which trustworthy capital users can make “credible commitments” to be trustworthy while untrustworthy capital users cannot.

Special Features 101
Monetary Authority of Singapore Economic Policy Group
Such separating equilibria are not always easy to get going. Channelling capital to genuinely promising start-ups and away from unpromising ones cannot rely on past dividends. In the US, the reputations of well-governed venture capital funds that back high-tech start-ups come into play instead (Gompers and Lerner, 2004). Many other countries lack comparably credible ways of separating wheat from chaff. These generally take the form of state-financed venture capital programmes, and most have very low success rates (Gompers and Lerner, 2004). Government bureaucrats in most countries generally have very poor track records for picking winners (Krueger, 1974). The government’s job is to set up corporate governance rules and regulations that ensure that trustworthy agents, that is, those both able and willing to direct resources to their highest value uses, can and do distinguish themselves from untrustworthy ones. Successful separation imposes costs that low-quality agents cannot pay, while keeping costs imposed on trustworthy agents reasonable (Spence, 1973). How this can work clearly differs across countries. In America and Britain, where a key agency problem arises between top executives and shareholders of diffusedly-owned corporations, regulations that inform and empower shareholders—disclosure requirements, majority voting for directors, links between executive pay and shareholder valuation, and the like—make sense. In countries where different agency conflicts matter more, different solutions are needed. In many Asian economies, major firms are controlled by wealthy business families (Claessens et al., 2000). These shareholders are already well informed and powerful, and do not generally need government help in becoming better informed or more powerful. They are not powerless principals, but are free decision-makers—that is, agents. In contrast, small shareholders genuinely are relatively powerless principals. In such economies, binding limitations on controlling shareholders’ freedom of action can
make sense as ways of guaranteeing their trustworthy behaviour—or of discouraging those who are not trustworthy from seeking public equity capital. Such limitations include rules against self-dealing, mandatory coat-tail provisions in corporate takeovers, mandatory majority-of-the-public float votes for related transactions, director fiduciary duties to non-controlling shareholders only, and the like (Djankov et al., 2008). In these economies, where controlling shareholders are powerful, stronger labour rights may well be helpful in achieving the needed separating equilibrium. Well-run firms might be able to reward talented employees in ways that ill-run firms cannot match. Well-enforced high environmental standards might likewise create a separating equilibrium by driving out ill-run businesses that can only survive by using obsolete high-pollution technologies. Obviously, laws and regulations cannot reduce agents to marionettes, whose strings are pulled by lawyers and regulatory compliance officers. In an efficient economy, agents—whether top executives in widely held Anglo-American firms or controlling shareholders in Asian firms—are in charge because they are talented and trustworthy. They are, at a minimum, marginally better than others in fulfilling Keynes’ charge to “defeat the dark forces of time and ignorance that envelope our future”. To fulfil that charge, they need to be able to get on with running the firm. Micromanagement by government, lawyers, board, and the like, is unnecessary. But the countervailing downside agents must accept in return for this freedom of action: when they fail to perform, they have to accept ouster, economic losses, and social and legal sanction for overtly negligent or felonious actions. The fear of these downsides should activate both self-selection (untalented agents will not apply for positions entailing responsibility for other people’s money) and market selection (firms run by untrusted agents, deprived of cheap capital, shrink and die).

102 Macroeconomic Review, April 2016
Monetary Authority of Singapore Economic Policy Group
Stakeholders And Shareholders
Still governance practices seem to be small shareholders focused. The logic? A corporation is a legal person with duties to multiple constituents: public shareholders, controlling shareholders, top executives, current and retired workers, banks, bond-holders, and suppliers granting trade credit, municipalities and national governments (taxes and employment). All of these assorted interested parties, along with environmentalists and future generations, qualify as stakeholders, in that their interests are, to varying extents, affected by the decisions the firm’s agents make. Some stakeholders are better positioned to pay attention to agents’ decision-making, and to its impact on their welfare. Banks, bondholders and other creditors can watch companies to ascertain that their loans will be repaid (Morck and Nakamura, 1999; Morck, Shivdasani and Nakamura, 2000). Organised labour can likewise monitor agents’ decisions, and press for the protection of workers’ jobs and wages and for retirees’ pensions. Newspapers and other media boost their own revenues by exposing frauds and incompetence; such coverage contributes to corporate monitoring (Dyck, Moss and Zingales, 2013).3 But the failure of such stakeholders to coalesce into unified classes limits their influence. Different creditors’ interests can correlate negatively with other creditors’ interests. Different labour subgroups can be at odds. Retirees want well-funded pensions, senior employees want high wages, junior employees want no lay-offs, and job market entrants want jobs. Tax ministries want clear reckonings of profits (Desai, Dyck and Zingales, 2007) but other branches want jobs. Shareholders’ interests differ fundamentally from those of other stakeholders in a way highlighted
by Fama and Jensen (1983a, 1983b, 1985). Other stakeholders’ claims on the firm are, for the most part, fixed. Creditors are owed fixed prearranged repayments of interest and loan principal. Workers and employees are due fixed predetermined wages and benefits. Local governments are owed fixed pre-assessed property taxes, and short-term oriented national governments’ income tax revenue depends on current earnings, not future earnings. Such claims are called contractual claims: legal contracts which the firm must honour or invite lawsuits or bankruptcy proceedings. Shareholders’ claims, in contrast, are residual claims and they are most sensitive to flagging firm performance. Shareholders get whatever is left over after all contractual claimants have been paid in full. Firms with cash-flow shortfalls cut or skip dividends first. Only if circumstances deteriorate far more do firms seek to reorganise their obligations to their creditors, workers, suppliers, and customers, often under bankruptcy (or the immediate threat of bankruptcy). Shareholders’ sensitivity to poor performance justifies shareholder-focused corporate governance. Thus, shareholder-focused corporate governance “uses” shareholders as an alarm system to protect all other stakeholders, an important aspect of governance that should not be overlooked. Shareholders are like canaries in mines. That a canary falling silent causes huge concern doesn’t mean we run mines in the interests of canaries, or think canaries are more important that miners. We are merely using both canaries’ silence and shareholders’ squeals of outrage as early warning alarms. This logic is correct given its assumptions, but may go too far for several reasons.
3 Encouraging a free and independent business press helps create the separating equilibrium discussed above, while a
controlled press or a press captured by special interests makes it difficult for investors to separate trustworthy from untrustworthy governance, and leads to a pooling equilibrium in which investors trust no one very much. It might be argued that a controlled press better encourages trust, and therefore capital formation, by curtailing coverage of scandals that would undermine public trust in the system. Empirical results support the former logic and undermine the latter. Dyck, Volchkova and Zingales (2008) link Russia’s controlled press to its financial underdevelopment, suggesting that a separating equilibrium is less likely to emerge in such economies.
Special Features 103
Monetary Authority of Singapore Economic Policy Group
First, the claims of creditors, labour, and government are not perfect contractual claims. Firms can reduce the value of their outstanding debt securities by taking on excessive risk. The option value associated with higher risk can lift share prices and depress debt prices. In this scenario, creditors are residual claimants, at least to an extent. If firms cut wages or retirement benefits, or cut jobs, in order to boost the share price, labour is effectively made the residual claimant. Second, shareholders valuations can rise and fall with market bubbles and crashes (Kindleberger, 1978; Aliber and Kindleberger, 2015). These phenomena may well reflect changing levels of trust, but might also reflect waves of buying and then waves of selling by uninformed noise traders. Recent work in behavioural finance highlights all manner of deviations from rationality in share valuations. Shares exhibit momentum—in the short term, shares can react oddly gradually to things like news in earnings announcements. Shares also exhibit mean reversion—high share prices predict low returns over the next decades and low share prices predict high returns over the same horizon. These and other well-documented forms of investor behavioural biases and irrationality distort share prices (Shleifer, 2000), providing grounds for questioning the reliability of public shareholders as alarm systems.4 Third, the “watchers” that we rely on to raise the alarm may themselves have governance problems. We rely on institutional investors, auditors, analysts, and sophisticated private investors to raise the alarm and demand change when the price drops because of bad decisions, rather than bad luck. All of these “watchers” are run by mortal people, who may be as talentless or self-interested as the worst agents running firms. The 2008 financial panic is attributed to governance problems in financial sector corporations and to inadequate financial sector regulators.
Shareholder-focused corporate governance would use shareholders’ cries as an early warning alarm. But these considerations suggest that the alarm might go off when it should not and fail to go off when it should. Moreover, the first line responders can be asleep on the job or react incorrectly to the alarm. However, unplugging an alarm system that occasionally misfires may be worse. An imperfectly functioning alarm system may be better than nothing.
Imperfect Government
The laws and regulations, regulators, and governments cannot be perfect. They need only be good enough to let well-run firms credibly distinguish themselves from ill-run firms to establish the separating equilibrium the financial sector and savers need. That separating equilibrium then allows the economy’s resources, including its savings, to be allocated efficiently. The imperfections of government need attention everywhere. Government bureaucracies are run by officials who act as agents for citizens. Political parties are run by politicians who act as agents for voters. Even some unopposed ruling parties, such as the Communist party of China, worry about their legitimacy in the eyes of the public. In both government and politics, agency problems abound because officials and politicians can (if rarely) be imperfect, untalented, and worse, corrupt. This makes overreliance on monitoring and intervention by officials and political leaders a problematic approach to resolving governance problems in the private sector in many countries. Indeed, even well-intentioned, competent and honest officials may have difficulty challenging a powerful tycoon, a well-connected business family, or a national champion firm. Perhaps because of long histories of such disasters, developed economies increasingly rely
4 Oddly, perhaps the most common allegation (by CEOs), shareholders’ purported fixation on short-term profitability, is the
only form of shareholder irrationality lacking clear empirical support. Rather, the data indicate that shareholders highly value long-term investments by firms in the US (McConnell and Muscarella, 1985; Chan, Martin and Kensinger, 1990; Chan, Lakonishok and Sougiannis, 2001; Hall, Jaffe and Trajtenberg, 2005 and others) and by European firms without controlling shareholders (Hall and Oriani, 2006). Foreign institutional investors acted more like long-term investors than either Korean institutional investors or Korean individual investors in 1997 (Choe, Kho and Stulz, 1999).

104 Macroeconomic Review, April 2016
Monetary Authority of Singapore Economic Policy Group
on private litigants, the media, and (more recently) legally protected whistle-blowers. By committing in advance to protect these private actors, and to let an independent judiciary protect entrenched constitutional freedoms, officials and politicians can stand aside. Having no power to intervene, they cannot be blamed. Once exposed to sunlight, the problem can mend, rather than be left hidden to fester. Concerned officials and politicians might express regret about damage to powerful interests, but this is something over which they have no influence.
Stewardship
Many qualifications must surround the residual versus contractual claimant delineation and concerns about the reliability of shareholders, as early warning alarms are valid. This leads thoughtful policy advisors to contemplate a stewardship or stakeholder model of corporate governance. Germany is one paradigmatic model of stewardship capitalism. Japan is another. Both economies prospered through the second half of the 20th century, so the development of their institutions deserves study. To defeat the threat of democracy, Chancellor Otto von Bismarck laid the foundations of worker involvement in corporate governance in 19th century Germany. If workers could vote for some of their firms’ directors, perhaps they would stop agitating for the right to vote for government leaders. In the mid-1930s, the German chancellor greatly extended the stakeholder model, stripping small shareholders of their voting rights and assigning director duties to all stakeholders, notably the Reich and its Führer (Fohlin, 2005). After World War II, the stakeholder system continued. Several other European countries have enacted legislation letting workers vote for a few directors, though only Austria has a system approaching Germany’s, in scope and depth. Japan is sometimes advanced as another stakeholder paradigm. Its assignment of director duties is (perhaps intentionally) vague, leaving managers largely free to run the firm as they will,
though firms dependent on continual bank credit need to acknowledge creditors’ interests from time to time (Morck and Nakamura, 1999). The end result may be something approximating a stewardship model, though this is far from clear. Despite its provenance, the German model attracts substantial support from interest groups with progressive agendas. This is understandable. Given their privileges, perhaps tycoons, wealthy families, and corporate executives, and managers ought to be charged with acting for the long-term benefit of society—creditors, employees, retired employees, consumers, suppliers, the environment, the state, and so on. Perhaps government officials, state-owned enterprises’ (SOE) managers, and others entrusted with major economic decisions should also have such broad legal duties. A legal duty of all key decision-makers to all stakeholders seems an entirely valid and progressive reform. The problem with this argument is revealed by the logical device of reductio ad absurdum. If an agent (decision-maker) has a legal duty to all stakeholders, what is she to do if two stakeholders have opposing interests? If she acts for one, she acts against the other, who can sue her in court (if stakeholder rights are enshrined in law). Fear of litigation would surely paralyse decision-making. Interwar Germany resolved this by making directors’ duty to the Führer paramount (the so-called Führerprinzip). Post-war Germany makes advancing the interests of one stakeholder a legal defence against challenges by other stakeholders. This is criticised as leeway to run the firm in the interests of its managers, in that any decision beneficial to management can be justified as beneficial to one stakeholder or another. Responsibility to all becomes responsibility to none. As a practical matter, conflicts of interest between stakeholders abound, and every decision-maker cannot be responsible for the interests of everyone else in the economy. Rather, political and economic power is generally organised through what we call “separation of assignment”. Specific government bodies are assigned to produce specific public goods and services, protect specific civil rights, or effect
Special Features 105
Monetary Authority of Singapore Economic Policy Group
specific government policies. In Anglo-American corporate governance, top executives (with many qualifications) are tasked with maximising shareholder wealth. This lets people specialise in advancing specific social goals, for the efficient allocation of resources by corporations is surely one of many social goals. To the extent that the system actually works, corporate executives advance their private interests by improving economic efficiency, while labour lawyers, threatening litigation under the country’s labour laws, advance their private interests by protecting employees, and environmental lawyers, using other laws as weapons, protect the environment. Of course, this requires yet other well-developed institutions—notably the rule of law and an efficient judicial system.
As Nobel Laureate Jan Tinbergen (1952) showed, the number of policy instruments must match the number of policy objectives. If promoting each discernible stakeholder is a legitimate public policy goal, then the government needs one policy instrument for each stakeholder class. These might include policies to encourage honest profit-making alongside policies to protect workers, consumers, the environment, and so on. This leaves unset the weights assigned to each policy goal. Democracies let median voters set and reset the weights on policy goals, subject to constraints enshrined in constitutions. Other countries entrust this to elites. The separation of assignments is seldom perfectly clean, and even the most benevolent governments make mistakes. Appealing to the goodness of people’s hearts may well mitigate such problems, but this too can fail. Some hearts are larger than others.
Developing Good Governance In Developing Asia
The Panic of 2008 has heightened doubts on governance in the West and its brands of capitalism. Manias and panics have been recurring phenomena in stock markets since shortly after the Western world’s first modern stock market self-organised in early 17th century Amsterdam. Despite these episodes, and some even argue because of them, the free market economies of America, Europe and developed Asia sustain the highest living standards in the world. The Panic of 2008 provides clear evidence of their system’s imperfections, but developing Asia still has no alternative. Communism and interwar dictatorial systems failed, and no third way (including Market Socialism with Chinese Characteristics) has yet lifted a major country to high-income status. Capitalism remains the worst economic system, except all the others. Despite episodic scandals and crises, corporate governance and capital allocation in the US, UK, and other high-income economies have been “good enough” to sustain their high-income status. What works in the West (or in developed Asia) may not work in developing Asia. Copying high-income countries’ current institutions may well be inappropriate because all had very
different institutions when they first became high-income countries. Copying their historical institutions might also be inappropriate because their starting points were quite different—though basics like investing in education, public health and basic infrastructure early on may be a universal experience. The rule of law, corruption-free government, and various financial rules and regulations came in different sequence, more or less gradually, and more or less completely in today’s high-income economies. Formulating a standardised path from low to high-income status is one of the greatest challenges in economics, and one the field has yet to solve. There are commonalities to the end point. High income economies’ sustained growth relies on the passably accurate allocation of capital, labour, and other resources to value-creating investments—typically innovations. There are also commonalities to the starting point. Low-income economies generally have opaque and illiquid markets for products, labour and capital. Capital markets may consist of little more than providing financing for one’s relatives or neighbours. Banks might take in deposits, but

106 Macroeconomic Review, April 2016
Monetary Authority of Singapore Economic Policy Group
lend only to the government and members of a tiny elite. Rule of law, if it exists at all, primarily protects an elite. Many economies start developing, growing rapidly for a decade or two, and then stall in the so-called “Middle-Income Trap”. This situation is thought to characterise much of Latin America and the Middle East. These countries have poorly functioning capital, labour, and product markets and big business sectors largely controlled by elitist politically powerful families—the only agents meaningfully protected by the rule of law. Wealth, government services, and market access are limited to these elites, and largely unavailable to most of the population. Middle-Income Trap economies are always developing, but never develop. To join the high-income world, Asian developing economies must rise from low-income status and get past this Middle-Income Trap. High-income economies contain all sorts of institutions that keep markets deep and transparent enough to let investors separate sound from unsound investments sufficiently accurately and enough of the time to channel resources tolerably accurately to their best uses. The list of institutions that matter is too long to write out. It includes abeyances, accelerated depreciation, acceptance markets, accounting standards, actuarial standards, analyst reputations, annual reports, and many more starting with an “A”. Comparably lengthy lists begin with the other letters. These complex dynamic self-organising systems were not the work of central planners. Rather, they arose endogenously. Problems arose, and different solutions were tried. Some solutions faded away and others became institutions. The systems in use in today’s high-income countries are clearly imperfect, but work “well enough”. What will work best for developing Asian economies remains to be seen. Government nonetheless has an important enabling role. Public schools and universities give people the skills they need to devise, implement, and improve possible solutions. Education generates accountants, analysts, annual report readers, arbitrageurs who adjust prices after
announcements of material inside information, and so on. Laws and regulations matter only if lawyers, regulators, and regulated decision-makers are educated and socialised to implement and obey. Middle-Income Traps seem to trip economies whose governments fail in these sorts of enabling roles. Governments, too, have agency problems. The agents are those who pull the levers of power and the principals are the general population. If the agents act for themselves (or their powerful families), rather than for the general citizenry, growth can slow or stall, even as firms run by the elite flourish (Pritchett and Summers, 2014). Exhortations to maintain the purity of their purpose, or to strictly obey rules and regulations are likely to be inadequate. Agents working in government are possessed of the same human nature as others, and helping family and friends is a deep part of human nature. Sure and effective penalties for such entirely human behaviour seem necessary. That is, the key building block seems to be government that itself obeys the rule of law. Institutions can become self-reinforcing. This can aid development: stronger self-selection and selection pressure strengthens corporate governance, which in turn strengthens selection and self-selection forces. This positive feedback loop seems to have arisen in today’s high-income countries around the times each experienced its economic take-off—that is, its era of sustained rapid development. But it can equally easily lock a country into a Middle-Income Trap: weaker self-selection and selection pressure let poor corporate governance persist, which further weakens selection and self-selection forces. Rajan and Zingales (2003), Morck, Wolfenzon and Yeung (2005) and others worry that these sorts of destructive feedback loops can become profoundly self-stabilising and can be very hard to break out of once in place.

Special Features 107
Monetary Authority of Singapore Economic Policy Group
Conclusion
A vibrant and dynamic economy relies on an efficient financial sector to channel the economy’s collective savings into value-increasing investments by firms and people. Efficiency turns on the financial sector’s ability to distinguish worthwhile investment plans from the rest. This distinction is possible if fund users with good investments can credibly signal their honesty and competence. Credibility arises if others cannot afford to send like signals. Thus, the essence of corporate governance is not regulations that enforce uniformity in incentive alignment practices or disclosure requirements, but regulations that force players to admit to their differences. Government policies can encourage this by imposing regulations that separate high- from low-quality capital users. For example, well-designed mandatory disclosure rules with large penalties for falsification impose costs on everyone, but an unacceptably high cost on low-quality firms posing as high-quality ones. Precise details vary across countries. Regulations in the US and the UK emphasise forcing powerful executives to make enforceable commitments to their firms’ numerous but individually relatively powerless shareholders. Regulations in economies whose large firms have powerful controlling shareholders force those people to make commitments to minority shareholders and others. The commonality is that the powerful decision-makers, or agents, are constrained to let less powerful people participate. The “right” rules, regulations, and governance practices are thus fundamentally similar, but the details depend on the country’s other institutions. The ultimate public objective is thus uniform: shaping rules and regulations so the financial sector fulfils its social purpose of reasonably reliably allocating people’s savings to value-creating investments, so that people willingly entrust their savings to financial institutions, corporations, and markets. This accomplished, the economy can continually create and deploy innovations that continually raise productivity and living standards.
In most developing Asian economies, corporate control is often in the hands of powerful tycoons, rich business families, or generically corporate elites. Given their great power, calls for them to accept a duty of stewardship, of using their power to advance the general good, are natural and even laudable. However, there are reasons to be sceptical. Different stakeholders within an economy have different, and often diametrically opposed, interests. Stewardship models give scant guidance about which stakeholder to steward when multiple stakeholders’ interests collide. Alternating across different stakeholders is no solution because every decision will have one stakeholder whose interests parallel those in control. By selecting the appropriate stakeholder to steward, the controlling tycoon, family or corporate elite can de facto always act in their own interests. Given multiple objective functions (each representing the interests of a distinct class of stakeholders), Nobel Laureate Jan Tinbergen (1952) argues for a separation of assignment: the number of government policy instruments must match the number of policy objectives. This is most naturally accomplished by establishing a distinct policy instrument to advance the interest of each stakeholder class. Banking regulations and bankruptcy laws are a policy instrument that empowers banks and creditors to defend their interests. Labour laws empower unions and individual workers to defend their interests. Environmental regulations empower environmentalists. Maximising firm value is then relegated to managers or tycoons. Courts provide forums where conflicting stakeholder interests vie against each other, so the rule of law and a high degree of judicial efficiency are also important. Governments, weighing popular support for each stakeholder class, assign de facto weights to the various policy interests by limiting or expanding the strength of each policy instrument.

108 Macroeconomic Review, April 2016
Monetary Authority of Singapore Economic Policy Group
References
Aliber, R Z and Kindleberger, C P (2015), Manias, Panics and Crashes: A History of Financial Crises, Seventh Edition, Palgrave Macmillan: New York. Berle, A and Means, G (1932), The Modern Corporation and Private Property, Transaction Publishers. Cadbury, A (1992), The Cadbury Report, Institute of Internal Auditors, London. Chan, S H, Martin, J D and Kensinger, J W (1990), “Corporate Research and Development Expenditures and Share Value”, Journal of Financial Economics, Vol. 26(2), pp. 255–276. Chan, L, Lakonishok, J and Sougiannis, T (2001), “The Stock Market Valuation of Research and Development Expenditures”, Journal of Finance, Vol. 56(6), pp. 2431–2456. Choe, H, Kho, B and Stulz, R M (1999), “Do Foreign Investors Destabilize Stock Markets? The Korean Experience in 1997”, Journal of Financial Economics, Vol. 54(2), pp. 227–264. Claessens, S, Djankov, S and Lang, L H P (2000), “The Separation of Ownership and Control in East Asian Corporations”, Journal of Financial Economics, Vol. 58(1–2), pp. 81–112. Davis, J H, Schoorman, D F and Donaldson, L (1997), “Toward a Stewardship Theory of Management”, The Academy of Management Review, Vol. 22(1), pp. 20–47. Desai, M A, Dyck, A and Zingales, L (2007), “Theft and Taxes”, Journal of Financial Economics, Vol. 84(3), pp. 591–623. Djankov, S, La Porta, R, Lopez-de-Silanes, F and Shleifer, A (2008), “The Law and Economics of Self-dealing”, Journal of Financial Economics, Vol. 88(3), pp. 430–465. Dyck, A, Volchkova, N and Zingales, L (2008), “The Corporate Governance Role of the Media: Evidence from Russia”, Journal of Finance, Vol. 63(3), 1093–1135. Dyck, A, Moss, D and Zingales, L (2013), “Media versus Special Interests”, Journal of Law & Economics, Vol. 56(3), 521–553.
Fama, E and Jensen, M (1983a), “Agency Problems and Residual Claims”, Journal of Law & Economics, Vol. 26(2), 327–349. Fama, E and Jensen, M (1983b), “Separation of Ownership and Control”, Journal of Law & Economics, Vol. 26(2), 301–325. Fama, E and Jensen, M (1985), “Organizational Forms and Investment Decisions”, Journal of Financial Economics, Vol. 14(1), pp. 101–119. Fohlin, C (2005), “The History of Corporate Ownership and Control in Germany”, pp. 223–281, in Morck, R (eds.), A History of Corporate Governance around the World: Family Business Groups to Professional Managers, University of Chicago Press.
Gompers, P and Lerner, J (2004), The Venture Capital Cycle, MIT Press.

Special Features 109
Monetary Authority of Singapore Economic Policy Group
Hall, B H, Jaffe, A and Trajtenberg, Manuel (2005), “Market Value and Patent Citations”, Rand Journal of Economics, Vol. 36(1), pp. 16–38. Hall, B H and Oriani, R (2006), “Does the Market Value R&D investment by European firms? Evidence from a Panel of Manufacturing Firms in France, Germany and Italy”, International Journal of Industrial Organization, Vol. 24(5), pp. 971–993.
Hellmann, T F and Murdock, K C (1998), “Financial Sector Development Policy: The Importance of Reputational Capital and Governance”, pp. 269–323, in Sabot, R and Skékely, I (eds.), Development Strategy and Management of the Market Economy Volume 2, Clarendon Press Oxford. Hertzel, R L (2012), The Great Recession: Market Failure or Policy Failure?, Cambridge University Press. Kindleberger, C P (1978), Manias, Panics, and Crashes: A History of Financial Crises, Basic Books, New York. Jensen, M and Meckling, W H (1976), “Theory of the Firm: Managerial Behavior, Agency Costs and Ownership Structure”, Journal of Financial Economics, Vol. 3(4), pp. 305–360. Jensen, M and Meckling, W H (1979), “Rights and Production Functions: An Application to Labor-managed Firms and Codetermination”, The Journal of Business, Vol. 52(4), pp. 469–506. King, R G and Levine, Ross (1993a), “Finance and Growth: Schumpeter Might be Right”, Quarterly Journal of Economics, Vol. 108(3), pp. 717–737. King, R G and Levine, Ross (1993b), “Finance, Entrepreneurship and Growth: Theory and Evidence”, Journal of Monetary Economics, Vol. 32(3), pp. 513–542. Krueger, A O (1974), “The Political Economy of the Rent-Seeking Society”, American Economic Review, Vol. 64(3), pp. 291–303. La Porta, R, Lopez-de-Silanes, F, Shleifer, A and Vishny, R (2000), “Agency Problems and Dividend Policies around the World”, Journal of Finance, Vol. 55(1), pp. 1–33. La Porta, R, Lopez-de-Silanes, F, Shleifer, A and Vishny, R (2002), “Investor Protection and Corporate Valuation”, Journal of Finance, Vol. 57(3), pp. 1147–1170. McConnell, J J and Muscarella, C J (1985), “Corporate Capital Expenditure Decisions and the Market Value of the Firm”, Journal of Financial Economics, Vol. 14(3), pp. 399–422. Morck, R, (eds. 2005), A History of Corporate Governance Around the World: Family Business Groups to Professional Managers, University of Chicago Press. Morck, R, Shleifer, A and Vishny, R (1988), “Alternative Mechanisms for Corporate Control”, NBER Working Paper No. 2532, March.
Morck, R, Nakamura, M and Shivdasani, A (2000), “Banks, Ownership Structure, and Firm Value in Japan”, Journal of Business, Vol. 73(4), pp. 539–567. Morck, R and Nakamura, M (1999), “Banks and Corporate Control in Japan”, Journal of Finance, Vol. 54(1), pp. 319–339.
110 Macroeconomic Review, April 2016
Monetary Authority of Singapore Economic Policy Group
Morck, R, Wolfenzon, D and Yeung, B (2005), “Corporate Governance, Economic Entrenchment, and Growth”, Journal of Economic Literature, Vol. 43(3), pp. 655–720. Morck, R and Yeung, B (2005), “Dividend Taxation and Corporate Governance”, Journal of Economic Perspectives, Vol. 19(3), pp. 163–180. Pritchett, L and Summers, L (2014), “Asiaphoria Meet Regression to the Mean”, NBER Working Paper No. 20573, October. Rajan, R and Zingales, L (2003), Saving Capitalism from the Capitalists: Unleashing the Power of Financial Markets to Create Wealth and Spread Opportunity, Princeton University Press. Shleifer, A (2000), Inefficient Markets: An Introduction to Behavioral Finance, Oxford University Press. Shleifer, A and Vishny, R (1997), “A Survey of Corporate Governance”, Journal of Finance, Vol. 52(2), pp. 737–783. Solow, R M (1970), Growth Theory: An Exposition, Oxford University Press. Spence, M (1973), “Job Market Signaling”, Quarterly Journal of Economics, Vol. 87(3), pp. 355–374. Tinbergen, J (1952), On the Theory of Economic Policy, North-Holland Publishing Company. Wurgler, J (2000), “Financial Markets and the Allocation of Capital”, Journal of Financial Economics, Vol. 58(1–2), pp. 187–214.


112 Macroeconomic Review, April 2016
Monetary Authority of Singapore Economic Policy Group
Statistical Appendix Table 1: Real GDP Growth by Sector
Table 2: Real GDP Growth by Expenditure
Table 3: Labour Market (I)
Table 4: Labour Market (II)
Table 5: External Trade
Table 6: Non-oil Domestic Exports by Selected Countries
Table 7: Consumer Price Index
Table 8: MAS Core Inflation
Table 9: Balance of Payments – Current Account
Table 10: Balance of Payments – Capital & Financial Accounts
Table 11: Exchange Rates
Table 12: Singapore Dollar Nominal Effective Exchange Rate Index
Table 13: Domestic Liquidity Indicator
Table 14: Monetary
Table 15: Fiscal

113
Monetary Authority of Singapore
TABLE 1: REAL GDP GROWTH by Sector
Period Total
Manu-
facturing
Finance
& Insur-
ance
Business
Services
Const-
ruction
Wholesale
& Retail
Trade
Accom &
Food
Services
Transpor-
tation &
Storage
Info &
Comms Total
Manu-
facturing
Finance
& Insur-
ance
Business
Services
Const-
ruction
Wholesale
& Retail
Trade
Accom &
Food
Services
Transpor-
tation &
Storage
Info &
Comms
Year-on-Year % Change Seasonally-adjusted Quarter-on-Quarter Annualised % Change
2014 3.3 2.7 9.1 1.6 3.5 2.1 1.7 2.6 7.0
2015 2.0 -5.2 5.3 1.5 2.5 6.1 0.2 0.0 4.2
2014 Q1 4.6 9.6 7.5 2.9 9.1 0.5 3.5 6.4 4.7 1.4 4.1 -0.7 -0.3 17.5 -6.3 6.7 0.2 6.6
Q2 2.6 1.4 5.9 1.4 3.3 2.4 0.7 3.0 6.0 1.5 -5.2 1.2 2.4 -12.5 8.0 -1.3 1.0 9.5 Q3 3.1 1.7 10.5 0.4 1.7 3.8 0.9 1.0 8.6 2.0 -2.4 8.9 -2.9 1.4 4.8 -0.1 -0.4 13.7 Q4 2.8 -1.2 12.5 1.6 0.2 1.9 1.7 0.4 8.6 6.9 0.4 46.3 7.4 -1.9 1.5 1.9 1.5 3.9
2015 Q1 2.7 -2.9 8.1 2.4 -1.6 5.7 -0.3 1.3 5.2 0.2 -3.5 -15.3 2.0 6.7 9.0 -2.0 2.3 -4.2 Q2 1.7 -5.2 6.6 0.6 3.6 5.5 -1.1 -1.0 5.8 -1.6 -13.8 -4.2 -3.2 7.7 7.0 -3.9 -6.3 10.3 Q3 1.8 -6.0 4.6 2.0 3.0 6.4 1.1 0.4 2.5 2.3 -6.0 0.9 2.5 0.2 7.9 8.8 3.7 0.7 Q4 1.8 -6.7 2.4 0.8 4.9 6.8 0.9 -0.9 3.3 6.2 -4.9 34.1 1.8 6.0 3.7 1.0 -2.6 6.4
Source: Singapore Department of Statistics
TABLE 2: REAL GDP GROWTH by Expenditure Year-on-Year % Change
Period Total
Demand
Domestic Demand Exports of Goods
& Services
Imports of Goods
& Services Total Consumption Gross Fixed Capital Formation
Total Private Public Total Private Public
2014 3.2 0.2 1.7 2.2 -0.1 -2.6 -5.2 10.4 4.3 3.9
2015 2.0 0.5 4.9 4.5 6.6 -1.0 -2.2 3.8 2.5 2.1
2014 Q1 6.1 0.8 -1.2 2.0 -10.1 -0.2 -3.7 14.9 8.3 8.5 Q2 3.2 2.9 4.4 2.2 15.2 -2.6 -5.4 12.4 3.4 4.5
Q3 0.7 -2.9 0.9 1.3 -0.7 -6.3 -9.3 9.3 2.0 -0.7 Q4 2.7 0.0 2.9 3.1 2.2 -1.1 -2.4 4.9 3.8 3.8
2015 Q1 1.2 -6.5 3.5 3.5 3.7 -4.2 -3.5 -6.6 4.1 0.7
Q2 0.8 1.8 3.8 4.5 1.0 2.3 0.4 10.6 0.4 0.0 Q3 4.2 8.7 6.1 4.6 12.2 -1.6 -1.8 -0.7 2.7 6.5 Q4 1.7 -1.4 6.3 5.5 9.4 -0.7 -3.9 13.8 2.8 1.4
Source: Singapore Department of Statistics

114
Monetary Authority of Singapore
TABLE 3: LABOUR MARKET (I) Year-on-Year % Change
Period Average Monthly Earnings
Value Added Per Worker1 Unit Labour Cost
Total2 Manufacturing Construction Wholesale & Retail Trade
Accom & Food Services
Transportation & Storage
Information & Communications
Finance & Insurance
Business Services
Overall Economy
Manufacturing
2014 2.3 -0.5 2.5 -1.8 -1.2 -2.4 -0.7 1.8 4.9 -4.1 3.3 2.5
2015 3.5 -0.1 -2.7 0.5 5.2 -2.9 -2.3 -1.5 1.9 -2.9 2.9 6.2
2014 Q1 3.2 0.6 8.6 1.9 -2.2 -1.1 2.4 -2.1 4.6 -2.5 2.7 -3.1
Q2 2.7 -1.1 0.9 -3.0 -0.8 -3.0 -0.4 2.4 1.9 -3.7 3.7 4.1 Q3 2.4 -0.5 1.9 -2.9 0.3 -3.3 -1.9 3.8 5.6 -5.3 4.0 3.0 Q4 0.8 -0.8 -0.5 -3.0 -2.1 -2.1 -2.6 3.1 7.2 -4.7 3.0 6.9
2015 Q1 3.0 -0.4 -1.5 -3.6 2.3 -3.7 -1.8 -0.9 3.7 -3.3 3.6 6.6 Q2 3.7 -0.6 -3.2 1.9 4.0 -4.3 -3.4 -0.5 2.6 -4.3 3.8 7.8 Q3 4.1 0.0 -3.2 1.0 6.3 -1.7 -1.7 -3.0 1.5 -1.9 2.7 6.4
Q4 3.3 0.5 -3.0 2.7 8.2 -1.9 -2.4 -1.5 -0.1 -2.2 1.5 4.4
1 Based on Gross Value Added At 2010 Basic Prices Source: Central Provident Fund Board/Singapore Department of Statistics and Ministry of Manpower 2 Based on GDP At 2010 Market Prices Note: The industries are classified according to SSIC 2010.
TABLE 4: LABOUR MARKET (II) Thousand
Period Changes in Employment
Total Manufacturing Construction Wholesale & Retail Trade
Accom & Food Services
Transportation & Storage
Information & Communications
Finance & Insurance
Business Services Other Services Others
2014 130.1 -4.4 14.3 20.5 9.1 7.5 6.4 9.3 34.5 32.4 0.5 2015 32.3 -22.1 8.6 -9.4 4.8 3.1 5.4 4.5 14.9 22.4 0.3
2014 Q1 28.3 -1.4 4.7 2.3 -0.1 1.9 1.0 2.4 6.8 10.7 0.1
Q2 27.7 -2.1 4.4 2.0 1.1 2.6 1.4 1.3 11.1 5.8 0.1
Q3 33.4 0.5 3.7 5.0 2.3 1.1 2.5 3.8 8.2 6.5 -0.2 Q4 40.7 -1.4 1.5 11.1 5.9 2.0 1.6 1.8 8.3 9.5 0.5
2015 Q1 -6.1 -6.9 -3.6 -4.5 -1.8 1.4 1.1 0.8 0.8 6.5 0.1
Q2 9.7 -4.4 7.6 -7.0 0.6 1.2 1.7 0.3 5.8 3.9 0.0 Q3 12.6 -4.3 3.7 -2.3 1.6 0.0 2.1 2.6 3.6 5.7 0.0 Q4 16.1 -6.5 0.9 4.4 4.4 0.5 0.4 0.8 4.7 6.2 0.2
Note: The industries are classified according to SSIC 2010. Source: Ministry of Manpower
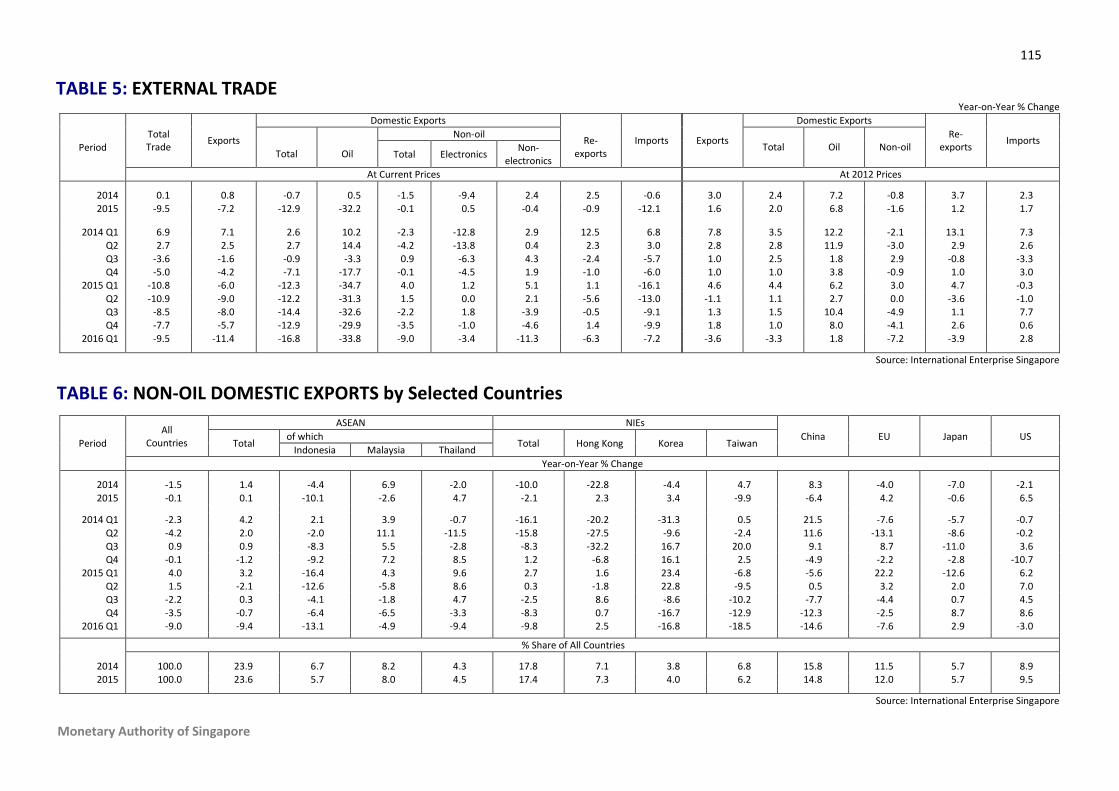
115
Monetary Authority of Singapore
TABLE 5: EXTERNAL TRADE Year-on-Year % Change
Period Total Trade
Exports
Domestic Exports
Re- exports
Imports Exports
Domestic Exports
Re- exports
Imports Total
Oil
Non-oil Total
Oil
Non-oil
Total Electronics Non-
electronics
At Current Prices At 2012 Prices
2014 0.1 0.8 -0.7 0.5 -1.5 -9.4 2.4 2.5 -0.6 3.0 2.4 7.2 -0.8 3.7 2.3
2015 -9.5 -7.2 -12.9 -32.2 -0.1 0.5 -0.4 -0.9 -12.1 1.6 2.0 6.8 -1.6 1.2 1.7
2014 Q1 6.9 7.1 2.6 10.2 -2.3 -12.8 2.9 12.5 6.8 7.8 3.5 12.2 -2.1 13.1 7.3 Q2 2.7 2.5 2.7 14.4 -4.2 -13.8 0.4 2.3 3.0 2.8 2.8 11.9 -3.0 2.9 2.6
Q3 -3.6 -1.6 -0.9 -3.3 0.9 -6.3 4.3 -2.4 -5.7 1.0 2.5 1.8 2.9 -0.8 -3.3 Q4 -5.0 -4.2 -7.1 -17.7 -0.1 -4.5 1.9 -1.0 -6.0 1.0 1.0 3.8 -0.9 1.0 3.0
2015 Q1 -10.8 -6.0 -12.3 -34.7 4.0 1.2 5.1 1.1 -16.1 4.6 4.4 6.2 3.0 4.7 -0.3
Q2 -10.9 -9.0 -12.2 -31.3 1.5 0.0 2.1 -5.6 -13.0 -1.1 1.1 2.7 0.0 -3.6 -1.0 Q3 -8.5 -8.0 -14.4 -32.6 -2.2 1.8 -3.9 -0.5 -9.1 1.3 1.5 10.4 -4.9 1.1 7.7 Q4 -7.7 -5.7 -12.9 -29.9 -3.5 -1.0 -4.6 1.4 -9.9 1.8 1.0 8.0 -4.1 2.6 0.6
2016 Q1 -9.5 -11.4 -16.8 -33.8 -9.0 -3.4 -11.3 -6.3 -7.2 -3.6 -3.3 1.8 -7.2 -3.9 2.8
Source: International Enterprise Singapore
TABLE 6: NON-OIL DOMESTIC EXPORTS by Selected Countries
Period
All Countries
ASEAN NIEs
China EU Japan US Total
of which Total Hong Kong Korea Taiwan
Indonesia Malaysia Thailand
Year-on-Year % Change
2014 -1.5 1.4 -4.4 6.9 -2.0 -10.0 -22.8 -4.4 4.7 8.3 -4.0 -7.0 -2.1
2015 -0.1 0.1 -10.1 -2.6 4.7 -2.1 2.3 3.4 -9.9 -6.4 4.2 -0.6 6.5
2014 Q1 -2.3 4.2 2.1 3.9 -0.7 -16.1 -20.2 -31.3 0.5 21.5 -7.6 -5.7 -0.7
Q2 -4.2 2.0 -2.0 11.1 -11.5 -15.8 -27.5 -9.6 -2.4 11.6 -13.1 -8.6 -0.2 Q3 0.9 0.9 -8.3 5.5 -2.8 -8.3 -32.2 16.7 20.0 9.1 8.7 -11.0 3.6 Q4 -0.1 -1.2 -9.2 7.2 8.5 1.2 -6.8 16.1 2.5 -4.9 -2.2 -2.8 -10.7
2015 Q1 4.0 3.2 -16.4 4.3 9.6 2.7 1.6 23.4 -6.8 -5.6 22.2 -12.6 6.2 Q2 1.5 -2.1 -12.6 -5.8 8.6 0.3 -1.8 22.8 -9.5 0.5 3.2 2.0 7.0 Q3 -2.2 0.3 -4.1 -1.8 4.7 -2.5 8.6 -8.6 -10.2 -7.7 -4.4 0.7 4.5
Q4 -3.5 -0.7 -6.4 -6.5 -3.3 -8.3 0.7 -16.7 -12.9 -12.3 -2.5 8.7 8.6 2016 Q1 -9.0 -9.4 -13.1 -4.9 -9.4 -9.8 2.5 -16.8 -18.5 -14.6 -7.6 2.9 -3.0
% Share of All Countries
2014 100.0 23.9 6.7 8.2 4.3 17.8 7.1 3.8 6.8 15.8 11.5 5.7 8.9 2015 100.0 23.6 5.7 8.0 4.5 17.4 7.3 4.0 6.2 14.8 12.0 5.7 9.5
Source: International Enterprise Singapore

116
Monetary Authority of Singapore
TABLE 7: CONSUMER PRICE INDEX
Period All Items Food Clothing & Footwear
Housing & Utilities
Household Durables &
Services
Health Care
Transport Communication Recreation &
Culture Education
Miscellaneous Goods & Services
2014 = 100
2014 100.0 100.0 100.0 100.0 100.0 100.0 100.0 100.0 100.0 100.0 99.9 2015 99.5 101.9 100.1 96.5 99.4 99.9 98.6 100.3 100.3 103.4 99.9
2014 Q1 100.1 99.3 100.6 101.0 99.2 99.1 100.9 99.6 100.1 99.4 99.1 Q2 100.0 99.7 100.3 100.1 99.9 100.0 100.4 99.5 100.2 99.6 100.3 Q3 100.0 100.2 99.7 99.8 100.4 100.7 99.8 99.9 99.6 100.3 100.3
Q4 99.8 100.7 99.5 99.1 100.3 100.1 98.9 100.9 100.0 100.7 100.0 2015 Q1 99.8 101.5 99.6 98.4 100.8 99.3 97.7 101.1 100.2 102.8 99.9
Q2 99.6 101.7 99.6 96.3 99.2 99.7 100.5 100.5 100.1 102.8 100.0
Q3 99.4 102.0 100.4 96.3 98.5 100.6 98.3 99.3 100.0 103.9 100.0 Q4 99.1 102.4 100.7 94.9 98.9 100.0 97.6 100.4 100.9 104.3 99.6
2016 Q1 98.9 103.5 101.7 94.4 100.0 100.0 94.9 100.0 100.7 105.3 100.3
Source: Singapore Department of Statistics
TABLE 8: MAS CORE INFLATION Index (2014=100)
Period Jan Feb Mar Apr May Jun Jul Aug Sep Oct Nov Dec
2000 77.5 77.8 77.5 77.6 77.4 77.5 77.9 78.4 78.4 78.4 78.8 78.9
2001 79.4 79.2 79.3 79.6 79.2 79.0 79.4 79.3 79.2 79.1 79.0 78.9
2002 78.8 79.0 78.9 79.0 79.2 79.2 79.3 79.2 79.3 79.2 79.5 79.6
2003 79.8 79.6 79.8 80.1 79.6 79.3 79.9 80.0 80.2 80.1 80.3 80.4
2004 81.2 81.2 81.3 81.4 81.5 81.4 81.5 81.4 81.8 81.8 81.9 81.8
2005 82.0 82.1 82.2 82.2 82.2 82.0 82.4 82.7 82.7 83.2 83.4 83.4
2006 83.9 83.7 83.7 83.7 83.6 83.4 83.8 84.0 84.0 84.3 84.6 84.8
2007 84.8 84.9 84.8 84.7 84.8 84.8 85.9 86.1 86.3 86.8 87.3 88.5
2008 89.1 89.4 89.5 90.1 90.2 90.3 90.8 91.1 91.1 92.1 92.1 92.2
2009 91.5 91.1 91.2 90.3 90.1 90.0 90.3 90.4 90.3 90.8 90.8 90.9
2010 91.0 91.5 91.6 91.8 91.7 91.6 92.1 92.5 92.5 92.6 92.8 92.8
2011 92.8 93.1 93.2 93.8 93.7 93.7 94.1 94.5 94.4 94.7 95.0 95.2
2012 96.1 95.9 96.0 96.3 96.2 96.2 96.4 96.6 96.7 96.9 96.9 97.0
2013 97.2 97.7 97.6 97.6 97.8 97.8 97.9 98.3 98.4 98.6 98.9 99.0
2014 99.4 99.4 99.6 99.9 100.0 99.8 100.1 100.3 100.1 100.3 100.3 100.5
2015 100.4 100.7 100.6 100.3 100.1 100.0 100.4 100.5 100.7 100.6 100.5 100.8
2016 100.8 101.2 101.2
Note: MAS Core Inflation is the CPI less the costs of accommodation and private road transport. Source: Monetary Authority of Singapore

117
Monetary Authority of Singapore
TABLE 9: BALANCE OF PAYMENTS – Current Account
Current Account Balance Goods Account Services Account Balance Primary Income Balance
Secondary Income Balance $ Million % of GDP
Exports Imports Balance Total Maintenance
& Repairs Transport Travel Financial
Intellectual Property
Others
$ Million
2014 67,377 17.4 554,705 453,813 100,891 -5,994 9,127 7,182 -6,622 20,327 -20,276 -15,732 -19,174 -8,346 2015 79,136 19.7 518,378 404,921 113,457 -5,305 8,532 4,318 -7,304 21,714 -19,224 -13,342 -18,974 -10,042
2014 Q1 13,362 14.1 136,433 115,288 21,145 -857 2,840 1,979 -1,361 4,414 -4,975 -3,753 -4,905 -2,021
Q2 14,680 15.4 142,573 117,476 25,098 -3,165 2,011 1,636 -2,105 4,542 -5,113 -4,136 -5,228 -2,025 Q3 20,748 21.4 139,887 112,019 27,867 -938 2,259 1,962 -1,142 4,934 -5,076 -3,876 -4,071 -2,110 Q4 18,587 18.4 135,811 109,030 26,781 -1,034 2,017 1,606 -2,014 6,437 -5,111 -3,967 -4,970 -2,190
2015 Q1 21,270 21.2 129,043 98,193 30,851 -1,513 1,991 1,368 -1,648 4,959 -4,832 -3,353 -5,598 -2,470 Q2 16,653 16.6 130,731 103,804 26,927 -2,364 2,135 809 -2,317 5,197 -4,849 -3,338 -5,456 -2,454 Q3 20,616 20.6 129,746 103,268 26,478 -665 2,178 1,256 -1,140 5,195 -4,772 -3,382 -2,660 -2,537
Q4 20,597 20.2 128,857 99,656 29,201 -763 2,228 886 -2,199 6,364 -4,771 -3,270 -5,260 -2,580
Source: Singapore Department of Statistics
TABLE 10: BALANCE OF PAYMENTS – Capital & Financial Accounts
$ Million
Period Capital and Financial Account Balance
Net Errors & Omissions
Overall Balance
Official Foreign Reserves
(End of Period) Total Direct
Investment Portfolio
Investment Financial
Derivatives Other
Investment
2014 -58,577 37,206 -67,613 15,159 -43,329 -183 8,618 340,438 2015 -77,052 40,939 -75,315 27,325 -70,001 -583 1,501 350,991
2014 Q1 -11,917 8,502 -22,026 1,602 4 -998 448 343,253
Q2 -9,936 11,011 -40,532 4,559 15,026 -89 4,655 346,494
Q3 -18,460 6,081 -4,930 3,270 -22,881 1,117 3,405 339,511 Q4 -18,263 11,611 -124 5,728 -35,478 -214 111 340,438
2015 Q1 -24,341 12,113 -17,503 4,574 -23,524 1,760 -1,311 340,759
Q2 -13,322 6,807 -10,454 7,470 -17,145 -645 2,687 341,064 Q3 -20,508 13,339 -19,473 8,281 -22,656 372 479 357,848 Q4 -18,882 8,680 -27,885 7,000 -6,677 -2,070 -354 350,991
Source: Singapore Department of Statistics/Monetary Authority of Singapore

118
Monetary Authority of Singapore
TABLE 11: EXCHANGE RATES
End of Period
Singapore Dollar Per
US Dollar
Pound Sterling
EURO 100 Swiss
Franc 100 Japanese
Yen Malaysian
Ringgit Hong Kong
Dollar 100 New
Taiwan Dollar 100 Korean
Won Australian
Dollar
2014 1.3213 2.0563 1.6072 133.67 1.1060 0.3781 0.1703 4.1840 0.1210 1.0836 2015 1.4139 2.0957 1.5457 143.08 1.1743 0.3294 0.1824 4.2995 0.1203 1.0323
2014 Q1 1.2605 2.0961 1.7328 142.03 1.2252 0.3857 0.1625 4.1356 0.1182 1.1636
Q2 1.2490 2.1270 1.7041 140.16 1.2326 0.3889 0.1611 4.1830 0.1235 1.1766
Q3 1.2728 2.0692 1.6157 133.87 1.1643 0.3891 0.1640 4.1813 0.1208 1.1140 Q4 1.3213 2.0563 1.6072 133.67 1.1060 0.3781 0.1703 4.1840 0.1210 1.0836
2015 Q1 1.3765 2.0350 1.4876 142.07 1.1447 0.3704 0.1775 4.3978 0.1239 1.0497
Q2 1.3474 2.1189 1.5080 145.02 1.1014 0.3559 0.1738 4.3626 0.1204 1.0337 Q3 1.4253 2.1613 1.6045 146.70 1.1884 0.3205 0.1839 4.3349 0.1199 0.9984 Q4 1.4139 2.0957 1.5457 143.08 1.1743 0.3294 0.1824 4.2995 0.1203 1.0323
2016 Q1 1.3511 1.9372 1.5290 139.82 1.2020 0.3445 0.1742 4.1935 0.1181 1.0339
Source: Monetary Authority of Singapore
TABLE 12: SINGAPORE DOLLAR NOMINAL EFFECTIVE EXCHANGE RATE INDEX Index (29 Sep–3 Oct 2014 Average=100)
Average for Week Ending S$ NEER
Average for Week Ending S$ NEER
Average for Week Ending S$ NEER
Average for Week Ending S$ NEER
Average for Week Ending S$ NEER
Average for Week Ending S$ NEER
2014 Oct 3 100.00 2015 Jan 2 99.71 2015 Apr 2 99.13 2015 Jul 3 100.95 2015 Oct 2 99.33 2016 Jan 8 99.62 10 99.86 9 99.57 10 99.65 10 101.00 9 99.08 15 99.38 17 99.80 16 99.60 17 99.90 16 100.60 16 99.90 22 99.48 24 99.71 23 99.71 24 100.29 24 100.42 23 100.46 29 99.65 31 99.72 30 99.31 30 101.13 31 100.42 30 100.42 Feb 5 99.82
Nov 7 99.70 Feb 6 99.07 May 8 100.81 Aug 6 99.97 Nov 6 100.26 12 100.51 14 99.90 13 98.75 15 100.86 14 99.43 13 99.85 19 99.99 21 99.64 18 98.70 22 100.83 21 99.63 20 100.08 26 100.28 28 99.68 27 98.83 29 100.62 28 99.76 27 100.29 Mar 4 100.68
Dec 5 99.70 Mar 6 98.67 Jun 5 100.65 Sep 4 99.28 Dec 4 100.58 11 100.96 12 99.75 13 98.51 12 100.66 10 99.44 11 100.64 18 101.33 19 100.21 20 98.34 19 101.10 18 100.34 18 100.60 24 101.36 26 99.83 27 98.75 26 101.27 25 99.64 24 100.69 Apr 1 101.55
31 100.30 8 101.38
Source: Monetary Authority of Singapore

119
Monetary Authority of Singapore
TABLE 13: DOMESTIC LIQUIDITY INDICATOR Change from 3 Months Ago
Period Jan Feb Mar Apr May Jun Jul Aug Sep Oct Nov Dec
2011 0.390 0.299 0.340 0.343 0.398 0.450 0.491 0.411 -0.200 -0.886 -1.094 -0.550 2012 0.129 0.555 0.645 0.591 0.305 0.106 0.260 0.428 0.656 0.355 0.284 0.194 2013 0.003 -0.108 -0.176 0.076 -0.023 -0.031 -0.070 0.087 0.385 0.411 0.511 0.206 2014 -0.050 -0.124 -0.228 0.132 0.126 0.337 0.180 0.088 0.035 0.202 0.320 0.021 2015 -0.190 -0.406 -0.120 0.325 0.643 0.689 0.153 -0.189 -0.109 0.003 0.245 0.232 2016 -0.065 -0.004 0.168
Note: The DLI is a measure of overall monetary conditions, reflecting changes in the S$NEER and 3-month S$ SIBOR rate. Source: Monetary Authority of Singapore
A positive (negative) number indicates a tightening (easing) monetary policy stance from the previous quarter.
Please refer to the June 2001 issue of the MAS ED Quarterly Bulletin for more information.
TABLE 14: MONETARY
End of Period
Money Supply Interest Rates
Narrow Money
M1
Broad Money
M2
Broad Money
M3
Reserve Money
Narrow Money
M1
Broad Money
M2
Broad Money
M3
Reserve Money
Prime Lending
Rate
3-month S$ SIBOR
3-month US$ LIBOR
Banks’ Rates
Savings Deposits
12-month Fixed
Deposits
$ Billion Year-on-Year % Change % Per Annum
2014 160.2 512.5 524.2 55.2 3.6 3.3 3.4 -13.7 5.35 0.46 0.26 0.11 0.31
2015 160.4 520.2 532.9 60.7 0.1 1.5 1.7 10.0 5.35 1.19 0.61 0.14 0.34
2014 Q1 159.1 501.3 512.4 64.7 6.9 1.8 1.8 25.0 5.35 0.41 0.23 0.12 0.33
Q2 154.6 494.8 506.3 61.2 -0.8 0.6 0.6 8.6 5.35 0.40 0.23 0.11 0.31 Q3 156.5 505.0 516.9 54.9 1.6 1.9 2.0 -8.3 5.35 0.41 0.24 0.11 0.31 Q4 160.2 512.5 524.2 55.2 3.6 3.3 3.4 -13.7 5.35 0.46 0.26 0.11 0.31
2015 Q1 162.7 521.9 533.7 58.5 2.3 4.1 4.2 -9.5 5.35 1.01 0.27 0.11 0.33 Q2 158.3 512.5 525.0 56.2 2.4 3.6 3.7 -8.2 5.35 0.82 0.28 0.11 0.32 Q3 158.6 521.2 533.7 57.4 1.3 3.2 3.3 4.6 5.35 1.14 0.33 0.14 0.34
Q4 160.4 520.2 532.9 60.7 0.1 1.5 1.7 10.0 5.35 1.19 0.61 0.14 0.34
Source: Monetary Authority of Singapore/ABS Benchmarks Administration Co Pte Ltd/ICE Benchmark Administration Ltd

120
Monetary Authority of Singapore
TABLE 15: FISCAL
Period
Operating Revenue Expenditure
Primary Surplus (+)/
Deficit ()
Less:
Special Transfers
Add: Net
Investment Returns
Contribution
Overall Budget
Surplus (+)/
Deficit ()
Total
Tax Revenue
Non-tax Revenue
Total
Operating
Development Total
of which
Income Tax
Assets Taxes
Stamp Duty
GST
$ Million
FY2013 57,020 51,146 22,050 4,182 3,930 9,513 5,875 51,728 39,725 12,003 5,292 8,584 8,289 4,998
FY2014 60,838 54,110 23,940 4,341 2,784 10,215 6,728 56,648 42,685 13,963 4,190 12,356 8,738 571
FY2015 (Revised) 64,163 55,113 24,719 4,391 2,730 10,326 9,050 68,409 48,726 19,682 -4,246 10,537 9,898 -4,884
FY2016 (Budgeted) 68,445 59,173 26,747 4,396 2,523 10,615 9,272 73,431 54,427 19,003 -4,986 6,270 14,705 3,450 % of Nominal GDP
FY2013 15.1 13.5 5.8 1.1 1.0 2.5 1.6 13.7 10.5 3.2 1.4 2.3 2.2 1.3
FY2014 15.5 13.8 6.1 1.1 0.7 2.6 1.7 14.4 10.9 3.6 1.1 3.1 2.2 0.1
FY2015 (Revised) 15.9 13.7 6.1 1.1 0.7 2.6 2.2 17.0 12.1 4.9 -1.1 2.6 2.5 -1.2
FY2016 (Budgeted) 16.7 14.4 6.5 1.1 0.6 2.6 2.3 17.9 13.2 4.6 -1.2 1.5 3.6 0.8
Source: Ministry of Finance

MARKETASIA DISTRIBUTORS (S) PTE LTD601 Sims Drive #04-05 Pan-I Complex Singapore 387382 Tel: (65) 6744 8483 Fax: (65) 6744 3690
Email: [email protected] VISIT OUR WEBSITE @ http://www.marketasia.com.sg
Subscription Form Yes! I wish to subscribe to the Macroeconomic Review
SUBSCRIPTION RATES
Country 1 Year (Vol XV, Issue 2 and Vol XVI, Issue 1)
Singapore S$ 28.00
Name:
Company:
Address:
Job Title:
Postalcode:
Telephone: Fax:
E-mail:
Payment Options:Cheque/ Draft in Singapore Dollars (made payable to MarketAsia Distributors (S) Pte Ltd)
Credit Card Visa MasterCard Amex
Credit Card No:
Name (as appears on card):
Expiry Date: Signature:
I authorise the indicated amount to be charged to my credit card.
Please complete this subscription form and mail to:
Others S$ 75.00(Inclusive of GST)
(Inclusive of postage and handling)
GST REG No. M2-0077937-1