Embed Size (px)
Citation preview

s u c c e s s f u l p e o p l e s u c c e s s f u l p r o j e c t s s u c c e s s f u l p e r f o r m a n c e
Strategic Flood Risk Assessment of Chichester District Council
VOLUME II TECHNICAL REPORT
July 2008

Issue Box The Chichester District Council Strategic Flood Risk Assessment (SFRA) is a "live" document. The current version is developed using the best information and concepts available at the time. As new information and concepts become available the document will be updated and so it is the responsibility of the reader to be satisfied that they are using the most up-to-date information and that the SFRA accounts for this information. All revisions to this summary document are listed in the table below. Version Issue Date Issued by Issued to Amendments from previous
version
Draft v1 14/05/2007 Capita Symonds Ltd
Chichester District Council N/A
Final Draft
29/05/2008 Capita Symonds Ltd
Chichester District Council Major revisions
Final 29/07/08 Capita Symonds Ltd
Chichester District Council Minor revisions
Capita Symonds House Wood Street East Grinstead West Sussex RH19 1UU Tel: 01342 327 161 Fax: 01342 315 927 Project manager: George Baker Project director: Marc Pinnell www.capitasymonds.co.uk

Chichester SFRA (July 2008) Volume II - Technical Report
i
Contents
Index of Maps in Annex A........................................................................................ ii
Foreword .................................................................................................................. iii
1. Introduction................................................................................................... 1-1
2. Strategic assessment across the study area ............................................. 2-1
3. Environment and planning context............................................................. 3-1
4. Flood defences and assets.......................................................................... 4-1
5. Flood warning and emergency plans.......................................................... 5-1
6. Flooding from rivers..................................................................................... 6-1
7. Flooding from the sea .................................................................................. 7-1
8. Flooding from land ....................................................................................... 8-1
9. Flooding from groundwater......................................................................... 9-1
10. Flooding from sewers ................................................................................ 10-1
11. Assessing flooding from artificial sources .............................................. 11-1
Glossary and notation.............................................................................................. 1 ANNEX A - Flood maps ANNEX B – Additional Information

Chichester SFRA (July 2008) Volume II - Technical Report
ii
Index of Maps in Annex A Background maps
Overview Map O - Overview of Chichester District Map G2 - Indicative geology map Map T1 – Scource of Topographic Data Map T2 – Ground Topography
Management Map M1 - Areas covered by Catchment Flood Management Plans (CFMPs) and Shoreline Management Plans (SMP) Map M2 - Existing flood management policies across Chichester District Map M3 - Location of existing hydraulic model extents across Chichester District
Flood defences and flood warning Map D1 - System Asset Management Plan areas Map D2 – Flood Defences across the district (type of defence) Map D3 – Flood Defences across the district (source of flooding being defended) Map D4 – Flood Defences across the district (estimated standard of protection) Map W - Environment Agency flood warning areas
Sequential Test
Flooding from rivers (fluvial) Map F1-F - Fluvial Flood Zones Map F2-F – Source of River Flood Zone 3a Data Map C2-F - Fluvial Flood Zones with climate change
Flooding from the sea (tidal) Map F1-T - Sea Flood Zones & coastal risk area Map F2-T – Source of Tidal Flood Zone 3a Data Map C2-T - Sea Flood Zones with climate change
Flooding from land Map L - Areas prone to flooding from land
Flooding from groundwater Map G1 - Land more prone to groundwater flooding
Flooding from sewers Map S - Historic incidents of sewer flooding
Exception Test
Flooding from rivers (fluvial) Map A1-F - Actual and residual risk of flooding from rivers (extent) Map A2-F - Depth of actual flooding from rivers Map A3-F – Actual flooding from rivers (indicative velocities)
Map C1-F - Extent of flooding from rivers with allowance for climate change
Flooding from the sea (tidal) Map A1-T - Extent of actual flooding from the sea & coastal risk area Map A2-T - Depth of actual flooding from the sea & coastal risk area Map A3-T – Actual flooding from the sea (indicative velocities) & coastal risk area
Map C1-T - Extent of flooding from sea with allowance for climate change & coastal risk area
Map B – Locations where breach assessments may be require

Foreword
Chichester SFRA (July 2008) Volume II - Technical Report
iii
Foreword Chichester District Council (CDC) is required to prepare a Strategic Flood Risk Assessment (SFRA) to support the development of their Local Development Framework.
The SFRA creates a strategic framework for the consideration of flood risk when making planning decisions. It has been developed with reference to Planning Policy Statement 25 (PPS25): development and flood risk and additional guidance provided by the Environment Agency.
The fundamental concepts that underpin the SFRA are outlined in PPS25. The guidance provided in this document requires local authorities and those responsible for development decisions to demonstrate that they have applied a risk based, sequential approach in preparing development plans and consideration of flooding through the application of a sequential test. Failure to demonstrate that such a test has been undertaken potentially leaves planning decisions and land allocations open to challenge during the planning process.
The underlying objective of the risk based sequential allocation of land is to reduce the exposure of new development to flooding and reduce the reliance on long-term maintenance of built flood defences. Within areas at risk from flooding, it is expected that development proposals will contribute to a reduction of flood risk.
SFRAs are essential to enable a strategic and proactive approach to be applied to flood risk management. The assessment allows us to understand current flood risk on a wide-spatial scale and how this is likely to change in the future.
The main objective of the Chichester District SFRA is to provide flood information:
− so that an evidence based and risk based sequential approach can be adopted when making planning decisions, in line with PPS25;
− that is strategic, in that it covers a wide spatial area and looks at flood risk today and in the future;
− that supports sustainability appraisals of the local development frameworks; and
− that identifies what further investigations may be required in flood risk assessments for specific development proposals.
The SFRA is presented in a number of documents:
− VOLUME I – user guide
− VOLUME II – technical report and flood maps
− VOLUME III – management guide
− VOLUME IV – assessment of sites of Interest
The SFRA is a live document which is intended to be updated as new information and guidance becomes available. The outcomes and conclusions of the SFRA may not be valid in the event of future changes. It is the responsibility of the user to ensure they are using the best available information.

Introduction
Chichester SFRA (July 2008) Volume II - Technical Report
1-1
1. Introduction
The Chichester DC Strategic Flood Risk Assessment (SFRA) is a "live" document. The current version is developed using the best information and concepts available at the time. As new information and concepts become available the document will be updated and so it is the responsibility of the reader to be satisfied that they are using the most up-to-date information and that the SFRA accounts for this information. All revisions to this summary document are listed in the table.
Version Issue Date Issued by Issued to
Final 29/07/08 Capita Symonds
Ltd
CDC, EA

Introduction
Chichester SFRA (July 2008) Volume II - Technical Report
1-2
Purpose of this report
1.1 Strategic Flood Risk Assessments (SFRAs) can provide flood risk information to inform a range of activities, such as land use planning, emergency planning, development control and the development of specific flood risk management policy.
1.2 The Chichester SFRA has been developed to form part of the Local Development Framework. The SFRA must be robust and be evidence based so that it does not leave planning decisions and land allocations open to challenge through the land use planning process. For this reason, it is crucial that there is transparency in the data and methods used in the assessment.
1.3 This report represents Volume II of the SFRA, containing all of the technical information and methods used in the assessment of flood risk across Chichester DC. This includes information on the sources and reliability of data, methods used in the assessment, discussion regarding uncertainty and key assumptions made.
1.4 Chapter 2 provides a summary of flood risk across the District. The flood maps generated during the assessment are provided in Annex A.
1.5 Chapters 3 to 5 provide information on Planning, Environment, Flood Defences and Flood Warning.
1.6 Chapters 6 to 11 provide historic information, and details of the methodology applied in assessing the risk for the six ‘sources of flooding’. This enables the technical information to be easily updated when new assessments are undertaken in the future. To ensure that the technical information is easily updated when new assessments are undertaken in the future, the six ‘sources of flooding’ have been reported in stand alone chapters.
1.7 The user is referred to Volumes I and III for guidance on how to interpret the information in this technical report and how to update the SFRA following any improvements in data or changes in guidance.
1.8 The SFRA is a 'live' document and as such will be updated when new data and/or guidance becomes available. It is the responsibility of the user to ensure that they refer to the latest information that is available.
1.9 The SFRA is based on a range of data from different sources and of various degrees of certainty. It is the responsibility of the user to consider the source and certainty of the data when referring to the flood risk summaries and flood maps.

Strategic assessment across the study area
Chichester SFRA (July 2008) Volume II - Technical Report
2-1
2. Strategic assessment across the study area
The Chichester DC Strategic Flood Risk Assessment (SFRA) is a "live" document. The current version is developed using the best information and concepts available at the time. As new information and concepts become available the document will be updated and so it is the responsibility of the reader to be satisfied that they are using the most up-to-date information and that the SFRA accounts for this information. All revisions to this summary document are listed in the table.
Version Issue Date Issued by Issued to
Final 29/07/08 Capita Symonds
Ltd
CDC, EA

Strategic assessment across the study area
Chichester SFRA (July 2008) Volume II - Technical Report
2-2
Context
2.1 Chichester District Council (CDC) is required to prepare a Strategic Flood Risk Assessment (SFRA) to support the Local Development Framework and Core Strategy. The information collected in the SFRA has therefore been developed to support this use. The specific objectives of the SFRA are outlined in Chapter 3.
2.2 Information concerning the six sources of flooding (river, sea, land, groundwater, sewer and artificial sources) has been collated and analysed for the whole of the district. Where relevant, the four types of flood risk (flood zones, actual, residual-overtopping, and residual-breach/failure) have been addressed.
2.3 The assessment has aimed to characterise flood risk today, and also into the future. Two time horizons have been analysed (2056 and 2106) to predict the likely impacts of climate change.
2.4 The Environment Agency and other key stakeholders (see Chapter 3) have been contacted through the SFRA process in an attempt to gather as much information as possible. Several meetings with the Environment Agency have provided an insight on the expectations of the SFRA.
2.5 The methodology for the SFRA was based on use of the best available information and involved minimal additional hydraulic modelling. Each dataset was reviewed with regard to its accuracy and the most appropriate datasets used to define flood risk across Chichester District under varying conditions.
2.6 In general, the results of the more detailed Environment Agency hydraulic models (TUFLOW) were used in preference to the results from their national generalised broad scale models (JFLOW), in defining Flood Zones. It is important that the source of flood data is considered whenever using the data in informing a land use planning decision.
2.7 Chichester District Council and the Environment Agency will need to agree management and update protocols for the SFRA datasets in the future, as more detailed flood risk information becomes available. These protocols are outlined in Volume III of the SFRA.
Summary of flood risk across Chichester District
2.8 The Chichester District SFRA has been undertaken over the whole administrative boundary so that the local planning authority can make a comparative assessment of flood risk. Thus they can undertake a risk-based approach to land allocation and the ‘Sequential Test’ described in PPS25. Table 2.1 provides a summary of the key flood risk statistics for Chichester.
2.9 Chichester District is affected to varying degrees by all six sources of flooding, although the sources affecting most land are from rivers, the sea and groundwater. Flooding from artificial sources is relatively low risk, as very few sources of flooding were identified at the strategic level. Further information regarding flood risk from all sources across the district is provided in the following section.
2.10 Whilst flood risk in Chichester is not as significant as some other districts, several of the ‘areas if interest’ investigated in this SFRA are located in areas at higher risk of flooding. Thus it is apparent that more detailed flooding information will be required in high probability flood zones.

Strategic assessment across the study area
Chichester SFRA (July 2008) Volume II - Technical Report
2-3
Table 2.1 Key Flood Risk Statistics
Flood risk indicator Area (km2) % of total CDC area
Size of CDC planning area 813.6 N/A
Total developed area 35.3 4.3
Area in Flood Zone 2 (flooding from rivers – 0.1% AEP) 32.9 4.0
Area in Flood Zone 2 (flooding from the sea – 0.1% AEP) 26.0 3.2
Area in Flood Zone 3a (flooding from rivers – 1% AEP) 25.7 3.2
Area in Flood Zone 3a (flooding from the sea – 0.5% AEP) 23.5 2.9
Area in Flood Zone 3b (flooding from rivers – defended 5% AEP) 23.4 2.9
Area in Flood Zone 3b (flooding from the sea – defended 5% AEP) 4.6 0.6
Area that has a high probability of being affected by flooding from land 408.0 50.1
Area that has a high probability of being affected by flooding from groundwater 294.0 36.1
Area that has a high probability of being affected by flooding from sewers Unable to quantify
Area that has a high probability of being affected by flooding from artificial sources Unable to quantify
Total area of Settlement Policy Areas 23.3 2.9
Area (km2) % of Settlement Policy Area
Settlement Policy Areas in Flood Zone 3b 0.6 2.5
Settlement Policy Areas in Flood Zone 3a 1.0 4.2
Settlement Policy Areas in Flood Zone 2 1.8 7.6
Flooding from rivers (fluvial) 2.11 Map F1-F shows the flooding from rivers ignoring the presence of flood defences, and Map
A1-F shows the flooding from rivers with flood defences in place. The largest areas affected by flooding from rivers are along the River Rother and Lavant. The floodplains from these rivers are also expected to feature the deepest floodwaters during large flood events. Map A2-F shows the estimated flood depths during a 1% annual exceedance probability (AEP) river flood event.
2.12 The latest government guidance suggests that climate change will increase river flows by 20 per cent by 2106. In addition, mean sea levels are expected to rise, which can exacerbate river flooding in tidally influenced systems. Maps C1-F and C2-F show the estimated extents of flooding from rivers in a 2056 and 2106 time frame, with and without flood defences being in place.

Strategic assessment across the study area
Chichester SFRA (July 2008) Volume II - Technical Report
2-4
Flooding from the sea (tidal) 2.13 The length of the Chichester coastline is approximately 66km (including Chichester and
Pagham Harbour) and extends from Pagham Harbour in the east to Emsworth in the west.
2.14 The low-lying parts of the coastline are at risk of flooding from high tides and storm surges on the English Channel. Historical development has taken place on areas which were once part of the coastal environment, for example large flat marshy areas surrounding Selsey Peninsula.
2.15 Land drainage and the development of defences enabled occupation and then intensification of development within these areas. The sea defences consist of shingle beaches stabilised by rock and timber groynes. In some areas seawalls at the rear of shingle beaches enhance flood protection.
2.16 The sea defences that have been constructed offer greatly varying Standards Of Protection (SOP) with very few achieving protection against a 0.5% AEP storm surge. Even where protection against a 0.5% AEP event is provided there exists a residual risk of flooding behind these defences from the chance that extreme high tides and tidal surges, coupled with wave action, could produce water levels exceeding the design height of the frontage and therefore cause them to be overtopped.
2.17 In addition to the open coastline, many watercourses in CDC are tidally influenced where they discharge into the sea, and thus flooding from sea affects land a significant distance away from the immediate coastline. With sea level rise, this distance will become even greater.
2.18 Map F1-T shows the flooding from sea ignoring the presence of flood defences, and Map A1-T shows the flooding from sea with flood defences in place. Map A2-T shows the estimated flood depths during a 0.5% AEP sea flood event.
2.19 The latest government guidance suggests that climate change will increase mean sea levels by approximately 1m by 2106. The area at risk of flooding from sea is therefore expected to significantly increase in the future. Maps C1-T and C2-T show the estimated extents of flooding from rivers in a 2056 and 2106 time frame, with and without flood defences being in place.
2.20 There exists a risk of flooding due to flood defences overtopping or breaching. A number of locations have been identified, and in some instances breaches modelled, which are considered to be more prone to a breach, as shown on Map B.
Flooding from groundwater 2.21 Due to the large chalk bands across the district, there is a significant proportion of land which
is more likely to be affected by groundwater flooding. Map G1 shows the groundwater emergence zones, and the results of a spatial analysis of GIS datasets and historic incidents of groundwater flooding used to indicate those areas at greater risk of groundwater flooding.
2.22 Most at risk will be deep foundations, basements and underground infrastructure. The location of the emergence points cannot be accurately located. Groundwater can often emerge over a large or diffuse area, but can also emerge at single points. It has therefore only been possible to identify a broad area over which emergence may occur.
Flooding from land (surface water) and sewers 2.23 The potential for surface water flooding is variable across the district, reflecting the changing
geology, soil types and rainfall patterns. A broad scale spatial analysis has been undertaken to assess areas which may be more prone to surface water flooding. The results of this analysis and the historic incidents of surface water flooding are shown in Map L. Due to the

Strategic assessment across the study area
Chichester SFRA (July 2008) Volume II - Technical Report
2-5
dependence on the local sewer infrastructure, it is not beneficial to undertake a spatial analysis to identify areas more prone to sewer flooding. In this case, historic incidents of sewer flooding have been used to define this source of flooding, as shown on Map S.
2.24 A site specific assessment is required to refine the information on flood risk from sewers and surface water. It is expected that this will be undertaken during the detailed flood risk assessment of proposed development sites.
Flooding from artificial sources 2.25 Artificial sources of flooding include canals, reservoirs, lakes and pumping stations. No
artificial sources of flooding were identified during the strategic assessment. However the potential for this source of flooding on a local scale should be considered during the planning process and the hazards associated with the source of flooding be studied in detail as part of site-specific flood risk assessments. Artificial sources of flooding may develop over time, therefore these should still be considered during future updates of the SFRA.
Uncertainty
2.26 Flood risk can be assessed using a number of techniques and also in various levels of detail. It is important to be confident that the methods used for estimation produce results that are sufficiently certain for land use planning decisions to be based upon.
2.27 Uncertainty in flood estimation arises from the:
• complexity of the flooding - such as complex or unusual hydrological regime, highly variable floodplain topography and roughness, and/or controlling channel/structure features; and
• quality of the input data - such as low quality or absent survey data, and/or lack of measured flow and level data.
2.28 Chapters 8 to 13 provide more details regarding the uncertainty associated with the methods used to assess flood risk from each source across the study area.
2.29 The assessment of flooding from land, groundwater and sewers has been limited by scale and the availability of historic datasets.
2.30 Confidence in river and sea flood zones is greater due the availability of CFMP and ABD models for use in the assessment of flooding.
2.31 The potential impacts of climate change are an important aspect of uncertainty relevant to flood risk estimation. The latest Government research predicts significant increases in river flow and sea level rise in the future. Such changes are likely to have a dramatic effect on current flood source-pathway-receptor relationships. In October 2006, Defra released supplementary guidance which suggested two principal approaches for managing uncertainty of climate change predictions in the assessment of flood risk:
• Managed Adaptive Approach - allows for adaptation in the future by monitoring change in risk and managing this through multiple interventions. This approach is likely to be more cost effective than the precautionary approach as this latter approach may lead to over-design; and
• Precautionary Approach - where a managed adaptive approach is not technically feasible or too complex, a precautionary principle can be used. This involves a once-off intervention (such as a culvert or bridge) which should include a conservative allowance

Strategic assessment across the study area
Chichester SFRA (July 2008) Volume II - Technical Report
2-6
for changes in climatic variables based on the best scientific evidence available at the time.
2.32 Following a 'Managed Adaptive Approach' in land use planning is not advised. Future adaptation to the impacts of climate change may not be technically feasible in the long-term or practical in intervening periods. The requirement to review and take action can be managed more effectively through individual planning applications rather than by CDC within the LDF process.
2.33 A precautionary approach, as outlined in PPS25 is advised. Climate change information within the SFRA has been based therefore on a conservative approach to ensure that planning led decisions are 'no-regret'.
2.34 With consideration of the precautionary principle, the following questions should be considered when assessing certainty of flood risk estimation:
• Is the assessment suitable for the type of flooding and the scenarios being considered (fit for purpose)?
• Is the model appropriate for the level of detail required for the flood risk assessment?
• Are the limitations of the method clearly understood and reported?
• Has the model been calibrated / verified?
• Are the key assumptions identified and stated?
• Is the key input data justified and appropriate for the level of flood risk assessment (fit for purpose)?
• Has a sensitivity analysis been carried out?
• Have all relevant uncertainties (such as climate change) been identified and appropriately addressed?
2.35 No further assessments will be necessary where there is high certainty in flood estimation. However where there is low certainty further assessments may be required.
Management of the different Sources of Flooding
2.36 The following section provides details of how flooding from different sources can be managed. The most suitable type of flood management for a site depends on site specific conditions, the receptor of flooding and the type of flooding.
Flooding from rivers 2.37 Flooding from rivers can be managed in a number of ways, including:
• Avoidance - developing outside of the floodplain.
• Prevention - walls and embankments used to exclude water from a site, improved channel conveyance, pumping or flood storage areas used to attenuate/retain peak flood flows upstream.
• Management/Adaptation - flood resilient design, flood warning, evacuation and emergency planning, and flood awareness.

Strategic assessment across the study area
Chichester SFRA (July 2008) Volume II - Technical Report
2-7
2.38 The most suitable type of flood management for a site depends on site specific conditions, the receptor of flooding and the type of flooding.
2.39 The Environment Agency is currently reviewing its assets and developing System Asset Management Plans (SAMPs). These will identify and provide information on existing assets, and help to decide where investment is most needed.
2.40 Catchment Flood Management Plans (CFMPs) provide a large-scale assessment of the risks associated with river flooding. They present a policy framework to address the risks to people and the developed, historic and natural environment in a sustainable manner. In doing so, a CFMP is a high-level document that forms an important part of the Department for Environment, Food and Rural Affairs (Defra) strategy for flood and coastal defence. CFMPs provide the management plan for the next 100 years and the policies required for it to be implemented.
Flooding from the sea 2.41 The main ways to manage flooding from sea are walls, embankments, groynes and shingle
beaches. Coastal flood defence schemes are usually highly designed to withstand pressure from high water levels as well as erosive wind and wave action. Coastal Defence Strategies (CDSs) and Shoreline Management Plans (SMPs) outline policies and options for the management of coastlines and flood defences in Chichester.
2.42 SMPs provide a large-scale assessment of the risks associated with coastal evolution and present a policy framework to address the risks to people and the developed, historic and natural environment in a sustainable manner. In doing so, a SMP is a high-level document that forms an important part of the Defra strategy for flood and coastal defence. They provide the management plan for the next 100 years and the policies required for it to be implemented.
2.43 The long term plan for the Chichester coastline is to continue to protect assets by holding the line, defending the present position. The preferred polices to be implemented in order to hold the line, for the immediate, medium and long term, is to maintain, upgrade or replace defences along the coast. These policies are defined in the East Solent SMP. It should be noted that the ability to deliver the long-term plan detailed in the SMP is dependant on available funding, which may not be provided in the long-term.
2.44 CDSs build on SMPs and aim to identify a range of options most suitable for stretches of coastline (including do nothing). From this a series of preferred options are defined and these are used to develop a detailed implementation strategy established for the next 5 – 10 years as well as a plan for the next 50 – 100 years. The primary focus of this strategy is the protection of life, urban assets and coastal defences. The government places particular emphasis on a strategic approach and encourages defence to be sustainable in a changing environment.
Flooding from land (surface water) 2.45 At present there is no government body with a clear responsibility for managing this type of
flooding, having a statutory obligation for measuring and reporting events or providing advice and protection to those at risk.
2.46 As of spring 2006 the Environment Agency assumed a strategic overview role for monitoring flooding from land but the extent and the legislative details remain to be clarified. The Environment Agency and Meteorological Office provide a limited warning service for flooding from land in some areas, and the EA includes records of known surface water flooding in its Historic Flood Map. However flood warning is complicated for surface water flooding due to its complex nature, localised occurrence, and generally short lead in times.
Strategic assessment across the study area
Chichester SFRA (July 2008) Volume II - Technical Report
2-8
2.47 A review of historical maps may provide evidence that a site has experienced flooding problems in the past, and may therefore experience flooding problems in the future. Historical maps may show the presence of springs, areas of bog or marsh.
2.48 Developments which are adjacent to artificial drainage systems or located at the bottom of hillslopes, in valley bottoms and hollows may be more prone to flooding from overland flows. This may especially be the case in areas that are downslope of land that increases runoff potential including agricultural land, impermeable areas due to urban development or transport infrastructure, and compacted ground from past industrial activities.
2.49 Management of surface water flooding is highly dependent upon the characteristics of the site. The implications of surface water flooding should be considered and managed through development control and building design.
2.50 Responses to surface water flooding include:
• Sensitive land use management based on policies at a strategic level.
• Major ground works (such as new or improved drainage systems including drains, balancing ponds and embankments).
• Appropriate site selection for developments.
• Development zoning including the use of green space and planting to manage runoff.
• Flood proofing of developments (including land raising and raising floor levels) and flood warning.
• Management of development runoff (such as the inclusion of SuDS).
• Pumping.
2.51 The impact of management of surface water flooding must also be considered. Consideration of runoff from developments is required to manage flood risk posed on site and elsewhere by the development. Long-term operation and maintenance requirements and responsibilities are a key consideration. The appropriateness of sustainable drainage techniques (SuDS) should also be assessed.
2.52 Surface water flooding is often highly localised and complex. Management is highly dependent upon the characteristics of the specific situation and the costs associated with the management of surface water flooding are highly variable. The implications of surface water flooding should be considered and managed through development control and building design.
Groundwater flooding 2.53 As for flooding from land, at present there is no government body with a clear responsibility
for groundwater flooding. The Environment Agency assumed a strategic overview for monitoring groundwater flooding in spring 2006 and currently provides some data of known groundwater flooding incidents in its Historic Flood Map. However the extent and the details of the EA’s role remain to be clarified.
2.54 Groundwater flooding is often highly localised and complex. Management is highly dependent upon the characteristics of the specific situation. The costs associated with the management of groundwater flooding are highly variable. The implications of groundwater flooding should be considered and managed through development control and building design.
2.55 Responses to groundwater flooding include:

Strategic assessment across the study area
Chichester SFRA (July 2008) Volume II - Technical Report
2-9
• Major ground works (such as construction of new or enlarged watercourses) and improvements to the existing surface water drainage network to improve conveyance of floodwater through and away from flood prone areas.
• Raising property ground or floor levels.
• Flood Proofing (e.g. tanking or sealing of building basements).
• Flood Warning.
• Replacement and renewal of leaking sewers, drains and water supply reservoirs. Water companies have a programme to address leakage from infrastructure, so there is clear ownership of the potential source.
• Pumping to reduce groundwater levels locally.
2.56 Most options involve the management of groundwater levels. It is important to assess the impact of managing groundwater with regard to water resources, and environmental designations. Likewise, placing a barrier to groundwater movement can shift groundwater flooding from one location to another. The appropriateness of sustainable drainage techniques (SuDS) should also be assessed, where source protection zones are close by.
Flooding from sewers 2.57 Flooding from sewers or urban areas can theoretically be managed with engineering works
for any size event. However such works are not economically or environmentally sustainable. Improvements to urban drainage can also lead to rapid rainfall runoff into rivers, increasing flood risk downstream and potentially transporting contaminants.
2.58 Improvements to sewer systems are often undertaken on a local scale (such as for individual developments or sites). However, in some cases strategic improvements may be required to improve the performance of sewer systems and reduce flooding problems over a wider area. It is likely that strategic improvements will be undertaken by the relevant water company (such as Southern Water), and will follow an assessment of the areas most in need of improvements and where these are technically feasible.
2.59 PPS25 recommends that Sustainable Drainage Systems (SuDS) are used to decrease the probability of flooding by limiting the peak demand on urban drainage infrastructure. All new developments, and wherever possible existing networks, are also advised to provide separate foul and surface water drainage systems to ensure that any flooding that does occur is not contaminated. Further information on sustainable drainage systems is provided in Volume I (User Guide) of the SFRA.
Flooding from artificial sources 2.60 Whilst the SFRA has only identified one source of artificial flooding at the strategic level,
Chichester Canal, these should be considered for individual developments.
2.61 The owner or appropriate operating authority (eg Chichester Canal Trust) is normally responsible for the management and safety of their assets. In some cases a separate regulating body (eg the Environment Agency) also has responsibility for enforcement of the relevant legislation. The processes and procedures undertaken by the operating authorities to ensure the safety of their assets and / or issue flood or water level warnings should be determined at the appropriate level of flood risk assessment. Further information is provided in Chapter 11 of this report.

Strategic assessment across the study area
Chichester SFRA (July 2008) Volume II - Technical Report
2-10
Planning Considerations for different Sources of Flooding
2.62 PPS25 requires that decision makers use the SFRA to inform their knowledge of flooding, refine the information on the Flood Map and determine the variations in flood risk from all sources of flooding across and from their area. These should form the basis for preparing appropriate policies for flood risk management for these areas. The Flood Zones cover only river and sea flooding but PPS25 requires that consideration be given to other forms of flooding during the decision making process. The SFRA determines the variations in flood risk from all sources of flooding across the study area.
2.63 PPS25 requires a precautionary approach to be undertaken when making land use planning decisions regarding flood risk. This is partly due to the considerable uncertainty surrounding flooding mechanisms and how flooding may respond to climate change. It is also due to the potentially devastating consequences of flooding to the people and property affected.
Flooding from rivers 2.64 Flooding from rivers is one of the most destructive forms of flooding in England and Wales. As
such, information on areas liable to flood is usually more refined than for other sources. A large amount of information can be obtained from local District Council or Environment Agency staff.
2.65 PPS25 states that, particularly in large and flat catchments, natural river floodplains act as the regulator of flood flows and that the planning system should seek to promote and enhance this function where possible.
Flooding from the sea 2.66 PPS25 requires decision makers to consider flooding from sea when making land use
planning decisions. The consequences of flooding from the sea are usually more severe than flooding from rivers, so larger flood events (0.5% AEP) are examined.
2.67 Flood zones, actual risk, residual risk and breach and failure hazards should all be considered.
2.68 The impact of climate change on flooding from the sea is particularly important. The latest government guidance indicates exponential growth rates in sea level rise. This will have enormous implications on this type of flood risk in the future. It is important that the land use planning process is used to guide development away from these areas so that there may be less reliance on sea defences in the future.
Flooding from land 2.69 The SFRA determines the variations in flood risk from all sources of flooding across the study
area, including flooding from land. This information should form the basis for preparing appropriate policies for flood risk management. PPS25 states that local planning authorities should further the use of SuDS by, amongst other things, adopting 'policies for incorporating SuDS requirements in local development documents.' It must be recognised however, that many of the typical approaches to SuDS will not work in low lying areas which suffer from high groundwater levels or seasonally waterlogged soils – as is the case in many parts of the Sussex coastal plain.
2.70 A probabilistic approach to assessing flooding from land requires an understanding of hydrological and hydraulic processes. These processes are highly variable at the local scale and cannot meaningfully be performed at a strategic level. The assessment should be

Strategic assessment across the study area
Chichester SFRA (July 2008) Volume II - Technical Report
2-11
undertaken using site and upstream catchment characteristics and historic incidents of flooding.
2.71 As well as informing land use planning, flooding should be managed through the flood risk assessment process. Further collation of relevant data is required, such as land use, runoff rates, existing drainage systems, past events and consultation with relevant bodies. Specific factors that should be considered when undertaking a flood risk assessment include:
• Areas liable to flooding (based on site and catchment characteristics).
• The extent, standard and effectiveness of existing drainage systems.
• The likely rates of surface water runoff and overland flow.
• The likely impacts to other areas (such as increases in surface water runoff rates).
• The likely extent, depth and velocity of flooding.
• The effects of climate change.
• The suitability of sustainable drainage systems.
Flooding from groundwater 2.72 The propensity for groundwater flooding should be a material consideration when making land
use allocation decisions, and broad-scale assessment of groundwater flooding has been completed as part of the SFRA.
2.73 Groundwater flood risk should be investigated, identified, quantified and managed where possible by the flood risk assessment process. Assessments of groundwater flooding must therefore always be included at all levels of future flood risk assessment. Collation of all relevant data, such as spring flows, borehole water levels and recorded flood levels, past history and photographs of events and consultation with local residents should be undertaken when preparing site specific flood risk assessments (FRAs).
2.74 In particular, the factors that should be taken into account during these FRAs are:
• Areas liable to flood based on the best available information.
• Extent, standard and effectiveness of existing flood defences (if present).
• Likely rates of water level rise within the aquifer, and if possible, trigger levels for the onset of overland flow
• Quantities and velocities of overland flow.
• Likely depth of flooding.
• Likelihood of impacts to other areas.
• Possible impacts of climate change.
2.75 Indicators that the site may be at risk from groundwater flooding include:
• The development site is near to the junction between geological strata of differing permeability.

Strategic assessment across the study area
Chichester SFRA (July 2008) Volume II - Technical Report
2-12
• The development site is located at a similar level to nearby springs, or stream headwaters.
• The development proposals include basements or excavation into the ground.
• The vegetation on the site suggests periodic waterlogging due to high groundwater levels.
• Nearby recorded borehole levels reach those of the site.
2.76 If the FRA concludes that a more detailed assessment of groundwater flooding is required then it may be appropriate to undertake further hydrogeological monitoring and statistical analyses of recorded borehole water levels. To inform flood risk assessments detailed assessment of flow from springs, recorded flood levels and groundwater processes may be required. This should be undertaken by an expert hydrogeologist or geotechnical engineer.
Flooding from sewers 2.77 A probabilistic approach to assessing flooding from sewers requires an understanding of
hydrological, hydraulic and structural engineering processes, which are all highly variable at the local scale. Thus a more detailed assessment is required for individual proposed developments.
2.78 As well as informing land use planning, flooding from sewers should be managed by the development control process. Further collation of all relevant data, such as sewer capacity, past events and consultation with water companies and operating authorities should be undertaken when preparing site specific flood risk assessments. Factors that should be taken into account during these flood risk assessments are:
• Capacity of the existing drainage system.
• Increase in surface water runoff rates.
• Effects of climate change.
• Suitable sustainable drainage systems.
2.79 PPS25 states that the local planning authority should further the use of SuDS by, amongst other things, adopting 'policies for incorporating SuDS requirements in local development documents.’
Flooding from artificial sources 2.80 The propensity for flooding from artificial sources should be a material consideration when
making land use allocation decisions. Although the SFRA has not identified any artificial sources of flooding which warranted further consideration at a strategic level, this may need consideration for a local development proposal. Thus a more detailed assessment is required for individual proposed developments.
2.81 Further collation of all relevant data, such as asset information, measured water levels, operating regimes, past history and photographs of events and consultation with operating authorities should be undertaken when preparing more detailed assessments.
2.82 More specifically, factors that should be taken into account during these detailed assessments are (Lancaster et al 2004) the:
• area liable to flooding;

Strategic assessment across the study area
Chichester SFRA (July 2008) Volume II - Technical Report
2-13
• extent, standard and effectiveness of existing impoundment structures;
• likely depth of flooding;
• likelihood of impacts to other areas;
• effects of climate change.
Conclusions and recommendations
2.83 This SFRA provides an assessment of flood risk in accordance with PPS25 and the Practice Guide Companion to PPS25. The SFRA should be used to inform the Sequential Test and Sequential Approach to planning.
2.84 This SFRA provides information on river, sea, groundwater, land, and sewer flooding. The flood maps provided should be used when investigating flood risk. The Flood Zone and SFRA maps provide an indication of the areas at risk from rivers and the sea. Flooding from other sources should be considered at all sites, and maps provided give an indication of the risk of flooding from these other sources. Particular attention should be given to sites where there has been a higher concentration of historic incidents reported or identified.
2.85 Due to limitations and uncertainty associated with information on the sources of flooding other than river and sea, and in some cases the local nature of problems, it is recommended that these issues are considered in detail on a site by site basis.
2.86 The main benefits of the SFRA approach were the use of existing information; Environment Agency involvement; and an iterative process which now established can be improved upon as required. The primary limitations of the study relate to the quality and availability of datasets, which increases the importance of regular updates to the SFRA.
2.87 The SFRA makes the following recommendations for future work:
• Environment Agency and CDC to agree Flood Zones extents for planning purposes;
• CDC to manage and update the SFRA and relevant data;
• CDC continue to contact stakeholders for new or updated datasets;
• increased involvement of Southern Water in future iterations of the SFRA; and
• strategic solutions to development and flood risk issues within the study area should be considered where appropriate.

Environment and planning context
Chichester SFRA (July 2008) Volume II - Technical Report
3-1
3. Environment and planning context
The Chichester DC Strategic Flood Risk Assessment (SFRA) is a "live" document. The current version is developed using the best information and concepts available at the time. As new information and concepts become available the document will be updated and so it is the responsibility of the reader to be satisfied that they are using the most up-to-date information and that the SFRA accounts for this information. All revisions to this summary document are listed in the table.
Version Issue Date Issued by Issued to
Final 29/07/08 Capita Symonds
Ltd
CDC, EA

Environment and planning context
Chichester SFRA (July 2008) Volume II - Technical Report
3-2
Introduction
3.1 Chichester District covers approximately 811km2 along the south coast of England from Pagham Harbour in the East to Thorney Island in the West. It stretches as far north as Hammer in the north of the District and forms the largest District in the County. Map O in Annex A of this report shows the district boundary and an overview of the District.
3.2 The District forms part of West Sussex County, which itself forms part of the South East England region. In England there is a hierarchical structure of guidance and plans covering national, regional and local planning. At the local (district) level, Chichester District Council (CDC) must prepare a Local Development Framework (LDF). The LDF comprises of a folder of documents for delivering the core development strategy for the district.
3.3 Strategic Flood Risk Assessments (SFRA) are undertaken to inform the development planning process at the local (district) scale. Whilst the SFRA is not a spatial plan or a planning policy, it informs the planning process by providing information of present, future and residual flood risk. The SFRA will enable CDC to designate areas for development following the sequential test as required by National Planning Policy Statement 25: Development and Flood Risk (PPS25). The SFRA should provide the necessary information for planners to be able to take the strategic decisions that identify the amount of development that may be permitted, how the drainage of that development should function and how vulnerable areas should be protected or adapted.
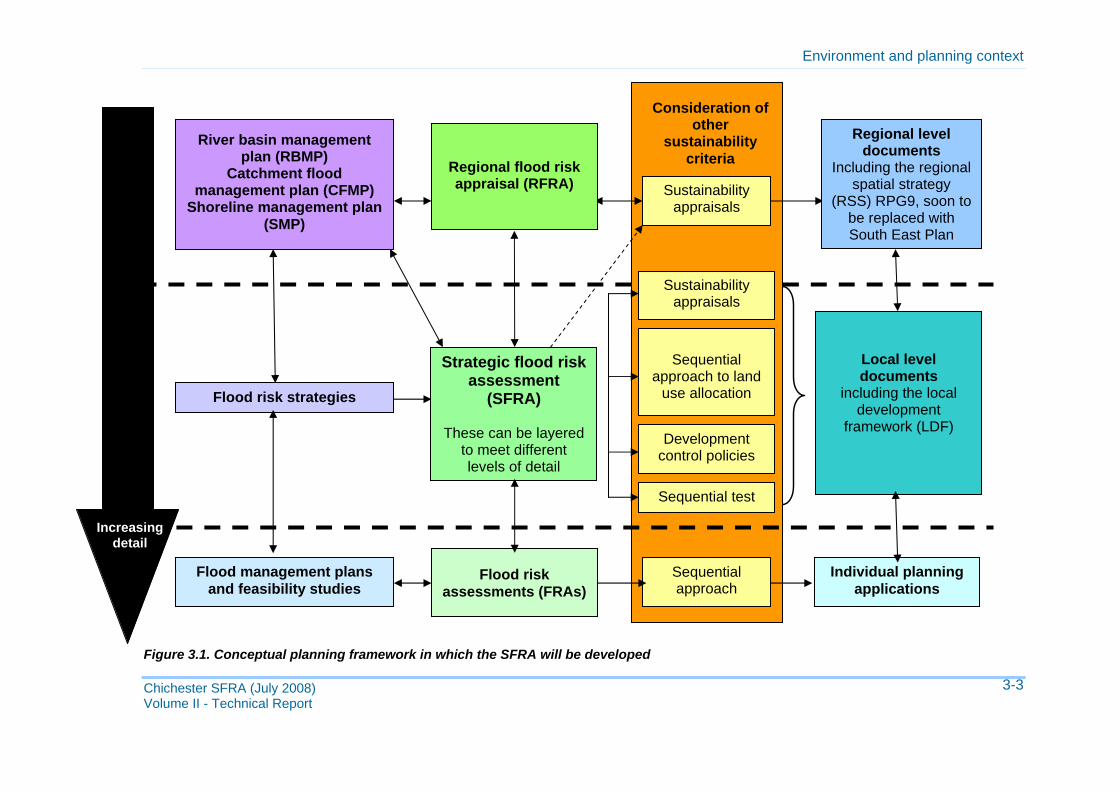
3.4 As well as PPS25, there are a number of other plans and policies which will influence, and will be influenced by, the SFRA. Figure 3.1 shows the conceptual land use planning framework in which the SFRA has been developed and how it may fit into the wider planning framework in England and Wales.
3.5 The catchment flood management plans (CFMPs) and shoreline management plans (SMPs) represent the first ‘tier’ in the strategic flood risk management process, providing the overall framework within which more detailed assessments, such as the Chichester District SFRA are undertaken. The SFRA covers specific land uses and is better able to influence flood risk management policies to address local issues, although the CFMP may be better placed to guide flood risk management policies on a catchment scale.
3.6 The SFRA's relationship with the land use (spatial) planning process is particularly important and operates at two levels, with a strong link to local level documents, such as the Local Development Framework (LDF) and a slightly weaker, but still important, link to county and regional level documents, such as the West Sussex Structure Plan and the Regional Spatial Strategy (RSS). It provides information so that an evidence-based and risk-based sequential test may be undertaken.
3.7 The SFRA does not eliminate the need for more detailed flood risk assessments (FRAs) of individual proposed allocation sites. More detailed FRAs will still be required which are in accordance with PPS25. Rather the SFRA will provide additional information for these FRAs to draw upon and identify more detailed issues associated with flood hazards and flood consequences.
3.8 The following chapter discusses the plans and policies relevant to developments and flood risk within Chichester District.
Environment and planning context
Chichester SFRA (July 2008) Volume II - Technical Report
3-3
Figure 3.1. Conceptual planning framework in which the SFRA will be developed
Strategic flood risk assessment
(SFRA)
These can be layered to meet different levels of detail
Flood risk strategies
Local level documents
including the local development
framework (LDF)
Individual planning applications
Regional level documents
Including the regional spatial strategy
(RSS) RPG9, soon to be replaced with South East Plan
River basin management plan (RBMP)
Catchment flood management plan (CFMP)
Shoreline management plan (SMP)
Flood risk
assessments (FRAs)
Regional flood risk appraisal (RFRA)
Sustainability
appraisals
Flood management plans and feasibility studies
Sequential approach
Consideration of other
sustainability criteria
Increasing detail
Development control policies
Sequential
approach to land use allocation
Sustainability appraisals
Sequential test
Environment and planning context
Chichester SFRA (July 2008) Volume II - Technical Report
3-1
National level
3.9 The National requirements for preparing local development frameworks is set out in Planning Policy Statement 12 (PPS12) and general guidance on delivering sustainable development is set out in Planning Policy Statement 1 (PPS1). National guidance on developing in flood risk areas and in coastal areas is set out in Planning Policy Statement 25 (PPS25) and Planning Policy Guidance 20 (PPG20). These are described below.
PPS25: development and flood risk 3.10 The current government guidance on development and flood risk is outlined in PPS25, issued
by Communities and Local Government (CLG). PPS25 advises that a strategic approach should be adopted in keeping with Government’s aims to ensure that new development is sustainable.
3.11 The previous government guidance outlined in Planning Policy Guidance 25: Development and Flood Risk (PPG25) is no longer valid. PPG25 replaced DOE Circular 30/92 and was formulated following the severe floods of April 1998 and Autumn 2000. The guidance provided in PPS25 is current and supersedes older policies including the Environment Agency's 'Policy and Practice for the Protection of Floodplains' (1997).
3.12 PPS25 outlines how flood risk should be considered at all stages of the planning and guidance development process. It gives guidance on how flood risk can be managed and reduced through the land use planning process. PPS25 acts on a precautionary basis and takes into account climate change.
3.13 PPS25 uses the planning process to promote a risk-based approach to ensure new development is not exposed unnecessarily to flooding by considering flood risk at every stage. New developments should reduce the flood risk where possible and maintain floodplains as natural areas that continue to function effectively. Therefore, floodplains should be protected from inappropriate development. The guidance also places emphasis on the adoption of the precautionary principle and the benefits that should be derived from developer contributions.
3.14 The focus of the guidance in PPS25 enshrines the concepts introduced in PPG25. However, notably it introduces:
• revised Flood Zones (PPS25 Table D1).
• classifications of the vulnerability of different land uses to flooding. (PPS25 Table D2);
• the need for the ‘Exception Test’ in circumstances where it is thought necessary to locate new development in ‘Higher Probability’ Zones;
• the need to undertake SFRAs to aid decision making at all levels of planning;
• the concept of 'flood risk reduction', particularly in circumstances where development has been sanctioned on the basis of the ‘Exception Test’.
3.15 Table D1 of PPS25 describes the new flood risk zone classifications as:
• Zone 1 low probability - land assessed as having a less than 0.1 per cent annual exceedance probability (AEP) of river or sea flooding in any year.
• Zone 2 medium probability - land assessed as having between a 1 per cent and 0.1 per cent AEP of river flooding or between a 0.5 per cent and 0.1 per cent AEP of sea flooding in any year.

Environment and planning context
Chichester SFRA (July 2008) Volume II - Technical Report
3-2
• Zone 3a high probability - land assessed as having a 1 per cent AEP of river flooding or a 0.5 per cent AEP of flooding from the sea in any year.
• Zone 3b functional floodplain - land where water has to flow or be stored in times of a flood. SFRAs should identify this Flood Zone (land which would flood with an annual probability of 5 per cent, or greater in any given year or is designed to flood in an extreme flood, or at another probability to be agreed).
3.16 Table D2 of PPS25 outlines the Flood Risk Vulnerability Classification, as:
• Essential infrastructure.
• Highly vulnerable.
• More vulnerable - including landfill and sites used for waste management facilities for hazardous waste. PPS25 refers the reader to Planning for Sustainable Waste Management: Companion Guide to Planning Policy Statement 10 for definitions of hazardous waste.
• Less vulnerable - including buildings used for general industry, waste treatment (except landfill and hazardous waste facilities), minerals workings and processing (except for sand and gravel).
• Water-compatible development - including sand and gravel workings and wharves.
3.17 Planning policies and decisions should consider flood risk and its management on a whole-catchment basis and not be restricted to floodplains.
3.18 PPS25 states that regional and local planning bodies should prepare and implement strategies that help deliver sustainable development by:
• Appraising risk.
• Managing risk.
• Reducing risk.
3.19 SFRAs fall into the first category of ‘Appraising risk’ so that the risk can be appropriately managed or reduced.
PPG20: coastal planning 3.20 Planning Policy Guidance 20 (PPG20) concerns the character of the coast, designated coastal
areas, heritage coasts and the international dimension. The document discusses types of coasts, policies for their conservation and development and policies covering risks of flooding, erosion and land instability, as well as coastal protection and defence. It also outlines policies for developments which may specifically require a coastal location. These include tourism, recreation, mineral extraction, energy generation and waste water and sewage treatment plants.
3.21 Policies 2.15 to 2.17 provide guidance for risks of flooding, erosion and land instability in land use planning.

Environment and planning context
Chichester SFRA (July 2008) Volume II - Technical Report
3-3
Regional level
Regional spatial strategy
RPG9 - South East
3.22 Chichester District is covered under the Regional Planning Guidance for the South East (RPG9), issued by the South East Regional Assembly in March 2001.
3.23 Policy INF1 provides guidance on flooding:
"Development should be guided away from areas at risk or likely to be at risk in future from flooding, or where it would increase the risk of flood damage elsewhere. Existing flood defences should be protected where they continue to be relevant."
3.24 The overall premise is that development will be planned to avoid the risk of flooding and will not be permitted if it would:
• be subject to an unacceptable risk of flooding or increase the risk elsewhere; and
• prejudice the capacity or integrity of flood plains or flood protection measures.
3.25 It encourages local development documents to include policies to:
• adopt a risk based approach to guiding categories of development away from flood risk areas; and
• ensure that development proposals are accompanied by flood risk assessments.
South East Plan
3.26 The draft South East Plan (SEP) will become part of the statutory development plan for development and conservation for West Sussex when it is adopted by the government in about 2009. This is a regional spatial strategy covering the period up to 2026. It replaces RPG 9, RPG9a, and RPG9b.
3.27 The SEP was submitted by the South East England Regional Assembly to the Government in March 2006.
West Sussex Structure Plan 2001 – 2016
3.28 The statutory 'development plan' for West Sussex includes the West Sussex Structure Plan 2001-2006, which was adopted in October 2004. This sets out a number of policies and targets, including strategic planning policies.
3.29 Policy ERA4 provides guidance on flooding and coastal defence.
3.30 Amongst other things, the aims of the structure plan are to:
"make the best use of land, especially previously-developed land (including the use of existing buildings) within existing built-up areas, and to minimise the use of greenfield sites" whilst considering "the need to avoid areas at risk of land instability, erosion, and flooding (both fluvial and marine) and to avoid increasing the risk of flooding"

Environment and planning context
Chichester SFRA (July 2008) Volume II - Technical Report
3-4
Local level
Relevant local development documents
Chichester District Council Local Plan 1999-2006
3.31 The current district development guidance is included in the Chichester District Local Plan, adopted in April 1999, which forms a statement of CDC’s planning policies. Policies RE26, C13, C9 and C3 and the principle policies relate to flooding, coastal defence and drainage issues. The Local Plan is soon to be superseded by the Local Development Framework, which CDC is currently in the process of the developing the new Core Strategy. Details of the programme for the production of LDF documents are in the Council’s Local Development Scheme which can be found on the Council’s website www.chichester.gov.uk.
Chichester District Council Local Development Framework (LDF)
3.32 The LDF will comprise a folder of Local Development Documents (LDDs). The statutory development plan for the district will consist of the LDF as well as the Regional Spatial Strategy for the South East, the South East Plan. The Core Strategy is the principal development plan document, and sets out the long-term spatial vision and objectives for delivery in the LDF. The core strategy document outlines the council’s strategy for delivering strategic development needs, including housing, leisure and retail. All other development plan documents must conform with the Core Strategy. CDC is currently in the process of developing this document, and expects to issue an initial ‘Issues and Options’ assessment in November 2008.
Other plans and policies
Agency Management System (AMS) 3.33 The Environment Agency "Flood Risk Assessment for Major Installations on the Floodplain"
(EA AMS 29/05/02) provides guidance to:
• "ensure major installations are adequately protected from the risks of flooding; and
• ensure that human health and the environment is adequately protected from the consequences of major installations should they flood."
3.34 Whilst this policy is based on PPG25, it is consistent with PPS25 in that it states the need to consider the probability and consequences of flooding on waste sites and will be considered in the SFRA.
Catchment flood management plans (CFMPs) 3.35 The future management of flood risk on a catchment scale is set out within the non-statutory
Catchment Flood Management Plans (CFMPs). These plans are being developed by the Environment Agency in consultation with local stakeholders. CFMPs look at the current level of flood risk and compare this to the predicted future flood risk. This allows a targeted approach in dealing with flood risk in the areas that will need it most. The CFMP process assesses how flooding might affect the environment in the future and how anticipated future flood patterns might be maximised for environmental benefit. The CFMP policies should be considered when making land planning decisions.
3.36 The Chichester District Council area is almost completely covered by a single CFMP area, the Arun and Western Streams CFMP. Small areas in the north and to the west are covered by

Environment and planning context
Chichester SFRA (July 2008) Volume II - Technical Report
3-5
the Thames CFMP and Hampshire CFMP respectively. The River Arun and Western Streams CFMP is currently awaiting imminent public release of the finalised main stage report. The boundaries of the CFMPs are shown in Map M1 in Annex A.
Shoreline management plans (SMPs) 3.37 The long term management of coastal flood risk and erosion is set out within Shoreline
management plans (SMPs). As with CFMPs, SMPs are developed by a group of key stakeholders such as the South Downs Coastal Group (SDCG) and the Environment Agency. The CDC coastline is covered by two SMPs. The Beachy Head to Selsey Bill SMP (2nd Review) and the East Solent Shoreline SMP. The extents of the SMPs are shown in Map M1 in Annex A. The East Solent SMP cover all of the Chichester district coastline, extending from Pagham in the east to the mouth of the River Hamble in the west, and includes the natural harbours of Chichester, Langstone, Portsmouth and Pagham.
3.38 The SMPs identify policies appropriate to the long-term management of coastal flood risk. Much of the coastline has a SMP policy of 'hold the line'. This means that existing coastal defences will be maintained to offer the same level of protection in the future, as they do today. This may require the defences to be raised in line with rising sea levels as a result of climate change and the localised sinking of land in southern England. In other places, such as Atherington, the SMP policy is 'managed realignment,' which means that new development in these areas must consider a possible reduction in future standards of protection in the area. As with CFMP policies, the policies of the SMP should be considered when making land use planning decisions. The policies are shown on Map M2 in Annex A.
Flood defences strategies 3.39 The Environment Agency, in partnership with Chichester and Arun District Council’s, are
consulting on the draft Pagham to East Head Coastal Defence Strategy (May 2008).
3.40 The Environment Agency are currently reviewing their assets to develop System Asset Management Plans so that they can make informed decisions on their investments in capital works. These plans may have a bearing on decisions made by Chichester District Council in relation to the long term condition of existing flood defences in the area.
Manhood Peninsula Partnership 3.41 The Manhood Peninsula Partnership was formed in 2001 to assist in the management of the
future development of the Peninsula. It has identified a number of issues for further investigation within the area. One of these is the overall view of land drainage since certain areas within the Peninsula appear to be becoming increasingly prone to drainage problems.
3.42 Consequently, Chichester District Council, on behalf of the Manhood Peninsula Partnership, has commissioned a Land Drainage Study of the Manhood Peninsula. The study is being undertaken on a phased basis.
• Phase 1 was submitted in August 2003 and involved an initial assessment to gain a basic understanding of the land drainage issues. It identified any gaps in the understanding of the drainage system and, most importantly, provided a platform for further assessment;
• Phase 2 involved a study into the effects of siltation in and around Pagham Harbour taking into account the effects of climate change. Also included were suggested remedial measures, the potential effect on the Lavant flood alleviation scheme and the impact on the environment;
• Phase 3 is a study of the role of the ditch system in terms of transport and storage, an investigation of possible storage sites and consideration of SuDS; and

Environment and planning context
Chichester SFRA (July 2008) Volume II - Technical Report
3-6
• Phase 4 is the implementation of proposals.
Key stakeholders
3.43 PPS25 requires all sources of flood risk to be considered when making land use planning decisions. To ensure all sources of flood risk are included, it is important to consult a range of organisations. The key organisations within Chichester District are listed below.
3.44 The Environment Agency - is a statutory consultee for regional spatial strategies, local development documents, sustainability appraisals, strategic environmental assessments and planning applications. Their role generally involves provision of flood risk information and advice. Chichester District lies within the Southern Region of the Environment Agency.
3.45 Wastewater companies - generally responsible for surface water drainage from developments connected to adopted sewers. CDC should consult Southern Water in developing their spatial plans, so that their SFRA takes account of specific capacity problems and Urban Drainage Plans.
3.46 Local authorities acting as operating authorities/maritime district councils - CDC is a drainage authority under the Land Drainage Act 1991 as well as a Maritime District Council under the Coastal Protection Act 1949.
3.47 Internal drainage boards (IDBs) - should be consulted to identify land drainage problems within IDB boundaries.
3.48 Highways authorities – should be consulted to ensure highway drainage issues are addressed in the SFRA.
3.49 Reservoir undertakers - under the Reservoirs Act 1975, reservoirs impounding over 25,000m3 of water above natural ground level are categorised on a risk basis according to the consequences of a structural failure occurring. LPAs should discuss their proposed site allocations with reservoir undertakers to avoid an intensification of development within areas at risk from reservoir failure. Due to public safety reasons, it may not be possible to publish specific details about reservoirs to the general public.
3.50 British Waterways - should be consulted in relation to sites adjacent to canals, especially where these are impounded above natural ground level.
3.51 Emergency services and multi-agency emergency planning - consult Emergency Resilience Forums during the preparation of development documents and liaise with their emergency planning officers regarding any planning applications which have implications for emergency planning. In some cases, it may be appropriate for CDC to consult the emergency services themselves on specific emergency planning issues related to new developments.

Flood defences and assets
Chichester SFRA (July 2008) Volume II - Technical Report
4-1
4. Flood defences and assets
The Chichester DC Strategic Flood Risk Assessment (SFRA) is a "live" document. The current version is developed using the best information and concepts available at the time. As new information and concepts become available the document will be updated and so it is the responsibility of the reader to be satisfied that they are using the most up-to-date information and that the SFRA accounts for this information. All revisions to this summary document are listed in the table.
Version Issue Date Issued by Issued to
Final 29/07/08 Capita Symonds
Ltd
CDC, EA

Flood defences and assets
Chichester SFRA (July 2008) Volume II - Technical Report
4-2
Introduction
4.1 Structures and defences are built to help reduce the occurrence, and therefore consequences of flooding. These assets are owned, operated and maintained by either the Environment Agency, Local Authorities or private business and local residents.
4.2 River and sea processes have been modified over time by these defence structures (such as river walls, embankments and sea walls) and by undertaking maintenance activities (such as beach replenishment and river dredging).
4.3 To fully understand flood risk, it is necessary to assess the area at risk of flooding:
• with these flood defences in place;
• with these the flood defences removed;
• with a breach or failure in flood defence.
4.4 To do so the existing flood defences within the District must be identified and defined in terms of their type and physical characteristics. In addition, information of ownership, condition and maintenance arrangements are required to assess the likelihood of failure.
4.5 The following Chapter summarises the datasets that have been reviewed to identify flood defences in Chichester District.
4.6 Environment Agency National guidance states that flood defences should be assumed to be in perfect condition when defining 'areas benefiting from flood defences.' This assumption has been used when undertaking the SFRA. This means that there has been no leakage, breach or failure of hard defences, and manual operation of structures was carried out as designed.
System Asset Management Plans (SAMPs)
4.7 The Environment Agency is revising how it manages its flood defences. It is now recognised that flood defences should be analysed as groups of structures, rather than individual assets. These groups are termed System Assets and System Asset Management Plans (SAMPs) will be produced to manage each system and contribute to reducing or maintaining the level of flood risk in a particular area.
4.8 Each SAMP has been identified by reviewing geographical, hydrological and operational factors, including how the system can be managed as a whole to deliver an acceptable level of flood risk. SAMPs are compatible with Catchment Flood Management Plan (CFMP) and Shoreline Management Plan (SMP) policy units.
4.9 Forty SAMPs have been identified within the Chichester District. The locations of these ASMP’s are shown in Map D1 in Annex A, and listed in Table 4.1.
4.10 Each system contains all the Environment Agencies assets that contribute to the reduction in flooding, even if they are remote from the area at risk. For small urban areas located within larger rural systems, the assets protecting the urban area are identified as a separate ‘high-consequence’ systems with ‘lesser consequence’ systems upstream and downstream.
4.11 SAMPs will change with time as the Environment Agency develop a better understanding of how their assets are operated and maintained. Currently the SAMPs are an internal tool for managing flood defence assets.

Flood defences and assets
Chichester SFRA (July 2008) Volume II - Technical Report
4-3
Table 4.1 SAMPs identified in Chichester DC
Asset Group ID Asset group name FR/11/S003 Bognor FR/11/S004 Aldingbourne FR/11/S005 Pagham & Siddlesham FR/11/S006 Highleigh FR/11/S007 Hunston FR/11/S008 Runcton FR/11/S009 RLFAS FR/11/S010 East Lavant FR/11/S011 Singleton FR/11/S012 Chichester City FR/11/S013 Apuldram FR/11/S014 Bosham East FR/11/S015 Bosham South FR/11/S016 Ratham Mill FR/11/S017 Colner Creek FR/11/S018 Hambrook Stream FR/11/S019 Emsworth FR/11/S020 Westbourne FR/11/S021 Upper Chalk Ems FR/11/S022 Witterings FR/11/S023 Earnley FR/11/S026 Pagham Harbour FR/11/S027 Medmerry FR/11/S030 Chichester Harbour FR/11/S031 Chiddingfold FR/11/S032 Ifold FR/11/S032 Ifold FR/11/S035 Rudgewick FR/11/S036 Malham FR/11/S037 Billingshurst FR/11/S038 Kirdford FR/11/S039 Stopham FR/11/S041 Amberley FR/11/S042 Fittleworth FR/11/S043 Midhurst FR/11/S044 Petersfield FR/11/S271 Arundel FR/16/S039 South Wey (Wey Catchment) FR/16/S041 Haslemere (Wey Catchment) FR/16/S045 Cobblers Brook (Wey Catchment)
4.12 The Environment Agency identified the limits and extent of each SAMP by reviewing geographical, hydrological and operational factors, including how the system can be managed as a whole to deliver an acceptable level of flood risk.
4.13 The Environment Agency is determining SAMPs to be compatioble with Catchment Flood Management Plan (CFMP) and Shoreline Management Plan (SMP) policy units. In coastal areas the “Management Unit”, as defined in the Shoreline Management Plan has been used to delineate each FRM system.

Flood defences and assets
Chichester SFRA (July 2008) Volume II - Technical Report
4-4
Data collection
4.14 The Environment Agency's National Flood and Coastal Defence Database (NFCDD) has been the primary source of information used to identify river, sea (coastal and tidal) and surface water defences. The database contains flood defence and asset data for the whole of England and Wales.
4.15 Whilst most major flood defences are owned by the Environment Agency, a number of key flood defences are owned and operated by local planning authorities, private business and local residents. Flood defence data has been collected from these organisations where available.
4.16 Chichester District Council has also provided information on coastal defence location, type, and maintenance within their administrative boundary.
4.17 Coastal Defence Strategy reports have been used to provide additional information on the coastal defence structures (Halcrow 2003 and Scott Wilson 2000).
4.18 Information from the Mapping Coastal Evolution and Risks in a Changing Climate, part of an EU Life funded research project (undertaken by the Centre for Coastal Environment, Isle of Wight Council), has also provided information on coastal defence structures, coastal processes and future management of the coastline.
4.19 Discussions with local authorities, Environment Agency publications (Shoreline Management Plans, Catchment Flood Management Plans, Coastal Defence Strategies), the South Downs Coastal Group webpage, and SCOPAC webpage have also been consulted.
4.20 Table 4.2 provides a summary of data collected to date. Further information on the data collected is stored in the document database in Volume III of the SFRA.
Table 4.2 Flood and asset data sources collected to date
Source Title Data type Date Environment Agency NFCDD data GIS 21/12/2006
Environment Agency Sussex and Hampshire Harbours asset management survey Report 1999
Environment Agency Sussex and Hampshire Harbours asset management survey Report 10/1998
Environment Agency nat_defences_v2_0.shp GIS 2006 Local Councils Coastal Defence Strategies Report Environment Agency Shorline Management Plans Report Environment Agency Catchment Flood Management Plans Report SCOPAC Website
Data manipulation
NFCDD dataset
Attributes
4.21 The NFCDD dataset provided by the Environment Agency contained attributed polyline and point data for flood defences in ten catchment areas (Upper Arun, Lower Arun, Upper Adur, Lower Adur, Chichester, Western Rother, Mole, Ouse, Ferring Rife, Thames). These were merged and clipped to the West Sussex boundary.

Flood defences and assets
Chichester SFRA (July 2008) Volume II - Technical Report
4-5
4.22 The full NFCDD table structure was maintained for the SFRA, although many fields are poorly defined and populated. Table 4.3 lists the attributes of the NFCDD dataset and where possible provides a description of the field.
Table 4.3 Original defences dataset attribute fields
Field Explanation Comment
NFCDD_ID Individual identifier number within NFCDD. Number reset when exported from NFCDD
No use
ASSET REFER Specific asset reference number (unique number) Unique asset identifier
ASSETTYPE Asset type MAINTAINER Asset maintainer ASSETPROTE Asset protection type
ASSETCOMM Asset comment Often details on asset owner or more detail about the asset construction.
ALTERNATIV Alternative reference code
ASSETDESCR Asset description
Significant number of unpopulated entries. Some entries in conflict with information in comment column.
ASSET LOCAT Asset location Description of asset location; rarely populated.
DESIGNTYPE Design type Rarely populated CONSENTNUM Consent number Not populated
ASSETLENGT Asset Length Significant number of fields left blank
ASSETHEIGH Asset Height Significant number of fields left blank
DEGREEOFEX Degree of exposure Not populated REPLACEMEN Replacement cost REPLACEM0 Replacement cost assessment date REPLACEM1 Replacement cost assessment method ENGINEERIN Engineering drawing numbers Not populated NATURAL Natural Not populated MAINTENANC Maintenance flag Not populated NEXTINSPEC Next inspection date NEXTINSP0 Next inspection date override
DEFENCETYP Defence type Minor or Major. Often an asset noted as having a design std of 5 would be classed as major.
DESIGNSTAN Design standard Significant number of fields not populated
BANK Bank Left or right SUBREACHRE Sub reach reference REACHREFER Reach reference WATERCOURS Watercourse reference FRONTAGESU Frontage sub unit reference FRONTAGEUN Frontage unit reference FRONTAGERE Frontage reference SUBAREAREF Sub area reference

Flood defences and assets
Chichester SFRA (July 2008) Volume II - Technical Report
4-6
Field Explanation Comment AREANUMBER Area number REGIONNUMB Region number YEARBUILT Year built Rarely populated
DESIGNEDUP Design up stream level Significant number of fields with no data
DESIGNEDDO Design downstream level Significant number of fields with no data
ACTUALDOWN Actual downstream level Significant number of fields with no data
ACTUALDO0 Actual downstream level data quality Significant number of fields with no data
ACTUALUPST Actual upstream level Significant number of fields with no data
ACTUALUP0 Actual upstream level data quality Significant number of fields with no data
EFFECTIVEC Effective crest level Significant number of fields with no data
EFFECTIV0 Effective crest level data quality Significant number of fields with no data
WAVEHEIGHT Wave height Not populated GEOLOGYSED Geology sediment Very few entries (<10) EROSIONRAT Erosion rate Not populated HATVALUE LATVALUE
RECOMMENDE Recommended action Significant number not populated
RECOMMEN0 Recommended action date RECOMMEN1 Recommended action description LEADTEAM Lead team Mostly unpopulated ACTIONDATE Action date DOWNLOADED Date data extracted ASSETGROUP Asset group Mostly unpopulated FORESHORET Foreshore type Mostly unpopulated FORESHORED Foreshore Not populated FORESHOREL Foreshore Level Not populated BEACHSTABI Beach stability Not populated ACTIONBEAC Action beach level Not populated TOELEVEL Toe level Not populated FLOODMAPIN Flood map indicated Rarely populated FLOODMAPNA Flood map name Rarely populated GRIDREFERE Grid reference Few omissions
ACTUALSTAN Actual standard Significant number not populated
ACTUALST0 Actual standard assessment date Significant number not populated
DATAOWNER Data owner SUPPORTING True/False COASTAL True/False CHANGED True/False FOR_UPLOAD True/False SPATIALDAT Spatial data quality Source Data source file (for merged file)

Flood defences and assets
Chichester SFRA (July 2008) Volume II - Technical Report
4-7
NFCDD Processing
Defences
4.23 Due to the vast amount of information in NFCDD, the dataset was cleaned to remove non-flood defence structures and defences only providing protection for small flood events. A number of processing tasks were undertaken to filter the results of NFCDD to show only those defences that are likely to act as significant flood defence assets and which should therefore be considered in a broadscale SFRA.
4.24 Firstly, the ‘Asset type’ field was used to remove non-flood defence structures. The following were removed:
• Natural channel.
• Non flood defence structure.
• Other.
4.25 It was not possible to filter those assets entered into NFCDD with an ‘Asset Type’ of ‘Culverted Channel’. However it should be noted that most assets recorded as ‘Culverted Channel’ are culverts, pipes or bridges with no specific flood defence propose. When considering a ‘Culverted Channel’ asset, knowledge of the site and asset will be required to assess its designation as a flood defence structure.
4.26 After applying the first filter many records remained for ‘Maintained Channel’, where the channel serves no flood defence propose. In order remove these records a filter was applied that removed all ‘Maintained Channel’ if not designated with a standard of protection of 10 years or greater.
4.27 Any significant defences missing from NFCDD were added to the dataset and where possible the NFCDD table was populated with attribute data for these new records.
4.28 The NFCDD database is continually being updated and improved. Consequently it is advisable that the SFRA ‘defences layer’ be regularly updated. It was therefore decided that amendments to the NFCDD table structure should be avoided and simple filters used to enable to quick and simple reproduction of the SFRA dataset. To reproduce or update the SFRA Defences line data the steps required are summarised below, in Table 4.4:
Table 4.4 NFCDD data processing steps
Step No.
Description Justification Query (in MapInfo format)
1 Delete records with an ‘ASSETTYPE’ not related to flood defence
Not regarded as defence
ASSETTYPE = "natural channel" Or ASSETTYPE = "other" Or ASSETTYPE = “non-flood defence structure”
2 Delete records for ‘Maintained Channel’ that is not designated with a standard of protection of 10 year or greater
Most ‘maintained channel’ does not serve significant flood defence propose
ASSETTYPE = "maintained channel" And DESIGNSTAN < 10
3 Append to NFCDD table any significant defences not held in NFCDD. (eg. data held by Local Authorities)
Additional information
Append table and manually classify the following fields ‘ASSETTYPE’, ‘ASSETPROTE’ and ‘ACTUALSTAN’

Flood defences and assets
Chichester SFRA (July 2008) Volume II - Technical Report
4-8
Structures
4.29 NFCDD contains a large number of structures which are not wholly for flood defence purposes. The dataset was filtered to extract only key flood defence structures which were defined as:
• Flapped outfalls.
• Pumped outfalls.
• Pumping stations.
Summary of key flood defences
4.30 The defences are shown in Maps D2 to D4 in Annex A. Maps D2 shows the type of flood defence. Map D3 shows the source of flood protection and Map D4 shows the estimated standard of protection.
4.31 Due to the volume and variety of defence data, the mapped data has been simplified. GIS layers provided within the SFRA must be reviewed to obtain all of the defence information when considering the condition and standard of protection offered by flood defences at specific locations.
4.32 It is important that users of the SFRA recognise issues with data quality and consistency of the source NFCDD datasets. The most current and correct information should be used. NFCDD is a live database, which is continually updated by the Environment Agency. Future updates of NFCDD should rectify any omissions and errors in the current dataset.
Sea flood defences 4.33 The coastline of Chichester District extends from the mouth of the River Ems in the west, to
Pagham Harbour in the East. In some instances land has been reclaimed and developed, making it more vulnerable to overtopping or breaching of defence structures.
4.34 The coastal fringe includes a number of important tourist areas such as Selsey and Wittering. The coastal defences serve to protect people and property as well as commercial and recreational interests including Pagham Harbour and Chichester Harbour.
4.35 Historically sea defences in Chichester District were built on a piecemeal basis as coastal towns grew, however many of these defences fell into disrepair during WWII. It was not until the Coast Protection Act 1949 that many coastal defence systems improved.
4.36 The area is mainly protected by timber, concrete and shingle defences. Prior to the 1950s some areas of the peninsula were eroding at a rate of 8m per year, however defences have been built since which provide protection to the area. There are large shingle banks which dominate Pagham Beach, Pagham Harbour and Church Norton.
4.37 The shoreline immediately west of Selsey Bill is protected only by the beach and erosion is ongoing due to exposure to waves and strong tidal currents. Erosion is also occurring along the low cliff where there are unconsolidated sands and gravels.
4.38 The shingle banks between Selsey and Bracklesham have breached previously during extreme events. Apparently this happened in 1910 when Selsey temporarily became an island. North of East Wittering the shoreline is mainly protected by a groyne shingle beach, with sections of breastwork revetment. Several groyne compartments are severely depleted.
4.39 In some locations flood protection is afforded by other means; such as the region of Wittering, which is protected by the sand spit at East Head. At a number of locations there are concrete

Flood defences and assets
Chichester SFRA (July 2008) Volume II - Technical Report
4-9
seawalls or rock revetments. Generally, the shingle beach provides the principal coastal defence. The defence system is supported by annual beach replenishment works.
4.40 Table 4.5 contains a summary of defences along the Chichester District coastline.
Table 4.5 Defences to prevent flooding from the sea
Coastal reach Structure(s) / FRM activity Estimated level
of protection Maintainer Comments
Chichester Harbour
Embankment Seawall Groynes Gabions Embankments
-
Various (EA, LA
and Riparian)
West Wittering - Bracklesham
Groyne stabilised beach -
Bracklesham Bay Beach recharge -
Bracklesham – Selsey Bill
Sea wall Groyne stabilised beach Breakwater
Pagham Harbour Embankment, wharf, quaysides Variable
Various (EA, LA, Riparian)
LA – Local Authority Environment Agency – Environment Agency SPA – Shoreham Port Authority
River flood defences 4.41 The key flood defences in Chichester District are summarised in Table 4.6 and include:
• Raised barriers such as walls or embankments.
• Online storage areas which act to reduce flood peaks.
• Diversion of flows from high risk areas, or increasing channel capacity to carry greater flow through high risk areas (e.g. widening, deepening and straightening of channels).
• Other structures that modify the natural flow of rivers, including weirs, sluices, culverts and bridge crossings and bank protection works.
4.42 There are no significant sections of raised embankment or river wall along any of the Chichester SFRA watercourses (River Lavant, Bosham Stream, River Ems, Pagham Rifes and the Rifes of Manhood Peninsula). However there is a disused sluice gate on the Bosham Stream.
4.43 The River Lavant is highly modified, with the first modifications believed to have occurred in Roman times when the river was diverted through Chichester to provide a source of water for the town. Following the floods of 1994 and 2000, the river was modified again through the introduction of the River Lavant Flood Relief Scheme. This scheme consists of a by-pass channel to divert high flows away from the culverted watercourse through Chichester town centre. A proportion of river flow is diverted and discharged to a lake at Chalk Farm pit before entering a series of man-made and natural channels on the course to its outlet at Pagham Harbour.
4.44 Through consultation with the Environment Agency it has been agreed to assume that the scheme is not a flood defence but a channel improvement. Thus the flood zones (undefended) outline will be the same as the actual (defended) outline.

Flood defences and assets
Chichester SFRA (July 2008) Volume II - Technical Report
4-10
4.45 The land beside the middle reaches of the Rother, would originally have been marshy and subject to regular flooding but was cleared and drained for agriculture, defences and maintenance work becoming more important once towns and villages had established.

Flood defences and assets
Chichester SFRA (July 2008) Volume II - Technical Report
4-11
Table 4.6. River flood defences
Watercourse Defence schemes/structures Extent Defence type Owner Maintainer Estimated level of protection Recommended action
River Lavant
River Lavant FAS - Construction of a new flood flow route linking River Lavant to the Pagham Rife via a flood and uses a series of channels, tunnels, lakes and existing watercourses to reach the outfall. Scheme used when river levels are 4.1m3/s or greater. Key components of scheme include the Westhampnett Mill Bypass Control and Westhampnett Tunnels. New outfalls at Pagham Rife.
Flow route starts at Westhampnett Mill, east of Chichester to Pagham Rife outfall. A distance of about 13km
Variable - series of new diversion tunnels and control structures to convey flow from Lavant to Pagham
EA and riparian owners
EA Reduce peak flow by 4.1m3/s or more
Maintain to improve condition
River Ems Pumping station SU 7825009330 Pumping station EA EA NA Maintain to improve condition

Flood defences and assets
Chichester SFRA (July 2008) Volume II - Technical Report
4-12
Minor defence structures 4.46 NFCDD contains a wealth of information on minor defences and structures which may be
critical in preventing or controlling flooding for more frequent but smaller flood events. There are many structures which have not been mapped as these are not considered strategically significant but may be of importance at a local level.
Maintenance
4.47 The Environment Agency and local authorities carry out annual inspections of flood defence assets and update the condition in NFCDD. The data from these inspections is used to inform the riparian owner of their duty to maintain assets to an appropriate level.
4.48 The management of the river and coastal defences and assets within Chichester District is divided between a number of different parties. The Environment Agency is responsible for the majority of the tidal and river defences and has a supervisory duty over all flood defences given under the Environment Act 1995.
4.49 There is 21km of shoreline within Chichester District Council’s area. Of this, 11km is defended against erosion by Chichester DC maintained structures, 5km is defended against erosion by the Environment Agency, 1km is defended against erosion by privately owned defences and 4km is undefended.
4.50 Chichester District Council as the operating authority has the regulatory and supervisory role for flood defence on all ordinary watercourses which are not within the area of an internal drainage board (IDB). Within Chichester District, all IDBs are managed by the Environment Agency.
4.51 The Environment Agency has permissive powers to maintain and improve watercourses designated as 'Main river' and associated structures for the efficient passage of river flow and the management of water levels. The Environment Agency also has a general supervisory duty for all flood risk management activities. The development of flood risk management systems by the Environment Agency has been carried out in order to direct public funding to areas of greatest flood risk.
4.52 Culverts under roads are generally the responsibility of the relevant Highways Authority (West Sussex County Council or The Highways Agency).
References
• Environment Agency (2006) 'National Flood and Coastal Defence Database' Download supplied by the Environment Agency in December 2006
• South Downs Coastal Group (2006) 'Selsey Bill to Beachy Head Shoreline Management Plan' Final document, May 2006
• Centre for Coastal Environment, Isle of Wight Council (2006) 'Mapping Coastal Evolution and Risks in a Changing Climate'. A training pack
• Environment Agency (2007) January 07 download of data from the NFCDD
• Standing Conference on Problems Associated with the Coastline (SCOPAC) (2007) Coastal Defence and Protection http://www.scopac.org.uk/maps/protection.pdf
• South Downs Coastal Group (SDCG) (2007) 'Description of the coastline'. Available at http://www.sdcg.org.uk/

Flood warning
Chichester SFRA (July 2008) Volume II - Technical Report
5-1
5. Flood warning and emergency plans
The Chichester DC Strategic Flood Risk Assessment (SFRA) is a "live" document. The current version is developed using the best information and concepts available at the time. As new information and concepts become available the document will be updated and so it is the responsibility of the reader to be satisfied that they are using the most up-to-date information and that the SFRA accounts for this information. All revisions to this summary document are listed in the table.
Version Issue Date Issued by Issued to
Final 29/07/08 Capita Symonds
Ltd
CDC, EA

Flood warning
Chichester SFRA (July 2008) Volume II - Technical Report
5-2
Introduction
5.1 PPS25 states, 'the receipt of and response to warnings of floods is an essential element in the management of the residual risk of flooding'. Thus it recognises that flood warning and emergency planning is a useful measure for managing flood risk from extreme events.
5.2 In exceptional cases where land allocation within flood risk areas is unavoidable, new development should be designed so that flood warning complements other measures and minimises residual risk. It should not be the primary means of protection.
5.3 Flood warning and evacuation procedures can reduce the risk of people being exposed to flood waters and minimise the consequences of flooding. Effective land use planning will reduce the requirement for flood warning and emergency planning as new development is steered away from flood risk areas.
Flood warning
5.4 The Environment Agency is responsible for monitoring flood events and to issue warnings to people in properties and businesses at risk of flooding. In order to fulfil their responsibilities, the Environment Agency operates a coded warning system.
5.5 This is a four stage warning system and each stage will trigger a set of procedures for various organisations. Definitions and symbols for each warning code are described in Table 5.1.
Table 5.1 Environment Agency flood warning stages
Alert state Symbol Action
Flood Watch
Flooding of low-lying land and roads is expected in the (XXXX) Area. Be aware, be prepared, watch out!
Flood Warning
Flooding of homes and businesses is expected in the (XXXX) Area. Act Now!
Severe Flood Warning
Severe Flooding is expected in the (XXXX) Area. There is extreme danger to life and property. Act now!
All Clear
Flood Watches or Warnings are no longer in force for this area.
5.6 River flood forecasting in Chichester District is undertaken by the Environment Agency's
regional flood warning office in Worthing. Forecasting uses a combination of Meteorological Office weather forecasts and real-time data (rainfall, flow, level and soil moisture).
5.7 Forecasting flooding from the sea relies largely on data from organisations other than the Environment Agency. The Storm Tide Forecasting Service (STFS) is part of the Environment Monitoring and Response Centre at the Meteorological Office. STFS responsibilities include the forecasting of sea levels and the issuing of primary alerts to the Environment Agency and the Police when danger levels are predicted. The Environment Agency regions then operate a secondary local warning service.
5.8 A network of forty-five tide gauges around the country provides the first step in storm surge forecasting. These are maintained by the Proudman Oceanographic Laboratory in Liverpool

Flood warning
Chichester SFRA (July 2008) Volume II - Technical Report
5-3
and are linked by an interactive data logging and transmission system to which the STFS has access.
5.9 The Environment Agency maintains a FLOODLINE website (www.environment-agency.gov.uk/subjects/flood) that carries the latest information on alert states as well as a series of advice publications. Alert categories of 'Flood Warning' and higher may also be broadcast on television and radio.
5.10 Chichester District is covered by the river and sea flood warning areas listed in Table 5.2. Some areas receive flood warnings for both types of flooding. The areas covered by the flood warning service are shown in Map W in Annex A.
Table 5.2 Environment Agency flood warning service
Short area code Flood warning area
River F3B4 Broad and Earnley Rifes at Selsey - The Earnley Rife to Medmerry and the Broad Rife
to Pagham Harbour including low lying areas of Earnley, Bracklesham and western Selsey
F3C1 The River Arun from Billingshurst to District boundary at Drungewick Manor F3A1 River Ems from Westbourne to Emsworth including Lumley F3D1 River Rother from Midhurst to District boundary F3D2 River Rother from Pulborough to Midhurst F3B2 The Bosham Stream from West Ashling to Bosham Harbour
F3B3 River Lavant from Mid Lavant to Chichester, including areas at East Lavant, Shopwhyke and Westhampnett
F3C2 River Arun, Pulborough to Billinghurst
F3C3 Small area within District along the River Arun, around Bury F3B1 Small area along Oving and Aldingbourne Rife around Colworth
Sea C12B Coastal areas from Selsey Bill to Western Arm Littlehampton Harbour C12A Chichester Harbour to Selsey Bill
Emergency planning
5.11 In addition to the Flood Warning Service operated by the Environment Agency, WSCC and Boroughs and District Councils within, have a defined role in emergency planning. The role and responsibilities for emergency planning is set out by legislation following the implementation of the Civil Contingencies Act 2004 on April 1st 2005.
5.12 The Civil Contingencies Act 2004 defines the term 'emergency' as:
• "an event or situation which threatens serious damage to human welfare;
• an event or situation which threatens serious damage to the environment, or
• war, or terrorism, which threatens serious damage to security'."
5.13 Regional emergency planning is undertaken by Local Resilience Forums (known as LRFs). These are multi-agency partnerships convened in response to the Act. West Sussex is covered by the Sussex LRF partnership formed of the emergency services, health agencies, LPAs, the Environment Agency and other organisations such as the Maritime and Coastguard
Flood warning
Chichester SFRA (July 2008) Volume II - Technical Report
5-4
Agency. Together these groups prepare for incidents, including flooding, in the form of contingency plans. They respond to incidents and then assist in the recovery following the incident.
5.14 In West Sussex, if an emergency is confined to one Borough or District, then that Borough or District Council will normally undertake the local authority coordinating role. However, where more than one Borough or District is affected, West Sussex County Council will normally coordinate local authority operations. The local authorities in Sussex have agreed a mutual aid protocol that enables them to call upon each other for support during a disaster.
5.15 Version 2 of the Chichester District Emergency Plan was issues in March 2006. The Chichester District Emergency Plan aims to help the authority to respond effectively to any major emergency, irrespective of its cause, whilst maintaining its normal services. This accords with the Civil Contingencies Act 2004 and Cabinet Office guidance. The plan is prepared by the District Emergency Planning Officer.
References
• Civil Contingencies Act 2004

Flooding from rivers
Chichester SFRA (July 2008) Volume II - Technical Report
6-1
6. Flooding from rivers
The Chichester DC Strategic Flood Risk Assessment (SFRA) is a "live" document. The current version is developed using the best information and concepts available at the time. As new information and concepts become available the document will be updated and so it is the responsibility of the reader to be satisfied that they are using the most up-to-date information and that the SFRA accounts for this information. All revisions to this summary document are listed in the table.
Version Issue Date Issued by Issued to
Final 29/07/08 Capita Symonds
Ltd
CDC, EA

Flooding from rivers
Chichester SFRA (July 2008) Volume II - Technical Report
6-2
Description
6.1 Flooding from rivers occurs when water levels rise higher than bank levels, causing floodwater to spill across adjacent land (floodplain). The main reasons that water levels can rise in rivers are:
• intense or prolonged rainfall causing runoff rates and flow to increase in rivers, exceeding the capacity the channel. This can be exacerbated by wet antecedent conditions and where there are significant contributions of groundwater;
• constrictions in the river channel causing flood water to backup;
• blockage of structures or the river channel causing flood water to backup; and
• high water levels and/or locked flood (tide) gates preventing discharge at the outlet of the river.
6.2 The consequence of river flooding depends on how hazardous the flood waters are and what the receptor of flooding is. The hazard of river flood water is related to the depth and velocity, which depends on the:
• magnitude flood flows;
• size, shape and slope of the river channel;
• width and roughness of the floodplain; and
• types of structures that cross the channel.
6.3 Flood hazard can vary greatly throughout catchments and even across floodplain areas. The most hazardous flows generally occur in steep catchments and towards the bottom of large catchments. Hazardous river flows can pose a significant risk to exposed people, property and infrastructure.
6.4 Whilst low hazard flow flows are less of a risk to life, they can disrupt communities, require significant post-flood cleanup and can cause superficial and possibly structural damage to property.
Data collection
Existing hydraulic models
Detailed assessments
6.5 The Environment Agency holds a number of hydraulic models and hydrological assessments that were developed for previous river flood studies (mainly flood risk assessments). These are summarised in Table 6.1.
6.6 Many of these models are too detailed for the SFRA assessment and have already been incorporated in catchment flood management plan (CFMP) models developed by the Environment Agency (see Section 6.10).

Flooding from rivers
Chichester SFRA (July 2008) Volume II - Technical Report
6-3
Table 6.1 Previous hydraulic models used in river flood studies
Name Scenario Date
of model
Return Period Consultant Model Type
Date of land
survey
Date of river
survey
Chichester Undefended 2010 2005 200 CS TUFLOW 1997-2000 1997-2000
Chichester Breach 2010 (with defences) 2005 200 CS TUFLOW 1997-2000 1997-2000
Chichester Defended 2010 2005 200 CS TUFLOW 1997-2000 1997-2000
Chichester 2060 Breach (with defences) 2005 200 CS TUFLOW 1997-2000 1997-2000
Chichester 2060 Undefended 2005 200 CS TUFLOW 1997-2000 1997-2000 Chichester ABD 2010 2005 200 CS TUFLOW 1997-2000 1997-2000
Selsey Breach 2010 (with defences) 2005 200 CS TUFLOW 1997-2000 1997-2000
Selsey Breach 2060 (with defences) 2005 200 CS TUFLOW 1997-2000 1997-2000
Selsey Defended 2010 2005 200 CS TUFLOW 1997-2000 1997-2000 Selsey Undefended 2010 2005 200 CS TUFLOW 1997-2000 1997-2000 Selsey Undefended 2060 2005 200 CS TUFLOW 1997-2000 1997-2000 Selsey ABD 2010 2005 200 CS TUFLOW 1997-2000 1997-2000 Ems 2006 100 PBA Lavant 2006 PBA Bosham 2006 100 PBA Aldingbourne Rife
2010 Depth of flooding. Defended 2003 100? MM HYDRO-1D 1996?
Aldingbourne Rife
2060 Depth of flooding. Defended 2003 100? MM HYDRO-1D 1996?
Aldingbourne Rife 2010 flood. Defended 2003 100? MM HYDRO-1D 1996? Aldingbourne Rife 2060 flood. Defended 2003 100? MM HYDRO-1D 1996?
Upper Arun IFPM 2002 2, 5, 25, 50, 75, 100 PBA TUFLOW 1996 1997/1998
* CS = Capita Symonds, MM = Mott MacDonald
National generalised broad scale flood modelling (JFLOW)
6.7 In 2004, the Environment Agency commissioned national generalised broad scale modelling, using a 2D raster flood spreading model (JFLOW), all rivers in England and Wales. At the time, these models were based on a SAR DTM which had flood defences and major infrastructure removed.
6.8 Flow estimates were derived using an automated system of the Flood Estimation Handbook (FEH) Statistical Method. A flow estimate was defined every 200m along all flow paths with catchment greater than 3km2. Flood outlines for the 1 per cent AEP and 0.1 per cent AEP floods were generated. These flood outlines form the basis of the Environment Agency Flood Zone maps as published on their website.
6.9 The Environment Agency Flood Zones are periodically updated as new information becomes available. The latest version (v3.3) was received in January 2007 and has been used to determine areas at risk of flooding where CFMP were not available.
Broadscale CFMP models
6.10 The production of Environment Agency Catchment Flood Management Plans (CFMPs) involves an evidenced-based policy appraisal, which requires an understanding of current and future flood risk. This understanding has been developed by collating flood related datasets and undertaking broadscale flood modelling.

Flooding from rivers
Chichester SFRA (July 2008) Volume II - Technical Report
6-4
6.11 Map M3 in Annex A shows the extent of the broadscale CFMP models that were provided by the Environment Agency for use in the SFRA. These models were reviewed to identify their relevance to the SFRA. Their key features are summarised in Table 6.2.
River Arun and Western Streams
6.12 The River Arun CFMP used results from seven different flood models. Some of the models were built from base datasets and others were based on existing models. All of the seven models were built using TUFLOW and used topographic data from a mixture of ground survey, LIDAR, SAR and photogrammetry. In some areas, model cross-sections were estimated and less confidence could be placed on the model results. The extents of the seven models were:
• Lavant - upstream model extent near West Dene and downstream model extent was just downstream of the A27 in Chichester. Outfall via uni-directional culvert into Chichester Harbour. The model also included the Pagham and Bremere Rifes which discharged into Pagham Harbour via uni-directional culverts;
• Aldingbourne - upstream extent of model on tributaries at Aldingbourne and Westergate and downstream model extent was at the English Channel in Bognor Regis;
• Bosham - the upstream model extent was north of the A27 in West Ashling and the downstream extent was in Bosham;
• Ems - the upstream extent of the model on the Ems was upstream of the A27 in Westbourne and the downstream model extent was the estuary in Emsworth;
• Wittering - the upstream extent of modelling on the Wittering was at Holme Farm, east of West Wittering and the downstream extent of the model was at the English Channel in East Wittering;
• Selsey - the upstream extents of the model were on the tributaries near Somerly, Aldington and Highleigh, south of the A246. The downstream extent of the model was where the Rife entered the English Channel, west of Selsey; and
• River Arun and Western Rother - the upstream extent of the model on the eastern branches of the River Arun was at Horsham and on the western branch was at Chiddingfold on the A283. The River Rother was modelled from Chithurst (west of Midhurst) to the confluence with the River Arun. The downstream extent of the model on the River Arun was where the river entered the English Channel near Littlehampton.
6.13 All seven watercourses and thus models were connected to harbours or to the English Channel. For this reason the downstream tidal boundary was an important factor in determining flood risk. The tidal boundaries were reviewed for the purposes of the SFRA. The downstream of most of the models were flapped and represented by a uni-directional culvert element. The models included the impact of flood defences.
6.14 Climate change was investigated in two future scenarios. A 20 per cent increase in river flows and 300mm on sea level was used for a 50 year time horizon and a 30 per cent increase in river flow and 600mm on sea level was used for a 100 year time horizon. These scenarios were not consistent with the latest Government predictions on climate change and were updated in this commission.

Flooding from rivers
Chichester SFRA (July 2008) Volume II - Technical Report
6-5
Table 6.2 Summary of key CFMP model features
Topography Boundary conditions Model
DTM Survey Hydrology Tidal boundary Materials
Grid cell size (m)
Flood defences included in model Calibration / verification
Lavant LiDAR Existing ISIS model
Unidirectional culverts into Pagham and Chichester harbours
30
River Lavant FAS: flood flows on diverted upstream of Chichester through culverts into flood storage area. Outfall of flood storage area is Pagham Rife.
Aldingbourne Mix of LiDAR & SAR
Some channel survey
Unidirectional culvert into Chichester Harbour 20 Pumping station at tidal outfall
Bosham LiDAR Some channel survey
Unidirectional culvert into Chichester Harbour 15
None (note: NFCDD contains a bypass sluice to relieve flood flows through Bosham village. However the Environment Agency have advised that this is no longer operational.
Ems LiDAR Some channel survey
Open outfall into Chichester Harbour 10 None
Wittering Mix of LiDAR & SAR None Unidirectional culvert into
English Channel 20 None
Selsey Mostly SAR None Unidirectional culverts into English Channel and Pagham Harbour
20 Small earth banks along some sections of watercourse
Arun and Western Rother
Mix of LiDAR & SAR
Some channel survey
Broadscale FEH rainfall runoff methods checked against more detailed studies
Open channel into English Channel
OS mapping
50 Flood embankments along both sides of river
Checked and approved by Environment Agency and CFMP Steering Group members

Flooding from rivers
Chichester SFRA (July 2008) Volume II - Technical Report
6-6
CFMP tidal boundaries 6.15 Most of the downstream boundaries used in the CFMP models were taken from existing
models provided by the Environment Agency. For this reason, the downstream boundary conditions were assumed appropriate for use in the CFMPs. As the SFRA must consider the source and certainty of datasets, it was important to review the downstream boundary conditions to make sure that they were "fit for purpose".
6.16 Where watercourse outlets are flapped, sea levels only have a minor influence on flooding, in the form of tide-locking. Where the watercourse is open to the sea, the impact of sea and tide levels is much greater.
6.17 At Pagham Harbour the peak water level was typically 2.85mAOD and the river flood event resulted in a peak in the order of 4.2mAOD. The Chichester Harbour outfall boundary condition was based on a predicted tide with a maximum water level of 2.4mAOD. The highest astronomical tide (HAT) for Chichester was 2.51mAOD and the mean high water spring (MHWS) was 2.05mAOD, which showed that the boundary condition was quite conservative. Although the boundary was reasonable it did not reflect any hydraulic processes within Chichester Harbour.
6.18 The downstream boundary of the Aldingbourne Rife is a flapped outfall (uni-directional culvert) and an outfall pump. A sinusoidal tide was used as the downstream boundary condition with a peak level of 3.12mAOD. Mean high water spring was 2.65mAOD, highest astronomical tide was 3.31mAOD, and the 1 in 1 year water level was estimated to be 3.2mAOD (JBA), which showed the downstream boundary condition to be conservative for a river flood model.
6.19 At Bosham, where the rifes meet Chichester Harbour, two out of the three outfalls contained uni-directional culverts. The applied boundary condition was a predicted tide (for Chichester Harbour) with a maximum water level of 2.4mAOD. Highest astronomical tide for Chichester was 2.51mAOD and the mean high water spring was 2.05mAOD, which showed that the boundary condition was reasonably conservative. Again none of the hydraulic properties of Chichester Harbour were represented in the model.
6.20 For the Ems model again the applied boundary condition was a predicted tide (for Chichester Harbour) with a maximum water level of 2.4mAOD which was reasonably conservative, however did not account for the hydraulic properties of Chichester Harbour. The boundary condition was applied directly to the 2D domain, which is likely to have produced more accurate results.
6.21 The downstream boundary for the Wittering model included a uni-directional culvert and a weir at 4.71mAOD. The same tidal boundary was used for this model as for the River Arun (observed tide with a peak of 3.0mAOD). This tidal boundary required a review for the purposes of the SFRA.
6.22 The downstream extent of the Selsey model was the outfall to the English Channel. Part of the model also drained into Pagham Harbour through a uni-directional culvert. The downstream boundary into the English Channel also consisted of a uni-directional culvert. The same tidal boundary was used for this model as for the River Arun and a constant (0mAOD) water level was applied to Pagham harbour. This boundary required a review to more accurately reflect the impact of tide-locking.
6.23 Table 6.3 summarises the downstream boundary conditions of existing CFMP models and whether a review was undertaken.

Flooding from rivers
Chichester SFRA (July 2008) Volume II - Technical Report
6-7
Table 6.3 Model downstream boundary conditions
Model (outfall) Downstream boundary Flapped Review undertaken
Lavant (Pagham Harbour)
Tidal with river influence Y Review undertaken
Lavant (Chichester Harbour) DS_HT_Chichester Y Review undertaken
Aldingbourne (Chichesterh Harbour) DS_HT_Chichester Y Review undertaken
Bosham (Chichester Harbour) DS_HT_Chichester Some Review undertaken
Ems (Chichester Harbour) DS_HT_Chichester N Review undertaken
Wittering (English Channel) ScenarioA4_tide.csv Y Review undertaken
Selsey (English Channel) ScenarioA4_tide.csv Y Review undertaken
Selsey (Pagham Harbour) Constant 0mAOD Y Review undertaken
Arun and Western Rother (English Channel)
ScenarioA4_tide.csv N Review undertaken
Existing hydrological assessments
Broadscale CFMP hydrology
6.24 The hydrology of the main catchment areas of interest was previously assessed as part of Environment Agency Catchment Flood Management Plans (CFMPs) for the area. The hydrological assessment undertaken for the CFMPs followed a broadscale FEH Rainfall Runoff method. All flows were estimated using the FEH Rainfall Runoff Method based on unadjusted FEH CD-ROM catchment descriptors. The validity of the flows was assessed through comparison with previous more detailed Environment Agency flood studies, historic flooding information and hydrometric data. Flows were scaled to match this verification data where appropriate. Particular care was taken to verify the flows in permeable catchments where the FEH Rainfall Runoff Method is known to over-estimate. The methods adopted in each catchment are summarised in Table 6.5.
CEH automated statistical dataset
6.25 Hydrological flow estimates for most UK watercourses have been derived by the Centre for Environment and Hydrology (CEH) through the development of their Automated Statistical dataset. The dataset consists of cumulative FEH Statistical Method (pooled analysis) flow estimates for a range of return periods at 50m intervals along all watercourses in the UK with a catchment greater than 3km2. The methodology used to determine them is a broadscale, automatic version of the FEH Statistical Method. This does not involve pooling group review or weighting of flow estimates to stations higher up pooling groups.
6.26 Despite these limitations, the dataset is a very useful source of information, particularly for permeable catchments where the broadscale FEH Rainfall Runoff Method is known to over-estimate.

Flooding from rivers
Chichester SFRA (July 2008) Volume II - Technical Report
6-8
Detailed hydrological assessments
6.27 The hydrology for a number of reaches within the two main catchment areas of interest (the River Arun and West Sussex Rifes) has previously been assessed as part of Environment Agency detailed flood studies (S105 and SFRM).
6.28 Environment Agency S105 and SFRM studies involve detailed hydrological assessment and hydraulic modelling in critical flood risk areas. The key outputs are water level, flow and depth data for a range of return periods, as well as a set of online flood maps for use in development control and landuse planning.
6.29 Table 6.4 provides a summary of the detailed studies in the two main catchments within Chichester District that included flow estimates. The flow estimates from these studies were compared to those estimated in the CFMPs, to ensure the broadscale methods used in the CFMP were producing realistic flow estimates.
Table 6.4 Summary of Section 105 and SFRM studies used verification of the CFMP flow estimates
Catchment Study Consultant Date River Arun Flood Study Peter Brett Associates 2003 Arun Toddington Lane, Littlehampton Flood Risk Assessment (Revision B)
Peter Brett Associates 2004
Land Drainage Study of the Manhood Peninsula Royal Haskoning 2003 Aldingbourne Rife Flood Risk Mapping Study Mott MacDonald 2003 River Lavant Flood Alleviation Scheme Binnie Black & Veatch 2003
West Sussex Rifes
North East Chichester Strategic Partnership Report on Flood Risk
Binnie Black & Veatch 2006

Flooding from rivers
Chichester SFRA (July 2008) Volume II - Technical Report
6-9
Table 6.5 Summary of CFMP hydrology
CFMP area Catchment Method used to estimate flows
Critical storm durations modelled
River Arun Un-calibrated FEH Rainfall Runoff Method peak flow estimates were used in the model without any alteration as they had been verified against previous studies as part of the CFMP, and the catchment is not highly permeable hence it is reasonable to assume standard baseflows.
12 hours 20 hours 29.75 hours
Aldingbourne Rife
The un-calibrated FEH Rainfall Runoff Method peak flow estimates for the permeable sub-catchments (AL_02, AL_03, AL_15 – AL_18) were adjusted for the effects of permeability based on local hydrometric data. The baseflow for each of the permeable sub-catchments was increased to 0.8m3/s and the hydrographs were scaled by a factor of 0.255.
15 hours
Bosham Stream The un-calibrated FEH Rainfall Runoff Method peak flow estimate for sub-catchment B_01 was adjusted for the effects of permeability based on local hydrometric data. The baseflow for the sub-catchment was increased to 0.36m3/s and the hydrograph was scaled by a factor of 0.183.
8 hours
River Ems The un-calibrated FEH Rainfall Runoff Method peak flow estimates for sub-catchments EMS_01 and EMS_02 were adjusted for the effects of permeability based on local hydrometric data. The baseflow for the sub-catchments was increased to 0.36m3/s and the hydrographs were scaled by a factor of 0.183.
11 hours
River Lavant The un-calibrated FEH Rainfall Runoff Method peak flow estimates for sub-catchments RL_01 and RL_02 were adjusted for the effects of permeability based on local hydrometric data. The baseflow for the sub-catchments was increased to 0.8m3/s and the hydrographs were scaled by a factor of 0.255.
9 hours
Arun and Western Streams
Manhood Peninsula
Un-calibrated FEH Rainfall Runoff Method peak flow estimates were used in the model without any alteration as they had been verified against previous studies as part of the CFMP, and the catchment is not highly permeable hence it is reasonable to assume standard baseflows.
9 hours (E. Wittering) 11 hours (Selsey)

Flooding from rivers
Chichester SFRA (July 2008) Volume II - Technical Report
6-10
Topographic data 6.30 Map T1 in Annex A shows the availability of topographic datasets held by the Environment
Agency within Chichester. Topographic datasets include:
• Synthetic Aperture Radar (SAR) dataset over the whole county with a vertical root mean square error (RMSE) in the order of ± 1m;
• Light Detecting and Ranging (LiDAR) dataset over much of the county with a vertical RMSE in the order of ± 0.15m;
• Photogrammetry over much of the coastline with variable RMSE; and
• Ground survey of river cross-sections along most of the main watercourses with a vertical RMSE of less than ± 0.05m.
6.31 All topographic data has been used in the SFRA, with a preference to sources which are more accurate. Map T2 in Annex A provides an overview of the topography across the Chichester District.
Historic flooding 6.32 Historic incidents of river flooding have been collected from various sources as summarised in
Table 6.6. A preliminary review of the datasets has identified in broad terms the locations and types of previous flooding problems. Map H in Annex A shows the locations of previous flood events.
Table 6.6 Historic flood datasets
Source Details Area Covered Status Description
EA Southern Region Autumn 2000 Floods Review
West Sussex Received Review of sources and impacts of flood incidents
Arun and Western Rifes CFMP and Adur CFMP Downlands flooding
report Downlands Received Assessment of flood defences
Environment Agency
West Sussex Flood Events Database West Sussex Received
GIS Layers including information on type, date and source of flooding
Chichester DC Parish Flood records
Various locations Received
Various hardcopy questionnaires and records from the public
WSCC Parish Flood records
Various locations
Not available at time of SFRA
-
Southern Water Database of flooding incidents
Various locations
Received but not analysed during SFRA
-
6.33 There have been many recorded flooding incidents across the District. Two events of note occurred in 1974 and 2000 where widespread flooding was observed across the district. During these events fluvial flooding affected many of the watercourses, in particular the Lavant through Chichester.

Flooding from rivers
Chichester SFRA (July 2008) Volume II - Technical Report
6-11
Data held by Chichester District Council
6.34 Historic flood event information has been collected by Chichester County Council since 2000.
Flood information has been collected by requesting all parishes to complete an annual Flood Survey Questionnaire. On initial review of the data it would seem that on average two thirds of Parishes respond to the survey. It may be assumed that Parishes that do not respond do not suffer significant flood related issues.
6.35 The annual Flood Survey Questionnaire has been sent by Chichester County Council to each of the 68 Parishes within the District for each of the winters form 2000 to 2004. A lack of resources and a dry winter led to no survey being sent out for 2005. The questionnaire is a one page A4 document with tick boxes to indicate what type of flooding occurred, what was affected and for how long, and the cause of flooding. Maps of the Parish extent have also been sent with the questionnaires and have been returned with annotations indicating areas of serious flooding and letters detailing other events of value added to the archive.
6.36 Some parishes have submitted to the District Council detailed reports of flood events and issues affecting their areas. Both Bosham and Lavant Parish Council’s are examples of Parishes that have published detailed reports of the localised and recurring flooding problems affecting their Parishes. In the case of Lavant Parish Council, the questionnaire prompted just such a detailed approach.
6.37 All the collected data is still stored in its original paper based format. No spatial analysis of the information has been undertaken, nor can it be, unless the records are digitised. Spatial analysis of the information would provide valuable further insight into the flood issues affecting the District. It is recommended that future records a stored in a suitable geo-reference digital data format and that paper based records are digitised for inclusion in future revisions of the SFRA.
Methods for assessing flood risk
6.38 The level of assessment required for the SFRA is broadscale. For this reason, existing datasets and tools have been used were possible to provide flood risk information across the District.
6.39 The Environment Agency holds a dataset of Flood Zones for all catchments greater than 3km2 in size. These zones are published on their website. The zones are primarily based on the results of their national generalised broad scale modelling (JFLOW). In some locations, they are based on more detailed hydraulic modelling, if these models were found to be more appropriate.
6.40 These flood zones were interrogated to form the basis of many of the SFRA datasets over the entire Chichester District. Where CFMP models were available, the results were compared to determine which dataset was more appropriate for use in the SFRA.
Flood zones
6.41 As defined in Table D1 of PPS25, flood zones indicate the land at risk of flooding, ignoring the presence of flood defences. These zones present the first step in assessing the risk of river (and sea) flooding at a location.
6.42 The models developed for CFMPs are considered more detailed than the Environment Agency national generalised broadscale flood zones. Where CFMP models were available, the results were compared to determine which dataset was more appropriate for use in the SFRA.
6.43 PPS25 provides guidance on the definition of the Flood Zone 3b - the functional floodplain:

Flooding from rivers
Chichester SFRA (July 2008) Volume II - Technical Report
6-12
"SFRAs should identify this Flood Zone (land which would flood with an annual probability of 1 in 20 (5%) or greater in any given year or is designated to flood in an extreme (0.1%) flood, or at another probability to be agreed between the LPA and Environment Agency, including water conveyance routes."
The Practice Companion Guide to PPS clarifies that this should be with flood defences in place.
6.44 Flood Zone 3b was defined using the CFMP models, with defences, for the 5% AEP flood event. Where CFMP models were not available, Environment Agency Flood Zone 3 was used instead, as advised in the PPS25 Practice Companion Guide.
6.45 In addition to Flood Zones for the current conditions, Future Flood Zones have also been produced. Future Flood Zones enable the users of the SFRA to consider the future flood risk at a site based on climate change predictions and as such this approach is considered to conform to the precautionary approach identified in PPS25. The method used to define the Future Flood Zone is described in section 6.63.
Actual risk
6.46 Actual risk shows the land at risk of flooding, when existing flood defences are in place. For the purposes of the SFRA, the flood defences are assumed to operate in perfect condition and to their specified design standard. The analysis considers flooding from a river event with a 1 per cent AEP.
6.47 Actual risk was defined using CFMP models substituted with GIS analysis of Environment Agency Flood Zones.
Residual risk
6.48 Residual risks are those which result from a:
• flood of greater magnitude than that for which flood defences were designed; and/or
• breach or failure of flood defence and other assets
6.49 These risks are particularly important because although they are less likely to occur, the consequences of them occurring are greater.
6.50 Residual risk was defined using CFMP models and Environment Agency Flood Zones.
Hydrological assessment 6.51 To meet the objectives of the SFRA a broadscale hydrological assessment has been
undertaken. The approach adopted was based on broadscale Flood Estimation Handbook (FEH) methods, verified with existing studies and other sources of data, to produce flow estimates of reasonable certainty, appropriate to the aims of the SFRA. The main sources of hydrological data used in the verification process were Environment Agency Catchment Flood Management Plans (CFMPs), Centre for Environment and Catchment Hydrology (CEH) Automated Statistical dataset, and Environment Agency commissioned detailed flood studies.
6.52 As the CFMPs cover such a large area of the Chichester District and used a broadscale approach, the broadscale Rainfall Runoff CFMP methodology has been used as a basis upon which to build the hydrology of the SFRA.
6.53 CFMPs require flood outlines for the 20, 10, 4, 1 and 0.5 per cent AEP flood events whereas SFRAs require flood outlines for the 5, 1 and 0.1 AEP flood events. As such the 1 per cent AEP CFMP hydrology was modified to obtain 5 and 0.1 per cent AEP flow estimates by changing the return period in each iSIS .DAT file. This has the effect of changing the amount
Flooding from rivers
Chichester SFRA (July 2008) Volume II - Technical Report
6-13
of rainfall received by the catchment over the course of the specified storm duration (i.e. it alters the rainfall intensity and therefore the runoff). The flow estimates determined for each flow node are provided in Table A in Annex B.
6.54 The 1 per cent AEP year peak flow estimates for the Arun and West Sussex Rife catchments were compared to other studies during the development of the CFMPs. These flows were accepted by the Environment Agency and thus it was assumed that they were suitable for use in the SFRA. To ensure that the 5 and 0.1 per cent AEP flood flows were also suitable, they have been compared to flow estimates derived using other estimation methods. It was particularly important to review the 0.1 per cent AEP flood flows as the FEH Rainfall Runoff Method is prone to over-estimate larger flows, particularly in the permeable catchments.
6.55 The FEH Statistical Method is based on a large dataset of flood events and has been directly calibrated to reproduce flood frequency on UK catchments. It is also recommended over the FEH Rainfall Runoff Method for flood estimation in permeable catchments where the runoff response to rainfall may be limited. Thus the 5 and 0.1 per cent AEP flow estimates were compared with the CEH Automated Statistical dataset.
6.56 The comparison identified significant differences between the Automated Statistical dataset and the broadscale Rainfall Runoff flows. This was particularly evident in the 0.1 per cent AEP event for the Lower Arun, the Aldingbourne Rifes, the River Lavant, the Bosham Stream and the River Ems. These were all permeable catchments, where over-estimation was expected. A table showing the comparison between the FEH Rainfall Runoff flow estimates and the Automated Statistical flow estimates is provided in the flow adjustment table (Table B in Annex B).
6.57 Due to the significant over-estimation of the broadscale Rainfall Runoff method, the 0.1 per cent AEP flood flow estimates were modified. The exception to this was the River Lavant where, although there were differences between the two sets of flow estimates, the FEH Rainfall Runoff estimates were considered the most appropriate in light of previous studies undertaken to develop the Lavant Flood Defence Scheme.
6.58 0.1 per cent AEP flood flow estimates for the nodes on the Lower Arun, the Aldingbourne Rifes, the Bosham Stream and the River Ems were adjusted by scaling the 1 per cent AEP broadscale Rainfall Runoff Method flows by the same factor as the difference between the 1 per cent and 0.1 per cent AEP Statistical flows for that sub-catchment. The factors used in scaling the flows and the final 0.1 per cent AEP flood flow estimates can be seen in the flow adjustment table (Table B in Annex B) together with the final flows used on each of the watercourses.
Tidal boundaries 6.59 As the models were used to assess river flooding only, a mean spring tide was used on the
sea to ensure that no flooding from the sea was experienced. The tidal boundaries used in the CFMPs were reviewed to make sure that they were appropriate and that the latest data was incorporated.
6.60 The tidal boundaries used in the SFRA were based on POLTIPs and software provided by the Proudman Oceanographic Laboratory. A set of tidal harmonics exists for a large number of main ports around the UK where sufficient water level data has been collected. These ports are called “standard ports” and POLTIPS can compute a full time-series of water level predictions based at these locations. At other ports “secondary ports,” where long periods of tidal observations do not exist, predictions are based on the nearest standard port with time and height differences applied to the high and low waters. Each secondary port has four separate time differences depending on whether high or low waters are being predicted and on the time of the day. There are also four height differences for mean high and low water springs and neaps. Time series data cannot be produced for a secondary port.

Flooding from rivers
Chichester SFRA (July 2008) Volume II - Technical Report
6-14
6.61 The Mean High Water Spring (MHWS) and the Mean Low Water Spring (MLWS) values, obtained from POLTIPs, were used to develop a sinusoidal tidal hydrograph for each model (see Figure 6.1).
6.62 Different tidal boundaries were determined for each of the sea (coastal/tidal) and river models. However for the Selsey coastal model two different tidal boundaries were determined, one for Pagham Harbour and another for the boundaries in the English Channel. Table 6.6 contains a summary of the different parameters used.
Sinusoidal Tide (mAOD)
-3.0
-2.0
-1.0
0.0
1.0
2.0
3.0
4.0
0 12 24 36 48 60 72
Time (Hours)
Wat
er L
evel
(mA
OD
)
Sinusoidal Tide (mAOD)
Figure 6.1 Total storm tide for the tidal boundaries used in the SFRA
Table 6.6 Parameters used to produce SFRA tidal boundaries
Location Mean high water
spring (mAOD from POLTIPs)
Mean low water spring (mAOD from POLTIPs)
Secondary Port
Chichester 2.05 -1.81 Standard Port Selsey 2.3 -2.3 Portsmouth Selsey, Pagham Harbour 2.55 -2.55 Portsmouth
River Arun (Littlehampton) 2.85 -2.65 Shoreham
Harbour
Impact of the revised climate change guidance 6.63 FCDPAG3 Economic Appraisal: Supplementary Note to Operating Authorities – Climate
Change Impacts October 2006. The note was issued in November 2006 and informs appraisers and decision makers of new climate change allowances and broadly how these should be considered when assessing flood risk. Defra expects this note to be applied to all future appraisals, strategies and management plans that have started since October 2006.

Flooding from rivers
Chichester SFRA (July 2008) Volume II - Technical Report
6-15
6.64 The guidance is also referred to in PPS25 Annex B where it states that “…the most up to date guidance on climate change…should be considered in the preparation of Regional Flood Risk Assessments, Strategic Flood Risk Assessments…”.
6.65 The most important points to consider are the:
• Updated figures of Regional net sea level risk allowances contained within Table 1 (of the note).
• New indicative sensitivity ranges covering peak rainfall intensity, peak river flow volume, offshore wind speed and extreme wave heights in Table 2 (of the note).
• The precautionary approach in assessing sea level rise.
• Use of sensitivity analysis to reflect the greater uncertainty in predictions of flows, rainfall, and wind and wave action on sea levels.
• Response to climate change through either managed/adaptive or precautionary approaches. Note: for land use planning, a precautionary approach is recommended.
6.66 In the SFRA, the baseline was set as 2006 and climate change time horizons of 2056 and 2106 were considered. These epochs are consistent with the approximate design life of industrial and residential land uses. It will be up to the decision-maker to select the most appropriate time horizon for the specific land use.
6.67 Unlike previous climate change guidance, the latest guidance predicts that sea levels will rise at different rates over the next 100 years. A comparison of the superseded and revised rates of rise are summarised in Table 6.7. For this reason, a different sea level is required when climate change for each time horizon is modelled.
Table 6.7 Comparison of the latest and superseded estimates of sea level rise
Year Sea-Level Guidance 2056 2106
Superseded guidance (constant rate of 6mm/year) 336 636 Latest guidance (exponential growth rate) 367 1030
6.68 Accordingly, the SFRA baseline (2006 model) tide boundary level was increased by 0.024m, to account for the increase since they were estimated in 2000. It was assumed that the 2000 water levels included for sea level rise from 1990 (the baseline for the Defra climate change guidance). For the 2056 and 2106 scenarios the tide levels were increased by 0.367m and 1.03m, respectively.
6.69 The Defra guidance also provides guidance on how flows will change over time. River flows in catchments that are not small or urban are expected to increase by 10 per cent in 25 years and 20 per cent in 50 to 100 years. Both the 50 and 100 year time horizons were modelled to indicate possible impacts of climate change. Whilst the sea levels modelled changed over these two time horizons, a 20 per cent increase in flow was used in both.
6.70 The method is considered to conform to the precautionary approach identified in PPS25. The managed/adaptive approach discussed in FCDPAG3 is not considered within the planning guidance. Planning led intervention or “no-regret” actions derived during the SFRA and based on a precautionary approach will be used to inform the Sequential Test.
6.71 The following Future Flood Zones were produced based on climate change predictions for the next 50 to 100 years. The information and methods used to produce these Future Flood Zones were agreed with the Environment Agency and are detailed in Table 6.8. The Future

Flooding from rivers
Chichester SFRA (July 2008) Volume II - Technical Report
6-16
Flood Zones were produced for two time horizons, 2056 and 2106. It should be noted that at this stage the Future Flood Zone 2 was not required for river flooding.
Table 6.8 Approach to producing Future Flood Zones
Future Flood Zone Method Fluvial FZ 3b 2056 Use SFRA Fluvial Flood Zone 3a Fluvial FZ 3b 2106 Use SFRA Fluvial Flood Zone 3a Fluvial FZ 3a 2056 Use a combination of SFRA climate change (fluvial defended) 1%
AEP 2056 flood outline and SFRA Flood Zone 2. Flood Zone 2 was used in areas where defences exist or/and where there are no models.
Fluvial FZ 3a 2106 Use a combination of SFRA climate change (fluvial defended) 1% AEP 2106 flood outline and SFRA Flood Zone 2. Flood Zone 2 was used in areas where defences exist or/and where there are no models.
CFMP modelling
Scenarios
6.72 The hydraulic models developed for the Environment Agency CFMPs were reused for this commission. These models were checked and approved by the Environment Agency during the development of the CFMPs and thus were assumed appropriate without adjustment for use in the SFRA. The model files were not adjusted thus the key model features described in Table 6.2 remain relevant to this commission.
6.73 Whilst the models themselves were unadjusted, the flood defences, hydrology and tidal boundaries were checked to make sure that they were appropriate for use in the SFRA according to the latest Government guidance.
6.74 Where available, the models were used to define three components of flood risk: flood zones, actual risk and residual risk, as described in the following sections.
Flood zones
6.75 Flood Zones 2 and 3a show estimated flood extents ignoring the presence of flood defences. The following steps were undertaken to redefine the flood zones using CFMP models:
• Key flood defences as identified in Chapter 4 of this report were removed. Table 6.9 provides a summary of the defences and methods of removing them from the CFMP models.
• The hydrological inflows and tidal boundaries were updated as described earlier. The 1 per cent and 0.1 per cent AEP river flow estimates were modelled with a mean spring tide boundary.
• The model results were processed using the methods outlined in Section 6.75.
• The CFMP model results and Environment Agency Flood Zones were compared to determine the preferable method for defining Flood Zones in each flood cell across the district. In general CFMP model results were given preference over Environment Agency Flood Zones
6.76 Unlike the other Flood Zones, Flood Zone 3b (Functional Floodplain) does not ignore the presence of flood defences. The functional floodplain was defined using the CFMP models by:

Flooding from rivers
Chichester SFRA (July 2008) Volume II - Technical Report
6-17
• Reviewing and amending model files where necessary, to ensure that all key flood defences (as identified in Chapter 4) were included in the models.
• Updating the hydrological inflows (5 per cent AEP) and tidal boundaries (mean spring tide).
• The models were rerun and processed in the same way as Flood Zones 2 and 3a.
• The Environment Agency does not currently hold a national dataset for the functional floodplain. Thus no cross-comparison could be undertaken. For quality control purposes, the results were sensibility checked.
Actual risk
6.77 Actual risk was determined by using the 'with defences' model (functional floodplain model) to model the 1 per cent AEP flood. The results were processed in the same way as Flood Zones. Environment Agency Flood Zones were used to substitute areas outside the CFMP model extents (see Section 6.75).
Residual risk
6.78 Residual risk (overtopping) was determined by modelling the 0.1 per cent AEP river flood event and climate change 1 per cent AEP river flood event in the 'with defences' model (functional floodplain model). The results were processed in the same way as Flood Zones. Environment Agency Flood Zones were used to substitute areas outside the CFMP model extents (see Section 6.75).
6.79 Residual risk (failure) was too detailed to comprehensively model in the SFRA, however locations of probable failure were considered and selected failure scenarios were modelled to provide an indication of the residual risk. (see Section 6.92)
Table 6.9 Summary of flood defences removed from CFMP models
Model Key flood defences included/ removed from CFMP models Method of removal
Lavant
River Lavant FAS: flood flows on diverted upstream of Chichester through culverts into flood storage area. Outfall of flood storage area is Pagham Rife.
Diversion to flood storage area removed (ignore flag in 1d network). Floodwaters remain in River Lavant during flood event.
Aldingbourne Pumping station at tidal outfall Pumping station at outlet removed. Bosham None - Ems None - Wittering None -
Selsey Small earth banks along some sections of watercourse
Z-Polygons used to lower embankment to surrounding ground levels. Ground levels defined using LiDAR and SAR DTMs.
Arun and Western Rother
Flood embankments along both sides of river
Z-Polygons used to lower embankment to surrounding ground levels. Ground levels defined using LiDAR DTM.

Flooding from rivers
Chichester SFRA (July 2008) Volume II - Technical Report
6-18
Processing of results
6.80 Water level results from the CFMP TUFLOW models were processed to form flood outlines and depth grids for the purposes of the SFRA. A range of other results are available, however are not required at this level of assessment.
6.81 The following steps were followed to process the results:
• Maximum water levels were extracted as .ASC and .MIF points from the relevant _h.DAT TUFLOW results files (note: more than one file may have been interrogated if several storm durations were run).
• .MIF points were converted to a water surface using an inverse distance weighting procedure in the GIS software package GRASS. The same software package was used to subtract the water surface from the ground DTM to produce a depth grid.
• The .MIF depth grid and .ASC depth grid were imported into MapInfo/Vertical Mapper to analyse and contour to produce flood outlines. The resultant two flood outlines were merged. This ensured the flood outlines reflected the model results and incorporated the improved topographic information available through the GRASS process.
• The flood outlines were cleaned by removing all dry islands less than 200m2 in size.
Environment Agency flood zones 6.82 The Environment Agency Flood Zone maps (based on national generalised broad scale
modelling) are available for the whole of Chichester District. Where CFMP models were not available, these zones were used to define Flood Zones 1, 2 and 3a, as per Table D1 of PPS25.
6.83 Following the approach outlined in the Practice Guide Companion to PPS25 (CLG 2007), where the functional floodplain had not been defined with CFMP models, the entire Environment Agency Flood Zone 3 was assumed to be functional floodplain (Zone 3b).
6.84 All key flood defences in Chichester District were located within the extents of the CFMP models. Thus in areas outside the model extents, with no flood defences, the Flood Zones as defined in Table D1 of PPS25 are the same as actual and residual risk.
Breach or failure risks 6.85 Whilst the probability of a breach or failure of flood defences or assets is low, the
consequences can be very high. Thus it is important to consider the consequences of such an event when making land use planning decisions.
6.86 Quantification of the exact hazards associated with specific breach or failure scenarios is outside the scope of the SFRA. However it is important to consider probable locations of breaches when making land use planning decisions.
6.87 The following criteria was used to identify locations where breach and/or failure hazard should be considered during more detailed studies:
• A review of CFMPs to identify areas prone to breach according to local knowledge.
• A review of flood defences/assets to identify breach scenarios which are plausible.
• A review of flood defence/asset condition (where available) to determine likely areas of failure.
• qualitative assessment of the consequences of the flood defence/asset failing.

Flooding from rivers
Chichester SFRA (July 2008) Volume II - Technical Report
6-19
6.88 For any further breach or failure locations or where new defences are constructed it will be necessary to quantify specific breach and failure hazards. This is achieved by specifying:
• The breach or failure location and mechanism.
• The appropriate flood event that should be assessed.
• The appropriate time during a flood event when the breach or failure is likely to occur.
• The duration of the breach or failure.
6.89 For flood walls and embankments this is the width of the gap in the wall or embankment and time required to rebuild. The report ‘Tidal Breach Trials’ prepared by the Environment Agency (2000) recommends the width and duration of a breach which is dependant on the defence type, as shown in Table 6.10.
6.90 The start time of a breach, should commence at the peak of the flood, or when the water level exceeds the bank crest, whichever occurs first. The duration of the breach should be taken from Table 6.10. The breach level should be set at the level of the ground behind the defence, based on ground survey and the DTM.
Table 6.10 Selection of breach type
Time to close Source Defence type Breach width (m) Nominal Use
Earth bank 40 2 days 56 hours River Reinforced concrete 20 12 hours 18 hours Earth bank 50 1 day 30 hours Estuary Reinforces concrete 20 18 hours 18 hours
Results
Flood Zones 6.91 The fluvial Flood Zones derived for Chichester District are shown in Map F1-F in Annex A.
The Flood Zones have been developed from a number of different datasets. The source of the data used to define the fluvial Flood Zones is shown in Map F2-F in Annex A. The majority of Chichester District lies within Flood Zone 1. As all rivers have an area of floodplain along their length, Flood Zones 2, 3a and 3b are spread throughout the District. The floodplains of many of the rivers are well defined and for this reason the flood outlines for different events do not change significantly.
6.92 The area of floodplain is larger where river flows are large and where the ground adjacent to the river is flat, allowing flood flows to spread out. The largest areas of Flood Zones 2 and 3a are therefore the lower extents of the Rifes, on the River Lavant around Chichester and on the River Rother.
6.93 Most of the Flood Zones cover rural areas. The floodplain of the River Lavant has been modified over time and the flood alleviation scheme aims to reduce flood risk in Chichester. Without this flood alleviation scheme in place, a significant number of properties lie within the 0.1 and 1 per cent AEP river floodplains.
6.94 Flood Zone 3b (the functional floodplain) comprises of land where water has to flow or be stored in times of flood. The SFRA identifies this as a Flood Zone with an annual probability of 5 per cent or greater. The impact of flood defences is included in the assessment. The largest areas of functional flooding in Chichester District are along the River Rother and Bosham

Flooding from rivers
Chichester SFRA (July 2008) Volume II - Technical Report
6-20
Stream. Most of the functional floodplain in Chichester is essentially rural, with a few notable exceptions.
Actual Flooding 6.95 Actual flooding shows the land at risk of flooding, when flood defences are in place. The flood
defences are assumed to operate in perfect condition and to their specified design standard. The analysis considers flooding from a river event with a 1 per cent AEP. Chichester District is relatively sparse of flood defence schemes that are designed to provide protection up to the 1 per cent AEP standard. Thus the actual risk is similar in many areas to the Flood Zones. The actual risk of flooding is shown in Map A1-F in Annex A. The main area protected by defences is Chichester.
6.96 Actual flood depths and velocities have been mapped to provide additional flood hazard information. (See Maps A2-F and A3-F in Annex A). The deepest flood depths are expected in the River Rother and Arun. The highest velocities are also expected on the River Rother and Arun.
Residual Flooding (overtopping) 6.97 Residual risk (overtopping) is the flooding caused by an event bigger than the event for which
the flood defences were designed. For the SFRA, a residual risk scenario with a 0.1 per cent AEP has been chosen. The residual risk of flooding is shown in Map A1-F in Annex A
6.98 Two climate change scenarios have also been run to determine whether overtopping is expected to occur in the 2056 or 2106 time horizons. The residual risk of flooding is shown in Map A1-F in Annex A. The climate change flood outlines are shown on Map C1-F in Annex A. A 20 per cent increase in flows was used for both time-horizons. However the mean spring tide for the downstream boundary varied between the two time-horizons. For this reason, only those areas which are affected by tides vary between the two time-horizons. The main areas affected by river flooding in a climate change scenario are the tidally influenced areas. The forecast sea level rise is thus expected to have a significant influence on river flooding, through the prevention of discharge.
Residual Flooding (breach and failure hazards) 6.99 The hazard of breach and failure was considered during the production of the SFRA. Several
possible breach or failure scenarios were identified:
• Failure of the Lavant Flood Relief Scheme which provides flood protection for Chichester. Hazard mapping was not produced for this scenario.
• Failure of the tidal outfall on the Lavant Flood Relief Scheme. Hazard mapping was not produced for this scenario.
6.100 Other more detailed scenarios which should be investigated during more detailed assessments include:
• Blockage of key culverts/bridges within urban areas.
• Failure to manually operate flood defence infrastructure such as sluice gates.
• Failure of flapped outfalls to operate efficiently.
• Failure or blockage of the River Lavant culvert under Chichester. This possible scenario was not modelled, although the consequence of complete or even partial failure would be significant. Modelling the failure of this asset would require detailed consideration and modelling outside of the current scope of the SFRA.

Flooding from rivers
Chichester SFRA (July 2008) Volume II - Technical Report
6-21
Uncertainty in flood risk assessment
6.101 Due to the expanse of CFMP models across Chichester District, estimation of risk of flooding from rivers is considered robust for the level of assessment required in the SFRA.
6.102 The greatest uncertainties in the hydraulic modelling occur as a result of:
• Models not having been fully calibrated or verified (they were only sensibility checked by the Environment Agency).
• Hydrological estimates not having been generated through a detailed study. However due to the methods employed, hydrological estimates are considered conservative.
• Joint probability of storm surges with high river flows has not been assessed.
• The models assume that flood defences do not fail and the conditions of the defences do not change i.e. the crest levels remain constant.
• Larger grid cell sizes have been used to model the River Arun. These models provide an indication of flooding on a broadscale however predictions of flood depths and velocities throughout the floodplain are less certain.
• Small structures, small flood defences and detailed topographic details in urban areas have not been included in the broadscale models. Thus flood outlines are less certain near these features.
References
• FCDPAG3 Economic Appraisal: Supplementary Note to Operating Authorities – Climate Change Impacts October 2006
• Department of Communities and Local Government (2006) 'Planning Policy Statement 25' (PPS25)
• Department of Communities and Local Government (2007) 'A practice guide companion to Planning Policy Statement 25' Living draft, consultation paper
• CFMPs (Arun and Western Streams, Environment Agency 2008 and River Adur, Environment Agency 2008)
• Tidal Beach Trials (Environment Agency, 2000).
Flooding from the sea
Chichester SFRA (July 2008) Volume II - Technical Report
7-1
7. Flooding from the sea
The Chichester DC Strategic Flood Risk Assessment (SFRA) is a "live" document. The current version is developed using the best information and concepts available at the time. As new information and concepts become available the document will be updated and so it is the responsibility of the reader to be satisfied that they are using the most up-to-date information and that the SFRA accounts for this information. All revisions to this summary document are listed in the table.
Version Issue Date Issued by Issued to
Final 29/07/08 Capita Symonds
Ltd
CDC, EA

Flooding from the sea
Chichester SFRA (July 2008) Volume II - Technical Report
7-2
Introduction
Description 7.1 Flooding from the sea occurs when water levels in the sea rise above ground levels of coastal
land. This can occur:
• during normal high tides - where land floods on a regular basis;
• when there are extreme atmospheric effects such as storm surges; and
• when wind action causes water levels of the sea to rise.
7.2 Flooding from sea is a natural and regular occurrence in estuarine environments and coastal marshlands. All low-lying ground along the coastline of Chichester District is at risk. Where development has encroached on the coastal areas, flood defences have been constructed to prevent flooding from the sea. These flood defences can be at risk of overtopping or breaches.
Impacts 7.3 The onset of flooding from the sea can be extremely rapid. Deep fast flowing flood water can
be extremely hazardous. The severity of flooding will depend on tide levels, wind and wave conditions, and topography.
7.4 The coastline of Chichester District is well populated although there are few flood defences offering a high standard of flood protection. However even the best flood defences can be overtopped or can breach, which can cause extensive flooding of the land with significant flood depths and high velocities.
7.5 Flooding from sea is hazardous to life, property and the environment. Significant rebuild is required after severe flood events.
7.6 Flooding from sea can last a long time in areas where gravity drainage to the sea is hindered by flood defences (Balmforth et al., 2006).
Data collection
Previous studies
7.7 There are a number of existing studies which have been undertaken along the West Sussex coastline, including Coastal Defences Strategies (CDS), Shoreline Management Plans (SMP) and CFMPs. These are summarised in Table 7.1.
Table 7.1 Previous studies
Study Author Coastal defence strategies River Arun to Pagham: Coastal Defence Strategy Study HR Wallingford, 2003
Planning for the Future, Pagham to East Head Shoreline management plans Beachy Head to Selsey Bill, Shoreline Management Plan, First Review
South Downs Coastal Group, 2006
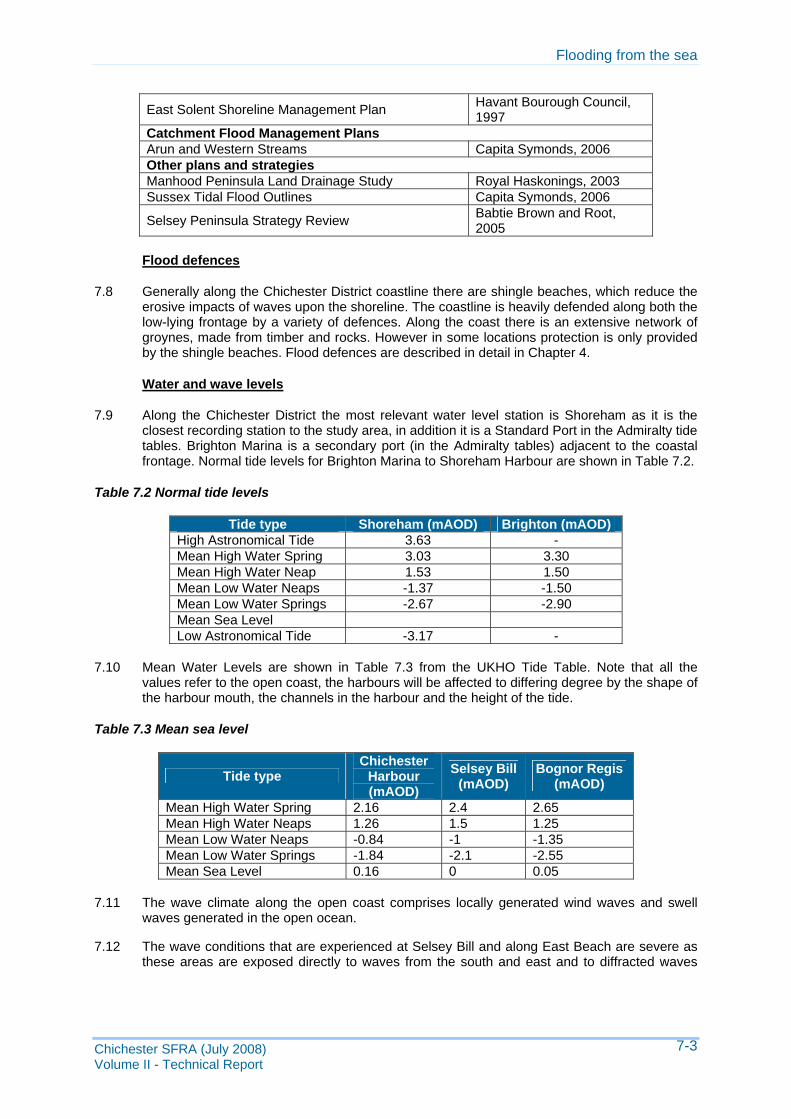
Flooding from the sea
Chichester SFRA (July 2008) Volume II - Technical Report
7-3
East Solent Shoreline Management Plan Havant Bourough Council, 1997
Catchment Flood Management Plans Arun and Western Streams Capita Symonds, 2006 Other plans and strategies Manhood Peninsula Land Drainage Study Royal Haskonings, 2003 Sussex Tidal Flood Outlines Capita Symonds, 2006
Selsey Peninsula Strategy Review Babtie Brown and Root, 2005
Flood defences
7.8 Generally along the Chichester District coastline there are shingle beaches, which reduce the erosive impacts of waves upon the shoreline. The coastline is heavily defended along both the low-lying frontage by a variety of defences. Along the coast there is an extensive network of groynes, made from timber and rocks. However in some locations protection is only provided by the shingle beaches. Flood defences are described in detail in Chapter 4.
Water and wave levels
7.9 Along the Chichester District the most relevant water level station is Shoreham as it is the closest recording station to the study area, in addition it is a Standard Port in the Admiralty tide tables. Brighton Marina is a secondary port (in the Admiralty tables) adjacent to the coastal frontage. Normal tide levels for Brighton Marina to Shoreham Harbour are shown in Table 7.2.
Table 7.2 Normal tide levels
Tide type Shoreham (mAOD) Brighton (mAOD) High Astronomical Tide 3.63 - Mean High Water Spring 3.03 3.30 Mean High Water Neap 1.53 1.50 Mean Low Water Neaps -1.37 -1.50 Mean Low Water Springs -2.67 -2.90 Mean Sea Level Low Astronomical Tide -3.17 -
7.10 Mean Water Levels are shown in Table 7.3 from the UKHO Tide Table. Note that all the
values refer to the open coast, the harbours will be affected to differing degree by the shape of the harbour mouth, the channels in the harbour and the height of the tide.
Table 7.3 Mean sea level
Tide type Chichester
Harbour (mAOD)
Selsey Bill (mAOD)
Bognor Regis (mAOD)
Mean High Water Spring 2.16 2.4 2.65 Mean High Water Neaps 1.26 1.5 1.25 Mean Low Water Neaps -0.84 -1 -1.35 Mean Low Water Springs -1.84 -2.1 -2.55 Mean Sea Level 0.16 0 0.05
7.11 The wave climate along the open coast comprises locally generated wind waves and swell
waves generated in the open ocean.
7.12 The wave conditions that are experienced at Selsey Bill and along East Beach are severe as these areas are exposed directly to waves from the south and east and to diffracted waves

Flooding from the sea
Chichester SFRA (July 2008) Volume II - Technical Report
7-4
generated by south-westerly winds in the Channel. Waves in Pagham Harbour are generated locally and are only significant at higher water levels (ESSMP).
7.13 Table 7.4 details extreme water levels that have been produced by a number of different studies and summarised in the Manhood Peninsula Study.
Table 7.4 Extreme water levels from Manhood Peninsula study
Return period (years)
Chichester Harbour (mAOD)
Bracklesham (mAOD)
Medmerry (mAOD)
Selsey Bill (mAOD)
Bognor Regis
(mAOD) 1 2.86 2.95 2.98 3.07 3.27 2 2.89 2.98 3.02 3.11 3.31 5 3.08 3.17 3.21 3.30 3.50 10 3.16 3.25 3.29 3.38 3.58 20 3.36 3.45 3.49 3.59 3.79 50 3.46 3.56 3.59 3.69 3.89 100 3.67 3.77 3.81 3.91 4.11 200 3.83 3.93 3.97 4.07 4.27 500 4.03 4.14 4.18 4.28 4.48 1000 4.23 4.34 4.38 4.48 4.67
Chichester and Pagham Harbours
7.14 Harbours are different to the open coast as they are dominated by high energy processes acting over long lengths of frontage. For this reason flooding must be assessed differently and water levels are different from those recorded at open sea.
7.15 Chichester Harbour is not a heavily developed harbour. The shoreline is defined by seawalls, revetments and embankments, plus a number of lengths of natural coastline, largely within Bosham and Chichester channels. Many of these defences are in need of maintenance or upgrading to provide a reasonable standard of service for the future, particularly in view of rising sea levels.
7.16 Areas of particular concern include the east shore of Hayling Island, the shoreline around the Military of Defence (MoD) establishment at Thorney Island, the Mill Pond at Emsworth and the west shore of the Chidham Peninsula.
7.17 The defences along the east shore of Hayling Island are subject to breaching which causes widespread flooding of agricultural land, holiday and recreation developments, residential areas and main roads. There is particular concern in regards to breaching at Tourner Bay and North Hayling frontage. The Tourner Bay frontage has been protected by a bank of building rubble, but this is not a sustainable defence.
7.18 Works have been undertaken along Langstone – Emsworth frontage to prevent minor erosion and flooding, including protection of Conigar Point where breaching has occurred. Emsworth has been identified as a risk area due to overtopping.
7.19 The MoD has complete design proposals for improvements to the revetments along Thornley Island. Along Marker Point the MoD has agreed to allow the existing defences to deteriorate naturally
7.20 The Environment Agency have undertaken major works along the Prinsted-Nutbourne frontage, which involves armouring the existing bank with rock to ensure that there is no future damage.
7.21 The west shore of Chidham Peninsula is suffering erosion of flood embankments and breaches are likely if maintenance is not undertaken.

Flooding from the sea
Chichester SFRA (July 2008) Volume II - Technical Report
7-5
7.22 The shoreline of the upper reaches of Bosham and Chichester channels are subject to flooding due to embankments being below the required levels.
7.23 Pagham Harbour is a Nature Reserve with mudflats, salt marsh and marsh creek systems. The harbour is gradual silting up with tidal and fluvial deposits. Approximately two thirds of Manhood Peninsula drains into Pagham Harbour, through three main rife systems and several small outfalls. The harbour is a semi natural harbour of approximately 300 hectares. The remaining one third drains directly into Chichester Harbour or to the sea.
7.24 Pagham harbour was reclaimed in 1876 and remained dry for a period of 34 years until the defences were breached in 1910. A single northern training arm was built in 1963 and replaced during the 1980s. A large mobile shingle spit is located to the south of the entrance, and if it moved it would block the entrance. This would cause water quality problems and flooding of the surrounding area. However there is a possibility if the training wall or the shingle spit were breached then increased wave and tidal activity would enter the harbour which may wash some silt away, which would possibly aid drainage.
7.25 The harbour has continues to silt up as the low energy tidal environment allows sediment to settle and/or get trapped in the inter-tidal vegetation. The harbour has been silted up mainly due to silt from the sea rather than the drainage system. It was approximated from previous reports that the average long-term rate of siltation is between 3.8 – 8.3 mm per year. Current rates of siltation are estimated at an average of 6mm per year.
7.26 The main impact that siltation will have on the existing drainage system is a restriction on the quantity of discharge that can take place on low tide. All the outfalls are tide locked at high tide.
Topographic datasets 7.27 Map T1 in Annex A shows the availability of topographic datasets held by the Environment
Agency within Chichester District. Topographic datasets include:
• Synthetic Aperture Radar (SAR) dataset over the whole county with a vertical root mean square error (RSME) in the order of ± 1m;
• Light Detecting and Ranging (LiDAR) dataset over much of the county with a vertical RSME in the order of ± 0.15m; and
• Photogrammetry over much of the coastline with RSME in the order of ± 0.10m.
7.28 All topographic data has been used in the SFRA, which a preference to sources which are more accurate. Map T2 is Annex A provides an overview of the topography across the West Sussex County.
Historic incidents of flooding 7.29 Historic flood event information for the SFRA area has been requested and obtained from
various sources as detailed in Table 7.5. This has been supplemented with historic flood information contained in the coastal defence strategies and shoreline management plan noted in Table 7.1. A review of the datasets has identified in broad terms the locations and types of previous flooding problems. Map H in Annex A shows the locations of all recorded flood events collected during the SFRA.

Flooding from the sea
Chichester SFRA (July 2008) Volume II - Technical Report
7-6
Table 7.5 Historic Flood Datasets
Source Details Area Covered Status Description
Environment Agency
West Sussex Flood Events Database West Sussex Received
GIS Layers including information on type, date and source of flooding
Chichester DC Parish flood records Chichester DC area Received
Records of flooding problems, including some information on type and source of flooding. These records were not digitised as part of the SFRA.
Southern Water
Database of flooding incidents West Sussex Received
Spreadsheet converted to GIS layer
West Sussex Fire & Rescue Service
Details of recorded flood incidents West Sussex Received
Very few records and no information on cause of flooding
7.30 The area around Selsey has had a long history of the construction of defences which provide extensive protection to high density, urban developments in low lying area, and reduce flooding and erosion in these areas. The removal/failure of these defences would result in a breakdown of the beach, extensive erosion and flooding.
7.31 All the channels draining to the sea, Pagham Harbour, or Chichester Harbour are provided with flapped outlets and are tide locked (water in rivers cannot discharge to sea as the sea level is higher) for some hours either side of high tide. Due to the low gradients available, stream velocities are low and water levels rise and fall very slowly.
Methods for assessing flood risk
7.32 The level of assessment required for the SFRA is broadscale. For this reason, existing datasets and tools have been used were possible to provide flood risk information.
7.33 The Environment Agency holds a dataset of Flood Zones for the entire coastline of England and Wales. These Zones are published on their website. The coastal Flood Zones are primarily based on the results of their national generalised broadscale modelling (Hydrof). In some locations, they are based on more detailed hydraulic modelling, if these models were found to be more appropriate.
7.34 Where other models (such as ABD or CFMP) were available, the results were compared to Flood Zones to determine which dataset was more appropriate for use in the SFRA.
Flood Zones
7.35 As defined in Table D1 of PPS25, Flood Zones 2 and 3a indicate the land at risk of flooding, ignoring the presence of flood defences. These zones present the first step in assessing the risk of sea (and river) flooding at a location. Environment Agency Flood Zones 2 and 3a are available for the whole West Sussex coastline.

Flooding from the sea
Chichester SFRA (July 2008) Volume II - Technical Report
7-7
7.36 The models developed for Environment Agency ABD and CFMP studies are considered more detailed than the Hydrof generated Environment Agency Flood Zones. For this reason these models were used to redefine the Flood Zones.
7.37 In addition to Flood Zones for the current conditions, Future Flood Zones have also been produced. Future Flood Zones enable the users of the SFRA to consider the future flood risk at a site based on climate change predictions and as such this approach is considered to conform to the precautionary approach identified in PPS25. The methods used to produce the Future Flood Zones are described in section 7.67.
Actual risk
7.38 Actual risk shows the land at risk of flooding, with existing flood defences in place. For the purposes of the SFRA, the flood defences were assumed to operate in perfect condition and to their specified design standard. The analysis considered flooding from a river event with a 0.5% AEP. Actual risk was defined using ABD and CFMP.
Residual risk
7.39 Residual risks are those which result from a:
• flood of greater magnitude that flood defences were designed; and/or
• breach or failure of flood defence and other assets.
7.40 These risks are particularly important because although they are less likely to occur, the consequences of them occurring are greater. Residual risk was defined using ABD and CFMP models.
7.41 Modelling of specific breaches in flood defences was outside the scope of the SFRA and thus residual risk (breach failure) was achieved by identifying locations most likely for a breach or failure to occur. The actual consequences of such a breach should be examined in more detailed flood risk assessments.
Baseline Tidal boundary 7.42 The probability of flooding from the sea along the Chichester coastline was assessed during
the SFRA using the following existing CFMP and ABD hydraulic modelling:
• Chichester Sussex Coast ABD Study
• Wittering CFMP Study
• Bosham CFMP Study
• Bognor Sussex Coast ABD Study
• Aldingbourne CFMP Study
• Lavant CFMP Study
• Arun CFMP Study
• Selsey Sussex Coast ABD Study
• Selsey CFMP Study
7.43 The coverage of each hydraulic Model is shown in Map M3 in Annex A. All hydraulic models were modelled in the TUFLOW software package and after review were deemed to provide higher accuracy results than existing Flood Zones and water level projection modelling.
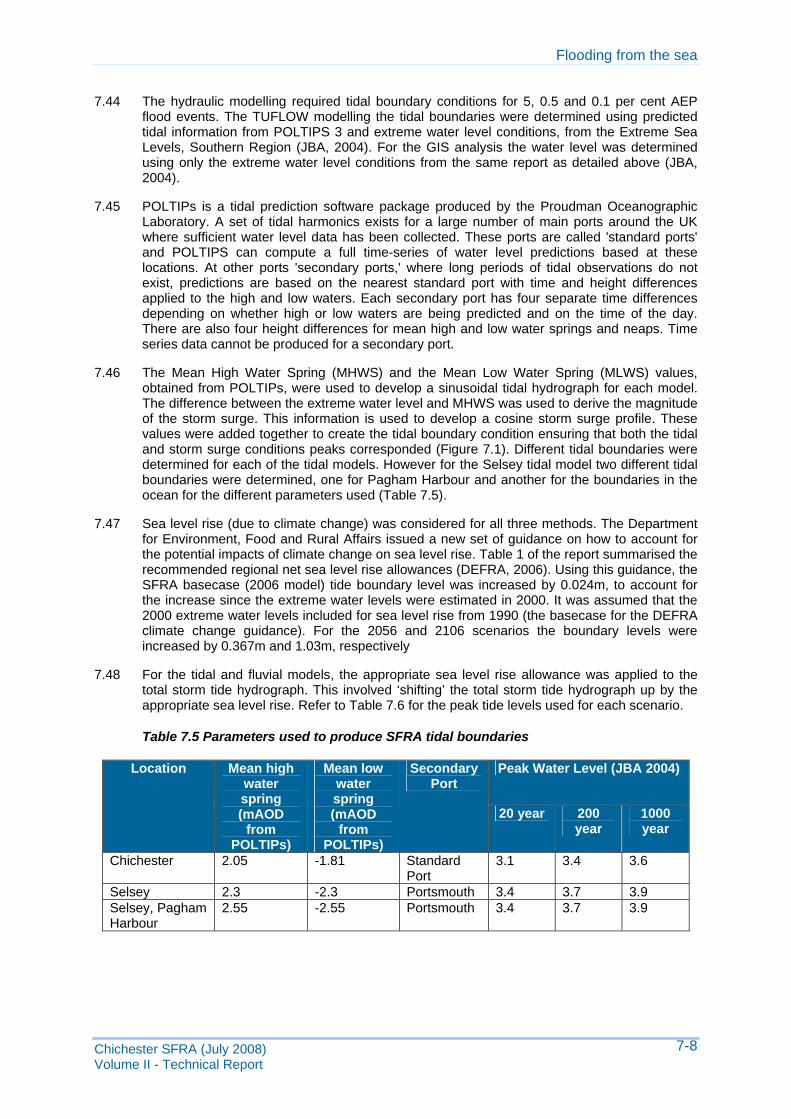
Flooding from the sea
Chichester SFRA (July 2008) Volume II - Technical Report
7-8
7.44 The hydraulic modelling required tidal boundary conditions for 5, 0.5 and 0.1 per cent AEP flood events. The TUFLOW modelling the tidal boundaries were determined using predicted tidal information from POLTIPS 3 and extreme water level conditions, from the Extreme Sea Levels, Southern Region (JBA, 2004). For the GIS analysis the water level was determined using only the extreme water level conditions from the same report as detailed above (JBA, 2004).
7.45 POLTIPs is a tidal prediction software package produced by the Proudman Oceanographic Laboratory. A set of tidal harmonics exists for a large number of main ports around the UK where sufficient water level data has been collected. These ports are called 'standard ports' and POLTIPS can compute a full time-series of water level predictions based at these locations. At other ports 'secondary ports,' where long periods of tidal observations do not exist, predictions are based on the nearest standard port with time and height differences applied to the high and low waters. Each secondary port has four separate time differences depending on whether high or low waters are being predicted and on the time of the day. There are also four height differences for mean high and low water springs and neaps. Time series data cannot be produced for a secondary port.
7.46 The Mean High Water Spring (MHWS) and the Mean Low Water Spring (MLWS) values, obtained from POLTIPs, were used to develop a sinusoidal tidal hydrograph for each model. The difference between the extreme water level and MHWS was used to derive the magnitude of the storm surge. This information is used to develop a cosine storm surge profile. These values were added together to create the tidal boundary condition ensuring that both the tidal and storm surge conditions peaks corresponded (Figure 7.1). Different tidal boundaries were determined for each of the tidal models. However for the Selsey tidal model two different tidal boundaries were determined, one for Pagham Harbour and another for the boundaries in the ocean for the different parameters used (Table 7.5).
7.47 Sea level rise (due to climate change) was considered for all three methods. The Department for Environment, Food and Rural Affairs issued a new set of guidance on how to account for the potential impacts of climate change on sea level rise. Table 1 of the report summarised the recommended regional net sea level rise allowances (DEFRA, 2006). Using this guidance, the SFRA basecase (2006 model) tide boundary level was increased by 0.024m, to account for the increase since the extreme water levels were estimated in 2000. It was assumed that the 2000 extreme water levels included for sea level rise from 1990 (the basecase for the DEFRA climate change guidance). For the 2056 and 2106 scenarios the boundary levels were increased by 0.367m and 1.03m, respectively
7.48 For the tidal and fluvial models, the appropriate sea level rise allowance was applied to the total storm tide hydrograph. This involved ‘shifting’ the total storm tide hydrograph up by the appropriate sea level rise. Refer to Table 7.6 for the peak tide levels used for each scenario.
Table 7.5 Parameters used to produce SFRA tidal boundaries
Peak Water Level (JBA 2004) Location Mean high water spring (mAOD
from POLTIPs)
Mean low water spring (mAOD
from POLTIPs)
Secondary Port
20 year 200 year
1000 year
Chichester 2.05 -1.81 Standard Port
3.1 3.4 3.6
Selsey 2.3 -2.3 Portsmouth 3.4 3.7 3.9 Selsey, Pagham Harbour
2.55 -2.55 Portsmouth 3.4 3.7 3.9

Flooding from the sea
Chichester SFRA (July 2008) Volume II - Technical Report
7-9
-4.0
-3.0
-2.0
-1.0
0.0
1.0
2.0
3.0
4.0
5.0
0 12 24 36 48 60 72
Time (Hours)
Wat
er L
evel
(mA
OD
)Sinusoidal Tide (mAOD)Cosine Tide Surge (m)Total Storm Tide (mAOD)
Figure 7.1 Total storm tide for the tidal boundaries used in the SFRA
Table 7.6 Peak Water Levels (including Sea Level Rise allowances)
5 per cent 0.5 per cent 0.1 per cent Location 2000 2006 2056 2106 2000 2006 2056 2106 2000 2006 2056 2106
Chichester H. 3.100 3.124 3.467 4.130 3.400 3.424 3.767 4.430 3.600 3.624 3.967 4.630Brackelsham 3.300 3.324 3.667 4.330 3.500 3.524 3.867 4.530 3.700 3.724 4.067 4.730Medmerry 3.400 3.424 3.767 4.430 3.600 3.624 3.967 4.630 3.800 3.824 4.167 4.830Selsey Bill 3.400 3.424 3.767 4.430 3.700 3.724 4.067 4.730 3.900 3.924 4.267 4.930
Impacts of climate change 7.49 The latest policy guidance on climate change and flood risk is the FCDPAG3 Economic
Appraisal: Supplementary Note to Operating Authorities – Climate Change Impacts, October 2006. This guidance was issued in November 2006 and informs appraisers and decision makers of new climate change allowances and broadly how these should be applied.
7.50 Key and relevant points to note in the supplementary guidance are:
• updated figures of Regional net sea level risk allowances are contained within Table 1 (of the guidance);
• new indicative sensitivity ranges covering peak rainfall intensity, peak river flow volume, offshore wind speed and extreme wave heights are shown in Table 2 (of the guidance);
• allowances in relation to sea level rise reflect the greater uncertainty in these predictions, which should be used to determine base cases and options – reflecting a precautionary approach;

Flooding from the sea
Chichester SFRA (July 2008) Volume II - Technical Report
7-10
• sensitivity ranges referring to flows, rainfall, winds and waves have a higher degree of uncertainty. A sensitivity analysis approach should therefore be used to inform decision making; and
• the response to climate change can be through either managed/adaptive or precautionary approaches.
7.51 The revised guidance increases the predicted climate change impacts due to projected sea level rise effects. The baseline will be set as 2006, and the climate change of 2056 and 2106 have been considered, as detailed above. Table 7.7 contains a comparison of the latest estimates of sea level rise against the superseded version.
Table 7.7 Comparison of the latest and superseded estimates of sea level rise
Year Sea-Level Guidance 2056 2106
Superseded guidance (constant rate of 6mm/year) 336 636
Latest guidance (exponential growth rate) 367 1030
7.52 The coastal area along Chichester District is generally low lying land and there is limited sediment input to the system, consequently the area has a significant flood risk especially due to sea level rise. In addition, an increase in sea level rise may cause a significant loss of beach frontage, which may cause substantial loss of residential assets.
7.53 The impact of sea level rise on Chichester District was carried out by modelling climate change scenarios for 2056 and 2106. The tidal boundaries were adapted according to the new climate change guidance.
Hydraulic modelling
Scenarios
7.54 The SFRA requires four different datasets to understand flood risk, which is Flood Zones, actual risk, residual risk and breach and failure hazards. Consequently the following scenarios were run for the four model areas:
Flood Zones
• Flood Zone 2: 0.1 per cent AEP flood event (2006) without flood defences
• Flood Zone 3a: 0.5 per cent AEP flood event (2006) without flood defences
• Flood Zone 3b: 5 per cent AEP flood event (2006) with flood defences. (This model scenario was only carried out for the locations where the flood defences were overtopped for the 0.5 per cent AEP flood event).
Actual Risk
• 0.5 per cent AEP flood event (2006) with flood defences
Residual Risk
• 0.1 per cent AEP flood event (2006) with flood defences
• 0.5 per cent AEP flood event (2056) with flood defences

Flooding from the sea
Chichester SFRA (July 2008) Volume II - Technical Report
7-11
• 0.5 per cent AEP flood event (2106) with flood defences
Residual Risk (Breach/failure)
• 0.5 per cent AEP flood event (2006) with a specified breach or failure of defences at various locations (see section 7.68)
CFMP tidal modelling
7.55 A number of separate hydraulic models were developed for the Arun and Western Streams CFMP. All the models were developed using TUFLOW software. A constant inflow of 1m3/s was applied to all inflow nodes in the models. The tidal boundary condition was determined using the extreme water level conditions (see section 7.43). Existing flood defences were checked against NFCDD.
7.56 To determine the area at risk of flooding without defences in place, models were run with them removed. The digital terrain model (DTM) was used to identify the natural land level after removing the defences for both models.
Sussex ABD tidal modelling
7.57 The Chichester District coastline was modelled during the Environment Agency flood mapping commissions. The models were developed using TUFLOW software and models relevant to this commission included: Selsey, Bognor Regis and Chichester Harbour.
Processing of results
7.58 Water level results from the CFMP and Sussex ABD models were processed to form flood outlines and depth grids. Whilst a range of other results are available, they have not been required for this level of assessment.
7.59 The following steps were followed to process the results:
• Maximum water levels were extracted as .ASC and .MIF points from the relevant _h.DAT TUFLOW results files (note: more than one file may have been interrogated if several storm durations were run).
• .MIF points were converted to a water surface using an inverse distance weighting procedure in the GIS software package GRASS. The same software package was used to subtract the water surface from the ground DTM to produce a depth grid.
• The .MIF depth grid and .ASC depth grid were imported into MapInfo/Vertical Mapper to analyse and contour to produce a flood outlines. The resultant two flood outlines were merged.
• The flood outlines were cleaned by removing all dry islands less than 200m2 in size.
Breach and failure hazards 7.60 Modelling specific hazards associated with breach and failure of flood defences and other
infrastructure is too detailed for this level of assessment. However it is important to consider these risks when making land use planning decisions. For this reason, an assessment has been based on locations that are likely to be at risk of breach of failure:
7.61 The locations were determined using the following activities:
• A review of the Shoreline Management Plans (SMP) and Costal Defence Strategies (CDS).

Flooding from the sea
Chichester SFRA (July 2008) Volume II - Technical Report
7-12
• Consideration of policies for the future condition and maintenance of defence assets.
• Assessment of defence condition using data from NFCDD, SMP, CDS and survey data from the South Downs Coastal Group.
• A review of historic flooding and breaching of defences.
• An analysis of LiDAR, Flood Zones, the level of the defences, the level of the floodplain behind the defences, and the area that could possibly be flooded;
• analysis of OS Mapping and other mapping to determine the location and density of development.
• Consideration of the likely breach mechanism and consequence.
7.62 The extent of flooding from a breach is dependent on the potential volume of floodwater that could enter the compartment. This can most accurately be determined by hydraulically modelling the breach. To do so it is necessary to select an appropriate breach level, width and duration. The report ‘Tidal Breach Trials’ prepared by the Environment Agency (2000) provides information on these parameters, as shown in Table 7.8. The start time of a breach, should commence at the peak of the tide, or when the water level exceeds the bank crest, whichever occurs first. The breach width and duration is dependent on source of flooding and defence type. The duration of the breach should also account for the remoteness and accessibility of the breach.
Table 7.8 Selection of breach type
Time to close Source Defence type Breach width (m) Nominal Use
Earth bank 50 24 hours 30 hours Estuary Reinforces concrete 20 18 hours 18 hours Earth bank (including bank with
concrete facing) 200 48 hours 56 hours
Dunes 100 48 hours 56 hours Shingle bank 100 24 hours 30 hours
Coast (exposed to wave action)
Reinforced concrete 50 24 hours 30 hours
Results
Flood Zones 7.63 Map F1-T in Annex A shows the Flood Zones within Chichester. Most of the district lies within
Flood Zone 1.
7.64 Flood Zone 2 (medium probability) comprises of land assessed as having between a 0.5 per cent AEP and 0.1 per cent AEP. Only a small area in Chichester Harbour, Selsey and Manhood Peninsula lies within Flood Zone 2.
7.65 Flood Zone 3a (high probability) comprises of land assessed as have a 5 per cent AEP. In Chichester Harbour, the majority of Thornley island, and low lying areas of Chidham, Boshma, West Itchenor and West Wittering lie within Flood Zone 3a. The land from the west side of Selsey Beach across to Pagham Harbour lies within Flood Zone 3a, this includes area of Sidlesham. Along the east side of Selsey beach a small area is included in Flood Zone 3a.

Flooding from the sea
Chichester SFRA (July 2008) Volume II - Technical Report
7-13
7.66 Flood Zone 3b (the functional floodplain) comprises of land where water has to flow or be stored in times of flood. The SFRA identifies this as a Flood Zone with an annual probability of 5 per cent. For this SFRA defences have been included, as the defence would provide protection during the 5 per cent AEP.
7.67 Zone 3b shows that the defences on the east and west side of Thornley Island have been overtopped, causing flooding across Great Deep. The flood defence have been overtopped in most locations, however only minor flooding has occurred on the landward side. Only minor flooding has occurred at West Wittering. And at Selsey the sea defences in Pagham Harbour have been overtopped, which has caused flooding in the lower areas of Pagham Harbour. Minor flooding has occurred in Sidlesham.
7.68 The Future Flood Zones derived for Chichester are shown in Map C2-T in Annex A. The maps give an indication of the area which may be at risk of flooding from the sea in the future time horizons of 2056 and 2106. Future Flood Zones assist in determining whether a development will be at risk of flooding throughout its designs life and as such are an important consideration in the planning process.
7.69 The Future Flood Zones show that a large area around Selsey and Chichester Harbour could be considered ‘functional floodplain’ in the future.
Actual risk 7.70 Actual risk shows the land at risk of flooding, when flood defences are in place. In this
situation the flood defences were assumed to operate in perfect condition and to their specified design standard. The analysis considered flooding from a coastal event with a 0.5 per cent AEP. Map A1-T, A2-T and A3-T (Annex A) show the extent, depth and velocity of this flooding.
7.71 Sea defences are overtopped at Pagham Harbour and flooding occurs in the lower areas of Sidlesham, Pagham and Church Norton. Along the west side of Selsey the sea defences are not overtopped.
7.72 In Chichester a number of sea defences are overtopped at Thorney Island, Chidham, Bosham, West Itchnpor, West Wtiitering, Marine Birdham, Birdham and Fishbourne. Significant flooding occurs in the lower area of Thorney Island, at West Thorney.
Residual risk 7.73 Residual risk is the flooding caused by an event bigger than an event for which the flood
defences were designed. With an allowance for a climate change and wave action, most of the major sea defences are designed for a flood event with a 0.5 per cent AEP. For the SFRA the extreme event was a 0.1 per cent AEP flood. Map A1-T in Annex A shows the areas at residual risk of flooding.
7.74 For the extreme event Thorney Island is mostly flooded, except for West Thorney. The majority of Chidham has been flooded. The lower lying properties in Bosham have been flooded from tidal influences. The Apuldram sewage works is flooded. The lower areas of Fishbourne has been flooded. Further south West Wittering has been flooded, with a number of lower lying properties being flooded.
7.75 For the extreme event the sea defences along the west of Selsey and East Beach are not over topped. Flooding occurs in Sidlesham, Church Norton and Pagham due to the overtopping of defence in Pagham Harbour.
7.76 The climate change scenarios can also be used to indicate residual risk. The climate change events modelled in the SFRA were the 0.5 per cent AEP flood event for the years 2056 and 2106. The flood extents are shown on Map C1-T in Annex A.
Flooding from the sea
Chichester SFRA (July 2008) Volume II - Technical Report
7-14
7.77 The 2056 shows flooding along most of the low lying coastal areas. With a significant increase in flooding of Thorney Island, including the lower lying areas of West Thorney. There is significant flooding of the following towns Chidham, Bosham, Fishbourne, the marina at Bosham, Bosham, West Itchenor, West Wittering. A lot of the low lying residential properties in these towns have been flooded. For 2106 event causes a wider floodplain affecting the same towns however impacting more properties. There is a significant increase in flooding at Chidham, which spans the entire peninsula, further upstream at Bosham.
7.78 For the 2056 event the sea defence on the west side of Selsey and East Beach do not overtopped. The defences along Pagham Harbour are overtopped which cause flooding through out the land north of Selsey. In addition flooding occurs further upstream in Hunston and North Mundham. For the 2106 event there is an increase in the floodplain along the coastal area. The sea defence is overtopped on the west side of Selsey and the east side, East Beach, this cause significant flooding in the areas north of Selsey.
Breach and failure hazards 7.79 The locations that were identified as more likely to experience breach or failure, or where the
consequences of breach may be more significant, are shown on Map B (Annex A). Selected breach scenarios were modelled to provide an indication of the residual risk of flooding. It should be noted that limitations in the scope of the broadscale assessment restricted the number of breach scenarios that could be modelled. The fact that a particular scenario has not been modelled does not imply a lower level of risk.
7.80 The locations for likely breach and failure of sea flood defences are described below.
Chichester Harbour
7.81 Chichester Harbour does not have any major settlements. The Harbour is covered by the East Solent Shoreline Management Plan (SMP). There are a number of areas that are exposed to erosion and there is a need for management of defences where there are potential flood areas (East Solent Coastal Group, 1997).
7.82 North West Chichester Harbour: The SMP provides information of the defences around Chichester Harbour for the areas of interest:
• The Ministry of Defence have completed a design proposal for improvements to the revetments along the frontage of Thornley Island.
• The existing defences on the southwest corner, at Marker Point have been allowed to deteriorate naturally (East Solent Coastal Group, 1997).
• Environment Agency has undertaken major works along the Prinsted-Nutbourne frontage to prevent flooding. The existing embankment has been armoured with rock to ensure no future damage (East Solent Coastal Group, 1997).
• The west shore of Chidham Peninsula is suffering erosion of flood embankments and breaches are likely to occur if maintenance is not undertaken. Flooding may extend over adjacent farmland (East Solent Coastal Group, 1997).
7.83 The LiDAR and Flood Zones indicates that Thornley Island elevation is relatively low, particularly in the northern section at Great Deep Channel. The OS mapping indicates the following urban areas are located in the modelling extent, Thornley Island, Chidham and Bosham. Consequently we believe the breach should be located between Prinsted Point and Stanbury Point. The breach level would be approximately 0m AOD, with the length of the breach 50m and the breach would occur for 30 hours starting at the peak of the tide, or when the section is overtopped.

Flooding from the sea
Chichester SFRA (July 2008) Volume II - Technical Report
7-15
7.84 North East Chichester Harbour: There is no background information for this section of the coastline. The LiDAR indicates that there is a significant floodplain at the Marina, (Birdham), at the sewage work (Apuldrum) and Fishbourne. However according to OS mapping none of these area are heavily urbanised. Therefore the suggested breach location has been selected based on the potential impact to infrastructure and an area considered for future strategic development. We propose that the breach be located adjacent to the sewage works (Apuldrum) with a length of breach of 50m and breach duration of 30 hours starting at the peak of the tide, or when the section is overtopped.
7.85 South East Chichester Harbour: Along West Itchenor and West Wittering the shoreline is subject to some flooding and erosion. Minor works have been undertaken to prevent further damage and loss of footpath (East Solent Coastal Group, 1997).
7.86 There are sand spits on East Head that helps protect part of West Wittering. The defences along West Wittering are made up of a mixture of shingle and sand beaches backed by concrete walls and timber breastworks. The failure of these defences would lead to the loss of 550 properties. The timber groynes and breastwork are in poor condition, however the shingles along the defences are replenished naturally.
7.87 Along Cakeham the existing defences here consist of a wide shingle beach with timber groynes and sections of timber breastworks. There are no hard defences along this frontage. (Babtie Brown and Root, 2005).
7.88 The Flood Zones and LiDAR indicate that there are low lying areas at both West Wittering and West Itchenor. A review of the OS mapping suggests a greater extent of infrastructure and number of properties are at risk in West Wittering.
7.89 Therefore in the absence of further information we propose to locate the breach in the West Wittering defences, close to Roman Landing road.
7.90 It has been assumed from the information available that the defence is of earth bank construction. Consequently the breach level would be approximately 0m AOD, with the length of the breach 50m and the breach would occur for 30 hours starting at the peak of the tide, or when the section is overtopped.
Selsey & Manhood Peninsula
7.91 Medmerry defences provide protection to the only road (B2145) and all the utilities that service the town. Failure of these defences would cause significant implications for the infrastructure of the peninsula. Protection is provided from a shingle bank. The defences provide protection to 300 properties, a large caravan site and 650 hectares of land. Minor breaches of these banks occur regularly.
7.92 The existing defences at Selsey’s East Beach provide protection from flooding and erosion for 1000 properties. Along the east side of Selsey there are seawalls and groyne system which have been fixed landward by the limits of the beach, however the foreshores have narrowed and will continue to do so, which will increase the frequency and risk of breaches. There has been a reduction of over 650m in the last 125 years.
7.93 The defences around Selsey are currently in good condition and would have a lifespan of in excess of 20 years.
7.94 LiDAR and Flood Zones indicates that on the western side of Selsey the ground elevation is much lower compared to the eastern side. The floodplain on the western side is more extensive.
7.95 Although both potential breach locations could led to significant flooding we believe that the flood hazard will be greatest on the eastern shoreline of Selsey and as such the breach should be located at 486700, 93300. The location were the breach would occur is at a shingle beach

Flooding from the sea
Chichester SFRA (July 2008) Volume II - Technical Report
7-16
with presumably a concrete reinforced seawall, therefore the breach length would be 50 m and the time to close will be 30 hours. The breach level will be approximately 1.5 mAOD (note this needs to be checked).
Uncertainty in flood risk assessment
7.96 The study area is entirely covered by existing broad scale hydraulic models.
7.97 The uncertainties related to the tidal models are:
• The tidal models have not been calibrated or verified, they were only sensibility checked by the Environment Agency; and
• Wave over topping was not included in the models however the SMP and CDS indicated that this was an important processes that caused flooding in the area.
• The tidal boundary is based on a design sinusoidal tide. It was assumed that that the peak of the mean spring tide and the storm surge occurred at the same time;
• The extreme water levels were taken from a previous study and there are uncertainties in the calculation that were used to derive these results.
• The model assumes that the defences do not fail and the conditions of the defences do not change ie. the crest levels remain constant; and
• Change in beach morphology was not included in the models it is assumed that there is no change to the beach profile (shingle banks) in front of the defences.
References
• JBA (2004) Extreme Sea Levels, Kent, Sussex, Hampshire and Isle of Wight, Updated Summary Report, December 2004.
• DEFRA (2006) Flood and Coastal Defence Appraisal Guidance FCDPAG3 Economic Appraisal, Supplementary Note to Operating Authorities – Climate Change Impacts, October 2006.
• South Downs Coastal Group (2006) Beachy Head to Selsey Bill, Shoreline Management Plan, First Review.
• Black & Veatch (2004b); River Arun Catchment Flood Management Plan, Inception Report, for the Environment Agency, January 2004.
• Capita Symonds (2005) River Arun Catchment Flood Management Plan; Scoping Report for Consultation, Environment Agency.
• Capita Symonds (2006a) Arun and Western Streams Catchment Management Plan, Environment Agency, January 2006.
• Royal Haskonings (2003) Manhood Peninsula Study Phase
• Capita Symonds (2006b) SO 617 Sussex Tidal Flood Outlines, Project Report, on Behalf of the Environment Agency (Southern Region), August 2006.
• South Downs Coastal Group (2006a) Beach Head to Selsey Bill Shoreline Management Plan, Final Document, May 2006.

Flooding from the sea
Chichester SFRA (July 2008) Volume II - Technical Report
7-17
• Royal Haskonings (2003) Manhood Peninsula Land Drainage Study, prepared on behalf of Chichester District Council.
• Environment Agency (2007) Planning for the Future, Pagham to East Head Coastal Defence Strategy.
• Babtie Brown and Root (2005) Selsey Peninsula Strategy Review, Technical Review Report, June 2005.
Flooding from land
Chichester SFRA (July 2008) Volume II - Technical Report
8-1
8. Flooding from land
The Chichester DC Strategic Flood Risk Assessment (SFRA) is a "live" document. The current version is developed using the best information and concepts available at the time. As new information and concepts become available the document will be updated and so it is the responsibility of the reader to be satisfied that they are using the most up-to-date information and that the SFRA accounts for this information. All revisions to this summary document are listed in the table.
Version Issue Date Issued by Issued to
Final 29/07/08 Capita Symonds
Ltd
CDC, EA

Flooding from land
Chichester SFRA (July 2008) Volume II - Technical Report
8-2
Introduction
Description 8.1 Flooding from land occurs when intense, often short duration rainfall is unable to soak into the
ground or enter drainage systems. This is known as surface water flooding, overland flow or pluvial flooding. This type of flooding is usually short lived and associated with heavy downpours of rain. Often there is limited advance notice of this type of localised flooding.
8.2 Drainage systems are designed to deal with certain frequencies of storm and rainfall intensity. Flooding can be caused by the sheer volume of water or as a result of a blockage or maintenance problem with the system.
8.3 Drainage basins or catchments vary in size and shape, having a direct effect on surface runoff. The extent of runoff is a function of geology, slope, climate, precipitation, saturation, soil type, vegetation and time.
8.4 Geological considerations include rock and soil types and characteristics, as well as degree of weathering. Porous material (sand, gravel, and soluble rock) absorbs water more readily than fine-grained, dense clay or unfractured rock. Well-drained material has a lower runoff potential whereas poorly drained material has a higher runoff potential, resulting in greater potential for flooding.
8.5 Distinguishing between surface water flooding and groundwater flooding can be difficult. Groundwater can be defined as that water that reaches the water table. Most often ‘groundwater flooding’ is considered as a rise in the groundwater level sufficient for the water table to intersect the ground surface in areas where it would not usually do so (Environment Agency, 2006).
8.6 Water that infiltrates the soil but resurfaces as surface water runoff further down the hill is classified as surface water. Springs are also classified as surface water, as is water in lakes, marshes and reservoirs as well as that flowing in streams. Water flowing over the ground surface that has not entered a natural channel or artificial drainage system can be classified as surface water runoff or overland flow.
8.7 Surface water runoff can cause localised flooding in natural valleys as normally dry areas become inundated and in natural low spots where water may pond.
Causes and classifications 8.8 There are two main types of flooding from land. Surface water runoff flooding is caused by
localised heavy rain that cannot soak into the ground and is greater than the capacity of the drainage network. It may also occur when soils become saturated such that they cannot accept any more water.
8.9 Surface water runoff flooding can occur in rural and urban areas, but causes more damage in the latter. Developments that include significant impermeable surfaces, such as roads and car parks may increase the occurrence of surface water runoff.
8.10 Pluvial flooding may occur as a result of overland flow from saturated land. Urban areas can be inundated by flow from adjacent farmlands. Where ditches, drainage channels, culvert or sewer capacities are exceeded pluvial flooding can occur as a result of local rainfall (Balmforth et al., 2006). Pluvial flooding is exacerbated by structure failures and blockages. Where drainage channels become blocked or flood defence structures fail, significant flooding can occur.

Flooding from land
Chichester SFRA (July 2008) Volume II - Technical Report
8-3
8.11 Urban areas usually have extensive drainage or sewer systems. For the purpose of this study, urban, drainage-related flooding and rural or peri-urban flooding caused by saturated soils leading to overland flow have been dealt with as two, separate types of flooding. Urban drainage flooding is covered in greater detail in Chapter 10 (Flooding from sewers).
8.12 Flooding as a result of a structural failure may include damage to any structure that leads to flooding. Within this study such failures include culvert collapse, damage to a penstock and inadequate culvert operation. Flooding can also occur as a result of blockages in drainage or sewerage systems. This is more frequently an urban problem, where it is likely to cause more damage than in a rural setting.
8.13 Direct runoff from hills, inadequate local drainage systems, surface water ponding in low points and exceedance of local drainage infrastructure can also be locally responsible for increased runoff and soil erosion from agricultural land during heavy rain.
Impacts of surface water flooding 8.14 Surface water flooding can affect all forms of the built environment, including residential,
commercial and industrial properties; infrastructure, such as roads and railways, telecommunication system and sewer systems; agriculture; the natural environment and amenity and recreation facilities.
8.15 Flooding from overland flow will tend to last the duration of the rainfall event. However flooding may persist in low-lying areas where ponding occurs. Flooding may occur as sheet flow or as rills and gullies. Overland flow can result in “muddy floods” where soil and other material is washed onto roads and properties.
8.16 Flood pathways include the land and water features over which floodwater flows. These pathways include rivers, drainage channels, rail and road cuttings, canals and coastal systems. Flood management infrastructure can also serve as a flood pathway.
8.17 Both rural and urban land use changes are likely to alter flood pathways in the future. Future development in floodplains is also likely to change the position and numbers of people and/or developments susceptible to flooding (Defra, 2004).
Data collection
Records of historic flood incidents 8.18 A comprehensive list of the datasets collated during the production of the SFRA is included in
Volume III. Table 8.1 includes a summary of the historic flood information collected during this study.
8.19 A review of all available datasets has identified the locations and types of historic flooding problems. Map H within Annex A of the SFRA displays all historic flood information. All historic records attributed to surface water flooding have been plotted on Map L, Annex A.
8.20 The principal dataset used to create historical spatial and temporal flood maps of for the SFRA was provided by the Environment Agency Flood Events database. This was supplemented by other information provided by organisations as noted in Table 8.1.
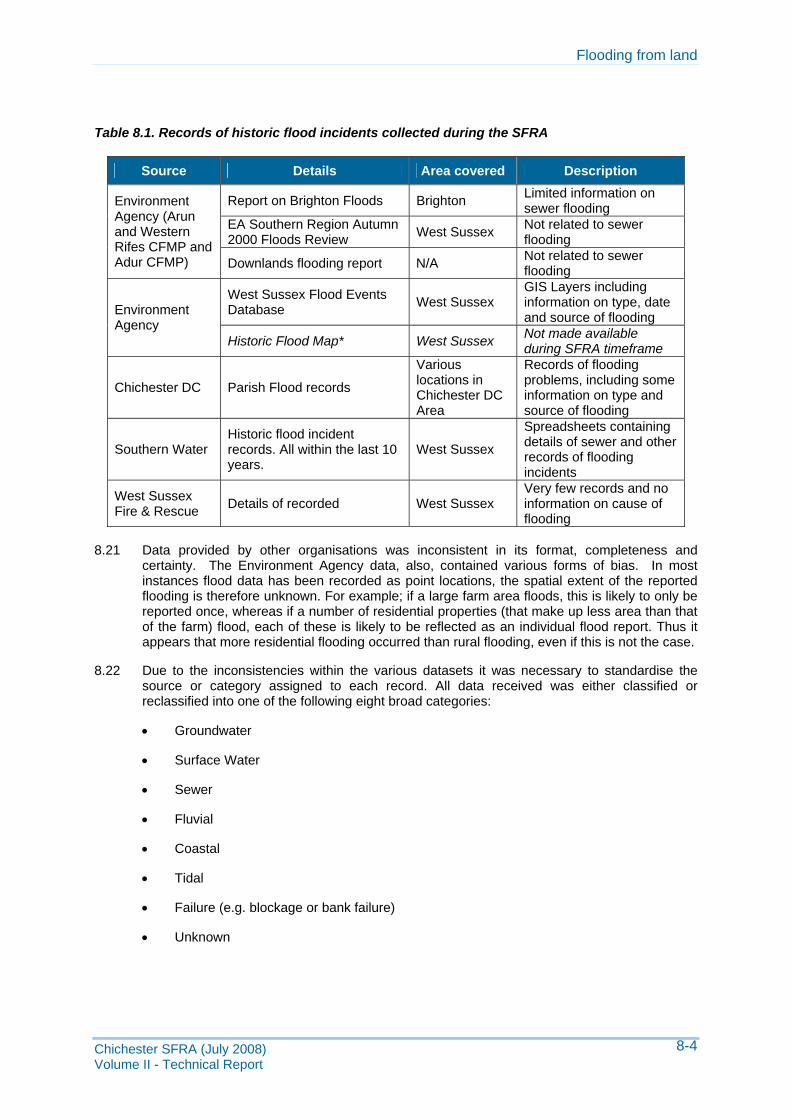
Flooding from land
Chichester SFRA (July 2008) Volume II - Technical Report
8-4
Table 8.1. Records of historic flood incidents collected during the SFRA
Source Details Area covered Description
Report on Brighton Floods Brighton Limited information on sewer flooding
EA Southern Region Autumn 2000 Floods Review West Sussex Not related to sewer
flooding
Environment Agency (Arun and Western Rifes CFMP and Adur CFMP) Downlands flooding report N/A Not related to sewer
flooding
West Sussex Flood Events Database West Sussex
GIS Layers including information on type, date and source of flooding Environment
Agency Historic Flood Map* West Sussex Not made available
during SFRA timeframe
Chichester DC Parish Flood records
Various locations in Chichester DC Area
Records of flooding problems, including some information on type and source of flooding
Southern Water Historic flood incident records. All within the last 10 years.
West Sussex
Spreadsheets containing details of sewer and other records of flooding incidents
West Sussex Fire & Rescue Details of recorded West Sussex
Very few records and no information on cause of flooding
8.21 Data provided by other organisations was inconsistent in its format, completeness and
certainty. The Environment Agency data, also, contained various forms of bias. In most instances flood data has been recorded as point locations, the spatial extent of the reported flooding is therefore unknown. For example; if a large farm area floods, this is likely to only be reported once, whereas if a number of residential properties (that make up less area than that of the farm) flood, each of these is likely to be reflected as an individual flood report. Thus it appears that more residential flooding occurred than rural flooding, even if this is not the case.
8.22 Due to the inconsistencies within the various datasets it was necessary to standardise the source or category assigned to each record. All data received was either classified or reclassified into one of the following eight broad categories:
• Groundwater
• Surface Water
• Sewer
• Fluvial
• Coastal
• Tidal
• Failure (e.g. blockage or bank failure)
• Unknown

Flooding from land
Chichester SFRA (July 2008) Volume II - Technical Report
8-5
Data Processing 8.23 The following categories are assigned within the Environment Agency data received:
• OSF - Operational Structure Failure
• DK - Don't Know
• DR - Drainage
• OBE - Obstruction / blockage
• OCE - Overtopping Capacity Exceeded
• OTHER - Other
• GW – Groundwater
• SEWER – Sewer
• SEA - Coastal / Sea
• TIDAL - Tidal (Flooding on saline sections of rivers)
8.24 Discussions with the Environment Agency (Jonathan Hunter, Sussex Area) confirmed that the category ‘OTHER’ had in the past been used to assign groundwater flooding, flooding from dam breakages, flooding from overland flow and from urban drainage. The later addition of a specific code for groundwater flooding and a tendency to use ‘OTHER’ as a catch all for overland flow has led to confusion.
8.25 Therefore within the SFRA 'OTHER' data points have been assessed and re-categorised. Firstly where records coincided with areas in which groundwater flooding had been identified as likely these points were categorised as ‘Groundwater’. The remaining data points were sorted depending on whether they occurred in urban or rural areas. Where the data points occurred in urban areas, these were categorised as ‘Sewer’, and if the points occurred in rural or peri-urban areas they were categorised as ‘Surface Water’.
8.26 Data received classified as ‘Don’t Know’ or without flood type information (such as the 1899 data points) were also reclassified. This was based on the position of the data point. Those that were on the banks of a river were classified as fluvial flooding, and those positioned on roads within towns were classified as ‘Surface Water’. ‘Don’t Know’ and 1899 data points that coincided with areas in which groundwater flooding had been identified were also reclassified as ‘Groundwater’ flooding.
8.27 Flood incidents classified by the Environment Agency as ‘DR’ or ‘Drainage’ where often due to surface water issues in rural areas, but in urban areas flooding was caused by issues with sewer drainage. It was therefore decided appropriate to re-classify all ‘Drainage’ events according to the 10k urban extent GIS layer. Those ‘DR’ events within an urban area were classified as ‘Sewer’, and those outside as ‘Surface Water’.
8.28 The original flood categories have thus been re-classified as follows:
Table 8.2 - Classification and re-classification of historic flood event records
EA Designation Code Name Reclassification
Unknown Unknown Unknown
Other Other Reclassified as ''Groundwater', Surface Water' or 'Sewer'
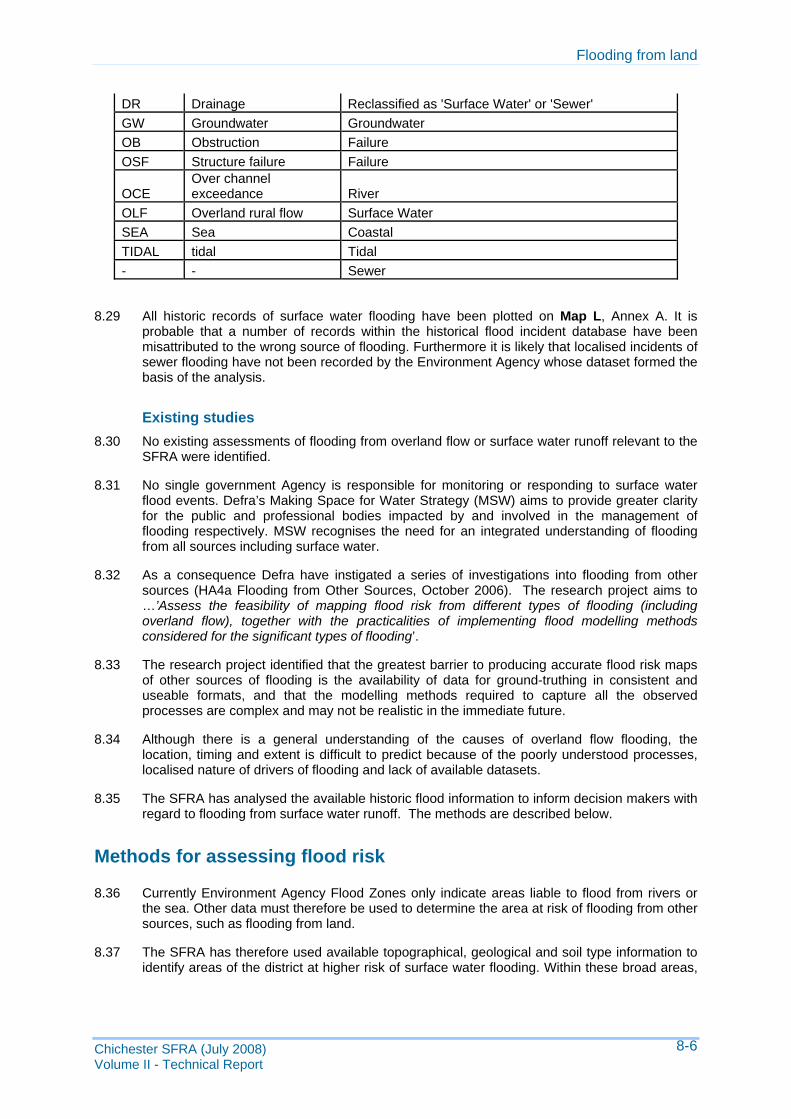
Flooding from land
Chichester SFRA (July 2008) Volume II - Technical Report
8-6
DR Drainage Reclassified as 'Surface Water' or 'Sewer' GW Groundwater Groundwater OB Obstruction Failure OSF Structure failure Failure
OCE Over channel exceedance River
OLF Overland rural flow Surface Water SEA Sea Coastal TIDAL tidal Tidal - - Sewer
8.29 All historic records of surface water flooding have been plotted on Map L, Annex A. It is probable that a number of records within the historical flood incident database have been misattributed to the wrong source of flooding. Furthermore it is likely that localised incidents of sewer flooding have not been recorded by the Environment Agency whose dataset formed the basis of the analysis.
Existing studies 8.30 No existing assessments of flooding from overland flow or surface water runoff relevant to the
SFRA were identified.
8.31 No single government Agency is responsible for monitoring or responding to surface water flood events. Defra’s Making Space for Water Strategy (MSW) aims to provide greater clarity for the public and professional bodies impacted by and involved in the management of flooding respectively. MSW recognises the need for an integrated understanding of flooding from all sources including surface water.
8.32 As a consequence Defra have instigated a series of investigations into flooding from other sources (HA4a Flooding from Other Sources, October 2006). The research project aims to …’Assess the feasibility of mapping flood risk from different types of flooding (including overland flow), together with the practicalities of implementing flood modelling methods considered for the significant types of flooding’.
8.33 The research project identified that the greatest barrier to producing accurate flood risk maps of other sources of flooding is the availability of data for ground-truthing in consistent and useable formats, and that the modelling methods required to capture all the observed processes are complex and may not be realistic in the immediate future.
8.34 Although there is a general understanding of the causes of overland flow flooding, the location, timing and extent is difficult to predict because of the poorly understood processes, localised nature of drivers of flooding and lack of available datasets.
8.35 The SFRA has analysed the available historic flood information to inform decision makers with regard to flooding from surface water runoff. The methods are described below.
Methods for assessing flood risk
8.36 Currently Environment Agency Flood Zones only indicate areas liable to flood from rivers or the sea. Other data must therefore be used to determine the area at risk of flooding from other sources, such as flooding from land.
8.37 The SFRA has therefore used available topographical, geological and soil type information to identify areas of the district at higher risk of surface water flooding. Within these broad areas,

Flooding from land
Chichester SFRA (July 2008) Volume II - Technical Report
8-7
the historic flood information identifies areas where flooding has occurred in the past and can be used to further inform decision makers with regard to the risk of flooding from surface water runoff.
8.38 Map L (Annex A), shows the areas categorised as at ‘low to medium’ and ‘medium to high’ risk of flooding from land and the historic flood events attributed to surface water flooding. Major urban areas have also been identified. These urban areas are likely to be served by significant drainage infrastructure and therefore for the SFRA it has been assumed that flooding from sewers is likely to be the more important source of flooding to consider than flooding from land.
Climate change 8.39 There is no research specifically considering the impact of climate change on surface water
flooding. The mechanisms of flooding from overland flow are likely to be affected by climate change. Future climate change projections indicate that more frequent short-duration, high intensity rainfall and more frequent periods of long duration rainfall are to be expected. These kinds of changes will have implications for overland flow flooding.
8.40 Indirect impacts of climate change on land use and land management may also change future flood risk.
8.41 In the absence of certainty PPS25 advocates a precautionary approach using sensitivity ranges for peak rainfall intensities over various time horizons. As our understanding of the impact of climate change increase these guidelines are likely to be revised. It is imperative that the SFRA is reviewed appropriately.
Results 8.42 Map L in Annex A shows the results of the analysis of surface water flooding over Chichester
District. This shows that the low-lying land, generally south of the A27 is at highest risk of flooding, due to the flat topography and impermeable (clay) geology. A further area at higher risk has been identified along the River Rother corridor.
8.43 The historic flood records generally correspond with the identified flood risk regions, with a greater number of records in the south of the District. Although this may be in part due to the higher population density in this area.
8.44 In the South Downs area the records of historic flooding are mostly associated in highway drainage and the flooding of roads.
8.45 Urban areas have been excluded from the assessment as these are likely to have significant sewer infrastructure and therefore flooding is more likely to occur from sewers (refer to Chapter 10).
Uncertainty in flood risk assessment
8.46 The causes of surface water flooding are generally understood. However it is difficult to predict the actual location, timing and extent of surface water flooding, which are dependent upon the characteristics of the proposed land use, local variations in topography, geology, soils and the hydrological conditions.
8.47 There is a lack of reliable measured datasets. The estimation of return periods for surface water flooding events is therefore difficult to verify.
8.48 Strategic studies therefore tend to present the occurrences of surface water flooding, rather than undertake a frequency analysis.

Flooding from land
Chichester SFRA (July 2008) Volume II - Technical Report
8-8
8.49 The impact of climate change on surface water flooding is uncertain. More intense short duration rainfall and higher winter rainfall are both likely to exacerbate surface water flooding in the future.
8.50 Making Space for Water (Defra, 2004) recognises the need for an integrated understanding of flooding from all sources including groundwater. Ongoing research into other sources of flooding, notably HA4 should inform the update of this SFRA when finalised.
References
• Defra 2006 (2006a) 'Flooding from other sources' Technical report HA4a, prepared by Jacobs, October 2006
• Balmforth, D, CJ Digman, D Butler and P Schaffer, 2006. Defra Integrated Urban Drainage Pilots. Scoping Study March 2006

Flooding from groundwater
Chichester SFRA (July 2008) Volume II - Technical Report
9-1
9. Flooding from groundwater
The Chichester DC Strategic Flood Risk Assessment (SFRA) is a "live" document. The current version is developed using the best information and concepts available at the time. As new information and concepts become available the document will be updated and so it is the responsibility of the reader to be satisfied that they are using the most up-to-date information and that the SFRA accounts for this information. All revisions to this summary document are listed in the table.
Version Issue Date Issued by Issued to
Final 29/07/08 Capita Symonds
Ltd
CDC, EA

Flooding from groundwater
Chichester SFRA (July 2008) Volume II - Technical Report
9-2
Introduction
9.1 Groundwater flooding is caused by the emergence of water originating from sub-surface permeable strata (Defra 2006). A groundwater flood event results from a rise in groundwater level sufficient for the water table to intersect the ground surface and inundate low lying areas.
9.2 Groundwater floods may emerge from either point or diffuse (widespread) locations. They tend to be long in duration developing over weeks or months and prevailing for days or weeks.
9.3 There are numerous mechanisms associated with groundwater flooding; all are linked to high groundwater levels and can be broadly classified as:
• direct contribution to channel flow;
• springs erupting at the surface;
• inundation of drainage infrastructure; and
• inundation of low-lying property (basements).
9.4 Groundwater level rise in response to extreme rainfall can occur regularly, in several locations in England and on a significant geographical scale.
9.5 Although groundwater flood events have been recorded in various aquifer units (such as Cretaceous Chalk, Limestones, River Terrace Gravels), accounts of groundwater flooding are almost entirely confined to the chalk outcrop and within the chalk of Southern England (Defra 2006).
9.6 The primary controls on the distribution and timing of groundwater flooding from chalk are:
• spatial and temporal distribution of rainfall;
• spatial distribution of aquifer properties;
• recharge mechanisms;
• spatial distribution of geological structures (drift deposits, stratigraphy); and
• efficiency of the surface drainage network.
9.7 Compared to other aquifer units Chalk is more vulnerable to groundwater flooding because of its geological formation. During periods of rapid recharge groundwater flow through both pores and fissures can result in rapid rises in groundwater levels and subsequently prolonged recession of these levels. Where chalk aquifers are exposed, with no significant drift cover, the propensity for groundwater flooding is also higher.
9.8 Groundwater flooding occurs when groundwater levels rise to the ground surface and the local drainage network is unable to cope with the volume of water. These areas are often located near or beyond the headwaters of ephemeral streams.
9.9 Where channels seldom flow there is a tendency for them to become neglected, poorly maintained, or constricted by development. The vulnerability of an aquifer to groundwater flooding can largely be determined by an analysis of the meteorological situation and geological knowledge.
9.10 Groundwater flooding has always occurred. It generally occurs more slowly than river flooding and in specific locations. The rarity of groundwater flooding combined with the mobility of the population means that people often do not know there is a groundwater flood risk.

Flooding from groundwater
Chichester SFRA (July 2008) Volume II - Technical Report
9-3
9.11 New developments are particularly at risk because little consideration is given to groundwater as a source of flooding in the planning process. The sparse frequency of groundwater flood events can contribute to poor decision-making.
9.12 The nature and occurrence of groundwater flooding in England is highly variable. 1.7million properties are vulnerable to groundwater flooding in England (Defra 2004). The occurrence of groundwater flooding is very local and often results from the interaction of very site specific factors, such as aquifer properties and topography.
Causes of high groundwater levels 9.13 High groundwater levels can result from the combination of geological, hydrogeological,
topographic and recharge phenomena and can mostly be associated with:
• rising groundwater levels in response to prolonged extreme rainfall;
• rising groundwater levels due to leaking sewers, drains and water supply reservoirs;
• increased groundwater levels due to artificial obstructions;
• groundwater rebound owing to rising water table and failed or ceased pumping;
• upward leakage of groundwater driven by artesian heads; and
• inundation of trenches intercepting high groundwater levels.
9.14 Table 9.1 summarises the characteristics of each of these forms of groundwater flooding using the source-pathway-receptor model.
9.15 In the SFRA study area rising groundwater levels in major aquifers as a result of long duration rainfall presents the greatest and most extensive level of groundwater flood risk. The impacts of the other forms of groundwater flooding are not significant in terms of scale or cost, and cannot be easily identified at the strategic level. Although the hazard associated with other forms of groundwater flooding can be notable, these are commonly localised and very difficult to identify.
9.16 For the purposes of the SFRA it is appropriate to consider the geographical scale, social and economic cost and certainty of prediction when considering groundwater flood risk. Rising groundwater levels as a result of extreme rainfall therefore presents a high risk to property damage over a long time scale event.
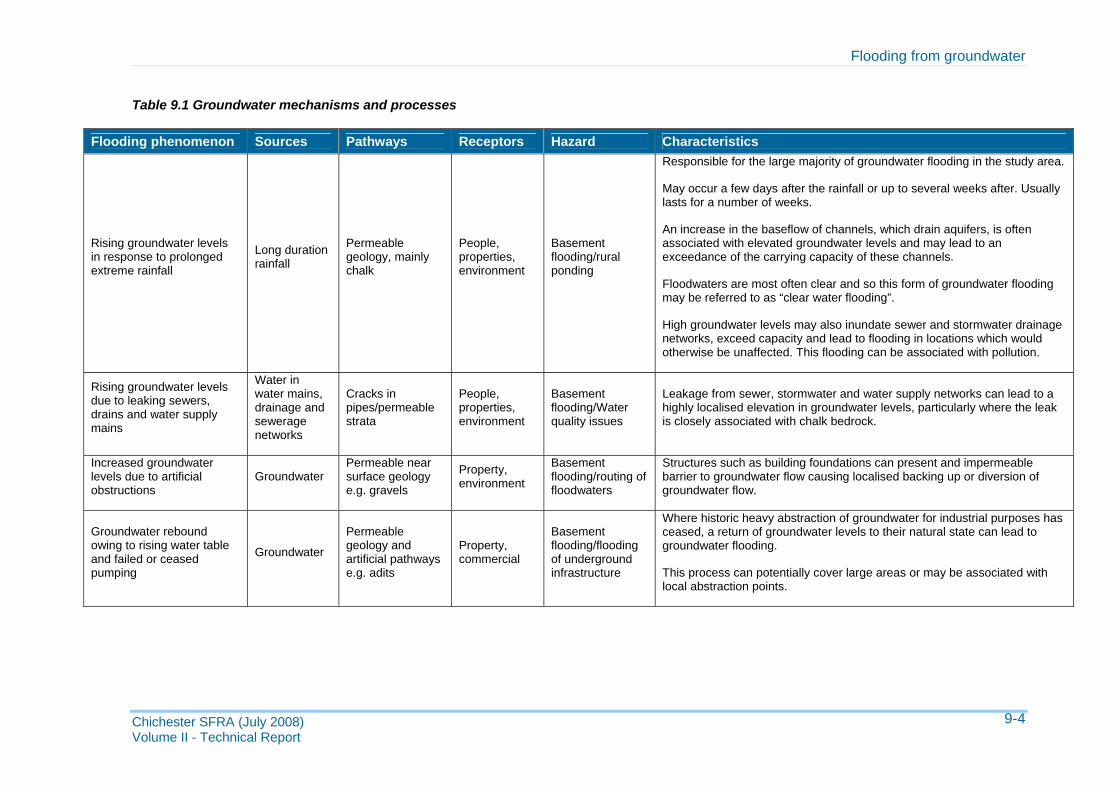
Flooding from groundwater
Chichester SFRA (July 2008) Volume II - Technical Report
9-4
Table 9.1 Groundwater mechanisms and processes
Flooding phenomenon Sources Pathways Receptors Hazard Characteristics
Rising groundwater levels in response to prolonged extreme rainfall
Long duration rainfall
Permeable geology, mainly chalk
People, properties, environment
Basement flooding/rural ponding
Responsible for the large majority of groundwater flooding in the study area.
May occur a few days after the rainfall or up to several weeks after. Usually lasts for a number of weeks.
An increase in the baseflow of channels, which drain aquifers, is often associated with elevated groundwater levels and may lead to an exceedance of the carrying capacity of these channels.
Floodwaters are most often clear and so this form of groundwater flooding may be referred to as “clear water flooding”.
High groundwater levels may also inundate sewer and stormwater drainage networks, exceed capacity and lead to flooding in locations which would otherwise be unaffected. This flooding can be associated with pollution.
Rising groundwater levels due to leaking sewers, drains and water supply mains
Water in water mains, drainage and sewerage networks
Cracks in pipes/permeable strata
People, properties, environment
Basement flooding/Water quality issues
Leakage from sewer, stormwater and water supply networks can lead to a highly localised elevation in groundwater levels, particularly where the leak is closely associated with chalk bedrock.
Increased groundwater levels due to artificial obstructions
Groundwater Permeable near surface geology e.g. gravels
Property, environment
Basement flooding/routing of floodwaters
Structures such as building foundations can present and impermeable barrier to groundwater flow causing localised backing up or diversion of groundwater flow.
Groundwater rebound owing to rising water table and failed or ceased pumping
Groundwater
Permeable geology and artificial pathways e.g. adits
Property, commercial
Basement flooding/flooding of underground infrastructure
Where historic heavy abstraction of groundwater for industrial purposes has ceased, a return of groundwater levels to their natural state can lead to groundwater flooding.
This process can potentially cover large areas or may be associated with local abstraction points.

Flooding from groundwater
Chichester SFRA (July 2008) Volume II - Technical Report
9-5
Flooding phenomenon Sources Pathways Receptors Hazard Characteristics
Upward leakage of groundwater driven by artesian head
Groundwater emerging from boreholes or through permeable geology
Artesian aquifer and connection to surface
Property Basement flooding/flooding at surface
Mainly associated with short duration and localised events this process can lead to significant volumes of discharge.
It can occur in locations where boreholes have been drilled through a confining layer of clay to reach the underlying aquifer.
Inundation of trenches intercepting high groundwater levels
Groundwater Permeable geology Property Routing of
floodwaters
The excavation and fill of engineering works with permeable material can create groundwater flow paths.
High groundwater levels maybe intercepted, resulting in flooding of trenches and land to which they drain.
Other – alluvial aquifers, sea level rise
Rivers, rainfall, sea
Floodplain gravels, permeable geology
Property, environment
Basement flooding/flooding at surface/saline intrusion.
Other mechanisms of groundwater flooding include leakage of fluvial flood waters through river gravels to surrounding floodplains e.g. behind flood defences; and a rise in groundwater levels as a result of adjacent sea level rise as a result of the discharge boundary rising.

Flooding from groundwater
Chichester SFRA (July 2008) Volume II - Technical Report
9-6
Impacts of groundwater flooding 9.17 Groundwater flooding can be expected to have the following impacts:
• Flooding of basements of buildings below ground level – in the mildest case this may involve seepage of small volumes through walls and temporary loss of services. In more extreme cases larger volumes may lead to the catastrophic loss of stored items and loss of structural integrity.
• Overflowing of sewers and drains – surcharging of drainage networks can lead to overland flows causing significant but localised damage to property. Sewer surcharging can lead to inundation of property by polluted water.
• Flooding of buried services or other assets below ground level – prolonged inundation of buried services can lead to interruption and disruption of supply.
• Inundation of farmland, roads, commercial, residential and amenity areas – inundation of grassed areas can be inconvenient, however the inundation of areas of hard standing can lead to structural damage and the disruption of commercial activity. Inundation of agricultural land for long durations can have financial consequences.
• Flooding of ground floors of buildings above ground level – this can be disruptive, and may result in structural damage. The long duration of flooding can outweigh the lead time which would otherwise reduce the overall level of damages.
9.18 An increase in pore pressures in clay overlying chalk aquifers can also be associated with groundwater flooding. This may cause costly damage to structures in the ground and the buildings that they support.
9.19 In general terms groundwater flooding does not pose a risk to life. However groundwater flooding can be associated with significant damage to property. The economic and social costs of groundwater flooding are compounded by the relative long duration of events.
Data collection
Sources of data 9.20 A comprehensive list of the datasets collated during the production of the SFRA is included in
Volume III. Data relevant to groundwater flooding and covering the study area are summarised in Table 9.2.
Table 9.2 Groundwater Flooding Related Datasets
Data Source Comment Hydrometric Information Southern Region – Hydrometric Yearbook.
Environment Agency
List of groundwater monitoring stations Southern Region.
Hydrological Data UK, Hydrometric Register 1996-2000.
Centre for Ecology and Hydrology
List of groundwater monitoring stations and station records for key stations from 1996-2000.
Hydrometric Data
Groundwater borehole records Environment Agency
Groundwater monitoring borehole and well records from across the county.
Historic Flood Records Historic Flood Map, Flood Events Database
Environment Agency
Dataset outlining all recent flood events in the county that includes groundwater.
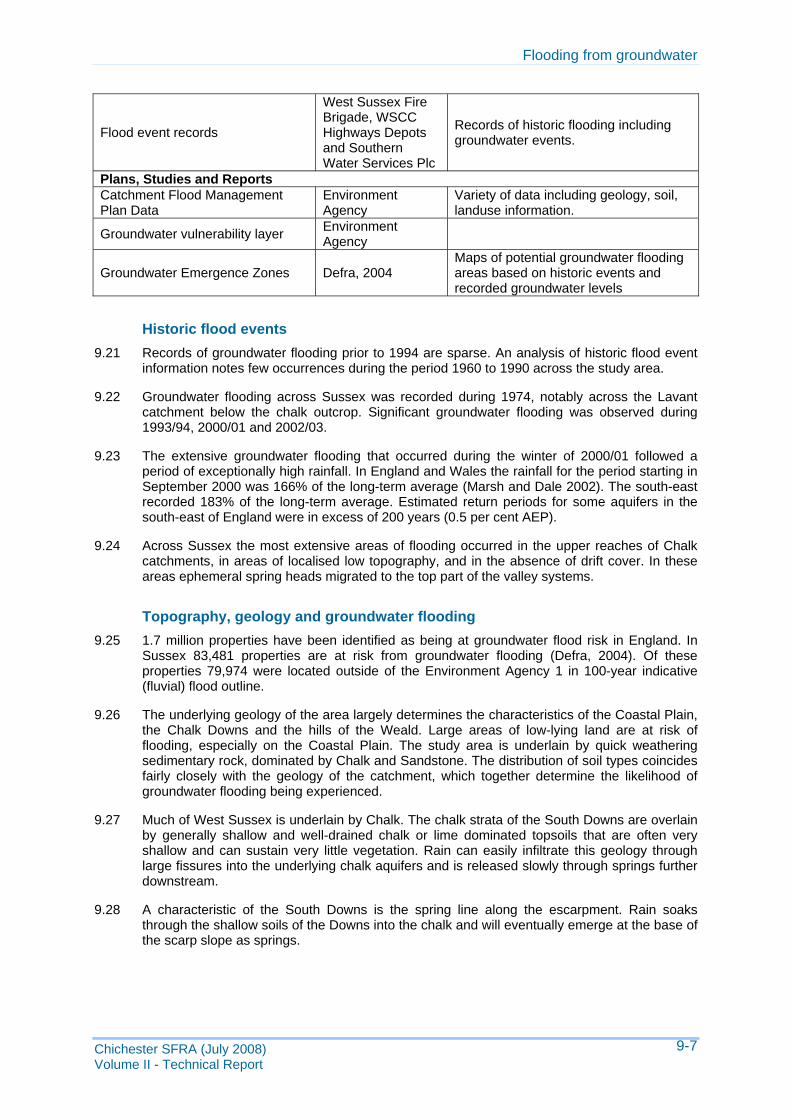
Flooding from groundwater
Chichester SFRA (July 2008) Volume II - Technical Report
9-7
Flood event records
West Sussex Fire Brigade, WSCC Highways Depots and Southern Water Services Plc
Records of historic flooding including groundwater events.
Plans, Studies and Reports Catchment Flood Management Plan Data
Environment Agency
Variety of data including geology, soil, landuse information.
Groundwater vulnerability layer Environment Agency
Groundwater Emergence Zones Defra, 2004 Maps of potential groundwater flooding areas based on historic events and recorded groundwater levels
Historic flood events 9.21 Records of groundwater flooding prior to 1994 are sparse. An analysis of historic flood event
information notes few occurrences during the period 1960 to 1990 across the study area.
9.22 Groundwater flooding across Sussex was recorded during 1974, notably across the Lavant catchment below the chalk outcrop. Significant groundwater flooding was observed during 1993/94, 2000/01 and 2002/03.
9.23 The extensive groundwater flooding that occurred during the winter of 2000/01 followed a period of exceptionally high rainfall. In England and Wales the rainfall for the period starting in September 2000 was 166% of the long-term average (Marsh and Dale 2002). The south-east recorded 183% of the long-term average. Estimated return periods for some aquifers in the south-east of England were in excess of 200 years (0.5 per cent AEP).
9.24 Across Sussex the most extensive areas of flooding occurred in the upper reaches of Chalk catchments, in areas of localised low topography, and in the absence of drift cover. In these areas ephemeral spring heads migrated to the top part of the valley systems.
Topography, geology and groundwater flooding 9.25 1.7 million properties have been identified as being at groundwater flood risk in England. In
Sussex 83,481 properties are at risk from groundwater flooding (Defra, 2004). Of these properties 79,974 were located outside of the Environment Agency 1 in 100-year indicative (fluvial) flood outline.
9.26 The underlying geology of the area largely determines the characteristics of the Coastal Plain, the Chalk Downs and the hills of the Weald. Large areas of low-lying land are at risk of flooding, especially on the Coastal Plain. The study area is underlain by quick weathering sedimentary rock, dominated by Chalk and Sandstone. The distribution of soil types coincides fairly closely with the geology of the catchment, which together determine the likelihood of groundwater flooding being experienced.
9.27 Much of West Sussex is underlain by Chalk. The chalk strata of the South Downs are overlain by generally shallow and well-drained chalk or lime dominated topsoils that are often very shallow and can sustain very little vegetation. Rain can easily infiltrate this geology through large fissures into the underlying chalk aquifers and is released slowly through springs further downstream.
9.28 A characteristic of the South Downs is the spring line along the escarpment. Rain soaks through the shallow soils of the Downs into the chalk and will eventually emerge at the base of the scarp slope as springs.

Flooding from groundwater
Chichester SFRA (July 2008) Volume II - Technical Report
9-8
9.29 However, groundwater flooding is not limited to the spring line. Significant flooding has also arisen in the areas downstream of major aquifers in the surrounding floodplains. Springs sustain baseflow and low flows throughout the county.
9.30 Soils on the Manhood Peninsula are seasonally waterlogged and clay-rich. The River Ems and Bosham Stream in the west of the peninsula run through this relatively impermeable coastal plain, however they have a high winter baseflow component as the headwaters are fed by chalk springs in the south of the South Downs. Prolonged wet winter periods lead to high groundwater levels that result in saturated ground conditions and extensive surface water in the upper catchments. This leads to an immediate response to additional rainfall and high flow velocities due to the steep stream gradients at the foot of the Downs. Groundwater processes are an important contributor to flooding in these areas.
9.31 Large areas of the district have relatively impermeable soils, the parent material of which is the dominant bedrock of the Weald, Sandstone. This bedrock weathers quickly in geological terms, leaving clay-rich soils, which generate a large amount of runoff quickly. Steep gradients in the High Weald intensify runoff velocities and volumes, leading to a higher density of streams on the Weald Clay. Poor surface drainage in these areas results in a scarcity of alluvial deposits.
9.32 The Sussex Rifes, which drain the flat coastal plain, respond rapidly to rainfall due to the waterlogged clay soils in the area. Flood velocities are relatively slow however due to shallow gradients. The watercourses in these areas are therefore runoff dominated. The likelihood of groundwater flooding in these regions is relatively low.
Methods for assessing flood risk
Identifying groundwater flood risk 9.33 No single government Agency is responsible for monitoring or responding to groundwater
flood events. Defra’s Making Space for Water Strategy (MSW) aims to provide greater clarity for the public and professional bodies impacted by and involved in the management of flooding respectively. MSW recognises the need for an integrated understanding of flooding from all sources including groundwater.
9.34 As a consequence Defra have instigated a series of investigations into groundwater flooding (HA4a Flooding from Other Sources, October 2006; and HA5 Groundwater Flooding Records Collation, Monitoring and Risk Assessment, March 2006).
9.35 The research projects aim to:
• HA4 - Assess the feasibility of mapping flood risk from different types of flooding (including groundwater), together with the practicalities of implementing flood modelling methods considered for the significant types of flooding (including groundwater flooding).
• HA5 - Make recommendations for effective collation and monitoring of groundwater flooding information and identify organisational and funding arrangements required to implement this.
9.36 The research projects have identified:
• HA4 - The greatest barrier to producing accurate flood risk maps of other sources of flooding is the availability of data for ground-truthing in consistent and useable formats, and that the modelling methods that would be required to capture all the observed processes are complex and may not be realistic in the immediate future.

Flooding from groundwater
Chichester SFRA (July 2008) Volume II - Technical Report
9-9
• HA5 - A national database for groundwater flooding is desirable and that scientific research into improving the understanding of groundwater flood processes is required; and
9.37 Although there is a general understanding of the causes of groundwater flooding, the location, timing and extent is difficult to predict because of the poorly understood processes, localised nature of drivers of groundwater flooding and lack of available datasets.
9.38 A number of attempts have been made at predicting groundwater flooding, particularly in chalk aquifers. These are outlined below.
Predicting groundwater flooding 9.39 The estimation of return periods for groundwater flooding events is complicated due to the
non-independence of groundwater level data. Studies therefore tend to present the occurrences of high groundwater levels or flooding, rather than undertake a frequency analysis.
9.40 There have been a number of approaches adopted for the prediction of groundwater flooding including:
• Determining the depth of the water table using regional groundwater levels and topographic models (Jackson 2004). The level of risk was assigned based on the depth to the water table.
• Production of groundwater emergence maps (GEMs) using historical datasets and predictive techniques (Defra 2004) used to define groundwater emergence areas in England. These maps have been produced using observations of groundwater flooding in 2000/1 and, where insufficient observations exist, by mapping representative rises in groundwater levels at locations where the water table neared the ground surface during this period. The resulting maps provide an indication of where groundwater may emerge NOT where groundwater flooding might occur.
• Simple mass balance spreadsheet models to relate rainfall to groundwater levels. These models predict the emergence of groundwater at different spring line elevations based upon different rainfall conditions. Regional numerical groundwater models may also be used although these are often calibrated against periods of low groundwater levels for abstraction management, reducing the applicability for flood prediction.
Methods used in the SFRA 9.41 Overlaying GIS datasets can produce a better understanding of groundwater emergence and
therefore an indicative overview of groundwater flood risk. The first analysis undertaken in the SFRA was a comparison of:
• groundwater borehole data from the 2000/1 event;
• areas of probable groundwater flooding in 1994 and 2000/1 as identified in the CFMPs; and
• point historic flood event data (as listed in Table 9.2).
9.42 The following trends could be distinguished:
• CFMP groundwater polygon data was located downstream of boreholes, indicating artesian flow during the 2000/1 event.
• CFMP groundwater polygon data was coincident with a number of historic events.

Flooding from groundwater
Chichester SFRA (July 2008) Volume II - Technical Report
9-10
• Significant numbers of historic data points were situated south of boreholes that had high groundwater levels during the 2000/1 event.
• Large numbers of historic data points appeared to be related to groundwater emergence.
9.43 An analysis of physical, hydrological and environmental spatial data sets within a Geographical Information System (GIS) platform was undertaken after the initial assessment. The analysis allowed areas that had not previously been highlighted, but had a greater likelihood of experiencing groundwater flooding, to be identified.
9.44 The first stage of the spatial analysis was to identify drivers of groundwater flooding. Each driver was then assigned a weighting value based on the relative importance of its contribution to groundwater flooding. Drivers and values for groundwater flooding were:
• Geology (value of 7).
• Soil (value of 4).
• Historic Groundwater Events (value of 3).
• Agricultural Land Classification (value of 1).
• Land Classification (value of 1).
9.45 Datasets for each driver were collected and assembled in a GIS platform. Each driver dataset was divided into three categories (high, medium and low), based on likelihood for flooding. For example chalk geology was assigned a value of 3, whereas clay geology was assigned a value of 1. The only exception was for historic groundwater events. In this case a 3 was attributed to a grid square which contained at least 1 historic groundwater event. A 0 was attributed if no events had occurred in the grid square.
9.46 The datasets were then interrogated for a 250m grid cell and the rankings summed to come up with a total value indicating the likelihood of flooding for each grid cell. To allow the relative likelihood of flooding to be assessed, the cells were grouped into high, medium and low likelihood regions as shown on Map G1, Annex A. The results of the analyses were sensibility checked with known incidents of groundwater flooding. Map G2 (Annex A) shows the distribution of geology across the district. There are only two sets of recorded incidents of groundwater flooding across Chichester District, although I reality the number of historic incidents is far higher.
Climate change 9.47 There is no research specifically considering the impact of climate change on groundwater
levels. The mechanisms of flooding from aquifers are unlikely to be affected by climate change, however if winter rainfall becomes more frequent and heavier incidents of groundwater flooding may increase. Higher winter recharge could however be balanced by lower recharge during hotter and drier summers.
Results
9.48 The overriding characteristics of the spatial and temporal distribution of groundwater flooding from chalk aquifers across the study area are that flooding occurs:
• following above average recharge raising groundwater levels;
• in the vicinity of insufficient surface drainage; and

Flooding from groundwater
Chichester SFRA (July 2008) Volume II - Technical Report
9-11
• almost wholly on the outcrop of the chalk aquifer.
9.49 Local controls which appear to affect the distribution of groundwater flooding include:
• spatial and temporal distribution of rainfall;
• spatial distribution of aquifer properties;
• recharge mechanisms;
• spatial distribution of geological structures and drift deposits; and
• efficiency of the surface water drainage network
9.50 Information on the drivers of groundwater flooding, recorded historic flood events and areas likely to experience groundwater flooding have been collated in the production of the SFRA. Much of Chichester district has a high potential for groundwater flooding, due to the chalk geology. A large groundwater emergence zone (Defra, 2004) stretches across along the approximate route of the A27, including the towns of Southbourne, Bosham, Runcton and Chichester. Groundwater flooding is a known problem throughout the Downs north of Chichester. However, there are very few records of groundwater flooding in the district.
Uncertainties in flood risk assessment
9.51 The causes of groundwater flooding are generally understood. However groundwater processes are on the whole poorly understood. Groundwater flooding is dependant on local variations in topography, geology and soils. It is difficult to predict the actual location, timing and extent of groundwater flooding.
9.52 There is a lack of reliable measured datasets. The estimation of return periods for groundwater flooding events is complicated due to the non-independence of groundwater level data.
9.53 Studies therefore tend to present the occurrences of high groundwater levels or flooding, rather than undertake a frequency analysis.
9.54 The impact of climate change on groundwater levels is uncertain. Higher winter rainfall may increase the frequency of groundwater flooding incidents, but drier summers and lower recharge of aquifers may balance this.
9.55 Making Space for Water (Defra, 2004) recognises the need for an integrated understanding of flooding from all sources including groundwater. Ongoing research into groundwater flooding, notably HA5 Groundwater Flooding Records, Collation, Monitoring and Risk Assessment should inform the update of this SFRA when finalised.
References
• Balmforth, D, CJ Digman, D Butler and P Schaffer, 2006. Defra Integrated Urban Drainage Pilots. Scoping Study March 2006
• Conservation Technology Information Center (2005) 'Know Your Watershed' West Lafayette, Indiana 47906-1383
• Defra (2004) 'Making Space for Water: Developing a New Government Strategy for Flood & Coastal Erosion Risk Management' Physical Drivers Behind Flood and Coastal Erosion Risks. Department for Environment, Food and Rural Affairs

Flooding from groundwater
Chichester SFRA (July 2008) Volume II - Technical Report
9-12
• Defra (2006) ‘Making Space For Water. Groundwater Flooding Records Collation, Monitoring and Risk Assessment (reference HA5). Department for Environment, Food and rural Affairs.
• Defra 2006 (2006a) 'Flooding from other sources' Technical report HA4a, prepared by Jacobs, October 2006
• Jackson, I (2004). Britain Beneath Our Feet. British Geological Survey Occasional Publication No.4.
• Lancaster, J W et al (2004). Development and Flood Risk: guidance for the construction industry. CIRIA, London, 182pp.
• Marsh, T J and Dale, M (2002). The UK Floods of 2000-2001: A Hydrometrical Appraisal. Jnl. CIWEM, 16, p180-188.
• Meteorology @ Bracknell. http://homepage.ntlworld.com/booty.weather/climate/wxevents.htm. Accessed 9th January 2007.
• Summerfield, M.A. (1991) 'Global geomorphology' Wiley & Sons, New York

Flooding from sewers
Chichester SFRA (July 2008) Volume II - Technical Report
10-1
10. Flooding from sewers
The Chichester DC Strategic Flood Risk Assessment (SFRA) is a "live" document. The current version is developed using the best information and concepts available at the time. As new information and concepts become available the document will be updated and so it is the responsibility of the reader to be satisfied that they are using the most up-to-date information and that the SFRA accounts for this information. All revisions to this summary document are listed in the table.
Version Issue Date Issued by Issued to
Final 29/07/08 Capita Symonds
Ltd
CDC, EA

Flooding from sewers
Chichester SFRA (July 2008) Volume II - Technical Report
10-2
Introduction
Description 10.1 Flooding from sewers occurs when rainfall exceeds the capacity of sewer networks or when
there is an infrastructure failure.
10.2 For the purposes of this SFRA sewer flooding is defined as any flooding directly related to the failure (capacity or otherwise) of any piped drainage infrastructure. This includes combined and surface water sewers, culverted minor watercourses (lost watercourses), sewer pumping stations and water treatment facilities. It does not include flooding from overland drainage systems.
Causes of sewer flooding 10.3 The main causes of sewer flooding are:
• Lack of capacity in sewer drainage networks due to original under-design.
• Lack of capacity in sewer drainage networks due to an increase in demand (such as climate change and/or new developments).
• Lack of capacity in sewer drainage networks due to events larger than the system design event.
• Lack of capacity in sewer drainage networks when a watercourse is fully culverted (lost watercourses), thus removing floodplain capacity.
• Lack of maintenance of sewer networks which leads to a reduction in capacity and can sometime lead to total sewer blockage.
• Water mains bursting/leaking due to lack of maintenance or as a result of damage.
• Groundwater infiltration into poorly maintained or damaged pipe networks.
• Restricted outflow from the sewer systems due to high water levels in receiving watercourses or the sea.
Impacts of sewer flooding 10.4 The impact of sewer flooding is usually confined to relatively small localised areas. When
flooding is associated with blockage or failure of the sewer network, flooding can be rapid and unpredictable.
10.5 Drainage systems generally rely on gravity assisted dendritic systems, which convey water to trunk sewers located at the lower end of the catchment. Failure of these trunk sewers can have serious consequences, which is often exacerbated by topography as water from surcharged manholes will flow into low-lying land which may already be suffering from other types of flooding.
10.6 The modification of watercourses into culverted or piped structures results in a limited capacity. This reduced capacity may cause water to be sent along unexpected routes as its original channel is no longer present and the new system cannot absorb it.
10.7 Whilst the area affected by sewer flooding can be relatively small when considering flooding on the Chichester District scale, the quality of water can be poor. Flooding of combined sewers can lead to flood water contaminated with sewage entering properties and with this

Flooding from sewers
Chichester SFRA (July 2008) Volume II - Technical Report
10-3
comes the potential for the spread of water borne diseases and pollution of receiving watercourses.
10.8 Urban flooding is likely to have a high load of suspended solid, soluble and insoluble free phase liquid contaminants. This can lead to a reduction in the environmental quality of the receiving watercourses. Flooding of contaminative land uses (such as landfills, motorways, and petrol station forecourts) will transport contaminants to vulnerable receptors if the respective drainage systems are not designed to deal with storm events.
Data collection
Records of historic flood incidents 10.9 Datasets relating to sewer flooding are held by local planning authorities, water companies,
fire services (who keep records of call outs to flood events), internal drainage boards, the Environment Agency and the Highways Agency. The datasets contain various levels of detail depending on their purpose in relation to the collecting body. These datasets contain information on flood incidents from a range of flood sources, many of which are not related to sewer flooding.
10.10 A review of all available datasets (as listed in Table 10.1) has identified the locations and types of historic flooding problems. Map H within Annex A of the SFRA displays all historic flood information. Furthermore all historic records attributed to sewer flooding have been plotted on Map S, Annex A.
Table 10.1 - Records of historic flood incidents collected during the SFRA
Source Details Area covered Description EA Southern Region Autumn 2000 Floods Review West Sussex Not related to sewer
flooding Arun and Western Rifes CFMP and Adur CFMP Downlands flooding report N/A Not related to sewer
flooding
Environment Agency
West Sussex Flood Events Database West Sussex
GIS Layers including information on type, date and source of flooding
Chichester DC Parish Flood records
Various locations in Chichester DC Area
Records of flooding problems, including some information on type and source of flooding
Southern Water Historic flood incident records. All within the last 10 years.
West Sussex
Spreadsheets containing details of sewer and other records of flooding incidents
West Sussex Fire & Rescue Service
Details of recorded flood incidents West Sussex
Very few records and no information on cause of flooding
10.11 The principal dataset used to create historical flood maps for the SFRA was provided by the Environment Agency Flood Events database. This data was supplemented by other information provided by organisations as noted in Table 10.1.
10.12 Data provided by other organisations was inconsistent in its format, completeness and certainty. The Environment Agency data, also, contained various forms of bias. In most instances flood data has been recorded as point locations, the spatial extent of the reported

Flooding from sewers
Chichester SFRA (July 2008) Volume II - Technical Report
10-4
flooding is therefore unknown. For example; if a large farm area floods, this is likely to only be reported once, whereas if a number of residential properties (that make up less area than that of the farm) flood, each of these is likely to be reflected as an individual flood report. Thus it appears that more residential flooding occurred than rural flooding, even if this is not the case.
10.13 Due to the inconsistencies within the various datasets it was necessary to standardise the source or category assigned to each record. All data received was either classified for reclassified in one of the following eight broad categories:
• Groundwater
• Surface Water
• Sewer
• Fluvial
• Coastal
• Tidal
• Failure (e.g. blockage or bank failure)
• Unknown
Data Processing 10.14 The following categories are assigned within the Environment Agency data received:
• OSF - Operational Structure Failure
• DK - Don't Know
• DR - Drainage
• OBE - Obstruction / blockage
• OCE - Overtopping Capacity Exceeded
• OTHER - Other
• GW – Groundwater
• SEWER – Sewer
• SEA - Coastal / Sea
• TIDAL - Tidal (Flooding on saline sections rivers)
10.15 Discussions with the Environment Agency (Jonathan Hunter, Sussex Area) confirmed that the category ‘OTHER’ had in the past been used to assign groundwater flooding, flooding from dam breakages, flooding from overland flow and from urban drainage. The later addition of a specific code for groundwater flooding and a tendency to use ‘OTHER’ as a catch all for overland flow has lead to confusion.
10.16 Therefore within the SFRA 'OTHER' data points have been assessed and re-categorised. Firstly where records coincided with areas in which groundwater flooding had been identified as likely these points were categorised as ‘Groundwater’. The remaining data points were sorted depending on whether they occurred in urban or rural areas. Where the data points
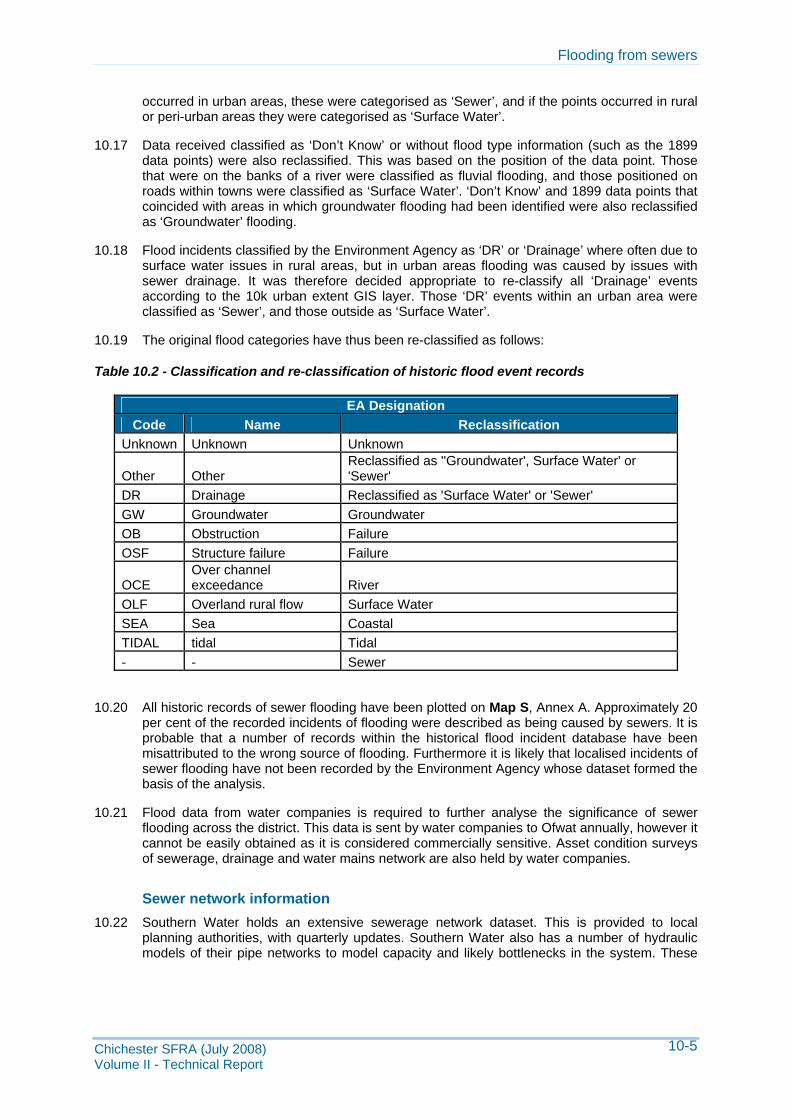
Flooding from sewers
Chichester SFRA (July 2008) Volume II - Technical Report
10-5
occurred in urban areas, these were categorised as ‘Sewer’, and if the points occurred in rural or peri-urban areas they were categorised as ‘Surface Water’.
10.17 Data received classified as ‘Don’t Know’ or without flood type information (such as the 1899 data points) were also reclassified. This was based on the position of the data point. Those that were on the banks of a river were classified as fluvial flooding, and those positioned on roads within towns were classified as ‘Surface Water’. ‘Don’t Know’ and 1899 data points that coincided with areas in which groundwater flooding had been identified were also reclassified as ‘Groundwater’ flooding.
10.18 Flood incidents classified by the Environment Agency as ‘DR’ or ‘Drainage’ where often due to surface water issues in rural areas, but in urban areas flooding was caused by issues with sewer drainage. It was therefore decided appropriate to re-classify all ‘Drainage’ events according to the 10k urban extent GIS layer. Those ‘DR’ events within an urban area were classified as ‘Sewer’, and those outside as ‘Surface Water’.
10.19 The original flood categories have thus been re-classified as follows:
Table 10.2 - Classification and re-classification of historic flood event records
EA Designation Code Name Reclassification
Unknown Unknown Unknown
Other Other Reclassified as ''Groundwater', Surface Water' or 'Sewer'
DR Drainage Reclassified as 'Surface Water' or 'Sewer' GW Groundwater Groundwater OB Obstruction Failure OSF Structure failure Failure
OCE Over channel exceedance River
OLF Overland rural flow Surface Water SEA Sea Coastal TIDAL tidal Tidal - - Sewer
10.20 All historic records of sewer flooding have been plotted on Map S, Annex A. Approximately 20 per cent of the recorded incidents of flooding were described as being caused by sewers. It is probable that a number of records within the historical flood incident database have been misattributed to the wrong source of flooding. Furthermore it is likely that localised incidents of sewer flooding have not been recorded by the Environment Agency whose dataset formed the basis of the analysis.
10.21 Flood data from water companies is required to further analyse the significance of sewer flooding across the district. This data is sent by water companies to Ofwat annually, however it cannot be easily obtained as it is considered commercially sensitive. Asset condition surveys of sewerage, drainage and water mains network are also held by water companies.
Sewer network information 10.22 Southern Water holds an extensive sewerage network dataset. This is provided to local
planning authorities, with quarterly updates. Southern Water also has a number of hydraulic models of their pipe networks to model capacity and likely bottlenecks in the system. These

Flooding from sewers
Chichester SFRA (July 2008) Volume II - Technical Report
10-6
models were not made available for use during the SFRA. In the future, it may be possible to obtain locations of places most at risk of sewer flooding during the 1% AEP flood event.
10.23 The current models produced by Southern Water are based only on the ‘minor system’ (i.e. the piped network) and additional work would have to be carried out to account for the ‘major system’ (i.e. the above ground flow network). This means that the modelling is limited in its ability to assess joint probability of multiple flooding sources and/or determine overland flow paths once sewers surcharge. There is software available to assess integrated drainage systems, however this is too detailed for the SFRA. Sites at risk of flooding from sewers combined with other sources should be assessed in a detailed flood risk assessment.
10.24 The lack of any significant gradient in the low-lying coastal areas means that sewer networks in these areas often rely on pumping stations to carry piped flows. Consequently failure of these pumping stations can lead to rapid sewer flooding. The assessment of surface water pumping systems is too detailed for the SFRA, however where relevant should be investigated further in detailed flood risk assessments.
Methods for assessing flooding from sewers
10.25 Currently Environment Agency Flood Zones only indicate areas liable to flood from rivers or the sea. Other data must therefore be used to determine the area at risk of flooding from other sources, such as sewers.
10.26 As the SFRA investigates flood risk over a large spatial area, it is not practical to undertake a detailed assessment of all sewer networks across the district. The three most appropriate methods for assessing the risk of flooding from sewers within the SFRA are:
• Review of historical data - qualitative review of areas at risk and/or GIS analysis to create a buffer zone around locations of known risk.
• Reference to existing studies carried out by water companies, the Environment Agency and private developers.
• Urban drainage modelling - model the urban drainage network and determine locations likely to flood. Historically urban drainage models have been unable to provide a representation of the integrated impact of different flood mechanisms (i.e. river flooding with sewer flooding), however software packages such as TUFLOW are now able to jointly model these sources.
10.27 The results of the assessment of sewer flood risk using historic records should be viewed with caution as the sewer network is constantly being maintained, upgraded and improved such that issues may be relatively short lived (<10 years). Additionally the records held by Southern Water are reported not to include records of flooding caused by extreme weather, such as occurred in 2000/2001.
10.28 The affects of sewer flooding are relatively local and datasets available relatively poor. For these reasons, it has not been assessed in detail at this stage of the SFRA. The assessment of sewer flooding has therefore focussed on the identification of areas more likely to be at risk, due to the presence of sewer pumping stations and recorded incidents of sewer flooding. If identified by the Environment Agency or the water company as a major risk, sewer flooding will need to be assessed in greater detail during individual site assessments.
Results
10.29 The majority of the sewer pumping stations are located in the southern half of the district, where the relatively flat land requires sewers are pumped. There is limited sewer infrastructure

Flooding from sewers
Chichester SFRA (July 2008) Volume II - Technical Report
10-7
outside existing towns and villages and therefore it is mainly the large towns, such as Chichester and Wittering and Selsey, which rely on pumped sewers that are at risk from sewer flooding.
Uncertainties in flood risk assessment
10.30 Assessing the risk of sewer flooding over a wide area is complicated by lack of data and project constraints.
10.31 An integrated modelling approach is required to fully assess and identify the potential for sewer flooding but these models are complex and require detailed information. Obtaining this information can be problematic as datasets held by stakeholders are often confidential, contain different levels of detail and may not be complete.
10.32 Existing sewer models are not generally capable of predicting flood routing (flood pathways and receptors) in the 'major system' (i.e. the above ground network of flow routes - streams, dry valleys, highways etc).
10.33 Use of historic data to estimate probability of sewer flooding is the most practical approach for an SFRA, however this does not take account of possible future changes due to climate or future development. Climate change will impact sewer flooding through the predicted increases in rainfall intensity. This will require new infrastructure to be designed with greater capacities and existing infrastructure may require upgrading to maintain the same level of service. The relevant climate change predictions contained with PPS25 are reproduced in Table 10.3 below:
Table 10.3 Recommended national precautionary sensitivity ranges for peak rainfall intensities
Parameter 1990 to 2025 2025 to 2055 2055 to 2085 2085 to 2115
Peak rainfall intensity +5 % +10 % +20 % +30 %
Source: Communities and Local Government (2006) 'Planning Policy Statement 25:Development and Flood Risk'
References
• Environment Agency (October 2006), Flooding from Other Sources (HA4a)

Assessing flooding from artificial sources
Chichester SFRA (July 2008) Volume II - Technical Report
11-1
11. Assessing flooding from artificial sources
The Chichester DC Strategic Flood Risk Assessment (SFRA) is a "live" document. The current version is developed using the best information and concepts available at the time. As new information and concepts become available the document will be updated and so it is the responsibility of the reader to be satisfied that they are using the most up-to-date information and that the SFRA accounts for this information. All revisions to this summary document are listed in the table.
Version Issue Date Issued by Issued to
Final 29/07/08 Capita Symonds
Ltd
CDC, EA

Assessing flooding from artificial sources
Chichester SFRA (July 2008) Volume II - Technical Report
11-2
Introduction
11.1 Flooding from high intensity or prolonged rainfall, exceedance or blockages of sewerage and drainage systems, groundwater flooding or tidal and coastal flooding are dealt with elsewhere in the SFRA. All other sources of flooding can be categorised as being from “artificial sources”.
11.2 For the SFRA flooding from artificial sources has been defined as that arising from failure of infrastructure such as canal embankments or reservoir embankments.
11.3 Typically flooding from artificial sources will be concurrent with heavy and prolonged rainfall. To understand flooding from artificial sources the whole hydrological and drainage system must be considered, along with the potential of interactions with fluvial and tidal flooding.
11.4 The spatial and temporal extent of flooding from artificial sources is highly variable. For example the likelihood of reservoir failure is very small compared to the likelihood of failure of an urban sewer network. However the consequences of a dam failure are potentially catastrophic in comparison to a local sewer blockage.
11.5 Increased urbanisation, ageing infrastructure and the impacts of climate change all result in the requirement for consideration of flooding from artificial sources within the development process.
Flooding from Canals
Mechanisms of flooding 11.6 Canals are man-made waterways, usually connected to (and sometimes connecting) existing
lakes, rivers, or seas. There are two main types of canals: irrigation canals for the delivery of water and transportation canals for passage of goods and people. Some canals are part of a waterway, which is not entirely artificial (usually where a river has been canalised to make it navigable).
11.7 Flooding may occur as a result of canal structure failure (i.e. erosion of canal structure) or overtopping due to intense precipitation or input from another system such as a river. There are three principal mechanisms associated with flooding from canals - breach, leakage and overtopping.
11.8 Leakage may occur through bed and bank linings or through structures designed to drain and manage water levels in the canal. This form of flooding is often of limited extent and low hazard, but may be prolonged in duration.
11.9 Breach is a catastrophic failure of a water retaining structure, normally leading to rapid loss of all impounded water unless emergency measures are taken. Breach is considered to be of low probability but high consequence and for this reason is identified as a significant flooding mechanism.
11.10 Overtopping of canal banks either into or from the canal may lead to property flooding or breach. A canal may act as a conduit for flooding to low lying areas away from the canal itself. Overtopping may lead to erosion and breach but in general is a low consequence event and so is often under reported.
11.11 The probability of a canal sourced flood occurring is related to either one or a combination of the following:
• The geometry of the canal, i.e. volume, banks level and free board.

Assessing flooding from artificial sources
Chichester SFRA (July 2008) Volume II - Technical Report
11-3
• Excessive inflow due to heavy precipitation increasing surface water run-off.
• Failure to close a flood lock between a river and canal to prevent floodwaters from the river entering the canal (the condition of assets may also impact upon this e.g. lock gates being vandalised preventing closing).
• A change in adjacent land use or surface water management may cause increased flow and overtopping.
• Drainage infrastructure carried beneath the canal may leak, causing erosion of the base liner of the canal.
• The age and construction type e.g. puddle clay liners may vary in thickness and may not be as competent as a modern concrete liner. Historically workmanship also varied from canal to canal.
• Mining may cause undermining of a canal structure.
• Groundwater flow beneath a canal liner may cause erosion and damage to the liner and groundwater may enter the system causing a seasonal variation in water levels.
• Breach of a canal structure either due to complete failure or partial failure due to voids.
• Overtopping due to intense rainfall events.
• Insufficient outflow due to blockage of by-weirs may cause increased water levels resulting in overtopping or breach of the overloaded canal structure.
11.12 A comprehensive list of the factors affecting canal flood risk is contained within Flooding from Other Sources HA4a (Appendix D: Flooding from Canals).
11.13 The inland waterway system in the U.K. was largely built between 1750 and 1800. The canals were built and maintained by private companies under acts of parliament.
11.14 The Transport Act 1962 established the British Waterways Board (BW) and divided canals into three categories; commercial, cruising and the remainder. BW completed a programme of safety related work on commercial and cruising waterways in March 2004. A number of remainder waterways have also been re-categorised and adopted by BW.
11.15 Inland waterways include artificial waterways, river navigations, tidal navigations and broads and lakes. Responsibilities for the inland waterways network are held by a large number of public and private authorities. The three largest authorities are British Waterways, the Environment Agency and the Broad Authority. The Association of Navigation Authorities (AINA) is a national body representing all navigation authorities.
Impacts of flooding 11.16 The volume of water available determines the impact a flood event will have. For a canal
structure this is calculated from pound length (distance from lock to lock) and average cross section. Complete failure of a canal side (depending on the water level being stored within the pound) is likely to have a greater impact than partial failure whereby a void is created and water issues at a constant rate.
11.17 The vulnerability of the adjacent land use is also an important factor. Traditionally canals were constructed to provide transport links to large urban areas. In 2002 the Union Canal in Edinburgh flooded causing more than 3 feet of water to flow down nearby roads after a period of erosion weakened the canal sides.

Assessing flooding from artificial sources
Chichester SFRA (July 2008) Volume II - Technical Report
11-4
11.18 Environmental damage may be a direct result of canal flooding whereby habitats or historic sites of interest are lost or damaged. Further economic loss may occur where flooding results in the closure of a canal that is an important tourist, or commercial enterprise.
Methods for assessing flooding from canals 11.19 HA4a proposes a four-stage assessment of the risk associated with flooding from canals. The
stages of assessment are:
• Data gathering and review – collation of data on the artificial waterway network, historic events including causes and mechanisms of flooding, consultation with operating authorities and asset management data.
• Assessment of Hazard – classification based on an assessment of the canal and characteristics of the surrounding area.
• Assessment of Consequences – estimation of flood extent and damages based on modelling assessments.
• Assessment of Overall risk – The overall risk would be derived from the product of Hazard and Consequences.
Data collection 11.20 Datasets associated with canal flooding include:
• Topographic surveys (e.g. LiDAR) that provide embankment height etc. and relative elevations such as surrounding ground levels.
• Structural dimensions (construction drawings may be available) e.g. pound length, depth and width.
• Construction details such as embankment material.
• Underlying geology.
• Asset inspection records and canal structure survey records.
• Canal breach hydrograph analysis undertaken by British Water ways.
• Historic flood events.
• Recordings of vandalism of locks.
11.21 Datasets may be held at varying levels of detail by British Waterways, local interest groups, Environment Agency, British Geological Survey Mapping, canal operators/owners, and Local Authorities.
11.22 British Waterways is understood to maintain a database of known breaches. British Waterways also has an established asset management system containing data on asset condition.
11.23 Flooding from Other Sources HA4a assessed the influence of various canal characteristics on the probability and consequences of canal flooding. British Waterways has extensive experience in asset management and risk assessment including the risk of overtopping and is delivering a programme to improve the understanding of canal breaches (HA4a).

Assessing flooding from artificial sources
Chichester SFRA (July 2008) Volume II - Technical Report
11-5
11.24 Assessments by BW have concluded that:
• The risk of flooding due to overtopping is small, as the volume of water lost is likely to be small.
• The risk of breach due to overtopping is small based on a review of historic events and canal embankment design methods.
11.25 Breach often occurs as a result of land use changes upstream of canal reaches.
11.26 There are no recorded incidents of breach or overtopping of canals within the study area and there is no evidence to suggest that the risk posed by canal flooding warrants detailed assessment.
11.27 The assessment of the risk of canal flooding has been limited to the identification of the presence or not of canals and artificial waterways. No existing canals have been identified in the study area.
Results 11.28 The Chichester Canal is the only potential source of artificial flooding identified within the
SFRA. The Canal Network in Chichester District is limited to the 6km stretch of the Chichester Canal.
11.29 The Chichester Canal runs from “the basin” or “inland dock” in the heart of Chichester to Salterns Lock by the Chichester Marina. The canal is navigable for canal boat trips between Chichester Basin and Crosbie Bridge, which covers a length of approximately 3.5km.
11.30 West Sussex County Council now owns the rights and ownership of the canal and leases it to the Chichester Canal Society. Currently the canal is only used for pleasure use by boats owned by the Chichester Ship Canal Trust.
11.31 West Sussex County Council are targeting for this to be achieved by 2010. It will involve the building of two road bridges, possibly re-routing the canal to facilitate this, building one lock and the refurbishment of another. Maintenance of the canal is an ongoing project and includes dredging, verge management and keeping the towpath clear.
11.32 The canal is only minimally embanked (or perch) along short stretches. The only location identified during the SFRA where a breach could impact low lying properties is in the vicinity of the village of Hunston.
11.33 Hydraulic modelling of a possible breach scenario in the Chichester Canal at Hunston has been undertaken to determine the extent and hazard of a possible breach. The results of this modelling are shown in Map B in Annex A.
Uncertainties in flood risk assessment 11.34 Often damage to the canal structure is below the water depth and is not visible unless a full
structural survey is undertaken. Such surveys may not detect erosion of sub basal liners due to groundwater or leaking water mains.
11.35 It is difficult to allow for and predict the actions of third parties e.g. construction works alongside a canal that may cause damage the integrity of the canal structure and damage by canal users.
11.36 Data sets relating to canal construction may be incomplete especially for the older systems or at an inappropriate level of detail.

Assessing flooding from artificial sources
Chichester SFRA (July 2008) Volume II - Technical Report
11-6
11.37 Historic flood event data may not be relevant. If the historic event was due to structure failure and the damage has been competently repaired this data is not relevant to the prediction of flooding from other mechanisms e.g. overtopping due to excessive surface water inflow. Historic flood data does not take account of climate change.
11.38 Asset management is more likely to be undertaken along canal ways that provide a tangible economic benefit, whereas disused canal ways are unlikely to have this dataset.
11.39 British Waterways have undertaken research to understand a typical breach hydrograph and there is European research on breaching of canal embankments.
11.40 British Waterways do not provide flood or water level warnings on their website but do advise that the Environment Agency website is consulted, however they do manage the closure of lengths of canal when flash floods have either caused damage or have altered water levels.
Flooding from reservoirs
Mechanisms of flooding 11.41 Reservoirs are artificial lakes, used to store water for various uses. They can be either
modified natural structures or man-made. An "attenuation" or “impoundment” reservoir is used to prevent flooding to lower lying lands or regulate flows for abstraction and irrigation purposes downstream. Control reservoirs collect water at times of excess (or unseasonably high rainfall), then release it slowly on demand or over the course of the following weeks or months.
11.42 Managed or un-managed reservoir release may increase floodwater depths and velocities in adjacent areas. Reservoir flooding may occur as a result of failure of a reservoir’s civil structure or due to the system being overwhelmed.
11.43 Reservoir flooding can be caused by breach or failure of the reservoir or dam structure or by malfunction of the water level control system.
Impacts of flooding 11.44 Design standards at impounding reservoirs are necessarily high. While there have been no
major flood-related incidents at UK reservoirs since July 1968 the consequences of such an event can be catastrophic.
11.45 A breach within a dam or flooding impounding reservoir would result in significant flooding depths and velocities downstream in the watercourse or valley across which the dam is built. For non-impounding reservoirs and service reservoirs it is likely to be more complex, and may be influenced by the geometry of buildings and transport infrastructure as well as topography.
11.46 The vulnerability of the location in which the reservoir is located is significant in determining the impact that flooding will have. Reservoirs are generally at a high elevation and located in areas of low population density. If the reservoir has been designed to attenuate flood waters within a downstream urbanised catchment area then failure can have a catastrophic impact, especially if it occurs during a flood event which is a combination of sources.
11.47 If a reservoir is located adjacent to another reservoir failure of one dam retaining a reservoir may result in the failure of the dam retaining the other (cascade/domino effect).
11.48 Environmental damage may be a result of reservoir flooding whereby habitats or historic sites of interest are lost or damaged.

Assessing flooding from artificial sources
Chichester SFRA (July 2008) Volume II - Technical Report
11-7
11.49 Further economic loss may occur where flooding results in the closure of a reservoir that is an important tourist, or commercial enterprise.
Data collection 11.50 The Environment Agency now enforces the Reservoirs Act 1975, making them responsible as
the Enforcement Authority of some 2000 reservoirs in England and Wales. The Reservoir Act makes owners (undertakers) responsible for the safety of their reservoirs and they are obliged to ensure assessments are undertaken by appropriately qualified engineers on a routine basis.
11.51 As Enforcement Authority the Environment Agency have the following key roles:
• Surveillance - maintaining a register of reservoirs for England and Wales.
• Enforcement - achieving compliance.
• Reporting incidents and ensuring flood plans are produced for specified reservoirs (The Water Act 2003 requires that undertakers produce flood maps by Autumn 2007)
11.52 For reservoirs below the threshold of 25,000 cubic metres regulation is managed by the Health and Safety Executive and they carry out inspections in accordance with the Health and Safety at Work Act. The Reservoir Safety Unit at the Environment Agency has collated data on small reservoir failure as they consider this to be a significant flood risk.
11.53 The Environment Agency is currently compiling a register of reservoirs and undertakers. Risk maps are being produced by undertakers for high consequence dams and these are due to be completed in 2007.
11.54 The Water Act 2003 requires that Flood Plans be produced for specified reservoirs. In the event that a reservoir could cause a flood after an uncontrolled release of water, it is important that arrangements are in place so that Emergency Services and Local Authorities can provide effective assistance.
11.55 Defra has commissioned a report on “Engineering Guide to Emergency Planning for UK Reservoirs” which went out to informal consultation in June 2006 and outlines how a flood plan should be undertaken.
11.56 For reservoirs below the threshold of 25,000 cubic metres the Reservoir Safety Unit at the Environment Agency has collated information on dam failure and reports that there have been several to date. The most recent of which was Cow Creek Dam failure in Gloucester 2006 due to internal erosion of the dam structure.
11.57 General datasets associated with all reservoir types include topography, i.e. LiDAR/SAR, dam height, volume stored, geotechnical reports on reservoir structure and hydrological assessments.
Methods for assessing flooding from reservoirs 11.58 Statutory reservoir flood plans are to be prepared by reservoir undertakers from 2007
onwards, which will assist in identifying the potential extent of flooding.
11.59 Reference should be made to these and the SFRA updated as they become available.
11.60 The assessment of the risk of flooding from reservoirs has been limited to the identification of the presence or not of significant reservoirs in the study area. No existing reservoirs have been identified.

Assessing flooding from artificial sources
Chichester SFRA (July 2008) Volume II - Technical Report
11-8
Results 11.61 Communications with the Environment Agency’s national Reservoir Safety Team have
revealed that there is only a single ‘large raised reservoir’ in the District. River Farm Reservoir, near Petworth, has a design capacity of 44680m3 and maximum dam height of 5m. The reservoir was built in 2005. The exact location of the reservoir could not be identified from the information provided by the Environment Agency.
Uncertainties in flood risk assessment 11.62 Generally the area of damage that leads to the flooding event is likely to be below the water
level of the reservoir. Without regular thorough inspection it is unlikely that damage such as erosion will be observed and rectified.
11.63 Geotechnical assessment of embankments is required to assess the likelihood of flooding and associated risk. This then needs to be combined with hydrological data and the risk assessment and modelling process becomes complicated.
11.64 It is difficult to allow for and predict the actions of third parties e.g. construction works alongside a reservoir that may cause damage to the integrity of the impounding structure.
11.65 Datasets relating to reservoir construction may be incomplete especially for the older systems or at an inappropriate level of detail.
11.66 Historic flood event data may not be relevant. If the historic event was due to structure failure and the damage has been competently repaired this data is not relevant to the prediction of flooding from other mechanisms e.g. overtopping due to excessive surface water inflow. Historic flood data does not take account of climate change.
11.67 Asset management is more likely to be undertaken on reservoirs that have a capacity in excess of 25,000 cubic metres or where they form part of a commercial activity. It is anticipated that such studies will be undertaken in more detail and for all impounding structures by reservoir operators in the course of producing statutory flood reservoir plans.
Reservoir management and control 11.68 The reservoirs Act 1975 provides the legal framework to ensure the safety of UK reservoirs
that hold at least 25,000 cubic metres of water above natural ground level.
11.69 Following the Water Act 2003, the Environment Agency is now responsible for the enforcement of the Reservoirs Act 1975 in England and Wales.
11.70 The Water Act requires that undertakers produce flood maps by Autumn 2007 for these reservoirs.
11.71 Under the Reservoirs Act 1975 reservoir owners (undertakers) have ultimate responsibility for the safety of their reservoirs, ensuring frequent inspections are undertaken by appropriately qualified engineers.
11.72 As the Enforcement Authority, the Environment Agency is responsible for:
• Maintaining a register of reservoirs and making this information available to the public.
• Ensuring the undertaker meets his obligations under the Reservoirs Act 1975.
• Commissioning essential works in the interest of safety, where necessary.
• Biannually reporting to Defra.

Assessing flooding from artificial sources
Chichester SFRA (July 2008) Volume II - Technical Report
11-9
• Acting in an emergency if the undertaker cannot be found.
11.73 Flood risk from dams with a capacity below 25,000 cubic metres is less well regulated. Where there is a workplace at risk from flooding, the Health and Safety Executive (HSE) is responsible under the Health and Safety at Work Act.
11.74 Where people are at risk the Local Authority has a duty under the 1984 Building Regulations to serve notice on owners if the structure is deemed unsafe.
11.75 The HSE undertakes inspections of many small reservoirs in accordance with the Health and Safety (Enforcing Authority) Regulations 1998.
11.76 Mine lagoons are not under the remit of the Reservoirs Act as they are dealt with by the by the HSE under the Mines and Quarries (Tips) Act.
11.77 Lagoons associated with quarries are covered by the Quarries Regulations 1999 and assessed as to whether they pose a geotechnical hazard. Lagoons containing 10,000 cubic metres with an embankment greater then 4m and within 50m of an excavation are considered as presenting a significant hazard.

Glossary and notation
Chichester SFRA (July 2008) Volume II - Technical Report
G-1
Glossary and notation
The Chichester DC Strategic Flood Risk Assessment (SFRA) is a "live" document. The current version is developed using the best information and concepts available at the time. As new information and concepts become available the document will be updated and so it is the responsibility of the reader to be satisfied that they are using the most up-to-date information and that the SFRA accounts for this information. All revisions to this summary document are listed in the table.
Version Issue Date Issued by Issued to
Final 29/07/08 Capita Symonds
Ltd
CDC, EA

Glossary and notation
Chichester SFRA (July 2008) Volume II - Technical Report
G-2
ABD Area Benefiting from Defences
Actual risk The risk that has been estimated based on a qualitative assessment of the performance
capability of the existing flood defences
AEP Annual probability of exceedence. The annual chance of experiencing a flood with the
corresponding flood magnitude, i.e. a 1% AEP flood is a flood with a flow magnitude
that has a 1% chance of occurring in each and every year
Breach or failure hazard
Hazards attributed to flooding caused by a breach or failure of flood defences or other
infrastructure which is acting as a flood defence.
CDC Chichester District Council
CFMP Catchment flood management plan
DCLG Department for Communities and Local Government.
EA Environment Agency
Flood defence Natural or man-made infrastructure used to prevent flooding
Flood risk Flood risk is a combination of two components: the chance (or probability) of a particular flood event and the impact (or consequence) that the event would cause if it occurred (EA 2003).
FRA Flood risk assessment
Flood risk management
Flood risk management can reduce the probability of occurrence through the management of land, river systems and flood defences, and reduce the impact through influencing development in flood risk areas, flood warning and emergency response (EA 2003).
Flood zones This refers to the Flood Zones in accordance with Table 1 of PPG25. For the purpose of the SFRA, the definition of flood zones varies slightly from PPG25 in that it shows the extent of flooding ignoring the presence of flooding defences, "except where the 'actual risk' extent is greater"
LDD Local development documents
LDF Local development framework
m metres (measure of distance)
m/s metres per second (measure of velocity)
NGR National grid reference

Glossary and notation
Chichester SFRA (July 2008) Volume II - Technical Report
G-3
ODPM Office of the Deputy Prime Minister (ODPM). Former government body responsible for
PPG25 and PPS25. DCLG is now the responsible Government body.
OS Ordnance survey
PPG25 Policy Planning Guidance Note 25: Development and Flood Risk - Guidance explaining
how flood risk should be considered at all stages of the planning and development
process in order to reduce future damage to property and loss of life.
PPS25 Planning Policy Statement Note 25: Development and Flood Risk. Currently at
consultation draft status (October 2005).
Precautionary principle
‘’Where there are threats of serious or irreversible damage, lack of full scientific
certainty shall not be used as a reason for postponing cost effective measures to
prevent environmental degradation’’. The precautionary principle was stated in the Rio
Declaration in 1992. Its application in dealing with the hazard of flooding acknowledges
the uncertainty inherent in flood estimation.
RBMP River basin management plan.
Residual risk Flood risks resulting from an event more severe than for which particular flood defences have been designed to provide protection.
RFRA Regional flood risk assessment
RSS Regional spatial strategy
Sequential risk-based assessment
Priority in allocating or permitting sites for development, in descending order to the flood zones set out in Table 1 of PPG25, including the sub divisions in Zone 3. Those responsible for land development plans or deciding applications for development would be expected to demonstrate that there are no reasonable options available in a lower- risk category (PPG25 paragraph 30).
SFRA Strategic flood risk assessment
SFRM Strategic Flood Risk Management. Current Environment Agency framework for commissioning flood mapping products (2003 - 2008).
SMP Shoreline management plan
SREP Strategic risk evaluation procedure
S105 National Section 105 Framework Agreement (NATCON 257) (1998 to 2003). Previous
Environment Agency framework for commissioning flood mapping products under
Section 105 of the Water Resources Act (1991).
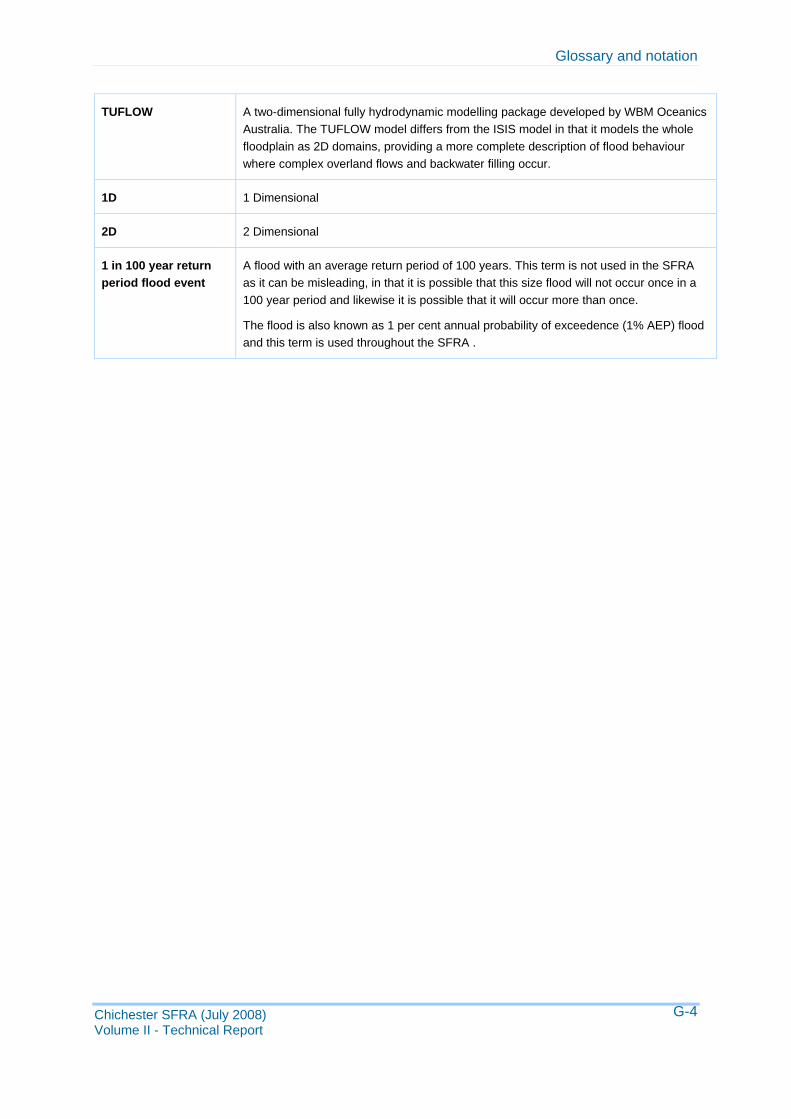
Glossary and notation
Chichester SFRA (July 2008) Volume II - Technical Report
G-4
TUFLOW A two-dimensional fully hydrodynamic modelling package developed by WBM Oceanics Australia. The TUFLOW model differs from the ISIS model in that it models the whole floodplain as 2D domains, providing a more complete description of flood behaviour where complex overland flows and backwater filling occur.
1D 1 Dimensional
2D 2 Dimensional
1 in 100 year return period flood event
A flood with an average return period of 100 years. This term is not used in the SFRA as it can be misleading, in that it is possible that this size flood will not occur once in a 100 year period and likewise it is possible that it will occur more than once.
The flood is also known as 1 per cent annual probability of exceedence (1% AEP) flood and this term is used throughout the SFRA .