Embed Size (px)
Citation preview
INSTITUTE FOR
WATER RESOURCES
DEPARTM CORP
HE ARMY NEERS
Volume II of III
FOREIGN DEEP WATER PORT DEVELOPMENTS
A Selective Overview of Economics, Engineering, and Environmental Factors
APPENDIX-A FRANCE, DUNKIRK AND LE HAVRE APPENDIX-B BELGIUM, ANTWERP APPENDIX-C THE NETHERLANDS, ROTTERDAM AND AMSTERDAM
DECEMBER, 1971 IWR REPORT 71-11
INSTITUTE FOR WATER RESOURCES
The Institute for Water Resources is the focal point of efforts to improve U. S. Army Corps of Engineers' planning for the development and management of the nation's water and related land resources, particularly as national objectives are affected by changing public values. Through in-house and contract stud-ies, the Institute identifies emerging planning issues and re-quirements; evaluates planning efficiency and effectiveness; develops applications to Corps' planning of analytical and pro-jectional techniques and planning management systems; and formulates the bases for improved Corps' planning policies and procedures. In concert with the Office, Chief of Engineers, it advises and assists Corps' agencies in utilizing such tech-niques and carrying out suchprocedures. Finally, it evaluates and recommends improvements in the professional develop-ment program for Corps' planners; develops training programs; and conducts training.
The Institute welcomes your comments and suggestions on its program and publications.
K. B. COCVER Brigadier General, USA Director
\11111111•111111•111111101
0
!_
IWR REPORT 71-11 FOREIGN DEEP WATER PORT DEVELOPMENTS VOLUME II OF III
TWI$M.
Volume II of III
FOREIGN DEEP WATER PORT DEVELOPMENTS
A Selective Overview of Economics, Engineering, and Environmental Factors
APPENDIX-A FRANCE, DUNKIRK AND LE HAVRE APPENDIX-B BELGIUM, ANTWERP
APPENDIX-C THE NETHERLANDS, ROTTERDAM AND AMSTERDAM
DECEMBER, 1971 IWR REPORT 71-11
APPENDIX A
FRANCE DUNKIRK AND LE HAVRE
APPENDIX A
Page
A.1 DUNKIRK
A.1.1 Summary A-1
A.1.2 General Area Description A-3
A.1.3 Institutions and Financing A-8
A.1.4 Economic Aspects A-11
A.1.5 Engineering A-34
A.1.6 Environmental Appraisal A-,43
A.2 LE HAVRE
A.2.1 Summary A-53
A.2.2 General Area Description A-53
a. Geography A-53
b. Geology A-54
c. Tides and Currents A-55
d. Climate A-55
A.2.3 Demography A-55
A.2.4 Management and Financing A-36
A.2.5 Area Description A-57
a. Commodity Flows A-57
b. Petroleum Products and Pipelines A-57
c. Containers A-62
d. Industrialization A-63
e. Regional Development A-64
f. Port of Rouen A-72
1. Physical History & Commodities
2. Industrialization
3. Competition
A.2.6 Environmental Impact A-75
a. Water Pollution A-75
b. Air Pollution A-78
c. Solid Waste A-79
d. Visual Intrusion A-80
e. Noise Intrusion A-80
f. Fire Safety and Other Security Problems A-81
g. Future Issues A-81
A.2.7 Engineering Considerations A-83
a. General A-83
b. Rouen Channel and River A-85
c. Le Havre A-88
d. Lessons and Problems A-88
e. Le Havre-Antifer Oil Terminal A-89
f. Design Vessel A-89
g. Technical Alternatives A-90
ii
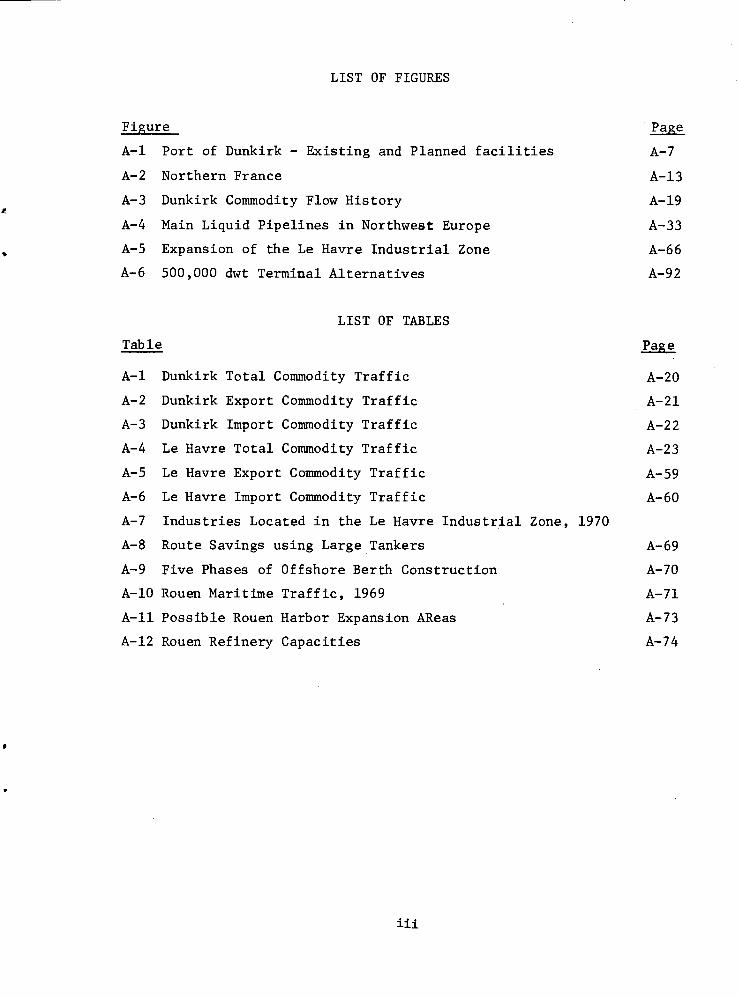
LIST OF FIGURES
Figure Page
A-1 Port of Dunkirk - Existing and Planned facilities A-7
A-2 Northern France A-13
A-3 Dunkirk Commodity Flow History A-19
A-4 Main Liquid Pipelines in Northwest Europe A-33
A-5 Expansion of the Le Havre Industrial Zone A-66
A-6 500,000 dwt Terminal Alternatives A-92
LIST OF TABLES
Table Page
A-1 Dunkirk Total Commodity Traffic A-20
A-2 Dunkirk Export Commodity Traffic A-21
A-3 Dunkirk Import Commodity Traffic A-22
A-4 Le Havre Total Commodity Traffic A-23
A-5 Le Havre Export Commodity Traffic A-59
A-6 Le Havre Import Commodity Traffic A-60
A-7 Industries Located in the Le Havre Industrial Zone, 1970
A-8 Route Savings using Large Tankers A-69
A-9 Five Phases of Offshore Berth Construction A-70
A-10 Rouen Maritime Traffic, 1969 A-71
A-11 Possible Rouen Harbor Expansion AReas A-73
A-12 Rouen Refinery Capacities A-74
iii
A.1 DUNKIRK
A.1.1 SUMMARY
Dunkirk is dwarfed by its neighbor ports, Rotterdam (world's largest),
Antwerp (world's second) and Le Havre (France's second), but it is the
closest French port to the Golden Delta and the continental interior and
it is the most western of the ports directly connected to that area.
A military port, recently developed as an iron ore terminal (125,000 dwt)
and steel mill, it bases immediate growth on a bauxite terminal (300,000
dwt) and future growth on an offshore island for 500,000 to 1,000,000 dwt
crude oil transshipment to northwest Europe.
The Dunkirk port development project is more politically based than either
of the other two major French port projects (i.e., Le Havre and Marseilles/
Fos). The northern region of France has been heavily oriented towards
the coal mining and textile industries. In the last two decades, these
industries have experienced a significant decline, with resulting un-
employment and social problems. The port development project at Dunkirk
is a government attempt to reverse the northern industrial decay and
initiate an economic resurgence, the idea being to concentrate a heavy
industrial zone in Dunkirk to use the excess labor that is becoming in-
creasingly available in the northern region.
In addition, the port planners in Paris view the Dunkirk development as
opening up a new supply route for the heavy industrial areas of Germany. It
also offers an alternative to Le Havre in the competition with Flemish
and Dutch ports for the European continent including northeast France.
Thus, major objectives of the Dunkirk development are to siphon off com-
modity flows of northern France and possibly Belgium and Germany, which are
presently being exported and imported via Antwerp. While the initial
economic rationale upon which the port development is based relates
primarily to dry bulk imports (iron ore, bauxite), oil is ultimately ex-
pected to be the principal product handled. It is planned that, in the
future, oil will be pipelined from Dunkirk through Belgium into the Ruhr,
to provide Germany with an additional supply route.
In summary, the primary factors which supported Dunkirk's candidacy for a
deep water port were:
• Dunkirk already has an established, well-maintained port, presently
capable of handling vessels up to 125,000 dwt;
• with moderate financial expenditure, the port is capable of receiving
750,000 dwt vessels;
• It is a good European location for supertankers;
• the port could serve the very large industrial European interior,
including the north of France, south Benelux, the Ruhr, and southeast
England (through the future channel tunnel at Calais between France & England)
• over the long term, considerable water frontage may be needed for
anticipated industry, and a 25-mile strip is available (equivalent
in size to Rotterdam's present port) with the cost of land at 1/3
to 1/4 that of the northern lands ports;
• the beach between Dunkirk and Calais is essentially flat and sandy,
and is described, because of the climate as being relatively "uninteresting"
from a recreational standpoint (however Dunkirk maintains that they
have more days of sunshine than Paris);
• the area is said to lend itself well to heavy construction; and
• the region is economically depressed and requires government assistance.
The cost to purchase the 200,000,000 square feet which comprise the present
surface of the industrial zone was $54 million, ($0.27/sq. ft. or 1/4 of
Amsterdam's new land). The port will own a 300-meter band which will run
along the harbor basin. Through lease arrangements industrial users will have
access to this land for finished product storage and materials handling
concerning exports and imports.
Plans for expansion of the port of
docks westward from existing installations. The new harbor between
Dunkirk and Graveline - will be at sea level, without locks, extending
up to six miles inland to provide extensive dockside facilities for vessels
up to 300,000 dwt, as well as sufficient frontage for industries depen-
dent upon water transportation. Planners expect that the new dock length
will also affect, from a, Practical standpoint, the landward extension of
heavy industry leaving the rest of the inland region to light industry,
residential areas, and agriculture. It is also planned to connect the
new harbor with the old by a large basin and lock.
Dunkirk include the excavation of new
A-2
A second stage of expansion, details and timing which have not been
finalized, would involve constructing either a new port near CFI:Leis
(similar to the one now planned between Graveline and Dunkirk) or an
offshore island about eight miles from Dunkirk. Either of these alterna-
tives would be capable of handling vessels of at least 500,000 to 750,000
dwt. Because no one knows yet which of the two alternatives will be sel-
ected, the area between Graveline and Calais will be retained as a po-
tential industrial site until the decision is made.
A computer model has been built and is being used both for long- range
planning (Dunkirk vs. competing ports to serve the German oil refineries)
and short-range equipment acquisition and use (ship scheduling, cargo-
handling and maintenance).
The lock and basin construction methods appear quite advanced in Dunkirk.
Although lock construction is not needed in a U.S. port (other than pos-
sibly in Maine)certain approaches to heavy construction might be utilized
to advantage in the U.S. Some salt water intrusion has occurred from
channel deepening, and remedial methods are under consideration to control
this condition. Hydraulic modeling should decide the port configuration
rather than designing the port and later using modeling to ascertain the
design effects as was done in Dunkirk and in many other cases.
Communications and infrastructure in the Dunkirk region need urgent
improvement.
Throughout our discussions with port representatives, it was continually
apparent that economic development had by far the highest priority, and
that environmental considerations in terms of such factors as short and
long range land use plans, water quality, air pollution abatement, solid
waste disposal, and recreational and conservation activities ranked far
below. As far as we could determine, there is little official concern
for either solids pollution, noise abatement or visual pollution.
A.1.2 General Area Description
a. Geography
Dunkirk is located on the extreme northern French coast, about 16 km
(10 miles) from the Belgian border. Its nearest coastal neighbor
A-3
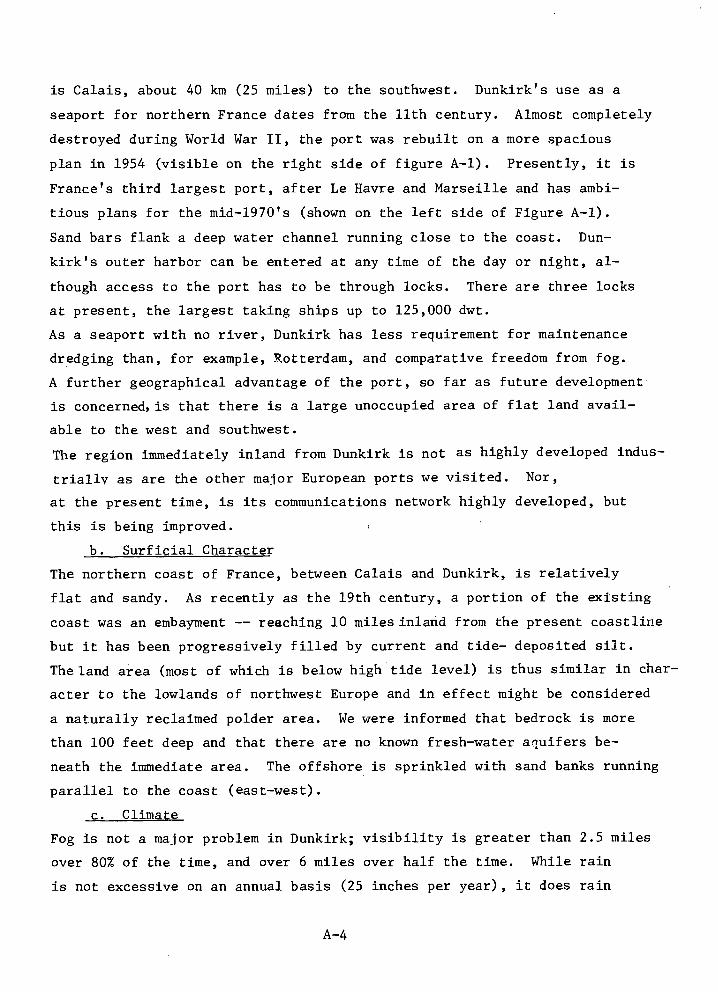
is Calais, about 40 km (25 miles) to the southwest. Dunkirk's use as a
seaport for northern France dates from the 11th century. Almost completely
destroyed during World War II, the port was rebuilt on a more spacious
plan in 1954 (visible on the right side of figure A-1). Presently, it is
France's third largest port, after Le Havre and Marseille and has ambi-
tious plans for the mid-1970's (shown on the left side of Figure A-1).
Sand bars flank a deep water channel running close to the coast. Dun-
kirk's outer harbor can be entered at any time of the day or night, al-
though access to the port has to be through locks. There are three locks
at present, the largest taking ships up to 125,000 dwt.
As a seaport with no river, Dunkirk has less requirement for maintenance
dredging than, for example, Rotterdam, and comparative freedom from fog.
A further geographical advantage of the port, so far as future development
is concerned, is that there is a large unoccupied area of flat land avail-
able to the west and southwest.
The region immediately inland from Dunkirk is not as highly developed indus-
trially as are the other major European ports we visited. Nor,
at the present time, is its communications network highly developed, but
this is being improved.
b. Surf icial Character
The northern coast of France, between Calais and Dunkirk, is relatively
flat and sandy. As recently as the 19th century, a portion of the existing
coast was an embayment -- reaching 10 miles inland from the present coastline
but it has been progressively filled by current and tide- deposited silt.
The land area (most of which is below high tide level) is thus similar in char-
acter to the lowlands of northwest Europe and in effect might be considered
a naturally reclaimed polder area. We were informed that bedrock is more
than 100 feet deep and that there are no known fresh-water aquifers be-
neath the immediate area. The offshore is sprinkled with sand banks running
parallel to the coast (east-west).
c. Climate
Fog is not a major problem in Dunkirk; visibility is greater than 2.5 miles
over 80% of the time, and over 6 miles over half the time. While rain
is not excessive on an annual basis (25 inches per year), it does rain
A-4
about half the time. Temperatures are moderate, ranging between 40 and
65 °F, with maximums of 9 ° F and 86 ° F. The air is seldom quiet in Dunkirk:
southwest winds between 5 and 33 MPH occur 87% of the time. Because of
these climate factors, plus the relatively featureless coastline, the
Dunkirk/Calais coastal area is not considered prime recreational land.
The local population is traditionally not inclined to reserve acreage
for trees and recreation parks.
d. Hydraulics
The variations between high and low water at Dunkirk are 17.4 feet (spring)
and 11.4 feet (neap). High-tide currents between 1 and 2 knots run west,
while low-tide currents run about 1 knot in an easterly direction. Northern
storms (winter) may bring substantial swells in the outer harbor.
e. General Land Use
Inland from the Dunkirk-Calais coast, the land is used primarily for agri-
cultural purposes, although in some cases it is poorly drained. Because
of the small degree of recreational, tourist, or residential use of the
beach zone westward of Dunkirk -- except around the two communities of
Gravelines and Fort Philippe -- the entire coastline between Calais and
Dunkirk will be industrially zoned up to an inland "depth" of six miles,
approximately twice as far as it was originally planned and completely
enclosing Loon Plage, as the current zone has enclosed Mardyck township.
The present industrial zone extends approximately 14 miles to the west of
Dunkirk. Continuing west, another 14-mile strip is available for
future industry use.
One of the primary problems has been securing adequate resources to pur-
chase the required land and reserves necessary for the port and industrial
zone. For example, if the entire Dunkirk project could be started afresh,
the area on which a major steel plant was constructed by Usinor would be
re-zoned. This steel plant facility is too far from western deep waters,
near the present Dunkirk port and cities, and consumes far too much coastal
land as it is presently laid out. The Usinor plant was located at this
site over ten years ago, well before any type of national planning regarding
port development. The present land which is used by the plant could be more
economically used for commercial purposes, with the mill located close to the
A-5
site projected for the alumina plant further west. But ten years ago,
financial resources were limited for land purchase and few people were
thinking of long-range planning.
Dunkirk remains a small community even after its recent merging with its
eastern neighl.or (Malo-Les-Bains) and now has 43,000 inhabitants. It
is constricted between the sea and a dozen, independent-minded commun-
ities with up to 30,000 inhabitants each. Fortunately, a voluntary grouping
occurred (with some government pressure and a lot of public relations work)
between the 16 municipalities in the Dunkirk/Calais region. Commercial
activities are concentrated essentially around the present community of
Dunkirk-Malo as well as in surrounding towns, including Petite Synthe,
Grande Synthe, Fort Mardyck, St. Pol-sur-Mer, and Coudekerque.
Despite this grouping there appears to have been relatively little urban
planning done by the municipalities in the Dunkerque-Gravelines area.
We were informed during our interviews that various leisure time activities
such as entertainment, sports, and recreational facilities were viewed
as relatively unimportant by the community leaders in the past.
The area is quite underdeveloped regarding such leisure activities and
this situation could possibly retard the industrial development of the
Dunkirk region. Housing requirements have increased rapidly over the
past ten years, resulting in tract-type developments (primarily low-
income apartments and extensive trailer camps), which are often located
in virtually direct contact with large industrial facilities, without visual
or other means of separation, and without adequate sewage or septic
facilities.
f. Population
The present population of the Greater Dunkirk area, including the cities
named above, is approximately 140,000. This population is expected to
double over the next 15 years, thereby requiring a major effort to provide
the necessary housing, related infrastructure, and higher-education
institutions.
g. Port
Maximum draft capability within the present harbor is 48 feet, sufficient
A-6
4 fr
< V 19
A 4
A V
" .
DUNKIRK • 4
SP•SD 9P'9' /
300,000 dw TERMINAL
7.9 4 W f<\C)
4 4 4 .4 4 1 'C , p•
V •4 1•' St POL SUR MER
COUDEKERQUE
\sy -
125,000 dwt CHANNEL
PROJECTED BASINS EXISTING BASINS --ow POWER PLANT
ACDB SHIPYARD
C4-C ‚,15,'
% 044
PECHINEY ALUMINA
Pt FORT PHILIPPE
LES HUTTES
GRAVELINES
EXISTING DOCKS AVAILABLE I
FUTURE INDUSTRIAL
OCCUPIED INDUSTRIAL A
EXISTING RAILROADS
FUTURE RAILROADS
EXISTING ROADWAYS
FUTURE ROADWAYS
Gd FORT PHILIPPE
07 0'9 Co 0
O\ •7.,0
2-Fy
L AREAS
X
• .900
URBAN AREAS
itl ■- 1 33 ft
0
FUTURE DOCKS • Nr1r-I
•
0 . 400 800 1200 2000 m
Scale
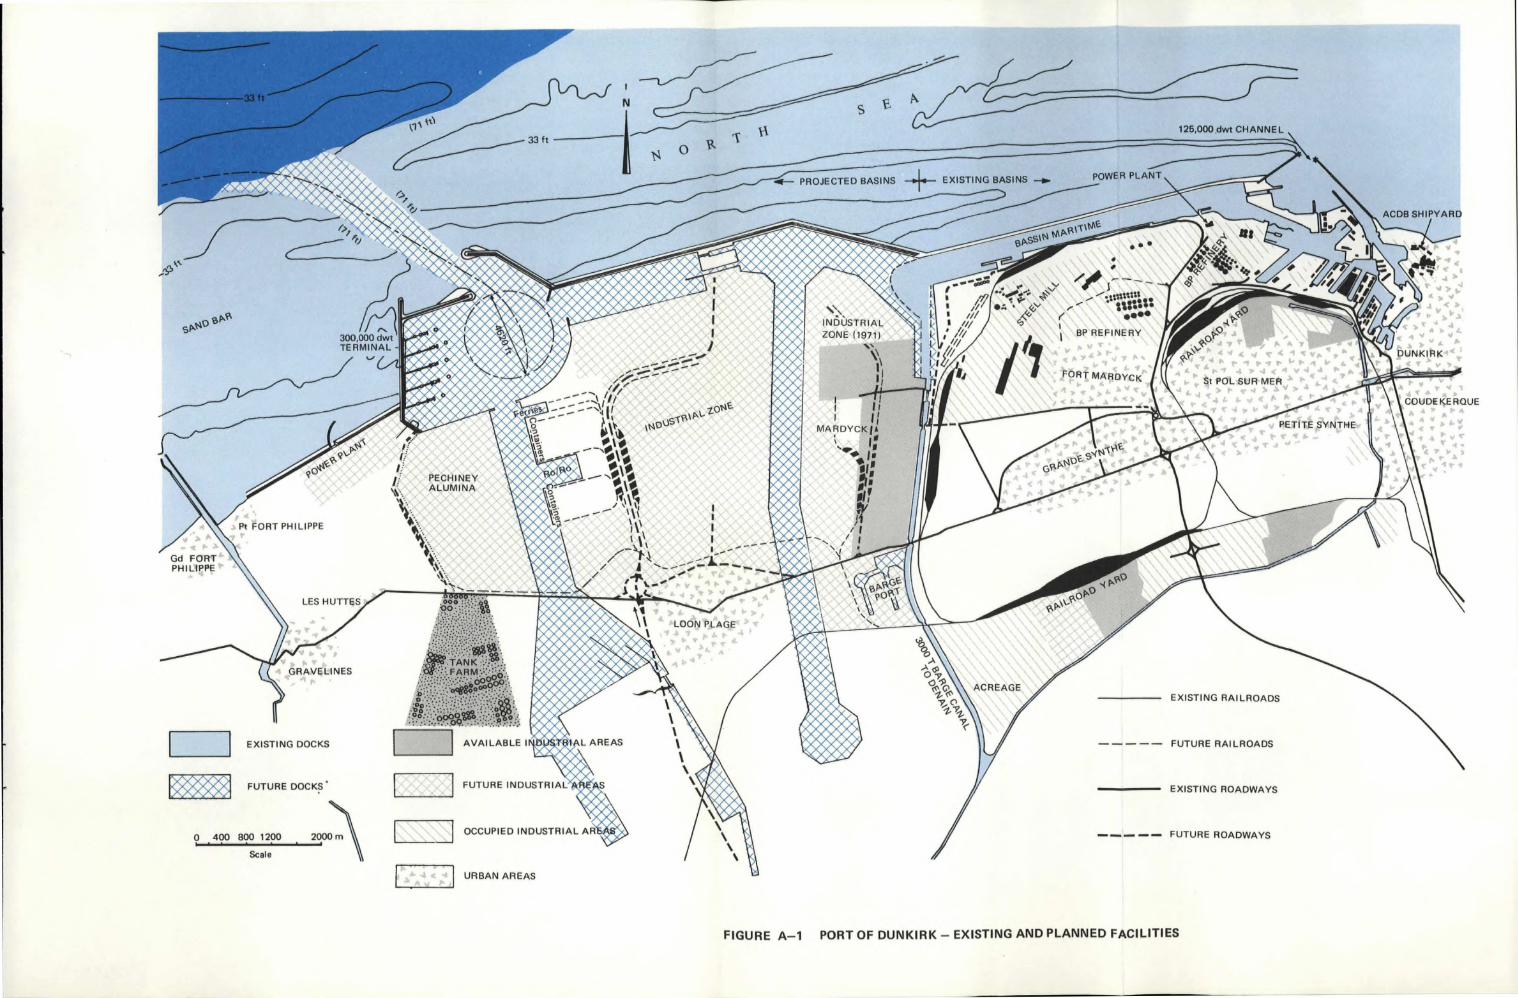
FIGURE A-1 PORT OF DUNKIRK - EXISTING AND PLANNED FACILITIES
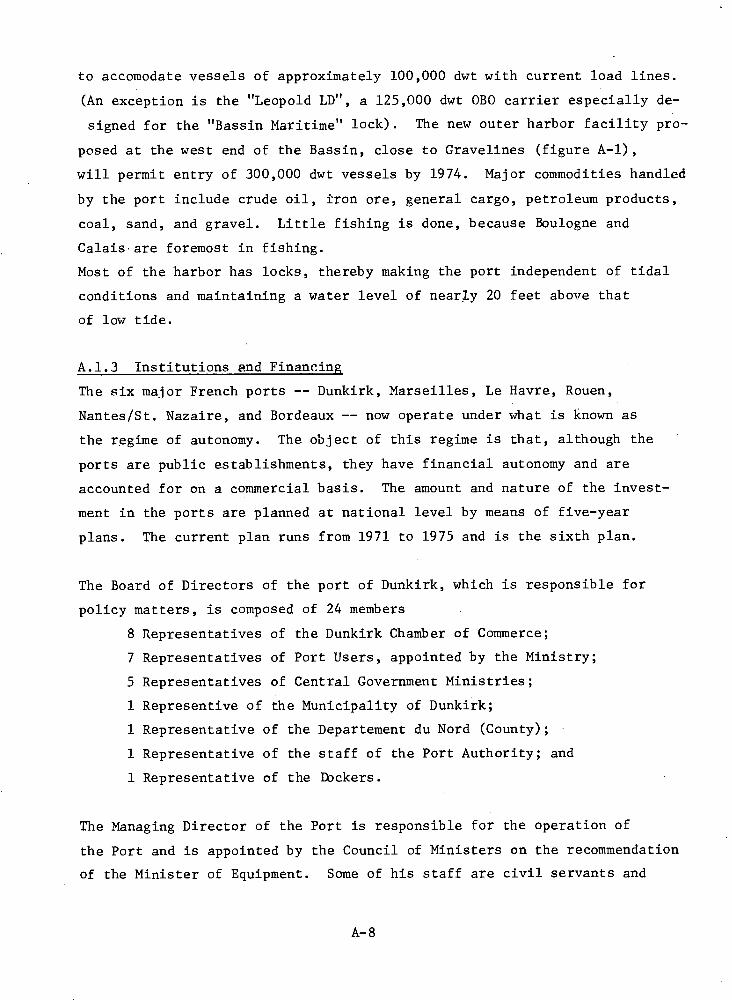
to accomodate vessels of approximately 100,000 dwt with current load lines.
(An exception is the "Leopold LD", a 125,000 dwt OBO carrier especially de-
signed for the "Bassin Maritime" lock). The new outer harbor facility pro-
posed at the west end of the Bassin, close to Gravelines (figure A-1),
will permit entry of 300,000 dwt vessels by 1974. Major commodities handled
by the port include crude oil, iron ore, general cargo, petroleum products,
coal, sand, and gravel. Little fishing is done, because Boulogne and
Calais are foremost in fishing.
Most of the harbor has locks, thereby making the port independent of tidal
conditions and maintaining a water level of nearly 20 feet above that
of low tide.
A.1.3 Institutions end Financing
The six major French ports -- Dunkirk, Marseilles, Le Havre, Rouen,
Nantes/St. Nazaire, and Bordeaux -- now operate under what is known as
the regime of autonomy. The object of this regime is that, although the
ports are public establishments, they have financial autonomy and are
accounted for on a commercial basis. The amount and nature of the invest-
ment in the ports are planned at national level by means of five-year
plans. The current plan runs from 1971 to 1975 and is the sixth plan.
The Board of Directors of the port of Dunkirk, which is responsible for
policy matters, is composed of 24 members
8 Representatives of the Dunkirk Chamber of Commerce;
7 Representatives of Port Users, appointed by the Ministry;
5 Representatives of Central Government Ministries;
1 Representive of the Municipality of Dunkirk;
1 Representative of the Departement du Nord (County);
1 Representative of the staff of the Port Authority; and
1 Representative of the Dockers.
The Managing Director of the Port is responsible for the operation of
the Port and is appointed by the Council of Ministers on the recommendation
of the Minister of Equipment. Some of his staff are civil servants and
A-8
the others are independently recruited by the Port Authority.
The Port Autonome is thus practically free from municipal boundaries and
constraints.
On a regional basis, the most important planning institution is OREAM du
Nord, which concerns itself with the northwestern portion of France, and
principally with the long-range development of the Nord-Pas de Calais
Region. Among the agencies with whom OREAM cooperates are the Cross-
Ministerial Delegation for Regional and Land Planning (DATAR), City
Planning Agencies -- primarily in Dunkirk and Calais - Ministry of Equipment,
Port Authority, state and local Chambers of Commerce, water supply group,
and agricultural agencies.
The "Agence Financiere du Bassin de la Region du Nord" concerns itself with
approximately the same region as that of OREAM du Nord, but deals only
with the water quality of the area. Except for this agency, there is
virtually no other organization which deals specifically with the question of
environmental quality or pollution abatement, but rather an array of
governmental bodies depending on various Ministries. The January 1971,
creation of a Ministry of Environment is too recent for the necessary
organization to have taken place.
At the local level, the Port Authority has direct charge of port develop-
ment and operation, which it carries out with assistance from high levels
of authority. A "Commission pour l'industrializations" has recently
been organized by the Prefet to meet monthly, and includes the following
representatives:
• Chambers of Commerce (Dunkirk, Calais, St. Omer);
• Sous-prefets d'arrondissements (administrative subdivision of department);
• Directeurs departmentaux (Nord, Pas-de-Calais) representing the Ministries of Equipment (waterways), Agriculture, Labor, Tel-ecommunications;
• Public utilities, SNCF (railroads), EDF (Electricity);
• The association for regional industrial expansion (DATAR-sponsored
A-9
group of urbanists and sociologists); and
• President of the 16 municipalities and mayors of Dunkirk and Calais.
The purpose of this Coordinating Committee is to keep each other informed
as to developments and to try and identify potential problems before
they occur. The Committee has no direct authority, and acts only in an
advisory and informational capacity.
As an autonomous port, Dunkirk benefits from government aid in building
infrastructure and in dredging outside the port. The state is entirely
responsible for maintenance of the maritime approach channels, the sea
walls, the outer harbor, and the access locks from the sea. It also pays
for the operation of these locks.
Concerning capital expenditure for such items and excavation of docks,
the state contributes 80%, while the port pays 20%. For quays, quay
walls, and dry docks, the state pays 60%. The state also contributes
to the cost of servicing loans obtained by the port in the past for carrying
out such works. For the cranes, sheds and warehouses, however, there is
no assistance from the state.
In addition, the state has delegated responsibility to the Dunkirk Port
Authority for two annexed services -- the light and beacon service in
the maritime approaches, and the canal service immediately inland of the
port. The state reimburses the port for the cost of running these ser-
vices.
Although the state pays these various contributions, the Port Authority
is responsible for supervising building both the infrastructure and the
superstructure, operating the locks, policing the port itself, and
dredging. It is, of course, also responsible for the day-to-day management
of the port.
The port authority does not, however, concern itself with handling cargo.
A-10
It owns and operates warehouses, cranes, floating docks, silos, etc.,
but rents them on short or long-term leases. Private cargo-handling
enterprises do the actual loading and unloading, and employ the dockers.
Cranes are rented complete with operator for four hours or eight hours;
warehouses either for the short-term or by the year. The port also
grants concessions to investors to construct sheds, silos, and other
equipment in the port.
The main financial advantages which Dunkirk receives from the state are :
• The state bears 60% of the cost of quays, quay walls, and dry docks,
and 80% of the rest of the infrastructure, including channel dredging.
The port does not pay interest on this gift capital.
• The state bears the depreciation charge on its share of the assets.
• The state pays for all maintenance dredging outside the port area.
• The state owns the land, the use of which it grants to the port,
rent-free.
• The state pays for the operation and upkeep of the access locks.
• The port pays no municipal taxes.
• The French National Railway Company operates the railway in the
port, with no running cost falling on the port authority.
A.1.4 Economic Aspects
a. Historical Development
Dunkirk commercial port was born in the 1800's from a walled fortified town
and military base. Its activities were initially based upon commercial
trading with the French colonies. In comparison to other European ports,
Dunkirk is not an old port.
One can distinguish the'following periods in the development of the harbor:
• In 1947-1954 the basic infrastructure of the harbor -- completely
destroyed during the war -- was rebuilt; by 1961, total traffic
reached the pre-war level, growing at the rate of 4% per year.
• In 1962, a major steel company, Societe Usinor, established a steel
mill, and the same year, the refinery (SFBP - Societe Francaise
des Petrole P.) increased its capacity substantially.
A-11
• In 1969, the capacity of the Socitte Usinor steel plant was increased
and a coking plant was added; at the same time, the harbor opened roll-
on/roll-off (RO/RO) and container terminals.
The imports of iron ore for the Societe Usinor plant and for the steel
industry to the East of France caused a substantial increase in the total
traffic of the harbor. Port traffic increased from 8.0 million tons in
1960 to 20.8 million tons in 1969 with an average growth of 11.2% per
year. Today, Dunkirk is the third largest harbor in France. In 1969,
Marseilles handled 65 million tons, Le Havre 49 million tons, and Dunkirk
21 million tons. However, Dunkirk is ranked first when excluding crude
oil and petroleum products : Dunkirk with 12 million tons; Marseilles
with 8 million tons; and Le Havre with 6 million tons.
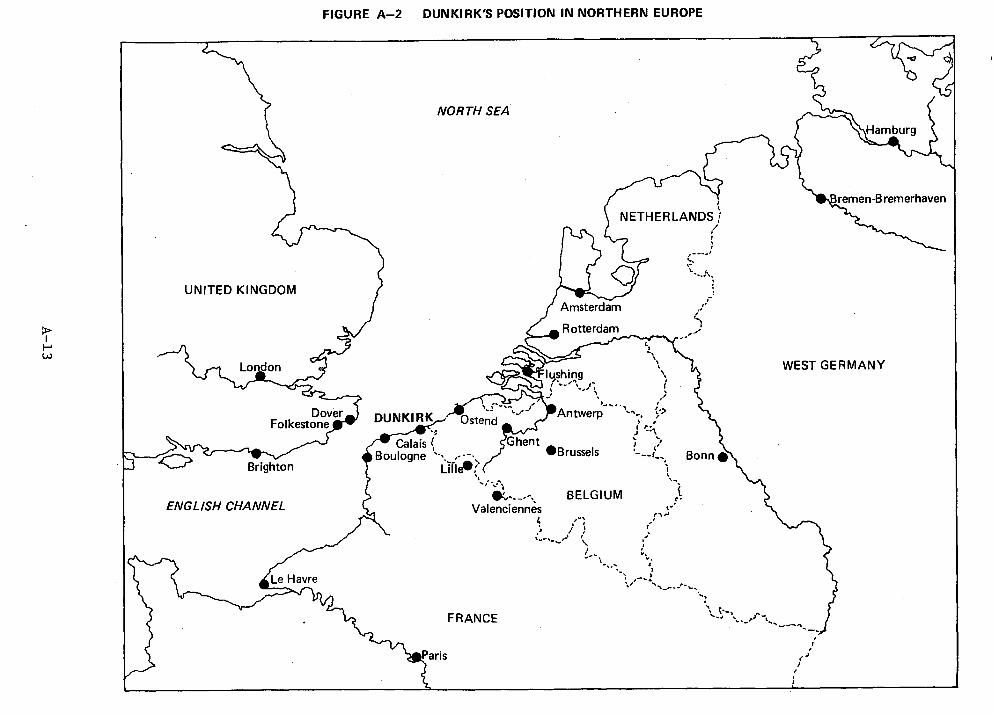
b. The Regional Development Strategy
This northern region (figure A-2) with a population of 4 million, is not
important enough in its own right to justify a major deep water port invest-
ment. However, the important European industrial areas (Belgium, the
Netherlands, the United Kingdom, and Germany) are close, and supertankers
could have reasonable access to the Dunkirk facility, whereas Antwerp
and the ports to the east have some draft and traffic limitations.
Dunkirk is also rail-oriented and could become a heavy rail shipping
center for Britain (via the proposed channel tunnel). The English Coast
is already heavily overcrowded and for manufacturers who wish to serve
the British market, it may be a decided advantage to locate their facilities
in the Dunkirk region. They could then serve Britain either by fast
RO/RO vessels or through the proposed tunnel (which is still considered
for 1980).
The Dunkirk industrial project is apparently well thought of in higher
Paris government circles, even though the offshore island concept raises
skepticism. The "white book" covering the Dunkirk industrial project
is said to have been read and favorably commented upon by President Pompidou.
The development scheme follows the following directives:
A-12
Le Havre
Paris
vt,
;
5- 1 ....;
FRANCE
FIGURE A-2 DUNKIRK'S POSITION IN NORTHERN EUROPE
NORTH SEA
Hamburg
remen-Bremerhaven
NETHERLANDS
UNITED KINGDOM
Amsterdam
Rotterdam
z,
London -
‹f;?*113shing .. % 1 i . )
' ,
Folkestone Dover DUNKIRI.!,-, Ostend ' ■ ..
Calais ‘, Ghent • Brussels ' il
■ ,
p----- <:› Brighton I Boulogne -,..__,---•,,
LilleOf ,
N 1 s ,
BELGIUM I. , ENGLISH CHANNEL (I.,, Valenciennes
e-
l: . I I
/
WEST GERMANY
Bonn •
\-1
,"
• industrial and harbor development will occur between Calais and
Dunkirk (with the exceptions of historical sites or cities like
Gravelines, Grand Fort Philippe, and Petit Fort Philippe);
• tourist and recreation facilities will be reserved from Dunkirk's
eastern edge to the Belgium frontier and to the west and southwest
of Calais.
c. The Coastal Inland Zone
The coast will thus be shared among industrialization, urbanization, tourism,
and recreation. Somewhat inland, the area centered on Bourbourg will be
limited to agricultural development and serve as a "buffer" between the
heavy (polluting) industries of the coast and the urban development of
the surrounding communities of Guisnes, Ardres, Audruick, Bergues, Crochte,
and Pitgam.
This development pattern is an attempt to avoid the development path of
Rotterdam, and the urban consequences that followed. If the urban develop-
ment was concentrated on Dunkirk, it would entail such an unreasonable
growth of the urban area that dangerous social and environmental constraints
would arise. The city of Dunkirk has been planned not to grow at the
same rate as the port, but to connect the port to several peripheral
urban centers.
Environmental pollution from the industrial complex make it necessary to
locate residential areas some distance from the industrial area. Conse-
quently, urban developments tend to be in the opposite direction as that
of the port development. As a consequence, travel distances between resi-
dential and industrial areas tend to increase. For these reasons, the
urban development for the Dunkirk-Calais area has been based on a multi-
urban pole scheme that should disperse residential areas behind the agri-
cultural screen, but still at a reasonable commuting distance from the
industrial activity sectors.
The development of the Calais-Dunkirk industrial zone will be directed
by the Port Authority, independent of the administrative structure that
will take care of the urban areas, but the urban centers are expected to
A-14
act jointly for the preparation of common development plans. Already, local
urban commissions have been organized. Furthermore, a research group of
local urbanists and architects will sponsor continuing studies on the ur-
ban development. Finally, a central inter-ministry agency at the national
level will coordinate communication and collaboration between people working
on the national development plan and the Calais-Dunkirk regional agency.
Timing Horizon
By 1975: New front harbor from Dunkirk to Gravelines, accommodating 300,000 dwt vessels to serve an alumina plant (Pechiney). Societe Usinor will open its second steel plant, creating 7,000 new jobs.
1975-1985: Completion of communication links between the Dunkirk-Grave- lines coastal zone and the Belgian frontier. Two major high-ways will have been completed: Lille-Dunkirk and Calais-Ostende. The industrialization spread towards Calais will continue. The offshore island may be linked by pipelines to Belgium and Germany and channel tunnel completed.
By 2000: New front harbor between Calais and Gravelines. Unification of the coastal zone between Calais and the Belgium frontier (industry and recreation), with a coastal-metropolis of 800,000 inhabitants from Bray-Dunes to Calais.
d. The City of Dunkirk
Port development is resulting in significant change for the consolidated
town of Dunkirk-Malo Les Bains, (population 43,000) and other area commun-
ities. Many new social demands are arising. At the present time,the
average income in the Dunkirk area is said to be low, with little oppor-
tunity for employment(especially for women).
The city administration's primary concern is to provide additional job
opportunities and to upgrade existing jobs. The next major problem is
to provide the necessary housing and infrastructure for an expected doubling
of population over the next fifteen years in the greater Dunkirk area -
from 140,000 to approximately 300,000 people.
Various leisure time activities (e.g., sports stadium, entertainment
facilities) were viewed as unimportant by community leaders in the past ,
It is now understood that the area is quite under-developed (regarding
A-15
leisure activities, fashion shops, university facilities, etc.) and this
situation possibly could retard the industrialization process, since the
area is lacking many commonly accepted amenities.
An urban commission (composed of towns surrounding the port-industrial
area) was recently formed to collect tax revenue from the industrial zone
and split the proceeds among member towns for various social infrastructure
facilities. According to our contacts, Dunkirk has received about $2
million over the past six years from the central government, in the form
of subsidies for the construction of various municipal facilities. This
amounts to approximately one-third of total expenditures during the past
six years.
The city administration believes that - as long as industrial development
is reasonably well planned, housing is adequate and recreational facilities
are made available -- they will have little of the political and social
problems which are plaguing other ports in France.
The regional planning agency (OREAM du Nord) - whose objective it is to
disperse population and secondary light industry over as wide an area as
possible - has had difficulties with the Dunkirk city planners Dunkirk
wants to be a big city. This has resulted in the city's own projections
of astronomical growth, which OREAM believes will result in significant
infrastructure problems for the city. OREAM has attempted to make the city
of Dunkirk be more selective in its Objectives, concentrating on secondary
industries and only that amount which would absorb present excess labor
capacity (especially female). One of the basic concepts which the regional
planning authority has tried to sell the cities of Dunkirk and Calais is
that the port (which was taken from Dunkirk) is now an autonomous port,
for both Calais and Dunkirk. This concept is somewhat difficult to sell
but progress is being made.
Dunkirk administrative officials were somewhat critical of the regional
planning commission covering Dunkirk (i.e., OREAM du Nord). They believe
A-16
the regional planning commission does not consult the oil companies or
other basic industries regarding what they want in industrial sites,
transportation infrastructure, and facilities.
e. New Outer Harbor
Approximately $27 million have been invested in extending the Dunkirk port
to its present size; including land acquisition for the old industrial
zone (which includes 1,235 acres of land for the Societe Usinor steel
plant). The new expansionary port development program can be classified
as the Second Phase of development. In this phase, there are two steps:
first, construction to the west of the new, large outer harbor which
is expected to cost approximately $90 million; second, the construction
of the necessary infrastructure (i.e., jetties and large locks) which
will connect the outer harbor to the old harbor in Dunkirk. This second
step is expected to cost an additional $90 million. The rationale for
this development consists of:
• approaching saturation of the existing port;
• needed for a new alumina plant project;
• the need for superships up to 300,000 dwt bauxite, iron ore, and oil.
• proximity to Gravelines, eight miles west from the entrance of the existing port limited to 100-125,000 dwt, with good land for six miles inland (up to Bourbourg); and
• shorter access to deep water (75 ft).
f. Port Commodity Flows
At present, the port of Dunkirk is still regional , but the port has
more than doubled its volume of cargo handled since 1960 almost entirely
by adding ores and crude petroleum traffic. The important growth period was
1962-63, when Societe Francaise des Petroles British Petroleum (oil refinery)
was expanded and Usinor steel plant, using basically Mauritanian and
Liberian ores, came into operation.
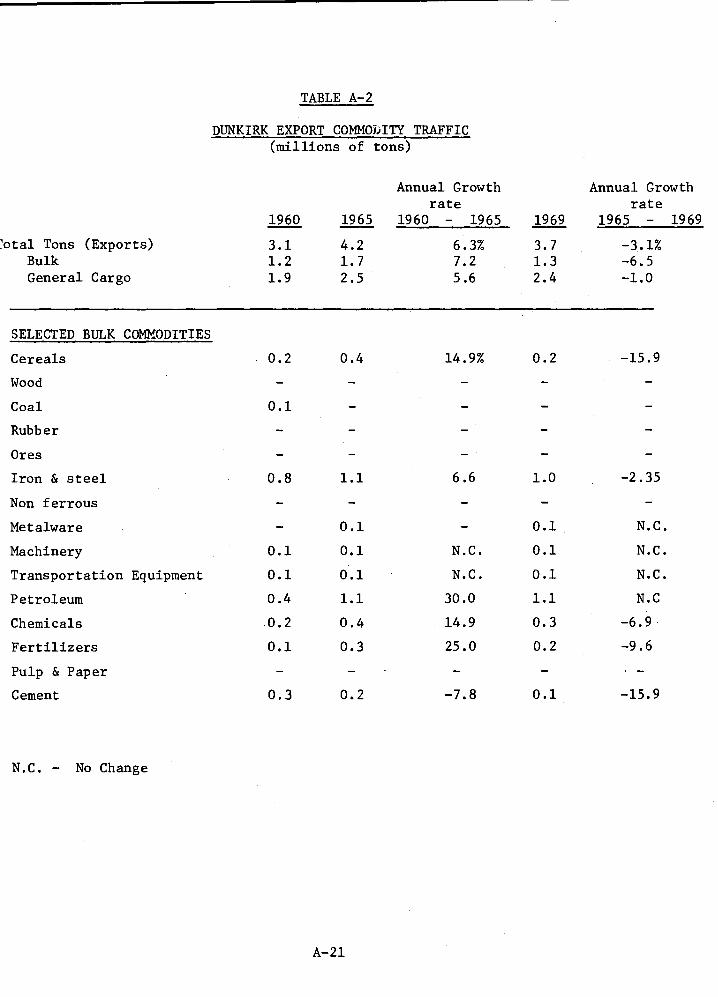
1. Export and Import Trade Imbalance
Export traffic has only increased by 20% while during the same period
import traffic increased by 350%. Industry in the port area generated
A-17
56% of the import traffic and 40% of the export traffic.
Because of inadequate transportation links with the hinterland and the
fact that current industrial operations at Dunkirk depend to a large
extent on foreign raw materials, imports represent the major share of tonnage
handled at the port (82%) while exports are relatively little (18%). It is
hoped that when the transportation links are improved between Dunkirk and
the northern regions of France, the export trade will pick up, and a more
reasonable balance between exports and imports will be attained. Another
reason why the export volume moving through Dunkirk is relatively modest
is because of some social and labor unrest in Dunkirk ports. If the problems
with labor could be resolved, then the general cargo moving through Dun-
kirk would increase.
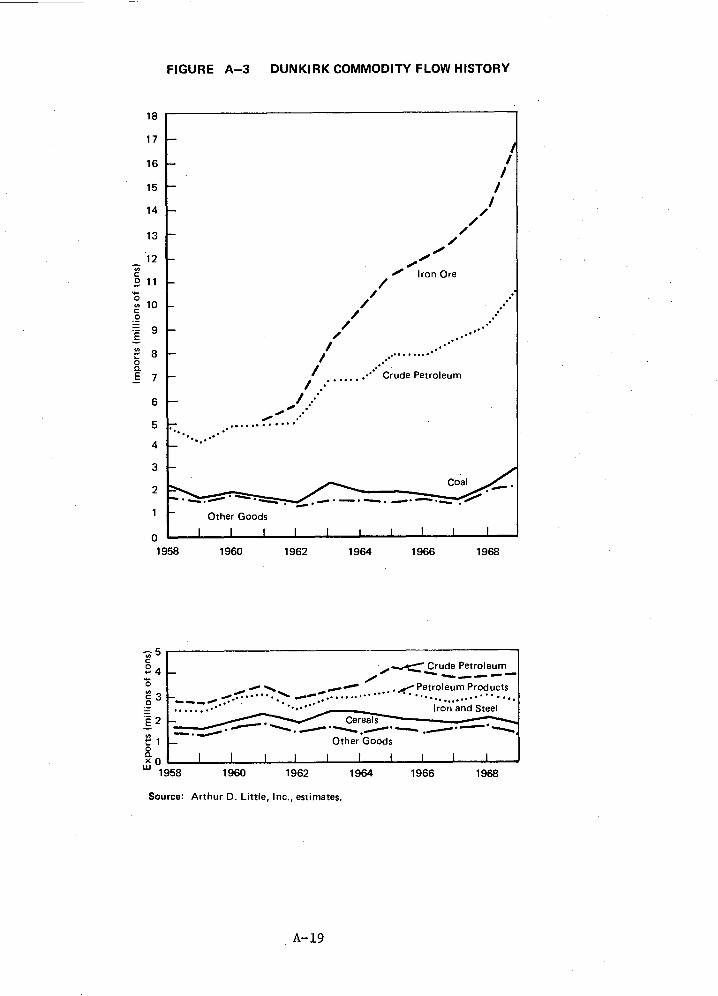
A profile of commodity traffic levels and their historical growth rates
(1960-1969) for the port of Dunkirk is illustrated in Tables A-1, A-2,
and A-3 and in Figure A-3.
2. Crude Oil and Petroleum Products
Petroleum traffic between 1960 and 1969 increased from 4.0 million tons
to 8.8 million tons, representing a 9.2% annual rate of growth. After
iron ore, petroleum is Dunkirk's most important traffic commodity. This
relationship of oil to iron ore will be reversed in the next five years.
Upon completion of the new deep water port, pipelines are scheduled to
be constructed across France, Belgium, and into Germany. Oil imports
will then increase very rapidly.
3. Iron Ore
Societe Usinor has been one of the key factors in the development of
Dunkirk during the past decade, and growth in traffic is still highly
sensitive to the needs of the Usinor plants. Iron ore represented 6.4
million tons in 1969, or 31% of total port traffic. Imports of iron ore
increased 16-fold between the years 1960 and 1969, going from 400,000
tons to 6,400,000 tons.
A-18
1■■
Iron Ore
.••• .••••
.••• .•...•'.. .•••
.• Crude Petroleum
18
17
16
15
14
13
2 11
1 0
t- 8
E7
8 o.
11.■
1■■
1■■
,1■■
Coal
L•■•••:°°;
7 Other Goods
FIGURE A-3 DUNKIRK COMMODITY FLOW HISTORY
/ .■•• .••
.•‘• •
4
3
01 1 1 1 1 1 1 I 1 1 1
1958 1960 1962 1964 1966 1968
5 •-• 4
Crude Petroleum
....... - PetroleumProducts 3
• . _..•• .... .„, ......... • • .„
E 2
8
LU 01 L 1958
Source: Arthur D. Little, Inc., estimates.
A-19
Iron and Steel Cet.•• ••••------■■••••"'
• • •-•-■ •-•-•••• Other Goods
1 1 I 1 1 1 1 1
1960 1962 1964 1966 1968
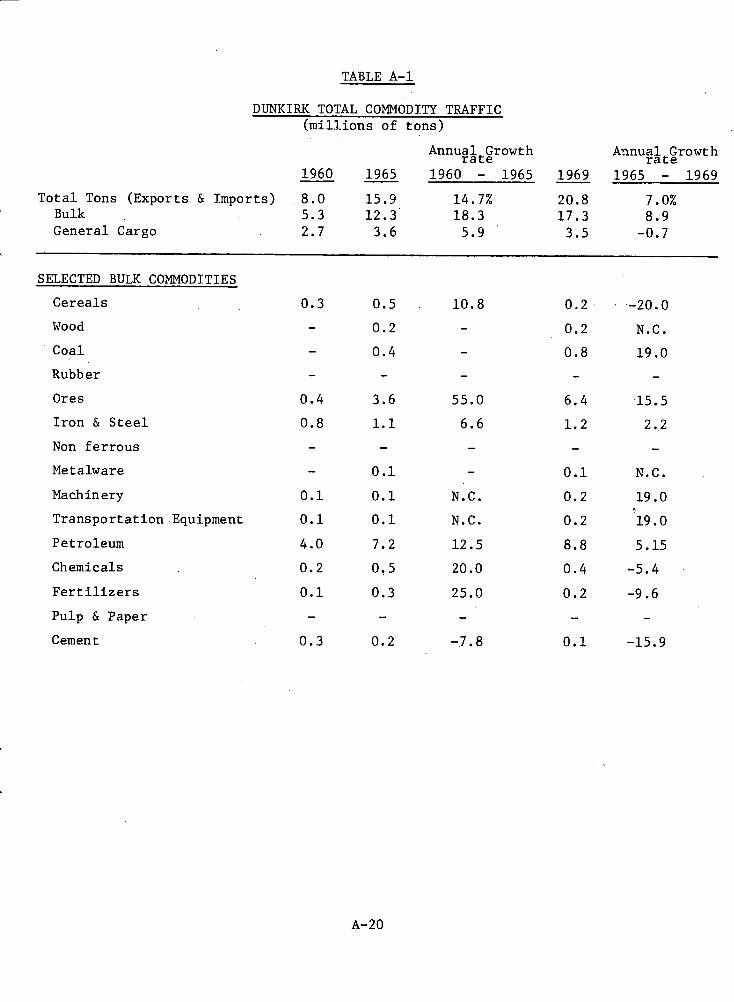
TABLE A-1
DUNKIRK TOTAL COMMODITY TRAFFIC (millions of tons)
Annual Growth Annual Growth rate rate 1960 1965 1960 - 1965 1969 1965 - 1969
Total Tons (Exports & Imports) 8.0 15.9 14.7% 20.8 7.0% Bulk 5.3 12.3 18.3 17.3 8.9 General Cargo 2.7 3.6 5.9 3.5 -0.7
SELECTED BULK COMMODITIES
Cereals 0.3 0.5 10.8 0.2 -20.0
Wood - 0.2 - 0.2 N.C.
Coal - 0.4 - 0.8 19.0
Rubber - - - - -
Ores 0.4 3.6 55.0 6.4 15.5
Iron & Steel 0.8 1.1 6.6 1.2 2.2
Non ferrous - - - - -
Metalware - 0.1 - 0.1 N.C.
Machinery 0.1 0.1 N.C. 0.2 19.0
Transportation Equipment 0.1 0.1 N.C. 0.2 19.0
Petroleum 4.0 7.2 12.5 8.8 5.15
Chemicals 0.2 0.5 20.0 0.4 -5.4
Fertilizers 0.1 0.3 25.0 0.2 -9.6
Pulp & Paper - - - - -
Cement 0.3 0.2 -7.8 0.1 -15.9
A-20
0.8
0.1
0.1
0.4
0.2
0.1
1.1
0.1
0.1
0.1
1.1
0.4
0.3
0.1
TABLE A-2
DUNKIRK EXPORT COMMODITY TRAFFIC (millions of tons)
Annual Growth Annual Growth rate rate
1960 1965 1960 - 1965 1969 1965 - 1969
'otal Tons (Exports) 3.1 4.2 6.3% 3.7 -3.1% Bulk 1.2 1.7 7.2 1.3 -6.5 General Cargo 1.9 2.5 5.6 2.4 -1.0
SELECTED BULK COMMODITIES
Cereals
Wood
Coal
Rubber
Ores
Iron & steel
Non ferrous
Metalware
Machinery
Transportation Equipment
Petroleum
Chemicals
Fertilizers
Pulp & Paper
Cement
0.2 0.4 14.9%
6.6
N.C.
N.C.
30.0
14.9
25.0
0.3 0.2 -7.8
0.2 -15.9
1.0 -2.35
0.1 N.C.
0.1 N.C.
0.1 N.C.
1.1 N.0
0.3 -6.9
0.2 -9.6
0.1 -15.9
N.C. - No Change
A-21
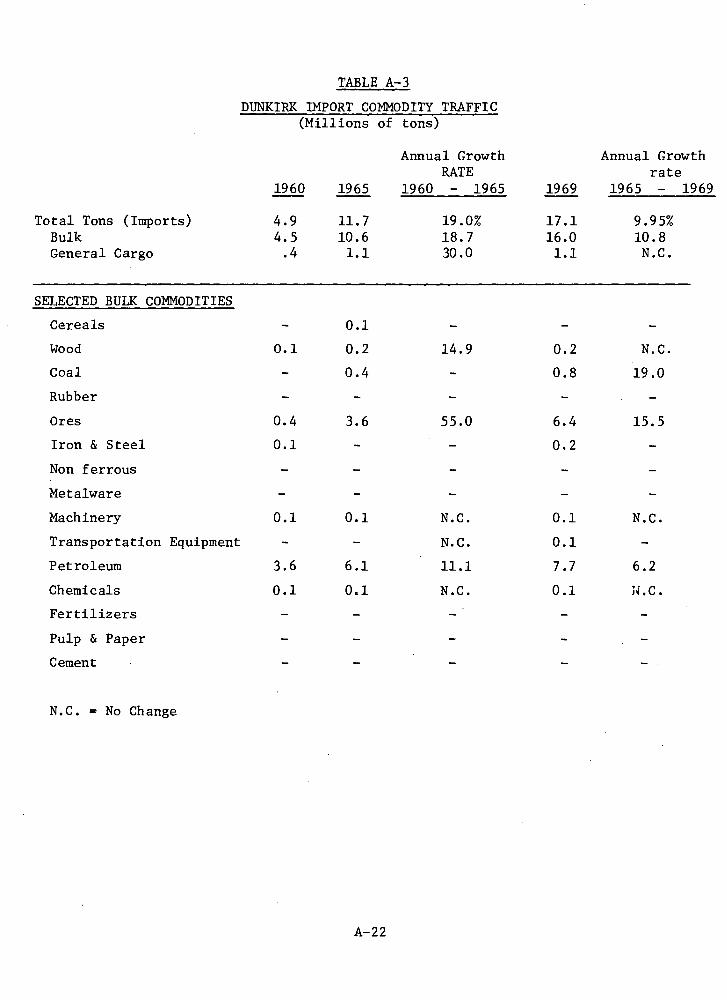
TABLE A-3
DUNKIRK IMPORT COMMODITY TRAFFIC (Millions of tons)
Annual Growth Annual Growth RATE rate
1960 1965 1960 - 1965 1969 1965 - 1969
Total Tons (Imports) 4.9 11.7 19.0% 17.1 9.95% Bulk 4.5 10.6 18.7 16.0 10.8 General Cargo .4 1.1 30.0 1.1 N.C.
SELECTED BULK COMMODITIES
Cereals - 0.1 - - -
Wood 0.1 0.2 14.9 0.2 N.C.
Coal - 0.4 - 0.8 19.0
Rubber - - - - -
Ores 0.4 3.6 55.0 6.4 15.5
Iron & Steel 0.1 - 0.2 -
Non ferrous - - - - -
Metalware - - - - -
Machinery 0.1 0.1 N.C. 0.1 N.C.
Transportation Equipment - - N.C. 0.1 -
Petroleum 3.6 6.1 11.1 7.7 6.2
Chemicals 0.1 0.1 N.C. 0.1 N.C.
Fertilizers - - _ - -
Pulp & Paper - - - - -
Cement - - _
- _
N.C. = No Change
A-22
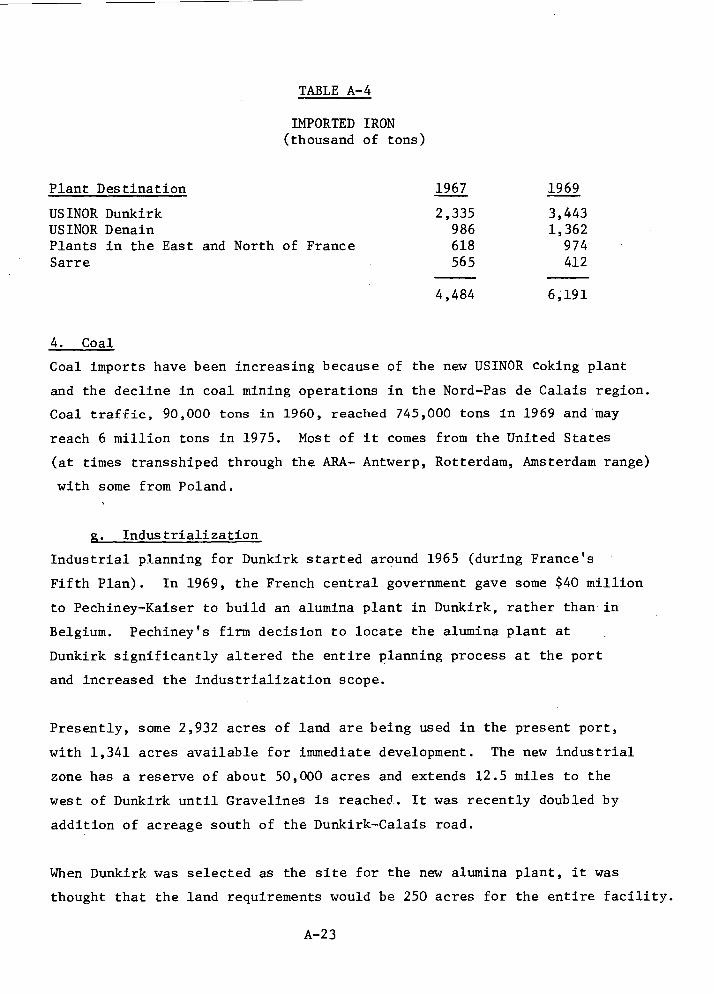
Plant Destination 1967 1969
TABLE A-4
IMPORTED IRON (thousand of tons)
USINOR Dunkirk 2,335 3,443 USINOR Denain 986 1,362 Plants in the East and North of France 618 974 Sarre 565 412
4,484 6,191
4. Coal
Coal imports have been increasing because of the new USINOR coking plant
and the decline in coal mining operations in the Nord-Pas de Calais region.
Coal traffic, 90,000 tons in 1960, reached 745,000 tons in 1969 and may
reach 6 million tons in 1975. Most of it comes from the United States
(at times transshiped through the ARA- Antwerp, Rotterdam, Amsterdam range)
with some from Poland.
g. Industrialization
Industrial planning for Dunkirk started around 1965 (during France's
Fifth Plan). In 1969, the French central government gave some $40 million
to Pechiney-Kaiser to build an alumina plant in Dunkirk, rather than in
Belgium. Pechiney's firm decision to locate the alumina plant at
Dunkirk significantly altered the entire planning process at the port
and increased the industrialization scope.
Presently, some 2,932 acres of land are being used in the present port,
with 1,341 acres available for immediate development. The new industrial
zone has a reserve of about 50,000 acres and extends 12.5 miles to the
west of Dunkirk until Gravelines is reached. It was recently doubled by
addition of acreage south of the Dunkirk-Calais road.
When Dunkirk was selected as the site for the new alumina plant, it was
thought that the land requirements would be 250 acres for the entire facility.
A-23
Type
Iron and steel manufacture
Oil refinery
Power plant
Food, fat products
Plywood
Petroleum products storage
Shipbuilding
However, as the planning proceeded, so has the necessary land requirement
which is now up to 1,700 acres (over 6-1/2 times the original estimate).
It is Dunkirk's experience (also, Antwerp's and Rotterdam's) that
in port and industrial development, planners always need much more land
than originally estimated.
Continuing west, another 12.5-mile strip is available for industry in the
long-term -- then Calais is reached. It is planned that the agricultural
zone located in the south will remain unspoiled at least until the
end of the century. Because of the lack of any recreational, tourist,
conservational, or residential use of the beach area, the entire coast-
line is set aside for industrialization, except in the Gravelines area,
which is to be retained as a "green belt." Some concern has been raised
in national circles about this coastal use for industry. At present
there are few relatively large companies located at Dunkirk. These are:
Companies
Societe Usinor, C.A.F.L. Dunes Plant
Societe Francaise des Petroles. BP
Electricite de France-Centrale Thermique de Dunkerque Les ieur
Fontvielle
Antar .
Compagnie Parisienne des Asphaltes
Ateliers rx Chantiers de France-Gironde Ateliers Ziegler
Of these nine companies, five constitute the major portion of harbor activity.
Steel Industry: USINOR - today producing 3 million tons of steel, but should reach 8 million during the sixth Plan (1971-1975). This 8 million tons should constitute 20 million tons worth of traffic for the harbor.
C.A.F.L. - produced 800,000 tons of steel in 1968. The production should reach 1,000,000 tons in 1980.
A-24
Shipbuilding :
Oil Refinery:
France-Gironde - construction of ships of all kinds except war vessels and Ziegler (fishing vessels)
BP - an integrated operation with a refinery capacity equal to 6 million tons per year (120,000 bbl/d) or 5% of the total French refinery capacity.
Food: Lesieur - major plant of the Lesieur group.
In addition to the present refinery, power station, steel works, and
planned alumina plant, other potential near-term industries to locate
in the Dunkirk industrial zone are : aluminum and steel fabrication plants,
chemicals and petrochemicals, and smaller industries. Petrochemicals
are expected to locate inland and be served by pipeline.
h. Labor
A basic constraint facing the industrialization plan is the lack of local
manpower. Transportation facilities will be required to bring workers
from surrounding communities, located within a radius of 30-60 miles -- quite
a distance for rural France. Housing for new families attracted by the
port development is also a major social problem. Various groups are
studying the transportation that will be required to bring workers from
the eastern coal region to the port area rapidly. East/West transportation
links between Dunkirk and Calais are also very difficult (eg., there are
neither freeways nor trains) and at the present time, it takes approximately
2.5 hours to commute round-trip (50 miles) from Calais to Dunkirk.
A committee for labor has been established which is evaluating the concept
of a manpower training center in Dunkirk. The Ministry of Labor in
Paris will underwrite the fixed investment cost for the training facilities.
The operating expenses for the training center are planned to be financed
by a training tax, to be paid by the industries locating in the port area.
Industrial manpower at Dunkirk is expected to be more expensive than
Rotterdam, but less than Le Havre.
A-25
One of the critical problems viewed by the port administration is in connecticn
with the longshoremen. Last year, about 3 million tons of general cargo
(exports) and a significant amount of ore were diverted to other ports
because of labor difficulties with dock workers at Dunkirk. Presently,
the port administration is thinking about improving the worker's pensions
and guaranteeing a week's pay, regardless of the work load (similar to dock
worker benefits now in Antwerp, Rotterdam, and Amsterdam). If such a pay
and benefits program is implemented, the port administration would
expect dock workers to be on-call day or night, depending upon demand.
But since
evenings,
Saturdays
week. In
speaking,
efficient
last September 12, 1971, French dockers have refused to work on
Sundays, or overtime. With strikes occurring frequently on
, French ports have been paralyzed virtually two full days a
consequence, merchandise has piled up on the quays. Generally
labor productivity in French ports is deemed less than 33% *as
as other European ports.
It has been, for example, conceded to unions that the handling of cement
be done by nine-man teams, when a new cement-bag elevator should have
reduced the team from ten men to five. The unions have also insisted
that pallet size is not to exceed one ton, and that cargo-tank bottom
unloading shifts at the ore quays be maintained, although the bulldozers
which now gather ore under the mechanized grab can do perfectly without
them.
i. Communication Inland
1. Railroads - One of the characteristics of the Dunkirk harbor is the
excellent railway connections towards Benelux, Paris, West Germany, and
Basel in Ewitzerland through the North of France and Lorraine. Four
* Source : Three Shipping conferences
A-26
marshalling yards are located close to the port (Figure A-1).
2. Water - The harbor is connected through a canal ("Canal a Grand Ga-
barit") with 3000-ton capacity to Valenciennes, with a 1350 ton cross-
over towards Lille and Arras. The Canal is also connected to the Paris
region through the St. Quentin Canal and the Northern Canal. Two internal
navigation locks connect basins 1 and 2 to the Dunkirk-Furnes Canal, giving
access to barges of 280 tons.
The Canal a grand Gabarit and the new lock at Mardyck can accommodate
barges of 3000 tons. Because the canal does not yet go very far inland,
about 40% of the volume is still handled by 250-300 ton barges.
3. Highways - The Dunkirk-Lille connection (55 miles) has been improved
by the construction of two cross-overs; one from Dunkirk to Bergues (7
miles), the other one from Nieppe and Lille (14 miles). The construction
of a cross-over from Bergues to Nieppe will be accelerated and the freeway
connection to Paris-Lille-Brussels completed in 1973-74.
It seems that Dunkirk suffers from a lack of coordination between the
transportation (road and water in particular) requirements of the region
and the development of the harbor. For example,there is a lack of coordination
between container traffic growth and freeway building. The major freeway
for Dunkirk may not be completed until 1974. However, in 1972 the second
container crane facility will be installed -- these containers must presently
go by rail, which is not as convenient or as efficient as truck trailer
transportation. A speed-up in the enlargement of the upstream canal grid
is also needed to enable 3000 dwt barges to travel north into Belgium.
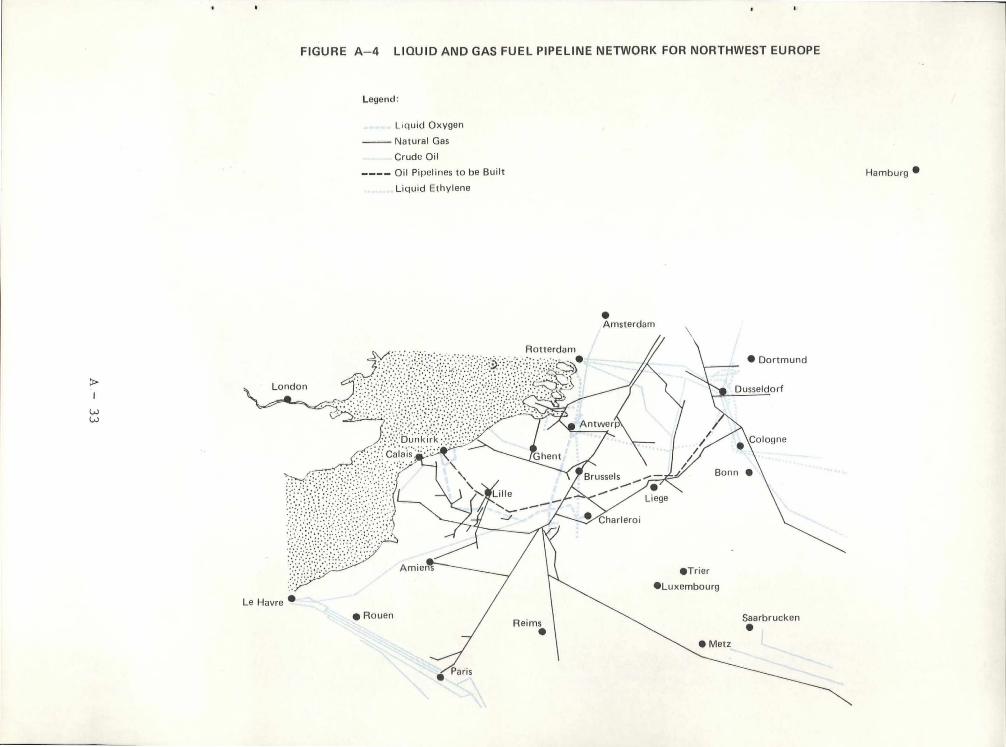
4. Pipelines - Dunkirk is connected to the "oxyducs" pipeline network
which joins major air-liquefaction plants of the area Dunkirk, Denain,
Mons, and Antwerp. From Dunkirk the pipeline is directed towards the
southeast, along the French/Belgium border.
A-27
A very dense gas pipeline network circulates in the north past de Calais
region towards Paris and the Eastern part of France, carrying gas produced
in Holland (Groningen) and in the coking plants of the coal mines area
of Northern France.
The development of the crude oil terminal in Dunkirk would lead to the
construction of an oil pipeline that would connect Dunkirk to Belgium
(Liege, Charleroi) and to Germany (Ruhr) (see Figure A-2).
i. Use of Econometric Models
The port of Dunkirk has set up an Economic Study Group, headed by a
petroleum economist, formerly in charge of crude supply and transport at
the BP refinery, with a staff of 16 people (one economist, one as8istant
economist, one operations research specialist, 1 engineer and 5 re-
searchers, 1 analyst-programmer, 2 programmers, 1 card-puncher, and 3
typists).
1. Potential Crude Oil market model
Several economic models have been developped for use in port planning.
The first model is a projective model of 1970-75 petroleum demand and
supply for northwestern Europe (excluding Scandinavia and the United
Kingdom.) The model incorporates data on historical petroleum consump-
tion by the major European refining regions (ports are underlined) --
Rotterdam, Cologne, Hamburg, Dunkirk, Karlsruhe--Frankfurt,
Bavaria, Le Havre-Basse Seine, Bordeaux and Marseille/Fos
and production by 4 sources--Persian Gulf, Libya, Algeria, and Nigeria.
Ocean transportation is distributed among five classes of ships, I
(30,000 dwt), II (60,000 dwt), III (100,000 dwt), IV (200,000 dwt) and
V (500,000 dwt). On existing vessels, only b -reakeven costs are fully considered
on new building options. Combinations for Persian Gulf crude are : Suez
both ways, Suez ballast only, Suez pipelines, Iraq pipeline kept at
maximum capacity.
A-28
The simulation makes it possible to determine handling capability and
installation requirements. It takes into account time delays by setting
up "windows" for large vessel arrivals.
Optimization of cost by linear programming was first tried on a continuous
basis, then on a discrete basis. The output is the total operating cost
and investment cost (15% capital charges) for the whole supply system to
northwest Europe. A shortage of pipelines was detected so five calcul-
ations were conducted:
1 = double PLSE capacity (Fos to Switzerland and Bavaria);
2 = P/L Le Havre Karlsruhe;
3 P/L Dunkerque to Ruhr;
4 = P/L Rotterdam Ruhr (RRP); and
5 = double TAL capacity (Trieste to Bavaria)
The European petroleum supply and demand model was tested against actual
historical data (1967) to determine its predictive accuracy concerning
petroleum input to Europe. At the total European aggregate level, the model'
was very accurate in predicting actual events, although it failed to pre-
dict accurately the actual petroleum input of each European port. In
particular, the introduction of TAL gave the actual PLSE momentary loss
of throughput.
The results are in favor of landing crude closest to a consuming center,
so that Rotterdam appears the best option. For Karlsruhe, Dunkirk is equi-
valent to Fos-PLSE (Marseille) and is cheaper for Cologne. If the Libyan
production were to decline enough, Dunkirk would beat PLSE on both accounts.
Dunkirk is better than Le Havre in all cases except for the Paris basin.
Currently, a sensitivity test to ship cost is being made. The results
were not found sensitive to growth in consumption, but quite sensitive to
the Libyan output, the growth of which favors PLSE and TAL.
This model is used for internal purposes and to support requests to the
Ministry. The saturation of the present outharbor (which motivated the
new projects) is evident as the waiting time curve (versus traffic) shows
unacceptable delays to big ships, beyond 35 million tons per year crude oil
A-29
throughput. Oil transfer inland would noticeably improve the economy of
the new port, which will be -reated initially for Pechiney's alumina plant.
However, development can be restricted to 300,000 dwt (outharbor) without
the Ruytingen island pIoject for 750,000 dwt, until more of such ships are
around.
Ore basin utilization involves a routine in the model which generates a
sequence of ship sizes and arrivals for ore ships (or oil tankers in a subcase
handled for BP) and treats it for ship unloading. The output is : total
shiphandling time, time of arrival, channeling, docking, unloading start
up, and departure; along with a plot of frequency versus time in port.
Every six months, the statistics of the ore basin are entered and tested
for actual loading time distribution for each berthing dock. The model
is then used to make six-month forecasts, and assess short term impact of
gantry crane repair, Sunday shifts, etc.
Another long-term use is to identify constraints ( a new dry bulk storage
park is being built, but not really because of the model which only confirmed
the need), and to adjust capacities of various elements afterwards. A
recent game for BP was to determine when they have to move to the new
outharbor (by building a pipeline or a new refinery).
In the near future, this model will be used to evaluate the overall compara-
tive economics resulting from increased costs of supertankers compared
to the economics of pipelines.
Other Models
A family of simulation routines is being designed to evaluate the port com-
plex itself, the size of a basin(wet dock), and the volume of trade necessary
to support the basin.
Another model idea is an attempt to evaluate a container shipping line's
decision ir terms of relative costs and reliability of alternatives.
Another project is related to cost and benefits for port industrialization.
A-30
Statistical Work
The economics group keeps six-months' operating statistics for cargo
handling equipment, particularly on utilization ratio at maximum capacity,
and at various lower capacity levels, looking at both percentage and re-
gularity. We have seen them used in combination with the ore basin routine.
The statistics are also used to plan relocation and change of cranes,
to make decisions on mobile vs. stationary new equipment, and to recon-
sider docking priorities at general cargo berths. As complete a sta
tistical data file as possible is being built on trade relations with the
interior. All national traffic through Dunkirk, Le Havre, and the other
major French ports is now known, but foreign trade is quite difficult
to handle.
2. The Sixth Plan
For the preparation of the sixth Plan and the justification of the new out-
harbor, several economic studies have been conducted, such as the economics
of oil, ore and other dry bulks, containers and RO/RO, and trade improve-
ments versus total port investment. National costs and benefits are in-
cluded.
The oil trade was analyzed and included a comparison of transshipment at
Le Havre, waiting-time, and possibility of exports from the BP refinery.
Transshipment opportunities in Dunkirk were not considered in the economic eval-
uation for conservative purposes, but were introduced later to assess tech-
nical difficulties; shortage of storage space, etc.
Dry bulk appeared quite promising, thanks to the good economy of railroad
transit to the Saar steel industry. Once established, this trade could
extend to the Ruhr, which might want to have an alternative to the port
of Rotterdam.
The new harbor project would bring tremendous improvements on the contain-
er trade and cross-channel roll-on/roll-off. It offers a tidal basin, saving
on lock delays, and a shorter channel crossing. In the analysis of unit-
A-31
cargo inland (Lille, Strasbourg, Paris, and Switzerland were considered),
the conventional 1970-80 containerization curve was discarded as too
arbitrary, in favor of a line-zone approach to study the redistribution
depending on cost, and to obtain the potential flow per line (Australia,
the United States, etc.).
A-32
STrier
• Luxembourg
Arnie
Saarbrucken • Reims
•
• Amsterdam
ai \Cologne
Brussels
Liege
Charleroi -.J
• Metz
Paris
Antwer
Rotterdam • Dortmund
Dusseldorf
Calais
Le Havre • • Rouen
FIGURE A-4 LIQUID AND GAS FUEL PIPELINE NETWORK FOR NORTHWEST EUROPE
Legend:
Lquid Oxygen
Natural Gas
Crude Oil
Oil Pipelines to be Built
Liquid Ethylene
Hamburg •
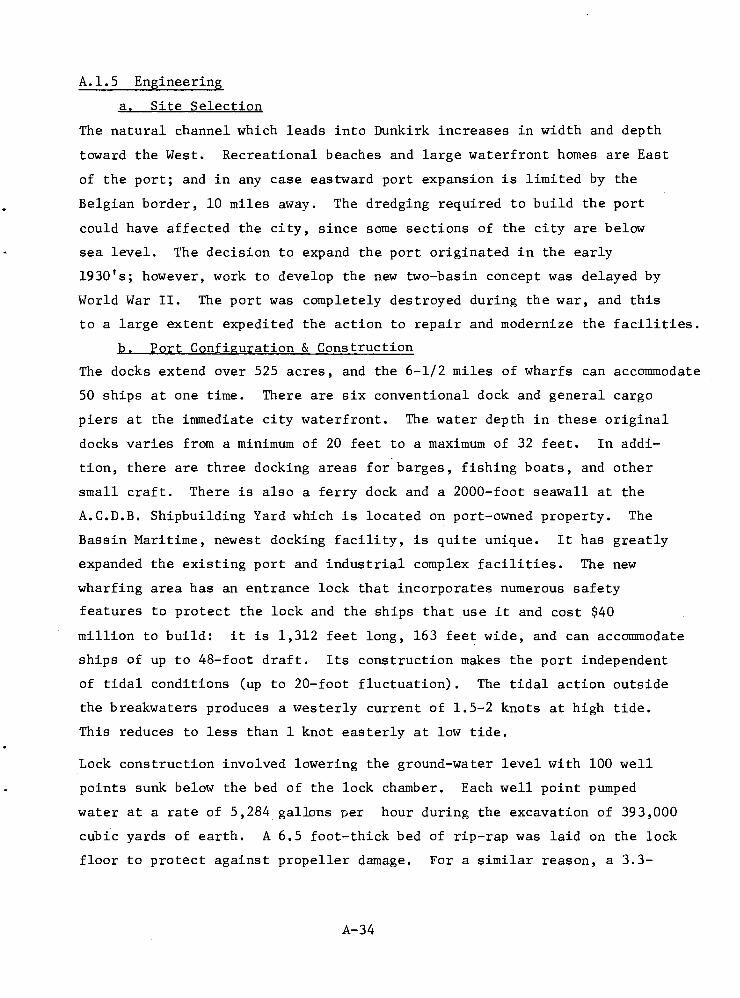
A.1.5 Engineering
a. Site Selection
The natural channel which leads into Dunkirk increases in width and depth
toward the West. Recreational beaches and large waterfront homes are East
of the port; and in any case eastward port expansion is limited by the
Belgian border, 10 miles away. The dredging required to build the port
could have affected the city, since some sections of the city are below
sea level. The decision to expand the port originated in the early
1930's; however, work to develop the new two-basin concept was delayed by
World War II. The port was completely destroyed during the war, and this
to a large extent expedited the action to repair and modernize the facilities.
b. Port Configuration & Construction
The docks extend over 525 acres, and the 6-1/2 miles of wharfs can accommodate
50 ships at one time. There are six conventional dock and general cargo
piers at the immediate city waterfront. The water depth in these original
docks varies from a minimum of 20 feet to a maximum of 32 feet. In addi-
tion, there are three docking areas for barges, fishing boats, and other
small craft. There is also a ferry dock and a 2000-foot seawall at the
A.C.D.B. Shipbuilding Yard which is located on port-owned property. The
Bassin Maritime, newest docking facility, is quite unique. It has greatly
expanded the existing port and industrial complex facilities. The new
wharf ing area has an entrance lock that incorporates numerous safety
features to protect the lock and the ships that use it and cost $40
million to build: it is 1,312 feet long, 163 feet wide, and can accommodate
ships of up to 48-foot draft. Its construction makes the port independent
of tidal conditions (up to 20-foot fluctuation). The tidal action outside
the breakwaters produces a westerly current of 1.5-2 knots at high tide.
This reduces to less than 1 knot easterly at low tide.
Lock construction involved lowering the ground-water level with 100 well
points sunk below the bed of the lock chamber. Each well point pumped
water at a rate of 5,284 gallons per hour during the excavation of 393,000
cubic yards of earth. A 6.5 foot-thick bed of rip-rap was laid on the lock
floor to protect against propeller damage. For a similar reason, a 3.3-
A-34
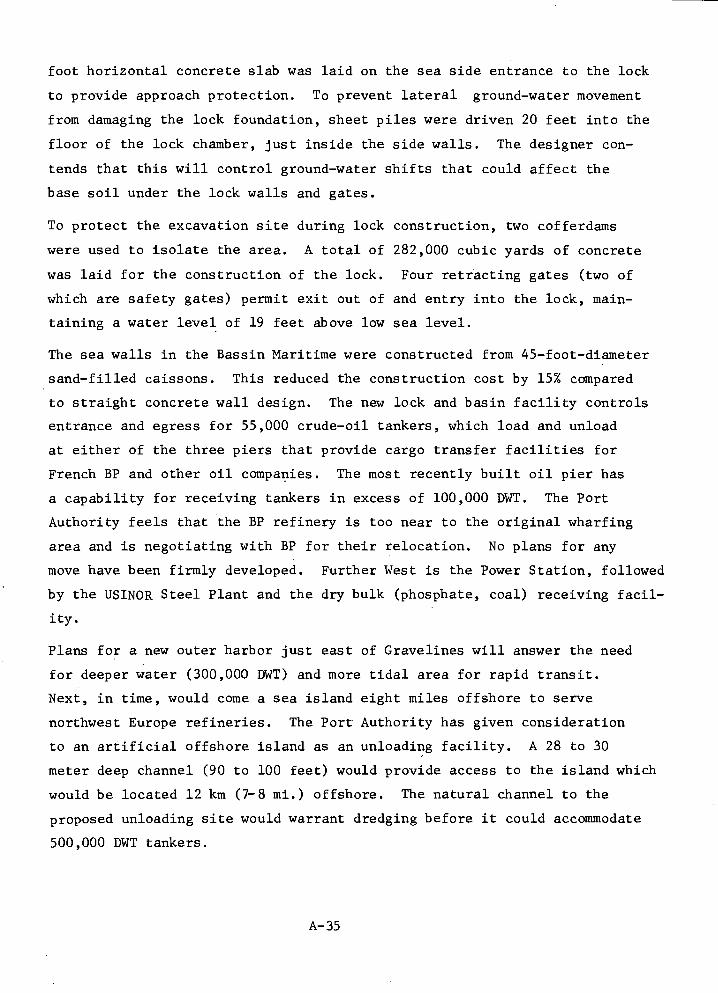
foot horizontal concrete slab was laid on the sea side entrance to the lock
to provide approach protection. To prevent lateral ground-water movement
from damaging the lock foundation, sheet piles were driven 20 feet into the
floor of the lock chamber, just inside the side walls. The designer con-
tends that this will control ground-water shifts that could affect the
base soil under the lock walls and gates.
To protect the excavation site during lock construction, two cofferdams
were used to isolate the area. A total of 282,000 cubic yards of concrete
was laid for the construction of the lock. Four retracting gates (two of
which are safety gates) permit exit out of and entry into the lock, main-
taining a water level of 19 feet above low sea level.
The sea walls in the Bassin Maritime were constructed from 45-foot-diameter
sand-filled caissons. This reduced the construction cost by 15% compared
to straight concrete wall design. The new lock and basin facility controls
entrance and egress for 55,000 crude-oil tankers, which load and unload
at either of the three piers that provide cargo transfer facilities for
French BP and other oil companies. The most recently built oil pier has
a capability for receiving tankers in excess of 100,000 DWT. The Port
Authority feels that the BP refinery is too near to the original wharfing
area and is negotiating with BP for their relocation. No plans for any
move have been firmly developed. Further West is the Power Station, followed
by the USINOR Steel Plant and the dry bulk (phosphate, coal) receiving facil-
ity.
Plans for a new outer harbor just east of Gravelines will answer the need
for deeper water (300,000 DWT) and more tidal area for rapid transit.
Next, in time, would come a sea island eight miles offshore to serve
northwest Europe refineries. The Port Authority has given consideration
to an artificial offshore island as an unloading facility. A 28 to 30
meter deep channel (90 to 100 feet) would provide access to the island which
would be located 12 km (7-8 mi.) offshore. The natural channel to the
proposed unloading site would warrant dredging before it could accommodate
500,000 DWT tankers.
A-35
c. Channel and Basin
The Port officials were questioned on the navigation problems recently
reported to exist in the Dover Strait, since it provides the main means
of entry and exit to and from Dunkirk. It has been reported that the
Strait handles as many as 1,000 ships per day. Although twenty miles
wide, the navigational width of the Strait is greatly reduced by
sands and shoals. North Sea-bound traffic hugs the French coast, while
English Channel-bound vessels (outward bound) pass toward the English coast-
line. Traffic in both lanes are continually confronted with navigational
hazards that include dense fog conditions, the meeting of flood tides, and
the frequent sailings of ferry boats which ply between the continent and
England. These vessels continually cross the main shipping lanes. Col-
lisions in the area have increased by 23% since 1967, and two ships recently
sank within a 27-hour period on the English side of the heavily traveled
area. The collisions have involved ships traveling straight in the
channel, and no cross-channel incidents have been reported. Dunkirk
officials contend that the navigational hazards were not as serious as
reported, and that an average of 300 ships per day used the Strait rather
than the reported 1,000.
Ships wait ten miles offshore to enter Dunkirk, where a pilot boat is on
standby to aid the entry of the larger vessels. Tugs are used only at the
immediate entrance to the port (none of the visiting vessels are equipped
with bow thrusters or active rudders). No dredge maintenance has been
required in the main entrance channel where the bottom at a depth of 44
feet is comprised of silt and sand in various grain sizes (no rock is evident
in the channel area). The use of the new lock and channel with their in-
creased depth capability has resulted in the need for some continuous
dredging (silt and sand moving eastward) to maintain the desired channel
depth, and some oscillation problems in the new channel are under study.
The port is relatively protected to the north, since it is in the lee of
a number of sand banks* and a conventional buoy system is maintained for
*The offshore deepwater island is under discussion for this area.
A-36
navigational assistance into the harbor. Turning basins are currently
440 yards in diameter to the east; 550 yards to the west of the Bassin
Maritime. Some silt comes from the "watringues" drainage system in the
outer harbor.
A new lock-free 1,125-acre outer harbor is being considered at a site
some eight miles west of the original harbor. The basic design of the
approach channel, breakwaters, and a 1560-yard turning basin has already
been selected even though hydraulic, wave, and sedimentation studies are
still underway. The effect on the coastline from the new outer-harbor
construction will not be fully known for another year. Wave and current
studies are largely completed, while sedimentation and long-shore-drift
studies continue on two 1 : 150 hydraulic models. It has been decided
from the model studies that the new channel can be angled in a way to
reduce harbor silting. Channel silting problems are being studied con-
sidering tidal currents which are twice as strong in a westerly direction
than easterly. The effects of waves which vary from 11.5 to 16.5 ft over
a 10-year period are also under study, since the wave force height and
reach will control safe entry into the channel. The objective is to design
the new harbor so that the currents aid exit and entry - the objective
being to permit harbor entrance at any time between mid and high tide.
d. Docking
There are no docking problems in the Port of Dunkirk other than
port entry of large ships is currently confined to periods of high tide
and the small outharbor is somewhat congested. Fendering in the old and
new piers and in the lock area consists entirely of old truck tires.
e. Construction Materials
Construction of the new lock commenced November 1966 and was completed in
1970. The sub-structure and a thick bed of sand over a clay sub-strata
were both favorable elements in the project. The lock was built in the
shelter of two dikes, one downstream and one upstream in the turning basin
of the Bassin Maritime.
The downstream dike, 720 yards in length, was made of circular caissons
of sheet piling, 62.8 feet in diameter. The arcs joining the cells have
a radius of 78.6 inches, and the angle of the joint with the cells is 20
degrees. Silt and muddy sand found during construction of the dike was
dredged and replaced by 16.4 feet of clean sand to form a leveled
A-37
foundation. The depth of the base of the sheet piling varies from -44
feet to -10 feet at the ends of the dike. The circular caissons were
leveled at -33 feet.
The upstream dike, 1420 feet long, is built of supported flat sheet. The
cells are constructed on a platform at -17 feet level. Inside, the cell
structure is buttressed with sand to a height of -3 feet. The footing
of the piling run at levels of -40 feet on the outside and -33 feet on
the inside. The cells were leveled at a height of +27 feet. Construction
of the cells was accomplished with the aid of templates.
The dikes were completed without incident on schedule. Under the direction
of the Central Laboratory for Ponts et Chaussees (Bridges and Roads) and
the Regional Laboratory at Lille, stress gauges were installed on the
cells of the downstream dike. The data obtained contributed greatly to
understanding the behavior of the cells.
Once the dikes were completed, the trench was excavated under the shelter
of a breakwater. The breakwater which completely encircled the excavation
is composed of two levels at -10 feet and +23 feet. The construction was
completed by using pumping units at the bottom of each trench. The sub-
mersible pumping units were spaced at 67-foot intervals. When the trench
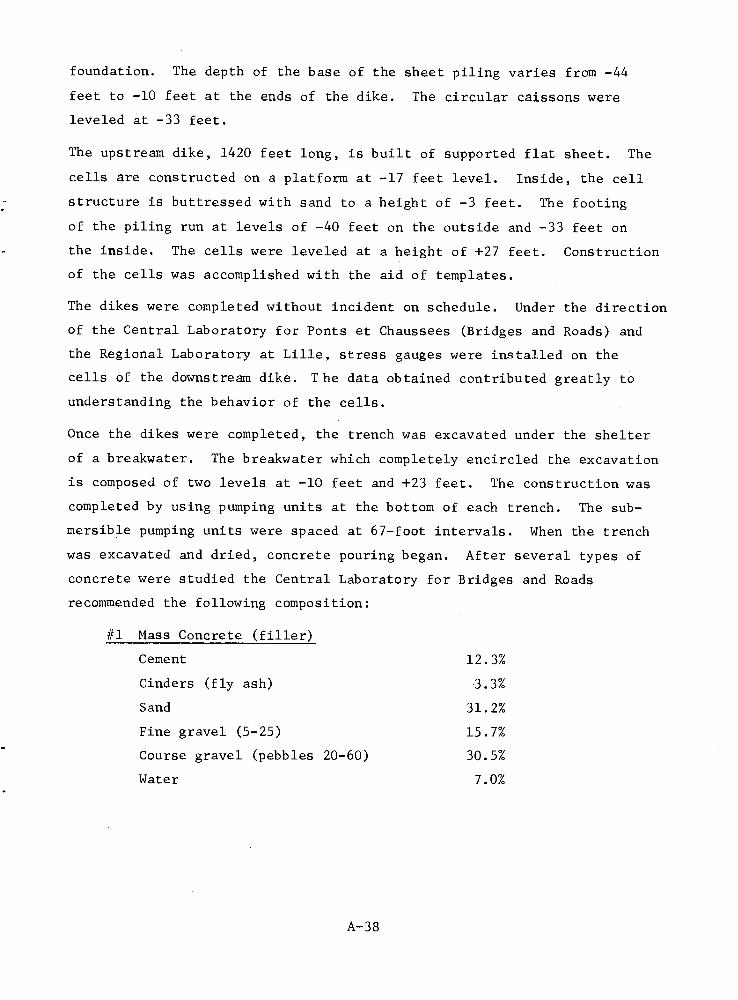
was excavated and dried, concrete pouring began. After several types of
concrete were studied the Central Laboratory for Bridges and Roads
recommended the following composition:
#1 Mass Concrete (filler)
Cement 12.3%
Cinders (fly ash) 3.3%
Sand 31.2%
Fine gravel (5-25) 15.7%
Course gravel (pebbles 20-60) 30.5%
Water 7.0%
A-38
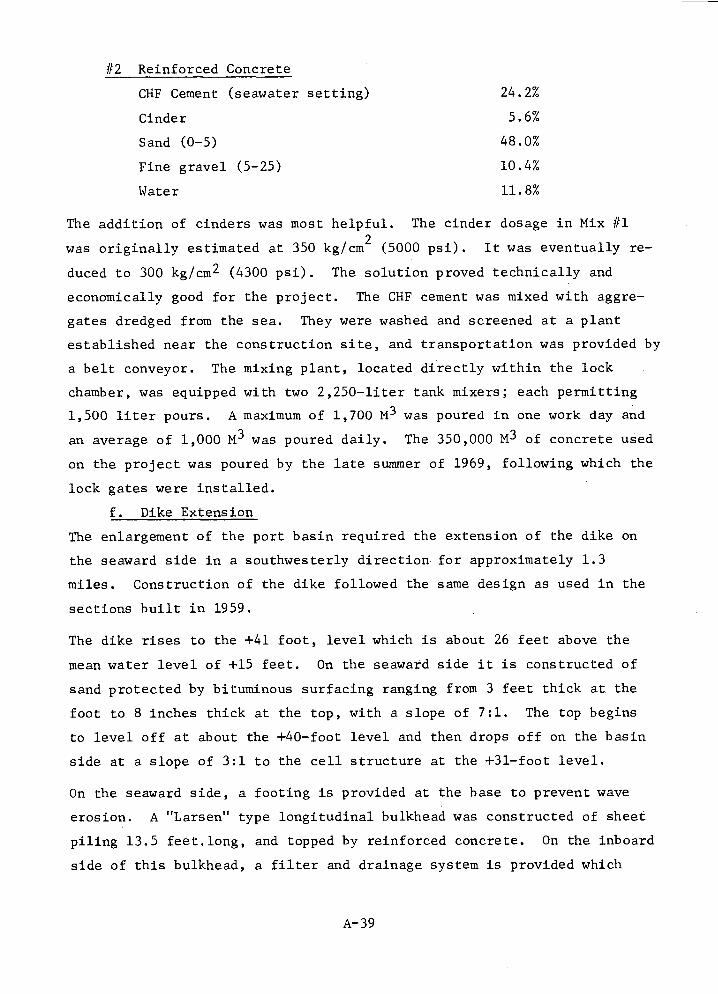
#2 Reinforced Concrete
CHF Cement (seawater setting) 24.2%
Cinder 5.6%
Sand (0-5) 48.0%
Fine gravel (5-25) 10.4%
Water 11.8%
The addition of cinders was most helpful. The cinder dosage in Mix #1
was originally estimated at 350 kg/cm2 (5000 psi). It was eventually re-
duced to 300 kg/cm 2 (4300 psi). The solution proved technically and
economically good for the project. The CHF cement was mixed with aggre-
gates dredged from the sea. They were washed and screened at a plant
established near the construction site, and transportation was provided by
a belt conveyor. The mixing plant, located directly within the lock
chamber, was equipped with two 2,250-liter tank mixers; each permitting
1,500 liter pours. A maximum of 1,700 M 3 was poured in one work day and
an average of 1,000 M 3 was poured daily. The 350,000 M 3 of concrete used
on the project was poured by the late summer of 1969, following which the
lock gates were installed.
f. Dike Extension
The enlargement of the port basin required the extension of the dike on
the seaward side in a southwesterly direction for approximately 1.3
miles. Construction of the dike followed the same design as used in the
sections built in 1959.
The dike rises to the +41 foot, level which is about 26 feet above the
mean water level of +15 feet. On the seaward side it is constructed of
sand protected by bituminous surfacing ranging from 3 feet thick at the
foot to 8 inches thick at the top, with a slope of 7:1. The top begins
to level off at about the +40-foot level and then drops off on the basin
side at a slope of 3:1 to the cell structure at the +31-foot level.
On the seaward side, a footing is provided at the base to prevent wave
erosion. A "Larsen" type longitudinal bulkhead was constructed of sheet
piling 13.5 feet.long, and topped by reinforced concrete. On the inboard
side of this bulkhead, a filter and drainage system is provided which
A-39
consists of precast reinforced concrete sections, a sand and gravel
filter medium, and covers of perforated concrete slabs. On the out-
board side, the sand was initially stabilized with brush mats which were
later covered with rock and bituminous filler. This part of the work
could only proceed at low tide.
On the inboard side of the dike, a cellular structure 43-feet wide was
constructed of sheet-piling metal. Transverse bulkheads spaced 49 feet
apart were put in place first, followed by the convex longitudinal
sections. The cells were then filled with sand and surfaced with
bitumen. The piling, which goes down to the -5 foot level (20 feet below
the water surface) was emplaced by jetting or vibrating. Further fill
is provided inboard of the cellular structure. The entire dike, from
the outboard bulkhead to the inboard side of the cellular structure is
approximately 270 feet thick.
The banks of the marine portion of the canal which enters the basin in
the southwest corner are built at a slope of 2:1. A rock-and-pile footing
is provided, and the bank is protected to a height of 13 feet by a
0.5-foot thickness of macadam over 0.66 feet of calcareous fill.
Above this level, topsoil to provide vegetation cover is used.
The requirements for formulation and application of the macadam surfacing
were considered most important. The final formulation consisted of:
Calcareous Gravel 8/16 40%
Calcareous Sand 0/3 35%
Beach Sand 23.5%
Calcareous Filler 1.5%
Bitumen 60/70 7%*
107.%
This composition provided the impermeability and high density required,
could be applied by bulldozers and equipment on pneumatic tires, and could
*Since the total exceeds 100%, it would appear that the bitumen percentage
was not included in the mix formula.
A-40
be surfaced by vibrating rollers. Particular care was taken at the joints
of the macadam and to prevent cracking due to contact with water or shifting
of the substructure.
g. Cargo Handling
Dunkirk has no unique cargo-handling equipment that would exceed that
normally found in any similar-sized U.S. port. There is 1,700,000 square
feet of one-story warehouse space, within which the various cargos are
handled by fork-lift trucks or similar mechanized equipment.
Commercial port dockside cranes can be classified as follows:
Electric Cranes
Electric Cranes
Electric Cranes
Electric Cranes
Diesel Cranes
Floating Boom Cranes -
39 of 3-ton capacity
84 of 6-ton capacity
13 of 10-ton capacity
3 of 15-ton capacity
2 of 7-ton capacity
2 of 50-ton capacity
The Port also has three floating cranes having maximum lift capabilities
of 30, 90, and 250 tons. The new ore and coal berths have a total of
five gantry cranes for ship unloading, including three Dravo 15 ton/second
gantry cranes and conveyors. In addition, two cranes (30 ton and 50 ton)
handle steel products for exports and Kangaroo cranes (10 tons every
30 seconds) handle phosphates. Re-export of ore by rail and barge works
well, but displeases the unions because it is too automated.
The Port has been slow in providing facilities for handling containerized
cargos, and containers were not even considered when Pier 6, one of the
most recently built general cargo piers, was constructed. It has since
been adapted to handle a limited number of containers and has a roll-on/
roll-off gangway. A 53-ton gantry crane handles containers, and the
installation of a second crane is under consideration. This is a temporary
facility, erected so that traffic would not be entirely lost to competing
ports, until a final facility is put into service in the new outer harbor
(1973-75).
A-41
The transfer of hydrocarbon products is handled entirely by French BP and
the cargo handling/transfer facilities are owned and operated by the
refinery.
h. Cost Data
Initial construction costs of the new developments included:
1) Bassin Maritime- USINOR-owned (quays excluded) $30 million, plus
1250 acres of industrial zone loaded to port industry,
2) New Projects-Outer harbor $90 million, connection to above Bassin
Maritime $90 million (dike, tidal basin, lock), tidal basins
and wet dock $72 million, industrial zone (5000 acres north
of RN 40) $54 million
The outside dredging is negligible, thanks to scouring by parallel
currents, after the initial "calibrating" dredging when the 55,000 DWT
pass was upgraded to 125,000 DWT. Some silting in the outer harbor
comes from the Watringues drainage system.
The new port will have two to three miles of oblique channel, now being
studied on the Chatou model, with results expected by the end of 1971.
Tenders for construction of the outer harber will come in by mid-1971.
i. Problems and Lessons
Better pre-planning was needed prior to Port expansion zoning and land
allocation.
The present trend of enticing plant manufacturing facilities to the
waterfront locations will invite water pollution problems, unless
pollution control planning is commenced immediately.
The Port Authority should concern themselves with in-plant water and air
pollution control as part of the leasing procedure.
Hydraulic modeling should decide the port configuration, rather than
designing the port and later using modeling to ascertain the design
effects.
Better cargo handling facilities are badly needed in the dockside warehouses.
Some salt-water intrusion has occurred from channel deepening. Remedial
methods are under consideration to control this condition.
A-42
The lock and basin construction methods appear quite advanced. Although
lock construction might not be needed in a U.S. port (other than possibly
in Maine)the methods and reduced construction costs might be utilized to
advantage in the U.S.
The trend is towards the leasing of quay surface to stevedoring companies,
as port dues are more profitable than cargo handling operations.
The ore gantry is equipped for transhipment, but cannot operate efficiently
as unloading is much quicker than loading.
A.1-6 Environmental Appraisal
Throughout our discussions with port representatives, it was continually
apparent that economic development had by far the highest priority, and that
environmental considerations in terms of such factors as short- and long-
range land use plans, water quality, air-pollution abatement, solid-waste
disposal, and recreational and conservation activities, were ranked very
low.
No officially recognized air pollution control and monitoring authority has
been established in the Dunkirk area, nor have any official emission stan-
dards been proposed or accepted. It is quite apparent that the community
depends primarily upon southwesterly breezes to carry most of the airborne
pollutants out to sea; this is indeed the case when winds are from the
correct direction. On the other hand, northerly winds are also common, and
these at best serve only to dilute the airborne pollutants from electrical
generating plants, the steel mill, and refinery operations.
As far as we could determine, there is no official concern about either
solids pollution, noise abatement, or visual pollution.
a. Water Quality
Control over water quality falls under the responsibility of the Agence
Financiere du Bassin de la Region du Nord. This Agency, set up about
2-1/2 to 3 years ago, has a staff of 12 and, up until the recent formation
of the new Ministry of Environment, was essentially autonomous. The
Agency's principal concern is with respect to the quality of water in
the rivers of the region involved. The region has been divided into
three zones or groups, ranked as follows on the basis of water quality:
A-43
Group 1 - Essentially the central part of the region out to the coastal areas
and especially concerned with surface waters fit for supply purposes; conventional
effluent treatment is required, including flocculation, filtration, and
chlorination or ozonation, with or without the use of activated carbon.
Group 2 - Primarily along the southern border of the region and much of
the northern area bordering on Belgium. This water is acceptable for use by
industry and occasionally for municipal water supplies.rlaste water must be
treated as in Group 1, and also stored for one month or injected into
the ground-water supply system.
Group 3 - Primarily in the Lens-Lille-Tourcoing area; the water is not fit
for municipal use but only for industrial cooling.
It is the purpose of the agency to either maintain, or in certain local
areas to improve rthe quality of water. This is to be achieved by working
with local authorities, appraising them of the need for improving water
quality, providing advice on the best way of accomplishing such an aim, and
by the imposition of an effluent tax:
Group 1 - 3 French francs (54Q U.S.) per year per person;
Group 2 - 2.4 French francs (43Q U.S.) per year per person;
Group 3 - 2 Grench francs (36Q U.S.) per year per person.
It is the intention of the agency that either municipal or industrial
effluents in the Group 1 inland areas should always be treated with primary
and secondary treatment plus lagooning. However, this is not always the
case at the present time because facilities are lacking. The effluent taxes
obtained by the agency are therefore used to meet the agency's financial
requirement in subsidizing the construction and operation of municipal
water-treatment facilities. Since the maximum tax of 3 French francs per
year is considerably less than the per capita cost of effectively treating
municipal effluents - estimated at 14 French francs per year - the agency
expects to use its funds in a progressive fashion, starting with those areas
that have the greatest need.
A-44
In addition to the three water-quality zones for the inland regions, water-
quality zones have also been set up along the coast. Coastal facilities --
whether municipal or industrial -- are presently not charged effluent fees.
This is particularly true with respect to heavily industrialized regions
such as Calais and Dunkirk, where no charges are planned because these
have been specified as major industrial areas. The Agency anticipates that
over the long run, if the growth of the coastal areas proceeds as planned,
effluent treatment may be required of industrial plants to provide a suffi-
cient water supply. However, since coastal industries did not pollute
inland rivers, they are at present essentially free to do whatever they wish.
Also, the Agency states that it does not yet know what pollution consti-
tutes damage to the marine environment and is therefore unable to set up a
rational effluent fee system.
b. Current and Potential Problems
1. Water
At present, Dunkirk obtains its water supply from inland fresh water sources.
Although we were unable to obtain specifics regarding water requirements in
Dunkirk during our short visit there, we were informed by the Port Author-
ity that no serious problem is anticipated regarding water supply for either
the municipalities involved or for industry in the near future. On the
other hand, it is expected that there may be increasing application of
recycle techniques, primarily for cooling water.
As far as can be ascertained, there is essentially no waste-water treatment
either by the industries in Dunkirk or by municipalities, and it is unlikely
that stringent waste-water treatment requirements will be imposed in the
near future, simply because the area falls within the zone of least priority
as set forth by the Agence Financiere du Bassin de la Region du Nord.
A major potential problem with the construction of the proposed new harbor
area between Dunkirk and Gravelines is that the water level in these new
harbors will be significantly higher than the surrounding land -- on the
order of 20 feet -- particularly at high tide, and will extend much further
inland -- up to 6 miles -- than the older installations. Therefore, there
A-45
is a real prospect of salt-water seepage from the new harbor into agricultural
or residential areas surrounding them. This possibility has been recognized
by both OREAM and the Dunkirk Port Authority, and studies are underway
regarding the possible effect of these new basins on the fresh/salt-water
interface inland and whether salt contamination will become a problem.
We were informed that no baseline studies as such have been made by which the
effect of Dunkirk port development on the marine environment can be
evaluated. Although modest compared to Boulogne, Dunkirk is a fishing
port -- 814,000 tons of fish were handled in 1969 -- and because of this
one would think that some investigation would have been made along the
immediate shoreline. However, we were informed that the majority
of fishing is done "well off" the immediate coastline and that therefore --
aside from any major catastrophe such as a large oil spill -- no serious
effects are expected.
Although no major oil spills were known to have occurred in Dunkirk
Harbor or immediately outside the Port, oil is considered to be the
main pollutant and an anti-pollution task force is being formed. During
a tour of the harbor, oil "rainbows" were seen fairly frequently in the
tidal basin. The British Petroleum (BP) loading/unloading facility has an
oil spill containment boom, a vacuum recovery barge, and a bubble-curtain
mechanism. The Port Authority could not provide any engineering details
on the characteristics of the oil-spill containment and clean-up equipment;
neither did they know what diking procedures were used around the refinery's
bulk storage tanks to contain spills should they occur from a storage source
(only a few tanks appear to have dikes).
Bilge pumping and deballasting of ships in the basin itself is forbidden;
however no onshore waste-water pumping facilities have been provided.
Presumably, major companies such as British Petroleum are more likely to
refrain from overt ballast or bilge discharging, but this cannot be said
to apply to smaller independent companies.
Rainwater runoff from open storage piles of coal, iron ore and phosphate
is allowed to flow directly into the locked ship basins or into temporary
storage moats along the quay. Iron ore and coal may fall into the basin
A-46
during handling, requiring occasional dredging (every few years) alongside
the quays to maintain the necessary water depth. This situation is not pre-
sently considered a problem, and the volumes of such discharges are unknown.
In a related sense, the "red muds" (Boues Rouges) of Pechiney's alumina
plant may constitute a major problem when the alumina facility is built in
about three years. Red mud discharges could amount to approximately
two million tons per year of waste having a 30% solids content. Investiga-
tions are currently underway to develop economical methods of limiting these
discharges or of treating the muds before they are discharged.
The state-owned electrical-power-generating plant (EDF) is presently
located outside the main harbor area, but another plant will be located
within the proposed new port limits. Thermal pollution may become a
problem from this plant by virtue of its discharging cooling water on a
once-through basis. On the other hand, because of the already polluted
nature of the basin, warm water discharges may not be too significant a
problem.
2. Air
The open stockpiling of coal and iron ore on the docksides creates an air
pollution problem when the fines are windblown. However, because of the
generally rainy weather, this ordinarily results in more of a water pollution
problem than an air pollution problem regarding nearby residential or
commercial areas. Thus far, there are no air pollution control regulations
in the Dunkirk area. Problems are being recognized, however, in connection
with the USINOR steel mill effluents and those from the electrical genera-
tion plant. Although we were unable to confirm this, we suspect that there
are relatively few air pollution control procedures in effect at British
Petroleum's refinery, either in terms of particulate, gaseous, or odor
control. During our field trip; through the area, hydrogen sulfide odors
were quite noticeable, as were smoke plumes from several stacks within the
refinery property (but refinery employees, who live in a compound close-
by never complain...).
A-47
To at least some degree, air pollutants are blown out to sea because of
the southwesterly winds. However, westerly breezes will adversely affect
the greater Dunkirk area, and offshore winds the inland regions. Here
again, however, it does not appear that stringent pollution-control regula-
tions are likely to be imposed within the near future because of the
overriding concern regarding attraction of new industries to Dunkirk, and
the coast and wind.
3. Solid Wastes, Dredging, etc.
Aside from the occasional dredging of spilled ore and coal, and some
silt from the drainage canal in the east, there has been no maintenance
dredging required in the inner portion of the old Dunkirk Harbor; nor
has maintenance dredging been required in the main entrance channel where
the bottom (at a depth of minus 45 feet) is comprised of silt and sand
various grain sizes.
Aside from the dredging required during construction, the use of the new
locks in the Bassin Maritime has resulted in the need for continuous
dredge maintenance to maintain the desired channel depth; spoils from this
operation are dumped at sea in an area some six miles offshore.
The new lock-free harbor under consideration some eight miles west of
the existing harbor will require considerable construction dredging, as
well as an extensive maintenance program to maintain the required depth.
Wave and current studies are largely completed, while sedimentation and
long-shore drift studies continue on the two hydraulic models. It has
been decided from model studies that the new channel can be angled to
reduce channel silting caused by shoreside currents, which are twice as
strong in a westerly direction than the eastward tidal currents.
Hydraulic studies were of first priority, because an evaluation of the
shape and magnitude of any currents from waves inside the breakwater
area would affect such factors as shipbearing, speed, timing of entry,
and degree of assistance required by approaching and departing ships.
A-48
As previously indicated, sedimentation studies are still underway with
about a year to go. These studies will, among other things, indicate the
influence of the new harbor design on coastal configuration, particularly
between Gravelines and Dunkirk. It is the Port Authority's tentative
opinion that, based upon historical performance, maintenance dredging of
the new channel should not be prohibitively expensive and-further that the
coastline should not be insignificantly altered. (We were told that even
if changes occurred in the shoreline as a result of breakwater construction,
there would be little negative impact on the environment, since the Grave-
lines-Dunkirk area, as well as that between the new harbor and the old
Dunkirk Harbor, are not recreational or conservation sites.)
The total volume of material to be dredged for the new harbor area is
estimated to be approximately 120 million cubic yards--42 million in
the turning basin, 60,000,000 in the new channel, and 18,000,000 in the dock
areas. All spoil on the seaward side of the new jetty is expected to be
used for fill or beach building in an area planned for the construction of
a nuclear power plant. Alternatively, spoil may be dumped in one of
several fairly deep channels about three miles offshore, such that dumping
would not interfere with any shipping and (it was claimed) should have no
adverse affect on fish breeding areas.
During our stay in Dunkirk,we learned nothing about solid waste disposal
methods as practiced by the municipality, other than being told open dump-
ing and burning in preselected areas was practiced.
4. Noise
This is generally not recognized as a significant problem, particularly
insofar as industrial noise effect on residential areas is concerned.
Over time, excessive noise related to general problems of overcrowding,
construction activity, and repair, may become more significant.
5. Land Use
It appears that the principal locus of planning regarding the Dunkirk-Calais
area originated and still exists in the OREAM Nord which cooperates with
appropriate city planning agencies -- primarily in Dunkirk and Calais --
the Harbor Authority, Ministry of Equipment, and other agencies.
A-49
It is also quite apparent as pointed out in greater detail Section IV of our
main report, that the Dunkirk Port Development project is an attempt by
the national government to revitalize the northern industrial
area by concentrating a heavy industrial zone in Dunkirk and use the excess
labor available in the region. An equally important and longer-range
objective is to enlarge Dunkirk to the point where it can serve not only
northwestern France, but also portions of The Netherlands, Belgium, and
Germany, thereby placing France in an excellent position to play an even
larger role in the Common Market.
Though perhaps coincidental, it is interesting to note that the 25-mile
stretch of coastline between Dunkirk and Calais - up to 6 miles deep -
offers about the same acreage as in the Rotterdam Port area; which suggests
the scope of the OREAM planning effort. Between Gravelines and Dunkirk,
the total expansion area includes facilities already developed in several
communities - notably Fort Mardyck, Grande Synthe, Petit Synthe, St. Pol
sur Mer, Loon Plage, and Les Huttes.
In addition to what will amount to virtual absorption of several communities
over time, planning for the Dunkirk-Calais region has been largely tech-
nical in nature (as opposed to environmental). That is, land requirements
for primary and secondary industry were carefully assessed (and industries
identified) which would be valuable to the region in terms of employment
opportunities and as bases upon which to build a broad integrated industrial
complex. However, the various planning agencies involved (mostly govern-
mental) do not appear to have analyzed sufficiently certain problems in
the immediate area, such as need for a "green belts," recreational oppor-
tunities, shopping centers, and population relocation in addition to
housing and infrastructure.
With respect to population relocation, Mardyck, for example, with a
population of 350 inhabitants in 1960-1964, resisted the industrialization
plan and elected to remain as a town. The population is now 250, and when
the industrialization zone is finished, the town will be 13 feet lower
than its surrounding area. Ultimately, the town will disappear, but
probably without the necessary arrangements being made with the inhabitants
A-50
who have to move. Similarly,Loon Plage, with approximately 2500 inhabi-
tants, is expected to be surrounded by a new 5000-hectare (12,500 acres)
industrial extension and become an undesirable place in which to live.
On a longer-term basis, even though Gravelines and Fort Philippe have
been identified as "green belt" areas, there appears to be real danger of
Gravelines being squeezed out of existence. This is primarily because,
when the cooperative effort between Dunkirk and Calais was set up, Grave-
lines was excluded. Furthermore, if industrialization proceeds as planned
over the next one or two decades, Gravelines itself will probably become
badly polluted, unless strong measures to prevent such an occurrence are
taken. This, plus the possibility of future demand for existing water
frontage, would seem to seriously threaten the town's existence.
Up to the present time, another major problem has been the securing of
adequate financial resources to purchase the required land and land
reserves necessary for the port and industrial zone. In relation to this,
too little attention was given in earlier planning stages to the allotment
of frontage to industrial "customers" -- primarily USINOR -- which in the
view of many officials now occupies far too much frontage land. The
steel plant was located over ten years ago - well in advance of any
national planning regarding port development - and the present land which
is owned by USINOR could be more economically applied to commercial purposes,
with the steel plant being located further west of its present site and with
a narrower frontage.
c. Future Issues
With the continued development of the Dunkirk-Calais area, hastened by the
soon-to-begin construction of the Pechiney alumina facility, Dunkirk will
face several issues; among which the most important are the following:
• The rapid growth of Dunkirk and Calais will bring lodging,
sociological, land zoning, and pollution problems.
• The ultimate justification of the port will depend in large measure
upon the size of the interior it can serve; this inland area will
have to extend beyond France's boundaries, and its importance to
Dunkirk is in many respects a guess.
A-51
• Communications and infrastructure will have to be rapidly improved.
• Development of the seashore and of the immediate interior will have
to go through careful selection of industry and its location
in terms of their effect upon this environment and the contribution
they can make to employment quantity and quality.
• Policies will have to be better coordinated between the towns
involved in the development, along with closer ties to the various
Ministries.
A-52
A-2 LE HAVRE
A.2.1 Summary
The Port of Le Havre started its development in 1517 under King Francois I,
and was both a naval military base and a trade center until about the
18th Century, when it developed into strictly a commercial port, including
passenger traffic.
Le Havre was 85% destroyed during World War II, and reconstruction was
completed only in 1960. Progressive widening, deepening, and construction
allowed the port to keep pace with maritime developments, and until about
1960, it was able to operate effectively, meeting the requirements of
most vessels. It appears to be an almost universal opinion that Le Havre
is about the best natural port the French have and is well situated to
serve the densely populated area along the Seine River, up to and includ-
ing Paris.
The second French port after Marseilles for total volume, Le Havre is the
first harbor in France for long-haul traffic. Out of 150 regular lines
serving the harbor, only 30 are coastal shipping lines. The harbor
function is primarily to accommodate big vessels--oil tankers up to
260,000 DWT and bulk carriers up to 90,000 DWT. Le Havre is also the
first French harbor for passenger traffic towards America, receiving
regularly "France" and "Queen Elizabeth II."
A literature survey and interviews with the Port Director and various
officials from the Port Management, the CFR refinery, and citizens con-
cerned with their environment, yielded the material contained in this
section.
A.2.2 Area Description
a. Geography
Located in the estuary of the navigable Seine River, Le Havre serves the
Paris basin. Its position as the westernmost major port on the conti-
nent of Europe (i.e., closest to the deep Atlantic) has become less
viable as ships grow in size and draft, and the Dover Straits become
A-53
congested. One-hundred-foot depth is available, five nautical miles
off Antifer in the north, and 12 nautical miles off Le Havre in the
west.
b. Geology
There is a marked difference between the high chalk cliffs of the north
side (Cretaceous) and the sandy south coast of the Seine estuary that
has clay outcrops of Jurassic age. The bay bottom was investigated in
the late 1960's, with three passes of high-definition, electro-seismic
sparker tests (IFP process) on a kilometric grid (1300 km) and coring
on the two sites, Parfond and Antifer, contemplated for the offshore
island. From west to east the substrate consists of: interbedded
limestones, and clays of Jurassic age, topped by Lower Cretaceous
green sands. Unconsolidated sediments include: bottom gravel (23 to 40
feet thick at 93 to 103 feet deep) with sandy cement; grey organic silt
(very fine 5 to 50 microns, from 80 to 93 feet); and coarse or fine sands
which make dunes in the river bed. To the north-northeast, towards An-
tifer, the sediment thickness decreases quickly to a foot or less.
Aquifers exist between Le Havre and Rouen which formerly carried fresh
water. These sands are already salty in Le Havre because of previous
salt-water intrusion; the precise cause of this intrusion is somewhat con-
jectural, but is probably at least in part related to the deepening
of the Seine estuary.
A recreational beach is located just north of the harbor entrance proper
and in front of the town. Other recreational areas include Deauville,
several miles south of the town. The latter was said to be in danger of
pollution from the harbor and outwash from the Seine River itself. Bot-
tom conditions in the harbor are essentially sandy and the material is
said to be easily dredged.
A-54
c. Tides and Currents, Sea State
An average 74 coefficient tide gives an additional water height of six
feet to 24 feet above chart soundings. Tidal currents reaching 2 knots
near and parallel to the shore, reverse themselves depending upon tidal
conditions, with a northeastward component being the stronger of the two.
Around Antifer, currents are also alternating southwest-northeast, with
a maximum intensity of 3 knots at spring and 2 knots in neap tide.
Swells follow the wind direction, are highest to the northwest. Significant
height could reach 20 feet in ten years (25-foot maximum height) and 29
feet in 100 years.
d. Climate
Fog is not too serious a problem, because visibility is over two miles
85% of the time, over one mile 90%, over 0.5 mile 96%. Winds are variable,
but prevail from the southwest quadrant (30%), northeast 28%, and northeast
25%, and the temperature ranges from approximately 10°F in winter
to a high of 97°F in summer. Breezy or windy days are common in Le Havre;
calm days occur only about 6% of the time (speed less than 4-1/2 mph),
while winds between 4-1/2 and 34 mph occur 87% of the time.
A.2.3 Demography and Land Use
A city of 250,000 inhabitants, Le Havre is located at the mouth of the
Seine Valley and serves the 3 million inhabitants of the Paris basin
within a radius of 120 miles.
Natural and artificial filling behind dikes has provided 1055 acres of
tidal basins, 330 acres of locked wet docks and 25,000 acres of indus-
trial land in the estuary. As industry could only expand eastward
along the estuary, the residential districts are generally well separated
from the upwind industrialized area.
The high hills which constrict Le Havre urban expansion are opened by
the Lezarde Valley which provides future expansion possibilities, some-
what less protected from industrial air pollution than the current town.
Further upstream, a series of industrial terminals, separated by green-
belts, lead into the river port of Rouen, about 100 km (60 miles) inland.
A-55
A.2.4 Management and Financing
Like Dunkirk, Le Havre is one of seven "Port Autonomes" which France has
freed from municipal ties since 1925. Local government and interests
(Chamber of Commerce) are only represented in the Board. The port
facility is controlled by the Ministry of Finance and the Ministry of
Equipment, both of which have regional departments. On a regional
basis, the most important planning institution is OREAM, which concerns
itself with the long-range development of the Lower Seine Valley region.
The Law of 29 June 1965 increased the State financial participation in
port operations. All autonomous ports benefit from government aid in
the building of the infrastructure and in the dredging necessary outside
the port. The State is entirely responsible for the maintenance of the
maritime approach channels, the sea walls, the outer harbor, and the
access locks from the sea. It also pays for the operation of these
locks.
As regards capital expenditure for such items and also the excavation of
docks, the State contributes 80% while the Port pays 20%. For quays,
quay walls, and dry docks, the State pays 60%. The State also contributes
to the cost of servicing loans obtained by the port in the past for
carrying out such works. The amount of such contributions increases the
cost borne by the State from the 50% of the pre-autonomy days to the
rates of 80% and 60% now current. For the superstructure, however (that
is to say cranes, sheds and warehouses), there is no assistance from the
State.
The Port Autonome at Le Havre pays no taxes to the city of Le Havre for
services which the port area needs (i.e., firefighting, etc.). There
is one man from the Le Havre City Council who sits on the Board of the
Port.
Major taxes accruing from industries located in the Le Havre industrial
zone are primarily going to small communities adjacent to the zone. The
city of Le Havre believes that it is not getting a sufficient share of
this tax revenue to finance the community services which it must provide
to the industrial zone. This could potentially be a significant problem
unless it is resolved. A-56
A.2.5 Economic Appraisal
a. Commodity Flows
Table A-4 illustrates the variety of commodities flowing through Le Havre,
with a total tonnage growing from 16.6 million tons in 1960 to 50.4
million tons in 1969. Petroleum is the major commodity by far, and in-
creased its share of total export and import tonnage, from 77% in 1960, to
80% in 1965, and 85% in 1969, a total of 51 million tons. The petroleum
annual growth rate increased from 12% in the first 5 years to 18% in the
second half of the decade. Coal, cereals, and chemicals come next,
growing respectively to 1.4, 0.6, and 0.4 million tons in 1969; while
wood, rubber, metallic ores, and manufactured products have a rather static
volume aggregating about 1 million tons per year.
Table A-5 and A-6 separate exports from imports, with exports showing
better growth in the second half of the decade than in the first, and
(in 1969) accounting for 17% of the cargo tonnage handled. Petroleum
and cereals account for most of the export tonnage.
b. Petroleum Products and Pipelines
The largest part of LeHavre's petroleum products storage belongs to
C.I.M.* which has a capacity of 15 million bbls. (58 tanks for crude oil con-
taining 14.2 MM bbls. and 45 tanks for white products containing 0
850,000 bbl). Eight refineries (24% of France's capacity) receive crude
oil directly from the C.I.M.'s storage. These are:
• C.F.R.'s Gonfreville refinery (325,000 bbl/d) at a distance
of approximately six miles, 2 pipelines (150,000 and
1,200,000 bbl/d capacity);
• Esso's Port Jerome refinery (150,000 bbl/d) at a distance
of approximately 22 miles, 3 pipelines (450,000 bbl/d);
*Compagnie Industrielle Maritime
A-57
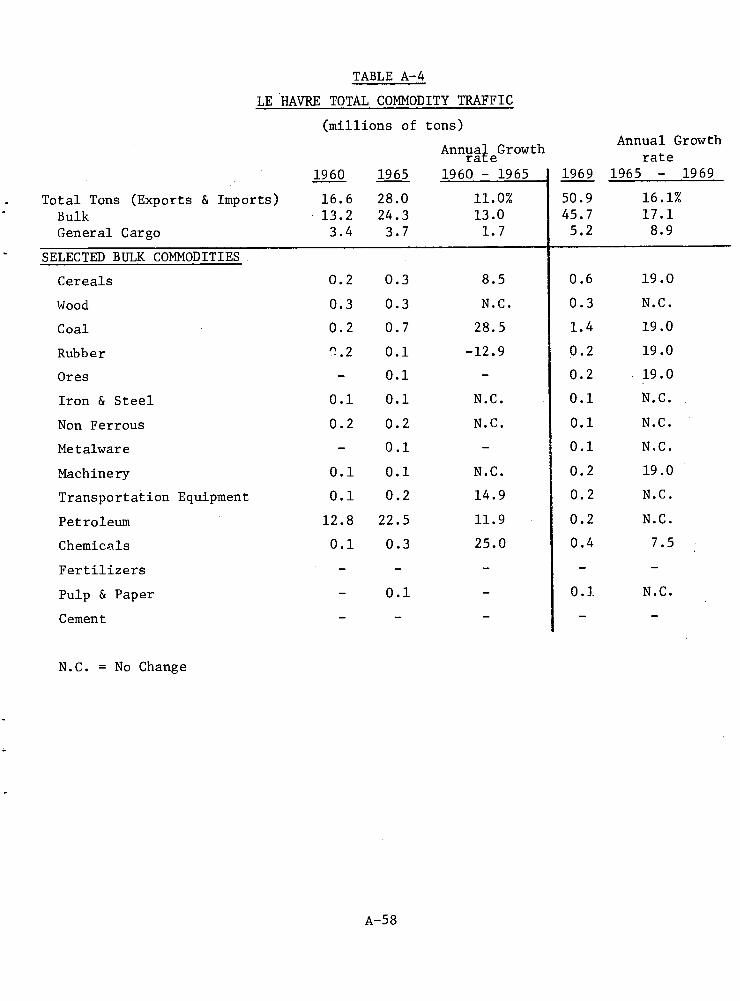
TABLE A-4
LE HAVRE TOTAL COMMODITY TRAFFIC
(millions of tons) Annual Growth
Annual e rate
1960 1965 1960 - 1965 1969 1965 - 1969
Total Tons (Exports & Imports) 16.6 28.0 11.0% 50.9 16.1% Bulk 13.2 24.3 13.0 45.7 17.1 General Cargo 3.4 3.7 1.7 5.2 8.9
SELECTED BULK COMMODITIES
Cereals 0.2 0.3 8.5 0.6 19.0
Wood 0.3 0.3 N.C. 0.3 N.C.
Coal 0.2 0.7 28.5 1.4 19.0
Rubber ^.2 0.1 -12.9 0.2 19.0
Ores - 0.1 - 0.2 19.0
Iron & Steel 0.1 0.1 N.C. 0.1 N.C.
Non Ferrous 0.2 0.2 N.C. 0.1 N.C.
Metalware - 0.1 - 0.1 N.C.
Machinery 0.1 0.1 N.C. 0.2 19.0
Transportation Equipment 0.1 0.2 14.9 0.2 N.C.
Petroleum 12.8 22.5 11.9 0.2 N.C.
Chemicals 0.1 0.3 25.0 0.4 7.5
Fertilizers - - - - -
Pulp & Paper - 0.1 - 0.1 N.C.
Cement - a
N.C. = No Change
A-58
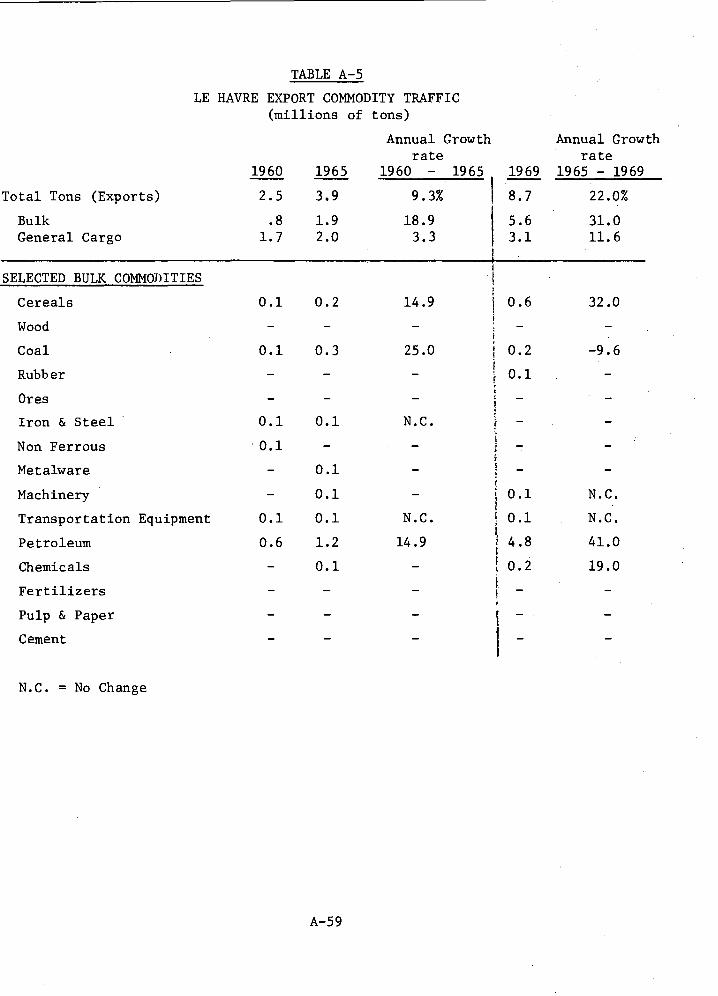
18.9 3.3
5.6 31.0 3.1 11.6
0.6
0.2
0.1
0.1 N.C.
0.1 N.C.
4.8 41.0
0.2 19.0
32.0
-9.6
Fertilizers
Pulp & Paper
Cement
Total Tons (Exports)
TABLE A-5
LE HAVRE EXPORT COMMODITY TRAFFIC (millions of tons)
Annual Growth Annual Growth rate rate
1960 1965 1960 - 1965 1969 1965 - 1969
2.5 3.9 9.3% 8.7 22.0%
Bulk .8 1.9 General Cargo 1.7 2.0
SELECTED BULK COMMObITIES
Cereals 0.1 0.2 14.9
Wood - - -
Coal 0.1 0.3 25.0
Rubber - - -
Ores - - -
Iron & Steel 0.1 0.1 N.C.
Non Ferrous 0.1 - _
Metalware - 0.1 -
Machinery - 0.1 -
Transportation Equipment 0.1 0.1 N.C.
Petroleum 0.6 1.2 14.9
Chemicals - 0.1
N.C. = No Change
A-59
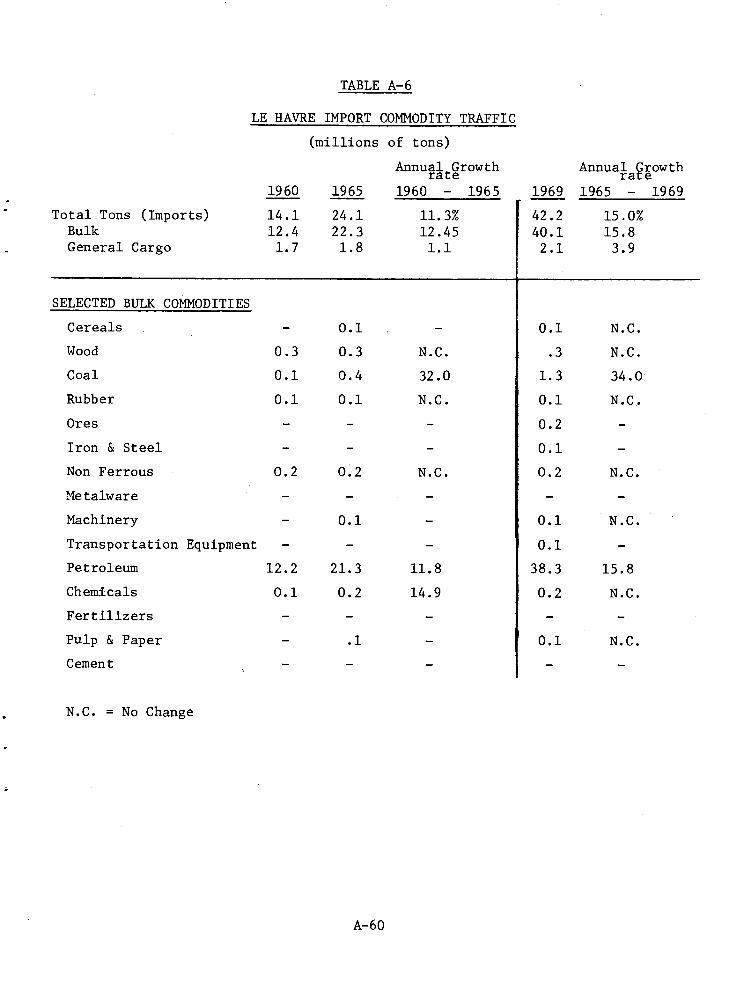
Annual Growth E
1965 - 1969
15.0% 15.8 3.9
1969
42.2 40.1 2.1
0.1
0.3 0.3
0.1 0.4
0.1 0.1
-
N.C.
32.0
N.C.
N.C.
N.C.
34.0
N.C.
-
N.C.
11.8
14.9
N.C.
N.C.
15.8
N.C.
0.1 N.C.
0.1
.3
1.3
0.1
0.2
0.1
0.2
0.1
0.1
38.3
0.2
0.2
12.2
0.1
0.2
0.1
21.3
0.2
-
.1
TABLE A-6
LE HAVRE IMPORT COMMODITY TRAFFIC
(millions of tons)
Annual Growth rate
1960 1965 1960 - 1965
Total Tons (Imports) 14.1 24.1 11.3% Bulk 12.4 22.3 12.45 General Cargo 1.7 1.8 1.1
SELECTED BULK COMMODITIES
Cereals
Wood
Coal
Rubber
Ores
Iron & Steel
Non Ferrous
Metalware
Machinery
Transportation Equipment
Petroleum
Chemicals
Fertilizers
Pulp & Paper
Cement
N.C. = No Change
A-60
• Mobil's Notre Dame de Gravenchon refinery (78,300 bbl/d)
at a distance of approximately 22 miles, 2 pipelines,
one is shared with Shell (255,000 bbl/d);
• The Shell Petit-Couronne refinery (189,000 bbl/d) at a
distance of 50 miles, 2 pipes, one shared with Mobil
(255,000 bbl/d);
• The Elf-Union's Grandpuit refinery (75,000 bbl/d) at a
distance of 155 miles and the Porcheville refinery
(70,000 bbl/d) at a distance of 62 miles, one pipeline
(210,000 bbl/d);
• B.P.'s Vernon refinery (80,000 bbl/d) presently uses the
same pipeline as Elf-Union; and
• Antar's Valenciennes refinery anticipates a flow rate of
78,000 bbl/d.
The total crude-oil transportation capacity to the refineries presently
amounts to 1,300,000 bbl/d for all nine pipelines, excluding C.F.R.'s
direct connection. Natural gas (Algerian LNG transported by the
"Jules Verne," and gasified at the methane terminal of the harbor) is
sent by pipeline to the Gaz de France underground storage in Beynes).
Transportation of refined petroleum products is done by the Trapil pipe-
line towards the Paris region and secondarily to Le Havre by a triple
pipeline grid. The Trapil pipeline system was completed at the end of
1968:
Le Havre-Rouen-Grigny 154 miles 10"
Gonfreville-St. Ouen 100 miles 12"
Gonfreville-Gennevilliers 100 miles 20"
Grandpuits-Grigny 28 miles 12"
In the tonnage transported to the Paris region in 1967, domestic fuel
oil had first place with 2.5 million tons, followed by gasoline with
almost 2 million tons (out of a total of 6.2 million tons) or twice the
amount transported in 1963, and three times the amount transported in
1957.
A-61
In addition, product and coastal tankers can be loaded at four berths
and barges (3000 tons) at three berths. C.I.M. finally has a 100-tank
wagon spurline and a ramp for simultaneous loading of two large trucks.
In 1968, total traffic with the interior was distributed as follows
between four modes of transport (million tons):
Exports Imports
Road 19.9 2.2
1611 16.2 1.7
Water 25.8 1.8
Pipelines 94.3 38.1
c. Containers
After a just period of stagnation in the early 1960's, general cargo is
showing some growth, up to 11.6% of export volume. The amount of
containerized cargo handled through the port has increased from 58,000
tons in 1966 to 679,000 tons in 1969, while the number of roll-on/
roll-off vehicles increased nearly ten-fold from 3,700 vehicles five
years ago to approximately 36,000 presently.
Le Havre considers itself, to be the French capital for containers, and to
this end it is building a 2,500-foot quay together with a roll-on/
roll-off link span and a 30-acre stacking area to handle three container
ships simultaneously. In addition, there is to be a 100,000 square
foot shed devoted to the purpose of filling and emptying containers.
There are plans to eventually build a new container harbor, capable of
handling a yearly traffic of up to 16,000,000 tons of merchandise per
year, along the central canal. However, the French ports of Le Havre
and Rouen are hardly a serious threat to the Belgium/Dutch ports for
container traffic. The distances are against the French, as are their
lack of major tradition in all the important port activities of shipping,
brokering, and forwarding upon which the vitality of ports like
Antwerp and Rotterdam depends. The transit traffic which Le Havre is
able to secure from Central European countries like Switzerland is
marginal.
A-62
d. Industrialization
Industrial acreage in Le Havre is located essentially between the canal
du Havre a Tancarville and the estuary (Figure A-5). It is distributed
as follows:
Space Occupied by Enterprises
Clear Available Surface
Clear Equipped Available Surface
Extension Surface
2,865 acres
6,649 acres
1,870 acres
8,200 acres
Total 19,584 acres
About 18,000 acres are in reserve between the harbor and the Tancarville
Bridge.
Table A-7 indicates the enterprises located in the Le Havre industrial
zones as of 1970. Several new industrial projects are under way includ-
ing the construction of a power plant which will produce 3,250,000 KW
and use 25,000 tons/day of coal.
The main beneficiaries of the development of the deepwater port at
Le Havre are the manufacturing industries which settle in the industrial
zone and rely upon imported raw materials. There will be no major
governmental incentive offered to industries for location in Le Havre,
since it is classified as a major deepwater port, with inherent
advantages. There is a small tax incentive given by the city of Le Havre
to industries that settle in the light manufacturing area.
Land in the industrial zone is and will be leased to the user industries
rather than sold. There have been exceptions to this rule for Goodyear
Corporation and Renault who both purchased land, as they would not settle
in Le Havre unless they did have a title to the land which they were
using. The leases normally run for 50 years with extension clauses. It
is also a policy of the industrial development plan that only industries
which can prove that they must have access to deepwater facilities will
be allowed into the industrial zone. Those industries which do not neces-
sarily have to have prime industrial sites on the water will be able to
locate in a large industrial zone outside of the port on a plateau above
Le Havre.
A-63
e. Regional Development
The development of Le Havre harbor is a major part of a national scheme
of regionalization to decentralize the Paris region. But the transfer
of activities from Paris to the Lower Seine Valley will be performed in
such a way that the industrialization in the Lower Seine will be "self-
contained" and not dependent on the development of Paris. This means
that the decentralization will take place over a broad range of complementary
activities.
Independence will, on the other hand, not mean isolation of the Lower
Seine Valley from Paris. Industrialization in the Lower Seine Valley
is planned in such a way that Paris will have to rely on certain acti-
vities of the Valley.
In addition, the development of the Lower Seine Valley seeks to achieve
a large industrial and harbor complex capable of competing with the
foreign harbors of the North Sea.
Between Le Havre and the "green belt" on the east, more than 25,000 acres
of alluvial lands are available. The urban development in Le Havre will
take place towards the northeast, around the Lezarde Valley, a site well
protected from the wind and connected to Le Havre by railroads. Popula-
tion should double to 500,000 people.
Additional urbanization will take place on the South Bank of the Seine
although hampered by the high toll of the Tancarville Bridge. In 1985,
the capacity of this bridge will be insufficient and a new bridge will
be located closer to Le Havre to better integrate the city.
The need for additional land for the development of industry in the
harbor seems to exceed the present land availability. Additional land
on the South Bank, east of Honfleur is set aside for industrial develop-
ment. But studies should be undertaken on the possibility of negative
effects on the maintenance of the access channel caused by industriali-
zation. Similarly, the development over 100 miles "upstream," through
Rouen to Mantes, with a new town at Le Vandreuil, has been studied for the
1985-2000 period.
A-64
Already the second, and fastest growing port of France, with access to
250,000 ships, the port of Le Havre has ambitious plans which require
spending over $236 million, a large part during the period of the Sixth
Plan, which will run from 1971 to 1976. The objective of the port
authority is to make Le Havre into a modern port, with an associated
deepwater industrial zone capable of handling vessels considerably larger
than those now docking at Antwerp and Rotterdam. Officials of the Port
Authority believe that the saturation of Antwerp and Rotterdam over the
next decade will give Le Havre the opportunity to close the gap. The
project to be undertaken provides for the development of a vast deepwater
industrial zone, the adaptation of the port to new transportation tech-
niques such as containerization and barge carrying and roll-on/roll-off
methods, the modernization of existing installations, the creation of a
major ship-repairing center, and the building of an artificial island--
to receive the future generation of supertankers (500,000 to 1,000,000 DWT)--
and related land facilities.
Two important development projects have to be carried out; the first one,
which is already very advanced, consists of the eastward extension of the
harbor toward the alluvial plain; the other consists of deepening the
approaches and the Tidal Basin, building new oil wharfs, and developing
unloading installations and crude oil storage.
Extension Toward the East of the Industrial Zone (Figure A-5)
To connect the alluvial plain that stretches east of Le Havre harbor to
the existing installations, the whole extension zone had to be protected
by a closed sea wall, behind which new platforms and new basis are con-
structed. The developments are:
- The new "Bassin de Mare" (Tidal Basin) with a 300-acre
surface, the bottom of which has been deepened from 37
feet to 50 feet in 1970;
- A constant-level basin, called South-East Basin, with
a 130-acre surface, and 15-foot depth;
A-65
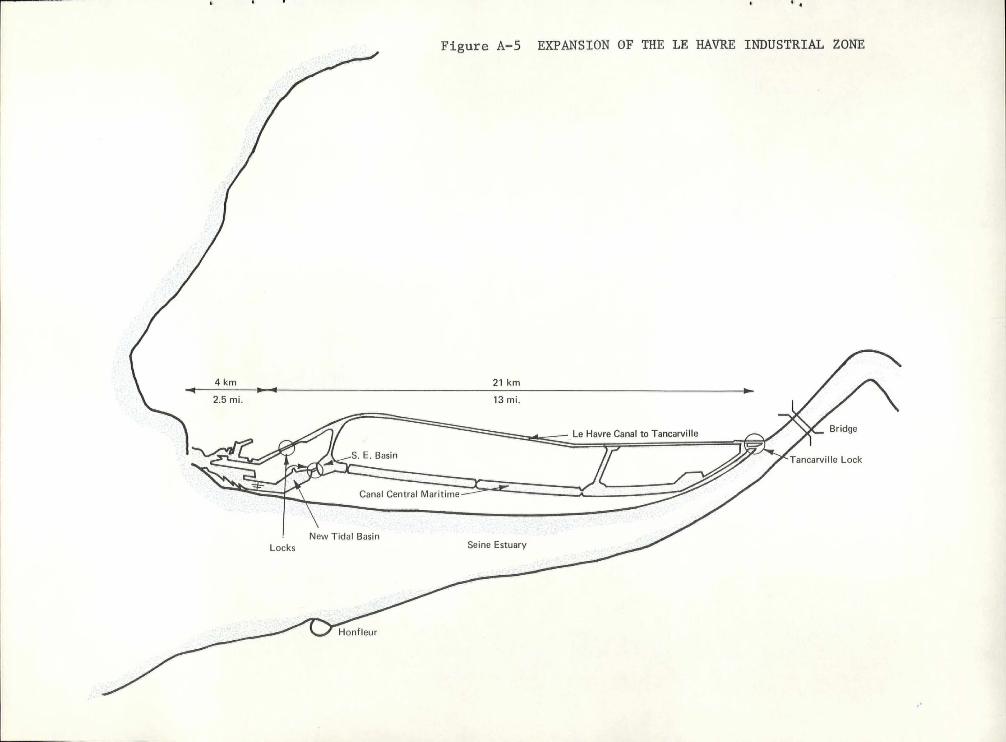
ow, Le Havre Canal to Tancarville •••■ Bridge
Tancarville Lock
4,
almil#04 gifil eggir=ima
New Tidal Basin
Honfleur
Locks Seine Estuary
4 km 21 km
2.5 mi. 13 mi.
Figure A-5 EXPANSION OF THE LE HAVRE INDUSTRIAL ZONE
- A group of three locks that will connect the "Bassin de Maree"
with the constant-level basin. The first of these locks is
being built, with a 222-foot beam and 47-depth; it will allow
the passage of 200,000 DWT ships.
A junction canal, 4000 feet long and 670 feet wide, connects the South-
East Basin to the Tancarville canal in the north. A Central Maritime
Canal, 1260 feet wide, implanted in the alluvial plain and on the banks
of which waterfront industries are developing, is already being dug to a
6 miles length (with a width reduced to 400 feet) at a level of -7.3
feet in a first phase.
The basic infrastructure will of course be completed according to traffic
development, by new railroad and road connections and by docking berths.
For example, on its north bank, the new Bassin de Maree made room, in
1968, for a wharf, particularly organized to welcome vehicle carriers and
container ships. The south bank will be reserved for the development of
the petroleum harbor and for the raw materials necessary to the industries
that will settle on the new acreage. The north side of the South-East
Basin and the west bank of the Canal de Jonction will come by a public
wharf 4,300 feet long, serving a transit and warehousing zone larger
than 130 acres. The west shore of the Canal de Jonction and the shores
of the Canal Central Maritime will be adaptable to the installation of
industrial piers.
Adaptation of the Port to Large Oil Tankers
The whole Bassin de Mare was deepened to 50 feet, the access channel
widened (from 830 feet to 1000 feet) and deepened to 52 feet, and since
July 1970 vessels up to 250,000 DWT enter the harbor.
Shortly, the harbor will accommodate vessels up to 300,000 DWT, but in
the long run, this will not be quite sufficient. The port is evaluating
plans to accommodate 1,000,000 DWT vessels by constructing an artificial
offshore island at Antifer.
A-67
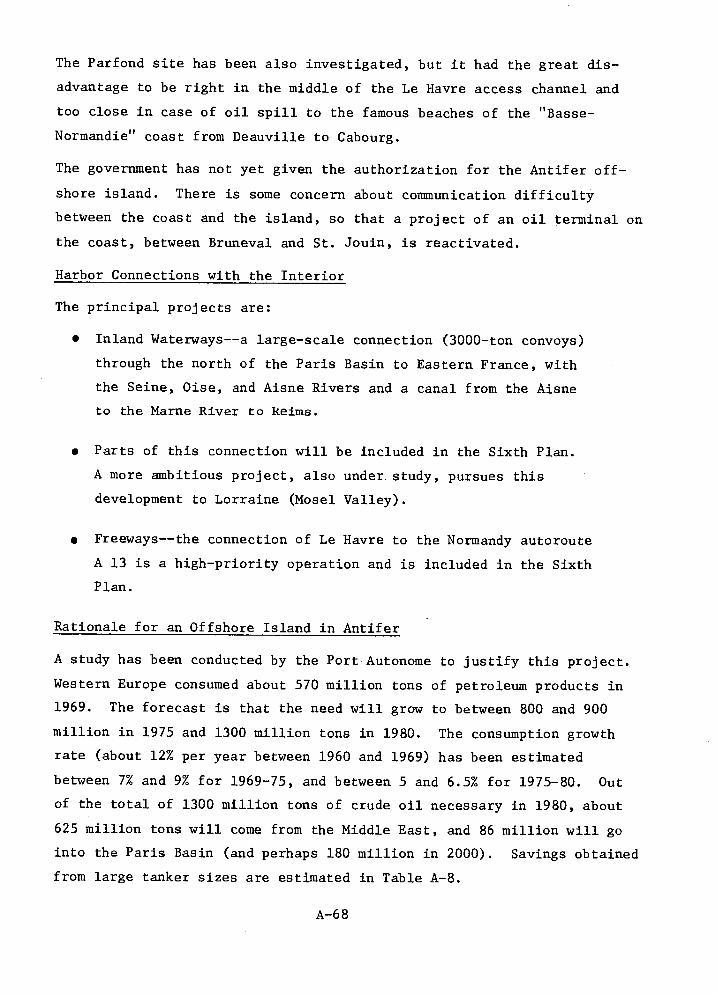
The Parfond site has been also investigated, but it had the great dis-
advantage to be right in the middle of the Le Havre access channel and
too close in case of oil spill to the famous beaches of the "Basse-
Normandie" coast from Deauville to Cabourg.
The government has not yet given the authorization for the Antifer off-
shore island. There is some concern about communication difficulty
between the coast and the island, so that a project of an oil terminal on
the coast, between Bruneval and St. Jouin, is reactivated.
Harbor Connections with the Interior
The principal projects are:
• Inland Waterways--a large-scale connection (3000-ton convoys)
through the north of the Paris Basin to Eastern France, with
the Seine, Oise, and Aisne Rivers and a canal from the Aisne
to the Marne River to Reims.
• Parts of this connection will be included in the Sixth Plan.
A more ambitious project, also under study, pursues this
development to Lorraine (Mosel Valley).
• Freeways--the connection of Le Havre to the Normandy autoroute
A 13 is a high-priority operation and is included in the Sixth
Plan.
Rationale for an Offshore Island in Antifer
A study has been conducted by the Port Autonome to justify this project.
Western Europe consumed about 570 million tons of petroleum products in
1969. The forecast is that the need will grow to between 800 and 900
million in 1975 and 1300 million tons in 1980. The consumption growth
rate (about 12% per year between 1960 and 1969) has been estimated
between 7% and 9% for 1969-75, and between 5 and 6.5% for 1975-80. Out
of the total of 1300 million tons of crude oil necessary in 1980, about
625 million tons will come from the Middle East, and 86 million will go
into the Paris Basin (and perhaps 180 million in 2000). Savings obtained
from large tanker sizes are estimated in Table A-8.
A-68
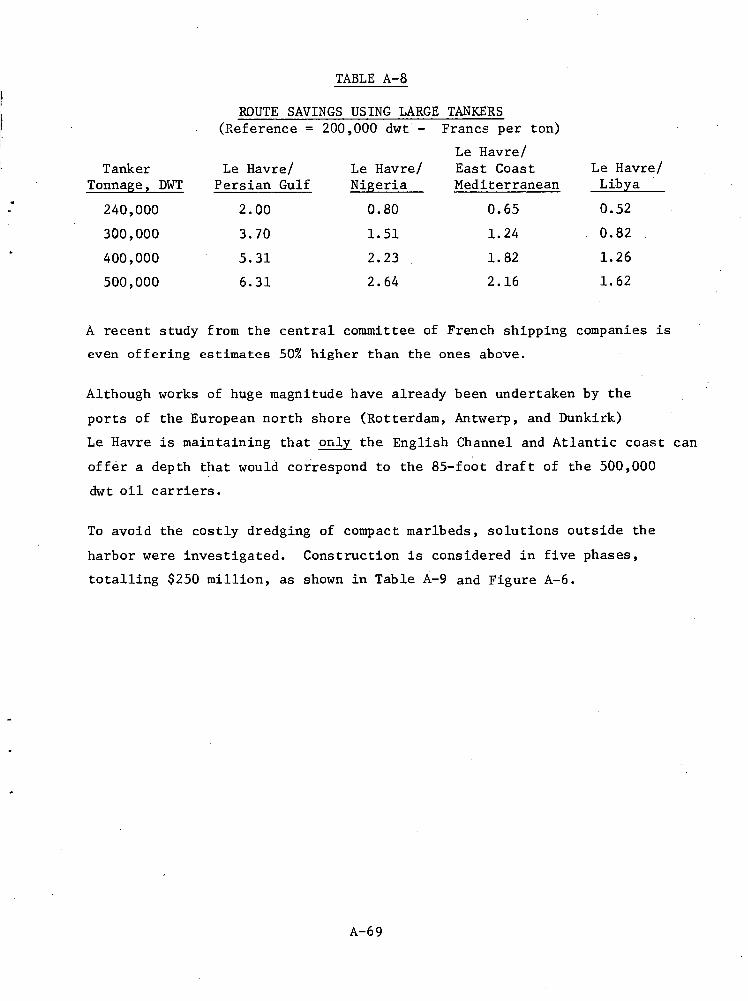
TABLE A-8
ROUTE SAVINGS USING LARGE TANKERS (Reference = 200,000 dwt - Francs per ton)
Le Havre/ Tanker Le Havre/ Le Havre/ East Coast Le Havre/
Tonnage, DWT Persian Gulf Nigeria Mediterranean Libya
240,000 2.00 0.80 0.65 0.52
300,000 3.70 1.51 1.24 0.82
400,000 5.31 2.23 1.82 1.26
500,000 6.31 2.64 2.16 1.62
A recent study from the central committee of French shipping companies is
even offering estimates 50% higher than the ones above.
Although works of huge magnitude have already been undertaken by the
ports of the European north shore (Rotterdam, Antwerp, and Dunkirk)
Le Havre is maintaining that only the English Channel and Atlantic coast can
offer a depth that would correspond to the 85-foot draft of the 500,000
dwt oil carriers.
To avoid the costly dredging of compact marlbeds, solutions outside the
harbor were investigated. Construction is considered in five phases,
totalling $250 million, as shown in Table A-9 and Figure A-6.
A-69
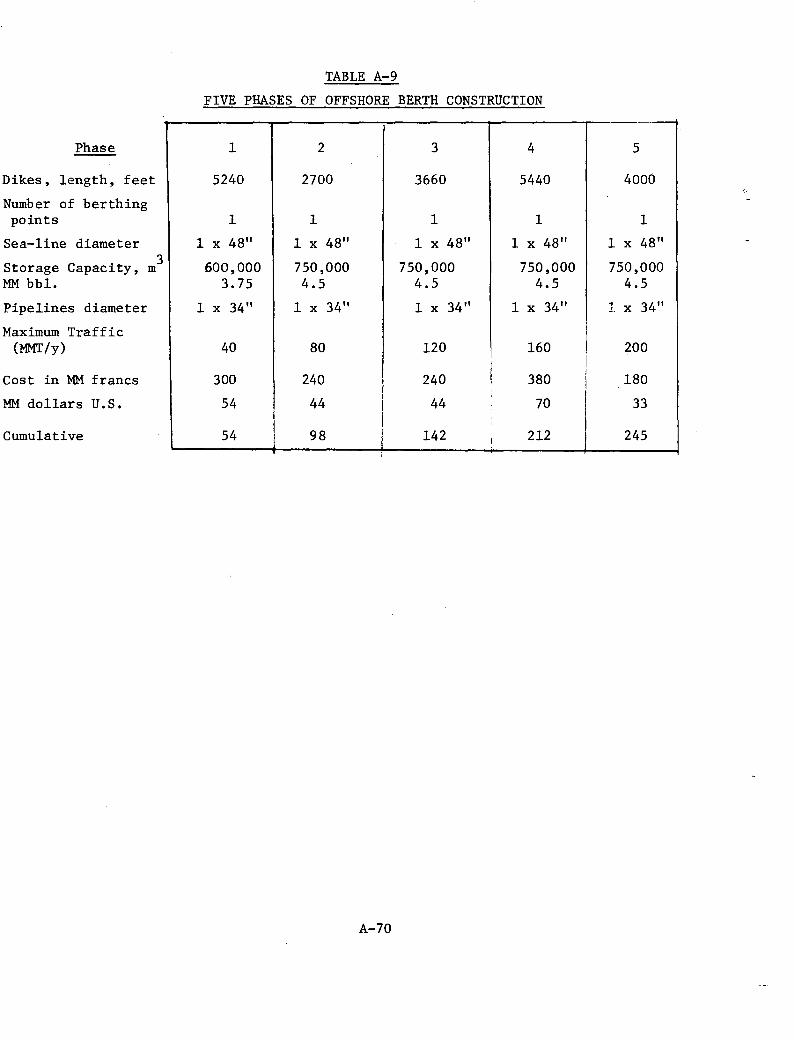
Phase
Dikes, length, feet
Number of berthing points
Sea-line diameter
Storage Capacity, m MM bbl.
Pipelines diameter
Maximum Traffic (MMT/y)
3
Cost in MM francs
MM dollars U.S.
Cumulative
TABLE A-9
FIVE PHASES OF OFFSHORE BERTH CONSTRUCTION
1 2 3 4 5
5240 2700 3660 5440 4000
1 1 1 1 1
1 x 48" 1 x 48" 1 x 48" 1 x 48" 1 x 48"
600,000 750,000 750,000 750,000 750,000 3.75 4.5 4.5 4.5 4.5
1 x 34" 1 x 34" 1 x 34" 1 x 34" 1 x 34"
40 80 120 160 200
300 240 240 380 180
54 44 44 70 33
54 98 142 212 245
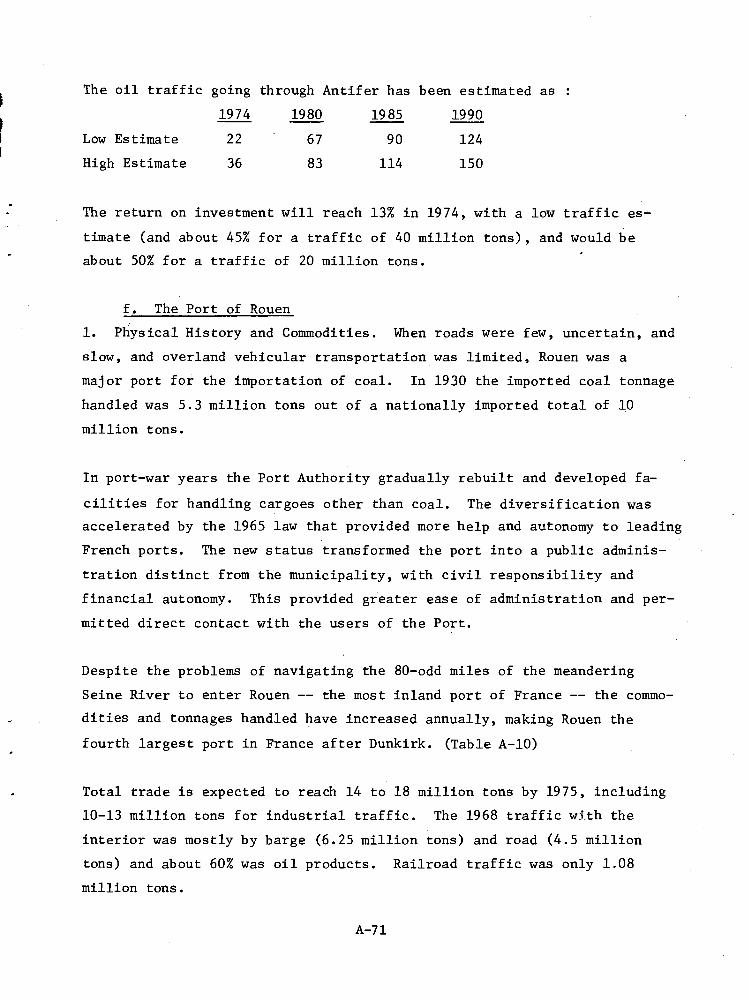
The oil traffic going through Antifer has been estimated as :
1974 1980 1985 1990
Low Estimate 22 s 67 90 124
High Estimate 36 83 114 150
The return on investment will reach 13% in 1974, with a low traffic es-
timate (and about 45% for a traffic of 40 million tons), and would be
about 50% for a traffic of 20 million tons.
f. The Port of Rouen
1. Physical History and Commodities. When roads were few, uncertain, and
slow, and overland vehicular transportation was limited, Rouen was a
major port for the importation of coal. In 1930 the imported coal tonnage
handled was 5.3 million tons out of a nationally imported total of 10
million tons.
In port-war years the Port Authority gradually rebuilt and developed fa-
cilities for handling cargoes other than coal. The diversification was
accelerated by the 1965 law that provided more help and autonomy to leading
French ports. The new status transformed the port into a public adminis-
tration distinct from the municipality, with civil responsibility and
financial autonomy. This provided greater ease of administration and per-
mitted direct contact with the users of the Port.
Despite the problems of navigating the 80-odd miles of the meandering
Seine River to enter Rouen -- the most inland port of France -- the commo-
dities and tonnages handled have increased annually, making Rouen the
fourth largest port in France after Dunkirk. (Table A-10)
Total trade is expected to reach 14 to 18 million tons by 1975, including
10-13 million tons for industrial traffic. The 1968 traffic with the
interior was mostly by barge (6.25 million tons) and road (4.5 million
tons) and about 60% was oil products. Railroad traffic was only 1.08
million tons.
A-71
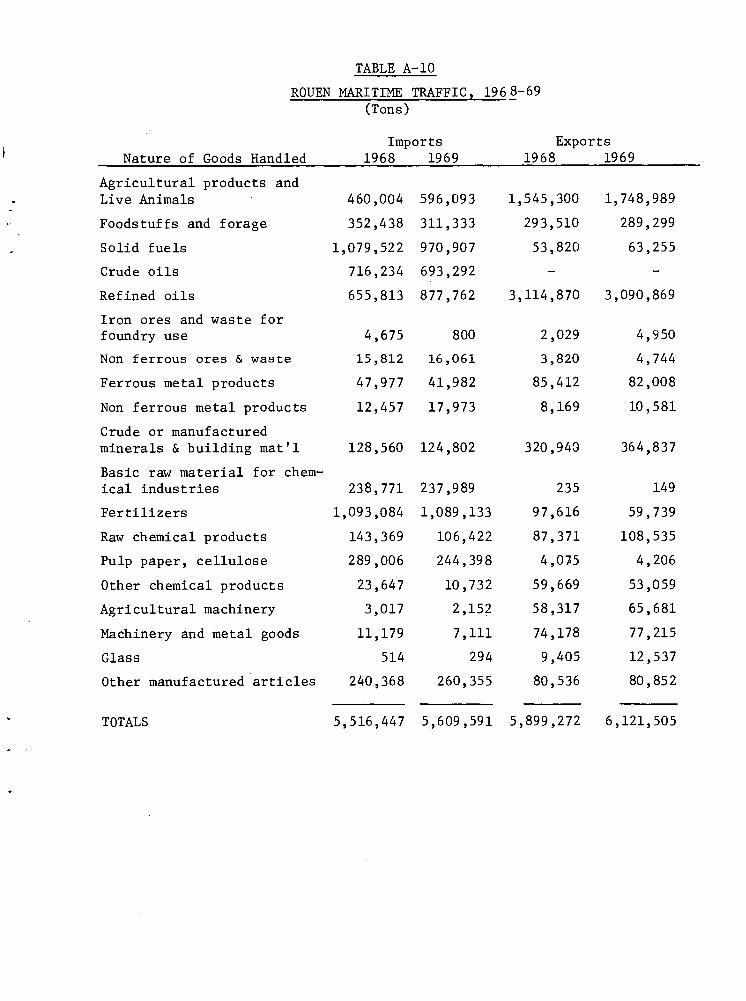
TABLE A-10
ROUEN MARITIME TRAFFIC, 1968-69 (Tons)
Nature of Goods Handled Imports Exports
1968 1969 1968 1969
Agricultural products and . Live Animals 460,004 596,093 1,545,300 1,748,989
Foodstuffs and forage 352,438 311,333 293,510 289,299
. Solid fuels 1,079,522 970,907 53,820 63,255
Crude oils 716,234 693,292
Refined oils 655,813 877,762 3,114,870 3,090,869
Iron ores and waste for foundry use 4,675 800 2,029 4,950
Non ferrous ores & waste 15,812 16,061 3,820 4,744
Ferrous metal products 47,977 41,982 85,412 82,008
Non ferrous metal products 12,457 17,973 8,169 10,581
Crude or manufactured minerals & building mat'l 128,560 124,802 320,940 364,837
Basic raw material for chem- ical industries 238,771 237,989 235 149
Fertilizers 1,093,084 1,089,133 97,616 59,739
Raw chemical products 143,369 106,422 87,371 108,535
Pulp paper, cellulose 289,006 244,398 4,075 4,206
Other chemical products 23,647 10,732 59,669 53,059
Agricultural machinery 3,017 2,152 58,317 65,681
Machinery and metal goods 11,179 7,111 74,178 77,215
Glass 514 294 9,405 12,537
Other manufactured articles 240,368 260,355 80,536 80,852
TOTALS 5,516,447 5,609,591 5,899,272 6,121,505
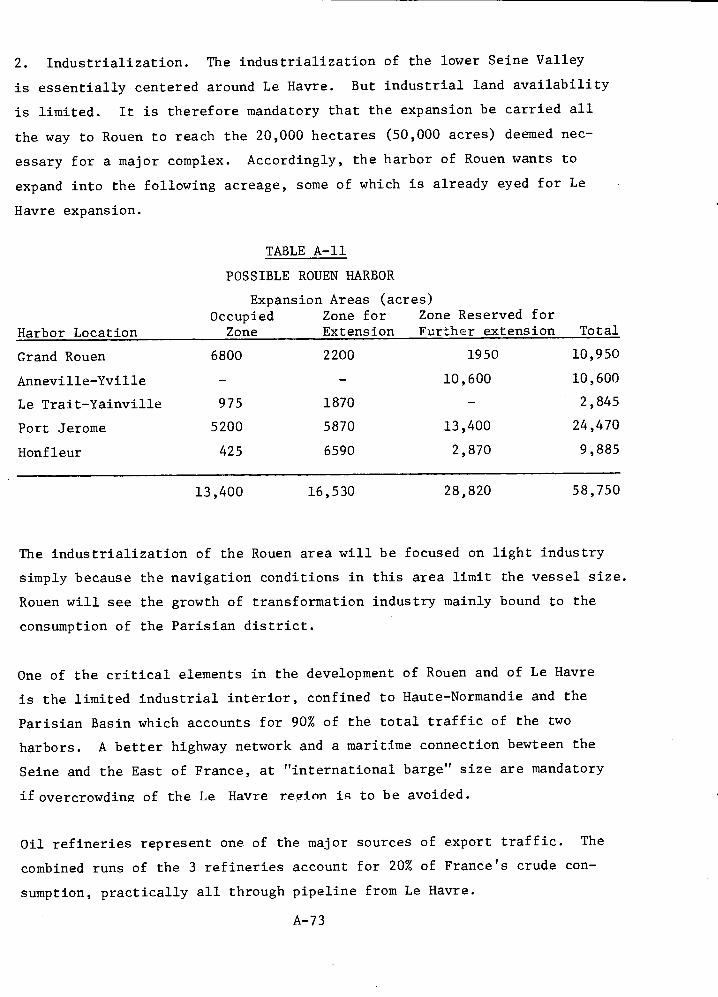
2. Industrialization. The industrialization of the lower Seine Valley
is essentially centered around Le Havre. But industrial land availability
is limited. It is therefore mandatory that the expansion be carried all
the way to Rouen to reach the 20,000 hectares (50,000 acres) deemed nec-
essary for a major complex. Accordingly, the harbor of Rouen wants to
expand into the following acreage, some of which is already eyed for Le
Havre expansion.
TABLE A-11
POSSIBLE ROUEN HARBOR
Expansion Areas (acres) Occupied Zone for Zone Reserved for
Harbor Location Zone Extension Further extension Total
Grand Rouen 6800 2200 1950 10,950
Anneville-Yville - - 10,600 10,600
Le Trait-Yainville 975 1870 - 2,845
Port Jerome 5200 5870 13,400 24,470
Honfleur 425 6590 2,870 9,885
13,400 16,530 28,820 58,750
The industrialization of the Rouen area will be focused on light industry
simply because the navigation conditions in this area limit the vessel size.
Rouen will see the growth of transformation industry mainly bound to the
consumption of the Parisian district.
One of the critical elements in the development of Rouen and of Le Havre
is the limited industrial interior, confined to Haute-Normandie and the
Parisian Basin which accounts for 90% of the total traffic of the two
harbors. A better highway network and a maritime connection bewteen the
Seine and the East of France, at "international barge" size are mandatory
if overcrowding of the Le Havre region is to be avoided.
Oil refineries represent one of the major sources of export traffic. The
combined runs of the 3 refineries account for 20% of France's crude con-
sumption, practically all through pipeline from Le Havre.
A-73
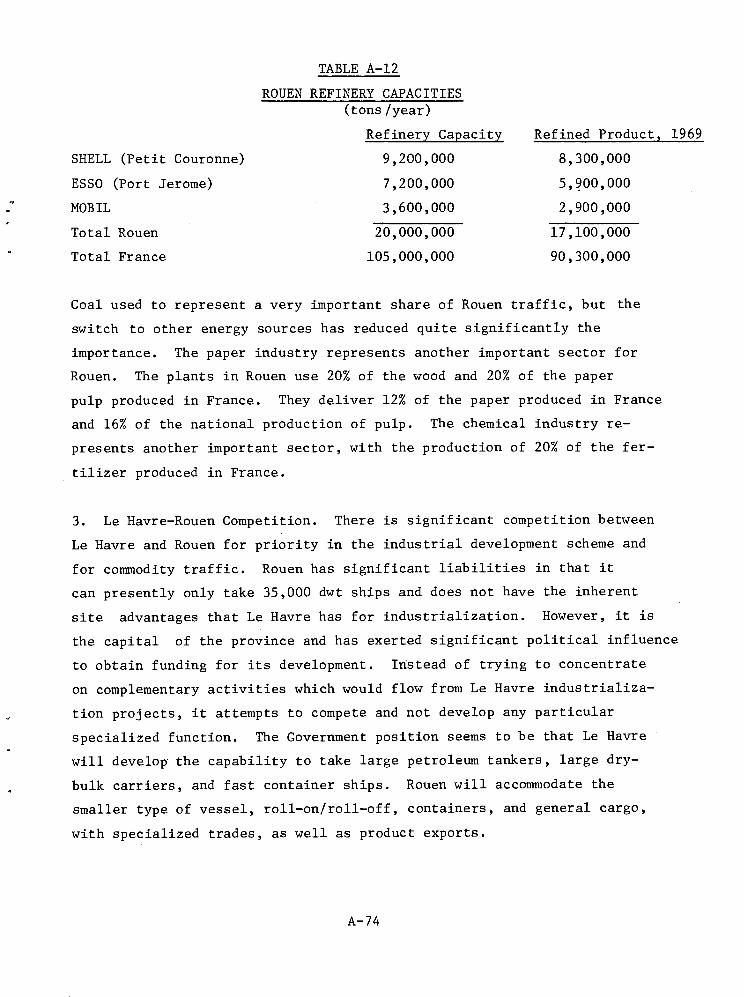
TABLE A-12
ROUEN REFINERY CAPACITIES (tons /year)
Refinery Capacity Refined Product, 1969
SHELL (Petit Couronne) 9,200,000 8,300,000
ESSO (Port Jerome) 7,200,000 5,900,000
MOBIL 3,600,000 2,900,000
Total Rouen 20,000,000 17,100,000
Total France 105,000,000 90,300,000
Coal used to represent a very important share of Rouen traffic, but the
switch to other energy sources has reduced quite significantly the
importance. The paper industry represents another important sector for
Rouen. The plants in Rouen use 20% of the wood and 20% of the paper
pulp produced in France. They deliver 12% of the paper produced in France
and 16% of the national production of pulp. The chemical industry re-
presents another important sector, with the production of 20% of the fer-
tilizer produced in France.
3. Le Havre-Rouen Competition. There is significant competition between
Le Havre and Rouen for priority in the industrial development scheme and
for commodity traffic. Rouen has significant liabilities in that it
can presently only take 35,000 dwt ships and does not have the inherent
site advantages that Le Havre has for industrialization. However, it is
the capital of the province and has exerted significant political influence
to obtain funding for its development. Instead of trying to concentrate
on complementary activities which would flow from Le Havre industrializa-
tion projects, it attempts to compete and not develop any particular
specialized function. The Government position seems to be that Le Havre
will develop the capability to take large petroleum tankers, large dry-
bulk carriers, and fast container ships. Rouen will accommodate the
smaller type of vessel, roll-on/roll-off, containers, and general cargo,
with specialized trades, as well as product exports.
A-74
A.2.6 Environmental Impact
The following notes refer often to the CFR refinery, because the
company was most helpful during our short field trip. However, they are
by no means the only polluter in the area. A cement plant, a nickel
smelter enclosed by the city expansion and shipping pollution have been
criticized by the local press.
a. WaLer Pollution
One of the largest users is the "Compagnie Francaise de Raffinage" (CFR)
which requires 12 million cubic meters per year of fresh water, and 90 mil-
lion cubic meters per year of salt water which it obtains from the Tancarville
Canal. Decanting basins are used to control effluent discharge. Phenol
is the most difficult effluent to control and the CFR is preparing to reinforce
its bacterial filter.
Fishing is forbidden in the polluted Canal de Tancarville around the in-
dustrial zone. However, the fish periodically choke the intake grid of
the intake condensers and mussels proliferate in the warm water discharged
as well as in the pipes handling this discharge. An electrical barrage
has been successfully used to solve this problem.
Several times a year the prefect of Seine Maritime makes a control of the
quality of water around the refinery. Some problems have been encountered
and a study is in process to reinforce the bacterial filters. CFR
controls itself by analysis at five points of discharge once a week.
In addition, the research center of Gonfreville makes a continuous moni-
toring of phenol at the west and south units.
The executive arm of the prefecture is the local technical officer, head of
Circonscription des Mines. He is in charge of controlling the application
of the various decrees concerning water pollution. Since 1964, a system
of fees (redevances) to the Agence de Bassin, has been set up for both
improvement of pollution control and water quality in a given river basin,
and as a receiving end for fines and penalties for polluting accidents.
A-75
More generally, since 21 February, 1962, the local prefecture has classed
the refinery among "dangerous, unhealthy, or disturbing establishments"
and subjected the refinery to the Ministerial Instruction of June 1953,
on residual water discharge by such establishments. However, it considers
that the receiver has a relatively low industrial pollution load
so that the limits are not the most severe; there are two more levels of
severity : (b) for important pollution load and (c) extreme pollution
load or localization close to water intake, beaches, shell beds, or
salmon reserves.
To calculate the annual effluent fee, the Agency considers the categories
of polluting activities, the unit or quantity characterizing each polluting
activity, and the specific quantity of polluting effluent allowable per
unit of the former characteristic, expressed in total solid suspended
and in oxidable material content. For example, a refinery is character-
ized by the number of people it employs and will release 3000 grams per
day of suspended solids as well as 3000 grams per day of oxidable mater-
ials per employee. According to company data, the continuous annual fee
paid by CFR was 20,000 francs in 1970; i.e., about $4,000 calculated with
the following formula:
R - .62(N.T.S.)
N. is the maximum number of people employed
S. is the weight of waste per person, which is 3 kilograms per day
T. is the rate which depends on the type of zone and the existing pollution in the environment
Domestic water needs of 28 billion gallons per year covered
for 1970, but the 1985 consumption of 48 billion gallons may oblige
Le Havre and Rouen to rely on water reserves located further north, at
Etretat and Yport for Le Havre, and Cailly and Andelle Valleys for Rouen.
A-76
Surface Water
Underground Water
The industrial needs have been evaluated as follows:
1970 1985 2000
118 284 570
83 79 66
201 363 636
There have been no salt intrusion problems as in Etang de Berre, but some
potential problems. The two aquifers, located in deep gravel layers
below a protective clay, show a 40% pressure fluctuation in phase with
tides. The last dredging program increased the fluctuation from 40 to 70%
as it gouged further into the layer of clay. The increasing concentration
of industrial water drawings from the underground reserves create a real
danger of spoilage caused by infiltrations of the Seine water. As a result
industry has been encouraged to rely essentially on surface water.
For example, in the Lillebonne-Port Jerome area the overexploitation of
the water beds increased the salinity to a point where the water , has become
unusuable. One plan is that in 1973 water will be pumped out of the river
at Villequiers where the salinity of the sea is insignificant and be sent
to Port Jerome and Le Havre by an 80 million g.p.d. pipeline.
In the Rouen area, the underground water beds are overexploited and very
serious pollution from the Seine water infiltrations are registered.
A series of measures will be taken to remedy this stivation, among them
drawing water from the Andelle and the Eure.
A major problem here, of course, is the pollution of the Seine. To stop
the degree of pollution it is planned to alternate industrial urban areas
with recreational areas that would give the river the opportunity to
clean up; however, whether this approach will haVe •the desired - results
remains to be.seen. The Seine, in addition to being polluted by sani-
tary and industrial waste, suffers from thermal pollution caused by
central power stations located on the river.
A-77
Commercial and even recreational fishing activity in the Le Havre area
appears negligible. Fishing is specifically prohibited in the port
area itself (although it does occur), and fishing vessels based in Le
Havre work either in the North Sea or to the west off the coast of
England.
b. Air Pollution
Electricity of France (EDF) is a major contributor to air pollution
through its 2850-megawatt power plant, scheduled for expansion to
3600 megawatts. Since 1966 it has been making daily measurements and
calculating average daily quantities of sulfur dioxide (SO 2 ) and dust
content of the air. The measurements have been made since 1966 on nine
locations and the first report dates from 1967. EDF is in the process
of installing automatic measurement equipment to measure SO 2 every
quarter hour. This equipment does not measure dust, but studies of
dust sedimentation from fumes have been made by EDF.
CFR is now installing also equipment for measuring SO2 at the
request of DICA, a government authority on oil and petroleum products
which asked this action through the Chambre Syndicale. This latter
organization will gather the results and communicate them to DICA (Direc-
tion industrielle des Carburants). SO2 contents are lower than or close
to 90 micrograms per cubic meter of arithmetic annual average, 400
to 600 micrograms for daily maximum over 3% of the cases, and less
than 50 micrograms in 60 or 70% of the cases. Dust measurement
shows, in the town only (they have not yet been measured in the refinery),
50-60 micrograms per cubic meter. This pollution is still acceptable
and no worse in the refinery area than in the center of town because
of many other polluters, such as industrial fuel users, cement plants,
the St. Gobain glass works, sulfuric acid plants, etc., in addition to
EDF. The stack of EDF is 240 meters high in an effort to send the
gases beyond the plateau which overlooks Le Havre. The stacks of CFR
are generally limited to 50-80 meters in height.
A-78
The above numbers seem to be acceptable and the windy weather combined with
the rather wet climate help in this case. However, what will happen
when industrialization is fully developped is open to question and de-
serves planning.
Petroleum product vapors were picked up at CFR refinery by a special
collector pipeline long before World War II.
There are no specific controls or specifications at all. If a new plant
is built, plans that the operator may have for any air pollution control are
reviewed by the government, but no specifications are imposed upon the
plant. Acceptance of the new plant is purely a subjective matter,
and is quite likely. An environmental group within the port manage-
ment has recently been assigned to look into the question of industrial
pollution control within the developed area of the port -- both air and
water -- and in the expected growth of the harbor in the years ahead.
Ultimately, it will define rules on what type of industry may locate,
and where, and may even go so far as to specify air and water effluent
criteria.
For such suggestions to have any weight, however, legislative, regulatory,
and enforcement authority must at least be at the Prefect level. Without
some national type of control, various prefects would then compete among
themselves with less stringent environmental regulations to attract
industry. It is therefore specialists' opinion that environmental con-
trol specifications, must be at the national level.
c. Solid Waste
In the past, "discoloring earths" from refining operations had to be
disposed of once they were loaded with 30% in weight of crude oil
or oil. They were used for land fill and it was admitted that the
aquifer was already salty and polluted underneath the marsh. Hydro-
finishing now replaces this practice.
The acid tars coming from paraffin and oleum (concentrated sulfuric acid)
A-79
treating, were burnt, then leached by rain water, and used as land fill.
Treatment calls now for about 50 tons of bauxite which are loaded in the
process, then recovered every two years and calcined for inerting prior
to being used for land fill. Crude storage tank sludge is washed
and the residues used for land fill. Catalysts are generally regenerated
by the manufacturer or by CFR or sold for recovery of rare metals.
Finally, plastic packaging, which has been developed by the company to
make a captive use of ethylene will probably develop into a consumer
solid waste disposal problem. The city itself is commissioning a modern
sewage-treatment plant, including a powerful sludge unit and estimates
the cost per inhabitant at $2 per year for incineration and $3.00 per
year for water treatment.
d. Visual Intrusion
CFR is careful to maintain as clean a refinery as possible and to do a
good painting job. They also have a tree beautification program which
has been imposed by the local town. There have recently been protests
against the brilliantly lit refinery because of light intrusion during the
night which prevents birds from sleeping.
e. Noise Intrusion
The CFR main water pump was quite noisy and had to be sound-proofed at
great cost and pains. In the 7rovence southern refinery, CFR also had
problems with screw compressors for catalytic cracking that had a whist-
ling sound. Routinely they use silencers on cat-cracking equipment, and on
the dryers which equip ethylene crackers.
CFR systematically designs the diameter of its torches to reduce the
whistling of steam injection, sometimes used to fight black smoke.
_
In addition to the Concawe Organization which groups refinery capacity, CFR
is setting up an information service which will also coordinate the po-
sitions of various members of the CFR group within the EEC. This service
A-80
is financed 50% by the CFR and 50% by CFE, Compagnie Francaise de Petro-
leum, or TOTAL.
f. Fire Safety, and other Security Problems
The refinery has a good safety history. It has its own fire-fighting
equipment and teams with other refineries at Port Jerome and Grand
Couronne which will lend men and materials on call. The city fire
department will come to help on call, but remains under the order of
the refinery team. CFR has conducted training seminars for the city
fire department so that mistakes made during the great Feyzin fire
will be avoided. In addition, supervisors, foremen, and security oper-
ators live in a special housing district, close enough for immediate intervention.
For fire protection, the harbor has fire-fighting vessels and CFR provides
fire-fighting equipment and additional protection on the shore side of the
terminal. Floating booms made of wood and cork have been on hand for
30 or 40 years and have never been used. For more than 30 years, minor
oil spills have been handled by pumping of the filmed water and sinking
with cement.
g. Future Issues
There can be little doubt that over the short term, economics and indus-
trial developments of the lower Seine -- as well as that portion of the
river between Le Havre and Rouen -- will take precedence over protection
or improvement of the environment. Since Le Havre is about the best
natural port that the French have, in addition to being well situated to
serve the Paris hinterland, authorities intend to expand its tanker handling
capability from 200,000 dwt up to 500,000 dwt or more. This will be
accomplished by de,P.pening the existing harbor and then probably by constructing
an offshore island in the Cap d'Antifer area, about 10 miles offshore in
water depth of 100 feet.
Insofar as environmental considerations are concerned, the basic em-
phasis seems to be on keeping future residential areas "upwind" of pro-
A-81
posed industrial concentrations and in maintaining or establishing
strategically-located "greenbelts" or green areas which will serve either
as recreational sites or visual screens.
Among OREAM officials and in a pressure group(B.A.N.) associated with
the local press, the inherent long-term pollution dangers of substantial
stimulated industrial growth along the Seine River are recognized, and it
is believed that pollution abatement will have to be practiced more thor-
oughly than it has been in the past. However, except for the Seine itself,
pollution is not yet deemed very serious by many people, and waste water
treatment is too expensive especially for existing installations. Ul-
timately, it may be that industrial locations for the industries near
Le Havre will eventually have to purify the Seine to use it for their own
purposes. The water is too dirty to use at present for virtually any
purpose whatsoever, but other reasonably close water supplies are not
believed sufficient for expected future demand. It is somewhat ironic
that OREAM foresees an eventual requirement for purification of the Seine
essentially at its mouth, while upstream, where the majority of pollution
presently occurs, there seems to be less pressure for cleanup.
Although perhaps not as much in evidence in the Le Havre area as in the
other port regions visited, the regional planning approach -- involving
not only the immediate harbor area, but the related hinterland as well --
was very much in evidence.
A-82
A.2.7 ENGINEERING CONSIDERATIONS
a. General
The President of one of the leading contenders, for the construction of
the offshore island discussed with us the philosophy and experience
acquired with recent French port development. A first principle is that
the port is a rigid structure like a ship hull. The shell of a snail is a
good example of the way a rigid structure can grow and expand. This
leads to a funnel concept for port planning where the dynamic development.
can freely move towards offshore deep water, rather than the reverse.
Lavera, an oil terminal between Marseilles and Fos, is a good example
of the wrong way: at the end of a 2.5-mile-long canal to the Etang de Berre,
dredged to 30 feet, piers were built not from the bottom of the harbor towards
the outlet but from the entrance of the harbor inward, and the first piers •
thus preempt future turning basins for larger vessels. The same thing
happened in Le Havre, fortunately on a much larger scale and the most
recent berth for 250,000 DWT tankers is more than 3000 feet from the
turning basin. In a typical coastal Mediterranean port, the dike should
not be parallel to the coast but at an angle with the first pier being put
in the narrow part, the development moving towards the wider, deeper part
of the harbor.
Similarly, wet docks are much more rigid than tidal basins, although the
latter has some size limitations introduced by the current in the narrow
entrance which should not be higher than 2 knots. Le Havre has been helped
by its initial orientation to large transatlantic liners which had great
size and windage, so it has much room in the tidal basin. However,
the channel is 11 nautical miles long, and the rising tide lasts only 5
hours. Even though the flat top of the tidal curve helps for 250,000 DWT,
the manoeuver becomes quite difficult to program, hence the reason for the
concept of an artificial island offshore (which may now be linked to shore).
A second principle is the importance of geology in site selection. Channel
deepening by natural scouring, encouraged by low dikes in estuaries, has
the advantage of favoring the formation of sedimental alluvial plains
between the land and the dike. The Le Havre industrial zone was thus
A-83
Partly naturally gained from reducing land fill requirements.
The present channel was changed to north-northwest from west to dredge
recent quaternary sediments, rather than a lump of bedrock, so that
geology also played an important role here. Another reason for this
change in orientation was to bring large-vessel passage away from the
coast which is quite residential on the south. Bedrock incidents in
particular play a major role in basin and channel design. It is important
to make preliminary surveys by first doing some drilling, then conducting
a seismic study to look for bedrock, followed by a more systematic drilling
program. Sparkers are good, but limited in depth, and electric sounding
has problems in salty soils.
Due to the water movement since the last ice cap melting 15,000 years ago,
the sediments normally are found down 100 feet from the water level.
This search for 100-foot bottoms has led the port of Le Havre to first
select the Antifer bar for an artificial island, then the Parfonds, which
is more west of Le Havre and further out. During the preliminary inquiry
on the basis of an island on Parfonds, CFA proposed again an island on the
Antifer site which does not need offshore storage because it has shorter
piping distance to the mainland. This shorter crossing distance is also
very important for maintenance and service and may ultimately be bridged
by a permanent causeway.
The third principle is that current is more important and critical for
big ships than swell or wind. The importance of the swell becomes marginal
for very big vessels, although tests may still be necessary, like those
conducted for Gulf's Kuwait terminals. Wind also becomes marginal for
large tankers and bulkers, but is still important for Atlantic liners
(which are fast disappearing). In Le Havre, use was made of warehouses
and sheds to protect them from the wind effect. This might still be
useful for container ships.
A-84
On the other hand, a current of 2 knots may give a lateral lift effect
of several hundred tons to a vessel approaching a quay at a slight angle
with the current parallel to the quay. A one-knot current would give a
500,000 dwt tanker a lift of 200 tons. In the hook-shaped artificial
island (figure A-6), a compromise has to be reached to limit current inside
the protected area, but also to prevent large eddies at the tip of the
island opposite the hook. The design of a perforated dyke at the hook side
extremity of the quay had to be carefully optimized for that purpose.
A transverse current of 1.7 knots will exert a push of 1100 tons on the
same loaded 500,000 dwt.
The fourth principle is that the future is paramount, and the new harbor
should not be an annex of the old established smaller harbor. As the
basin of La Chaudiere in Marseilles is not an annex of the old port,
similarly Fos is not an annex of Lavera or even Marseilles, despite
several attempts by local municipalities to do so. In the same vein, deserted
virgin sites are preferable to existing harbors, not only because of the
flexibility enjoyed by the planner, but because socio-environmental
problems can be minimized.
b. Rouen Channel and River
Average tidal fluctuations in Le Havre at the mouth of the Seine are 23
(Spring) to 6.5 feet (Neap), which adds 26 feet (Spring) to 18 feet
(Neap) to charted depths. Tidal height declines to 10.5 feet in Rouen.
Tidal action extends 20 miles beyond Rouen, but maritime navigation is
practically no longer possible above Rouen. The water depth and bridges
confine travel to small coasters and barges (3,000 to 4,000 tons
pushed).
The present site provides close access to the Parisian
duces a third of the nation's wealth. Within 100-mile
influences 12 million consumers, and 20 million within
basin, which pro-
radius, Rouen
a 160-mile radius.
From the Seine's estuary into Rouen, ships must traverse 70 miles
of winding river. The channel can accommodate 32-foot-draft ships
or bulk carriers of up to 30,000 dwt. Port Jerome, which is 50 miles
A-85
down river from Rouen can accommodate ships of up to 50,000 dwt. Of
necessity, inbound vessels move up to Rouen with the 10-knot tidal wave.
After taking a pilot (a requirement when ship length exceeds 70 meters),
the vessels enter the estuary channel as soon as there is sufficient water
depth to accommodate their draft. Vessels of shallow draft can proceed
upriver well before high tide at Le Havre; vessels of deep draft or
exceptional length enter the channel just before high tide.
River bank degradation from the wash of ships has been a problem, es-
pecially in the upper reaches of the river from La Bouille into Rouen.
A 10 knot speed limit is strictly enforced in this last 19 mile stretch
of river. Otherwise there is no speed limit, and vessels ride the wave
to its maximum speed, and a travel time of 6 hours (11 knots average)
is normal.
By 1975, radar navigational aids (two existing stations, three more
planned), in conjunction with a Toran positioning system at downstream
Honfleur, will be available for travel between Le Havre and Caudebecen-
caux (about one-third of the way upriver). Plans also include pro-
vision of a VHF radio network, complete with emergency channels (channel
9 normal, 11 operations, 16 emergency). Existing navigational aids
consist of two radar stations, 38 lighted beacons on the left bank
(proceeding down river) and 38 on the right bank with an additional
beacon in the inner harbor (St. Gervais Docks). There is a concentra-
tion of beacons in the mid portion of the river between Caudebec-en-
caux and Dunclair where the river has severe bends.
Channel maintenance is handled by bucket ladder dredges and two 1,000
cubic meter trailing-suction dredges that use a side-arm unloader to pump
••••
A-86
dredging spoil on a land reclamation area at between Grand and Petit Cour-
onne, the ports and industrial extension area SSE of Rouen. Silt accumu-
lations from upstream sources average 400,000 cubic meters/year. More-
over, the dissymmetry in tidal currents brings in 73 million cubic yards/
year of fine sand (less than 1/10 mm), which are dredged at an average
cost of $2 million per year. Spoils are dropped at sea in a special zone.
Total silting between 1834 and 1968 is estimated at 1,050 million cubic
yards i8.7 million cubic yards/year average). The incoming tide
is always stronger than the outgoing, and bottom scouring is reduced
accordingly. Extensive dredging at the entrance channel south of Le
Havre and low dikes construction have been conducted on the basis of model
tests. The Hydraulic Basin of Lower Seine has been extensively modelled
to plan the above actions. First, a mathematical model of the channel
from Cherbourg, Cotentin, to Calais yielded boundary conditions at the
Seine estuary. Then, a physical model was made of the estuary itself. Fi-
nally, both models and more mathematical models were tested for 20-year
(1962-1982) modifications with various interventions such as low dikes
in the estuary, high permanent dikes, dredging, etc. A combination of
dredging of the heavy "galets" (riverbed stones) which are not moved by
the current, and of low dikes south of Gonfreville has resulted in a
depth gain of 8.3 feet. Another system is under investigation to gain a
further 6 feet and to develop new land as well as a new Avant Port for Le
Havre. Channel maintenance and sidewall stability have also been much
improved.
A typical profile for these low dikes are: 33-foot-wide flat summit, 6.6
feet high, with a 10:1 angle of repose.
Traffic control is conducted through on-board pilots and Port launches
patrolling the river. Most vessels entering Rouen carry outbound freight,
but this is limited to capacities up to 25,000 tons, since the outgoing
tide is weaker than the incoming, thereby restricting the channel depth
by a reduced tidal wave.
A-87
The port turning basin can handle ships up to 760 feet in length. Re-
cently a ship of 710 feet overall utilized the basin.
c. Le Havre
Berth No. 10, for 250,000 dwt 66-foot tankers, was inaugerated in
December 1970. A large part of construction cost was the strengthening
of the banks by steel sheets prior to dredging the 69-foot excavation.
Four breasting dolphins, covering a 530-foot-long front, are made of steel
tube piles carrying wooden shields by means of rubber dampers. The two
end dolphins are designed for 300 ton meter, the central ones for 200
ton meter, i.e., a total energy of 1000 ton meter (7.2 billion ft-lb),
compared to 800 ton meter for the 200,000 dwt berth No. 8. The tubes are
made of special, high-yield-strength steel, allowing movement of 8
feet (end piles) and 6.6 feet (central dolphins).
Nine mooring bollards with a rupture strength of at least 300 tons (nom-
inal strength, 125 tons) are equipped with automatic release hooks. A
340 x 230 foot platform is made of a reinforced concrete slab, with 52
tube piles (steel, 2.5 feet 0.D.) and may carry a 30-ton load (in fact,
it carries a 20-ton crane with four supports).
Four articulated arms, carrying a 16" and a 40" pipeline connect a ship to
the tankfarm. Unloading may proceed at 2.25 to 3.0 million barrels per
day. Some 18 new tanks have been added to the tankf arm, each with 530,000
barrel capacity. Retention dikes walls are made with sheet piling, covered
with lightly reinforced gunite.
d. Lessons & Problems
• The first container terminal, with 400-foot depth was insufficient. The
terminal planned in the new tidal basin will have a depth of 1000 feet
before the unloading shed and loading racks, 200 feet overall.
• The turning basin (calculated by 2 x L) seems a bit uncomfortable, and 2.5
x the length of the design vessel should be the norm.
A-88
• Locks are inflexible and should be built as big as possible. The new lock
system was planned with three parallel locks. The intermediate size was
tendered at 150-foot width and 40-foot depth, and estimated at $24 million
for a 1200-foot length between gates. The price came to $34 million when
the width was increased to 172 feet. Works were started, and the excava-
tion completed, when "a gut feeling" led the port engineers to make
the lock the largest possible: 221-feet wide, 48-feet deep, and 1325-feet long,
which will be welcome for the new generation of containerships which can
now enter two at a time.
• Landfill operations have been delayed, because the building of the dike and
the dredging of the tidal basin providing hydraulic fill were handled by
two different contractors
• There is time-acceleration, and major changes occur now every 15-20 years
rather than every half-century in a port's life. Besides the offshore
island, Le Havre is dreaming of a new dike in the estuary, to create a
bigger outer harbor and double the land to 50,000 acres and more.
e. Le Havre-Antifer Oil TerminalProject
The French do represent a major threat to the dominance of Rotterdam as
Europe's major oil port. Not even mentioning Dunkirk's ambitions, the
pipeline connections from Le Havre to Paris and then to northeastern
France and into Germany could attract an increasing amount of oil. It
is for the handling of tankers and the storage of oil where the biggest
developments are taking place in Le Havre. Presently, the harbor is
capable of taking 250,000 dwt tankers at any tide and up to 300,000 dwt
tankers in some high tides. Tenders are expected in August 1971, for a
500,000 dwt terminal (Figure A-6).
f. Design Vessel in Antifer Project
Preliminary research has shown that a loaded 500,000* dwt tanker has stopping
distances of 6000-meters (20,000 feet) at 16 knots (6 x length at 8 knots,
1.5 x length at 4 knots), in 23 minutes (15 minutes and 5 minutes). Tokyo
* 500,000 dwt, 1325-foot LBP, 1370 feet overall, 211-foot beam, 92.5 foot draft
104-foot depth. A-89
Maru", 150,000 dwt, had a 14,000 ft. stopping distance at 16 knots, and
2.000 ft. stopping distance at 4 knots. Motor ships, generally slower
and with more power aft, have shorter stopping distances. Lateral move-
ment reaches 10,000 ft.! at 16 knots, 5,000 ft. at 8 knots, 660 feet
at 4 knots for the 500,000 dwt ship. Turning diameter is 4,000 ft. in
deep water, -8,000 feet in shallow water.
A 3-knot current exerts a 4000-ton action on the ship when perpendicular,
a 50-knot crosswind exerts 300 tons on a ballasted ship and 120 tons on
a loaded ship. Squat is negligible at 5 knots in restricted channels, and
is about 2 feet at 8 knots for a ratio depth/draft of 1.10 and a channel
width of 250 meters (830'). A 15-second, 33-foot high swell would give 2 feet
additional draft on roll and 3.3 feet additional draft on pitch. A 15%
safety margin appears necessary at 5 knots with a 15-second swell, 16.5 feet
high; but 10% would be sufficient in a 12-second, 11.5-foot-htgh swell.
In addition, extensive testing with the 213,000 dwt tanker "Magdala"
showed that bottom effect is negligible for a ratio 1.3. Finally, a
margin of 10% is believed sufficient; channel width must be equal to ship
length in straight channels; stopping distance is below 3 lengths at 5 knots
but 3.5-to-4 x Length appears preferable with a 1/2 x Length for distance
of lateral movement. At 5 to 7 knots, turning diameter is about 5-to-
10 x length. Turning basins could be 1-1/2 x length, but should be 2
or even 2.5 x length.
Tugs are not effective, and even dangerous unless the ship has reduced
speed to below 3 knots. Securing the hawser takes about 20 minutes, with
the ship having progressed 1 mile. Bollard pulls are 35 tons and pushing
may reach 40-45 tons. Swells beyond 2-2.5 meters (6.6 to 8 feet) or
winds beyond 40 knots render such assistance difficult.
g. Technical Alternatives in Antifer Project (figure A-6)
Antifer has finally been preferred to the Parfond site for the following
reasons:
• 100-foot depths are only six miles from the coast, so that the
A-90
tankfarm may be onshore.
• Currents and swell directions are more favorably combined at Antifer.
Currents are stronger, but in a well-defined direction.
• Antifer has more room for maneuvering, is away from recreational beaches
• Antifer is much cheaper than Parfond
• A sand strata, perpendicular to the coast at Antifer, allows consider-ation of a deep port at the coast.
The alternatives considered then were:
• Protected offshore dike -- straight E-14 dike, 5000-feet long in Phase
I; then 8000 feet (two berths), etc. with a protective west dike,
which in later phases (five berths) constitutes the bottom of a bag
open to the east. The west dike may be perforated to reduce eddy
currents at the eastern end of the north dike.
• Coastal port which unfortunately must open to the NW -- which is the
direction of maximum swells and requires an inner port, with a 3300-
foot turning basin, and four 500,000 dwt berths. A construction in
two phases has been studied.
• One (then two) SPM, single-point mooring buoys, 50 feet in diameter
with 24" and 30" hoses. No optimization of port or island location
versus the coast (to balance pipeline and pumping costs versus invest-
ment and dredging).
A-91
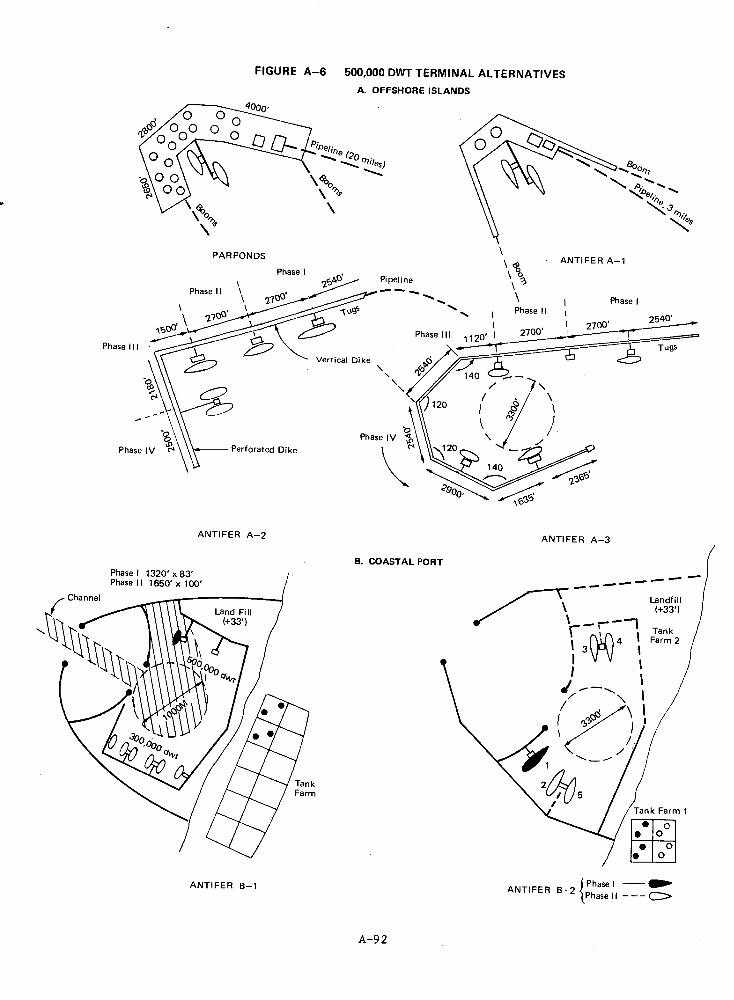
Phase I
Phase II
TO ' \ 150°'
2700' ogs
Phase Ill
PAR FONDS ANTI FER A-1
Pipeline
1120'
Vertical Dike
Perforated Dike Phase IV
Phase I
2540 ' 2700'
\ o
Phase II
2700' Phase III 27
ANTIFER A-2 ANTIFER A-3
rChannel
P
Land Fill (+33')
Phase I 1320' x 83' Phase II 1650' x 100'
Tank Farm
■••• •■•••
Landfill
-
(+33')
-1 Tank 1 3 ; Farm 2
1
g
s506 \
i„
Tank Farm 1
• 00 • • • 0
0
Phase I — Phase II — C:>
ANTIFER B-2
FIGURE A-6 500,000 DWT TERMINAL ALTERNATIVES
A. OFFSHORE ISLANDS
B. COASTAL PORT
ANTIFER B-1
A-9 2
APPENDIX B
ANTWERP
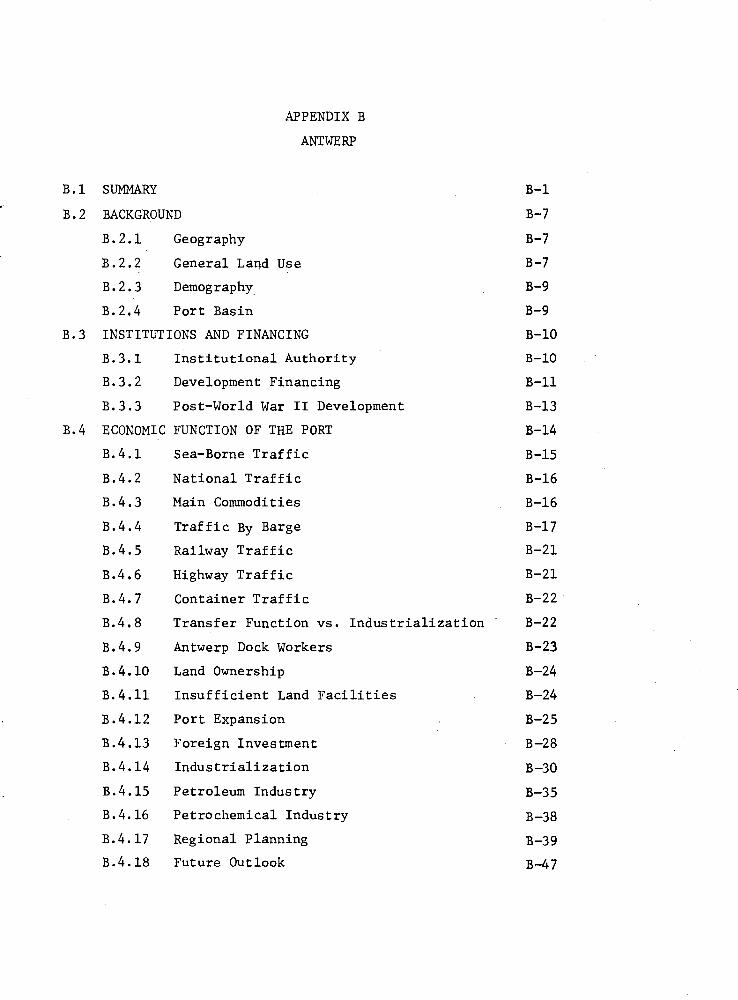
APPENDIX B
ANTWERP
B.1 SUMMARY B-1
B.2 BACKGROUND B-7
3.2.1 Geography B-7
3.2.2 General Land Use B-7
B.2.3 Demography B-9
B.2.4 Port Basin B-9
B.3 INSTITUTIONS AND FINANCING B-10
B.3.1 Institutional Authority B-10
B.3.2 Development Financing B-11
B.3.3 Post-World War II Development B-13
B.4 ECONOMIC FUNCTION OF THE PORT B-14
B.4.1 Sea-Borne Traffic B-15
B.4.2 National Traffic B-16
3.4.3 Main Commodities B-16
B.4.4 Traffic By Barge B-17
B.4.5 Railway Traffic B-21
B.4.6 Highway Traffic B-21
B.4.7 Container Traffic B-22
B.4.8 Transfer Function vs. Industrialization B-22
B.4.9 Antwerp Dock Workers B-23
B.4.10 Land Ownership B-24
3.4.11 Insufficient Land Facilities B-24
B.4.12 Port Expansion B-25
B.4.13 Foreign Investment B-28
B.4.14 Industrialization B-30
3.4.15 Petroleum Industry B-35
B.4.16 Petrochemical Industry B-38
B.4.17 Regional Planning 3-39
B.4.18 Future Outlook B-47
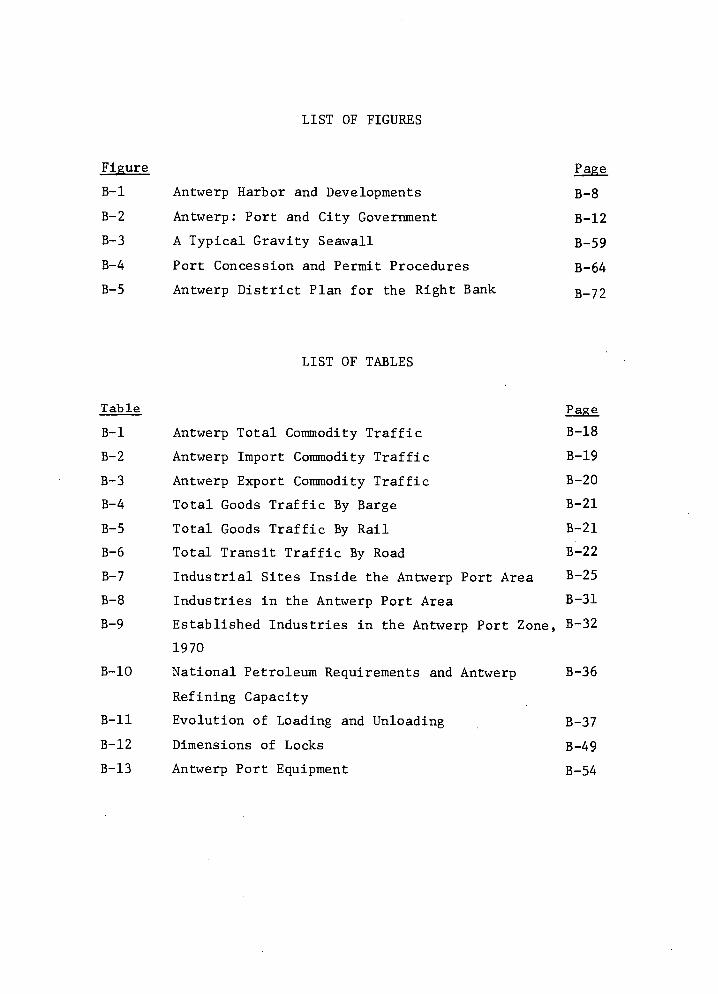
LIST OF FIGURES
Figure Page
B-1 Antwerp Harbor and Developments B-8
B-2 Antwerp: Port and City Government B-12
B-3 A Typical Gravity Seawall B-59
B-4 Port Concession and Permit Procedures B-64
B-5 Antwerp District Plan for the Right Bank B-72
LIST OF TABLES
Table Page
B-1 Antwerp Total Commodity Traffic B-18
B-2 Antwerp Import Commodity Traffic B-19
B-3 Antwerp Export Commodity Traffic B-20
B-4 Total Goods Traffic By Barge B-21
B-5 Total Goods Traffic By Rail B-21
B-6 Total Transit Traffic By Road B-22
B-7 Industrial Sites Inside the Antwerp Port Area B-25
B-8 Industries in the Antwerp Port Area B-31
B-9
Established Industries in the Antwerp Port Zone, B-32
1970
B-10 National Petroleum Requirements and Antwerp B-36
Refining Capacity
B-11 Evolution of Loading and Unloading B-37
B-12 Dimensions of Locks B-49
B-13 Antwerp Port Equipment B-54
B.5 ENGINEERING FACTORS B-48
B.5.1 Site Selection B-48
B.5.2 Configuration B-48
B.5.3 Channel and Basin B-49
B.5.4 Navigational Aids B-52
B.5.5 Docking B-53
B.5.6 Cargo Handling B-53
B.5.7 Communications B-56
B.5.8 Cost Data B-57
B.5.9 Problems and Lessons B-57
B.6 ENVIRONMENTAL IMPACT B-60
B.6.1 Environmental Management Efforts B-60
B.6.2 Organizational Structure B-61
3.6.3 The Center for Prevention of Air and Water Pollution B-62
B.6.4 Current and Potential Problems B-67
B.6.5 Future Issues B-76
APPENDIX B
AN
B.1 SUMMARY
Based on our field interviews, surveys of the Antwerp port area,
and reviews of appropriate documents, we have extracted the
following highlights of Antwerp's port experience.
• Antwerp, located 45 miles south of Rotterdam, is the
third largest port in the world; in Europe, it is second
in size only to Rotterdam (which also serves the Northern
European Delta Region). A long and difficult approach of
58 miles up the Scheldt estuary, mostly in Netherlands
territory, and considerable distance from the Rhine put
Antwerp at a decisive disadvantage as a bulk port in
the era of large vessels.
• For these reasons, Antwerp does not plan to develop
deepwater facilities (the port will be deepened to take
125,000 dwt, deemed sufficient for ore, vs. 80,000 presently),
but will concentrate on expanding the trade value of the port,
improving its general cargo-handling function, and expanding
its process-oriented industry, while connecting through
pipelines to the deepwater oil ports of Rotterdam and Le Havre.
• The Antwerp port represents a major asset to Belgium and is,
therefore, of national interest. Perhaps as much as half
of the nation's economic activity takes place in the greater
Antwerp area. Similarly, some 50% of all economic activities
in Belgium are linked to international trade. Approximately
70,000 out of 210,000 workers, or one-third of the people
employed in the Antwerp area, are working in port-related
B-1
activities. This figure does not include the
indirect or tertiary employment accounted for by banks,
insurance companies, and others who benefit from port-
related activities. The main reason for seeking expansion
of the port lies with the need (or desire) to promote
greater industrialization of the Antwerp region and to
provide port facilities that will take advantage of somewhat
larger ships.
• Antwerp rose to its present position as the world's third
largest port (in tonnage handled) as a result of a rigorous
ten-year plan, which began in the mid-1950's and greatly
expanded the dock basins, and improved access to the port.
The plan included two large new locks, a huge basin and
industrialization of the right (east) bank of the Scheldt River.
After completion of the ten-year plan, there was a slowdown
in port expansion activities between the years 1966 and 1969.
However, a new round of port expansion programs is now
being initiated.
• The increasing size of vessels and industrial land shortages
have forced Antwerp to consider another port deepening and
expansion project. Improvements will include extensive
dredging of the Scheldt to allow 125,000 dwt access to the
docks. Although this plan is complicated, because much of the
access lies through Dutch territory, success in current
negotiations should allow Antwerp to make the necessary
modifications of the Scheldt River. This will also allow
cutting the Baalhoek Canal through Dutch territory, which
will eliminate the narrow, low-radius Bend of Bath in the
river, despite ecological problems caused by cutting through
marshlands. A major secondary project is the improvement of
the distribution function of the port when the Albert Canal,
B-2
(which links Antwerp with the Belgian and German interior),
has been fully adapted to the use of push-barges, and better
connected to the new industrial areas planned for the right
and left banks.
• Antwerp's main assets seem to be:
1) Excellent communications to the interior;
2) Strong national and local support, including exports
for backhaul opportunities; and
3) Excellent docker-labor situation and efficiency.
A municipal port (38 townships, 600,000 people), Antwerp receives
state grants for infrastructure and channel maintenance.
Cargo handling and terminals are now in the hands of private
companies. Industrial investment incentives include equity
from a national development corporation, training, selection
and relocation subsidies. The acquired acreage on the left
bank for the new port/industrial expansion is known to be
excessive and beyond present needs, and the Port Authority
is prepared to initially utilize less land than that plotted
for port use. This is a planning measure that will permit future
expansion without requiring further legal proceedings to ex-
tend port acreage when needed.
• Antwerp has spent significant time, on the subject of land-
use planning related to port development. On the other hand,
authorities to date appear to have been only moderately concerned
with respect to pollution abatement or prevention efforts, in
action.-oriented programs. Maintaining Antwerp's industrial and
economic position within the nation and, indeed, with the European
Common Market, is by far the most important consideration.
A local spokesman has said, "The effective concern regarding
environmental quality can occur only in a rich and polluted
society; we haven't been rich quite long enough."
B7-3
• From an anti-pollution planning standpoint, the most important
of the Antwerp commissions is The Center for Prevention of Air
and Water Pollution, a municipal organization created in 1968.
The Center has three principal tasks: 1) to advise the town regarding
air and water pollution abatement procedures to be followed
both by the city and industry; 2) to assist in controlling air and
water pollution and solid waste pollution; and 3) to sponsor and
recommend research programs appropriate to the city's needs.
A fourth function which the Center performs is to advise
the municipal council as to whether--and under what conditions--
applications by industrial firms to build new plant facil-
ities should be approved.
• When the planned development of the left bank of the Scheldt
River begins to take place, it is expected that the Center
will be considerably more stringent in its pollution abate-
ment requirements concerning new industry that locates on the
left bank. (This expectation stems not only from a basic
concern over pollution control, but also from officials' be-
lief that the Antwerp Port is in a position to be more selective
in identifying and attracting those industries which it wishes
to have locate in the Antwerp area.)
• As yet, there are no waste-water-effluent taxes levied in
Belgium, although Center officials believe that these may
be instituted some time in the not-too-distant future and
bear some similarity to those already in effect in France.
• Waste water treatment plants are now being built by most new
industrial complexes, and discharges are made into the
Scheldt River, synchronized with the outgoing tide. Some
harmful products, such as acid, may have to be taken out to sea.
Antwerp's municipal sewage treatment capacity is inade-
quate, as is that of virtually all of the country; only 5%
of Belgium's sewage is treated.
B-4
• Relocation, because of port development, entails hardship, but
is better than subsisting in an industrializing zone. There should
be less hardship, with much more planning and individual help,
and with replacement housing started early in similar environment.
As Antwerp continues to modernize, older, less efficient harbor-
related activities will have to either be rebuilt or replaced by
some other type of activity. To date, "urban renewal" constitutes
only a tiny fraction of the district's planning efforts.
• The bulk-oil-storage-tank failure experienced in Antwerp clearly
indicates that piled-earth retaining dikes may be capable
of retaining gradually spilled materials, but that all retaining
dikes should be evaluated structurally for adequate resistance to
dynamic, shock loading of spilled material.
B-5
B.2 BACKGROUND
B.2.1 Geography
The city of Antwerp, and its associated port, is located on the upper
portion of the Scheldt River estuary in the center of a vast alluvial
plain about 55 miles from the North Sea. Most of this distance is in
Dutch territory. Though centuries old, the port began its growth after
1863 when Dutch rights to levy toll on the Scheldt were redeemed by
purchase.
The land around Antwerp itself, as well as that extending to the North Sea,
is alluvial in character, flat, sandy, and essentially featureless. A
thick layer of unconsolidated sand lies over thick clay. Much of the
area is polder land, and there are no known fresh water aquifers in the
region which might be damaged by harbor activities. Fresh water require-
ments are obtained from inland sources.
Antwerp climate is much the same as Dunkirk -- somewhat wet with strong
prevailing winds coming from the southwest quadrant. Visibility is
greater than 4 km (2.5 miles) over 80% of the time.
The variation between high and low water at Antwerp is 13 feet; spring
tides result in a rise and fall of an additional 3 feet, for a maximum
effective depth in the channel of approximately 42 feet. The strength
of the river current is insufficient to keep the natural channel clean,
and considerable sand is brought in by the tide. Maintenance dredging
is a continual large-scale operation to keep the channel depth at a
minimum of 42 feet.
B.2.2 General Land Use
As would be expected, the greatest concentration of heavy industrial
activity is at the new Kanaaldok basin opened along the right (east)
bank in 1967 (Figure B-1). The heaviest population concentration is
within the city of Antwerp itself, south and upstream on the same right
B-7
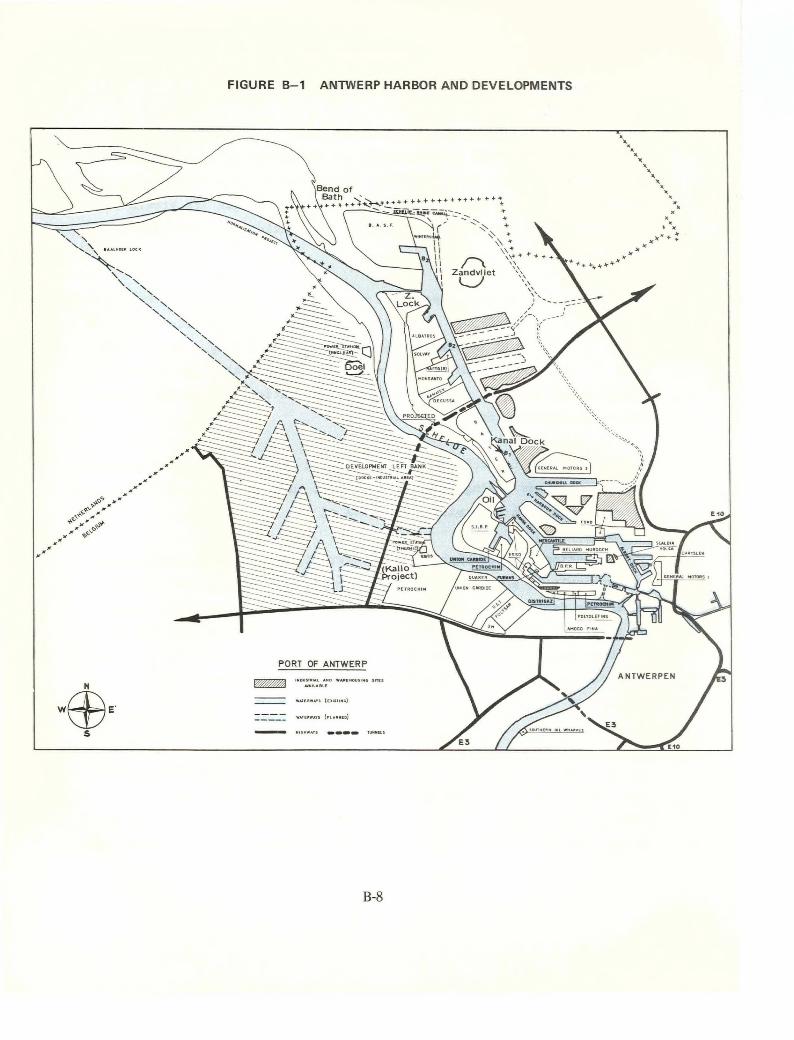
Bend of
Bath ++++4 +++.,+.+,.++++++++++++++++ ++ \
1:v
. , I 1 \\ + 11
\\0'.,.. + + I i I 1 r-\ " ....
\I Zandviiet s s,s
I Li , \\
‘■,,,, /
,
E 1,1
WINY
_
%,
4"*''
•■ -•
D EVELOPMENT LEFT BANK
Won -INDUSTRIAL ANDO
!la
1'4
PORT OF ANTWERP A NTWERPEN
I WSW 0 ARE OUS NO SITES ANAILDDLE
WO. NWAYS (EXISTING)
WATSRWAYS
NIIONWAYS TUMORS
E3 marl.. ail WHARVES
E3 [10
DAALNOER LOCK
\ N \
\
N. s`
".5 N
\ N
N Nss \
;,'■
t.
FIGURE B-1 ANTWERP HARBOR AND DEVELOPMENTS
bank of the Scheldt, and indeed it is here that the bulk of all
commercial activity is also carried on. Around greater Antwerp, which
includes up to 38 municipalities, polder farming is the principal
activity. These farms are usually quite small by U.S. standards, ranging
in size between 20 and 50 hectares (50 to 125 acres).
There appears to be relatively little open land on the right bank near
Antwerp, other than a few strips along the Scheldt River, which can be
used for conservation purposes. On the other hand, within a distance
of about 15 miles northeast of the center of Antwerp, near the town of
Kappellen, wild deer are still seen in partially forested or cultivated
residential areas.
B.2.3 Demography
Over the years, Antwerp has grown in areal extent by incorporating neigh-
boring villages; since 1959, the city's boundaries have been increased
to extend the administrative area from 24 square miles (21,470 acres) to
54 square miles (34,600 acres) with a population of some 600,000 people,
for an average population density of 11,000 per square mile. For compar-
ative purposes, Baltimore, Maryland has a 1970 population density of 11,400
per square mile, and Philadelphia, Pennsylvania, had a population density
of 14,600 per square mile in 1970.
B.2.4 Port Basin
The port now extends over 12,500 acres, with industrial plants occupying
6,200 acres. Extensive plans are under way to extend port operations
over to the left bank of the Scheldt River. The new Kanaaldok basin system
has an average depth of 55 feet, and the entrance lock a depth of 44 feet.
A partially loaded 90,000 dwt tanker with a fully loaded draft of 42'6",
is the largest vessel ever to enter the harbor. Effective tonnage which
can be accommodated by the port is about 60,000-70,000 dwt or 80,000 dwt
special design.
B-9
The proposed new harbor facility on the left (west) bank of the Scheldt,
called the Baalhoek Canal, should be able to handle vessels up to
125,000 dwt, depending upon configuration, and will probably be the final
depth for the Antwerp port. To utilize this capacity however, the
Scheldt itself will have to be deepened at considerable cost, both
initially and on an annual maintenance basis.
Antwerp is connected to the Meuse by the Albert Canal and benefits from
considerable French and German traffic as the port has closer communica-
tions to the industrial areas of Eastern France and Southern Germany
than any other Channel or North Sea port.
B.3 INSTITUTIONS AND FINANCING
B.3.1 Institutional Authority
Because of Antwerp's importance to the Belgian economy, basic policy
decisions relating to its development and expansion rest with the
Ministry of Public Works at the national level, which serves to combine
the functions held by the U.S. Army Corps of Engineers and the Department
of Transportation. Federal appropriations for port development activities
are secured through the legislature on the recommendation of the Public
Works Minister. Historically, decisions regarding what was to be done
with the port were based primarily on economic, engineering, and
political considerations, and environmental matters played a relatively
small part. Recently, however, environmental concern, particularly
with respect to land use and air pollution, have begun to play a more
important role, and accordingly have involved the Ministry of Public
Health.
On the regional level, authority rests with the Provincial Government,
whose principal responsibility is to assure reasonable consideration of
the needs of the people within the province in terms of such factors as
job opportunities, public health, transportation, and the like. With
respect to environmental matters, the Provincial Government ultimately
approves or disapproves applications by industrial or commercial firms
to erect and operate manufacturing facilities on public lands.
B-10
On a local level, illustrated by Figure B-2, the highest authority is the
City Council, consisting of 54 representatives elected by the population
for a period of six years. At the present time, the City Council
represents some 38 separate municipalities within "Greater Antwerp."
The number of members of the City Council is fixed by law according to
the number of inhabitants. The Burgomaster, or head of the Council,
is appointed by the King on the proposal of the City Council.
The city of Antwerp owns the dock, the port area, and the port equipment,
and the city expands its boundaries to suit port expansion. Direct
daily administration of the port is headed by a General Manager, who
controls the activities of the approximate 2,300 administrative and
technical staff personnel. It is primarily through the City Council
and its various commissions and aldermen (including a new alderman for
environment) that the final details of port development and operation are
worked out.
B.3.2 Development Financing
Since World War II, the state has financed practically 100% of basins,
locks, and quays, and granted them to the city, particularly the 2,000
hectares (5,000 acres) extension on the right bank (Kanaaldok) which
was voted in 1956. Land fill is done by the city, the state, or private
interests depending on the case. Private industry will finance site
preparation and handling equipment (formerly fitted by city) against
15-to-40 year site leases which thus far have been renewable without
problems. Two major exceptions to the practice of land rental are Bayer
and BASF (Badische Anilin Sodawerke Fabriek) which were the first two
companies in the new Kanaldok development and which insisted on purchasing
their land.
A major group of beneficiaries appear to be the citizens, as a 22%
unemployment ratio in 1955 has evolved into a tight labor market. The
state also receives a 7% transfer tax for each transfer of property and
volume of cargo trading. Manufacturing industries have earned about
B-11
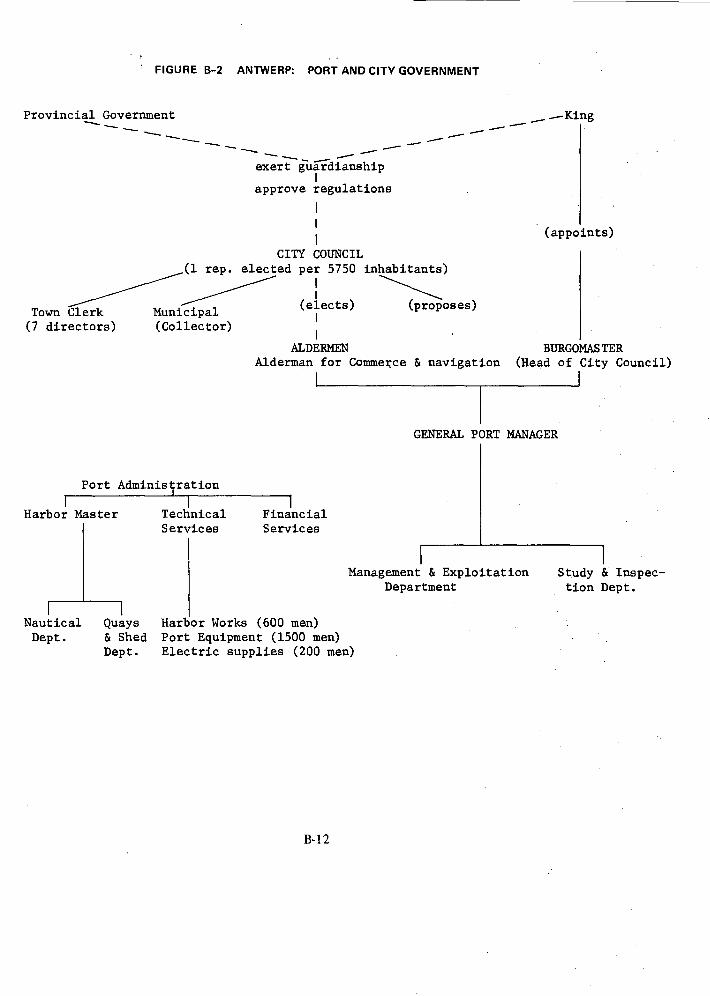
--King
(appoints)
BURGOMASTER
(elects)
ALDERMEN
Town Clerk Municipal (7 directors) (Collector)
exert iiii-i-dianship
approve regulations
CITY COUNCIL (I rep. elected per 5750 inhabitants)
(proposes)
FIGURE B-2 ANTWERP: PORT AND CITY GOVERNMENT
Provincial Government
Alderman for Commerce & navigation (Head of City Council)
1
GENERAL PORT MANAGER
Port Administration
I I I 1 Harbor Master Technical Financial
Services Services
Management & Exploitation Study & Inspec- Department tion Dept.
1 1 Nautical Quays Harbor Works (600 men) Dept. & Shed Port Equipment (1500 men)
Dept. Electric supplies (200 men)
B-12
three times the 10 billion Belgium Francs (BF) invested. Finally, the
nation has kept export traffic which might have been lost.
Officials at Antwerp believe that their port receives the least financial
aid of any other major European port. They also believe that they are
handicapped by the following factors:
• Interest on and repayments of loan capital are charged
to revenue;
• Losses are carried forward, bear interest, and must
be made good;
• The port has to bear the cost of police, fire brigade,
and street maintenance in the port area; and
• The port has to pay for the building and operation of
locks.
But, we believe the above factors are overshadowed by the following
financial advantages which Antwerp has:
• The central government paid for $140 million worth of
fixed assets, for which the Port of Antwerp has neither
to pay interest nor to charge depreciation; and
• The central government pays for dredging in the river.
B.3.3 Post-World War II Development
Within a radius of 300 km (180 miles) from Antwerp, there are about
100 million inhabitants and one of the most dense industrial concentrations
in the world. Since 1870, the port traffic has increased on an average
of 44% per decade. The last ten years has seen the greatest expansion
in port activities, and since 1960 goods traffic has increased by 90%
in volume to make Antwerp the world's third largest port.
Before World War II, the port operated largely as a commercial and traffic
center. Since the War, the demand for petroleum and chemical products
has resulted in a rapid growth of industrial complexes, which in turn
greatly stimulated port operations.
B-13
Major dates and events in the Port of Antwerp's expansion are as follows:
1955 -- an investment law providing for a Development
Plan involving government appropriations to the amount
of $100 million during the period 1956-1966;
• 1960 -- opening of the Fifth Harbor Dock and connected
Industrial Basin;
• 1962 -- opening of the dock for oil tankers;
• 1964 -- opening of 6th Harbor Dock;
• 1967 -- opening of the Canal Dock, the Zandvliet Lock
and the Churchill Dock (Kanaaldok basin system);
• 1969 -- opening of Scheldt tunnel and circular speedway
Europe-3 (Route E-3); and
• 1971 -- planned port expansion to the Left Bank.
The 1956-1966 development of the Port of Antwerp was essentially
designed to implement regional industrial development goals.
The Ministry of Public Works has spent over $200 million since 1956
implementing the Antwerp Port plan. About $70 million of this was for
expanding waterways, such as dredging the waterways of the Scheldt basin.
Little money as yet has been allocated for the development of the left
bank -- the big problem is that it is partly in Dutch territory. The
Dutch are, of course, not particularly interested in furthering
Antwerp's competitive stature without receiving some type of compensa-
tion.
B.4 ECONOMIC FUNCTION OF THE PORT
The attraction of the Antwerp Port makes itself felt far beyond the
frontier of the Belgian-Luxembourg Economic Union. As a matter of fact,
it extends into the populous parts of West and Central Europe, which are
part of one of the most intensely industrialized regions of the world.
Antwerp owes its original attraction to a favorable geographical position
B-14
in relation to the industries of Western Europe. The development of
Western European industry meant a parallel development of Antwerp as the
most important port for exports of industrial products (in terms of value)
on the European continent. The volume of goods handled in the Port of
Antwerp has been doubling every 10 years since World War II. This is due
to several factors, some of which are favorable geographical location,
excellent road, rail, and canal links with the interior, close cooperation
of the port authority with the firms using the port, a good business climate,
and strong national support.
This dominant position as a port for general cargo exerted strong attrac-
tion on the world's merchant fleet. Antwerp has become the main liner
port of the continent, with approximately 300 regular shipping lines.
There has also been increasing growth in container and roll-on/roll-off
traffic. The automobile industry inside the port area is well estab -
lished; GMs Antwerp plant (established in the early 1920's) is pro-
ducing 230,000 automobiles annually, while the nearby Ford plant pro-
duces 30,000 agricultural tractors each year.
Bulk cargoes--petroleum, ores, grains, coal, phosphate, and chemicals-- 0
increased from 22 million tons in 1960 to over 52 million tons in 1969.
Petroleum refineries in the port's industrial zone develop an annual
output of refined products that represents the single most important import,
which presently amount to 24.5 million tons. General cargo handled has
increased from 15 million tons in 1960 to over 20 million tons in 1969,
of which approximately 14 million tons were for export.
B.4.1 Sea-Borne Traffic
In 1969, a total volume of 73 million tons was handled, as against 21.5
million tons in 1950. This growth is due to a continuous increase of
inward traffic, which (in 1969) amounted to about 48.9 million tons
(versus 10.6 million tons in 1950). The outward traffic, on the other
B-15
hand, has tripled since 1950, and presently amounts to 24.1 million
tons. The ever-growing demand by the continental industries for raw
materials, and the growth of sea-going trade, are the main forces
underlying this evolution;
B.4.2 National Traffic
The importance of a port as a link between inland traffic and sea traffic
depends mainly on the economic and geographic structure of its hinter-
land. Thus, the economic interdependence between Antwerp and its national
interior -- in fact, the territory of the B.L.E.U. (Belgian/Luxembourg
Economic Union) -- is of basic importance. This interdependence rests
upon two main factors:
• If the standard of living of the Belgian population is to
be maintained, very great quantities of raw materials
have to be imported from overseas (na:Mely, oil, ores,
coal, cereals), and at the same time, exports to overseas
markets are indispensable, since trade must be in rough
balance; and
• It is of vital importance for a world port to have
national traffic, which guarantees that port equipment 0 will attain maximum efficiency.
In these two factors, one finds a remarkable correlation between the increase
in Belgian economic activity and the increase in port traffic at Antwerp.
In recent years, national traffic (imports and exports) reached up to
54 million tons. This means that 90% of the total overseas trade of
the B.L.E.U. is handled by Antwerp. It is this national traffic, and
its relative stability, that has attracted foreign shipowners, who are
particularly interested in general return cargo.
B.4.3 Main Commodities
With the growth of West European industry, the port of Antwerp has
gradually become the most important general cargo port of the continent.
The share of general cargo varies between 65% and 70% of total outgoing
B-16
tonnage. In 1969, overseas general cargo traffic armroximated 20.6 million
tons (see Table B-1). Although Antwerp is a typical general cargo port,
transshipment of bulk cargoes is very important, especially for
incoming commodities.
a. Import Traffic
Mineral oil, ores and phosphates, chemicals, cereals, and coal are (when
measured in volume) the most important of the goods brought to Antwerp
(see Table B-2). Certain traffic patterns underwent striking evolution
in the course of the postwar period. For instance, incoming petroleum
has increased threefold since 1960; Antwerp has evolved as a
center of refineries and petrochemicals, the ever-increasing demand
of the hinterland was 24.5 million tons in 1969. The growth of
ore traffic is mainly a structural phenomenon and a direct consequence
of increased steel production (1969: 14.3 million tons). Other
important products are chemicals, fruit, fertilizers, grain and coal;
but quantities are much smaller.
b. Export Traffic
The greatest share of the outward traffic is in iron and steel
products. Though B.L.E.U. products of heavy industry are the basis of
this traffic, an important part also comes from France and West Germany.
The large number of sailings and the specialized handling facilities
attract steel forwarders of neighboring countries. This traffic, which
regularly reaches between 6 and 8 million tons per year, makes up 25 % to
35% of total outgoing traffic and much of it goes to The Great Lakes on
backhaul with coal or ore carriers. Other important outgoing commodities
are fertilizers, mineral oils, and chemicals (see Table B-3).
B.4.4 Traffic By Barge
Every year, some 60,000 barges enter the port. In 1969, they aggregated
35 million tons (Table B-4). Since 1960 this barge tonnage has
increased by 60%. About 60% of barges entering Antwerp are Belgian
registered, the remaining 40% are Dutch, Swiss, French, or German.
B-17
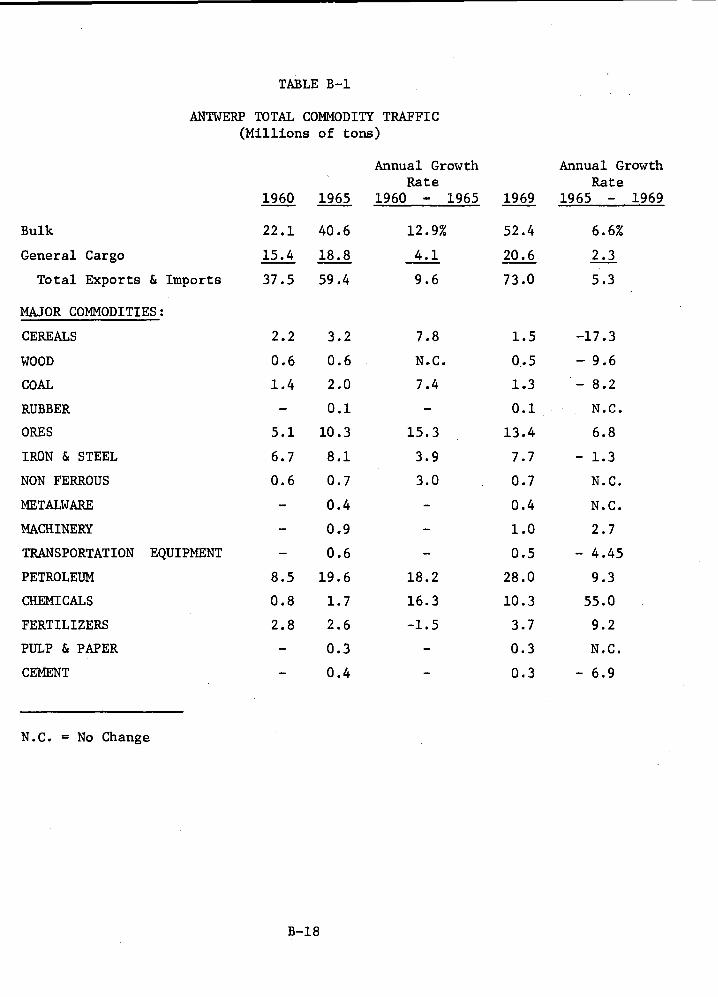
TABLE B-1
ANTWERP TOTAL COMMODITY TRAFFIC (Millions of tons)
Annual Growth Annual Growth Rate Rate
1960 1965 1960 - 1965 1969 1965 - 1969
Bulk 22.1 40.6 12.9% 52.4 6.6%
General Cargo 15.4 18.8 4.1 20.6 2.3
Total Exports & Imports 37.5 59.4 9.6 73.0 5.3
MAJOR COMMODITIES:
CEREALS 2.2 3.2 7.8 1.5 -17.3
WOOD 0.6 0.6 N.C. 0.5 - 9.6
COAL 1.4 2.0 7.4 1.3 - 8.2
RUBBER - 0.1 - 0.1 N.C.
ORES 5.1 10.3 15.3 13.4 6.8
IRON & STEEL 6.7 8.1 3.9 7.7 - 1.3
NON FERROUS 0.6 0.7 3.0 0.7 N.C.
METALWARE - 0.4 - 0.4 N.C.
MACHINERY - 0.9 - 1.0 2.7
TRANSPORTATION EQUIPMENT - 0.6 - 0.5 - 4.45
PETROLEUM 8.5 19.6 18.2 28.0 9.3
CHEMICALS 0.8 1.7 16.3 10.3 55.0
FERTILIZERS 2.8 2.6 -1.5 3.7 9.2
PULP & PAPER - 0.3 - 0.3 N.C.
CEMENT - 0.4 - 0.3 - 6.9
N.C. = No Change
B-18
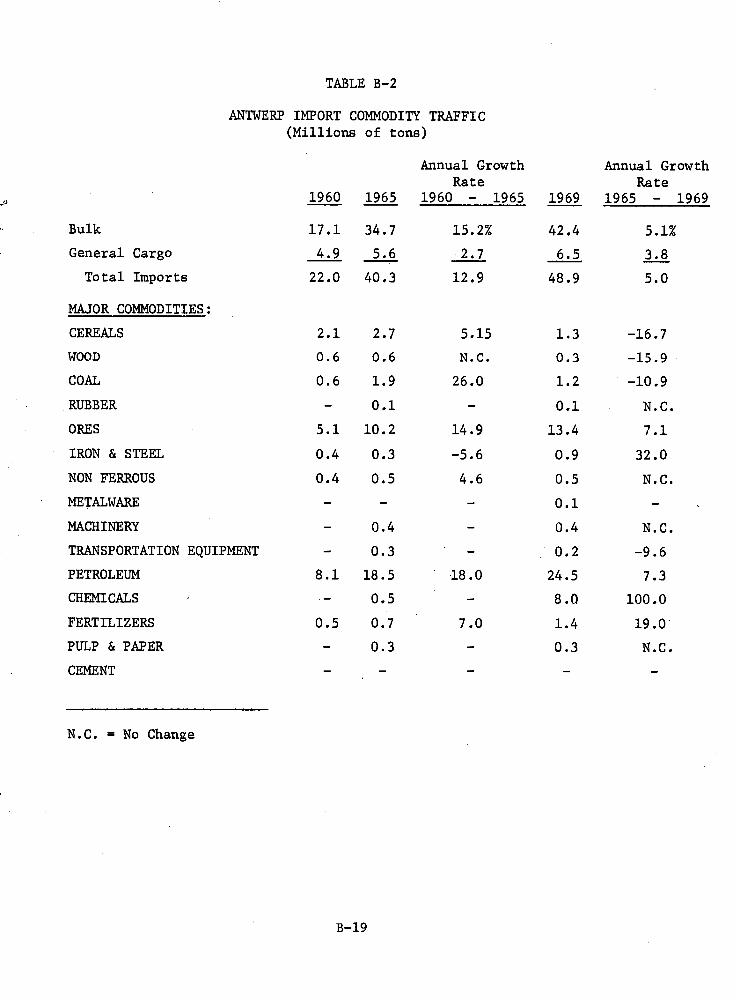
TABLE B-2
ANTWERP IMPORT COMMODITY TRAFFIC (Millions of tons)
Annual Growth Annual Growth Rate Rate
1960 1965 1960 - 1965 1969 1965 - 1969
Bulk 17.1 34.7 15.2% 42.4 5.1%
General Cargo 4.9 5.6 2.7 6.5 3.8
Total Imports 22.0 40.3 12.9 48.9 5.0
MAJOR COMMODITIES:
CEREALS 2.1 2.7 5.15 1.3 -16.7
WOOD 0.6 0.6 N.C. 0.3 -15.9
COAL 0.6 1.9 26.0 1.2 -10.9
RUBBER - 0.1 - 0.1 N.C.
ORES 5.1 10.2 14.9 13.4 7.1
IRON & STEEL 0.4 0.3 -5.6 0.9 32.0
NON FERROUS 0.4 0.5 4.6 0.5 N.C.
METALWARE - - - 0.1 -
MACHINERY - 0.4 - 0.4 N.C.
TRANSPORTATION EQUIPMENT - 0.3 - 0.2 -9.6
PETROLEUM 8.1 18.5 18.0 24.5 7.3
CHEMICALS - 0.5 - 8.0 100.0
FERTILIZERS 0.5 0.7 7.0 1.4 19.0
PULP & PAPER - 0.3 - 0.3 N.C.
CEMENT -
N.C. = No Change
B-19
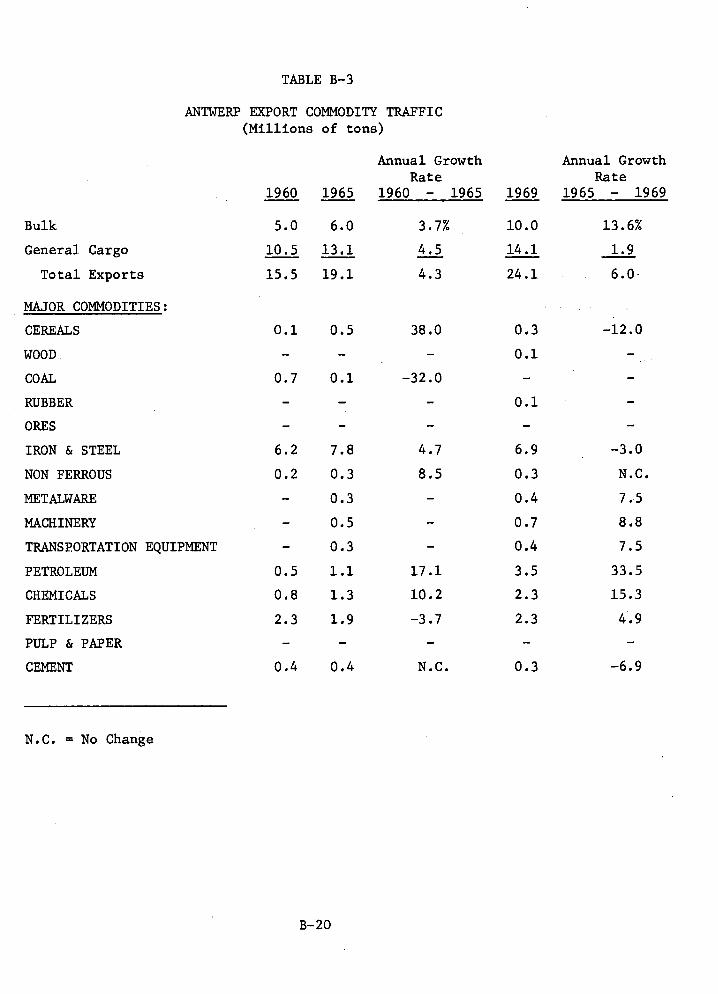
13.6%
1.9
6.0
3.7%
4.5
4.3
10.0
14.1
24.1
38.0
-
-32.0
4.7
8.5
1■•
17.1
10.2
-3.7 ■■■•
N.C.
-12.0
■■■
■■•
-6.9
-3.0
N.C.
7.5
8.8
7.5
33.5
15.3
4.9
0.3
0 .1
0 .1
6.9
0.3
0.4
0.7
0.4
3.5
2.3
2.3 ••••
0.3
TABLE B-3
ANTWERP EXPORT COMMODITY TRAFFIC (Millions of tons)
Annual Growth Annual Growth Rate Rate
1960 1965 1960 - 1965 1969 1965 - 1969
Bulk 5.0 6.0
General Cargo 10.5 13.1
Total Exports 15.5 19.1
MAJOR COMMODITIES:
CEREALS
WOOD
COAL
RUBBER
ORES
IRON & STEEL
NON FERROUS
METALWARE
MACHINERY
TRANSPORTATION EQUIPMENT
PETROLEUM
CHEMICALS
FERTILIZERS
PULP & PAPER
CEMENT
0.1 0.5
0.7 0.1
ONO
6.2 7.8
0.2 0.3
- 0.3
- 0.5
- 0.3
0.5 1.1
0.8 1.3
2.3 1.9
0.4 0.4
N.C. = No Change
B-20
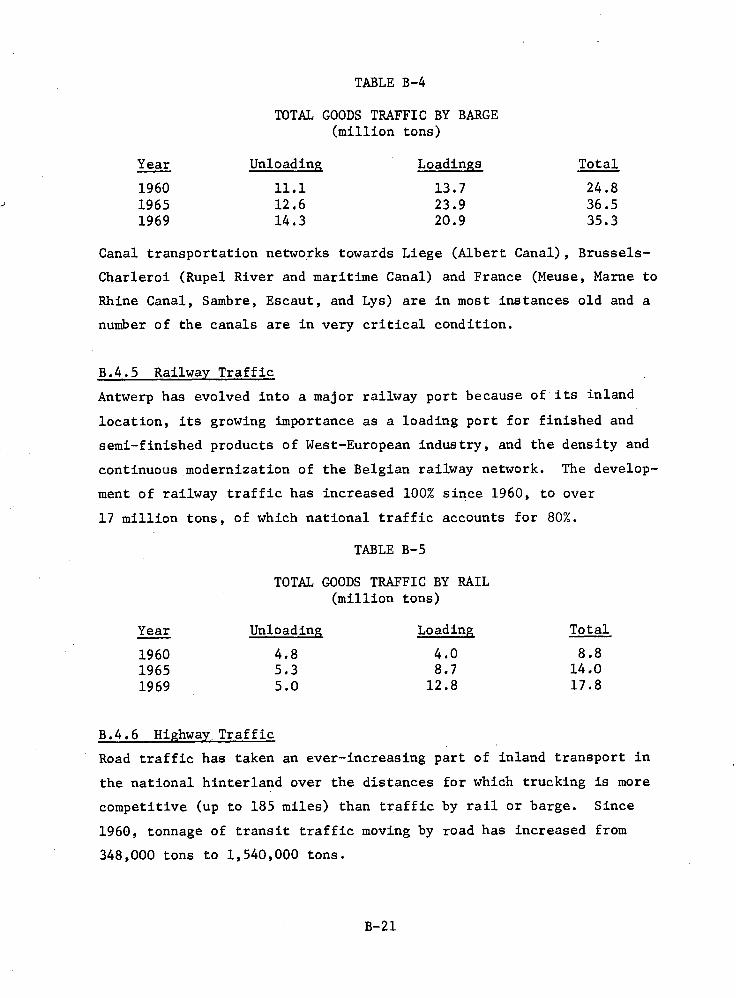
Total
24.8 36.5 35.3
TABLE B-4
TOTAL GOODS TRAFFIC BY BARGE (million tons)
Year Unloading Loadings
1960 11.1 13.7 1965 12.6 23.9 1969 14.3 20.9
Canal transportation networks towards Liege (Albert Canal), Brussels-
Charleroi (Rupel River and maritime Canal) and France (Meuse, Marne to
Rhine Canal, Sambre, Escaut, and Lys) are in most instances old and a
number of the canals are in very critical condition.
B.4.5 Railway Traffic
Antwerp has evolved into a major railway port because of its inland
location, its growing importance as a loading port for finished and
semi-finished products of West-European industry, and the density and
continuous modernization of the Belgian railway network. The develop-
ment of railway traffic has increased 100% since 1960, to over
17 million tons, of which national traffic accounts for 80%.
TABLE B-5
TOTAL GOODS TRAFFIC BY RAIL (million tons)
Year Unloading Loading Total
1960 4.8 4.0 8.8 1965 5.3 8.7 14.0 1969 5.0 12.8 17.8
B.4.6 Highway. Traffic
Road traffic has taken an ever-increasing part of inland transport in
the national hinterland over the distances for which trucking is more
competitive (up to 185 miles) than traffic by rail or barge. Since
1960, tonnage of transit traffic moving by road has increased from
348,000 tons to 1,540,000 tons.
B-21
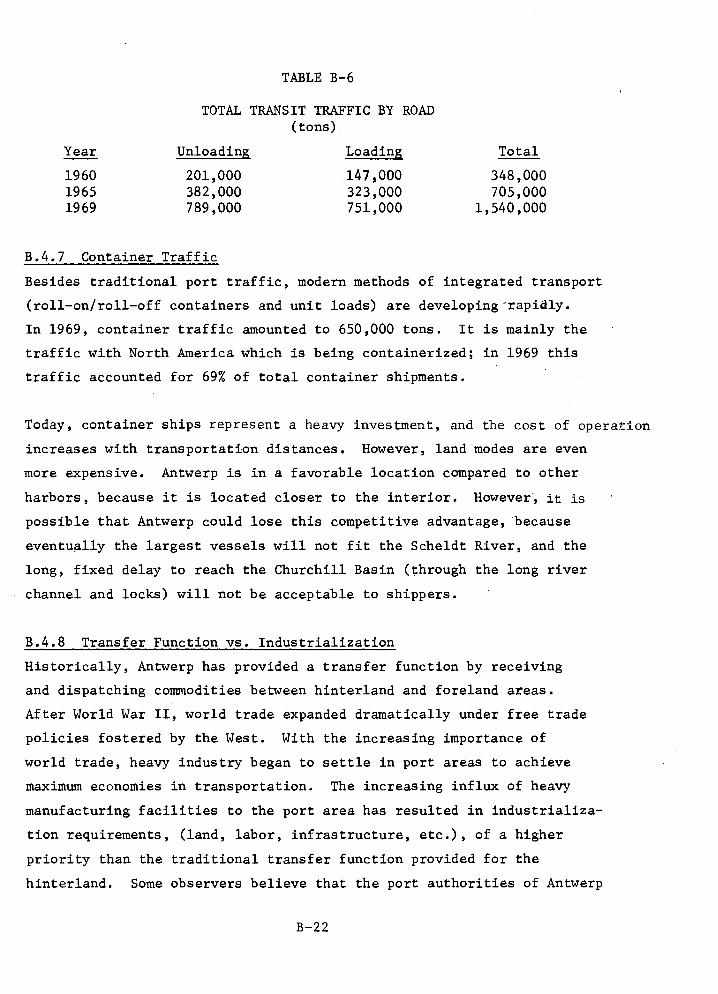
TABLE B-6
TOTAL TRANSIT TRAFFIC BY ROAD (tons).
Year Unloading Loading Total
1960 201,000 147,000 348,000 1965 382,000 323,000 705,000 1969 789,000 751,000 1,540,000
B.4.7 Container Traffic
Besides traditional port traffic, modern methods of integrated transport
(roll-on/roll-off containers and unit loads) are developing -rapidly.
In 1969, container traffic amounted to 650,000 tons. It is mainly the
traffic with North America which is being containerized; in 1969 this
traffic accounted for 69% of total container shipments.
Today, container ships represent a heavy investment, and the cost of operation
increases with transportation distances. However, land modes are even
more expensive. Antwerp is in a favorable location compared to other
harbors, because it is located closer to the interior. However, it is
possible that Antwerp could lose this competitive advantage, because
eventually the largest vessels will not fit the Scheldt River, and the
long, fixed delay to reach the Churchill Basin (through the long river
channel and locks) will not be acceptable to shippers.
B.4.8 Transfer Function vs. Industrialization
Historically, Antwerp has provided a transfer function by receiving
and dispatching commodities between hinterland and foreland areas.
After World War II, world trade expanded dramatically under free trade
policies fostered by the West. With the increasing importance of
world trade, heavy industry began to settle in port areas to achieve
maximum economies in transportation. The increasing influx of heavy
manufacturing facilities to the port area has resulted in industrializa-
tion requirements, (land, labor, infrastructure, etc.), of a higher
priority than the traditional transfer function provided for the
hinterland. Some observers believe that the port authorities of Antwerp
B-22
and Rotterdam have allowed inland transportation links and services to
erode through over-concentration on port industrialization.
B.4.9 Antwerp Dock Workers
The Antwerp docks have not faced the same labor shortages as other
European ports. Special respect is given to the Antwerp dock worker,
who is treated as a major craftsman. Jobs are handed down from father
to son, and a statue honoring the dock worker is on the principal city
square. The unions work closely with management in all-important port
decisions, and upper management often appears at the docks. Consequently,
Antwerp has the advantage of having sufficient, highly-trained dock
workers at hand. These men run the port on a 24-hour basis, throughout
the week, and on Sundays and holidays, when required. Productivity
premiums have not been found necessary, and might even be harmful.
The dock workers' salary status is regulated by collective agreement
between workers' and employers' delegates. In 1928, when the first
collective agreements were reached, the basic salary was fixed so that
four days of work would insure a weekly living minimum. In 1946, a
special indemnity was introduced for the days on involuntary unemploy-
ment. This special indemnity consists of assistance money in case of
unemployment (just as for other workers in Belgium), plus a special
contribution from port employers. By contrast, French longshoremen
have just obtained some form of income security, but it will take about
a generation to be truly effective.
In Antwerp, the basic wage is fixed as a function of the normal workday.
Also, the basic wage is linked to the national index of retail prices.
The "Shifts" (night shift, Sundays and holidays) are paid extra. There
are also premiums and compensation for overtime work, heavy duty, etc.
In 1964 the enlistment system was thoroughly revised and the five-day
week was introduced, probably as a compensation for streamlining and
mechanizing the port operation.
B-23
Since the 1968 "May Revolution," the five-day week is guaranteed at 7.5
hours per day, along with wage increases, the right to shift preference,
and freedom to work on Saturday (pay plus 50%) and Sunday (pay plus 100%).
Automation in the port is handled through a Commission Paritaire (50%
labor, 50% management) with mutual trust and informality. Dockers are
100% unionized and labor turnover is remarkably low; every year
Antwerp takes in only 500 new dockers (versus Rotterdam's 10,000) thanks
to this good labor/management climate.
B.4.10 Land Ownership
In general, land in the port area on the right bank of the Scheldt
River has only been available on long-term leases. In a few cases,
where the land was situated on the outskirts of the port area, land has
been sold. In this way, the West German companies, Bayer and BASF,
were able to purchase large sites although the strip of land adjacent
to the water area was only given on a long-term lease. However, on
the left bank of the River, companies have been able to purchase land
directly from the government. This latter area--previously lying
outside the boundary of the City of Antwerp--was acquired when the
government served compulsory purchase orders on the former land owners.
The length of a lease, generally 15 to 40 years, depends on the invest-
ments made by the firms involved. The big petrochemical companies
may obtain factory-site leases for periods up to 80 years. After a
lease expires, the leaseholder normally has the option to renegotiate.
B.4.11 Insufficient Land Facilities
Development of the port facilities and the industrial areas has been
rapid during the past two decades. The port area occupied by industry
has grown from 320 acres in 1950, to 7,000 acres in 1970 (Table B-7) ,
a growth factor of 22.
B-24
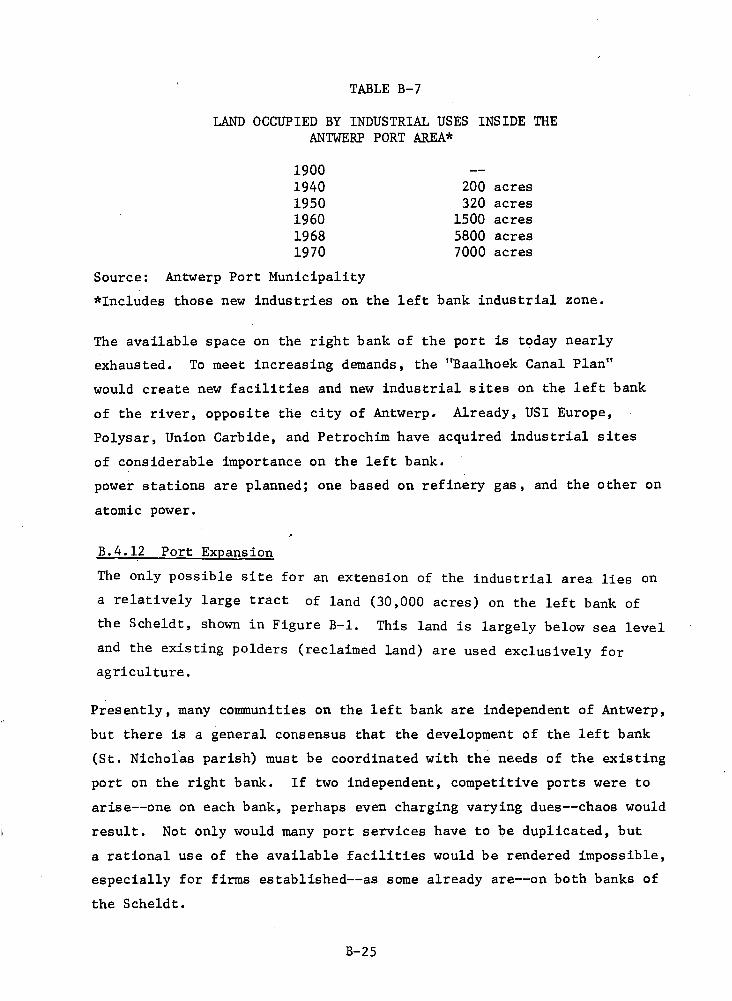
TABLE B-7
LAND OCCUPIED BY INDUSTRIAL USES INSIDE THE ANTWERP PORT AREA*
1900 -- 1940 200 acres 1950 320 acres 1960 1500 acres 1968 5800 acres 1970 7000 acres
Source: Antwerp Port Municipality
*Includes those new industries on the left bank industrial zone.
The available space on the right bank of the port is today nearly
exhausted. To meet increasing demands, the "Baalhoek Canal Plan"
would create new facilities and new industrial sites on the left bank
of the river, opposite the city of Antwerp. Already, USI Europe,
Polysar, Union Carbide, and Petrochim have acquired industrial sites
of considerable importance on the left bank.
power stations are planned; one based on refinery gas, and the other on
atomic power.
B.4.12 Port Expansion
The only possible site for an extension of the industrial area lies on
a relatively large tract of land (30,000 acres) on the left bank of
the Scheldt, shown in Figure B-1. This land is largely below sea level
and the existing polders (reclaimed land) are used exclusively for
agriculture.
Presently, many communities on the left bank are independent of Antwerp,
but there is a general consensus that the development of the left bank
(St. Nicholas parish) must be coordinated with the needs of the existing
port on the right bank. If two independent, competitive ports were to
arise--one on each bank, perhaps even charging varying dues--chaos would
result. Not only would many port services have to be duplicated, but
a rational use of the available facilities would be rendered impossible,
especially for firms established--as some already are--on both banks of
the Scheldt.
B-25
It is Antwerp's position that both banks should be under the control of
one local authority, whose task it will be to carry out decisions
efficiently and rapidly. Thus, this will involve Antwerp's incorporation
of the communes on the left bank, an idea which is still being fought by
villages such as Doel, and is not facilitated by the fact that most of
the new land is in a different province.
Of the more than 16,000 acres projected for the first development phase
of the left bank, only 10,000 acres will ultimately be available for
industry: 1,250 acres of recent housing area across the Scheldt from
Antwerp will not be expropriated (Kallo), 2,500 acres reserved for green-
belts, and 2,500 acres for transport and utility infrastructure. (There
may be 13,500 acres for further expansion westward, by successive ad-
ditions of 5,127, then 5,485, and finally 2,915 acres of raw agricultural land).
This possible extension of the Port of Antwerp on the left bank has been
under discussion for a number of years. The successful development
of a new complex of docks and industrial sites depends essentially on
the means of access, for which a completely new sea lock would be required.
The siting of this lock is determined not only by the general course of
the Scheldt, but also by the position of the main channel. The lock
must be sited where the navigable channel is nearest to the
the river bank. Such large locks are also generally constructed in
line with the flow of the river (i.e., not perpendicular to the channel).
To allow access to sea-going vessels of as large a size as possible,
and to keep river-dredging expenses to a minimum, the lock will be
constructed as far downstream as possible.
A preliminary investigation, based on a purely Belgian land-use solution,
suggested a lock near the Dutch frontier, north of Doe. The principal
B-26
objection to this scheme is that ships entering the new dock facilities
on the left bank would still have to come around the narrow "Bath curve",
which remains a navigational hazard.
However, within the broader scope of a plan embracing the Benelux
countries, there arose the idea of building a sea lock, on the left bank, much
further downstream in Holland near Baalhoek. Such a lock scheme--
$29 million for the lock----has already gained widespread approval in
Belgium, but depends on the approval of the Dutch Government.* The two
governments have already started preparatory negotiations on the project.
Though political and economic factors seem under control, considerable
concern has been evidenced by the Dutch regarding the effects of the
proposed project on adjoining marshland.
Another large excavation work will be the paring away of outjutting
land at the Bath Bend, not far from the Antwerp's dock complex. Unfor-
tunately, this piece of land is on the same Dutch marshlands and again,
until the negotiations with the Dutch government are completed, work
cannot start. But $58 million has been set aside for land purchase
that is planned to be pared away.
Despite the fact that negotiations have not yet been completed, factories
and plants are already under construction in the 10,000 acres set aside
for industrial purposes along the left bank. Belgium is therefore going
ahead with the "Kallo" lock development, which will open the backyard
of the Balhoek Canal to the Scheldt, across from the main Antwerp oil
terminal.
If this project can be realized and if a new complex can be created on
the left bank of the Scheldt, the Port of Antwerp could really be said
to have come closer to the sea. Its realization would certainly be an
*There is some frail hope that the Netherlands may share the cost of the Baalhoek lock which would open a four-mile "Kanaal Dok" equivalent in their territory, downstream from the Belgian plan.
B-27
important landmark and a major step forward in the development of the
port as a whole, even though it has been limited to ships in the 125,000
dwt range.
B.4.13 Foreign Investment
As far back as the 19th Century, people in Antwerp tried to speed up the
city's development by attracting foreign investment, which not only
created jobs but also strengthened the technology of the local community.
Even before 1925, Ford and General Motors were established in Antwerp.
More recently, foreign investors such as BP, Esso, Amoco, Phillips,
Rhone-Poulenc, Monsanto, Union Carbide, Bayer, and BASF have all played
an important part in the industrial development of Antwerp. This
extraordinarily rapid development in about ten years has been made
possible by a liberal attitude towards foreign investment.
The Ten-Year Plan which began in 1956 was a major factor in this
attraction. In the ensuing years, private investment in industry in the
port area has exceeded $1.2 billion. A further $760 million, in capital
investment is scheduled to be spent by industry in the next two years
on projects now under construction or those definitely committed.
This figure is bound to increase as present projects are expanded and
other new installations are planned.
At present, there is considerable American industrial investment in the
Port of Antwerp area. More than $450 million has been invested by
American industrial interests here since 1956. Belgian and German
investments both follow closely the level of American investment.
Thus, total investment since 1956 will exceed $2.1 billion within the
next three to four years. Total American investment will soon be over-
taken by Belgian commitments in the area. Existing private Belgian
investments plus those scheduled total $716 million; West Germany will
have invested $688 million; and the United States, $551 million, in the
next two years.
B-28
Foreign investment in the Port of Antwerp receives considerable aid
from the local banks, including branches of foreign banks and the semi-
public institutions, such as the National Society for Industrial Credit
(Nationale Maatschappij voor Krediet aan de Nijverheid - Societe
Nationale de Credit A l'Industrie). Under certain conditions, the
interest rates can be reduced for a limited period of time under the
laws designed to promote investments.
Special mention must be made of the National Investment Corporation
(Nationale Investeringsmaatschappij, NIM). This semi-public institution
may participate in the initial capitalization of a newly-formed company
or in an increase of the capital of an existing corporation. NIM's
equity participations are temporary, unless decided otherwise, and are
not restricted to a specific proportion of a company's capital. As a
general rule, however, such participation cannot exceed 80%.
A less-known type of governmental help is technical training assistance.
The National Employment Board may assist financially in the selection,
retraining, or relocation of workers and may assume, for example :
1) 25-35% of the cost of training production personnel; and 2) as much
as 50% of the cost (including travel and remuneration) of bringing
foreign technicians to Belgium or sending Belgian workers abroad for
training. To obtain such advantages, the new enterprise must file a
formal application with the National Employment Board, before the
period of training begins. The subsidies received do not have to be
repaid.
In addition, the recently-passed Belgian "law of decentralization" has
created three economic areas -- Souther (Walloon), Antwerp (Flemish),
and Brussels -- which are being given unprecedented powers to attract
foreign industry, as well as commercial establishments. While every company
contemplating location in any of the areas is treated as a special case,
incentives and grants are largely determined by the area itself with con-
sideration given to the number of people who will be eventually employed.
B-29
Tax holidays are a part of the plan, and temporary -- up to five years --
American managers usually receive special benefits.
B.4.14 Industrialization
Small industrial workshops and plants settled originally in and
around the port of Antwerp. The industrial function of the port,
however, was generally limited to specific port industries such as
shipbuilding and ship repair. Between the two World Wars, other
industries such as motor-car assembly plants, sawing mills, and a few
small refineries were set up. In 1950, the industrial sites in the
port totalled only 320 acres. Since then, the industrial function
of the port has changed in such a way that Antwerp has become a major
industrial port. This metamorphosis was caused by the well-known
European phenomenon of industrial migration to the coastal zones.
An example of how the location choice of a production center in Europe
is influenced by the cost of transport would be a fertilizer plant.
Phosphate rock can be obtained from Russia, France, or the United
States. As an example, if the phosphate rock is purchased in the
United States, the price for a specific P 205 content is $7.30 per ton
f.o.b. and the sea freight cost to ship it to Antwerp is $4.90 per ton.
However, unloading and shipping several hundred miles into the hinter-
land adds a further $2.20 per ton to the cost. Therefore, the additional
cost of phosphate rock several hundred miles inland is about 18% higher
than the cost in Antwerp. With a plant capacity of 300,000 tons
per year this difference in transportation costs amounts to $660,000
per year. Moreover, if a major percentage of the fertilizer is to be
exported and shipped out of the interior, this cost difference
would increase. With a production center at a port such as Antwerp,
all the raw materials, fuel oil, phosphate rock, sulphur, and pyrites
can be supplied by sea, thereby creating substantial savings.
Basic industries are still transferring from the interior to the sea
ports, because continental raw material reserves are being exhausted,
B-30
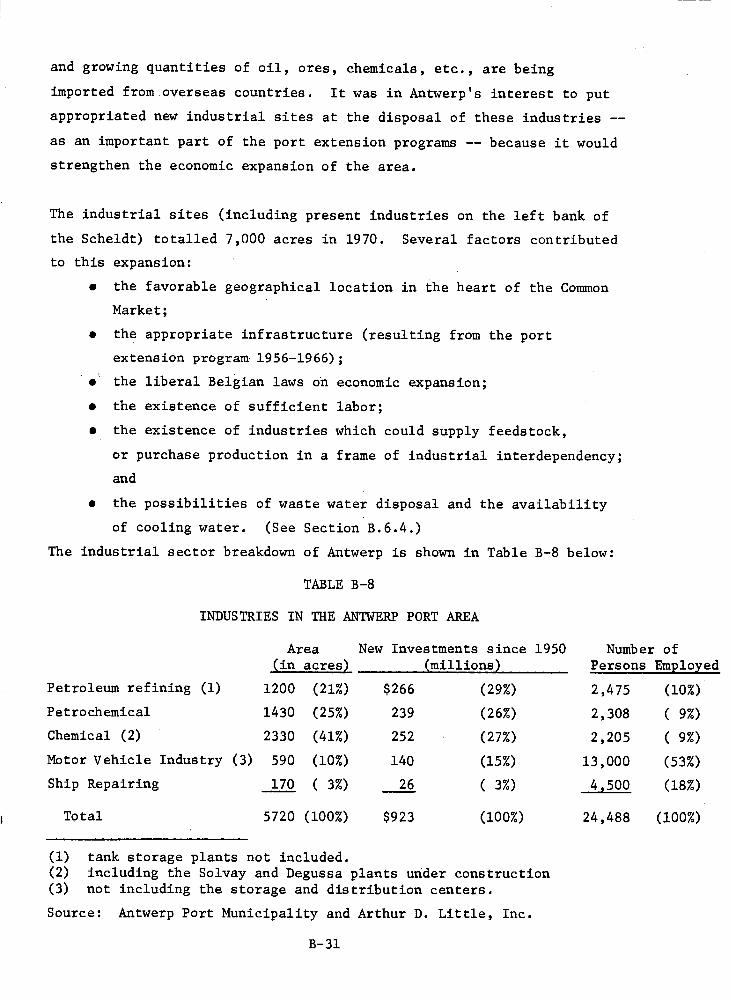
$266
239
252
140
26
(10%)
( 9%)
( 9%, )
(53%)
(18%)
(29%)
(26%)
(27%)
(15%)
( 3%)
Petroleum refining (1) 1200 (21%)
Petrochemical 1430 (25%)
Chemical (2) 2330 (41%)
Motor Vehicle Industry (3) 590 (10%)
Ship Repairing 170 ( 3%)
2,475
2,308
2,205
13,000
4.500
and growing quantities of oil, ores, chemicals, etc., are being
imported from overseas countries. It was in Antwerp's interest to put
appropriated new industrial sites at the disposal of these industries --
as an important part of the port extension programs -- because it would
strengthen the economic expansion of the area.
The industrial sites (including present industries on the left bank of
the Scheldt) totalled 7,000 acres in 1970. Several factors contributed
to this expansion:
• the favorable geographical location in the heart of the Common
Market;
• the appropriate infrastructure (resulting from the port
extension program 1956-1966);
• the liberal Belgian laws on economic expansion;
• the existence of sufficient labor;
• the existence of industries which could supply feedstock,
or purchase production in a frame of industrial interdependency;
and
• the possibilities of waste water disposal and the availability
of cooling water. (See Section B.6.4.)
The industrial sector breakdown of Antwerp is shown in Table B-8 below:
TABLE B-8
INDUSTRIES IN THE ANTWERP PORT AREA
Area New Investments since 1950 (in acres) (millions)
Number of Persons Employed
Total 5720 (100%) $923 (100%) 24,488 (100%)
(1) tank storage plants not included. (2) including the Solvay and Degussa plants under construction (3) not including the storage and distribution centers.
Source: Antwerp Port Municipality and Arthur D. Little, Inc.
B-31
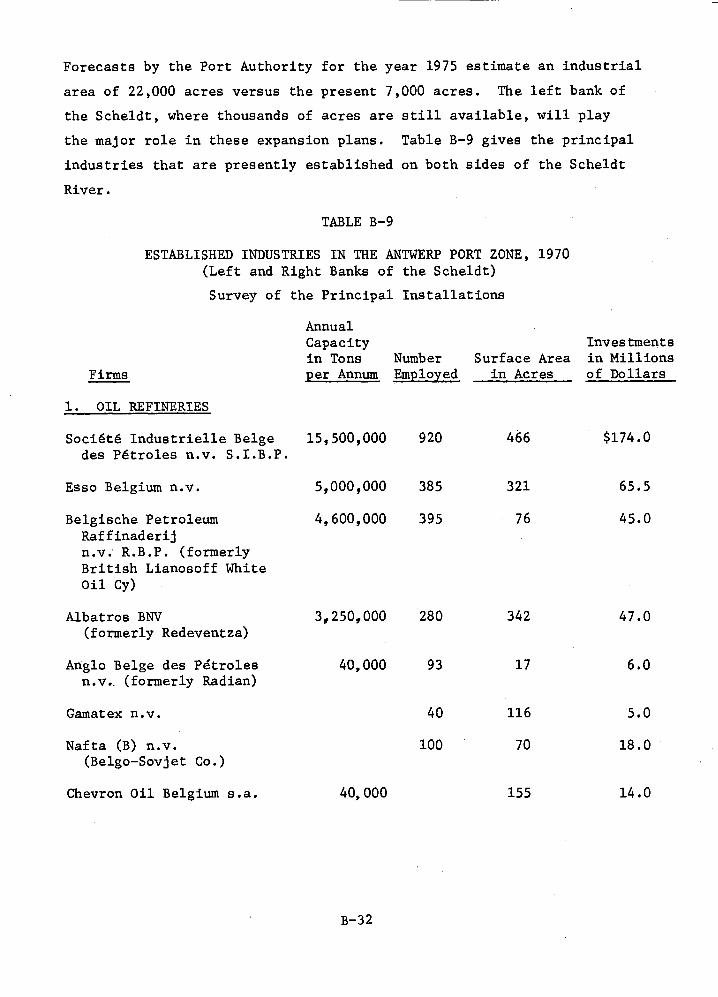
Forecasts by the Port Authority for the year 1975 estimate an industrial
area of 22,000 acres versus the present 7,000 acres. The left bank of
the Scheldt, where thousands of acres are still available, will play
the major role in these expansion plans. Table B-9 gives the principal
industries that are presently established on both sides of the Scheldt
River.
TABLE B-9
ESTABLISHED INDUSTRIES IN THE ANTWERP PORT ZONE, 1970 (Left and Right Banks of the Scheldt)
Survey of the Principal Installations
Annual Capacity Investments in Tons Number Surface Area in Millions
Firms per Annum Employed in Acres of Dollars
1. OIL REFINERIES
Soc16te Industrielle Beige 15,500,000 920 466 $174.0 des Pftroles n.v. S.I.B.P.
Esso Belgium n.v. 5,000,000 385 321 65.5
Belgische Petroleum 4,600,000 395 76 45.0 Raffinaderij n.v. R.B.P. (formerly British Lianosoff White Oil Cy)
Albatros BNV (formerly Redeventza)
Anglo Beige des Petroles n.v, (formerly Radian)
Gamatex n.v.
3,250,000 280 342 47.0
40,000 93 17 6.0
40 116 5.0
Nafta (B) n.v. 100 70 18.0 (Belgo-Sovjet Co.)
Chevron Oil Belgium s.a. 40,000 155 14.0
B-32
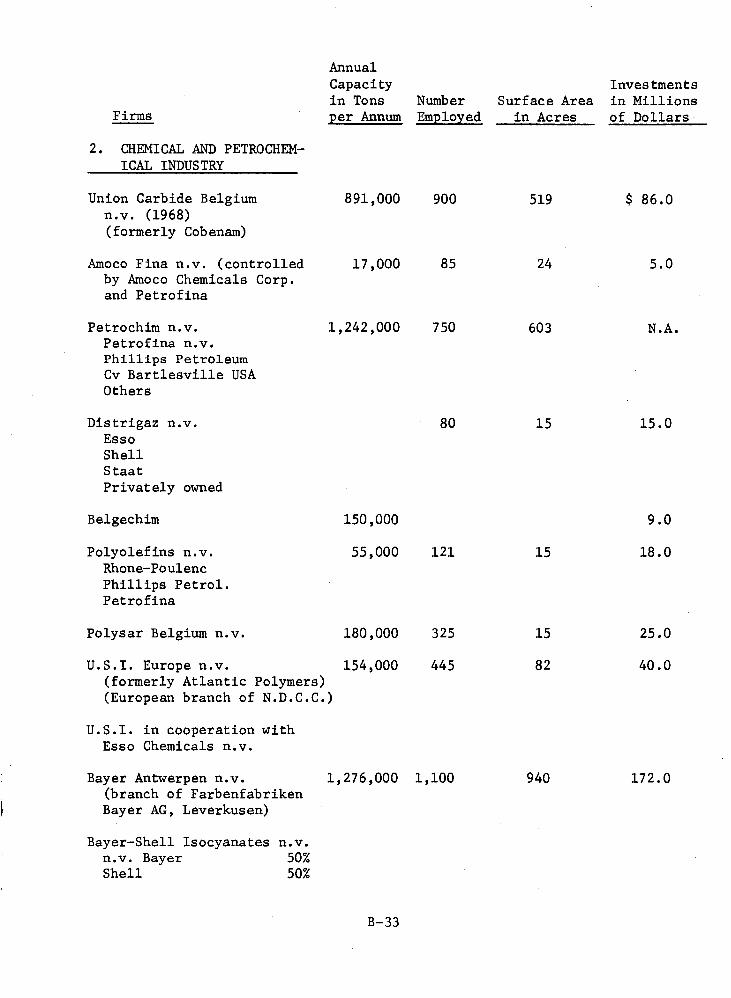
519
24
603
891,000 900
17,000 85
1,242,000 750
$86.0
5.0
N.A.
80 15.0 15
150,000
55,000 121
180,000 325
154,000 445
9.0
15 18.0
15 25.0
82 40.0
Bayer Antwerpen n.v. (branch of Farbenfabriken Bayer AG, Leverkusen)
940 1,276,000 1,100 172.0
Firms
Annual Capacity Investments in Tons Number Surface Area in Millions per Annum Employed in Acres of Dollars
2. CHEMICAL AND PETROCHEM-ICAL INDUSTRY
Union Carbide Belgium n.v. (1968) (formerly Cobenam)
Amoco Fina n.v. (controlled by Amoco Chemicals Corp. and Petrofina
Petrochim n.v. Petrofina n.v. Phillips Petroleum Cv Bartlesville USA Others
Distrigaz n.v. Esso Shell Staat Privately owned
Belgechim
Polyolef ins n.v. Rhone-Poulenc Phillips Petrol. Petrofina
Polysar Belgium n.v.
U.S.I. Europe n.v. (formerly Atlantic Polymers) (European branch of N.D.C.C.)
U.S.I. in cooperation with Esso Chemicals n.v.
Bayer-Shell Isocyanates n.v. n.v. Bayer 50% Shell 50%
B-33
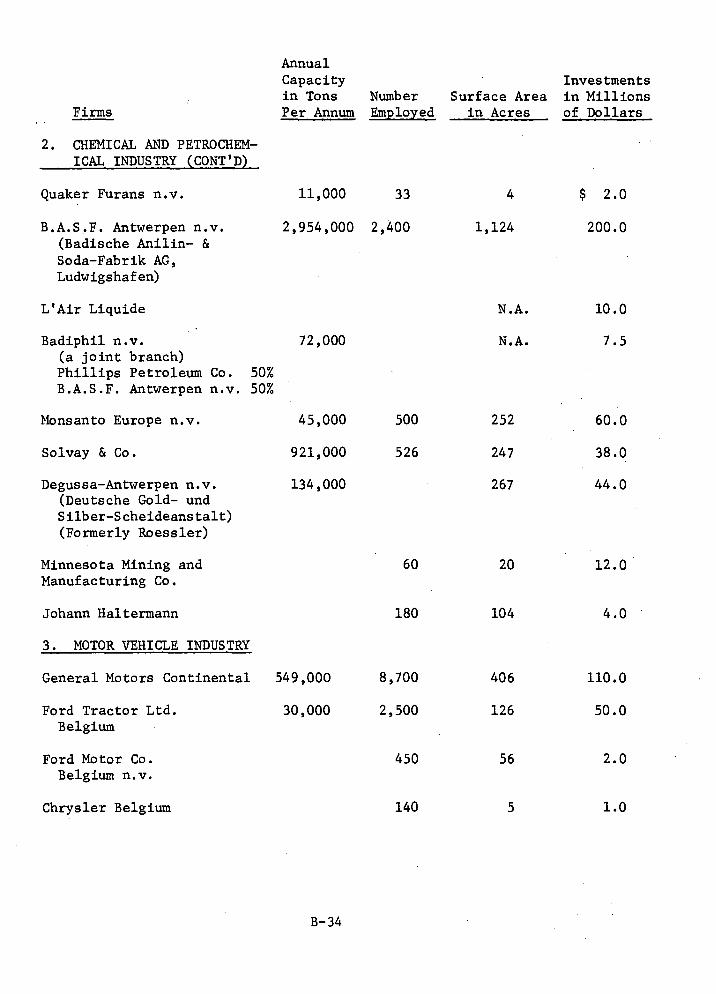
11,000 33
2,954,000 2,400
72,000
45,000 500
921,000 526
134,000
60
180
549,000
30,000
450
140
4 $ 2.0
1,124 200.0
N.A. 10.0
N.A. 7.5
252 60.0
247 38.0
267 44.0
20 12.0
104 4.0
406 110.0
126 50.0
56 2.0
5 1.0
8,700
2,500
Annual Capacity Investments in Tons Number Surface Area in Millions Per Annum Employed in Acres of Dollars Firms
2. CHEMICAL AND PETROCHEM-ICAL INDUSTRY (CONT'D)
Quaker Furans n.v.
B.A.S.F. Antwerpen n.v. (Badische Anilin- & Soda-Fabrik AG, Ludwigshafen)
L'Air Liquide
Badiphil n.v. (a joint branch) Phillips Petroleum Co. 50% B.A.S.F. Antwerpen n.v. 50%
Monsanto Europe n.v.
Solvay & Co.
Degussa-Antwerpen n.v. (Deutsche Gold- und Silber-Scheideanstalt) (Formerly Roessler)
Minnesota Mining and Manufacturing Co.
Johann Haltermann
3. MOTOR VEHICLE INDUSTRY
General Motors Continental
Ford Tractor Ltd. Belgium
Ford Motor Co. Belgium n.v.
Chrysler Belgium
B-34
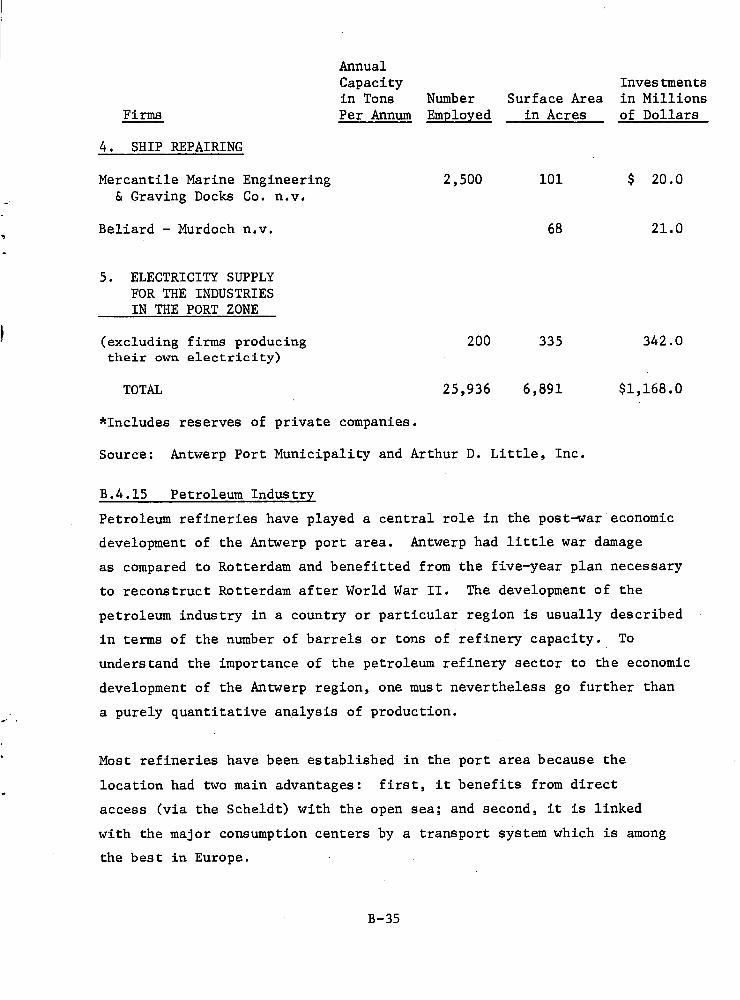
Annual Capacity Investments in Tons Number Surface Area in Millions
Firms Per Annum Employed in Acres of Dollars
4. SHIP REPAIRING
Mercantile Marine Engineering & Graving Docks Co. n.v.
Beliard - Murdoch n.v.
2,500 101 $ 20.0
68 21.0
5. ELECTRICITY SUPPLY FOR THE INDUSTRIES IN THE PORT ZONE
(excluding firms producing 200 335 342.0 their own electricity)
TOTAL 25,936 6,891 $1,168.0
*Includes reserves of private companies.
Source: Antwerp Port Municipality and Arthur D. Little, Inc.
B.4.15 Petroleum Industry
Petroleum refineries have played a central role in the post-war economic
development of the Antwerp port area. Antwerp had little war damage
as compared to Rotterdam and benefitted from the five-year plan necessary
to reconstruct Rotterdam after World War II. The development of the
petroleum industry in a country or particular region is usually described
in terms of the number of barrels or tons of refinery capacity. To
understand the importance of the petroleum refinery sector to the economic
development of the Antwerp region, one must nevertheless go further than
a purely quantitative analysis of production.
Most refineries have been established in the port area because the
location had two main advantages: first, it benefits from direct
access (via the Scheldt) with the open sea; and second, it is linked
with the major consumption centers by a transport system which is among
the best in Europe.
B-35
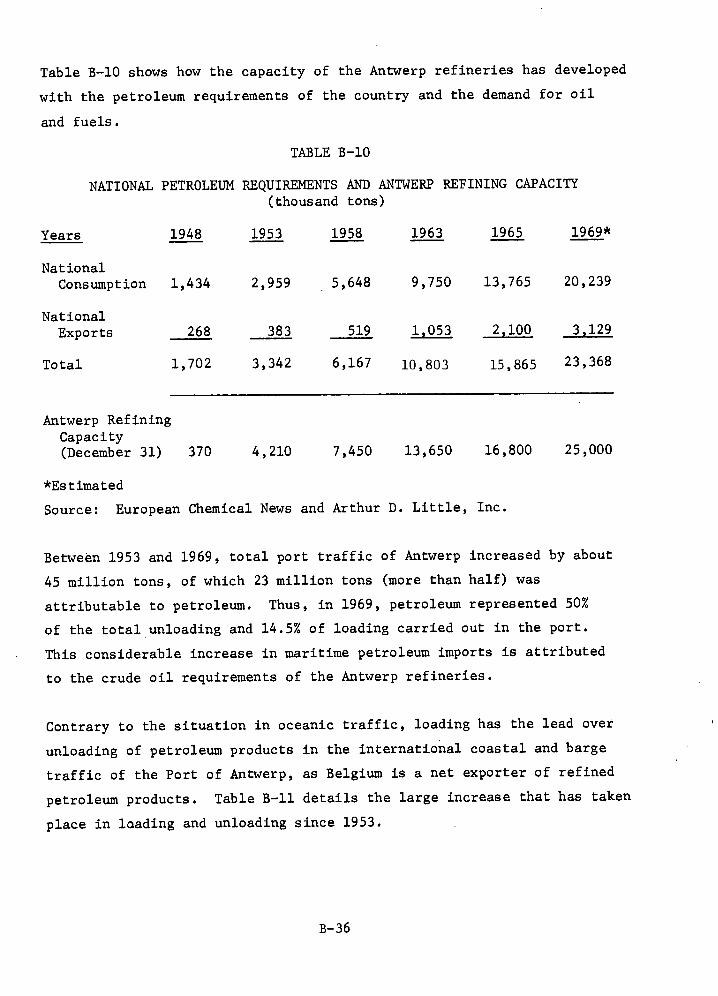
Table B-10 shows how the capacity of the Antwerp refineries has developed
with the petroleum requirements of the country and the demand for oil
and fuels.
TABLE B-10
NATIONAL PETROLEUM REQUIREMENTS AND ANTWERP REFINING CAPACITY (thousand tons)
Years 1948 1953 1958 1963 1965 1969*
National Consumption 1,434 2,959 5,648 9,750 13,765 20,239
National Exports 268 383 519 1,053 2,100 3,129
Total 1,702 3,342 6,167 10,803 15,865 23,368
Antwerp Refining Capacity (December 31) 370 4,210 7,450 13,650 16,800 25,000
*Estimated
Source: European Chemical News and Arthur D. Little, Inc.
Between 1953 and 1969, total port traffic of Antwerp increased by about
45 million tons, of which 23 million tons (more than half) was
attributable to petroleum. Thus, in 1969, petroleum represented 50%
of the total unloading and 14.5% of loading carried out in the port.
This considerable increase in maritime petroleum imports is attributed
to the crude oil requirements of the Antwerp refineries.
Contrary to the situation in oceanic traffic, loading has the lead over
unloading of petroleum products in the international coastal and barge
traffic of the Port of Antwerp, as Belgium is a net exporter of refined
petroleum products. Table B-11 details the large increase that has taken
place in loading and unloading since 1953.
B-36
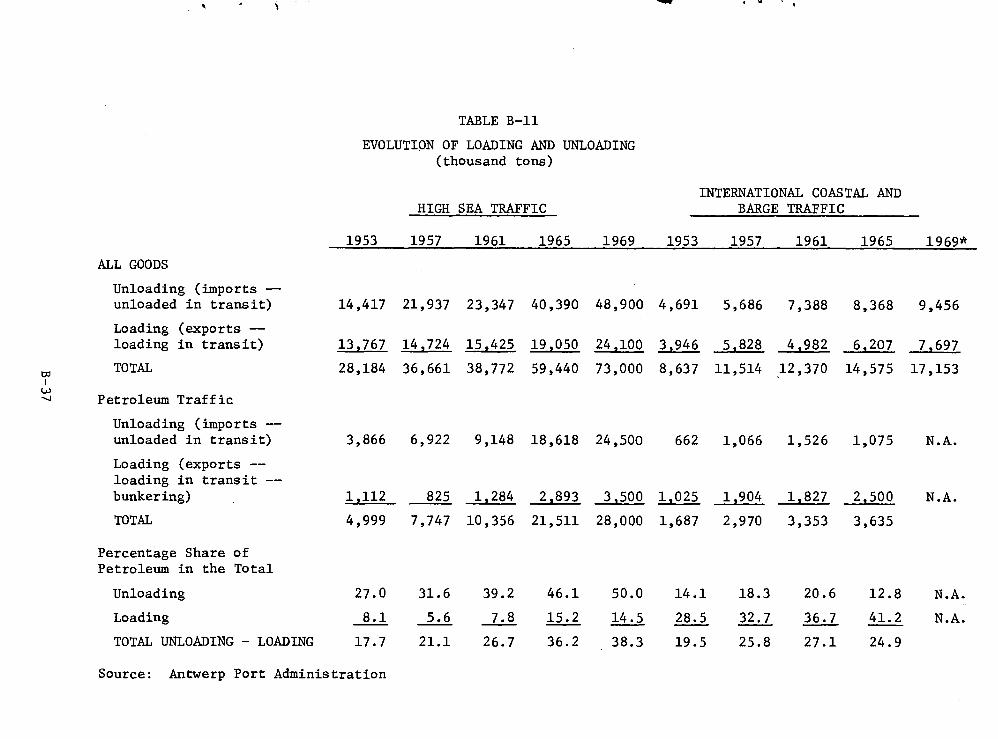
14.1
28.5
19.5
18.3
32.7
25.8
20.6
36.7
27.1
12.8
41.2
24.9
N.A.
N.A.
N.A.
TABLE B-11
EVOLUTION OF LOADING AND UNLOADING (thousand tons)
HIGH SEA TRAFFIC INTERNATIONAL COASTAL AND
BARGE TRAFFIC
1953 1957 1961 1965 1969 1953 1957 1961 1965 1969*
ALL GOODS
Unloading (imports -- unloaded in transit)
Loading (exports -- loading in transit)
TOTAL
Petroleum Traffic
Unloading (imports -- unloaded in transit)
Loading (exports -- loading in transit -- bunkering)
TOTAL
Percentage Share of Petroleum in the Total
Unloading
Loading
TOTAL UNLOADING - LOADING
14,417 21,937 23,347 40,390 48,900 4,691 5,686 7,388 8,368 9,456
13,767 14,724 15,425 19,050 24,100 3,946 5,828 4,982 6,207 7,697
28,184 36,661 38,772 59,440 73,000 8,637 11,514 12,370 14,575 17,153
3,866 6,922 9,148 18,618 24,500 662 1,066 1,526 1,075 N.A.
1,112 825 1,284 2,893 3,500 1,025 1,904 1,827 2,500
4,999 7,747 10,356 21,511 28,000 1,687 2,970 3,353 3,635
27.0 31.6 39.2 46.1 50.0
8.1 5.6 7.8 15.2 14.5
17.7 21.1 26.7 36.2 38.3
Source: Antwerp Port Administration
B.4.16 Petrochemical Industry
In recent years, a major part of the expansion in organic chemistry in
Western Europe has been in petrochemicals based on by-products from
petroleum refining. Much of this development has been due to the large
increase in refining capacity which has resulted in increasing quanti-
ties of raw materials for the petrochemical industry being made
available. Prices have also decreased as the scale of production has
increased. The Belgian petrochemical industry developed later than in
most European countries, because, historically, the Belgian chemical
industry has been coal-based.
This development and diversification into petrochemical manufacture
obviously ran parallel with a considerable increase in the availability
of feedstocks. The resulting petrochemical growth has concentrated
around the petroleum refineries.
There is a significant advantage to Antwerp's geographic location,
which permits finished products to be distributed easily to Northern
Europe, inland, and overseas. The characteristics of the petrochemical
industry tend to make the most of the advantages offered by Antwerp.
Large-scale manufacturing, typified by the size of ammonia units and
naphtha crackers, is very dependent on any economies of transport that
can be made. Moreover, in a relatively small, well-located country
such as Belgium, these industries tend to be export-oriented. The
proximity of port facilities, as available at Antwerp, improves their
competitive positions in the international market.
Following the establishment of a petrochemical industry, there is a
market interdependence between the production units. The products or
by-products of one industry often serve as feedstocks for other
industries. Besides this, the production of numerous petrochemical
products in one area increases the demand for certain mineral-based
chemicals (such as sulphuric acid and chlorine), to such a level that
manufacturing units for these products may be set up. Total
B-38
petrochemical investment of $380 million was reached for this industry
in 1970. Antwerp is now one of the principal European petrochemical
centers, with almost the entire gamut of petrochemicals and intermediates.
The petroleum refineries have acted as a center for industrial development,
not only on a regional, but also on an international basis. Nevertheless,
the petroleum industry can only continue in this role if it is able to
supply petrochemical feedstocks at prices comparable to those of
competitors. To meet this requirement, the petroleum industry must
be able to obtain its crude oil supplies under favorable conditions and
be able to carry out its refining business under fiscal and institutional
conditions similar to those enjoyed by refiners in neighboring countries.
B.4.17 Regional Planning
Regional planning was introduced formally in Belgium by a 1962 law.
First, an extensive inventory and 1980 forecasts for the Scheldt-Dijle
region (i.e., the province of Antwerp, plus St. Niklaas Parrish) were
completed, followed by land-use planning, which is expected to be
approved by the 38 municipalities this year. (See Section B.6.4.) An
input-output model has been established to study both industry structure
and labor markets. Problems with zoning and real estate speculation
are raising controversy. A royal decree enforces application of the
sector plan, once approved, but municipality burgomasters are quite
powerful politically. The following extracts from the "Regional Master
Plan," published in 1969, give the scope and the flavor of the work
performed and conclusions reached, even though some, based on 1960-
1965 data, are already obsolete:
"The Master Plan is a summary of the survey of the regional characteristics, their evolution and the development that may be expected. It suggests solutions to the resultant problems within the separate plans covering the different fields with which an adjusted planological model co-ordinates.
B-39
POPULATION "The region includes the large-town sphere of influence of Antwerp, consisting of 198 municipalities with a surface area of approximately 3,600 square kilometres, grouped in 4 regions: the Antwerp, Mecklin, Waas and Campine region, 14 regional sectors and 9 regional subsectors. In 1965 the region had a popu-lation of 497 inhabitants per square kilometre -- whereas the national figure was 311 -- and it had a total population of 1,768,457, of which 53.39% lived in the Antwerp area, 22.13% in the Campine, 13.87% in the Mecklin area and 10.61% in the Waas area. By 1980 more than 2 million inhabitants are expected, with marked increases especially in the Campine (+80,000), in the Antwerp agglomeration (+80,000) and in the Mecklin agglomeration (+30,000).
"The main portion of the survey area runs from north to south over thirty kilometres and is formed by one of the most important development axes of Belgium: Antwerp - Brussels - Charleroi. It is supported by an important hydrographic net and by a hinterland with 60 million inhabitants, one of the greatest economic concentrations in the world. The structure of the town system grafted on this development line is of a polycentric nature. The Antwerp agglomera-tion fulfils the function of a metropolis and thus polarizes the whole survey area. Lier, St. Nicholas, Mecklin, Turnhout and Herenthals-Mol form the regional centres; Geel, Heist-op-den-Berg, Schoten, Boom, Willebroek, Duffel, Beveren and Temse make up the subregional centers, whereas a group of other muni-
SOIL cipalities offer local significance. The soil conditions are, as a rule, favorable for agricultural and building purposes, but vary due to the water-supply systems. The Scheldt, the Rupel, the Nete,
WATER the Eijle, the Demer and the Durme are rather badly polluted, but the conditions of the canals are fairly sound. It is anticipated that this state will be improved by installing proper purifying plants and an industrial collector on the Albert Canal.
AIR The air pollution resultant from domestic and industrial causes is creating problems especially along the Antwerp-Mecklin axis and needs to be remedied by the industrial enterprises and by designating specific "green-belt" areas.
"The socio-economic sphere, whose dynamic influence greatly determines the development of the region, will be characterized by an increase of the gross
INDUSTRY
regional product from 98.4 milliard (U.S.: billion) in 1960 to 216.8 in 1975, an increase of 120.3%. In
B-40
1960 the gross value added per regional inhabitant was already higher than the national average. The industrial sector (40.7%) and the trade and service sectors (40.1%) make up an important part of the regional product (public servants and domestics not included). As compared to the State, the activity of the region is less directed to agriculture, but, it is on the contrary, very explicitly directed to the service sectors. In 1975 the contribution of the industrial sector will have risen to 44.8%, in contrast to the service and agricultural sectors whose contributions are falling. Due to the open nature of the regional economy, as a result the trade balance showed a deficit of 1.1 milliard (billion) francs in 1960.
"Between 1960 and 1975 an increase of labor supply of 85,700 men and 60,200 women is forecast. This also
LABOR partly due to the migration from the depressed SUPPLY sectors. Taking into account the demand, a labor
shortage of 14,700 units may result from this, in fact a shortage of 28,800 men and a surplus of 14,100 women. In the agricultural sectors the employment opportunities will further decrease from 38,656 units in 1960 to 16,100 in 1975. This retrenchment of man-power will be strongly felt especially in the Campine region, in which a relatively large part of the working population is still employed in agriculture. At the same time, however, the position of agriculture will have to be strengthened by structure-improving measures like redistributions of land holdings, an appropriate hydraulic engineering system, country-road improvements, economic reconstruction of the enterprises, stimula-tion of auctions and the creation of information centers. In addition the raising of the standard of education would help.
"In 1960 the industry employed 275,112 people; another 84,400 are expected by 1975, but 17,200 existing employment opportunities will have disappeared. Due to the spontaneous expansion of the Antwerp metropolis, 30,000 new opportunities will be created. The layout
LABOR and equipment of industrial sites will have to keep DEMAND pace with the spontaneous industrial growth, which
implies that on the left bank of the Scheldt 6,300 hectares must be set aside, of which 3,500 hectares of industrial grounds must be reserved for the use of deep-dockage industries. Other industries, however, can be partly directed to other nuclei in the survey area, where a great labor supply may be expected. This
B-41
will promote the polycentric development of the region and keep the number of long-distance commuters within reason. Mecklin, Turnhout-Beerse, Geel and St.-Nicholas will be considered the regional nuclei of the industry, whereas complimentary sites in the region of the Rupel, Mol, Herenthals, Essen, Heist-op-den-Berg, Hamme and Bornem will be able to fulfiila supporting function.
"The employment in the trade and service sectors, numbering 190,581 units in 1960, will be increased by 76,200 units in 1975. More than 43,000 employment opportunities will be created in the Antwerp sector, however, the service functions of other centers will also be strongly stimulated. Antwerp will be con-sidered the metropolitan region, Mecklin, St.-Nicholas, Turnhout and the component town Herenthals-Geel-Mol will develop as regional service centers, whereas Hamma, Wuustwezel, Oostmalle, Heist-op-den-Berg and Londerzeel should be raised to the level of subregional centers.
HOUSING
"In the socio-cultural field the necessity of building 13,647 houses a year between 1966 and 1975 will be needed. In order to obtain this end the present rate of building should be increased by 28%. This would necessitate a yearly allocation of 546 hectares for building sites, of which a minimum of 1/3 should be reached through land management. Next to the above, the housing conditions of the existing patrimony need improvement, especially in the Waas region, the conditions being the most favorable in the Campine region. The equipment of the dwellings must also be adapted, especially in the Campine region. In the micro-planological field one will strive for better livable housing entities by centralized implantings which would also have a better sociological structure. In the marco-planological field one will attempt to hold in check the disorderly expansion of the Antwerp agglomeration by opening up residential zones on the axes linking this nucleus with other poles and which will be integrated in a hierarchic interdependent structure.
"In the province of education one will endeavor to expand university and higher non-university education in Antwerp, so as to stimulate the participation of
EDUCATION youth in this type of education, which up to now has been small in comparison with the national population. As for secondary school education a greater task will be assigned to the centers of the regional sectors to secure the population's
B-42
education. In view of the necessity to supply the school population an education more adapted to the socio-economic life, one will also strive to reduce the number of vocational schools for girls and integrate them in another system of education.
WELFARE
"As to the medical facilities, a special effort must be made to reach a normal medical treatment of the population by 1980, especially in the Antwerp areas, where the obsolescence of the existing institu-tions offers additional problems, and in the Campine, particularly the Southern Campine. Generally speaking there is a shortage of institutions for non-acute illnesses. There is especially a quantitative shortage of institutes for the welfare of the old-aged persons in the Antwerp region. Geriatric institutes are practically non-existent. In the sector of social housing it will be necessary in the future to build adequate dwellings for old-aged persons. As far as children care is concerned, there is a definite shortage of institutes for socially unadapted and for physically or mentally handicapped children. The cultural equipment will be more and more developed in the form of integrated cultural centers. In this field a considerable leeway must be made up especially in the border communes of the Antwerp area, in the Campine and in the Waas region. The sports equipment is on the whole unsatisfactory, particularly in the Haacht, Bornem, Hoogstraten, Geel, Zandhoven, and Heist-op-den-Berg sectors. In the infrastructure the provisions of equipment for youth movement activities are in most cases inadequate or the infrastructure itself is used for other ends. Due to the disorderly town planning, the outdoor recreation for youth is becoming a problem, especially in the Antwerp agglom-eration, Mecklin and the Rupel region. The corrosion of the remaining green zones by the disorderly conversions of land into sites and by ribbon building offers an earnest problem. This is also the case with the city parks within the great agglomerations. In the survey area, especially Kalmthout Heath as well as the nature reserves of both Netes and of the Scheldtland should be kept reserved for green zones. Green buffer zones along the important industrial zones are being planned.
TRANSPORT "Transport, particularly the harbor activity, is a specific activity of the region. It is significant both nationally and internationally: 10% of the freight transport by sea of the E.E.C. countries passes through the Antwerp harbor; also more than 10% of the
B-43
(WATER)
(ROAD)
(RAIL )
(AIR)
employment in the region is connected with the Antwerp harbor. However, the increase of the shipping tonnage, in comparison with the accessibility of the Scheldt, on which calibration and rectification works are necessary, raises a serious problem. This increase of shipping tonnage for petroleum-tankers puts such exigencies that they cannot be met. The solution would be the connection with the West European net of pipelines. In the framework of the international harbor competition, industrial grounds with deep-water frontage must be opened up; both the left and the right bank of the Scheldt are suitable. The inland navigation has a particular significance for the connection of the Antwerp harbor with its hinterland. The plan urges the necessity of the construction of the Scheldt-Rine Canal, of the communication canal between the harbor area of Antwerp North and the Albert Canal and the Nete Canal. It also indicates that the Albert Canal should be modernized. As to the capacity of the harbor itself, 2 new docks must be constructed for the handling of general cargo.
"In the field of road traffic, one will have to consider the fact that the fleet of private cars in the survey area will have increased from 154,800 in 1962 to 440,200 by 1975. The suburban traffic on the fringe of the Antwerp agglomeration and the through traffic to Brussels, Mecklin, Ghent, Lier and Herenthals is very dense, as well the cross-frontier traffic to Breda. Another very acute problem in the Antwerp agglomeration is parking. The proposals for the infra-structure of the roads are designed to relieve the present and the future saturated roads by new or improved plans and by increasing the number of parking places. As to the passenger transport by rail it is assumed that by added comfort, better service and higher speed, the passenger transportation will remarkably increase, particularly on the Antwerp-Brussels section which is already thickly crowded. To enable this increased efficiency a restructuring of the railway net will be necessary for convenience as well as a co-ordination with the town and bus traffic. This adjustment will be spread over a ten years' period. The Antwerp town center will thus be opened up by a "pre-metro", and the connection with the suburban communes needs to be secured by tramway lines, in their own "beddings."
"Also the necessity of an air-port near the seaport of Antwerp is stressed. The airport of Deurne, however, does not satisfy the requirements of commercial traffic
B-44
any more and this for several reasons. Therefore the plan foresees a new airport at Oostmalle at a 20 kilometers distance from Antwerp and connected with the metropolis by the motor-way E-3.
"In the sector of public utility new electric-supply stations would be erected at Doel and Kallo to satisfy the increased industrial and home consumption. The electric-supply net is satisfactorily spread, whereas the inter-regional feeding-net between the
UTILITIES stations of 150 kV meets the requirements. As far as the gas supply is concerned, radical changes may be expected in the near future, i.e., the supply stations will be closed down and replaced by earth-gas from Holland. It will be introduced into the survey area through two feeders. The water-supply is fed by the Albert Canal, but new water reserves are necessary to meet increased consumption. One will be able to reduce the pollution of the surface water by working systematically and processing the sewerage-system, and also by constructing refuse pulverizing plants.
"The planological model for the survey area is a poly-centric hierarchical model, according to which the Antwerp metropolis would be primarily developed as a supra-rational center, and subsequently the four regional centers as urban nuclei, viz. Mecklin, St.-Nicholas, Turnhout and Herenthals-Geel-Mol. These nuclear communities are situated on the development axes connecting them with Antwerp. Other nuclei will be assigned a function on a lower level. The inter-mediate green spaces and agricultural zones will, however, be safeguarded as much as possible.
"The planning of the Antwerp region is based upon the opening up of the city and the harbor area, whereas the metropolitan area, the suburban zone and the intermediate centers "Voorkempen", Beveren-Melsele, Boom-Willebroek and Lier will be developed as residential areas. The Mecklin region is based on the expansion of -- next to the regional center of Mecklin itself -- Lier and Heist-op-den-Berg. The Waas region includes St.-Micholas, Lokeren and Temse, which ought to be further developed as regional centers. In the Campine region there are especially Turnhout and Herenthals-Geel-Mol, next to Westerlo as sub-nucleus."
Each community traditionally establishes a general plan for communal
orientation, and a special municipal zoning plan. This is integrated
B-45
by sector, then by province, and finally at the state level (which do not
always correspond to one arrondissement,* province, or other adminis-
trative division) where it comes back to the people for discussion
prior to approval.
Problems often arise from discrepancies between administrative sub-
divisions and sector subdivisions, and Antwerp's St. Niklaas Parrish
is just as responsible as the Dutch for the delay in Left Bank develop-
ment..
Another example of the frustration of regional planning is the Hoboken
riverside oil storage terminal, south of Antwerp, at the site of the
already closed Albatross refinery. The regional plan had decided that
this area should be turned into a waterside residential area. Terminal
operators and heating-oil distributors succeeded in marshalling the
Chamber of Commerce, which in turn was able to keep the land as a
storage zone. The winning argument was that despite the attractiveness
of the zone for residential housing (once the river was cleaned), the
main problem in Antwerp is the lack of industrial land; the right
bank is practically saturated, and the left bank development is not
started. Thus the Hoboken plan will not be implemented, at least
until new industrial acreage is made available.
Still another problem is the competition for industry and its unbalanced
distribution. There are talks of Antwerp taking over the suburbs for
administration services (as well as taxes) to avoid the classic
distortion between tax income and services rendered (particularly in
higher education, communications, etc.). Actually, Antwerp is on the
verge of becoming more selective in its screening of industry, because
of land shortage, environmental concern, and the city's obvious loca-
tional advantages for industry. Antwerp has started promoting
decentralization of certain industries, southeast on the Albert Canal
*Similar to a district.
B-46
(Amoco and Goodrich Petrochemicals in Geel, 20 miles away towards
Liege), and on the Terneuzen-Ghent canal now developed for 50-60,000
dwt vessels. At the European level, long range planners envision
cooperation between Rotterdam and Antwerp to fully exploit the Golden
Delta (the area between Rotterdam and Antwerp) and to become the two
largest and richest ports of the world: Antwerp for cargo handling,
and Rotterdam for big ships.
B.4.18 Future Outlook
The growth of the Port of Antwerp in the 1950's and 1960's was rapid,
but expansion plans for the current decade will be even more pervasive.
The port's future economic growth will result from two major interacting
forces:
• First, the port will continue to attract commodity traffic,
in its role as a major continental distribution point for
world trade, and as the major port and city in Belgium, with
perhaps 50% of national economic activity;
• Second, the city should develop industrially at a rate close
to the past decade's 6% to 7%; increased industrial
production should contribute measurably to the overall develop-
ment of traffic flowing through the port.
Most of the industrial expansion will be in the petrochemical and
chemical sectors, but concentration of allied industries is expected
as well, particularly in the rubber, plastics, and fibre-transforming
industries. Industries needing water front facilities -- refining
and petrochemical installations -- will settle around the port itself.
This will probably lead to a concentration of secondary processing
industries in outer districts in a pattern of concentric circles
rippling out from Antwerp.
B-47
B.5 ENGINEERING FACTORS
B.5.1 Site Selection
The river profile, the city's developed areas, and the population settlement
control the selection of sites for port expansion, since the land is
essentially flat. The water frontage increased downstream from 24 to 54
miles (mostly in a northerly direction) on the right bank during the past
ten years. Future development of the Baalhoek project is
planned on 30,000 acres of low polder land on the left bank of the Scheldt
River. The acreage is below high-water level twice daily when an average
4.80 meter (15.4 foot) spring tidal range is experienced. The acquired
acreage is known to be excessive and beyond present needs, and the Port
Authority is prepared to utilize less land than that plotted for port use.
This is an advance planning measure that will permit future expansion without
requiring further legal gymnastics to extend port acreage when needed.
B.5.2 Configuration
Basin facilities are behind river quay walls and date from the Napoleonic
era (1805-1810) when the Bonaparte and Kattendjik barge locks were constructed.
In 1906, the Royers lock was constructed for coaster-size vessels. A major
step was taken in 1925 with the opening of the Van Cauwelaert lock six miles
downstream. In 1949, a petroleum dock with two finger-type piers was
constructed. By 1955, the parallel Bonde lock was completed, and a fifth
Harbor Dock (11.75 m or 39 feet deep) was added. Another major change
occurred in 1967, when the new Kanaal Dock was officially opened (see Figure
B-1), linking the two previous locks with the Zandvliet lock twelve miles
downstream. The new dock resulted in the development of an industrial island
which accommodates the plant facilities of Albatros (a refinery), Solvay,
Monsanto, Degussa, and Bayer (chemicals). Access to the island is gained by
a double bascule, twin track, railroad bridge, and a traffic tunnel. The
bridge has a vertical clearance of 31 feet when down and 270 feet when open.
The lesser dimension provides adequate clearance for normal daily river
traffic. The bridge was arranged to handle both vehicular and railroad
traffic until the vehicular tunnel was opened. The new Kanal Dock has a
total length of five miles and has an average depth of 16.75 meters (55 feet),
B-48
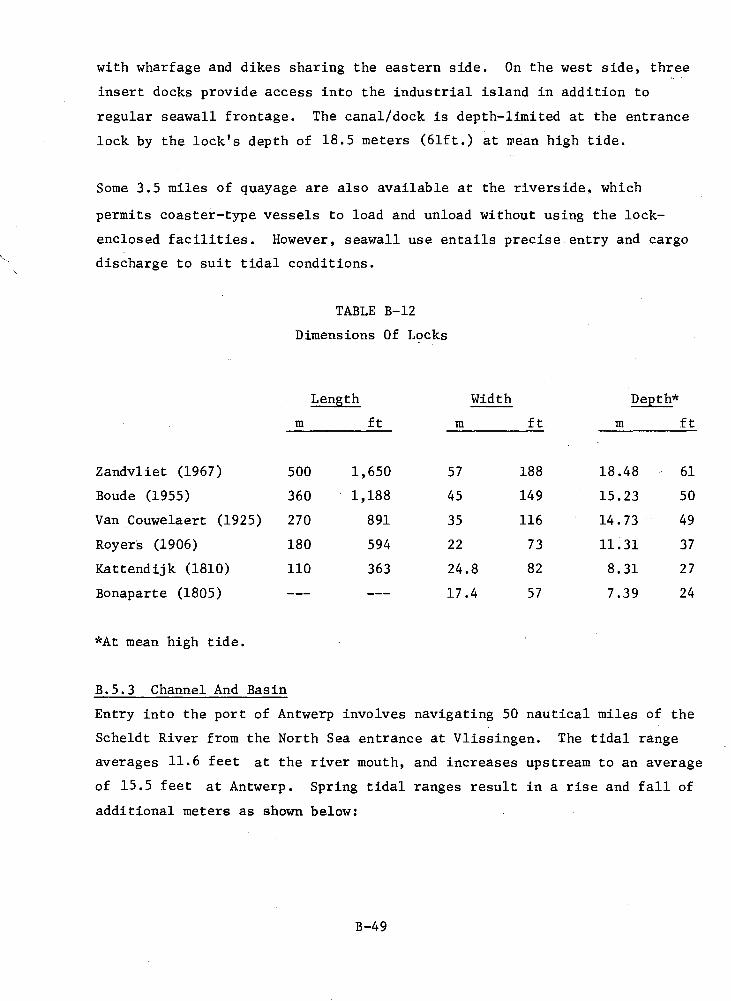
with wharfage and dikes sharing the eastern side. On the west side, three
insert docks provide access into the industrial island in addition to
regular seawall frontage. The canal/dock is depth-limited at the entrance
lock by the lock's depth of 18.5 meters (61ft.) at mean high tide.
Some 3.5 miles of quayage are also available at the riverside, which
permits coaster-type vessels to load and unload without using the lock-
enclosed facilities. However, seawall use entails precise entry and cargo
discharge to suit tidal conditions.
TABLE B-12
Dimensions Of Locks
Length Width Depth*
ft m ft m ft
Zandvliet (1967) 500 1,650 57 188 18.48 61
Boude (1955) 360 1,188 45 149 15.23 50
Van Couwelaert (1925) 270 891 35 116 14.73 49
Royers (1906) 180 594 22 73 11.31 37
Kattendijk (1810) 110 363 24.8 82 8.31 27
Bonaparte (1805) --- --- 17.4 57 7.39 24
*At mean high tide.
B.5.3 Channel And Basin
Entry into the port of Antwerp involves navigating 50 nautical miles of the
Scheldt River from the North Sea entrance at Vlissingen. The tidal range
averages 11.6 feet at the river mouth, and increases upstream to an average
of 15.5 feet at Antwerp. Spring tidal ranges result in a rise and fall of
additional meters as shown below:
B-49
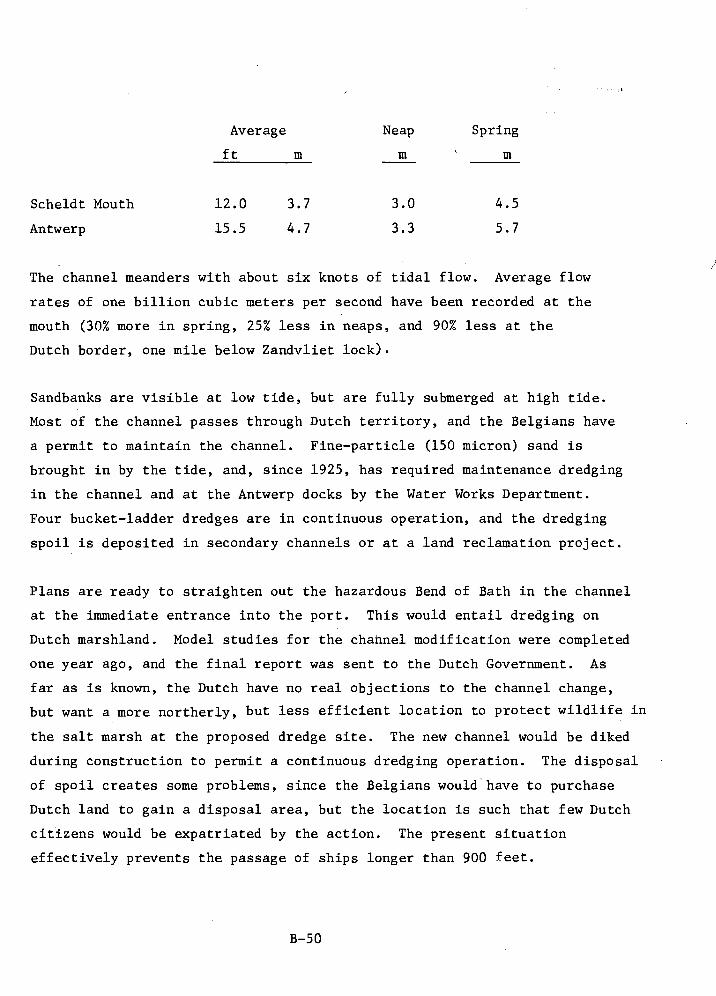
4.5
3.3
3.0
5.7
Average Neap Spring
ft
Scheldt Mouth
Antwerp
12.0 3.7
15.5 4.7
The channel meanders with about six knots of tidal flow. Average flow
rates of one billion cubic meters per second have been recorded at the
mouth (30% more in spring, 25% less in neaps, and 90% less at the
Dutch border, one mile below Zandvliet lock).
Sandbanks are visible at low tide, but are fully submerged at high tide.
Most of the channel passes through Dutch territory, and the Belgians have
a permit to maintain the channel. Fine-particle (150 micron) sand is
brought in by the tide, and, since 1925, has required maintenance dredging
in the channel and at the Antwerp docks by the Water Works Department.
Four bucket-ladder dredges are in continuous operation, and the dredging
spoil is deposited in secondary channels or at a land reclamation project.
Plans are ready to straighten out the hazardous Bend of Bath in the channel
at the immediate entrance into the port. This would entail dredging on
Dutch marshland. Model studies for the channel modification were completed
one year ago, and the final report was sent to the Dutch Government. As
far as is known, the Dutch have no real objections to the channel change,
but want a more northerly, but less efficient location to protect wildlife in
the salt marsh at the proposed dredge site. The new channel would be diked
during construction to permit a continuous dredging operation. The disposal
of spoil creates some problems, since the Belgians would have to purchase
Dutch land to gain a disposal area, but the location is such that few Dutch
citizens would be expatriated by the action. The present situation
effectively prevents the passage of ships longer than 900 feet.
B-50
The 185 staff and employees of Waterbouwkundig Laboratorium van het
Besturir der Waterwegen (Borgerhout) conducted extensive hydraulic
studies to determine the effects of channel straightening. With the
exception of a very slight change in tidal time and ecology, plus a
slight tidal rise and fall increase (less than one foot), no adverse effects
are anticipated,and channel maintenance should be reduced by virtue of
accelerated flow in the new channel section. The hydraulic model was
built ten years ago, and it encompassed 20 miles of river from Antwerp
to Hanswert. This was later extended to include the inland section of
the river into Ghent, and the latter portion was labyrinthed to conserve
laboratory space. The model scales 3:1000 horizontal and 1:100 vertical.
Tests showed that the existing channel would still have to be dredged to
aid water movement and that an underwater dike (covered from half to
high tide) would be needed. Some bottom duning is also anticipated
which, by extrapolation from the model, could go up to ten feet.
Two such dikes were effectively built, with 4/10 slopes, before the pro-
posal to cut the Bath Bend changed the picture (if the proposed cutting
occurs, the tide may change by one foot).
The new locks and harbor (Balhoek to Kallo) facilities planned for the
left bank will not affect the river, according to model tests. The
Laboratorium reports no bedrock down to 83 feet, only unconsolidated
clay and sand. Spoil material is good,clean sand of which 420 million
cubic feet were dredged last year at a cost of $4 million (IQ U.S./cubic
foot), mostly for maintenance.
Considerable dredging is required at the river mouth, where two channels
(26.5 and 26 feet) converge, with sandbanks between them. Continual dredging
is being done in the estuary area at six miles, dredging to 30 feet.
Current and wave direction should reduce maintenance, but no model
was built. The Port of Antwerp does not own or operate any dredges, so
to maintain the main channel, contractors use 10,000 to 30,000 cubic
feet per hour bucket dredgers and trailing suction-hopper dredges.
B-51
Spoils are now dumped southeast of Churchill Dock for land fill. There
have been problems with vessels "squatting" on the bottom in narrow sections
of the river, and in some cases, a passing-suction situation has occurred
in the narrow reaches of the river; one bad collision occurred in the
early 1960's when a 40,000-ton tanker collided with a 30,000-ton tanker.
The pilot situation is now such that three pilots join a ship at the sea
buoy to the area of Flushing, then one river pilot takes over and guides
the vessel through the locks. Some of the tankers are now equipped with
active rudders and bow thrusters of up to 1,500 horsepower capacity.
Turning basins have 2300 and 2650 foot diameters for the 1650-foot long
Zandvliet lock. The Kanal Dock takes in fresh water, which is sent to
the Scheldt by a pumping station.
B.5.4 Navigational Aids
Navigational aids consist of floating lighted buoys and fixed beacons.
It was anticipated that a radar navigational system would have been avail-
able by October 1970, but the Dutch have purposely been holding up
any discussion on the system; they do not want to discuss navigational
radar with Antwerp, contending that it could affect Holland's national
security by becoming a spying system on their nation. Additional
aids, other than the buoyage system, consist of VHF radio with two
channels (12 and 14) keeping in constant contact with a vessel. There is a
restricted radio chain between the Belgian and Dutch borders. The
Dutch plan to install a Decca Hi-Fix navigational system at the river
entrance some time next year.
The submerged dike that will be used in conjunction with the final
channel modification will be signalized with propane-gas-lighted buoys.
On the Belgian side of the river the buoys are surveyed twice a week.
Some of the buoys are equipped with radar reflectors. No audible
system, bells or horns, are used on the buoyage system.
B-52
B.5.5 Docking
Pilot and tug assistance is mandatory for the entire length of the
river and in the confines of the inner harbor. A partially loaded
90,000 dwt vessel was recently docked in the port, and departure was
facilitated by the 2650 foot turning basin now available in the new
canal/dock.
B.5.6 Cargo Handling
Although last year Antwerp took the record for cheapest European cargo
handling port from Rotterdam, there does not appear to be any major
breakthrough in cargo handling. Standard dockside cranes are available
in the original basins (pre-1967) and the new canal/dock has 15- to
25-ton cranes capable of discharging general cargo at a rate of 60,000
tons per 48 hours.
Warehouse facilities are generally built by the user, and there is a
trend toward single-story steel structures which are more economic.
City-owned buildings are mainly of concrete construction for 20 to 40
year payout, though steel is better for short payout, at the cost of
more maintenance. Few, if any, of the buildings are sprinklered for
fire safety.
B-53
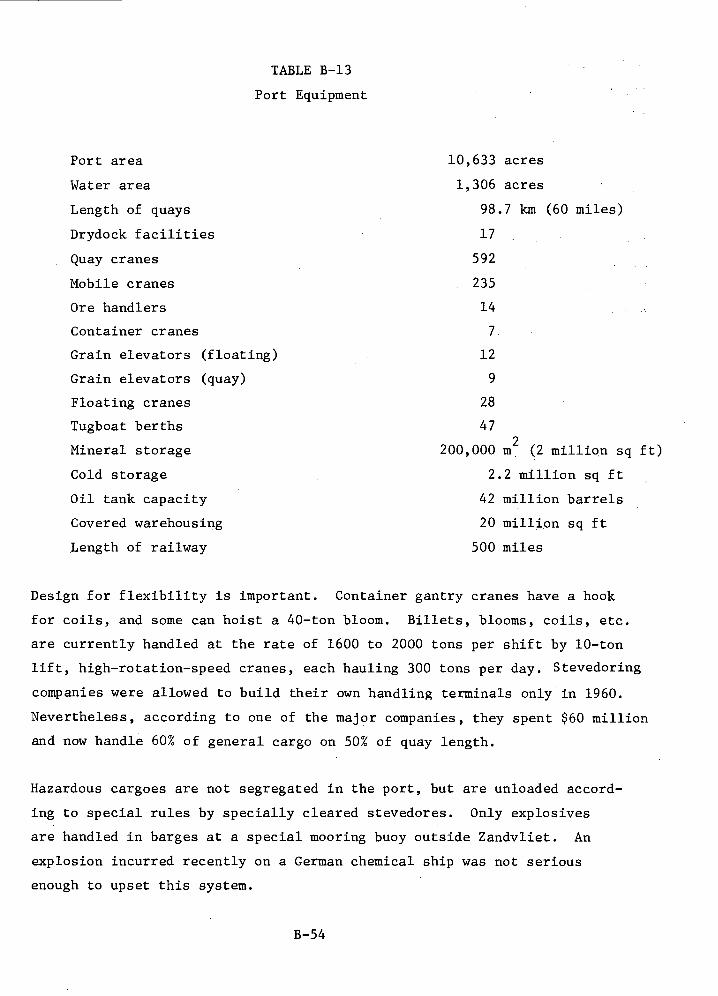
TABLE B-13
Port Equipment
Port area 10,633 acres
Water area 1,306 acres
Length of quays 98.7 km (60 miles)
Drydock facilities 17
Quay cranes 592
Mobile cranes 235
Ore handlers 14
Container cranes 7
Grain elevators (floating) 12
Grain elevators (quay) 9
Floating cranes 28
Tugboat berths 47
Mineral storage 200,000 m2
(2 million sq ft)
Cold storage 2.2 million sq ft
Oil tank capacity 42 million barrels
Covered warehousing 20 million sq ft
Length of railway 500 miles
Design for flexibility is important. Container gantry cranes have a hook
for coils, and some can hoist a 40-ton bloom. Billets, blooms, coils, etc.
are currently handled at the rate of 1600 to 2000 tons per shift by 10-ton
lift, high-rotation-speed cranes, each hauling 300 tons per day. Stevedoring
companies were allowed to build their own handling terminals only in 1960.
Nevertheless, according to one of the major companies, they spent $60 million
and now handle 60% of general cargo on 50% of quay length.
Hazardous cargoes are not segregated in the port, but are unloaded accord-
ing to special rules by specially cleared stevedores. Only explosives
are handled in barges at a special mooring buoy outside Zandvliet. An
explosion incurred recently on a German chemical ship was not serious
enough to upset this system.
B-54
More generally, Antwerp's performance in cargo handling is attributed to:
• good labor and careful management, and informal and
positive relationships ("We would never introduce a
change if not backed by unions" declared a top
executive);
• terminal specialization. Steel breakbulk can be
mixed with containers, but not with light fruit
pallets which cannot be handled the same way. The
specialization trend is increasing as large ships
are developed which need both quick turn-around and
ample storage space, which the receiving or ship-
ping industry is not always ready to provide. This
storage function will increasingly become a port
responsibility. A standard container terminal is
now 200 meters long and 400 meters deep (660 feet
by 1300 feet). However, terminals 300 meters long
and 800 meters deep (1000' and 2600') may be necessary
for the next two decades. Another reason for
specialization is the influx of heavy equipment.
Some companies doubled output in three years and
tripled output in four years. This increase was
possible with only a 50% increase in acreage and with the
same labor force. One of these companies predicts
another 50% productivity increase.
• flexibility. The ten-year plan is an information-
pooling operation for budget appropriations (valid
for ten years, rather than a constraining one-year
period). Flexibility appears also in labor-management
relations and company-state-city interactions, thanks to
the municipal environment and the relatively small
scale of the country.
B-55
B.5.7 Communications
In a previous section (B.4.17), the economic importance of water, rail,
and road transportation has been stressed, because Antwerp is the major
port of Belgium and a major outlet for the industrial interior.
A major recent development is the construction of oil pipelines, which
was started in 1965 with the reservation of a 33-foot-wide land strip
(originally thought to be overly conservative). Three times as much
land now appears necessary: a major underground (4.7 feet deep) crude
pipeline (not heated, so that some crudes must still come directly to
Antwerp) is being built by oil companies and Dutch contractors to
Rotterdam, (the alternative finally preferred over the further channel
deepening or an offshore island by Zeebrugge for very large tankers);
ethylene and ammonia pipelines take much more room than expected. Several
canals and rivers require underground tunnelling. The announcement of
the oil pipeline to Rotterdam triggered several requests from local Antwerp
refineries to double their output. The period 1975 to 1980 could see
the completion of a link to a new European system, starting from a
major terminal in Le Havre for 500,000 to 1,000,000 dwt tankers.
Other major bulk commodities are iron ore and coking coal, for the
supply of the Wallon Steel Industry. Unit trains (1500 tons) still
compete well with towed barges, despite huge works on up-country
waterways.
However, straightening the Albert Canal for pushed barges may improve
the competitive position of water transportation. This would also
involve a direct leg to the right bank's Kanal Dock, circumventing
Antwerp by the north.
A new canal, from the Scheldt to the Rhine is also being pushed. Many
officials regret that no canal links Antwerp to the Golden Delta in
Belgian territory. Extensive land speculation is taking place along
the path of this potential new canal and the new Albert Canal leg, but
B-56
the government cannot directly block land sales. It can only discourage
land development by declaring the area a greenbelt, which requires that
access and feeder roads be cleared by the government and built before
the acreage is split into lots for residential or other uses, a procedure
which effectively maintains the status quo.
Other recent or planned improvements, resulting from improved regional
and land-use planning are: the construction of tunnels under the
Canal Dock and the Scheldt, between Hoboken and Antwerp, the completion
an efficient highway beltway system.
B.5.8 Cost Data
To finance the port expansion program, a royal decree appropriated the
following monies in the sixties:
• Three billion Belgian Francs ($60 million) for terminal
facilities, to be spent over a ten-year period; and
• Ten billion Belgian Francs ($200 million) for the port
itself. Initial estimates for $120 million on the
right bank and $30 million for the Zandvliet lock were
exceeded by $30 million.
For the July 1969 six-year improvement plan (1970 to 1975),a total of
$235 million was appropriated for waterway improvements. The breakdown
by specific locations of improvement were:
1. Upper River Scheldt -- $33.6 million
2. Meuse River -- 64.8 million
3. Central Canal -- 28.8 million
4. Charleroi/Brussels/Rupel Canal -- 48.0 million
5. Dutch Section of River Scheldt -- 60.0 million
B.5.9 Problems and Lessons
Although there is a channel depth limitation and a need for constant
channel maintenance and Antwerp continues to be a port of major impor-
tance, the harbor has difficulty accommodating vessels j_n excess of 65,000
dwt due to the shallow meandering channel. However, the proposed development
B-57
of the port's left bank should permit entry of 125,000 dwt vessels, the
maximum size being considered for the future. Further expansion will have to
take place in Rotterdam (linked by pipeline), Dunkirk-Le Havre, or
offshore Zeebrugge.
Wet docks are better than tidal quays in the five-meter tide range and
tidal currents, except for short-haul shipping (coasters, U.K. trade,
roll-on/roll-off),but the lock must be big (Zandvliet was the world's'
largest for a long time). Thanks to good sandy soil, the Port Authority
has developed a fast system of seawall construction that eliminates the
need for pile driving. About 2,000 cubic feet of concrete can be poured
daily to construct gravity-type seawalls, as illustrated in Figure B-3.
From an environmental control standpoint, the bulk-oil storage-tank
failure experienced in Antwerp clearly indicates that piled -earth
retaining dikes may be capable of retaining gradually spilled materials,
but that all retaining dikes should be evaluated structurally for
adequate resistance to static and shock loading of spilled material.
Along with some U.K. experts, Antwerp believes that ore carriers will
not go beyond 125,000 to 150,000 dwt in size. Because of the increasing
size of oil tankers, Antwerp decided to link by pipeline to Rotterdam,
which it preferred to Dunkirk for political and labor reasons, as well
as pressures of BP and Esso who have refineries in both Antwerp and
Rotterdam. The Zeebrugge offshore island project is not expected to
have a chance for development during the next decade. The winding
channel in Dutch territory is a problem which has brought on the
125,000 dwt future limitation But general cargo exports from the hinter-
land, expanding port industry, and good oil links (pipeline and shuttle
tankers) to deep water terminals will carry the port forward.
B-58
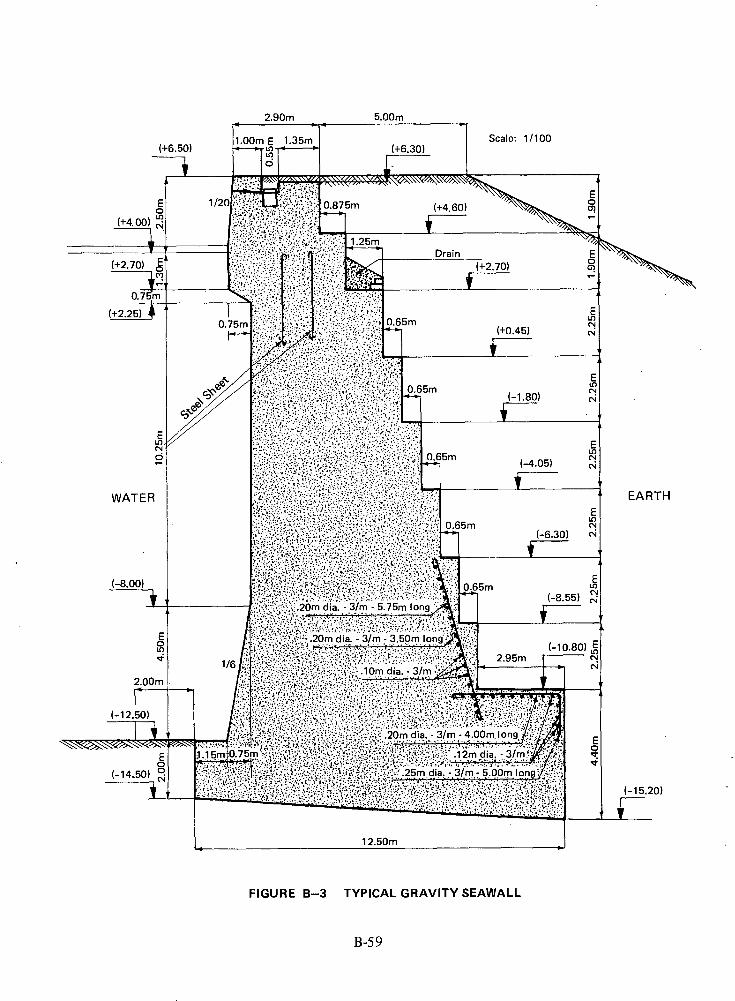
2.90m 5.00m
1 .15m
0.75m
fiJ5 r1.1
1.00m E 1.35m
.10m dia. - 3/m
0.65m
(+6,30)
Om dia. -3/m - 4.00m. long
.12m dia. - 3/m 1:.
5m dia. - 3/m - 5.00m Ion
0.65m
L0455m
(+4,60)
Drain
0.65m
0.65m
(+2.70)
(+0.45)
2.95m
(-1.80)
(-4.05)
CV
(-6.30) es+
(-8.55)
(-10.80) g
--On CV
FIGURE B-3 TYPICAL GRAVITY SEAWALL
B-59
B.6 ENVIRONMENTAL IMPACT
B.6.1 Environmental Management Efforts
Antwerp has spent significant time, compared to other ports, on the
subject of land-use planning related to port development. On the other
hand, authorities to date appear to have been only moderately concerned,
with respect to pollution abatement or prevention efforts, in action-
oriented programs. Maintaining Antwerp's industrial and economic
position within the nation -- and indeed the European Common Market --
is by far the most important consideration, as illustrated by the
comment by a local spokesman: "Effective concern regarding environmental
quality can occur only in a rich and polluted society; we haven't been
rich quite long enough."
On the other hand, Antwerp has had considerable success in attracting
industrial firms to the port on her own terms. Previous comment to the
contrary, there is a growing awareness on the part of many concerned
officials of the necessity for more effective environmental management,
and we believe it likely that increasingly stringent, though perhaps
informal, controls will be applied. Public consciousness has been
aroused in particular by chemical odors from the BASF, Bayer, and other
plants, the shrinkage of the romantic polder and marshland on the - .
right bank, and the disappearance of river fishing. Recent municipal
elections led to the election of an "Alderman for Environment" who took
over some of the duties of the Public Health alderman; the latter had
set up a sulfur dioxide monitoring system.
From an environmental standpoint, the most important of the Antwerp
commissions is the Center for Prevention of Air and Water Pollution,
a municipal organization created in 1968. The Center has three main
tasks: 1) advise the town regarding air and water pollution abatement
procedures to be followed both by the city and industry; 2) assist in
controlling air and water pollution and solid waste pollution; and
3) sponsor and recommend research programs appropriate to the city's
needs. A fourth function which the Center performs is to advise the
B-60
municipal council as to whether and under what conditions applications
by industrial firms to build new plant facilities should be approved.
(This function will be described in greater detail later.)
B.6.2 Organizational Structure
There are no officially recognized air quality standards in Belgium,
either on a national or local basis. The basic air pollution control
law is the Clean Air Act, initiated by the Ministry of Public Health in
December 1964, which provides the framework for subsequent decrees to
bring into effect its very broadly written provisions. These provisions
include: granting the King the power necessary to take all appropriate
measures to prevent or fight atmospheric pollution, defining atmospheric
pollution, establishing the means by which royal decrees can be put
forth, and assigning to the Ministry of Public Health the responsibility
of coordinating follow-on efforts to abate atmospheric pollution.
Follow-on decrees have been few; a 1966 decree was set forth establish-
ing requirements for the approval of laboratories or institutions to
undertake official air pollution work. It was by virtue of this decree
that the Antwerp Center for Prevention of Air and Water Pollution was
created in 1968.
A 1950 water-quality law requires that every industrial facility obtain
a waste-water discharge permit from the Authority controlling the river
into which the discharge is to be made. It is left up to each Authority,
however -- again with no specifics defined -- what specifications or
treatment methods are to be followed. The Ministry of Public Works is
the governing authority for the Scheldt River, outside of the municipality
of Greater Antwerp. For the dock area within the port of Antwerp, the
city is the governing authority. The Ministry of Agriculture also plays
a role in protecting water and land use, and the Inter-Ministry Commission
for Economic and Social Coordination provides the coordination. There
is no national legislation about solids pollution, only local laws which
may vary from one town to another.
B-61
Industry has reacted by creating the Pollution Consulting Center under
a special association. Furthermore, the Antwerp and Rotterdam Chambers
of Commerce have a permanent exchange agreement which includes environ-
mental matters. Presently, the Advisory Health Board, which includes
everyone who has a say in air and water quality, is the big hurdle for
building and operating permits.
B.6.3 The Center for Prevention of Air and Water Pollution
Members of the Center include university professors, port authority
officials, municipal officials, and a delegate from the Provincial
Government of Antwerp. Although it is in fact a municipal organization,
the Center's activities and influence extend, from a practical viewpoint,
over the entire Antwerp Province, primarily with respect to the problems
associated with air pollution.
The following hypothetical example illustrates how the Center functions.
To locate in Antwerp, an industrial firm must first apply to the College
of Mayor and Alderman (i.e., the Municipal Council) for a land concession.
The firm is a tenant, not an owner of land, and would, therefore, be subject
to certain conditions laid down by the municipality. In reviewing the con-
cession application, the College would seek the advice of the Center
regarding health and environmental matters. In preliminary discussions
with the applicant, the Center would review general plans of construction
and operation with the candidate industry and discuss the overall
philosophy which the company expected to follow with respect to pollution
abatement. On the basis of these discussions, the Center would advise the
College whether a concession should be granted.
Assuming a favorable recommendation, the concession would be enacted
between the candidate industry and the Antwerp municipality. Included
in the concession agreement are broad conditions regarding air, water,
and solid pollution abatement -- requiring, in effect, that the industry
conduct itself in a manner deemed appropriate by the town. The
implication is that the concession can be revoked at any time if the
B-62
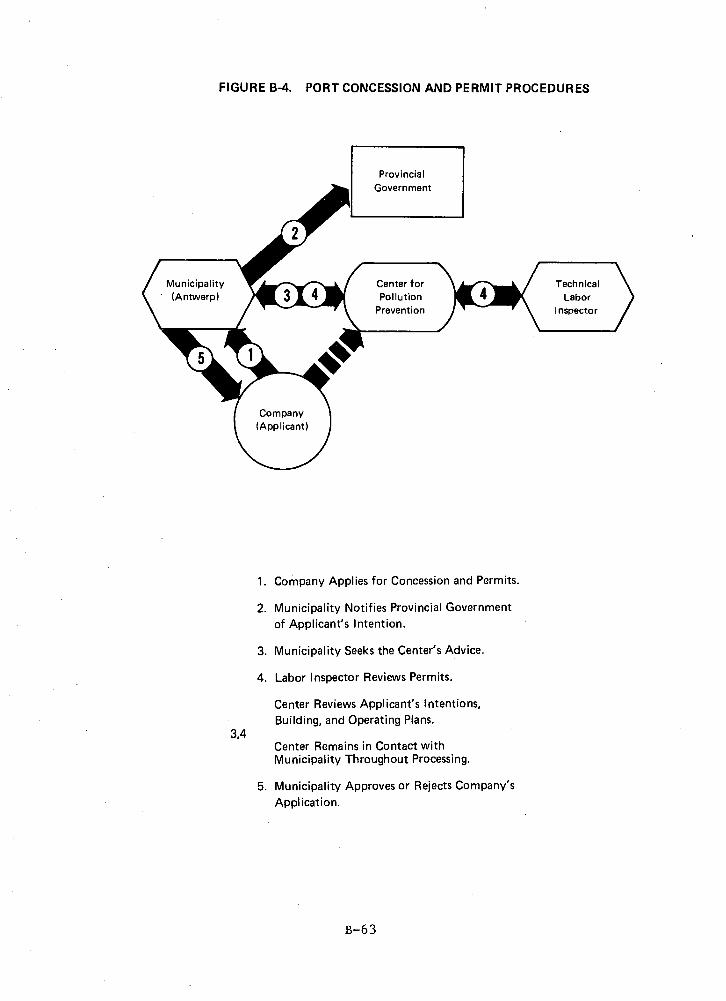
FIGURE B-4. PORT CONCESSION AND PERMIT PROCEDURES
Provincial
Government
1. Company Applies for Concession and Permits.
2. Municipality Notifies Provincial Government
of Applicant's Intention.
3. Municipality Seeks the Center's Advice.
4. Labor Inspector Reviews Permits.
Center Reviews Applicant's Intentions,
Building, and Operating Plans. 3,4
Center Remains in Contact with Municipality Throughout Processing.
5. Municipality Approves or Rejects Company's
Application.
B-63
industry does not comply with the conditions subsequently set forth in
the building and operations permits.
After obtaining a concession, the company would ask the College for a
building permit. The College would again consult the Center, which
would make a detailed review of the company's construction, operations
specifications, and plans, including examination of production details,
effluent details (e.g., chemical nature, amounts, toxicity, concentra-
tion, periodicity, etc.), and effluent treatment program. The Center
might make suggestions to the company regarding the pollution abatement
program, which the company would probably accept. Assuming all went
well, the Center would recommend to the city that the building permit
be granted. In due course, permission would be granted (all other
factors assumed favorable), but with a specific caveat to the company
that it must build the plant to avoid pollution, so as to not subsequently
lose its operating permit.
With the building permit granted, construction proceeds. Then the opera-
tional permit is applied for and presumably granted; the ultimate decision
being based upon previous discussions and the understandings reached. If
the company in question does not adhere to previous agreements, its conces-
sion can be revoked (we were unable to learn of any permit which has been revoked).
Because there are no formalized air quality standards in Belgium, the
Commission depends to a considerable extent on the VDI (Verein Deutscher
Ingenieure) standards regarding such considerations as maximum emission
concentrations and stack heights. Other sources may be used whenever
applicable. The Center may also invite a representative of the Technical
Labor Inspector (TLI) because this organization is concerned with the
health conditions under which the candidate company's workers will
operate. While the TLI's concern is specifically connected with the
operation of the plant, the Center recognizes that their approval
should be gained at this point, rather than waiting until actual
operation is under way and risking delays at that time.
B-64
According to the 1950 law, an industrial facility must get a discharge
permit from the controlling authority of the river into which any waste
water discharges are to be made. For example, the authority for the
Scheldt River is Belgium's Ministry of Public Works. For the dock area
within the Port of Antwerp, the city of Antwerp is the governing authority.
Before granting a discharge permit, the authority in charge is required
to consult with the State Health Ministry which reviews effluent
characteristics and specifies treatment methods to which the company
must agree (based upon precedent or existing law).
The role of the Center for Prevention of Air and Water Pollution is a
rather passive one in this case: it invites a representative of the
Ministry of Health to its meetings, at which it informs the representa-
tive of the desires of the Center, including recommendations concerning
how discharges should be handled in the area of the Center's concern --
in this case, that portion of the Scheldt flowing through Antwerp,
including the dock area.
There is greater uncertainty regarding solid-waste handling. The Center
studies a given solid-waste-disposal problem and makes suggestions,
but in general allows a given company to handle its own problems as
long as they are not deemed directly harmful to the environment. For
example, the Center advised one refinery rather strongly that it should
discontinue dumping tank bottoms on open land, an action which, if
continued, could result in groundwater pollution.
The above procedures relate primarily to "grass-roots" installations
built since 1968, the date of the Center's formation. However, the
Center has some control over industry built prior to 1968, since re-
building or modification of existing plants is subject to the Center's
review.
Of particular interest is the rather informal manner in which the Center
operates and, within the context of Antwerp's environmental concern, the
B-65
perceived degree of success which the program has enjoyed.
While there are no legislative standards or specifications to which a
company must adhere regarding pollution abatement, only those which
the Center may recommend in its review of a specific situation, Center
officials feel that through this kind of procedure, an applicant comes
to know where the town of Antwerp stands and what the company must do
to be a "good neighbor." Of course, the threat of concession revocation
always lurks in the background if a company does not match its statements
of good intentions with appropriate action. Since the Center has staff
qualified in economics, engineering, and environmentally related areas,
citizens tend to feel that their interests are reasonably well protected
and there has been little incentive or reason to form ad hoc groups to
question the suitability of a candidate industry.
Because it is a municipal body, the Center is undoubtedly affected by
the city's desires whether or not to have a candidate locate within its
boundaries. Employment potential, tax revenue, second and third-order
industrial effects, and other factors undoubtedly play a part in the
Center's deliberations.
However, the dialogue established between the Center and the candidate
is also extremely important, particularly since it is established at
the very beginning, thereby making the town specifically aware of any
risks that it may be taking, as well as offsetting or partially
compensating benefits (e.g., employment opportunities) which may be
derived. (This same attention to early and continuing communication
between various interests is also given extreme importance regarding
the question of land-use development by the municipal council, as will
be described later on.) Regardless of such questions as effluent
specifications, air and water quality criteria, or specific land-use
practices, the central point is that virtually all representative
interests are involved in a given project from the very beginning. It
is this practice which we firmly believe the Federal Government should
B-66
follow in its review of and development of the deepwater port sites in
the United States.
B.6.4 Current and Potential Problems
a. Water
At the present time, Antwerp obtains its fresh water supplies from in-
land sources and from an area southwest of the city, across the Scheldt
River. As far as we could determine, no problems are anticipated
regarding water supply, for either the municipalities involved in the
Antwerp district or for industry in the near future. Since no fresh
water aquifers are known to exist beneath the Scheldt River or the
dock areas, it is felt that construction in maintenance dredging will
have little if any direct effect on water quality.
Waste-water treatment plants are now being built by most industrial
complexes, and discharges are made into the Scheldt River, synchronized
with the outgoing tide. Some harmful products such as acid, may have
to be taken out to sea. Antwerp's municipal sewage treatment capacity
is inadequate, as is that of virtually all of the country; only 5% of
Belgium's sewage is treated.
As yet, there are no waste water effluent taxes levied in Belgium,
although Center officials believe that these may be instituted some
time in the not too distant future and may bear some similarity to those
already in effect in France.
The development plans for the left bank (Baalhoek Project) could have
an undesirable effect on the immediate land and water resources.
The area, which is largely polder land, would be filled and a new deep
channel dredged from the Scheldt to serve the new facilities. Such
development of the left bank may eventually expose new land areas to
possible salt water contamination and might also adversely affect the
quality of water supplies in the Fort de Haasdonk area. However, port
B-67
authority officials don't expect drainage problems, since at low tide
the water of the Scheldt is below the level of the surrounding land
and drainage will be toward the river. If necessary, intercept dikes
will be built around the reclaimed area, to catch saline water and
allow it to be pumped into the Scheldt and drain to the sea.
With one notable exception, no major oil spills have occurred in Antwerp.
In 1967, a new oil storage tank on the Esso Refinery property
catastrophically ruptured at the base. The resulting tidal wave of
oil (approximately 100,000 barrels)* broke through the standard earthen
dike surrounding the tank and then entered the storm water system of
the refinery, eventually finding its way into the harbor. Since the
harbor was locked, little or no oil entered the Scheldt River. During
the next six or seven days, the majority of oil was recovered from the
harbor area by a fleet of barges and pumps brought in from Holland
and France to supplement equipment on hand. The precise cause of the
accident and financial responsibility for the spill is still in
litigation.
Harbor equipment for oil spill cleanup includes a small self-propelled
oil (skimmer) barge purchased in 1955. A barge is also available for
taking on bilge pumpings from small vessels, and early in 1971 a bilge
cleaning operation was initiated near the Zandvliet lock. Most of the
refineries have ballast-handling facilities and are also serviced by
Societe Maritime de Degazage, a private French firm from Le Havre.
This firm--which has a virtual monopoly on bilge/water handling--has
its rate schedule controlled by the Antwerp Port Authority. An oil contain-
ment boom is available to isolate unloading vessels; the boom has a steel
skirt of 6.5 feet with a freeboard of 3.3 ft. It will soon be doubled by
an air-bubble curtain. This kind of equipment should normally be sufficient
for small spills; however, the 1967 spill demonstrated that substantial
additional equipment is needed if a major spill is experienced.
* According to a personal communication received from Esso R&E (USA), the tank was approximately 190 feet in diameter and 64 feet high; when it ruptured during filling, it contained about 20 feet of oil.
B-68
b. Air
The prevailing winds are south-southwesterly, but only blow in this
direction about 25% of the time, according to officials at the Center
for Prevention of Air and Water Pollution. Even with this, air
pollution from the industrialized portion of Antwerp can adversely
affect the downwind communities of Berendrecht, Stabroek, Hoevenen,
and others.
In contrast to the situation at Dunkirk, there is relatively little
open stockpiling of raw materials (ores, coal, etc.) in open unprotected
areas, and consequently dust plumes are relatively infrequent.
Through the offices of the Center for Prevention of Air and Water
Pollution, reasonably effective measures have been carried out with
respect to industrial particulate control, especially for new plant
construction or plant additions. Industrial emissions of sulfur
dioxide are combatted primarily through the construction of higher
stacks to disperse emissions. There is no restriction on the sulfur
content of fuel burned in Antwerp, and SO 2 levels are described as
"too high," using a base concentration of 150 micromilligrams per cubic
meter. Twenty-six stations in Antwerp currently are monitoring SO 2 ,
CO, and smoke-concentration levels. This service was set up by the
Alderman for Public Health prior to the election of the Environmental
Alderman.
Though concerned about SO2 levels, town officials appear to be looking
forward to increasing use of virtually sulfur-free natural gas from
the North Sea as the ultimate solution to the problem, rather than
imposing more stringent SO2 control procedures (either in the form of
low-sulfur fuel oil or the installation of SO 2-recovery equipment).
B-69
When the expected development of the left bank of the Scheldt River
begins to take place, it is expected that the Center will be considerably
more stringent in its pollution abatement requirements concerning new
industries that locate in this new area. This expectation stems not
only from a basic concern over pollution control, but also from
officials' belief that Antwerp Port is in a position to be more
selective in identifying and attracting those industries which it
wishes to have locate in the Antwerp area.
c. Solid Wastes
Dredging and spoil disposal practices have been discussed in the
engineering section.
Municipal solid waste generated in the Antwerp district is first milled
near the Albatros refinery site, and then taken to open clay pits
near Boom, about 12 miles south of Antwerp, where it is dumped
in a landfill operation. City officials are concerned about the long-
range problems of solid waste disposal in the Antwerp district, but
other than the identification of new landfill sites, little formal
planning is being done. Closed steel containers, available on port
quays, are picked up regularly by a private contractor.
Industrial solid wastes are handled by the companies themselves ; they are
either burned on site or landfilled in a north side dump. Improved
methods (e.g., the construction of a large clean-burning incinerator)
are under consideration, but no formalized alternatives have been
developed to meet the current inadequate situation.
d. Noise
Noise is not considered a significant problem at this time, at least from
the specific point of view of port development. Downtown Antwerp, like any
other major city, can be quite noisy, but this is not necessarily the fault
of the Port Authority.
B-70
e. Land Use
Because ot Antwerp's rapid growth and its importance to the Belgian
economy, a major and a continuing problem is the availability of
desirable industrial sites and the required expansion of the port area
to obtain such sites.
Another major difficulty which Antwerp has always had to face is that
the ownership of the land on either side of the Scheldt estuary: down-
stream is primarily in Dutch hands, and that of the left bank belongs
to another municipality and province. This means that regional
planning, transportation planning, land acquisition, and development
is a long job, sometimes involving international negotiations which
are slow and cumbersome. To some extent, the same situation might
appear in the United States where two or more states might become
involved in the construction and operation of a deepwater port --
or where, for example, in Puget Sound -- the United States and Canada
might be involved.
Because of draft limitations on the Scheldt, Antwerp certainly cannot
be considered a truly deepwater port in terms of depth capability , of
other ports (e.g., Rotterdam, Dunkirk, LeHavre, and Marseilles-Fos)
and has in fact resigned itself to a 125,000 DWT limit with a pipeline
to Rotterdam. On the other hand, the extent to which Antwerp's land-
use program for both banks of the Scheldt -- now in effect on the right
bank -- may provide lessons which might be applied in the United States.
The Gwestplan developed for the right bank is a land use or occupation
plan through the year 1980 which was recently approved by the Antwerp
District (38 municipalities). In general, the Gwestplan may be
considered a series of concentric circles, as shown in Figure B-5, with
the docks and water-dependent industry in the center, surrounded by
light industry and commercial activity, then agricultural and a "green"
buffer zone, and finally housing. "Fingers" of green belt or recrea-
tional acreage frequently extend across two or more of the concentric
B-71
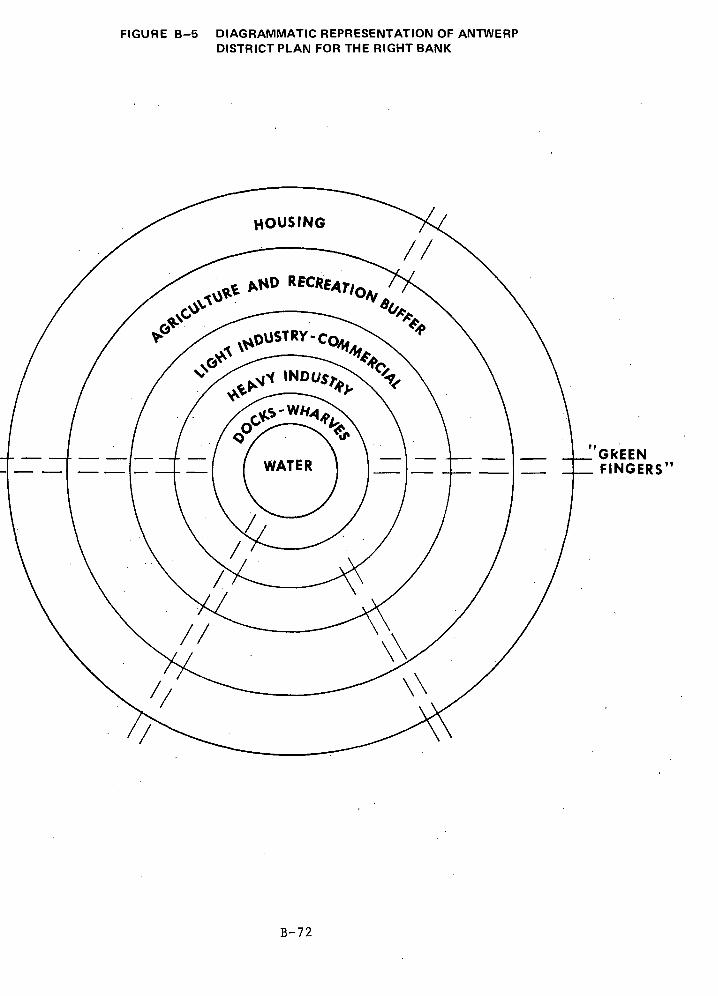
FIGURE B-5 DIAGRAMMATIC REPRESENTATION OF ANTWERP DISTRICT PLAN FOR THE RIGHT BANK
1 „
GREEN FINGERS"
B-72
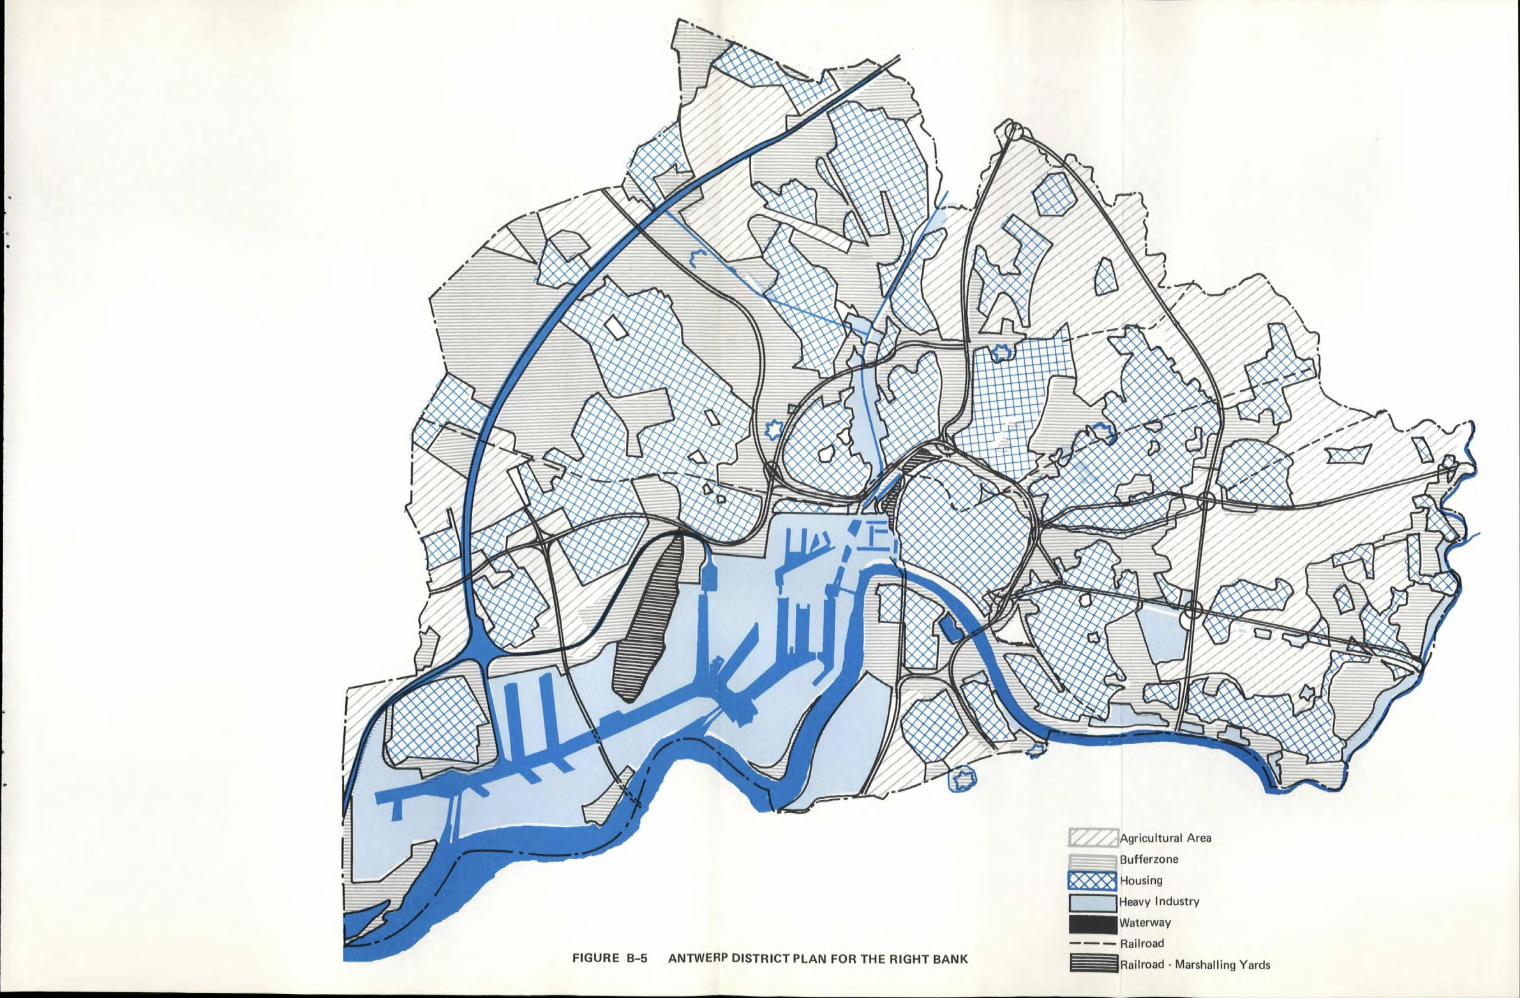
FIGURE B-5 ANTWERP DISTRICT PLAN FOR THE RIGHT BANK
Agricultural Area
Bufferzone
Housing
Heavy Industry
Waterway
-- Railroad
Railroad - Marshalling Yards
layers to improve communications to the industrial center and provide
visual and aesthetic relief. Restricted building activities are
allowed to occur in certain "green" zones. Used as buffers, these
areas might include office buildings, schools, recreational facilities,
and the like. There are parks with only recreational buildings, and
natural conservation areas where nature cannot be altered. Depending
on population density, certain residential areas may also contain
light industry or commercial activities. Although there seems to have
been relatively little consideration given to the intrinsic suitability
of the land itself for the various uses specified, the Gwestplan
appears to be quite well conceived and amenable to reasonable changes
in the future, so long as the basic concept of separating different
kinds of land use is not violated. In fact, practically all industries
located within the city have been moved out. Expropriation is carried
out by the government, and the city reimburses displaced individuals
and companies.
During 1971, residents of the 38 communities involved will have an
opportunity to review the Gwest plan and request changes which might be
made. A potential problem is that several townships want income-generating
industry on their own property, and greenery and agriculture on their
neighbor's - an interesting contrast to most situations in the U.S.
By the end of 1971, it is expected that the plan will receive official
approval from the National Ministry of Public Works.
A similar plan has been prepared, but not yet passed, regarding the
left bank development, which, when it takes place, will serve to
effectively double the port and industrial capacity of Antwerp and
possibly include an international airport (although the latter idea is
still controversial). Antwerp officials are particularly concerned
about the expropriation and relocation of residents in the areas
affected, because there is a widely held opinion that the right bank
land acquisition program could have been carried out with greater
sensitivity to the needs of the affected people.
B-73
An example is the experience of the residents of Berendrecht which is some
distance to the north of Antwerp itself and close to Kanaaldock D-3 and is
now surrounded by industry. By 1958, Antwerp's harbor had been expanded
substantially and it became apparent that further expansion would be
required if it were to maintain its position as a leading European
harbor. Therefore, the government planned to take an additional 6200
acres of farmland north of town for the new Kanaaldock area, which
would also make available sufficient acreage to attract new industrial
firms. This area, including the towns of Berendrecht and Zandvliet,
were annexed by Antwerp.
In the first plan of development, the entire area was to be industrialized,
with complete relocation of any communities in the way of the project.
This concept was fought by the two communities because workers in the small
communities surrounding the new area needed to be closer to their jobs than
the 20 miles or more that the plan required. As a result of this resistance,
a High Court decision allowed both Berendrecht and Zandvliet to remain.
However, many farms outside of the communities were expropriated without
sufficient appreciation for the farmers' historical traditions of working
the land; furthermore, the authorities devoted insufficient effort to
thoughtful relocation of the expropriates and to efficient management of
indemnification monies.
The city also put up a number of low- to middle-income housing projects
in Berendrecht and Zandvliet. While this allowed workers to remain
relatively clost to their jobs, it altered their environment and
subjected both old and new residents to significant amounts of air
pollution, some water pollution, and overcrowding. Thus, while standards
of living have unquestionably risen in the strictly economic sense, there
is a real question as to whether the social and environmental costs were
worth the economic benefits. One municipal official summarized the situa-
tion by saying that the planners had paid too little attention to
the questions of human relations, and that the citizens had not been
B-74
warned of their plans. In retrospect, this same official feels
that perhaps he should not have fought for the survival of Berendrecht and
Zandvliet because it turned out to be a poor environment. His efforts
could have been better spent on securing more indemnity and, above all,
more help in relocating and readjusting the people.
Looking ahead, as a result of the Berendrecht and Zandvliet experience,
a significant proportion of the population on the left bank of the
Scheldt River are rather dubious about whether their needs have been
taken into account, so that the subsequent industrialization and
expansion of Antwerp may in some significant way be hindered by past
results. Many people now feel that left bank communities such as el --
which, like Berendrecht, wish to remain
relocated -- should be moved now, but be effectively relocated away
from pollution, in an environment similar to the old one, with new
houses individually built now for the relocated residents. Unfortunately,
the left bank plan presently envisions very little relocation of individ-
ual homes or small communities, although now is the time to plan for
such relocation and assistance to the residents, rather than just give
money and push people out or allow the settlements to "die slowly on
the vine" as they are progressively surrounded by the heavy industry
for port activities. A general lesson drawn by European port planners
is to try to expand in virgin areas, where practically no one has to be
relocated.
All of these problems are related primarily to an integrated port
concept -- that is, a port which is not merely a terminal for handling
incoming or outgoing cargoes, but one which is intended to process
products (i.e., upgrade iron ore to steel, refine crude oil, manufacture
petrochemicals, or other manufacturing activities). If a comparison can
B-75
be fairly made, it would seem that if properly designed, a strictly
transfer operation, such as the one in Bantry Bay, would be far less
detrimental to the local physical and social environment than an
integrated port. Industries dependent upon the port would then be
required to locate at some distance in satellite areas, so that
environmental planning could be more effectively carried out. Admittedly,
such an approach would be more costly from an economic standpoint, since
the advantages of a deep port would in part be negated. To the extent
that they could be quantified, however, the social and environmental
advantages might well offset the economic disadvantage.
B.6.5 Future Issues
With the continued development of the port, as it becomes more
affluent and thus environment conscious, Antwerp will face several
issues, among which the most important are the following:
• As Antwerp continues to modernize, older less efficient
harbor-related activities will have to either be rebuilt
or replaced by some other type of activity. To date,
"urban renewal" constitutes only a tiny fraction of the
district's planning efforts.
o Increasingly stringent pollution-abatement requirements
will have to be passed and enforced.
• More sensitive planning will have to be carried out with
respect to communities, farms, or homes which are encroached
upon or surrounded by industrial activity.
• As industrialization opportunities expand, new candidates for
location in Antwerp will have to be carefully screened for
their effect upon the environment and the social contribution
they can make, not only to the economy in general but to
specific communities.
Presently, the attitude is still sensitive to cost benefits in terns of
employment; a relatively small, but "dirty", plant may be denied a
concession or building permit, while another larger plant, still "dirty"
but providing greater employment potential, would have a greater chance
of acceptance.
B-76
This could change when the quantity of jobs becomes a hindrance in a labor-
shortage situation, and when people start considering life and work quality
as prime requisites, instead of advocating additional expansion with foreign
labor which has resulted in more crowding. Existing good communications
between labor, management, and the state administration must hence be
maintained.
B-77
APPENDIX C
THE NETHERLANDS
ROTTERDAM AND AMSTERDAM
APPENDIX C Page
C.1 ROTTERDAM
C.1.1 Summary
C.1.2 General Area Description . C-6
Geography C-6
Surficial Character C-6
Climate C-6
Channel Hydraulics C-8
General Land Use C-8
Population C-8
Port C-9
C.1.3 Institutions and Financing
Rotterdam Port and Municipality C-11
Development Financing C-11
Beneficiaries C-13
Port Labor Force C-13
Regional Authority - Rijnmond C-14
C.1.4 Economic Appraisal
National Seaport Policy C-17
Traffic Flows and Land Requirements C-18
Land Requirements for Seaport Industries C-19
Supply of Seaport Areas C-19
Demand and Supply - Policy Conclusions C-21
Rotterdam Confrontation C-24
Employment C-39
The Growing Consensus on Port Industrial Develop- ment and Land Use C-44
Communication to Hinterland C-45
Economic Studies C-48
C.1.5 Engineering
Configuration C-52
Channel And Basin C-52
C-54
C-55
C-56
Docking
Cargo Handling
Problems and Lessons
C.1.6 Environmental Impact
Environmental Management Efforts C-57
Current and Potential Problems C-63
Future Issues C-71
ii
C.2 AMSTERDAM
C.2.1 Summary C-73
C.2.2 General Area Description C-75
Geography C-75
Surficial Character C-75
Climate C-77
Hydraulics C-77
General Land Use C-77
Population c-78
Port C-79
Institutional Authority C-79
C.2.3 Economic Aipraisal C-80
Historical Development of the Port C-80
The Past Twenty Years C-81
Sea Access C-82
Mono-port Concept C-84
Inland Transportation C-86
Land c-88
Labor C-90
General Cargo C-91
Iron Ore c-92
Other Ores C-93
Grain and Derivatives C-93
Coal and Coke C-94
Oil C-95
Commodity Flow Forecasts C-95
Industrialization C-100
Cost of Outer Port C-104
Recurring Costs C-105
Financial Cost Benefit Analyses of Alternative Plans C-1C5
Municipality C-105
National Aspect C-109
Other Benefits of the Outer Port C- 110
iii
C.2.4 Engineering Factors C-111
Site Selection C-111
Configurations C-111
Channel and Basin C-113
Docking C-115
Cargo Handling C-115
Environmental Protection C-116
Cost Data C-117
Crucial Problems and Lessons C-118
C.2.5 Environmental Impact C-120
Environmental Management Efforts C-120
Current and Potential Problems C-120
Water C-120
• Hazardous Cargoes C-124
Air C-124
Land and Solid Waste C-125
Noise/Visual C-I26
Land Use C-126
Future Issues C-127
iv
LIST OF FIGURES
Figure Page
C-1 Astronaut's View of the Golden Delta C-7
C-2 Port of Rotterdam C-10
C-3 Port of Amsterdam C-76
LIST OF TABLES
Table Page
C-1 Freight Flows in Netherlands Ports C-18
C-2 Land Requirements for Industrial Purposes in Netherlands Port Areas C-19
C-3 Total Land Requirements for Port Activities in the Netherlands C-20
C-4 Existing and Possible Future Port Area in the Netherlands C-22
C-5 Total Required Port Area in the Netherlands C-26
C-6 Distribution of Port Areas C-27
C-7 Rotterdam Total Commodity Traffic C-29
C-8 Rotterdam Export Commodity TRaffic C-30
C-9 Rotterdam Import Commodity Traffic C-31
C-10 Rotterdam Potential Tonnage C-32
C-11 Accumulative Total Additions Required Above Land Leased out in 1968 C-33
C-12 Accumulative Total Additions Required Above Land Leased out in 1968 C-34
C-13 Total Freight Flows in Netherlands Ports C-35
C-14 Freight Flows in Netherlands ports Commodity Category C-36
C-15 Freight Flows in Netherlands Ports C-36
C-16 Total Additional POrt Area Required in Netherlands C-37
C-17 Additional Port Area Required in the Northern Delta and in the Delta Region C-38
C-18 Estimated Additional Labor Force Employment and Popula- tion in the Greater Delta C-40
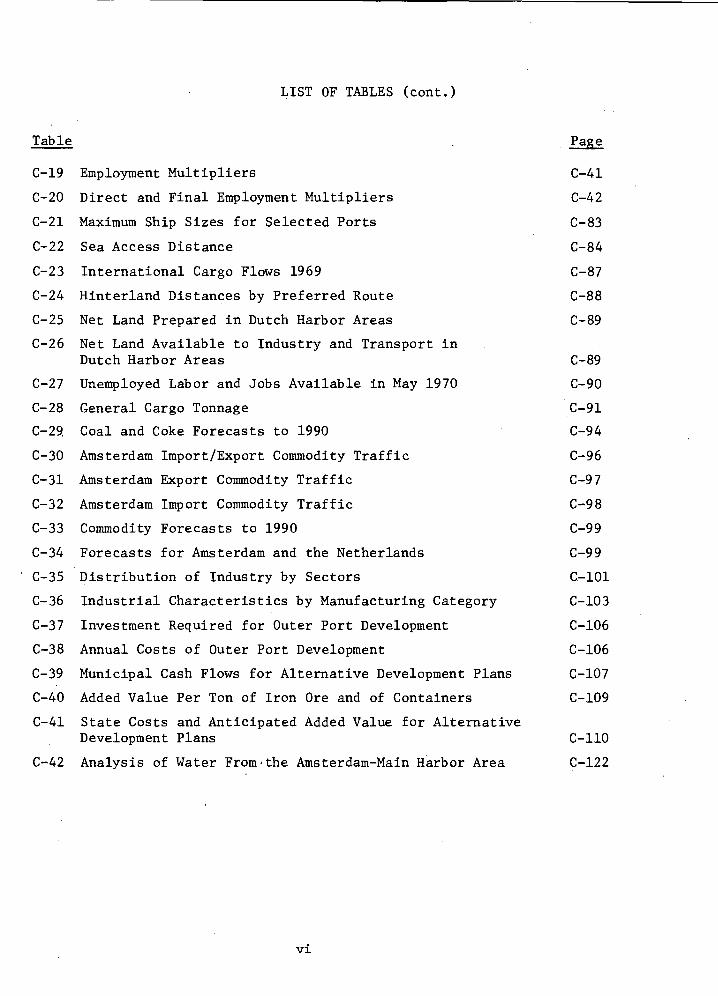
LIST OF TABLES (cont.)
Table Page
C-19 Employment Multipliers C-41
C-20 Direct and Final Employment Multipliers C-42
C-21 Maximum Ship Sizes for Selected Ports C-83
C-22 Sea Access Distance C-84
C-23 International Cargo Flows 1969 C-87
C-24 Hinterland Distances by Preferred Route C-88
C-25 Net Land Prepared in Dutch Harbor Areas C-89
C-26 Net Land Available to Industry and Transport in Dutch Harbor Areas C-89
C-27 Unemployed Labor and Jobs Available in May 1970 C-90
C-28 General Cargo Tonnage C-91
C-29 Coal and Coke Forecasts to 1990 C-94
C-30 Amsterdam Import/Export Commodity Traffic C-96
C-31 Amsterdam Export Commodity Traffic C-97
C-32 Amsterdam Import Commodity Traffic C-98
C-33 Commodity Forecasts to 1990 C-99
C-34 Forecasts for Amsterdam and the Netherlands C-99
' C-35 Distribution of Industry by Sectors C-101
C-36 Industrial Characteristics by Manufacturing Category C-103
C-37 Investment Required for Outer Port Development C-106
C-38 Annual Costs of Outer Port Development C-106
C-39 Municipal Cash Flows for Alternative Development Plans C-107
C-40 Added Value Per Ton of Iron Ore and of Containers C-109
C-41 State Costs and Anticipated Added Value for Alternative Development Plans C-110
C-42 Analysis of Water From , the Amsterdam-Main Harbor Area C-122
vi
APPENDIX C
C.1 ROTTERDAM
C.1.1 Summary
Rotterdam is not a new port. Almost totally destroyed in World War II,
it capitalized on its geographic position and the need in post-war Europe for
efficient port facilities to rebuild into the world's largest seaport. As
such, Rotterdam epitomizes many of the conflicts facing port planners today:
increasing demands for deep water capability, expanding land requirements,
overcrowding, pollution, increasing competition from other ports, and some
uncertainty as to "where it will all end".
Rotterdam is situated on the joint delta estuary of the Rhine and of the
Meuse; the former is the world's busiest commercial river, while the latter
runs through Belgian coalfields and iron and steel industry regions deep
in the industrial northeast of France. The Rotterdam region of the Netherlands
also has the densest road and canal network in the world, allowing efficient
transport of vast quantities of freight to most of the countries of Western
Europe. These factors combine to make Rotterdam the most favorably located
port in Europe, and first in the world for trade volume.
We have extracted the following highlights of Rotterdam's deep-water port
experience, based on a literature survey and a field trip, including the
Hague, Schiedam, and the Hook of Holland as well as the ports of Rotterdam
and Amsterdam.
• Rotterdam is a municipal port which receives from the
state funds for all maintenance dredging and two-thirds of
initial deepening costs. In addition, the city budget absorbs
each year the deficits from the port, ferries and port rail-
way operations while waiving the local taxes. However, this
support remains below what has been enjoyed by directly competing
ports in Belgium and France. Rotterdam is trying to muster more support
from the state or the province which, since the abandonment of the
C- 1
"monoport policy" concept in 1966, would rather restrict Rotterdam
expansion and screen the new trade and industries it seeks to at-
tract. A major area of contention is what deliberate limits, if any,
should be set on Rotterdam's needs for deep-water sites during
the rest of the century.
• The basic development strategy of the Port of Rotterdam has been
to expand local industrialization. Captive traffic is the best way
to compete in the Northwest European port competition. The con-
struction of improved deep-water harbors alone without on-site
industry is not viewed as the answer, because the diversionary
tendencies (from competing ports) will be too strong and will make
themselves felt in the next decade.
• Other local planning efforts are primarily carried out through
the Rijnmond, an authority initiated in 1965 and embracing 25
municipalities, including Rotterdam. Though it is responsible for
the Provincial government, the Rijnmond is virtually an auton-
mous organization, having authority over two major subjects
overall land use and the location of the major land uses. The
Rijnmond is more and more in conflict with the Port's strategy.
• Sophisticated techniques are used in national and regional
planning. A regional input/output model is in the making,
to be updated somewhat less frequently than the national
macro-economic model. In the meantime, Rotterdam's many port traf-
fic forecasts use various methods: production/acreage ratios,
interviews with major corporations, estimates of induced industrial-
ization, industry/employment/acreage ratios, multiple regression
analysis and port area input/output models.
Input/output techniques have also been used to determine the
manpower requirements of major port industries, and compare their
return on investment to the national economy. Metallurgical,
chemical process and refining operations have been calculated to be
the most beneficial activities, with shipbuilding having marginal
C-2
positive effects.
• Planning for very large ships is aleatory. Maas Vlakte I was
planned for 57 ft. vessels in 1963 and modified for 65 ft.
vessels after work began on implementation, in 1967. The
question of whether tankers beyond 250-300,000 dwt could
berth at Rotterdam is still unanswered because it
would require much additional dredging, possibly including part
of the English Channel. Alternatives are the rerouting of such
large tankers around the Scottish Peninsula, or the develop-
ment of super-tanker hulls with shallow draft - now being investi-
gated with government support.
• The natural coastline ceased to be a boundary some time ago;
nearly 6,500 acres of shallow sea off the coast, known as
Maasvlakte I, which will yield 4,025 acres of net usable space
for port handling facilities and industrial sites,is now
being turned into dry land surrounding several huge dock basins.
Forty percent (40%) of new land development is generally absorbed
by wet or dry port infrastructure and superstructure.
The Rotterdam authorities believe that all the available in-
dustrial space in the Maasvlakte I will have been reserved by
companies when the project is completed by 1971. Rotterdam is
also convinced that the demand for sites on or near deep water
will not be stilled by then. Consequently, Rotterdam is ac-
tively studying the technical and economic aspects of extending
the artificial Maasvlakte I southward.
Another possibility is the development of the delta area
to the south of Rotterdam. Rotterdam,in fact,foresees the
whole area between Rotterdam and Antwerp as developing into
a vast and almost continuous port/industrial complex. This concept
would dwarf the Dunkirk-Calais project, and has attracted
Antwerp's interest despite the traditional rivalry.
C-3
• There are two strong obstacles in the way of this Rotterdam
plan. One is the overcrowding of the western Netherlands,
to which Dutch public opinion is becoming highly sensitive.
The other reason is that many see the delta as an indispensable
area for Rotterdam City itself and feel its sand dunes, coasts,
and open spaces should be developed for recreation, and its popu-
lation centers expanded further to accomodate Rotterdam's overspill.
• Up to the present, concern over the quality of the environment
has played a relatively small role in the development of Rot-
terdam. Despite a strong institutional structure, with a Nuisance
Act dating from 1875 and encompassing air, water, and soil pol-
lution, noise and odors, fire, safety and radiation hazards
(but not yet visual intrusion and aesthetics), the central pre-
occupation of the Netherlands and Rotterdam continues to revolve
around land reclamation and continued economic expansion;
an indication of the increased questioning of this policy is the
5,000 annual net emigration balance over immigration in the greater
Rotterdam area and the fact that the Rijnmond receives as many as
20,000 anti-pollution calls per year.
• For better overall environmental quality, management, planning and
control are being shifted from the local level to provincial and
federal institutions. This shift has been completed for water;
air management should be transferred by the end of 1971. To date,
national air and water quality standards have not been established;
flagrant violations are combatted through technical assistance
and moral condemnation. It is expected, however, that more
stringent regulations will be passed.
• Overcrowding and heavy commuting, inadequate greenbelts, and
recreation areas, insufficient revenue from industrial land rentals,
pollution and safety hazards, and traffic congestion are charac-
teristic of the Rotterdam area. As Rotterdam continues to expand
C-4
and become more densely populated with industrial operations, the
pollution potential will not only become greater, but the pos-
sibilities will undoubtedly sharply increase regarding accidents
involving dangerous materials, explosives, fires and spills.
• The extension of the moles or breakwaters at the harbor
entrance is expected to change the pattern of the currents
along shore and thereby affect sediment transport. Beach
cultivation is underway. Relocation of the beach facilities and
an extension of the access roads will be warranted.
• The port has had sloughing and sliding problems for years,
and seawall fractures have been common. The deepening of the
channel has increased inner harbor wave action, and in com-
bination with the suction of the dredges and tidal seepage forces,
has accelerated erosion of the river bottom.
C-5
C.1.2 General Area Description
a. Geography
Located on the Netherlands' west coast, the city of Rotterdam is about
20 miles inland on one of the major portions of the Rhine River estuary
and is also at the northern extremity of the so-called "Golden Delta"
region (see Figure C.1).
A Geaport community since before 1300, Rotterdam rose in stature to a
major European port in the 1930's. The city and harbor of Rotterdam
were virtually destroyed during World War II; afterward, the entire area
was rebuilt and extended. With the resurgence of the European economy
and Holland's membership in the European Economic Community, Rotterdam
has become the world's largest seaport.
b. Surficial Character
As is typical of much of the Netherlands coastal region, substantial
portions of the Rotterdam area have been reclaimed from the North Sea
and lie at or below sea level. Sand, clay, and peat are the principal
soil materials, forming a layer of quaternary sediments of considerable
thickness.
c. Climate
Visibility in the Rotterdam area is 4 kms (2.5 miles) or more over
75% of the time and over 10 kms. (6 miles) at least half the time.
Rainfall ranges between 20 and 30 inches annually, temperature is between
30 and 55 °F, and the average wind speed is 11 mph. Prevailing winds
are southerly about 35 percent of the time.
C-6
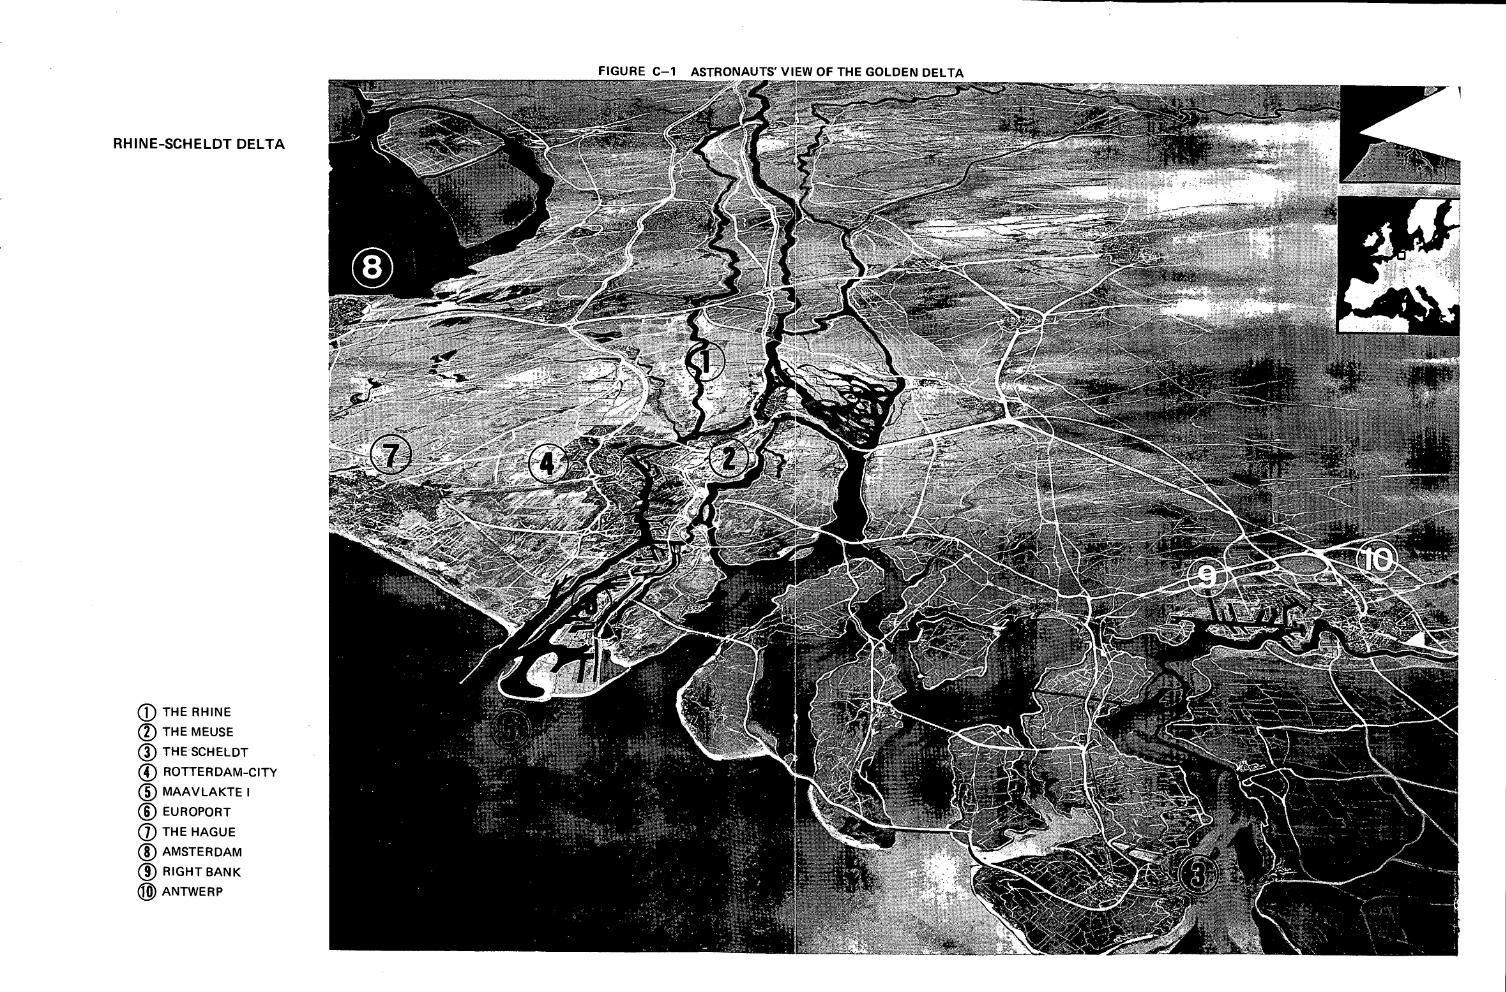
FIGURE C-1 ASTRONAUTS' VIEW OF THE GOLDEN DELTA
RHINE-SCHELDT DELTA
0 THE RHINE
0 THE MEUSE
® THE SCHELDT
0 ROTTERDAM-CITY
0 MAAVLAKTE I
0 EUROPORT
0 THE HAGUE
0 AMSTERDAM
0 RIGHT BANK
@ ANTWERP
d. Channel Hydraulics
At the Hook of Holland, on the coast, the tidal range has a mean variation
of 5.3 feet increasing to 5.7 feet with spring tides, while in Rotterdam
itself, tidal variations are somewhat less, ranging from a mean of 5.0
feet to 5.3 feet during spring tides. During high tide, cross currents
of about 2 1/2 knots occur in the outside channel, running in a westerly
direction. These cross currents create a need for heavy maintenance
dredging.
e. General Land Use
Virtually the entire left (southern) bank of the waterway connecting
Rotterdam with the North Sea is industrialized or committed to harbor use
up to a width of about 1-1/2 miles (Fig. C-2). A similar situation exists
on the right bank for about half the distance of the waterway from
Rotterdam. Principal industries are refining and petrochemical operations.
Several communities, principally Rozenburg and Pernis, both on the left
bank, are virtually surrounded by industry, although they are protected
to some extent by "greenbelts." These communities, which it is assumed
chose not to be displaced by industrial expansion during the development
of the Rotterdam area, are seriously threatened from an environmental
standpoint, and because of their location on the waterway, are prime
candidates for eventual replacement by industrial plants.
There appears to have been a specific intent to limit lateral expansion of
industry and instead to restrict it to a narrow belt surrounding the
waterway. It is obvious, however, that pressure is increasing to expand
the industrial area because existing land sites are limited. A new
dock is planned on the right bank between the Hook of Holland and the
community of Maassluis.
Because of the need for additional docking area besides that just described,
it is also planned to extend Europort seaward by constructing the
Maasvlakte, a deep-water port area immediately west of Europort.
f. Population
Present population of the city of Rotterdam is somewhat in excess of
700,000; within what might be called the Greater Rotterdam area, which
falls within the authority of the Rijnmond, a population of about 1.2
million lives in an area of some 155,000 acres.
C-8
Although the population of Rotterdam is increasing, we were informed that,
because of poor or expensive living conditions, insufficient variety, and
a "dirty and crowded existence," people are leaving the city in the amount
of a net 5,000 per year emigration over immigration. This does not
include births within Rotterdam which offset this 5,000 negative figure.
The people who are leaving Rotterdam are largely skilled blue collar or
white collar workers whose rising standard of living has made them aware
of their depreciating environment, and they have therefore decided either
to go elsewhere within Holland or to relocate well outside the Rotterdam
area but keep the same job. An unsettling result of this population shift
is that Rotterdam is becoming increasingly populated with semi-skilled
labor, which in turn tends to further depreciate the environment.
The physical and economic growth of Rotterdam plus the shifting patterns
of population create rather dramatic pressures in various sub-areas of the
Rijnmond region. For example, we were informed by an official of the
Rijnmond that approximately 70,000 people are now living in the Voorne
area and working in the western portions of the Rotterdam Harbor complex;
this official estimated that by 1990, 200,000 people will be living in
the same area, for a compound growth rate of approximately 5 1/2 percent.
g. Port
Major commodities handled by the Port of Rotterdam include crude oil and
petroleum products, ores and coal, fertilizers, and general cargo. The
principal commodities handled are crude oil and petroleum products,
accounting for approximately 60 percent of the throughput in 1969.
The main access channel to the waterway has a present draft of 65 feet.
If a minimum bottom-to-keel clearance of 15 percent of the ship's draft is
included, vessels of up to approximately 250,000 dwt can be accommodated
at high tide. Vessels have direct access to the port without having to
go through locks.
With the construction of the Maasvlakte and related deepening
of the access channel, it is expected that vessels up to 300,000 dwt can
be accommodated in Rotterdam.
C-9
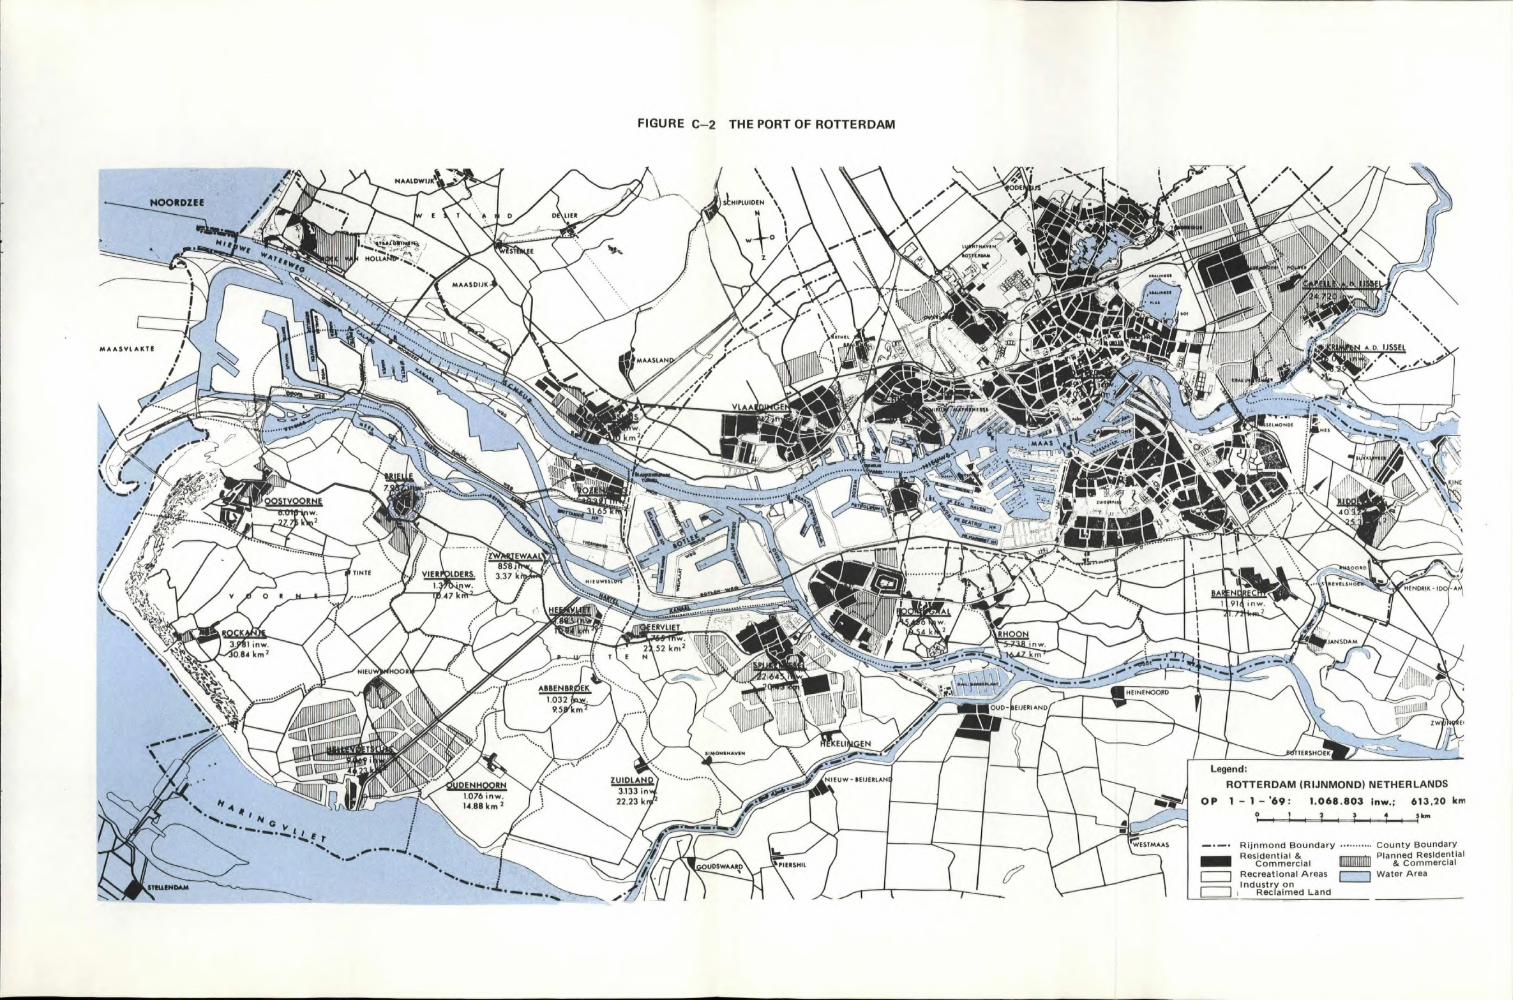
—•—• Rijnmond Boundary Residential &
Commercial Recreational Areas Industry on
Reclaimed Land
County Boundary Planned Residential
& Commercial
Water Area 1111 111111111 1111
FIGURE C-2 THE PORT OF ROTTERDAM
A.D. IJSSEL
NAALDWIJ 1 /. \
NOORDZEE SINIPLUIDEN
•••..
rig\ LIER
01
••••••••••
MAASDIJK
MAASYLAKTE
MAARAN
1 ' \-' „_, KINC
OOSTvOORK
fi VIER LDERS. 3.37 k
k
-0.84 km 2 1 inw.
ERVLIET PIR• w.
.52 km?
\k"vtV
•V‘kl..1
2Y 4
• •■,. i N • w.,,,. G L.. .. .
'••••• ■ • 4 1 1 ,, . E ; ".% •r ; ......
----,--- ; .. .... ...0 • .... • *4 .. . .4. _
-----1------ .
I I A:1 I di I I °I II I .11 11 I 11 111111 111I 11111 ' 111 f' (111[01 111111101 111 11 11111111 11 11: 11 111111 11111
1 111.11[11 11.11 11 11 111m.,;„ ,....!;1 ' t- 1111,100,111111:.,4; 100111 1Pr
loom 11 .",r1A/ A lib Ili!. , [Ho
Aes
DENHOORN 1.076 inw. 14,88 km 2
ZUIDLAND 3.133 in
22.23 IL'
SIMOMSHAVTN
UDSWAARD
Kw. *PIERSHIL
NIEUW - IIEIJERLAN
STELLENDAM 'w.L.
• •
JAN S.DAm
i
.%'efr
I' •
100//1
/
RHOAN
•
• m
40.
\.
Ilk Legend:
‚ ROTTERDAM IR IJNMOND) NETHERLANDS OP
km
—
.....,(7-77 li 27vzszmA,
1.1 t ? i ?ill i k"'
HEINENOORD
1.1rouo- EIJERI AND EWA
WESTMAA5
C.1.3 Institutions And Financing
a. Rotterdam Port and Municipality
Rotterdam is a municipal port. The basins, their quays and most of the
land in the port area are owned and controlled by the municipality, although
part of the Europoort area lies outside the municipal boundaries. Some
of the land in the port area is owned by shipyards and other industrial
enterprises, and some by the Dutch Railways.
A municipal port authority, headed by the managing director. appointed
by the City Council, is responsible for the day-to-day management of the
port. Policy is decided by a Board consisting of the Burgomaster and six
Alderman, assisted by an advisory committee for port management, itself
presided over by the Alderman responsible for port affairs, and consisting
of five other members of the City Council, and six citizens representing
the various interested groups in the port, employees as well as employers.
All the capital requirements of the port are provided by the municipality.
Any surplus or deficit on the port operations in any year is transferred
to the accounts of the municipality as a whole, and is not carried forward
in the port accounts.
b. Development Financing
The officials at Rotterdam believed that, under the present legislation
in other countries, the port is now receiving the least amount of outside
assistance of any port in Europe. The Burgomaster has recently been
expressing the same view and contrasting the situation of Rotterdam with
other European ports. As far as other Continental ports are concerned,
they may well be right, though it is difficult to make direct comparisons
between capital and revenue subsidies.
The financial subsidies received by Rotterdam are the following:
• The State pays for all maintenance dredging outside the
port area and bears two-thirds of the cost of deepening
the channels (except the new 65 feet deep offshore
channel). The access channel, the "Caland" and "Beerkanaal"
have been financed 100 percent by the Port Authority.
The construction of the dams in the Mosan area has been
supported two-thirds by the state and one-third by the
C-11
Port Authority. The government has since requested that
the Port Authority return the funds.
• The operating deficit of the port is written off each
year in the municipal accounts. The port is thus receiving
an annual subsidy of the amount of the deficit which in
recent years has been substantial. In addition, the port
does not have to bear the burden of financial charges on the
deficit.
It was pointed out that in the past the port produced
surpluses which were paid over to the municipality;
however, the current deficits are considerably larger, and
to this extent the port is indeed being subsidized
and not living on reserves built up in the past and
held in the municipal accounts.
The authorities stated that they expected to make surpluses
again in two years' time, but with the Maasvlakte
development we believe that the port will remAin in
deficit for several years to come.
• As a result of accelerated depreciation, the interest
charge payable to the municipality is lower than it
otherwise would be.
The port is not subject to local taxes nor does it have to
bear the costs of land police or fire brigade services
in the port area.
• The port only bears half the operating loss of the railway
in the port area.
• The municipality paid two-thirds of the deficit on
ferries.
Infrastructure (locks, basins, docks, roads, bridges) are investments
financed in totality by the Port Authority. The superstructure (cranes,
buildings, etc.) is in principle financed by the private sector. The
C-12
handling and storage facilities which have been financed in the past by
the Port Authority were sold to private industry in 1968.
Rotterdam Port Authority has shown great desire for more government aid
to combat the intensifying competition from other European ports. Rot-
terdam appears to be facing a strong competitive disadvantage compared to
the other European ports as far as subsidies are concerned; for example,
in Antwerp, the state is funding two-thirds of the investment costs of the
harbor entrance to the 20-mile waterway between the city center and the
Hook of Holland and in France the state pays 60 to 80 percent of investment
costs and covers all maintenance expenditures.
c. Beneficiaries
In the opinion of the Rijnmond economic group, the companies and the
nation overall were basically the only beneficiaries of port development.
The municipality of Rotterdam is heavily in debt because of its financing
of infrastructure in the port, and per capita income in the Rijnmond area
is no higher than any other region of the nation.
The Rotterdam area has been particularly attractive to large corporations
because of the comparatively low price of land. The companies pqrchase
(also lease) land on favorable terms with a considerable amount of stockpiling.
Lease contracts are initially for a 25-year period with two more 25-year
options available. An item of high priority should be the reevaluation
of this land.
d. Port Labor Force
The port authority does not act as a port operator and consequently does
not employ dock labor. All cargo handling operations are carried out by
private enterprise companies. Approximately 14,500 dock workers are
permanently employed in the port. Of this total, 12,000 are employed by
individual employers and 2,500 are in a labor pool. The labor pool basic
wage is financed through a surcharge on cargo-handling charges.
There are three labor unions operating in the port as follows:
1) N.B.V. - the largest union (Socialist)
2) C.B.B. - the Protestant union
3) K.B.V. - the Catholic union.
C-13
The unions negotiate with the employers as one unit; the standard working
week is 40 hours. In 1967, a school for "dockers" was started, and only
certificated workers are now added to the labor force. Through the sixties,
the pattern of labor relations was good, and Rotterdam enjoyed the advan-
tage of having a highly competitive port labor force. The major reasons
advanced for this position were:
- the steadily rising station of dock labor through
the introduction of sound training programs;
- sound negotiating practices;
- increasing levels of pay in relation to other sectors of Dutch
industry.
In 1970, however, worker turnovers increased and a major strike occurred,
due primarily to the wage discrepancy between Rotterdam and neighboring
ports, principally Antwerp. As a result, wages were increased substantially,
but the yearly turnover rate remains uncomfortably high, while produc-
tivity is believed inferior to Antwerp's.
e. Regional Authority--Rijnmond
Prior to World War II, the growth of the port of Rotterdam occurred
within the municipality itself, which grew on an "as needed" basis by
incorporating small adjoining municipalities in order to acquire the
necessary acreage to build port facilities and related industrial sites.
Virtually all operations relating to the port were under the control of
the Rotterdam municipality.
Following World War II and the reconstruction of Rotterdam, the
port began to grow at a much faster rate than in the late 30's, and the
municipality found it increasingly difficult to expand its jurisdiction
without seriously conflicting with the traditional autonomy and prerogatives
of adjoining communities. As a result, it became increasingly evident
that a new kind of governmental authority was required which would take
into account not only the needs of Rotterdam and the port itself, but also
C-14
those of surrounding communities which were being or could be affected by
port operations, and in so doing, provide a more rational and thoughtful
planning framework within which the port of Rotterdam could grow.
After much discussion among authorities at local, regional, and national
levels, a solution was agreed upon in 1964, culminating in the formation
of the Rijnmond (Rhine estuary area) in 1965. In essence, the Rijnmond
is a supra-municipal authority, comprising at present 23 municipalities
and covering an area of some 155,000 acres. The Authority is a legal
entity, established at Schiedam and consists of a council, an executive
committee, and a chairman. The council, consisting of 81 members, is
directly elected by the population for a period of four years. The six
members of the Executive Committee are appointed by the Rijnmond Council,
each for a period of four years, while the Chairman is appointed by the
Queen for a period of six years, but is not a member of the Council.
The Rijnmond thus falls essentially between municipal and provincial levels
of government, and "reports" to the province of South Holland. It is in
effect an autonomous organization having virtually full authority within
its region over two major subjects: overall land use, and the location
of major land uses. There is no other similar formal authority operating
in The Netherlands at the present time, although a similar move seems to
be afoot for the Amsterdam area.
In addition to its planning efforts pertaining to its region, Rijnmond
personnel interrelate with and advise communities outside the Rijnmond
area and also cooperate with neighboring provinces on a "good neighbor
basis."
With respect to land use, the Rijnmond Council is obligated to prepare
regional plans for the entire area under its jurisdiction or for parts
within that area. The regional or sub-regional plan prepared by the
Council requires approval from the Provincial Government before it can
take effect.
With respect to the municipalities within its jurisdiction, the Rijnmond
is empowered to issue guiding directives regarding the following:
C-15
1) Dock and industrial site construction,
2) Industrial establishment on appropriate sites,
3) Housing construction and distribution,
4) Open-air recreation,
5) Construction and improvement of roads and waterways,
6) Transportation of passengers and goods,
7) Cross river communications (e.g., bridges and tunnels),
8) Air and water pollution control.
The Rijnmond brings to the attention of the Provincial Government, and
to the authorities of the municipalities affected, the results of their
studies regarding any of the above subjects; the communities involved
have the right of appeal to higher authorities, but if this appeal is
denied, the Rijnmond directives have the force of law.
Besides its authority over the Rijnmond area specifically, the Council
can on its own initiative tender unsolicited advice or proposals to
government officials in the Province of South Holland or to municipalities
within the Province. Such advice has no legal weight, but because of
the stature and importance of the Rijnmond, it is certainly given con-
sideration in larger areal programs.
The financial obligations of the Rijnmond Council are paid for by the
municipalities involved in proportion to their population, with Rotterdam
contributing the major share of the monies needed.
As is the case with many authorities of this type, its members often
believe that it does not have sufficient authority to carry out the
programs in which it believes, nor that it has adequate funding.
Accordingly, it is seeking to remedy these two deficiencies by obtaining
certain taxing powers as well as to increase its authority in the
fields of road and waterway construction, public health, recreation,
and cross river transportation.
C-16
Obviously, the ascension to greater power by the Rijnmond Council will
be somewhat at the expense of the municipalities which it serves and
of which it is a part. The degree to which the municipalities involved
perceive Rijnmond in a directly beneficial or adverse light regarding
their interests will in large measure determine the long-term success
of the Rijnmond in its attempts to broaden and increase its powers.
C.1.4 Economic Appraisal
a. National Seaport Policy
In 1966, the major principles for a national seaport were laid down in
the "Zeehavennota Report."* In this report, the Netherlands' central
government issued an outline of possible future development concerning
the nation's seaports and the policy to be followed in order to obtain
an optimal solution to the economic and social problems connected with
over concentration and development in the Rotterdam area.
The report recognized the significant change in the function of ports** '
in the national economy. Before World War II, ports served essentially
for import and export of commodity cargo, transport of persons, and
for transshipment. There also was limited industrial activity. After
the war the freight flows increased dramatically, and the transport of
passengers almost disappeared. On the other hand, industrial activities
in port areas have shown a tremendous increase. Only some 20 percent
of Rotterdam port areas is used for transport and transshipment while
80 percent is occupied by port-based industries (e.g., oil refineries,
chemical and petrochemical industries, shipyards, etc.).
The two functions which seaports have today make it necessary to make
two different kinds of forecasts in order to calculate the required
size of port areas in the future. The one concentrates on forecasts
of freight flows, the other on future development of port-based in-
dustries and the required port areas to locate these industries. Both
kinds of forecasts are given attention in the Zeehavennota Report.
* Zeehavennota: het zeehavenbeleid van de Rijksoverheid, Staatsuitgeverij, 's-Gravenhage 1966.
** In essence RotterdaiNthen accounting for 86 percent of national sea traffic.
C-17
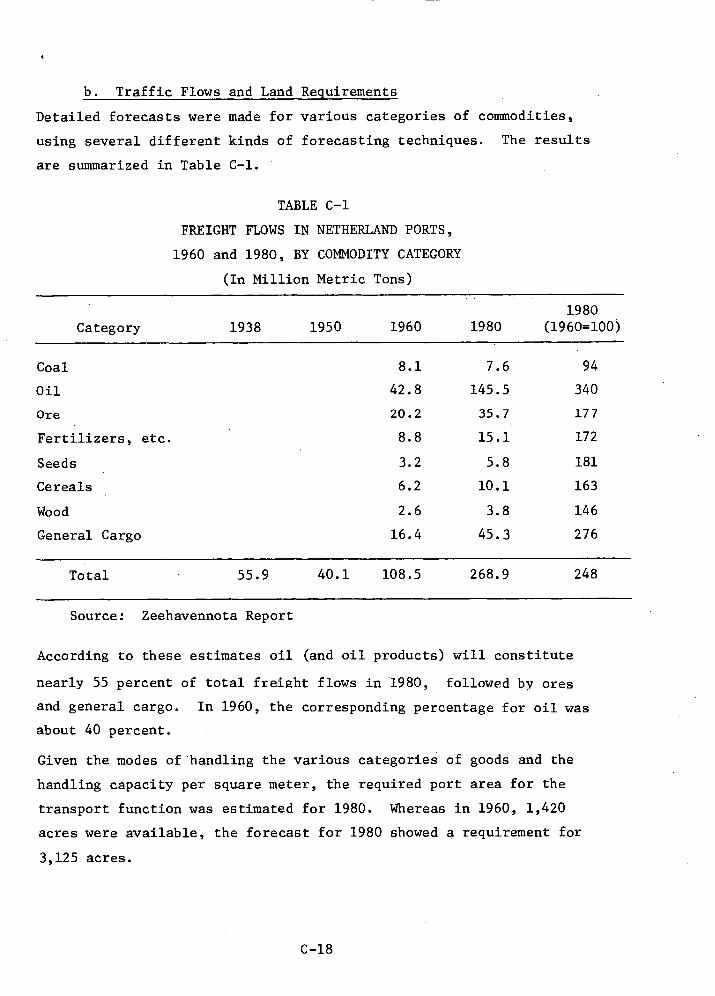
55.9 40.1 108.5 268.9 248 Total
b. Traffic Flows and Land Requirements
Detailed forecasts were made for various categories of commodities,
using several different kinds of forecasting techniques. The results
are summarized in Table C-1.
TABLE C-1
FREIGHT FLOWS IN NETHERLAND PORTS,
1960 and 1980, BY COMMODITY CATEGORY
(In Million Metric Tons)
Category 1980
1938 1950 1960 1980 (1960=100)
Coal 8.1 7.6 94
Oil 42.8 145.5 340
Ore 20.2 35.7 177
Fertilizers, etc. 8.8 15.1 172
Seeds 3.2 5.8 181
Cereals 6.2 10.1 163
Wood 2.6 3.8 146
General Cargo 16.4 45.3 276
Source: Zeehavennota Report
According to these estimates oil (and oil products) will constitute
nearly 55 percent of total freight flows in 1980, followed by ores
and general cargo. In 1960, the corresponding percentage for oil was
about 40 percent.
Given the modes of handling the various categories of goods and the
handling capacity per square meter, the required port area for the
transport function was estimated for 1980. Whereas in 1960, 1,420
acres were available, the forecast for 1980 showed a requirement for
3,125 acres.
C-18
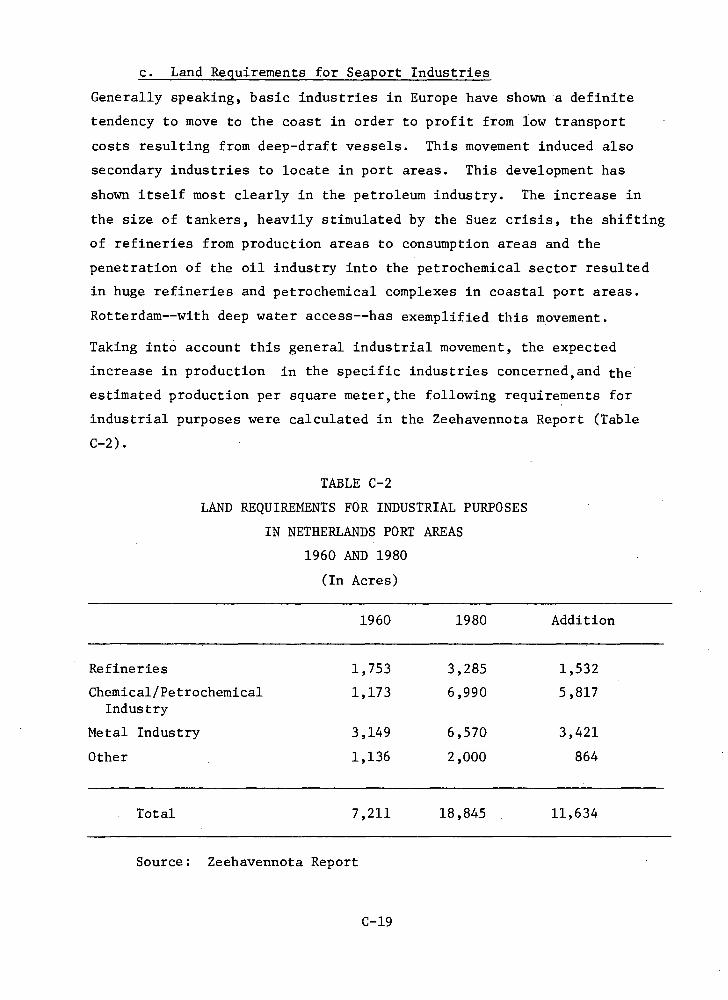
c. Land Requirements for Seaport Industries
Generally speaking, basic industries in Europe have shown a definite
tendency to move to the coast in order to profit from low transport
costs resulting from deep-draft vessels. This movement induced also
secondary industries to locate in port areas. This development has
shown itself most clearly in the petroleum industry. The increase in
the size of tankers, heavily stimulated by the Suez crisis, the shifting
of refineries from production areas to consumption areas and the
penetration of the oil industry into the petrochemical sector resulted
in huge refineries and petrochemical complexes in coastal port areas.
Rotterdam--with deep water access--has exemplified this movement.
Taking into account this general industrial movement, the expected
increase in production in the specific industries concerned,and the
estimated production per square meter,the following requirements for
industrial purposes were calculated in the Zeehavennota Report (Table
C-2).
TABLE C-2
LAND REQUIREMENTS FOR INDUSTRIAL PURPOSES
IN NETHERLANDS PORT AREAS
1960 AND 1980
(In Acres)
1960 1980 Addition
Refineries 1,753 3,285 1,532
Chemical/Petrochemical 1,173 6,990 5,817 Industry
Metal Industry 3,149 6,570 3,421
Other 1,136 2,000 864
Total 7,211 18,845 11,634
Source: Zeehavennota Report
C-19
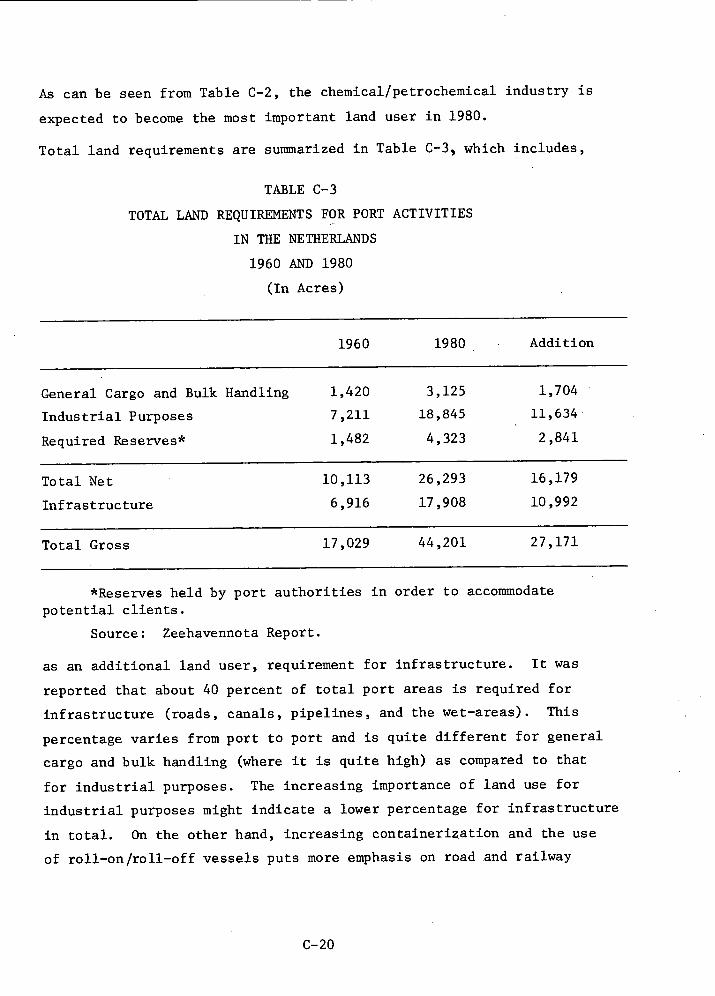
Total Net
Infrastructure
10,113 26,293 16,179
6,916 17,908 10,992
Total Gross 17,029 44,201 27,171
As can be seen from Table C-2, the chemical/petrochemical industry is
expected to become the most important land user in 1980.
Total land requirements are summarized in Table C-3, which includes,
TABLE C-3
TOTAL LAND REQUIREMENTS FOR PORT ACTIVITIES
IN THE NETHERLANDS
1960 AND 1980
(In Acres)
1960 1980 Addition
General Cargo and Bulk Handling 1,420 3,125 1,704
Industrial Purposes 7,211 18,845 . 11,634
Required Reserves* 1,482 4,323 2,841
*Reserves held by port authorities in order to accommodate potential clients.
Source: Zeehavennota Report.
as an additional land user, requirement for infrastructure. It was
reported that about 40 percent of total port areas is required for
infrastructure (roads, canals, pipelines, and the wet-areas). This
percentage varies from port to port and is quite different for general
cargo and bulk handling (Where it is quite high) as compared to that
for industrial purposes. The increasing importance of land use for
industrial purposes might indicate a lower percentage for infrastructure
in total. On the other hand, increasing containerization and the use
of roll-on/roll-off vessels puts more emphasis on road and railway
C-20
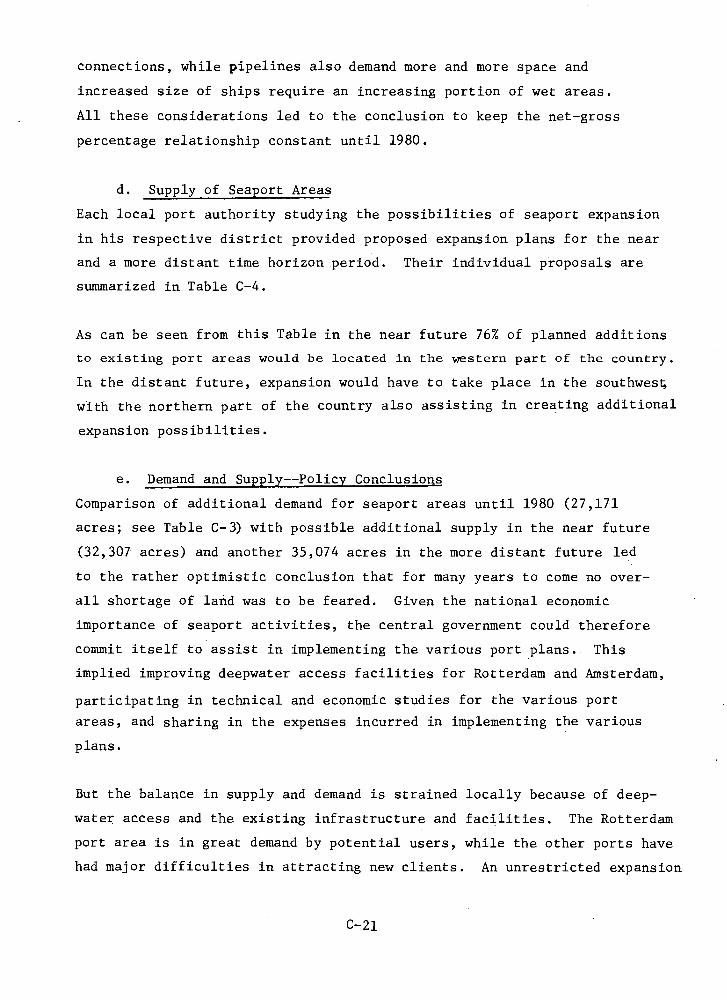
connections, while pipelines also demand more and more space and
increased size of ships require an increasing portion of wet areas.
All these considerations led to the conclusion to keep the net-gross
percentage relationship constant until 1980.
d. Supply of Seaport Areas
Each local port authority studying the possibilities of seaport expansion
in his respective district provided proposed expansion plans for the near
and a more distant time horizon period. Their individual proposals are
summarized in Table C-4.
As can be seen from this Table in the near future 76% of planned additions
to existing port areas would be located in the western part of the country.
In the distant future, expansion would have to take place in the southwest,
with the northern part of the country also assisting in creating additional
expansion possibilities.
e. Demand and Supply--Policy Conclusions
Comparison of additional demand for seaport areas until 1980 (27,171
acres; see Table C-3) with possible additional supply in the near future
(32,307 acres) and another 35,074 acres in the more distant future led
to the rather optimistic conclusion that for many years to come no over-
all shortage of land was to be feared. Given the national economic
importance of seaport activities, the central government could therefore
commit itself to assist in implementing the various port plans. This
implied improving deepwater access facilities for Rotterdam and Amsterdam,
participating in technical and economic studies for the various port
areas, and sharing in the expenses incurred in implementing the various
plans.
But the balance in supply and demand is strained locally because of deep-
water access and the existing infrastructure and facilities. The Rotterdam
port area is in great demand by potential users, while the other ports have
had major difficulties in attracting new clients. An unrestricted expansion
C-2l
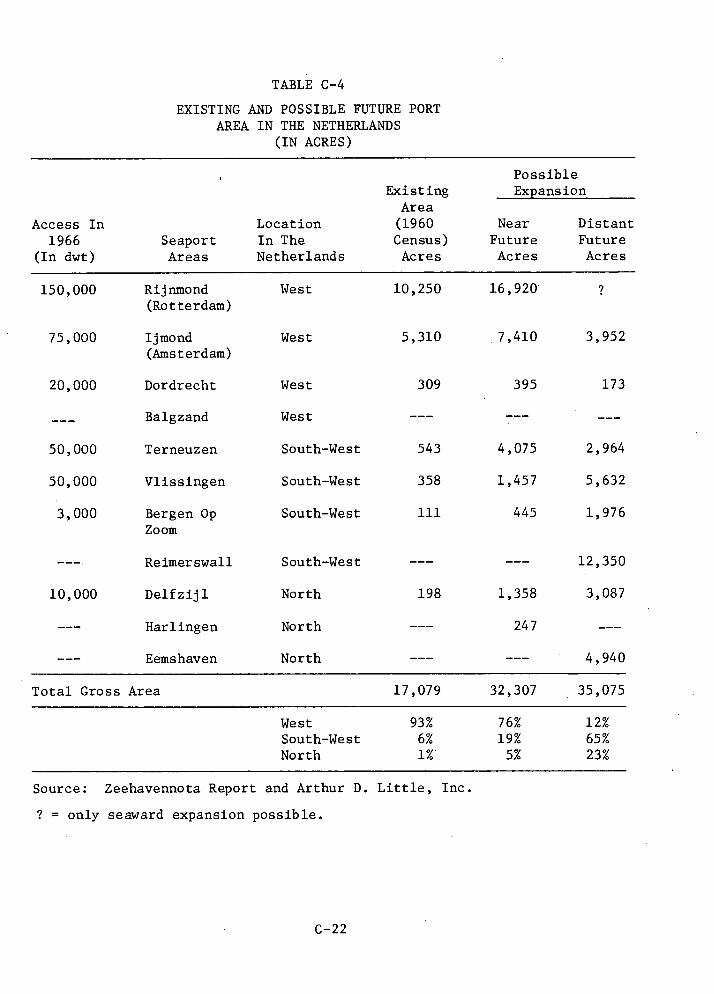
TABLE C-4
EXISTING AND POSSIBLE FUTURE PORT AREA IN THE NETHERLANDS
(IN ACRES)
Possible Existing Expansion
Area Access In Location (1960 Near Distant
1966 Seaport In The Census) Future Future (In dwt) Areas Netherlands Acres Acres Acres
150,000 Rijnmond West 10,250 16,920 (Rotterdam)
75,000 Ijmond West 5,310 7,410 3,952 (Amsterdam)
20,000 Dordrecht West 309 395 173
Balgzand West --- 7-- ---
50,000 Terneuzen South-West 543 4,075 2,964
50,000 Vlissingen South-West 358 1,457 5,632
3,000 Bergen Op South-West 111 445 1,976 Zoom
Reimerswall South-West ___ --- 12,350
10,000 Delfzijl North 198 1,358 3,087
--- Harlingen North --- 247
--- Eemshaven North --- --- 4,940
Total Gross Area 17,079 32,307 35,075
West 93% 76% 12% South-West 6% 19% 65% North 1% . 5% 23%
Source: Zeehavennota Report and Arthur D. Little, Inc.
? = only seaward expansion possible.
C-22
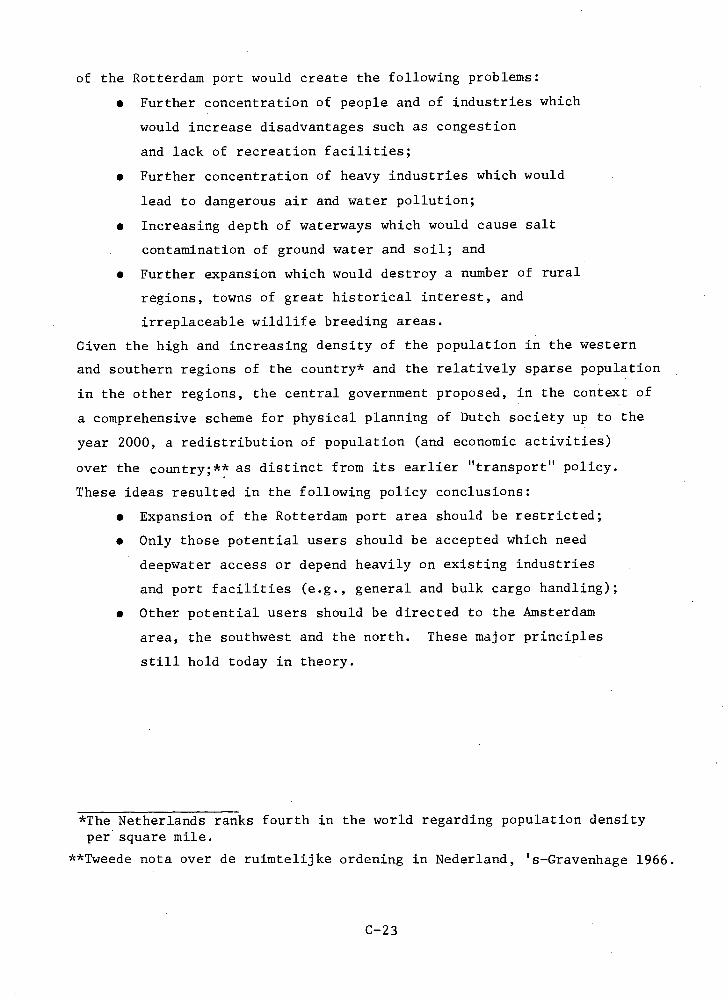
of the Rotterdam port would create the following problems:
• Further concentration of people and of industries which
would increase disadvantages such as congestion
and lack of recreation facilities;
• Further concentration of heavy industries which would
lead to dangerous air and water pollution;
• Increasing depth of waterways which would cause salt
contamination of ground water and soil; and
• Further expansion which would destroy a number of rural
regions, towns of great historical interest, and
irreplaceable wildlife breeding areas.
Given the high and increasing density of the population in the western
and southern regions of the country* and the relatively sparse population
in the other regions, the central government proposed, in the context of
a comprehensive scheme for physical planning of Dutch society up to the
year 2000, a redistribution of population (and economic activities)
over the country;** as distinct from its earlier "transport" policy.
These ideas resulted in the following policy conclusions:
• Expansion of the Rotterdam port area should be restricted;
• Only those potential users should be accepted which need
deepwater access or depend heavily on existing industries
and port facilities (e.g., general and bulk cargo handling);
• Other potential users should be directed to the Amsterdam
area, the southwest and the north. These major principles
still hold today in theory.
*The Netherlands ranks fourth in the world regarding population density per square mile.
**Tweede nota over de ruimtelijke ordening in Nederland, 's-Gravenhage 1966.
C-23
f. Rotterdam Confrontation
As soon as this first attempt to formulate a national seaport policy was
published by the government, a strong controversy arose, illustrated by
some well known reports:
1) Een prognose van de Nederlandse behoefte aan
Zeehavenareaal in 1980 (Kamer van Koophandel
en Fabrieken voor Rotterdam, 1968).
2) Verkenning van enkele aspekten van de ontwikkelings
mogelijkheden voor zeehavens in het Deltagebied.
(Rapport uitgebracht door het Overlegorgaan
Zeehavenontwikkeling Zuid-West Nederland, 1968.) ,
3) The Greater Delta Region. (Frederic R. Harris.
Holland N.V., 1968).
4) Verkenning van de toekomstige werkgelegenheid in
het Rotterdamse haven en industriegebied. (Rapport
uitgebracht door de commissie ad hoc aan de commissie
van advies voor het havenbedrijf, 1969).
5) Ontwikkeling noordelijke delta: plan 2000+. (In
opdracht van het gemeentebestuur van Rotterdam
opgesteld door het havenbedrijf en de diensten van
stadsontwikkeling en gemeentewerken, 1969).
6) Land Use and Transportation Study, Technical Report,
Volume II, Economic Analyses and Forecasts of Port
Traffic Flows. (Freemand, Fox, Wilbur Smith and
Associates in association with Management Sciences
Ltd. 1969).
7) Rijnmond in de delta. Beoordeling der economische
ontwikkelings mogelijkheden van het Rijnmondgebied.
(Openbaar Lichaam Rijnmond, 1969).
These reports differ in scope and methods: (6) Land Use and Transporta-
tion Study is a technical report specifically dealing with forecasts of
port traffic flows in the Rotterdam area; (5) Plan 2000+ tries to trans-
late the figures contained in (3) The Greater Delta Region; and (4)
Rotterdam Committee ad hoc into a concrete physical plan for the northern
C-24
part of the Delta. In the reports, different methods were used to
estimate the reuqired port area in the future and they are for this
reason rather difficult to compare. As extremes, (2) Overlegorgaan and
(3) The Greater Delta Region, will be reviewed.
The Overlegorgaan report is based on the hypothesis that the area required
for port activities is a simple function of production, and that the
productivity of land, just as all other factors of production, will show
a steady and continuous increase. On the basis of a preliminary analysis
of production and port area in the past, it was assumed that in the
long run an increase in production of 10 percent would be accompanied
by an increase of 7 percent in the port area required. This relationship
and the estimates of possible growth of production in port activities (in-
cluding general cargo and bulk handling) leads to the following require-
ments shown in Table C-5 and C-6.
C-25
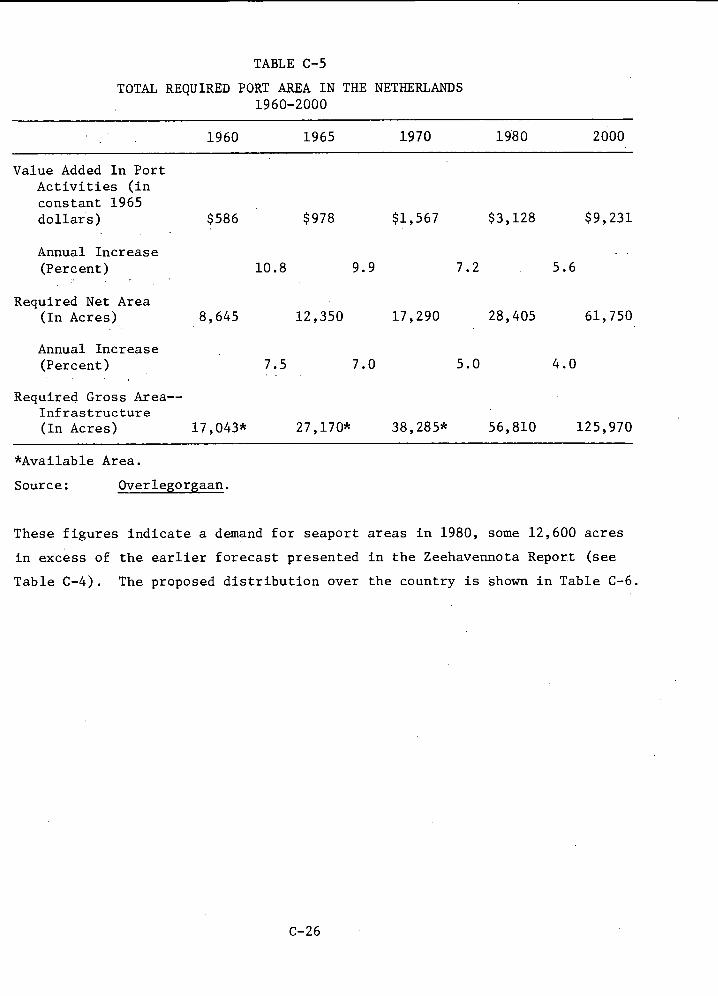
1960 1965 1970 1980 2000.
Value Added In Port Activities (in constant 1965 dollars) $586 $978 $1,567 $3,128 $9,231
Annual Increase (Percent) 10.8 9.9 7.2 5.6
Required Net Area (In Acres) 8,645 12,350 17,290 28,405 61,750
Annual Increase (Percent) 7.5 7.0 5.0 4.0
Required Gross Area-- Infrastructure (In Acres) 17,043* 27,170* 38,285* 56,810 125,970
TABLE C-5
TOTAL REQUIRED PORT AREA IN THE NETHERLANDS 1960-2000
*Available Area.
Source: Overlegorgaan.
These figures indicate a demand for seaport areas in 1980, some 12,600 acres
in excess of the earlier forecast presented in the Zeehavennota Report (see
Table C-4). The proposed distribution over the country is shown in Table C-6.
C-26
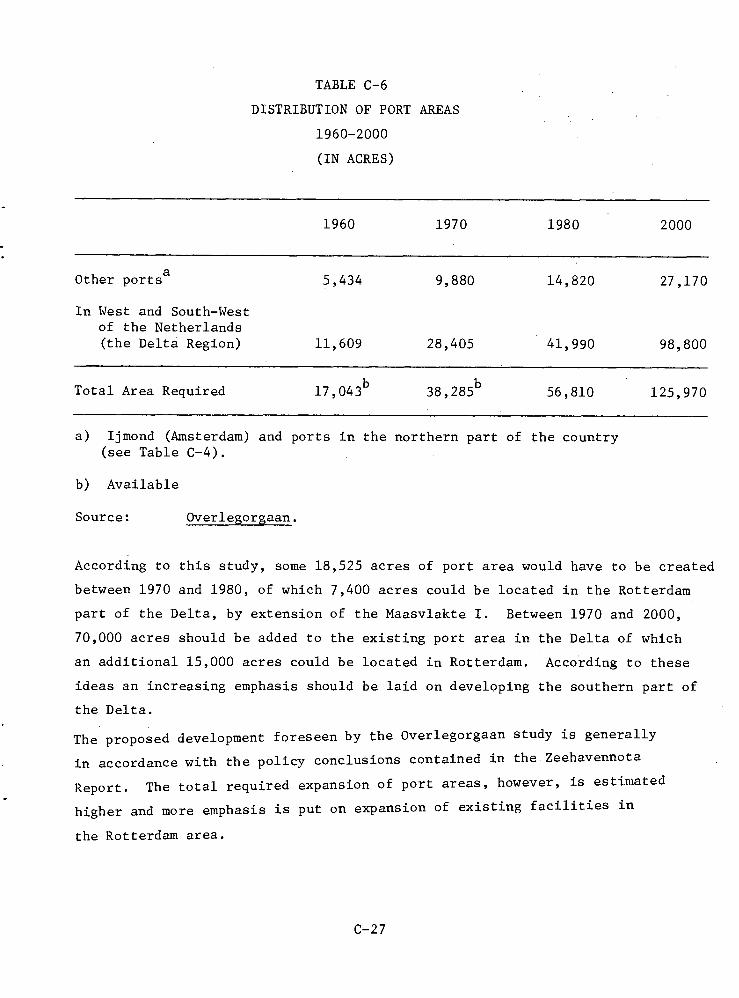
Other ports a 5,434 9,880 14,820 27,170
In West and South-West of the Netherlands (the Delta Region)
Total Area Required
11,609 28,405 41,990 98,800
17,043b
38,285b
56,810 125,970
TABLE C-6
DISTRIBUTION OF PORT AREAS
1960-2000
(IN ACRES)
1960 1970 1980 2000
a) Ijmond (Amsterdam) and ports in the northern part of the country (see Table C-4).
b) Available
Source: Overlegorgaan.
According to this study, some 18,525 acres of port area would have to be created
between 1970 and 1980, of which 7,400 acres could be located in the Rotterdam
part of the Delta, by extension of the Maasvlakte I. Between 1970 and 2000,
70,000 acres should be added to the existing port area in the Delta of which
an additional 15,000 acres could be located in Rotterdam. According to these
ideas an increasing emphasis should be laid on developing the southern part of
the Delta.
The proposed development foreseen by the Overlegorgaan study is generally
in accordance with the policy conclusions contained in the Zeehavennota
Report. The total required expansion of port areas, however, is estimated
higher and more emphasis is put on expansion of existing facilities in
the Rotterdam area.
C-27
In The Greated Delta Region study, the principal method used was inter-
viewing. The interviews included the major users of port facilities (12
large industrial enterprises which in total use 80 percent of the port
area) and potential users known to have an interest in locating in the
port area. This method is in accordance with the basic philosophy under-
lying the whole report, i.e., "...the belief that the future of the port
will be determined to a great extent by the specific plans of current
and known potential industrial and commercial tenants of the port,
supplemented by unidentified users which would be the logical type of
firms that would be attracted to the industrial raw material and balance
out the industrial complex." The objective of the report was to estimate
the size of the potential port defined as "...today's port (the port of
of Rotterdam) fully developed plus all new harbor and land facilities
which would be required if everything possible were done to develop it,
and no restraints or constrictions were imposed."
The forecasts of possible commodity flows were individually analyzed for
each category of goods. The historical and projected results are
illustrated in Tables C-7 to C-12.
C-28
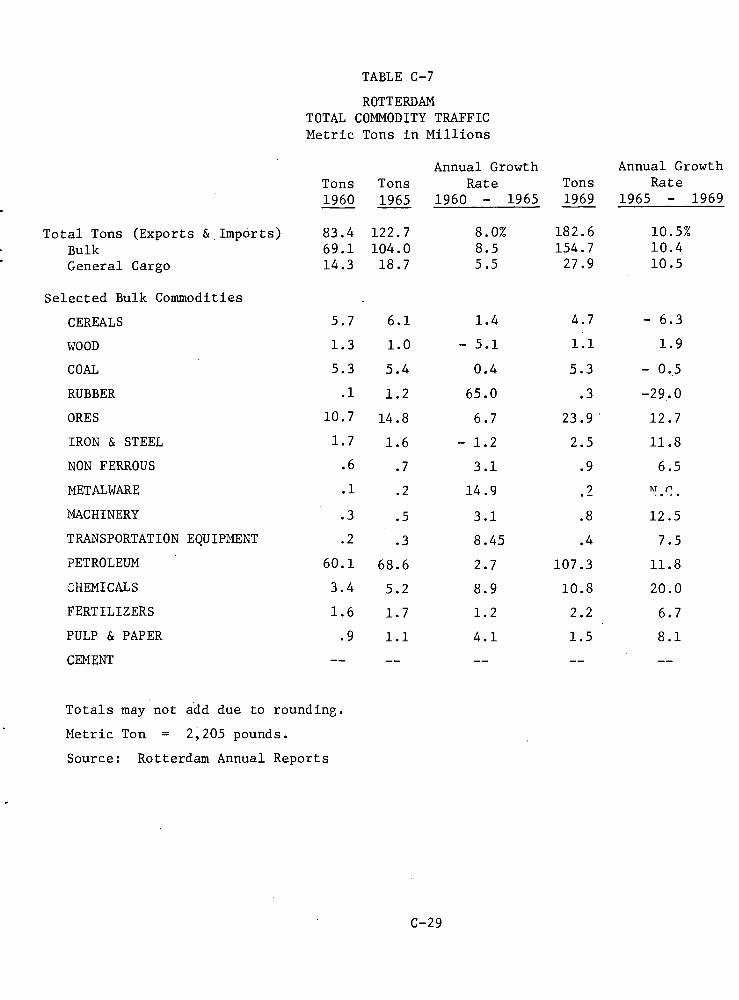
TABLE C-7
ROTTERDAM TOTAL COMMODITY TRAFFIC Metric Tons in Millions
Annual Growth Annual Growth Tons Tons Rate Tons Rate 1960 1965 1960 - 1965 1969 1965 - 1969
Total Tons (Exports & Imports) 83.4 122.7 8.0% 182.6 10.5% Bulk 69.1 104.0 8.5 154.7 10.4 General Cargo 14.3 18.7 5.5 27.9 10.5
Selected Bulk Commodities
CEREALS 5.7 6.1 1.4 4.7 - 6.3
WOOD 1.3 1.0 - 5.1 1.1 1.9
COAL 5.3 5.4 0.4 5.3 - 0.5
RUBBER .1 1.2 65.0 .3 -29.0
ORES 10.7 14.8 6.7 23.9 12.7
IRON & STEEL 1.7 1.6 - 1.2 2.5 11.8
NON FERROUS .6 .7 3.1 .9 6.5
METALWARE .1 .2 14.9 • . •
MACHINERY .3 .5 3.1 .8 12.5
TRANSPORTATION EQUIPMENT .2 .3 8.45 .4 7.5
PETROLEUM 60.1 68.6 2.7 107.3 11.8
CHEMICALS 3.4 5.2 8.9 10.8 20.0
FERTILIZERS 1.6 1.7 1.2 2.2 6.7
PULP & PAPER .9 1.1 4.1 1.5 8.1
CEMENT -- -- -- --
Totals may not add due to rounding.
Metric Ton = 2,205 pounds.
Source: Rotterdam Annual Reports
C-29
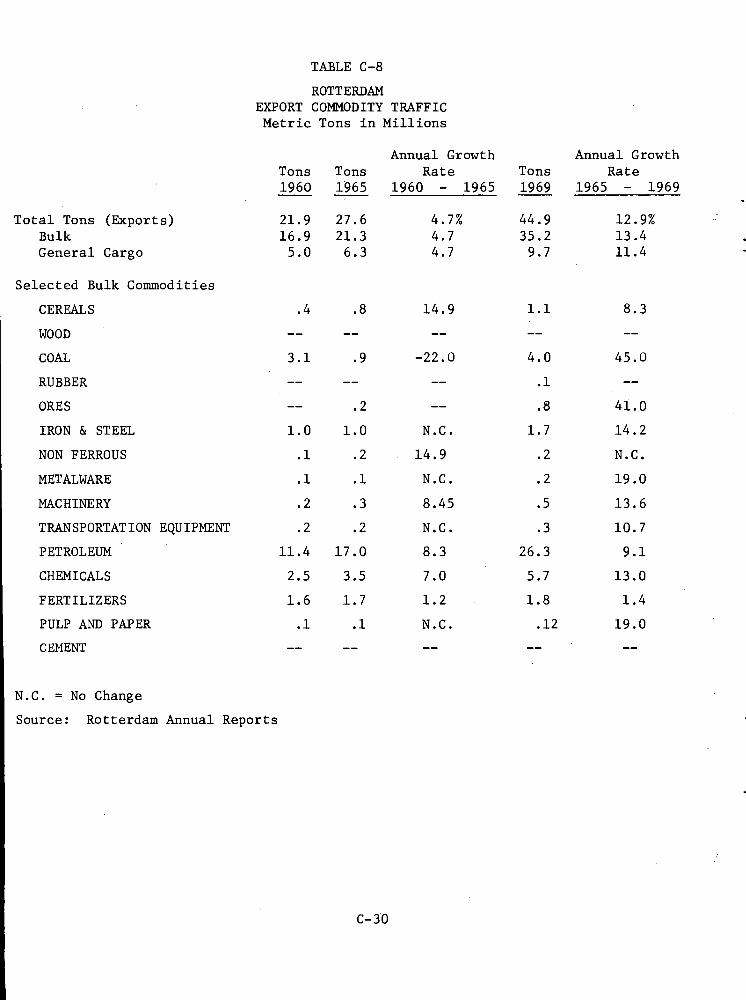
TABLE C-8
ROTTERDAM EXPORT COMMODITY TRAFFIC Metric Tons in Millions
Annual Growth Annual Growth Tons Tons Rate Tons Rate 1960 1965 1960 - 1965 1969 1965 - 1969
Total Tons (Exports) 21.9 27.6 4.7% 44.9 12.9% Bulk 16.9 21.3 4.7 35.2 13.4 General Cargo 5.0 6.3 4.7 9.7 11.4
Selected Bulk Commodities
CEREALS .4 .8 14.9 1.1 8.3
WOOD -- -- -- -- --
COAL 3.1 .9 -22.0 4.0 45.0
RUBBER -- -- -- .1 --
ORES -- .2 -- .8 41.0
IRON & STEEL 1.0 1.0 N.C. 1.7 14.2
NON FERROUS .1 .2 14.9 .2 N.C.
METALWARE .1 .1 N.C. .2 19.0
MACHINERY .2 .3 8.45 .5 13.6
TRANSPORTATION EQUIPMENT .2 .2 N.C. .3 10.7
PETROLEUM 11.4 17.0 8.3 26.3 9.1
CHEMICALS 2.5 3.5 7.0 5.7 13.0
FERTILIZERS 1.6 1.7 1.2 1.8 1.4
PULP AND PAPER .1 .1 N.C. .12 19.0
CEMENT -- -- -- __ --
N.C. = No Change
Source: Rotterdam Annual Reports
C-30
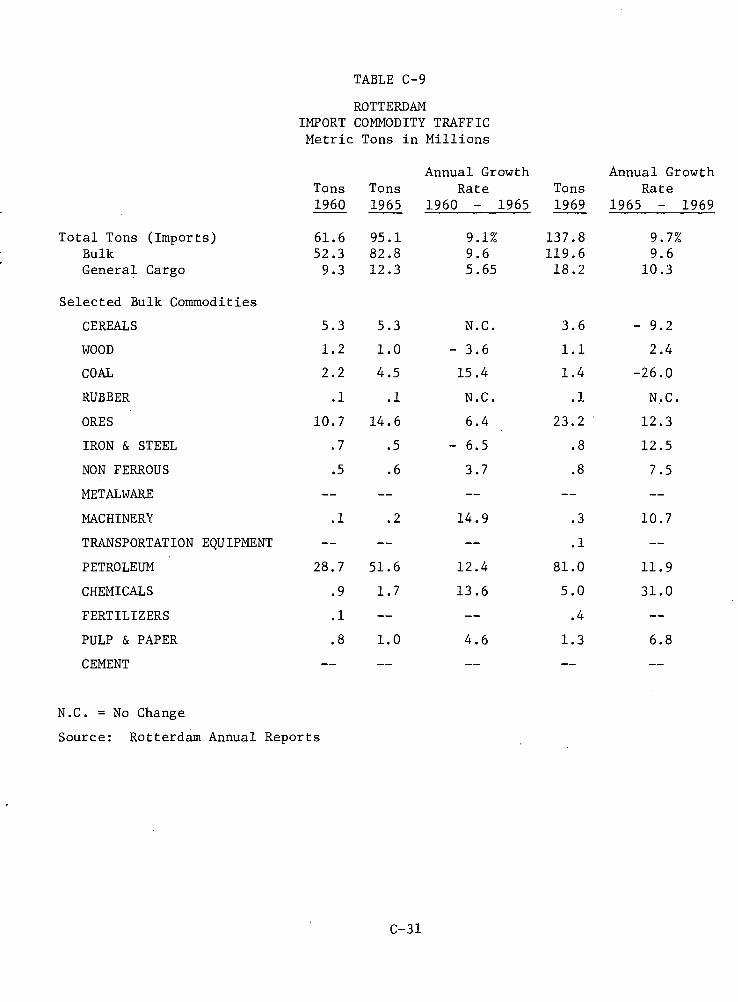
TABLE C-9
ROTTERDAM IMPORT COMMODITY TRAFFIC Metric Tons in Millions
Annual Growth Annual Growth Tons Tons Rate Tons Rate 1960 1965 1960 - 1965 1969 1965 - 1969
Total Tons (Imports) 61.6 95.1 9.1% 137.8 9.7% Bulk 52.3 82.8 9.6 119.6 9.6 General Cargo 9.3 12.3 5.65 18.2 10.3
Selected Bulk Commodities
CEREALS 5.3 5.3 N.C. 3.6 - 9.2
WOOD 1.2 1.0 - 3.6 1.1 2.4
COAL 2.2 4.5 15.4 1.4 -26.0
RUBBER .1 .1 N.C. .1 N.C.
ORES 10.7 14.6 6.4 23.2 12.3
IRON & STEEL .7 .5 - 6.5 .8 12.5
NON FERROUS .5 .6 3.7 .8 7.5
METALWARE -- -- -- -- --
MACHINERY .1 .2 14.9 .3 10.7
TRANSPORTATION EQUIPMENT -- -- -- .1 --
PETROLEUM 28.7 51.6 12.4 81.0 11.9
CHEMICALS .9 1.7 13.6 5.0 31.0
FERTILIZERS .1 -- -- .4 --
PULP & PAPER .8 1.0 4.6 1.3 6.8
CEMENT -- -- -- --
N.C. = No Change
Source: Rotterdam Annual Reports
C-31
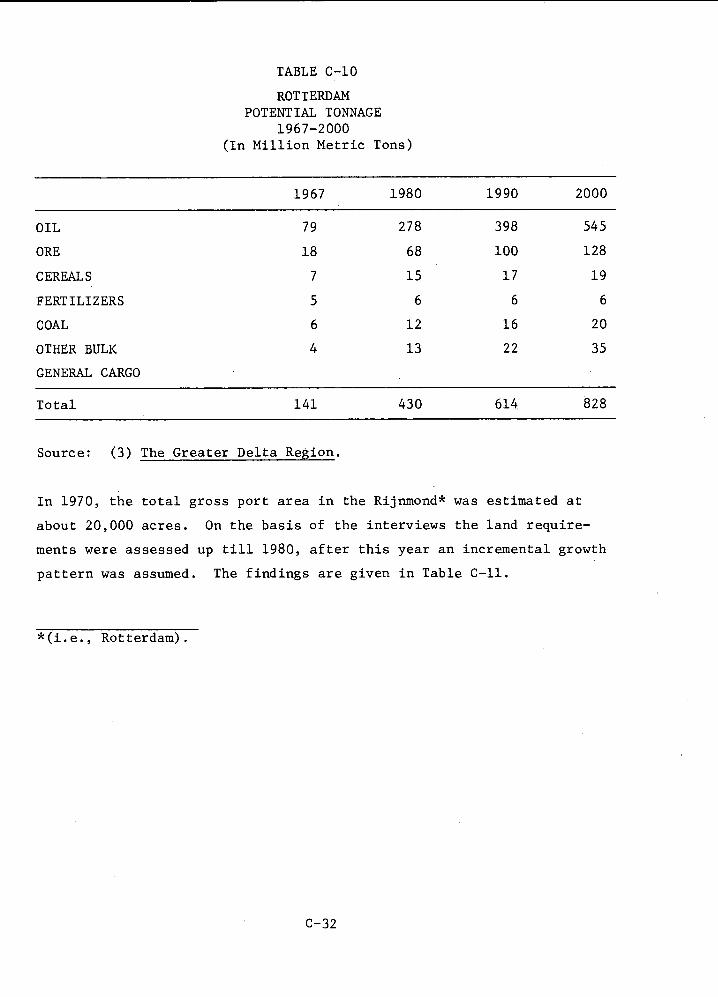
141 430 614 828 Total
TABLE C-10
ROTTERDAM POTENTIAL TONNAGE
1967-2000 (In Million Metric Tons)
1967 1980 1990 2000
OIL 79 278 398 545
ORE 18 68 100 128
CEREALS 7 15 17 19
FERTILIZERS 5 6 6 6
COAL 6 12 16 20
OTHER BULK 4 13 22 35
GENERAL CARGO
Source: (3) The Greater Delta Region.
In 1970, the total gross port area in the Rijnmond* was estimated at
about 20,000 acres. On the basis of the interviews the land require-
ments were assessed up till 1980, after this year an incremental growth
pattern was assumed. The findings are given in Table C-11.
*(i.e., Rotterdam).
C-32
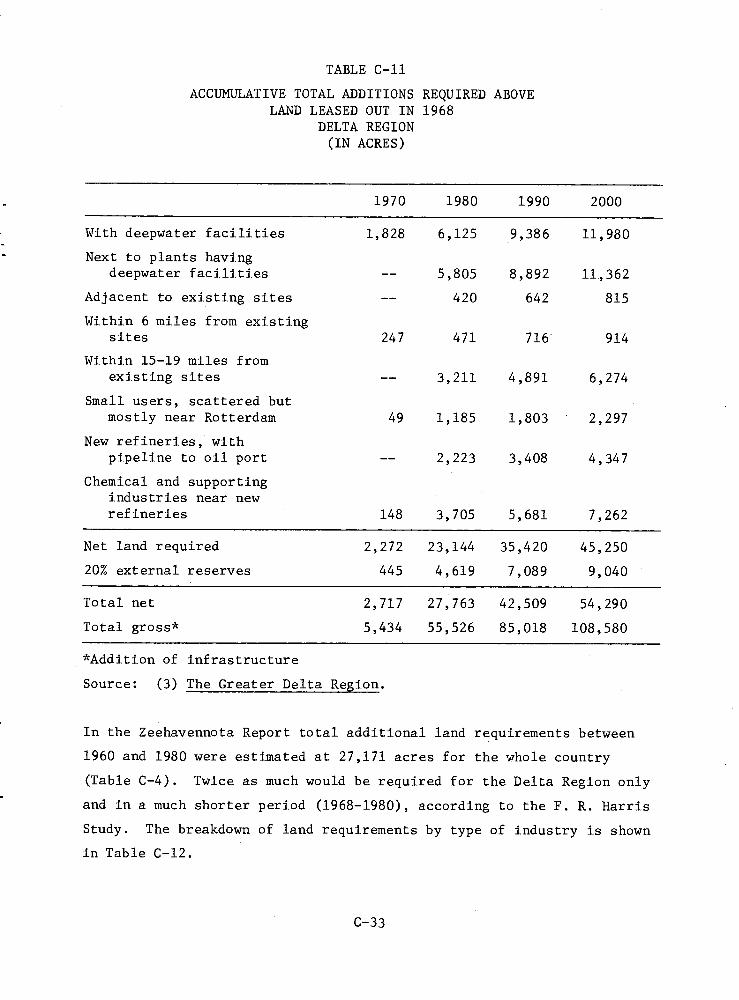
TABLE C-11
ACCUMULATIVE TOTAL ADDITIONS REQUIRED ABOVE LAND LEASED OUT IN 1968
DELTA REGION (IN ACRES)
1970 1980 1990 2000
With deepwater facilities 1,828 6,125 9,386 11,980
Next to plants having deepwater facilities 5,805 8,892 11,362
Adjacent to existing sites 420 642 815
Within 6 miles from existing sites 247 471 716 914
Within 15-19 miles from existing sites 3,211 4,891 6,274
Small users, scattered but mostly near Rotterdam 49 1,185 1,803 2,297
New refineries, with pipeline to oil port 2,223 3,408 4,347
Chemical and supporting industries near new refineries 148 3,705 5,681 7,262
Net land required 2,272 23,144 35,420 45,250
20% external reserves 445 4,619 7,089 9,040
Total net 2,717 27,763 42,509 54,290
Total gross* 5,434 55,526 85,018 108,580
*Addition of infrastructure
Source: (3) The Greater Delta Region.
In the Zeehavennota Report total additional land requirements between
1960 and 1980 were estimated at 27,171 acres for the whole country
(Table C-4). Twice as much would be required for the Delta Region only
and in a much shorter period (1968-1980), according to the F. R. Harris
Study. The breakdown of land requirements by type of industry is shown
in Table C-12.
C-33
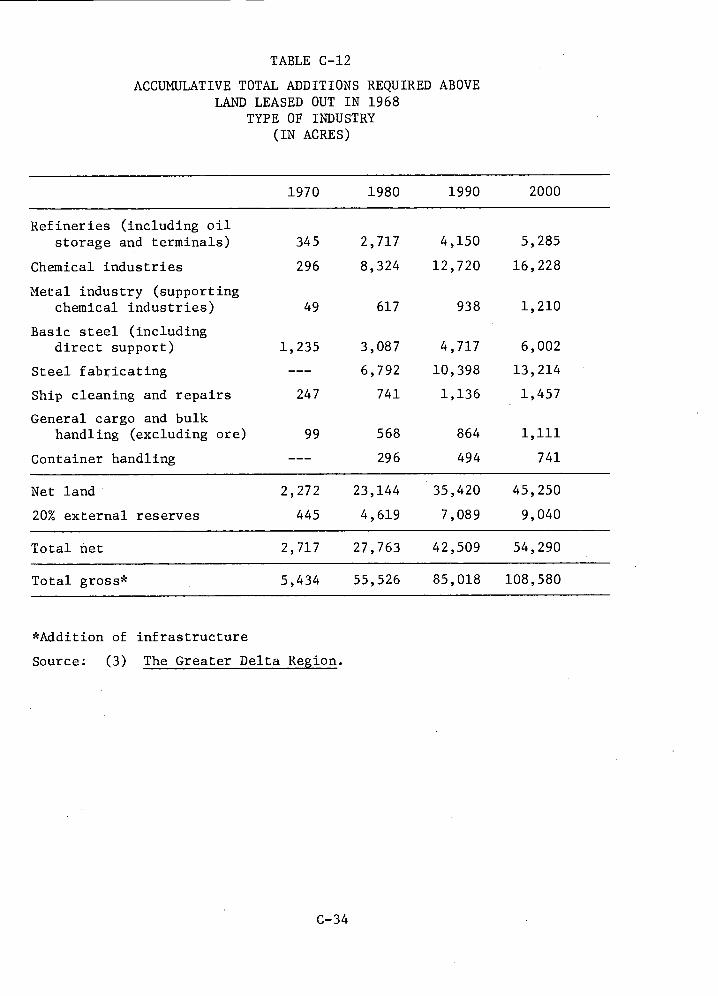
TABLE C-12
ACCUMULATIVE TOTAL ADDITIONS REQUIRED ABOVE LAND LEASED OUT IN 1968
TYPE OF INDUSTRY (IN ACRES)
1970 1980 1990 2000
Refineries (including oil storage and terminals) 345 2,717 4,150 5,285
Chemical industries 296 8,324 12,720 16,228
Metal industry (supporting chemical industries) 49 617 938 1,210
Basic steel (including direct support) 1,235 3,087 4,717 6,002
Steel fabricating --- 6,792 10,398 13,214
Ship cleaning and repairs 247 741 1,136 1,457
General cargo and bulk handling (excluding ore) 99 568 864 1,111
Container handling --- 296 494 741
Net land 2,272 23,144 35,420 45,250
20% external reserves 445 4,619 7,089 9,040
Total net 2,717 27,763 42,509 54,290
Total gross* 5,434 55,526 85,018 108,580
*Addition of infrastructure
Source: (3) The Greater Delta Region.
C-34
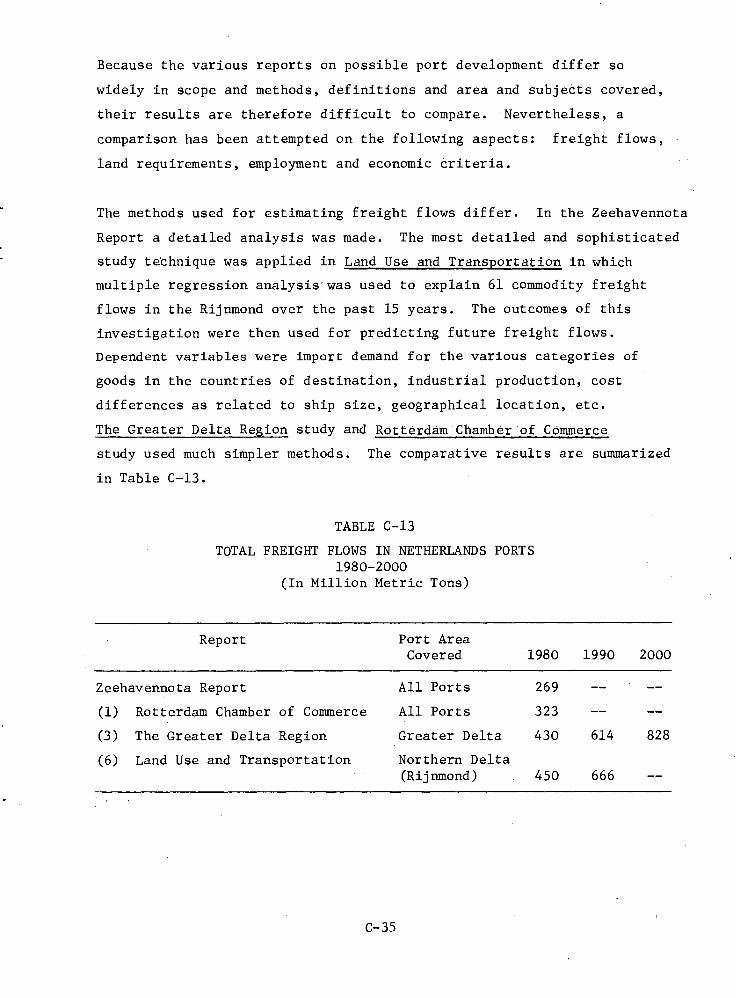
Because the various reports on possible port development differ so
widely in scope and methods, definitions and area and subjects covered,
their results are therefore difficult to compare. Nevertheless, a
comparison has been attempted on the following aspects: freight flows,
land requirements, employment and economic criteria.
The methods used for estimating freight flows differ. In the Zeehavennota
Report a detailed analysis was made. The most detailed and sophisticated
study technique was applied in Land Use and Transportation in which
multiple regression analysis was used to explain 61 commodity freight
flows in the Rijnmond over the past 15 years. The outcomes of this
investigation were then used for predicting future freight flows.
Dependent variables were import demand for the various categories of
goods in the countries of destination, industrial production, cost
differences as related to ship size, geographical location, etc.
The Greater Delta Region study and Rotterdam Chamber of Commerce
study used much simpler methods. The comparative results are summarized
in Table C-13.
TABLE C-13
TOTAL FREIGHT FLOWS IN NETHERLANDS PORTS 1980-2000
(In Million Metric Tons)
Report Port Area Covered 1980 1990 2000
Zeehavennota Report
(1) Rotterdam Chamber of Commerce
(3) The Greater Delta Region
(6) Land Use and Transportation
269 -- --
323 -- --
430 614 828
Northern Delta (Rijnmond) 450 666
All Ports
All Ports
Greater Delta
C-35
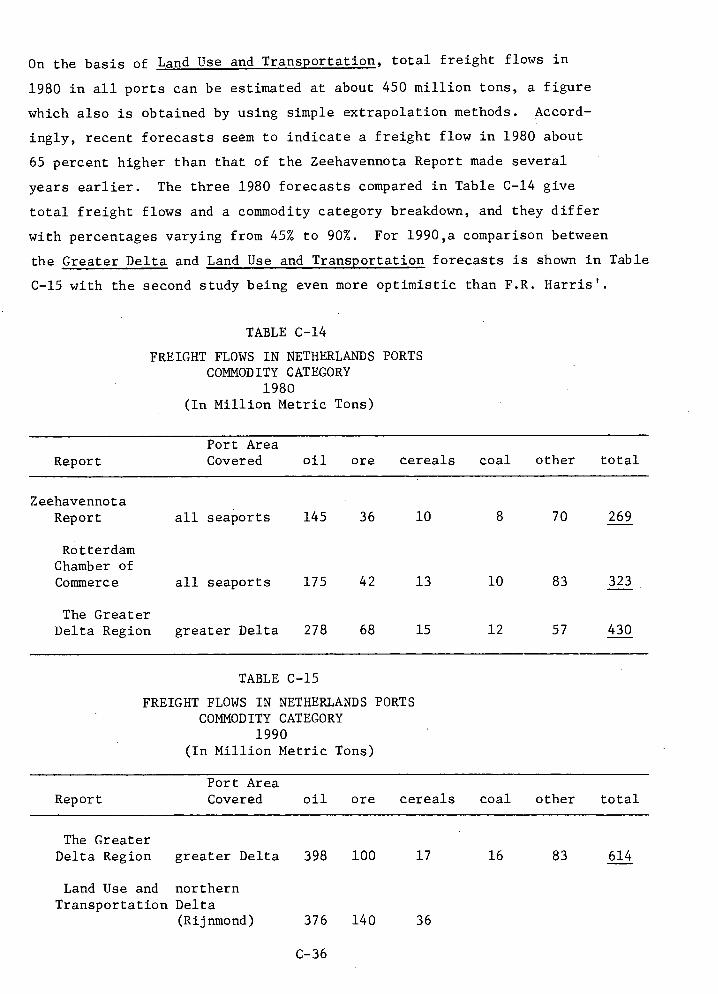
On the basis of Land Use and Transportation, total freight flows in
1980 in all ports can be estimated at about 450 million tons, a figure
which also is obtained by using simple extrapolation methods. Accord-
ingly, recent forecasts seem to indicate a freight flow in 1980 about
65 percent higher than that of the Zeehavennota Report made several
years earlier. The three 1980 forecasts compared in Table C-14 give
total freight flows and a commodity category breakdown, and they differ
with percentages varying from 45% to 90%. For 1990,a comparison between
the Greater Delta and Land Use and Transportation forecasts is shown in Table
C-15 with the second study being even more optimistic than F.R. Harris'.
TABLE C-14
FREIGHT FLOWS IN NETHERLANDS PORTS COMMODITY CATEGORY
1980 (In Million Metric Tons)
Report Port Area Covered oil ore cereals coal other total
Zeehavennota Report all seaports 145 36 10 8 70 269
Rotterdam Chamber of Commerce all seaports 175 42 13 10 83 323
The Greater Delta Region •greater Delta 278 68 15 12 57 430
TABLE C-15
FREIGHT FLOWS IN NETHERLANDS PORTS COMMODITY CATEGORY
1990 (In Million Metric Tons)
Report Port Area Covered oil ore cereals coal other total
The Greater Delta Region greater Delta 398 100 17 16 83 614
Land Use and northern Transportation Delta
(Rijnmond) 376 140 36
C-36
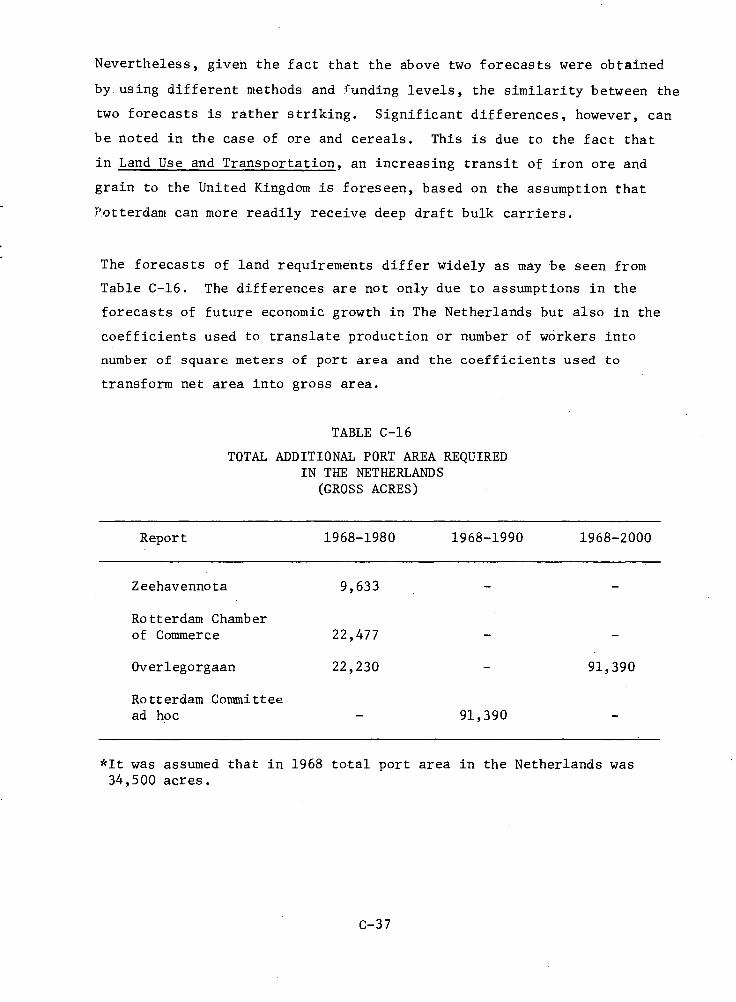
91,390
Nevertheless, given the fact that the above two forecasts were obtained
by using different methods and runding levels, the similarity between the
two forecasts is rather striking. Significant differences, however, can
be noted in the case of ore and cereals. This is due to the fact that
in Land Use and Transportation, an increasing transit of iron ore and
grain to the United Kingdom is foreseen, based on the assumption that
Potterdam can more readily receive deep draft bulk carriers.
The forecasts of land requirements differ widely as may be seen from
Table C-16. The differences are not only due to assumptions in the
forecasts of future economic growth in The Netherlands but also in the
coefficients used to translate production or number of workers into
number of square meters of port area and the coefficients used to
transform net area into gross area.
TABLE C-16
TOTAL ADDITIONAL PORT AREA REQUIRED IN THE NETHERLANDS
• (GROSS ACRES)
Report 1968-1980 1968-1990 1968-2000
Zeehavennota 9,633
Rotterdam Chamber of Commerce 22,477
Overlegorgaan 22,230
Rotterdam Committee ad hoc 91,390
*It was assumed that in 1968 total port area in the Netherlands was 34,500 acres.
C--37
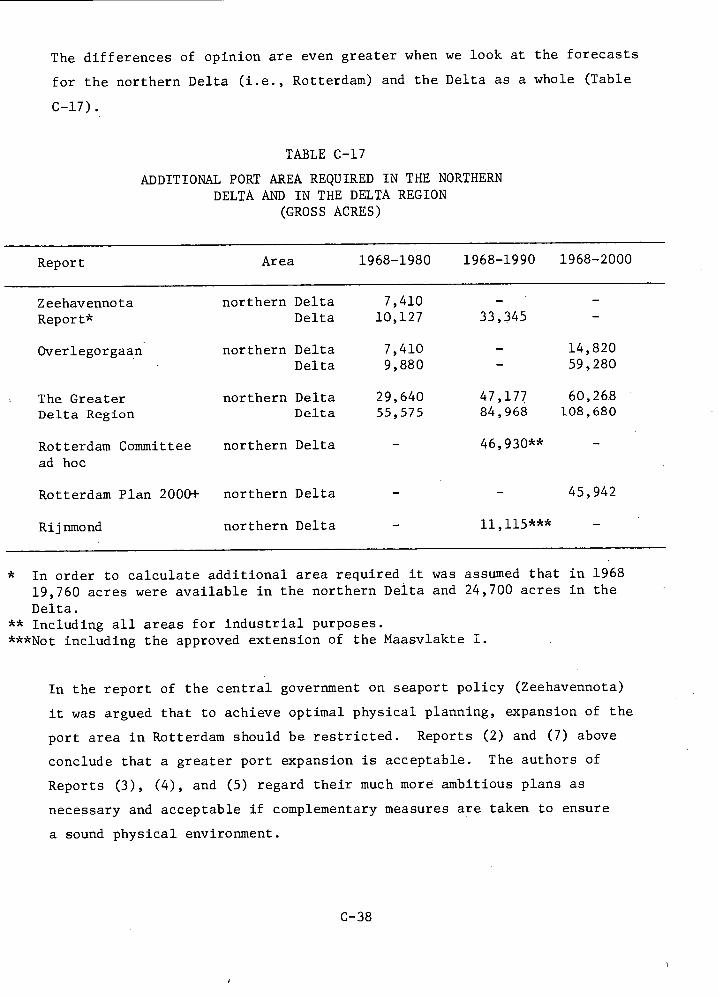
Area 1968-1980 1968-1990 1968-2000 Report
Zeehavennota Report*
northern Delta 7,410
Delta 10,127 33,345
47,177 84,968
46,930**
The differences of opinion are even greater when we look at the forecasts
for the northern Delta (i.e., Rotterdam) and the Delta as a whole (Table
C-17).
TABLE C-17
ADDITIONAL PORT AREA REQUIRED IN THE NORTHERN DELTA AND IN THE DELTA REGION
(GROSS ACRES)
Overlegorgaan
The Greater Delta Region
Rotterdam Committee ad hoc
Rotterdam Plan 2000+
Rijnmond
northern Delta 7,410
Delta 9,880
northern Delta 29,640
Delta 55,575
northern Delta
northern Delta
northern Delta 11,115***
14,820 59,280
60,26.8 108,680
45,942
* In order to calculate additional area required it was assumed that in 1968 19,760 acres were available in the northern Delta and 24,700 acres in the Delta.
** Including all areas for industrial purposes. ***Not including the approved extension of the Maasvlakte I.
In the report of the central government on seaport policy (Zeehavennota)
it was argued that to achieve optimal physical planning, expansion of the
port area in Rotterdam should be restricted. Reports (2) and (7) above
conclude that a greater port expansion is acceptable. The authors of
Reports (3), (4), and (5) regard their much more ambitious plans as
necessary and acceptable if complementary measures are taken to ensure
a sound physical environment.
C--38
g. Employment
In all the reports except Rotterdam Chamber of Commerce. attention
is given to employment. In Rotterdam Committee ad hoc, employment
is the main concern, and from an employment forecast the required seaport
area is derived. The common line of reasoning is, however, just opposite.
For example, in The Greater Delta Region use is made of key figures of square
meters per worker to transform required additional port area into additional
employment.
Other key figures--besides square meters per worker--are the indirect
employment multiplier (additional employment induced in secondary
industries, construction and services) as a consequence of additional
employment in basic industries (such as oil refineries, petrochemical,
steel fabrication) and the labor force participation rate (percentage of
total population employed). The various reports differ, of course, in
their views about the correct size of the various key figures. The
greatest differences of opinion exist about the indirect employment
multiplier.
In (3) The Greater Delta Region, an employment multiplier of 2 is used
on the assumption that every worker in port-based industries creates one
job in the service sector, and it is assumed that there is one employed
worker out of every four persons in the total population. The follow-
ing results are then obtained (Table C-18).
C-39
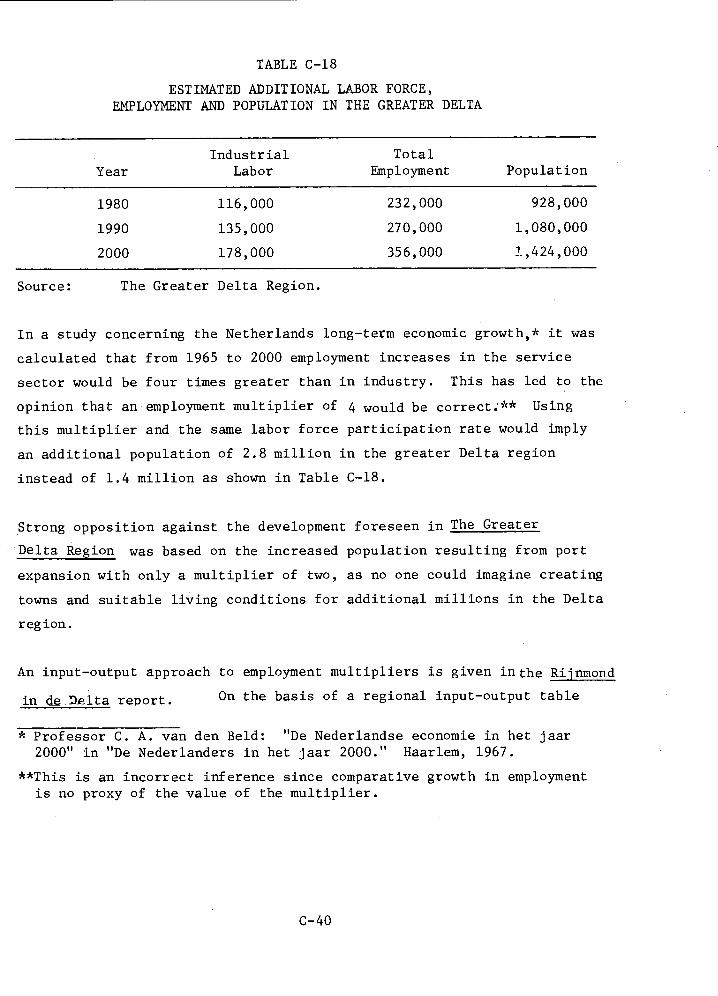
Industrial Total Labor Employment Population Year
TABLE C-18
ESTIMATED ADDITIONAL LABOR FORCE, EMPLOYMENT AND POPULATION IN THE GREATER DELTA
1980 116,000 232,000 928,000
1990 135,000 270,000 1,080,000
2000 178,000 356,000 1,424,000
Source: The Greater Delta Region.
In a study concerning the Netherlands long-term economic growth,* it was
calculated that from 1965 to 2000 employment increases in the service
sector would be four times greater than in industry. This has led to the
opinion that an employment multiplier of 4 would be correct:** Using
this multiplier and the same labor force participation rate would imply
an additional population of 2.8 million in the greater Delta region
instead of 1.4 million as shown in Table C-18.
Strong opposition against the development foreseen in The Greater
Delta Region was based on the increased population resulting from port
expansion with only a multiplier of two, as no one could imagine creating
towns and suitable living conditions for additional millions in the Delta
region.
An input-output approach to employment multipliers is given in the Riinmond
in de Dklta report. On the basis of a regional input-output table
* Professor C. A. van den Beld: "De Nederlandse economie in het jaar 2000" in "De Nederlanders in het jaar 2000." Haarlem, 1967.
**This is an incorrect inference since comparative growth in employment is no proxy of the value of the multiplier.
C-40
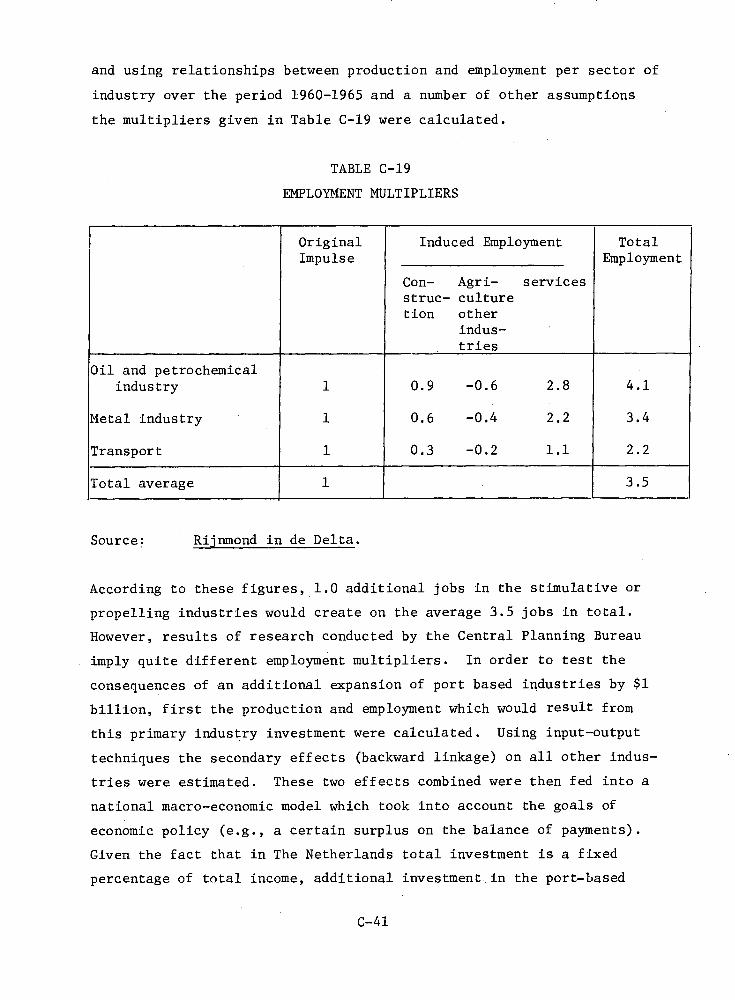
and using relationships between production and employment per sector of
industry over the period 1960-1965 and a number of other assumptions
the multipliers given in Table C-19 were calculated.
TABLE C-19
EMPLOYMENT MULTIPLIERS
Original Induced Employment Total Impulse Employment
Con- Agri- services struc- culture
tion other indus- tries
Oil and petrochemical industry 1 0.9 -0.6 2.8 4.1
Metal industry 1 0.6 -0.4 2.2 3.4
Transport 1 0.3 -0.2 1.1 2.2
Total average 1 3.5
Source: Rijnmond in de Delta.
According to these figures, 1.0 additional jobs in the stimulative or
propelling industries would create on the average 3.5 jobs in total.
However, results of research conducted by the Central Planning Bureau
imply quite different employment multipliers. In order to test the
consequences of an additional expansion of port based industries by $1
billion, first the production and employment which would result from
this primary industry investment were calculated. Using input-output
techniques the secondary effects (backward linkage) on all other indus-
tries were estimated. These two effects combined were then fed into a
national macro-economic model which took into account the goals of
economic policy (e.g., a certain surplus on the balance of payments).
Given the fact that in The Netherlands total investment is a fixed
percentage of total income, additional investment in the port-based
C-41
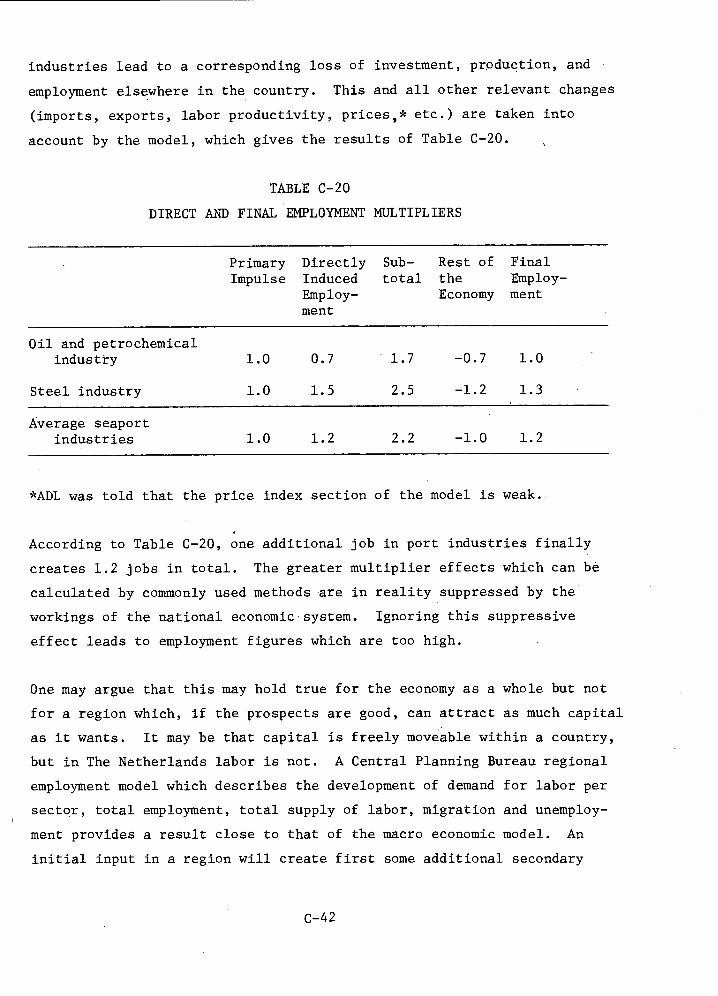
Average seaport industries 1.0 1.2 2.2 -1.0 1.2
1.3
Oil and petrochemical industry 1.0 0.7 1.7 -0.7 1.0
2.5 -1.2 1.0 1.5 Steel industry
industries lead to a corresponding loss of investment, production, and
employment elsewhere in the country. This and all other relevant changes
(imports, exports, labor productivity, prices,* etc.) are taken into
account by the model, which gives the results of Table C-20.
TABLE C-20
DIRECT AND FINAL EMPLOYMENT MULTIPLIERS
Primary Directly Sub- Rest of Final Impulse Induced total the Employ-
Employ- Economy ment ment
*ADL was told that the price index section of the model is weak.
According to Table C-20, one additional job in port industries finally
creates 1.2 jobs in total. The greater multiplier effects which can be
calculated by commonly used methods are in reality suppressed by the
workings of the national economic system. Ignoring this suppressive
effect leads to employment figures which are too high.
One may argue that this may hold true for the economy as a whole but not
for a region which, if the prospects are good, can attract as much capital
as it wants. It may be that capital is freely moveable within a country,
but in The Netherlands labor is not. A Central Planning Bureau regional
employment model which describes the development of demand for labor per
, sector, total employment, total supply of labor, migration and unemploy-
ment provides a result close to that of the macro economic model. An
initial input in a region will create first some additional secondary
C-42
employment but the final result is that total employment will increase
only a little more than the original input, but with a different distribu-
tion over the various sectors of the economy. The reason for this low
multiplier is again the suppressive effect--now caused by the labor
market. The employment created by the original input will be deducted
for the greater part from other industries as the labor supply is
restricted and labor mobility is low.
The low employment multiplier agrees with experience. The enormous
increase of port activities in Rotterdam has gone together with an
increase in total labor force in this region even lower than could be
calculated on the basis of demographic trends, because of the loss by
emigration.
Excluding the problem of environmental degradation, it may be that even
the most ambitious plans of The Greater Delta Region and Rotterdam
Plan 2000+ reports are acceptable regarding employment and population.
h. Economic Justification
After reviewing the various reports one immediately reaches the rather
astonishing conclusion that none of them contains an economic justifica-
tion of the proposed plans. In the Zeehavennota Report some figures
are given on value added in port activities and sea transport; the
importance of sea activities for other sectors of the economy is
mentioned, employment figures are given, etc. It concludes the economic
section of the report by saying: "As seaports constitute an integral
part of the economy it is impossible to imagine a Dutch economy without
seaports. This is also the very reason why it is impossible to make a
national economic cost-benefit analysis of seaports."
An incorrect economic justification is found in The.Greater Delta
Region, where total sales of port industries are regarded as a correct
measure of the contribution of port industries to gross national product
in The Netherlands (p.127).
C-43
Rather confusing are sections of Riinmond in de Delta. In this
report it is calculated that profits on investments in the Rijnmond
area (with its heavy concentration on port industries and activities) is
the same as elsewhere in The Netherlands (which has little port industry).
Nevertheless, the report favors further expansion of the port area in
the Rijnmond, notwithstanding the fact that it recognizes possible
disadvantages of this development on favorable living conditions,
congestion, etc.
i. The Growing Consensus on Port Industrial Development and Land Use
It is becoming widely recognized that to avoid over-industrialization of
the Greater Delta Region, it is necessary to be selective with respect
to types of industries that should be admitted. The greatest limitation
should be on industries in the areas nearest the port, which should be
restricted to:
1) Primary process industries which definitely need
deepwater port facilities because of raw materials
being received in deep -draft ships;
2) Secondary process and manufacturing industries which
for economic, process, or manufacturing reasons need
to be close to the primary industries;
3) Secondary process and manufacturing industries which
are under the same corporate roof as a primary
producer and purely for economic reasons (no process
or manufacturing requirements) want to centalize
operations.
The tertiary, consumer-oriented manufacturing industries (mostly
relatively labor intensive) do not normally require deepwater facilities
or proximity to primary industries. As a matter of fact, their prefer-
ence is usually for location near the consumer areas which saves
relatively high transportation costs of valuable finished goods. The
location of these tertiary industries away from port areas also fits
with the industrial dispersal plans of The Netherlands.
C-44
i. Communication to Hinterland
1) Highways--a network of roads, bridges, and tunnels is in the
planning stage as there is serious industrial and commuter traffic con-
gestion in Rotterdam, which is expected to increase as expansion of
industrial facilities requires additional employees and heavier indus-
trial traffic for support.
The early establishment of any relatively labor-intensive industry on
Maasvlakte I will prove disastrous to the traffic situation if this
planned system of roadways is not simultaneously supplemented with a
system of mass transit to existing and new population centers along
with a modern primary and secondary network of roadways to service these
centers.
New roadways must also be constructed to connect the hinterland of the
Netherlands and northwest Europe with the Greater Delta Region. The
need already exists,and the advent of containerization will greatly add
to the urgency. Failure to create such improvements may in fact become
a serious deterrent to development for the Port of Rotterdam.
With the forecast industrialization of the Greater Delta Region, comments
similar to those above apply for the entire region. A road and highway
network well beyond that currently envisaged should be developed to
avoid strangulation of the expected industrial potential.
2) Railroads--the existing port is served by a double track line,
now terminating in Europort. It is intended to extend this line to
Maasvlakte I now that the land development is completed. This rail line
has adequate capacity to serve all current port users and the intended
occupants of Maasvlakte I, (even when all industrial sites are filled).
It is believed that, if and when Maasvlakte II,or even Maasvlakte III,
is created and industrially developed, an extension of the double track
line should still be sufficient to provide adequate capacity for the
expected goods traffic.
C-45
3) Inland Waterways--as shown in Table C-10 above, the cargo tonnage
to be handled by the port is rapidly increasing. The associated barge
traffic using the inland waterways connecting with the port is also
expected to increase, but at a much slower rate than the increase in
port tonnage. There are several reasons for this:
• much of the oil and oil products shipped inland from
the port is being diverted to the more economical
pipelines;
• relatively larger portions of the bulk raw materials
which formerly (and currently) were shipped to the
hinterland for processing will remain in the greater
port region*;
• general cargo is increasingly being containerized.
Movement of containers away from the port by barges
would defeat the purposes of the entire containeriza-
tion system of rapid point-to-point goods transfer.
Slowly increasing tonnage that is expected to be handled by barge, coupled
with improvement in barge traffic practices (particularly the increas-
ing conversion to push boat technology), leads to the belief that the
inland waterways system with its barge traffic is expected to be adequate
for the needs of the port in the foreseeable future.
Port officials already claim that the barge canal is too far away from
the ocean loading-unloading areas and that a material handling problem
has resulted. A new canal would create traffic problems warranting
extensive bridging to control.
*These will be used in the new industries which are expected to be established as well as in industries that are relocating from the hinterland to the coastal areas. The products of these coastal industries lend themselves more to containerized movements by rail and truck than by barge.
C-46
4) Pipelines--Table C-10 indicated that the port is forecast to
handle 278 million tons of oil and oil products in the year 1980, and
it was also indicated that refining capacity was expected to be 140
million tons in 1980. Twenty percent of this capacity, or 28 million tons,
is expected to be consumed for internal refinery use and chemical raw
materials production, leaving 250 million tons to be handled in and out
of the port. Of the 250 million, 69 million tons were forecast to be
re-exported by sea, leaving 181 million tons to be shipped to the hinter-
land. Current pipelining capacity out of the port is 80 million tons
per year (Rhein-Ruhr pipeline, 40 million tons crude, 20 million tons
product; and Rotterdam-Amsterdam pipeline 20 million tons crude per year).
Within the next few years the Rotterdam-Antwerp pipeline is expected to
be completed, adding a capacity of 30 million tons per year for a total
of 110 million tons per year pipeline capacity out of the port.
However, in the year 1980, a need will develop to construct a liquid
transportation system for an additional 61 million tons. Although some
of this may be shipped by barge, rail, and truck, plans are needed for two
additional crude lines and one additional product line leaving the port.
Furthermore, some of the new refineries, by the oil industries' own fore-
casts, are expected to be located in the southern point of the Greater
Delta Region (i.e., Vlissingen). This would require a crude line from
Rotterdam, passing south through the delta region.
After 1980, the forecast oil tonnage to be handled by the port continues
to increase. Examining the figures in Table C-10 and assuming that the
Greater Delta Region port will maintain its relative refining and re-
export-by-sea position, it can be seen that by 1990 another two pipe-
lines would be needed, and by 2000 two additional pipelines would be
required. No attempt has been made to forecast the ratio between crude
and product-lines of these new lines. The ratio would depend upon the
oil companies' refining policies at those periods of time. The lines
C-47
can always be alternated from one service to the other within a short
period of time. The important fact is the realization that about seven
additional pipelines are required to service the Greater Delta Region's
infrastructure over the next 30 years, adding one approximately every
four years.
k. Economic Studies
There are two kinds of basic studies performed today in the Netherlands
which relate to Rotterdam port industrialization:
• Macro-Economic Studies performed by the Central
Planning Bureau, the Hague; and
• Micro-Economic Studies performed by Rotterdam
organizations.
The first series of studies aim at helping the government to formulate
a national seaport policy, where the second series of studies, financed
by various Rotterdam organizations and authorities, are used either for
local planning, to secure additional support from the government, or combat
certain government proposals.
The Economics Section of the Central Planning Bureau is working on the
construction of a model which evaluates industrial investment alterna-
tives in order to arrive at that balanced mix which will most significantly
increase the national income while operating under a number of constraints
(i.e., savings rate, labor availability, etc.).
The birth of this model was based on a governmental question: Is it
desirable to increase port industrialization?" The economists have
tried to answer this question from the economic point of view (which will
be only one input in determining what is desirable from a total national
viewpoint). From their work they believe that the cost/benefit approach
is not the right tool. Cost/benefit is too narrow. What is required is
an input/output model of the entire port operation tied to a national
macro-economic model.
C-48
To determine which industry grouping ("port industries" or "all other
industries") was the most important to the national economy, from a
value-added standpoint, they divided the model data base into two
sectors. Sector "E" was classified as "port industries." To be in-
cluded in Sector "E" an industry was required not only to be historically
port-based, but also to have a high projected growth rate to 1980. Any
port-based industry which was projected to have a zero or negative growth
rate was dropped from the "E" classification. The remainder of the
industrial sectors were lumped into the "all other" category. At this
stage, certain investments were fed into the "E" sector and then re-
peated for the "all other industries" sector. The resulting impact was
measured for value-added increases. The findings indicate that national
income will grow more if investment priority is placed on high growth
port industries rather than in the "all other industries" sector. They
found only four industries which are stimulative in their own right;
all other industries follow. These four stimulative industries are:
• Metals (particularly iron and steel);
• Oil refining;
• Chemicals (including petrochemicals);
• Shipbuilding (this industry is marginal in its
stimulative effects on other industrial sectors).
Transportation (port function included) was not found to be stimulative,
but grows under the demand effect of other industries. Unfortunately,
only two sectors (the "E" sector and the "all other") have been evaluated.
To run other comparisons one would have to sub-divide the "all other"
into smaller groups (i.e., electronics) and run the model on a case-by-
case basis.
The model has forecast the Rotterdam value-added profile in 1980 for the
four stimulative industries as follows:
1) 20%- Metals
2) 40% - Chemicals
3) 35% - Oil
4) 5% - Shipbuilding
C-49
After investment levels have been fed into the model, the information
output is:
1) National Income (distribution of income)
2) Labor Employment
3) Surplus amount in balance of payments
4) Price stability (this area of the model is very
weak)
Officials now state that national income improvement is not really the
best measure for investment allocation; rather one should optimize
labor needed, capital needed, regional development needs, and environ-
mental costs.
The Central Planning Bureau is also working on a regional model (Inter-
Regional Economic Impact Model) which breaks down the Netherlands into
forty regions. The purpose of the model will be to measure investment
projects within the Netherlands and measure the resulting labor require-
ments, commodity flows, investment flows, etc., to the various regions.
They are about one-third completed and we were informed that the model
would be finished in 1971.
Regional data has been a major problem. For many important statistical
indices which are taken for granted in the United States, bureau planners
are being forced to make educated guesses. They have been success-
ful in obtaining regional labor statistics for the years 1950-1966.
They have also developed investment by region and by major industrial
sectors for the years 1955-1969, although the impression was that there
were shortcomings in this area.
Every year the national Input/Output Model is updated and plans are to
update the Regional Input/Output Model (when it is completed) every
five years for 40 regions covered.
Although still far from completed and in the theoretical stage in many
aspects, this Model will be valuable aid to the Central Government in its
C-50
economic planning activities.
One of the purposes of this Model will be to evaluate the heavy concen-
tration of population and production in the Rijnmond area and to analyze
various alternatives and techniques to spread the population and indus-
trial growth throughout the country.
C-51
C.1.5 Engineering
a. Configuration
The newly dredged 65-foot-deep channel now provides direct access from
the North Sea into the old and new port areas. The industrial land and
dock area is bounded to the south by an existing barge canal and to the
west and north by the new "Caland" and "Beer" Canals. Finger piers are
provided at four hydrocarbon transfer facilities. The inner,or old,
harbor has numerous general cargo piers on both banks of the river with
the main piers located on the south or left banks of the river. The
total quayage now available in the port has increased to 107,900 feet
and the port water area encompasses 4,955 acres. The directional move
to the west for deeper water was also determined by geographical
necessity as lack of land and industrial space warranted the reclamation
of submerged North Sea land.
b. Channel and 13osin
The new outer approach channel is 18 miles long and 4,000 feet wide.
The new inner entrance canal has a length of 9 miles and its width
decreases slowly from 2,000 to 1,300 feet. It takes about three hours
to sail from the channel entrance to the Europort entrance. The bottom
of the outer canal is sand waved (duned) while the bottom of the inner
channel stays flat. Water depth measu;ements in Holland are measured
at "mean-level"--this being the water level at a midpoint between high
and low water. The tidal range at the Hook of Holland has a mean
variation of 5.3 feet increasing to 5.7 feet with spring tides, with
cross-channel currents of 2.5 knots at high water. From the entrance
at the Hook of Holland there is a tidal range decrease into the old port.
The tidal variation in Rotterdam itself ranges from a mean of 5.0 feet
to 5.3 feet during spring tides. Large tankers normally enter at high
water which gives almost three feet above mean water level so that
250,000 dwt tankers might be accommodated. A minimum bottom-to-keel
clearance of 15% of the ship's draught is mandatory.
C-52
A publication, "PIAC 1969 Report", details soil and submerged wreck
conditions encountered while dredging the channel. At no time did the
dredges hit bedrock. Cutterhead dredges were used to cut through the
clay (a 3 to 6 foot thick layer at -67 feet) and peat bottom in the
inner channel, and trailing suction hopper dredges completed the dredging
operation, never encountering bedrock.
As an experimental procedure, pits (catch-basins) were dug at specifically
selected locations in the channel. The sites were selected from past
experience at known sediment accumulation areas. It is anticipated that
the pits will aid in collecting and entrapping sediments to reduce channel
maintenance costs. A maximum of 20 dredges work on contracts to maintain
the channels into Rotterdam. The dredges range from hoppers to endless
bucket dredges, with some suction and floating pontoon systems. Clamshell
dredges are used in front of the jetties and quaywalls to permit a "close
in" dredging operation, i.e., within 15 to 30 feet, from the seawall.
Submerged wrecks were physically removed to clear the site of the outer
channel whereas, in the inner channels, areas were excavated near the
wrecks in a mannner that permitted the wrecks to slide into the excavation.
The behavior of channel bottom turbulence was tested in the Netherlands
ship model basin (116'x216") under a program called "Bottom Wash". The
study revealed that, under beam winds of up to 6 to 8 Beaufort scale,
(11.6 foot waves), the bow section of mammoth tankers requires a greater
water depth. The wave size, period and direction becomes critical to
safe entry. Long waves from the north are extremely critical and tankers,
working in close coordination with the meteorological station which can
provide a three-to-four-day advance warning, may have to anchor outside.
A three-ship capacity emergency anchorage is also provided in the inner
harbor. A total of 200 mammoth tankers were accommodated by Rotterdam
in 1970, and an increase to 300 is anticipated for 1971.
C-53
The navigational aids were increased to ensure optimal safety in
navigation for the deep-draft vessels entering the port, as the
approach into Rotterdam extended outside the visibility range of light-
houses and other landmarks. A combination of conventional and electronic
navigational aids is now provided for safe entry. For the approach to
Europort, the Decca Navigator chain 5B/MP (British chain) is used. The
southern side of the Euro channel is marked by conventional light buoys
equipped with radar reflectors, spaced every two nautical miles
approximately, and a Decca Navigator chain 2E can be used in the entire
Euro channel under all visibility conditions. For periods of reduced
or bad visibility, a system of seven shore-based radar stations has
been operational for several years. The navigational system has also
been of considerable assistance to the dredges in the channel. It has
provided a pin-point aid for positioning the stone needed for construction
of the entrance breakwaters. The 2E Decca chain is a temporary installa-
tion, using one master and two slave stations, with three patterns. By
1975 a new system will be extended further to sea, probably using an
artificial island. The radar system will also be extended.
For direct entry into the port, two white lighted towers provide a
centerline range into the breakwater area. Entrance into Europort is
then guided by two green lighted towers, and entrance into the old port
is guided by a similar type range with red lights. The entrance harbor
lights (fixed lighted beacons) also provide navigational assistance.
About 200 ship movements per day occur in the inner channel, and deep-
draft ships are currently limited to one-way traffic.
c. Docking
Dutch pilots can be taken aboard off the coast of France near Calais,
or alternatively, they can be flown out to join a ship in American-built
Sikorsky helicopters, which proved to be practical in all weather
conditions and during night hours.
C-54
Once within the lee of the moles in the outer harbor, the major problem
caused by the average 200 ship movements a day is the heavy traffic
in the confined waters of the inner harbor. This is currently aggravated
by a fleet of dredges working on the new Europort approach canal.
Ample tugs are available to aid in the final docking procedure. The
number of tugs depends on the wishes of the ship's master, whose opinion
is largely based on that of the harbor pilot.
Pier fendering consists mainly of vertical wood fenders mostly fabricated
from African tropical wood, locust or similar.
d. Cargo Handling
The available warehouse space within the port is now in the vicinity of
10 million square feet. Cold storage space is available in 4.8 million
cubic feet of warehouse volume. Grain silo capacities are given at
331,600 tons, and 4.8 million tons of dry bulk cargo can be accommodated.
Bulk liquid storage facilities are rated at 20,273,900 tons.
The following equipment comprises the port's major cargo handling equip-
ment:
Loading Bridges 28
Cranes 461
Floating Cranes 33
Floating Elevators 31
Shore-Based Elevators 15
Container Cranes 6
The warehouses and cargo handling equipment originally belonged to the
Port Authority, but were sold to private industry in 1968. As the new
industrial complexes progress in the new Europort area, there will be a
considerable increase in warehouse space and cargo handling equipment.
C-55
e. Problems and Lessons
1) Changed Current Patterns--the extension of the moles or
breakwaters at the harbor entrance changed the pattern of
currents along the short. This had direct effect on sed-
iment transportation to the northwest. The current that
normally transports the sand onto the northern beaches
will eddy around the 3-km-long northern mole or break-
water. This will result in an accumulation of 60 to 80 million
cubic meters of sand on a recreational beach directly
north of the mole at the Hook of Holland, thereby tem-
porarily "starving" beaches more to the northeast.
To expedite this anticipated action and hasten con-
tinued nourishment of the northern beaches, 15 million
cubic meters of sand fill is being pumped, through three
submerged pipelines, onto the recreational beach.
Modification of beach facilities will be required.
2) Sloughing and Sliding--the port has had sloughing and
sliding problems for years, and seawall fractures have
been common. During August 1956, 300 feet of seawall
slid into the adjacent slip. The deepening of the main
channel has increased inner harbor wave action, and in
combination with the suction of the dredges and tidal
seepage forces, has accelerated erosion of the river
bottom. These factors have therefore aggrnvated a
civil engineering problem of long standing. Extensive
sand drains and piling will be necessary, coupled with
more gradual sloping of the basin side, 1:5 or more.
The latter action will make difficult, if not impossible,
the securing of deep draft vessels alongside seawall-
type pier facilities.
3) Saltwater Penetration--the deepening and widening of
• the channel has caused saltwater to migrate further
up the river than it had before, and the salt has begun
to penetrate into the dikes on both sides of the
C-56
river. An experimental attempt to control this problem
involves laying filter gravel of varying grade and thick-
ness onto the bed of the channel--the results will be
carefully monitored. The problem of water quality
degradation due to increased salinity in the upper river
is still acute, and a number of corrective measures to
improve the gathering and protection of fresh water are
under consideration.
4) Ocean-to-Barge Transfer--a material handling problem is
being experienced due to the distance between the ocean
traffic facilities and the hinterland barge transporta-
tion facility. This could be corrected by dredging a
new canal in the center of the industrial complex, but
the canal would have to be bridged extensively to permit
an unrestricted traffic flow.
5) Removal of Submerged Hulks--the method of excavating and
sliding submerged wrecks into the excavation to remove
submerged navigational hazards originated on the Rotterdam
channel project. The method might be used to advantage
during the construction of U.S. channels.
C.1.6 Environmental Impact
a. Environmental Management Efforts
While it is certainly true that the subject of environmental quality is
becoming increasingly important in The Netherlands--the National Planning
Service is adding to its staff to deal with these problems, and proposals
have been made to establish a separate Ministry of Environmental Planning
at the national level--conscious concern over the quality of the environ-
ment has played a relatively small role in the development of both
Rotterdam and Amsterdam as major seaports. Numerous studies have been
made regarding the need for major port capability in The Netherlands and
have related that need to the country's dependence upon maritime trade.
Because of this dependence, environmental problems--particularly those
connected with pollution control--have been likened to a "fifth wheel"
C-57
on the development vehicle. Land use-planning has, in the environmental
sense, received the majority of attention , but even here it appears to
have been predicated on the assumptions that excessive (not defined)
controls would inhibit port growth and place The Netherlands at a
competitive economic disadvantage. This is a viable assumption, for one
can logically argue that if there is not a healthy economy to support
the population of the country, the question of environmental quality
automatically becomes secondary anyway. (Conversely, the reverse may also
be true.)
On the other hand, despite the obvious fact that the central preoccupation
of The Netherlands continues to revolve around land reclamation and
continued economic expansion, sufficient momentum has been established
in Rotterdam's development such that increasing attention--albeit from
a small base--is being given to environmental quality. -
1) Organizational Structure--the principal means by which
pollution control has been and will be carried out in
The Netherlands is the Nuisance Act (Hinderwet), first
passed in 1875, which forbids manufacturing operations
to create beyond the boundaries of a plant any public
danger, damage or nuisance, or to be in operation or
extend or change operations without a license. Enforce-
ment of this law was to be carried out through municipal
agencies (also called Hinderwet) which would have
authority within a given town's borders. If manufactur-
ing operations were located on a border between two or
more towns, provincial authorities would be involved,
and if on a provincial border, national authorities
would have cognizance.
In 1952, the original Hinderwet was updated to include
the definition and identification of various industry
types and to add new potential "nuisances" such as
nuclear power. With the revised law, the Hinderwet
covers virtually all manufacturing and commercial
C-58
activity, and includes such nuisances as air, water,
and soil pollution, fire, explosion, noise, radiation,
and odors. Visual or aesthetic pollution has not yet
been included.
In practice, most Dutch towns are too small to support
their own Hinderwet. The effect has been that Hinder-
wets in major communities such as Rotterdam, The Hague,
Amsterdam, and Utrecht, have, to the extent feasible,
worked not only within their own community but have also,
on request, consulted with surrounding towns.
Through 1970, virtually any new plant or industrial/
commercial operation in Holland was required to obtain
a permit, granted by the Burgemeister in the community
involved, who so granted the permit partly on the basis
of advice received from Hinderwet staff. The community
might also obtain advice from national officials, such
as public health, defense (if applicable), labor safety
and RIZA (the Water Pollution Control Board—Rijksinstituut
Voor Zuivering van Afvalwater).
2) Hinderwet Review Process--to date, the Hinderwet in
Rotterdam has been concerned primarily with reducing
air pollution; to this end, emission standards and
pollution abatement procedures are set by the Rotterdam
Hinderwet on a plant-by-plant basis, based upon a review
of the applicant's flow diagrams and operational
specifications. The procedure is similar to that
followed in Antwerp. There are no formalized emission
standards; instead, general emission levels given in
the Hinderwet Handbook are used as guidelines. Except
on an informal basis, Hinderwet officials seldom recommend
specific equipment or procedures to reduce atmospheric
C-59
emissions; this is left to the applicant. Occasionally,
because of the nature of the operation involved,
specifications as shown in the Hinderwet Handbook are
modified. For example, the minimum standard on particulate
emissions is 150 milligrams per cubic meter. When
Hoogovens--the State-owned steel company--expressed
interest in constructing a steel mill in the Rotterdam
area, Hinderwet reduced the emission levels by a factor
of one-half because of the enormous quantity of effluent
involved. This reduction in acceptable emission levels
was a factor in causing the company to locate its plant
in Ijmuiden on the Amsterdam North Sea Canal.
Despite its authority and the fact that continued operation
of a facility is tied to its concession permit, we were
informed that Hinderwet does not follow a policy of
confrontation with an actual or potential polluter
resulting in the imposition of a fine, threatening to
shut the plant down, or to revoke its permit. Instead,
Hinderwet uses direct contact with plant managers on a
"be a better citizen" basis. Pollution problems are
discussed openly and Hinderwet offers its assistance on
a technical basis if this should be needed. The approach
was described as having been generally successful, although
it may not be so successful elsewhere because of the
different philosophical approaches in other areas of the
country or within the EEC.
3) Changes in Authority--in December 1970, control over water
pollution problems was taken from the Hinderwet and given
to two bodies: (1) the national government, controlling
all major rivers and all ports or harbors in open
connection to those rivers, and (2) the provinces, which
control all open waters not under national jurisdiction.
C-60
Either national or provincial authorities may delegate
power to lower bodies, such as a municipality. The
purpose of the new law (Wet Verontreiniging Oppervlakte-
wateren--Law of Surface Water Pollution) is to improve
surface water quality in Holland and accordingly to make
available on a wider basis technical and financial
assistance to accomplish this end; the Water Pollution
Control Board--RIZA--is the principal advisor. Commencing
in December 1971, it is planned that no effluent can be
discharged into surface streams without a permit. In
addition, a method is set up by which effluent fees may
be charged, beginning with initial level of 2 guilders
(about 55c) per population equivalent (COD basis) and
rising progressively to a level of about $1.00 per
population equivalent. Calculation of population levels
will be based upon discharge rates and characteristics
from the previous year. Tax revenues will be used by
provincial and national authorities to establish waste-
water treatment plants, starting at the head waters on
national streams in Holland. Thus far, population
equivalents have not been defined for all industries.
Also in December 1970, a new air pollution control law
was passed--Wet Inzake de Luchterontreiniging. In general,
this law is the same as the new water law, requiring a
permit from an industrial operation which discharges
contaminants into the atmosphere. We were informed that
other than to move air pollution control activities
from municipal levels to the provincial levels in order
to provide communities with better control and tech-
nical assistance, specific details of this law re-
garding such questions as emission levels have not
yet been established.
C-61
Legislation regarding noise pollution and solid
waste pollution is being prepared at the present
time but has not yet been issued.
Thus, in theory the need for municipal Hinderwet
organizations has been eliminated; in practice
however, major Hinderwets such as the one in
Rotterdam will undoubtedly continue to play an
important role in pollution abatement or prevention
for some time to come because of their past records
of performance and vast experience in dealing with
major industrial firms. In addition, the Rotterdam
Hinderwet supervises the operation of a municipal
air monitoring system consisting of 23 scattered
stations each of which takes one sample per day of
SO 2 and particulate matter, and three other stations
measuring oxides of nitrogen concentration by taking
eight samples per day.
In addition to the Hinderwet operation, the Rijnmond
because of its direct involvement in port planning
and land use, also concerns itself with certain
aspects of environmental quality, particularly with
regard to air quality. The Rijnmond's authority does
not appear to be as great as the Hinderwet's, particularly
since the Hinderwet has indirect control over permits
and land concessions, but because of its SO2 monitoring
network (described in a later section of this report),
the Rijnmond is an air pollution abatement authority
with which industries must reckon, and the data which
it is accumulating will be invaluable if and when
stronger and more comprehensive air pollution abatement
measures are undertaken.
C-62
We were unable to determine the number or degree
of influence of industrially-sponsored organizations
in the field of environmental management; certainly
however, one of the most widely recognized is CONCAWE
(Conservation of Clean Air and Water, Western Europe),
founded about six years ago by Shell, British Petroleum
and Esso to deal with environmental problems. Today,
CONCAWE includes 18 oil companies as members, representing
approximately 80% of Western European refining capacity.
CONCAWE has three principal functions: dissemination of
relevant information among member companies, the provision
of a forum from which an industry viewpoint can be given,
and the public relations function. Refining operations
provide the focus of the organization's work, and deal
with air pollution control, liquid refinery effluent
treatment and disposal, oil migration in soils, noise
pollution, and pollution from pipeline breaks. At
present, there is no working group within the organiza-
tion which concerns itself with the problems of marine
pollution such as oil spill prevention and cleanup.
Aside from the public relations value, CONCAWE's principal
value is undoubtedly that it provides a rapid means of
communication between all member companies regarding
pollution abatement techniques, process changes and
the like which member companies can use in combatting
various forms of pollution.
b. Current and Potential Problems
1) Water--because of Rotterdam's location at the mouth of
the Rhine estuary, and the large volume of pollution
brought down from upstream, wastewater treatment is
essentially not practiced by the municipality and to
only a modest extent by major industries.
C-63
Virtually everyone with whom we discussed the
subject agreed that Rotterdam Harbor is "quite"
to "extremely" dirty. In addition to discharge
of raw or partially treated municipal sewage,
industrial plants--primarily refineries and
petrochemical operations--contribute large volumes
of polluted water, related primarily to cooling
water effluents since most plants operate on a
"once through system": When the amounts of water
involved are taken into account, the volume of oil
discharged in this manner can be significant. For
example, one refinery discharges up to 70,000 cubic
feet per hour of process water effluent having an
oil content of approximately 50 parts per million.
This content translates to a daily discharge rate
of approximately two tons, or 16 barrels of oil;
on an annual basis, the refinery discharges about
5800 barrels of oil.
Because of severe space limitations, the installa-
tion of adequate water and wastewater treatment
equipment for either effluent treatment or for
recycle purposes is difficult, and would be costly,
particularly with regard to plants which have been
in operation for some time. While central treating
facilities could probably be installed, the cost
would be sizable (no estimates were given), and
specific legislation would undoubtedly have to be
passed to accomplish this end.
Minor spills of one kind or another and including
materials other than crude oil or refined
products are common in the harbor. We were informed
that hose bursts involving spills up to 40 barrels
have occurred, and ballast and bilge pumping is common,
C-64
particularly by vessels not owned or chartered by
major companies.
Major oil companies use the "load on top" system of
handling ballast, and in addition most major companies
have holding tanks for dirty ballast. Two companies
in the Rotterdam area handle ballast on a contract
basis.
At present, the Rotterdam Port Authority has no
physical equipment for spill cleanup. Aside from one
or two small "skimmer" boats owned by private companies,
the Port would have no way to effectively combat a
major spill should it occur. The Authority is con-
sidering the purchase of an oil spill containment
boom to divide the harbor into sections, thereby
presumably making it easier to combat spills if and
when they occur.
A further difficulty regarding harbor pollution control
is that monitoring and control authority is divided;
the national government has jurisdiction over illegal
discharges in the river itself (Nieuwe Waterweg), but
in fact exercises very little control. The Port
Authority has control over spills and discharges within
the Harbor itself, and operates at least 7 patrol boats
(several of which are dual purpose, such as firefighting
and personnel transfer). Modest fines can be levied
against offenders, but only if they are caught in the
act of spilling or discharging contaminants into the
harbor. With over 50,000 vessel movements per year
through Rotterdam, it is obvious that effective control
over spills is a difficult task at best, and further
that the present program is inadequate.
C-65
Outside of the Harbor, the Dutch Naval Air Patrol
monitors vessel traffic and utilizes infrared
photograph to identify oil slicks and, if possible,
their source. In connection with these patrols,
a German vessel was said to have been detected
carrying out a "massive" dump action about 20 to
30 miles out in the North Sea. Because of the
possibility of ecological damage resulting from
this action, objections were lodged with the
German Government.
Because Rotterdam is not a locked harbor, the North
Sea has direct access to the waterway and saltwater
penetrates a considerable distance upstream; this
condition has been somewhat aggrevated by deepening
the westward portion of the new waterway around
Europort. While there is some concern that salt or
brackish water may migrate laterally through the
diking system into the surrounding countryside, this
does not appear to have yet occurred to a major extent;
it is being eldsely watched.
There apparently have been no baseline studies done
with respect to marine life as it may be affected
by pollution from the Rotterdam harbor. This question
may have considerable long-range importance because
northeastward trending currents may carry pollution
products into the Waddenzee area, which has been
characterized as the "fish nursery" for the North
Sea. On a purely speculative basis, it may be that
officials involved in the expansion and development
of Rotterdam implicitly felt that the economic impact
of this facility was far more important than any
presumed adverse affects on marine life. Furthermore,
C-66
since pollutive substances have long been assaulting
the North Sea through the Rhine estuary, the question
regarding a baseline study obviously arises as to what
original conditions should be or were prior to further
construction activities.
Marine baseline studies have been made south of Rotter-
dam in the Golden Delta region in connection with the
extensive damming systems constructed between Veerse
Gatdam and Quakjes Water. Such studies were perhaps
more feasible in that they concern relatively unspoiled
areas and were made with regard to completely changing
the ecology of inland areas from marine or brackish to
fresh water conditions.
2) Air--despite the fact that industrial and municipal
water pollution of the Rotterdam Harbor area is widely
acknowledged to be a serious problem, more progress
seems to have been made in terms of analyzing the
problem with respect to air pollution control. Two
atmospheric monitoring systems are operated in the
Rotterdam area, one by the Hinderwet and one by the
Rijnmond. The Hinderwet system has already been
described.
The Rijnmond network consists of 32 SO2 monitoring
stations which are arranged in a rough circular pattern
around the most heavily industrialized portion of
Rotterdam Harbor; none are within the city of Rotterdam
itself. Hourly readings are taken automatically by
the monitors and fed into a computer at Rijnmond head-
quarters. When relative values of SO2 concentrations
from the computer system as computed by the system
exceed pre-established averages, Rijnmond notifies up
C-67
to 22 neighboring petrochemical companies by a taped
early warning telephone message. By pre-arranged
agreement, the notified companies are expected to
modify or curtail certain activities based upon the
nature of air pollution occurring at the time.
In addition to the SO 2 monitoring system itself,
Rijnmond accepts calls from citizens regarding other
environmental pollutants such as smoke, smell, and
noise. The number of such calls has been on the order
of 20,000 per year. When a sufficient number of calls
are made which pinpoint an offender, that organization
is called by the Rijnmond.
Interestingly enough, while the network was set up to
monitor industrial pollution, a major source of sulfur
dioxide contamination has been related to domestic
heating and the large number of greenhouses located to
the northwest of the central harbor area, all of which
use fuel oil containing three to four percent sulfur.
It is expected that over the long run, these sources
of SO2 contamination will be gradually eliminated as
the Netherlands changes over from fuel oil to natural
gas.
While smoke and SO2 pollution continue to be a problem
in the Rotterdam area, Hinderwet officials are of the
opinion that the gradual switch to natural gas and high
stacks (for dispersion purposes) will in large measure
solve the problem for at least the near future. On a
longer term basis, however, there seems to be little
question that increasing industrialization and urban-
ization of Rotterdam will cause a gradual worsening of
the atmospheric environment unless increasingly stringent
C-68
measures are adopted. As yet, no air quality standards
have been decreed; directives from the Ministry of Public
Health and Social Affairs are expected eventually to
give the air pollution law some more specificity through
the eventual setting of emission standards and correlation
with various industries in the setting of specifications
as a function of industry type and location.
Of considerable interest is a study on which Dr. L. A.
Clarenberg of the Rijnmond Authority is presently working,
regarding when a given geographical area might be expected
to reach its capacity to absorb given volumes and types
of air pollutants. The study is covering all major aspects
of air pollution, including oil spills as they will affect
air quality in terms of odor and evaporate constituents.
Results are expected in 1973, and this report, as well as
any preliminary findings published before then, should be
a major contribution to environmental planning in Rotterdam.
3) Land and Solid Waste--industrial and municipal disposal
in Rotterdam has long been a chronic problem; open
burning, poorly operated small incinerators, improper
land fill operations, and dumping at sea (or in the
harbor) have been common practices. Presently under
construction near St. Laurens Haven--near the center of
the Rotterdam complex--is a large incinerator scheduled
for completion in 1974. Planned for only industrial
waste disposal, the capacity of the unit--600,000 tons
per year (approximately 2,000 tons per day) is already
judged to be too small.
Siltation is a problem in the Rotterdam Harbor, resulting
from the combined actions of tidal fluctuations and the
sediments brought into the waterway from the Rhine River
C-69
System. A fleet of up to 20 contract dredges work to
maintain the Rotterdam channels. Dredging spoil is
either discharged in selected sites on the harbor bank,
or is barged to sea. Whether sea dumping of such
material has had an adverse affect on marine life is
apparently not known.
With the construction of Europort, moles or breakwaters
were extended to protect the harbor entrance, to reduce
near shore currents and their effect on transiting
vessels, and sedimentation. The construction of these
facilities also had a direct effect on the volume and
rate of sand transport from south to north along the
coast and their impact on the northern beaches is
discussed in Section E.1.6. To permit continued
nourishment of the northern beaches, up to 15 million
cubic meters of sand fill is being pumped through
three submerged pipelines on to the Hook of Holland
recreational beach. By extending this area faster
than would otherwise occur it is expected that northern
sand transport will be accelerated.
4) Noise--this factor of environmental quality has received
very little attention in the past, and only recently
has it begun to be considered in the form of proposed
legislation. For the present we were able to identify
only one means by which citizens could communicate their
dissatisfaction in this area: through the Rijnmond
telephone system. The total effect of such noficiation
is moot, since most complaints were with regard to plant
upsets, which in turn were rather difficult if not
impossible to control.
C-70
5) Land Use--prior to 1965, Rotterdam experienced virtually
unrestrained development of its port activities. Even
after the formation of the Rijnmond in 1965, the momentum
of development and the perceived need to maintain Rotterdam
as a center of world commerce, coupled with the vital
importance of international maritime trade to the Nether-
lands, caused Rotterdam to continue growing seaward and
created pressure to grow laterally. Such a process caused
the sandwiching of residential communities between
industrially zoned areas, the rapid growth of urban areas,
and all types of social, labor, environmental and
congestion problems. One result has been dissatisfaction
on the part of large segments of the population about the
quality of life in Rotterdam, and many of these people
are migrating to other parts of the country.
This problem has been readily perceived by the Rijnmond,
which tries to redirect the expansion of Rotterdam harbor
increasingly seaward instead of allowing the harbor to
continue to encroach on land areas, particularly in the
Voorne region. A result has been the planning of the
Maasvlakkte, a seaward and southerly extension of Euro-
port.
c.. Future Issues
Many of the problems that Rotterdam now shares with Japanese ports are
those which are only incipient in the lesser developed ports such as
Dunkirk and Le Havre: over-crowding, inadequate recreational facilities,
inadequate infrastructure to supply proper access to the hinterlands,
and an unrealistically low value placed upon the land used for indus-
trialization; this latter point is particularly important since the
community of Rotterdam is now heavily in debt because of its financing
of the superstructure for the port.
C-71
Those issues which have been raised with respect to Dunkirk, Le Havre,
and Antwerp--improvement of infrastructure, retention of existing and
development of more recreational facilities, and closer cooperation
among the affected communities--also apply to Rotterdam.
As Rotterdam continues to expand and become more densely populated with
industrial operations, the pollution potential will not only become
more chronic but the possibilities will undoubtedly sharply increase
regarding the accidents involving dangerous materials, and explosives,
fires and spills. At present, minor accidents are common occurences in
Rotterdam, and it would appear that it is merely a matter of time before
a major disaster of some kind occurs.
As industrialization opportunities continue to expand, it is being
increasingly felt that only those industries which will suffer
economically by not being adjacent to deepwater facilities should be
allowed to settle in the Rotterdam area. Other industries which are
less dependent upon port activities should be located elsewhere in the
country, as should industries which have a high degree of pollution
potential.
But even such a highly deep-sea dependent industry as a steel mill, is
encountering much difficulty to settle on Maasvlakte, because the people
from Rotterdam are increasingly asking themselves: "Where do we stop?"
"How long will developing countries allow us to process at home their
raw materials?" "Shouldn't we concentrate on electronics and leisure
products which alter little the environment?"
C-72
APPENDIX C
AMSTERDAM
C.2 Amsterdam
C.2.1 Summary
Amsterdam is not a "heavyweight contender" for a major deep water port.
There are hopes, however, of constructing a new outer harbor on the
mouth of the North Sea canal that would be capable of receiving 180,000
dwt vessels, shown by various studies to be the bulk carriers of the
seventies. Although this new outer harbor will have only 500 acreas of
wet and dry surface, the municipality of Amsterdam believes that it will
be sufficiently stimulative from an economic standpoint to encourage ad-
ditional industrialization in the area and •to generate additional traffic
flow, without bringing the host of environmental problems that plague
Rotterdam. The major elements of Amsterdam's port development experience
are summarized in the following paragraphs.
• Amsterdam was caught by the economic requirements of Rotterdam
approximately twenty years ago and has not yet recovered. Un-
der the "Mono-port concept," Rotterdam convinced the central
government that there could only be one major port in the na-
tion and that all national efforts should be focused on this
port in order to obtain the maximum economies of scale. Frcm
a national viewpoint, a unique and highly successful port and
associated industrial complex has been created. However, the
question increasingly being asked is: "Has the strategy out-
lived its usefulness?"
Amsterdam argues that the law of diminishing returns applies
now in Rotterdam (port, land, labor, transport congestion) and
that it is time for a more balanced regional approach to
industrialization. Amsterdam contends that it is time for
Amsterdam to receive priority in development, because without
immediate investment in the port areas future cargo flows may
very well go to competing German ports. Amsterdam points to
the paucity of heavy secondary industries in the region and
the very slow growth in general cargo during the past 20 years.
C-73
• Amsterdam is basically a city built upon a huge commercial
tertiary sector. The city authorities are apprehensive about
its long-term economic outlook. In their view, and rightly
so, the tertiary sector would better be able to maintain its
vitality if it were based upon a larger secondary industrial
base. Acting as a constraint on general industrialization is
a labor and housing shortage in the Amsterdam area which has
led the authorities to investigate the capital intensive process
industries in the secondary sector. Those industries would
not require large numbers of personnel but would result in
high-value added products and a significant commodity
traffic requirement for the port. These economic objectives
have led sequentially to the proposal that new transit
harbor facilities and expanded infrastructure be installed
for the purpose of attracting industry.
• Amsterdam's economic rationale for port investment is
consistent with the central government's regional equalization
policy. But, Rotterdam, anticipating a potential economic
threat from French port policy, albeit long range, is making
a parallel case for new subsidies from the central Government.
The final decision will be political and Amsterdam may well
be threatened anew by Rotterdam.
• The organic and inorganic pollutants discharged into the port
are cumulative because the locks inhibit tidal flushing
and enhance water evaporation, which further concentrates the
pollutants. In an attempt to control the situation, the city
of Amsterdam continually pumps fresh water through the
brackish canal and into the North Sea through the sluices
at the canal entrance.
Oil spills from a pipeline leak and a flexible hose rupture call for
better design and maintenance. The rupture of a bulk oil storage
tank, which washed out the retaining dike (similar to
Antwerp's recent experience) in an inland canal, points to
the need for better design to resist static and shock loading.
C-74
• The water pollution problem within the Amsterdam Harbor
is recognized. Aside from the potential threat of major
spills of oil, hazardous materials and salt water intrusion,
however, water pollution isskinor uin comparison to developing
a purely economic program rationale for port expansion and
development.
• Amsterdam is more of a dry cargo port and as such has not
experienced the rapid growth of petroleum-based industry.
Consequently, in the Amsterdam area itself, air pollution
has not been judged to be a serious problem, although the
Hosgovens steel mill is polluting small communities in the
West.
• As a highly viable but slower growing general cargo port,
Amsterdam has an opportunity to plan its future growth with
greater attention to environmental and sociological
considerations. We have the impression that economic growth
is of paramount importance, and that industrial expansion
is to be achieved as rapidly as possible, perhaps at the
expense of a more balanced and environmentally-oriented
program to conserve a unique historical and natural city
asset.
C.2.2 General Area Description
a. Geography
Situated in the province of North Holland, Amsterdam lies at the
southwest extremity of the Ijsselmeer inland sea and about 16 miles
from the North Sea, to which it is connected by the North Sea Canal,
originally constructed in 1870 (Figure C-3).
b. Surficial Character
Founded among swamps and stretches of water, the city has always been
built on piles and methodically planned. The soil is essentially fine
grained sand, separated by layers of clay and peat; much of the developed
acreage in the Amsterdam region and along the North Sea Canal is of
C-75

NOR//H WEST)
north sea
1
outerport
MARK
4 " j
ijsselme E
A
rtiA RDAM \* _
Legend:
Boundary of Regional Plan Ijmeer
Present Industrialized Port Area
Under Construction
Planned
I I
aar
a
IIR .1.411/ ■ wf-FN\--Trm. ruw
FIGURE C-3 PORT OF AMSTERDAM
polder construction; there are no known fresh water aquifers in the
area which could have been affected by canal deepening.
c. Climate
Fog is not uncommon in Amsterdam: visibility is equal to or less than
0.6 miles about 10-15% of the time. But visibility generally exceeds
2.5 miles, and exceeds 7 miles about half the time. Rainfall averages
approximately 30 inches annually, and average temperatures range from
between 21°F in winter to 68 °F in summer. The air is seldom calm;
average wind speed is eleven miles per hour, and wind directions are
fairly evenly dispersed with the most frequent direction out of the
southeast to southwest quadrant.
d. Hydraulics
Tidal variations at the entrance to the North Sea Canal are rather
modest, amounting to a total variation between high and low water of
1.6 meters (5.25 feet).
With the exception of the steel works harbor at Hoogovenshaven, the
North Sea Canal and Amsterdam Harbor proper are locked, with a maximum
depth of 15.5 meters (approximately 51 feet) in the newer portions of
the harbor (Amerika-Haven and West Haven) and diminishing to approxi-
mately ten feet in portions of the old, inner harbor. As a matter of
practicality, the Ijmuiden locks, with a maximum depth of 15 meters
(50 feet) effectively control the draft of any vessel capable of
entering Amsterdam Harbor. Under normal circumstances, the maximum
draft allowed into the Amsterdam port is 31.1 meters (43 feet), but by
special permission this draft can be and has been exceeded, the largest
vessel to enter Amsterdam Port having a 45-foot draft.
e. General Land Use
Because Amsterdam has not grown as rapidly as has Rotterdam, a significant
portion of the land abutting either side of the North Sea Canal remains
undeveloped from an industrial standpoint. The bulk of industrialization
C-77
extends from the center of Amsterdam proper towards the sea approximately
7 miles (of a total distance of 15 miles to the sea) to Amerika-Haven;
a separate development on the seaward side of the Ijmuiden locks is
located in Velsen and is the site of Hoogovenshaven, the state-owned
steel works. Between these two areas, land on either side of the canal
is used primarily for agricultural and recreation purposes.
It appears obvious, however, that in response to ever increasing pressure
to make available suitable industrial sites with a direct access to the
sea, a belt of industrial activity will eventually extend from Amsterdam
to Ijmuiden in essentially a continuous line approximately one or two
miles wide on either side of the canal. At present, for example, a new
1500-hectare (3750 acres) area immediately west of Amerika-Haven is
under development. In addition, plans are being finalized to construct
an outer, deep-water port off Ijmuiden that will accommodate vessels
up to 60 feet in draft or approximately 180,000 dwt.
As in the other ports we visited, it is readily apparent that economic
considerations (i.e., port growth and development) take priority over
environmental matters. At the same time, it is also apparent that
even considering the premium placed upon economic expansion in the
Netherlands, a significant amount of open land remains in the greater
Amsterdam region and that great attention is being given to its use,
not only to meet economic needs, but also to meet social, recreational,
and environmental requirements.
f. Population
The present population of the city of Amsterdam is 861,000, and within
what might be called greater Amsterdam (including those communities along
the North Sea Canal to Amerika-Haven) the population is about 1.1 million.
Housing is short in Amsterdam; living conditions are overcrowded, and
one source estimated that 49,000 are waiting for adequate housing. While
it is a prosperous city, Amsterdam by no means is free of environmental
and social problems.
C-78
g. Port
Major commodities handled by the port of Amsterdam include grains, coal,
iron ore, crude oil and petroleum products, and general cargo. For all
practical purposes, the North Sea Canal's maximum depth -- and therefore
that of Amsterdam inside the Ijmuiden locks -- has been reached. It
would be impractical to enlarge the northern lock; furthermore, two
tunnels built beneath the canal (in 1947 and 1952) have only 3-5 feet
of overburden above them. The cost of deepening these two tunnels has
been shown to be prohibitive. Thus, the only reasonably practical
alternative for a deeper port is to build a deep outer port near Ijmuiden,
and use it primarily as a transshipment facility, rather than as an
integrated industrial complex.
h. Institutional Authority
Administration of the port of Amsterdam falls within the responsibility
of the municipality of Amsterdam, the government of which consists of a
45-man elected council under the chairmanship of a Crown-appointed
Burgomaster. The town council controls the following phases of port
operation: port management organization, port usage rates (with royal
assent), harbor police, financial management, and port expansion.
An organization similar to the Rijnmond in Rotterdam does not formally
exist in the Amsterdam area; the Ijmond is the nearest thing to such
an authority and is in reality a loose confederation of four communities
-- Haarlem, Zaandam, Amsterdam, and Beverwijk (which includes the two
communities of Ijmuiden and Velsen). At present, the planning efforts
of these four communities are being coordinated by the North Holland
Provincial Government. It is expected, however, that a more formal
authority will be created in the relatively near future.
Among its activities, the Ijmond participated in the development of a
master plan for the North Sea Canal area, which, in a general sense,
provided a plan for the region out to 1990. Among the groups involved
in developing this regional plan were the Planning Department of the
C-7 9
Province, the Planning Department of the Public Works Department in
Amsterdam, the Port Authority, transportation companies, and the
Rijkswaterstaat.
C.2.3 Economic Appraisal*
• a. Historical Development of the Port
The history of the Amsterdam port areas started with the construction of
a dam in the river Amstel, primarily to protect the surrounding areas
against floods from the sea. Subsequently, the dam was used as the first
transshipment quay both for seagoing vessels and for inland barges.
During the late 16th century the Amsterdam traders were successful in
trading grain from the Baltic to Italy, and the sea routes on the
Baltic and on the Mediterranean Seas became very important to Amsterdam.
By that time the East Indian trade was established and until the 1950's
Amsterdam was the most successful seaport on this important trade route.
In 1824, Amsterdam's sea accessibility via the Zuider Zee was improved
for larger ships by the opening of the 'Groot Noord-Hollandsch' Canal
to Den Helder. Ships' capacities continued to grow, consequently, the
North Sea Canal and the Ijmuiden Locks were constructed about 1875.
Over the years the North Sea Canal has been enlarged, new locks have
been built -- the Northern Lock was opened in 1930 -- and the Ijmuiden
harbor mouth was enlarged between 1962 and 1967. Amsterdam presently
can receive ships up to 90,000 dwt.
The inland waterways have also been improved over the years. In 1893 the
Merwede Canal was opened, as an improved connection between the Amsterdam
port areas and the Rhine, and in 1952 the Amsterdam-Rhine Canal was
completed, making Amsterdam accessible for the large Rhine barges.
*The economic information about the port of Amsterdam is based on our
field investigations as well as extracts from recent publications by
the Amsterdam Port Authority and its consultants, Inbucon, Inc.
C-80
In the early 1920's a significant industrial development occurred at
Ijmuiden (located at the North Sea entrance of the North Sea Canal)
with the establishment of an integrated steelworks. This introduced
a new dimension to the function of the port.
b. The Past Twenty Years
Until the early 1950's Amsterdam was the home port of the major Dutch
shipowners, and the Indonesian trade route was very important. Through
the influence of the Dutch shipowners, however, foreign shipping
companies were discouraged from using the port. Therefore the commercial
development of the Amsterdam port areas was subject to an artificial
constraint. Then the Indonesian trade lost its importance to The
Netherlands and the Dutch shipowners became less interested in the
Amsterdam port areas and moved to Rotterdam. Amsterdam found itself in
a competitive situation with other Northwest European ports, which meanwhile
had strengthened their positions by attracting foreign shipping lines.
Consequently, there had been an absence in growth of general cargo.
The reasons advanced to explain the absence of growth in general cargo
are as follows:
• The absence of sufficient opportunity for Amsterdam-based
shipping agents and forwarding agents to take an active
interest in canvassing Amsterdam traffic in the hinterland.
• Action and/or absence of action on the part of the shipping
companies. This is coupled with the circular argument that
more cargo would mean greater interest on the part of the
shipping companies with consequent increased service frequency,
whereas the opposite is also claimed to be true.
• Lack of sufficient industrialization, at least of the right
category, to produce cargo flow.
• Limitations in the provision of barge canal services.
• The Netherlands' policy of not linking financial aid to
developing countries with securement of port traffics.
• Reduction in Dutch influence in the East Indies.
c_81
The Amsterdam port areas have not been successful in handling general
cargo. Annual growth has been approximately 0.5% between 1965 and 1969.
Amsterdam lost part of its share of the total amount of general cargo
handled to Rotterdam, where the annual growth has been about 10.5%.
The Amsterdam port area has been more successful in handling bulk cargo.
Annual growth rate has been about 13%. Hence, Amsterdam's share of
total amount of bulk handled has increased slightly.
In addition to shipbuilding and repairs, Amsterdam recognized the
importance of modern port-based industries after 1950. Subsequently,
one refinery and several small chemical firms have located close to the
Amsterdam port area. Apart from these industries, however, the overall
rate of port industrialization has been discouraging. About 4,400 acres
of land have been designated for the development of port industries.
c. Sea Access
Sea access to Amsterdam port areas is through the North Sea Canal with
the locks at Ijmuiden. The capacity of the Northern Lock dictates the
size of vessel which can use the North Sea Canal. The limiting dimension
is the depth,fifty feet, and the maximum vessel draft permitted through
the lock is 45 feet (salt water). This means that while most 85,000 dwt
vessels can enter the North Sea Canal, very few vessels of 100,000 could
be received fully loaded. (The maximum ship size permissible at Amsterdam
and several other European ports is given in Table C-21.)
The implications of this situation are clear. First, the large crude
oil carriers cannot use the Amsterdam port areas. Second, the large
iron ore and coal carriers now coming into service will not be able to
enter the North Sea Canal. Third, other dry and wet bulk carriers
ultimately may not have access to the inner port. Somewhat larger
vessels can be accepted at Ijmuiden, but the future optimal sized ore
carriers may not be able to serve the established steelworks directly
because of the limitations of the existing access channel. Finally, some
C-82
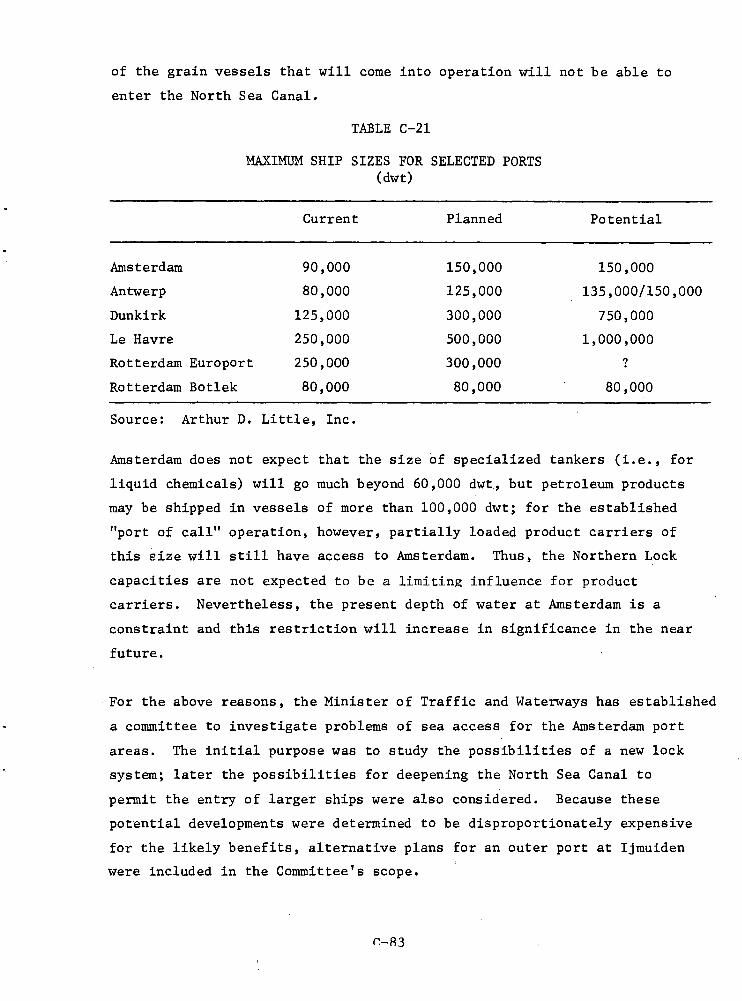
Current Planned Potential
Amsterdam 90,000 150,000 150,000
Antwerp 80,000 125,000 135,000/150,000
Dunkirk 125,000 300,000 750,000
Le Havre 250,000 500,000 1,000,000
Rotterdam Europort 250,000 300,000 ?
Rotterdam Botlek 80,000 80,000 80,000
of the grain vessels that will come into operation will not be able to
enter the North Sea Canal.
TABLE C-21
MAXIMUM SHIP SIZES FOR SELECTED PORTS (dwt)
Source: Arthur D. Little, Inc.
Amsterdam does not expect that the size of specialized tankers (i.e., for
liquid chemicals) will go much beyond 60,000 dwt, but petroleum products
may be shipped in vessels of more than 100,000 dwt; for the established
"port of call" operation, however, partially loaded product carriers of
this eize will still have access to Amsterdam. Thus, the Northern Lock
capacities are not expected to be a limiting influence for product
carriers. Nevertheless, the present depth of water at Amsterdam is a
constraint and this restriction will increase in significance in the near
future.
For the above reasons, the Minister of Traffic and Waterways has established
a committee to investigate problems of sea access for the Amsterdam port
areas. The initial purpose was to study the possibilities of a new lock
system; later the possibilities for deepening the North Sea Canal to
permit the entry of larger ships were also considered. Because these
potential developments were determined to be disproportionately expensive
for the likely benefits, alternative plans for an outer port at Ijmuiden
were included in the Committee's scope.
r-83
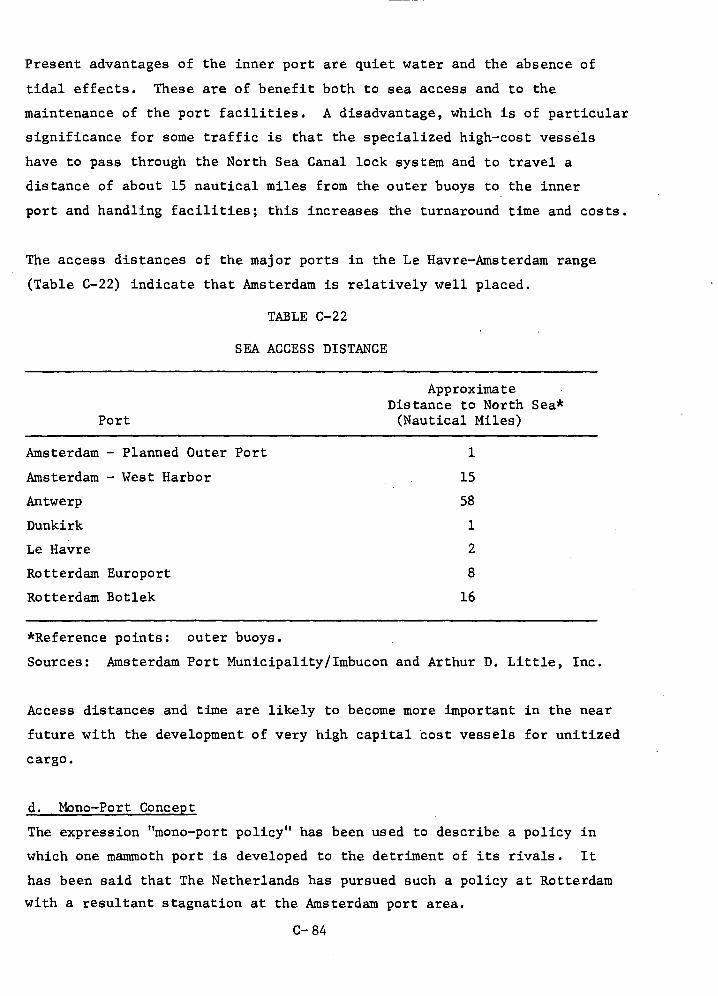
Present advantages of the inner port are quiet water and the absence of
tidal effects. These are of benefit both to sea access and to the
maintenance of the port facilities. A disadvantage, which is of particular
significance for some traffic is that the specialized high-cost vessels
have to pass through the North Sea Canal lock system and to travel a
distance of about 15 nautical miles from the outer buoys to the inner
port and handling facilities; this increases the turnaround time and costs.
The access distances of the major ports in the Le Havre-Amsterdam range
(Table C-22) indicate that Amsterdam is relatively well placed.
TABLE C-22
SEA ACCESS DISTANCE
Approximate Distance to North Sea* (Nautical Miles)
Amsterdam - Planned Outer Port 1
Amsterdam - West Harbor 15
Antwerp 58
Dunkirk 1
Le Havre 2
Rotterdam Europort 8
Rotterdam Botlek 16
Port
*Reference points: outer buoys.
Sources: Amsterdam Port Municipality/Imbucon and Arthur D. Little, Inc.
Access distances and time are likely to become more important in the near
future with the development of very high capital cost vessels for unitized
cargo.
d. Mono-Port Concept
The expression "mono-port policy" has been used to describe a policy in
which one mammoth port is developed to the detriment of its rivals. It
has been said that The Netherlands has pursued such a policy at Rotterdam
with a resultant stagnation at the Amsterdam port area.
C-84
The National Government's official policy has been to give equal
opportunities to the ports of Amsterdam and of Rotterdam. In 1965, this
twin port policy underwent some modification when it was decided that only
Rotterdam should go ahead in terms of deep water, in order to provide
facilities for the giant crude oil carriers, but that equality should be
maintained in the capability of handling all other cargo. At that time,
the possibility of very large dry bulk carriers was not foreseen. It is
now clear that if the Government is to maintain a policy of equality,
deep water access at the Amsterdam port areas must be improved.
Despite this policy of equal opportunity, the Rotterdam port has received
a much greater share of port investment than the Amsterdam port area.
From the national viewpoint, a unique opportunity was taken and a highly
successful port and associated industrial complex created. However, the
Amsterdam port area has been overshadowed by these developments and its
growth rate has suffered accordingly.
Many arguments have been advanced in favor of the mono-port concept,
including:
a) economy of scale;
b) protection of existing investments;
c) port alternatives.
Economy-of-scale arguments apply to all aspects of a port's activities,
including handling, infrastructure, and frequency of service. This has
been a major reason for the rapid growth in the Rotterdam region.
However, the law of diminishing returns will apply to this situation as
soon as a certain traffic density has been reached. (In the ultimate
situation diseconomy of scale arises.)
Amsterdam believes that in the future, the economy-of-scale argument
will be much more significant when applied in favor of investment in
the Amsterdam port areas. Without immediate investment at the Amsterdam
port areas, however, the economy-of-scale arguments will again work
against Amsterdam, possibly in favor of competing ports outside The
Netherlands (e.g., on the Baltic).
C-85
Sizable port investments in Amsterdam are at risk through the mono-port
developments. Already a number of Amsterdam port users have transferred
some of their operations to other ports and there is a danger that a
number of the main terminals in the Amsterdam port areas may be unable
to remain operational. Loss in public and private investment, and the
social consequences of a disruption in employment could well be the
outcome of this situation.
It is a fact that, on occasion, serious delays are experienced by port
users at Rotterdam. The costs involved in delaying large ships are
considerable and can, if they arise frequently at a port, result in the
transfer of some shipping lines to non-Holland ports. Other diseconomies
which can arise, though concentrating all major port developments in one
area, relate to the availability and costs of the various support
resources required. In particular these include land, labor and inland
transport links.
Many individuals in Amsterdam believe that commercial interests at
Rotterdam have attempted to minimize these problems. However, with
inadequate port alternatives (for example, deep water access) in The
Netherlands, any diversion of traffic and industry from Rotterdam is
likely to be for the benefit of port areas outside The Netherlands.
This is the Amsterdam argument for national investment to improve the
transport function at Amsterdam.
A further argument is that 'regional equalization' is a most important
aspect of national policy; by such means, required maximization of
national income, high land utilization and stabilization of employment
can follow. Within the implementation of regional developments, it is
argued that port investment at the Amsterdam port areas should be
awarded a high priority.
e. Inland Transportation
Amsterdam, along with the other North Sea ports, enjoys the advantage
of easy access to the vast European industrial heartland. This, coupled
c_86
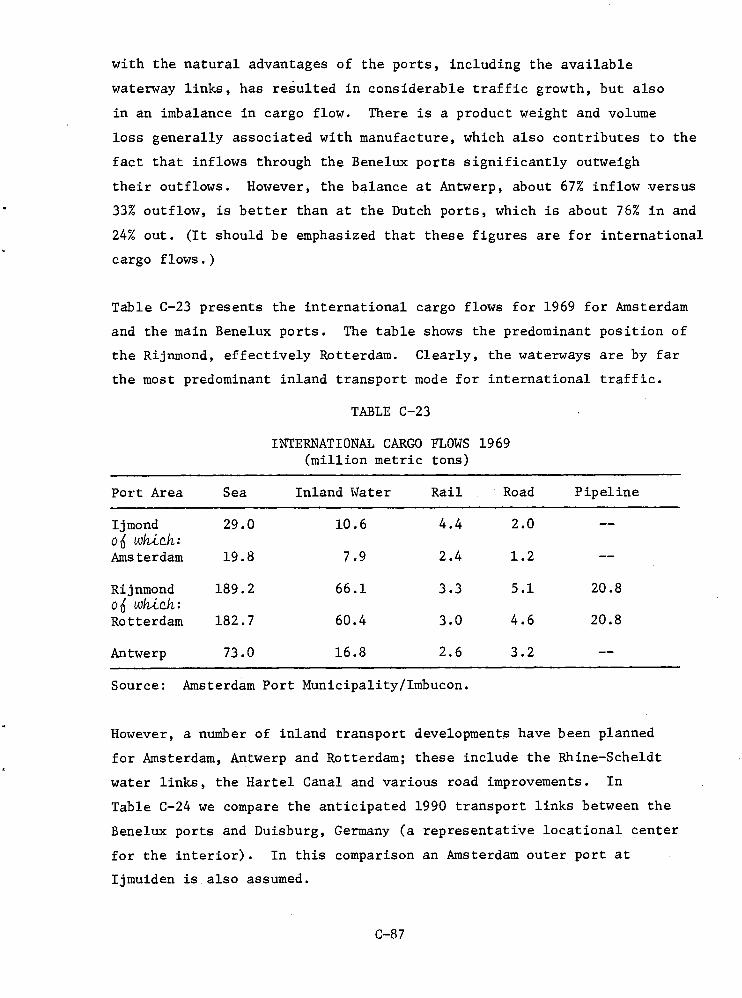
10.6
7.9
Ijmond 29.0 o4 which: Amsterdam 19.8
4.4 2.0
2.4 1.2
16.8 Antwerp 73.0 2.6 3.2
with the natural advantages of the ports, including the available
waterway links, has resulted in considerable traffic growth, but also
in an imbalance in cargo flow. There is a product weight and volume
loss generally associated with manufacture, which also contributes to the
fact that inflows through the Benelux ports significantly outweigh
their outflows. However, the balance at Antwerp, about 67% inflow versus
33% outflow, is better than at the Dutch ports, which is about 76% in and
24% out. (It should be emphasized that these figures are for international
cargo flows.)
Table C-23 presents the international cargo flows for 1969 for Amsterdam
and the main Benelux ports. The table shows the predominant position of
the Rijnmond, effectively Rotterdam. Clearly, the waterways are by far
the most predominant inland transport mode for international traffic.
TABLE C-23
INTERNATIONAL CARGO FLOWS 1969 (million metric tons)
Port Area Sea Inland Water Rail Road Pipeline
Rijnmond 189.2 o4 which: Rotterdam 182.7
66.1 3.3
60.4 3.0
5.1 20.8
4.6 20.8
Source: Amsterdam Port Municipality/Imbucon.
However, a number of inland transport developments have been planned
for Amsterdam, Antwerp and Rotterdam; these include the Rhine-Scheldt
water links, the Hartel Canal and various road improvements. In
Table C-24 we compare the anticipated 1990 transport links between the
Benelux ports and Duisburg, Germany (a representative locational center
for the interior). In this comparison an Amsterdam outer port at
Ijmuiden is also assumed.
C-87
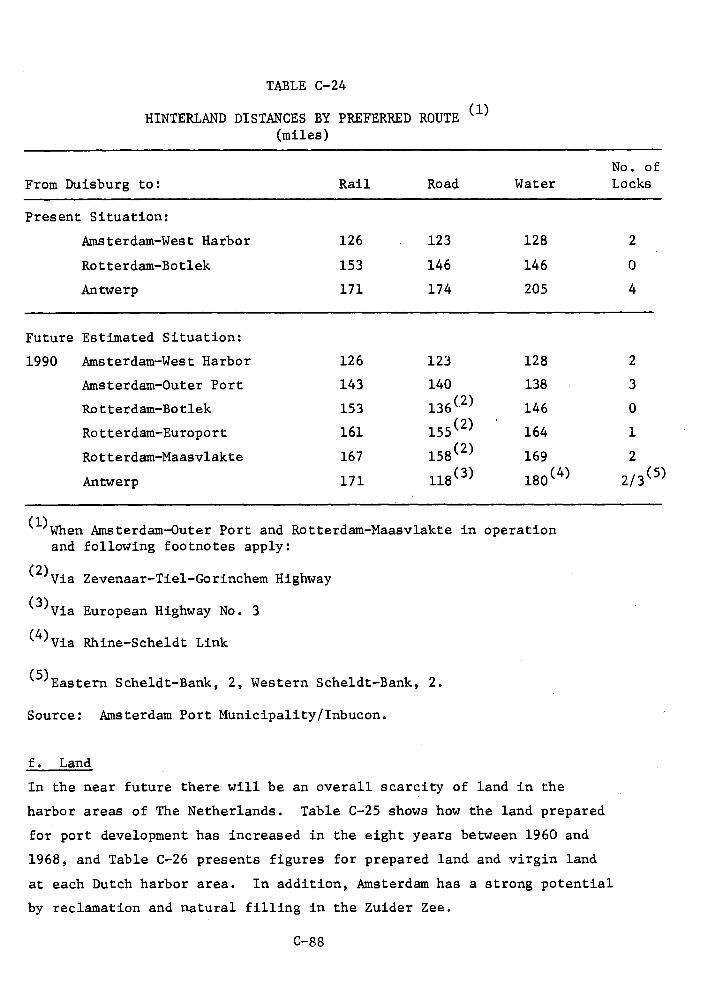
2
0
4
TABLE C-24
(1) HINTERLAND DISTANCES BY PREFERRED ROUTE
(miles)
No. of From Duisburg to: Rail Road Water Locks
Present Situation:
Amsterdam-West Harbor 126 . 123 128
Rotterdam-Botlek 153 146 146
Antwerp 171 174 205
Future Estimated Situation:
1990 Amsterdam-West Harbor 126 123 128 2
Amsterdam-Outer Port 143 140 138 3 (2)
Rotterdam-Botlek 153 136 146 0 (2) '
Rotterdam-Europort 161 155 164 1 (2)
Rotterdam-Maasvlakte 167 158 169 2
Antwerp 171 118 (3) 180(4)
2/3 (5)
(1) When Amsterdam-Outer Port and Rotterdam-Maasvlakte in operation and following footnotes apply:
(2) Via Zevenaar-Tiel-Gorinchem Highway
(3)Via European Highway No. 3
(4)Via Rhine-Scheldt Link
(5)Eastern Scheldt-Bank, 2, Western Scheldt-Bank, 2.
Source: Amsterdam Port Municipality/Inbucon.
f. Land
In the near future there will be an overall scarcity of land in the
harbor areas of The Netherlands. Table C-25 shows how the land prepared
for port development has increased in the eight years between 1960 and
1968, and Table C-26 presents figures for prepared land and virgin land
at each Dutch harbor area. In addition, Amsterdam has a strong potential
by reclamation and natural filling in the Zuider Zee.
C-88
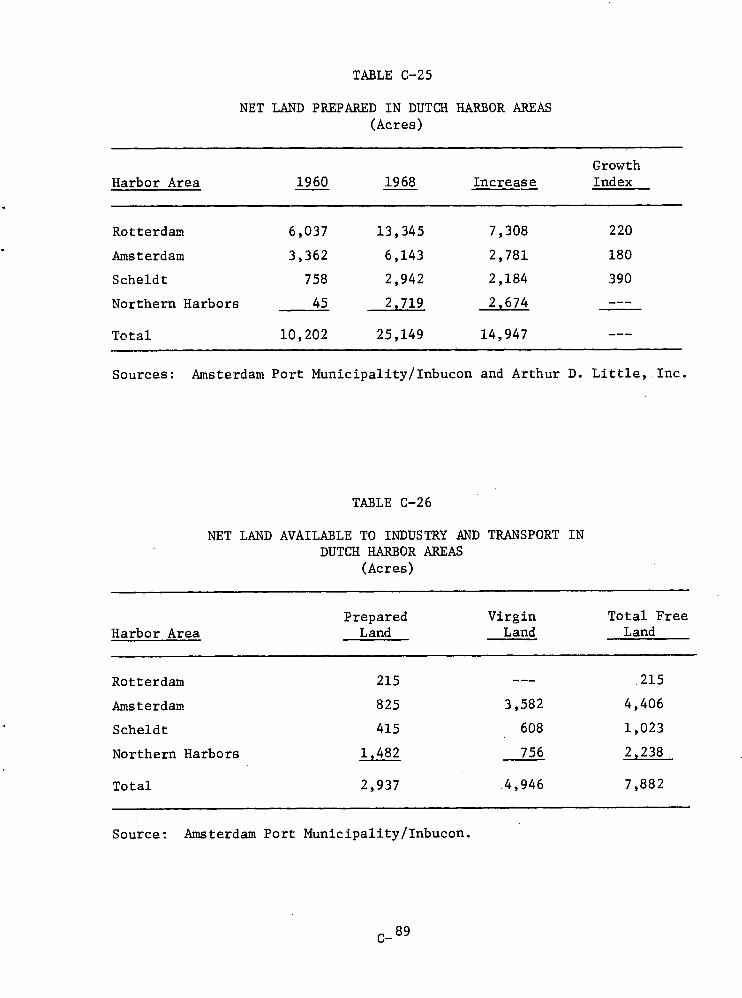
TABLE C-25
NET LAND PREPARED IN DUTCH HARBOR AREAS (Acres)
Harbor Area Growth
1960 1968 Increase Index
Rotterdam 6,037 13,345 7,308 220
Amsterdam 3,362 6,143 2,781 180
Scheldt 758 2,942 2,184 390
Northern Harbors 45 2,719 2,674 ---
Total 10,202 25,149 14,947
Sources: Amsterdam Port Municipality/Inbucon and Arthur D. Little, Inc.
TABLE C-26
NET LAND AVAILABLE TO INDUSTRY AND TRANSPORT IN DUTCH HARBOR AREAS
(Acres)
Harbor Area Prepared Virgin Total Free
Land Land Land
Rotterdam 215 --- 215
Amsterdam 825 3,582 4,406
Scheldt 415 608 1,023
Northern Harbors 1,482 756 2,238
Total 2,937 4,946 7,882
Source: Amsterdam Port Municipality/Inbucon.
C- 89
The total land available is 7,882 acres. Clearly, whatever forecast of land
requirement is considered, there is shortly going to be an overall short-
age of land in the Dutch harbor areas. Of the land available, more than
half is in the Amsterdam port areas, primarily on the south bank of the
North Sea Canal_and thus, land availability is a very important asset for
Ansterdam. In addition, there is land designated for development on
the north bank of the Canal.
In principle, the policy of the Amsterdam Minicipality is to lease land
to industry rather than to sell it. However, existing port-based
industries own some of the land and it is possible for a user to buy an
industrial site. Broadly speaking, the companies coming to the port
area are given a contract entitling them to use the land for 50 years
with an option to renew the contract for a further period. The rent
charged to companies leasing land is negotiated initially on the basis
of land and infrastructure costs to the port. Thus, users requiring,
for example, 300 acres, will pay less per acre than users requiring only
a few acres. The reason for this is that the port will incur less
infrastructure cost supplying a single lot of 300 acres than would be
the case for 15 separate users each requiring 20 acres.
The rent charged at Amsterdam is reviewed every five years in accordance
with a specified formula that takes into account inflation. At Rotterdam
the adjustment can take into account the increase in land value through
scarcity as well as inflations.
g. Labor
There is a serious overall labor shortage in The Netherlands, but the
labor situation at Amsterdam is not expected to deteriorate relative to
other regions. In fact, with an increasing emphasis on capital-intensive,
high-skill industries, the labor availability advantages of the Amsterdam
port areas could increase, provided there is sufficient housing. At
present, housing is scarce.
C-90
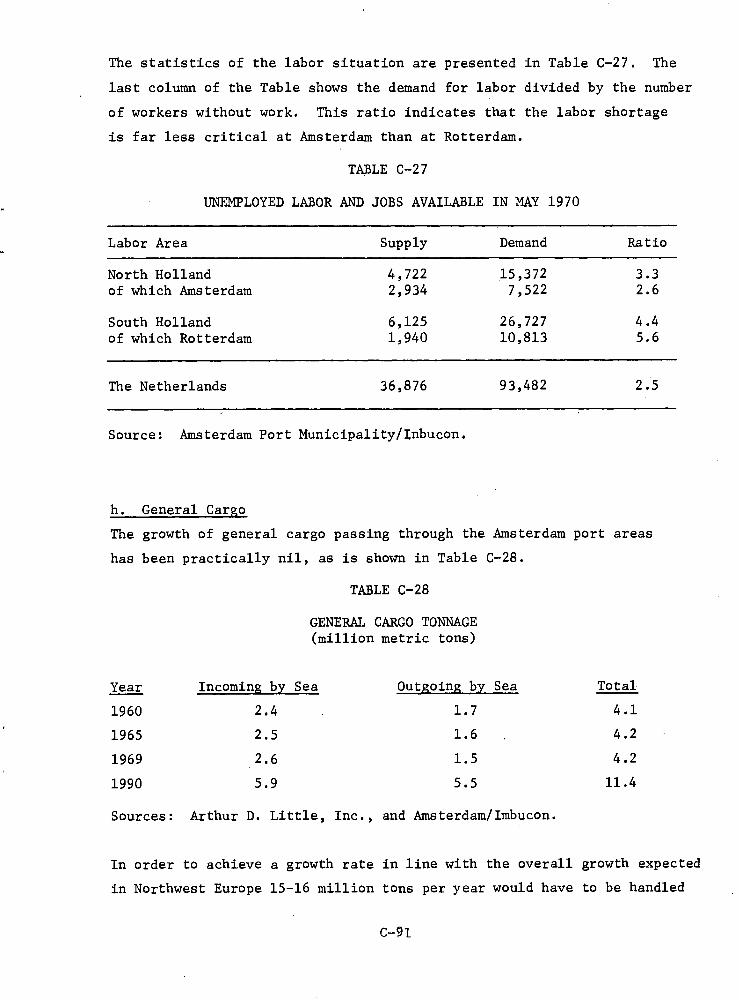
Labor Area
North Holland of which Amsterdam
South Holland of which Rotterdam
Supply Demand Ratio
4,722 15,372 3.3
2,934 7,522 2.6
6,125 26,727 4.4
1,940 10,813 5.6
The statistics of the labor situation are presented in Table C-27. The
last column of the Table shows the demand for labor divided by the number
of workers without work. This ratio indicates that the labor shortage
is far less critical at Amsterdam than at Rotterdam.
TABLE C-27
UNEMPLOYED LABOR AND JOBS AVAILABLE IN MAY 1970
The Netherlands 36,876 93,482 2.5
Source: Amsterdam Port Municipality/Inbucon.
h. General Cargo
The growth of general cargo passing through the Amsterdam port areas
has been practically nil, as is shown in Table C-28.
TABLE C-28
GENERAL CARGO TONNAGE (million metric tons)
Year Incoming by Sea Outgoing by Sea Total
1960 2.4 1.7 4.1
1965 2.5 1.6 4.2
1969 2.6 1.5 4.2
1990 5.9 5.5 11.4
Sources: Arthur D. Little, Inc., and Amsterdam/Imbucon.
In order to achieve a growth rate in line with the overall growth expected
in Northwest Europe 15-16 million tons per year would have to be handled
C-91
by 1990. Port personnel believe that even the forecast 11.4 million
tons of general cargo cannot be achieved without significant development
of the Amsterdam port areas.
It is the position of the port administration, that with present facilities
the Amsterdam port area will not be able to maintain its share of European
general cargo traffic. This share has been declining over the past 20
years and this negative trend will be accelerated without the proposed
outer port.
i. Iron Ore
Iron ore, a relatively low cost commodity, is coming increasingly from
more distant, higher-quality sources and the volume of trade is rising.
Accordingly, vessels are expected to increase in size.
The ships in service for particular traffics depend on the' harbor facili-
ties available both at the loading and unloading ports, but developments
expected in the next few years at ore loading ports, and the current origin
of ore supplies, imply that in the near future nearly three-quarters of
the requirements of the German steelworks could be supplied in vessels
not acceptable at the Amsterdam port area.
Swedish iron ore is important and will probably meet a quarter of the
Northwest European demand. In the long term, however, with larger steel-
making units, joint buying arrangements and the expected composition of
the ore fleet, even this ore probably will be carried increasingly in
larger vessels. In 1975 only 40% of incoming transshipment ore might
be received at the Amsterdam port area without the construction of an
outer port. By 1990, this figure may be as low as 10%. In 1969, 5
million tons of iron ore were imported for transshipment. This excludes
seagoing traffic for the steel plant at Ijmuiden of about 8 million tons
in 1969, which will probably be doubled by 1990. By 1990, the forecast
of imported iron ore to Amsterdam is 11 million metric tons.
In the immediate future, two events will probably enable the Amsterdam
port area, with only the current facilities, to continue to retain some
C- 92
of the transshipment trade. The first is the existing fleet of smaller
vessels that will be chartered out at rates per ton comparable with the
big vessels. The second is the employment of the large vessels only
partially loaded because of inadequacies in the port's facilities or
because demand was less than maximum.
j. Other Ores
The estimated 1990 net requirements of other ores in West Germany and
BLEU* are 10 million tons and 5 million tons, respectively. Although
the effect of ship size will not be as significant as for iron ore,
cargo flows will tend to be transported through the centers of iron ore
handling. Thus, The Netherlands should receive a dominant share of
other ore traffic. The 1990 forecast is about 8 million tons; again
this is about double the present tonnage.
This tonnage is indirectly dependent on adequate facilities for deep
water transport (e.g., iron ore). Hence, should such facilities not be
developed in the Amsterdam port areas, anticipated tonnage in 1990
would be only about 2 million tons.
k. Grain and Derivatives
The grain business is undergoing a significant change. Increasingly,
so-called "derivatives" are replacing the traditional corn. The demand
for "hard" grain for human consumption is static, but the demand for
"soft" grain, and increasingly for "derivatives" for animal foodstuff,
is growing slowly. The tariff policy of the EEC favors the internal
supply of "soft" grain, particularly from France, and at the same time
encourages the switch to importing "derivatives." The result is that in
Europe the rate of growth of imports in total (grain and derivatives)
is slow, and derivatives are growing at the expense of grains. Reduced
grain volumes mean that the size of grain vessels is not going to
increase as much as was expected. This smaller size will reduce the
tendency for transshipment.
*Belgium/Luxembourg Economic Union.
C-93
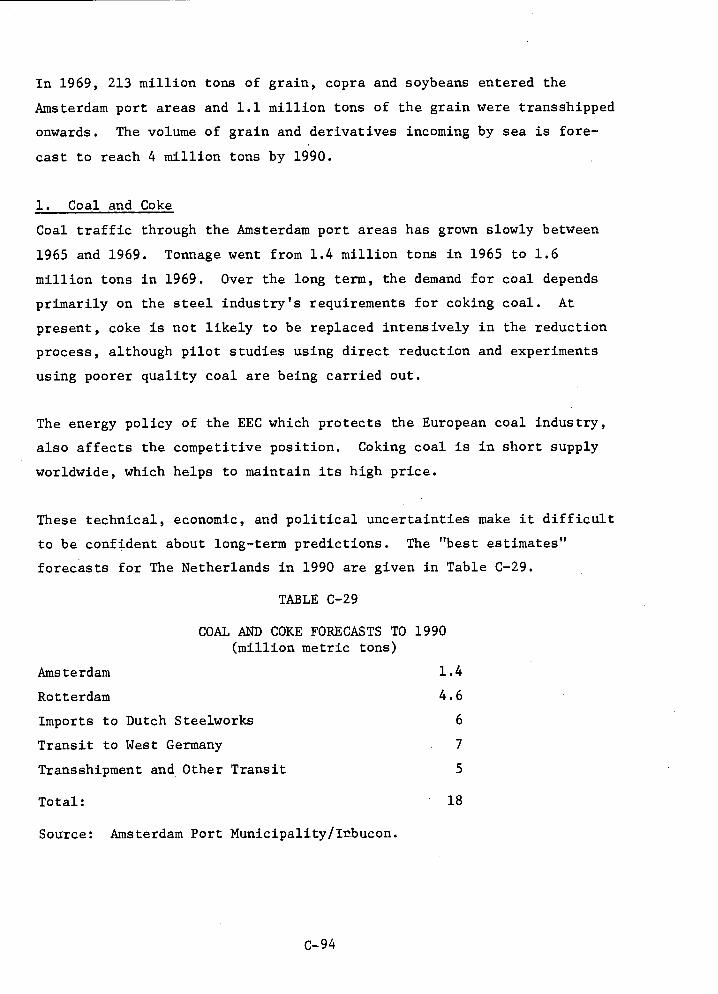
In 1969, 213 million tons of grain, copra and soybeans entered the
Amsterdam port areas and 1.1 million tons of the grain were transshipped
onwards. The volume of grain and derivatives incoming by sea is fore-
cast to reach 4 million tons by 1990.
1. Coal and Coke
Coal traffic through the Amsterdam port areas has grown slowly between
1965 and 1969. Tonnage went from 1.4 million tons in 1965 to 1.6
million tons in 1969. Over the long term, the demand for coal depends
primarily on the steel industry's requirements for coking coal. At
present, coke is not likely to be replaced intensively in the reduction
process, although pilot studies using direct reduction and experiments
using poorer quality coal are being carried out.
The energy policy of the EEC which protects the European coal industry,
also affects the competitive position. Coking coal is in short supply
worldwide, which helps to maintain its high price.
These technical, economic, and political uncertainties make it difficult
to be confident about long-term predictions. The "best estimates"
forecasts for The Netherlands in 1990 are given in Table C-29.
TABLE C-29
COAL AND COKE FORECASTS TO 1990 (million metric tons)
Amsterdam 1.4
Rotterdam 4.6
Imports to Dutch Steelworks 6
Transit to West Germany 7
Transshipment and Other Transit 5
Total: 18
Source: Amsterdam Port Municipality/Irbucon.
C- 94
The current position in the Amsterdam port areas is not a good indication
of future coal and coke traffic. More recent developments indicate the
possibility that Australian and Canadian coke may be imported, which
would require large vessels, and arguments similar to those described
for iron ore would apply. However, the smaller annual tonnages reauired
make the economy of scale less important.
m. Oil
In 1969, 4 million tons of oil (crude and products) were handled at the
Amsterdam port areas. Included in this figure is 1.2 million tons of Lib-
yan high-viscosity crude oil going to the existing Mobil Oil refinery.
This crude oil cannot use the unheated pipeline from Rotterdam. The tonnage
of crude oil handled at Amsterdam in the future will depend on expansion
by the established oil refinery and the possible building of new refineries.
However, the bulk of the crude oil will come by pipeline from Rotterdam.
On the basis of present refinery expansion plans, and without assuming
new refineries requiring significant volumes of specialized crude oil,
Amsterdam forecasts an import tonnage by tanker of about 2 million tons
in 1990. Petroleum products will add another 2 to 6 million tons, depending
on port and industry developments.
n. Commodity Flow Forecasts
A review of major commodity traffic is given in Tables C-30, C-31, and
C-32.
Without an outer port and without improved traffic flows from industriali-
zation, the commodity flows shown in Table C-33 are expected to occur.
Table C-34 indicates the volume of commodity flows that would be
possible after implementation of the outer harbor project and the
realization of industrial objectives.
C-95
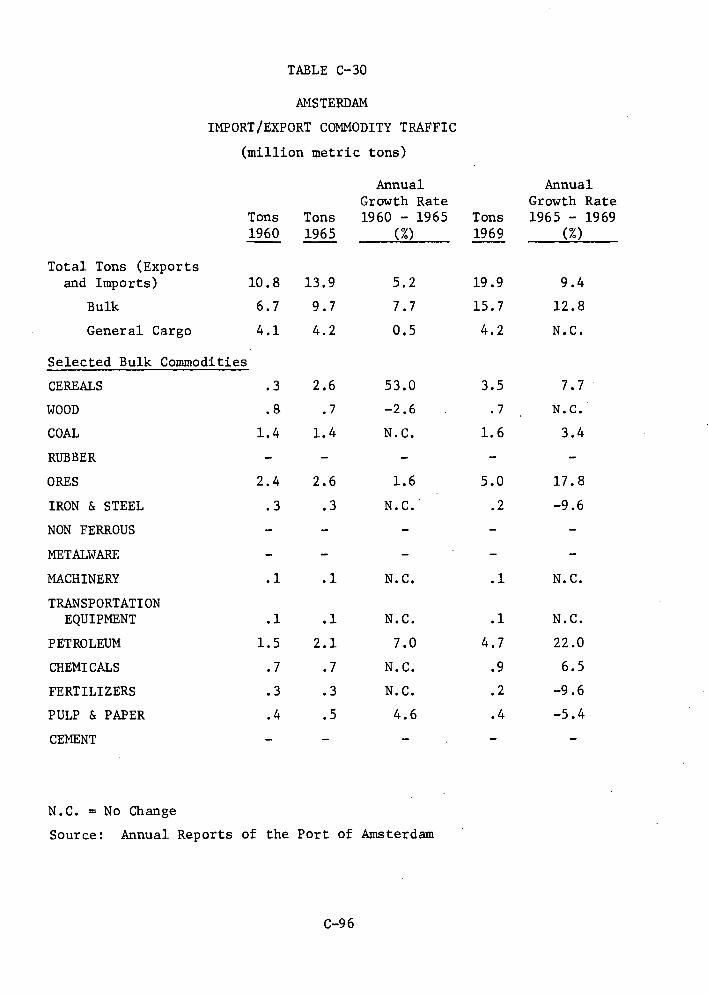
■■■
AM,
TABLE C-30
AMSTERDAM
IMPORT/EXPORT COMMODITY TRAFFIC
(million metric tons)
Annual Annual Growth Rate Growth Rate
Tons Tons 1960 - 1965 Tons 1965 - 1969 1960 1965 (70 1969 (%)
Total Tons (Exports and Imports) 10.8 13.9 5.2 19.9 9.4
Bulk 6.7 9.7 7.7 15.7 12.8
General Cargo 4.1 4.2 0.5 4.2 N.C.
Selected Bulk Commodities
CEREALS .3 2.6 53.0 3.5 7.7
WOOD .8 .7 -2.6 .7 N.C.
COAL 1.4 1.4 N.C. 1.6 3.4
RUBBER - - - - -
ORES 2.4 2.6 1.6 5.0 17.8
IRON & STEEL .3 .3 N.C. .2 -9.6
NON FERROUS - -
METALWARE - -
MACHINERY .1 .1 N.C. .1 N.C.
TRANSPORTATION EQUIPMENT .1 .1 N.C. .1 N.C.
PETROLEUM 1.5 2.1 7.0 4.7 22.0
CHEMICALS .7 .7 N.C. .9 6.5
FERTILIZERS .3 .3 N.C. .2 -9.6
PULP & PAPER .4 .5 4.6 .4 -5.4
CEMENT - _ _
N.C. = No Change
Source: Annual Reports of the Port of Amsterdam
MEW
C-96
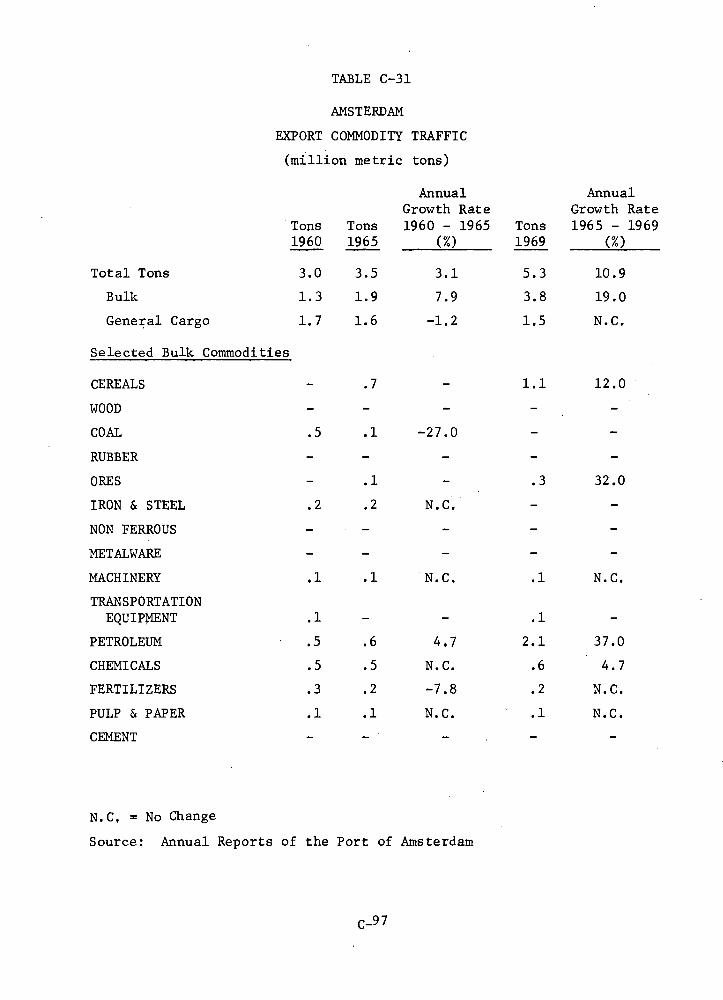
TABLE C-31
AMSTERDAM
EXPORT COMMODITY TRAFFIC
(million metric tons)
Annual Annual Growth Rate Growth Rate
Tons Tons 1960 - 1965 Tons 1965 - 1969 1960 1965 (%) 1969 (%)
Total Tons 3.0 3.5 3.1 5.3 10.9
Bulk 1.3 1.9 7.9 3.8 19.0
General Cargo 1.7 1.6 -1.2 1.5 N.C.
Selected Bulk Commodities
CEREALS - .7 - 1.1 12.0
WOOD - - - -
COAL .5 .1 -27.0 _ _
RUBBER - - - - -
ORES - .1 _ .3 32.0
IRON & STEEL .2 .2 N.C. - -
NON FERROUS - - -
METALWARE
MACHINERY .1 .1 N.C. .1 N.C.
TRANSPORTATION EQUIPMENT .1 - - .1 -
PETROLEUM .5 .6 4.7 2.1 37.0
CHEMICALS .5 .5 N.C. .6 4.7
FERTILIZERS .3 .2 -7.8 .2 N.C.
PULP & PAPER .1 .1 N.C. .1 N.C.
CEMENT _
N.C. = No Change
Source: Annual Reports of the Port of Amsterdam
C-97
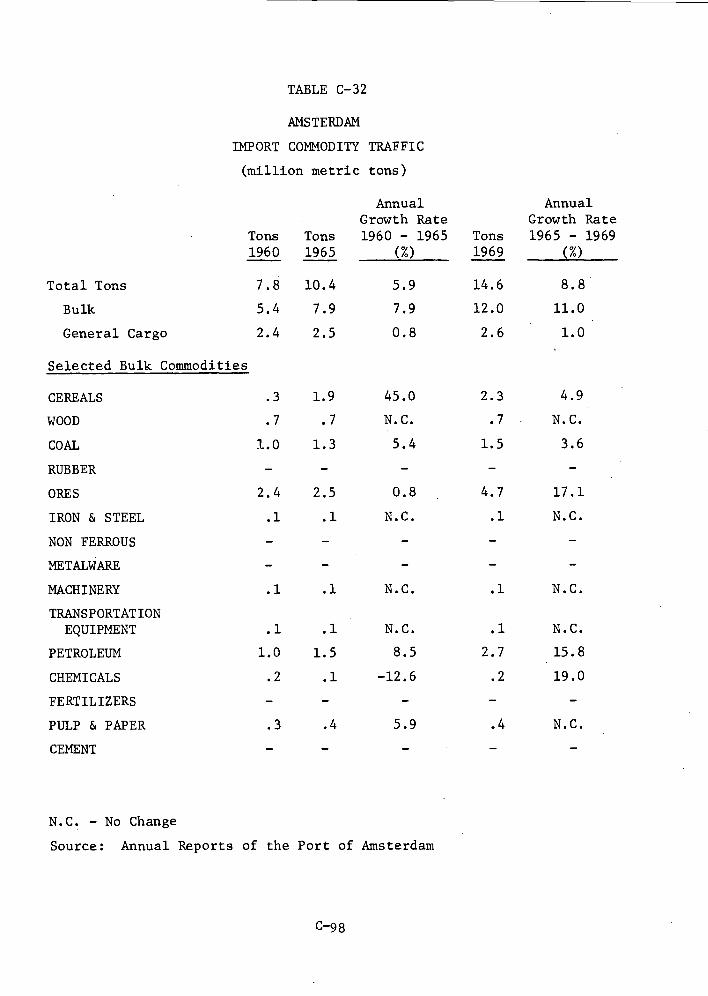
NON FERROUS - -
METALWARE
■•■•
TABLE C-32
AMSTERDAM
IMPORT COMMODITY TRAFFIC
(million metric tons)
Annual Annual Growth Rate Growth Rate
Tons Tons 1960 - 1965 Tons 1965 - 1969 1960 1965 (70 1969 (%)
Total Tons 7.8 10.4 5.9 14.6 8.8
Bulk 5.4 7.9 7.9 12.0 11.0
General Cargo 2.4 2.5 0.8 2.6 1.0
Selected Bulk Commodities
CEREALS .3 1.9 45.0 2.3 4.9
WOOD .7 .7 N.C. .7 N.C.
COAL 1.0 1.3 5.4 1.5 3.6
RUBBER - - - - -
ORES 2.4 2.5 0.8 4.7 17.1
IRON & STEEL .1 .1 N.C. .1 N.C.
MACHINERY .1 .1 N.C. .1 N.C.
TRANSPORTATION EQUIPMENT .1 .1 N.C. .1 N.C.
PETROLEUM 1.0 1.5 8.5 2.7 15.8
CHEMICALS .2 .1 -12.6 .2 19.0
FERTILIZERS _ - _ _
PULP & PAPER .3 .4 5.9 .4 N.C.
CEMENT - - -
N.C. - No Change
Source: Annual Reports of the Port of Amsterdam
C-9 8
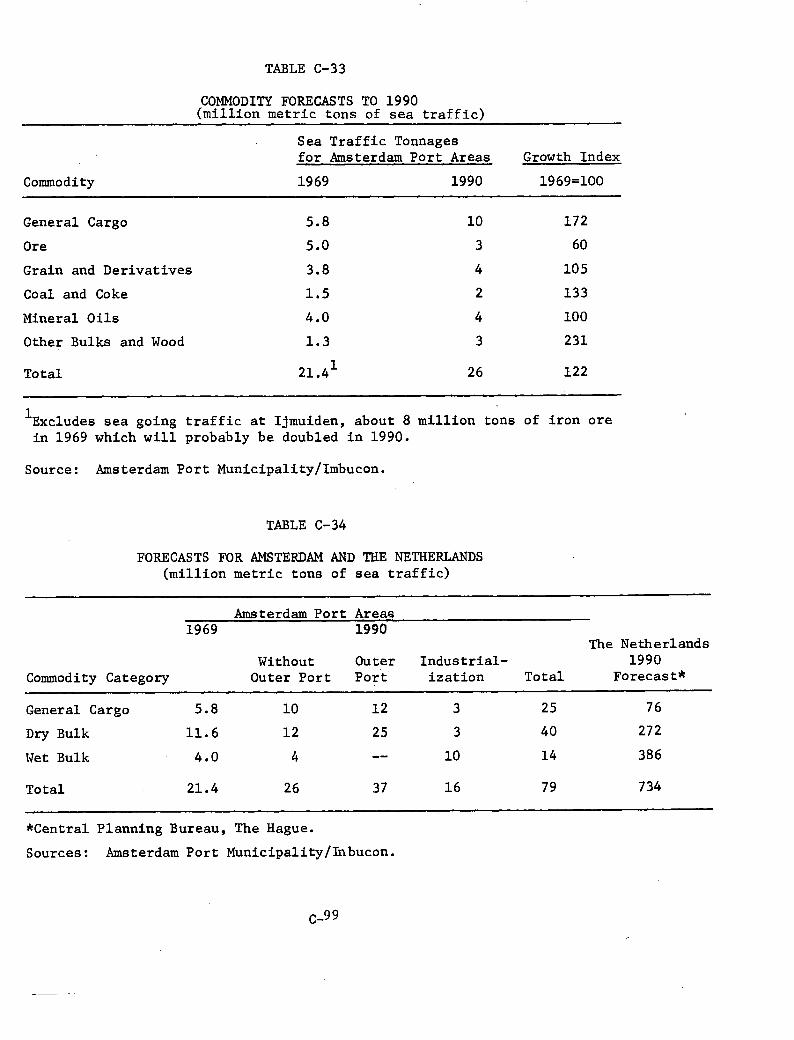
5.8
5.0
3.8
1.5
4.0
1.3
172
60
105
133
100
231
10
3
4
2
4
3
Total 21.4 1 26 122
General Cargo
Dry Bulk
Wet Bulk
5.8 10 12 3
11.6 12 25 3
4.0 4 -- 10
25
40
14
76
272
386
734 79 21.4 26 37 16 Total
TABLE C-33
COMMODITY FORECASTS TO 1990 (million metric tons of sea traffic)
Commodity
Sea Traffic Tonnages for Amsterdam Port Areas Growth Index
1969 1990 1969=100
General Cargo
Ore
Grain and Derivatives
Coal and Coke
Mineral Oils
Other Bulks and Wood
'Excludes sea going in 1969 which will
traffic at Ijmuiden, about 8 million tons of iron ore probably be doubled in 1990.
Source: Amsterdam Port Municipality/Imbucon.
TABLE C-34
FORECASTS FOR AMSTERDAM AND THE NETHERLANDS (million metric tons of sea traffic)
Amsterdam Port Areas 1969 1990
Commodity Category Without Outer Port
Outer Industrial- Port ization Total
The Netherlands 1990
Forecast*
*Central Planning Bureau, The Hague.
Sources: Amsterdam Port Municipality/Inbucon.
C-99
o. Industrialization
One of the major benefits arising from the establishment of an outer
port, along with the continual development of the Amsterdam port areas,
is the effect on industrialization. The effect works in two ways.
First, the existence of a successful deep water port can be expected to
encourage port-based industry to locate in the harbor areas. Second,
given this development, the industrial traffic generated can be handled
by the port.
The industries that locate in harbor areas are also influenced by the
presence of linkages to existing industries, or by those industries
which are likely to locate in the area in the future. The clearest
example is the petroleum industry, which because of the expected
increase in size of oil tankers, was encouraged to locate refining
capacities at those areas of consumption with deep water facilities.
This, coupled with the parallel developments in petrochemicals, has
resulted in mammoth oil and petrochemical complexes being established
at seaports (e.g., Rotterdam and Antwerp). The current master plan
was in fact triggered by the Mobil refinery and its request for 150,000
dwt facilities.
Other likely seaport locational candidates are enterprises within the
industrial groups: metal processing (e.g., iron and steel, aluminum
smelting), food processing (e.g., grain milling, sugar refining) and
processing activities (e.g., timber processing, paper manufacturing).
In regard to port based industry, the developments at the Amsterdam port
areas have been discouraging. Areas on both the north and south banks
of the North Sea Canal have been allocated for industrial development.
Along the south bank about 3200 net acres are available for port-based
industries where the primary requirement is access to water berths.
Already established is a 130,000 bbl/year crude oil refinery, connected
by city and state-owned pipeline to Rotterdam, which has a current, much
underused capacity of 20 million tons per year. Other refiners are strongly
C-100
invited and MURCO is considering a 100,000 bbl/day refinery. The
adjacent land in this region offers opportunities for a range of petro-
chemical industries that would benefit from being sited in the immediate
vicinity of the refinery by being guaranteed supply of raw materials.
Similarly, the established steelworks offers possibilities for the
development of iron and steel finishing and fabricating.
TABLE C-35
DISTRIBUTION OF INDUSTRY BY SECTORS (70
Amsterdam Netherlands
1953 1965 1953 1965
Secondary 40.9 36.2 52.5 52.4
Tertiary 59.1 63.8 47.5 47.6
The status of the secondary sector in Amsterdam is alarming, as shown
in Table C-35 and as confirmed by the slow rate at which land has been
issued to industry; between 1952 and 1967, only 1500 acres were leased
in Amsterdam port areas.
In conclusion, the growth of the secondary sector, specifically seaport
industry, has been insufficient to act as a locational stimulus at
present. The Amsterdam port areas need high-growth industries coupled
with high transport tonnage and rigorous control of pollution effects.
Table C-36 lists selected industrial classifications and provides an
assessment of the industrial characteristics by manufacturing category
as determined by the Amsterdam Port Authority. Each of the classifica-
tions is made up of a number of different industries. Below are
examples of industries for each manufacturing category:
(1) Electrical Equipment: Electric power machines, distributing equipment,
telecommunications apparatus, domestic equipment, medical equipment, etc.
including electronics industry.
(2) Glass and Ceramics: Glassware, glass rods, tubes and plate,
refractory materials, ceramic materials, etc.
C-101
(3) Machinery: Steam generating machinery, agricultural machinery,
metalworking machinery, textile and leather machinery, machine parts,
etc.
(4) Metals -- Iron and Steel: Pig iron, iron and steel ingots, iron
and steel bars, rods, plates, sheets, rail, tubes, castings and forgings,
etc.
(5) Metals -- Non-Ferrous: Aluminum, copper, nickel, and other metal bars,
rods, plates, sheets, strip and tubes, etc.
(6) Oil Refining, Petrochemicals and Other Chemicals: Crude petroleum,
petroleum products, organic chemicals, inorganic chemicals, fertilizers,
chemical products, etc.
(7) Pulp and Paper: Pulp waste, paper waste, chemical wood pulp,
sulphate wood pulp, sulphite wood pulp, etc.
(8) Transport Equipment: Railway vehicles, road motor vehicles, other
road vehicles, ships and boats, etc.
(9) Wood, Lumber and Cork: Pulpwood, sawlogs, and veneer logs, shaped
wood, worked lumber, cork in blocks, plates and sheets, wood manufactures,
etc.
(10) Other Industries: Cereals, cereal preparations, sugar, sugar
preparations, other food preparations, oil-seeds, textile, rubber
manufactures, etc.
The industrial characteristics assessed (relative to land use) in
Table C-36 are labor, utilities (electricity, gas, water and effluent
disposal) and investment. Important generation factors, stemming from
industrialization, are added value and output tonnage; both are presented
as proportional to land allocation and added value is also presented
relative to employment. Output tonnage is particularly relevant to
• port based industrialization.
C-102
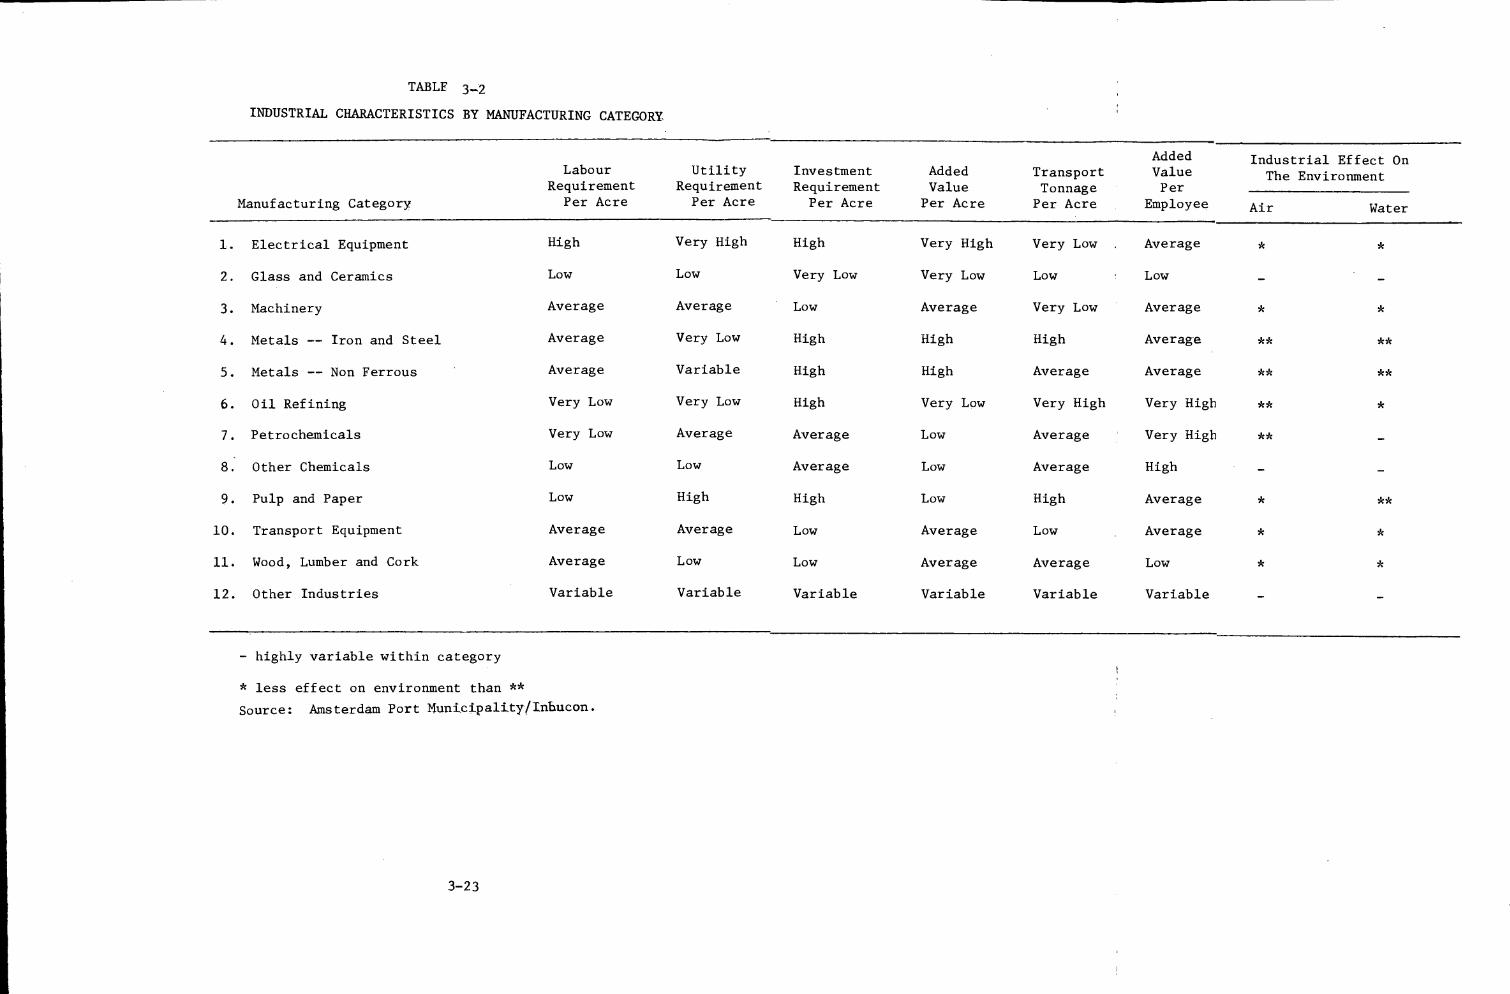
TABLE 3_2
INDUSTRIAL CHARACTERISTICS BY MANUFACTURING CATEGORY
Added Industrial Effect On Labour Utility Investment Added Transport Value The Environment
Requirement Requirement Requirement Value Tonnage Per
Manufacturing Category. Per Acre Per Acre Per Acre Per Acre Per Acre Employee Air Water
1. Electrical Equipment High Very High High Very High Very Low . Average * *
2. Glass and Ceramics Low Low Very Low Very Low Low Low _ ,
3. Machinery Average Average Low Average Very Low Average * *
4. Metals -- Iron and Steel Average Very Low High High High Average ** **
5. Metals -- Non Ferrous Average Variable High High Average Average ** **
6. Oil Refining Very Low Very Low High Very Low Very High Very High ** *
7. Petrochemicals Very Low Average Average Low Average Very High ** _
8. Other Chemicals Low Low Average Low Average High _
9. Pulp and Paper Low High High Low High Average * **
10. Transport Equipment Average Average Low Average Low Average * *
11. Wood, Lumber and Cork Average Low Low Average Average Low * *
12. Other Industries Variable Variable Variable Variable Variable Variable _ _
- highly variable within category
* less effect on environment than **
Source: Amsterdam Port Municipality/Inhucon.
p. Cost of Outer Port
It is Amsterdam's position that port expansion in the Amsterdam port
system should be implemented if port traffic is to be maintained in The
Netherlands. A possible method of providing the required facilities for
say, 100,000 to 150,000 dwt ships would be to construct a new lock
system at Ijmuiden and to deepen the North Sea Canal. The cost, however,
would be prohibitive. The only practicable alternative is the building
of an outer port.
(1) Investment Costs. An outer port with 250 to 500 acres of dry area
is under consideration. The proposed outer port is located to the south
of the southern harbor entrance mole and would be entered through a
gap in this mole. Land on such an outer port will be costly. It must
therefore be reserved for transportation activities and in particular
to those activities that would not take place at all, or at least not
without a heavy financial penalty, elsewhere.
The larger outer port (i.e., the 500-acre alternative) has the advantage
of incurring similar costs for an approach channel and for hinterland
transport links, and relatively low extra costs for mole construction,
for land and for water basins. The overall cost per acre is therefore
reduced significantly.
Cost estimates are listed below for a possible 3-phase program of work
for the 500-acre outer port;
Phase I: construction of a 250-acre dry area outer port with an
approach channel of about 60 feet.
Phase 2: an increase in the dry area from 250 acres to 370 acres
and a deepening of the approach channel from 60 feet to 63
feet.
Phase 3: a further increase in the dry area from 370 acres to 500 acres.
The costs of each phase are presented in Table C-37 classified by source
of finance (M: Municipality, S: State). This division is based on
the central Government's role in previous investments of this nature,
C-104
in which two-thirds of channel and sea wall costs have been met by the
central Government. The remaining investment is allocated to the
Municipality.
The overall cost of the 500-acre project is $74 million. After exclusion
of channel costs and the expected State contribution, the land requires
a Municipal investment of $30 million, or approximately $1.50 per square
foot. This amount compares with an estimated $1.30 per square foot for
the Maasvlakte I development at Rotterdam.
(2) Recurring Costs. Once the outer port is established, there will be
a number of recurring costs (Table C-38).
q. Financial Cost Benefit Analyses of Alternative Plans
In Amsterdam, a financial cost/benefit analysis concerning, the proposed
outer port' was undertaken, with the costs and benefits of the outer
port allocated between the Municipality and the State.
The Municipality would acquire revenue both from harbor dues and from
land leases. The State would benefit from increased 'added value'
resulting from the handling of transit traffic which would not otherwise
pass through The Netherlands.
(1) Municipality. Municipal investments required were for a proportion
of the costs related to land, water basins, infrastructure and channel,
together with the recurring costs for land maintenance, additional Port
Management overheads and marketing of the outer port services. Costs
not included were those related to the construction and operation of the
port handling terminals. These costs were not relevant, because they
were met by private enterprise as a commercial and profitable undertaking
not directly involving the Municipality.
An exception was the cost of quay development. Whether these costs were
to be met by private enterprise or by the Municipality (and then leased
C-10 5
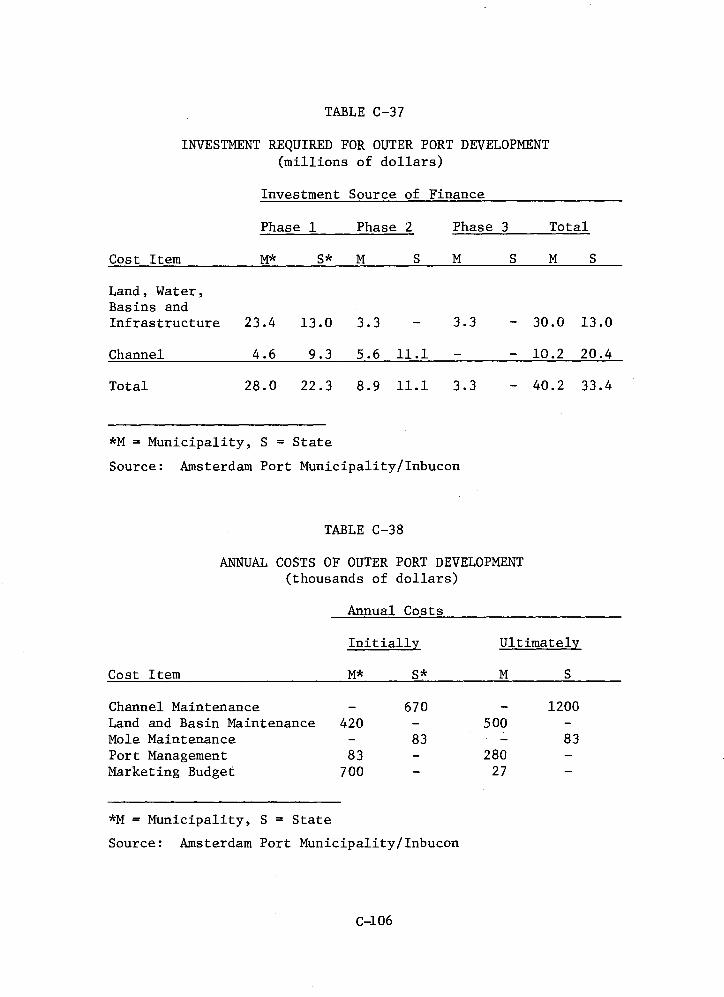
Cost Item M* S*
TABLE C-37
INVESTMENT REQUIRED FOR OUTER PORT DEVELOPMENT (millions of dollars)
Investment Source of Finance
Phase 1 Phase 2 Phase 3 Total
Cost Item M* S* M S M S M S
Land, Water, Basins and Infrastructure 23.4 13.0 3.3 - 3.3 - 30.0 13.0
Channel 4.6 9.3 5.6 11.1 - - 10.2 20.4
Total 28.0 22.3 8.9 11.1 3.3 - 40.2 33.4
*M = Municipality, S = State
Source: Amsterdam Port Municipality/Inbucon
TABLE C-38
ANNUAL COSTS OF OUTER PORT DEVELOPMENT (thousands of dollars)
Annual Costs
Initially Ultimately
Channel Maintenance - 670 - 1200 Land and Basin Maintenance 420 - 500 - Mole Maintenance - 83 _ 83 Port Management 83 - 280 - Marketing Budget 700 - 27 -
*M = Municipality, S = State
Source: Amsterdam Port Municipality/Inbucon
C-106
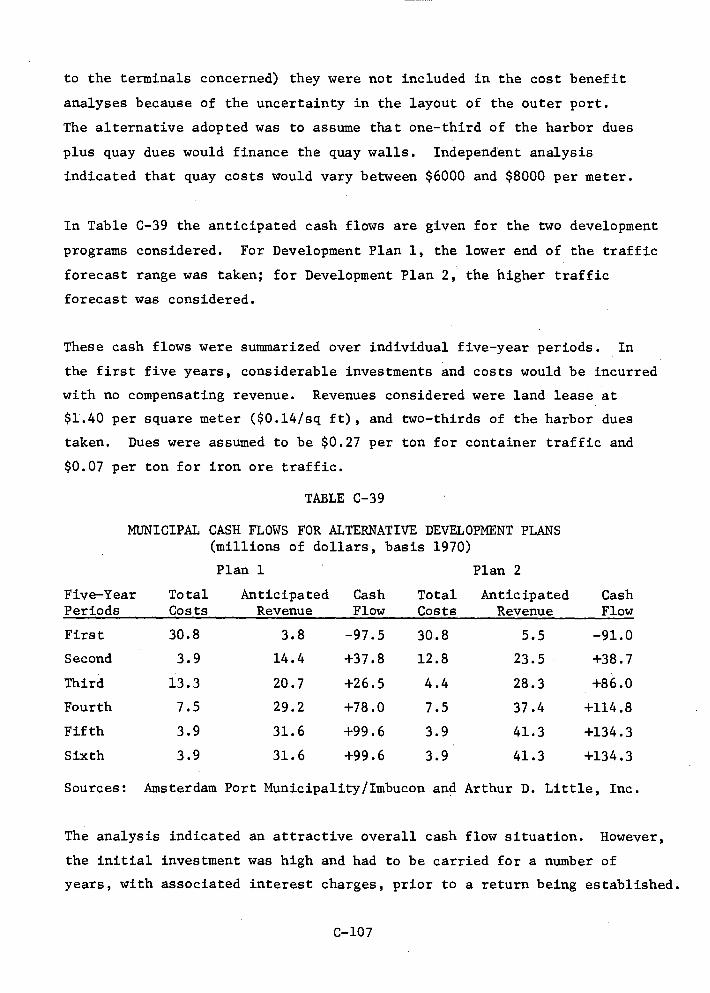
Plan 2
Total Anticipated Cash Costs Revenue Flow
30.8 5.5 -91.0
23.5 +38.7
28.3 +86.0
37.4 +114.8
41.3 +134.3
41.3 +134.3
12.8
4.4
7.5
3.9
3.9
to the terminals concerned) they were not included in the cost benefit
analyses because of the uncertainty in the layout of the outer port.
The alternative adopted was to assume that one-third of the harbor dues
plus quay dues would finance the quay walls. Independent analysis
indicated that quay costs would vary between $6000 and $8000 per meter.
In Table C-39 the anticipated cash flows are given for the two development
programs considered. For Development Plan 1, the lower end of the traffic
forecast range was taken; for Development Plan 2, the higher traffic
forecast was considered.
These cash flows were summarized over individual five-year periods. In
the first five years, considerable investments and costs would be incurred
with no compensating revenue. Revenues considered were land lease at
$1.40 per square meter ($0.14/sq ft), and two-thirds of the harbor dues
taken. Dues were assumed to be $0.27 per ton for container traffic and
$0.07 per ton for iron ore traffic.
TABLE C-39
MUNICIPAL CASH FLOWS FOR ALTERNATIVE DEVELOPMENT PLANS (millions of dollars, basis 1970)
Plan 1
Five-Year Total Anticipated Cash Periods Costs Revenue Flow
First 30.8 3.8 -97.5
Second 3.9 14.4 +37.8
Third 13.3 20.7 +26.5
Fourth 7.5 29.2 +78.0
Fifth 3.9 31.6 +99.6
Sixth 3.9 31.6 +99.6
Sources: Amsterdam Port Municipality/Imbucon and Arthur D. Little, Inc.
The analysis indicated an attractive overall cash flow situation. However,
the initial investment was high and had to be carried for a number of
years, with associated interest charges, prior to a return being established.
C-107
Consequently, a series of discounted cash flows was calculated.
• By this means, each alternative was tested, first to determine whether
the investment return was adequate, second, to test how sensitive the
results were to changes in assumption. A period of 30 years was
considered for each calculation and at the end of this period, a
conservative assumption was made that the outer part had no residual
or depreciated value. After the first period of 20 years, the further
conservative assumption was made that traffic volume would not increase.
On the assumptions of land leases at $0.14 per square foot for only the
land leased by the container and the iron ore terminals, and harbor dues
of $0.27 per container ton and $0.02 per iron ore ton, the percentage
discounted cash flow returns were as follows:
Container Traffic
Low High Forecast Forecast
Ore Traffic
Low Forecast 8.1 10.1
High Forecast 9.1
Source: Amsterdam Port Municipality/Imbucon.
As can be seen, the rates or return on investment are high enough to
allow prevailing European interest rates (7-9%) to be acceptable.
Under the assumption that harbor dues would be 25% less, the percentage
discounted cash flow returns were as follows:
Container Traffic
Low • High Forecast Forecast
10.9
Ore Traffic
Low Forecast 6.8 8.3
High Forecast 8.0 8.4
Source: Amsterdam Port Municipality/Imbucon.
C-108
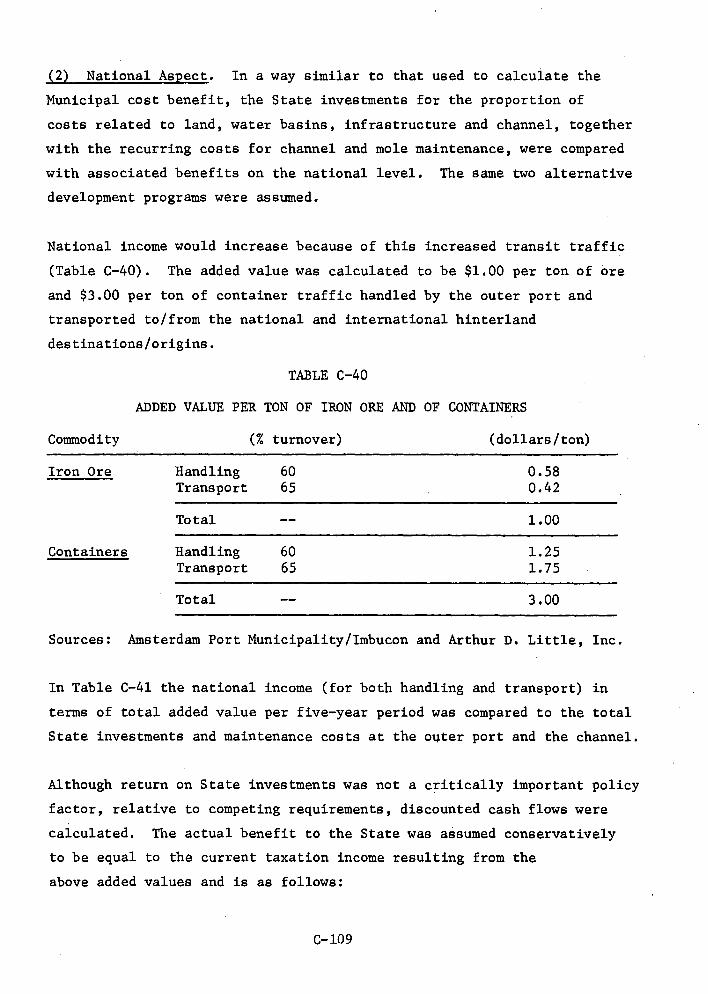
(2) National Aspect. In a way similar to that used to calculate the
Municipal cost benefit, the State investments for the proportion of
costs related to land, water basins, infrastructure and channel, together
with the recurring costs for channel and mole maintenance, were compared
with associated benefits on the national level. The same two alternative
development programs were assumed.
National income would increase because of this increased transit traffic
(Table C-40). The added value was calculated to be $1.00 per ton of ore
and $3.00 per ton of container traffic handled by the outer port and
transported to/from the national and international hinterland
destinations/origins.
Commodity
TABLE C-40
ADDED VALUE PER TON OF IRON ORE AND OF CONTAINERS
(% turnover) (dollars/ton)
Iron Ore Handling 60 0.58 Transport 65 0.42
Total 1.00
Containers Handling 60 1.25 Transport 65 1.75
Total 3.00
Sources: Amsterdam Port Municipality/Imbucon and Arthur D. Little, Inc.
In Table C-41 the national income (for both handling and transport) in
terms of total added value per five-year period was compared to the total
State investments and maintenance costs at the outer port and the channel.
Although return on State investments was not a critically important policy
factor, relative to competing requirements, discounted cash flows were
calculated. The actual benefit to the State was assumed conservatively
to be equal to the current taxation income resulting from the
above added values and is as follows:
C-109
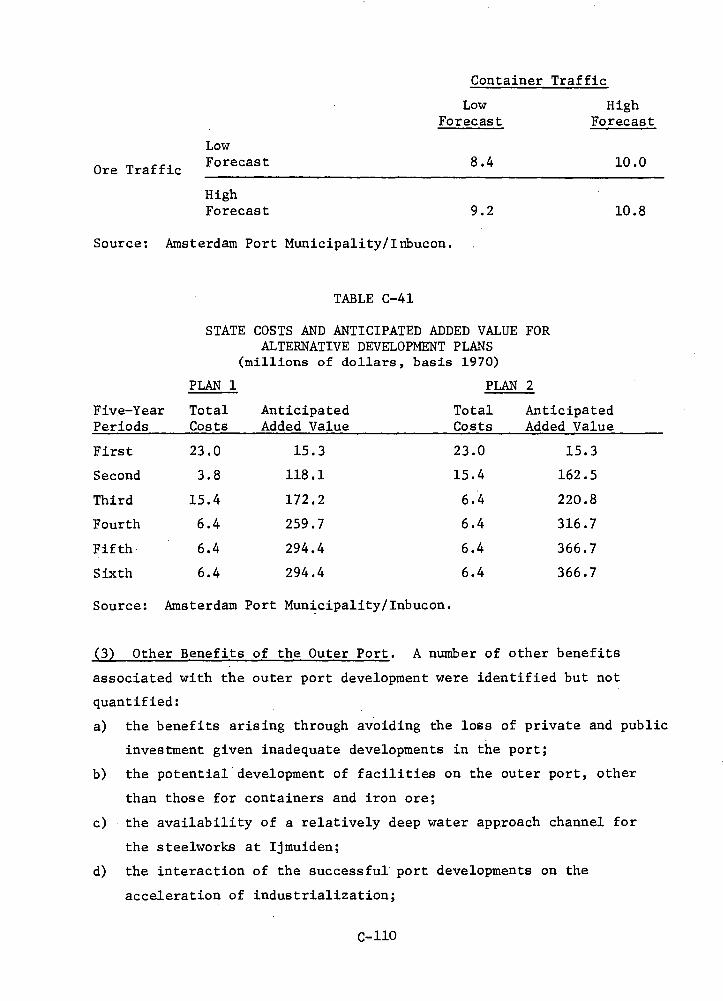
Container Traffic
Low High Forecast Forecast
Ore Traffic
Low Forecast 8.4 10.0
High Forecast 9.2 10.8
Source: Amsterdam Port Municipality/Inbucon.
TABLE C-41
STATE COSTS AND ANTICIPATED ADDED VALUE FOR ALTERNATIVE DEVELOPMENT PLANS
(millions of dollars, basis 1970)
PLAN 1 PLAN 2
Five-Year Total Anticipated Total Anticipated Periods Costs Added Value Costs Added Value
First 23.0 15.3 23.0 15.3
Second 3.8 118.1 15.4 162.5
Third 15.4 172.2 6.4 220.8
Fourth 6.4 259.7 6.4 316.7
Fifth 6.4 294.4 6.4 366.7
Sixth 6.4 294.4 6.4 366.7
Source: Amsterdam Port Municipality/Inbucon.
(3) Other Benefits of the Outer Port. A number of other benefits
associated with the outer port development were identified but not
quantified:
a) the benefits arising through avoiding the loss of private and public
investment given inadequate developments in the port;
b) the potential development of facilities on the outer port, other
than those for containers and iron ore;
c) the availability of a relatively deep water approach channel for
the steelworks at Ijmuiden;
d) the interaction of the successful port developments on the
acceleration of industrialization;
C-1 10
e) the benefits to other established port users, given the potential
growth of port activity;
f) the stimulative effect on commercial activities in neighboring
areas around Amsterdam, elsewhere in the region, and in The
Netherlands;
avoiding the imbalance of port developments in The Netherlands and
the risks of diseconomy of scale arising in some areas and
effective subsidies necessary in other areas;
h) the total effect of the different developments leading to the
consolidation of the Amsterdam port areas as an international multi-
purpose port.
C.2.4 ENGINEERING FACTORS
a. Site Selection
Once the original site of the city was established 1000 years ago, the
port, through geologic necessity, expanded down the North Sea Canal
toward the North Sea. When progressing or extending seaward, the port
has about 5 nautical miles of waterfront property on each side of river
(total 10 nautical miles) in which to expand. From a cost and technical
standpoint an outer port of Ijmuiden appears to be the optimum in port
development. Such a facility would provide rapid turnaround for container
traffic and cheaper accommodation of deep-draft ore carriers.
b. Configurations
Within the city of Amsterdam there are numerous docks and piers on both
the north and south bank of the canal, most of which formed the original
port facilities. The newer docking facilities are southwest of the city
• on the south bank of the canal.
A Mobil Oil refinery docking facility at the "America" and "Australia"
harbors has been operational since June 1968. There is one jetty
designed to handle tankers of 44'6" draft. The dock has an 8" and a 12"
pipeline, and an additional jetty that can accommodate three inland
barges. Some 4 million tons of crude oil a year is pipelined to
C-1 11
Amsterdam from the Mobil Terminal at Rotterdam's Europort. The oil is
received at rates up to 27,000 barrels per hour. The refinery produces
gasolines, kerosines, L.P.G. and various grades of fuel oils that are
shipped from the port in tankers, by inland barges, and by rail. The
onloading pumping rate ranges between 2,500 and 12,000 barrels per hour
depending on the grade of the petroleum product.
The bulk storage capacity at the refinery is 850,000 barrels supported
by a 1.5 million barrel storage capacity in Rotterdam.
The Amsterdam Tank Storage Company, "Amatex," an independent tank
storage plant at Jan van Riebeeckhavey, has bulk storage facilities
for mineral oil, edible oil, creosote, molasses, chemicals, and wine.
The liquid storage facilities consist of 260 tanks with a total capacity
of 3.15 million barrels. The five jetties have water depths ranging
from 31 to 41 feet. Receiving capacity ranges from 400 to 1,200 tons
per hour, and the maximum loading rate is 1,000 tons per hour.
Cosmos Tank N.V. at Usselinexhaven has a jetty with 42-ft water depth
and 67 liquid storage tanks with a total storage capacity of 1.35
million barrels.
Cindu and DeHumber, two private oil companies at Petroleumhaven, have
two 33-ft jetties and 23 tanks with 630,000-barrel total storage
capacity.
Smid & Hollander, an asphalt refinery at Southhaven, has a 36-ft jetty
and 32 storage tanks with 500,000 barrels of crude oil and asphalt
storage.
BP in Usselinexhaven has a 42-ft jetty and 28 hydrocarbon storage tanks
with 800,000-barrel capacity.
Shell has two tank installations with two discharge and bunkering 32-ft
jetties.
C-1 1 2
Pankhoed-Tankinstallation has a 20-ft seagoing tanker jetty and 26 tanks
with a 70,000-barrel wine, alcohol and fruit juice capacity.
Albatros Superfosfaatfabrieken N.V. is a fertilizer plant situated on
the North Sea Canal. The plant has a 1000-ft long jetty, with 32-ft
water depth accommodating 25,000 dwt vessels; it can handle 6,500 tons of
phosphate rock daily.
The N.V. Houtveem facility, also on the Canal, was built especially for
the discharging, trans-shipment, and storage of tropical logs, wood
pulp, and packaged timber. A 1000-ft long dock with 33 feet of water
and a 500-ft long lighter quay with 13 feet water depth are located on
the property.
The N.V. Container Terminal "Amsterdam" is situated on the west bank of
the canal in Westhaven, 10 miles from the open sea and 8 miles from the
locks of Ijmuiden. The present permissible draft is 45 feet.
At the mouth of the canal, on the north bank, the Royal Netherlands
Blast Furnace and Steelworks operates its own port which has a 51.5-ft
canal-controlled dock to receive ore carriers of 100,000 dwt on a
favorable tide.
c. Channel and Basin
The channel starts at about 9000 feet from the Dutch coastline and the width
of the channel at the harbor entrance is 1340 feet. The water depth at
the harbor mouth varies from 16 m (52'6") to 15 m (493") below mean sea
level between high and low tides (NAP) near the biggest sea lock. The
maximum draft allowed into the port under normal circumstances is 31.1 m
(43') salt water load line (Plimsoll). By special permission, subject
to one week's notice, this draft may be exceeded. The largest vessels
to enter the Port of Amsterdam were as follows:
• "Aegier," 81,156 dwt, 45-ft draft (salt water) loaded with
81,407 tons of ore;
C-113
• "Skaufast," 100,700 dwt, 39-ft draft (salt water) loaded
with 80,250 tons soya beans;
• "Golar Sanko," 80,800 dwt, fully loaded with iron ore
(41.67-ft draft).
There are three sea locks: one each for small, medium sized, and big
vessels.
The biggest lock ("Hordersluis") has a length of 400 m (1312 ft), a
width of 50 m (164 ft), and a depth of 15 m NAP (49 ft 3 in). This
depth is controlled, however, by the water level of the North Sea Canal
--14.5 m (47 ft 7 in) water depth below NAP. The distance from the
lock to the North Sea is 5 km (2.7 nautical miles).
The North Sea Canal has a bottom width of 135 m (443 ft). This will
eventually be 170 m (557 ft). The width at water surface is 235 m
(771 ft); a width increase to 270 m (886 ft) is in progress. The
original dimensions of the canal at Amsterdam, 50-m (162.5 ft) bottom
width and 4.2 m (14 ft) water depth, gradually decrease at Tiel (canal
terminus) to 41 m (135 ft) bottom width, and 3.2 to 7.75 m (10 to 25 ft),
depending on the water level of the River Rhine. The locks at Teal
measure 360 x 18 m (1181 ft x 59 ft).
The following improvements are underway to increase the Canal's capa-
bilities:
Amsterdam Tiel
Bottom Width 109 m (357 ft) 115 m (377 ft)
Water Level Width 130 m (427 ft) 155 m (509 ft)
Depth 5 m ( 16 ft) 4.3 m to 8.85 m (14 ft to 29 ft)
New locks will be built at Tiel with a dimension of 275 x 24 in (853 ft
x 79 ft). (All of the locks are air ballasted to facilitate raising
for repair.)
C-114
The navigational aids consist of lighted buoys and fixed lighted beacons
on the breakwater's locks and canal banks.
A VHF radio telephone communication system is available between incoming
and outgoing ships, the commanding post of the locks and the Coast
Station "Pilot Ijmuiden". The government patrol boats are also equipped
with VHF installations. ETA messages on VHF channel 12 are requested
two hours before arrival to arrange for a pilot, lock and berth.
A harbor radar can be used if visibility is poor (under 3000 ft) to guide
incoming ships day or night. For telecommunication, a portable radio
is provided by the pilot.
d. Docking
In the harbor of Amsterdam, the maximum speed is 150 m (488 ft) per
minute for vessels with a draft of 6.6 feet or more, 200 m (650 ft) per
minute for those with a draft of 5-6.5 feet, 250 m (812 ft) per minute
for those with a draft of less than 5 feet. Ships with a draft of 2.7
feet or more must fly the blue peter during daylight and display 3
vertical red lights at night.
Pilotage in the estuary, canals, and harbor is a state function and the
use of pilots is advised, but not compulsory. Within recent months a
helicopter transportation service for pilots was made available to
ships that have adequate space for deck landings.
Harbor tugs to assist vessels in the North Sea Canal and in the dock
area are stationed at Ijmuiden at the mouth of the canal. There appear
to be no fixed rules on tug requirements or on the number of mooring
lines used in the harbor.
e. Cargo Handling
The following equipment is a 1969 listing of the main cargo handling
facilities in Amsterdam:
C-115
Water Area
Length of Quays
General Cargo Sheds
Warehouses
Timber sheds
Cold Storage Warehouses
Open Storage (ores, coal & timber)
Tank Capacity (wines, mineral oils, chemicals)
Grain Silos
1037 hectares
24.1 km
3,500,000 sq.ft.
2,900,000 sq.ft.
1,600,000 sq.ft.
2,366,000 cu.ft.
12,000,000 sq.ft.
42,400,000 cu.ft.
103,000 tons
Grain Elevators: Floating Quay
Cranes and Gantries
f. Environmental Protection
The municipal laws for pollution control are admitted to be weak. The
past spill data is quite extensive. One power plant spilled 20,000
tons of crude oil when a bulk storage tank ruptured and demolished the
earthen retaining dike to spill the oil in an area designated as a bird
sanctuary.
A pipeline corroded at its support and leaked oil into the canal.
In 1969 a flexible hoseline ruptured while hydrocarbons were being
transferred from the M/V "Diana" to the Mobil Refinery. In addition to
ecological and environmental damage, this spill resulted in fire and
explosions which killed 10 persons.
The port operates floating tank cleaning vessels of limited capacity. A
privately operated shore-based tank cleaning company can accommodate tankers
of up to 820 ft. with a 30-ft. draft. The separator at this facility has
a capacity of 1,000 tons per hour and treatment tanks with 8,000 ton cap-
acity. The harbor rules forbid the discharge of ashes, dirt, or waste oil
inside the territorial waters. A barge for the removal of pollutants is
available upon application to the harbor-master's office.
2 4
596
C-116
Present port maintenance--exclusive of work undertaken by the industrial
firms--involving the maintenance of sheds, roads, quay walls, pavements,
dredging, crane, crane tracks, buoys, etc. is as follows:
MM Guilders MM$
1968 3 1.07 1969 3 1.07 1970 3.8 1.35 1971 4.3 1.54
Of the above costing, the dredging budget for 1971 has been established
at $400,000, or 26% of the total maintenance budget.
At the moment, the port is in the last phases of constructing a 3750-
acre - area for industrial plant sites midway between Amsterdam and the
North Sea Locks. Another area, across the canal, amounting to about
2500 acres, is scheduled for development when the work on the south side
of the canal is finished.
h. Crucial Problems and Lessons
Port expansion is restricted by the concerted effort to develop Rotterdam
as the largest port in the world. Unless an offshore port is approved,
financed, and built, the port cannot meet the demands of the shipping in-
dustry. The port administrators consider that access for 180,000 dwt
ships is vital to the port's future.
The port has quay settling problems and must construct quay walls with
concrete capped sheet piles, with dockside crane tracks and a railroad
system being installed on the capped piles. The dock surface consists of
6 ft. x 6 ft. concrete slabs that can easily be removed and replaced
so settled areas can be filled with sand.
C-117
C.2.5 ENVIRONMENTAL IMPACT
a. Environmental Management Efforts
As in Rotterdam and most ports visited, concern over the physical envi-
ronment--indeed even detailed planning regarding the effects of intensive
industrialization on social structures--has been given short shrift in
comparison to developing a purely economic program rationale for port
expansion and development.
One outgrowth of this perceived lack of concern is the Kabouter, a re-
cently formed organization in Amsterdam. Its main concern is the reduction
of harbor pollution and its stated goals include the banning of heavy
industry near cities, the alleviation of the acute housing shortage in
Amsterdam, and a more effective program against excessive drug avail-
ability and usage. Members of the Kabouter organization have run for
public office and five have won seats on the Amsterdam city council; the
organization claims to now have the fourth largest political organization
in the city. Perhaps more than any other event, the growing influence
of this organization seems to have recently stimulated municipal and
provincial officials to include in their planning programs more specific
and detailed attention to environmental and sociological matters.
As in Rotterdam, the Hinderwet constitutes the basic framework within
which pollution control and prevention efforts are carried out; thus far,
these efforts have been devoted primarily to air pollution control
(especially particulates and SO 2 ). Unless the Ijmond, Amsterdam analog
to the Rijnmond is soon set up formally, it is reasonable to expect that
as a result of the new water and air pollution control laws passed in
December 1970, the North Holland Provincial Government will play a
proportionately larger and more important role in future pollution
abatement programs. The Ijmond covers the townships of Amsterdam,
Zaandam, Haarlem, Bevorwijk and Ijmuden, now in loose confederation.
b. Current and Potential Problems
(1) Water. Visual inspection and discussions with personnel in the
C418
Amsterdam Port Authority indicate without question that the water in the
Amsterdam harbor is polluted. Aside from the discharge of raw or parti-
ally treated industrial and municipal waste water into the harbor and
North Sea Canal waters, a major contributor to the build-up of pollution
is the fact that Amsterdam is a locked port with limited drainage.
Furthermore, raw sewage is discharged directly into the 50 miles of
municipal canals that lace the city; at night, locks are opened which
permit these canals--essentially fresh water based--to drain into
Amsterdam Harbor.
A water analysis for the main harbor area of Amsterdam
Table C-42. Several comments may be made regarding this analysis. First,
the water is obviously saline (2000 mg/liter) because of the influx of
sea water through the Ijmuiden Lock system when these locks are open to
permit vessel passage. It has been estimated that 100 kilograms (220
pounds) of common salt flow into the North Sea Canal per second when
the lock gates are open. Reduction of salinity in the North Sea Canal--
or its continued maintenance at a low level--is of the utmost importance
because of the possibility of contaminating the fresh water canals, which
are tributary to the Canal, and also because of lateral migration of salt
water through the dike system, to contaminate adjoining farm land. For
this reason, the North Sea locks have been fitted with "bubble screens,"
which have approximately halved the influx of salt water.
The considerable amount of suspended matter (3500 mg/liter) in the harbor
water is not necessarily a positive indicator of water pollution per se.
A large percentage of this material may be bottom sediments placed in
suspension by the action of passing vessels. Furthermore, the compara-
tively low fi e-day BOD (4 mg/liter) suggests that the suspended matter
is probably not sewage. Nevertheless, because of the high turbidity of
the water, it is extremely unlikely that a fish population of any
significance and quality could be supported, despite the high oxygen
content of the water (8 mg/liter) which approaches saturation for fresh
water and is probably close to saturation for brackish water of this type.
C- 119
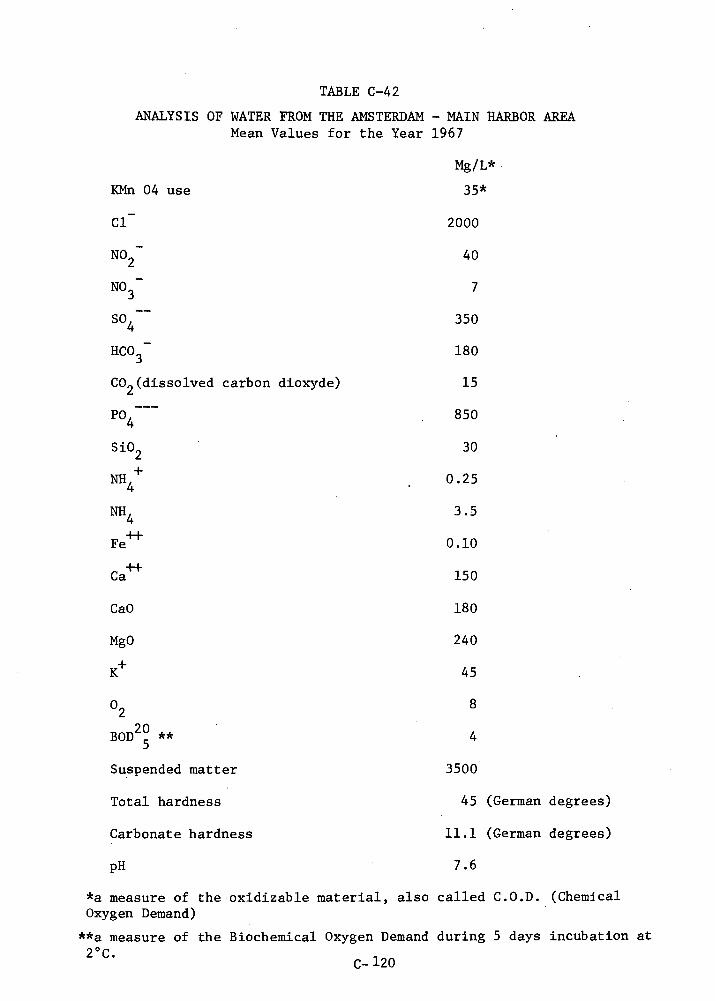
pH 7.6
TABLE C-42
ANALYSIS OF WATER FROM THE AMSTERDAM - MAIN HARBOR AREA Mean Values for the Year 1967
Mg /L*
KMn 04 use 35*
Cl- 2000
NO2 40
NO3 7
-- SO4 350
HCO3 180
CO2 (dissolved carbon dioxyde) 15
--- PO
4 850
SiO2 30
NH4
. 0.25
NH4 3.5
Fe++
0.10
Ca++
150
CaO 180
MgO 240
K+
45
02
BOD20
** 4 5
Suspended matter 3500
Total hardness 45 (German degrees)
Carbonate hardness 11.1 (German degrees)
*a measure of the oxidizable material, also called C.O.D. (Chemical Oxygen Demand)
**a measure of the Biochemical Oxygen Demand during 5 days incubation at 2 ° C.
C-120
Nitrate and nitrite levels (calculated at approximately 14 mg/liter as
N), phosphate content, and ammonia content, indicate that biologically
active wastes are present in significant quantities in the North Sea
Canal.
Finally, the ratio between potassium-manganese and BOD of approximately
nine to one suggests a relatively high concentration of inorganic materials
usually indicative of a high degree of pollution by industrial effluents
or nonbiodegradable detergents.
The organic and inorganic pollutants discharged into the canal tend to
accumulate because there is no tidal flushing of the canal other than
when the locks are open or when non-saline water (fresh or polluted) is
allowed to enter the canal through one of the tributary locks. In an
attempt to control the situation, Amsterdam periodically pumps city canal
water through the canal and harbor and into the North Sea through sluices
at the lock entrance. No recent data was available on water quality.
As far as we were able to determine, there have been only two notable
spills in Amsterdam Harbor (a pipeline leak and a hose rupture which killed
10 persons) but small spills and intentional or accidental discharges
of dirty ballast are common. Fines are levied against offenders, but only
if they are caught in the act and even then the fines are low--only
about 100 guilders (about $28) per offense. Major oil companies have
ballast water holding tanks and can also accommodate bilge water. Most
dumping in the harbor or North Sea Canal is limited to coastal barges.
No skimmer or vacuum craft are in the area, but the only oil company--
Mobil--is equipped with oil containment booms--about 300 feet, presumably
enough to close off its own dock in the event of a small spill.
During rainy weather, run-off from open storage piles of dry bulk cargo
(e.g., fertilizers, ores, and coal) is ordinarily allowed to run directly
into the harbor.
C-121
In summary, our investigations indicate the definite awareness of a
water pollution problem within the Amsterdam Harbor, but aside from the
potential threat of major spills of oil or hazardous materials and salt
water intrusion, water pollution is of relatively minor concern.
As in Rotterdam, there have been no biological base-line studies either
in the North Sea Canal itself or along the coast where the canal empties
into the North Sea. Fishing activity is concentrated much further north,
and there appears to be little concern over possible effects of discharg-
ing contaminatedwater and allowing this water to be carried northward
along the coast into the Waddenzee area.
(2) Hazardous Cargoes. Other than requiring the handling of explosives
in an isolated spot in the North Sea Canal, hazardous materials (e.g.,
petroleum products, other inflammables, or highly toxic substances)
ordinarily are not separated. It was generally agreed that some means
of isolating these cargoes would be desirable, but given the already
accomplished development of Amsterdam Harbor and the intermingling of
plants--as in other harbors--this undertaking would be extremely diffi-
cult. The problem could be handled more easily if a "grass roots" harbor
were built.
(3) Air. In contrast to Rotterdam, Amsterdam is more of a dry cargo
port with only one refinery, and as such has not experienced the rapid
growth of petroleum-based industry its southern neighbor has. Conse-
quently, in the Amsterdam area itself, air pollution has not been judged
to be as serious a problem as in Rotterdam; nevertheless, an SO 2 moni-
toring system, similar to that used by the Rijnmond, is expected to be
installed within one or two years. It will be focussed primarily on
the western portions of the North Sea Canal and the vicinity of West-
Haven and Amerika-Haven, which have the heaviest concentrations of
petroleum-based industry.
The principal contributor to air pollution in the entire region is
C- J22
Hoogovens, the Royal Netherlands blast furnace and steel works, which
operates a seven-million-ton-per-year steel plant in Velsen, immediately
seaward of the North Sea Locks. Hoogovens originally wished to locate
in Rotterdam but went instead to Amsterdam because of emission standards
set by the Rotterdam Hinderwet. Considerable quantities of SO 2 are
liberated in the coking operations, and particulate emissions are also
significant. Because of the essentially prevailing southerly winds, the
communities of Velsen and Beverwijk are often adversely affected.
As previously stated, there is as yet no Rijnmond-type authority in
Amsterdam; the Ijnmond is the nearest approximately to Rijnmond but does
not yet have the authority of the latter. As yet no records have been
made concerning the extent of air pollution in Amsterdam to the degree
that has been carried out in Rotterdam.
(4) Land and Solid Waste. The disposal of both industrial and municipal
solid wastes in Amsterdam is generally unsatisfactory. The city's rela-
tively new incinerator is used for domestic waste combustion and can also
accommodate certain types of industrial solid wastes; however, the unit
is too small (70 tons per day) to meet the need. Industrial solid wastes
are generally burned in the open on a spit of land just east of the town.
This area once was used not only by the town itself, but by Germans and
Belgians who barged in solid wastes; this latter practice has been stopped.
Nevertheless, the situation continues to be unattractive and officials
are concerned that no action has yet been taken.
Harbor rules forbid the discharge of ashes, dirt, waste oil, etc. inside
the territorial waters. A barge for removal of such pollutants is avail-
able upon application to the Harbor Master's office. Solid waste loads
of this type are taken out to sea for dumping.
Because the canal is locked, excessive sedimentation in the channel itself
c_123
is not a problem, and maintenance dredging is relatively minor. Dredging
spoil may be dumped into specific storage area, barged out to sea, or
used for non-industrial fill purposes.
We were informed that there has been relatively little if any modifica-
tion of the shoreline due to the construction of the breakwaters leading
to the North Sea Canal entrance. Detailed studies regarding construction
of the outer port at Ijmuiden are just beginning, and relatively little
information is available. It is planned, however, to include in these
studies a detailed examination of the extent to which shoreline currents
will be further modified by construction of the port and the effect this
will have on sedimentation characteristics. The biggest current issue
is the momentary suppression of one mile of recreational beach which
will be replaced within three years.
(5) Noise/Visual. Except for objections raised by such organizations
as the Kabouters, noise pollution and aesthetic problems have received
little attention.
(6) Land Use. The emphasis by the Netherlands National Government on
development of Rotterdam as Holland's major port facility has threatened
the long-term growth and outlook for Amsterdam. Accordingly, by far the
greatest priority has been set on improving Amsterdam's role as a major
sea port through the development of additional port facilities and
industrial sites, both along the North Sea Canal and on the coast. Be-
cause much of the land abutting the canal is presently used for agri-
cultural purposes, reclamation of this acreage for industrial sites is
relatively less difficult than if large residential or municipal areas
were involved.
Of the land available for development in the harbor areas of the
Netherlands, roughly one-half is in the Amsterdam port area; this is
an important asset to Amsterdam in its efforts to remain competitive.
In 1965, a master plan for the North Sea area was developed with a 10-
to 15-year span. An industrialization zone, composed of approximately
2500 hectares of land, was planned immediately west of Amerika-Haven.
At present, the port is in the process of purchasing this land and
developing roughly one-half of it to meet industrial specifications.
The southern half of this area, called the Houtrak polder, contains
approximately 1500 hectares and is being filled with sand obtained from
the North Sea, which is desalted and then either barged or piped to the
site. Approximately 22 million cubic yards of sand will be emplaced at
the Houtrak polder and total preparation costs are about 30 guilders
($0.85) per square foot. About one-tenth is for purchasing land, thereby
placing a sale value on each 50- to 125-acre farm of $165,000-$415,000,
a tidy sum for a Dutch farmer. Members of the older generation who
owned their farms have subsequently retired, while many younger farmers
have used the proceeds from the land sale to acquire land elsewhere.
According to the development plans, the Houtrak polder will be bounded
on its western and southern borders by a large recreational area,
approximately equal in acreage to the industrial site. Across the
canal from the Houtrak polder, another area (approximately 1000 hectares)
is also scheduled for industrial development. This acreage would be
bounded on the north and west by agricultural land, and on the east by
an already industrialized site.
As is the case with other European ports, the industrial sites are seldom
sold to corporations; instead they are rented as concessions for periods
ranging 25 to 99 years. This general policy prevails because such
acreage is scarce and because it is in effect communal property, since
public monies were used to develop the acreage.
(7) Future Issues. Perhaps the critical issue which Amsterdam faces
is whether in fact it should endeavor to become a medium-deep-water port
through the construction of the outer harbor on the coast, and thereby
seek to compete more directly with Rotterdam but take the risk of
C-1 25
building too much capacity too quickly in the Netherlands.
As a highly viable but slower growing general cargo port, Amsterdam also
has an opportunity to plan its future growth with greater attention to
environmental and sociological considerations and the preservation of
its historical beauty (the Northern Venice) if it will only take the
time to do so; we have the impression that economic growth is of para-
mount importance, and that industrial expansion is to be achieved as
rapdily as possible, perhaps at the expense of a more balanced and
environmentally-oriented program.
Finally, it is readily apprent that the communities located on or immedi-
ately affected by the North Sea Canal development will have to work
together more closely in the future in planning land use, development
of inftastructure, industrial and municipal pollution control, and
economic growth.
C-126
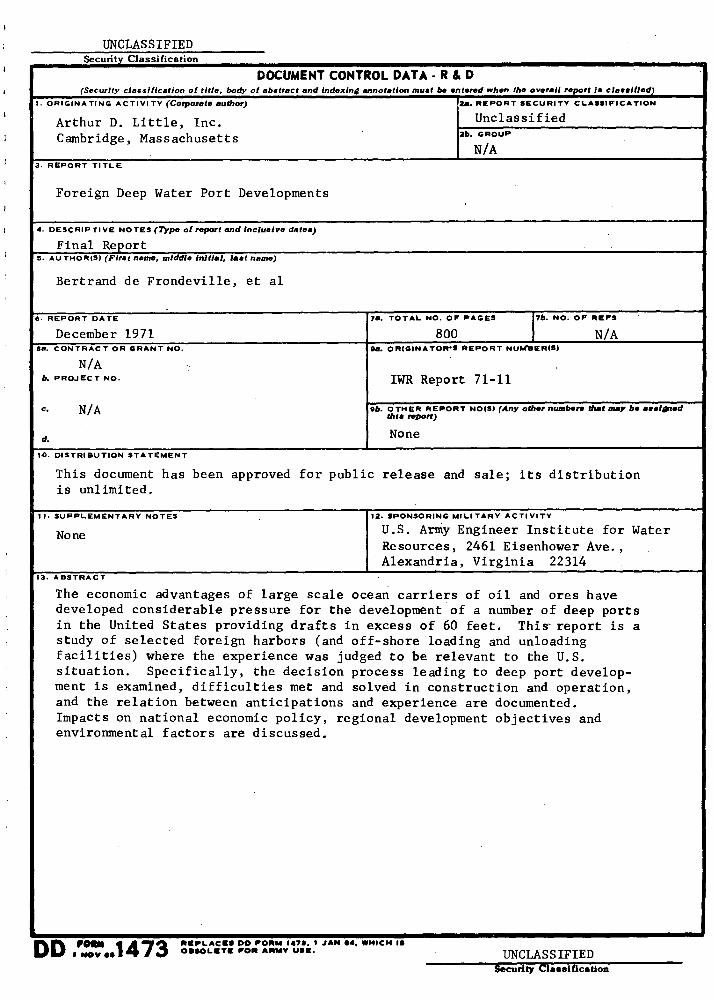
REPLACES 00 FORM 1471. 1 JAN 114, WHICH IS OBSOLETE FOR ARMY USE. UNCLASSIFIED DD
UNCLASSIFIED Classificatio _
DOCUMENT CONTROL DATA - R & D (Security classification of title, body of abstract and indexing annotation must be entered when the overall report is classified)
I. ORIGINATING ACTIVITY (Corporate author) 2a. REPORT SECURITY CLASSIFICATION
Arthur D. Little, Inc. Unclassified Cambridge, Massachusetts 2b. GROUP
N/A 3. REPORT TITLE
Foreign Deep Water Port Developments
•. DESCRIPTIVE NOTES (Type of report and inclusive date.)
Final Report 5. AUTHOR(S) (First name, middle initial, last name)
Bertrand de Frondeville, et al
6. REPORT DATE 71. TOTAL NO. OF PAGES 74. NO. OF REFS
December 1971 800 N/A ea. CONTRACT OR GRANT NO. 95. ORIGINATOR'S REPORT NUMBER(S)
N/A ,
b. PROJECT NO- rwR Report 71-11
C. N/A ab. OTHER REPORT NO(S) (Any other numbers that may lso assigned this report)
d. None
14. DISTRIBUTION STATEMENT
This document has been approved for public release and sale; its distribution is unlimited.
11. SUPPLEMENTARY NOTES 12. SPONSORING MILITARY ACTIVITY
None U.S. Army Engineer Institute for Water Resources, 2461 Eisenhower Ave., Alexandria, Virginia 22314
13. ABSTRACT
The economic advantages of large scale ocean carriers of oil and ores have developed considerable pressure for the development of a number of deep ports in the United States providing drafts in excess of 60 feet. This reportis a study of selected foreign harbors (and off-shore loading and unloading facilities) where the experience was judged to be relevant to the U.S. situation. Specifically, the decision process leading to deep port develop- ment is examined, difficulties met and solved in construction and operation, and the relation between anticipations and experience are documented. Impacts on national economic policy, regional development objectives and environmental factors are discussed.
Security Classification
UNCLASSIFIED Security Classification
I• LINK A LINK B LINK C KEY WORDS ■
ROLE WT ROLE WT ROLE WT
Water Resources Planning Engineering Works Techniques of Planning Evaluation Process Ecologic Impact of Water Development Cost Sharing Port Development
UNCLASSIFIED Security Classification