Embed Size (px)
Citation preview
Technical Main Report
i
ACKNOWLEDGEMENT
The Detailed Project Report of Kuntabesi – Nayagaun – Nagarkot Road (DRCN Code No:
24DR007) Rehabilitation & Reconstruction Road Project (Km 0+000 to Km 18+673),
Kavrepalanchowk district under ADB funded Earthquake Emergency Assistance Project
(ADBLoan No. 3260 – NEP), which aims to accelerate the recovery and reconstruction of the rural
roads damaged by earthquake. This main report is part of the assignment as per contract between
Central Implementation Support Consultants, DRILP-AF, Lalitpur, Nepal as the Client and JV of
BEAM/CEMECA/ Digicon, Kathmandu as consultant . We take this opportunity to express our
gratitude to MOFALD, EEAP, the Central Level Project Implementation Unit, Lalitpur, Nepal and
officials of DoLIDAR, DDC and DTO.
We are also very much grateful to the contribution of all the individuals who were directly or
indirectly involved in this project works for their kind co-operation and help at every step in the
process for the completing the assignment.
JV of
BEAM Consultants Pvt. Ltd.,
Cemeca Consultant Pvt. Ltd.
Digicon Engineering Consult Pvt.Ltd
Kathmandu, Nepal
Technical Main Report
ii
EXECUTIVE SUMMARY
The detailed engineering survey, design and cost estimate for rehabilitation and reconstruction of
Kuntabesi – Nayagaun - Nagarkot Road of Kavrepalanchok district, Nepal has been prepared for
ADB funded Emergency Earthquake Assistance Project (ADB Loan 3260-NEP). The road length is
18.673 km. The road alignment starts from Kuntabesi of Mahadevsthan VDC and ends at
Malluwapati of Deupur VDC.The road passes through Mahadevsthan, Nayagaun Deupur and
Baluwapati Deupur Village Development Committees.
Design of the road was carried out by SW_ROAD 2006 and SW_DTM 2006 computer software
developed by SOFTWEL (P) Ltd, Nepal. Design was carried out using strip survey method, so that
alignment could be optimized as per requirement.
Nepal Rural Road Standard (2055) with 2nd Revision, DoLIDAR is followed to design the road.
The road falls under the category of District Road Core Network as per NRRS as it connects
village and district headquarters as well as SRN. And accordingly, the design parameters and
standards are considered for the road design. A total right of adopted is 20m (10 m on either side).
Adopted Roadway width is 5.25 m which includes carriageway and its shoulder width and
formation width is 6.25m including drain.
DoLIDAR and DoR Guidelines is adopted to design the retaining structures as appropriate. The
retaining structures include gabion retaining wall, stone masonry retaining wall, RCC cantilever
retaining wall and dry stone masonry wall.
The road alignment passes through settlement area, agricultural area and forest . The land use
has been classified into settlements, agricultural land and forest area. The average width of the
existing road is 4 m. Though the right of way is 10m on either side from road centerline it is
proposed to acquire only 5m on both side from the centre of the road for the carriageway,
shoulder, side drains and passing bays. However, in the built up area even this may not be
feasible accordingly in such areas only minimum required land has been proposed for acquisition
.It is proposed that additionally only 1.5 m on each side from centre the alignment of the road be
acquired to avoid the demolition of RCC buildings, temples and school . The total area of land to
be acquired is 10.29 Hectare.
The road alignment passes through slightly limestone, colluvial and residual soil deposits. A few
cut slope failures were observed along the road alignment. There is a landslide prone section from
Chainage 18+360 to 18+560 along the alignment. In this section, bioengineering works have been
proposed along with retaining wall to stabilize the area. The total cost of bioengineering works is
estimated to be NRs. 2,576,131.00.
The pavement design for gravel road is based on DOR pavement design guidelines for flexible
pavement. As per DoR Pavement Design Guidelines (Flexible Pavement) - 2013 based on CBR
Value 9% and traffic loading 1.69 MSA, total Pavement thickness is computed as 350-450 mm.
Accordingly, 175 mm thick gravel sub-base, 150-175 mm thick gravel base and 25-100 mm thick
capping layer has been proposed.
Technical Main Report
iii
Regarding construction materials, Gravel and aggregates required for road works can be
procured from quarry sites at Indrawati khola that is about 2.32 km from Kuntabesi. In addition,
boulders and dressed stones can be procured from quarry sites located nearby the end section of
the road i.e. Nagarkot. Other construction materials like cement and reinforcement can be made
available from Zero Kilo, Panchkhal which is 7 km away from the starting point of the project.
Besides, materials like bitumen, hume pipe, GI wire etc. can be procured from Nagarkot (end
point of the alignment).
The cost estimates are based on applicable DoLIDAR norms. In cases where DoLIDAR norms are
not available, DOR norms have been used. The unit item rates for each item have been calculated
on the basis of approved district rate for fiscal year 2072/73. While calculating item rates, it is
assumed that a qualified contractor will undertake construction following mechanized approach for
road works. It is envisaged that a construction period of 18 months will be appropriate giving due
consideration to the volume of works.
The base cost of civil works has been estimated to be NRs. 273,070,530.77. The total cost for
rehabilitation and reconstruction of the road project Ch: 0+000 to 18+673 Km is NRs.
344,068,868.78 .This total cost includes work charge staff & Miscellaneous Expenses, Physical
contingencies & VAT as per GON rules. The cost of per construction of works is NRs
16,524,912.96 per Km inclusive of VAT to Base Cost. It is envisaged that the construction works
can be completed within 18 months from award of contract and estimates are based on it. For
budgetary purpose to take account of change in scope in accordance with GON financial rules a
provision of 10% of the base cost estimate has been indicated in the budgetary cost estimate.
Technical Main Report
iv
Table of Contents
ACKNOWLEDGEMENT ............................................................................................................. i
EXECUTIVE SUMMARY .......................................................................................................... ii
LIST OF FIGURES .................................................................................................................... vii
LIST OF TABLES ...................................................................................................................... vii
SALIENT FEATURES ................................................................................................................ ix
ACRONYMS ................................................................................................................................ xi
1 INTRODUCTION .......................................................................................................... 1
1.1 GENERAL.................................................................................................................................... 1
1.2 PROJECT BACKGROUND ........................................................................................................ 1
1.3 GENERAL FEATURES OF THE DISTRICT AND SUB PROJECT AREA ............................. 1
1.4 SCOPE OF THE WORK .............................................................................................................. 2
2 ENGINEERING SURVEY AND STUDY ................................................................... 3
2.1 DESK STUDY ............................................................................................................................. 3
2.2 WORKING TEAM ....................................................................................................................... 3
2.3 PRE – SURVEY ACTIVITIES .................................................................................................... 3
2.4 TOPOGRAPHICAL SURVEY .................................................................................................... 3
2.5 GEOLOGICAL OBSERVATION ............................................................................................... 4
2.6 SOIL TYPE ALONG THE ROAD ALIGNMENT ...................................................................... 7
2.7 LANDSLIDES AND SLOPE STABILITY ................................................................................. 7
2.8 VEGETATION SURVEY ............................................................................................................ 8
2.9 MATERIAL SURVEY ................................................................................................................. 9
2.10 GENERAL INVENTORY ........................................................................................................... 9
2.11 DATA ENTRY AND ANALYSIS .............................................................................................. 9
2.12 GENERAL ALIGNMENT ........................................................................................................... 9
2.13 LAND USE PATTERN ALONG THE ROAD ........................................................................ 10
3 ROAD CORRIDOR COMMUNITY PROFILE ....................................................... 12
3.1 ZONE OF INFLUENCE ............................................................................................................ 12
3.2 OCCUPATION OF PEOPLE ..................................................................................................... 12
3.3 ETHNICITY ............................................................................................................................... 12
3.4 EDUCATION AND HEALTH .................................................................................................. 12
3.5 COMMUNICATION AND ELECTRICITY ............................................................................. 13
Technical Main Report
v
3.6 WATER SUPPLY AND SANITATION ................................................................................... 13
3.7 COMMUNITY DEVELOPMENT FACILITIES ...................................................................... 13
3.8 FOOD SECURITY ..................................................................................................................... 13
3.9 LAND ACQUISITION .............................................................................................................. 13
4 HYDROLOGICAL STUDY ....................................................................................... 14
4.1 GENERAL.................................................................................................................................. 14
4.2 SCOPE AND METHODOLOGY .............................................................................................. 14
4.3 AVAILABILITY OF RAINFALL DATA ................................................................................. 14
4.4 RAINFALL ANALYSIS ............................................................................................................ 15
4.5 DESIGN FLOOD ESTIMATION .............................................................................................. 17
4.6 DESIGN INTENSITY ................................................................................................................ 17
4.7 RUNOFF COEFFICIENT .......................................................................................................... 17
4.8 FLOOD ESTIMATION BY RATIONAL METHOD................................................................ 17
4.9 CROSS DRAINS ........................................................................................................................ 20
4.10 SIDE DRAINS ........................................................................................................................... 21
5 ENGINEERING DESIGN AND ADOPTED DESIGN STANDARDS ................... 22
5.1 GENERAL.................................................................................................................................. 22
5.2 ROAD CLASSIFICATION........................................................................................................ 22
5.3 DESIGN PARAMETERS AND STANDARDS FOR DESIGN ............................................... 22
5.4 DESIGN SPEED ........................................................................................................................ 23
5.5 RIGHT OF WAY ....................................................................................................................... 23
5.6 FORMATION WIDTH .............................................................................................................. 23
5.7 EXTRA WIDENING ................................................................................................................. 23
5.8 STOPPING SIGHT DISTANCE ................................................................................................ 25
5.9 HORIZONTAL CURVES .......................................................................................................... 25
5.10 ROAD CROSS- SECTION ........................................................................................................ 25
5.11 PASSING BAYS ........................................................................................................................ 25
5.12 PAVEMENT DESIGN ............................................................................................................... 26
5.13 INVESTIGATION OF EXISTING SUB-GRADE .................................................................... 27
5.14 TRAFFIC SURVEY AND STUDIES ........................................................................................ 31
5.15 ESTIMATION OF TRAFFIC DATA ........................................................................................ 32
5.16 TRAFFIC GROWTH ................................................................................................................. 33
5.17 TRAFFIC FORECASTS ............................................................................................................ 33
5.18 DESIGN LOADING FOR PAVEMENT DESIGN ................................................................... 35
5.19 DETERMINATION OF PAVEMENT THICKNESS ............................................................... 37
Technical Main Report
vi
5.20 RETAINING STRUCTURES .................................................................................................... 37
5.21 TRAFFIC SAFETY .................................................................................................................... 37
5.22 BIO-ENGINEERING WORKS .................................................................................................. 37
6 ENGINEERING COST ESTIMATE ......................................................................... 38
6.1 PROJECT COST ESTIMATE .................................................................................................. 38
6.2 QUANTITY ESTIMATE ........................................................................................................... 39
6.3 ANALYSIS OF RATES ............................................................................................................. 39
7 ENVIRONMENT PROTECTION MEASURES ...................................................... 40
8 CONCLUSION ............................................................................................................. 41
APPENDICES
Appendix-I: Abstract of Cost
Appendix-II: Description Card (D- Card) for Bench Marks
Technical Main Report
vii
LIST OF FIGURES
Figure 1: Geological Subdivision of Nepal Himalaya ....................................................................................... 5
Figure 2 : Geological Map of Project Area ........................................................................................................ 6
Figure 3: IDF Curves of Different Return Period Generated ........................................................................... 16
Figure 4: Extra Widening ................................................................................................................................. 24
Figure 5: Single Lane Road with drain in Hill area of District Road – Core Network ................................... 25
Figure 6: Plan of Adopted Passing Bay ........................................................................................................... 26
Figure 7: DCP-CBR relationships (Oversees Road Note 31, 4th edition, 1993) ............................................. 29
LIST OF TABLES
Table 1: Summary of the Surface Geology along the Road Alignment ............................................................. 6
Table 2 : Slope grade and geological condition for cutting slope/ Filling ......................................................... 7
Table 3 : Soil Type along the Road Alignment ................................................................................................. 7
Table 4 : Small trees and Shrubs ........................................................................................................................ 8
Table 5 : List of Major Tree Species.................................................................................................................. 8
Table 6 : Inventory of Existing Pipe Culverts .................................................................................................... 9
Table 7 : Land Use Pattern along the alignment .............................................................................................. 10
Table 8 : Distribution of Population with Household along the ZoI ................................................................ 12
Table 9 : Land Area for Acquisition ................................................................................................................ 13
Table 10 : List of Rainfall Stations in the district ............................................................................................ 14
Table 11 : Hourly Maximum Values ............................................................................................................... 15
Table 12 : Predicted Rainfall Intensity (mm/hr) of different Durations .......................................................... 16
Table 13 : Design Rainfall Intensities and Design Flood Flows ...................................................................... 18
Table 14 : Hydraulics of Proposed Cross Drains (Pipe Culverts) .................................................................... 21
Table 15 : Flow capacity of proposed side drains at maximum slope of 10% ................................................. 21
Table 16 : Design Parameters for Road ........................................................................................................... 22
Table 17 : Extra Widening (m) ........................................................................................................................ 24
Table 18 : Correlation to find CBR from DCP test .......................................................................................... 29
Table 19: Summary of CBR of Subgrade obtained from DCPT ..................................................................... 30
Table 20: PCU Factor adopted ......................................................................................................................... 31
Table 21: Baseline AADT in VPD & PCU ...................................................................................................... 33
Technical Main Report
viii
Table 22: Projected Traffic in AADT .............................................................................................................. 34
Table 23: Estimation of Cumulative Numbers of Vehicles (vpd) .................................................................. 36
Table 24: Estimate of Equivalent Standard Axles (ESA)ation of Cumulative Numbersof Vehicles (vpd) .... 36
Table 25: Chainage wise Pavement Thickness ................................................................................................ 37
Table 26: Summary Cost Estimate................................................................................................................... 38
Table 27: Spoil Disposal Sites ........................................................................................................................ 40
Technical Main Report
ix
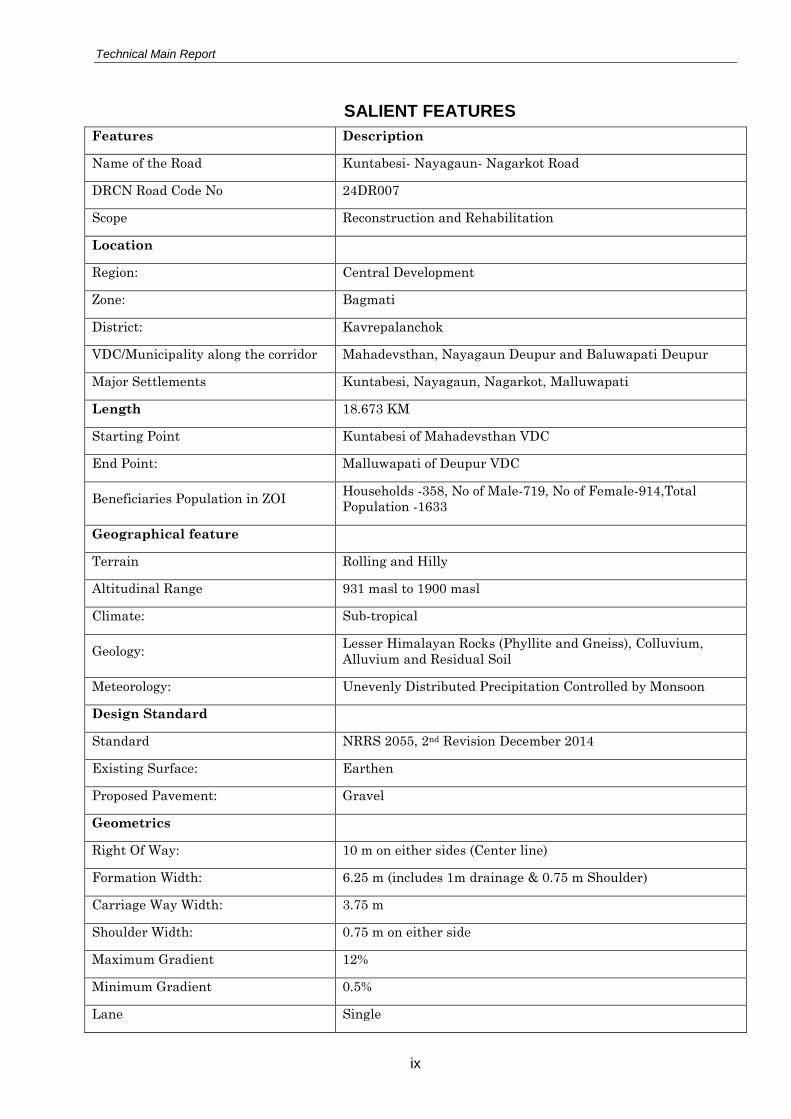
SALIENT FEATURES
Features Description
Name of the Road Kuntabesi- Nayagaun- Nagarkot Road
DRCN Road Code No 24DR007
Scope Reconstruction and Rehabilitation
Location
Region: Central Development
Zone: Bagmati
District: Kavrepalanchok
VDC/Municipality along the corridor Mahadevsthan, Nayagaun Deupur and Baluwapati Deupur
Major Settlements Kuntabesi, Nayagaun, Nagarkot, Malluwapati
Length 18.673 KM
Starting Point Kuntabesi of Mahadevsthan VDC
End Point: Malluwapati of Deupur VDC
Beneficiaries Population in ZOI Households -358, No of Male-719, No of Female-914,Total
Population -1633
Geographical feature
Terrain Rolling and Hilly
Altitudinal Range 931 masl to 1900 masl
Climate: Sub-tropical
Geology: Lesser Himalayan Rocks (Phyllite and Gneiss), Colluvium,
Alluvium and Residual Soil
Meteorology: Unevenly Distributed Precipitation Controlled by Monsoon
Design Standard
Standard NRRS 2055, 2nd Revision December 2014
Existing Surface: Earthen
Proposed Pavement: Gravel
Geometrics
Right Of Way: 10 m on either sides (Center line)
Formation Width: 6.25 m (includes 1m drainage & 0.75 m Shoulder)
Carriage Way Width: 3.75 m
Shoulder Width: 0.75 m on either side
Maximum Gradient 12%
Minimum Gradient 0.5%
Lane Single
Technical Main Report
x
Features Description
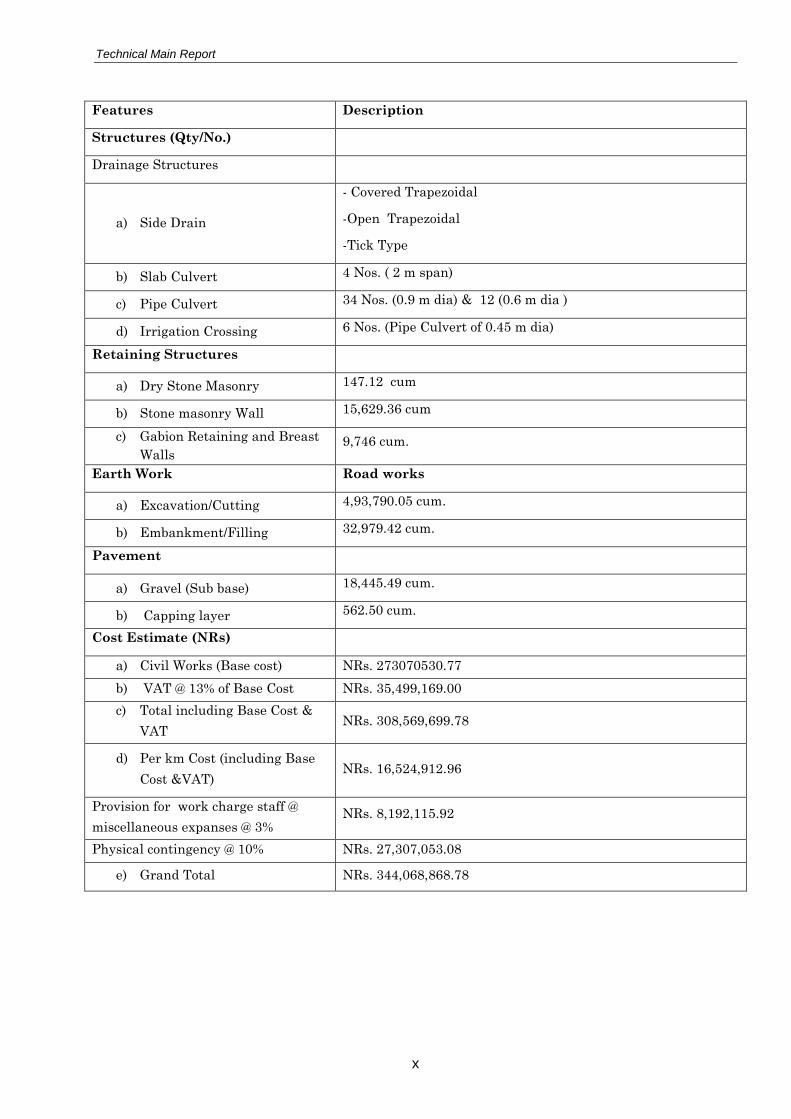
Structures (Qty/No.)
Drainage Structures
a) Side Drain
- Covered Trapezoidal
-Open Trapezoidal
-Tick Type
b) Slab Culvert 4 Nos. ( 2 m span)
c) Pipe Culvert 34 Nos. (0.9 m dia) & 12 (0.6 m dia )
d) Irrigation Crossing 6 Nos. (Pipe Culvert of 0.45 m dia)
Retaining Structures
a) Dry Stone Masonry 147.12 cum
b) Stone masonry Wall 15,629.36 cum
c) Gabion Retaining and Breast
Walls 9,746 cum.
Earth Work Road works
a) Excavation/Cutting 4,93,790.05 cum.
b) Embankment/Filling 32,979.42 cum.
Pavement
a) Gravel (Sub base) 18,445.49 cum.
b) Capping layer 562.50 cum.
Cost Estimate (NRs)
a) Civil Works (Base cost) NRs. 273070530.77
b) VAT @ 13% of Base Cost NRs. 35,499,169.00
c) Total including Base Cost &
VAT NRs. 308,569,699.78
d) Per km Cost (including Base
Cost &VAT) NRs. 16,524,912.96
Provision for work charge staff @
miscellaneous expanses @ 3% NRs. 8,192,115.92
Physical contingency @ 10% NRs. 27,307,053.08
e) Grand Total NRs. 344,068,868.78
Technical Main Report
xi
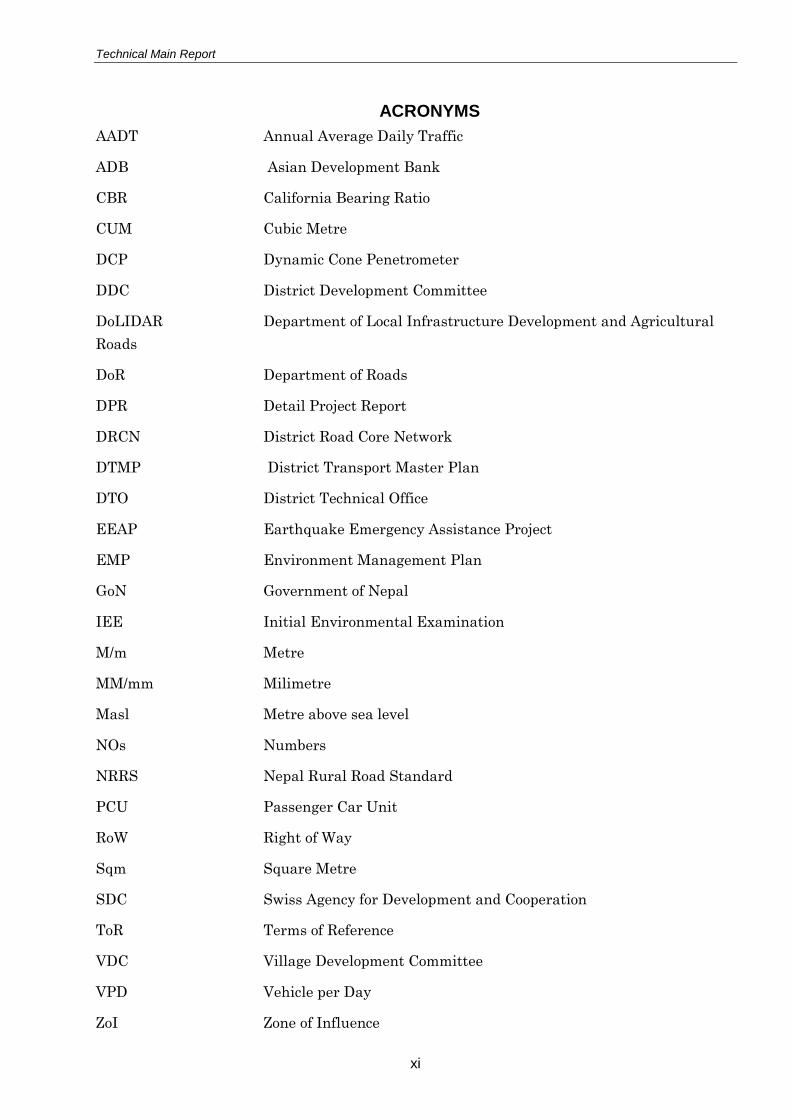
ACRONYMS
AADT Annual Average Daily Traffic
ADB Asian Development Bank
CBR California Bearing Ratio
CUM Cubic Metre
DCP Dynamic Cone Penetrometer
DDC District Development Committee
DoLIDAR Department of Local Infrastructure Development and Agricultural
Roads
DoR Department of Roads
DPR Detail Project Report
DRCN District Road Core Network
DTMP District Transport Master Plan
DTO District Technical Office
EEAP Earthquake Emergency Assistance Project
EMP Environment Management Plan
GoN Government of Nepal
IEE Initial Environmental Examination
M/m Metre
MM/mm Milimetre
Masl Metre above sea level
NOs Numbers
NRRS Nepal Rural Road Standard
PCU Passenger Car Unit
RoW Right of Way
Sqm Square Metre
SDC Swiss Agency for Development and Cooperation
ToR Terms of Reference
VDC Village Development Committee
VPD Vehicle per Day
ZoI Zone of Influence
Technical Main Report
1
1 INTRODUCTION
1.1 GENERAL
This report has been prepared as per the Contract between Central Implementation Support
Consultants, DRILP-AF, Lalitpur, Nepal as the Client and JV of BEAM/CEMECA/ Digicon,
Kathmandu as the Consultant, made on January 2016for preparation of Detailed Project Report for
rehabilitation and reconstruction of selected road subprojects in Cluster 1 districts of
Kavrepalanchowk, Lalitpur and Chitwan for ADB funded Emergency Earthquake Assistance
Project (ADB Loan 3260-NEP).
1.2 PROJECT BACKGROUND
The rehabilitation and reconstruction of the local road network damaged due to devastating
earthquake of 25 April 2015 and the major aftershock of May 12, 2015 has high priority for the
Government of Nepal (GoN).The Asian Development Bank (ADB) funds Earthquake Emergency
Assistance Project(EEAP) through (ADB Loan No. 3260 – NEP) is aimed to accelerate the
recovery and reconstruction of about 385 km of rural roads damaged by the earthquake and
landslides in 10 of the earthquake hit districts (Dolakha, Kavrepalanchok, Lalitpur, Chitwan,
Sindhuli, Solukhumbu, Okhaldunga, Ramechhap, Gorkha and Lamjung). The rehabilitation &
reconstruction of 18.673 km long Kuntabesi - Nayagaun - Nagarkot Road in Kavrepalanchok
district is one of the road subproject being selected.
1.3 GENERAL FEATURES OF THE DISTRICT AND SUB PROJECT AREA
Kavrepalanchok District is located in Bagmati Zone in the Central Development Region of Nepal
and lies within latitude 27o20' to 27o35' and longitude 85o24' to 85o59'. Its elevation ranges from
1007 to 3018m. Ecologically, it lies in the mountain region bordering Sindhupalchok in the north,
Ramechap & Sindhuli in the East, Sindhuli & Makwanpur in the South and Kathmandu, Lalitpur &
Bhaktapur in the West.
The total population of the district is 381,937 living in 80,720 households with male population -
47.90% and female - 52.10%, (CBS, 2012). Kavrepalanchok district has an average population
density of around 4.73 people per square km. The average family size is 4.73. Different castes
living there and are Newer, Brahmin, Chhetri, Gurung, Tamang, Malla, Thakuri, Damai, Kami,
Sarki, etc. The common language is Nepali.
Climate is dominated by topographical variations. The subproject has sub-tropical climatic
condition with average maximum temperature of 23°C and average minimum of 5.5°C. The
average annual rain fall is 1900.
The Kuntabesi – Nayagaun - Nagarkot road starts from Kuntabesi of Mahadevsthan VDC
(Longitude / Latitude: 85°31'16.33" E / 27°43'11.11" N) and ends at Malluwapati of Deupur VDC
(Longitude / Latitude: 85°36'52.24" E / 27°42'50.52" N).

Technical Main Report
2
1.4 SCOPE OF THE WORK
For the preparation of the detailed engineering design and cost estimate for the rehabilitation and
reconstruction of Kuntabesi-Nayagaun-Nagarkot road the scope of work covers:
a. Detailed engineering survey of the road including fixing of centerline,
b. Detailed design of the road to DoLIDAR's NRRS 2055, 2nd Revision, December 2014,
c. Preparation of engineering drawings including alignment plan, design profile, design cross
section and typical drawings,
d. Preparation of detailed cost estimate, and
e. Preparation of technical study reports
To fulfill the above scope of services under the assignment as part of the preparation of the
Detailed Project Report (DPR), the consultant carried out the following activities:
Discussions and meetings with the Client and stakeholders
Collection and review of concerned documents, report, manual, guidelines, specifications,
norms and others
Preparation for field survey
Reconnaissance survey, Monumentation, Traversing and Chainage Marking
Detailed engineering survey of the existing road alignment and its corridor (topographical
survey, geological observation, hydrological study slope patterns, drainages patterns, Cross-
drainage and others)
Material and labour availability survey
Collection of district rates (labour, material and transportation)
Detail designs as per the DoLIDAR’s Rural Road Design Standards.
Drawings preparation
Quantity estimation, rate analysis and cost estimates.
Preparation of reports
Technical Main Report
3
2 ENGINEERING SURVEY AND STUDY
2.1 DESK STUDY
The Consultant collected documents, drawings, study reports, maps, walkover survey report and
existing DTMP to acquire and extract key information to carry of the study. The Consultant
collected and reviewed the following documents to field survey:
Maps and previous reports
Relevant guidelines, norms, handout, specification and maps
Nepal Rural Road Standard (NRSS 2055) 2nd Revision and DoLIDAR Norms & Specification
District Transport Master Plan (DTMP) of district
Geological map to acquire geological/geotechnical feature of road alignment.
After the desk study, the field survey was carried out by the Consultants' team and during the field
survey; the major following activities performed are discussed herewith:
2.2 WORKING TEAM
The team for the assignment has included the following key members:
Highway or Transport Engineer(Team Leader) Mr. Hare Krishna Shrestha
Environmental expert Mr. Madhav Giri
Resettlement Specialist Mr. Chinta Mani Sharma
GESI Specialist Mr. Pradip Parajuli
Civil engineer Mr. Surya Chaudhary
Surveyor Mr. Om Yadav
2.3 PRE – SURVEY ACTIVITIES
Before the field visit, the team had meetings and discussions with the concerned site offices in
Kathmandu and district. The team also held consultation with local community for the purpose of
collecting information about road corridor and also to get support in conducting the engineering
survey of the assignment.
2.4 TOPOGRAPHICAL SURVEY
Road strip survey method was used in the field which included fixing of the base stations and
taking details 10m either side for preparing a topographic map of the road corridor. Topography
survey was carried out in adequate details and accuracy to prepare DTM of the road alignment in
1:1000 scales. Horizontal and vertical control points were established by monument of concrete
pillar at an interval of 500m.
Technical Main Report
4
Initially traverse survey was carried out with high accuracy (1:70,000 to 1:148,000.)To establish
traverse station and other permanent control points. Topographical details were carried out from
these traverse station to attain accuracy at higher level. Close traverse method was applied for
horizontal traversing.
Establishment of Control Points / Benchmarks
Permanent monuments were installed as benchmarks (approx. size 15 cm x 15 cm x 60 cm) with
1:2:4 cement concrete nails embedded as per the DoLIDAR standards and / or nailed in the
permanent structure at interval of 500 m and or less than that according to site condition.
Traverse and Fly Leveling
The coordinates of Bench Mark is presented in NEZD (Northing, Easting, Elevation and
Description) format along with point number and remark. Closed traverse survey was carried out to
confirm the control point coordinates. All traverse angles and distances were double checked with
reciprocal observations. Traverse and level were calculated at the site itself for accuracy and
quality control as well as data validation.
Centerline and Cross Section Survey
Centerline of road was marked using Abney level by the method of chaining and pegging
which then followed by Total station survey.
Cross sections survey carried out at intervals of 10 m and where topographic features such as
ridges and valleys were encountered, additional cross sections taken.
Cross sections - 15 m either side of road centerline and also extended further whenever site
demands
Enough points taken at each cross-section or for each string to cover full width of the road
including roadside feature, side drain, toe of cut/fill slope retaining wall, cross drainage
structure etc.
Topographical survey also included individual building, utilities (water supply, electricity,
telephone poles etc.), landslides, canals, footpaths, temples, drainages, cross structures,
retaining structures, land use patterns and other information such as fences etc.
At bridge side, the bank lines lowest water level, HFL, direction and distribution of flow taken.
2.5 GEOLOGICAL OBSERVATION
The Lesser Himalaya lies between the Siwalik Group to the south and the Higher Himalaya to the
North. Both the southern and the northern limits of the Lesser Himalaya are represented by the
thrust fault; the Main Boundary Thrust (MBT) and the Main Central Thrust (MCT), to the south and
north, respectively. It is represented by thick piles of the sedimentary rocks and low-grade
metamorphic rocks, ranging from the Pre-Cambrian to Tertiary in age. Total thickness of the
Lesser Himalayan rocks are exposed more than 14 km. Nappe, Klippe and Schuppen like tectonic
structures have made complexity in the Lesser Himalayan geology. The project area is located in
Lesser Himalaya zone as shown in the figure given below.
Technical Main Report
5
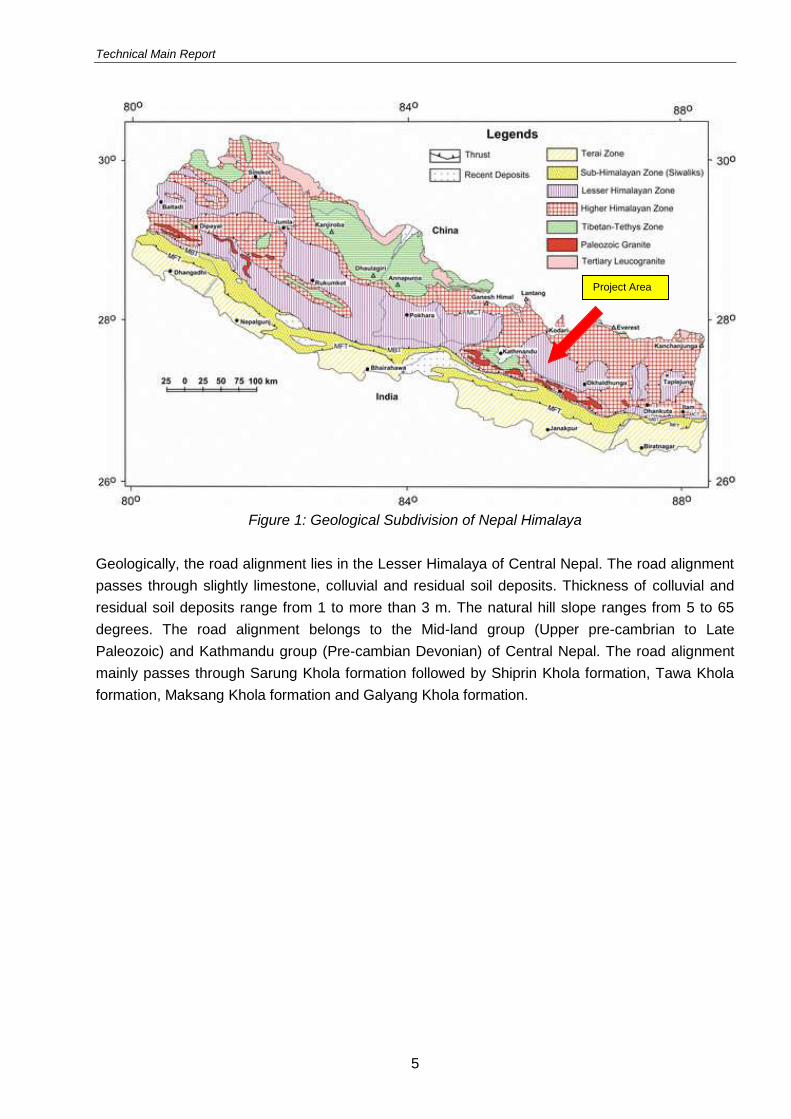
Figure 1: Geological Subdivision of Nepal Himalaya
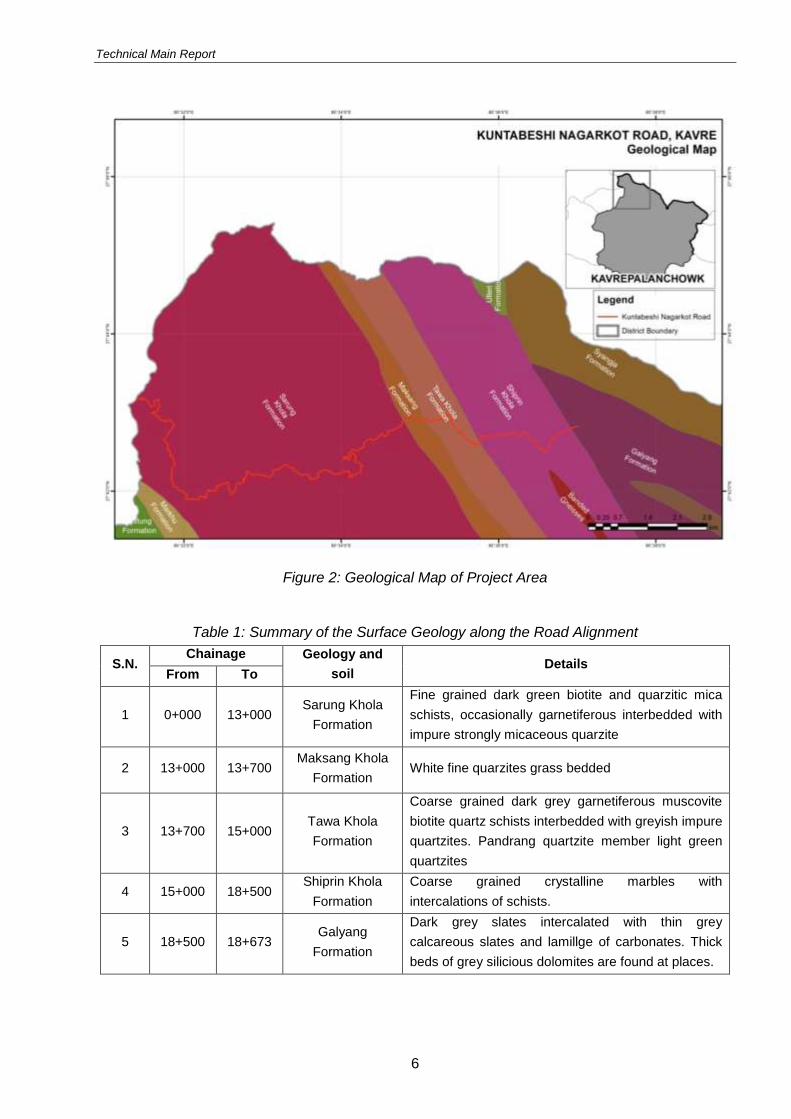
Geologically, the road alignment lies in the Lesser Himalaya of Central Nepal. The road alignment
passes through slightly limestone, colluvial and residual soil deposits. Thickness of colluvial and
residual soil deposits range from 1 to more than 3 m. The natural hill slope ranges from 5 to 65
degrees. The road alignment belongs to the Mid-land group (Upper pre-cambrian to Late
Paleozoic) and Kathmandu group (Pre-cambian Devonian) of Central Nepal. The road alignment
mainly passes through Sarung Khola formation followed by Shiprin Khola formation, Tawa Khola
formation, Maksang Khola formation and Galyang Khola formation.
Project Area
Technical Main Report
6
Figure 2: Geological Map of Project Area
Table 1: Summary of the Surface Geology along the Road Alignment
S.N. Chainage Geology and
soil Details
From To
1 0+000 13+000 Sarung Khola
Formation
Fine grained dark green biotite and quarzitic mica
schists, occasionally garnetiferous interbedded with
impure strongly micaceous quarzite
2 13+000 13+700 Maksang Khola
Formation White fine quarzites grass bedded
3 13+700 15+000 Tawa Khola
Formation
Coarse grained dark grey garnetiferous muscovite
biotite quartz schists interbedded with greyish impure
quartzites. Pandrang quartzite member light green
quartzites
4 15+000 18+500 Shiprin Khola
Formation
Coarse grained crystalline marbles with
intercalations of schists.
5 18+500 18+673 Galyang
Formation
Dark grey slates intercalated with thin grey
calcareous slates and lamillge of carbonates. Thick
beds of grey silicious dolomites are found at places.
Technical Main Report
7
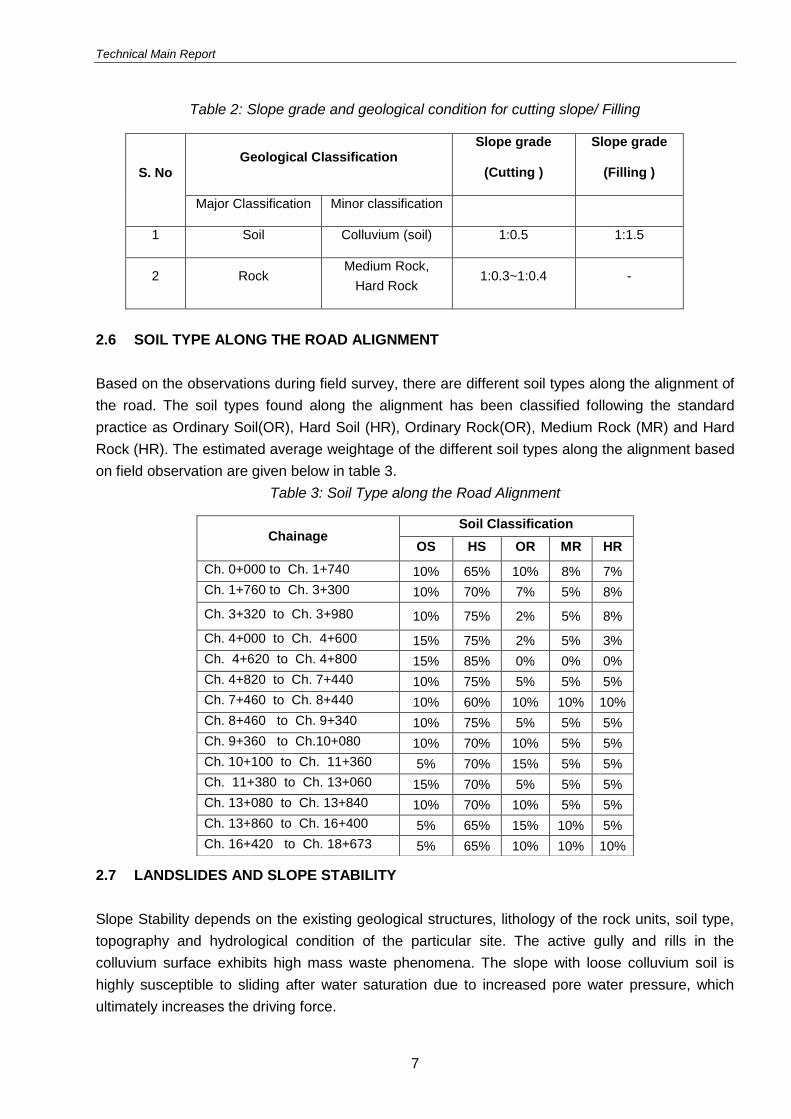
Table 2: Slope grade and geological condition for cutting slope/ Filling
S. No
Geological Classification Slope grade
(Cutting )
Slope grade
(Filling )
Major Classification Minor classification
1 Soil Colluvium (soil) 1:0.5 1:1.5
2 Rock Medium Rock,
Hard Rock 1:0.3~1:0.4 -
2.6 SOIL TYPE ALONG THE ROAD ALIGNMENT
Based on the observations during field survey, there are different soil types along the alignment of
the road. The soil types found along the alignment has been classified following the standard
practice as Ordinary Soil(OR), Hard Soil (HR), Ordinary Rock(OR), Medium Rock (MR) and Hard
Rock (HR). The estimated average weightage of the different soil types along the alignment based
on field observation are given below in table 3.
Table 3: Soil Type along the Road Alignment
2.7 LANDSLIDES AND SLOPE STABILITY
Slope Stability depends on the existing geological structures, lithology of the rock units, soil type,
topography and hydrological condition of the particular site. The active gully and rills in the
colluvium surface exhibits high mass waste phenomena. The slope with loose colluvium soil is
highly susceptible to sliding after water saturation due to increased pore water pressure, which
ultimately increases the driving force.
Chainage Soil Classification
OS HS OR MR HR
Ch. 0+000 to Ch. 1+740 10% 65% 10% 8% 7%
Ch. 1+760 to Ch. 3+300 10% 70% 7% 5% 8%
Ch. 3+320 to Ch. 3+980 10% 75% 2% 5% 8%
Ch. 4+000 to Ch. 4+600 15% 75% 2% 5% 3%
Ch. 4+620 to Ch. 4+800 15% 85% 0% 0% 0%
Ch. 4+820 to Ch. 7+440 10% 75% 5% 5% 5%
Ch. 7+460 to Ch. 8+440 10% 60% 10% 10% 10%
Ch. 8+460 to Ch. 9+340 10% 75% 5% 5% 5%
Ch. 9+360 to Ch.10+080 10% 70% 10% 5% 5%
Ch. 10+100 to Ch. 11+360 5% 70% 15% 5% 5%
Ch. 11+380 to Ch. 13+060 15% 70% 5% 5% 5%
Ch. 13+080 to Ch. 13+840 10% 70% 10% 5% 5%
Ch. 13+860 to Ch. 16+400 5% 65% 15% 10% 5%
Ch. 16+420 to Ch. 18+673 5% 65% 10% 10% 10%
Technical Main Report
8
A few cut slope failures were observed along the road alignment. There were very less chances of
occurring failure because of opposite natural hill slope. There is a landslide prone area from
Chainage 18+360 to 18+560 along the alignment. It has been proposed to manage the drainage
surface water and apply the bioengineering works in the landslide prone area, loose soil exposed
area as well as groundwater prone area.
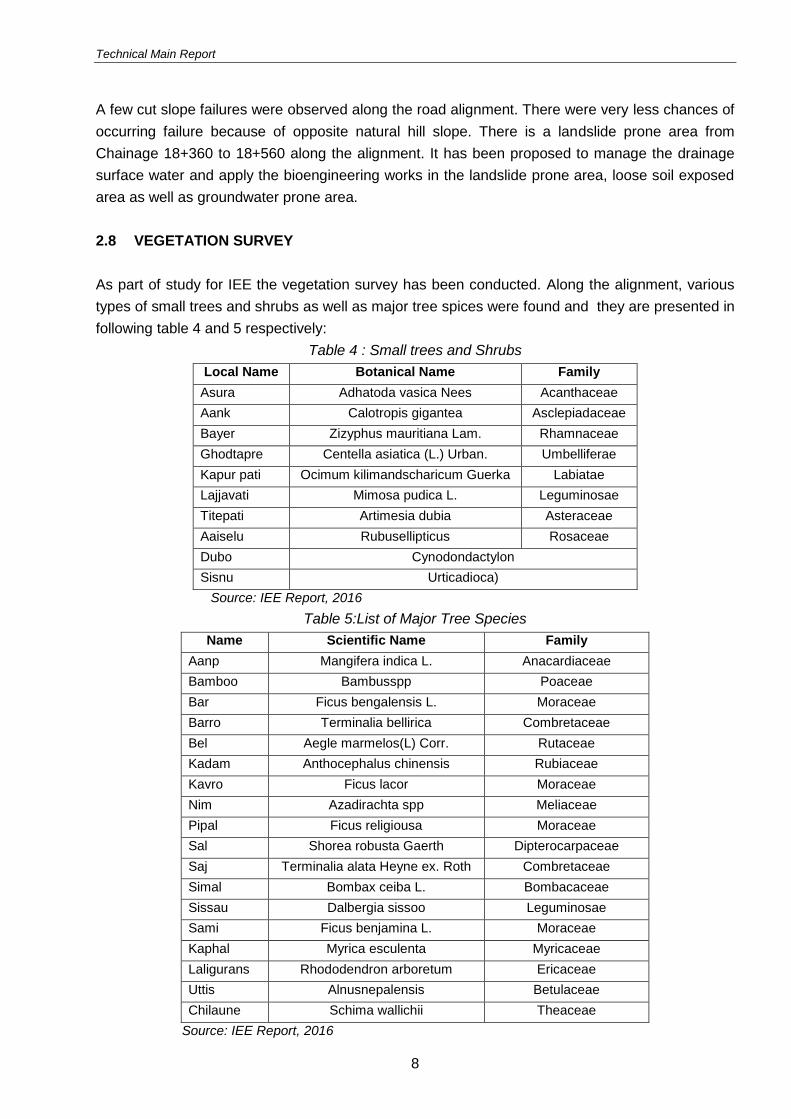
2.8 VEGETATION SURVEY
As part of study for IEE the vegetation survey has been conducted. Along the alignment, various
types of small trees and shrubs as well as major tree spices were found and they are presented in
following table 4 and 5 respectively:
Table 4 : Small trees and Shrubs
Local Name Botanical Name Family
Asura Adhatoda vasica Nees Acanthaceae
Aank Calotropis gigantea Asclepiadaceae
Bayer Zizyphus mauritiana Lam. Rhamnaceae
Ghodtapre Centella asiatica (L.) Urban. Umbelliferae
Kapur pati Ocimum kilimandscharicum Guerka Labiatae
Lajjavati Mimosa pudica L. Leguminosae
Titepati Artimesia dubia Asteraceae
Aaiselu Rubusellipticus Rosaceae
Dubo Cynodondactylon
Sisnu Urticadioca)
Source: IEE Report, 2016
Table 5:List of Major Tree Species
Name Scientific Name Family
Aanp Mangifera indica L. Anacardiaceae
Bamboo Bambusspp Poaceae
Bar Ficus bengalensis L. Moraceae
Barro Terminalia bellirica Combretaceae
Bel Aegle marmelos(L) Corr. Rutaceae
Kadam Anthocephalus chinensis Rubiaceae
Kavro Ficus lacor Moraceae
Nim Azadirachta spp Meliaceae
Pipal Ficus religiousa Moraceae
Sal Shorea robusta Gaerth Dipterocarpaceae
Saj Terminalia alata Heyne ex. Roth Combretaceae
Simal Bombax ceiba L. Bombacaceae
Sissau Dalbergia sissoo Leguminosae
Sami Ficus benjamina L. Moraceae
Kaphal Myrica esculenta Myricaceae
Laligurans Rhododendron arboretum Ericaceae
Uttis Alnusnepalensis Betulaceae
Chilaune Schima wallichii Theaceae
Source: IEE Report, 2016
Technical Main Report
9
2.9 MATERIAL SURVEY
Gravel and aggregates required for road works can be procured from quarry sites at Indrawati
khola that is about 2.32 km from Kuntabesi. In addition, boulders and dressed stones can be
procured from quarry sites located nearby the end section of the road i.e Nagarkot. Other
construction materials like cement and reinforcement can be made available from Zero Kilo,
Panchkhal which is 7 km away from the starting point of the project . Besides, materials like
bitumen, hume pipe, GI wire etc. can be procured from Nagarkot (end point of the alignment).
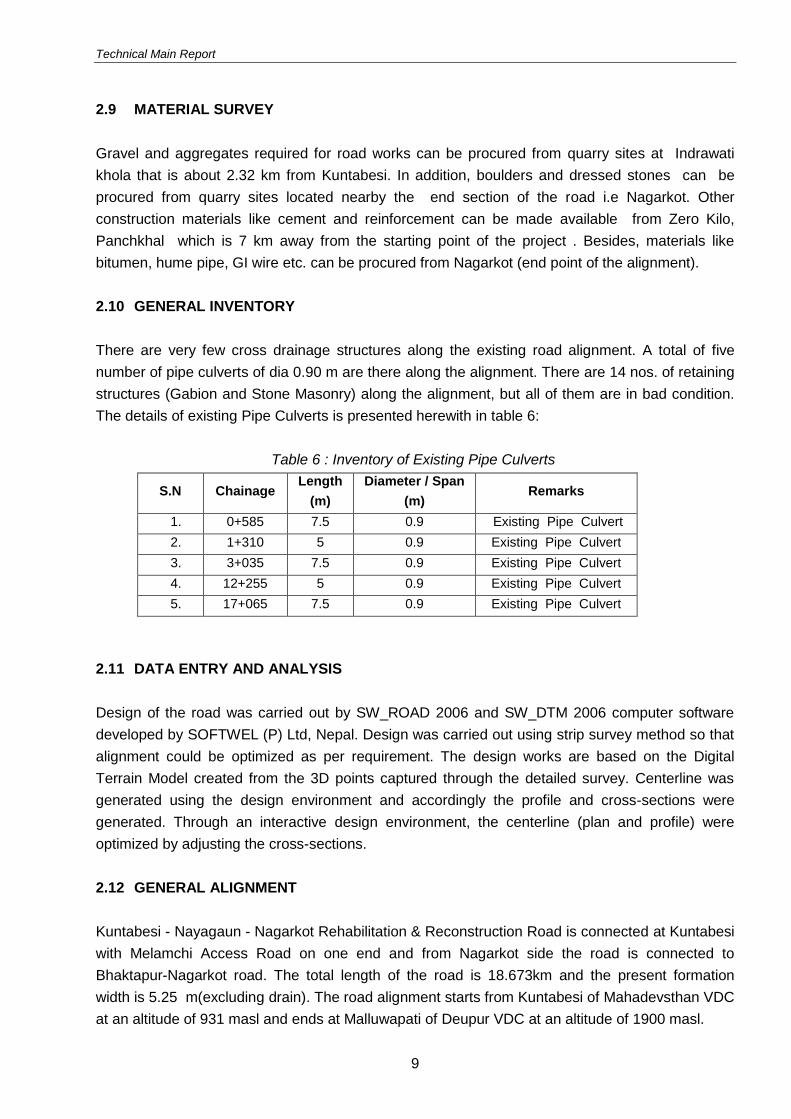
2.10 GENERAL INVENTORY
There are very few cross drainage structures along the existing road alignment. A total of five
number of pipe culverts of dia 0.90 m are there along the alignment. There are 14 nos. of retaining
structures (Gabion and Stone Masonry) along the alignment, but all of them are in bad condition.
The details of existing Pipe Culverts is presented herewith in table 6:
Table 6 : Inventory of Existing Pipe Culverts
S.N Chainage Length
(m)
Diameter / Span
(m) Remarks
1. 0+585 7.5 0.9 Existing Pipe Culvert
2. 1+310 5 0.9 Existing Pipe Culvert
3. 3+035 7.5 0.9 Existing Pipe Culvert
4. 12+255 5 0.9 Existing Pipe Culvert
5. 17+065 7.5 0.9 Existing Pipe Culvert
2.11 DATA ENTRY AND ANALYSIS
Design of the road was carried out by SW_ROAD 2006 and SW_DTM 2006 computer software
developed by SOFTWEL (P) Ltd, Nepal. Design was carried out using strip survey method so that
alignment could be optimized as per requirement. The design works are based on the Digital
Terrain Model created from the 3D points captured through the detailed survey. Centerline was
generated using the design environment and accordingly the profile and cross-sections were
generated. Through an interactive design environment, the centerline (plan and profile) were
optimized by adjusting the cross-sections.
2.12 GENERAL ALIGNMENT
Kuntabesi - Nayagaun - Nagarkot Rehabilitation & Reconstruction Road is connected at Kuntabesi
with Melamchi Access Road on one end and from Nagarkot side the road is connected to
Bhaktapur-Nagarkot road. The total length of the road is 18.673km and the present formation
width is 5.25 m(excluding drain). The road alignment starts from Kuntabesi of Mahadevsthan VDC
at an altitude of 931 masl and ends at Malluwapati of Deupur VDC at an altitude of 1900 masl.
Technical Main Report
10
It passes through nine settlements: Suthikuriya, Singhe, Khasre, Lama Tol, Ratopahiro, Dhaitar,
Bayarbot, Kuntabesi and Chainpur. It does not pass through any protected areas, historically and
archaeologically sensitive areas. This road has been proposed for upgrading. It passes through
forests, cultivated land, settlement area and stream (khola/kholsi) at some locations. The
alignment of the proposed road is shown in the location map.
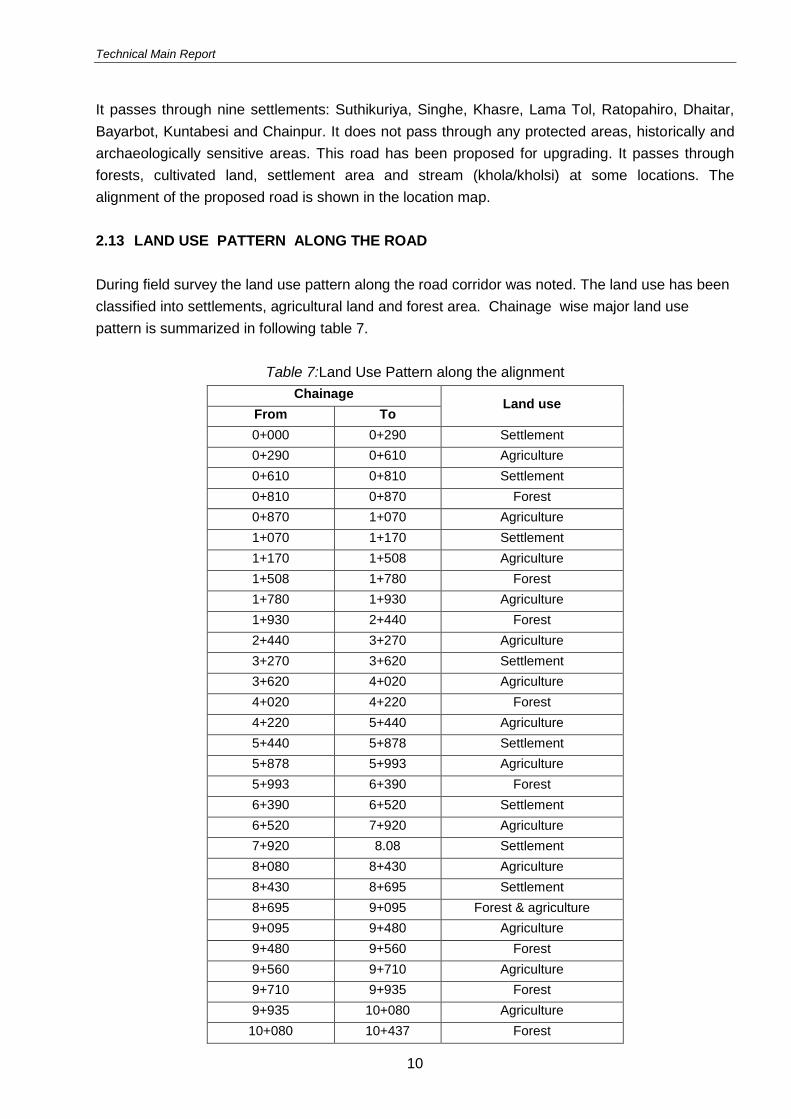
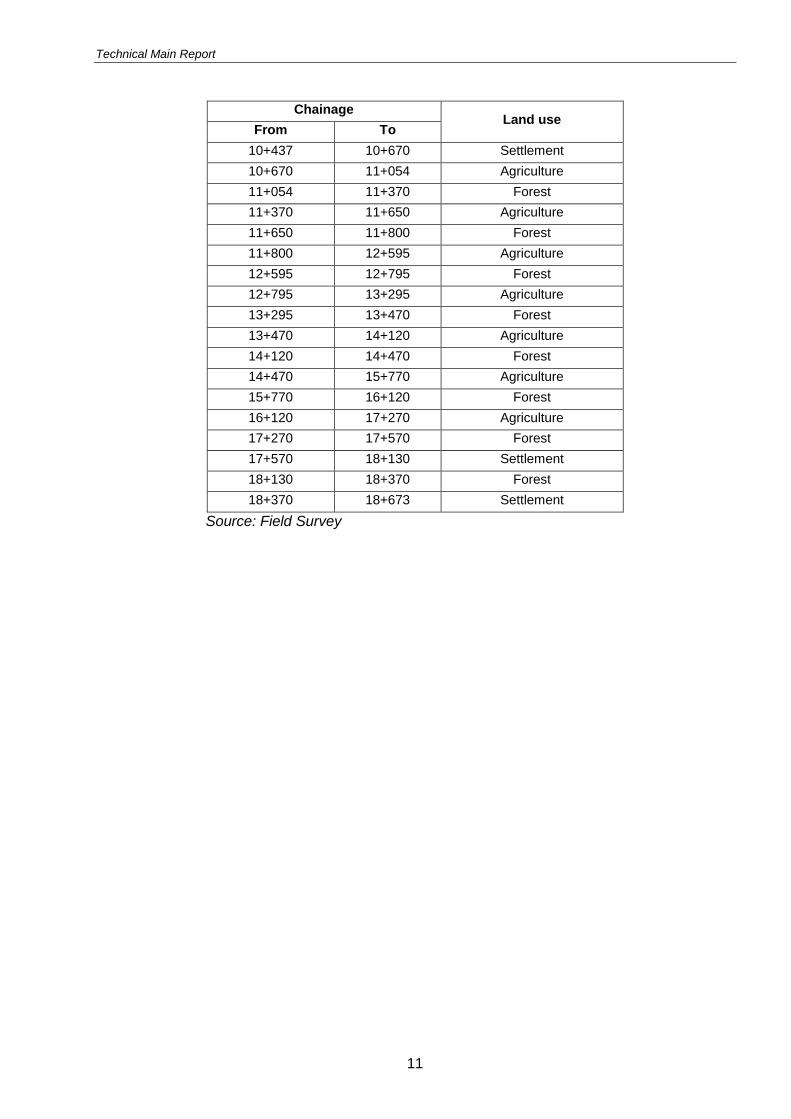
2.13 LAND USE PATTERN ALONG THE ROAD
During field survey the land use pattern along the road corridor was noted. The land use has been
classified into settlements, agricultural land and forest area. Chainage wise major land use
pattern is summarized in following table 7.
Table 7:Land Use Pattern along the alignment
Chainage Land use
From To
0+000 0+290 Settlement
0+290 0+610 Agriculture
0+610 0+810 Settlement
0+810 0+870 Forest
0+870 1+070 Agriculture
1+070 1+170 Settlement
1+170 1+508 Agriculture
1+508 1+780 Forest
1+780 1+930 Agriculture
1+930 2+440 Forest
2+440 3+270 Agriculture
3+270 3+620 Settlement
3+620 4+020 Agriculture
4+020 4+220 Forest
4+220 5+440 Agriculture
5+440 5+878 Settlement
5+878 5+993 Agriculture
5+993 6+390 Forest
6+390 6+520 Settlement
6+520 7+920 Agriculture
7+920 8.08 Settlement
8+080 8+430 Agriculture
8+430 8+695 Settlement
8+695 9+095 Forest & agriculture
9+095 9+480 Agriculture
9+480 9+560 Forest
9+560 9+710 Agriculture
9+710 9+935 Forest
9+935 10+080 Agriculture
10+080 10+437 Forest
Technical Main Report
11
Chainage Land use
From To
10+437 10+670 Settlement
10+670 11+054 Agriculture
11+054 11+370 Forest
11+370 11+650 Agriculture
11+650 11+800 Forest
11+800 12+595 Agriculture
12+595 12+795 Forest
12+795 13+295 Agriculture
13+295 13+470 Forest
13+470 14+120 Agriculture
14+120 14+470 Forest
14+470 15+770 Agriculture
15+770 16+120 Forest
16+120 17+270 Agriculture
17+270 17+570 Forest
17+570 18+130 Settlement
18+130 18+370 Forest
18+370 18+673 Settlement
Source: Field Survey
Technical Main Report
12
3 ROAD CORRIDOR COMMUNITYPROFILE
3.1 ZONE OF INFLUENCE
The road alignment passes through three Village Development Committees (VDCs), namely
Mahdevsthan, Nayagaun Deupur and Baluwapati. There are nine settlements along the alignment
such as Suthikuriya, Singhe, Khasre, Lama Tol, Ratopahiro, Dhaitar, Bayarbot, Kuntabesi and
Chainpur.
3.2 OCCUPATION OF PEOPLE
The majority of the people are involved in agriculture and livestock (60%) followed by labour /
porter (25%), business & commerce (11%) and so on. Paddy, millet, maize, mustard, barley are
the main crops. (Field Survey, 2016).
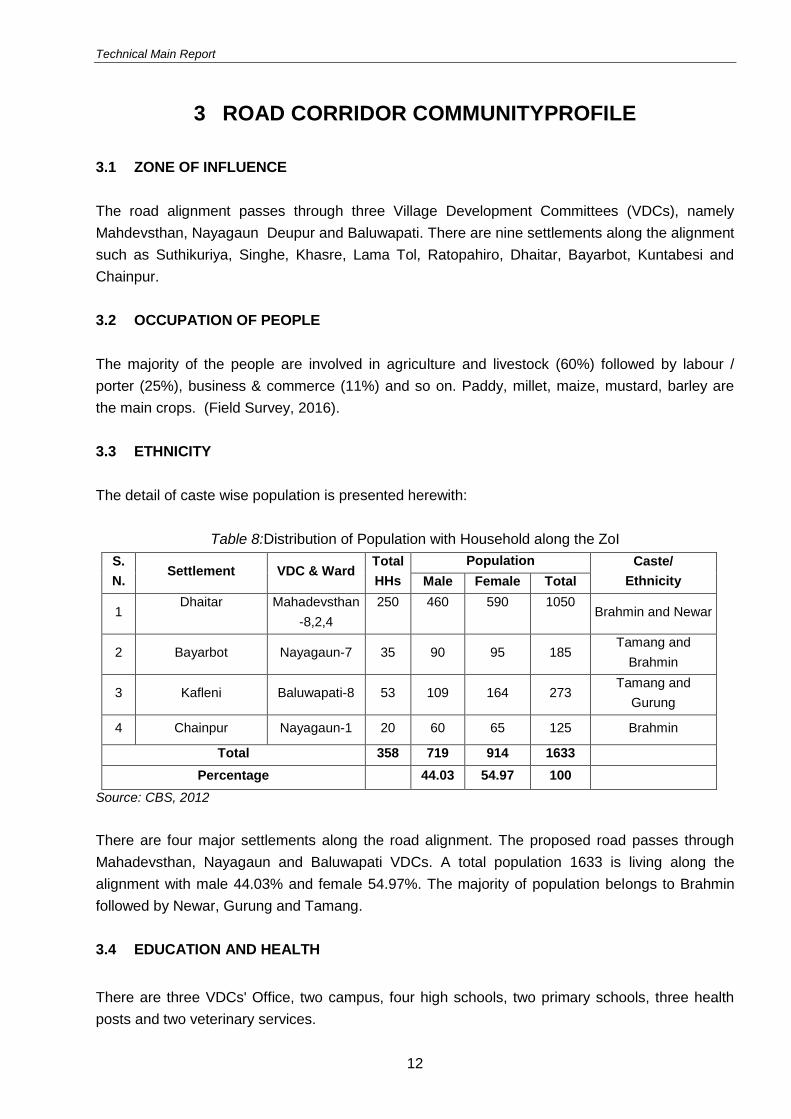
3.3 ETHNICITY
The detail of caste wise population is presented herewith:
Table 8:Distribution of Population with Household along the ZoI
S.
N. Settlement VDC & Ward
Total
HHs
Population Caste/
Ethnicity Male Female Total
1 Dhaitar
Mahadevsthan
-8,2,4
250
460
590
1050
Brahmin and Newar
2 Bayarbot Nayagaun-7 35 90 95 185 Tamang and
Brahmin
3 Kafleni Baluwapati-8 53 109 164 273 Tamang and
Gurung
4 Chainpur Nayagaun-1 20 60 65 125 Brahmin
Total 358 719 914 1633
Percentage 44.03 54.97 100
Source: CBS, 2012
There are four major settlements along the road alignment. The proposed road passes through
Mahadevsthan, Nayagaun and Baluwapati VDCs. A total population 1633 is living along the
alignment with male 44.03% and female 54.97%. The majority of population belongs to Brahmin
followed by Newar, Gurung and Tamang.
3.4 EDUCATION AND HEALTH
There are three VDCs' Office, two campus, four high schools, two primary schools, three health
posts and two veterinary services.
Technical Main Report
13
3.5 COMMUNICATION AND ELECTRICITY
There is facility of communications as all the households have mobile facility as well as electricity
through national grid line. In addition, some of the HHs have solar system.
3.6 WATER SUPPLY AND SANITATION
There is well facility of tap water through gravity flow scheme and spring water. All the households
have toilet facility and almost three fourth of the HHs have permanent toilet and only one-third HHs
have temporary toilet facility. However, there is no proper solid waste management.
.
3.7 COMMUNITY DEVELOPMENT FACILITIES
There are 17 community organizations and are CFUGs, agricultural groups, mother’s group and
youth clubs etc.
3.8 FOOD SECURITY
Based on focus group discussion during field survey almost half of the HHs (62%) have enough
food for nine to one year followed by 33% HHs have for three to nine months and remaining 5%
HHs have for less or equal to three months food.
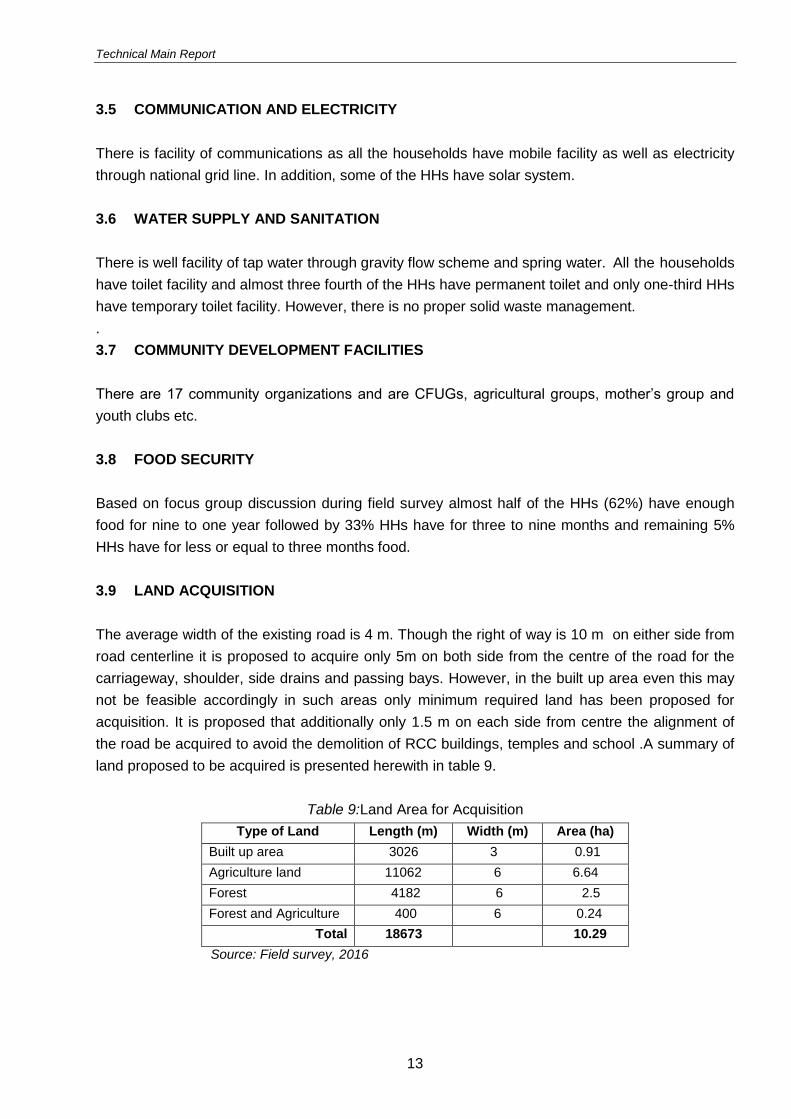
3.9 LAND ACQUISITION
The average width of the existing road is 4 m. Though the right of way is 10 m on either side from
road centerline it is proposed to acquire only 5m on both side from the centre of the road for the
carriageway, shoulder, side drains and passing bays. However, in the built up area even this may
not be feasible accordingly in such areas only minimum required land has been proposed for
acquisition. It is proposed that additionally only 1.5 m on each side from centre the alignment of
the road be acquired to avoid the demolition of RCC buildings, temples and school .A summary of
land proposed to be acquired is presented herewith in table 9.
Table 9:Land Area for Acquisition
Type of Land Length (m) Width (m) Area (ha)
Built up area 3026 3 0.91
Agriculture land 11062 6 6.64
Forest 4182 6 2.5
Forest and Agriculture 400 6 0.24
Total 18673 10.29
Source: Field survey, 2016
Technical Main Report
14
4 HYDROLOGICAL STUDY
4.1 GENERAL
A hydrological study was carried out to determine the design flood discharge for cross and side
drains along the proposed road alignment. The type, size, span and shape of cross and side
drains are to be fixed according to the corresponding design discharge.
4.2 SCOPE AND METHODOLOGY
The scope of hydrological study is to estimate the design flows for cross drains and side drains
along the road alignment. For the better results in hydrological analysis, following stepwise
procedures were followed:
Collection of rainfall data in the vicinity of road area
Rainfall analysis
Review of previous studies/reports
Delineation of catchment boundary of cross drains and determination of their catchment areas
using digital topographical map
Verification of cross and side drains during field visit and with survey data
Estimation of design floods by rational formula for cross and side drains based on available
rainfall data.
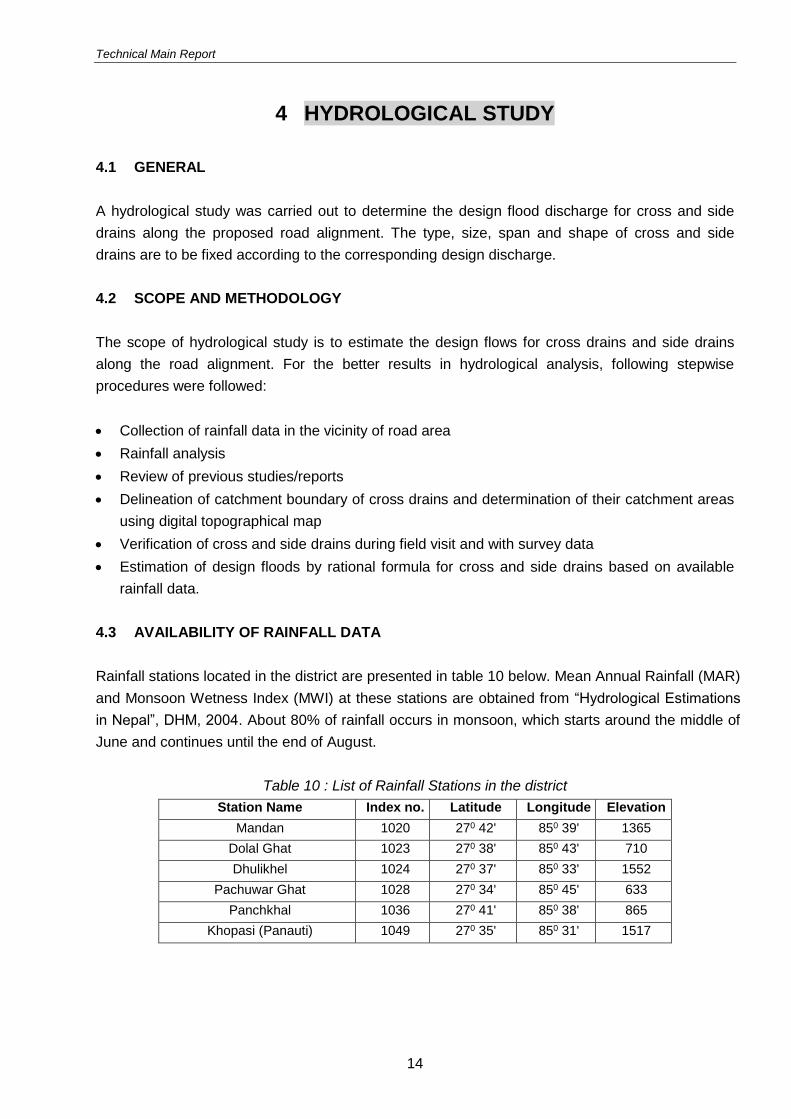
4.3 AVAILABILITY OF RAINFALL DATA
Rainfall stations located in the district are presented in table 10 below. Mean Annual Rainfall (MAR)
and Monsoon Wetness Index (MWI) at these stations are obtained from “Hydrological Estimations
in Nepal”, DHM, 2004. About 80% of rainfall occurs in monsoon, which starts around the middle of
June and continues until the end of August.
Table 10 : List of Rainfall Stations in the district
Station Name Index no. Latitude Longitude Elevation
Mandan 1020 270 42' 850 39' 1365
Dolal Ghat 1023 270 38' 850 43' 710
Dhulikhel 1024 270 37' 850 33' 1552
Pachuwar Ghat 1028 270 34' 850 45' 633
Panchkhal 1036 270 41' 850 38' 865
Khopasi (Panauti) 1049 270 35' 850 31' 1517
Technical Main Report
15
4.4 RAINFALLANALYSIS
Yearly maximum daily rainfalls for representative stations were collected from DHM and frequency
analysis were carried out. Values obtained by frequency analysis were adopted for determination
of design intensities for the design of cross and side drains.
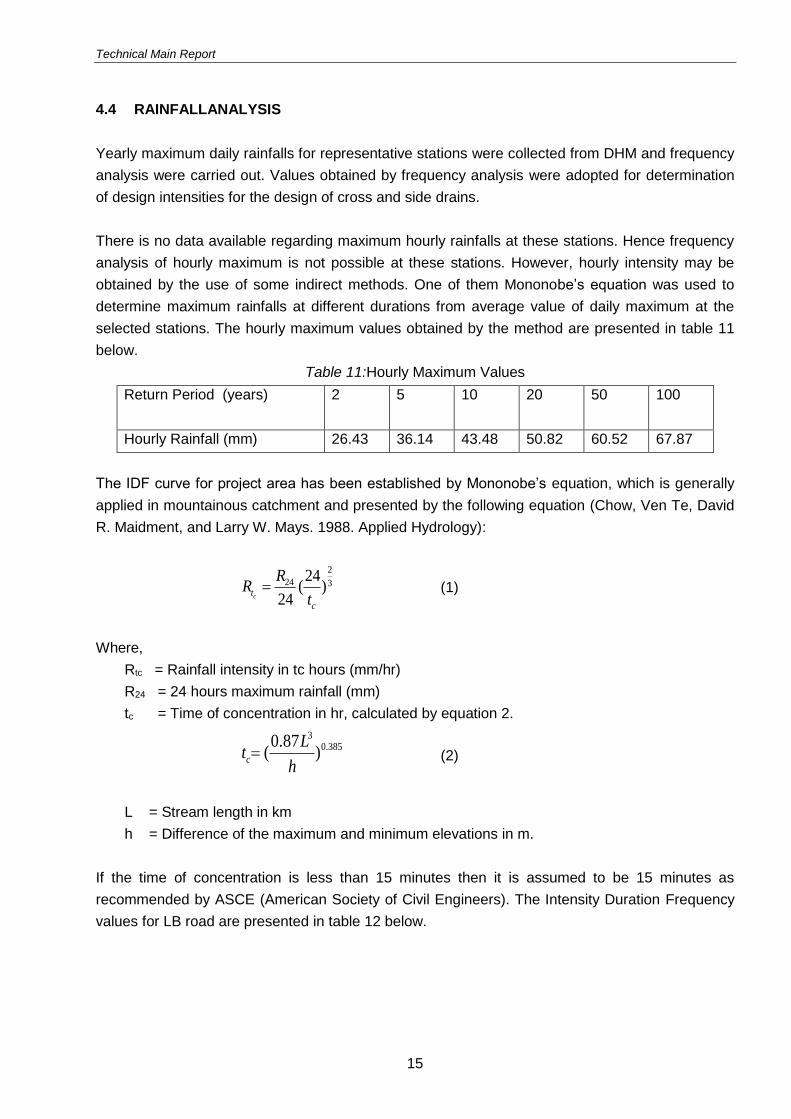
There is no data available regarding maximum hourly rainfalls at these stations. Hence frequency
analysis of hourly maximum is not possible at these stations. However, hourly intensity may be
obtained by the use of some indirect methods. One of them Mononobe’s equation was used to
determine maximum rainfalls at different durations from average value of daily maximum at the
selected stations. The hourly maximum values obtained by the method are presented in table 11
below.
Table 11:Hourly Maximum Values
Return Period (years) 2 5 10 20 50 100
Hourly Rainfall (mm) 26.43 36.14 43.48 50.82 60.52 67.87
The IDF curve for project area has been established by Mononobe’s equation, which is generally
applied in mountainous catchment and presented by the following equation (Chow, Ven Te, David
R. Maidment, and Larry W. Mays. 1988. Applied Hydrology):
2
24 324
( )24ct
c
RR
t (1)
Where,
Rtc = Rainfall intensity in tc hours (mm/hr)
R24 = 24 hours maximum rainfall (mm)
tc = Time of concentration in hr, calculated by equation 2.
30.3850.87
( )c
Lt
h (2)
L = Stream length in km
h = Difference of the maximum and minimum elevations in m.
If the time of concentration is less than 15 minutes then it is assumed to be 15 minutes as
recommended by ASCE (American Society of Civil Engineers). The Intensity Duration Frequency
values for LB road are presented in table 12 below.
Technical Main Report
16
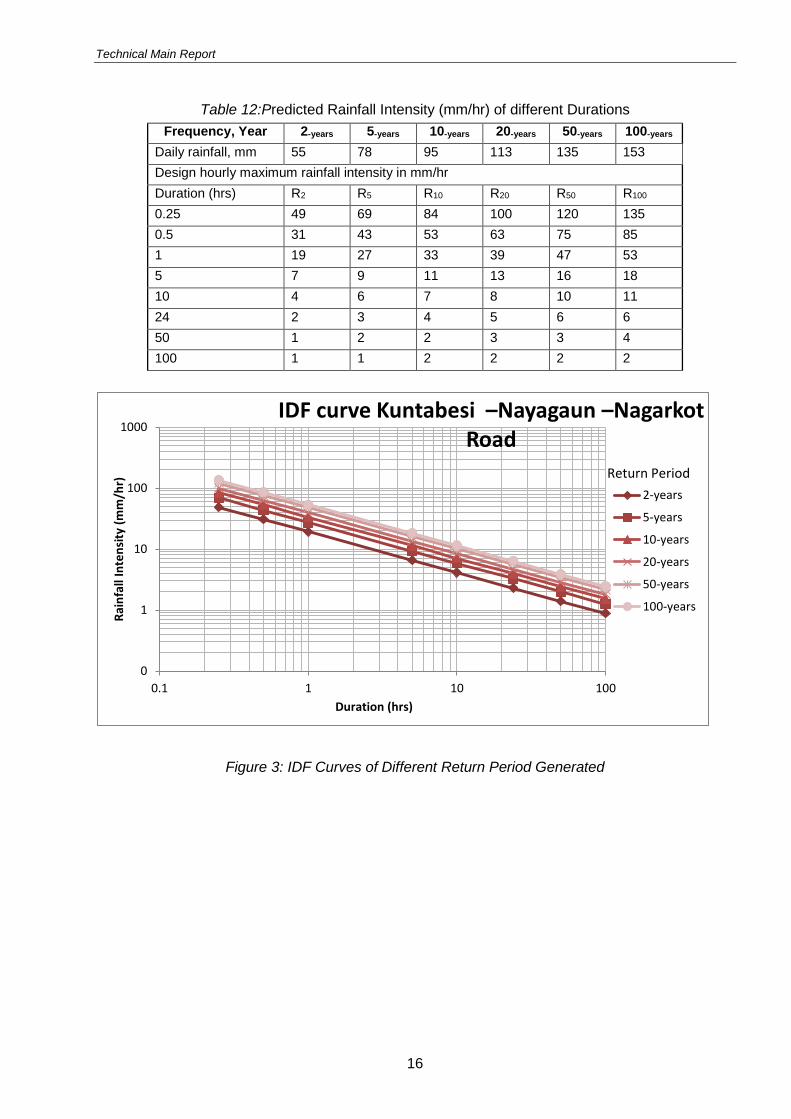
Table 12:Predicted Rainfall Intensity (mm/hr) of different Durations
Frequency, Year 2-years 5-years 10-years 20-years 50-years 100-years
Daily rainfall, mm 55 78 95 113 135 153
Design hourly maximum rainfall intensity in mm/hr
Duration (hrs) R2 R5 R10 R20 R50 R100
0.25 49 69 84 100 120 135
0.5 31 43 53 63 75 85
1 19 27 33 39 47 53
5 7 9 11 13 16 18
10 4 6 7 8 10 11
24 2 3 4 5 6 6
50 1 2 2 3 3 4
100 1 1 2 2 2 2
Figure 3: IDF Curves of Different Return Period Generated
0
1
10
100
1000
0.1 1 10 100
Rai
nfa
ll In
ten
sity
(m
m/h
r)
Duration (hrs)
IDF curve Kuntabesi –Nayagaun –Nagarkot Road
2-years
5-years
10-years
20-years
50-years
100-years
Return Period
Technical Main Report
17
4.5 DESIGN FLOOD ESTIMATION
Drainage facilities should have sufficient capacity to carry off safely not only peak runoffs, which
occur frequently, say several times a year, but also larger runoffs, occurring less frequently. For a
rural highway where some minor traffic disturbances can be tolerated, a peak runoff that recurs in
10 years is sufficient. Highway culverts having low traffic may be designed for 5 - 10 years flow
and having intermediate traffic for 10 - 25 years. Following these recommendations and
considering that the road alignment passes through rural areas having low traffic and with very
small catchments, cross drains are designed for 10 years return period flood and side drains for 5
years return period.
4.6 DESIGN INTENSITY
Rational method is used to compute design floods. This method needs design intensity
corresponding to selected design frequency and time of concentration. As the catchments are very
small and the concentration time is too short (less than 15 minutes), it is decided to use the
intensity for 15 minutes duration as design intensity except for the special cases where
concentration time is more than 15 minutes.
4.7 RUNOFF COEFFICIENT
The runoff coefficient depends on catchment characteristics such as slope, vegetation, shape and
size of the catchment. These characteristics are different even in a single watershed. It is very
difficult to define the accurate value of runoff coefficient. Thus, standard tables are used to select
coefficient roughly for different cases. In the present study, it is difficult to establish the coefficient
for individual catchments as they are in plenty. It is very clear from topographical maps and field
visit that the catchments are more or less homogeneous. Hence, a single value of runoff
coefficient is used for all the catchments in the project area.
Slope of these catchments is so steep; most of the catchments are well vegetated and forested. It
seems that more than 50% of rainfall will be retained by catchments due to dense vegetation and
forests as well as by infiltration. Considering all these factors, an average value of 0.4 is used for
all catchments.
4.8 FLOOD ESTIMATION BY RATIONAL METHOD
Rational formula is well applicable to small catchments and used to calculate the design floods for
cross drainage and side drains using maximum hourly rainfall intensity for determined duration and
adopted frequency. The average runoff coefficient is assumed equal to 0.4 for all catchments. The
formula (Refer : Chow, Ven Te, David R. Maidment, and Larry W. Mays. 1988. Applied Hydrology)
is as follows:
Technical Main Report
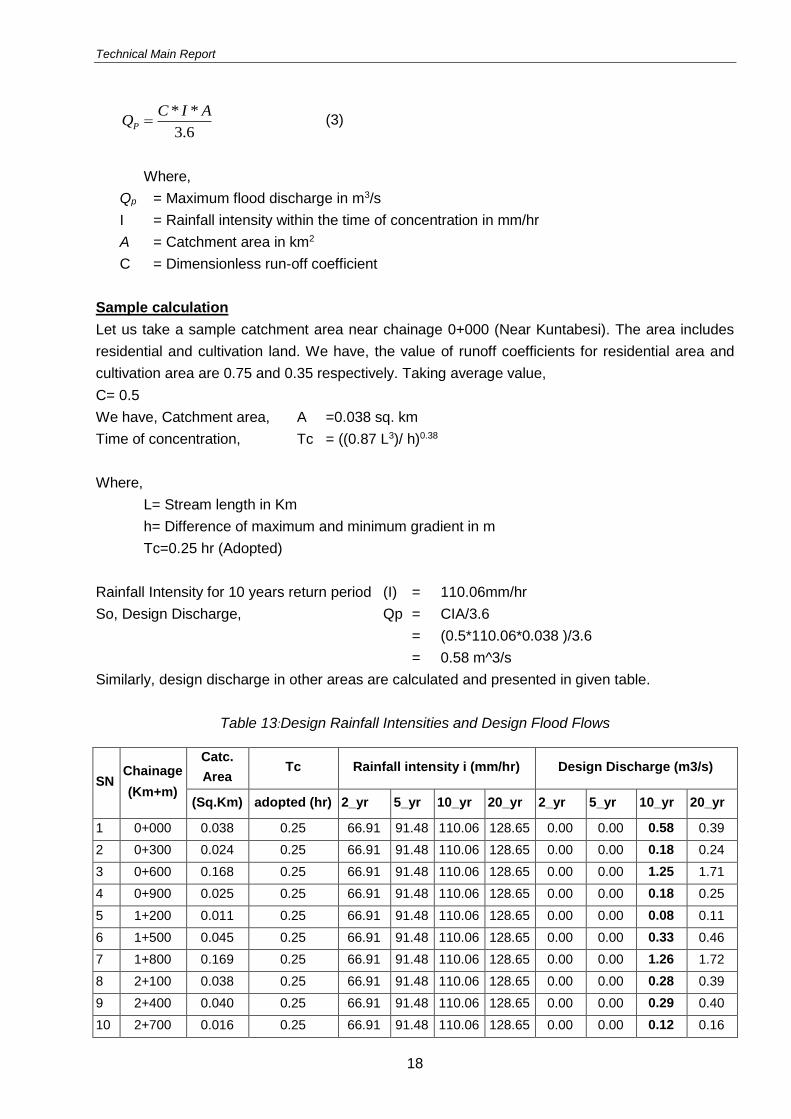
18
6.3
** AICQP (3)
Where,
Qp = Maximum flood discharge in m3/s
I = Rainfall intensity within the time of concentration in mm/hr
A = Catchment area in km2
C = Dimensionless run-off coefficient
Sample calculation
Let us take a sample catchment area near chainage 0+000 (Near Kuntabesi). The area includes
residential and cultivation land. We have, the value of runoff coefficients for residential area and
cultivation area are 0.75 and 0.35 respectively. Taking average value,
C= 0.5
We have, Catchment area, A =0.038 sq. km
Time of concentration, Tc = ((0.87 L3)/ h)0.38
Where,
L= Stream length in Km
h= Difference of maximum and minimum gradient in m
Tc=0.25 hr (Adopted)
Rainfall Intensity for 10 years return period (I) = 110.06mm/hr
So, Design Discharge, Qp = CIA/3.6
= (0.5*110.06*0.038 )/3.6
= 0.58 m^3/s
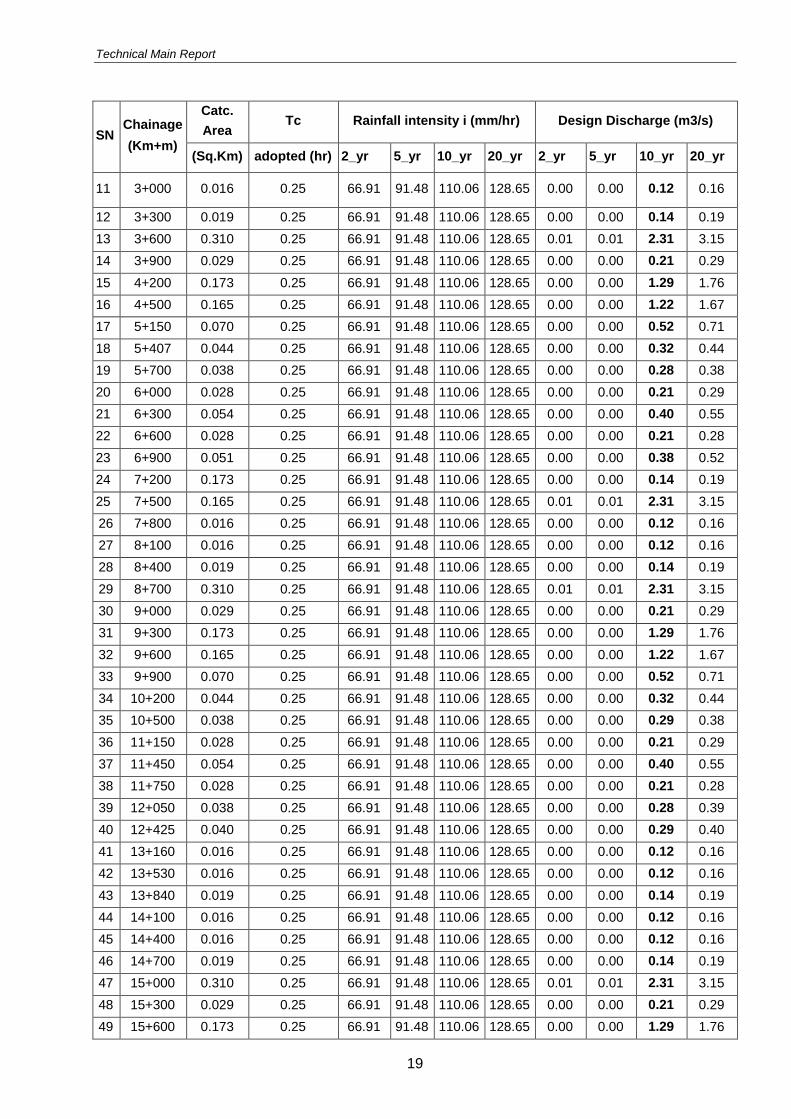
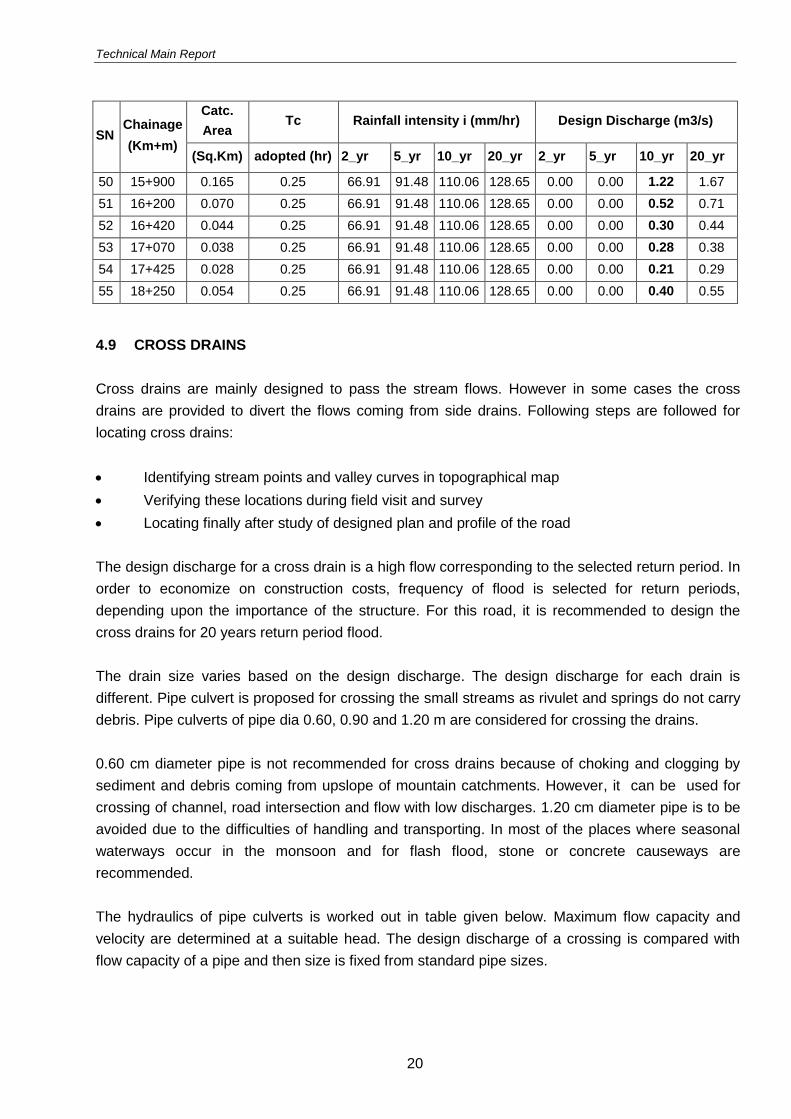
Similarly, design discharge in other areas are calculated and presented in given table.
Table 13:Design Rainfall Intensities and Design Flood Flows
SN Chainage
(Km+m)
Catc.
Area Tc Rainfall intensity i (mm/hr) Design Discharge (m3/s)
(Sq.Km) adopted (hr) 2_yr 5_yr 10_yr 20_yr 2_yr 5_yr 10_yr 20_yr
1 0+000 0.038 0.25 66.91 91.48 110.06 128.65 0.00 0.00 0.58 0.39
2 0+300 0.024 0.25 66.91 91.48 110.06 128.65 0.00 0.00 0.18 0.24
3 0+600 0.168 0.25 66.91 91.48 110.06 128.65 0.00 0.00 1.25 1.71
4 0+900 0.025 0.25 66.91 91.48 110.06 128.65 0.00 0.00 0.18 0.25
5 1+200 0.011 0.25 66.91 91.48 110.06 128.65 0.00 0.00 0.08 0.11
6 1+500 0.045 0.25 66.91 91.48 110.06 128.65 0.00 0.00 0.33 0.46
7 1+800 0.169 0.25 66.91 91.48 110.06 128.65 0.00 0.00 1.26 1.72
8 2+100 0.038 0.25 66.91 91.48 110.06 128.65 0.00 0.00 0.28 0.39
9 2+400 0.040 0.25 66.91 91.48 110.06 128.65 0.00 0.00 0.29 0.40
10 2+700 0.016 0.25 66.91 91.48 110.06 128.65 0.00 0.00 0.12 0.16
Technical Main Report
19
SN Chainage
(Km+m)
Catc.
Area Tc Rainfall intensity i (mm/hr) Design Discharge (m3/s)
(Sq.Km) adopted (hr) 2_yr 5_yr 10_yr 20_yr 2_yr 5_yr 10_yr 20_yr
11 3+000 0.016 0.25 66.91 91.48 110.06 128.65 0.00 0.00 0.12 0.16
12 3+300 0.019 0.25 66.91 91.48 110.06 128.65 0.00 0.00 0.14 0.19
13 3+600 0.310 0.25 66.91 91.48 110.06 128.65 0.01 0.01 2.31 3.15
14 3+900 0.029 0.25 66.91 91.48 110.06 128.65 0.00 0.00 0.21 0.29
15 4+200 0.173 0.25 66.91 91.48 110.06 128.65 0.00 0.00 1.29 1.76
16 4+500 0.165 0.25 66.91 91.48 110.06 128.65 0.00 0.00 1.22 1.67
17 5+150 0.070 0.25 66.91 91.48 110.06 128.65 0.00 0.00 0.52 0.71
18 5+407 0.044 0.25 66.91 91.48 110.06 128.65 0.00 0.00 0.32 0.44
19 5+700 0.038 0.25 66.91 91.48 110.06 128.65 0.00 0.00 0.28 0.38
20 6+000 0.028 0.25 66.91 91.48 110.06 128.65 0.00 0.00 0.21 0.29
21 6+300 0.054 0.25 66.91 91.48 110.06 128.65 0.00 0.00 0.40 0.55
22 6+600 0.028 0.25 66.91 91.48 110.06 128.65 0.00 0.00 0.21 0.28
23 6+900 0.051 0.25 66.91 91.48 110.06 128.65 0.00 0.00 0.38 0.52
24 7+200 0.173 0.25 66.91 91.48 110.06 128.65 0.00 0.00 0.14 0.19
25 7+500 0.165 0.25 66.91 91.48 110.06 128.65 0.01 0.01 2.31 3.15
26 7+800 0.016 0.25 66.91 91.48 110.06 128.65 0.00 0.00 0.12 0.16
27 8+100 0.016 0.25 66.91 91.48 110.06 128.65 0.00 0.00 0.12 0.16
28 8+400 0.019 0.25 66.91 91.48 110.06 128.65 0.00 0.00 0.14 0.19
29 8+700 0.310 0.25 66.91 91.48 110.06 128.65 0.01 0.01 2.31 3.15
30 9+000 0.029 0.25 66.91 91.48 110.06 128.65 0.00 0.00 0.21 0.29
31 9+300 0.173 0.25 66.91 91.48 110.06 128.65 0.00 0.00 1.29 1.76
32 9+600 0.165 0.25 66.91 91.48 110.06 128.65 0.00 0.00 1.22 1.67
33 9+900 0.070 0.25 66.91 91.48 110.06 128.65 0.00 0.00 0.52 0.71
34 10+200 0.044 0.25 66.91 91.48 110.06 128.65 0.00 0.00 0.32 0.44
35 10+500 0.038 0.25 66.91 91.48 110.06 128.65 0.00 0.00 0.29 0.38
36 11+150 0.028 0.25 66.91 91.48 110.06 128.65 0.00 0.00 0.21 0.29
37 11+450 0.054 0.25 66.91 91.48 110.06 128.65 0.00 0.00 0.40 0.55
38 11+750 0.028 0.25 66.91 91.48 110.06 128.65 0.00 0.00 0.21 0.28
39 12+050 0.038 0.25 66.91 91.48 110.06 128.65 0.00 0.00 0.28 0.39
40 12+425 0.040 0.25 66.91 91.48 110.06 128.65 0.00 0.00 0.29 0.40
41 13+160 0.016 0.25 66.91 91.48 110.06 128.65 0.00 0.00 0.12 0.16
42 13+530 0.016 0.25 66.91 91.48 110.06 128.65 0.00 0.00 0.12 0.16
43 13+840 0.019 0.25 66.91 91.48 110.06 128.65 0.00 0.00 0.14 0.19
44 14+100 0.016 0.25 66.91 91.48 110.06 128.65 0.00 0.00 0.12 0.16
45 14+400 0.016 0.25 66.91 91.48 110.06 128.65 0.00 0.00 0.12 0.16
46 14+700 0.019 0.25 66.91 91.48 110.06 128.65 0.00 0.00 0.14 0.19
47 15+000 0.310 0.25 66.91 91.48 110.06 128.65 0.01 0.01 2.31 3.15
48 15+300 0.029 0.25 66.91 91.48 110.06 128.65 0.00 0.00 0.21 0.29
49 15+600 0.173 0.25 66.91 91.48 110.06 128.65 0.00 0.00 1.29 1.76
Technical Main Report
20
SN Chainage
(Km+m)
Catc.
Area Tc Rainfall intensity i (mm/hr) Design Discharge (m3/s)
(Sq.Km) adopted (hr) 2_yr 5_yr 10_yr 20_yr 2_yr 5_yr 10_yr 20_yr
50 15+900 0.165 0.25 66.91 91.48 110.06 128.65 0.00 0.00 1.22 1.67
51 16+200 0.070 0.25 66.91 91.48 110.06 128.65 0.00 0.00 0.52 0.71
52 16+420 0.044 0.25 66.91 91.48 110.06 128.65 0.00 0.00 0.30 0.44
53 17+070 0.038 0.25 66.91 91.48 110.06 128.65 0.00 0.00 0.28 0.38
54 17+425 0.028 0.25 66.91 91.48 110.06 128.65 0.00 0.00 0.21 0.29
55 18+250 0.054 0.25 66.91 91.48 110.06 128.65 0.00 0.00 0.40 0.55
4.9 CROSS DRAINS
Cross drains are mainly designed to pass the stream flows. However in some cases the cross
drains are provided to divert the flows coming from side drains. Following steps are followed for
locating cross drains:
Identifying stream points and valley curves in topographical map
Verifying these locations during field visit and survey
Locating finally after study of designed plan and profile of the road
The design discharge for a cross drain is a high flow corresponding to the selected return period. In
order to economize on construction costs, frequency of flood is selected for return periods,
depending upon the importance of the structure. For this road, it is recommended to design the
cross drains for 20 years return period flood.
The drain size varies based on the design discharge. The design discharge for each drain is
different. Pipe culvert is proposed for crossing the small streams as rivulet and springs do not carry
debris. Pipe culverts of pipe dia 0.60, 0.90 and 1.20 m are considered for crossing the drains.
0.60 cm diameter pipe is not recommended for cross drains because of choking and clogging by
sediment and debris coming from upslope of mountain catchments. However, it can be used for
crossing of channel, road intersection and flow with low discharges. 1.20 cm diameter pipe is to be
avoided due to the difficulties of handling and transporting. In most of the places where seasonal
waterways occur in the monsoon and for flash flood, stone or concrete causeways are
recommended.
The hydraulics of pipe culverts is worked out in table given below. Maximum flow capacity and
velocity are determined at a suitable head. The design discharge of a crossing is compared with
flow capacity of a pipe and then size is fixed from standard pipe sizes.
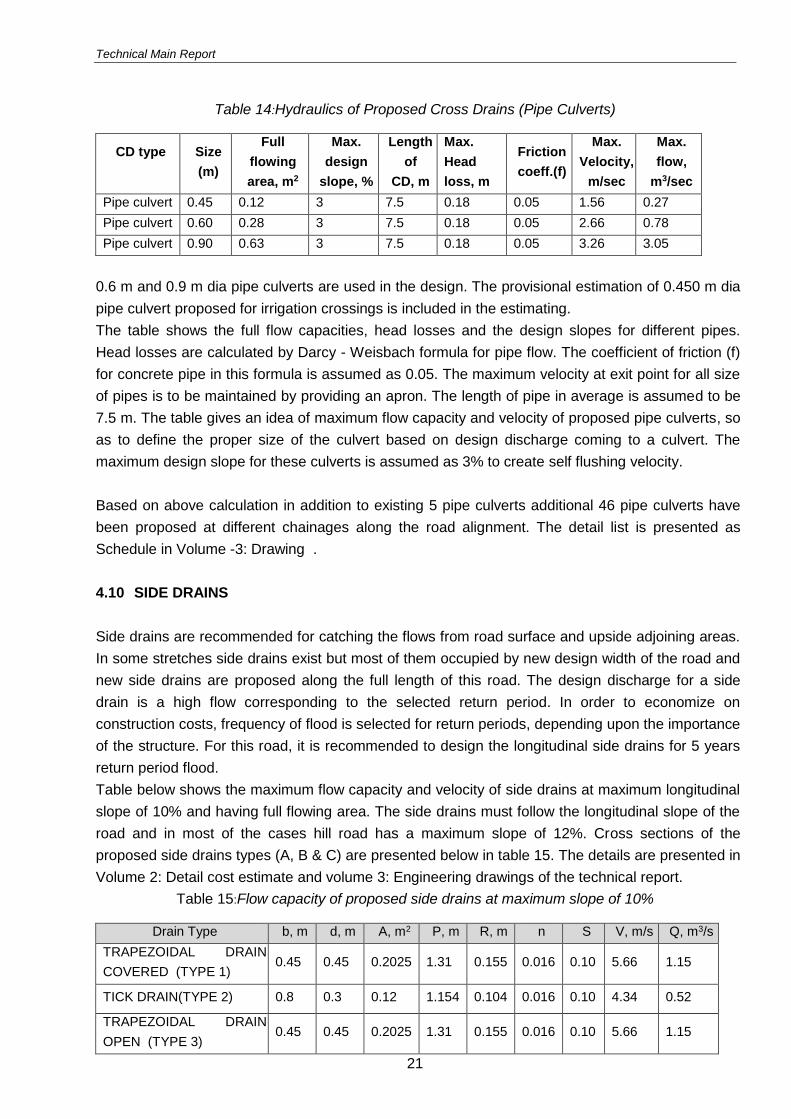
Technical Main Report
21
Table 14:Hydraulics of Proposed Cross Drains (Pipe Culverts)
CD type
Size
(m)
Full
flowing
area, m2
Max.
design
slope, %
Length
of
CD, m
Max.
Head
loss, m
Friction
coeff.(f)
Max.
Velocity,
m/sec
Max.
flow,
m3/sec
Pipe culvert 0.45 0.12 3 7.5 0.18 0.05 1.56 0.27
Pipe culvert 0.60 0.28 3 7.5 0.18 0.05 2.66 0.78
Pipe culvert 0.90 0.63 3 7.5 0.18 0.05 3.26 3.05
0.6 m and 0.9 m dia pipe culverts are used in the design. The provisional estimation of 0.450 m dia
pipe culvert proposed for irrigation crossings is included in the estimating.
The table shows the full flow capacities, head losses and the design slopes for different pipes.
Head losses are calculated by Darcy - Weisbach formula for pipe flow. The coefficient of friction (f)
for concrete pipe in this formula is assumed as 0.05. The maximum velocity at exit point for all size
of pipes is to be maintained by providing an apron. The length of pipe in average is assumed to be
7.5 m. The table gives an idea of maximum flow capacity and velocity of proposed pipe culverts, so
as to define the proper size of the culvert based on design discharge coming to a culvert. The
maximum design slope for these culverts is assumed as 3% to create self flushing velocity.
Based on above calculation in addition to existing 5 pipe culverts additional 46 pipe culverts have
been proposed at different chainages along the road alignment. The detail list is presented as
Schedule in Volume -3: Drawing .
4.10 SIDE DRAINS
Side drains are recommended for catching the flows from road surface and upside adjoining areas.
In some stretches side drains exist but most of them occupied by new design width of the road and
new side drains are proposed along the full length of this road. The design discharge for a side
drain is a high flow corresponding to the selected return period. In order to economize on
construction costs, frequency of flood is selected for return periods, depending upon the importance
of the structure. For this road, it is recommended to design the longitudinal side drains for 5 years
return period flood.
Table below shows the maximum flow capacity and velocity of side drains at maximum longitudinal
slope of 10% and having full flowing area. The side drains must follow the longitudinal slope of the
road and in most of the cases hill road has a maximum slope of 12%. Cross sections of the
proposed side drains types (A, B & C) are presented below in table 15. The details are presented in
Volume 2: Detail cost estimate and volume 3: Engineering drawings of the technical report.
Table 15:Flow capacity of proposed side drains at maximum slope of 10%
Drain Type b, m d, m A, m2 P, m R, m n S V, m/s Q, m3/s
TRAPEZOIDAL DRAIN
COVERED (TYPE 1) 0.45 0.45 0.2025 1.31 0.155 0.016 0.10 5.66 1.15
TICK DRAIN(TYPE 2) 0.8 0.3 0.12 1.154 0.104 0.016 0.10 4.34 0.52
TRAPEZOIDAL DRAIN
OPEN (TYPE 3) 0.45 0.45 0.2025 1.31 0.155 0.016 0.10 5.66 1.15
Technical Main Report
22
5 ENGINEERING DESIGN AND ADOPTED DESIGN
STANDARDS
5.1 GENERAL
Nepal Rural Road Standard (2055) with 2nd Revision, DoLIDAR is followed to design the road.
.
5.2 ROAD CLASSIFICATION
The road falls under the category of District Road Core Network as per NRRS as it connects
village and district headquarters as well as SRN.
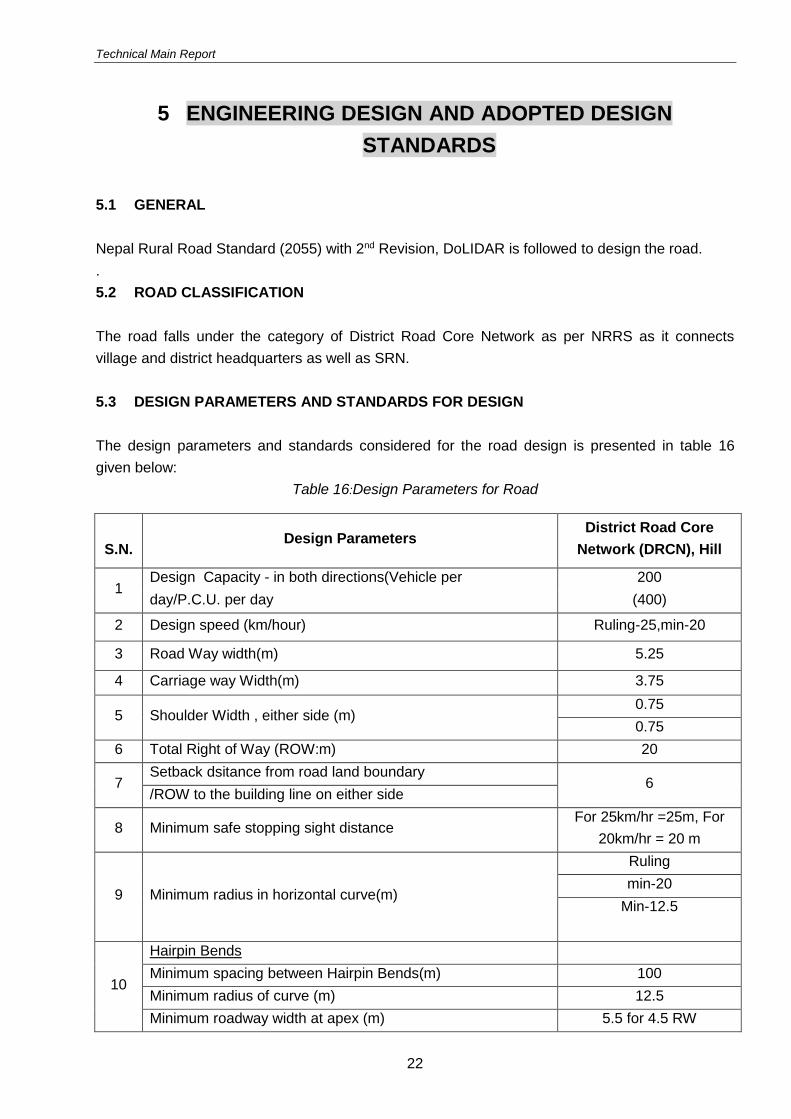
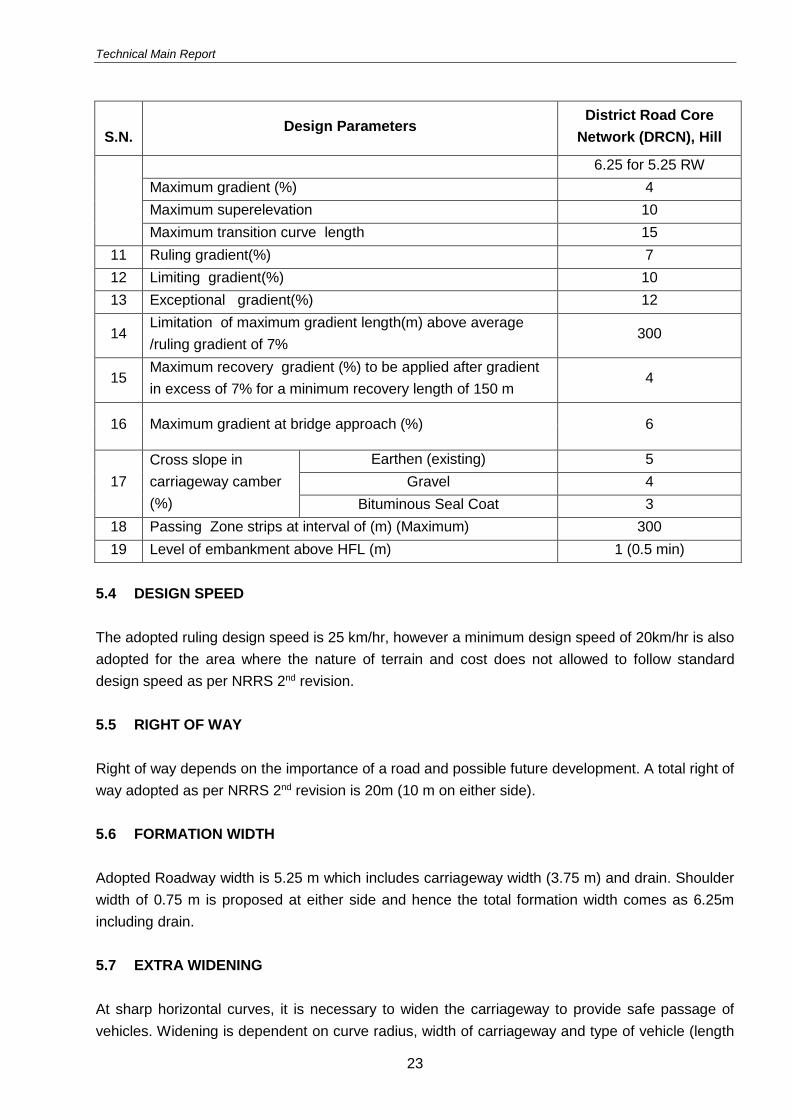
5.3 DESIGN PARAMETERS AND STANDARDS FOR DESIGN
The design parameters and standards considered for the road design is presented in table 16
given below:
Table 16:Design Parameters for Road
S.N. Design Parameters
District Road Core
Network (DRCN), Hill
1 Design Capacity - in both directions(Vehicle per 200
day/P.C.U. per day (400)
2 Design speed (km/hour) Ruling-25,min-20
3 Road Way width(m) 5.25
4 Carriage way Width(m) 3.75
5 Shoulder Width , either side (m) 0.75
0.75
6 Total Right of Way (ROW:m) 20
7 Setback dsitance from road land boundary
6 /ROW to the building line on either side
8 Minimum safe stopping sight distance For 25km/hr =25m, For
20km/hr = 20 m
9 Minimum radius in horizontal curve(m)
Ruling
min-20
Min-12.5
10
Hairpin Bends
Minimum spacing between Hairpin Bends(m) 100
Minimum radius of curve (m) 12.5
Minimum roadway width at apex (m) 5.5 for 4.5 RW
Technical Main Report
23
S.N. Design Parameters
District Road Core
Network (DRCN), Hill
6.25 for 5.25 RW
Maximum gradient (%) 4
Maximum superelevation 10
Maximum transition curve length 15
11 Ruling gradient(%) 7
12 Limiting gradient(%) 10
13 Exceptional gradient(%) 12
14 Limitation of maximum gradient length(m) above average
/ruling gradient of 7% 300
15 Maximum recovery gradient (%) to be applied after gradient
in excess of 7% for a minimum recovery length of 150 m 4
16 Maximum gradient at bridge approach (%) 6
17
Cross slope in
carriageway camber
(%)
Earthen (existing) 5
Gravel 4
Bituminous Seal Coat 3
18 Passing Zone strips at interval of (m) (Maximum) 300
19 Level of embankment above HFL (m) 1 (0.5 min)
5.4 DESIGN SPEED
The adopted ruling design speed is 25 km/hr, however a minimum design speed of 20km/hr is also
adopted for the area where the nature of terrain and cost does not allowed to follow standard
design speed as per NRRS 2nd revision.
5.5 RIGHT OF WAY
Right of way depends on the importance of a road and possible future development. A total right of
way adopted as per NRRS 2nd revision is 20m (10 m on either side).
5.6 FORMATION WIDTH
Adopted Roadway width is 5.25 m which includes carriageway width (3.75 m) and drain. Shoulder
width of 0.75 m is proposed at either side and hence the total formation width comes as 6.25m
including drain.
5.7 EXTRA WIDENING
At sharp horizontal curves, it is necessary to widen the carriageway to provide safe passage of
vehicles. Widening is dependent on curve radius, width of carriageway and type of vehicle (length
Technical Main Report
24
and width).Widening has two components: i) mechanical widening to compensate for the extra
width occupied by the vehicle on the curve due to tracing of the rear wheels, and ii) psychological
widening vehicles in a lane tend to wander more on a curve than on a straight reach.
Since the volume of traffic movement in this road is very low, only mechanical widening is
considered to facilitate the extra width occupied by vehicle. The widening is done in inner part of
the road using the following formula.
We = (L2/ 2R)
Where,
We = Extra widening
N = number of traffic lanes
L = length of wheel base (6.1 m)
R = radius of curve
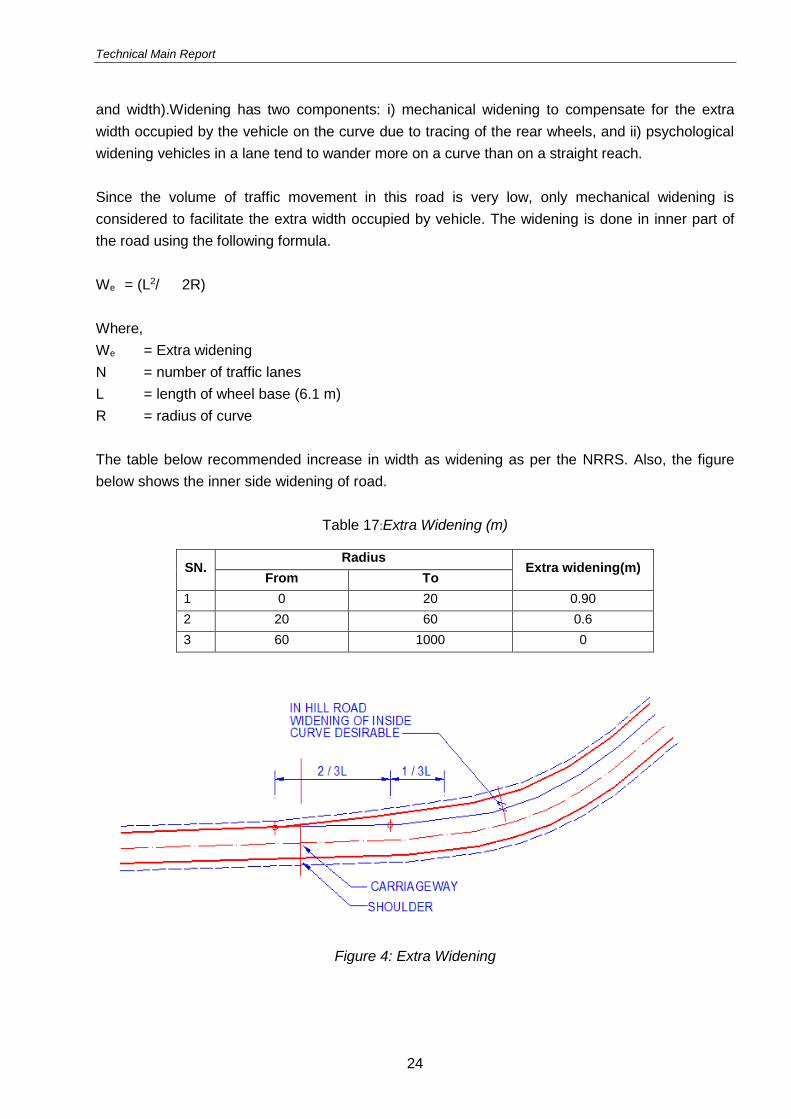
The table below recommended increase in width as widening as per the NRRS. Also, the figure
below shows the inner side widening of road.
Table 17:Extra Widening (m)
SN. Radius
Extra widening(m) From To
1 0 20 0.90
2 20 60 0.6
3 60 1000 0
Figure 4: Extra Widening
Technical Main Report
25
5.8 STOPPING SIGHT DISTANCE
As per the NRRS (refer Table 16:Design Parameters for Road), the adopted stopping site
distance for design speed 25km/hr is 25m and for 20km/hr is 20m.
5.9 HORIZONTAL CURVES
For the alignment of the road where difficult site conditions are in predominance, the minimum
radius of horizontal curves adopted are ruling minimum - 15 m and absolute minimum - 12.5 m
(As per the NRRS - refer Table 16: Design Parameters for Road).
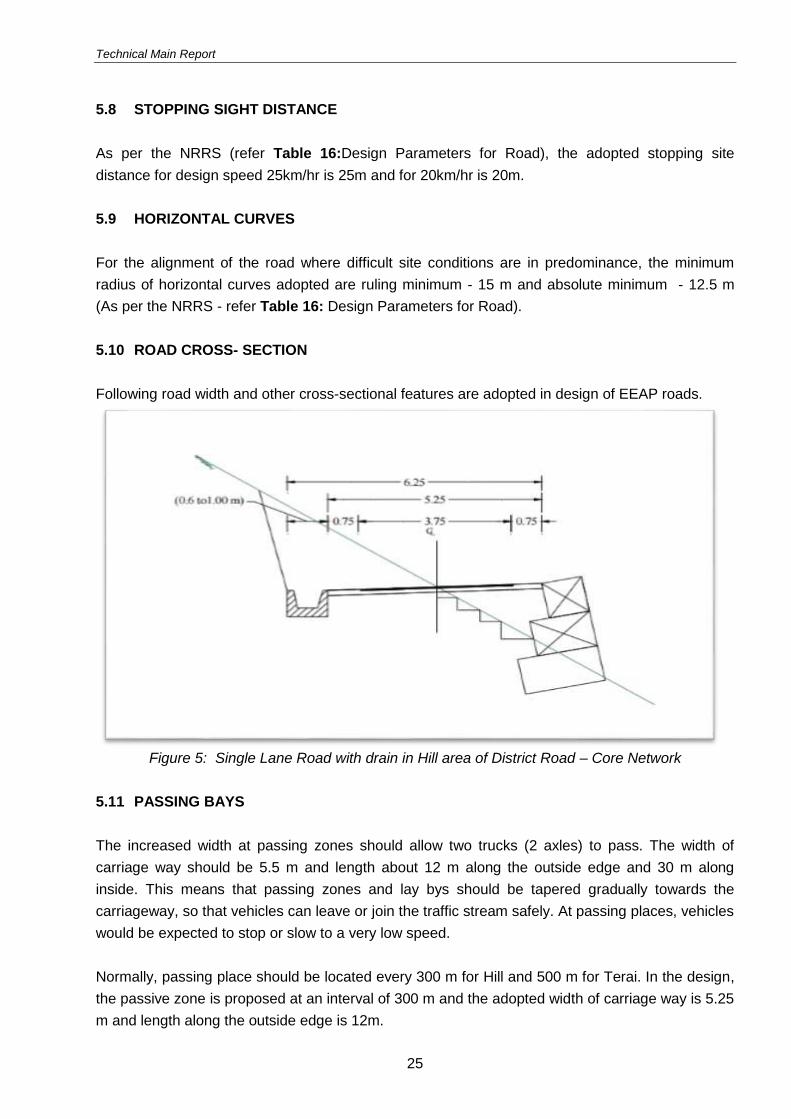
5.10 ROAD CROSS- SECTION
Following road width and other cross-sectional features are adopted in design of EEAP roads.
Figure 5: Single Lane Road with drain in Hill area of District Road – Core Network
5.11 PASSING BAYS
The increased width at passing zones should allow two trucks (2 axles) to pass. The width of
carriage way should be 5.5 m and length about 12 m along the outside edge and 30 m along
inside. This means that passing zones and lay bys should be tapered gradually towards the
carriageway, so that vehicles can leave or join the traffic stream safely. At passing places, vehicles
would be expected to stop or slow to a very low speed.
Normally, passing place should be located every 300 m for Hill and 500 m for Terai. In the design,
the passive zone is proposed at an interval of 300 m and the adopted width of carriage way is 5.25
m and length along the outside edge is 12m.
Technical Main Report
26
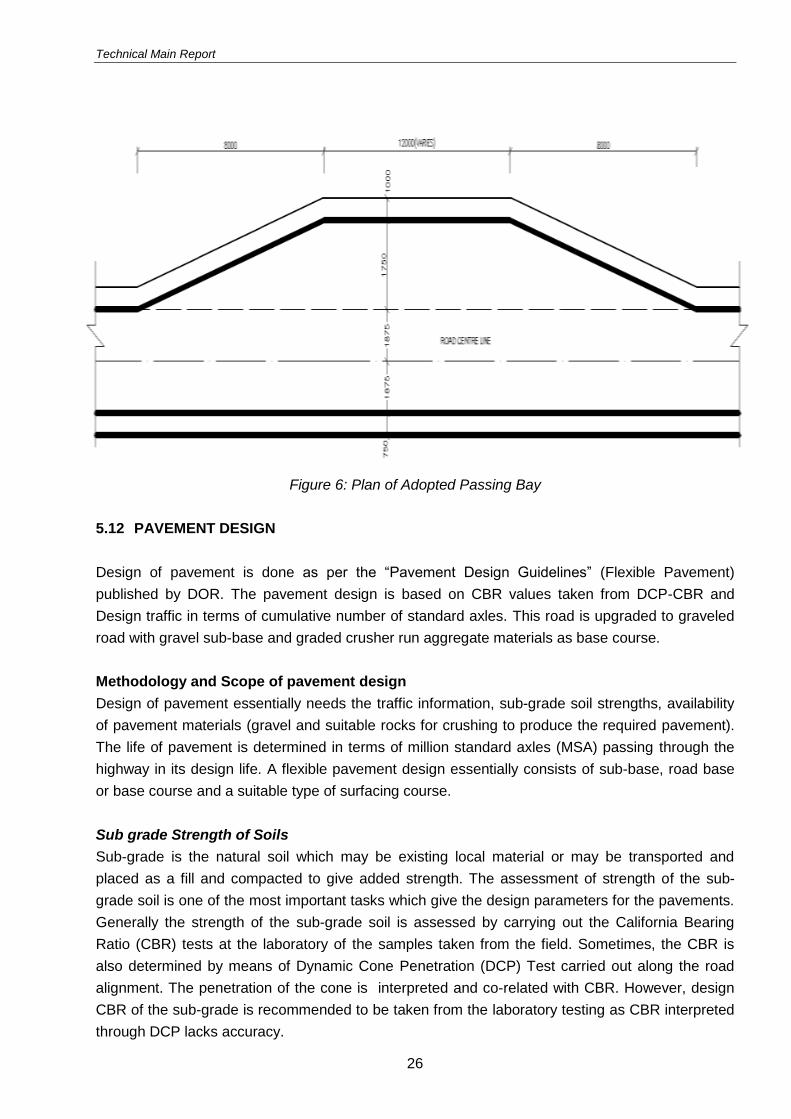
Figure 6: Plan of Adopted Passing Bay
5.12 PAVEMENT DESIGN
Design of pavement is done as per the “Pavement Design Guidelines” (Flexible Pavement)
published by DOR. The pavement design is based on CBR values taken from DCP-CBR and
Design traffic in terms of cumulative number of standard axles. This road is upgraded to graveled
road with gravel sub-base and graded crusher run aggregate materials as base course.
Methodology and Scope of pavement design
Design of pavement essentially needs the traffic information, sub-grade soil strengths, availability
of pavement materials (gravel and suitable rocks for crushing to produce the required pavement).
The life of pavement is determined in terms of million standard axles (MSA) passing through the
highway in its design life. A flexible pavement design essentially consists of sub-base, road base
or base course and a suitable type of surfacing course.
Sub grade Strength of Soils
Sub-grade is the natural soil which may be existing local material or may be transported and
placed as a fill and compacted to give added strength. The assessment of strength of the sub-
grade soil is one of the most important tasks which give the design parameters for the pavements.
Generally the strength of the sub-grade soil is assessed by carrying out the California Bearing
Ratio (CBR) tests at the laboratory of the samples taken from the field. Sometimes, the CBR is
also determined by means of Dynamic Cone Penetration (DCP) Test carried out along the road
alignment. The penetration of the cone is interpreted and co-related with CBR. However, design
CBR of the sub-grade is recommended to be taken from the laboratory testing as CBR interpreted
through DCP lacks accuracy.
Technical Main Report
27
a. Design Life of the Pavement
Design life of a pavement is measured in terms of cumulative number of standard axles passing
through the pavement in its entire life. The standard axle is considered to be 8160 kg load in an
axle of a vehicle as established by the AASHO road test. The conversion factor for the measured
axle load to the standard axle lies in the exponent of 4 to 5. It is taken 4.55 for Nepal as suggested
by TRRL. All axle loads of commercial vehicles are converted into standard axle loads and added
together to get the cumulative number expressed in million standard axles (msa) considering the
annual growth of traffic for the design life of pavement which could be between 10 to 15 years for a
developing country like Nepal. Sub-grade strength in one hand and the design life msa in the other
hand, the thickness of different structure layers of the pavement will be designed. There are
various methods available for the design of pavement.
b. Sub-base
This forms a load distributing layer below the road base. Sub-base material essentially consists of
naturally occurring gravel, gravel sand or gravel clay or the crushed rock or suitable material which
meets the strength criteria and forms the lowermost layer of pavement structure. This layer serves
as separating layer for the overlaying road base thus preventing contamination of the road base by
the sub grade. This has also another important role to play that it protects the sub-grade from
damage due to traffic. The thickness of sub-base is determined by the design and laid in
accordance with the specified manner.
c. Road Base
This acts as the main load spreading layer for the pavement. This normally consists of crushed
rock or gravel or of gravelly soils, decomposed rock, sands and sand clays stabilized with cement,
lime or bitumen. Sometimes, premixed asphalt is also laid on top of the road base and they are
called base course.
5.13 INVESTIGATION OF EXISTING SUB-GRADE
In road construction, there is a need to assess the adequacy of a sub-grade to behave
satisfactorily beneath a pavement. Proper pavement performance requires a satisfactorily
performing sub grade. DCPT can be used to evaluate the mechanical properties of sub-grade
soils.
DCP Tests
The Dynamic Cone Penetrometer (DCP) is a simple testing device used to estimate the in situ
shear strength of soil and granular materials used in roadways and other construction related
projects. The apparatus consists of 16mm diameter steel rod in which a tempered steel cone with
a 20 mm base diameter and a 60 degree point angle is attached. The DCP is driven into the soil
by a 8kg hammer with a free fall of 575mm. The hammer correction factor is unity for 8kg hammer.
The DCP index or reading is defined as the penetration depth (D) in mm for a single drop of
hammer. The cone is driven in to the ground upto the desired depth and average DCP index is
Technical Main Report
28
calculated for a single blow. The desired depth could be the depth till difference in the penetration
value comes very close to each other.
DCP testing consists of using the DCP’s free-falling hammer to strike the cone, causing the cone
to penetrate the base or subgrade soil, and then measuring the penetration per blow, also called
the penetration rate (PR), in mm/blow. This measurement denotes the stiffness of the tested
material, with a smaller PR number indicating a stiffer material. In other words, the PR is a
measurement of the penetrability of the subgrade soil.
The CBR value of uniform soils having similar characteristics can be determined quickly and with
adequate accuracy using the DCPT results. The correlation is established between CBR index for
tests conducted under different conditions and compaction level or in-situ density. The soaked
CBR value in the field can be determined very quickly by conducting the in-situ DCPT for existing
conditions and using the CBR value for that particular condition.
DCPT results consist of number of blow counts versus penetration depth. Since the recorded blow
counts are cumulative values, results of DCPT in general are given as incremental values defined
as follows:
BC
DPI
p
[Oversees Road Note 31, 4th edition, 1993]
Where,
PI = DCP penetration index in units of length divided by blow count;
ΔDp = penetration depth;
BC = blow counts corresponding to penetration depth ΔDp. As a result, values of the
penetration index (PI) represent DCPT characteristics at certain depths.
The investigation of existing sub-grade was carried out using Dynamic Cone Penetration (DCP)
equipment to find out the CBR value of the subgrade using DCP test. The DCP test was carried
out at 500 m interval.
There are several empirical relationships to calculate the CBR from DCP test. Some of the
empirical co-relationships mentioned in oversees road note 31 is shown below:
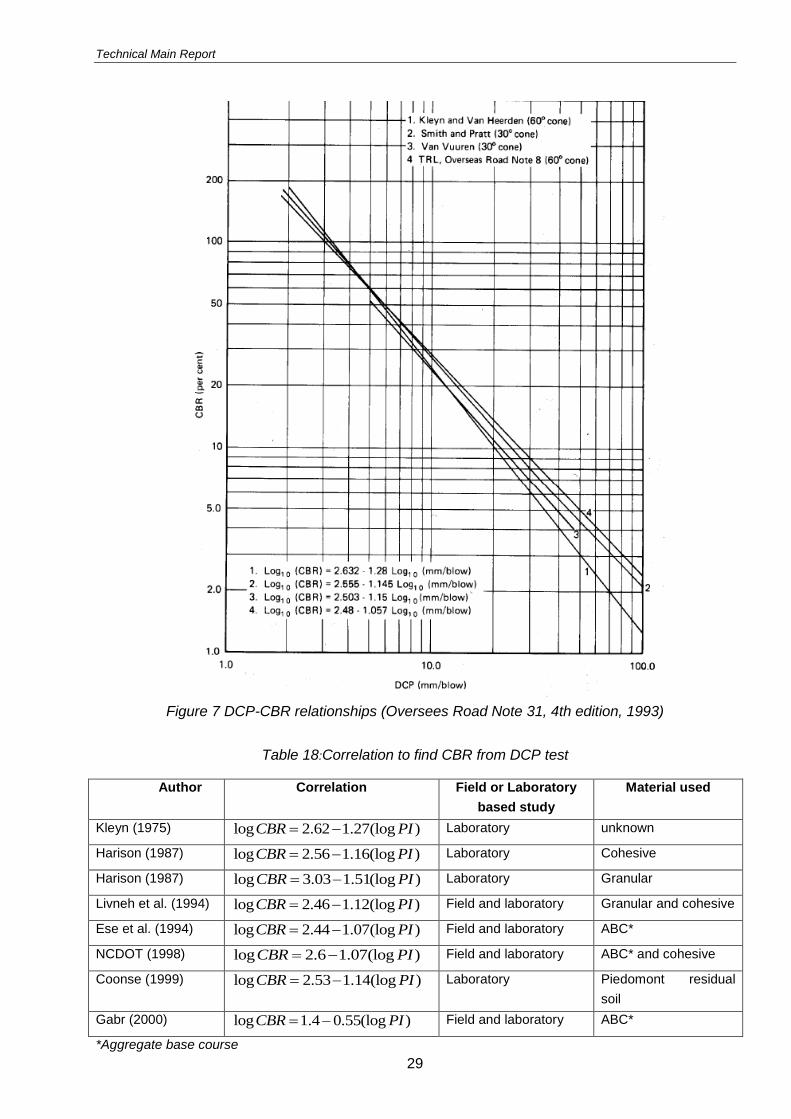
Technical Main Report
29
Figure 7 DCP-CBR relationships (Oversees Road Note 31, 4th edition, 1993)
Table 18:Correlation to find CBR from DCP test
Author Correlation Field or Laboratory
based study
Material used
Kleyn (1975) log 2.62 1.27(log )CBR PI Laboratory unknown
Harison (1987) log 2.56 1.16(log )CBR PI Laboratory Cohesive
Harison (1987) log 3.03 1.51(log )CBR PI Laboratory Granular
Livneh et al. (1994) log 2.46 1.12(log )CBR PI Field and laboratory Granular and cohesive
Ese et al. (1994) log 2.44 1.07(log )CBR PI Field and laboratory ABC*
NCDOT (1998) log 2.6 1.07(log )CBR PI Field and laboratory ABC* and cohesive
Coonse (1999) log 2.53 1.14(log )CBR PI Laboratory Piedomont residual
soil
Gabr (2000) log 1.4 0.55(log )CBR PI Field and laboratory ABC*
*Aggregate base course
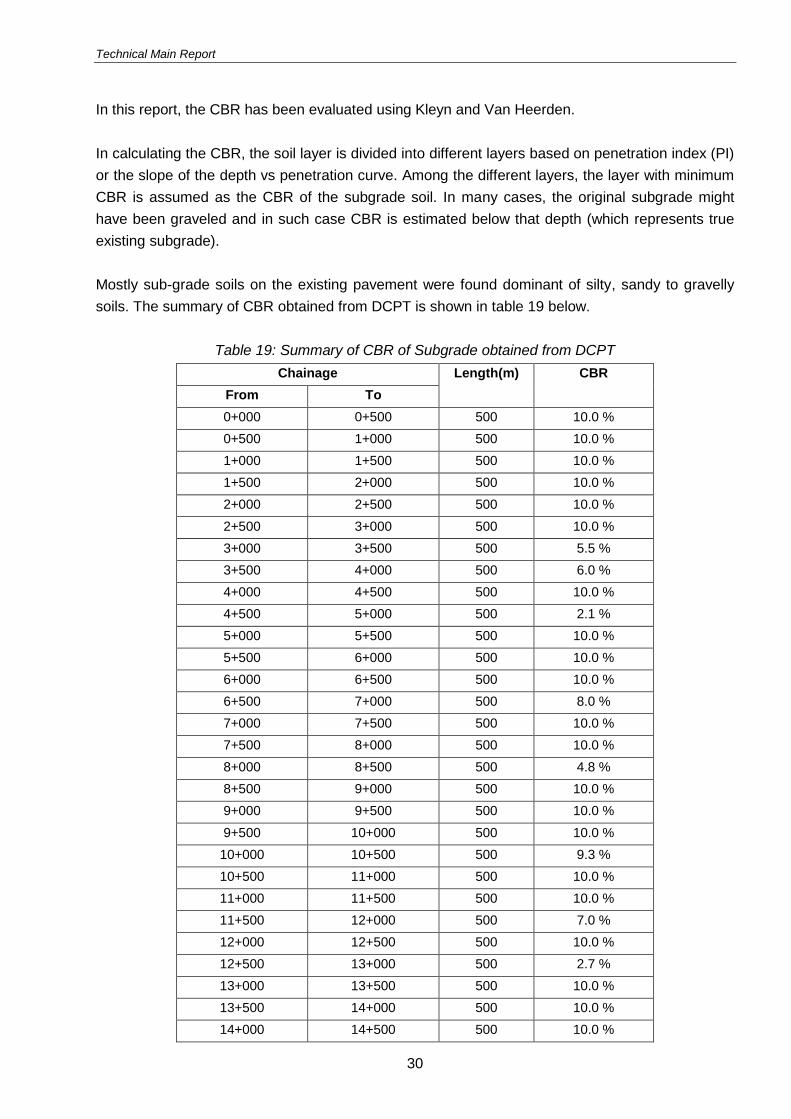
Technical Main Report
30
In this report, the CBR has been evaluated using Kleyn and Van Heerden.
In calculating the CBR, the soil layer is divided into different layers based on penetration index (PI)
or the slope of the depth vs penetration curve. Among the different layers, the layer with minimum
CBR is assumed as the CBR of the subgrade soil. In many cases, the original subgrade might
have been graveled and in such case CBR is estimated below that depth (which represents true
existing subgrade).
Mostly sub-grade soils on the existing pavement were found dominant of silty, sandy to gravelly
soils. The summary of CBR obtained from DCPT is shown in table 19 below.
Table 19: Summary of CBR of Subgrade obtained from DCPT
Chainage Length(m) CBR
From To
0+000 0+500 500 10.0 %
0+500 1+000 500 10.0 %
1+000 1+500 500 10.0 %
1+500 2+000 500 10.0 %
2+000 2+500 500 10.0 %
2+500 3+000 500 10.0 %
3+000 3+500 500 5.5 %
3+500 4+000 500 6.0 %
4+000 4+500 500 10.0 %
4+500 5+000 500 2.1 %
5+000 5+500 500 10.0 %
5+500 6+000 500 10.0 %
6+000 6+500 500 10.0 %
6+500 7+000 500 8.0 %
7+000 7+500 500 10.0 %
7+500 8+000 500 10.0 %
8+000 8+500 500 4.8 %
8+500 9+000 500 10.0 %
9+000 9+500 500 10.0 %
9+500 10+000 500 10.0 %
10+000 10+500 500 9.3 %
10+500 11+000 500 10.0 %
11+000 11+500 500 10.0 %
11+500 12+000 500 7.0 %
12+000 12+500 500 10.0 %
12+500 13+000 500 2.7 %
13+000 13+500 500 10.0 %
13+500 14+000 500 10.0 %
14+000 14+500 500 10.0 %
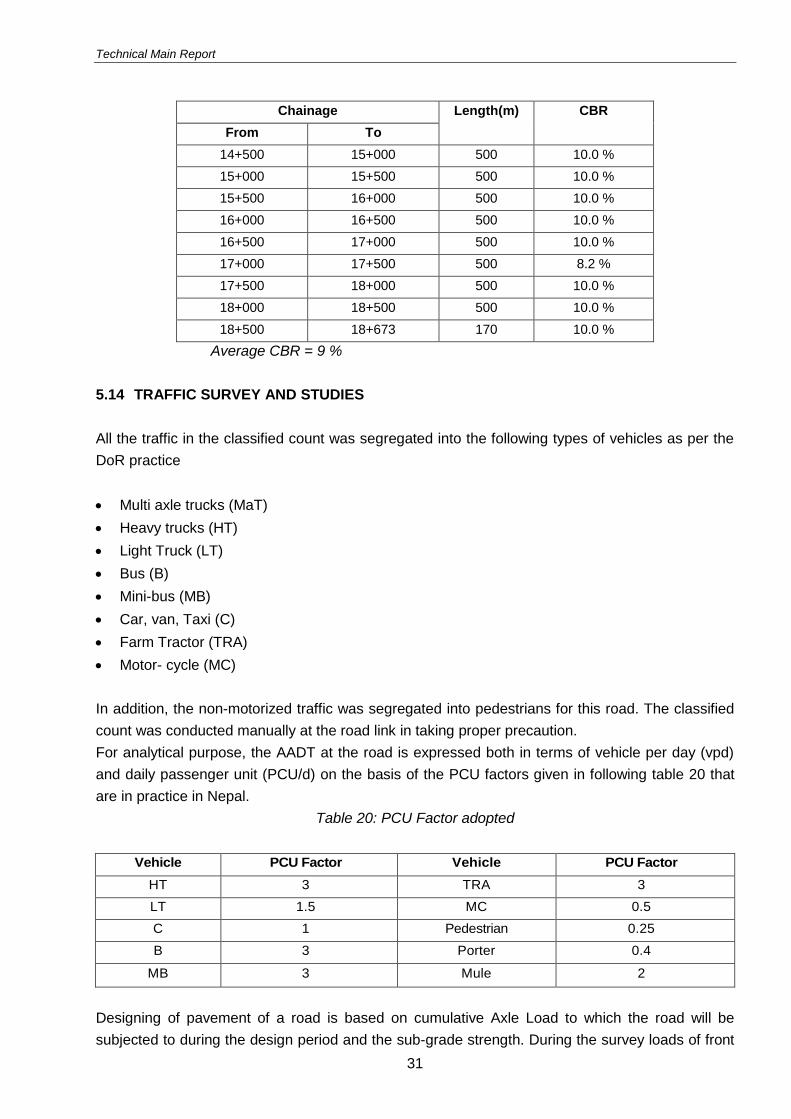
Technical Main Report
31
Chainage Length(m) CBR
From To
14+500 15+000 500 10.0 %
15+000 15+500 500 10.0 %
15+500 16+000 500 10.0 %
16+000 16+500 500 10.0 %
16+500 17+000 500 10.0 %
17+000 17+500 500 8.2 %
17+500 18+000 500 10.0 %
18+000 18+500 500 10.0 %
18+500 18+673 170 10.0 %
Average CBR = 9 %
5.14 TRAFFIC SURVEY AND STUDIES
All the traffic in the classified count was segregated into the following types of vehicles as per the
DoR practice
Multi axle trucks (MaT)
Heavy trucks (HT)
Light Truck (LT)
Bus (B)
Mini-bus (MB)
Car, van, Taxi (C)
Farm Tractor (TRA)
Motor- cycle (MC)
In addition, the non-motorized traffic was segregated into pedestrians for this road. The classified
count was conducted manually at the road link in taking proper precaution.
For analytical purpose, the AADT at the road is expressed both in terms of vehicle per day (vpd)
and daily passenger unit (PCU/d) on the basis of the PCU factors given in following table 20 that
are in practice in Nepal.
Table 20: PCU Factor adopted
Vehicle PCU Factor Vehicle PCU Factor
HT 3 TRA 3
LT 1.5 MC 0.5
C 1 Pedestrian 0.25
B 3 Porter 0.4
MB 3 Mule 2
Designing of pavement of a road is based on cumulative Axle Load to which the road will be
subjected to during the design period and the sub-grade strength. During the survey loads of front
Technical Main Report
32
wheels and rear wheels of trucks and buses running in opposite directions are measured using
portable weighting scales. Equivalent Factor (EFs) of trucks and buses are calculated by using
following formula (Refer : DoR /Pavement Design Guidelines - Flexible Pavement).
EF = (Total Axle Load/8.16)^4.5
The axle load survey could not be carried out as the road was in very poor condition and not used
by conventional vehicles on a regular basis to obtained valid representative equivalent factors.
5.15 ESTIMATION OF TRAFFIC DATA
Normal and Diverted Traffic Data
To forecast future traffic of a road section after improvement or after construction, it is first
necessary to estimate the level of base year normal traffic of the existing road or track. Generally,
base year volume and composition of normal traffic movements in the existing road are calculated
through Classified Manual Vehicle Counts (CMVCs) or Origin and Destination (O-D) surveys.
Seasonal traffic influences are usually associated with agricultural activities and rainfall. During the
harvesting season, traffic levels are increased due to more movements of labour, transport of
harvested crops and an increase in other associated activities. The impact of rainfall on traffic level
is due to disruptions caused by damage to roads and slides. DoR has developed a set of monthly
traffic seasonal adjustment factors for general use based on the traffic data obtained from regular
counts in different stations on strategic roads.
Generated Traffic
Additional journeys can be expected as a result of lower costs of travel. The principle behind
generated traffic is that additional journeys will be made as a result of lower costs of travel on the
improved roads. The number of additional trips is usually based on the reduction in travel and
transport costs, with the response based on the price elasticity. Similar to demand elasticity, price
elasticity is the proportional change in the number of trips per unit change in price. It has been
measured in road appraisal studies in developing countries and usually found to fall in the range -
0.6 to -2.0, with an average of about -1.0. This means that a one per cent decrease in transport
costs leads, on average, to a one per cent increase in traffic. Evidence suggests that the elasticity
of demand for passenger transport is well above that for freight transport. The cost reduction
following improvement depends largely on the existing condition of the track/road. Reductions of
travel and transport costs by 30 to 40 percent can be expected in the case of track or unsealed
roads. With improvements to sealed roads the cost reduction will normally be below 25 percent,
and it is normally considered that there is no significant generation below this level.
Keeping in mind all the above possibilities and difficulties, a generation rate of 15 percent is
assumed to current freight traffic and 40 percent to passenger traffic.
Induced Traffic
Induced traffic can occur when the increased economic growth, as a result of the road
improvement, produces additional traffic on the road. This is not generated traffic, which is
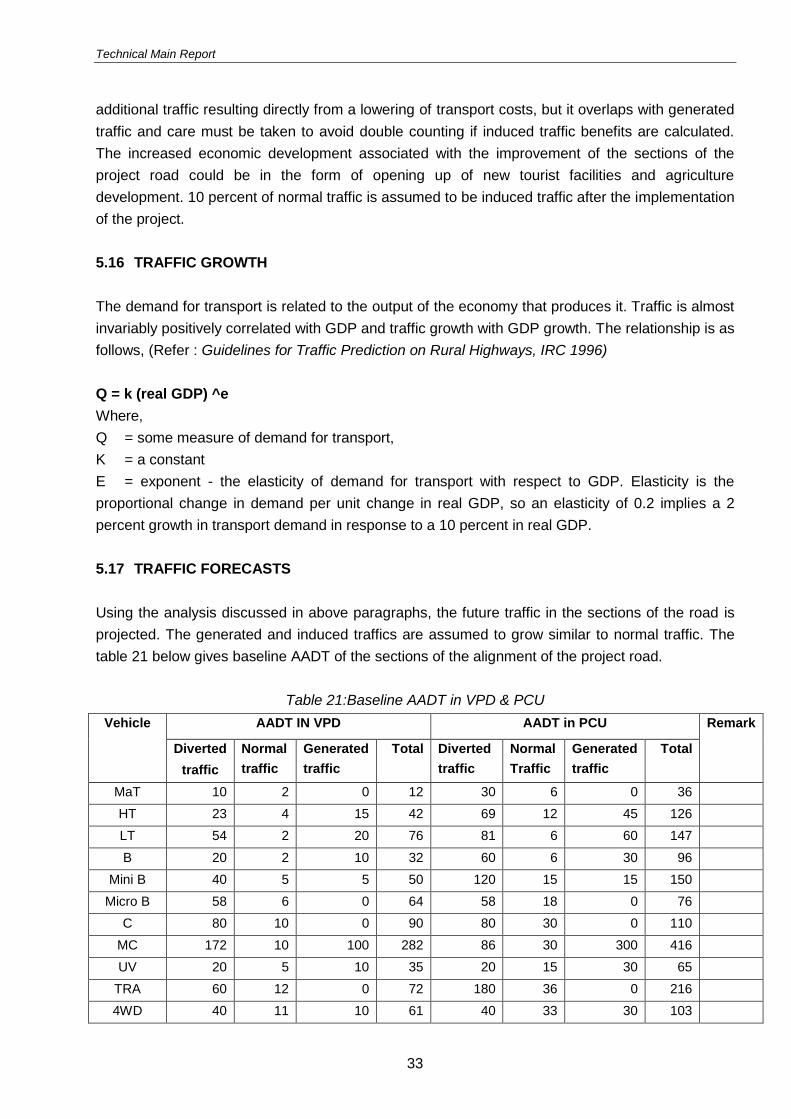
Technical Main Report
33
additional traffic resulting directly from a lowering of transport costs, but it overlaps with generated
traffic and care must be taken to avoid double counting if induced traffic benefits are calculated.
The increased economic development associated with the improvement of the sections of the
project road could be in the form of opening up of new tourist facilities and agriculture
development. 10 percent of normal traffic is assumed to be induced traffic after the implementation
of the project.
5.16 TRAFFIC GROWTH
The demand for transport is related to the output of the economy that produces it. Traffic is almost
invariably positively correlated with GDP and traffic growth with GDP growth. The relationship is as
follows, (Refer : Guidelines for Traffic Prediction on Rural Highways, IRC 1996)
Q = k (real GDP) ^e
Where,
Q = some measure of demand for transport,
K = a constant
E = exponent - the elasticity of demand for transport with respect to GDP. Elasticity is the
proportional change in demand per unit change in real GDP, so an elasticity of 0.2 implies a 2
percent growth in transport demand in response to a 10 percent in real GDP.
5.17 TRAFFIC FORECASTS
Using the analysis discussed in above paragraphs, the future traffic in the sections of the road is
projected. The generated and induced traffics are assumed to grow similar to normal traffic. The
table 21 below gives baseline AADT of the sections of the alignment of the project road.
Table 21:Baseline AADT in VPD & PCU
Vehicle AADT IN VPD AADT in PCU Remark
Diverted
traffic
Normal
traffic
Generated
traffic
Total Diverted
traffic
Normal
Traffic
Generated
traffic
Total
MaT 10 2 0 12 30 6 0 36
HT 23 4 15 42 69 12 45 126
LT 54 2 20 76 81 6 60 147
B 20 2 10 32 60 6 30 96
Mini B 40 5 5 50 120 15 15 150
Micro B 58 6 0 64 58 18 0 76
C 80 10 0 90 80 30 0 110
MC 172 10 100 282 86 30 300 416
UV 20 5 10 35 20 15 30 65
TRA 60 12 0 72 180 36 0 216
4WD 40 11 10 61 40 33 30 103
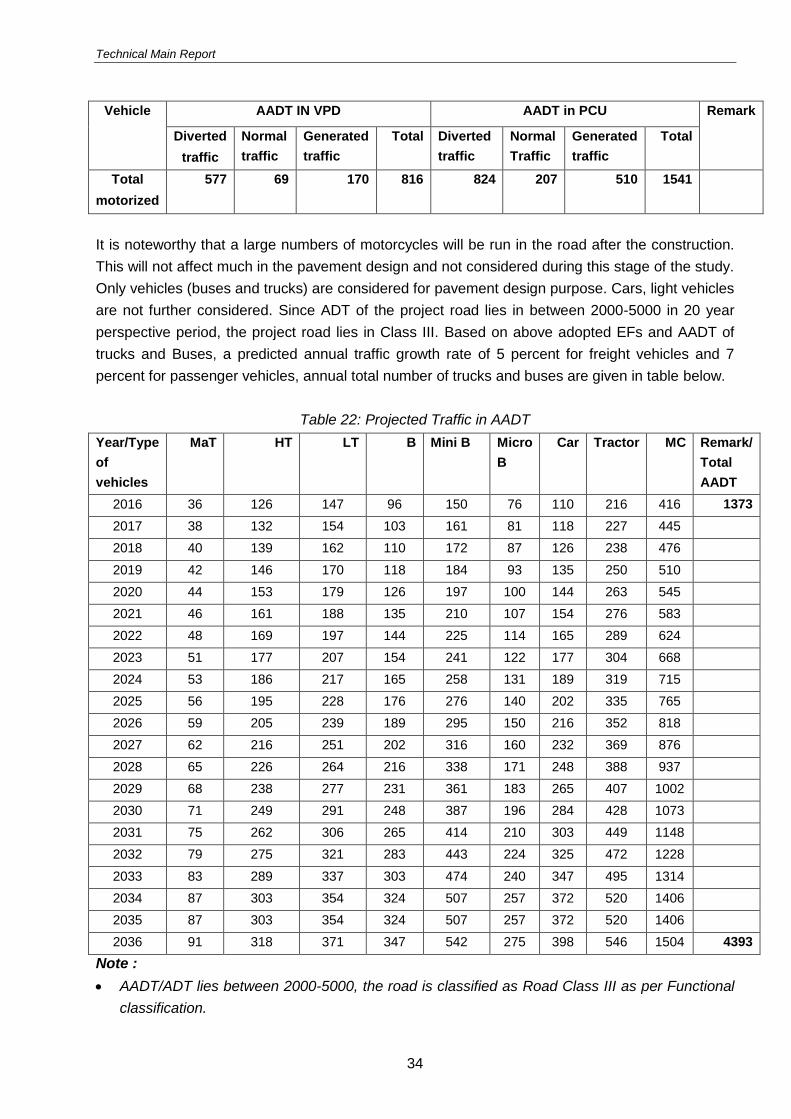
Technical Main Report
34
Vehicle AADT IN VPD AADT in PCU Remark
Diverted
traffic
Normal
traffic
Generated
traffic
Total Diverted
traffic
Normal
Traffic
Generated
traffic
Total
Total
motorized
577 69 170 816 824 207 510 1541
It is noteworthy that a large numbers of motorcycles will be run in the road after the construction.
This will not affect much in the pavement design and not considered during this stage of the study.
Only vehicles (buses and trucks) are considered for pavement design purpose. Cars, light vehicles
are not further considered. Since ADT of the project road lies in between 2000-5000 in 20 year
perspective period, the project road lies in Class III. Based on above adopted EFs and AADT of
trucks and Buses, a predicted annual traffic growth rate of 5 percent for freight vehicles and 7
percent for passenger vehicles, annual total number of trucks and buses are given in table below.
Table 22: Projected Traffic in AADT
Year/Type
of
vehicles
MaT HT LT B Mini B Micro
B
Car Tractor MC Remark/
Total
AADT
2016 36 126 147 96 150 76 110 216 416 1373
2017 38 132 154 103 161 81 118 227 445
2018 40 139 162 110 172 87 126 238 476
2019 42 146 170 118 184 93 135 250 510
2020 44 153 179 126 197 100 144 263 545
2021 46 161 188 135 210 107 154 276 583
2022 48 169 197 144 225 114 165 289 624
2023 51 177 207 154 241 122 177 304 668
2024 53 186 217 165 258 131 189 319 715
2025 56 195 228 176 276 140 202 335 765
2026 59 205 239 189 295 150 216 352 818
2027 62 216 251 202 316 160 232 369 876
2028 65 226 264 216 338 171 248 388 937
2029 68 238 277 231 361 183 265 407 1002
2030 71 249 291 248 387 196 284 428 1073
2031 75 262 306 265 414 210 303 449 1148
2032 79 275 321 283 443 224 325 472 1228
2033 83 289 337 303 474 240 347 495 1314
2034 87 303 354 324 507 257 372 520 1406
2035 87 303 354 324 507 257 372 520 1406
2036 91 318 371 347 542 275 398 546 1504 4393
Note :
AADT/ADT lies between 2000-5000, the road is classified as Road Class III as per Functional
classification.
Technical Main Report
35
MaT=Medium Truck HL=Heavy Truck LT=Light Truck B=Bus Micro B=Micro
Bus
5.18 DESIGN LOADING FOR PAVEMENT DESIGN
The design traffic is considered in terms of cumulative number of standard axles (in the particular
lane carrying maximum traffic) to be carried for the design life of the pavement. This can be
computed as
N= [365{(1+r)^n -1}/r] *A*D*F
(Refer : DoR /Pavement Design Guidelines - Flexible Pavement – 2013)
Where,
N = the cumulative number of standard axles to be catered for in the design in terms of msa
A =Initial traffic in the year of completion of construction in terms of number of commercial
vehicles per day
D = Lane distribution factor
F = Vehicle damage factor
n = Design life in year
r =annual growth rate of commercial vehicle (in the absence of detail traffic study r can be
taken as 7% i.e0.07)
The traffic in the year of completion is estimated using the following formula: A*(1+r)^ x
Where,
P = number of commercial vehicles as per the last traffic count;
X = number of years between the last traffic count and the year of completion of construction.
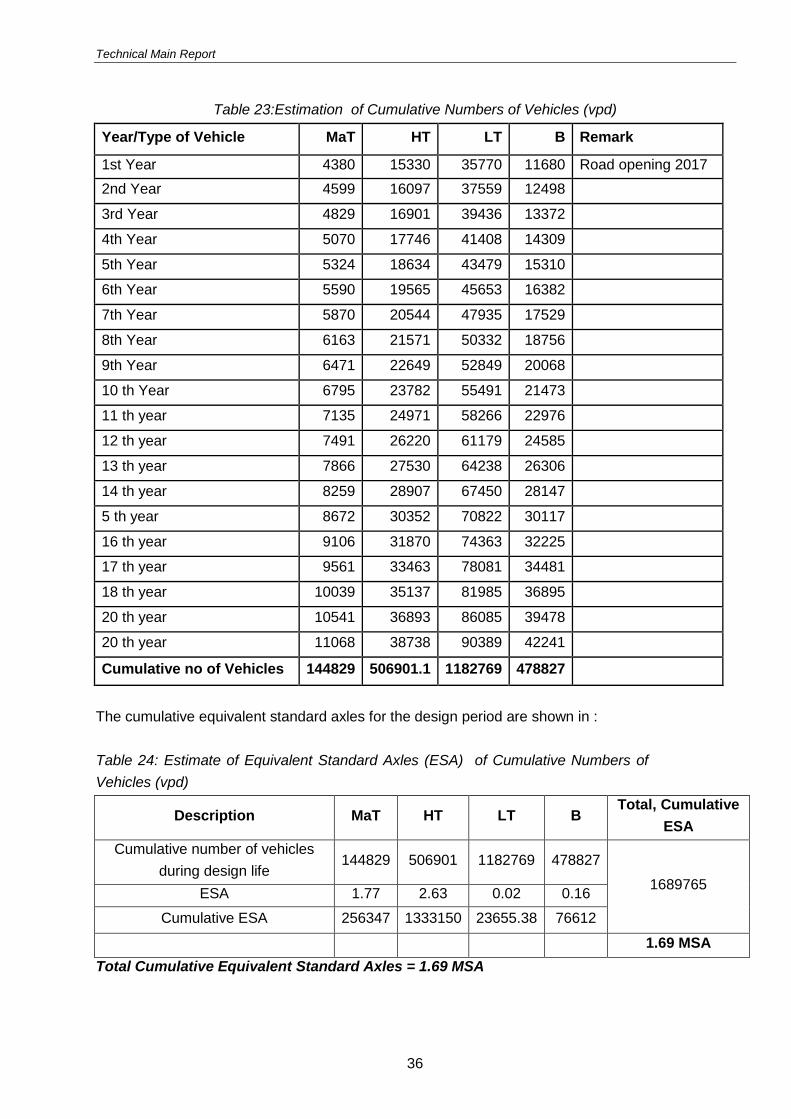
Technical Main Report
36
Table 23:Estimation of Cumulative Numbers of Vehicles (vpd)
Year/Type of Vehicle MaT HT LT B Remark
1st Year 4380 15330 35770 11680 Road opening 2017
2nd Year 4599 16097 37559 12498
3rd Year 4829 16901 39436 13372
4th Year 5070 17746 41408 14309
5th Year 5324 18634 43479 15310
6th Year 5590 19565 45653 16382
7th Year 5870 20544 47935 17529
8th Year 6163 21571 50332 18756
9th Year 6471 22649 52849 20068
10 th Year 6795 23782 55491 21473
11 th year 7135 24971 58266 22976
12 th year 7491 26220 61179 24585
13 th year 7866 27530 64238 26306
14 th year 8259 28907 67450 28147
5 th year 8672 30352 70822 30117
16 th year 9106 31870 74363 32225
17 th year 9561 33463 78081 34481
18 th year 10039 35137 81985 36895
20 th year 10541 36893 86085 39478
20 th year 11068 38738 90389 42241
Cumulative no of Vehicles 144829 506901.1 1182769 478827
The cumulative equivalent standard axles for the design period are shown in :
Table 24: Estimate of Equivalent Standard Axles (ESA) of Cumulative Numbers of
Vehicles (vpd)
Description MaT HT LT B Total, Cumulative
ESA
Cumulative number of vehicles
during design life 144829 506901 1182769 478827
1689765 ESA 1.77 2.63 0.02 0.16
Cumulative ESA 256347 1333150 23655.38 76612
1.69 MSA
Total Cumulative Equivalent Standard Axles = 1.69 MSA
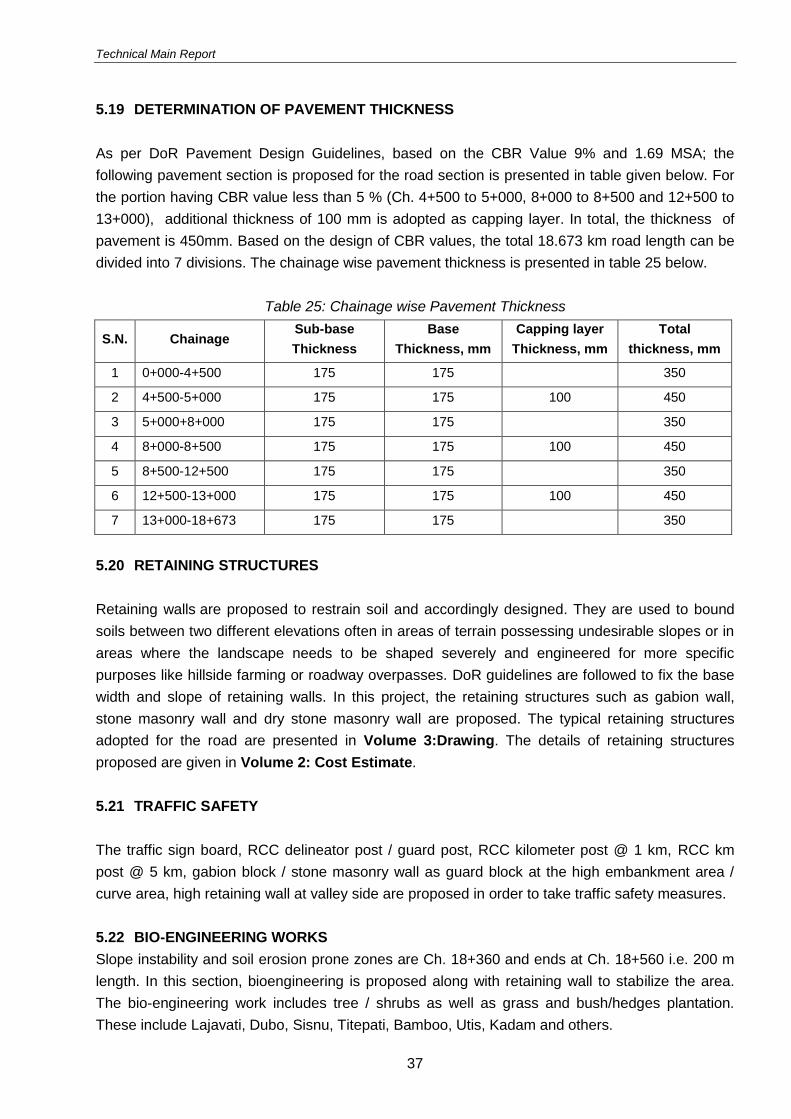
Technical Main Report
37
5.19 DETERMINATION OF PAVEMENT THICKNESS
As per DoR Pavement Design Guidelines, based on the CBR Value 9% and 1.69 MSA; the
following pavement section is proposed for the road section is presented in table given below. For
the portion having CBR value less than 5 % (Ch. 4+500 to 5+000, 8+000 to 8+500 and 12+500 to
13+000), additional thickness of 100 mm is adopted as capping layer. In total, the thickness of
pavement is 450mm. Based on the design of CBR values, the total 18.673 km road length can be
divided into 7 divisions. The chainage wise pavement thickness is presented in table 25 below.
Table 25: Chainage wise Pavement Thickness
S.N. Chainage Sub-base
Thickness
Base
Thickness, mm
Capping layer
Thickness, mm
Total
thickness, mm
1 0+000-4+500 175 175
350
2 4+500-5+000 175 175 100 450
3 5+000+8+000 175 175
350
4 8+000-8+500 175 175 100 450
5 8+500-12+500 175 175
350
6 12+500-13+000 175 175 100 450
7 13+000-18+673 175 175
350
5.20 RETAINING STRUCTURES
Retaining walls are proposed to restrain soil and accordingly designed. They are used to bound
soils between two different elevations often in areas of terrain possessing undesirable slopes or in
areas where the landscape needs to be shaped severely and engineered for more specific
purposes like hillside farming or roadway overpasses. DoR guidelines are followed to fix the base
width and slope of retaining walls. In this project, the retaining structures such as gabion wall,
stone masonry wall and dry stone masonry wall are proposed. The typical retaining structures
adopted for the road are presented in Volume 3:Drawing. The details of retaining structures
proposed are given in Volume 2: Cost Estimate.
5.21 TRAFFIC SAFETY
The traffic sign board, RCC delineator post / guard post, RCC kilometer post @ 1 km, RCC km
post @ 5 km, gabion block / stone masonry wall as guard block at the high embankment area /
curve area, high retaining wall at valley side are proposed in order to take traffic safety measures.
5.22 BIO-ENGINEERING WORKS
Slope instability and soil erosion prone zones are Ch. 18+360 and ends at Ch. 18+560 i.e. 200 m
length. In this section, bioengineering is proposed along with retaining wall to stabilize the area.
The bio-engineering work includes tree / shrubs as well as grass and bush/hedges plantation.
These include Lajavati, Dubo, Sisnu, Titepati, Bamboo, Utis, Kadam and others.
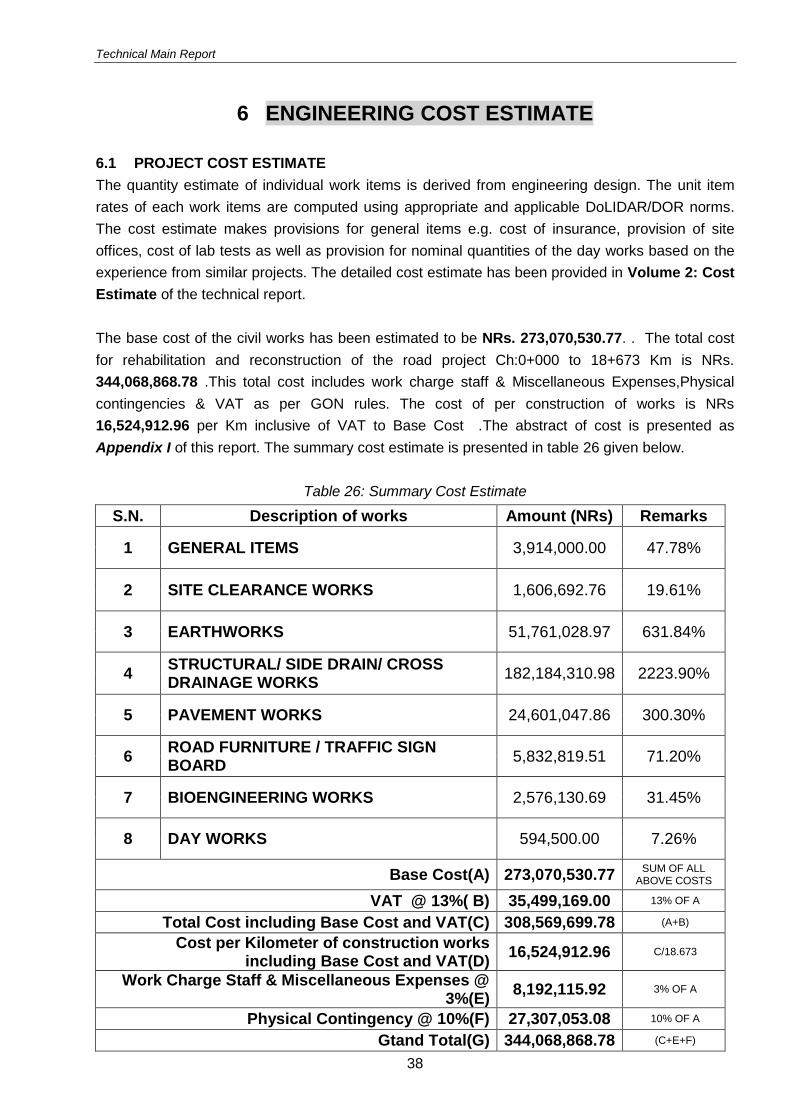
Technical Main Report
38
6 ENGINEERING COST ESTIMATE
6.1 PROJECT COST ESTIMATE
The quantity estimate of individual work items is derived from engineering design. The unit item
rates of each work items are computed using appropriate and applicable DoLIDAR/DOR norms.
The cost estimate makes provisions for general items e.g. cost of insurance, provision of site
offices, cost of lab tests as well as provision for nominal quantities of the day works based on the
experience from similar projects. The detailed cost estimate has been provided in Volume 2: Cost
Estimate of the technical report.
The base cost of the civil works has been estimated to be NRs. 273,070,530.77. . The total cost
for rehabilitation and reconstruction of the road project Ch:0+000 to 18+673 Km is NRs.
344,068,868.78 .This total cost includes work charge staff & Miscellaneous Expenses,Physical
contingencies & VAT as per GON rules. The cost of per construction of works is NRs
16,524,912.96 per Km inclusive of VAT to Base Cost .The abstract of cost is presented as
Appendix I of this report. The summary cost estimate is presented in table 26 given below.
Table 26: Summary Cost Estimate
S.N. Description of works Amount (NRs) Remarks
1 GENERAL ITEMS 3,914,000.00 47.78%
2 SITE CLEARANCE WORKS 1,606,692.76 19.61%
3 EARTHWORKS 51,761,028.97 631.84%
4 STRUCTURAL/ SIDE DRAIN/ CROSS DRAINAGE WORKS
182,184,310.98 2223.90%
5 PAVEMENT WORKS 24,601,047.86 300.30%
6 ROAD FURNITURE / TRAFFIC SIGN BOARD
5,832,819.51 71.20%
7 BIOENGINEERING WORKS 2,576,130.69 31.45%
8 DAY WORKS 594,500.00 7.26%
Base Cost(A) 273,070,530.77 SUM OF ALL
ABOVE COSTS
VAT @ 13%( B) 35,499,169.00 13% OF A
Total Cost including Base Cost and VAT(C) 308,569,699.78 (A+B)
Cost per Kilometer of construction works including Base Cost and VAT(D)
16,524,912.96 C/18.673
Work Charge Staff & Miscellaneous Expenses @ 3%(E)
8,192,115.92 3% OF A
Physical Contingency @ 10%(F) 27,307,053.08 10% OF A
Gtand Total(G) 344,068,868.78 (C+E+F)
Technical Main Report
39
6.2 QUANTITY ESTIMATE
The detail quantity estimates is done for each item of works required for rehabilitation and
reconstruction of the road to gravel standard. These have been provided in Volume 2:Cost
Estimate. For summary quantity estimates refer to Appendix I.
6.3 ANALYSIS OF RATES
For estimating the cost of each item of works, prevailing norms of DoLIDAR and DOR for rate
analysis has been used throughout. Rate analysis of each of the items has been carried out
according to the approved norms of DoLIDAR and approved district rates of Kavrepalanchowk
District for Fiscal Year 2072/2073. The copy of approved district rates are given in Volume 2:
Cost Estimate. For rate of earthwork quantities, rate for earthwork excavation by machine and
manually for roadway and drain and for foundation of structure is adopted 95% and 5% as carried
out by DOR. The detailed analysis of rates of each items are provided in Volume 2: Cost
Estimate.
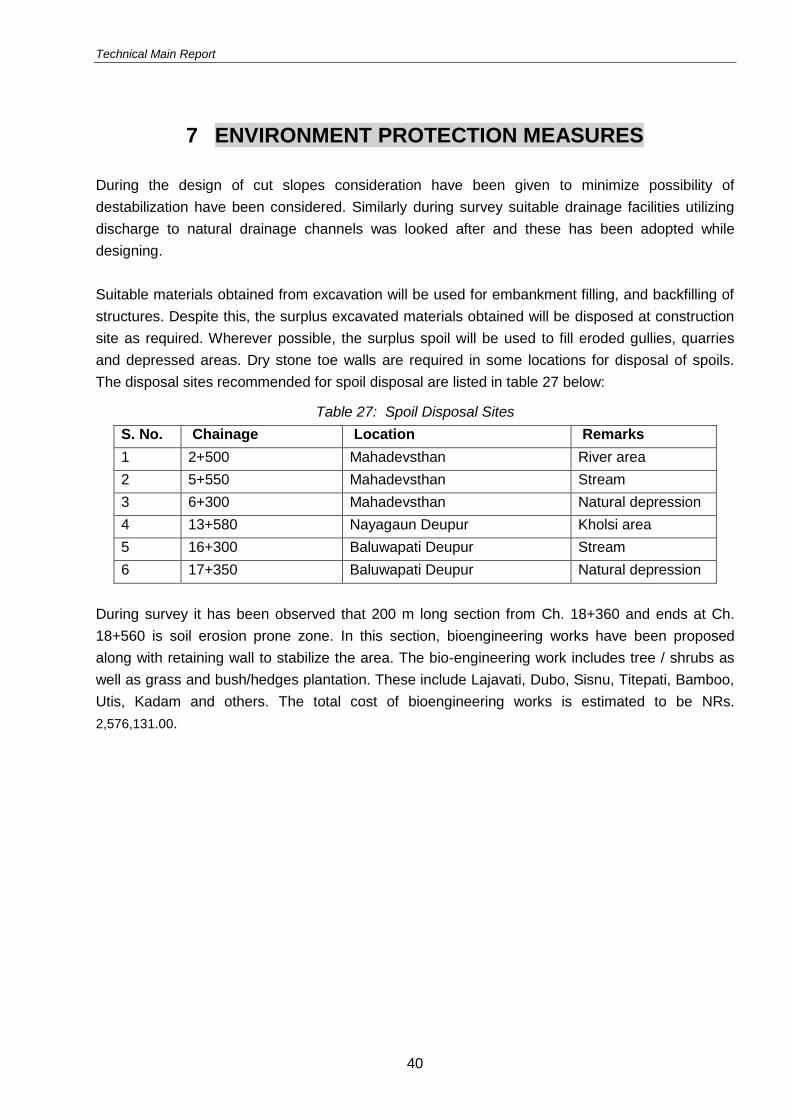
Technical Main Report
40
7 ENVIRONMENT PROTECTION MEASURES
During the design of cut slopes consideration have been given to minimize possibility of
destabilization have been considered. Similarly during survey suitable drainage facilities utilizing
discharge to natural drainage channels was looked after and these has been adopted while
designing.
Suitable materials obtained from excavation will be used for embankment filling, and backfilling of
structures. Despite this, the surplus excavated materials obtained will be disposed at construction
site as required. Wherever possible, the surplus spoil will be used to fill eroded gullies, quarries
and depressed areas. Dry stone toe walls are required in some locations for disposal of spoils.
The disposal sites recommended for spoil disposal are listed in table 27 below:
Table 27: Spoil Disposal Sites
S. No. Chainage Location Remarks
1 2+500 Mahadevsthan River area
2 5+550 Mahadevsthan Stream
3 6+300 Mahadevsthan Natural depression
4 13+580 Nayagaun Deupur Kholsi area
5 16+300 Baluwapati Deupur Stream
6 17+350 Baluwapati Deupur Natural depression
During survey it has been observed that 200 m long section from Ch. 18+360 and ends at Ch.
18+560 is soil erosion prone zone. In this section, bioengineering works have been proposed
along with retaining wall to stabilize the area. The bio-engineering work includes tree / shrubs as
well as grass and bush/hedges plantation. These include Lajavati, Dubo, Sisnu, Titepati, Bamboo,
Utis, Kadam and others. The total cost of bioengineering works is estimated to be NRs.
2,576,131.00.
Technical Main Report
41
8 CONCLUSION
Kuntabesi - Nayagaun – Nagarkot (DRCN Code No: 24DR007) Rehabilitation & Reconstruction
Road Project lies in Kavrepalanchok District. It starts from Kuntabesi of Mahadevsthan VDC and
ends at Malluwapati of Deupur VDC. The alignment of the road passes through Mahadevsthan,
Nayagaun Deupur and Baluwapati Deupur VDCs.
While considering the improvement of the road to gravel standard, provisions have been made for
adequate cross drainage as well as side drains. However for the preservation of gravel surface it is
important that surface water does not flow through the road surface. As such it is recommended
that during rainy season in construction phase the adequacy of side drains and cross drainage
shall be observed and modification as required shall be made to preserve the road asset. It shall
be noted that a construction period of 18 months from start of works has been considered while
preparing the estimates and any delay in completion of works may cause cost overrun.
Kuntabesi – Nayagaun – Nagarkot road in Kavrepalanchok district is given a high priority as it
provides access to district headquarters and other parts of the country. After the road upgrading,
the road can provide a better accessibility to the hinterland people. Local products can get market
with improved transportation facility, so that people from the area may have better earning
opportunities. And, ultimately it helps to boost up the economy of the area.
References
CBS, 2012. National Population and Housing Census 2011. Kathmandu, Nepal: Central Bureau of
Statistics (CBS).
DoLIDAR, 2014. Nepal Rural Road Standards (2055) 2nd Revision 2071. Kathmandu, Nepal:
Department of Local Infrastructure Development and Agricultural Roads (DOLIDAR), Ministry
of Federal Affairs and Local Development (MoFALD).
DoR, 2013. Nepal Road Standard 2070. Kathmandu, Nepal: Department of Roads (DoR), Ministry
of Physical Infrastructure and Transport (MoPIT).