Embed Size (px)
Citation preview

ISSN 2041-6539
rsc.li/chemical-science
ChemicalScience
EDGE ARTICLEYousung Jung et al.Active learning with non-ab initio input features toward effi cient CO2 reduction catalysts
Volume 9 Number 23 21 June 2018 Pages 5123–5302

ChemicalScience
EDGE ARTICLE
Ope
n A
cces
s A
rtic
le. P
ublis
hed
on 1
7 A
pril
2018
. Dow
nloa
ded
on 2
/9/2
022
4:45
:19
AM
. T
his
artic
le is
lice
nsed
und
er a
Cre
ativ
e C
omm
ons
Attr
ibut
ion
3.0
Unp
orte
d L
icen
ce.
View Article OnlineView Journal | View Issue
Active learning w
Graduate School of EEWS, Korea Advanc
(KAIST), 291 Daehakro, Daejeon 305-701
+82-042-350-1712
† Electronic supplementary informa10.1039/c7sc03422a
Cite this: Chem. Sci., 2018, 9, 5152
Received 6th August 2017Accepted 16th April 2018
DOI: 10.1039/c7sc03422a
rsc.li/chemical-science
5152 | Chem. Sci., 2018, 9, 5152–5159
ith non-ab initio input featurestoward efficient CO2 reduction catalysts†
Juhwan Noh, Seoin Back, Jaehoon Kim and Yousung Jung *
In a conventional chemisorption model, the d-band center theory (augmented sometimes with the upper
edge of the d-band for improved accuracy) plays a central role in predicting adsorption energies and
catalytic activity as a function of the d-band center of solid surfaces, but it requires density functional
calculations that can be quite costly for the purposes of large scale screening of materials. In this work,
we propose to use the d-band width of the muffin-tin orbital theory (to account for the local
coordination environment) plus electronegativity (to account for adsorbate renormalization) as a simple
set of alternative descriptors for chemisorption which do not require ab initio calculations for large-scale
first-hand screening. This pair of descriptors is then combined with machine learning methods, namely,
neural network (NN) and kernel ridge regression (KRR). We show, for a toy set of 263 alloy systems, that
the CO adsorption energy on the (100) facet can be predicted with a mean absolute deviation error of
0.05 eV. We achieved this high accuracy by utilizing an active learning algorithm, without which the
accuracy was 0.18 eV. In addition, the results of testing the method with other facets such as (111)
terrace and (211) step sites suggest that the present model is also capable of handling different
coordination environments effectively. As an example of the practical application of this machine, we
identified Cu3Y@Cu* as an active and cost-effective electrochemical CO2 reduction catalyst to produce
CO with an overpotential �1 V lower than a Au catalyst.
1. Introduction
Understanding and predicting the energetics associated withbond-forming and bond-breaking reactions occurring on thesurface of solid materials is the central theme of heterogeneouscatalysis research. Among many other catalysis theories, inparticular, the Sabatier principle1 is an important simpleconcept that states that the chemisorption strength of keyreaction intermediates on catalyst surfaces should be just rightto maximize catalytic activity; either too weak or too strongbinding leads to insufficient activation of the reactant or greatdifficulty in product desorption aer catalysis completion,respectively, and therefore a typical volcano activity relationshipcan be plotted as a function of the binding energies.2 In a seriesof pioneering studies, Nørskov and co-workers suggested a wayto understand the chemisorption of reaction adsorbates interms of the surface electronic structure of the materials in a so-called d-band theory.3 Here, the essence is that the bindingenergy of an adsorbate to a metal surface is largely dependenton the electronic structure of the surface itself, namely, the
ed Institute of Science and Technology
, Korea. E-mail: [email protected]; Tel:
tion (ESI) available. See DOI:
d-band centre of the surface rather than the entire detaileddensity of states (DOS).
With the recent progress in electronic structure methods(mainly density functional theory calculations for solids) thatcan now give reliable electronic structures and bindingenergetics, the d-band center theory, along with the scalingrelations that exist between the binding energies of relatedadsorbates, has been successfully applied to understandingand predicting new materials for many different applica-tions.4–8 However, exceptions were also found in which theusual d-band center trend could not explain the activitymeasured.9–11 The main cause for the aforementionedexceptions was the lack of consideration of the spread inenergy states and, for those cases, the correlation betweenthe d-band center and the activity was improved by theintroduction of the d-band width (Wd)11 and the upper edge ofthe d-band (Eu) when using the Hilbert transform of theprojected DOS.10 It has also been suggested that the standardd-band model is not a reliable measure for systems such asthe Pt–Au–M ternary nanoparticle system because of thenotable change in the electronic structure caused by thestrain and ligand effects compared to that for pure Ptnanoparticles.12
Recently, instead of energetic descriptors, an alternativemetric to describe the activity of the catalyst based on the localgeometric features of the active sites has been proposed,
This journal is © The Royal Society of Chemistry 2018

Edge Article Chemical Science
Ope
n A
cces
s A
rtic
le. P
ublis
hed
on 1
7 A
pril
2018
. Dow
nloa
ded
on 2
/9/2
022
4:45
:19
AM
. T
his
artic
le is
lice
nsed
und
er a
Cre
ativ
e C
omm
ons
Attr
ibut
ion
3.0
Unp
orte
d L
icen
ce.
View Article Online
namely, the generalized coordination number.13,14 Thisapproach yielded simple coordination–activity plots that pre-dicted the optimal geometric structure of platinum nano-particles, which were then experimentally veried.15
Nonetheless, these generalized coordination numbers are noteasy to extend to alloy systems, at least in their current form,since they cannot distinguish the different electronic structuresassociated with the different metal atoms in the alloys. In thissense, it would be helpful to have a descriptor that can describethe local coordination environment as well as the electronicstructure of the constituent metal atoms when describing metalalloys. Indeed, an approach to satisfying the latter two aspectshas been proposed in an orbital-wise coordination number16
although it still requires ab initio calculated geometries toobtain high accuracy.
We note that an open database such as the MaterialsProject17 provides an excellent general platform to perform largescale material screening for many applications using variousDFT-derived quantities such as the density of states (DOS). Inthis work, we propose to use the d-band width within the (tightbinding) linear muffin-tin orbital (LMTO or TB-LMTO) theory18
as a simple non-ab initio quantity that can be efficiently used inrst-stage catalyst screening applications. Unlike the usuald-band width obtained from DFT calculations that is a bulkproperty of the slab, the LMTO d-band width in practice cancapture the local electronic structure due to the truncation ofthe interatomic couplings up to the second nearest neighboratoms.
Using this LMTO-based d-band width, we construct, as a toyproblem, a chemisorption model to compute the bindingenergy of *CO on various metal alloys. The idea is to establisha functional relation between the simple yet analytical LMTOd-band width and *CO binding energy, and to perform large-scale screening using these non-ab initio descriptors to nda material with optimal *CO binding for an efficient CO2
reduction reaction (CRR). Although there are many linearmodels between the descriptors such as the d-band center(sometimes augmented by the upper edge of the d-band) andthe binding energy of the adsorbate,10,11,19 to increase theprediction accuracy we adopt machine learning techniques toincorporate the potential nonlinear correlation between thedescriptors and binding energies.
We note that there are two machine learning models topredict *CO binding energy in literature that inspired thepresent work and used simple descriptors, with 13 electronicstructure based descriptors in one case20 and 2 local geometricfeatures in the other case.21 The authors, in both reports, ob-tained a similar mean absolute deviation error of 0.13 eV whenpredicting the *CO binding energy for various alloy systemsdespite the very different input features (13 electronic vs. 2geometric), demonstrating the importance of proper featureselection for improved learning efficiency. It can also be notedthat the input features in both machines still required ab initiocalculations to relax the geometries and/or to obtain accurateelectronic structures of the materials. In a recent and veryinteresting reaction network study,22 non-ab initio extendedconnectivity ngerprints (ECFPs) based on a Gaussian process
This journal is © The Royal Society of Chemistry 2018
(GP) model were used to predict the formation energies of �90surface intermediate species, with a nal goal of identifying themost likely reaction pathways of syngas formation on rhodium(111), although a potential transferability limitation of ECFPsfor different adsorption sites was noted in which ab initiocalculations would still be needed. Finding non-ab initio inputfeatures that represent local environments is thus of signicantcurrent interest in the eld of heterogeneous catalysis.
In this work, we propose the use of two non-ab initio inputfeatures, i.e. LMTO d-band width and electronegativity, as aneasy-to-compute model to predict the *CO binding energy ofvarious alloy systems. By combining the aforementioneddescriptors and utilizing the latest active learning algorithms,we obtained a root mean square error (RMSE) of 0.05 eV. As anexample of the application of the machine to screen transitionmetal based alloy catalysts for CRR, we identied three prom-ising catalysts, Cu–Fe@Cu, Cu3Sc@Cu* and Cu3Y@Cu*, withhigher activity than the most active Au based catalysts.
2. Methods2.1 Non-ab initio descriptors for chemisorption
Selecting proper descriptors is one of the most important tasksin machine learning since it determines the learning efficiencyas well as the prediction power. While most current descriptorsfor chemisorption models in machine learning require ab initiocalculations, such as the d-band center and its higher-ordermoments,21 our main focus is to utilize non-ab initio baseddescriptors. As proposed by Nørskov and co-workers,3 thesurface–adsorbate binding process can be decomposed into twoeffects; the coupling of the adsorbates with the sp-bands andd-bands of the catalyst surface. For the former, based on anempirical correlation between the sp-coupling and surface–adsorbate bonding distance,19,23–25 the sp-coupling term isusually estimated as the geometric mean of the electronegativity
for the rst coordination shell c ¼" YN
i˛1st n:n:
ci
#1=N0@
1A and we
followed the same practice. For the latter, instead of theconventional ab initio d-band center, we propose the use ofa non-ab initio analytical expression of the d-band width withinthe LMTO theory, denoted WLMTO
d (see eqn (S4) in the ESI†).While WLMTO
d does not contain information about the centerposition of the d-band, there are two advantages of using it asa descriptor for the purpose of large-scale screening. Firstly, iteffectively captures the local chemical environment of thed-state for chemical events due to the use of interatomiccoupling terms with the second nearest neighbor atoms fromthe active site, a similar concept as used for the generalizedcoordination number.13,14,26 Secondly, it does not require DFTcalculations to generate input features since the analyticalexpression for WLMTO
d can be evaluated based on tabulatedvalues for a given composition (see ESI†). Since the learning willbe supervised by labeled reference data, one would still need theDFT calculations of the *CO binding energy to establisha training set. However, we emphasize that, unlike existing abinitio input features such as the d-band center, the current
Chem. Sci., 2018, 9, 5152–5159 | 5153
Chemical Science Edge Article
Ope
n A
cces
s A
rtic
le. P
ublis
hed
on 1
7 A
pril
2018
. Dow
nloa
ded
on 2
/9/2
022
4:45
:19
AM
. T
his
artic
le is
lice
nsed
und
er a
Cre
ativ
e C
omm
ons
Attr
ibut
ion
3.0
Unp
orte
d L
icen
ce.
View Article Online
model does not require additional DFT calculation to predictthe *CO binding energy once the machine is trained.
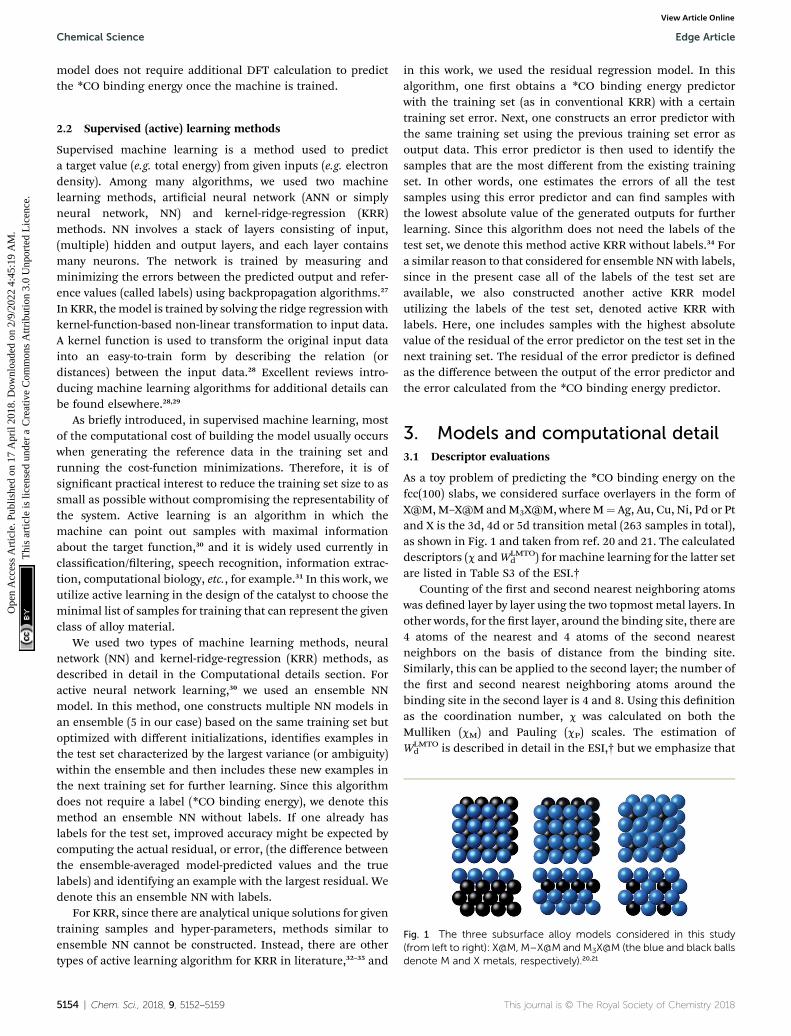
Fig. 1 The three subsurface alloy models considered in this study(from left to right): X@M, M–X@M and M3X@M (the blue and black ballsdenote M and X metals, respectively).20,21
2.2 Supervised (active) learning methods
Supervised machine learning is a method used to predicta target value (e.g. total energy) from given inputs (e.g. electrondensity). Among many algorithms, we used two machinelearning methods, articial neural network (ANN or simplyneural network, NN) and kernel-ridge-regression (KRR)methods. NN involves a stack of layers consisting of input,(multiple) hidden and output layers, and each layer containsmany neurons. The network is trained by measuring andminimizing the errors between the predicted output and refer-ence values (called labels) using backpropagation algorithms.27
In KRR, themodel is trained by solving the ridge regression withkernel-function-based non-linear transformation to input data.A kernel function is used to transform the original input datainto an easy-to-train form by describing the relation (ordistances) between the input data.28 Excellent reviews intro-ducing machine learning algorithms for additional details canbe found elsewhere.28,29
As briey introduced, in supervised machine learning, mostof the computational cost of building the model usually occurswhen generating the reference data in the training set andrunning the cost-function minimizations. Therefore, it is ofsignicant practical interest to reduce the training set size to assmall as possible without compromising the representability ofthe system. Active learning is an algorithm in which themachine can point out samples with maximal informationabout the target function,30 and it is widely used currently inclassication/ltering, speech recognition, information extrac-tion, computational biology, etc., for example.31 In this work, weutilize active learning in the design of the catalyst to choose theminimal list of samples for training that can represent the givenclass of alloy material.
We used two types of machine learning methods, neuralnetwork (NN) and kernel-ridge-regression (KRR) methods, asdescribed in detail in the Computational details section. Foractive neural network learning,30 we used an ensemble NNmodel. In this method, one constructs multiple NN models inan ensemble (5 in our case) based on the same training set butoptimized with different initializations, identies examples inthe test set characterized by the largest variance (or ambiguity)within the ensemble and then includes these new examples inthe next training set for further learning. Since this algorithmdoes not require a label (*CO binding energy), we denote thismethod an ensemble NN without labels. If one already haslabels for the test set, improved accuracy might be expected bycomputing the actual residual, or error, (the difference betweenthe ensemble-averaged model-predicted values and the truelabels) and identifying an example with the largest residual. Wedenote this an ensemble NN with labels.
For KRR, since there are analytical unique solutions for giventraining samples and hyper-parameters, methods similar toensemble NN cannot be constructed. Instead, there are othertypes of active learning algorithm for KRR in literature,32–35 and
5154 | Chem. Sci., 2018, 9, 5152–5159
in this work, we used the residual regression model. In thisalgorithm, one rst obtains a *CO binding energy predictorwith the training set (as in conventional KRR) with a certaintraining set error. Next, one constructs an error predictor withthe same training set using the previous training set error asoutput data. This error predictor is then used to identify thesamples that are the most different from the existing trainingset. In other words, one estimates the errors of all the testsamples using this error predictor and can nd samples withthe lowest absolute value of the generated outputs for furtherlearning. Since this algorithm does not need the labels of thetest set, we denote this method active KRR without labels.34 Fora similar reason to that considered for ensemble NN with labels,since in the present case all of the labels of the test set areavailable, we also constructed another active KRR modelutilizing the labels of the test set, denoted active KRR withlabels. Here, one includes samples with the highest absolutevalue of the residual of the error predictor on the test set in thenext training set. The residual of the error predictor is denedas the difference between the output of the error predictor andthe error calculated from the *CO binding energy predictor.
3. Models and computational detail3.1 Descriptor evaluations
As a toy problem of predicting the *CO binding energy on thefcc(100) slabs, we considered surface overlayers in the form ofX@M,M–X@M andM3X@M, where M¼ Ag, Au, Cu, Ni, Pd or Ptand X is the 3d, 4d or 5d transition metal (263 samples in total),as shown in Fig. 1 and taken from ref. 20 and 21. The calculateddescriptors (c andWLMTO
d ) for machine learning for the latter setare listed in Table S3 of the ESI.†
Counting of the rst and second nearest neighboring atomswas dened layer by layer using the two topmost metal layers. Inother words, for the rst layer, around the binding site, there are4 atoms of the nearest and 4 atoms of the second nearestneighbors on the basis of distance from the binding site.Similarly, this can be applied to the second layer; the number ofthe rst and second nearest neighboring atoms around thebinding site in the second layer is 4 and 8. Using this denitionas the coordination number, c was calculated on both theMulliken (cM) and Pauling (cP) scales. The estimation ofWLMTO
d is described in detail in the ESI,† but we emphasize that
This journal is © The Royal Society of Chemistry 2018
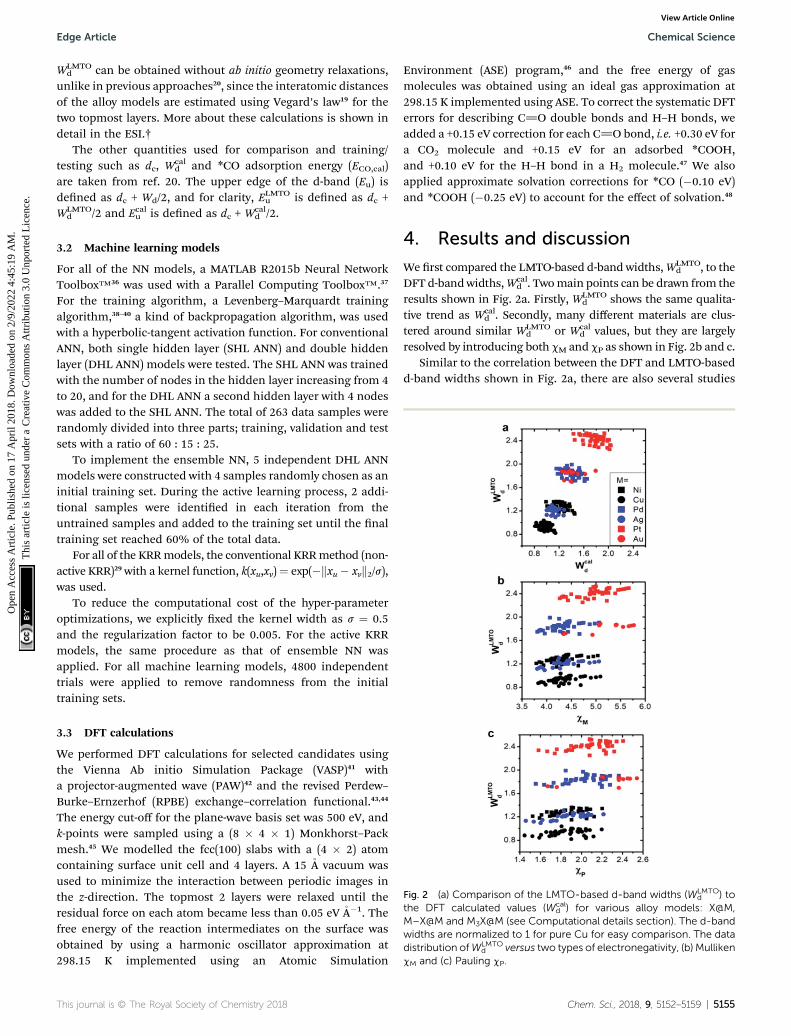
Fig. 2 (a) Comparison of the LMTO-based d-band widths (WLMTOd ) to
the DFT calculated values (Wcald ) for various alloy models: X@M,
M–X@M and M3X@M (see Computational details section). The d-bandwidths are normalized to 1 for pure Cu for easy comparison. The datadistribution ofWLMTO
d versus two types of electronegativity, (b) MullikencM and (c) Pauling cP.
Edge Article Chemical Science
Ope
n A
cces
s A
rtic
le. P
ublis
hed
on 1
7 A
pril
2018
. Dow
nloa
ded
on 2
/9/2
022
4:45
:19
AM
. T
his
artic
le is
lice
nsed
und
er a
Cre
ativ
e C
omm
ons
Attr
ibut
ion
3.0
Unp
orte
d L
icen
ce.
View Article Online
WLMTOd can be obtained without ab initio geometry relaxations,
unlike in previous approaches20, since the interatomic distancesof the alloy models are estimated using Vegard’s law19 for thetwo topmost layers. More about these calculations is shown indetail in the ESI.†
The other quantities used for comparison and training/testing such as dc, W
cald and *CO adsorption energy (ECO,cal)
are taken from ref. 20. The upper edge of the d-band (Eu) isdened as dc + Wd/2, and for clarity, ELMTO
u is dened as dc +WLMTO
d /2 and Ecalu is dened as dc + Wcald /2.
3.2 Machine learning models
For all of the NN models, a MATLAB R2015b Neural NetworkToolbox™36 was used with a Parallel Computing Toolbox™.37
For the training algorithm, a Levenberg–Marquardt trainingalgorithm,38–40 a kind of backpropagation algorithm, was usedwith a hyperbolic-tangent activation function. For conventionalANN, both single hidden layer (SHL ANN) and double hiddenlayer (DHL ANN) models were tested. The SHL ANN was trainedwith the number of nodes in the hidden layer increasing from 4to 20, and for the DHL ANN a second hidden layer with 4 nodeswas added to the SHL ANN. The total of 263 data samples wererandomly divided into three parts; training, validation and testsets with a ratio of 60 : 15 : 25.
To implement the ensemble NN, 5 independent DHL ANNmodels were constructed with 4 samples randomly chosen as aninitial training set. During the active learning process, 2 addi-tional samples were identied in each iteration from theuntrained samples and added to the training set until the naltraining set reached 60% of the total data.
For all of the KRRmodels, the conventional KRRmethod (non-active KRR)29 with a kernel function, k(xu,xv)¼ exp(�kxu� xvk2/s),was used.
To reduce the computational cost of the hyper-parameteroptimizations, we explicitly xed the kernel width as s ¼ 0.5and the regularization factor to be 0.005. For the active KRRmodels, the same procedure as that of ensemble NN wasapplied. For all machine learning models, 4800 independenttrials were applied to remove randomness from the initialtraining sets.
3.3 DFT calculations
We performed DFT calculations for selected candidates usingthe Vienna Ab initio Simulation Package (VASP)41 witha projector-augmented wave (PAW)42 and the revised Perdew–Burke–Ernzerhof (RPBE) exchange–correlation functional.43,44
The energy cut-off for the plane-wave basis set was 500 eV, andk-points were sampled using a (8 � 4 � 1) Monkhorst–Packmesh.45 We modelled the fcc(100) slabs with a (4 � 2) atomcontaining surface unit cell and 4 layers. A 15 �A vacuum wasused to minimize the interaction between periodic images inthe z-direction. The topmost 2 layers were relaxed until theresidual force on each atom became less than 0.05 eV�A�1. Thefree energy of the reaction intermediates on the surface wasobtained by using a harmonic oscillator approximation at298.15 K implemented using an Atomic Simulation
This journal is © The Royal Society of Chemistry 2018
Environment (ASE) program,46 and the free energy of gasmolecules was obtained using an ideal gas approximation at298.15 K implemented using ASE. To correct the systematic DFTerrors for describing C]O double bonds and H–H bonds, weadded a +0.15 eV correction for each C]O bond, i.e. +0.30 eV fora CO2 molecule and +0.15 eV for an adsorbed *COOH,and +0.10 eV for the H–H bond in a H2 molecule.47 We alsoapplied approximate solvation corrections for *CO (�0.10 eV)and *COOH (�0.25 eV) to account for the effect of solvation.48
4. Results and discussion
We rst compared the LMTO-based d-band widths,WLMTOd , to the
DFT d-bandwidths,Wcald . Twomain points can be drawn from the
results shown in Fig. 2a. Firstly, WLMTOd shows the same qualita-
tive trend as Wcald . Secondly, many different materials are clus-
tered around similar WLMTOd or Wcal
d values, but they are largelyresolved by introducing both cM and cP as shown in Fig. 2b and c.
Similar to the correlation between the DFT and LMTO-basedd-band widths shown in Fig. 2a, there are also several studies
Chem. Sci., 2018, 9, 5152–5159 | 5155

Chemical Science Edge Article
Ope
n A
cces
s A
rtic
le. P
ublis
hed
on 1
7 A
pril
2018
. Dow
nloa
ded
on 2
/9/2
022
4:45
:19
AM
. T
his
artic
le is
lice
nsed
und
er a
Cre
ativ
e C
omm
ons
Attr
ibut
ion
3.0
Unp
orte
d L
icen
ce.
View Article Online
showing that the electronic property from LMTO theory isstrongly correlated to that from DFT calculation. As reported byA. Vojvodic et al.,11 the d-band center approximated by LMTOtheory showed the same trend as that from DFT calculation. Inaddition, as reported by J. R. Kitchin et al.,49 it was theoreticallyshown that the matrix element, dened as the summation ofthe interatomic coupling terms up to all the nearest neighbors,from LMTO theory is strongly correlated to the d-band widthfrom DFT calculations. All of these results suggest that theproposed d-band width using LMTO theory can reasonablyrepresent the electronic properties of local environments.
Using these two selected descriptors, the performances ofvarious machine learning models are summarized in Fig. 3.Three points are noteworthy:
(1) Interestingly, even the LMTO-based d-band width(WLMTO
d ) alone performs quite well (RMSE ¼ 0.07 eV). In addi-tion, the LMTO-based d-band width consistently yields a lowerRMSE than the ab initio-based d-band width by 0.05–0.15 eV,when combined with c. This suggests that the local conceptinvolved in the evaluation of WLMTO
d (interactions up to the 2nd
nearest neighboring atoms in the surface and subsurface layers)helps to correlate better with the binding affinity as comparedto the bulk surface quantity (Wcal
d ). The localized nature ofWLMTO
d can also be conrmed by the data shown in Fig. 4, in
Fig. 3 The performance of various machine learning models withdifferent descriptors: (a) without an ab initio d-band center, and (b andc) with a d-band center. All RMSE values were calculated for the entiredata set.
5156 | Chem. Sci., 2018, 9, 5152–5159
which the core@M alloys with the same M species are all clus-tered around a similar region, whereas the distribution ofWcal
d is much broader for the same M species. This clustering isa helpful feature for active learning since it becomes easier tochoose new data which differ the most from the existingtraining set data.
(2) For all of the combinations of descriptors shown inFig. 3a, KRR (0.05–0.37 eV) performs consistently better thanANN (0.21–0.45 eV) for the chemistry studied.
(3) The actively learned KRR enhances the accuracy of themodel signicantly, lowering the RMSE by 0.13 eV compared tothat of conventional KRR (from 0.18 to 0.05 eV) for the best case.A more detailed discussion on the effects of active learning onthe RMSE variance and accuracy for both ANN and KRR will begiven later.
Therefore, by combining all of these results, the bestchemisorption model without any ab initio inputs is the activeKRR model based on the pair of descriptors (WLMTO
d and cP)with an RMSE of 0.05 eV. This can be compared with previousresults (0.13 eV) using ANN with ab initio based parameters andgeometries.
There are many indications that the d-band center alone isnot a sufficient descriptor for more complicated catalyst struc-tures,9–12 but the d-band center is still one of the most widely-used descriptors for chemisorption models on the catalystsurface, so we also considered models that included theconventional d-band center (Fig. 3b and c). As expected, for allof the machine learning methods and combinations ofdescriptors, the inclusion of the d-band center improves theaccuracy signicantly, with the best model being the active KRRwith any combination of descriptors with RMSE � 0.02 eV. It isremarkable, however, to note that the difference between thecost-effective LMTO d-band width model (0.05 eV) and theexpensive d-band center model is only 0.03 eV.
Because the current model is trained using a single type ofactive site (fcc(100)-terrace), we tested the extensibility of theapproach by treating two different additional coordinationenvironments, namely fcc(111)-terrace and fcc(211)-step sites.For each fcc surface type, 3 kinds of surface slab model (X@M,M–X@M and M3X@M where M, X ¼ Ni, Cu, Pd, Ag, Pt or Au)were considered. We constructed the machine based on theactive KRR with labels model with a pair of descriptors(WLMTO
d and cP) and a total of 305 samples. We obtained anoverall combined RMS error of 0.08 eV, quite close to the 0.05 eV
Fig. 4 Data distributions of *CObinding energies versus (a)WLMTOd and
(b) Wcald .
This journal is © The Royal Society of Chemistry 2018
Edge Article Chemical Science
Ope
n A
cces
s A
rtic
le. P
ublis
hed
on 1
7 A
pril
2018
. Dow
nloa
ded
on 2
/9/2
022
4:45
:19
AM
. T
his
artic
le is
lice
nsed
und
er a
Cre
ativ
e C
omm
ons
Attr
ibut
ion
3.0
Unp
orte
d L
icen
ce.
View Article Online
obtained with the (100) facet only, as shown in Fig. 3a. Appar-ently, the latter subset is not an extensive test of the method, yetit clearly shows the reasonable potential of the d-band width asan efficient descriptor for the rst-hand screening of largecandidates before DFT calculation on various coordinationenvironments.
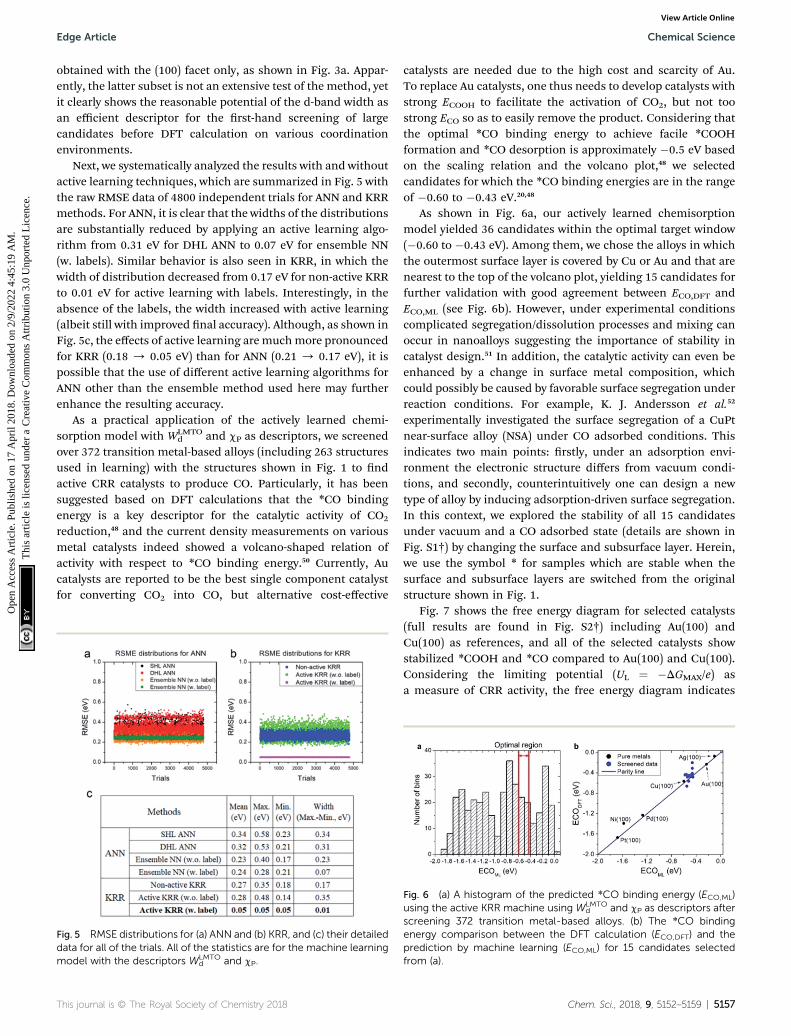
Next, we systematically analyzed the results with and withoutactive learning techniques, which are summarized in Fig. 5 withthe raw RMSE data of 4800 independent trials for ANN and KRRmethods. For ANN, it is clear that the widths of the distributionsare substantially reduced by applying an active learning algo-rithm from 0.31 eV for DHL ANN to 0.07 eV for ensemble NN(w. labels). Similar behavior is also seen in KRR, in which thewidth of distribution decreased from 0.17 eV for non-active KRRto 0.01 eV for active learning with labels. Interestingly, in theabsence of the labels, the width increased with active learning(albeit still with improved nal accuracy). Although, as shown inFig. 5c, the effects of active learning are muchmore pronouncedfor KRR (0.18 / 0.05 eV) than for ANN (0.21 / 0.17 eV), it ispossible that the use of different active learning algorithms forANN other than the ensemble method used here may furtherenhance the resulting accuracy.
As a practical application of the actively learned chemi-sorption model with WLMTO
d and cP as descriptors, we screenedover 372 transition metal-based alloys (including 263 structuresused in learning) with the structures shown in Fig. 1 to ndactive CRR catalysts to produce CO. Particularly, it has beensuggested based on DFT calculations that the *CO bindingenergy is a key descriptor for the catalytic activity of CO2
reduction,48 and the current density measurements on variousmetal catalysts indeed showed a volcano-shaped relation ofactivity with respect to *CO binding energy.50 Currently, Aucatalysts are reported to be the best single component catalystfor converting CO2 into CO, but alternative cost-effective
Fig. 5 RMSE distributions for (a) ANN and (b) KRR, and (c) their detaileddata for all of the trials. All of the statistics are for the machine learningmodel with the descriptors WLMTO
d and cP.
This journal is © The Royal Society of Chemistry 2018
catalysts are needed due to the high cost and scarcity of Au.To replace Au catalysts, one thus needs to develop catalysts withstrong ECOOH to facilitate the activation of CO2, but not toostrong ECO so as to easily remove the product. Considering thatthe optimal *CO binding energy to achieve facile *COOHformation and *CO desorption is approximately �0.5 eV basedon the scaling relation and the volcano plot,48 we selectedcandidates for which the *CO binding energies are in the rangeof �0.60 to �0.43 eV.20,48
As shown in Fig. 6a, our actively learned chemisorptionmodel yielded 36 candidates within the optimal target window(�0.60 to �0.43 eV). Among them, we chose the alloys in whichthe outermost surface layer is covered by Cu or Au and that arenearest to the top of the volcano plot, yielding 15 candidates forfurther validation with good agreement between ECO,DFT andECO,ML (see Fig. 6b). However, under experimental conditionscomplicated segregation/dissolution processes and mixing canoccur in nanoalloys suggesting the importance of stability incatalyst design.51 In addition, the catalytic activity can even beenhanced by a change in surface metal composition, whichcould possibly be caused by favorable surface segregation underreaction conditions. For example, K. J. Andersson et al.52
experimentally investigated the surface segregation of a CuPtnear-surface alloy (NSA) under CO adsorbed conditions. Thisindicates two main points: rstly, under an adsorption envi-ronment the electronic structure differs from vacuum condi-tions, and secondly, counterintuitively one can design a newtype of alloy by inducing adsorption-driven surface segregation.In this context, we explored the stability of all 15 candidatesunder vacuum and a CO adsorbed state (details are shown inFig. S1†) by changing the surface and subsurface layer. Herein,we use the symbol * for samples which are stable when thesurface and subsurface layers are switched from the originalstructure shown in Fig. 1.
Fig. 7 shows the free energy diagram for selected catalysts(full results are found in Fig. S2†) including Au(100) andCu(100) as references, and all of the selected catalysts showstabilized *COOH and *CO compared to Au(100) and Cu(100).Considering the limiting potential (UL ¼ �DGMAX/e) asa measure of CRR activity, the free energy diagram indicates
Fig. 6 (a) A histogram of the predicted *CO binding energy (ECO,ML)using the active KRR machine using WLMTO
d and cP as descriptors afterscreening 372 transition metal-based alloys. (b) The *CO bindingenergy comparison between the DFT calculation (ECO,DFT) and theprediction by machine learning (ECO,ML) for 15 candidates selectedfrom (a).
Chem. Sci., 2018, 9, 5152–5159 | 5157

Fig. 7 A free energy diagram of selected catalysts. Pure Au(100) andCu(100) surfaces are also plotted as references. The symbol * indicatessamples that are stable when the surface and subsurface layers areswitched from the original structure shown in Fig. 1.
Chemical Science Edge Article
Ope
n A
cces
s A
rtic
le. P
ublis
hed
on 1
7 A
pril
2018
. Dow
nloa
ded
on 2
/9/2
022
4:45
:19
AM
. T
his
artic
le is
lice
nsed
und
er a
Cre
ativ
e C
omm
ons
Attr
ibut
ion
3.0
Unp
orte
d L
icen
ce.
View Article Online
that the UL of Cu–Fe@Cu (�0.85 V) is less negative than that ofAu(100) (�1.21 V) by 0.36 V. Furthermore, Cu3Y@Cu* andCu3Sc@Cu* have a UL of �0.20 V and �0.35 V respectively,which is less negative than Au(100) by 1.01 V and 0.86 Vrespectively. The catalytic activity of Cu3Y@Cu* is expected tooutperform various Au-based catalysts, such as a Au–Cu bi-functional interfacial catalyst (UL ¼ �0.60 V)53 and Au NPcorner site (UL ¼ �0.60 V).54 These results should also becompared to the experimental potentials of the best performingAu-based catalysts that reach a current density of CO productionof more than 5 mA cm�2 in literature; �0.40 V for oxide-derivedAu nanoparticles,55 �0.35 V for Au needles56 and �0.35 V for Aunanowires.57 All of these results imply that Cu3Y@Cu* could behighly active, comparable to the Au catalysts, and a cost-effective alternative to the Au catalysts for the CO2 reductionreaction.
5. Conclusions
We presented a machine learning model that can predict thebinding energy of surface adsorbates on alloys using simplenon-ab initio input features, namely, linear muffin-tin orbitaltheory (LMTO)-based d-band width and a geometric mean ofelectronegativity. By combining the aforementioned descriptorswith the active learning algorithm, we obtained a high accuracy(RMSE ¼ 0.05 eV for active KRR with labels) to predict *CObinding energy. The use of the LMTO d-band width asa learning descriptor yielded a higher prediction accuracy thanthe DFT-based d-band width due to the local characteristics ofthe WLMTO
d . The effects of active learning were signicant,lowering the RMSE for a neural network 0.21/ 0.17 eV, and forKRR 0.18 / 0.05 eV. The present d-band width model is alsoshown to work reasonably well for other facets such as (111) and(211) step sites to describe different coordination environments(with a combined error of 0.08 eV for all three facets). As anexample of the practical application of the constructed KRRmachine, we then screened the alloy catalysts for the CO2
electro-chemical reduction reaction by estimating their *CObinding energies, and identied that Cu3Sc@Cu* andCu3Y@Cu* have an overpotential of �1 V lower than Au(100).We expect that the non-ab initio descriptors proposed here canbe easily applicable to other types of catalyst designs, such as
5158 | Chem. Sci., 2018, 9, 5152–5159
understanding the statistical behaviour of realistic experi-mental nanoparticles or nanowires with long temporal andlarge spatial sampling aspects where there are thousands ofpossible reaction sites with different local environments.58
Being able to rapidly estimate *CO binding energies using theeasy-to-compute input features proposed here will undoubtedlybe helpful to provide new insights for exciting experimental CO2
reduction results on complex surfaces.
Conflicts of interest
There are no conicts to declare.
Acknowledgements
We acknowledge the nancial support for this research fromthe Korean Government through the National Research Foun-dation of Korea (NRF-2017R1A2B3010176).
References
1 P. Sabatier, Eur. J. Inorg. Chem., 1911, 44, 1984–2001.2 A. J. Medford, A. Vojvodic, J. S. Hummelshøj, J. Voss, F. Abild-Pedersen, F. Studt, T. Bligaard, A. Nilsson and J. K. Nørskov,J. Catal., 2015, 328, 36–42.
3 B. Hammer and J. K. Nørskov, Adv. Catal., 2000, 45, 71–129.4 J. K. Nørskov, T. Bligaard, J. Rossmeisl andC. H. Christensen, Nat. Chem., 2009, 1, 37–46.
5 J. Greeley, I. Stephens, A. Bondarenko, T. P. Johansson,H. A. Hansen, T. Jaramillo, J. Rossmeisl, I. Chorkendorffand J. K. Nørskov, Nat. Chem., 2009, 1, 552–556.
6 S. Back and Y. Jung, ChemCatChem, 2017, 9, 1–8.7 S. Back, H. Kim and Y. Jung, ACS Catal., 2015, 5, 965–971.8 V. Stamenkovic, B. S. Mun, K. J. Mayrhofer, P. N. Ross,N. M. Markovic, J. Rossmeisl, J. Greeley and J. K. Nørskov,Angew. Chem., 2006, 118, 2963–2967.
9 M. Gajdo, A. Eichler and J. Hafner, J. Phys.: Condens. Matter,2004, 16, 1141–1164.
10 H. Xin, A. Vojvodic, J. Voss, J. K. Nørskov and F. Abild-Pedersen, Phys. Rev. B: Condens. Matter Mater. Phys., 2014,89, 115114.
11 A. Vojvodic, J. K. Nørskov and F. Abild-Pedersen, Top. Catal.,2014, 57, 25–32.
12 P. C. Jennings, S. Lysgaard, H. A. Hansen and T. Vegge, Phys.Chem. Chem. Phys., 2016, 18, 24737–24745.
13 F. Calle-Vallejo, J. I. Martinez, J. M. Garcia-Lastra, P. Sautetand D. Loffreda, Angew. Chem., Int. Ed., 2014, 53, 8316–8319.
14 F. Calle-Vallejo, D. Loffreda, M. T. Koper and P. Sautet, Nat.Chem., 2015, 7, 403–410.
15 F. Calle-Vallejo, J. Tymoczko, V. Colic, Q. H. Vu, M. D. Pohl,K. Morgenstern, D. Loffreda, P. Sautet, W. Schuhmann andA. S. Bandarenka, Science, 2015, 350, 185–189.
16 X. Ma and H. Xin, Phys. Rev. Lett., 2017, 118, 036101.17 A. Jain, S. P. Ong, G. Hautier, W. Chen, W. D. Richards,
S. Dacek, S. Cholia, D. Gunter, D. Skinner and G. Ceder,APL Mater., 2013, 1, 011002.
This journal is © The Royal Society of Chemistry 2018

Edge Article Chemical Science
Ope
n A
cces
s A
rtic
le. P
ublis
hed
on 1
7 A
pril
2018
. Dow
nloa
ded
on 2
/9/2
022
4:45
:19
AM
. T
his
artic
le is
lice
nsed
und
er a
Cre
ativ
e C
omm
ons
Attr
ibut
ion
3.0
Unp
orte
d L
icen
ce.
View Article Online
18 W. A. Harrison, Electronic structure and the properties ofsolids: the physics of the chemical bond, CourierCorporation, 2012.
19 H. Xin, A. Holewinski and S. Linic, ACS Catal., 2012, 2, 12–16.
20 X. Ma, Z. Li, L. E. Achenie and H. Xin, J. Phys. Chem. Lett.,2015, 6, 3528–3533.
21 Z. Li, X. F. Ma and H. L. Xin, Catal. Today, 2017, 280, 232–238.
22 Z. W. Ulissi, A. J. Medford, T. Bligaard and J. K. Norskov, Nat.Commun., 2017, 8, 14621.
23 H. Xin and S. Linic, J. Chem. Phys., 2010, 132, 221101.24 H. Xin, N. Schweitzer, E. Nikolla and S. Linic, J. Chem. Phys.,
2010, 132, 111101.25 H. L. Xin, A. Holewinski, N. Schweitzer, E. Nikolla and
S. Linic, Top. Catal., 2012, 55, 376–390.26 F. Calle-Vallejo, M. D. Pohl, D. Reinisch, D. Loffreda,
P. Sautet and A. S. Bandarenka, Chem. Sci., 2017, 8, 2283–2289.
27 A. Van Ooyen and B. Nienhuis, Neural Network, 1992, 5, 465–471.
28 K. Hansen, G. Montavon, F. Biegler, S. Fazli, M. Rupp,M. Scheffler, O. A. von Lilienfeld, A. Tkatchenko andK. R. Muller, J. Chem. Theory Comput., 2013, 9, 3404–3419.
29 K. Vu, J. C. Snyder, L. Li, M. Rupp, B. F. Chen, T. Khelif,K. R. Mueller and K. Burke, Int. J. Quantum Chem., 2015,115, 1115–1128.
30 A. Krogh and J. Vedelsby, Adv. Neural Inf. Process. Syst., 1995,7, 231–238.
31 B. Settles, Synthesis Lectures on Articial Intelligence andMachine Learning, 2012, vol. 6, pp. 1–114.
32 J. O’Neill, S. J. Delany and B. MacNamee, in Advances inComputational Intelligence Systems, Springer, 2017, pp. 375–386.
33 M. Sharma and M. Bilgic, Data Min. Knowl. Discov., 2017, 31,164–202.
34 F. Douak, F. Melgani and N. Benoudjit, Appl. Energy, 2013,103, 328–340.
35 K. Yu, J. Bi and V. Tresp, Presented in part at the Proceedings ofthe 23rd international conference on Machine learning,Pittsburgh, Pennsylvania, USA, 2006.
36 H. B. Demuth and M. H. Beale, Neural Network Toolbox; forUse with MATLAB; Computation, Visualization, Programming;User’s Guide, Version 4, Math Works, 2000.
37 G. Sharma and J. Martin, Int. J. Parallel Program., 2009, 37, 3–36.
38 K. Levenberg, Q. Appl. Math., 1944, 2, 164–168.
This journal is © The Royal Society of Chemistry 2018
39 D. W. Marquardt, J. Soc. Ind. Appl. Math., 1963, 11, 431–441.40 W. H. Press, S. Teukolsky, W. Vetterling and B. Flannery,
Numerical Recipes in C, Cambridge University Press, 1988,vol. 1, p. 3.
41 G. Kresse and J. Furthmuller, Phys. Rev. B: Condens. MatterMater. Phys., 1996, 54, 169.
42 P. E. Blochl, Phys. Rev. B: Condens. Matter Mater. Phys., 1994,50, 17953.
43 J. P. Perdew, K. Burke and M. Ernzerhof, Phys. Rev. Lett.,1996, 77, 3865.
44 B. Hammer, L. B. Hansen and J. K. Nørskov, Phys. Rev. B:Condens. Matter Mater. Phys., 1999, 59, 7413.
45 H. J. Monkhorst and J. D. Pack, Phys. Rev. B: Condens. MatterMater. Phys., 1976, 13, 5188.
46 S. R. Bahn and K.W. Jacobsen, Comput. Sci. Eng., 2002, 4, 56–66.
47 R. Christensen, H. A. Hansen and T. Vegge, Catal. Sci.Technol., 2015, 5, 4946–4949.
48 A. A. Peterson and J. K. Nørskov, J. Phys. Chem. Lett., 2012, 3,251–258.
49 J. R. Kitchin, J. K. Norskov, M. A. Barteau and J. G. Chen,Phys. Rev. Lett., 2004, 93, 156801.
50 K. P. Kuhl, T. Hatsukade, E. R. Cave, D. N. Abram,J. Kibsgaard and T. F. Jaramillo, J. Am. Chem. Soc., 2014,136, 14107–14113.
51 S. Lysgaard, J. S. Myrdal, H. A. Hansen and T. Vegge, Phys.Chem. Chem. Phys., 2015, 17, 28270–28276.
52 K. J. Andersson, F. Calle-Vallejo, J. Rossmeisl andI. Chorkendorff, J. Am. Chem. Soc., 2009, 131, 2404–2407.
53 S. Back, J.-H. Kim, Y.-T. Kim and Y. Jung, ACS Appl. Mater.Interfaces, 2016, 8, 23022–23027.
54 S. Back, M. S. Yeom and Y. Jung, ACS Catal., 2015, 5, 5089–5096.
55 Y. Chen, C. W. Li and M. W. Kanan, J. Am. Chem. Soc., 2012,134, 19969–19972.
56 M. Liu, Y. Pang, B. Zhang, P. De Luna, O. Voznyy, J. Xu,X. Zheng, C. T. Dinh, F. Fan, C. Cao, F. P. de Arquer,T. S. Safaei, A. Mepham, A. Klinkova, E. Kumacheva,T. Filleter, D. Sinton, S. O. Kelley and E. H. Sargent,Nature, 2016, 537, 382–386.
57 W. Zhu, Y. J. Zhang, H. Zhang, H. Lv, Q. Li, R. Michalsky,A. A. Peterson and S. Sun, J. Am. Chem. Soc., 2014, 136,16132–16135.
58 M. Li, Z. Zhao, T. Cheng, A. Fortunelli, C.-Y. Chen, R. Yu,Q. Zhang, L. Gu, B. Merinov, Z. Lin, E. Zhu, T. Yu, Q. Jia,J. Guo, L. Zhang, W. A. Goddard, Y. Huang and X. Duan,Science, 2016, 354, 1414–1419.
Chem. Sci., 2018, 9, 5152–5159 | 5159