Embed Size (px)
Citation preview

Volume 6 • 2012
T H E U N I V E R S I T Y O F A L A B A M A A T B I R M I N G H A M
Volume 6 • 2012Volume 6 • 2012
TH
E U
NIV
ER
SIT
Y O
F A
LA
BA
MA
AT
BIR
MIN
GH
AM
Volu
me 6 • 2012

Inquiro © 2012
The rights to the papers published in
this work are retained by the authors.
Authors may publish their work in any
other media, with the exception of
another undergraduate publication.
This is an internal document of
Front cover art: “Emulsions”Likhitha Pathivada
Senior, Biomedical Engineering
Inside cover art: “Anatomy of a Peasant”Sarah AdkinsSophomore, Biology
inquiro staff 2012

Volume 6 • 2012
Founded and staffed by undergraduate
students at the University of Alabama
at Birmingham, Inquiro is an annual
research journal produced as an outlet
for the publication of undergraduate
scientific research. UAB is an excellent
undergraduate research university,
and with the addition of a journal such
as Inquiro in which to publish their
findings, the package is complete. Any
undergraduate student at UAB, as well
as any student participating in a summer
program at the university, is eligible to
submit research. The rights to every paper
published in Inquiro are retained by the
author, leaving each individual free to
submit to and publish in a larger national
journal or magazine. Students are
invited to submit research papers, short
reports derived from posters or research
narratives throughout the year.

2 • inquiro | no. 6 | 2012
letter from the editorinquiro staffScience impacts our lives. When Edward Jenner created the smallpox vaccine, he forever changed the world’s understanding of disease and its prevention. James Watt’s invention of the steam engine enabled the Industrial Revolution. Charles Darwin’s theory of evolution launched a paradigm shift within multiple scientific disciplines.
The influence of science may be undeniable, but progress does not come without complications. Curiosity about disease led to human rights abuses like the infamous Tuskegee Syphilis Study. The Industrial Revolution generated environmental pollution and overuse of natural resources. Even evolution, a simple theory about how species change over time, has polarized society to the point that many do not want it taught in schools.
The conflicting implications of these examples illustrate that science cannot be separated from its context. Knowledge is not important for the sake of knowledge; instead, knowledge serves as a vital tool that can be used to better understand and improve the world. In order to use science as an agent of positive change, scientists have many responsibilities. For example, they must understand how to answer scientific questions. Their experiments must be conducted in ways that minimize biases and yield significant and reproducible results. Scientists must also share their findings with others. An integral component of the dissemination of scientific results is review by an independent third party. Once the results have been reviewed and verified, the investigator must publish his or her work. However, publishing in peer-reviewed scientific journals is only one element of successful distribution: scientists should also translate their results to the general population. Cutting-edge research is becoming increasingly interdisciplinary, and researchers must effectively communicate with those outside of their specific field of study in order to make meaningful contributions to scientific and social progress.
Miranda’s and my editorial partnership has been defined by our commitment to these principles. In this volume, we have combined our experiences to sustain and improve Inquiro. My path started in the Department of Philosophy. Through my studies of the history of medical research, I learned about the suffering that can result from irresponsible science. However, I also learned about the miraculous benefits that can result from careful and ethical investigation. I seized the opportunity to assume a leadership position on Inquiro’s editorial board. During my two-year tenure as editor, I have helped to create a more rigorous review protocol that holds the published authors to a higher standard.
UAB’s emphasis on undergraduate research quickly engaged Miranda’s interests. During her freshman year, she joined the lab of Professor Stephen Barnes in the Department of Pharmacology, and she started to devote long hours to the trying but rewarding task of research. After two additional years in Dr. Barnes’s lab and an internship at the University of Oxford, Miranda decided to pursue a career in structural biochemistry. Her strengths as an editor include critiquing experimental design and editing articles to be more simple and concise. Next year, she hopes to continue to improve Inquiro and to instill the value of scientific research and publication into potential future scientists.
Chief Editors Miranda CollierRachael Rosales
Assistant EditorChapin Cavender
Board Members Amiya AhmedSadhvi BatraNaveed FarrukhTimothy FernandezPooja GajareNikhita JainPaul LeeRoxanne LockhartAnum MuzzafarGrace NixSope OguntuyoHarsh ShahRamya Singireddy

the university of alabama at birmingham | inquiro • 3
table of contentsLetter from the Editor 2
Science News 4
Faculty Interview: Dr. Joel Berry 11
Research Narrative 13
Feature Article: Isolation of Novel Mycobacteriophages 15
Faculty Spotlight: Nick Bieser 17
Short Reports Structural and Functional Analysis of Cryptosporidium 18
parvum Pyruvate Kinase, a Potential Drug Target
Effect of Distraction and Traffic Congestion 21 on Visual Attention
Faculty Interview: Uday Vaidya, Ph.D. 23
Thermally Triggered Drug Release from Polymer Micelles 25
Determining the Pharmacological Activity of in 27 Cystic Fibrosis Sputum Ex Vivo: A Potential New
Treatment for Mucus Stasis
Statistical Analysis of Differential Gene Expression in 28 the Coat Patterns of the Striped Mouse
Research PapersDevelopment of Novel Thin Film Electrolyte Materials 31 for Intermediate Temperature Solid Oxide Fuel Cells
Design of a Torsion Tester for Study of the Effects of 36 Diabetes and Obesity on Murine Bone Properties
Effect of Genistein After Spinal Cord Injury 43 in Male Rodents
Development of Dot Array Biosensor using 49 Dip-Pen Nanolithography of Polyacrylamide Ink
Synergistic Effects of Nicotine and Angiotensin II: 54 Implications for Progression of Chronic Kidney Disease
in Smokers
Counting Sibling Portraits in Laminations of the Unit Disk 57
Work Function and HOMO Levels of 64 Zinc Phthalocyanine on Different Substrates
2012 Barry M. Goldwater Scholarship Recipient 75
Submission Guidelines for 2012 76
Inquiro Staff 77
Acknowledgments 80
Since its first edition, Inquiro has been committed to encouraging young scientists to share their research. When Suzanne McCluskey founded the journal in 2007, she recognized UAB’s strengths as a world-class research university with ample opportunities for undergraduate research experience. While she appreciated the opportunities to learn and investigate, she realized that students did not have a platform to share their results with others. To address this problem, she created Inquiro. Miranda and I have thoroughly enjoyed the opportunity to promote her vision.
This journal could not have been created without the guidance and mentorship of many UAB faculty and administrators. Dr. Mike Sloane’s unwavering support has enabled the journal to expand and flourish. Dr. Peter O’Neil’s feedback has helped the journal adapt to the needs of the UAB community. During the academic realignment, Dr. Brad Newcomer maintained Inquiro’s administrative support. As he restores the Office for Undergraduate Research, Nick Bieser has taken an active role in improving the journal.
This year, we expanded the journal’s mission to target a larger audience, so we worked with authors to make the articles more accessible to readers with a general science background. On page 64, you will find an incredible physics article that is one of the clearest we have ever read. If you were curious about the Higgs Boson discovery, Naveed describes its meaning and implications on page 4. Even though we have made this edition more accessible, we have not compromised Inquiro’s rigorous review process.
The editorial board and authors have worked diligently to produce the articles contained in Volume 6, and we hope that you enjoy the product of their labor. However, Inquiro’s value cannot be limited to these pages. The real value of this publication comes from the impact that it has on the UAB community. Miranda and I hope that Inquiro inspires you to contribute to the scientific community, both at UAB and wherever your careers take you.
Rachael Rosales, Chief Editor 2012 – 2013
Volume 6 • 2012

4 • inquiro | no. 6 | 2012
science newsThe Particle that Stephen Hawking Bet Against: A Look at the Elusive Higgs BosonNaveed Farrukh
Consider a particle so difficult to detect that researchers have compared its discovery to finding a “sock buried at the back of the last drawer – in a dresser with 100
drawers.” Theoretically, this particle is present in every space of the entire universe, but even Stephen Hawking doubted its existence. He actually lost $100 in a 48-year ongoing wager with Michigan University physicist Gordon L. Kane upon its discovery. Many believe the particle to be the final key to understanding the nature of matter. The particle has been theorized about for decades, and by the end of the 20th century, its existence was widely accepted; however, no scientist could actually confirm that it was real until now.
On July 4, 2012, CERN (European Organization for Nuclear Research) formally announced that it had gathered strong evidence to support the existence of the Higgs boson. People across the globe reacted to news of the particle’s discovery in a variety of ways, ranging from disbelief to outright claims that God is unnecessary. The months since CERN’s announcement have been filled with lively interpretations and reactions to the breakthrough.
CERN Laboratory and Fermilab developed the advanced technology necessary to detect the Higgs boson. Similar to the use of gravitational and electric fields leading to the discovery of the electron in Millikan’s classic Oil Drop Experiment, finding the Higgs boson required the physical abilities of the Large Hadron Collider. Within this nearly $10 billion piece of equipment, protons are accelerated toward each other at velocities approaching the speed of light until they collide, releasing an enormous amount of energy. While some more radical theorists predicted a black hole and the end of humanity, most researchers predicted that the collision would contain enough energy to break the protons into smaller particles. Within the sea of resulting decay particles, for an infinitesimally small moment of time, the Higgs boson particle did indeed seem to come into existence.
Because of this miniscule time frame, scientists could not directly observe the Higgs boson. Instead, they inferred that a Higgs boson particle was present due to interactions between the resulting observable decay particles. This approach contained a degree of uncertainty because interactions between decay products could have also been the result of particles other than the Higgs boson. In order to statistically confirm the existence of such a particle, researchers had to achieve the “five-sigma” margin of error, meaning the probability of incorrect results had to be less than 0.00003%. Reaching this level of certainty requires an
extremely large sample size. After sifting through the complex decay patterns of more than 800 trillion collisions, scientists at CERN met this standard and were able to formally claim the discovery of the elusive Higgs boson particle after four decades of searching. Joe Incandella, the first American to head a Large Hadron Collider experiment, presented the data to eager physicists. Discussions highlighted that the data “likely” pointed to such a particle and that “the probability of this particle’s appearance can be 99.9% confirmed.” The presentation was littered with graphs and pictures of crossing high intensity beams, perfect molecular mirror images to nature’s beauty on the macro level. CERN director Dr. Rolf Heurer, a strong advocate of translating science for the general audience, ended the evening by clearly stating, “I think we have it,” but hedged his statement with the more reserved interpretation, “We have observed a new particle consistent with a Higgs boson” (Heurer, 2012).
Since most people’s perceptions of reality are far removed from the realm of theoretical physics, some critics speculate that scientists simply made up these results in order to maintain funding. As such, physicists should strive to develop a language that helps those with a basic collegiate understanding of physics appreciate the significance of the Higgs boson. Many college students understand the value of such a discovery. UAB Physics major Joe Olson appreciates the renewed enthusiasm among researchers. “I am lucky to be entering graduate school on the front wave of this movement,” says Olson. “The discovery of the Higgs boson symbolizes the beginning of a new era of physics” (Olson, 2012).
Fortunately, understanding the implications of the discovery of the Higgs boson does not require a Ph.D. in theoretical physics, merely a basic understanding of matter. The Higgs boson is the last missing puzzle piece in the centuries-long effort to construct
Large Hadron Collider, CERN.

the university of alabama at birmingham | inquiro • 5
the Standard Model of particle physics. With the acceptance of this model, scientists are closer to understanding the nature of the universe in its entirety. Primitive versions of this model attempted to define matter using protons, neutrons and electrons, but the discovery that these particles were in fact composed of even smaller building blocks – quarks – gave birth to the modern Standard Model. Another category of building blocks – the leptons – were later added, leaving the bosons as the final missing blocks. Each type of boson represents a different kind of force in the world. The common photon is a boson that acts as “force-carrier,” according to Yale Assistant Professor of Physics, Tobias Golling (2010). These force-carriers enable electromagnetic force to exist between charged particles, creating light and magnetism.
Until the Higgs boson’s discovery, the Standard Model had predicted nearly all interactions at the subatomic level, and its real beauty lay in its self-sustainability and predictive nature. In fact, even before confirmation of the particle’s existence, physicists used the Higgs boson in their calculations. They faced the conundrum of knowing that such a particle must exist for the model to be reliable, yet failing to find it for over forty years. The Higgs boson represents the very base of matter; it allows all other particles to act as they do.
The Higgs boson allows for a field like its photon counterpart, but the Higgs field is quite different. Many theories included a built-in symmetry that implied that the resulting matter was massless. Since this is clearly false due to our knowledge that matter does have mass, physicists conceptually derived a field that would disturb the symmetry, which created a model in which particles did have mass. Based on this theory, the Higgs boson is a vibration of the field that creates the disturbance.
This explanation exemplifies one of the themes of physical theories in the 20th century – the wave nature of particles. Photons, quarks, and electrons can be described more accurately as fields than discrete particles. The Higgs field essentially gives other particles mass, and the Higgs boson – or vibration in the Higgs field – is the detectable component that confirms the existence of the Higgs field. The Large Hadron Collider vibrates the Higgs field very intensely, requiring an extremely large amount of energy that is generated by colliding particles at 99.9999% of the speed of light. From these collisions, CERN detected that a Higgs boson had decayed into two photons. Interestingly, some theories posit that a similar high energetic state led to the birth of the universe. The enormous amount of energy expended then vibrated the Higgs field, creating particles that decayed and combined into what now constitutes our universe.
Data collected by CERN also had larger implications. Because photons do not have mass, these particles do not interact with the Higgs boson directly (otherwise those interactions would create photon mass). The missing mass points to the likelihood of some intermediate particles between the Higgs boson and the two photons. The Standard Model predicted a Higgs boson that gives mass to all matter; however, the nature of the Higgs boson discovery has led many to think otherwise. There may be different types of Higgs particles that give mass to different things. Thus, while the discovery of the Higgs boson particle represents the end of an era, it also signals the beginning of a new one. Another implication is the possibility of finally detecting dark matter, a type of matter thought to account for a substantial part of the total mass in the universe. Some scientists theorize that the Higgs boson might decay into types of dark matter that have yet to be detected.
The general population does not typically spend hours poring over computational physics, yet many have begun scouring the Internet to learn more about the Higgs boson. In fact, this discovery, unlike most discoveries in the field of physics, whipped the media into a frenzy. CNN, Fox News, The New York Times, and even the Colbert Report have tried explaining the Higgs boson to their subscribers. Unfortunately, some reports have resulted in misunderstandings and exaggerations, such as the term “God Particle.” Most physicists cringe at the usage, but its popularity shows no signs of decreasing.
The news has permeated modern culture; the Higgs boson particle now even has several Facebook and Twitter accounts. The discovery has sparked heated debates concerning its significance in many sectors, and this lively discussion emphasizes the need for the scientific community to actively encourage and facilitate conversations with the greater society. Hopefully, this progress in discovering more about the universe has inspired a new generation of brilliant physicists. Much more work needs to be done in this area, especially because theories predict that there may be as many as five different kinds of Higgs bosons. For budding physicists and casual enthusiasts alike, there remains much left to ponder.
SourcesGolling, T. (Performer) (2010). CERN: The standard model of particle physics. Retrieved from www.youtube.com/watch?v=V0KjXsGRvoA.
Heurer, R. (Producer) (2012). 4th July 2012, press conference update on the Higgs boson searches at the LHC. Retrieved from http://cds.cern.ch/record/1459512.
Olson, J. (2012, Sept 19). Interview by N Farrukh.

6 • inquiro | no. 6 | 2012
science news
Outer Space Just Got a Little Bit SweeterAmiya Ahmed
I t’s 7:30 a.m., before work, and you’re looking for something to sweeten your coffee to get through the day ahead of you. Would you ever imagine that you could
find that spoonful of sugar in space?
Last August, Danish and American scientists discovered molecular glycoaldehyde, a type of sugar, orbiting a young star similar to our own Sun. However, unlike our Sun, this star, known as IRAS 16293-2422, is part of a binary (or two-star) system. Using the Atacama Large Millimeter Array (ALMA), a radio telescope located in northern Chile, astronomers determined that the sugar around this star is 400 light-years away in the constellation of Ophiuchus. In deep space, molecules sometimes evaporate into a gas from the heat of a star and emit radiation. Scientists can use these radio frequencies to determine the existence of microscopic molecules over 1.85 billion miles away.
These findings mean more than just the discovery of a tasty treat. The presence of this simple sugar may illuminate some answers about prebiotic chemistry, primarily how the ingredients of life could spontaneously form in deep space. While glycoaldehyde has been previously discovered in space, this is the first time it has been detected so close to a star similar to the Sun. In fact, the sugar is approximately the same distance from its star as Uranus is from the Sun in our solar system. While glycoaldehyde is similar in its molecular structure to the sugar we put in coffee, it is also one of the building blocks in the formation of nucleic acids – DNA and RNA – that contain genetic information. Glycoaldehyde can react with the molecule acrolein to form ribose, a major component of RNA, which is necessary for the origin of life.
At that distance from a star, the sugar is in the right place for the spontaneous generation of more complex molecules. Scientists hypothesize that the evolution of life on early Earth occurred through spontaneous chemical reactions, which allowed for the formation of the primary building blocks of life. While many reactions on Earth occur in aqueous solutions, molecules in outer space appear to form on the surface of cosmic dust particles. A subsequent shock wave provides the energy necessary for the simple molecules to spontaneously assemble into more complex molecules. Many astronomers question what degree of complexity these molecules can achieve before being integrated into new planets. It is theorized that when comets
crash into planets, these complex molecules release the catalytic energy necessary for the formation of biotic life.
While scientists still disagree on how life originated, these sweet findings may have brought us one step closer to determining the mysteries of prebiotic life. In addition, we are also closer to discovering if life may exist somewhere in the far reaches of space.
SourcesSpace sugar discovered in gas around young sun-like star. (2012, August 29). NBC News. Retrieved fromhttp://www.msnbc.msn.com/id/48829061/ns/technology_and_science-space/#.UInXN7Q1alLSPACE.com Staff.
Space Sugar Discovered Around Sun-Like Star. (2012, Aug. 29). SPACE.com.” Retrieved from http://www.space.com/17345-sugar-molecules-discovered-young-star.html
Than, K. (2012, August 29). Sugar found in space: A sign of life? National Geographic News. Retrieved fromhttp://news.nationalgeographic.com/news/2012/08/ 120829-sugar-space-planets-science-life/
glycoaldehyde molecules

the university of alabama at birmingham | inquiro • 7
science newsDangerous Research: Threat of bioterrorism creates need for new precautionsRamya Singireddy
We are constantly witnessing new scientific breakthroughs. Visiting the UAB webpage makes it clear that scientific exploration is treated with the utmost respect. There is no dearth of articles about the groundbreaking research being conducted on our campus and the ways it might revolutionize various fields. It can be difficult to imagine that research could be used for malignant purposes. However, as bioterrorism becomes more common in the world rather than a concept out of a sci-fi film, researchers are taking increased precautions for the safety and security of society at large.
Recently, two independent labs examining the highly pathogenic H5N1 virus called a 60-day moratorium on their studies to give government organizations sufficient time to prepare for their results. This group of 39 researchers acknowledged the “intense public debate in the media on the benefits and potential harm of this type of research” (Dean, 2012). The H5N1 virus is a highly infectious avian flu virus that has caused outbreaks in Asia and the Middle East. This virus can infect humans through close contact with sick or dead poultry but does not spread between humans. However, H5N1 has a staggering mortality rate: of the 600 cases of this viral infection since 2003, 60% of infected people have died (H5N1 Avian Flu, 2012).
The decision to begin research on the virus was made with the best intentions: to discover whether the virus can mutate into forms that may be transmissible between humans. Two labs, one in Wisconsin and the other in the Netherlands, synthesized closely related airborne forms of H5N1 that could spread between ferrets, animals whose immune system is similar to that of humans (Dean, 2012).
Despite the potential advantages of this research, there is a looming fear about the harm that may ensue from knowledge of the synthesis of this deadly viral strain. Reportedly, al-Qaeda has already called out for brothers with degrees in microbiology and chemistry to develop weapons of mass destruction (Schorow, 2012). Since the September 11 attacks, the government has examined many avenues of terrorism.
To reduce the risk of bioterrorism, the U.S. government has placed restrictions on the publication of potentially harmful research. Science in the United States has commonly followed a fully transparent system, in which research is freely published so that scientists can collaborate with one another. However, the threat of research being utilized for biological warfare has led to limitations on publication freedom. After the anthrax attacks in 2001 and small pox studies in 2003, the National Academy of Sciences

8 • inquiro | no. 6 | 2012
developed guidelines to regulate information published in scientific journals. They concluded that seven types of information pose a threat to national security. Among these are studies that enhance the virulence of a pathogen, demonstrate the ability to overpower vaccines, or create pathogens resistant to antiviral drugs (Steinbruner and Harris, 2003).
Although this is an effective method to eliminate the possibility of information being used for bioterrorism, only labs that are funded by the U.S. government – such as the National Institutes of Health – are required to follow these standards. Labs that are privately funded by corporations or that are located in other countries are not necessarily subject to the same scrutiny (Steinbruner and Harris, 2003).As two New York Times writers put it: “If we are to reduce the risk that biotechnology research is used for destructive purposes, we must require all institutions that conduct relevant research to adhere to internationally agreed rules.” Bioterrorism is no longer a figment of our imagination; it is a looming possibility. The utmost care must be taken in order to both maintain scientific integrity and ensure safe research practices.
SourcesDean, T. (2012). Research on deadly H5N1 influenza strain halted. Australian Life Scientist. Retrieved from www.lifescientist.com.au/article/413080/research_deadly_h5n1_influenza_strain_halted/.
H5N1 Avian Flu (H5N1 Bird Flu). (2012). Flu.gov. Retrieved from http://www.flu.gov/about_the_flu/h5n1/index.html. Schorow, S. (2012) Fears of bioterrorism or an accidental release. Harvard Gazette. Retrieved from www.news.harvard.edu/gazette/story/2012/02/fears-of-bioterrorism-or-an-accidental-release/.
Steinbruner, J. D. and Harris, E. D. (2003). Dangerous research: when science breeds nightmares. The New York Times. Retrieved from www.nytimes.com/2003/12/03/opinion/03iht-edstein_ed3_.html
science news
Pursuing a Research Career… Without the DoctoratePaul Lee
If a student expressed interest in research and medical practice, most people assume that he or she will pursue a combined M.D./Ph.D. degree. Despite the utility of a combined degree, the prospect of extra years in school deters some students. However, those extra years may not be necessary for all students who wish to incorporate scientific research into their medical careers.
Most people believe that physicians exclusively care for patients. While private practitioners are often pure clinicians, academic physicians defy this conception. In an article published in Academic Medicine, Dr. Steven Kanter describes the field as one that “encompasses the traditional tripartite mission of educating the next generation of physicians and biomedical scientists, discovering causes of and cures for diseases, and advancing knowledge of patient care while caring for patients” (Kanter 2008). Although many academic doctors do not possess combined degrees, they can be involved in research and teaching as well as clinical care. Dr. Ali Ahmed of the UAB School of Public Health and Dr. Harrison Walker of the UAB Department of Neurology, both medical doctors, spoke about their lives as physician-scientists.
Ali Ahmed, M.D. Harrison Walker, M.D.
Dr. Ahmed studies heart failure in older adults, the leading cause of hospital admission for this age group. While undergoing training in geriatric medicine, he learned that little was known about how to care for older patients with heart failure. He understood that more research needed to be conducted in this area, so it became a natural choice for the focus of his studies.
Dr. Walker’s research focuses on clinical conditions such as Parkinson’s, a disease characterized by loss of muscle function due to degradation of nerve cells in the brain. “My research uses clinical and electrophysiological methods to investigate how deep brain stimulation helps patients with neurological disorders,” he explained.

the university of alabama at birmingham | inquiro • 9
The desire to conduct research is an important motivator for an academic career. Research findings can enable a physician to make an impact outside of his or her own clinic. Dr. Walker expressed that while he enjoys caring for patients, he also enjoys the creative process of research and the opportunity to contribute to a body of knowledge that can improve quality of life for patients.
Dr. Ahmed echoed these sentiments, stating, “My clinical skills can only help my patients; however, findings from clinical research published in the peer-reviewed medical literature have the potential to help other patients as well, those you will not and cannot see.”
Not surprisingly, the life of an academic doctor differs vastly from the private practitioner. Doctors in private practice are independent; they can decide how much they work and how they spend their work hours. Academic doctors are not as independent because they are employed by medical schools and carry researching and teaching duties in addition to seeing patients. However, they do have some freedom to decide how to divide their daily routines between the clinic and their research.
In fact, M.D.’s can focus solely on their research, but this is rare. “M.D.’s are trained to take care of their patients, and most are emotionally attached to that skill,” explained Dr. Ahmed. “Most M.D.’s have at least some amount of clinical practice in parallel with their research; this clinical work ideally will be the basis of or a complement to their research interests.”
Dr. Walker spends one day a week seeing patients and half a day in the operating room assisting his neurological team with the placement of brain stimulators. He explained that lab funding can also influence how physician-scientists divide their time. “It helps greatly to have funding because
this allows you to have more protected time to do research,” said Dr. Walker.
“Depending on your funding and the nature of your research work, you allocate your time between research and patient care,” explained Dr. Ahmed. “If you have multiple funded projects that require a lot of effort, you may have to cut back your clinical effort. If you run into a temporary funding gap you may need to increase your efforts in the clinic.”
M.D. researchers are generally involved in research that is relevant to clinical work. After all, treating patients is the basis of medical doctors’ training. Translational research, which moves scientific knowledge from bench to patients, is one area in which physician scientists are very invested.
Dr. Ahmed considered obtaining a Ph.D. or a combined M.D./Ph.D. at one point, but decided against a doctorate because he was guided into more hands-on training in clinical research. “There are other areas of research, such as in the more basic science-related fields, where a Ph.D. might be more helpful,” he cautioned. Pursuing bench research is not as common for medical doctors.
As Dr. Ahmed’s and Dr. Walker’s careers demonstrate, many clinicians with only M.D. degrees have been successful in various areas of research. “An M.D./Ph.D. definitely gives extra sets of knowledge and skills,” said Dr. Ahmed. “Individual determination and perseverance, however, are probably more important for long-term success, whether M.D. or Ph.D.”
SourceKanter, S. (2008). What is academic medicine?. Academic Medicine, 83(3), 205-206. Retrieved from http://journals.lww.com/academicmedicine/Fulltext/2008/03000/What_Is_Academic_Medicine_.1.aspx
Road to a Cure: UAB’s Sickle Cell Disease Research InitiativeRoxie Lockhart
A normal red blood cell (left) and diseased sickle cell (right).
Sickle cell disease is a devastating genetic disease that changes normal, round erythrocytes into sickle-shaped cells. Normal red blood cells move easily through blood vessels and carry oxygen throughout the human body. However, sickled red blood cells aggregate and block blood vessels, which stops oxygen from being transported. This disease causes severe pain and harms organs, muscles, and bones. Sickle cell disease occurs more commonly in people from regions where malaria is common. In these regions, there is an evolutionary benefit in carrying a single sickle cell gene because carriers are more resistant to malaria.

10 • inquiro | no. 6 | 2012
science newsHaving sickle cell disease means a lifelong battle against health problems such as prolonged physical pain, infections, anemia, and stroke. The current treatment for sickle cell disease includes daily antibiotics from two months to five years of age to help prevent infections. Patients must find ways to manage the pain associated with sickle cell disease for the rest of their lives.
At UAB several scientists are searching for a permanent solution to cure sickle cell disease. Dr. Tim Townes has developed a research model involving gene therapy that could potentially cure sickle cell disease, a task once considered impossible. Dr. Rick Myers, director and president of HudsonAlpha Institute for Biotechnology in Huntsville, has stated, “In research you never speak lightly of curing a disease, but if anyone is going to cure sickle cell, it will be Tim (Townes).”
Dr. Townes’s research is primarily focused on gene regulation during human development. “We study the human hemoglobin gene as a model system,” he says. “The basic science interest concerns the signals that turn genes on and off as well as the mechanisms that determine tissue specific gene expression, developmental gene expression, and direct quantitative expression. Expression is an important concept because all cells have the same number and kinds of genes. What makes a brain cell different from a blood cell is differential gene expression. So the question is, ‘What are the mechanisms that determine which genes are expressed in which cells?’” Dr. Townes’s research into this question has led to important progress in the quest to find a permanent cure for sickle cell anemia.
Hereditary defects that result from mutations in the adult beta hemoglobin gene are responsible for sickle cell disease. Individuals with this disease are perfectly healthy during development because they make normal fetal hemoglobin. When they are born their bodies make both normal fetal hemoglobin and mutated adult hemoglobin. The mixture protects them from showing the symptoms at birth, but over the subsequent twelve months, fetal hemoglobin levels drop and adult levels increase due to changing gene expression. Once the level of fetal hemoglobin falls to 1%, the individuals become sick. According to Dr. Townes, “If we understood the mechanism of the switch from fetal to adult hemoglobin and could then switch them back to fetal hemoglobin, we could cure them. That’s what we’ve done.” By identifying the transcription factors responsible for the switch, he plans to use the mechanisms to develop a gene therapy and a drug that an individual can take once a day to reactivate their fetal hemoglobin levels, keeping those levels at 20% instead of 1% in order to inhibit cell sickling. The treatment would be similar to taking statin once a day for high
cholesterol and would prevent affected individuals from experiencing the physical repercussions of the disease.
This research utilizes Induced Pluripotent Stem Cell (iPSC) technology developed by 2012 Nobel laureate Shinya Yamanaka. This method converts adult skin cells back into stem cells. Dr. Townes’s research has proven that adult skin cell mutations can be corrected when they are changed into iPSCs. Sickle cell disease patients could reprogram their skin cells into iPSCs with corrected levels of hemoglobin. These cells would be available for transplantation, which would decrease the likelihood of rejection because the therapeutic cells are the patients’ own cells.
An ideal future for treating sickle cell disease would include screening every child for sickle cell at birth. “Doctors would know if the child was sick after one month,” he explains. “If at that point they get a skin biopsy and give back the corrected hemoglobin, the child would never experience any symptoms of sickle cell disease.” Realistically, this may not be available for everyone, which is why Dr. Townes is also developing a drug therapy.
Dr. Townes has not encountered any trouble in acquiring patients for clinical trials. Since he started with adult skin cells and was able to reprogram them to produce iPSCs, the research bypassed all embryonic stem cell issues. He currently has the largest population of patients participating in sickle cell research, with approximately 1000 children and 500 adults. In order to reprogram adult skin cells into iPSCs, he must first meet FDA standards to prove that the cells are safe and effective before transplanting them back into the patients.
Dr. Townes has played an instrumental role in developing a
Tim Townes, Ph.D.

the university of alabama at birmingham | inquiro • 11
sickle cell disease model in mice. Because of his efforts, the clinical relevance of iPSCs is now widely recognized. He is now paving the way to a future of gene therapy and drug treatment that will permanently prevent suffering from sickle cell disease.
SourcesInduced pluripotent stem cell. (2013). In Encyclopædia Britannica. Retrieved from www.britannica.com/EBchecked/topic/1382874/induced-pluripotent-stem-cell
Townes, T. (2012, Oct. 19). Interview by R. Lockhart.
Sickle cell anemia. (2013). In Encyclopædia Britannica. Retrieved from www.britannica.com/EBchecked/topic/542875/sickle-cell-anemia
Ryan, T. M., Townes, T. M., & Reilly, M. P. (1990). Human sickle hemoglobin in transgenic mice. Science, 247566-568.
faculty spotlightAn Interview with Dr. Joel Berry: Extending the Edges of PossibilityChapin Cavender
Joel Berry is an Associate Professor in the UAB Department of Biomedical Engineering. He is currently an active researcher and serves as a research mentor to undergraduate engineering students.
UAB is well known for its innovation in the medical sciences. A key component of this ability to find new horizons in the medical world is the field of research in biomedical engineering. Dr. Joel Berry’s research in tissue engineering and vascular stents has proved to be invaluable to both the medical community and to the undergraduate students whom he mentors.
Berry grew up in Birmingham and is an alumnus of UAB. He initially studied biology before accepting a job as a technician in an electron microscopy laboratory. During his time there, Berry was inspired by his supervisor’s interest in designing mechanical devices and in creating technical drawings of such devices. As a result, Berry decided to pursue bachelor’s and master’s degrees in mechanical engineering at UAB. His undergraduate senior design project began as a servomechanical wearable exoskeletal suit, a topic which piqued his interest in biomechanics. This subsequently led to computer modeling of dental implants for a master’s degree in mechanical engineering at UAB followed by a Ph.D. in biomedical engineering from Wake Forest University in 2001. Berry worked until 2010 as an assistant professor of biomedical engineering and was involved with the tissue engineering program at the Wake Forest Institute for Regenerative Medicine.
Though quite successful at Wake Forest, Berry missed his hometown and decided to move back to Birmingham and pursue a career at UAB. He currently serves as an Associate
Professor in the Department of Biomedical Engineering and as a researcher at the BioMatrix Engineering and Regenerative Medicine (BERM) Center. He has engaged in a variety of research projects at UAB, including engineering diseased tissues, which will expedite the process of drug development and allow for personalized drug treatments; studying the impact of electrospun nanofibers on cell behavior; and improving the use of carbon nanotubes with an embolic agent to kill tumor cells by clogging their blood supply and blasting them with heat.
Berry has been most involved with exploring the design of vascular stents. Vascular stents are pieces of cylindrical tubing which hold open an artery in a patient who suffers

12 • inquiro | no. 6 | 2012
“It’s important to explore the edges of possibility. Sometimes, when you arrive at the edges, you find
things that are not productive. You can’t be defeated by that. Go to the other edges. Find out what
possibilities exist there.”
from atherosclerosis, a condition in which buildup of plaque causes an artery to become occluded, or blocked. Berry’s research has demonstrated that vascular stents can disrupt blood flow and create stress on the walls of the arteries, and he has helped design a stent intended to reduce these adverse effects. The new stent has not yet been implemented in patients, but the research has helped to explain clinical observations about abnormal tissue growth within the blood vessels of patients who have received vascular stent treatments.
As a part of these projects, Berry has had the opportunity to travel to both Sweden and France. These international collaborations are an important aspect of Berry’s career. “Diplomacy,” he says, “is not most effectively carried out by governments, but rather by individuals—in the sciences, as an example. In diplomacy at a grassroots level, some really important differences are made.”
Undergraduate students are also an important part of Dr. Berry’s work at UAB. Berry interacts with undergraduate students through both the Department of Biomedical Engineering Honors Program and the Science and Technology Honors Program. He enjoys educating students on the concepts associated with his work, especially the clinical aspects of the engineering field. “It is a lot of fun for me to introduce students to some of the things that I have learned and see how they respond to that,” Berry says. He gives his students the opportunity to shadow physicians as they implant vascular stents into patients and to observe patients’ responses to such procedures.
Dr. Berry is also very supportive of his students and their career goals. He advises students who wish to pursue a research career to invest in their education because it
will give them the freedom to do what they enjoy. In his opinion, the most important qualities in a researcher are persistence and being undaunted by failure.
“It’s important to explore the edges of possibility. Sometimes, when you arrive at the edges, you find things that are not productive,” he explains. “You can’t be defeated by that. Go to the other edges. Find out what possibilities exist there. If you find something useful and productive at the edge of possibility, then you extend the boundaries of the next edge, the next possibility.” Berry believes that this ability to persevere in the face in failure has allowed him to have the freedom to do what he wants to do with his work, which he says is the most rewarding aspect of a career in research.
Outside of the lab, one of Dr. Berry’s main hobbies is music. He plays the guitar, the mandolin, and the bass guitar, and has also taken singing lessons. He enjoys all genres of music, but describes himself as primarily “an old rocker.” Berry also loves to spend time with his family, and he says that being a father has taught him how to focus his priorities and find a balance between his family life and his professional life.
In addition to being a successful researcher whose work has improved techniques for designing and implanting vascular stents and participating in several significant international collaborations, Dr. Joel Berry fosters a love for research in the students with whom he works. His passion for his job has inspired many students to explore the edges of possibility in biomedical research and to strive to make an impact in the international community of medical scientists with the collective knowledge they produce.

the university of alabama at birmingham | inquiro • 13
research narrativeThis One, or That One: Finding the Research for YouMira Patel
When I first thought about what I wanted to be when I grew up, I knew that I wanted to be a doctor who treated patients with direct interaction. I never thought about clinical or translational research as a career choice until I took the Phage Explorations class at the University of Alabama at Birmingham. UAB provides many research opportunities that help its current and future students excel in various fields. However, with a multitude of options, it can be difficult to choose which research to become a part of. Although everyone’s individual criteria may be different, the most important is to research something you are passionate about. Through the Science and Technology Honors Program I became zealous about research, I found my passion to pursue cancer research.
Finding the research field appropriate for me involved searches in many different categories. The first question I had to ask myself was, what field am I most interested in? Biology, chemistry, physics, or biomedical engineering? Even though I knew that the field I was majoring in did not have to be the subject for the research I would conduct, I could not resist the temptation to explore biology. I realized that research requires an understanding of the subject and
the willingness of the individual to continue to learn and apply new material. Being confident in one’s ability to adapt and learn new techniques is the most important quality that I have observed in undergraduates who join research labs.
Once I decided on the field, the next item on my checklist was a topic. Would I be intrigued by cancer, micoroorganisms, marine life or something more specific like the physiology
behind a heart stent or the effect of a genetic change on development? Ideas or inspirations can be found in the wide array of classes offered at UAB. Topics discussed in class, a subject the professor researches, or a question raised by a peer can generate interest for students. I was inspired by an upperclassman student in the Science and Technology Honors Program who had been working in Dr. Tollefsbol’s lab. Her project and the other ongoing projects in the lab appealed to me because of their use of every day dietary substances in the treatment of breast or ovarian cancer.
After narrowing my options for research to specific ones that met my area of interest, it still felt as if there were too many options. In order to funnel the options further, I needed to establish contact with the principal investigators in the labs that interested me the most. This not only allowed me to demonstrate interest to them, it also led to the opportunity to shadow for a day in their lab. Most importantly, I was able to establish rapport with the primary investigator and learn more about the subject. I also discussed my schedule with them and decided whether I would have enough time to fulfill my responsibilities in the lab. I shadowed the graduate students in the lab to get a feel for the procedures
and understand how the lab was run. This provided me with a grace period of understanding the lab before diving right in.
Lack of time can be a problem when joining a research lab because research involves a large time commitment. Undergraduates and graduates alike seem to underestimate the amount of time that a lab will consume in their daily schedule. Before joining a lab, I had to review my schedule
The first question I had to ask myself was, what field am I most interested in? Biology, chemistry,
physics, or biomedical engineering?

14 • inquiro | no. 6 | 2012
and extracurricular activities to decide if I would have enough time to be part of a lab. After joining Dr. Tollefsbol’s lab, I knew that research would then be a priority and I would have to learn how to more efficiently manage my
time. Lab work did not end in the laboratory, but continued at home and in the libraries with the understanding of other’s research and the latest findings.
The process of choosing a research lab has prepared me for various life situations. A few of the skills I developed are patience, time management, and perseverance. My coworkers in the lab became a family of support and criticism; they helped increase my tolerance and patience as I preservered through procedures. With extracurricular activities and a full load of classes, managing my time between everything became tough. However, my peers and co-workers were always willing to work with me and plan a schedule that would benefit everyone in the process.
Research is a behind-the-scenes job that ultimately impacts the public. If it were not for scientists and researchers working in their labs, doctors would not have the medicine or technology to treat patients. Researchers are the people working behind the curtains who are trying to help patients as much as the doctors up front. As research is applied to the medical field, everyone benefits and people learn new things. I believe that discovering something you never knew
before is the basis of life and medicine, because it helps one always keep an open mind and look forward to new and refreshing knowledge. The new research applied daily to people’s lives is based on the work of people who started
out as undergraduates and had to decide if research was the right career path for them. They experienced the process of searching and settling in to a lab, whether it was the first, second or third lab they tried.
Opportunities like the multitude of research labs offered at UAB and other institutions open new windows through which you see yourself and your career. With this experience, you can decide whether research is for you. My personal experience at UAB has been enlightening, and I now plan to incorporate research into my career. I encourage students who are looking into the medical field to explore every horizon and try something that you might not have thought was for you, because you never know how one experience or process can change your life forever.
The process of choosing a research lab has prepared me for various life situations. A few of the skills I developed are patience, time management,
and perseverance.
Research is a behind-the-scenes job that ultimately impacts the public. If it were not for
scientists and researchers working in their labs, doctors would not have the medicine or
technology to treat patients.

the university of alabama at birmingham | inquiro • 15
feature articleIsolation of Novel Mycobacteriophages
Mira Patel and Kasopefoluwa Oguntuyo
AbstractSince Fall 2011, UAB students in the Phage Explorations program have isolated and characterized many novel mycobacteriophages. Students isolated phages from environmental samples collected in Alabama. Phages were characterized using plaque morphology, restriction endonuclease digestions, and electron microscopy. UAB’s collection and classification of these phages will provide insight to viral evolution.
IntroductionBacteriophages (phages) are viruses that infect bacteria of the genus Mycobacterium. Millions of bacteriophages are found in soil, sea water, and extreme environments. There are an estimated 1031 phage species worldwide (Ackermann, 2011; Travis, 2003). Although only a tiny portion of this vast population has been identified and sequenced, phages have been utilized as important scientific tools. For example, the phage TM4 was used in the development of E. Coli cosmids (Keravala et al., 2006). In the future, phages could be used clinically to target bacterial pathogens (Sulakvelidze, 2001). In order to further develop these tools, phages must be better classified.
In order to simplify viral classification, the University of Pittsburg designed a classification schematic based on nucleotide similarity. Mycobacteriophages with at least 50% nucleotide similarity are sorted into the same cluster (e.g. A cluster phages). Phages with an even higher degree of nucleotide similarity are further sorted into the same subcluster (e.g. A1 subcluster phages).
Since 2010, UAB’s Phage Exploration program has isolated thirty-two phages. This summary piece includes a description of eleven of the newly isolated phages. Two of these phages were fully sequenced and classified.
Materials and MethodsPhage Collection and IsolationSamples were collected from regions in Alabama, Mississippi and Louisiana. Mycobacteriophage Mycobacterium smegmatis mc2155 were isolated from the host cell using either a standard enrichment or direct plating protocol. The nutrient rich enrichment media contained 10X 7H9/glycerol broth, AD supplement, and 100mM CaCl2. To ensure the integrity of the plaque morphology and to create a concentrated phage stock solution, spot tests and titter assays were performed according to a standard protocol established by the National Genomics Research Institutes Phage Laboratory Manual. Phage samples were plated with a standard 1X Middlebrook top agar medium containing 1 mL 100mM CaCl2, 50 mL 2XTA, and 50 mL 7H9.
Figure 1. Phages isolated from the 2010-2011 UAB Phage Explorations Program
1a. Plaque morphology of select mycobacteriophages.
1b. Restriction enzyme digests of select mycobacteriophages.
1c. Electron microscopy images of select mycobacteriophages.
Figure 2. Phages isolated from the 2010-2011 UAB Phage Explorations Program
2a. Plaque morphology of select mycobacteriophages.
2b. Restriction enzyme digests of select mycobacteriophages.
2c. Electron microscopy images of select mycobacteriophages.

16 • inquiro | no. 6 | 2012
Electron Micrograph ImagingA concentrated phage sample was stained with 1% uranyl acetate. Individual phages were structurally characterized using electron microscopy in the UAB Shelby Building.
Restriction Enzyme DigestPhage genomic DNA was isolated using DNaseI and RNase A, a pre-warmed buffer containing resin, Promega DNA Clean-up kit, and 80% isopropanol. Pre-warmed 80ºC TE was used to remove the DNA bound to the column. A spectrophotometer was used to assess the concentration and purity of the DNA samples. Phage genomes were digested using a variety of restriction endonucleases, including BbsI, EcoRV, HindIII, HaeIII, EcoRI, ClaI, BamHI, PstI, XbaI, and SalI. A 0.8% agarose gel with ethidum bromide and 10kb DNA ladder were used.
Sequencing and ClassificationThe 2010-2012 Phage Explorations class chose to send Deji Alakija’s OSMaximus to Virginia Commonwealth University for Sanger sequencing. The 2011-2012 class chose to sequence Harsh Shah’s Dhanush. Both phages were classified using the University of Pittsburg system.
Results and DiscussionOSMaximus was grouped with the B1 subcluster; Dhanush was classified into the A4 subcluster.
In this study, we provide evidence of the isolation of eleven novel mycobacteriophages from Alabama. The electron micrograph (EM) images show that the isolated phages have long tails, indicating that they may belong to the Siphoviridae family (Figs. 1a and 2a). Tail lengths varied from 150-200 nm, and capsid sizes ranged from 60-120 nm. The distinctly different banding patterns on the restriction enzyme digests suggests nucleotide dissimilarity, which is consistent with the claim that these samples are eleven distinct phages (Figs. 1b and 2b).
OSMaximus’s classification as an A4 phage may have biotechnological implications. Members of the A cluster possess a gene that encodes for an integrase protein, which incorporates the phage genome into the host cell’s chromosomal DNA in a site-specific manner. This may be useful in recombinant DNA technology.
Thirty of the newly discovered phages have not yet been fully sequenced and classified. We hope to sequence the full genome of these phages or to classify them by alternate means. Classifying phages enables scientists to assess similarities and differences between phage populations. Moreover, newly discovered phages may contain novel proteins that could be important experimental and clinical tools.
AcknowledgmentsWe would like to acknowledge the support received from the Science Education Alliance of Howard Hughes Medical Institute and the UAB Biology Department. Additionally, we would like to acknowledge contributions from the entire 2010-2011 and 2011-2012 Phage Explorations Teams: Amiya Ahmed, Peter
Blair, Grace Cain, Michelle Chang, Dakota Clark, Madison Duckworth, Courtney Dunkerly, Chris Johnston, Steve Layfield, Minchung Liu, Akshay Mentreddy, Colby Nance, Mira Patel, Sherwin Thomas, Laura Aristizabal, Katherine Beaufait, Lacey Kennedy, Roxie Lockhart, Michael Longmire, Matt Mardis, Erik McGuire, Carley McWilliams, Kiara Moss, Christine Nguyen, Sope Oguntuyo, Rikita Patel, Jui Paul, Harsh Shah, Ramya Singireddy, Michael Torello, Angelina Londono-Joshi, and Denise Monti, Ph.D., MPH.
References1. Ackermann, H.W. (2003) Bacteriophage observations and
evolution. Res Microbiology 154(4); 245-251.
2. Ackermann, H.W. (2011) Bacteriophage taxonomy. Microbiology Australia May 2011 Volume; 90-94.
3. Keravala, A., Groth, A.C., Jarrahian, S., Thyagarajan, B., Hoyt, J.J., Kirby, P.J., and Calos, M.P. (2006) A diversity of serine phage integrases mediate site-specific recombination in mammalian cells. Molecular Genetics Genomics 276: 135-146.
4. Kim, A.I., Ghosh, P., Aaron, M.A., Bibb, L.A., Jain, S., and Hatfull, G.F. (2003) Mycobacteriophage Bxb1 integrates into the Mycobacterium smegmatis groEL1 gene. Mol Microbial 50; 463-473.
5. Lavigne, R., Darius, P., Summer, E.J., Seto, D., Mahadevan, P., Nilsson, A.S., Ackermann, H.W., and Kropinski, A.M. (2009) Classification of myoviridae bacteriophages using protein sequence similarity. BMC Microbiology 9.
6. Mediavilla, J., Jain, S., Kriakov, J., Ford, M.E., Duda, R.L., Jacobs, W.R., Hendrix, R.W., and Hatfull, G.F. (2000) Genome organization and characterization of mycobacteriophage Bxb1. Mol Microbiol 38; 955-970.
7. Nelson, D. (2004) Phage Taxonomy: We agree to disagree. Journal of Bacteriology 186(21); 7029-7031.
8. Travis, J. (2003) All the world’s a phage: viruses that eat bacteria abound–and surprise. Science News Vol. 164; 26-28.
9. Pope, W.H. et. al… Hatfull, G.F. (2011) Expanding the Diversity of Mycobacteriophages: Insights into Genome Architecture and Evolution. PLOS ONE.
10. Sulakvelidze, A., Alavidze,Z., Morris, G. Jr. (2001) Bacteriophage Therapy. American Society for Microbiology: Antimicrobial Agents and Chemotherapy Vol. 45; 649-659.

the university of alabama at birmingham | inquiro • 17
faculty spotlightNick Bieser: UAB’s new Coordinator of Undergraduate ResearchTimothy Fernandez
Interested in studying biochemical pathways? Or is observing the life cycle of sea turtles more up your alley? Whatever your desired experience, the newly designed Office for Academic Engagement and Global Citizenship should be your destination. The office comprises three branches: the Office of Study Away, the Office of Service Learning, and the Office of Undergraduate Research. The Office of Undergraduate Research provides the information and tools necessary to educate students about research and creative activities, helps them find and engage in fulfilling research and creative activity opportunities, and assists them in communicating their findings. Under the direction of Nick Bieser, the new Coordinator of Undergraduate Research, this office helps pair students with mentors in the UAB and Birmingham communities.
Bieser received his bachelor’s degree in conservation zoology from Auburn University and earned his master’s degree in biology from Purdue University in Indiana. He has a passion for reptiles and amphibians and studied herpetology in particular. Prior to his undertaking at UAB, he was the Conservation Land Manager for Ruffner Mountain Nature Preserve in Birmingham as well as the Director of Conservation for the Alabama Reptile Rescue Sanctuary. During his time at Ruffner, he oversaw interns and students in many undergraduate ecological research projects, such as sampling chytrid fungus and performing botanical surveys. Bieser has always had a passion for helping students succeed in a research setting.The goal of the Office for Student Academic Engagement
and Global Citizenship is to increase undergraduates’ experiences in real world, hands-on involvement through study away, service learning, and undergraduate research. By getting students active in these areas, the office hopes that it will make them more academically engaged outside of the classroom.
Bieser hopes to increase awareness of the office because he wants to make it easier for students to find opportunities and to increase their research training. In order to help students secure spots in research labs, he emphasizes the dynamic of the student/mentor relationship.
“It’s important to make students aware of the expectations in a lab before they enter into a relationship with a mentor,” says Bieser. “The Office for Student Academic Engagement is here to help make the transition smoother so that both the student and the mentor are prepared for that relationship and make the experience beneficial for both.”
Bieser encourages undergraduates currently seeking a research or creative opportunity to stop by his office. “The best advice that I give to students is that they should have a genuine interest in their area of study, even if it is outside of their major. Having a real curiosity will make the entire experience that much more rewarding,” he says. “It’s important to get to know the people in their areas of interest and talk to them. From that, students will get a better understanding of what it’s like to be a research scientist.”
Bieser emphasizes, “Whether it is [through] undergraduate research, service learning, or study away, a student will be a better citizen and will have a better perspective of the world. These experiences will give you valuable skills later in life no matter what career path you choose.”
If you would like more information about getting involved in undergraduate research, feel free to contact Nick Bieser at [email protected] or visit his office in room 527 of Heritage Hall on the UAB campus.
“It’s important to make students aware of the expectations in a lab before they enter into a relationship with a mentor.”

18 • inquiro | no. 6 | 2012
short report
AbstractCryptosporidium parvum is a protozoan parasite, which causes the disease Cryptosporidiosis. There is no effective treatment for infection. Available data suggests that it depends mainly on glycolysis for energy production. Therefore pyruvate kinase, a major regulatory enzyme in the glycolytic pathway, may be a po-tential target for anti-cryptosporidial drugs. Unfortunately, bio-chemical pathways of cryptosporidium are poorly understood. Biochemical and structural characterization of its pyruvate kinase (CpPyK) would allow us to identify features that distin-guish it from its human counterpart. This knowledge is crucial for developing strategies for targeting CpPyK for drug design. The crystal structure of CpPyK in the apo form was determined in our laboratory. The aim of this project is determine optimal conditions for producing CpPyK crystals in the substrate-bound form to enhance our understanding of the enzyme’s active site. In pursuit of these goals, we determined the optimal concen-trations of magnesium and potassium ions needed for enzyme activity. Our results show that magnesium ion is essential for the activity and that potassium ion is not required, but signifi-cantly enhances the activity. We also show that a strong reduc-ing agent has no effect on the enzyme activity. Crystals used for solving the structure of CpPyK were grown in highly acidic con-ditions using ammonium sulfate as the crystallization reagent. In the crystal structure, a sulfate ion was bound to the activator binding site and a glycerol molecule was found at the substrate binding site. In this study, we prepared crystals of CpPyK in con-ditions (in the absence of sulfate and glycerol) more favorable for substrate binding.
IntroductionCryptosporidiosis is a waterborne disease caused by the pro-tozoan parasite C. parvum found worldwide [1]. Last year in Indiana and Michigan a group of firefighters contracted the dis-ease after using water from a nearby contaminated pond to ex-tinguish a fire [3]. Immunocompromised people, such as AIDS patients, are at high risk of contracting the disease. There is currently no effective drug for the treatment of Cryptosporidi-osis. C. parvum relies upon anaerobic oxidation of glucose for energy, so enzymes in the glycolytic pathway are potential drug targets. Pyruvate kinase (CpPyK), the last enzyme in the glyco-lytic pathway, is a major regulator of glycolytic flux and therefore has been targeted for developing antiparasitic and antibacterial agents [2].
Structural and Functional Analysis of Cryptosporidium parvum Pyruvate Kinase, a Potential Drug Target
Khadijah Aleem
Ronald E. McNair Scholars Program, University of Alabama at Birmingham
CpPyK converts phosphoenolpyruvate (PEP) and adenosine diphosphate (ADP) into pyruvate and adenosine triphosphate (ATP). Activity of these tetrameric enzymes is allosterically regu-lated by various phosphorylated sugars. CpPyK is unique in that it does not show allosteric activity with phosphosugars known to be effectors for other PyK’s.
The crystal structure of CpPyK in the apo form was determined in our laboratory. These crystals were grown at 4°C in an acidic pH (3.8-4.2) using ammonium sulfate as the precipitant. In the crystal structure, CpPyK maintains the tetrameric assembly as shown in Fig.1A. Each CpPyK subunit has four domains: N (residues 23-32), A (42-112 and 212-389), B (113-211) and C (390-526). The N domain usually remains disordered in PyK structures; the only portion of the N-domain visible in CpPyK structure is a short α-helix (residues 23-32) referred to as the N-helix (Fig. 1B). The A-domain has a parallel (α/β)8 barrel (Fig 1B). The B-domain forms an antiparallel β-barrel composed of nine β strands. The C-domain contains five β strands sur-rounded by five α helices. The crystal structure revealed that Cys26 of the N-helix is involved in a unique intermolecular di-sulfide bond with Cys312 of another CpPyK subunit. However, a number of questions remain to be answered. For example, we do not know whether or not the strong reducing agent TCEP will reduce the intracellular disulfide bond (i). PyK usually re-quires divalent and monovalent cations for activity. The cation requirement for optimum CpPyK activity is not known (ii). The biochemical role of the disulfide bond is also not known. No disulfide bond has been found in any other PyK and deletion of the N-helix was found to have no effect on Toxoplasma gondii PyK 1[6] (iii). Crystals of CpPyK contain no substrate or product, so the active site of CpPyK could not be mapped from the crys-tal structure. In the crystal structure, a glycerol molecule (from the crystallization medium) was found at the site where ADP is located in other PyK structures and a sulfate ion (also from the crystallization reagents) was located in the site where effector molecules bind in other PyK structures. Moreover, CpPyK was crystallized at highly acidic conditions which may not be opti-mum for enzymatic activity.
The purpose of this project is to determine the optimal concen-trations of Mg2+ and K+ ions needed for CpPyK activity. In addi-tion, we aim to examine the activity of CpPyK in the presence of TCEP, a strong reducing agent that may reduce its intermolecu-

the university of alabama at birmingham | inquiro • 19
lar disulfide bond. CpPyK may be more active at a higher pH than the crystal structure in Figure 1A and 1B models, so we crystallize the enzyme at higher pH. Lastly, we crystallized Cp-PyK in the absence of sulfate and glycerol to allow binding of the substrate and effector-like molecules in the appropriate sites.
Research Design, Results, and DiscussionDetermining the Optimal salt requirement for CpPyK activityCpPyK activity was measured spectrophotometrically in a cou-pled assay with lactate dehydrogenase (LDH). In the first re-action, CpPyK catalyzes the reaction between PEP and ADP to yield ATP and pyruvic acid. In the second reaction, LDH cata-lyzes the reduction of pyruvic acid into lactic acid and concomi-tantly NADH is oxidized to NAD+. The rate of the reaction is measured by following the decrease in absorbance at 340 nm due to oxidation of NADH. In the assay, 5 µg of CpPyK was in-cubated at 30°C for 3 min in 1 ml reaction containing 1.4 mM PEP, 0.14 mM ADP in 20 mM HEPES buffer, pH 7.5 with varying concentrations of MgCl2 (0-20 mM) and KCl (0-150 mM). Then 0.1 mM NADH and 0.18 µg of LDH were added. The reaction velocity was measured at 30°C for 30 sec by following the de-
crease in UV absorbance at 340 nm. The results indicated that 2.5-5.0 mM MgCl2 was necessary for CpPyK activity (Fig. 2B). KCl was not essential, but 10 mM KCl was optimal for CpPyK activity (Fig. 2A).
Determining the effects of the reducing agent TCEPThe crystal structure of CpPyK revealed the presence of inter-molecular disulfide bonds between Cys26 and Cys313 of each monomer. In order to test if the disulfide bond is required for the enzymatic activity we used Tris(2-carboxyethyl)phosphine (TCEP), a reducing agent which breaks disulfide bonds. First we checked if TCEP had any effect on the LDH activity. We in-cubated 1 µg of LDH in 20 mM HEPES buffer pH 7.5, 2 mM pyruvic acid and 0.1 mM NADH with and without 1 mM TCEP at 30°C. The decrease in absorbance (at 340 nM) was recorded. From the results of this assay it was concluded that TCEP has no effect on LDH activity. Since TCEP was observed to have no effect on the LDH activity, we proceeded to examine its effect on CpPyK activity using the coupled assay. For CpPyK assay, 5 µg CpPyK was incubated with and without 1 mM TCEP, 1.4 mM PEP, 0.14 mM ADP in 20 mM HEPES buffer pH 7.5 for 3 min at 30ºC. 1 µg LDH and 0.1 mM NADH were added to the mixture and the decrease in absorbance was measured for 30 sec. The result from the addition of TCEP indicated that TCEP had no ef-fect on CpPyK activity (Fig.3).
Crystallization at a higher pHCrystallization of CpPyK was performed using a hanging drop vapor diffusion technique. The drop contained 1 µl of CpPyK and 1 µl of reservoir solution mixed on a cover slip. Each res-ervoir solution contained different reagents and additives. The cover slips were sealed over the reservoir with vacuum grease to allow vapor diffusion between the reservoir and the drop. Crystals were obtained at a higher pH (reservoir condi-tion: 12.5% PEG 3000, 0.1 M Hepes pH 7.5, 0.3 M NaCl, 15% glycerol). Using a dye (Izit dye, Hampton Research) that binds to proteins we confirmed that were indeed CpPyK crystals but these crystals were not suitable for X-ray diffraction analysis.
Figure 1A. Tetrameric structure of C. parvum pyruvate kinase. The tetrameric structure was generated by a crystallographic 2-fold axis. Domains of monomer A: A-domain wheat, B-domain magenta, C-domain-light green. Monomer B is blue. (Reprinted from PLOS ONE)
Figure 1B. Monomer A of C. parvum pyruvate kinase showing two sulfate ions as ball and stick models labeled as SULF1 and SULF2. The N-helix of monomer B (colored cyan) is included to display the disulfide bond between Cys 26 and Cys312 (shown as orange balls). The glycerol molecules shown in stick models are GOL1 and GOL2. (Reprinted from PLOS ONE)

20 • inquiro | no. 6 | 2012
Crystallization with a substrate (ADP)CpPyK and the substrate ADP (with or without 10 mM MgCl2) were incubated for 1 hr before performing crystallization. The drops contained 0.5 µl water, 0.5 µl reservoir solution (10% PEG 1000, 0.1 M sodium acetate pH 4.8, 10 mM MgCl2), and 1 μl of CpPyK. These crystals were grown at room temperature overnight. The average dimensions of these crystals were 0.2 X 0.2 X 0.1 mm. Crystals were obtained in the presence of ADP with and without glycerol. Further optimization and analysis are in progress.
ConclusionOur results indicate that Mg2+ is essential for CpPyK activity and the optimum concentration of MgCl2 is between 2.5-5.0 mM. KCl was found to be non-essential for enzymatic activity, but ac-tivity increased significantly in the presence of 10 mM KCl. En-zyme assays in the presence of TCEP resulted in no measurable effect on CpPyK activity. Since we have no direct evidence that the TCEP in fact reduced the intermolecular disulfide bond we cannot ascertain if the disulfide bond has any influence on the enzyme activity. However, TCEP was a strong reducing agent and in the crystal structure the disulfide bond is found to be exposed. Therefore, it is likely that treatment with TCEP caused
reduction of the disulfide linkage.
CpPyK crystals grown at pH 7.5 exhibited needle-like shape and will require further optimization before X-ray diffraction analy-sis. Crystallization of the CpPyK with the substrate ADP resulted in obtaining crystals of good size but X-ray diffraction of these crystals did not produce significant diffraction patterns.
AcknowledgmentsI would like to thank my mentor Debasish Chattopadhyay for giv-ing me the opportunity to work in his lab, helping me establish the structure of my project, and providing academic support and encouragement. I would like to give an extended thanks to the Ronald E. McNair Scholars Program for providing me with the opportunity to explore the great aspects of research. Also, thanks to Norbert Schormann for providing me with support in the laboratory.
References1. Tzipori S, Ward H (2002) Microbes Infect 4: 1047-1058.
2. Zoraghi R, Worrall L, See RH, Strangman W, Popplewell WL, et al. (2011) J Biol Chem 286: 44716-44725.
3. Outbreak of Cryptosporidiosis Associated with a Firefighting Response — Indiana and Michigan, June 2011. (Web. 14 Oct. 2012). Retrieved September 2012, from http://www.cdc.gov/mmwr/preview/mmwrhtml/mm6109a2.htm
4. Bakszt R, Wernimont A, Allali-Hassani A, Mok MW, Hills T, et al. (2010) The Crystal Structure of Toxoplasma gondii Pyru-vate Kinase 1. PLOS ONE 5(9): e12736. doi:10.1371/journal.pone.0012736
5. Cook WJ, Senkovich O, Aleem K, Chattopadhyay D (2012) Crystal Structure of Cryptosporidium parvum Pyruvate Kinase. PLOS ONE 7(10): e46875. doi:10.1371/journal.pone.0046875
Figure 3. Reaction rate at 0 and 1 mM TCEP. Addition of 1 mM TCEP had no effect on enzyme activity.
Figure 2B. CpPyK reaction rate at varying concentration of MgCl2. The optimum MgCl2 concentration range is 2.5-5.0 mM.
0
0.01
0.02
0.03
0.04
0.05
0.06
0 50 100 150 200
KCl Concentration (mM)
Rate
(sec
onds
)
KCl
Figure 2A. CpPyK reaction rate at varying concentration of KCl. Optimum concentration of KCl is 10 mM.
0
0.005
0.01
0.015
0.02
0.025
0.03
0.035
0.04
0.045
0.05
0 5 10 15 20 25MgCl2 Concentration (mM)
Rate
(sec
onds
) MgCl2

the university of alabama at birmingham | inquiro • 21
short report
Effect of Distraction and Traffic Congestion on Visual Attention
Leslie Williams1,2, Benjamin McManus, B.S1, Despina Stavrinos, PhD1
1 Translational Research for Injury Prevention (TRIP) Laboratory, Department of Psychology, University of Alabama at Birmingham; 2 University Honors Program
ObjectiveA pilot study was conducted to determine the effect of distraction (e.g., texting and talking on the phone) and traffic congestion on visual attention during simulated driving.
Background In 2010, 18% of the over one million injury-related motor vehicle crashes were directly related to distracted driving (Department of Transportation [DOT], 2012). An overall lack of attention while driving is the primary cause of motor vehicle crashes (National Highway Traffic Safety Administration [NHTSA], 2012). A major threat to attention while driving is the visual distraction associated with cell phone use, as it is reported that 13.5 million drivers use cell phones at any given moment (NHTSA, 2012). There are three types of distractions present while driving: visual, cognitive, and manual (Young, K & Regan, M, 2007). This study focuses on the visual distractions involved with cell phone use while driving. Research suggests that engaging in cell phone conversation while driving may lead to an increase in traffic congestion (Cooper, Vladisavljevic, Medeiros-Ward, Martin, & Strayer, 2009). As the relationship between texting and traffic congestion was unknown, this pilot study extended previous work with the inclusion of texting as a form of distraction under consideration.
HypothesisIt was hypothesized that texting while driving required drivers to keep their eyes off of the road more than while engaged in cell phone conversation. Additionally, it was hypothesized that drivers would avert more attention from the road while texting during high traffic congestion than while talking on the phone or when no cellular distraction was present in medium or low levels of traffic congestion. This was suggested based on the assumption that drivers may be more willing to use their cellular device while traffic is at a standstill.
MethodParticipantsTwelve individuals, ages ranging 17 to 25 years old (M age = 22.3 years, SD =2.91) (50% male; 50% African American), were recruited to participate as part of a larger study. Inclusion criteria included possession of a driver’s license, possession and
regular use of a cell phone with text messaging capability, and a willingness to use the personal cell phone during the session. Exclusion criteria for both groups included physical disabilities (e.g., visual or hearing impairment, use of a wheelchair).
ProcedureParticipants drove in a STISIM™ (Systems Technology Inc.) simulator, which served as an interactive representation of the driving experience. Participants drove three times each, each time with one of three randomly presented distractions (cell phone, texting, and undistracted). Table 1 illustrates the repeated measures experimental design:
Table 1. Experimental Design
Distraction Condition (Presented in
Random Order)TXT CP ND
Congestion Level(Presented in
Random Order)
Low, Medium,
High
Low, Medium,
High
Low, Medium,
High
Note. TXT = text messaging; CP = cell phone; ND = no distraction. Participants drove three times each, each with three randomly ordered presented distractions (TXT, CP, & ND) in three randomly ordered presented traffic congestion levels (Low, Medium, High).
FaceLab Version 5™ (Seeing Machines Inc.) was used to track participants’ eye gaze position as they drove in the simulator. The percentage of time in which the driver’s eyes were not on the road was calculated by dividing time the participant’s eyes were not focused on the simulator screen by the total time of the simulated drive multiplied by 100.

22 • inquiro | no. 6 | 2012
Data AnalysisMain effects of distraction and level of traffic congestion and the interaction were assessed using 3x3 Repeated Measures ANOVA (with Greenhouse-Geisser correction). Within Subjects Factors: Distraction and Congestion. Dependent Variable: Percent of time eyes off road (visual attention).
ResultsThere was a significant difference between distracted (CP & TXT) (M = 31% of drive, SD = 28%) as compared to not distracted (ND) across all congestion levels (M = 15%, SD = 19%) (Figure 1). Post hoc analyses revealed a significant difference in percentage of times that drivers took their eyes
off the road between texting (M = 29%, SD = 19%) vs. not distracted (M = 15%, SD = 19%) (Figure 1). There was no significant difference among congestion levels regardless of distraction on the percentage of time that drivers took their eyes off of the road (F(1.4, 15.1) = 0.03, p = 93), and there was no interaction (each distraction measured across each congestion level) of distraction and congestion level on visual attention (F(2.3, 25.2) = 0.48, p = .65) (Figure 1).
Figure 1. A significant main effect of distraction was revealed, F(1, 11) = 9.42, p=.01* Indicates the significant difference between distraction (TXT and CP) and no distraction (ND)

the university of alabama at birmingham | inquiro • 23
Interview with Uday Vaidya, Ph.D. Harsh Shah
Professor Uday Vaidya’s academic career started in mechanical engineering, but he used his training to become a teacher in a very different engineering field. In addition to his academic and teaching obligations, he dedicates a significant amount of time to mentoring promising engineering students.
faculty interview
Describe your education. Where did you attain your undergraduate and graduate degrees and what did you study? I studied at Karnataka University in India, where I earned my bachelor’s degree. After this I went on to attend Shivaji University in India and earn my master’s degree. I then moved to the United States and attended Auburn University to earn my Ph.D. All of my degrees are in the field of mechanical engineering.
What did you study to attain your Ph.D.? My Ph.D. research focused on carbon–carbon composites. These composites are known for their resistance to high temperatures and are used on the front nose cones of NASA space shuttles. I researched, evaluated, and quantified defects that occur in the processing of carbon–carbon composites.
You studied mechanical engineering, but teach materials engineering. How did you become interested in the field of materials?Although my degrees are in mechanical engineering, my core research was always focused in materials. In many schools, the disciplines of material and mechanical are combined; this interdisciplinary aspect of the field was intriguing to me. The many possibilities of lighter and cheaper materials have always interested me, so I have stayed in this field from the time I started to perform research. The ever-changing nature of materials engineering is exciting. Every day, a new application of a material enters the research world. Finally, materials engineering is a central link to other engineering disciplines like mechanical, electrical, and biomedical; therefore, I am able to interact with engineers from different fields.
Why did you decide to become a professor at UAB?I first worked at Tuskegee University because of its close proximity to Auburn University. I then left Alabama and worked at North Dakota State University in Fargo, North Dakota. I came to UAB in 2000 because of the many opportunities that are present in Birmingham and the surrounding region.
What is the basis of your interest in research?I am interested in research because I am able to have variety in my work. Research presents the option to take your work in whichever direction you want. It is not as restrictive as industry. In industry, if I want to change my discipline focus, there are more procedures involved. I enjoy the freedom of tailoring my work to address multi-disciplinary problems.
The ever-changing nature of materials engineering is exciting. Every day, a new application of a material enters
the research world.
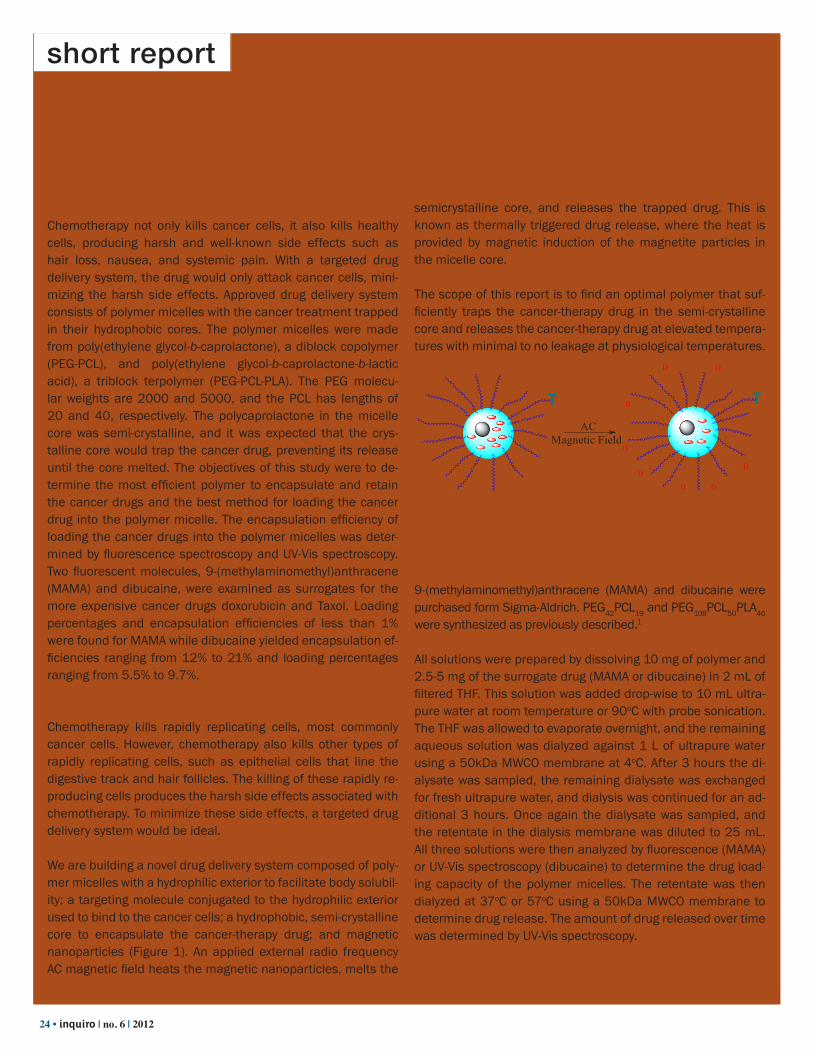
24 • inquiro | no. 6 | 2012
Thermally Triggered Drug Release from Polymer MicellesJerome S. Arceneaux1, Amanda L. Glover2, Jacqueline A. Nikles1, David E. Nikles2
1 Department of Chemistry, University of Alabama at Birmingham, Birmingham, Alabama 35294-12402 Department of Chemistry, The University of Alabama, Tuscaloosa, Alabama 35487-0336
AbstractChemotherapy not only kills cancer cells, it also kills healthy cells, producing harsh and well-known side effects such as hair loss, nausea, and systemic pain. With a targeted drug delivery system, the drug would only attack cancer cells, mini-mizing the harsh side effects. Approved drug delivery system consists of polymer micelles with the cancer treatment trapped in their hydrophobic cores. The polymer micelles were made from poly(ethylene glycol-b-caprolactone), a diblock copolymer (PEG-PCL), and poly(ethylene glycol-b-caprolactone-b-lactic acid), a triblock terpolymer (PEG-PCL-PLA). The PEG molecu-lar weights are 2000 and 5000, and the PCL has lengths of 20 and 40, respectively. The polycaprolactone in the micelle core was semi-crystalline, and it was expected that the crys-talline core would trap the cancer drug, preventing its release until the core melted. The objectives of this study were to de-termine the most efficient polymer to encapsulate and retain the cancer drugs and the best method for loading the cancer drug into the polymer micelle. The encapsulation efficiency of loading the cancer drugs into the polymer micelles was deter-mined by fluorescence spectroscopy and UV-Vis spectroscopy. Two fluorescent molecules, 9-(methylaminomethyl)anthracene (MAMA) and dibucaine, were examined as surrogates for the more expensive cancer drugs doxorubicin and Taxol. Loading percentages and encapsulation efficiencies of less than 1% were found for MAMA while dibucaine yielded encapsulation ef-ficiencies ranging from 12% to 21% and loading percentages ranging from 5.5% to 9.7%.
IntroductionChemotherapy kills rapidly replicating cells, most commonly cancer cells. However, chemotherapy also kills other types of rapidly replicating cells, such as epithelial cells that line the digestive track and hair follicles. The killing of these rapidly re-producing cells produces the harsh side effects associated with chemotherapy. To minimize these side effects, a targeted drug delivery system would be ideal.
We are building a novel drug delivery system composed of poly-mer micelles with a hydrophilic exterior to facilitate body solubil-ity; a targeting molecule conjugated to the hydrophilic exterior used to bind to the cancer cells; a hydrophobic, semi-crystalline core to encapsulate the cancer-therapy drug; and magnetic nanoparticles (Figure 1). An applied external radio frequency AC magnetic field heats the magnetic nanoparticles, melts the
semicrystalline core, and releases the trapped drug. This is known as thermally triggered drug release, where the heat is provided by magnetic induction of the magnetite particles in the micelle core.
The scope of this report is to find an optimal polymer that suf-ficiently traps the cancer-therapy drug in the semi-crystalline core and releases the cancer-therapy drug at elevated tempera-tures with minimal to no leakage at physiological temperatures.
Figure 1. Schematic representation of magnetically triggered drug release from the core of a polymer micelle.
Experimental9-(methylaminomethyl)anthracene (MAMA) and dibucaine were purchased form Sigma-Aldrich. PEG42PCL19 and PEG108PCL50PLA46 were synthesized as previously described.1
All solutions were prepared by dissolving 10 mg of polymer and 2.5-5 mg of the surrogate drug (MAMA or dibucaine) in 2 mL of filtered THF. This solution was added drop-wise to 10 mL ultra-pure water at room temperature or 90oC with probe sonication. The THF was allowed to evaporate overnight, and the remaining aqueous solution was dialyzed against 1 L of ultrapure water using a 50kDa MWCO membrane at 4oC. After 3 hours the di-alysate was sampled, the remaining dialysate was exchanged for fresh ultrapure water, and dialysis was continued for an ad-ditional 3 hours. Once again the dialysate was sampled, and the retentate in the dialysis membrane was diluted to 25 mL. All three solutions were then analyzed by fluorescence (MAMA) or UV-Vis spectroscopy (dibucaine) to determine the drug load-ing capacity of the polymer micelles. The retentate was then dialyzed at 37oC or 57oC using a 50kDa MWCO membrane to determine drug release. The amount of drug released over time was determined by UV-Vis spectroscopy.
short report

the university of alabama at birmingham | inquiro • 25
Results9-(methylaminomethyl)anthracene (MAMA) fluoresces at 394, 415, and 438.5 nm when excited at 366 nm. Dibucaine ab-sorbs strongly at 327 nm. These spectroscopic properties en-abled the measurement of drug loading capabilities for both molecules (Figure 3).
Drug loading was examined at both room temperature and at elevated temperature (90oC) using both PEG42PCL19 and PEG-
108PCL50PLA46. At low temperatures, the loading efficiency of MAMA was 0.026%. At elevated temperatures, the loading ef-ficiency increased to 0.20% in PEG42PCL19 and 0.22% in PEG-
108PCL50PLA46. Dibucaine showed a loading efficiency of 5.5% in PEG108PCL50PLA46 and 9.7% in PEG42PCL19 (Table 1). Due to the higher efficiency of drug loading, drug release studies were con-ducted using dibucaine in PEG42PCL19 and PEG108PCL50PLA46.When PEG108PCL50PLA46 was used to encapsulate dibucaine, 45% of the dibucaine is released at 57oC and 25% is released at 37oC (Figure 4). Using PEG42PCL19, 52% of dibucaine is released at 57oC and 40% is released at 37oC (Figure 4).
Polymer Drug ProcedureLoading
(% Drug by Total Mass)
PEG42PCL19 MAMA RT 0.026
PEG42PCL19 MAMA HOT 0.20
PEG108PCL50PLA46 MAMA HOT 0.22
PEG108PCL50PLA46 Dibucaine HOT 5.5
PEG42PCL19 Dibucaine HOT 9.7
Table 1. Methods and loading percentages used to prepare the micelles.
9-(methyllaminomethyl)antracence (MAMA)Dibucaine
CH2
NH CH3
N O CH2
CH2CH2
CH3
CNHO CH2
CH2N
CH2 CH3
CH2 CH3
Figure 2. Structures of MAMA and dibucaine
380 400 420 440 460 480 5000.0
5.0x10⁵
1.0x10⁶
1.5x10⁶
2.0x10⁶
2.5x10⁶
3.0x10⁶
3.5x10⁶
Inte
nsity
(cps
)
Wavelength (nm)
PEG42PCL19 PEG42PCL19(Hot) PEG108PCL50PLA46(Hot)
300 320 340 360 380 4000.00
0.05
0.10
0.15
0.20
0.25
0.30
Abs
orba
nce
Wavelength (nm)
Figure 3. Fluorescence emission spectra of 9-(methylaminomethyl)anthra-cene (MAMA) loaded in either PEG42PCL19 (black and red) or PEG108PCL50P-LA46 (blue) micelles (left). UV-Vis spectra of dibucaine trapped in the core of the triblock PEG108PCL50PLA46 (right).

26 • inquiro | no. 6 | 2012
0 1 2 3 40
102030405060708090
100
37 deg C 57 deg C
Dib
ucai
ne R
elea
sed
(%)
Time (h)
Changed Dialysate
0 1 2 3 4 5 60
10
20
30
40
50
60
70
80
90
100 37 deg C 57 deg C
Dib
ucai
ne R
elea
sed
(%)
Time (h)
Changed Dialysate
Figure 4. Isothermal dibucaine release at 37oC ( black squares) and 57oC (red circles) from encapsulation in the triblock PEG-
108PCL50PLA46 (top) and from the diblock PEG42PCL19 (bottom).
DiscussionTwo molecules, MAMA and dibucaine, were studied as drug surrogates. In addition, two different polymers, PEG108PCL50PLA46 and PEG42PCL19 were investigated as potential drug carriers. Loading efficiencies were higher at elevated temperature. When the surrogate drug was loaded into the micelle at 90oC, the semi-crystalline core of the micelles was allowed to melt, maximizing the amount of surrogate drug encapsulated in the micelle after the core crystallized. Though there was an increase in the amount of MAMA encapsulated in the micelle at higher temperature, the loading efficiency was still well below 1%. This could be due to the rigidity of the highly aromatic MAMA (Figure 2), which makes the MAMA less soluble in the micelle core. Dibucaine, which had a much higher loading efficiency, seems to be more compatible with the micelle core.
While the PEG42PCL19 gave higher loading efficiency, it released much more of dibucaine upon heating at 37oC than the PEG108PCL50PLA46 (38 versus 25%). The PEG108PCL50PLA46 allowed 45% release at 57oC and only 25% release at lower temperature. A low percentage of release at body temperature is critical for any drug release system. We want the delivery system to travel through the blood stream without releasing any drug. We only want the drug to be released when it reaches the targeted cancer site, whereupon magnetic field heating would
melt the caprolactone core and release the drug at the cancer site.
Previous reports have involved the incorporation of dibucaine into polymer micelles. In one study, a triblock poly(ethylene oxide-b-sodium 2-(acrylamido)-2-methyl-1-propane sulfonate-b-styrene)2 was loaded with dibucaine; in another, a diblock of poly(ethylene oxide-b-methacrylate)3 was used. Dibucaine was bound to each micelle core through electrostatic attractions. Here, we have expounded upon this previous work by determining the loading percentage of dibucaine and conducting isothermal release experiments, neither of which was previously reported.
ConclusionsThese preliminary results indicate that dibucaine rather than MAMA will serve as a better model drug for testing both loading efficiency and drug release capabilities of our micelle systems. MAMA could not be loaded into either of the polymer micelles tested with greater than 0.22% efficiency. Loading the micelles at 90°C, above the melting point of the polycaprolactone core, resulted in higher loading percentages for both MAMA and dibucaine. By loading at high temperature, dibucaine can be loaded into PEG108PCL50PLA46 up to 5%. After two hours, the micelles appear to release a maximum amount of drug. Initial results indicate that the PEG108PCL50PLA46 was more efficient at preventing release of drug at 37oC. This is an important result because in the body, as much drug as possible should be delivered to the tumor before being released. An ideal drug delivery system would have no release at 37°C and fast, complete release at 57°C. This will be the objective of future research.
References1. A. L. Glover, S. M. Nikles, J.A. Nikles, C. S. Brazel, D. E.
Nikles, Langmuir 2012, 28, 10653-10660.
2. B.P. Bastakoti, S. Guragain, A. Yonedu, Y. Yokoyama, S.I. Yusa, N. Nakashima, Polym. Chem. 2012, 1, 347-353.
3. Y. Li, S.Ikeda, K. Nakashima, H. Nakashima, Colloid Polym. Sci. 2003, 281, 562-568.

the university of alabama at birmingham | inquiro • 27
short reportDetermining the Pharmacological Activity of in
Cystic Fibrosis Sputum Ex Vivo: A Potential New Treatment for Mucus StasisHannah Bowers, Yao Li, Li Ping Tang, Steven M Rowe
Gregory Fleming James Cystic Fibrosis Research Center, Department of Medicine, Division of Pulmonary, Allergy and Critical Care Medicine, University of Alabama at Birmingham
Abstract Small airway mucus obstruction is characteristic of cystic fibrosis (CF). CF patients have a defect in the cystic fibrosis transmembrane receptor (CFTR) which leads to increased viscosity and elasticity of mucus in the lungs. This study investigates the most effective dosage of mucolytic to lower mucus viscosity and elasticity. Lower viscosity and elasticity of small airway mucus in CF patients can better allow airway clearance through mucociliary clearance and coughing. An effective mucolytic breaks up mucus in the lungs and allows CF patients to better expectorate their mucus. Spontaneously expectorated sputum was collected from CF patients and incubated with a novel mucolytic or vehicle control for 2 hours. Viscosity and elasticity were then measured using a TA instruments rheometer (DHR-II). The most effective mucolytic dose was found to be 0.003 mg/mL. These preliminary findings are an important indicator of proper dosage amount, which can be used in future experiments and clinical trials.
IntroductionObstruction of small airways is characteristic in patients with cystic fibrosis and is associated with loss of lung function. CF causes mucus to become highly viscous and elastic mucus and accumulate in the small airways. Increased mucus in the lungs leads to infections, inflammation and ultimately end stage lung disease. Many of the problems with mucus in the lungs of cystic fibrosis patients result from a defect in the cystic fibrosis transmembrane receptor (CFTR), which hydrates the mucus. A mucolytic agent that lowers the viscosity and elasticity of CF small airway mucus would help reverse the pathogenesis of the disease.
Methods Spontaneously expectorated sputum was collected from cystic fibrosis patients. Samples were homogenized together ten times with a 5 mL syringe. The samples were aliquoted and the following concentrations of the mucolytic were added to each vial: 0.01 mg/mL, 0.003 mg/mL, 0.001 mg/mL, 0.0003 mg/mL, 0 mg/mL (Control). The aliquots were vortexed for 10 seconds each and then incubated at 37oC for 2 hrs. The samples were then vortexed for another ten seconds and run on the TA Instruments rheometer with either a 20 mm geometry plate or a 40 mm geometry plate based on the sample size.
Results
Mucolytic Dose Analysis
0.01 0.1 1 10 100 1000 100000.01
0.1
1
10
100Viscosity-Control (0 mg/mL MucolyticViscosity-0.01mg/mL MucolyticViscosity-0.003 mg/mL MucolyticViscosity-0.001 mg/mL MucolyticViscosity-0.0003 Mucolytic
Shear (1/s)
Visc
osity
(Pa.
s)
Figure 1. The effect of a novel mucolytic on sputum viscosity. Controlled stress rheometric measures of viscosity in freshly expectorated CF sputum (n=5) treated with varying doses of mucolytic ex vivo. A reduction in viscosity at low shear stress is thought to significantly improve the transportability of CF mucus.
Elasticity (ΔG')
0.01 0.1 1 10 1000.01
0.1
1
10
100
1000ΔG' Control (0 mg/mL Mucolytic
ΔG' 0.003 mg/mL Mucolytic ΔG' 0.01 mg/mL Mucolytic
ΔG' 0.001 mg/mL MucolyticΔG' 0.0003 mg/mL Mucolytic
Frequency (Hz)
Elas
ticity
(Pa)
Figure 2. The elasticity of cystic fibrosis patient sputum treated with varying concentrations of mucolytic. The novel mucolytic reduces sputum elasticity in dose-dependent fashion. Low fre-quency elasticity is the clinically relevant parameter since the structure of the sputum breaks around a frequency of 1 Hz.

28 • inquiro | no. 6 | 2012
short reportStatistical Analysis of Differential Gene Expression
in the Coat Patterns of the Striped MouseLacey Kennedy
Barsh Lab, HudsonAlpha Institute for Biotechnology, Huntsville, AL
Figure 3. Dose response of the novel mucolytic on sputum elasticity. The elasticity of sputum from CF patients (n=6) at a shear of 0.063 Hz is lowest at the 0.003 mg/mL concentration of the mucolytic. *P < 0.05.
ConclusionsWhen 0.003 mg/mL mucolytic is added to the sputum from CF patients, the viscosity and elasticity are significantly decreased compared to the control sample. A dose response was observed for these parameters, which will be used to select doses to be advanced in further studies.
Future Directions Further research in the Rowe laboratory will include varying molecular weights of the mucolytic along with varying incubation times to identify the maximum efficacy of this mucolytic as a potential treatment for CF patients. Additional experiments will examine the effect of mucolytic on mucus transportability. The promising results of decreased viscosity and elasticity from this study support the effectiveness of this mucolytic and provide a strong rationale for in vivo testing.
IntroductionThe striped mouse, Rhabdomys pumilio, is a small rodent native to South Africa. Its appearance is characterized by the presence of alternating black and white stripes, similar to a chipmunk. The mechanism by which this pattern forms is not known; however, differential gene expression between the striped regions has been hypothesized to play a role. To better understand the mechanisms by which these stripes are produced, the Barsh lab, in collaboration with Drs. Hopi Hoekstra, Marie Manceau, and Ricardo Mallorino, has initiated experiments to identify genes that are differentially expressed between each striped region. We hypothesized that independent black stripes (BlA and BlB) would exhibit similar patterns of gene expression, and that these patterns differ from those of the intervening (Wh) and central (DrW) stripes.
Statistical analysis of sequencing results of EcoP151 Digital Gene Expression (EDGE) was used to compare transcriptional product abundance of dermal tissue samples from the striped areas of adult specimens for specific genes. Incidences of genes with low false discovery rates were used to evaluate which type of analysis would be more statistically powerful with respect to detecting differentially expressed genes.
The first objective of the study was to determine whether paired or unpaired analysis is more statistically powerful for identifying genes that are differentially expressed in each striped region. Once this was determined, the second objective was to use the superior analysis to identify patterns of differential gene expres-sion between given striped regions.
Methods Creation of a genomic library using EcoP151 Digital Gene Expression (EDGE tagging)Dermal skin tissue samples were collected from the striped and dorsal midline areas of adult striped mice. Each sample represents tissue from a single stripe (BlA, BlB, Wh, or DrW) on a single mouse (Fig. 1). Total RNA was isolated from each sample, and mRNA was extracted using oligo-dT paramagnetic beads. These beads bear sequences of multiple thymine nucleotides that attract only mRNA by targeting the polyA sequences that are added to transcripts after processing. The EcoP151 Digital Gene Expression (EDGE) method was selected to analyze the mRNA concentrations because it has been shown to be less susceptible to amplification bias than other techniques, such as RNA sequencing, since every molecule is exactly the same

the university of alabama at birmingham | inquiro • 29
size (Hong, 2011). Using reverse transcriptase, the mRNA was converted to cDNA in order to better evaluate the transcriptional abundance of each gene in each sample. The cDNA was cleaved with NlaIII and EcoP151 restriction endonucleases to create DNA fragments (EDGE tags) of 27 base pairs in length. This facilitated the attachment of a short nucleotide sequence adaptor on each end. The tags were amplified using PCR and then sequenced. Matching the expressed EDGE tags with known genes using a gene count table The files produced from sequencing contained the nucleotide sequences of each EDGE tag from each sample. In order to determine the probable identity of genes expressed in each stripe, the EDGE tags for each sample were aligned with the genome of Mus musculus using a program called Bowtie. Only one mismatched base was allowed in the alignment. Each match between an EDGE tag and a known Mus musculus gene was identified by its gene symbol and compiled in a table. This gene count table included the symbols of the genes which we identified as being expressed in each sample and the number of times each gene was identified. The table did not include any genes with less than ten counts for any given sample. Analysis of the gene count table The PoissonSeq package in R was used to normalize the gene count data and detect genes that were differentially expressed between samples. Paired analysis considered the stripe color and the individual mouse from which the samples were collected. Unpaired analysis considered only the stripe color. Both paired analysis and unpaired analysis of the data were performed on several sample combinations (BlA vs. BlB, BlA vs. Wh, etc.) to determine which genes were differentially expressed between those particular samples. The results for each analysis were examined based on the false discovery rate (FDR) for each gene in each comparison. A false discovery rate (FDR), similar to a p-value, indicates the certainty with which conclusions can be drawn from a statistical analysis. The closer an FDR is to zero, the more likely that the results of the comparison being drawn are statistically significant. Genes with an FDR of less than 0.05 are considered to be differentially expressed.
Results Comparison of paired and unpaired analyses The false discovery rate for any given gene on the paired analysis graph is lower than that of the corresponding unpaired analysis graph (Fig. 2), yielding a larger number of genes that were differentially expressed. The results of the DrW vs. BIB comparison indicated the largest difference between the paired and unpaired analyses.
Comparison of False Discovery Rates for paired analyses Each set of comparisons was different with respect to the number of differentially expressed genes (Fig. 3). The
comparison displaying the fewest low-FDR is DrW vs. BlB. The comparison displaying the most low-FDR genes is BlA vs. BlB. The comparisons between the two black stripes, and between the intervening white stripes and either black stripe, yielded more than 30 differentially expressed genes in each case.
Discussion The conclusions drawn in this study may be limited by certain factors. As Mus musculus is not genetically identical to Rhabdomys pumilio, genes that are unique to the striped mouse cannot be detected in this technique without a high quality reference genome for this particular species. This study only takes into account adult mice and therefore is not capable of detecting any potential influence of differential gene expression on the formation of coat pattern in younger mice.
Paired analysis is more powerful than unpaired analysis with respect to measuring differential gene expression in the coat of the striped mouse. In each comparison, the paired analysis was more statistically powerful than the unpaired analysis because the FDR for any given gene using paired analysis was lower than the FDR using unpaired analysis (Fig. 2). A low false discovery rate indicates a higher degree of certainty of the given result (the number of differentially expressed genes). A low FDR for a given gene corresponds to a differential expression of that gene within the given comparison.
There are significant differences in gene expression between the two black stripes as well as between the black and white stripes. The number of differentially expressed genes is highest for the BlA vs. BlB, BlA vs. Wh, and BlB vs. Wh comparisons. It was expected that there would be numerous differentially expressed genes between any given black stripe and any given white stripe. However, it was unexpected that the two black stripes would be so different with respect to gene expression. The paired comparison between the two black stripes returned more differentially expressed genes than the comparisons of either independent black stripe with the white stripe (Fig. 3). This could imply that the physical location on the body may be more important than stripe color in determining what genes will be expressed. However, further studies are needed in order to directly associate a pattern gene expression in dermal tissue with a particular stripe color.
ConclusionPaired analysis was more statistically powerful than unpaired analysis because it returned more differentially expressed genes in each case. More differentially expressed genes were detected between the two black striped regions (BlA and BlB) than in any other comparison. While this supports the idea that location on the body of the mouse is more important than coat color in determining what genes will be differentially expressed, further studies are needed to confirm this.
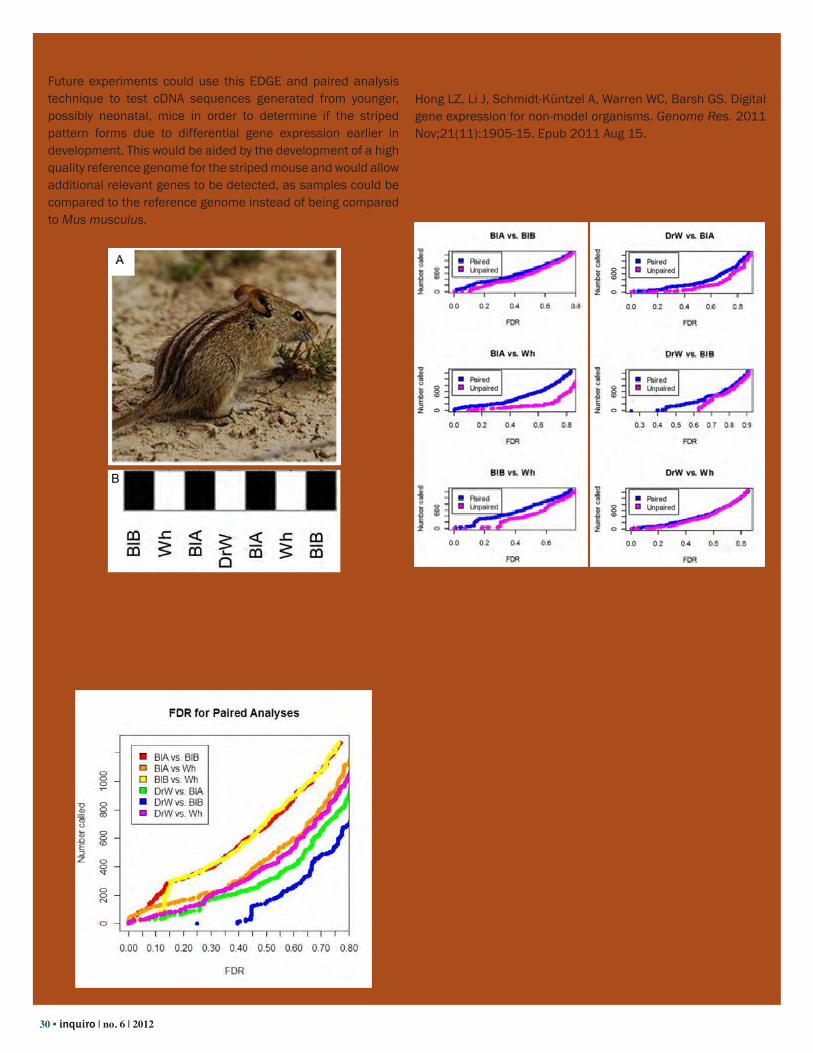
30 • inquiro | no. 6 | 2012
Future experiments could use this EDGE and paired analysis technique to test cDNA sequences generated from younger, possibly neonatal, mice in order to determine if the striped pattern forms due to differential gene expression earlier in development. This would be aided by the development of a high quality reference genome for the striped mouse and would allow additional relevant genes to be detected, as samples could be compared to the reference genome instead of being compared to Mus musculus.
ReferencesHong LZ, Li J, Schmidt-Küntzel A, Warren WC, Barsh GS. Digital gene expression for non-model organisms. Genome Res. 2011 Nov;21(11):1905-15. Epub 2011 Aug 15.
Figure 3. In the paired analyses, the number of genes with low FDRs varies with each comparison. The analysis of BlA vs. BlB yielded the most low-FDR (differentially expressed) genes.
B
Figure 1. A. The striped mouse, Rhabdomys pumilio. B. The striped pattern can be viewed from the mouse’s dorsal side. Naming convention designates the white dorsal midline as DrW, the dorsal-most black stripe as BlA, the white stripe that follows as Wh, and the ventral-most black stripe as BlB.
Figure 2. Unpaired analysis of the striped mouse gene counts resulted in fewer genes with low False Discovery Rates. This was consistent in every comparison. Each point represents one gene that was expressed in the sample The “Number called” axes refer to the number of times the gene was detected in each sample.

the university of alabama at birmingham | inquiro • 31
research paperDevelopment of Novel Thin Film Electrolyte Materials for Intermediate Temperature Solid Oxide Fuel Cells
Alex Skinner, Eric Remington, and Renato CamataDepartment of Physics, University of Alabama at Birmingham
AbstractSolid oxide fuel cells (SOFCs) are electrochemical devices that convert chemical energy into electricity using ion-conducting oxide ceramics as electrolytes. Two new electrolyte materials, (1) gadolinia-doped ceria coated with yttria-stabilized zirconia thin films (a three-layer electrolyte) and (2) thin films of gadolinium-doped barium zirconate (a proton conductor), have been developed which have the potential to lower SOFC operating temperatures. Pulsed laser deposition (KrF; 0.5-2 J/cm2) was used to deposit these materials as thin films on suitable substrates in a 20-200 mTorr oxygen environment. The crystalline structure of these films was confirmed to be cubic by X-ray diffraction and their thickness determined by transmission spectroscopy.
Keywords: Solid oxide fuel cells (SOFCs), Yttria-stabilized zirconia (YSZ), Gadolinia-doped ceria (CGO), Gadolinium-doped barium zirconate (BZG)
IntroductionWe are currently in the midst of a transition to sources of energy that are more efficient, more sustainable, and better for the environment than the sources currently used. Since the world’s energy demand is met primarily by fossil fuels, their depletion is becoming a concern. The current methods used to extract energy from fossil fuels, specifically combustion, are extremely inefficient and produce large amounts of greenhouse gases and other pollutants. After centuries of burning fossil fuels, the long-term negative effects on the environment have been realized. Thus, alternative energy sources are needed that will meet increasing demand without the disastrous effects of the most widely used sources today. Solid oxide fuel cells (SOFCs) are one possible solution to these challenges.
SOFCs are electrochemical conversion devices that produce electricity directly from the oxidation of a fuel, freeing them from the efficiency constraints that apply to combustion. The electrolytes used in SOFCs are ion-conducting oxides of two types: oxygen ion conducting oxides and proton conducting oxides. In the former, oxygen ions diffuse through the electrolyte from the cathode to the anode where they electrochemically oxidize the fuel. In the latter, oxidation of the fuel produces protons, which diffuse through the electrolyte from the anode to the cathode where they combine with oxygen from air to form water. The best electrolytes for use in SOFCs are those that have a high oxygen ion or proton conductivity. SOFCs present
a viable and attractive bridging technology in the global shift from energy production based on fossil fuels towards cleaner sources due to their greater efficiency and ability to utilize various fuels. SOFCs can usher in this transition by making more efficient use of fossil fuels widely available now and by utilizing more environmentally friendly sources such as hydrogen in the future. They can be used for energy production on several scales, ranging from large-scale on-site energy production such as the fuel cell stacks employed by Bloom Energy to smaller applications such as cars that run on natural gas. While fuel cells are more expensive now than other methods of extracting energy from fossil fuels (such as combustion), their superior efficiency makes them an attractive alternative and is the biggest motivator for continued research in the field.
Unfortunately, currently available ceramic electrolytes require very high temperatures (800-1000°C) in order to conduct ions. These temperatures present challenges in the design of fuel cells, especially regarding the materials used to hold and integrate the fuel cells in high power stacks [1]. Materials that can withstand these high temperatures tend to be costly. High temperatures also necessitate a start-up time before the fuel cell becomes fully operational and able to produce a current that can be used to perform work. Current research efforts are focused on reducing the operating temperatures of SOFCs by creating ceramics that have high ion conductivity in the intermediate temperature range (500-750°C) [2]. This could potentially lower operating costs of SOFCs, thereby encouraging their use. Accordingly, we pursued in this project the fabrication of two new electrolyte materials that have the potential to allow SOFCs to operate at reduced temperatures. First, we explored the synthesis of a novel three-layer electrolyte comprising gadolinia-doped ceria (CGO) coated on both sides with yttria-stabilized zirconia (YSZ) thin films. Second, we began development of the proton conductor gadolinium-doped barium zirconate (BZG) in the form of thin films.
Gadolinia-doped ceria (CGO) has been shown to exhibit high oxygen ion conductivity at relatively low temperatures [3,4]. However, in the temperature range of 500-750°C, CGO also conducts electrons [5]. This effectively shorts out the fuel cell and is the major reason why CGO has not been widely adopted over the current standard, yttria-stabilized zirconia (YSZ). In this project, we attempted to solve this problem by applying a very thin layer of YSZ to both sides of the CGO electrolyte and creating a triple layer YSZ/CGO/YSZ electrolyte that does not exhibit

32 • inquiro | no. 6 | 2012
electron conductivity. Unfortunately, this will also decrease the oxygen ion conductivity of the material. Nevertheless, our goal was to determine an optimal thickness that will prevent the flow of electrons through the ceramic and at the same time allow reasonable ionic conduction in the intermediate temperature range.
In parallel with the development of the triple layer YSZ/CGO/YSZ electrolyte, we also investigated the fabrication of the promising proton conductor gadolinium-doped barium zirconate (BZG). Recently, numerical simulations of proton transport in this material have predicted proton conductivity higher than those of the most commonly used electrolyte materials [6]. In this project we attempted to fabricate this material in the form of thin films, of which there have been virtually no reports in the literature to date.
ExperimentalBoth fabrication efforts in this project involve the use of the technique called as pulsed laser deposition (PLD). This method of thin film fabrication passes a laser beam through a quartz window of a vacuum chamber to strike a rotating target. This creates a plasma plume, originating from the target and ejecting material from the target surface, which then strikes a rotating, heated substrate. The ions, neutral species, and particles adhere to the substrate and form a thin film. The deposition rate of the film can be increased by increasing the laser energy density. The pressure of the background gas, if one is used, also alters the deposition rate and permits reactive synthesis. Figure 1 shows a schematic of the PLD system used in this project.Figure 1. Schematic diagram of pulsed laser deposition (PLD)
system. The system allows for controlled variation of substrate temperature, pressure of any background gasses, and laser en-ergy density.
Pulsed Laser Deposition of Yttria-Stabilized Zirconia (YSZ) Thin FilmsThin-films of YSZ were deposited on both sides of CGO substrates using PLD. A KrF excimer laser (248 nm) and commercial 8 mol. % yttria-stabilized zirconia targets were employed. The thicknesses of the resulting films were controlled by varying the number of pulses during deposition and using laser energy densities in the 0.5-2 J/cm2 range. In order to achieve desired oxide stoichiometry, deposition was carried out in an oxygen
atmosphere at pressures of 20-200 mTorr. The temperature of the substrate was kept constant at 680°C. Film thicknesses were then measured using transmission spectroscopy and the crystalline structures determined using X-ray diffraction (XRD).
In order to determine the best parameters for YSZ deposition, films were first grown on double-sided silicon substrates. Substrate temperature, O2 partial pressure, laser energy density, and the number of laser pulses were varied in order to obtain accurate calibration of YSZ deposition rates, which were then used to grow YSZ films with precise thickness control on the CGO substrates.
Pulsed Laser Deposition of Gadolinium-doped Barium Zirconate (BZG) Thin FilmsBecause the commercial cost of BZG targets is prohibitively high, we generated our own BZG targets for PLD thin films. This was achieved by mixing BaZrO3 and Gd2O3 powders at various concentrations. The obtained targets were then placed in a hydraulic press, compressed at a pressure of 2800 psi, and subsequently annealed at 1600°C in air for 24 hours. The temperature in the furnace was initially 450°C and increased
A)
B)
Figure 2. (A) Unit cell of cubic zirconia. (B) (100) projection of the crystal structure of cubic zirconia, as it should be featured in the material stabilized using the addition of yttria (i.e., YSZ). Both generated using Powder Cell.

the university of alabama at birmingham | inquiro • 33
at a rate of 120°C per hour. It took 9.5 hours for the furnace to reach 1600°C. The furnace was then cooled at the same rate. Figure 8 shows the resulting sintered target 21.8 mm in diameter. The annealing temperature and time were reduced for future targets. These targets were then laser ablated using the same PLD system described previously, also in an O2 environment but with pressures ranging from 40 to 200 mTorr. Thin films were deposited first on silicon substrates and then on various other materials suitable for electrochemical and electrical characterization. Transmission spectroscopy was used to measure the film thicknesses and XRD to investigate their crystal structures.
Results and DiscussionWe used a GUI based program called Powder Cell to explore crystal structures and calculate powder diffraction patterns [7]. Figure 2 shows the atomic structure of cubic zirconia visualized using Powder Cell. Zirconia, which can also crystallize in monoclinic or tetragonal configurations, is stabilized by the addition of yttria. The cubic configuration is the desired crystal structure because it conducts oxygen ions more efficiently than alternative configurations. Powder Cell was also used to calculate the X-ray diffraction pattern for yttria-stabilized zirconia (YSZ), shown in Figure 3a. The crystal data used to create this X-ray diffraction pattern were obtained from the American Mineralogist Crystal Structure Database [8]. This calculated pattern will be used for comparison to the pattern measured using XRD.
Figure 3b shows the XRD pattern obtained on the film deposited on a silicon substrate by ablating our YSZ target at an energy density of ~1.87 J/cm2 and an O2
pressure of 200 mTorr. The silicon substrate was kept at a temperature of 680°C and 24,000 laser pulses were used. The main peaks observed in the XRD pattern of our film correspond to the (111), (200), (220), and (311) reflections of the cubic zirconia structure and agree with the predicted diffraction pattern from Powder Cell for a unit cell with 5.070 Å. This indicates successful deposition of a cubic YSZ film. From the interference fringes of the transmission spectroscopy data obtained on the same film shown in Figure 5, film thickness was found to be 1.59 ± 0.01 mm. This thickness information allowed us to determine the deposition rate of YSZ for the deposition parameters employed. This deposition rate was found to be 0.066 ± 0.004 nm/pulse. The presence of large particulates on the film as shown by several micrographs of the film suggests that using lower energy densities would enhance film quality.
This deposition process was repeated at energy densities of ~0.64 J/cm2 and ~0.76 J/cm2 with all other variables held constant. The resulting deposition rates were 0.021 ± 0.0004 nm/pulse and 0.040 ± 0.0004 nm/pulse, respectively. Figure 6 shows the deposition rate as a function of laser energy density. The line is not a fit and should not be interpreted as
Figure 3. (a) Calculated XRD pattern of cubic zirconia from PowderCell, which serves as a reference for any XRD measurements taken of the YSZ films produced. (b) XRD pattern obtained from a nominal YSZ film deposited with an energy density of 1.87 J/cm2, at a temperature of 680°C and an O2 background pressure of 200 mTorr. The large peak at 58° is due to the silicon substrate.
Figure 4. XRD pattern obtained from YSZ deposition of various thicknesses on CGO substrates at various O2 pressures. (a) 250 nm at 20 mTorr. (b) 120 nm at 200 mTorr. (c) 250 nm at 200 mTorr. (d) Thick film on Si.

34 • inquiro | no. 6 | 2012
interpolation or extrapolation of the data. It is only meant to show the general trend of the data. We were not able to determine with confidence the uncertainty associated with our deposition rates and energy density. However, typical pulsed laser deposition experiments using our geometry usually yield film thickness variations of the order of 10%. Fluctuations in energy density in our experiment are also usually of the order of 10%. The error bars in the data shown in Fig. 6 reflect these uncertainties in our data. Micrographs of these films showed improved film quality with fewer particulates. Knowledge of the effect of energy density on the resulting film thickness allows for straightforward determination of which parameters to use for a particular YSZ thickness when YSZ is to be deposited on the CGO substrates. YSZ films were deposited at 20 to 200 mTorr O2 on both sides of a CGO substrate heated to 800°C with an approximate laser energy density of 0.5 J/cm2 and an appropriate number of laser pulses to give 290, 250, and 80 nm films. The resulting X-ray diffraction pattern shown in Figure 4 confirms that the cubic form of YSZ was indeed deposited.
The ionic conductivity of the CGO/YSZ samples was tested by our collaborators in Brazil using electrochemical spectroscopy (EIS). Figure 7 shows the resulting conductivity data, which is an order of magnitude lower than that of YSZ. Both the temperature control and the current measurement of the EIS system have precision better than 0.1%, resulting in error bars smaller than the points used to represent the data.
Targets of BZG were used to deposit films first on silicon to repeat the procedure for determining the deposition rate. XRD was again used to characterize the crystal structure of the deposited BZG. Figure 9 shows XRD data from three BZG samples of various dopant (Gd2O3) concentration. Two of the films were amorphous, as indicated by the broad peak, while the 15% film contained both crystalline and amorphous phases. Electrochemical impedance spectroscopy was carried out on
samples deposited using the same parameters on platinum substrates. Due to the mismatch between the coefficients of thermal expansion for the substrates and the BZG, the films were cracked. This resulted in a much lower measured value for ionic conductivity than was expected. To reduce the amount of thermal stress in the films, a substrate with a similar thermal expansion coefficient is needed. Niobium is a suitable candidate as it is used for ionic conductivity testing and its thermal expansion coefficient is almost identical to that of barium zirconate. Depositions on niobium substrates will be performed in future work.
ConclusionsThe goal of this research was to generate a more thorough understanding of the deposition process of YSZ. This understanding allowed for the deposition of very thin films of YSZ on CGO substrates in order to block electron conduction in this important electroceramic. We have shown that PLD is suitable for the deposition of cubic YSZ in thicknesses around 1 micron. We have also shown that energy densities around 1.87 J/cm2 are apparently too high as they lead to a large amount of particulate material on the films.
The ionic conductivity of our YSZ/CGO electrolyte was found to be lower than industry standard bulk YSZ. We believe that this is most likely the result of the loss of available ions for conduction due to their being trapped in the interface between YSZ and CGO or other defective areas in the YSZ itself. Further optimization of the deposition and the parameters used should correct this.
PLD targets of BaZrO3 and Gd2O3 powders were processed as described previously to create 10%, 15%, and 20% Gd2O3 targets. Films were then deposited on various substrates at 50 mTorr, 100 mTorr, and 200 mTorr and XRD was used to determine crystal structure. An XRD analysis
Figure 5. Transmission spectroscopy data of one YSZ film. The interference fringes lead to an estimated film thickness of ap-proximately 1.59 microns.
Figure 6. The deposition rate of YSZ at various laser energy densities for an O2 pressure of 200 mTorr. The line is not a fit and only shows the general trend of the data.

the university of alabama at birmingham | inquiro • 35
showed that cubic BZG was indeed deposited. However, the thermal stress present in the samples resulted in cracking in the films, which negatively affected the ionic conductivity as measured using electrochemical impedance spectroscopy. To attempt to overcome this, niobium will be tested as a substrate in future experiments.
In this research we have explored the fabrication of both gadolinium-doped ceria coated with yttria-stabilized zirconia thin films and thin films of gadolinium-doped barium zirconate using pulsed laser deposition. The results presented indicate that PLD is a suitable method for the fabrication of both of these materials. We anticipate that solid oxide fuel cells based on BZG and multilayer YSZ/CGO/YSZ structures will improve the range of applicability for efficient, clean, and economically viable fuel cell energy conversion.
AcknowledgmentsThe authors would like to thank Dr. Gopi Samudrala for his help in gathering the X-ray diffraction data and Mr. Ketan Goyal for his help in the Powder Cell simulations. We are also indebted to Dr. Gregg Janowski for his assistance with the annealing of the BZG pellet, and to Dr. Daniel de Florio and Mr. Murilo Nicolau for suggestions about annealing parameters and for the CGO substrates used in this work. We would also like to thank the anonymous reviewer of this paper whose comments
were extremely helpful. The authors acknowledge support from the National Aeronautics and Space Administration (NASA)-Alabama Space Grant Consortium - Research Experiences for Undergraduates (REU) award to UAB, which made this research possible.
References1. Steele BCH, “Material science and engineering: The
enabling technology for the commercialization of fuel cell systems.” Journal of Materials Science, vol. 36, p. 1053, 2001.
2. Fabbri E, Pergolesi D, Traversa E. “Materials challenges toward proton-conducting oxide fuel cells: a critical review.” Chemical Society Reviews 39 (2010): 4355
3. Steele BCH, Heinzel A, “Materials for fuel-cell technologies.” Nature, vol. 414, p. 345, 2001.
4. Huang H, Gür T, Saito Y, Prinz, F, “High ionic conductivity in ultrathin nonocrystalline gadollina-doped ceria.” Applied Physics Letters, vol. 89, p. 143107, 2006.
5. Kharton VV, Figueiredo FM, Navarro L, Naumovich EN, “Ceria-based materials for solid oxide fuel cells.” Journal of Materials Science, vol. 36, p. 1105, 2001.
6. Stokes SJ, Islam MS, “Defect chemistry and proton-dopant association in BaZrO3 and BaPrO3.” Journal of Materials Chemistry, vol. 20, p. 6258, 2010.
7. Powder Cell, Made available by the Collaborative Computational Project No. 14, www.ccp14.ac.uk/tutorial/powdcell/.
8. Available online at www.rruff.geo.arizona.edu/AMS/amcsd.php.
Figure 7. Resulting ionic conductivity of YSZ/CGO/YSZ struc-ture as a function of reciprocal temperature.
Figure 8. Target produced by mixing BZO3 and Gd2O3 pow-ders, pressing, and subsequent annealing at 1600°C for 24 h.
Figure 9. XRD data for three BZG films with (a) 15% , (b) 10%, and (c) 5% Gd2O3 concentration and one target for reference (d). The 15% film shows a cubic crystal structure as desired.

36 • inquiro | no. 6 | 2012
research paperDesign of a Torsion Tester for Study of the Effects of Diabetes
and Obesity on Murine Bone Properties
Brandon Sherrod1, Shawn Gilbert2, Krista Casazza3, and Alan Eberhardt1
1 Department of Biomedical Engineering, 2 Department of Orthopaedic Surgery, 3 Department of Nutrition Sciences, University of Alabama at Birmingham
Abstract
Characterization of bone mechanical integrity is critical when assessing effects of orthopedic surgical procedures and conditions such as diabetes and obesity. Since long bones experience torsional loading in vivo, mechanical characterization of torsional loading in vitro is a critical step in assessing the integrity of bone. Prior to this project, UAB’s testing facilities did not possess the capability to perform torsional testing on bone. The goal of this research effort was to design a cost-effective mechanism for translating the linear motion of the available testing equipment into rotational motion for torsional loading of murine (mouse) bone until failure. After successful development of the apparatus for testing, 9 (n=9) femurs from 3 age groups of non-obese diabetic-resistant (NOR) female mice were torqued at a rate of one degree per second until failure was observed in the diaphyseal region of the femora. Maximum torque, maximum shear stress, and torsional rigidity were calculated from test results. Micro-computed tomography (µCT) and bright field microscopy imaging were performed on the bone specimens. Age, femoral length, and bone density were all positively and significantly (p < 0.05) correlated with torsional strength. Values for maximum torque at 73 days of age were similar to values determined in previous studies on torsional loading of murine bone. Future studies will further investigate the relationships between previously mentioned conditions and bone mechanical integrity.
IntroductionFactors affecting bone strength include age, bone geometry (e.g. length, cross-sectional area, area moment of inertia, and thickness), species of origin, density, bone volume fraction, and cumulative effects (fatigue effects) of loads sustained over a lifetime [1,2]. Diseases and certain surgical procedures can also affect the strength of bone. Obesity and diabetes have both been associated with alterations in bone structure and strength. Diabetes has been associated with deterioration of bone integrity [3], and obesity with adverse alterations in bone metabolism [4] and mechanical integrity [5]. Studies have shown that diabetic rodent models exhibit lower levels of new bone formation during fracture healing [6], lower bone mineral density (BMD) [7], and increased risk of fracture [3]. There are differences, however, in the integrity of bone samples from type I and type II diabetics. These differences are most likely due to obesity [7].
Findings from research on obesity’s effects on bone integrity have been controversial. Although there is an increase in bone mineral density (BMD) with increasing body mass index (BMI) and a decrease in fracture incidence in the central body regions of obese women compared to those of healthy weight women due to soft tissue padding, there is an increase in fracture incidence in the extremities [8]. Other studies have shown that while cortical bone strength may not be adversely affected by high-fat diets, cancellous BMD and mechanical strength were significantly lower in mice with high-fat diets than in mice with low-fat diets [9]. In addition, extreme obesity has been associated with lower BMD despite the general trend of increased BMD with higher BMI [10]. Researchers at UAB are particularly interested in assessing the mechanical integrity of bone specimens of mice with diabetes and high-fat diets to determine if obesity or diabetes is associated with decreased or increased mechanical integrity of murine long bones.
Orthopedic surgeons are also interested in assessing the strength of murine long bones following use of methods that increase the rate of post-operation healing for a limb lengthening procedure known as distraction osteogenesis (DO). The DO procedure utilizes fracture healing of bone, a physiologically unique process that produces a regenerative callous at the fracture site. This callous will grow to fill the gap created by the fracture. Normal physiological fractures can be caused by loads exceeding the strength of bone, pathological weakening of bone, or fatigue fractures [1]. In the case of DO and limb lengthening, the fracture is created intentionally during surgery by removal of a portion of the diaphyseal region of the long bone by corticotomy. UAB researchers are interested in alterations of hypoxia-inducing pathways that have been found to accelerate the post-surgery healing process in animal models [11]. However, mechanical validation of the integrity of treated bone specimens has not been performed.
Spiral fractures are the result of torsional loading about the longitudinal axis of the whole bone. For example, a tibial fracture can often be explained by a force couple that results from the shear and frictional forces between the foot and the ground [12]. Fatigue fractures, or stress fractures, that result from torsional loading can be more easily induced than stress fractures caused by compressive or tensile loading [12,13]. The shear stress experienced by the bone in torsion is distributed over the entire bone structure (in the parallel and perpendicular

the university of alabama at birmingham | inquiro • 37
planes to the neutral axis), whereas the maximum tensile and compressive stresses occur in the plane diagonal to the neutral axis [14]. Because torsion results in shear, compressive, and tensile forces, it is an ideal in vitro loading test to assess the mechanical integrity of a long bone specimen. Because torsional loading is applied to the ends of whole bones, this loading pattern is applied away from defects and the site of fracture healing for fractures in the diaphysis. Torsional loading is therefore an important experimental loading mode in studies on fracture healing and DO, which is performed in the diaphysis of long bones rather than the ends.
The applied torque experienced in torsional loading can be characterized mathematically using the following equation:
T=Fd
where T is applied torque, F is applied axial force, and d is length of the moment arm. In this experiment, F is the negative force that the load cell measures as the pinion gear resists the twisting motion, and d is the distance from the rack gear to the center of the bone specimen, which is the pitch radius of the pinion gear. If T can be calculated as described above, then the maximum shear stress, which will occur at the outer edge of the bone specimen, can be calculated using the following equation:
τ=Tr / J
where τ is shear stress, T is applied torque, r is the radius of the bone specimen, and J is polar moment of inertia (analogous to area moment of inertia). The polar moment of inertia and specimen radius are found using micro-computed tomography (µCT) scans (see methods section). The torsional stiffness of the specimen is calculated based on the slope of the torque versus angular displacement curve (T vs. θ curve):
K= ∆T / ∆θ
where K is torsional stiffness, T is applied torque, and θ is angular displacement. Many of the calculations for torque and torsional shear stress result in a high error rate [15]; however, this error can be mitigated by using μCT scans rather than manual measurements to obtain geometrical parameters.
Prior to this project, UAB’s testing facilities did not possess the capability to perform torsional testing on bone. The goal of this research effort was to design a cost-effective mechanism for translating the linear motion of the available testing equipment into rotational motion for torsional loading of murine bone until failure. A torsional testing system was designed that is capable of applying a range of torques from 0 to 265 N•mm to a rodent long bone specimen. Nine (n=9) murine femur specimens from non-obese diabetic resistant (NOR) mice of different ages were tested in torsional loading after µCT scans were performed to assess geometrical properties and bone densities of the femora. It was hypothesized that, if the device design was
effective, there would be a significant and positive correlation between torsional strength and femoral length, geometry (i.e. radius and polar moment of inertia), age, and density. The results should also be relatively similar to results from previous studies on mechanical testing on murine long bones in torsion.
Materials and MethodsDevice Design Three goals guided the design of the torsion testing apparatus: translate the linear motion of the available lab equipment into rotational motion, use a cost-effective design, and keep the construction simple and accessible.
A rack and pinion gear system (Figure 1A) was initially modeled in PTC Creo® 3D software to attain a basic grasp of the feasibility of such a system. Due to design constraints such as cost, space, machining equipment limitations, and specimen size, the simplified rack and pinion system was determined to be feasible. A more detailed computer-aided design (CAD) model of the rack and pinion system with additional components was constructed (Figure 1B and 1C) as a more accurate representation of the testing system scale. The components of the assembly were ordered from various manufacturers (see Appendix A2) in a manner that would minimize cost. Machining was performed as necessary on the lathe, drill press, mill, and bandsaw. The aluminum gearshaft was turned on the lathe to decrease the diameter of the gear attachment end to 0.125 inches. The outer and inner aluminum tubings were cut with the bandsaw to a length of one inch each. A free body diagram was constructed (Figure 2) to visualize the force vectors and resultant torque on the bone specimen upon axial loading by the rack gear.
Figure 1. Apparatus design and components. (A) Initial rack and pinion gear concept. (B) Exploded view of components. (C) Final CAD assembly. (D) Final assembly on testing platform.
(B) (A)
Bone Sample
Torque
Axial Displacement
(C) (D) Figure 1. Apparatus Design and Components. (A) displays the initial rack and pinion gear concept. (B) displays the exploded view of the components. (C) displays the final CAD Assembly. (D) displays the final assembly on the testing platform

38 • inquiro | no. 6 | 2012
Figure 2. Free Body Diagram of the rack gear, pinion gear, and load cell Figure 2. Free body diagram of the rack gear, pinion gear, and load cell.
Experimental ProcedureMurine femur samples were obtained from the lab of Dr. Krista Casazza in the UAB Webb Nutritional Sciences Building. Samples were frozen in phosphate buffered saline (PBS) solution during storage. Micro-computed tomography (µCT) scans were performed on each femur specimen with a Scanco Medical (Brüttisellen, Switzerland) μCT 40 scanner. Each specimen was scanned to obtain 25 slices (equivalent to a 0.3 mm thick section) of the mid diaphysis. Values obtained from the µCT scans included specimen length, bone density, polar moment of inertia, bone volume, and outer radius.
Prior to torsional testing, the bone specimens were trimmed of excess connective tissue and allowed to thaw in PBS solution for 15 minutes by wrapping the specimen in a saline-saturated towelette. Poly-methyl methacrylate (PMMA) bone cement was prepared using 2 parts PMMA powder and 1 part monomer liquid. The proximal end of the femur was potted in the center of the inner rotating tubing using PMMA bone cement, and the distal end was potted in the center of the stationary block housing using PMMA cement. Once the cement had sufficiently hardened, the entire device (Figure 1D) was set on the Bose Electroforce® LM1 Testing System (Eden Prairie, Minnesota) platform. The rack gear was connected to the load cell using an adapter attachment. The load cell has a maximum loading
capacity of five pounds, or approximately 265 N•mm of torque with an 11.906 mm moment arm. The femur specimens were loaded in axial torsion until failure at a rate of one degree per second [16,17], requiring the linear displacement rate of the rack gear to be 0.2072 millimeters per second (see Appendix A1). Spiral fracture was observed in the diaphyseal region of the mouse femora (Figure 4A). Torque was calculated by multiplying the applied force on the pinion gear by the pitch radius of the gear, which is 11.906 mm. Data were collected at a rate of 136 Hz. Post-testing imaging was performed on a Nikon SMZ 3000 Microscope optics system using SPOT image acquisition software and equipment to obtain Figure 4C-E.
Statistical AnalysisThree hypotheses were formulated to validate the efficacy of the design: femoral length will affect the maximum torque required to induce failure; age of the mouse will affect the maximum torque required to induce failure; and bone density will affect the maximum torque required to induce failure. Statistical analyses were conducted using one-way ANOVA tests and linear regression. Significance was set at 95% confidence (p < 0.05). A total of nine (n=9) femurs were tested in torsion. Each age group of femurs (46 days, 62 days, 73 days) had 3 specimens (n=3) per group.
Results
Data from the torsional testing until failure and μCT imaging analysis of femurs from NOR (non-obese diabetic resistant) mice are displayed in Table 1. Bone density, polar moment of inertia, and outer radius were found by taking the mean values from 25 CT slices taken at the middle of the diaphysis. A 25-slice section is 0.3 mm thick. HA refers to hydroxyapatite. Table 2 displays mean values for maximum torque at failure, maximum shear stress, and torsional stiffness for each age group of NOR mice. Figure 3 displays linear regression plots of maximum torque versus femoral length (Figure 3A) and of maximum torque versus bone density (Figure 3B). Figure 4 displays post-testing images of spiral fracture observed in the femur specimens along with a CT scan construction of the middle portion of the diaphysis.
Table 1. Age, Femoral Length, Bone Density, Polar MOI, and Outer Radius Measurements for NOR mice (means ± standard deviation)
Age (days)
nSpecimen
Length (mm)Bone Density (mg HA/cm3)
Polar Moment of Inertia (mm4)
Outer Radius (mm)
46 3 11.26 ± 1.14 1262.252 ± 24.336 0.149 ± 0.016 0.639 ± 0.01262 3 14.08 ± 0.53 1338.155 ± 6.485 0.208 ± 0.021 0.682 ± 0.03573 3 14.29 ± 0.35 1376.493 ± 22.310 0.216 ± 0.010 0.690 ± 0.011

the university of alabama at birmingham | inquiro • 39
Table 2. Results from Torsional Loading Until Failure Tests (means ± standard deviation)
Age (days) nMaximum Torque at Failure
(N•mm)Max Shear Stress
(MPa)Torsional Stiffness (N•mm/degree)
46 3 10.42 ± 0.47 44.93± 4.39 0.419 ± 0.03462 3 15.66 ± 1.76 51.31 ± 4.66 0.749 ± 0.13973 3 17.26 ± 1.37 55.31 ± 5.11 0.903 ± 0.281
A BFigure 3. Linear regression plots of Max Torque vs. Specimen Length (A) and Max Torque vs. Bone Density (B)
Figure 4. (A) Apparatus containing a potted femur specimen post-fracture. (B) A μCT scan image of the 25 compiled slices from the mid-diaphysis. (C,D) Axial images of cross-sectional view of fracture. (E) Lateral view of spiral fracture.
A B
C D E
100 µm

40 • inquiro | no. 6 | 2012
Results for hypothesis testing by statistical analysis are discussed below. Hypotheses are stated and numbered with respective results. Tests were performed using one-way ANOVA via linear regression analysis.
1) Hypothesis 1: Femoral length affects maximum torque required to induce failure. The dependent variable was torque, and the independent variable was the femoral length.Results: p-value for probability of null hypothesis was found to be 0.0021 (p < 0.05). The F-test statistic was found to be 26.682. Linear regression analysis shows a positive correlation between femoral length and maximum torque with a correlation coefficient of 0.8895 and an R2 value of 0.7913.
2) Hypothesis 2: Specimen age affects maximum torque required to induce specimen failure. Results: p-value for probability of null hypothesis was found to be 0.0017 (p < 0.05). The F-test statistic was found to be 22.19. Additionally, the average maximum torque increased 65.6% from 46 day old specimens to 73 day old specimens.
3) Hypothesis 3: Bone density affects maximum torque required to induce specimen failure. Results: p-value for probability of the null hypothesis was found to be 0.0079 (p < 0.05). The F-test statistic was found to be 15.231. Linear regression analysis showed a positive correlation between bone density and maximum torque with a correlation coefficient of 0.8529 and an R2 value of 0.7835.
DiscussionThe results indicate that the factors of age, femoral length, and bone density are all significantly and positively correlated with the maximum torque applied to the femur specimens from NOR mice. The results for maximum torque, maximum shear stress, and torsional rigidity are similar to results found by previous researchers working with mouse femurs [14,15,20], indicating that the device design was effective. As mentioned by Brodt et
al (1999), femoral length has been found to stop increasing at 20 weeks (140 days) of age, which means that values reported at approximately 70 days are recorded while the mouse femora are still growing. Table 3 summarizes results from several studies, including this study, for comparative purposes.
Possible sources of error in the experiment include bone specimen potting misalignment, chatter at the pinion gear and rack gear interface, unidentified bone specimen irregularities, alteration of bone mechanics due to exothermic properties of the PMMA cement, and the assumption of isotropy and homogeneity in some of the calculations performed. The most important factor that could contribute to error is the potting location of the bone. Torque calculations were performed under the assumption that the center of the proximal end of the femur was potted at a distance away from the rack gear interface that equaled the pitch radius of the pinion gear. It is highly unlikely that the bone specimens were potted exactly 11.902 millimeters from the interface; however, great care was taken to ensure that the specimens were potted as closely to the center of the potting tube as possible.
ConclusionThe torsional testing apparatus for murine long bones was found to be effective and accurate in measuring the mechanical properties of femora specimens from NOR mice. Results matched expected outcomes and values reported in previous studies. Future work will investigate differences between groups such as obese and non-obese mice, diabetic and non-diabetic mice, and standard DO-treated femora and hypoxic DO-treated femora.
Table 3. Comparison of Results between Studies on Torsional Loading of Mouse Femurs.
Study Mouse TypeSpecimen Age
(days)Specimen
Length (mm)Max Torque
(N•mm)Rotation Rate
(degree/s)This Study (2012) Female NOR 73 14.29 ± 0.35 17.26 ± 1.37 1.0
Silva & Ulrich (2000)Female
C57BL/670 N/A 23.2 ± 4.2 1.0
Saunders et al (2010) N/A 84 N/A 25.45 ± 4.0 1.1
Brodt et al (1999)Female C57Bl/6
63 14.14 ± 0.31 21.0 ± 1.6 1.0

the university of alabama at birmingham | inquiro • 41
AcknowledgmentsI would like to thank my research mentor, Dr. Alan Eberhardt, for his continued support of this research effort. He has provided invaluable feedback for the improvement of this project. Dr. Tim Nagy and Dr. Xingching Li in the Small Animal Bone Phenotyping Core at UAB generously allowed us to scan our specimens with the CT scanner in their lab. Joe Schwertz, a PhD student in the BME department, contributed significantly to the development of this project.
References1. Doblaré, M., Garcia, J.M., and Gomez, M.J. (2004).
Modeling bone tissue fracture and healing: a review. Engineering Fracture Mechanics, 71: 1809-1840.
2. Boskey, A. L., Wright, T. M. and van der Meulen, M. C. H. (2003), Guidelines for describing mouse skeletal phenotype. Journal of Orthopaedic Research, 21: 1–5.
3. Reddy GK, Stehno-Bittel L, Hamade S, Enwemeka CS. (2001). The biomechanical integrity of bone in experimental diabetes. Diabetes Research and Clinical Practice, 54: 1–8.
4. Cao, JJ. (2011). Effects of obesity on bone metabolism. Journal of Orthopedic Surgery and Research, 6: 30.
5. Janicka A, Wren TA, Sanchez MM, Dorey F, Kim PS, Mittelman SD, Gilsanz V. (2007). Fat mass is not beneficial to bone in adolescents and young adults. The Journal of Clinical Endocrinology & Metabolism, 92:143–147.
6. Thrailkill, KM, Liu, L, Wahl, EC, Bunn, RC, Perrien, DS, Cockrell, GE, Skinner, RA, Hogue, WR, Carver, AA, Fowlkes, JL, Aronson, J, and Lumpkinm CK. (2005). Bone formation is impaired in a model of type 1 diabetes. Diabetes, 54: 2875-2881.
7. Schwartz, AV. (2003). Diabetes mellitus: does it affect bone? Calcified Tissue International, 73:515–519
8. Beck TJ, Petit MA, Wu G, LeBoff MS, Cauley JA, and Chen, Z. (2009). Does obesity really make the femur stronger? BMD, geometry, and fracture incidence in the women’s health initiative-observational study. Journal of Bone And Mineral Research, 24: 1369-1379.
9. Wohl GR, Loehrke L, Watkins BA, and Zernicke, RF. (1998). Effects of high-fat diet on mature bone mineral content, structure, and mechanical properties. Calcified Tissue International, 63: 74–79.
10. Núñez, N. P., Carpenter, C. L., Perkins, S. N., Berrigan, D., Jaque, S. V., Ingles, S. A., Bernstein, L., Forman, M. R., Barrett, J. C. and Hursting, S. D. (2007). Extreme obesity reduces bone mineral density: complementary evidence from mice and women. Obesity, 15: 1980–1987.
11. Wan, C., Shao, J., Gilbert, S.R., Riddle, R.C., Long, F., Johnson, R.S., Schipani, E., and Clemens, T.L. (2010). Role of HIF-1α in skeletal development. Annals of the New York Academy of Sciences, 1192: 322–326.
12. Vashishth, D., Tanner, K.E., and Bonfield, W. (2001). Fatigue of cortical bone under combined axial-torsional loading. Journal of Orthopaedic Research, 19: 414-420.
13. George, W.T. and Vashishth, D. (2005). Damage mechanisms and failure modes of cortical bone under components of physiological loading. Journal of Orthopaedic Research, 23: 1047-1053.
14. Nazarian, A., Entezari, V., Vartanians, V., Müller, R., and Snyder, B.D. (2009). An improved method to assess torsional properties of rodent long bones. Journal of Biomechanics, 42: 1720-1725.
15. Nazarian, A., Bauernschmitt, M., Eberle, C., Meier, D., Müller, R., and Snyder, B.D. (2008). Design and validation of a testing system to assess torsional cancellous bone failure in conjunction with time-lapsed micro-computed tomographic imaging. Journal of Biomechanics, 41: 3496–3501.
16. Silva, M.J., and Ulrich, S.R. (2000). In vitro sodium fluoride exposure decreases torsional and bending strength and increases ductility of mouse femora. Journal of Biomechanics, 33: 231-234.
17. Brodt, M.D., Ellis, C.B., and Silva, M.J. (1999). Growing C57B1/6 mice increase whole bone mechanical properties by increasing geometric and material properties. Journal of Bone and Mineral Research, 14: 2159-2166.
18. Saunders, M.M., Burger, R.B., Kalantari, B., Nichols, A.D., and Witman, C. (2010). Development of a cost-effective torsional unit for rodent long bone assessment. Medical Engineering & Physics, 32: 802-807.

42 • inquiro | no. 6 | 2012
AppendixA1 - Calculations
1) Linear displacement for achieving a rotation rate of one degree per second:
s=rθ
Where s is arc length, r is the gear pitch radius, and θ is the angle of twist. To find the rate of rotation:
θ ̇= s ̇/r
Where is the linear displacement rate of the rack gear and is the rate of rotation. To find the rate of linear displacement to match one degree of angular rotation per second, we will convert to radians per second:
(1 degree)/second x (π radians)/( 180 degrees) = (0.0174 radians)/second
Solving for yields the following equation:
s ̇=rθ ̇=(0.0174 radians/second)(11.906 mm)=0.2072 mm/second
2) Weight force of the rack gear and connector.
Determining the weight of the rack gear and the connector part is essential to calculating the forces acting on the load cell.
Fweight = (mrack + mconnector)(g)
Where Fweight is the weight force of the rack gear and connector part in Newtons, mrack is the mass of the rack gear, mconnector is the mass of the connector part, and g is the acceleration due to gravity, which is 9.81 m/s2.
The combined mass of the two parts was measured using a precision balance scale and was found to be 88.2 grams, or 0.0882 kilograms. The weight in Newtons can then be calculated:
Fweight = (0.0882 kg)(9.81 ) = 0.865 N
A2 – Manufacturer Part Specifications
# Part Name Manufacturer/Vendor Part Number Material Cost ($)
1 3” Rack Gear; 96 PitchStock Drive Products/Sterling
Instruments (SDP-SI)S1810Y-RC-7A 2024-Al 62.76
2 Pinion Gear; 96 Pitch; 90 TeethStock Drive Products/Sterling
Instruments (SDP-SI)S1063Z- 096A090 2024-Al 16.23
3 Block Housing; 0.375” IDStock Drive Products/Sterling
Instruments (SDP-SI)A 7Z28-P038 Sintered Al 4.86
4Miniature Ball Bearing
0.1875” Bore Dia.Spyraflow PB0-SR3ZZ
Mounts: Al; Ball Bearings:
Stainless Steel11.64
5 Outside Rotating Tube McMaster-Carr 89965K368 6061-Al 9.44
6 Inside Rotating Tube; 0.625” ID McMaster-Carr 8978K163 6061-Al 6.14
7 Gearshaft Smallparts.com (Amazon Supply) B003U6I39G 6061-Al 5.29
TOTAL 116.36

the university of alabama at birmingham | inquiro • 43
research paperEffect of Genistein After Spinal Cord Injury in Male Rodents
Roxanne Lockhart, Candace FloydDepartment of Physical Medicine and Rehabilitation, University of Alabama at Birmingham
AbstractThe post-injury administration of estrogen has been shown to provide protection and promote functional recovery in a rat model of spinal cord injury (SCI) but has potentially problematic feminizing effects. The administration of estrogen post-SCI reduced neuronal cell loss, reduced inflammation, reduced apoptosis, increased white matter sparing, and improved the functional recovery due to the activation of estrogen receptors α and β. Because of structural similarities to estrogen, genistein, a phytoestrogen derived from kudzu, activates the non-feminizing estrogen receptor β, which is present throughout the adult spinal cord. It is hypothesized that the post-SCI administration of genistein will reduce secondary injury and increase tissue sparing in male rats. To test this hypothesis, a SCI was generated in adult male Sprague-Dawley rats by contusion at the cervical vertebral level 5 (C5 level). Beginning at 30 minutes post-SCI and once daily for 14 days, genistein was injected at a dose of 5mg/kg to injured rodents. Skilled and unskilled locomotion and skilled and unskilled forepaw use for all spinal cord injured male rats were evaluated once pre-SCI and then once weekly for 4 weeks. Tissue samples were also evaluated to determine the amount of inflammation, apoptosis, lesion spread, and white matter sparing. The post-SCI administration of genistein caused an increase in the ipsilateral dominant paw use and tissue sparing, which suggests an increase in functional and physical recovery. Therefore, genistein may act as a protective and therapeutic treatment in male subjects post-SCI.
IntroductionIn all spinal cord injuries (SCI), a primary injury or initial lesion later results in a secondary injury or continuation of the lesion along the spinal cord over time. This secondary injury drastically decreases a person’s functionality and independence. Currently, no pharmacological treatment effectively prevents the inevitable secondary or sub-acute injury. This debilitating condition currently affects 280,000 to 300,000 people in the United States alone, with an estimated 12,000 new cases each year (National Spinal Cord Injury Statistical Center, 2008). After receiving a SCI, most people experience deficits in skilled and unskilled limb function and locomotion along with permanent tissue damage to the spinal cord. A recent study showed that female rats exhibit less tissue damage and improved function than male rats after suffering from a SCI (Farooque et al., 2006; Hauben et al., 2002). This result led to the hypothesis that estrogen reduces secondary injury and increases tissue sparing in humans after a SCI. However, estrogen treatment causes feminizing and other problematic hormonal effects on
male rats (Chaovich et al., 2006). Estrogen reduces neuronal cell loss, reduces inflammation, reduces apoptosis, increases white matter sparing, and improves the functional recovery after receiving a SCI through the activation of estrogen receptors α and β. Genistein activates the non-feminizing estrogen receptor β, which is present throughout the spinal cord. Administration of genistein may be considered a possible treatment in providing a protective and functional recovery in males with SCI.
HypothesisThe hypothesis of this experiment is that post-SCI treatment with genistein will improve functional recovery, reduce neuronal cell loss, reduce injury inflammation, reduce apoptosis, and increase white matter sparing. The null hypothesis is that administration of genistein will have no positive or preventive effect on the overall recovery post-SCI male rat.
Materials and MethodsFour behavioral tasks including unskilled and skilled forepaw and locomotion tasks were performed on 12 male Sprague-Dawley rats prior to receiving a cervical vertebral level 5 (C5) SCI. Three trials were administered for each behavior task for each animal. The dominant paw was assigned to each rat based on its individual results from the unskilled forepaw or paw preference behavioral task.
The rodents received a C5 hemicontusion SCI on the dominant side. Beginning at 30 minutes post-SCI and once daily for 14 days, genestein was injected at a dose of 5mg/kg body weight. Once weekly for 4 weeks, the animals were observed performing the 4 behavioral tasks including the skilled forepaw task (vermicelli handling task), skilled locomotor function task (horizontal ladder task), unskilled locomotor function task (catwalk gait and analysis task), and unskilled forepaw test task (paw preference task).
For the paw preference task, the rodents were placed in a clear Plexiglas cylinder for 5 minutes. Ipsilateral and contralateral paw placements were defined as when one of the corresponding paws supported the body against the wall of the cylinder without contact of the other paw or when the other paw contacted the wall more than 0.5 seconds after the initial paw contact. It was also noted if both paws contacted the wall within 0.5 seconds of the initial paw placement.
For the skilled forelimb function (vermicelli task), the rats were placed in individual cages and were given 3 pieces of 7 cm long

44 • inquiro | no. 6 | 2012
uncooked vermicelli. The animals were given a maximum of 10 minutes to consume the 3 pieces, and each trial was recorded with a Sony Handycam DCR-DRV280, which allowed for detailed analysis of the amount of paw adjustments per piece of pasta. The unskilled locomotor function task was performed using the CatWalk® gait analysis system. As each animal crossed a glass walkway in a dark room, light from a fluorescent bulb was internally reflected within the glass walkway and scattered when the surface of the paw contacted the glass floor. The resulting paw prints were recorded with a high-speed CCD camera. This task was performed by each animal three times. All animals were required to cross the walkways without stopping or changing directions.
For the skilled locomotor function, each rat was positioned so as it crossed the ladder, the ipsilateral side was recorded with a Casio Exilim EX-F1 camcorder to determine the dominant forepaw and hindpaw placements. The ladder was 129 cm long and 16.5 cm wide with removable rungs placed 2.5, 3.2, or 5.7 cm apart. Each week the 15 rungs were repositioned to prevent the animals from learning the spacing pattern. At least 3 runs in which the animal did not change direction or stop were recorded for each animal. The paw placements were later analyzed and labeled as: correct placement, touch, slip, or miss. A correct placement was defined as weight-supported paw placement on the rung and a subsequent removal from the rung. A touch was defined as initial contact and immediate paw removal without any weight support. A miss was defined as a paw movement below the level of the rung without any contact. A slip was defined as initial contact with a rung immediately followed by wrist or ankle movement below the rung level.
The 4 behavioral tasks determined the extent of functional recovery in each rodent. After 28 days of behavioral analysis, the 12 rats were euthanized and spinal cord tissue was harvested for histological analysis. Eighty sections were made from each rodent’s tissue sample using a cryostat and were randomly assigned for either cresyl violet staining or luxol fast blue staining to analyze gray or white matter sparing, respectively.
Data Collection and AnalysisFor the paw preference task, the average dominant paw use for 3 trials was calculated using the formula:
# 𝑜𝑓 𝑑𝑜𝑚𝑖𝑛𝑎𝑛𝑡 𝑝𝑎𝑤 𝑢𝑠𝑒𝑠# 𝑑𝑜𝑚𝑖𝑛𝑎𝑛𝑡 𝑝𝑎𝑤 𝑢𝑠𝑒 + # 𝑜𝑓 𝑛𝑜𝑛𝑑𝑜𝑚𝑖𝑛𝑎𝑛𝑡
𝑝𝑎𝑤 𝑢𝑠𝑒 + total 𝑝𝑎𝑤 𝑢𝑠𝑒
𝑎𝑣𝑒𝑟𝑎𝑔𝑒𝑑𝑜𝑚𝑖𝑛𝑎𝑛𝑡 𝑝𝑎𝑤 𝑢𝑠𝑒
=
An increase in the percentage of dominant paw use post-SCI signifies functional recovery. A simple t-test was used to compare the control and genistein treated groups.
A pre-SCI assessment was conducted to obtain the baseline average values for skilled forelimb function (vermicelli task) in each animal. Data was recorded as the number of dominant
paw adjustments per vermicelli piece averaged over the 3 trials. A paw adjustment was defined as any grasp and re-grasp motion or movement of the digits. The number of grasps were quantified and averaged for the control and genistein groups. After the catwalk gait task, the paw prints were then analyzed and labeled “right front paw,” “left front paw”, “right hind paw”, or “left hind paw” depending on the specific paw print using the CatWalk® analysis software (version 7.1.6) and the area of each dominant paw was also recorded. The average paw area was compared between the control and genistein group over the 4 weeks using a simple t-test. Post-SCI the forepaw had a clubbing effect, and a greater increase in paw print size , signifying an increase in functional recovery.
For the skilled locomotion task, the amount of rung usage and percent correct were analyzed using the following formulas.
% correct = ( x 100# of correct placements# of correct placements + # of misses)
An increase in percent correct signifies improvement in functional recovery.
After the cresyl violet stain, the number of surviving neuronal cell bodies in the ventral horn was calculated. The luxol fast blue stain, which stains the myelin basic protein, allowed for a comparison in the percentage of intact white matter. The amount of surviving cells and white matter in the spinal cord tissue were compared between the control and genistein treated groups.
Statistical AnalysisA t-test with 95% confidence level was used to compare the average functionality improvement overtime between the control and genistein groups in all behavioral tasks and tissue samples. The paw preference task was used to compare the average percentage of unskilled dominant paw use while touching the side of a Plexiglas cylinder. The vermicelli task (skilled forepaw use task) was used to compare the average number of dominant paw re-grasps while each rodent consumed three pieces of vermicelli. The catwalk task (unskilled locomotion) compared the average area of the dominant paw while crossing a glass catwalk. The horizontal ladder task (skilled locomotion) compared the average percentage of correct placements on each rung while traversing a ladder. The amount of intact white matter and of surviving neurons in gray matter were compared across groups.
ResultsFor both dominant paw forelimb tasks, the genistein treated group showed a statistically significant difference in functional
# 𝑜𝑓 𝑐𝑜𝑟𝑟𝑒𝑐𝑡 𝑝𝑙𝑎𝑐𝑒𝑚𝑒𝑛𝑡 𝑠 + # 𝑜𝑓 𝑡 𝑜𝑢𝑐ℎ𝑒𝑠 + # 𝑜𝑓 𝑠𝑙𝑖ps + # of misses
# of rungsx 100𝑟𝑢𝑛𝑔
𝑢𝑠𝑎𝑔𝑒 =

the university of alabama at birmingham | inquiro • 45
improvement. In the paw preference task, both groups showed an initial percentage of dominant paw use at 80%. Beginning at 2 weeks post-SCI, the genistein group showed a significant increase in dominant paw use from 0% to almost 20%. For the next 2 weeks, the genistein group continued to show improvement while the control group showed no improvement in dominant paw use (shown in Figure 1).
The skilled forelimb task showed that the genistein group had a statistically significant difference in the number of paw adjustments per piece of pasta compared to the control group. Pre-SCI assessment showed that each rodent made on average 12 paw adjustments per piece, and post-SCI this number decreased to 5 and 2 for the genistein and control group, respectively. For the remaining 2 weeks, the genistein treated group continued to show an increase in number of dominant paw adjustments (shown in Figure 2).
After comparing the dominant paw area between the groups, there was no statistically significant difference, but there was a trend toward improvement for the genistein treated group (shown in Figure 3). The t-test result for the horizontal ladder task and percentage of correct dominant paw placements showed no significant difference or trend between the genistein and control groups (shown in Figure 4).
After the comparison of gray matter and number of surviving neuronal cell bodies in the ventral horn (Figure 5), the genistein treated group showed a significant increase in surviving neurons (Figure 6). The genistein group also demonstrated statistically significant differences in percentage of white matter remaining post-SCI compared to the control group (Figure 7 and 8).
Figure 1. Quantification of Paw Preference Task. From Days 14 - 28 there was a significant difference in the percentage of ipsi-lateral paw use, suggesting that the administration of genistein improves unskilled forepaw use.
Figure 2. Quantification of Vermicelli Task. From Days 14 - 28 there was a significant difference in the percentage of ipsilat-eral paw use, suggesting that the administration of genistein improves skilled forepaw use.
Figure 3. Quantification of CatWalk® gait task. There is no significant difference between the post-SCI administration of genistein and the vehicle groups, but there is a trend toward improvement in the genestein group.
Figure 4. Quantification of Horizontal Ladder Task. There is no significant difference in the percentage of correct placements between the post-SCI administration of genistein and the ve-hicle. Therefore genistein did not improve skilled locomotor function.

46 • inquiro | no. 6 | 2012
Figure 5. Quantification of neurons in ventral horn. There was a statistically significant difference in the number of neurons present between the vehicle and genistein groups. Genistein treated groups demonstrated a larger neuronal cell survival post-SCI.
Figure 7. Percentage of white matter. There was a statistically significant difference in the amount of white matter remaining at the hemicontusion site between the vehicle and genistein groups. Genistein treated groups demonstrated a larger per-centage of white matter mass post-SCI.
Figure 6. Comparison of the ventral horn between the two groups. The arrow in (B) points to an intact neuron.
A. Vehicle
B. GenisteinFigure 8. Comparison of the amount of white matter between the two groups post-SCI.

the university of alabama at birmingham | inquiro • 47
DiscussionThe results were consistent with the original hypothesis that the post-SCI administration of genistein will increase functional recovery and tissue sparing in male rodents following a clinically-relevant cervical SCI. The group of male rats that were administered genistein show an increase in paralyzed ipsilateral dominant functionality, and the histological results confirmed a reduction of secondary injury through the improvement in gray and white matter sparing post-SCI. The four behavioral tasks illustrated the physical recovery, while the histological analysis illustrated less nervous tissue damage and more recovery. Therefore, this experiment indicated that genistein is an effective pharmacological treatment for rat spinal cord injuries.
ConclusionThe genistein treated groups showed a statistically significant difference in an increase in the dominant paw forelimb usage and a positive trend in unskilled locomotion. The experimental group also showed decreased apoptosis and prevented the secondary injury as shown by the gray and white matter sparing. Therefore, genistein improved functionality and provided protection to the spinal cord post-SCI.
Because the post-SCI administration of genistein has been shown to be effective in male rat models, it should be considered as a viable treatment for human males as well. The genistein administration timing in the rat model also has real world applications. The initial administration at 30 minutes post-injury is paralleled with an emergency medical technician reaching the scene of an accident and immediately administering genistein if he or she suspects a SCI. Also, the behavioral tasks were continually performed for two weeks after the genistein was no longer being administered as treatment. This allowed for the analysis of relatively long term effects of the genistein treatment. If genistein is able to reach human male trials, the dosage and administration times would require more testing to ensure the maximal functional recovery.
AcknowledgmentsI would like to give special thanks to Dr. Candace Floyd, Assistant Professor at the University of Alabama at Birmingham’s Center for Glial Biology in Medicine, Tracy Niedzeilko, Kelly Dunham, Nicole Day, and Malisa Girard for the opportunity to utilize their laboratory.
References1. Chaovipoch, P., Bozak Jelks, K., Gerhold, L., West, E.,
Chongthammakun, S., and Floyd, C. ( 2006). 17β-Estradiol Is Protective in Spinal Cord Injury in Post- and Pre-Menopausal Rats. Journal of Neurotrauma 23, 830-852.
2. Dunham,K., Siriphorn, A., Chompoopong, S., and Floyd, C. (2010). Characterization of a Graded Cervical Hemicontusion Spinal Cord Injury Model in Adult Male Rats. Journal of Neurotrauma 27, 2091-2106.
3. Farooque, M., Suo, Z., Arnold, P.M., et al. (2006). Gender-related differences in recovery of locomotor function after spinal cord injury in mice. Spinal Cord.
4. Kachadroka, S., Hall, A., Niedzielko, T., Chongthammakun, S., and Floyd, C. (2010). Effect of Endongenous Androgens on 17β- Estradiol-Mediated Protection after Spinal Cord Injury in Male Rats. Journal of Neurotrauma 27,611-626.
5. National Research Council. (1996). Guide for the Care and Use of Laboratory Animals. Washington, D.C.: National Academy Press. Spinal cord injury statistics. (2009, June). Retrieved from http://www.fscip.org/facts.htm
6. Zhang, Y., Chen, J., Zhang, C., Wu, W., Liang, X.,(2005). Analysis of the estrogenic components in kudzu root by bioassay and high performance liquid chromatography. The Journal of Steroid Biochemistry and Molecular Biology 94, 375-381.

48 • inquiro | no. 6 | 2012
research paperDevelopment of Dot Array Biosensor using Dip-Pen
Nanolithography of Polyacrylamide Ink
Aditi R. Naik1, Ethan J. White2, Dr. Aaron Catledge2*1 Cornell University, Department of Chemical Engineering, Cornell University
2 University of Alabama at Birmingham, Department of Physics, University of Alabama at Birmingham*Corresponding author
AbstractThe general goal of this project was to develop an acrylamide-based biosensor that may be used to capture and detect biomolecules, such as the cardiac protein troponin T. This paper demonstrates the ability to print nanodots of polyacrylamide hydrogel on a silicon dioxide substrate using dip-pen nanolithlography. Solutions of 3-30%T (w/v) acrylamide monomer were polymerized by adding 3%C (w/w) N,N’-methylene-bis-acrylamide. The addition of polyethylene glycol into the polymer solution resulted in greater stability of the nanodots. Optimal printing conditions were determined by considering the visible gelation time, initial and final viscosity, and porosity of polyacrylamide gel. Individual dots were examined using optical and atomic force microscopy. Fluorescent nanodiamond particles were incorporated into microdots of polyacrylamide on glass slides. It is anticipated that the captured protein will result in a variation in fluorescence, which can be measured to determine the concentration of protein detected. The presence of nanodiamond was confirmed by Raman spectroscopy and fluorescent microscopy.
IntroductionElevated levels of cardiac troponin T within the bloodstream is associated with heart failure. Detection of high levels of troponin T is currently considered the golden standard to diagnose patients who have experienced symptoms of a heart attack or other cardiac injury [1]. Currently, many available troponin test immunoassays use antibody-antigen bonding, which is constrained by poor stability, high cost, and lack of portability. The purpose of this research is to create a biosensor from the polymer polyacrylamide. Polyacrylamide gels are predominately used for gel electrophoresis, which is a common method for separating proteins, and are nontoxic, water-absorbent, and nonreactive toward proteins [3].
The biosensor would use a molecularly imprinted polymer (MIP) approach for protein capture. For this, the polymer is constructed to have specific recognition sites for a certain template molecule, which would be troponin T [4]. To improve access to the recognition sites on the MIP, the polymer will be printed as nanoscale dot array using dip-pen nanolithography (DPN). A cantilever with a DPN tip that is roughly 100 µm across is dipped into an “ink,” which can then be printed in any pattern on a substrate [5]. A biosensor printed in the form of a dot array using DPN will allow for a high surface area-to-volume ratio,
which will facilitate the binding of protein into the recognition sites. The concentration of protein captured will be measured using fluorescent nanodiamond (ND) particles incorporated uniformly within the polymer. The captured protein will lower the fluorescence of nanodiamond, which can be calculated to determine the amount of protein.
This paper focuses on the work involved in determining the optimal chemical ratios and conditions for printing polyacrylamide hydrogel dots on a silicon oxide substrate using DPN. The variables considered include chemical concentrations, gelation times, viscosity, and porosity of the final polymer created both with and without the addition of ND.
Materials & MethodsPolyacrylamide gels were synthesized by a radically initiated vinyl addition polymerization using the following reagents: acrylamide, N,N’-methylene-bis-acrylamide (bis), ammonium persulfate (APS), tetramethylethylenediamine (TEMED), polyethylene glycol 8000 (PEG), 2 wt% nanodiamond (ND) (aq); (0-0.2 μm and 0.35-0.5 μm), and Milipore water [3]. For initial experiments, polymer concentrations ranging from 3-30%T (=100*grams bis + acrylamide / mL water) with 3%C (=100*grams bis / grams bis + acrylamide) were analyzed to observe initial viscosities and changes in onset of polymerization. Gel volumes of 5 mL, 1 mL, and/or 0.5 mL were created in 5 mL capped glass vials by adding the appropriate amounts of monomer, initiator, and catalyst into solution.
To prepare monomer solutions, acrylamide and bis were dissolved in water. Both monomer and 15% (wt/vol) APS solutions were prepared fresh daily to prevent chemical degradation and degassed in a vacuum dessicator for 15 min at 200 torr to remove excess oxygen from the environment. Initiator solution and catalyst were pipetted directly into the monomer solution in the ratio of 1 mL water: 5 µL APS solution: 1 µL TEMED. Visible gelation times were measured from the addition of TEMED until the solution exhibited resistance to movement when vial was shaken.
For DPN, roughly 1 µl of gel solution was placed in the appropriate inkwell. A DPN tip was dipped into the ink, blotted on the substrate 2-3 times, and then printed on a silicon dioxide (SiO2) substrate. The dots were printed in grids of 6 dots by 6

the university of alabama at birmingham | inquiro • 49
dots, where the dots were 11 μm apart with a 1 second dwell time. The DPN chamber was flushed with nitrogen gas to remove oxygen from the environment when printing.
Results & DiscussionOnset of PolymerizationVarious %T and %C gels were created based on monomer concentrations from Ahern & Garrell (1988) that formed clear polyacrylamide gels and showed visible gelation within 15 min following the addition of TEMED [6]. Gels created from 3-8%T were found to have a soft, stringy consistency that would not be rigid enough to hold an MIP site. Gels created with 30%T 8%C released excessive heat during the polymerization process and created patterns of white swirls throughout the gel due to a high concentration of bis within the gel [7]. Based on the appearance and gelation times of polymer prepared with various concentrations of monomer, it was believed that a 15%T 3%C gel would be clear, rigid, and stable enough to provide the necessary gel flexibility for imprinting.
The main concern regarding printing polyacrylamide was that before polymerization, the solution would not be viscous enough for DPN printing, and following polymerization, it would be too
viscous. To imitate the DPN printing process, 0.2 µl of gel solution was pipetted as dots with roughly 5 mm diameters onto glass slides. However, when dots of 15%T and 3%C pre-
polymerized gel solution were created, they lacked the stability to hold their original positions on the slides. Increasing the viscosity of the gel solution was believed to help the dots remain in their pipetted locations. The porogen PEG was added into the gel solution to increase the initial viscosity of the pre-polymerized solution. The addition of PEG would be beneficial for the biosensor as well, since its formation of pores within the gel would allow for greater access to MIP sites.
Gels created with 5-20 wt% PEG showed a higher initial viscosity allowing for greater stability of polymer dots with increasing concentrations of PEG. The viscosity of pre-polymerized gel solution of any %T and %C solution was determined to be approximately 0.84-1.12 cp, which was not viscous enough for printing by DPN. As shown in Figure 1, the polymerized gels with 20 wt% PEG had a rough surface structure and a white color. The gel without PEG did not fully polymerize because the water quickly evaporated, causing the acrylamide and bis to crystallize out of solution. The white PEG powder dissolved
Figure 1. Images of polyacrylamide gel dots on glass slides: 15%T 3%C (left), 15%T 3%C 20wt% PEG (right)
Figure 2. 15%T and 3%C dots with 5-20 wt %PEG. The gel with 20 wt% PEG showed a well-defined and stable structure on the glass slide.

50 • inquiro | no. 6 | 2012
clearly into the monomer solution; however, at the moment of visible gelation, the PEG re-crystallized out of solution and became caught within the gel structure, turning the polymer a bright white color. Pre-polymerized solutions of 20%T and 5%C solution with 20 wt% PEG and 0.1 wt% ND were later measured to be 25 cP, which were viscous enough for printing.
It was known that for DPN printing, longer gelation times are necessary, since the printing process takes a minimum of 20 min. To accomplish this, reduced amounts of TEMED were added to the gel, and the visible gelation was timed. It was noticed during the first successful DPN printing attempt that the dots began to evaporate as time passed. To prevent this, 20%T and 5%C gels were used to allow a stronger, more rigid gel to be formed [3]. A set of experiments with gel created with decreasing amounts of TEMED were performed and lower amounts of TEMED resulted in longer visible gelation times.
Printing Polyacrylamide InksFor the first DPN attempt, a 15%T and 3%C solution consisting of only acrylamide and bis in water was used. It was tested without the addition of APS or TEMED to avoid the solution polymerizing during the printing process. However, by the time the tips were raised, brought to the substrate, and lowered, the ink had evaporated from the surface of the tip and did not print. Instead a crumbly material of acrylamide and bis, which had crystallized out of solution, fell from the tip on to the substrate. Next, the addition of PEG was considered, since gels created with PEG showed a higher viscosity. Solutions of 15%T and 3%C with concentrations ranging from 5-20 wt% PEG were created. Appropriate amounts of 15% (wt/vol) APS and TEMED were added, and then the solution was immediately pipetted onto glass slides to imitate a large-scale system of DPN dots on the SiO2 substrate. Images taken of the pipetted dots following polymerization are shown in Figure 2. The 5 wt% and 10 wt% PEG dots tended to slide from their pipetted location on the glass slide before the onset of gelation. Only the 20 wt% PEG solution remained in the exact position where it was pipetted and showed a well-defined surface structure.
A solution of 15%T and 3 %C with 20 wt% PEG and the appropriate amount of 15% (wt/vol) APS was printed. During printing, the ink remained on the tip when it was moved to the substrate and the solution printed well. The printing process was well-controlled and produced similarly sized dots. Close to 252 dots or 6x6 squares were printed before it was necessary to re-dip the tip. Three days after printing, AFM images of the surface of the dots were taken, and as shown in Figure 3, the defined surface structure of roughness of a single DPN printed dot shows that some polymerization had occurred.
Immediately after the printing process, optical microscopy images of the 15%T and 3%C DPN dots confirmed that the dots held their printed positions and were printed with uniform
consistency. Figure 4 shows a square of 36 dots a few hours following printing. When the same dots were examined two weeks following printing, it was noticed that the dots had moved slightly from their original printed locations. Additionally, smaller dots or some sort of debris had accumulated around the printed dots. It was visually determined that the diameters of the dots had decreased, possibly due to the evaporation of the water leading to incomplete polymerization.
It was noticed that 0.2-µl dots of polyacrylamide of 15%T and 3%C with 20 wt% PEG on glass slides were not fully polymerized as was earlier believed based on their defined surface structure. However, when a drop of Millipore water was added directly on top of the dot, the entire dot immediately dissolved. This lack of polymerization was attributed to the evaporation of water from the monomer solution when it was originally dotted onto the glass slide. The gels created inside closed vials fully polymerized and did not dissolve in the presence of water. A solution with higher concentration of acrylamide and PEG will help to prevent the water evaporation and lead to the formation of a more rigid gel structure [3].
Addition of NanodiamondNanodiamond (ND) was then added to the printing solution to determine its affects on the gel. The ND solution that was pipetted directly into the monomer solution contained 5 carats in 50 mL water. The nanodiamond size was between 0.25-0.5 µm, with an average diameter of 0.375 µm. The addition of ND turned the gel a white color, since the ND solution itself was white and did not dissolve into the monomer solution but was instead uniformly dispersed. Gels created with 0.2 wt% ND were found to exhibit delayed gelation time by 15 min, impeding the polymerization reaction. As seen in Figure 5, 0.2 wt% ND within the polyacrylamide gel was seen as small dark spots using optical microscopy. When focusing the microscope, the ND on the surface of the gel would reflect white, while the ND further within the gel would appear black.
Optical microscopy images were taken of polyacrylamide dots pipetted onto a glass slide to determine if the ND within the gel would fluorescence (470 ± 20 nm excitation, 525 ± 25 nm emission). In Figure 6, it is shown that ND, without silicon-vacancy defects, readily fluoresced. The fluorescent locations matched several of the black and white flecks of ND in the brightfield image. This confirmed that ND did indeed fluoresce and additional ND particles that were not visible under the brightfield image could be observed through the emission filter.Polyacrylamide ink with ND was attempted to be printed by DPN. A concentration of 20%T and 5%C was used with 20 wt% PEG and 0.1 wt% ND. The higher concentration of monomer and crosslinker was used to prevent water from evaporating as quickly from the inkwell and the printed dots. Both TEMED and APS were added to the ink so that a more fully polymerized gel could be formed. To delay the onset of polymerization, only a

the university of alabama at birmingham | inquiro • 51
ratio of 1 mL water: 0.1 µL TEMED was used, instead of the usual 1 mL water: 1µL TEMED ratio. This allowed for approximately 30 min before visible gelation, which was enough time for printing. It was observed that 6x6 squares of dots could be printed without re-dipping the DPN tip (see Figure 7). The printed dots looked similar in size, shape, and structure as the DPN printed dots without ND.
When the fluorescent images of the printed dots were observed, no ND was detected within the dots. Optical microscope images of the inkwell from where the dots were printed did show the presence of ND as did the microchannels that the ink traveled through prior to contacting the DPN tip. The channel which the DPN tips are dipped into was slightly tapered compared to the rest of the microchannel. It appeared that there was ND in the microchannel, but not nearly as high a concentration of ND within the tapered channel as shown by the lack of fluorescence (Figure 8). This may have occurred because the smaller channel blocked the ND due to aggregation at the tapering site.
Raman spectroscopy was performed on DPN printed dots with and without ND; however, both spectra looked similar. No ND peak was observed at 1332 cm-1 for the DPN printed dots, but it was observed for a gel film of 15%T 3%C with 0.1 wt% ND, as shown in Figure 6. Interestingly, no ND was observed for a liquid solution of 2 wt% ND in water either. These spectra should be retested when the Raman instrument has been realigned properly. The next attempt at printing ND should involve a higher concentration of ND and use smaller-sized ND (0-0.2 µm).
ConclusionIn this study, an array of polyacrylamide nanodots was successfully printed on a silicon dioxide substrate using dip-pen nanolithography. This work helps demonstrate initial steps
in creating a sensor that may be used to capture and detect molecules and other proteins, such as cardiac troponin T. It was shown that polyacrylamide dots with polyethylene glycol could be reproducibly printed, and 252 dots could be printed without re-dipping the printing tip. Nanodiamond particles were added to the polyacrylamide dots on a glass slide and confirmed to be uniformly dispersed using optimal microscopy. Additionally, the nanodiamond within the polyacrylamide fluoresced under a 525 ± 25 nm filter. Future work will involve adding a greater concentration of smaller nanodiamond particles and forming protein recognition sites within the printed dots. Once created, this type of molecularly imprinted biosensor could be used for rapid detection of proteins and other large biological molecules related to diseases or illnesses.
AcknowledgmentsThe authors thank Sonal Singh for assistance with dip-pen nanolithlography. We are grateful to Jared Ballinger and Jeffrey Montgomery for assistance with Raman spectroscopy. This work was supported by the National Science Foundation (Grant Number NSF-DMR-0646842), Research Experiences for Undergraduates (REU) Award to the University of Alabama at Birmingham.
References1. Babuin, L. & Jaffe, A.S. Troponin: the Biomarker of Choice
for the Detection of Cardiac Injury. Canadian Medical Association, 173 (10), 1191-1202. (2012).
2. Azzazy, H.M. & Christenson, R.H. Cardiac Markers of Acute Coronary Syndromes: Is there a Case for Point-of-Care Testing? Clinical Biochemistry. 35(1), 13-27. (2002).
Figure 3. AFM image of a 15%T 3%C single DPN dot. The defined structure showed some polymerization occurred after the DPN printing process. A. Surface Image. B. Phase Diagram.
A B

52 • inquiro | no. 6 | 2012
Figure 4. Image of a square of 15%T 3%C DPN dots. After printing (left), dots remain in their printed locations. Two weeks later (right), dots remain in printed locations but show signs of water evaporation.
Figure 5. Gel films on glass slides: 15%T 3%C (left), 15%T 3%C with 0.2 wt% ND (right). The ND appeared as black dots in the polyacrylamide gel and was uniformly dispersed.
Figure 6. Gel of 15%T and 3%C with 20 wt% PEG and 0.1 wt% ND on a glass slide: brightfield image (left), fluorescent image (right). This shows that the ND fluoresced (470 ± 20 nm excitation, 525 ± 25 nm emission).
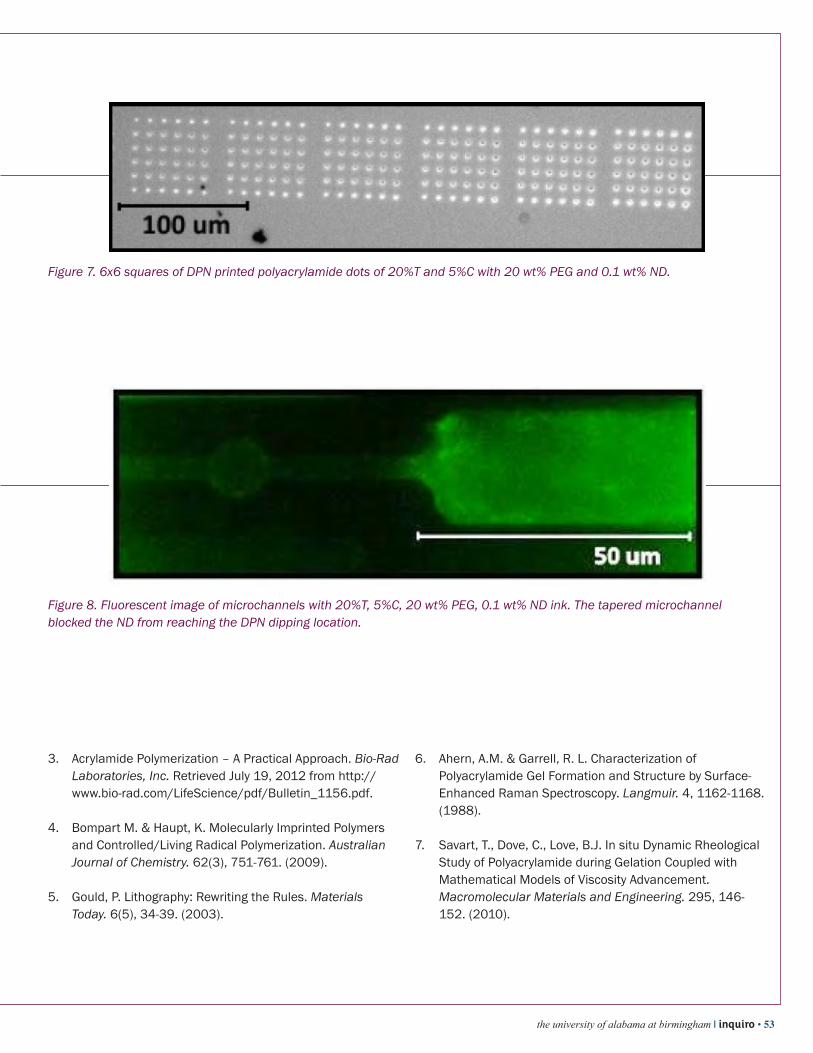
the university of alabama at birmingham | inquiro • 53
3. Acrylamide Polymerization – A Practical Approach. Bio-Rad Laboratories, Inc. Retrieved July 19, 2012 from http://www.bio-rad.com/LifeScience/pdf/Bulletin_1156.pdf.
4. Bompart M. & Haupt, K. Molecularly Imprinted Polymers and Controlled/Living Radical Polymerization. Australian Journal of Chemistry. 62(3), 751-761. (2009).
5. Gould, P. Lithography: Rewriting the Rules. Materials Today. 6(5), 34-39. (2003).
6. Ahern, A.M. & Garrell, R. L. Characterization of Polyacrylamide Gel Formation and Structure by Surface-Enhanced Raman Spectroscopy. Langmuir. 4, 1162-1168. (1988).
7. Savart, T., Dove, C., Love, B.J. In situ Dynamic Rheological Study of Polyacrylamide during Gelation Coupled with Mathematical Models of Viscosity Advancement. Macromolecular Materials and Engineering. 295, 146-152. (2010).
Figure 7. 6x6 squares of DPN printed polyacrylamide dots of 20%T and 5%C with 20 wt% PEG and 0.1 wt% ND.
Figure 8. Fluorescent image of microchannels with 20%T, 5%C, 20 wt% PEG, 0.1 wt% ND ink. The tapered microchannel blocked the ND from reaching the DPN dipping location.

54 • inquiro | no. 6 | 2012
research paperSynergistic Effects of Nicotine and Angiotensin II:
Implications for Progression of Chronic Kidney Disease in Smokers
C. Yoonhee Ryder, Edgar A. JaimesDepartment of Medicine, Division of Nephrology, University of Alabama at Birmingham
IntroductionIncreased generation of angiotensin II (Ang II) as a result of activation of the renin angiotensin system (RAS) plays a major role in the progression of chronic kidney disease (CKD) by increasing cell proliferation and the glomerular deposition of extracellular matrix [3,6]. Fibronectin (FN) is a multifunctional extracellular matrix protein that contributes to glomerular hypertrophy and fibrosis when RAS is activated [4]. The mechanisms by which Ang II increases matrix production and proliferation include increased generation of reactive oxygen species (ROS) and subsequent Mitogen Activated Protein Kinase (MAPK) activation [1]. Tobacco smoking is a risk factor for the progression of CKD of different etiologies including diabetes and hypertension [7]. Nicotine (NIC), a biologically active compound present in large amounts in tobacco, has been previously demonstrated to worsen renal injury in different animal models of CKD [2]. Nicotine has also been shown to increase the production of FN in mesangial cells by promoting ROS generation and extracellular-signal-regulated kinases (ERK) activation. [2]. In this study, a series of experiments were conducted to determine whether synergistic effects between NIC and Ang II cause deleterious effects of smoking in the presence of RAAS activation.
HypothesisWe hypothesize that NIC and Ang II have synergistic effects on mesangial cell proliferation and production of FN.
MethodsRat mesangial cells were grown in Dulbecco’s Modified Eagle Medium (DMEM) and made quiescent for 24 hours in media that contained 0.5% Fetal Bovine Serum (FBS). The cells were divided into two major test groups. The first group was exposed to 1 of 7 different concentrations of NIC (10-4 M to 10-10 M) or 1 of 5 different concentrations of Ang II (10-6 M to 10-10 M) for 24 hours. The second test group was exposed to 1 of 16 different concentration combinations that contained both NIC (10-7 M to 10-10 M) and Ang II (10-7 M to 10-10M) for 24 hours. Proliferation was measured by fluorescence of 5-ethynyl-2’-deoxyuridine (EdU) utilizing a Click-iT® EdU Microplate Assay (Invitrogen) kit following manufacturer’s instruction. EdU is a nucleoside analog to thymidine. During active DNA synthesis, it is incorporated into DNA, thus making it a good measure of proliferation [5]. Cells were treated in the same way described previously. After the second treatment, a western blot was performed using FN as the primary protein. Actin was used as the loading control. FN expression was
then measured via densitometry analysis using Image J ®.
Statistical AnalysisFor statistical comparison involving two groups, an unpaired Student’s t-test was used. For comparison of more than two groups, ANOVA was employed. Significance was considered present when p < 0.05.
ResultsAng II and NIC have increasing interactive effects on mesangial cell proliferation.For the rat mammalian cells exposed to different concentrtations of NIC and/or Ang II, Figure 1 illustrates an increase in proliferation of rat mesangial cells as concentration of NIC or Ang II increases. The data also shows a significant difference (p=0.00053) in fluorescence between those cells treated with both NIC and Ang II and those treated with only NIC or Ang II.Cells treated with both NIC and Ang II demonstrated a 15% (15717.5 of 18394.4 AFU) average increase in rat mammalian cell proliferation compared to cells treated exclusively with either agent.
Figure 1. Fluorescence of Ang II and NIC treated me-sangial cells as well as Ang II only or NIC only teated cells
measured in relative fluroescence units. N=3 per treatment group. Data acquired using Invitro gen Click-iT® EdU micro-plate assay.
*p<0.05 vs. Nicotine alone#p<0.05 vs. Angiotensin II alone
N=3

the university of alabama at birmingham | inquiro • 55
A. Control B. NIC 10-8 M C. Ang II 10-10 MD. NIC 10-8 M, Ang II 10-10 M
Figure 2. Fluorescence of cells treated with NIC with a concentration of 10-8 M, Ang II with a concentration of 10-10 M, and both NIC 10-8 M and Ang II 10-10 M. N=3 per treatment group. Significant increase determined.
A. Control B. NIC 10-8 M C. Ang II 10-10 MD. NIC 10-8 M, Ang II 10-10 M
Figure 3. Densitometry analysis of cells treated with NIC with a concentration of 10-8 M, Ang II with a concentration of 10-10 M, and both NIC 10-8 M and Ang II 10-10 M. N=4 per treatment group. Significant increase determined.
Angiotensin II and nicotine have increasing interactive effects on cell proliferation at low concentrations of NIC 10-8 M and Ang II 10-10 M.
Rat mesangial cells treated with NIC at 10-8 M or Ang II at 10-10
M have a fluorescence value of approximately 15,000 relative fluorescence units. However, when testing cells treated with both NIC at 10-8 M and Ang II at 10-10 M, the fluorescence value
significantly increases (compared to cells treated with the same amount of NIC but no Ang II) to 19,413 relative fluorescence units. The combined effect of Ang II and NIC indicates a much higher fluorescence value than the value resulting from either individual compound by itself.
Ang II and NIC have synergistic effects on FN expression at low concentrations of NIC 10-8 M and Ang II 10-10 M.

56 • inquiro | no. 6 | 2012
Cells treated with Ang II or NIC alone had lower relative densitometry values. However, Table 1 indicates that Ang II combined with NIC induced an approximate 12-fold increase in FN expression. Especially when considering lower concentrations (10-8 M or less), there is a significant increase (p=0.01773) in samples treated with both nicotine and angiotensin II compared to samples treated only with nicotine or angiotensin II. These multiple-fold increases of the combination samples compared to samples with just Ang II or NIC suggest a synergistic effect of Ang II and NIC on FN expression.
The NIC at 10-8 M sample and Ang II at 10-10 M sample have relative densitometry values of approximately 0.7 relative densitometry units (RDUs). The cell sample treated with both NIC at 10-8 M and Ang II at 10-10 M shows a significant increase in relative densitometry with a value of 5.83 RDUs suggesting more than an additive effect. At concentrations that by themselves do not considerably increase FN production, Ang II and NIC combined result in significant increases in FN production.
Table 1. Densitometry analysis of western blots using rat mesangial cell samples treated with NIC and/or Ang II (ranging from 0 to 10-7 M) measured in relative densi-tometry units. (N=4 per treatment group)
NIC (M)
ANG II (M) 0 10-7 10-8 10-9 10-10
01.00±
0.00
0.65±
0.19
0.81 ±
0.31
1.46 ±
0.23
1.14 ±
0.54
10-71.27 ±
0.098
1.12 ±
0.26
4.62±
1.72
3.80±
1.85
31.82±
15.8
10-81.11±
0.24
1.31±
0.33
0.77±
0.25*
34.59±
16.41
20.02±
9.88
10-90.72 ±
0.18
3.99±
2.14
9.52±
1.99*#
4.63±
1.12
6.28±
4.53
10-100.81 ±
0.14
0.68±
0.22
5.83±
1.11*#
16.07±
14.2
42.45±
21.0
*p<0.05 vs. Nicotine alone#p<0.05 vs. Angiotensin II aloneN=4
SummaryThese results suggest a synergistic effect between Ang II and NIC on mesangial cell fibronectin production and proliferation. Rat mesangial cells treated with both NIC and Ang II showed a significant increase in proliferation and fibronectin expression compared to cells treated with NIC or Ang II alone. In many cases, the effects were multiple-fold increases of FN expression
that exceeded the additive expression of both compounds independently, suggesting a synergistic effect. These effects were more evident at concentrations of Ang II or NIC that by themselves did not have significant effects on mesangial cell proliferation or FN production but induced robust proliferation and FN production when the cells were stimulated with both agents. At higher concentrations, their combined effects were of lower magnitude, which suggests the presence of feedback mechanisms that modulate these responses.
ConclusionThese studies show that a synergistic relationship between Ang II and NIC exists. The combined effects of the two compounds increase mesangial cell FN production. This relationship may explain some of the deleterious effects of tobacco smoking in renal diseases associated with RAS activation.
References1. Cheng TH, et al. J Am College Cardiology. 2003;42:1845-
1854.
2. Jaimes EA, Tian RX, Leopoldo R. Am J Physiology. 2007;292:H76-82.
3. Johnson RJ, Alpers CE, Yoshimura A, et al. Hypertension. 1992;19:464-474.
4. Kagami S, Border WA, Miller DA, et al. J. Clin. Invest. 1994;93:2431-2437.
5. Life Technologies, Click it EdU Microplate Assay. http://products.invitrogen.com
6. Myers BD, Boothroyd D, Olshen RA. J Am Soc Nephrol. 1998;9:S66-70.
7. Orth SR, Hallan SI. Clin. J. Am Soc Nephrol. 2008;3:226-236.
Acknowledgments• Funding support from NIH and FAMRI to E.A.J.• Travel grants provided by Department of Biology and
American Heart Association to C.Y.R.• Special thanks to Madison Duckworth, student researcher • All experiments performed in the lab of E.A.J.

the university of alabama at birmingham | inquiro • 57
Abstract The study of complex dynamics is currently of great interest in mathematics and related scientific fields. Invariant laminations, invented by William Thurston, are abstract mathematical structures which represent the dynamics of complex polynomials but are easier to understand. We will define a sibling portrait of an invariant lamination which can be thought of as a “snap shot” of the dynamical system. We will show the existence of a one-to-one correspondence between sibling portraits and bicolored trees, mathematical objects from graph theory. This immediately provides a count for the number of different sibling portraits possible. Introduction Dynamics is the mathematical study of the evolution of systems which obey some fixed law. The system could be the population of rabbits, the motion of particles in a box, or the motion of planets in a solar system. The dynamical law is simply a formula which describes the system. Typically, the law does not depend on previous states of the system. For example, the population of rabbits tomorrow does not depend on the population of rabbits yesterday; it only depends on the population of rabbits today. However, the law to describe the growth of the population should remain the same. Thus to study the population, we study the answers. Using this method, we can predict long-term behavior of a system. One simple yet interesting case to study is when the dynamical law is a quadratic polynomial of the form 𝑓𝑓 𝑥𝑥 =𝑎𝑎𝑥𝑥! + 𝑏𝑏𝑥𝑥 + 𝑐𝑐. This formula has three parameters: 𝑎𝑎, 𝑏𝑏 and 𝑐𝑐. The equation would be easier to analyze if there was only one parameter. By letting the variable be a complex number of the form 𝑧𝑧 = 𝛼𝛼 + 𝑖𝑖𝛽𝛽 where 𝛼𝛼 and 𝛽𝛽 are real numbers and 𝑖𝑖 = −1 ( 𝑧𝑧 typically denotes complex numbers while 𝑥𝑥 denotes real numbers), we can re-write 𝑓𝑓 𝑥𝑥 in terms of one
parameter. Note that 𝑓𝑓 𝑥𝑥 = 𝑎𝑎(𝑥𝑥 + !!!)! + 𝑘𝑘 where
𝑘𝑘 = 𝑐𝑐 − !!
!!. We will let 𝑧𝑧! = 𝑎𝑎(𝑥𝑥 + !
!!)! which means
𝑧𝑧 = 𝑎𝑎(𝑥𝑥 + !!!). If 𝑎𝑎 is a negative number, then 𝑧𝑧 is a complex
number. It follows that 𝑓𝑓 𝑥𝑥 = 𝑓𝑓 𝑧𝑧 = 𝑧𝑧! + 𝑘𝑘 has only one parameter 𝑘𝑘. If we think in terms of iterating the formula, we may write the dynamical law as 𝑧𝑧!!! = 𝑧𝑧!! + 𝑘𝑘. The study of quadratic polynomials still poses some challenges. For a given 𝑘𝑘-value and initial value 𝑧𝑧! we would like to know how the system evolves under many iterations. There are two possibilities. Either the values 𝑧𝑧! grow arbitrarily large, in other words 𝑧𝑧! → ∞ as 𝑛𝑛 → ∞, or the values never exceed some large number acting as an upper bound, i.e. 𝑧𝑧! < 𝑀𝑀 for all 𝑛𝑛 where 𝑀𝑀 is the upper bound. Sometimes, the accuracy in the initial value 𝑧𝑧! is extremely important. For
example, let 𝑘𝑘 = 0 so 𝑧𝑧!!! = 𝑧𝑧!! . If we know |𝑧𝑧!| = 1 with some margin of error, we can have very different results depending on what the value actually is. If |𝑧𝑧!| = 1 then |𝑧𝑧!| = 1 for all . The magnitude of the numbers never grows nor shrinks. However, if |𝑧𝑧!| = 0.999 then |𝑧𝑧!| → 0 as 𝑛𝑛 → ∞ since numbers less than 1 shrink when squared. If |𝑧𝑧!| =1.001 then |𝑧𝑧!| → ∞ as 𝑛𝑛 → ∞ . These are drastically different behaviors. This initial value sensitivity is the basis for chaos theory and chaotic dynamics. A popular choice for 𝑧𝑧! is 𝑧𝑧! = 0. Similar to the above example, there are some values of 𝑘𝑘 for which 𝑧𝑧!!! = 𝑧𝑧!! + 𝑘𝑘 tends towards ∞ or remains bounded. All the values of 𝑘𝑘 for which 𝑧𝑧!!! = 𝑧𝑧!! + 𝑘𝑘 remains bounded when 𝑧𝑧! = 0 form the Mandelbrot set. This set is essential in understanding the dynamics of quadratic polynomials as a whole. It is very difficult to understand, however, and there are still important open questions about the properties of this set. In the 1980s, William Thurston invented invariant laminations (described below) as a mathematical tool for understanding the Mandelbrot set [1]. Although more abstract, laminations are easier to study since they have nice topological and combinatorial properties. Just as the Mandelbrot set describes properties of quadratic polynomials, the “space of laminations” describes properties of invariant laminations. There are many similarities between the Mandelbrot set and the space of laminations which motivate this research. The invariant laminations defined by William Thurston, which we will refer to as Thurston invariant laminations, are very well studied in the quadratic polynomial case. However, the definition does not extend well to polynomials of higher dimensions, such as cubic polynomials of degree 3. Recently, Blokh, Mimbs, Oversteegen, and Valkenburg have modified Thurston's definition to one which is called sibling invariant laminations. This definition has demonstrated to be much more powerful in describing the cubic case [2]. This paper introduces sibling invariant laminations including definitions for sibling leaves and sibling portraits. We define central strips of laminations and prove a central strip exists for almost all full sibling families of sibling invariant leaves. We will define a bicolored tree, a mathematical object from graph theory, and show that there is a one-to-one correspondence between sibling portraits and bi-colored trees. This means that there are just as many bi-colored trees as sibling portraits. Thus we will provide counts for both the number of the different possible sibling portraits and consequently the number of different central strips. Preliminaries Let ℂ denote the complex plane, 𝕊𝕊 denote the unit circle in the complex plane – all the complex numbers 𝑧𝑧 such that 𝑧𝑧 = 1. The unit circle 𝕊𝕊 will be labeled from 0 to 1 such that 0
research paperCounting Sibling Portraits in Laminations of the Unit Disk
Joseph W. Olson1, Dr. John C. Mayer1, Luka Mernik2
1 Department of Mathematics, University of Alabama at Birmingham2 Department of Mathematics, California Institute of Technology
Abstract The study of complex dynamics is currently of great interest in mathematics and related scientific fields. Invariant laminations, invented by William Thurston, are abstract mathematical structures which represent the dynamics of complex polynomials but are easier to understand. We will define a sibling portrait of an invariant lamination which can be thought of as a “snap shot” of the dynamical system. We will show the existence of a one-to-one correspondence between sibling portraits and bicolored trees, mathematical objects from graph theory. This immediately provides a count for the number of different sibling portraits possible. Introduction Dynamics is the mathematical study of the evolution of systems which obey some fixed law. The system could be the population of rabbits, the motion of particles in a box, or the motion of planets in a solar system. The dynamical law is simply a formula which describes the system. Typically, the law does not depend on previous states of the system. For example, the population of rabbits tomorrow does not depend on the population of rabbits yesterday; it only depends on the population of rabbits today. However, the law to describe the growth of the population should remain the same. Thus to study the population, we study the answers. Using this method, we can predict long-term behavior of a system. One simple yet interesting case to study is when the dynamical law is a quadratic polynomial of the form 𝑓𝑓 𝑥𝑥 =𝑎𝑎𝑥𝑥! + 𝑏𝑏𝑥𝑥 + 𝑐𝑐. This formula has three parameters: 𝑎𝑎, 𝑏𝑏 and 𝑐𝑐. The equation would be easier to analyze if there was only one parameter. By letting the variable be a complex number of the form 𝑧𝑧 = 𝛼𝛼 + 𝑖𝑖𝛽𝛽 where 𝛼𝛼 and 𝛽𝛽 are real numbers and 𝑖𝑖 = −1 ( 𝑧𝑧 typically denotes complex numbers while 𝑥𝑥 denotes real numbers), we can re-write 𝑓𝑓 𝑥𝑥 in terms of one
parameter. Note that 𝑓𝑓 𝑥𝑥 = 𝑎𝑎(𝑥𝑥 + !!!)! + 𝑘𝑘 where
𝑘𝑘 = 𝑐𝑐 − !!
!!. We will let 𝑧𝑧! = 𝑎𝑎(𝑥𝑥 + !
!!)! which means
𝑧𝑧 = 𝑎𝑎(𝑥𝑥 + !!!). If 𝑎𝑎 is a negative number, then 𝑧𝑧 is a complex
number. It follows that 𝑓𝑓 𝑥𝑥 = 𝑓𝑓 𝑧𝑧 = 𝑧𝑧! + 𝑘𝑘 has only one parameter 𝑘𝑘. If we think in terms of iterating the formula, we may write the dynamical law as 𝑧𝑧!!! = 𝑧𝑧!! + 𝑘𝑘. The study of quadratic polynomials still poses some challenges. For a given 𝑘𝑘-value and initial value 𝑧𝑧! we would like to know how the system evolves under many iterations. There are two possibilities. Either the values 𝑧𝑧! grow arbitrarily large, in other words 𝑧𝑧! → ∞ as 𝑛𝑛 → ∞, or the values never exceed some large number acting as an upper bound, i.e. 𝑧𝑧! < 𝑀𝑀 for all 𝑛𝑛 where 𝑀𝑀 is the upper bound. Sometimes, the accuracy in the initial value 𝑧𝑧! is extremely important. For
example, let 𝑘𝑘 = 0 so 𝑧𝑧!!! = 𝑧𝑧!! . If we know |𝑧𝑧!| = 1 with some margin of error, we can have very different results depending on what the value actually is. If |𝑧𝑧!| = 1 then |𝑧𝑧!| = 1 for all . The magnitude of the numbers never grows nor shrinks. However, if |𝑧𝑧!| = 0.999 then |𝑧𝑧!| → 0 as 𝑛𝑛 → ∞ since numbers less than 1 shrink when squared. If |𝑧𝑧!| =1.001 then |𝑧𝑧!| → ∞ as 𝑛𝑛 → ∞ . These are drastically different behaviors. This initial value sensitivity is the basis for chaos theory and chaotic dynamics. A popular choice for 𝑧𝑧! is 𝑧𝑧! = 0. Similar to the above example, there are some values of 𝑘𝑘 for which 𝑧𝑧!!! = 𝑧𝑧!! + 𝑘𝑘 tends towards ∞ or remains bounded. All the values of 𝑘𝑘 for which 𝑧𝑧!!! = 𝑧𝑧!! + 𝑘𝑘 remains bounded when 𝑧𝑧! = 0 form the Mandelbrot set. This set is essential in understanding the dynamics of quadratic polynomials as a whole. It is very difficult to understand, however, and there are still important open questions about the properties of this set. In the 1980s, William Thurston invented invariant laminations (described below) as a mathematical tool for understanding the Mandelbrot set [1]. Although more abstract, laminations are easier to study since they have nice topological and combinatorial properties. Just as the Mandelbrot set describes properties of quadratic polynomials, the “space of laminations” describes properties of invariant laminations. There are many similarities between the Mandelbrot set and the space of laminations which motivate this research. The invariant laminations defined by William Thurston, which we will refer to as Thurston invariant laminations, are very well studied in the quadratic polynomial case. However, the definition does not extend well to polynomials of higher dimensions, such as cubic polynomials of degree 3. Recently, Blokh, Mimbs, Oversteegen, and Valkenburg have modified Thurston's definition to one which is called sibling invariant laminations. This definition has demonstrated to be much more powerful in describing the cubic case [2]. This paper introduces sibling invariant laminations including definitions for sibling leaves and sibling portraits. We define central strips of laminations and prove a central strip exists for almost all full sibling families of sibling invariant leaves. We will define a bicolored tree, a mathematical object from graph theory, and show that there is a one-to-one correspondence between sibling portraits and bi-colored trees. This means that there are just as many bi-colored trees as sibling portraits. Thus we will provide counts for both the number of the different possible sibling portraits and consequently the number of different central strips. Preliminaries Let ℂ denote the complex plane, 𝕊𝕊 denote the unit circle in the complex plane – all the complex numbers 𝑧𝑧 such that 𝑧𝑧 = 1. The unit circle 𝕊𝕊 will be labeled from 0 to 1 such that 0

58 • inquiro | no. 6 | 2012
Figure 1. The unit circle re-labeled. Middle: The σ2 map acting on points in the unit circle. Right: A triplet of leaves mapping to itself by σ2.
1/7
4/7
2/7
0
1412
34
0 o90 o
180o
270 o
1/7
4/7
2/7
l1
l2l3
corresponds to the point on the unit circle 𝕊𝕊 at the 0° angle, !!
corresponds to the point on 𝕊𝕊 at 90°, !! corresponds to the
point on 𝕊𝕊 at 180°, !! corresponds to the point on 𝕊𝕊 at 270°,
and 1 corresponds back to the point on 𝕊𝕊 at 0°. Fig. 1 depicts this re-labeling. For 𝑑𝑑 ≥ 2 and 𝑥𝑥 in 𝕊𝕊, 0 ≤ 𝑥𝑥 ≤ 1, define a function 𝜎𝜎!:𝕊𝕊 → 𝕊𝕊 by 𝜎𝜎! 𝑥𝑥 = 𝑑𝑑×𝑥𝑥 (𝑚𝑚𝑜𝑜𝑑𝑑 1). For example, for 𝑑𝑑 = 2, 𝜎𝜎! !
! = !
! ,
𝜎𝜎! !! = !
! , 𝜎𝜎! !
! = !
!− 1 = !
! . This example is depicted in
Fig. 1. A lamination ℒ is a collection of chords of the unit circle 𝕊𝕊 with the property that no two chords intersect except for possibly at their endpoint in the unit circle. A lamination ℒ must also be closed, meaning it contains all of its limit points. If a sequence of points in the lamination converges to a limit, that limit point is also in the lamination. A chord in a lamination which satisfies these properties is called a leaf (pl. leaves). If ℓ𝓁𝓁 is a leaf in a lamination ℒ, we write ℓ𝓁𝓁 = 𝑎𝑎𝑏𝑏, where 𝑎𝑎 and 𝑏𝑏 are the endpoints of ℓ𝓁𝓁 in 𝕊𝕊 . We let 𝜎𝜎! ℓ𝓁𝓁 be the chord 𝜎𝜎! 𝑎𝑎 𝜎𝜎! 𝑏𝑏 . For instance, if ℓ𝓁𝓁! =
!!!!, ℓ𝓁𝓁! =
!!!!, and ℓ𝓁𝓁! =
!!!!,
then 𝜎𝜎!(ℓ𝓁𝓁!) =!!!!, 𝜎𝜎!(ℓ𝓁𝓁!) =
!!!!, and 𝜎𝜎!(ℓ𝓁𝓁!) =
!!!!.
Fig. 1 depicts these three leaves. If it happens that 𝜎𝜎! 𝑎𝑎 =𝜎𝜎!(𝑏𝑏), for example 𝜎𝜎! 0 = 𝜎𝜎!
!!= 0, then 𝜎𝜎! ℓ𝓁𝓁 is a point,
called a critical value of ℒ and we say ℓ𝓁𝓁 is a critical leaf. In general, as 𝜎𝜎! is applied to ℓ𝓁𝓁 successively, we get iterations of ℓ𝓁𝓁. The 𝑖𝑖!! iterate of ℓ𝓁𝓁 is denoted 𝜎𝜎!! (ℓ𝓁𝓁). For example, 𝜎𝜎!! ℓ𝓁𝓁 =𝜎𝜎! 𝜎𝜎! ℓ𝓁𝓁 .
Leaf Length Function Let (𝑎𝑎, 𝑏𝑏) be an arc segment in the unit circle 𝕊𝕊. Define the length of (𝑎𝑎, 𝑏𝑏) , denoted |(𝑎𝑎, 𝑏𝑏)| , to be the length of the shortest path from 𝑎𝑎 to 𝑏𝑏 . For example, !
!, !! = !
! while
!!!", !!" = !
!"= !
! . For a leaf ℓ𝓁𝓁 = 𝑎𝑎𝑏𝑏, let the length of the
leaf, denoted |ℓ𝓁𝓁| or |𝑎𝑎𝑏𝑏|, be the length of the arc (𝑎𝑎, 𝑏𝑏). So ℓ𝓁𝓁 = |(𝑎𝑎, 𝑏𝑏)|. Notice that the maximum length of a leaf is !
!
since we choose the shortest distance between 𝑎𝑎 and 𝑏𝑏 to be the length. For a fixed 𝑑𝑑 ≥ 2, a leaf ℓ𝓁𝓁 of length ℓ𝓁𝓁 < !
!! will
grow since 𝜎𝜎! ℓ𝓁𝓁 < 𝑑𝑑× !!!= !
! . Also note that if two points 𝑎𝑎
and 𝑏𝑏 map to the same point under 𝜎𝜎! , then they are a distance !
! apart for some integer 𝑛𝑛 . Say 𝑏𝑏 = 𝑎𝑎 + !
! , then
𝜎𝜎! 𝑏𝑏 = 𝜎𝜎! 𝑎𝑎 + !!= 𝑑𝑑× 𝑎𝑎 + !
!𝑚𝑚𝑜𝑜𝑑𝑑 1 = 𝑑𝑑×𝑎𝑎 +
𝑛𝑛 𝑚𝑚𝑜𝑜𝑑𝑑 1 = 𝑑𝑑×𝑎𝑎 𝑚𝑚𝑜𝑜𝑑𝑑 1 = 𝜎𝜎!(𝑎𝑎) . So all the points which map to the same point are spaced evenly around the unit circle at !
! intervals.
Sibling Invariant Laminations Definition 1.1 (Sibling Leaves) Let ℓ𝓁𝓁 and ℓ𝓁𝓁! be leaves in a lamination ℒ such that 𝜎𝜎! ℓ𝓁𝓁! = ℓ𝓁𝓁. A leaf ℓ𝓁𝓁! is disjoint from ℓ𝓁𝓁! if they do not intersect at all, even at endpoints. If ℓ𝓁𝓁! is disjoint from ℓ𝓁𝓁! and 𝜎𝜎! ℓ𝓁𝓁! = 𝜎𝜎! ℓ𝓁𝓁! = ℓ𝓁𝓁 then ℓ𝓁𝓁! is called a sibling leaf of ℓ𝓁𝓁!. A collection of 𝑑𝑑 pair-wise disjoint leaves 𝒮𝒮 = {ℓ𝓁𝓁!, ℓ𝓁𝓁!,… , ℓ𝓁𝓁!} is called a full sibling family if for each 𝑖𝑖, 𝜎𝜎! ℓ𝓁𝓁! = ℓ𝓁𝓁.

the university of alabama at birmingham | inquiro • 59
corresponds to the point on the unit circle 𝕊𝕊 at the 0° angle, !!
corresponds to the point on 𝕊𝕊 at 90°, !! corresponds to the
point on 𝕊𝕊 at 180°, !! corresponds to the point on 𝕊𝕊 at 270°,
and 1 corresponds back to the point on 𝕊𝕊 at 0°. Fig. 1 depicts this re-labeling. For 𝑑𝑑 ≥ 2 and 𝑥𝑥 in 𝕊𝕊, 0 ≤ 𝑥𝑥 ≤ 1, define a function 𝜎𝜎!:𝕊𝕊 → 𝕊𝕊 by 𝜎𝜎! 𝑥𝑥 = 𝑑𝑑×𝑥𝑥 (𝑚𝑚𝑜𝑜𝑑𝑑 1). For example, for 𝑑𝑑 = 2, 𝜎𝜎! !
! = !
! ,
𝜎𝜎! !! = !
! , 𝜎𝜎! !
! = !
!− 1 = !
! . This example is depicted in
Fig. 1. A lamination ℒ is a collection of chords of the unit circle 𝕊𝕊 with the property that no two chords intersect except for possibly at their endpoint in the unit circle. A lamination ℒ must also be closed, meaning it contains all of its limit points. If a sequence of points in the lamination converges to a limit, that limit point is also in the lamination. A chord in a lamination which satisfies these properties is called a leaf (pl. leaves). If ℓ𝓁𝓁 is a leaf in a lamination ℒ, we write ℓ𝓁𝓁 = 𝑎𝑎𝑏𝑏, where 𝑎𝑎 and 𝑏𝑏 are the endpoints of ℓ𝓁𝓁 in 𝕊𝕊 . We let 𝜎𝜎! ℓ𝓁𝓁 be the chord 𝜎𝜎! 𝑎𝑎 𝜎𝜎! 𝑏𝑏 . For instance, if ℓ𝓁𝓁! =
!!!!, ℓ𝓁𝓁! =
!!!!, and ℓ𝓁𝓁! =
!!!!,
then 𝜎𝜎!(ℓ𝓁𝓁!) =!!!!, 𝜎𝜎!(ℓ𝓁𝓁!) =
!!!!, and 𝜎𝜎!(ℓ𝓁𝓁!) =
!!!!.
Fig. 1 depicts these three leaves. If it happens that 𝜎𝜎! 𝑎𝑎 =𝜎𝜎!(𝑏𝑏), for example 𝜎𝜎! 0 = 𝜎𝜎!
!!= 0, then 𝜎𝜎! ℓ𝓁𝓁 is a point,
called a critical value of ℒ and we say ℓ𝓁𝓁 is a critical leaf. In general, as 𝜎𝜎! is applied to ℓ𝓁𝓁 successively, we get iterations of ℓ𝓁𝓁. The 𝑖𝑖!! iterate of ℓ𝓁𝓁 is denoted 𝜎𝜎!! (ℓ𝓁𝓁). For example, 𝜎𝜎!! ℓ𝓁𝓁 =𝜎𝜎! 𝜎𝜎! ℓ𝓁𝓁 .
Leaf Length Function Let (𝑎𝑎, 𝑏𝑏) be an arc segment in the unit circle 𝕊𝕊. Define the length of (𝑎𝑎, 𝑏𝑏) , denoted |(𝑎𝑎, 𝑏𝑏)| , to be the length of the shortest path from 𝑎𝑎 to 𝑏𝑏 . For example, !
!, !! = !
! while
!!!", !!" = !
!"= !
! . For a leaf ℓ𝓁𝓁 = 𝑎𝑎𝑏𝑏, let the length of the
leaf, denoted |ℓ𝓁𝓁| or |𝑎𝑎𝑏𝑏|, be the length of the arc (𝑎𝑎, 𝑏𝑏). So ℓ𝓁𝓁 = |(𝑎𝑎, 𝑏𝑏)|. Notice that the maximum length of a leaf is !
!
since we choose the shortest distance between 𝑎𝑎 and 𝑏𝑏 to be the length. For a fixed 𝑑𝑑 ≥ 2, a leaf ℓ𝓁𝓁 of length ℓ𝓁𝓁 < !
!! will
grow since 𝜎𝜎! ℓ𝓁𝓁 < 𝑑𝑑× !!!= !
! . Also note that if two points 𝑎𝑎
and 𝑏𝑏 map to the same point under 𝜎𝜎! , then they are a distance !
! apart for some integer 𝑛𝑛 . Say 𝑏𝑏 = 𝑎𝑎 + !
! , then
𝜎𝜎! 𝑏𝑏 = 𝜎𝜎! 𝑎𝑎 + !!= 𝑑𝑑× 𝑎𝑎 + !
!𝑚𝑚𝑜𝑜𝑑𝑑 1 = 𝑑𝑑×𝑎𝑎 +
𝑛𝑛 𝑚𝑚𝑜𝑜𝑑𝑑 1 = 𝑑𝑑×𝑎𝑎 𝑚𝑚𝑜𝑜𝑑𝑑 1 = 𝜎𝜎!(𝑎𝑎) . So all the points which map to the same point are spaced evenly around the unit circle at !
! intervals.
Sibling Invariant Laminations Definition 1.1 (Sibling Leaves) Let ℓ𝓁𝓁 and ℓ𝓁𝓁! be leaves in a lamination ℒ such that 𝜎𝜎! ℓ𝓁𝓁! = ℓ𝓁𝓁. A leaf ℓ𝓁𝓁! is disjoint from ℓ𝓁𝓁! if they do not intersect at all, even at endpoints. If ℓ𝓁𝓁! is disjoint from ℓ𝓁𝓁! and 𝜎𝜎! ℓ𝓁𝓁! = 𝜎𝜎! ℓ𝓁𝓁! = ℓ𝓁𝓁 then ℓ𝓁𝓁! is called a sibling leaf of ℓ𝓁𝓁!. A collection of 𝑑𝑑 pair-wise disjoint leaves 𝒮𝒮 = {ℓ𝓁𝓁!, ℓ𝓁𝓁!,… , ℓ𝓁𝓁!} is called a full sibling family if for each 𝑖𝑖, 𝜎𝜎! ℓ𝓁𝓁! = ℓ𝓁𝓁.
1/7
4/7
2/7
9/1411/14
1/14
Figure 2. An example of the first few leaves in a degree d=2 sibling invariant lamination.
For example, in Fig. 2, the leaves ℓ𝓁𝓁! =!!!! and ℓ𝓁𝓁! =
!!"
!!!"
are sibling leaves. They are disjoint and map to the same leaf. 𝜎𝜎! ℓ𝓁𝓁! = !
!!!
and 𝜎𝜎! ℓ𝓁𝓁! = !"!"
!!!"= !
!!!!= !
!!!
. Since 𝑑𝑑 = 2 , {ℓ𝓁𝓁!, ℓ𝓁𝓁!} is a full sibling family. Notice that there are always 𝑑𝑑 sibling leaves and their endpoints will be spaced evenly around the unit circle 𝕊𝕊. In this case where 𝑑𝑑 = 2, there are two sibling leaves and they are on opposite sides of 𝕊𝕊. Thurston's definition of invariant laminations does not involve sibling leaves. His definition is more broad. Blokh, Mimbs, Oversteegen, and Valkenburg proved that every sibling invariant lamination is also Thurston invariant but not vice-versa [2]. They also proved that sibling invariance does not exclude any of the important laminations. In a sense, sibling invariance keeps the appropriate Thurston invariant laminations and discards the unnecessary ones. Definition 1.2 (Sibling Invariance) Recall that chords (called leaves) are in a lamination ℒ provided that they do not intersect any other leaves except possibly at endpoints. A lamination ℒ is said to be sibling d-invariant provided that:
(1) (Forward Invariance) For every leaf ℓ𝓁𝓁 in ℒ, 𝜎𝜎!(ℓ𝓁𝓁) is a leaf in ℒ.
(2) (Backward Invariance) For every leaf ℓ𝓁𝓁 in ℒ, there is a leaf ℓ𝓁𝓁! in ℒ such that 𝜎𝜎! ℓ𝓁𝓁! = ℓ𝓁𝓁.
(3) (Sibling Invariance) For every ℓ𝓁𝓁! in ℒ with 𝜎𝜎! ℓ𝓁𝓁! =ℓ𝓁𝓁 , there is a full sibling family of leaves in ℒ , {ℓ𝓁𝓁!, ℓ𝓁𝓁!,… , ℓ𝓁𝓁!} , such that 𝜎𝜎! ℓ𝓁𝓁! = ℓ𝓁𝓁 for all 𝑖𝑖.
Fig. 2 depicts an example of the first few leaves in a degree 2 sibling invariant lamination. Though chords are straight, we sometimes draw them curved to stand out. The construction begins with the leaves ℓ𝓁𝓁! =
!!!!, ℓ𝓁𝓁! =
!!!!, and ℓ𝓁𝓁! =
!!!!. See that
𝜎𝜎! ℓ𝓁𝓁! = ℓ𝓁𝓁!, 𝜎𝜎! ℓ𝓁𝓁! = ℓ𝓁𝓁!, and 𝜎𝜎! ℓ𝓁𝓁! = ℓ𝓁𝓁!. The leaves ℓ𝓁𝓁!, ℓ𝓁𝓁!, and ℓ𝓁𝓁! each need a sibling (only one since 𝑑𝑑 = 2 ). The additional leaves ℓ𝓁𝓁! , ℓ𝓁𝓁! , and ℓ𝓁𝓁! such that 𝜎𝜎! ℓ𝓁𝓁! = ℓ𝓁𝓁! ,
𝜎𝜎! ℓ𝓁𝓁! = ℓ𝓁𝓁! , and 𝜎𝜎! ℓ𝓁𝓁! = ℓ𝓁𝓁! are ℓ𝓁𝓁! =!!"
!!!"
, ℓ𝓁𝓁! =!!!"
!!"
, and
ℓ𝓁𝓁! =!!"
!!"
. Continue to construct the lamination by finding 2 disjoint leaves which map to ℓ𝓁𝓁! , ℓ𝓁𝓁! , and ℓ𝓁𝓁! . Then find 2 disjoint leaves which map to each of those and so forth. Note that this construction method may not produce a unique sibling invariant lamination. Definition 1.3 (Sibling Portrait) The sibling portrait 𝒮𝒮 of a full sibling family is the collection of regions complementary to the sibling leaves - the spaces between the leaves. We call a complementary region a 𝐶𝐶 -region provided all of the arcs in which the region meets the circle are short (length < !
!!). It will soon be apparent that the
name 𝐶𝐶 -region alludes to the central strip. We call a complementary region an 𝑅𝑅-region if all of the arcs are long (length > !
!!). The 𝑅𝑅 simply alludes to a not-so-special region.
The degree of a complementary region 𝑇𝑇 (𝑇𝑇 is a dummy variable for either 𝐶𝐶 or 𝑅𝑅), denoted deg(𝑇𝑇), is equal to the number of leaves in the boundary of 𝑇𝑇 or, equivalently, the number of circular arcs in the boundary of 𝑇𝑇 .

60 • inquiro | no. 6 | 2012
y3
y6
x1y1
x2y2
x3
x4y4
x5 y5
x6
C
RC
R
RR
C
σ6*
x
y
Figure 3. An example of a sibling portrait for degree d=6 on the left and its image under σ6 on the right.
Fig. 3 depicts an example a full sibling family of size 6 and the corresponding sibling portrait. All the leaves are mapped under 𝜎𝜎! to the same leaf depicted on the right. Note that since the 𝐶𝐶-regions intersect the circle with short arcs and 𝑅𝑅-regions intersect the circle with long arcs, the 𝐶𝐶-regions are mapped to the smaller of the two regions depicted on the right. Definition 1.4 (Graph) A graph is defined to be a finite number of points connected by lines which do not intersect. The points are called vertices and the connecting lines are called edges [3]. The degree of a vertex 𝑣𝑣 is the number of edges that share 𝑣𝑣 as a vertex. A tree is a graph with no loops of edges in it so that there is only one path connecting any two vertices [3]. A tree whose vertices are colored with two colors such that no edge connects vertices of the same color is said to be bicolored. An example of a bicolored tree is provided in Fig. 4. Definition 1.5 (Dual Graph) The dual graph 𝑇𝑇𝒮𝒮 of the sibling portrait 𝒮𝒮 corresponding to a full sibling family is defined as follows: put a dot in each region of the sibling portrait and connect any twos dots exactly when the two regions containing those dots share a leaf in their boundaries. See Fig. 4 for an example. Proposition 1.6 The dual graph of a sibling portrait under 𝜎𝜎! is a tree consisting of 𝑑𝑑 + 1 vertices (components of the portrait) and 𝑑𝑑 edges (sibling leaves between components that meet on their boundaries).
The proof is left to the reader. However, by referring to Fig. 4 it is easy to see that there are 𝑑𝑑 edges in the tree since there are 𝑑𝑑 leaves. One can also see that there are 𝑑𝑑 + 1 vertices of the tree since 𝑑𝑑 leaves partition the circle into 𝑑𝑑 + 1 regions. Since the leaves in the lamination are required to be disjoint, the graph contains no loops of edges. Therefore the dual graph is indeed a tree. The bicolored property is proven in Theorem 2.2. Recall that the degree of a complementary region 𝑇𝑇 of a sibling portrait is defined to be the number of leaves in its boundary, and the degree of a vertex in a graph is defined to be the number of edges coming out of it. Since leaves correspond to edges, the degree of a region 𝑇𝑇 is equal to the degree of 𝑇𝑇's corresponding vertex in the dual graph. In Theorem 2.2 below, we show that if a full sibling family does not map to a diameter, then all the complementary regions of the sibling portrait are either 𝐶𝐶 -regions or 𝑅𝑅 -regions. If the degree of a region is 1, we will refer to it as a terminal region since it corresponds to an endpoint of the dual tree. Central Strips During his study of quadratic laminations, Thurston used the idea of a “central strip” to classify types of laminations. This classification helps give structure to the space of laminations which we are trying to correlate to the parameter space for polynomials (the Mandelbrot set in the quadratic case). Since Thurston only worked with quadratic laminations, a rigorous definition for a central strip was not necessary. Below we will define a central strip for any degree 𝑑𝑑 ≥ 2.

the university of alabama at birmingham | inquiro • 61
If 𝒮𝒮 is a full sibling family which maps to the leaf ℓ𝓁𝓁 = 𝑥𝑥𝑦𝑦, then the endpoints 𝑥𝑥! , 𝑦𝑦! of the sibling leaves may be labeled 𝑥𝑥!, 𝑦𝑦!, 𝑥𝑥!, 𝑦𝑦!,… , 𝑥𝑥! , 𝑦𝑦! in a counterclockwise order around the unit circle 𝕊𝕊 (see Fig. 4). We do not generally suppose ℓ𝓁𝓁! = 𝑥𝑥!𝑦𝑦! unless so stated. Typically we denote ℓ𝓁𝓁! = 𝑥𝑥!𝑦𝑦! for some 𝑗𝑗. We can consider the case where the full sibling family maps to a leaf which is a diameter of the circle as a special case. Therefore, we will assume the sibling leaves map to a non-diametrical leaf. Definition 2.1 (Central Strip) Consider the sibling portrait of a full sibling family 𝒮𝒮. Then the central strip 𝐶𝐶 corresponding to 𝒮𝒮 is the collection of all 𝐶𝐶 -regions 𝐶𝐶! with degree at least 2. So in Fig. 4, the central strip would consist of two of the three 𝐶𝐶-regions. Theorem 2.2 Let 𝒮𝒮 = {ℓ𝓁𝓁!, ℓ𝓁𝓁!,… , ℓ𝓁𝓁!} be a full sibling family which does not map to a diameter. Then the following hold:
(1) If some leaf in 𝒮𝒮 is of length > !!!
, then there is a central strip 𝐶𝐶.
(2) The dual graph of the sibling portrait corresponding to 𝒮𝒮 is a bicolored tree where 𝐶𝐶 -regions are colored one color and 𝑅𝑅-regions the other.
Proof: Refer to Fig. 4. Since the 𝑥𝑥! (and 𝑦𝑦!) are evenly spaced, then either the arc (𝑥𝑥! , 𝑦𝑦!) or (𝑦𝑦! , 𝑥𝑥!!!) is short. We may assume that (𝑥𝑥! , 𝑦𝑦!) is the short one. Notice that on one side of ℓ𝓁𝓁 = 𝑥𝑥!𝑦𝑦! in Fig. 4 there is a 𝐶𝐶-region and on the other an 𝑅𝑅-region. This is true in general since if the length of arc (𝑥𝑥! , 𝑦𝑦!) is short then the length of (𝑦𝑦! , 𝑥𝑥!!!) must be long. Therefore, 𝐶𝐶-regions are only adjacent to 𝑅𝑅-regions and vice-versa. Since the regions correspond to vertices of the dual graph, we naturally see that the vertices must be bicolored in relation to 𝐶𝐶-regions and 𝑅𝑅-regions. Proposition 1.6 already established the dual graph is a tree; therefore the dual graph is a bicolored tree. First, note that if the length of ℓ𝓁𝓁! is !
!! then the length of
𝜎𝜎!(ℓ𝓁𝓁!) is !!
which implies 𝜎𝜎!(ℓ𝓁𝓁!) is a diameter. Since we assumed otherwise, none of the leaves in 𝒮𝒮 may be of length !!!
. Second, if all the leaves in 𝒮𝒮 are short (length < !!!
) then ℓ𝓁𝓁! = 𝑥𝑥!𝑦𝑦! for all 𝑖𝑖. Then each ℓ𝓁𝓁! subtends a 𝐶𝐶-region of degree one. The remaining region in the middle is an 𝑅𝑅 -region of degree 𝑑𝑑. Since in this case there are no 𝐶𝐶-regions of degree greater than or equal to two, there is no central strip. Fig. 5 depicts this case.
Figure 4. Mapping of a sibling portrait to a bicolored tree.
y3y6
x1y1
x2y2
x3
x4y4
x5 y5
x6
C
RC
R
RR
C

62 • inquiro | no. 6 | 2012
Figure 5. There is no central strip when all the leaves are short.
y3
y6
x1y1
x2y2
x3
x4y4
x5 y5
x6
RC
C
C
C
C
C
In the third and last case we may assume the length of at least one leaf in 𝒮𝒮 is long (length > !
!!). Without loss of
generality, we may assume the length of ℓ𝓁𝓁! is long. We may also label the generic leaf ℓ𝓁𝓁! as the one with endpoint 𝑥𝑥! . Since ℓ𝓁𝓁! = 𝑥𝑥!𝑦𝑦! (in Fig. 4, ℓ𝓁𝓁! = 𝑥𝑥!𝑦𝑦!) is assumed to be long and (𝑥𝑥! , 𝑦𝑦!) is assumed to be short, then 𝑗𝑗 ≠ 1. Thus there is a leaf emanating from 𝑦𝑦!, called ℓ𝓁𝓁! = 𝑦𝑦!𝑥𝑥! , different from ℓ𝓁𝓁!. Then the arc (𝑥𝑥! , 𝑦𝑦!) is short and there is another leaf emanating from 𝑦𝑦! , ℓ𝓁𝓁! = 𝑦𝑦!𝑥𝑥! . This continues until a leaf has endpoint 𝑥𝑥! (𝑥𝑥! in Fig. 4). This leaf completes the 𝐶𝐶-region which has ℓ𝓁𝓁! and ℓ𝓁𝓁! as boundary leaves. Since ℓ𝓁𝓁! ≠ ℓ𝓁𝓁! , this 𝐶𝐶 -region has degree at least two. Therefore, a central strip exists. (End of proof.) Definition 2.3 (Euler’s totient function) Integers 𝑥𝑥 and 𝑦𝑦 are relatively prime if their greatest common divisor is 1. Euler’s totient function, 𝜙𝜙(𝑥𝑥), is defined to be the number of positive integers less than, and relatively prime to, 𝑥𝑥 . For example, 𝜙𝜙 2 = 1 since 1 is relatively prime to 2. 𝜙𝜙 3 = 2 since both 1 and 2 are relatively prime to 3. 𝜙𝜙 4 = 2 since both 1 and 3 are relatively prime to 4. 2 is not relatively prime to 4 since 2 is a divisor of both.
Theorem 2.4 If ℓ𝓁𝓁 is a non-diametrical leaf then there are 𝑁𝑁(𝑑𝑑) different full sibling families which map onto ℓ𝓁𝓁 by 𝜎𝜎! , distinct up to rotations, where
𝑁𝑁 𝑑𝑑 =1𝑑𝑑
1𝑑𝑑 + 1
2𝑑𝑑𝑑𝑑
+ 𝜙𝜙 𝑑𝑑𝑛𝑛
2𝑛𝑛𝑛𝑛
!|!,!!!
and 𝜙𝜙(𝑥𝑥) is Euler's totient function. Proof: The goal is to show that there are just as many different full sibling families (equivalently sibling portraits) which map to the same leaf under 𝜎𝜎! as there are different bicolored trees with 𝑑𝑑 edges. The number of bicolored trees with 𝑑𝑑 edges is known to be 𝑁𝑁(𝑑𝑑) [4]. Thus we will use this correspondence to show there are 𝑁𝑁(𝑑𝑑) different sibling portraits mapping to the same leaf. Refer to Fig. 6 during this proof. The proof of Theorem 2.2 illustrates how to map a sibling portrait to a bicolored tree. It is easy to check that if two sibling portraits map to the same bicolored tree (up to rotation) then those two sibling portraits are the same (up to rotation). Therefore, since for every sibling portrait we can find a unique bicolored tree, there must be at least as many bicolored trees as sibling portraits.

the university of alabama at birmingham | inquiro • 63
y3
y6x1y1
x2y2
x3
x4 y4
x5
y5
x6
x6y6
x 1y1x2y2
x3y3x4
y4 x5y5
Figure 6. Mapping a bicolored tree to a sibling portrait.
Now assume we are given a bicolored tree with 𝑑𝑑 edges like the one in Fig. 6. Since each edge corresponds to a leaf in the full sibling family and each leaf has two endpoints, we may correlate each side of an edge with an endpoint of the leaf. Label the sides of the edges in the tree in a counterclockwise order 𝑥𝑥!, 𝑦𝑦!, 𝑥𝑥!, 𝑦𝑦!,… , 𝑥𝑥! , 𝑦𝑦! . Since we consider sibling portraits to be the same if one is a rotation of the other, then it does not matter which edge you choose to label 𝑥𝑥! with. However, since we generally assume (𝑥𝑥! , 𝑦𝑦!) to be a short arc, the vertex of the tree between 𝑥𝑥! and 𝑦𝑦! must correspond to a 𝐶𝐶 -region. Then in the unit circle, connect a leaf between 𝑥𝑥! and 𝑦𝑦! if they are two sides of the same edge in the tree. This will construct a full sibling family. Similarly, it is easy to check that if two bicolored trees map to the same sibling portrait then they are the same bicolored tree. Therefore for every bicolored tree there is a unique sibling portrait. It then follows that there are exactly as many sibling portraits as bicolored trees. (End of proof.) Corollary 2.5 If ℓ𝓁𝓁 is a non-diametrical leaf then the number of different central strips, distinct up to rotational symmetry, whose boundary leaves map onto ℓ𝓁𝓁 is 𝑁𝑁 𝑑𝑑 − 1. This corollary follows immediately from Theorem 2.4 since the only time a sibling portrait does not have a central strip is when all the boundary leaves are short, as in Fig. 5.
References 1. W.P. Thurston. On the geometry and dynamics of iterated
rational maps. Complex Dynamics: Families and Friends. Dierk Schleicher, ed. A K Peters, 2009, pp. 1-108.
2. A. Blokh, D. Mimbs, L. Oversteegen and K. Valkenburg.
Laminations in the language of leaves. Transactions AMS (to appear). 32 pages. arXiv: 1106.0273.
3. J.R. Munkres. Topology, 2nd ed. Pearson Education, Inc.
2000. 4. M. Bona, M. Bousquet, G. Labelle, and P. Leroux.
Enumeration of mAry Cacti. Advances in Applied Mathematics 24, 2009, 22-56.
Authors’ e-mail addresses John C. Mayer: [email protected] Luka Mernik: [email protected] Joseph W. Olson: [email protected] The first, second, and fourth authors thank the UAB Laminations seminar, and in particular Drs. Lex Oversteegen and Alexander Blokh and graduate students Ross Ptacek and David Cosper for useful conversations.

64 • inquiro | no. 6 | 2012
research paperWork Function and HOMO Levels of Zinc Phthalocyanine on Different Substrates
Joseph Olson1, Michael Kozlik2, Prof. Dr. Torsten Fritz2
1 Department of Mathematics, University of Alabama at Birmingham, Birmingham, AL2 Institut für Festkörperphysik, Friedrich-Schiller-Universität, Jena, Germany
AbstractUltraviolet photoelectron spectroscopy (UPS) is used to analyze the work function and highest occupied molecular orbital (HOMO) levels of zinc phthalocyanine (ZnPc) as well as the interface between evaporated ZnPc on Au/Si, ZnO/ITO/borosilicate, and AZO/quartz. Also, ultraviolet-visible spectroscopy (UV-Vis) and UPS are used to investigate the heating of ZnPc films at approximately 325°C in order to induce a change from α to β phase. Preliminary to the main investigation, the UPS equipment’s bias voltage is calibrated and UPS spectra for Au/Si, ITO/borosilicate, ZnO/ITO/borosilicate, and AZO/quartz are analyzed. While the measured Fermi edges, valence bands, and HOMOs of the samples are in good agreement with previously reported values, the measured work functions are consistently lower than expected. However, the construction of a Au/ZnPc/ZnO/TCO hybrid solar cell, where the TCO is either ITO or AZO, still appears to be feasible.
IntroductionOne of the new generations of photovoltaic cells is the “hybrid” solar cell, appropriately named because they are composed of both organic and inorganic materials. There are several benefits of hybrid solar cells. First, they can be mass manufactured at low cost compared to purely inorganic solar cells. Second, they combine the high absorbance of organic materials with the high conductivity of inorganic materials [1]. Third, many organic compounds easily form thin films, allowing a wide array of various layers with different properties to be constructed for specific design [2]. Fig. 1 depicts a general model for a hybrid solar cell. After entering into the solar cell (from the right through a layer of glass not shown in the diagram), light passes through a transparent conducting oxide (TCO) and an inorganic layer before entering an organic layer. In this organic layer, the photons excite an electron from the highest occupied molecular orbital (HOMO) level to the lowest unoccupied molecular orbital (LUMO) level. The HOMO level, as the name indicates, is the energy level of the highest energy electron orbital which contains an electron at ground state while the LUMO level is the energy level of the next highest electron orbital. When an electron is excited to the LUMO level in the organic layer, it becomes available to move within the material, traveling from molecule to molecule. Also, when it becomes excited into the LUMO level, the electron leaves behind a positively charged electron “hole” in the HOMO level. The “hole” travels throughout the material like a positively charged particle, akin to the electron’s movement. This electron-hole pair, called an exciton, can transfer energy
in the material without transferring any net charge. The energy, which originally came from the photon, is stored in the material as a potential difference between the electron and the hole. The binding energy of an exciton in organic materials is on the magnitude of 1 eV, depicted as the energy bumps in the HOMO and LUMO levels in Fig. 1. In the inorganic layer, the conduction band (CB) is analogous to the LUMO level while the valence band (VB) is analogous to the HOMO level. Although the Fermi energy in the metal is analogous to the HOMO level in organic materials, there is one distinct difference: there are always electrons above the Fermi energy in a metal. That is why metals are such excellent conductors. As the excited electrons in the organic layer try to return to ground state, they travel to the inorganic layer since there is a decrease in energy from the LUMO level to the conduction band. Similarly, the holes travel from the organic layer to the metal due to an increase from the HOMO level to the Fermi Energy. This charge separation creates a potential difference and, with the addition of a circuit, a current is produced.
This study uses ultraviolet photoelectron spectroscopy (UPS) to investigate the feasibility of a hybrid solar cell composed of gold as the metal, zinc phthalocyanine (ZnPc) as the organic material, zinc oxide (ZnO) as the inorganic material, and either aluminum-doped zinc oxide (AZO) or tin-doped indium oxide (ITO) as the TCO. The use of phthalocyanine derivatives as organic films in hybrid photovoltaic systems is currently of great interest because of their simple synthesis, thermal stability, and high absorbance [4]. ZnPc is well studied on ITO and C60 [4, 5, 6], but to date, little is known about the ZnPc/ZnO interface. ZnO has a high optical transparency in the visible spectral range (ideal for allowing light to pass through to the ZnPc layer) as well as good conductivity on the order of 10-3 ohm-1 cm-1 [7, 8]. AZO and ITO are popular choices as a TCO in optical devices because of their high conductivity and high transparency in the visible spectral range [9, 10]. The work function of a material is the amount of energy needed to remove an electron from that material. AZO was chosen for the front contact because its work function is slightly lower than ITO’s work function (which implies the electrons would rather move towards AZO than ITO). Also, AZO is inexpensive to manufacture because of the abundance of aluminum and zinc; the rarity of indium makes ITO more expensive. However, ITO has a critical advantage over AZO. When heated to temperatures exceeding 400°C, AZO on quartz or borosilicate will crack due to a mismatch of thermal expansions. These cracks cause an increase in resistivity [11].

the university of alabama at birmingham | inquiro • 65
metal TCOorganic inorganic
hybrid solar cell
EVacuum
FermiE
LUMO
HOMO
CB
VB
Figure 1. The general schematic of a hybrid solar cell, as described in the first paragraph. Here, the horizontal axis has units of distance indicating the thickness of the different layers of the semiconductor. The vertical axis has units of energy. Electrons are depicted as blue dots while positive holes are depicted as red dots [3].
Such high temperatures are needed to grow ZnO nanowires. Although the addition of ZnO nanowires will not be investigated in this study, ZnO nanowires grown on the ZnO side of the ZnPc/ZnO interface have been shown to significantly enhance conductivity [11].
As ZnPc crystals grow on a surface such as ZnO, they form a series of parallel columns. However, these columns are not directed perpendicular to the surface. In the α phase of ZnPc, the columns are directed at an angle of 25° to the surface normal. In the β phase, the columns are directed at an angle of about 45°-48° to the surface normal. Therefore, the columns of the α phase are closer to being perpendicular to the ZnO surface than the columns of the β phase [12]. The α and β phases have different absorbance spectra in the ultraviolet-visible spectrum range. This is due to the different distances and intermolecular forces acting between neighboring ZnPc molecules in the ZnPc crystal. Ultraviolet-visible spectroscopy (UV-Vis) is used on solid ZnPc crystal films to analyze an α to β phase change due to heating.
UPS uses a discharge lamp, usually helium emitting photons of energy hν = 21.22 eV, to excite electrons in a material. The electrons from the sample material are excited out of the
sample and the kinetic energy is measured. The kinetic energy of the electron, KE, depends on the energy of the photon, hν, and the binding energy of the electron, BE, by KE = hν-BE. Furthermore, if a bias voltage, VBias, is applied, then the spectra undergo a constant horizontal shift. This will appear in the equation as a negative term, yielding KE = hν-BE-VBias [13]. The area in the spectra of low kinetic energy, or high binding energy (as depicted in Fig. 2) is the secondary electron background which results from electrons losing energy through inelastic scattering before leaving the material [14]. The left most side of the spectra, known as the secondary edge or high binding energy cutoff (HBEC), is where the secondary background ends abruptly [15]. These electrons have just enough energy to make it out of the sample. The work function, WF, is calculated as the difference WF = hν-BEHBEC where BEHBEC is the binding energy associated with the high binding energy cutoff [13].
Besides the work function, another important energy is calculated from UPS spectra. If the material is a metal or TCO, this value is the Fermi edge, EF. If the material is an organic semiconductor, this energy is that of the HOMO level. If the material is an inorganic semiconductor, this value is the valence band maximum, VBM, the highest energy level in the valence band. The Fermi edge, as seen in Fig. 2, is determined by the

66 • inquiro | no. 6 | 2012
low binding energy cutoff (LBEC) on the right side. The LBEC is the sharp cut-off region of the UPS spectra which corresponds to electrons which were measured to have a low binding energy. These are electrons at the surface which escape with a large kinetic energy. Since a semiconductor has non-metallic layers, a semiconductor’s spectra will not have a visible Fermi edge but will instead have a peak of minimum binding energy, corresponding to the HOMO level or the valence band. Due to the relatively low energy used, UPS measures only the valence levels (outer electron orbitals) of a material, not the core levels. UPS measurements are very sensitive to the surface of the material due to the limited mean free path of electrons in this energy range - the average distance traveled by an electron before colliding with another particle. Thus, electrons emitted from the material during UPS measurements can only originate from areas close to the surface [13].
Materials and MethodsPreparationSputtering is the process in which a material is decomposed by the bombardment of high energy particles (such as argon). Thin films may be made by collecting the atoms ejected from this material on some surface. Multiple 100 nm gold films on silicon were prepared by sputtering. Each one was sputtered with pure argon gas at a pressure of 8 Pa and at a rate of 1 nm/s. The gold
was exposed to air while being transferred to the UPS chamber. Several 400 nm AZO films were also sputtered on quartz. AZO was sputtered with pure argon gas with a flow of 6 sccm (standard cubic centimeter per minute) at a pressure of 10-3 mbar. The concentration of aluminum doping is 2% by mass. The AZO films were exposed to air while being transferred to the UPS chamber. ZnO films were likewise sputtered onto ITO/borosilicate with a flow of 6 sccm at a pressure of 10-3 mbar. It was sputtered with a mixed gas of argon and 2 atm% oxygen. Both 100 nm and 200 nm ZnO films were prepared. The ZnO samples also were exposed to air while being transferred to the UPS chamber.
ZnPc films were prepared in a B30 high vacuum evaporation chamber (Oerlikon Leybold Vacuum Dresden GmbH, Germany). The chamber pressure before evaporation varied slightly for each film, ranging from 2 x 10⁻⁵ mbar to 5 x 10⁻⁵ mbar. The chamber pressure during evaporation ranged from 2 x 10⁻⁵ mbar to 20 x 10-5 mbar. Most commonly, the evaporation pressure was about 5 x 10⁻⁵ mbar. Also, the rate of evaporation varied from 0.3 Å/s to 1.0 Å/s (1 Å = 10-10 m) and the temperature at which evaporation began was between 260°C and 280°C. ZnPc films of varying thickness ranging from 1 nm to 100 nm were evaporated on both 100 nm ZnO/ITO/borosilicate and 400 nm AZO/quartz. ZnPc/ZnO will be used to mean ZnPc on 100
binding energy [eV]
elec
tron
inte
nsity
[cts
]
Figure 2. UPS spectra of gold (Au) [15]

the university of alabama at birmingham | inquiro • 67
nm ZnO/ITO/borosilicate and ZnPc/AZO will be used to mean ZnPc on 400 nm AZO/quartz. An oscillating quartz was used to measure film thickness. The measurements were calibrated by measuring the thickness of a 100 nm copper film on silicon with surface profiler Dektak 3030 (Veeco/Sloan, United States). The oscillating quartz was then used to determine the thickness of the ZnPc films by using the density parameter of ZnPc, 1.62 g/cm3.
After performing UPS measurements on all the ZnPc films, some samples were heated and measured again in order to investigate a phase change in ZnPc. Prior to heating, 10 nm ZnPc/AZO and 10 nm ZnPc/ZnO were analyzed in UV-Vis. Then they were heated on a hot plate in an open environment to 350° ± 10°C for 10 min. The heated 10 nm ZnPc films were first measured in the UV-Vis then transferred directly to the UPS for analysis. Also, 50 nm ZnPc/AZO and 50 nm ZnPc/ZnO were measured with UV-Vis then heated on the same hot plate at 325° ± 10°C for 10 min. The heated 50 nm ZnPc films were first measured in the UPS then transferred to the UV-Vis spectrometer for analysis.
Methods and CalculationThe samples were analyzed in the UPS with He(I) (hν=21.22 eV) and He(II) (hν=40.8 eV) excitation [16]. The range of energy analyzed was from 4 eV to 50 eV for all unheated 10 nm and 50 nm ZnPc films, ZnO/ITO/borosilicate, ITO/borosilicate, and AZO/quartz samples, as well as all the Au/Si samples used to calibrate the bias voltage. For the heated 10 nm and 50 nm
ZnPc films and the unheated 1, 2, 3, and 5 nm ZnPc films, the range of the energy analyzed was from 8 eV to 54 eV. The range of energy analyzed changed so that, with a -9 V bias voltage, the He(II) Fermi Edge of the samples, which was shifted from 40.8 eV to roughly 50 eV, would still be clearly visible. The pressure in the UPS chamber varied between 1.7 x 10⁻⁷ and 2.2 x 10⁻⁷ mbar. The UPS data is actually measured in intensity per channel instead of intensity per binding, energy so a correlation between the channels and binding energy needs to be established. Also, the applied bias voltage for that measurement needs to be considered. The appropriate relationship to use is BE = hν-KE-VBias. The He(I) and He(II) Fermi edges of gold spectra are well documented, so these values were used to generate a linear correspondence of the 1,508 channels used in the UPS measurements to binding energy for the energy axis.
The Fermi edge was determined by the same method Olthof used in her dissertation [13]. The value taken for the Fermi edge was the point of intersection between a linear approximation for the low binding energy cutoff and a linear approximation for the baseline as shown in Fig. 2. This method was also used in determining the HOMOonset and valence band maximum. As depicted in Fig. 4, the HOMOonset is the highest energy level of the HOMO energy band while HOMOmax is the most common energy level of the HOMO energy band. The high binding energy cutoff was determined by calculating half of the intensity of the secondary electron background peak and finding the corresponding binding energy as done by Yoshitake [17]. Fig. 2 depicts this method schematically. The work function is then calculated by WF = hν-BEHBEC.
Figure 3. UPS spectra for 10 nm ZnPc/AZO. The HBEC (left) is determined to be the binding energy corresponding to half of the in-tensity of the secondary electron background peak. The HOMOonset (right) is determined to be the point of intersection between a linear approximation for the low binding energy cutoff and a linear approximation for the baseline.

68 • inquiro | no. 6 | 2012
Results and DiscussionThe HOMO and valence band levels of the samples are in good agreement with previously found values in the literature. However, the work function of the samples is consistently lower than expected. The measured work function of the gold samples ranges from 4.17 eV to 4.52 eV with an average of 4.36 eV. According to literature, the work function of gold is between 4.8 eV and 5.2 eV [18, 19]. Considering the value 3.09 eV as an outlier, the measured work function of ZnO ranges from 3.35
eV to 3.53 eV with an average of 3.47 eV. The work function for ZnO on silicon cited in literature is 4.3 eV to 4.5 eV [8]. The average valence band maximum is measured to be 3.14 eV which is close to other reported values of 3.15 eV to 3.25 eV [20, 21]. Thus it seems the right side of the UPS spectra is accurate while the left side is inaccurate. Information could be lost in the bulk peak of the secondary electron background.
Sample Thickness (nm) HOMOonset (eV) HOMOmax (eV) Work Function (eV)
1 n/a n/a 4.032 n/a n/a 4.053 n/a n/a 4.065 -0.62 -1.23 4.31
10 -0.79 -1.29 4.55
Table 1. Optical measurements of various ZnPc films on a gold substrate.
Sample Thickness (nm) HOMOonset (eV) HOMOmax (eV) Work Function (eV)
1 -1.17 -1.75 3.802 -0.93 -1.51 3.623 n/a n/a 3.945 -0.90 -1.47 3.70
10 -1.05 -1.48 3.8450 -1.17 -1.72 3.75
Table 2. Optical measurements of various ZnPc films on an AZO substrate.
Sample Thickness (nm) HOMOonset (eV) HOMOmax (eV) Work Function (eV)
1 n/a n/a 3.592 -0.96 -1.57 3.653 -1.01 -1.66 3.685 -0.91 -1.57 3.87
10 -0.97 -1.45 3.9850 n/a n/a 3.37
Table 3. Optical measurements of various ZnPc films on a ZnO substrate.

the university of alabama at birmingham | inquiro • 69
AZO was measured to have a work function of 3.71 eV. Since the work function of AZO is strongly dependent on the level of aluminum doping and the O/Zn ratio [10], values have been reported as low as 3.7 eV and as high as 4.5 eV [10, 22]. It is generally found that a higher mass % of Al relates to a higher work function. The highest reported mass% of Al is 1.35% which is lower than the measured 2% in this study. The work function found by Jiang et al. corresponding to AZO with mass % of Al at 1.35% is 4.4 eV, which is much higher than the measured work function of 3.71 eV in this study [10]. The O/Zn ratio of the measured AZO sample is unknown.
The average work function of the two measured ITO samples is 3.75 eV. Literature values of ITO’s work function range from 4.1 eV to 5.5 eV, with 4.6 eV and 4.7 eV being the most commonly cited values [23, 24, 25]. The large gap in reported values could be due to the particularly high sensitivity of the ITO surface to the environment.
In general, the low work functions could be due to water, oxygen, or other contaminants on the surfaces. This is likely since the samples were exposed to air while transferring them to the UPS and film surfaces can be very sensitive to environmental exposure. A sputter chamber and surface profiler inside the UPS would resolve this issue since the samples would be able to be prepared and analyzed without leaving a vacuum.
No literature was found containing the work function, HOMOonset, or HOMOmax of ZnPc on ZnO, AZO, or gold. However, ZnPc on ITO is reported to have a work function of 4.14 ± 0.1 eV, HOMOonset at -1.04 ± 0.05 eV, and HOMOmax at -1.49 ± 0.05 eV [4].
As shown in Table 1, the HOMOonset and HOMOmax are not visible for 1, 2, and 3 nm ZnPc films on gold. This is probably due to an incomplete or very thin layer of ZnPc. The work function of ZnPc increased with film thickness. Although the measured work functions are generally low, the relation between the measured work function of ZnPc on gold and the measured work function of gold is interesting. At first, ZnPc lowers the work function of pure gold, but as the layer becomes thicker, the work function actually surpasses gold’s. The work functions of ZnPc films on gold are found to be similar to the work functions found of ZnPc films on ITO. Both HOMO levels of the 5 and 10 nm ZnPc films are lower than those of ZnPc on ITO.
As indicated in Table 2, all ZnPc on AZO films, except the 3 nm film, have a visible HOMOonset and HOMOmax. There is no correlation between the sample thickness and the HOMOonset, HOMOmax or work function. However, the ZnPc on AZO HOMO levels are not only higher than those of ZnPc on gold, they are also in good agreement with those of ZnPc on ITO. The work functions, however, are lower than those of ZnPc on gold and the reported values of ZnPc on ITO.
Figure 4. UPS spectra for various films of ZnPc on 100 nm ZnO. HOMOonset corresponds to the point at which the molecular orbital is first visible while HOMOmax corresponds to the peak.
Figure 5. UV-Vis spectra of 10 nm ZnPc samples before and after heating.

70 • inquiro | no. 6 | 2012
Figure 6. On left, UPS spectra of 10 nm ZnPc samples before and after heating. On right, UPS spectra of heated 10 nm ZnPc samples compared to UPS spectra of the samples’ substrates.
Figure 7. UV-Vis spectra of 50 nm ZnPc samples before and after heating.

the university of alabama at birmingham | inquiro • 71
Figure 8. On left, UPS spectra of 50 nm ZnPc samples before and after heating. On right, UPS spectra of heated 50 nm ZnPc samples compared to UPS spectra of the samples’ substrates.
Figure 9. Band diagram of a solar cell constructed of gold, ZnPc, ZnO and AZO. Blue lines correspond to the lowest unoccupied molecular orbital levels and the red lines correspond to the highest occupied molecular orbital levels and the valence band.

72 • inquiro | no. 6 | 2012
Fig. 4 shows the UPS spectra of various ZnPc films on ZnO while Table 3 shows the numerical values of the measured optical properties. It is clear from the diagram that the HOMO levels are not visible until 2 nm of thickness. As the thickness of the ZnPc layer increases, the HOMO levels become more pronounced and the work function increases from that of ZnO to 3.98 eV.. The work function of ZnPc on ZnO is generally close to that of ZnPc on AZO. Both HOMOonset and HOMOmax are seemingly unrelated to film thickness, but are in good agreement with the HOMO levels found of ZnPc on ITO.
The α and β phases of ZnPc are investigated by heating ZnPc samples on a hot plate in the open air. It is found that the evaporation chamber evaporates ZnPc in the α phase which can be converted to the β phase upon heating. The α and β phases of ZnPc have characteristic UV-Vis peaks. The α phase has an absorbance peak around 630 nm which has a higher intensity than another peak around 700 nm [26]. However, the β phase has a peak around 650 nm which has a lower intensity than the other peak around 750 nm [27]. Both 10 nm ZnPc on AZO and 10 nm ZnPc on ZnO exhibit an α phase before heating as seen in Fig. 5. However, after heating at 350° ± 10°C for 10 min, the peak around 700 nm simply vanishes in both spectra. Furthermore, the UPS spectra of the heated 10 nm ZnPc on AZO and 10 nm ZnPc on ZnO resemble the spectra of their respective substrates. The graph on the left of Fig. 6
shows that the UPS spectra of the heated ZnPc looks quite different from that of the non-heated ZnPc. The graph on the right of Fig. 6 shows that heated ZnPc samples resemble the UPS spectra for that of their respective substrates. This is likely due to interference effects since the films in these samples are relatively thin.
Fig. 7 shows that both 50 nm ZnPc on AZO and 50 nm AZO on ZnO exhibit α phase UV-Vis spectra before heating. After heating at 325° ± 10°C for 10 min, the UV-Vis spectra of these samples resemble the β phase. This supports the previous claim that the 10 nm ZnPc films did not exhibit a phase change because they were relatively thin compared to the 50 nm ZnPc films. Evidence for this explanation is also supported by the UPS spectra on the right side of Fig. 8. Here, the spectra of heated ZnPc films do not resemble to UPS spectra of their respective substrates. The UPS spectra in the left graph of Fig. 8 show a shift in HOMO level of ZnPc on AZO before and after heating. The HOMOonset before heating is -1.17 eV but after heating is -0.52 eV. The HOMOmax before heating is -1.72 eV but after heating is -1.08 eV. The reason for the HOMO shift is unknown. Since the HOMO level of both the heated and unheated ZnPc is higher in energy than the valence band of ZnO, either the α or β phase will work in this hybrid solar cell design. However, the α phase has higher conductivity which makes it more desirable [26].
Figure 10. Band diagram of a solar cell constructed of gold, ZnPc, ZnO and ITO. Blue lines correspond to the lowest unoccupied molecular orbital levels and the red lines correspond to the highest occupied molecular orbital levels and the valence band.

the university of alabama at birmingham | inquiro • 73
ConclusionFigures 9 and 10 show band diagrams for solar cells composed of gold, ZnPc, ZnO, and either AZO or ITO, respectively. Although, ZnPc on ZnO/AZO is not a sample that was investigated, it is included in a separate band diagram because AZO and ITO show similar energy cutoffs in their individual UPS spectra. In fact, the only difference between the two band diagrams, besides the change in labeling from AZO to ITO, is a change in the TCO work function from 3.71 eV to 3.75 eV. Because of the two different work functions measured for bulk ZnPc, one of ZnPc on gold and the other of ZnPc on ZnO, the band diagrams are split into two halves. It is believed that the work function between the two differ by 0.57 eV because of a change in Fermi edge due to different substrates. This is depicted in the diagrams by aligning the vacuum energy and shifting the Fermi energy. However, it could also be due to surface contamination. Since the HOMO levels have no correlation with film thickness like the work function does, the HOMO levels in the band diagrams are determined by the average of the HOMOonset measurements. The LUMO and conduction bands are predicted by using band gap values taken from literature. These values are assumed in the band diagrams.
The band diagrams indicate that the solar set-up is feasible. The diagrams show a decreasing energy level from the ZnPc LUMO level, to the ZnO conduction band, to the TCO (AZO or ITO) Fermi edge. As depicted in the general hyrbid solar cell schematic, Fig. 1, this allows for the excited electron to move from the organic layer to the TCO. Also, the increase in energy from the ZnPc HOMO level to gold’s Fermi edge allows for the hole to move towards the metal. Since the valence band of ZnO is lower in energy than the HOMO level on ZnPc, the hole is kept from moving towards the TCO.
However, more investigation needs to be done before precise conclusions can be made. Primarily, the reason for the work functions being consistently lower than expected needs to be investigated further. Since in situ UPS experiments are impossible to perform with the available equipment, it is difficult to resolve whether or not it is due to surface contamination. If the problem persists, perhaps a low temperature scanning tunneling microscope could be used to confidently determine any correlation between levels of surface contamination and differences in work function. Also, it should be established whether AZO or ITO is best to use for the TCO. It may be that a combination of the two, ZnO/AZO/ITO, is the best option. Although it would not be the cheapest design, the ITO may prevent the AZO from cracking while the AZO would provide a low work function contact with ZnO.
References1. S. Günes, N. S. Sariciftci. Hybrid Solar Cells. Inorg. Chim. Acta 361 (2008), 581-588.
2. E. Arici, N. S. Sariciftci, D. Meissner. Hybrid solar cells. Encyclopedia of Nanoscience and Nonotechnology 3, 929- 944.
3. This graphic was provided by Michael Kozlik.
4. Y. Gassenbauer, A. Klei. Electronic and chemical properties of tin-doped indium oxide (ITO) surfaces and ITO/ZnPc interfaces studied in-situ by photoelectron spectroscopy. J. Phys. Chem. B 110 (2006), 4793-4801.
5. C. Hein, E. Mankel, T. Mayer, W. Jaegermann. Engineering the electronic structure of the ZnPc/C60 heterojunction by temperature treatment. Solar Energy Materials & Solar Cells 94 (2010), 662-667.
6. S. H. Park et. al. The electronic structure of C60 /ZnPc interface for organic photovoltaic device with blended layer architecture. Appl. Phys. Lett. 96 (2010), 013302.
7. R. B. Lal, G. M. Arnett. Effect of Ultra-violet irradiation on the electrical conductivity of zinc oxide single crystals. Nature (1965), no. 5017, 1305.
8. K. B. Sundaram, A. Khan. Work function determination of zinc oxide films. J. Vac. Sci. Technol. A 15 (1997), no. 2, 428- 430.
9. H. Zhou et. al. Preparation of aluminum doped zinc oxide films and the study of their mircostructure, electrical and optical properties. Thin Solid Films 515 (2007), 6909-6914.
10. X. Jiang, F. L. Wong, M. K. Fung, S. T. Lee. Aluminum- doped zinc oxide films as transparent conductive electrode for organic light-emitting devices. Appl. Phys. Lett. 83 (2003), no. 9, 1875-1877.
11. S. Möller, Wachstum. von senkrechten ZnO-Nanodrähten auf verschiedenen Glassubstraten. Institut für Festkörperphysik auf Friedrich-Schiller-Universität Jena (2010).
12. F. Iwatsu. Size effects on the α-β Transformation of Phthalocyanine Crystals. J. Phys. Chem. 92 (1988), 1678- 1681.
13. S. S. Olthof. Photoelectron spectroscopy on doped organic semiconductors and related interfaces. Dissertation, Technische Universität Dresden (2010).
14. R. Schlaf. Calibration of photoemission spectra and work function determination. Dept. of Electrical Engineering at the University of South Florida. Retrieved from http://rsl.eng.usf.edu/ Documents/Tutorials/PEScalibration.pdf. June 08, 2011

74 • inquiro | no. 6 | 2012
15. R. Schlaf. Tutorial on Work Function. Dept. of Electrical Engineering at the University of South Florida. Retrieved from http://rsl. eng.usf.edu/Documents/Tutorials/TutorialsWorkFunction.pdf. June 08, 2011
16. D. Comdei, A. R. Zanatta, F. Alvarez, I. Chambouleyron, Photoelectron spectroscopy of shallow core levels using HeII (40.8) excitation. J. Vac. Sci. Technol. A 13 (1995), no. 4, 2278-2280.
17. M. Yoshitake. Principle and practical tips of work function measurement using UPS, XPS, and AES instruments. Hyomen Kagaku 28 (2007), no. 7, 397-401.
18. P. A. Anderson. Work function of gold. Phys. Rev. 115 (1959), no. 3, 553-554.
19. W. N. Hansen, K. B. Johnson. Work function measurements in gas ambient. Surf. Sci. 316 (1994), 373- 382.
20. B Carlson, K. Leschkies, E. S. Aydil, X. Y. Zhu. Valence band alignment at cadmium selenide quantum dot and zinc oxide interfaces. J. Phys. Chem. C 112 (2008), 8419-8423.
21. K. Sawada, Y. Shirotori, K. Ozawa, K. Edamoto, M. Nakatake. Valence band structure of the ZnO surface studied by angle-resolved photoemission spectroscopy. Appl. Surf. Sci. 237 (2004), 343-347.
22. K. Schulze et. al. Organic solar cells on indium tin oxide and aluminum doped zinc oxide anodes. Appl. Phys. Lett. 91 (2007), 073521.
23. F. Nesch, L. J. Rothberg, E. W. Forsythe, Q. T. Le, Y. Gao. A photoelectron spectroscopy study of the indium tin oxide treatment by acids and bases. Appl. Phys. Lett. 74 (1999), no. 6, 880-882.
24. Y. Park, V. Choong, Y. Gao, B. R. Hsieh, C. W. Tang. Work function of indium tin oxide transparent conductor measured by photoelectron spectroscopy. Appl. Phys. Lett. 68 (1996), no. 19, 2699-2701.
25. S. W. Tong, K. M. Lau, H. Y. Sun, M. K. Fung, C. S. Lee, Y. Lifshitz, S. T. Lee. Ultraviolet photoelectron spectroscopy investigation of interface formation in an indium-tin oxide/ fluorocarbon/organic semiconductor contact. Appl. Surf. Sci. 252 (2006), 3806-3811.
26. M. Kozlik, S. Paulke, M. Gruenewald, R. Forker, T. Fritz. Determination of the optical constants of α and β zinc (II) phthalocyanine films. Organic Electronics (2012) accepted.
27. L. Gaffo, M. R. Cordeiro, A. R. Freitas, W. C. Moreira, E. M. Girotto, V. Zucolotto. The effects of temperature on the molecular orientation of zinc phthalocyanine films. J. Mater. Sci. 45 (2010), 1366-1370.
Special thanks to Prof. Dr. Torsten Fritz, Michael Kozlik, and the FSU Festkörperphysik department for their hospitality.
Authors’ AddressesJoseph OlsonDepartment of Mathematics, University of Alabama at Birmingham, Birmingham, AL [email protected]
Michael KozlikInstitut für Festkörperphysik, Friedrich-Schiller-Universität, Jena, Germany [email protected]
Prof. Dr. Torsten FritzInstitut für Festkörperphysik, Friedrich-Schiller-Universität, Jena, Germany [email protected]

the university of alabama at birmingham | inquiro • 75
student feature
Ahmed and Gray named 2012 Barry M. Goldwater ScholarsMiranda Collier
Amiya Ahmed and Kenneth Gray, both juniors from Birmingham, were awarded 2012 Goldwater Scholarships by the Barry M. Goldwater Excellence in Education Foundation. The award recognizes outstanding achievement and potential of students who wish to pursue research careers in the natural sciences, engineering or mathematics.
Amiya, who is double majoring in molecular biology and philosophy and minoring in chemistry, has been involved in research since high school. He began working in the lab of his father, Dr. Ali Ahmed, in the UAB Center for Aging, where he studied the predictors of in-hospital mortality for nursing home residents. His projects evolved to include other aspects of geriatric health, including the impact of prior smoking and income on propensity for cardiovascular disease. Amiya has also researched under Dr. Trygve Tollefsbol in the Department of Biology, where he focused on methods of breast cancer treatment.
However, his experiences are not limited to the classroom and the lab. In addition to his involvement in the University Honors Program and the Biology Scholars Program, Amiya serves on Inquiro’s Editorial Board and works at the McWane Science Center giving science demonstrations to younger students. He also feels drawn toward opportunities that enhance his exposure to worldwide cultures, working as an International Mentor to help foreign students transition to life at UAB and serving as Executive Vice President for the UAB Multicultural Council.
“I have strong ties to Bangladesh, where my parents grew up,” explains Ahmed. “I hope to train talented and motivated young people from developing countries in research.” To this end, he plans to obtain a combined M.D./Ph.D. degree and specialize in pediatric oncology at a leading medical research university. His parents’ experiences and support have provided strong motivation for his life and career choices. “[They] have inspired me to pursue my passions and dedicate my life to help others,” he says.
Kenneth, a molecular biology major with minors in chemistry and Spanish, studies protein signaling in relation to glioblastoma and breast cancer. He works in the lab of Dr. Etty (Tika) Benvineste, Chair of the Department of Cell, Developmental and Integrative Biology, where he investigates how the kinase CK2 regulates JAK/STAT3 and NF-κB pathways by using a very specific
synthetic CK2 inhibitor called CX-4945, which is currently in Phase II clinical trials. Kenneth hopes to continue his training in translational research and earn a Ph.D. in biomedical science. Currently, he is on track to earn an M.S. in Biology with certificates in Global Health Studies and Translational and Molecular Science in addition to his B.S. degree in May 2014.
Besides his studies, Kenneth is involved in various organizations on campus. He is a member of the Honors College Student Executive Council and is Director Emeritus, formerly Director, of the UAB Regional Science Olympiad Tournament for high school students. He is also a Teaching Assistant for honors leadership courses and a Research Ambassador for the newly formed Undergraduate Research Association, a position involving mentorship of younger students who are starting research at UAB.
Kenneth’s ultimate goal is to become a professor researching therapeutically exploitable cancer cell signaling, and he says he has been fortunate to be influenced by a lot of strong role models. “For example, Dr. Benvineste is the embodiment of everything I want my career to be,” he says. “She maintains and leads a lab with a dozen members researching multiple sclerosis and cancer, and even with everything she does, she is completely tireless and has no plans of ever slowing down. I think if I could be half as successful as her, I would be content.”
Amiya Ahmed
Kenneth Gray

76 • inquiro | no. 6 | 2012
2013 Inquiro Submission GuidelinesAny UAB undergraduate student participating in scientific research and/or any undergraduate student participating in research at UAB is invited to submit a manuscript to be considered for publication in the 2013 issue of Inquiro. Papers will be subject to student and faculty review.
The deadline for submission is October 9, 2013; however, students participating in summer research at UAB or another institution are encouraged to submit by August 31, 2013.
The journal accepts submissions in the following categories:
Short reports: Short research papers give a brief overview of a project and are comparable to the content of science posters. The suggested length is 1000-2000 words.
Long papers: Long research papers result from more substantial projects. The suggested length is 2500-4000 words.
Research Narratives: These are editorial or narrative pieces related to scientific research. Faculty and students will review the article and consider it based on relevance and quality. The suggested length is 600-800 words.
Initial submissions should follow these guidelines:
1. Research papers should include a title, the full name(s) and affiliation(s) of the author(s), and the following sections: Abstract, Introduction, Materials and Methods, Results, Discussion, Conclusion, and References. References should be in APA format. Specific guidelines for each section will be posted on our website over the summer.
2. Research papers should be written in third person. Research narratives should be written in first person.
3. Research papers should be submitted as Microsoft Word documents, double spaced and formatted in 12 pt Times New Roman font. Pages should be numbered with the first author’s name appearing in a header on every page.
4. Figures, tables and graphs should be submitted in their original formats in the highest resolution possible. They may be submitted as separate files or embedded in the text of the document in the locations in which the author would like them to appear in a published version. If submitted separately, please indicate in the manuscript where the figures should appear.
5. A completed Permission to Publish form must be submitted with all research papers. The form can be found on our website.
Please send submissions, questions or comments to [email protected]. Students who wish to join the Inquiro staff may also contact the editors at this address.
For more information or to view previous publications, visit our website at uab.edu/inquiro.
Authors retain all rights to their submitted work, except to publish in another undergraduate science journal. Inquiro is an internal document of the University of Alabama at Birmingham.

the university of alabama at birmingham | inquiro • 77
inquiro staffCo-Editors
Rachael Rosales Rachael Rosales is a senior in the Early Medical School Acceptance Program and University Honors Program.
She will graduate with a B.S. in Biology and a B.A. in Philosophy. At UAB, she conducted public health and medical
ethics research. She will start medical school this year, and she plans to pursue a career in primary care.
Miranda Collier Miranda is a junior pursuing a B.S. in Biochemistry with minors in Mathematics and Biology. She is in the
University Honors Program, is a Chemistry Scholar, and is Co-Chair of the Undergraduate Research Organization.
She is interested in attending graduate school and one day teaching while conducting biochemical research.
Assistant EditorChapin Cavender Chapin is a sophomore pursuing a B.S. in Physics with a concentration in Biophysics and minors in Biology,
Chemistry, and Mathematics. He is a member of the University Honors Program, the Undergraduate Student
Government Association, and the Undergraduate Research Association. He works for Dr. Molly Bray in the
Department of Epidemiology at UAB since August 2011 on the TIGER study, which examines the influence of
genetics on response to an exercise protocol. He plans to participate in an MD/PhD program.
Staff Writers
Amiya Ahmed Amiya is a junior double who is majoring in Molecular Biology and Philosophy with a minor in Chemistry. He is
a member of the University Honors Program and the Biology Scholars Program. Amiya works at the McWane
Science Center as a facilitator, teaching science to middle school children. He also researches geriatrics and
heart failure with the UAB Center for Aging and hopes to pursue a career as a physician-scientist.
Sadhvi Batra Sadhvi is a junior majoring in Neuroscience and Philosophy. She plans on pursuing a career in medicine after
graduation. In her free time she enjoys writing and going on adventures with her friends.

78 • inquiro | no. 6 | 2012
inquiro staffNaveed FarrukhNaveed is a junior Neuroscience major who is also pursuing his Master’s in Public Health with a concentration
in Healthcare Organization and Policy. He hopes to one day be a physician but also work with the government
on healthcare policy. Seattle is a nice city in his mind, and, apart from oxygen, he also breathes a significant
amount of European football (aka soccer).
Timothy Fernandez Timothy is a senior double majoring in Biochemistry and Molecular Biology. He is in the University Honors
Program and is a Chemistry Scholar. Currently, he is researching protein interactions in the Fas-mediated
apoptosis pathway for which he received one of UAB’s first Beckman Scholarships. Outside of research, he
is a member of UAB’s Table Tennis Team. He will attend medical school in Fall 2013 upon completion of his
undergraduate degrees.
Pooja Gajare Pooja is currently a junior at UAB. She is a member of the University Honors Program as well as the Early Medical
School Acceptance Program. She enjoys helping make Inquiro an excellent publication.
Nikhita Jain Nikhita is a junior international studies major, with a concentration in Latin American awareness. She is on the
pre-medical track and aspires to pursue a specialty involving pediatric medicine. She is currently a research
assistant in a neurology lab of the Department of Pediatrics. Her project involves studying the roles that various
precursor proteins play in neural development within neonates. Nikhita also serves as a UAB Ambassador and a
member of the sorority Alpha Gamma Delta. She is in the Early Medical Acceptance Program and the University
Honors program.
Paul Lee Paul is a junior in the Science and Technology Honors program. He currently does research with Dr. Chattopadhyay
of the Department of Medicine on the parasite Cryptosporidium parvum. He is investigating the biochemical
properties of its pyruvate kinase enzyme.
Roxanne Lockhart Roxanne is a sophomore pursuing a B.S. in Molecular Biology with minors in Chemistry and Japanese. She
is a member of the University Honors Program. Roxanne has worked with Dr. Candace Floyd, a professor and
researcher in the Physical Medicine and Rehabilitation Department, for three years and is currently studying the
effect of N-acetylglucosamine and opioid abuse on post-traumatic brain injury. Roxanne plans to enter medical
school in the fall of 2015.

the university of alabama at birmingham | inquiro • 79
Anum Muzaffar Anum is a junior who is majoring in Biology and minoring in Chemistry and Public Health. She is part of the
University Honors Program and is doing research under Dr. Amsler in the Department of Biology, investigating
the role of temperature on Antarctic algae. She is also doing research under the guidance of Dr. James Galbraith
in the Emergency Medicine Department at UAB Hospital. In the future, she hopes to pursue a career in medicine.
Grace NixGrace is a sophomore studying Neuroscience with an expected Biology minor. She is in the University Honors
Program and is currently working in Dr. Rita Cowell’s lab in the Department of Psychiatry and Behavioral
Neurobiology on a research project involving Tourette’s phenotypes. She is interested in staying in the medical
field, but unsure what avenue within medicine.
Sope OguntuyoSope is a senior majoring in Molecular Biology and minoring in Chemistry and History. He is a member of the
Science and Technology Honors Program and co-director of the Alabama Brain Bee. His current independent
research project focuses on developing a novel means to classify mycobacteriophage. In the future, Sope hopes
to combine his medical and research interests to improve patient care.
Harsh ShahHarsh is a junior in the University Honors Program and Biology Honors Program. He is pursuing a Bachelors
in Biology and a Master’s in Public Health. Harsh conducts research in the UAB Department of Biology on
alternative, natural treatments of breast cancer cells. When Harsh is not a Teaching Assistant in the Biology
Department he like to play tennis, dance, and catch up on some sleep.
Ramya SingireddyRamya is a third-year UAB student and aspires to attend medical school after her undergraduate years. She is a
member of the EMSAP program and the undergraduate Neuroscience program. Ramya is currently conducting
Traumatic Brain Injury research under Dr. Hubert Tse. In addition, she was a member of UAB’s Phage Genomics
program her sophomore year. She is a native Californian and enjoys writing, dance, and watching movies.

80 • inquiro | no. 6 | 2012
Without the help and support of UAB faculty and staff, the vision of Inquiro could not have been made a reality. Many thanks to the following individuals:
2012 Faculty Reviewers:Dr. Aaron CatledgeDr. Jim CollawnDr. Vithal GhantaDr. Tracy HamiltonDr. Douglas R. HurstDr. Eugenia KharlampievaDr. Robert KestersonDr. Baldeep KhareDr. Changzhao LiDr. Thomas NordlundDr. Peter O’NeilDr. Dana PetersonDr. Sunil RangarajanDr. Nicole RiddleDr. Cynthia RyanDr. Vikram SainiDr. Yogesh VohraDr. R. Douglas WatsonDr. Lowell Wenger
Dr. Mike Sloane and the University Honors Program
Dr. Diane Tucker and the Science and Technology Honors Program
Ryan McAnulty, UAB Printing Solutions (production and printing)
A special thanks toDr. Suzanne Austin, Vice Provost for Student and Faculty Success, and Nick Bieser, Coordinator for Undergraduate Research.
The production and publication of this journal was made possible through the funding supplied by the Office for Student and Faculty Success of the University of Alabama at Birmingham.

the university of alabama at birmingham | inquiro • 81
Inquiro © 2012
The rights to the papers published in
this work are retained by the authors.
Authors may publish their work in any
other media, with the exception of
another undergraduate publication.
This is an internal document of
Front cover art: “Emulsions”Likhitha Pathivada
Senior, Biomedical Engineering
Inside cover art: “Anatomy of a Peasant”Sarah AdkinsSophomore, Biology
inquiro staff 2012

82 • inquiro | no. 6 | 2012
Volume 6 • 2012
T H E U N I V E R S I T Y O F A L A B A M A A T B I R M I N G H A M
Volume 6 • 2012Volume 6 • 2012
TH
E U
NIV
ER
SIT
Y O
F A
LA
BA
MA
AT
BIR
MIN
GH
AM
Volu
me 6 • 2012


![Volume Analysis [13th June, 2012]](https://img.pdfslide.us/doc/110x75/55c36438bb61eb94498b4894/volume-analysis-13th-june-2012.jpg)