Embed Size (px)
Citation preview
Dalton TransactionsAn international journal of inorganic chemistry
rsc.li/dalton
Volume 50Number 4321 November 2021Pages 15443-15936
ISSN 1477-9226
PAPER Andrew G. Tennyson et al. An organometallic catalase mimic with exceptional activity, H 2 O 2 stability, and catalase/peroxidase selectivity
Anniversary VolumeAnniversary Volume
DaltonTransactions
PAPER
Cite this: Dalton Trans., 2021, 50,15493
Received 17th June 2021,Accepted 23rd August 2021
DOI: 10.1039/d1dt02002a
rsc.li/dalton
An organometallic catalase mimic withexceptional activity, H2O2 stability, andcatalase/peroxidase selectivity†
Zhuomin Lu,a Ian V. Lightcapb and Andrew G. Tennyson *‡a,c,d
Manganese–porphyrin and –salen redox therapeutics catalyze redox reactions involving O2•−, H2O2, and
other reactive oxygen species, thereby modulating cellular redox states. Many of these complexes
perform catalase reactions via high-valent Mn–oxo or –hydroxo intermediates that oxidize H2O2 to O2,
but these intermediates can also oxidize other molecules (e.g., thiols), which is peroxidase reactivity.
Whether catalase or peroxidase reactivity predominates depends on the metal–ligand set and the local
environment, complicating predictions of what therapeutic effects (e.g., promoting vs. suppressing apop-
tosis) a complex might produce in a given disease. We recently reported an organoruthenium complex
(Ru1) that catalyzes ABTS•− reduction to ABTS2− with H2O2 as the terminal reductant. Given that H2O2 is
thermodynamically a stronger oxidant than ABTS•−, we reasoned that the intermediate that reduced
ABTS•− would also be able to reduce H2O2 to H2O. Herein we demonstrate Ru1-catalyzed H2O2 dispro-
portionation into O2 and H2O, exhibiting an 8,580-fold faster catalase TOF vs. peroxidase TOF, which is
89.2-fold greater than the highest value reported for a Mn–porphyin or –salen complex. Furthermore,
Ru1 was 120-fold more stable to H2O2 than the best MnSOD mimic (TON = 4000 vs. 33.4) Mechanistic
studies provide evidence that the mechanism for Ru1-catalyzed H2O2 disproportionation is conserved
with the mechanism for ABTS•− reduction. Therapeutic effects of redox catalysts can be predicted with
greater accuracy for catalysts that exhibit exclusively catalase activity, thereby facilitating the development
of future redox therapeutic strategies for diseases.
Introduction
Catalases are metalloenzymes that catalyze the disproportiona-tion of H2O2 into H2O and 1
2 O2,1 whereas peroxidases catalyze
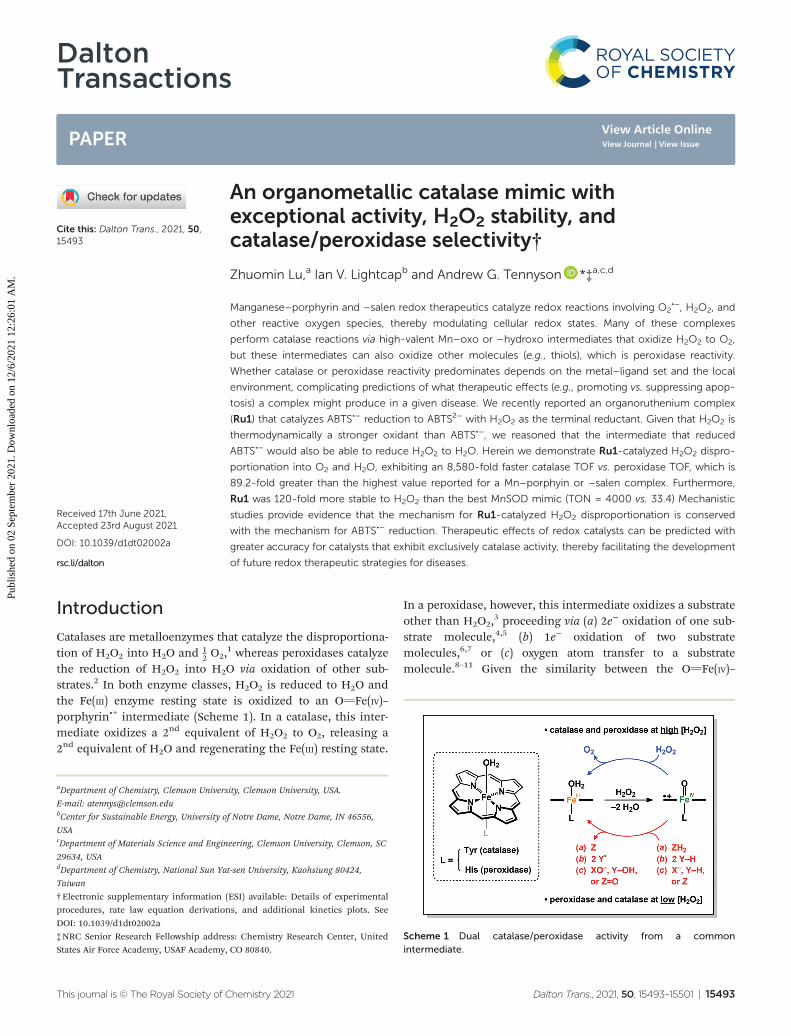
the reduction of H2O2 into H2O via oxidation of other sub-strates.2 In both enzyme classes, H2O2 is reduced to H2O andthe Fe(III) enzyme resting state is oxidized to an OvFe(IV)–porphyrin•+ intermediate (Scheme 1). In a catalase, this inter-mediate oxidizes a 2nd equivalent of H2O2 to O2, releasing a2nd equivalent of H2O and regenerating the Fe(III) resting state.
In a peroxidase, however, this intermediate oxidizes a substrateother than H2O2,
3 proceeding via (a) 2e− oxidation of one sub-strate molecule,4,5 (b) 1e− oxidation of two substratemolecules,6,7 or (c) oxygen atom transfer to a substratemolecule.8–11 Given the similarity between the OvFe(IV)–
Scheme 1 Dual catalase/peroxidase activity from a commonintermediate.
†Electronic supplementary information (ESI) available: Details of experimentalprocedures, rate law equation derivations, and additional kinetics plots. SeeDOI: 10.1039/d1dt02002a‡NRC Senior Research Fellowship address: Chemistry Research Center, UnitedStates Air Force Academy, USAF Academy, CO 80840.
aDepartment of Chemistry, Clemson University, Clemson University, USA.
E-mail: [email protected] for Sustainable Energy, University of Notre Dame, Notre Dame, IN 46556,
USAcDepartment of Materials Science and Engineering, Clemson University, Clemson, SC
29634, USAdDepartment of Chemistry, National Sun Yat-sen University, Kaohsiung 80424,
Taiwan
This journal is © The Royal Society of Chemistry 2021 Dalton Trans., 2021, 50, 15493–15501 | 15493
Publ
ishe
d on
02
Sept
embe
r 20
21. D
ownl
oade
d on
12/
6/20
21 1
2:26
:01
AM
.
View Article OnlineView Journal | View Issue
porphyrin•+ intermediates in catalase and peroxidase, it isunsurprising that catalase can exhibit peroxidase reactivity at asufficiently low [H2O2],
12 or that peroxidase can exhibit cata-lase reactivity at sufficiently high [H2O2].
13
Synthetic Mn complexes supported by porphyrin and salenligands, designed as manganese superoxide dismutase(MnSOD) mimics, catalyze the disproportionation of O2
•− intoO2 and H2O2.
14–19 However, these Mn–porphyrin and –salencomplexes also catalyze the disproportionation of H2O2 intoH2O and 1
2 O2,19,20 which is unsurprising given that a Mn
complex able to reduce O2 to O2•− (E′0 = –0.33 V vs. NHE)21 will
likewise be able to reduce H2O2 to 2 H2O (E′0 = –1.35 V).22
Because the latter reduction is more thermodynamically favor-able, many of the Mn–porphyrin and –salen complexes thatare capable of MnSOD activity are also intrinsically capable ofcatalase activity.
As is observed with catalase itself, some Mn–salen andMn–porphyrin complexes that (a) exhibit catalase activity canalso (b) exhibit peroxidase activity,23,24 such as oxidizingABTS2− to ABTS•− (Scheme 2A).25–32 Even non-biomimetic Mncomplexes will toggle between catalase activity33 vs. peroxidaseactivity34 upon simple ligand modification (e.g., R = Me vs.t-Bu). Thus, a single Mn complex is capable of producingeither antioxidant or pro-oxidant effects in a given biologicalenvironment, with its behavior being determined by themetal–ligand set and the local conditions. For example, theMn–porphyrin complexes that have entered clinical trials can(i) promote cancer cell death by shifting cellular redox states tomore oxidized potentials,35,36 or (ii) promote normal cell survi-val during radiotherapy by shifting cellular redox states tomore reduced potentials.37,38 Both outcomes are highly ben-eficial to patients and illustrate the enormous therapeuticpotential for complexes capable of both catalase and peroxi-dase activity. However, it is difficult to predict in advance
which reactivity mode will predominate in a given biologicalenvironment.
Our lab developed an organoruthenium complex (Ru1,Scheme 2B) that can catalytically reduce ABTS•− to ABTS2− byoxidizing biologically-relevant alcohols as the terminalreductants.39–41 We recently demonstrated that Ru1 can alsoharness H2O2 as a terminal reductant, generating O2(g) and aRu–H intermediate, and the latter can then reduce 2 equiv. ofABTS•− to ABTS2− (Scheme 2C, top).42 Because the ABTS•−/2−redox couple occurs at +0.68 V,43 and the standard reductionpotential for H2O2 to 2 H2O is much higher (+1.35 V),22 wereasoned that a Ru1-derived intermediate capable of reducing2 ABTS•− to 2 ABTS2− will also be capable of reducing the morestrongly-oxidizing H2O2 to 2 H2O, thus exhibiting catalaseactivity (Scheme 2C, bottom). Moreover, given that Ru1 canuse H2O2 to reduce ABTS•− to ABTS2−, we reasoned that Ru1would show little to no oxidation of ABTS2− to ABTS•− withH2O2, with this latter reaction being a spectroscopically-con-venient probe for peroxidase reactivity.
Herein we report the catalytic disproportionation of H2O2
into H2O and 12 O2 by Ru1 with values for catalase TOF = 1.09
s−1, catalase TON ≥ 4000, and catalase/peroxidase selectivity =8580, which are individually 11.9-, 120-, and 89.2-fold greater,respectively, than the highest values reported44 for the Mn–porphyrin and Mn–salen MnSOD mimics.19,20,23–32 Using acombination of catalase TOF, catalase TON, and catalase/per-oxidase selectivity values, the aggregated functionality of Ru1as a catalase mimic is 14 200-fold higher than the best-per-forming synthetic MnSOD mimic.
Results and discussionCatalase and peroxidase reactivity
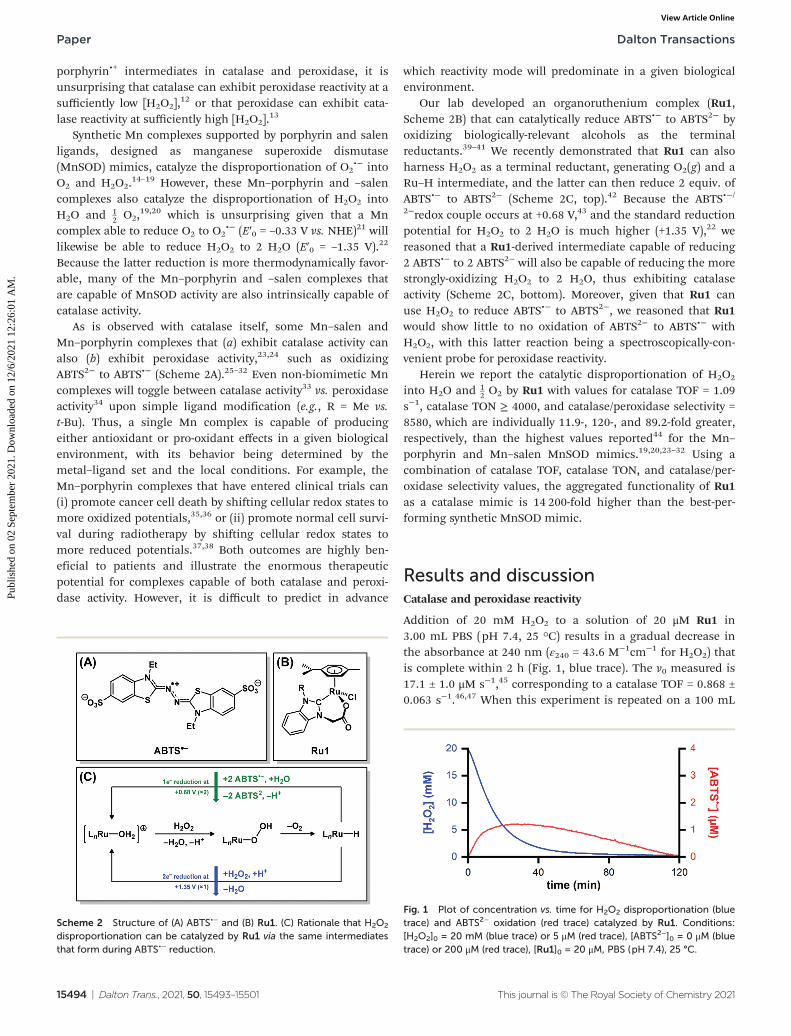
Addition of 20 mM H2O2 to a solution of 20 μM Ru1 in3.00 mL PBS (pH 7.4, 25 °C) results in a gradual decrease inthe absorbance at 240 nm (ε240 = 43.6 M−1cm−1 for H2O2) thatis complete within 2 h (Fig. 1, blue trace). The v0 measured is17.1 ± 1.0 μM s−1,45 corresponding to a catalase TOF = 0.868 ±0.063 s−1.46,47 When this experiment is repeated on a 100 mL
Scheme 2 Structure of (A) ABTS•− and (B) Ru1. (C) Rationale that H2O2
disproportionation can be catalyzed by Ru1 via the same intermediatesthat form during ABTS•− reduction.
Fig. 1 Plot of concentration vs. time for H2O2 disproportionation (bluetrace) and ABTS2− oxidation (red trace) catalyzed by Ru1. Conditions:[H2O2]0 = 20 mM (blue trace) or 5 μM (red trace), [ABTS2−]0 = 0 μM (bluetrace) or 200 μM (red trace), [Ru1]0 = 20 μM, PBS (pH 7.4), 25 °C.
Paper Dalton Transactions
15494 | Dalton Trans., 2021, 50, 15493–15501 This journal is © The Royal Society of Chemistry 2021
Publ
ishe
d on
02
Sept
embe
r 20
21. D
ownl
oade
d on
12/
6/20
21 1
2:26
:01
AM
. View Article Online
scale, to facilitate quantification of O2(g) evolution, 1.04 ±0.02 mmol of O2(g) is collected, corresponding to a TON =1000 and in good agreement with the 25 mL theoreticalvolume if every 1.0 equivalent of H2O2 that was consumed pro-duced 0.5 equiv. of O2(g). Four successive 20 mM aliquots ofH2O2 added every 2 h are all completely consumed by 20 μMRu1 in PBS, yielding a minimum catalase TON = 4000 for Ru1.Headspace gas sampling to a thermocouple detector confirmsthat 100% of the evolved gas was O2(g). In situ mass spectro-metric analysis of these H2O2 disproportionation reactionsreveals the same intermediates as those in Ru1-catalyzedABTS•− reduction with H2O2.
42
To assess potential peroxidase activity of Ru1, 100 μM ABTS2−
is introduced to a PBS solution containing 20 μM Ru1 followed bythe addition of 5 μM H2O2. The 4 : 1 Ru1/H2O2 ratio is chosen tomaximize coordination of H2O2 to Ru1 and minimize the amountof free H2O2 in solution available to undergo disproportionationby any Ru1/H2O2 derived species. The 20 : 1 ABTS2−/H2O2 ratiowas selected such that any Ru1/H2O2 derived species would be
significantly more likely to encounter ABTS2− than H2O2, thusfavoring oxidation of ABTS2− (peroxidase reactivity) over dispro-portionation of H2O2 (catalase reactivity).
When 5 μM H2O2 is added to a solution of 20 μM Ru1 and100 μM ABTS2− in PBS, the absorbance at 734 nm (character-istic for ABTS•−)48 gradually increases, reaching a maximumof 1.69 ± 0.13 μM after 28 min, and then gradually decays tozero over the course of 2 h (Fig. 1, red trace). The v0measured is 2.54 ± 0.03 nM s−1, corresponding to a peroxi-dase TOF = 1.27 ± 0.01 × 10⁻⁴ s−1. Dividing the catalase TOFby the peroxidase TOF yields the catalase/peroxidase selecti-vity ratio (C/P), which for Ru1 (at 20 μM) is 6830. Notably,5 μM H2O2 should have been sufficient to oxidize 10 μMABTS2− to 10 μM ABTS•−, but a maximum of only 1.69 ±0.13 μM ABTS•− forms under these conditions, whichdemonstrates that only 17% of the total H2O2 is consumedby peroxidase reactivity, even under conditions designed tomaximize peroxidase reactivity, and the remaining 83% isconsumed by catalase reactivity.
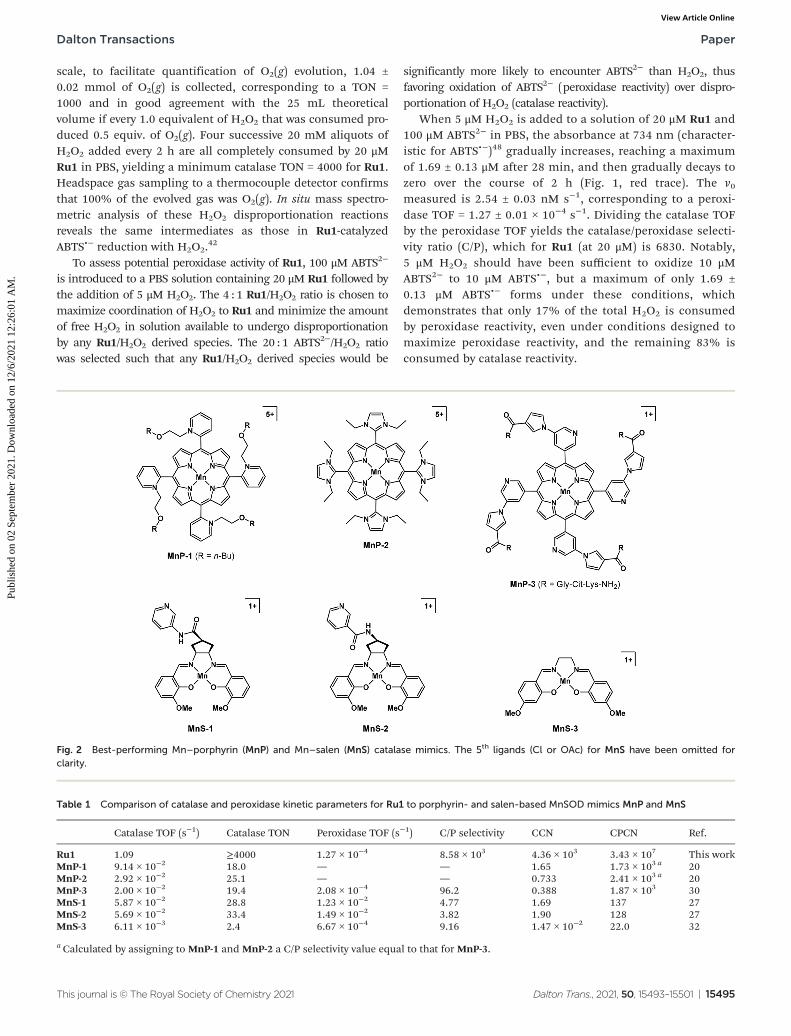
Table 1 Comparison of catalase and peroxidase kinetic parameters for Ru1 to porphyrin- and salen-based MnSOD mimics MnP and MnS
Catalase TOF (s−1) Catalase TON Peroxidase TOF (s−1) C/P selectivity CCN CPCN Ref.
Ru1 1.09 ≥4000 1.27 × 10⁻⁴ 8.58 × 10³ 4.36 × 10³ 3.43 × 10⁷ This workMnP-1 9.14 × 10⁻² 18.0 — — 1.65 1.73 × 10³ a 20MnP-2 2.92 × 10⁻² 25.1 — — 0.733 2.41 × 10³ a 20MnP-3 2.00 × 10⁻² 19.4 2.08 × 10⁻⁴ 96.2 0.388 1.87 × 10³ 30MnS-1 5.87 × 10⁻² 28.8 1.23 × 10⁻² 4.77 1.69 137 27MnS-2 5.69 × 10⁻² 33.4 1.49 × 10⁻² 3.82 1.90 128 27MnS-3 6.11 × 10⁻³ 2.4 6.67 × 10⁻⁴ 9.16 1.47 × 10⁻² 22.0 32
a Calculated by assigning to MnP-1 and MnP-2 a C/P selectivity value equal to that for MnP-3.
Fig. 2 Best-performing Mn–porphyrin (MnP) and Mn–salen (MnS) catalase mimics. The 5th ligands (Cl or OAc) for MnS have been omitted forclarity.
Dalton Transactions Paper
This journal is © The Royal Society of Chemistry 2021 Dalton Trans., 2021, 50, 15493–15501 | 15495
Publ
ishe
d on
02
Sept
embe
r 20
21. D
ownl
oade
d on
12/
6/20
21 1
2:26
:01
AM
. View Article Online
Catalase and peroxidase activities of Ru1 were measuredagain at 10 μM to match the concentrations employed instudies of Mn-based catalase mimics. At [Ru1]0 = 10 μM, thecatalase and peroxidase v0 values are 10.6 ± 0.5 μM s−1 and1.27 ± 0.12 nM s−1, respectively (Fig. S1†), corresponding to acatalase TOF = 1.09 ± 0.13 s−1, a peroxidase TOF = 1.27 ± 0.12 ×10⁻⁴ s−1, and a C/P = 8580 (Table 1). For comparison, MnP-1(Fig. 2) has the highest catalase activity (TOF = 9.14 × 10⁻²
s−1)20 of the porphyrin-based MnSOD mimics, which is 11.9-fold lower than Ru1. The highest catalase TON value achievedis 25.1 with MnP-2, 159-fold lower than Ru1. Using oxidationof ABTS2− to ABTS•− as the measure of peroxidase activity,MnP-3 exhibited the highest catalase/peroxidase selectivity(C/P = 96.2),30 which is 89.2-fold lower than Ru1.
Among the salen-based MnSOD mimics,49 MnS-1 has thehighest reported catalase TOF (5.87 × 10⁻² s−1),32 which is18.6-fold lower than Ru1. The highest catalase TON is 33.4 forMnS-2, 120-fold lower than Ru1. The best catalase selectivityamong the Mn-salen MnSOD mimics is observed with MnS-3(C/P = 9.16), which is 937-fold lower than Ru1. Porphyrin- andsalen-based MnSOD mimics have been reported to exhibitperfect catalase selectivity (i.e., zero peroxidase activity withnonzero catalase activity),29,32 but they suffer from poor H2O2
stability (TON < 3), which could indicate that the observed cat-alase reactivity is non-catalytic.
The catalase activity, H2O2 stability, and catalase/peroxidaseselectivity values for Ru1 are each greater than the highest indi-vidual value among the MnSOD mimics (11.9-, 120-, and 89.2-fold greater, respectively). However, this understates the per-formance of Ru1 as a whole relative to each individual Mncomplex in its totality. If we define a “catalase comparisonnumber” (CCN) as catalase TOF × catalase TON, the CCN forRu1 (4360) is 2290-fold higher than the best-performing Mn-based complex MnS-2 (CCN = 1.90). If we divide CCN by per-oxidase TOF to account for any competing peroxidase activity,i.e., CPCN = catalase TON × C/P, the CPCN for Ru1 (3.75 × 10⁷)is 14 200-fold higher than for MnP-2 (CPCN = 2.41 × 10³).Thus, not only are each individual catalase activity, H2O2 stabi-lity, and C/P value for Ru1 greater than the highest reportedvalues for Mn–porphyrin and –salen MnSOD mimics by 1–2orders of magnitude, the overall catalase performance of Ru1as a whole is 3–4 orders of magnitude greater than the best-performing MnSOD mimics.
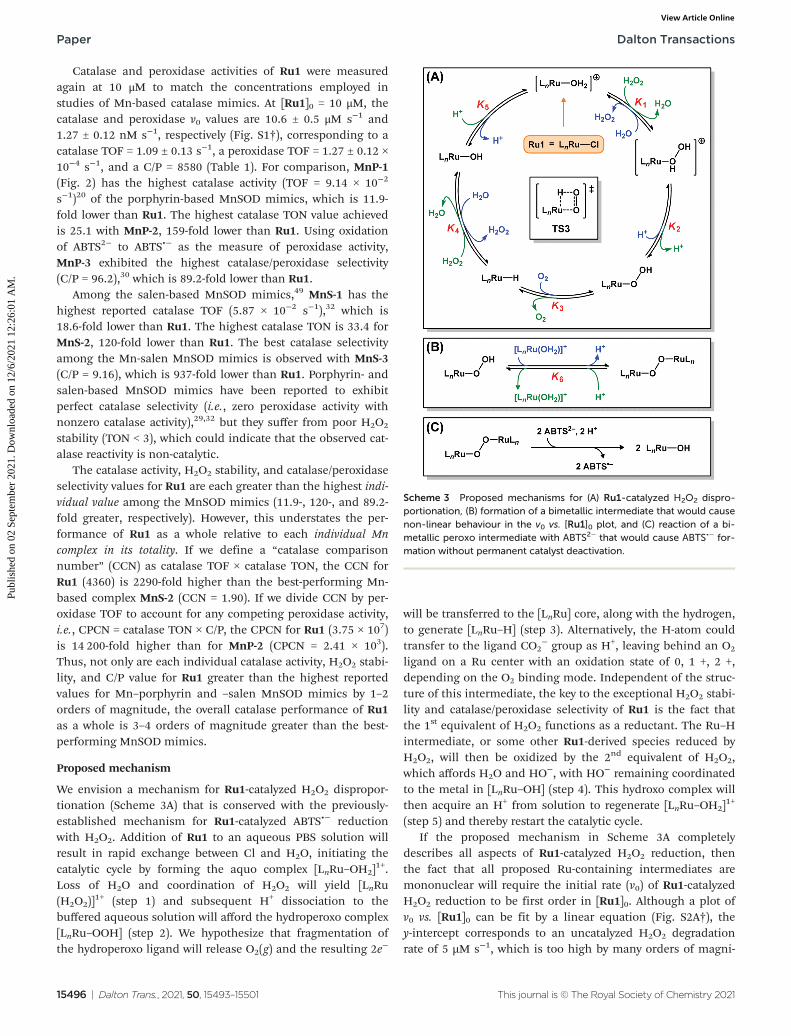
Proposed mechanism
We envision a mechanism for Ru1-catalyzed H2O2 dispropor-tionation (Scheme 3A) that is conserved with the previously-established mechanism for Ru1-catalyzed ABTS•− reductionwith H2O2. Addition of Ru1 to an aqueous PBS solution willresult in rapid exchange between Cl and H2O, initiating thecatalytic cycle by forming the aquo complex [LnRu–OH2]
1+.Loss of H2O and coordination of H2O2 will yield [LnRu(H2O2)]
1+ (step 1) and subsequent H+ dissociation to thebuffered aqueous solution will afford the hydroperoxo complex[LnRu–OOH] (step 2). We hypothesize that fragmentation ofthe hydroperoxo ligand will release O2(g) and the resulting 2e−
will be transferred to the [LnRu] core, along with the hydrogen,to generate [LnRu–H] (step 3). Alternatively, the H-atom couldtransfer to the ligand CO2
− group as H+, leaving behind an O2
ligand on a Ru center with an oxidation state of 0, 1 +, 2 +,depending on the O2 binding mode. Independent of the struc-ture of this intermediate, the key to the exceptional H2O2 stabi-lity and catalase/peroxidase selectivity of Ru1 is the fact thatthe 1st equivalent of H2O2 functions as a reductant. The Ru–Hintermediate, or some other Ru1-derived species reduced byH2O2, will then be oxidized by the 2nd equivalent of H2O2,which affords H2O and HO−, with HO− remaining coordinatedto the metal in [LnRu–OH] (step 4). This hydroxo complex willthen acquire an H+ from solution to regenerate [LnRu–OH2]
1+
(step 5) and thereby restart the catalytic cycle.If the proposed mechanism in Scheme 3A completely
describes all aspects of Ru1-catalyzed H2O2 reduction, thenthe fact that all proposed Ru-containing intermediates aremononuclear will require the initial rate (v0) of Ru1-catalyzedH2O2 reduction to be first order in [Ru1]0. Although a plot ofv0 vs. [Ru1]0 can be fit by a linear equation (Fig. S2A†), they-intercept corresponds to an uncatalyzed H2O2 degradationrate of 5 µM s−1, which is too high by many orders of magni-
Scheme 3 Proposed mechanisms for (A) Ru1-catalyzed H2O2 dispro-portionation, (B) formation of a bimetallic intermediate that would causenon-linear behaviour in the v0 vs. [Ru1]0 plot, and (C) reaction of a bi-metallic peroxo intermediate with ABTS2− that would cause ABTS•− for-mation without permanent catalyst deactivation.
Paper Dalton Transactions
15496 | Dalton Trans., 2021, 50, 15493–15501 This journal is © The Royal Society of Chemistry 2021
Publ
ishe
d on
02
Sept
embe
r 20
21. D
ownl
oade
d on
12/
6/20
21 1
2:26
:01
AM
. View Article Online
tude. Forcing the linear equation to have a y-intercept of zeroresults in a poor match between the fit and data (Fig. S2B†).
We reasoned that dimerization of a Ru-containing speciescan potentially, and reversibly, generate a catalytically-incom-petent intermediate, where (a) low [Ru1]0 leads to negligibledimer formation and thus v0 will increase with [Ru1]0 in 1 : 1fashion, but then (b) high [Ru1]0 leads to significant dimer for-mation and v0 will thus increase with [Ru1]0 in less than 1 : 1fashion. We propose [{LnRu}2(μ1,2-O2)] as the most likely bi-metallic intermediate, which would be formed via reaction of[LnRu–OOH] with [LnRu–OH2]
1+ (Scheme 3B).Although [LnRu–OH2]
1+ could itself dimerize to generatespecies such as [{LnRu}2(μ-OH)]1+ or [{LnRu}2(μ-O)], we believethe 1000-fold excess of H2O2 relative to Ru1 results in the con-centration of [LnRu–OOH] being significantly higher than[LnRu–OH2]
1+, which will favor the formation of [{LnRu}2(μ1,2-O2)] (step 6, Scheme 3B) over [{LnRu}2(μ-OH)]1+ or [{LnRu}2(μ-O)]. Furthermore, the greater Ru⋯Ru distance afforded by theμ1,2-O2 bridging ligand will result in [{LnRu}2(μ1,2-O2)] being alower energy species due to reduced steric clashing between Lnsets compared to [{LnRu}2(μ-OH)]1+ and [{LnRu}2(μ-O)], whichfeature shorter Ru⋯Ru distances due to the shorter μ-OH andμ-O bridging ligands.
Additionally, the formation of [{LnRu}2(μ1,2-O2)] offers apathway through which Ru1 can exhibit 1e− peroxidase-likereactivity without the Ru-containing species being irreversiblyshunted off the dominant catalase cycle. Specifically, the peroxobond in [{LnRu}2(μ1,2-O2)] can be reduced by 2 equiv. of ABTS2−
and acquire 2 H+ from the buffered solution to form 2 equiv. of[LnRu–OH] (Scheme 3C). As shown in Scheme 3A, [LnRu–OH] isan intermediate that participates in the catalase cycle.
In other complexes, moieties such as Ru–H, Ru–OOH, andRu–O–O–Ru can exhibit characteristic features observable by1H NMR, IR, and Raman spectroscopy.50–55 However, thesetechniques require mM concentrations (or higher), but Ru1has limited solubility (ca. 1 mM) in water-miscible organic sol-vents. Furthermore, the Ru1-catalayzed H2O2 disproportiona-tion reaction shuts down when the volume % of H2O in thereaction solution drops below 70%. Thus, 300 μM is thehighest Ru1 concentration that can be achieved in aqueoussolution that still affords catalytic H2O2 disproportionation.We were unable to detect any Ru–H, Ru–OOH, or Ru–O–O–Ruintermediates (or any other Ru1-derived intermediates) in theRu1-catalyzed H2O2 disproportionation reaction using 1HNMR, IR, and Raman spectroscopy, due to the inability toaccess analyte concentrations above 300 μM.
Rate law derivation
To test the validity of the proposed mechanism for H2O2 dis-proportionation catalyzed by Ru1, including the [LnRu–OOH]⇌ [{LnRu}2(μ1,2-O2)] branch, we derived the general rate lawand measured v0 as a function of [Ru1]0, [H2O2]0, and [H+].Steps 1, 2, 5, and 6 are relatively simple equilibria described byequilibrium constants K1, K2, K5, and K6, respectively(Scheme 3A and B). From our prior mechanistic investigationsof Ru1-catalyzed ABTS•− reduction with H2O2, we reasoned
that elimination of O2 from [LnRu–OOH] (step 3, Scheme 3A)would be turnover-limiting and effectively irreversible (k3 ≪ k4and k3 ≫ k–3). The pKa values reported for other [LnRu–OH2]
1+
complexes range from 9–10, therefore we reasoned that proto-nation of LnRu–OH to generate [LnRu–OH2]
1+ (step 5,Scheme 3A) would be faster than the formation of LnRu–OH,which would render step 4 effectively irreversible as well (k5 ≫k4 and k5 ≫ k–4).
One turnover of the proposed catalytic cycle in Scheme 3Arequires the consumption of 2 equiv. of H2O2, with the 1st
equiv. being consumed during turnover-limiting formation of[LnRu–H] (step 3) and the 2nd equiv. being consumed uponreaction with the [LnRu–H] (step 4, Scheme 3A). The time-dependent change in [H2O2] can thus be described by eqn (1):
� d½H2O2�dt
¼ k4 H2O2½ �½RuH� ð1Þ
The time-dependent concentration of [LnRu–H], abbreviatedas [RuH], is unknown and cannot be measured directly. It istherefore necessary to express [RuH] as a function of knownvariables and constants. This expression can be determinedusing (i) the equilibrium equations for steps 1, 2, 5, and 6, (ii)the steady-state first-derivative equation for [RuH], and (iii) theconstraint that the sum of the concentrations of all Ru-con-taining species must be equal to [Ru1]0. Using this approach,we can describe [RuH] as a function of [Ru1]0, [H2O2]0, and[H+]0. However, the formation of [{LnRu}2(μ1,2-O2)] (step 6,Scheme 3B) introduces a non-linear term to the equation relat-ing [Ru1]0 to [RuH]:
½Ru1�0 ¼ F1 � ½RuH�2 þ F2 � ½RuH� ð2Þ
The derivation of eqn (2) and the full expressions for F1, afunction of [H2O2]0, and F2, a function of both [H2O2]0 and[H+]0, can be found in the ESI (eqn (S1–S9)†). Because theexpression for [Ru1]0 contains both [RuH]2 and [RuH] terms,solving for [RuH] requires using the quadratic equation (eqn(S10–S13)†), which yields a non-linear relationship between[RuH] and [Ru1]0:
½RuH� ¼ �F2 þffiffiffiffiffiffiffiffiffiffiffiffiffiffiffiffiffiffiffiffiffiffiffiffiffiffiffiffiffiffiffiffiffiffiffiF22 þ 4F1 � ½Ru1�0
p2F1
ð3Þ
The “±” operator in the numerator of eqn (S12)† simplifiesto “+” in eqn (3) because equilibrium constants and rate con-stants cannot be negative, and thus having a “–” operatorwould have resulted in a negative value for [RuH], which isphysically impossible. Plugging eqn (3) into eqn (1) (eqn (S14–S17)†) affords an expression (eqn (4)) for the rate of H2O2 con-sumption as a function of [Ru1], [H2O2], and [H+], where G1 isa constant:
� d½H2O2�dt
¼ G1 � �F2 þffiffiffiffiffiffiffiffiffiffiffiffiffiffiffiffiffiffiffiffiffiffiffiffiffiffiffiffiffiffiffiffiffiffiffiF22 þ 4F1 � ½Ru1�0
q� �ð4Þ
Measuring the rate of H2O2 consumption at very shorttimes (v0) allows the time-dependent [H2O2] and [H+] terms inF1 and F2 to be replaced with the known constants [H2O2]0 and
Dalton Transactions Paper
This journal is © The Royal Society of Chemistry 2021 Dalton Trans., 2021, 50, 15493–15501 | 15497
Publ
ishe
d on
02
Sept
embe
r 20
21. D
ownl
oade
d on
12/
6/20
21 1
2:26
:01
AM
. View Article Online
[H+]0, respectively (eqn (S18)†). By varying the initial concen-tration of only one of Ru1, H2O2, or H
+, but holding the othertwo concentrations constant, eqn (3) simplifies to a single-vari-able function relating v0 (as the y-variable) to [Ru1]0, [H2O2]0,or [H+]0 (as the x-variable). If [Ru1]0 is varied but [H2O2]0, or[H+]0 are held constant (eqn (S19–S22)†), the general rate lawpredicts the plot of v0 vs. [Ru1]0 will follow eqn (5). If [H2O2]0 isvaried but [Ru1]0 and [H+]0 are held constant (eqn (S23–S26)†),the plot of v0 vs. [H2O2]0 will follow eqn (6). If [H+]0 is variedbut [Ru1]0 and [H2O2]0 are held constant (eqn (S27–S30)†), theplot of v0 vs. [H2O2]0 will follow eqn (7). Note that a, b, and care constants in eqn (5–7) and [Ru1]0 is a constant in eqn (6)and (7).
y ¼ ðcÞ½�bþ ðb 2 þ 4axÞ1=2� ð5Þ
y ¼ ðdÞ½�bx� cþ fðbxþ cÞ2 þ 4a½Ru1�0 � xg1=2� ð6Þ
y ¼ ðdÞ �bx� cþ f bxþ cð Þ2þ4a½Ru1�0g1=2h i
ð7Þ
Analysis of reaction kinetics
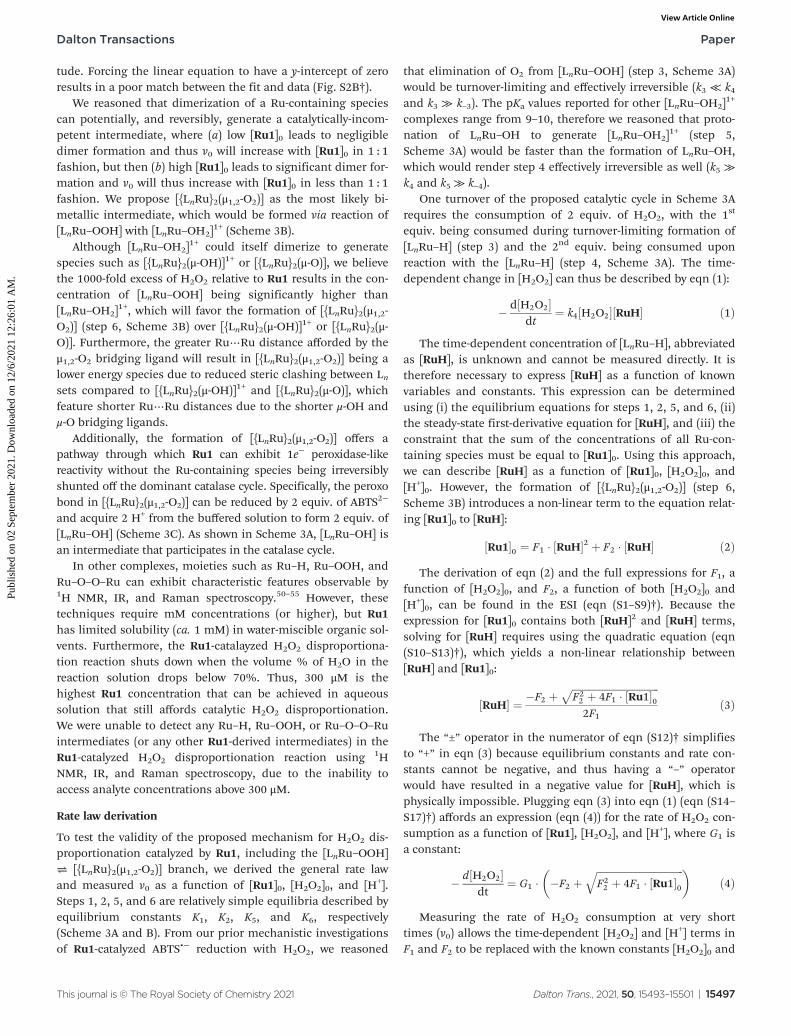
To fit the experimental v0 vs. [Ru1]0 data and not predict toohigh a rate of H2O2 consumption in the absence of Ru1, eqn(5) should produce a trace that (i) has a more positive slopefrom [Ru1]0 = 0 to 10 μM than at higher concentrations and (ii)increases roughly linearly from [Ru1]0 = 10 to 40 μM. Anoverlay of the eqn (5) trace (grey line, Fig. 3A) on the plot ofexperimental v0 vs. [Ru1]0 data (black crosses, Fig. 3A) showsthat eqn (5) accurately describes the experimental data andsatisfies the aforementioned constraints. If [Ru1]0 is very low,then [{LnRu}2(μ1,2-O2)] formation is negligible, and v0 increaseswith [Ru1]0 in roughly 1 : 1 fashion (i.e., the mechanismfollows Scheme 3A with negligible contribution byScheme 3B). As [Ru1]0 increases, more [{LnRu}2(μ1,2-O2)] forms,which decreases the relative amount of total Ru available toparticipate in the catalase cycle, and v0 increases with [Ru1]0in less than 1 : 1 fashion (i.e., the mechanism follows a combi-nation of the steps in Scheme 3A and B).
The plot of v0 vs. [H2O2]0 (Fig. 3B) shows v0 increasing withincreasing [H2O2]0, but with a shallower slope at higher[H2O2]0 values, behavior which can be accurately modeled byeqn (6). The shallower slope at higher [H2O2]0 reflects the factthat H2O2 coordinates to Ru before the turnover-limiting step(i.e., step 1, Scheme 3A). At sufficiently high [H2O2], the equili-brium in step 1 saturates and v0 cannot increase any further.
Conversely, v0 decreases as [H+]0 increases, with the slopeshallower at higher [H+]0 values (Fig. 3C), whereby the variationin the v0 vs. [H
+]0 experimental data can be accurately modeledby eqn (7). The general trend of greater v0 values at lower [H+]0arises because H+ dissociation must occur (step 2, Scheme 3A)before the turnover-limiting step (step 3, Scheme 3A). Thediminishing impact of increasing [H+]0 on v0 at higher valuesreflects the fact that step 2 is an equilibrium process.
Although the rate law equations that describe the [H2O2]0and [H+]0 dependencies of Ru1-catalyzed H2O2 disproportiona-
tion differ significantly from Ru1-catalyzed ABTS•− reductionwith H2O2, the general trends are similar, which suggests thatthe mechanism for the former reaction is partially conservedwith the latter. The most noteworthy difference is that Ru1does catalyze H2O2 disproportionation in pure H2O, but Ru1cannot catalyze ABTS•− reduction with H2O2 in pure H2O. Theorigin of this is that Ru1-catalyzed ABTS•− reduction with H2O2
generates a net 2 equiv. of H+ from each turnover of the cata-lytic cycle. A lack of buffer would mean that the H+ releasedwould decrease the pH of the reaction solution to the pointthat the rate of Ru1-catalyzed ABTS•− reduction with H2O2
becomes negligible. In contrast, Ru1-catalyzed H2O2 dispropor-tionation releases 1 equiv. of H+ to solution in step 2(Scheme 3A), but then acquires 1 equiv. of H+ from solution instep 5, with no net H+ generation or consumption during cata-lytic cycle turnover.
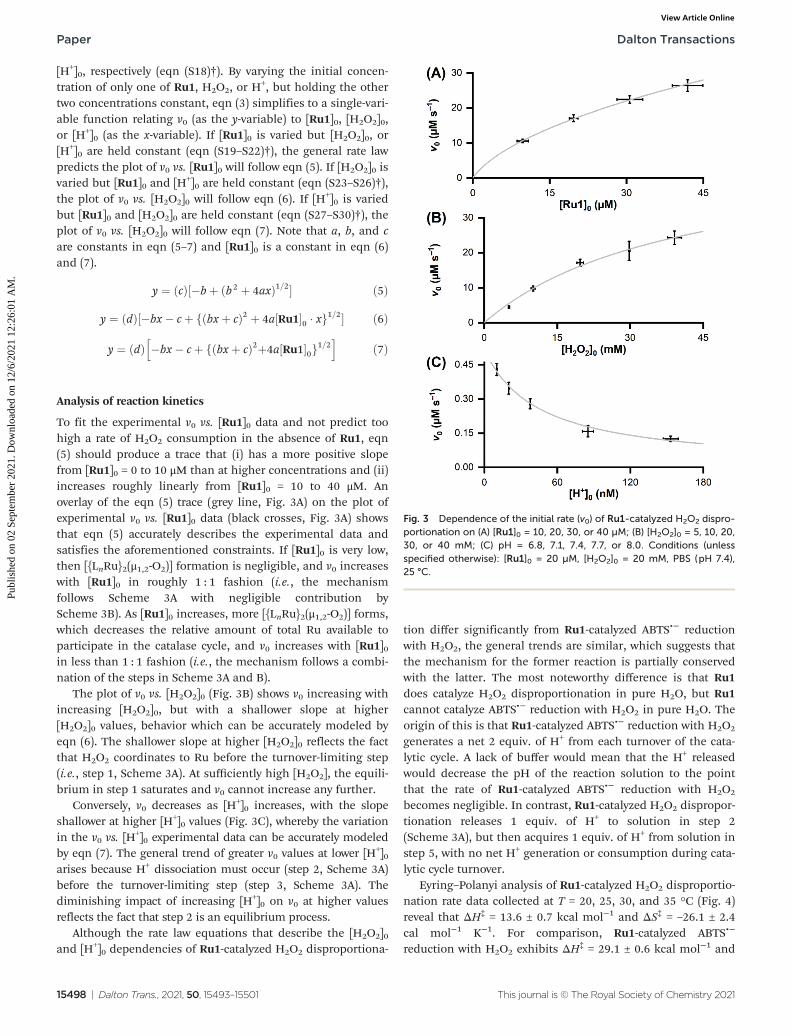
Eyring–Polanyi analysis of Ru1-catalyzed H2O2 disproportio-nation rate data collected at T = 20, 25, 30, and 35 °C (Fig. 4)reveal that ΔH‡ = 13.6 ± 0.7 kcal mol−1 and ΔS‡ = –26.1 ± 2.4cal mol−1 K−1. For comparison, Ru1-catalyzed ABTS•−
reduction with H2O2 exhibits ΔH‡ = 29.1 ± 0.6 kcal mol−1 and
Fig. 3 Dependence of the initial rate (v0) of Ru1-catalyzed H2O2 dispro-portionation on (A) [Ru1]0 = 10, 20, 30, or 40 µM; (B) [H2O2]0 = 5, 10, 20,30, or 40 mM; (C) pH = 6.8, 7.1, 7.4, 7.7, or 8.0. Conditions (unlessspecified otherwise): [Ru1]0 = 20 µM, [H2O2]0 = 20 mM, PBS (pH 7.4),25 °C.
Paper Dalton Transactions
15498 | Dalton Trans., 2021, 50, 15493–15501 This journal is © The Royal Society of Chemistry 2021
Publ
ishe
d on
02
Sept
embe
r 20
21. D
ownl
oade
d on
12/
6/20
21 1
2:26
:01
AM
. View Article Online
ΔS‡ = 25.5 ± 1.9 cal mol−1 K−1. Notably, the ΔS‡ value for Ru1-catalyzed H2O2 disproportionation is comparable in magni-tude but opposite in sign to the value for Ru1-catalyzed ABTS•−
reduction with H2O2, which indicates significant differences intransition state structures and properties. Indeed, all our pre-vious studies of Ru1-catalyzed ABTS•− reduction, with anyterminal reductant, revealed positive ΔS‡ values.
A large, negative ΔS‡ value for Ru1-catalyzed H2O2 dispro-portionation can be rationalized by the reaction of the Ru–Hintermediate with H2O2 (step 4, Scheme 3A). Because one OHgroup from H2O2 is transferred to Ru to yield the Ru–OH inter-mediate, then the corresponding transition state most likelyfeatures an associative interaction between H2O2 and Ru–H,potentially including H-bonding or direct coordination, whichwould give rise to the large, negative ΔS‡ value for Ru1-cata-lyzed H2O2 disproportionation. In contrast, the reaction of theRu–H intermediate with ABTS•− in Ru1-catalyzed ABTS•−
reduction with H2O2 involves 1e− transfer from Ru–H toABTS•−. A large, positive ΔS‡ value for this process suggestsouter-sphere electron transfer and coupling to the precedingstep, fragmentation of Ru–OOH into Ru–H and O2. The larger,positive ΔH‡ value for Ru1-catalyzed ABTS•− reduction withH2O2 likely reflects the fact that a negatively-charged electronmust be removed from a neutral Ru–H intermediate and separ-ated from the resulting cationic species, and then must betransferred to an already negatively-charged ABTS•− molecule,both of which are energetically-unfavorable due to coulombiceffects. In contrast, both H2O2 and the Ru–H intermediate areneutral, therefore unfavorable coulombic effects are absent.
Conclusions
This report constitutes to the best of our knowledge the firstinstance of an organometallic complex that functions as a cata-lase mimic (i.e., catalyzes the reaction H2O2 → H2O + 1
2 O2),which is surprising given that catalytic H2O2 disproportiona-tion has been reported for a multitude of non-organometalliccomplexes comprising a wide variety of metals.56–63 A similarlyrich diversity of peroxidase model complexes also exists.64–72
Compared to existing redox therapeutics, namely theMn–porphyrin and –salen complexes initially developed to
mimic MnSOD, Ru1 exhibits dramatically higher catalaseactivity, H2O2 stability, and catalase/peroxidase selectivity thanthe highest individual values reported for the MnSOD mimics(11.9-, 120-, and 89.2-fold greater, respectively). When thesevalues are aggregated for each complex, the overall perform-ance of Ru1 as a catalase mimic is 4 orders of magnitudesuperior to any Mn–porphyrin or –salen biomimetic complex.
A major focus area of research involving Ru complexes inliving systems is harnessing their cytotoxic effects for anti-cancer applications,73–81 but there is some evidence that Rucomplexes can harm or kill non-cancer cells.82 Interestingly,one report describes a non-organometallic Ru complex withanticancer effects that inhibits the activities of endogenouscatalases.83 Preliminary studies of Ru1 in RAW 264.7 cellsrevealed that concentrations of Ru1 up to 100 μM are non-cytotoxic.
Given that the catalase activity of Ru1 is nearly 9000-foldfaster than its peroxidase activity, its reactivity as a redox thera-peutic will be almost exclusively antioxidant, with minimalpro-oxidant reactivity. This selectivity will significantlydecrease uncertainty when investigating the behavior of Ru1 inbiological systems. Furthermore, the much greater catalaseactivity and H2O2 stability of Ru1 will enable it to alleviate sig-nificantly more severe and longer lasting oxidative stress inliving systems than current Mn–porphyrin or Mn–salen com-plexes. The ability of Ru1 to prevent or alleviate biological oxi-dative stress will be detailed in a subsequent report.
Conflicts of interest
There are no conflicts to declare.
Acknowledgements
This work was supported by the US National ScienceFoundation (DMR-1555224). We thank Dr. Yamin Htet forprior work with Ru1 and for helpful discussions.
Notes and references
1 P. Chelikani, I. Fita and P. C. Loewen, Cell. Mol. Life Sci.,2004, 61, 192–208.
2 H.-P. Hersleth, U. Ryde, P. Rydberg, C. H. Görbitz andK. K. Andersson, J. Inorg. Biochem., 2006, 100, 460–476.
3 M. Zámocký, S. Hofbauer, I. Schaffner, B. Gasselhuber,A. Nicolussi, M. Soudi, K. F. Pirker, P. G. Furtmüller andC. Obinger, Arch. Biochem. Biophys., 2015, 574, 108–119.
4 D. W. S. Wong, Appl. Biochem. Biotechnol., 2009, 157, 174–209.
5 T. Ishikawa and S. Shigeoka, Biosci. Biotechnol. Biochem.,2008, 72, 1143–1154.
6 J. E. Erman and L. B. Vitello, Biochim. Biophys. Acta, 2002,1597, 193–220.
Fig. 4 Eyring–Polanyi plot of ln(k/T ) vs. 1/T at T = 20, 25, 30, and 35 °C.Conditions: [Ru1]0 = 20 µM, [H2O2]0 = 20 mM, PBS (pH 7.4).
Dalton Transactions Paper
This journal is © The Royal Society of Chemistry 2021 Dalton Trans., 2021, 50, 15493–15501 | 15499
Publ
ishe
d on
02
Sept
embe
r 20
21. D
ownl
oade
d on
12/
6/20
21 1
2:26
:01
AM
. View Article Online
7 L. S. Harman, D. K. Carver, J. Schreiber and R. P. Mason,J. Biol. Chem., 1986, 261, 1642–1648.
8 C. Delporte, K. Z. Boudjeltia, P. G. Furtmüller, R. A. Maki,M. Dieu, C. Noyon, M. Soudi, D. Dufour, C. Coremans,V. Nuyens, F. Reye, A. Rousseau, M. Raes, N. Moguilevsky,M. Vanhaeverbeek, J. Ducobu, J. Nève, B. Robaye,L. Vanhamme, W. F. Reynolds, C. Obinger andP. V. Antwerpen, J. Biol. Chem., 2018, 293, 6374–6386.
9 A. Taurog, M. L. Dorris and D. R. Doerge, Arch. Biochem.Biophys., 1996, 330, 24–32.
10 M. Hofrichter and R. Ullrich, Appl. Microbiol. Biotechnol.,2006, 71, 276–288.
11 R. Z. Harris, S. Newmyer and P. R. Ortiz de Montellano,J. Biol. Chem., 1993, 268, 1637–1645.
12 H. N. Kirkman and G. F. Gaetani, Trends Biochem. Sci.,2007, 32, 44–50.
13 J. Vlasits, C. Jakopitsch, M. Bernroitner, M. Zamocky,P. G. Furtmüller and C. Obinger, Arch. Biochem. Biophys.,2010, 500, 74–81.
14 I. Batinic-Haberle, A. Tovmasyan and I. Spasojevic, RedoxBiol., 2015, 5, 43–65.
15 I. Batinic-Haberle, A. Tovmasyan, E. R. H. Roberts,Z. Vujaskovic, K. W. Leong and I. Spasojevic, Antioxid.Redox Signaling, 2014, 20, 2372–2415.
16 S. Miriyala, I. Spasojevic, A. Tovmasyan, D. Salvemini,Z. Vujaskovic, D. St. Clair and I. Batinic-Haberle, Biochim.Biophys. Acta, 2012, 1822, 794–814.
17 I. Batinic-Haberle, Z. Rajic, A. Tovmasyan, J. S. Reboucas,X. Ye, K. W. Leong, M. W. Dewhirst, Z. Vujaskovic, L. Benovand I. Spasojevic, Free Radicals Biol. Med., 2011, 51, 1035–1053.
18 I. Batinić-Haberle, J. S. Rebouças and I. Spasojević,Antioxid. Redox Signaling, 2010, 13, 877–918.
19 R. A. Rosenthal, K. D. Huffman, L. W. Fisette,C. A. Damphousse, W. B. Callaway, B. Malfroy andS. R. Doctrow, JBIC, J. Biol. Inorg. Chem., 2009, 14, 979–991.
20 A. Tovmasyan, C. G. C. Maia, T. Weitner, S. Carballal,R. S. Sampaio, D. Lieb, R. Ghazaryan, I. Ivanovic-Burmazovic, G. Ferrer-Sueta, R. Radi, J. S. Reboucas,I. Spasojevic, L. Benov and I. Batinic-Haberle, Free RadicalsBiol. Med., 2015, 86, 308–321.
21 All potentials are reported relative to NHE unless specifiedotherwise.
22 P. M. Wood, Biochem. J., 1988, 253, 287–289.23 D. K. Ali, M. Oriowo, A. Tovmasyan, I. Batinic-Haberle and
L. Benov, Redox Biol., 2013, 1, 457–466.24 J.-Y. Liu, X.-F. Li, Z.-X. Guo, Y.-Z. Li, A.-J. Huang and
W.-B. Chang, J. Mol. Catal. A: Chem., 2002, 179, 27–33.25 R. Kubota, T. Takabe, K. Arima, H. Taniguchi, S. Asayama
and H. Kawakami, J. Mater. Chem. B, 2018, 6, 7050–7059.26 A. Squarcina, A. Sorarù, F. Rigodanza, M. Carraro,
G. Brancatelli, T. Carofiglio, S. Geremia, V. Larosa,T. Morosinotto and M. Bonchio, ACS Catal., 2017, 7, 1971–1976.
27 Y. Noritake, N. Umezawa, N. Kato and T. Higuchi, Inorg.Chem., 2013, 52, 3653–3662.
28 S. Meftah and R. Yazdanparast, Iran. J. Chem. Chem. Eng.,2013, 32, 67–75.
29 V. Oliveri, A. Puglisi and G. Vecchio, Dalton Trans., 2011,40, 2913–2919.
30 N. Umezawa, N. Matsumoto, S. Iwama, N. Kato andT. Higuchi, Bioorg. Med. Chem., 2010, 18, 6340–6350.
31 V. Lanza and G. Vecchio, J. Inorg. Biochem., 2009, 103, 381–388.
32 S. R. Doctrow, K. Huffman, C. B. Marcus, G. Tocco,E. Malfroy, C. A. Adinolfi, H. Kruk, K. Baker,N. Lazarowych, J. Mascarenhas and B. Malfroy, J. Med.Chem., 2002, 45, 4549–4558.
33 W.-T. Lee, S. Xu, D. A. Dickie and J. M. Smith, Eur. J. Inorg.Chem., 2013, 3867–3873.
34 W.-T. Lee, S. B. Muñoz, D. A. Dickie and J. M. Smith,Angew. Chem., Int. Ed., 2014, 53, 9856–9859.
35 A. Flórido, N. Saraiva, S. Cerqueira, N. Almeida,M. Parsons, I. Batinic-Haberle, J. P. Miranda, J. G. Costa,G. Carrara, M. Castro, N. G. Oliveira and A. S. Fernandesa,Redox Biol., 2019, 20, 367–378.
36 Y. Yulyana, A. Tovmasyan, I. A. W. Ho, K. C. Sia,J. P. Newman, W. H. Ng, C. M. Guo, K. M. Hui, I. Batinic-Haberle and P. Y. P. Lam, Stem Cell Rev. Rep., 2016, 12,140–155.
37 I. Batinic-Haberle, A. Tovmasyan and I. Spasojevic,Antioxid. Redox Signaling, 2018, 29, 1691–1724.
38 Z. Rajic, A. Tovmasyan, O. L. de Santana, I. N. Peixoto,I. Spasojevic, S. A. do Monte, E. Ventura, J. S. Rebouças andI. Batinic-Haberle, J. Inorg. Biochem., 2017, 169, 50–60.
39 Y. Htet and A. G. Tennyson, J. Am. Chem. Soc., 2016, 138,15833–15836.
40 Y. Htet and A. G. Tennyson, Angew. Chem., Int. Ed., 2016,55, 8556–8560.
41 Y. Htet and A. G. Tennyson, Chem. Sci., 2016, 7, 4052–4058.42 Y. Htet, Z. Lu, S. A. Trauger and A. G. Tennyson, Chem. Sci.,
2019, 10, 2025–2033.43 S. L. Scott, W.-J. Chen, A. Bakac and J. H. Espenson, J. Phys.
Chem., 1993, 97, 6710–6714.44 Although catalytic H2O2 disproportionation has been
reported for a wider variety of synthetic complexes thanjust Mn–porphyrin and Mn–salen complexes, detailed com-parisons and discussion are only possible with MnSODmimics for which both catalase and peroxidase reactionkinetic data are available.
45 Values of v0 are calculated from the slopes of the [H2O2] vs.t plots at t′0, where t′0 is determined as the time at whichthe first-derivative of the [H2O2] vs. t plot reached aminimum. Typically, t′0 occurred < 4 min after H2O2
addition and when < 10% of H2O2 had been consumed.46 To be consistent with the reported kinetics for the Mn–por-
phyrin and Mn–salen complexes, catalase TOF values forRu1 in units of s−1 were calculated by dividing the initialrates of H2O2 consumption in µM s−1 by the concentrationsof Ru1 in µM.
47 In this manuscript, catalase TOF and with peroxidase TOFvalues derive specifically from H2O2 consumption.
Paper Dalton Transactions
15500 | Dalton Trans., 2021, 50, 15493–15501 This journal is © The Royal Society of Chemistry 2021
Publ
ishe
d on
02
Sept
embe
r 20
21. D
ownl
oade
d on
12/
6/20
21 1
2:26
:01
AM
. View Article Online
Literature TOF values that derive from O2 production andABTS•– production can be converted to H2O2 consumptionvia multiplication by 2 and 0.5, respectively.
48 R. Re, N. Pellegrini, A. Proteggente, A. Pannala, M. Yangand C. Rice-Evans, Free Radicals Biol. Med., 1999, 26, 1231–1237.
49 There is dramatic variation in the catalase reaction kineticsreported for many Mn–salen complexes. There are evenwith instances of the same research group studying thesame complex a second time and obtaining a second cata-lase TOF more than 10-fold lower than the TOF in theinitial report. Fortunately, each report on Mn–salen com-plexes used for comparison to Ru1 included at least oneMn–salen complex that had been measured more thanonce. Dividing the corrected second value by the value inthe initial report afforded a correction factor that wasapplied to each catalase TOF value.
50 M. Takenaka, M. Kikkawa, T. Matsumoto, T. Yatabe,T. Ando, K.-S. Yoon and S. Ogo, Chem. – Asian J., 2018, 13,3180–3184.
51 G. A. Silantyev, O. A. Filippov, P. M. Tolstoy, N. V. Belkova,L. M. Epstein, K. Weisz and E. S. Shubina, Inorg. Chem.,2013, 52, 1787–1797.
52 T. A. Tronic, W. Kaminsky, M. K. Coggins and J. M. Mayer,Inorg. Chem., 2012, 51, 10916–10928.
53 L. J. L. Häller, E. Mas-Marzá, A. Moreno, J. P. Lowe,S. A. Macgregor, M. F. Mahon, P. S. Pregosin andM. K. Whittlesey, J. Am. Chem. Soc., 2009, 131, 9618–9619.
54 J. Matthes, S. Gründemann, A. Toner, Y. Guari,B. Donnadieu, J. Spandl, S. Sabo-Etienne, E. Clot,H.-H. Limbach and B. Chaudret, Organometallics, 2004, 23,1424–1433.
55 M. Tamm, A. Kunst, F. E. Hahn, T. Pape and R. Fröhlich, Z.Anorg. Allg. Chem., 2003, 629, 2408–2414.
56 A. J. Ingram, K. L. Walker, R. N. Zare and R. M. Waymouth,J. Am. Chem. Soc., 2015, 137, 13632–13646.
57 S. K. Chatterjee, R. C. Maji, S. K. Barman, M. M. Olmsteadand A. K. Patra, Angew. Chem., Int. Ed., 2014, 53, 10184–10189.
58 I. Schepetkin, A. Potapov, A. Khlebnikov, E. Korotkova,A. Lukina, G. Malovichko, L. Kirpotina and M. T. Quinn,J. Biol. Inorg. Chem., 2006, 11, 499–513.
59 J. Gao, A. E. Martell and J. H. Reibenspies, Inorg. Chim.Acta, 2003, 346, 32–42.
60 R. Bandyopadhyay, S. K. Maiti and R. Bhattacharyya, Inorg.Chem. Commun., 2002, 5, 259–263.
61 Y. M. Goh and W. Nam, Inorg. Chem., 1998, 38, 914–920.62 S. Ménage, J. M. Vincent, C. Lambeaux and M. Fontecave,
J. Chem. Soc., Dalton Trans., 1994, 2081–2084.
63 J. M. Aubry and B. Cazin, Inorg. Chem., 1988, 27, 2013–2014.
64 A. M. Aslam, S. Rajagopal, M. Vairamani andM. Ravikumar, Transition Met. Chem., 2011, 36, 751–759.
65 H. Biava and S. Signorella, Polyhedron, 2010, 29, 1001–1006.
66 P. Wu, C. Çelik, G. Santoni, J. Dallery and D. Rehder,Eur. J. Inorg. Chem., 2008, 2008, 5203–5213.
67 S. Tabassum, S. Parveen and F. Arjmand, Transition Met.Chem., 2005, 30, 196–204.
68 A. G. J. Ligtenbarg, R. Hage and B. L. Feringa, Coord. Chem.Rev., 2003, 237, 89–101.
69 H. Fujii, Coord. Chem. Rev., 2002, 226, 51–60.70 I. Bernal, I. M. Jensen, K. B. Jensen, C. J. McKenzie,
H. Toftlund and J.-P. Tuchagues, J. Chem. Soc., DaltonTrans., 1995, 3667–3675.
71 D. Mandon, R. Weiss, K. Jayaraj, A. Gold, J. Terner, E. Billand A. X. Trautwein, Inorg. Chem., 1992, 31, 4404–4409.
72 J. T. Groves, R. C. Haushalter, M. Nakamura, T. E. Nemoand B. J. Evans, J. Am. Chem. Soc., 1981, 103, 2884–2886.
73 C. Li, K.-W. Ip, W.-L. Man, D. Song, M.-L. He, S.-M. Yiu,T.-C. Lau and G. Zhu, Chem. Sci., 2017, 8, 6868–6870.
74 L.-m. Chen, F. Peng, G.-d. Li, X.-m. Jie, K.-r. Cai, C. Cai,Y. Zhong, H. Zeng, W. Li, Z. Zhang and J.-c. Chen, J. Inorg.Biochem., 2016, 156, 64–74.
75 T. S. Morais, F. C. Santos, T. F. Jorge, L. Côrte-Real,P. J. A. Madeira, F. Marques, M. P. Robalo, A. Matos,I. Santos and M. H. Garcia, J. Inorg. Biochem., 2014, 130, 1–14.
76 A. M. Palmer, B. Peña, R. B. Sears, O. Chen, M. E. Ojaimi,R. P. Thummel, K. R. Dunbar and C. Turro, Philos.Trans. R. Soc., A, 2013, 371, 20120135.
77 G.-J. Lin, G.-B. Jiang, Y.-Y. Xie, H.-L. Huang, Z.-H. Liangand Y.-J. Liu, J. Biol. Inorg. Chem., 2013, 18, 873–882.
78 M. A. Sgambellone, A. David, R. N. Garner, K. R. Dunbarand C. Turro, J. Am. Chem. Soc., 2013, 135, 11274–11282.
79 M. Auzias, B. Therrien, G. Süss-Fink, P. Štěpnička,W. H. Ang and P. J. Dyson, Inorg. Chem., 2008, 47, 578–583.
80 A. Habtemariam, M. Melchart, R. Fernández, S. Parsons,I. D. H. Oswald, A. Parkin, F. P. A. Fabbiani, J. E. Davidson,A. Dawson, R. E. Aird, D. I. Jodrell and P. J. Sadler, J. Med.Chem., 2006, 49, 6858–6868.
81 D. N. Akbayeva, L. Gonsalvi, W. Oberhauser, M. Peruzzini,F. Vizza, P. Brüggeller, A. Romerosa, G. Savad andA. Bergamo, Chem. Commun., 2003, 264–265.
82 P. Hu, Y. Wang, Y. Zhang, H. Song, F. Gao, H. Lin, Z. Wang,L. Wei and F. Yang, RSC Adv., 2016, 6, 29963–29976.
83 B. S. Demir, T. Keleş and O. Serindağ, Bioinorg. Chem.Appl., 2014, 2014, 717421.
Dalton Transactions Paper
This journal is © The Royal Society of Chemistry 2021 Dalton Trans., 2021, 50, 15493–15501 | 15501
Publ
ishe
d on
02
Sept
embe
r 20
21. D
ownl
oade
d on
12/
6/20
21 1
2:26
:01
AM
. View Article Online