Embed Size (px)
Citation preview

Impact Factor 3.582 Case Studies Journal ISSN (2305-509X) – Volume 5, Issue 8–Aug-2016
http://www.casestudiesjournal.com/ Page 165
Analyzing the Relationship between Service Quality and Customer Satisfaction:
A Study on Sadat University in Egypt
Author Details: Wageeh A. Nafei
University of Sadat City, Menoufia, Egypt
Abstract
Purpose: The purpose of this study is to examine the relationship between SQ (tangibility, reliability, responsiveness,
assurance, and empathy) and CS.
Research Design/Methodology: To assess positive SQ, refer to (SQ Questionnaire, Cronin & Taylor, 1992), and CS
(CS Questionnaire, Athanassopoulos, et al, 2001). The data of the study was collected from 470 employees at Sadat
University in Egypt. Out of the 692 questionnaires that were distributed to employees at Sadat University in Egypt,
470 usable questionnaires were returned, a response rate of 68%. Multiple Regression Analysis (MRA) was used to
confirm the research hypotheses.
Findings: The research has found that there is significant relationship between SQ and CS at Sadat University in
Egypt. CS significantly influenced SQ. The finding reveals that SQ affects CS. This study has been specifically
conducted to seek empirical justification by considering SQ as the main contributory factor towards CS.
Practical implications: Learning the relationships between SQ and CS can effectively allocate their resources and
develop a rational plan to improve their SQ under specific business circumstances. Sadat University can attract more
customers. Managers are advised to satisfy and better manage their relationships through quality product and service
offerings to their customers as a competitive policy in the marketplace. Sadat University is required to offer
products/services that meet or surpass consumers’ expectation. The study also reveals interesting implications in SQ
and CL, useful to both academics and practitioners. Managers will find this research helpful in better understanding
these variables and their roles on their companies’ performance. Based on the study, organization managers are
advised to satisfy and better manage their relationships through SQ offerings to their customers as a competitive
policy in the marketplace.
Originality/value: This research dealt with SQ in terms of its concept and dimensions, in addition to dealing with the
CS at Sadat University in Egypt.
Keywords: service quality, customer satisfaction
1. Introduction
Service Quality (SQ) and Customer Satisfaction (CS) are very important concepts that companies
must understand if they want to remain competitive and grow. In today‟s competitive environment
delivering high quality service is the key for a sustainable competitive advantage. CS does have a positive
effect on an organization‟s profitability. CS forms the foundation of any successful business as CS leads to
repeat purchase, brand loyalty, and positive word of mouth (Angelova & Zekiri, 2011).
CS is a well known and established concept in several areas like marketing, consumer research,
economic psychology, welfare-economics, and economics. CS have long been a topic of high interest in
both academia and practice (Ganiyu et al., 2012).
CS is one of the most important issues concerning business organization of all types, which is
justified by the customer oriented philosophy and the principles of continuous improvement in modern
eateries. CS is a collective outcome of perception, evaluation, and psychological reactions to the
consumption expectation with a product or service. It is a customer‟s overall evaluation of the performance
of an offering. CS is a person‟s feelings of pleasures or disappointments resulting from comparing a product
perceived performance in relation to his/her expectation (Veloutsou et al, 2005; Kotler & Armstrong, 2010).
This study is structured as follows: Section one is introductory. Section two presents the literature
review. Section three discusses the research methodology. Section four presents the hypotheses testing.
Section five explains the research findings. Research recommendations will take place at section six. Section
seven handles the research implications. Limitations and future research will take place at section eight.
Conclusion will be provided at the last section.
2. Literature Review
2.1. Service Quality
There are many definitions regarding the concepts of service. Services are deeds, processes, and
performances (Parasuraman et al. 1985).
Impact Factor 3.582 Case Studies Journal ISSN (2305-509X) – Volume 5, Issue 8–Aug-2016
http://www.casestudiesjournal.com/ Page 166
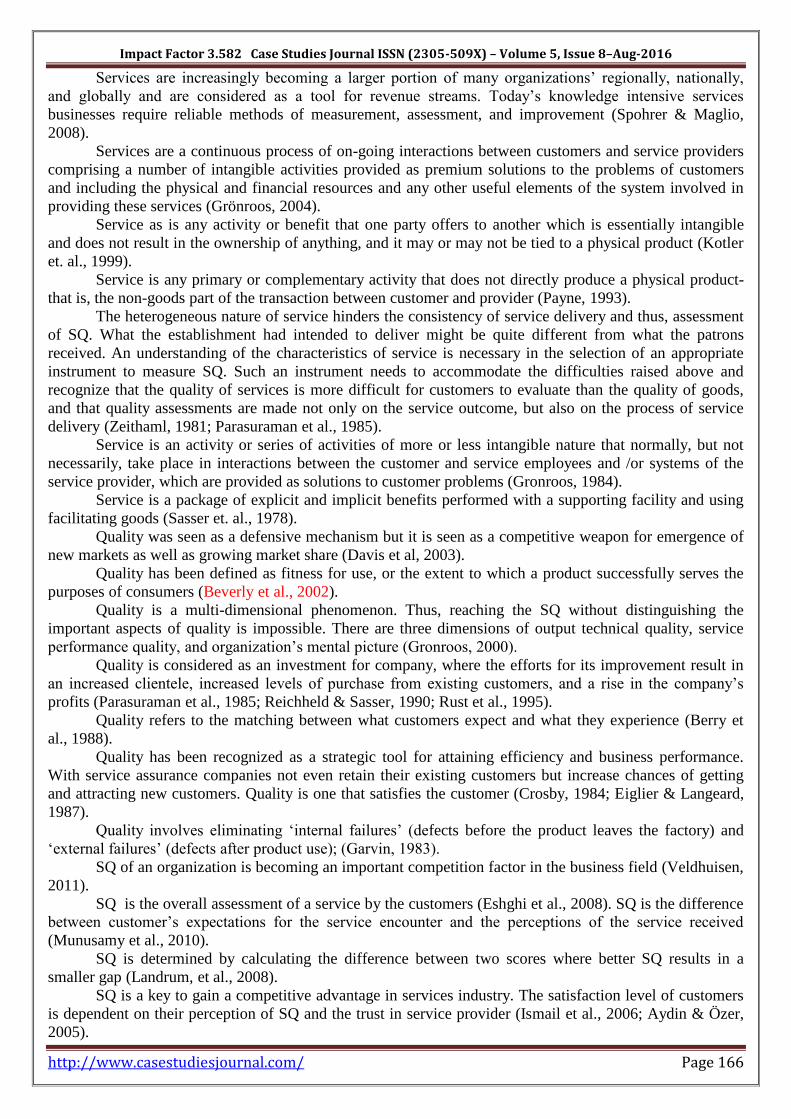
Services are increasingly becoming a larger portion of many organizations‟ regionally, nationally,
and globally and are considered as a tool for revenue streams. Today‟s knowledge intensive services
businesses require reliable methods of measurement, assessment, and improvement (Spohrer & Maglio,
2008).
Services are a continuous process of on-going interactions between customers and service providers
comprising a number of intangible activities provided as premium solutions to the problems of customers
and including the physical and financial resources and any other useful elements of the system involved in
providing these services (Grönroos, 2004).
Service as is any activity or benefit that one party offers to another which is essentially intangible
and does not result in the ownership of anything, and it may or may not be tied to a physical product (Kotler
et. al., 1999).
Service is any primary or complementary activity that does not directly produce a physical product-
that is, the non-goods part of the transaction between customer and provider (Payne, 1993).
The heterogeneous nature of service hinders the consistency of service delivery and thus, assessment
of SQ. What the establishment had intended to deliver might be quite different from what the patrons
received. An understanding of the characteristics of service is necessary in the selection of an appropriate
instrument to measure SQ. Such an instrument needs to accommodate the difficulties raised above and
recognize that the quality of services is more difficult for customers to evaluate than the quality of goods,
and that quality assessments are made not only on the service outcome, but also on the process of service
delivery (Zeithaml, 1981; Parasuraman et al., 1985).
Service is an activity or series of activities of more or less intangible nature that normally, but not
necessarily, take place in interactions between the customer and service employees and /or systems of the
service provider, which are provided as solutions to customer problems (Gronroos, 1984).
Service is a package of explicit and implicit benefits performed with a supporting facility and using
facilitating goods (Sasser et. al., 1978).
Quality was seen as a defensive mechanism but it is seen as a competitive weapon for emergence of
new markets as well as growing market share (Davis et al, 2003).
Quality has been defined as fitness for use, or the extent to which a product successfully serves the
purposes of consumers (Beverly et al., 2002).
Quality is a multi-dimensional phenomenon. Thus, reaching the SQ without distinguishing the
important aspects of quality is impossible. There are three dimensions of output technical quality, service
performance quality, and organization‟s mental picture (Gronroos, 2000).
Quality is considered as an investment for company, where the efforts for its improvement result in
an increased clientele, increased levels of purchase from existing customers, and a rise in the company‟s
profits (Parasuraman et al., 1985; Reichheld & Sasser, 1990; Rust et al., 1995).
Quality refers to the matching between what customers expect and what they experience (Berry et
al., 1988).
Quality has been recognized as a strategic tool for attaining efficiency and business performance.
With service assurance companies not even retain their existing customers but increase chances of getting
and attracting new customers. Quality is one that satisfies the customer (Crosby, 1984; Eiglier & Langeard,
1987).
Quality involves eliminating „internal failures‟ (defects before the product leaves the factory) and
„external failures‟ (defects after product use); (Garvin, 1983).
SQ of an organization is becoming an important competition factor in the business field (Veldhuisen,
2011).
SQ is the overall assessment of a service by the customers (Eshghi et al., 2008). SQ is the difference
between customer‟s expectations for the service encounter and the perceptions of the service received
(Munusamy et al., 2010).
SQ is determined by calculating the difference between two scores where better SQ results in a
smaller gap (Landrum, et al., 2008).
SQ is a key to gain a competitive advantage in services industry. The satisfaction level of customers
is dependent on their perception of SQ and the trust in service provider (Ismail et al., 2006; Aydin & Özer,
2005).
Impact Factor 3.582 Case Studies Journal ISSN (2305-509X) – Volume 5, Issue 8–Aug-2016
http://www.casestudiesjournal.com/ Page 167
SQ is the result of the comparison that customers make between their expectations about a service
and their perception of the way the service has been performed (Caruana, 2002).
SQ has gained tremendous attention from managers and academics due to its considerable influence
on business performance, cost reduction, CS and profitability (Gummesson, 1998; Sureshchander et al.,
2002).
SQ has been conceptualized as the difference between customer expectations regarding a service to
be received and perceptions of the service being received (Grönroos, 2001).
SQ has become a popular area of academic research and has been acknowledged as an observant
competitive advantage and supporting satisfying relationships with customers (Zeithmal, 2000).
SQ is the meeting or exceeding customer expectations or as the expectations of service (Nitecki &
Hernon, 2000).
SQ is a casual relationship between SQ and satisfaction and that the perceptions of SQ affect the
feelings of satisfaction and/or dissatisfaction by the customer (Fornell et al., 1996).
SQ divisions are related to overall SQ and/or CS (Dabhalker et al., 1996; Zeithaml et al., 1996).
SQ is a global judgment, or attitude, relating to the superiority of the service. SQ presents „the
consumer‟s overall impression of the relative inferiority/superiority of the organization and its services.
Therefore, SQ is a key of survival to all servicing companies (Parasuraman et al., 1994).
SQ is viewed as a form of attitude representing a long-run overall evaluation. Maintaining SQ at a
certain level and improving SQ must be life-time efforts to those companies who desire life-time prosperity
in customers‟ heart (Cronin & Taylor, 1992).
SQ is a difference between customer expectations of „what they want‟ and their perceptions of „what
they get (Gronroos, 1990).
SQ is a tool for gaining competitive advantage and lead in a market-driven system has been well
recognized by the organizations. However, in current highly competitive corporate environment, it has
become increasingly important to not only become the market leader but also to maintain that top position
(Zeithaml et al., 1996; Boltan & Drew, 1991).
SQ is the customer perception of how does a service meets or exceeds their expectations (Czepiel,
1990).
SQ delineates two rather distinct facets of the construct: a technical dimension (the core service
provided) and a functional dimension (how the service is provided). Product quality was traditionally linked
to the technical specifications of goods, with most definitions of quality arising from the manufacturing
sector where quality control has received prolonged attention and research (Grönroos, 1984; 1990).
SQ has been referred as the extent to which a service meets customers‟ needs or expectations (Lewis
& Mitchell, 1990; Dotchin & Oakland, 1994). It is conceptualized as the consumer‟s overall impression of
the relative inferiority or superiority of the services (Zeithaml et al., 1990).
SQ has become a major area of attention during the past few decades for managers, researchers, and
practitioners because of its huge impact on business performance of firms. Customers prefer and value
companies that provide high SQ. Thus, the attainment of quality in products and services has become a drive
concern of the 1980s (Brown & Swartz, 1989).
Customers judge SQ relative to what they want by comparing their perceptions of service
experiences with their expectations of what the service performance should be. Marketers described and
measured only quality with tangible goods, whereas quality in services was largely undefined and un-
researched (Brown & Swartz, 1989).
SQ was developed as the overall evaluation of a specific service firm that results from comparing
that firm‟s performance with the customer‟s general expectations of how firms in that industry should
perform. SQ is the global evaluation or attitude of overall excellence of services. SQ has become a
significant differentiator and the most powerful competitive weapon that organizations want to possess
(Berry et al. 1988).
SQ gives a sustainable competitive advantage to any business. It enables them to fulfill not only the
present needs of their customers satisfactorily, but also to anticipate their future needs. This ability to
anticipate the future needs of customers allows them to delight their customers through quality services on
consistent basis. Subsequently it enhances CS (Gantasala & Prabhakar, 2010; Wisniewski, 2001; Zeithaml,
1988).

Impact Factor 3.582 Case Studies Journal ISSN (2305-509X) – Volume 5, Issue 8–Aug-2016
http://www.casestudiesjournal.com/ Page 168
SQ is interpreted as perceived quality which means a customer‟s judgment about a service. SQ is the
degree of discrepancy between customers‟ normative expectation for service and their perceptions of service
performance (Parasuraman et al., 1985).
SQ is a causal antecedent of CS, due to the fact that SQ is viewed to be at the transactional level and
satisfaction is seen to be an attitude (Oliver, 1997).
SQ had ten dimensions such as reliability, responsiveness, competence, access, courtesy,
communication, creditability, security, understanding/knowing the customers and tangibility. These ten
dimensions were cut down to five namely, tangibility, reliability, responsiveness, assurance and empathy.
They are as follows (Parasuraman et al., 1988):
1. Tangibility: This dimension includes the appearance of physical facilities, equipment personnel and
communication materials used to communicate with customers. Elements within the tangibles dimension
are cleanliness, space, atmosphere, appearance of server and location.
2. Reliability: It is the ability to perform the promised services dependably and accurately. The elements of
reliability are speed, willingness to respond, accuracy and dependability.
3. Responsiveness: It is the willingness to help customers, and provide prompt service. Its elements include
that of reliability.
4. Assurance: It is the knowledge and courtesy of employees and their ability to convey trust and
confidence. Assurance may be measured using elements of knowledge, communications and caring for
the customer.
5. Empathy: It is the provision of caring individualized attention to customers. Its elements are the same as
assurance.
SERVQUAL scale is the most famous measure of SQ. SERVQUAL is applicable in an extensive
spectrum of service domains such as financial institutions, libraries, hotels, and medical centers. Many
researchers have tried to use this tool in different service domains (Zeithaml et al., 1996; Parasuraman et al.,
1988; 1994).
In many private research studies, SERVQUAL has been constructively deployed (Parasuraman et al.,
1991). Moreover, several published research studies have positively discussed the SERQUAL framework
and have assessed the validity and reliability of this measure (Crompton & Machay, 1989; Webster, 1989;
Woodside et al., 1989; Johnson, et al., 1988; Babakus & Boller, 1992; Brensinger & Lambert, 1990; Finn &
Lamb, 1991).
2.2. Customer Satisfaction
Satisfaction is a feeling that surfaces from an evaluation process, i.e. when the consumer of a good or
service compares what is received against what is expected from the utilization of that good or service
(Kotler et al., 2009).
Satisfaction is an overall customer attitude towards a service provider, or an emotional reaction to the
difference between what customers anticipate and what they receive, regarding the fulfillment of some
needs, goals or desire (Hansemark & Albinson, 2004).
Satisfaction is the customers‟ evaluation of a product or service in terms of whether that product or
service has met their needs and expectations (Bitner & Zeithaml, 2003).
Satisfaction is a positive, affective state resulting from the appraisal of all aspects of a party‟s
working relationship with another (Boselie et al., 2002).
There are three component of satisfaction. They are (1) consumer satisfaction is a response
(emotional or cognitive); (2) the response pertains to a particular focus (expectations, product, consumption
experience, etc.); and (3) the response occurs at a particular time (after consumption, after choice, based on
accumulated experience, etc) (Giese & Cote, 2002).
Satisfaction is an indicator of met or exceeded expectations (Grisaffe, 2001). Satisfaction is the
person‟s feelings of pleasure or disappointment resulting from comparing a product perceived performance
in relation to his or her expectations (Kotler, 2000).
If a customer received what she or he expected, the customer is most likely to be satisfied
(Reichheld, 1996).

Impact Factor 3.582 Case Studies Journal ISSN (2305-509X) – Volume 5, Issue 8–Aug-2016
http://www.casestudiesjournal.com/ Page 169
Satisfaction is the summary psychological state resulting when the emotion surrounding
disconfirmed expectations is coupled with a consumer‟s prior feeling about the consumer experience (Oliver
(1997).
Satisfaction is a much desired target for businesses, since a satisfied customer is likely to buy more,
return to the store and spread positive word-of-mouth opinions to other customers (Anderson et al., 1994).
Although satisfaction has been defined as the difference between expectation and performance, there
are differences between quality and satisfaction. Satisfaction is a decision made after experience while
quality is not the same. On the other hand, in satisfaction literature, expectations for goods is “would”, while
in SQ literature, expectations for goods is “should” (Parasuraman et al., 1991).
Satisfaction is the summary of psychological state resulting when the emotion surrounding
disconfirmed expectations is coupled with the consumer's prior feelings about the consumption experience
(Oliver, 1981).
The importance of customers has been highlighted by lots of researchers and academicians all around
the world. Top performing financial institutions believe that customers are the purpose of what they do and
they very much depend on them; customers are not the source of a problem and they should never make a
wish that customers should go away because their future and security will put in jeopardy. That is the main
reason why financial institutions of today are focusing much attention on CS, loyalty and retention (Zairi,
2000).
The concepts of CS is first introduced by Cardozo (1965), who indicates that customers‟ consume
behavior will be produced again and will not change to another product or service by increasing their
satisfaction. However, the definition of CS can be broadly fitted into two categories.
CS is the point at which expectation and reality coincide. The concept of satisfaction embraces not
only what is gained in the use of a product, but also consumers feeling about the effectiveness of their own
decision process. CS is the level of a person‟s perceived performance or outcome in relation to his/her own
expectation. (Howard & Sheth, 1969).
CS is a post choice evaluation judgment concerning a specific purchase decision. CS is the necessary
foundation for firms to retain the existing customers. The customers who are unsatisfied with the received
products/services would not be expected to have long run relationships with the firm (Guo et al., 2009; Lin
& Wu, 2011).
CS is regarded as how customers can get more benefits than their cost (Liu & Yen, 2010).
CS is hard to define because normally it is extenuated by expectation. Customers will be satisfied if
the product or service above demands or expectation. On the other hand, if the product or service below
demands or expectation, customer will be dissatisfied (Schmitt 2003; Goodman, 2009).
CS has for many years been considered as key factor in determining why customers leave or stay
with an organization. Therefore, organizations need to know how to keep their customers, even if they
appear satisfied. Every organization has come to realize that in order for it to survive, let alone grow, it has
to acquire and then retain profitable customers. CS is not a guarantee of repeat patronage. Satisfied
customers jump ship every day, and the reasons are not always due to customer dissatisfaction, some
customers are lost due to indifference which arises from pure neglect (Michael et al., 2008).
CS has been defined in various ways, but the conceptualization, which appears to have achieved the
widest acceptance, is that satisfaction is a post-choice evaluative judgment of a specific transaction (Bastos
& Gallego, 2008).
CS plays the most important role in total quality management. CS is probably less sensitive to
seasonal fluctuations, changes in costs, or changes in accounting principles and practices (Kotler, 2006).
CS is a standard to identify the actual feeling of a customer about quality of service or product. It is
not only about the direct impression about product or SQ, but also shows how the product or service meet
customer‟s expectation or demand (Woodcock et al., 2003).
CS will probably talk to others about their good experiences. This fact, especially in the Middle
Eastern cultures, where the social life has been shaped in a way that social communication with other people
enhances the society, is more important (Jamal & Naser, 2002).
CS is a key factor in the formation of a customer‟s desire to purchase future products. CS is
considered as the corporate level strategy and it is a source of successful entrepreneurship. Regarding to CS,
there are some differences in the definitions. There are three general components: response, focus and time.

Impact Factor 3.582 Case Studies Journal ISSN (2305-509X) – Volume 5, Issue 8–Aug-2016
http://www.casestudiesjournal.com/ Page 170
CS is a response, pertains to a particular focus, and occurs at a particular moment in time (Sureshchandar et
al , 2002).
CS is an overall customer attitude or behavior towards a service provider, or an emotional reaction
towards the difference between what customers expect and what they receive, regarding the fulfillment of
some desire, need or goal (Hansemark, & Albinsson, 2004; Kotler, 2000; Hoyer, & MacInnis, 2001).
CS is a key factor in the formation of customer‟s desires for future purchase (Mittal & Kamakura,
2001).
CS has been a central concept in marketing literature and is an important goal of all business
activities. Today, companies face their toughest competition, because they move from a product and sales
philosophy to a marketing philosophy, which gives a company a better chance of outperforming competition
(Kotler, 2000).
CS fosters loyalty to the extent that it is a prerequisite for maintaining a favorable relative attitude
and for recommending and repurchasing from the bank. Once customers recommend a financial institution,
it fosters both repurchase and loyalty towards that financial institution. Thus, the key to generating loyalty is
to get customers to recommend a service provider to others. Also, customers are likely to recommend a
service provider when they are satisfied with the services and when they have a favorable relative attitude
towards that service provider (Sivadas & Baker-Prewitt, 2000).
CS has a positive effect on an organization‟s profitability. The more customers are satisfied with
products or services offered, the more are chances for any successful business as CS leads to repeat
purchase, brand loyalty, and positive word of mouth marketing. CS leads to repeat purchases, loyalty and to
customer retention (Zairi, 2000).
CS is more likely to repeat buying products or services. They will also tend to say good things and to
recommend the product or service to others. On the other hand, dissatisfied customers respond differently.
Dissatisfied customers may try to reduce the dissonance by abandoning or returning the product, or they
may try to reduce the dissonance by seeking information that might confirm its high value (Kotler, 2000).
CS remains a worthy pursuit among the consumer marketing community (Oliver, 1999).
CS is the heart of marketing. The ability of an organization to satisfy customers is vital for a number
of reasons. Dissatisfied customers tend to complain to the company and in some cases seek redress from
them more often to relieve cognitive dissonance and bad consumption experiences (Oliver, 1987; Nyer,
1999).
CS tends to have a higher usage level of a service than those who are not satisfied (Ram & Jung,
1991; Bolton & Lemon, 1999). They are more likely to possess a stronger repurchase intention and to
recommend the product/service to their acquaintances. Numerous studies have also revealed that CS
positively affects loyalty (Zeithaml et al., 1996; Bloemer, et al., 1999; Oliver, 1999).
Moreover, sometimes even the customer is not totally satisfied with the product or service, he still
chooses it because of a lower price or just the location. There is no doubt that CS is the key element which
can cause repeating purchasing behavior (Gitomer, 1998).
CS is the degree to which customer expectations of a product or service are met or exceeded. CS
means that the customers‟ needs are met, product and services are satisfactory, and customers‟ experience is
positive (Friday & Colts, 1995.
CS is defined as the consumer‟s fulfillment response. It is a judgment/assessment that a product or
service feature, or the product or service itself, provides a pleasurable level of consumption related
fulfillment. In other words, it is the overall level of contentment with a service/product experience (Oliver‟s
(1997).
CS is how satisfied a customer is with the supplied product/service. It is closely related to
interpersonal trust (Geyskens et al., 1996).
CS is the result of a customer's perception of the value received in a transaction or relationship-
where value equals perceived SQ relative to price and customer acquisition costs (Hallowell, 1996).
CS in retail banking is influenced by the perceived competitiveness of the bank's interest rates
(Levesque & McDougall (1996).
Satisfied customers may seek for competitors because they believe they might receive better service
elsewhere. Unsatisfied customers may choose not to defect, because they do not expect to receive better
service elsewhere or if the switching cost is high (Reichheld, 1996).

Impact Factor 3.582 Case Studies Journal ISSN (2305-509X) – Volume 5, Issue 8–Aug-2016
http://www.casestudiesjournal.com/ Page 171
Companies with satisfied customers have a good opportunity to convert them into loyal customers
who purchase from those firms over an extended time period. Today's highly competitive and dynamic
corporate environment compels the financial institutions to have satisfied customers and retain them in order
to survive and compete with other market players successfully (Evans & Lindsay (1996).
Quite understandably, marketing practitioners often lay claim with CS, using slogans such as “Our
focus is CS”, or “The customer is a king” “Customer is our reason for being in business”. The importance of
CS inform the study carried out by the University of Michigan which tracks customers across 200 firms
representing all major economic sectors to produce the American CS Index (ACSI). Each company receives
an ACSI score computed from its customers‟ perceptions of quality, value, satisfaction, expectations,
complaints, and future loyalty (Fornell et al., 1996).
CS is a critical focus for effective marketing programs. CS is a collective outcome of perception,
evaluation and psychological reactions to the consumption experience with a product or service (Yi, 1990).
CS is the customer‟s overall evaluation of the performance of an offering to date (Johnson & Fornell
1991).
CS as an attitude is like a judgment following a purchase act or based on series of consumer-product
interactions (Yi, 1989).
CS is the judgment for the difference between the quality of the product or service and customer‟s
own expectation (Tse & Wilton, 1988).
CS is the statue of emotion response. More specifically, when a customer can feel about the benefit
of a product or service, the customer is willing to pay for the price and can tolerate with the rising price
(Westbrook, 1980).
In order to achieve CS, organizations must be able to build and maintain long lasting relationships
with customers through satisfying various customer needs and demands which resultantly motivate them to
continue to do business with the organization on on-going basis (La Barbera, & Mazursky, 1983).
3. Methodology
3.1. Research Model
The proposed comprehensive conceptual model is presented in Figure (1). The diagram below shows
that there is one independent variable of SQ. There is one dependent variable of CS. It shows the rational
link between the two types of observed variables i.e. independent and dependent variables.
Figure (1)
Proposed Comprehensive Conceptual Model
Dep
end
ent
Vari
ab
le
Ser
vic
e Q
uali
ty
Ind
epen
den
t V
ari
ab
le
Cu
stom
er S
ati
sfacti
on
H1
Empathy
Assurance
Responsiveness
Reliability
Tangibility
H2
H3
H4
H5

Impact Factor 3.582 Case Studies Journal ISSN (2305-509X) – Volume 5, Issue 8–Aug-2016
http://www.casestudiesjournal.com/ Page 172
An in-depth literature review pointed out that SQ and CS are related to each other. In other words,
there is a positive relationship between SQ and CS. So literature suggest that SQ has a relationship with CS
(Cavana et al, 2007; Garland & Gendall, 2004; Henkel et al, 2006; Heskett et al, 1997; Chau & Kao, 2009;
Lai, 2004; Naeem & Saif, 2009; Rauyruen et al, 2007; Yu & Dean, 2001; Ziethalm et al, 2008).
From the above discussion, the research framework suggests that SQ plays a significant role in
affecting CS.
SQ as measured consisted of reliability, responsiveness, assurance, empathy and tangibility (Cronin
& Taylor,1992).
CS is measured in terms of satisfaction with the conduct of the proceedings, satisfaction with the
workers, and satisfaction with the services of the organization (Athanassopoulos, et al, 2001).
3.2. Research Questions and Hypotheses
The researcher found the research problem through two sources. The first source is to be found in
previous studies, and it turns out that there is a lack in the number of literature reviews that dealt with the
analysis of the relationship between SQ and CS at Sadat University in Egypt. This called for the researcher
to test this relationship in the Egyptian environment. The second source is the pilot study, which was
conducted in an interview with (30) employees in order to identify the relationship between SQ and CS. The
researcher found, through the pilot study, several indicators notably the important and vital role that could be
played by SQ in reinforcing CS at Sadat University in Egypt.
As a result of the discussions given above, the research questions of this study are as follows:
Q1: What is the nature and extent of the relationship between SQ (tangibility) and CS at Sadat University in
Egypt?.
Q2: What is the nature of the relationship between SQ (reliability) and CS at Sadat University in Egypt?.
Q3: What is the statistically significant relationship between SQ (responsiveness) and CS at Sadat
University in Egypt?.
Q4: What is the nature and extent of the relationship between SQ (assurance) and CS at Sadat University in
Egypt?.
Q5: What is the nature of the relationship between SQ (empathy) and CS at Sadat University in Egypt?.
There are studies in literature that study SQ and CS factors separately and within the frame of
bilateral relation, but there is no study that examines these two factors collectively at the Egyptian
environment. This study aims to contribute to the literature by examining the research variables collectively
and reveal the interaction between the research variables.
As a result of the discussions given above, the following hypotheses were developed to test if there is
significant correlation between SQ and CS at Sadat University in Egypt.
H1: SQ (tangibility) has no statistically significant effect on CS at Sadat University in Egypt.
H2: There is no statistically significant impact of SQ (reliability) on CS at Sadat University in Egypt.
H3: SQ (responsiveness) has no statistically significant influence on CS at Sadat University in Egypt.
H4: There is no statistically significant relationship between SQ (assurance) and CS at Sadat University in
Egypt.
H5: SQ (empathy) has no statistically significant impact on CS at Sadat University in Egypt.
3.3. Population and Sample
The study subjects are employees at Sadat University in Egypt. The total population is 692
employees. The research population is illustrated in Table (1). Due to the small number of members of the
research community at Sadat University in Egypt, it was decided to study this community using
comprehensive inventory (Complete Numeration or Census) in order to get the highest percentage of survey
lists.

Impact Factor 3.582 Case Studies Journal ISSN (2305-509X) – Volume 5, Issue 8–Aug-2016
http://www.casestudiesjournal.com/ Page 173
Table (1) Distribution of the Sample Size
Faculty Members Number Percentage
1. Faculty of Veterinary Medicine 137 19.8%
2. Faculty of Tourism & Hotels 89 12.9%
3. Genetic Engineering Research Institute 117 16.9%
4. Faculty of Physical Education 174 25.1%
5. Faculty of Education 33 4.8%
6. Faculty of Commerce 55 7.9%
7. Faculty of Law 43 6.2%
8. Institute for Environmental Studies and Research 44 6.4%
Total 692 100% Source: Staff Members Affairs Department, Sadat University, Egypt, 2015
Table (2) provides more detailed information about the sample and the measures.
Table (2) Frequency Distribution Table of Demographics
Variables Number Percentage
1- Sex
Male 245 52.1%
Female 225 47.9%
Total 470 100%
2- The Academic Degree
Professor degree 80 17.0%
Associate professor 112 23.8%
Assistant professor 143 30.4%
Lecturer 55 11.7%
Demonstrator 80 17.0%
Total 470 100%
3- Marital Status
Married 338 71.9%
Single 132 28.1%
Total 470 100%
4- Age
Less than 30 years 78 16.6%
From 30 to 45 211 44.9%
More than 45 181 38.5%
Total 470 100%
5- Period of Experience
Less than 5 years 220 46.8%
From 5 to 10 157 33.4%
More than 10 93 19.8%
Total 470 100%
3.4. Procedure
The present study has drawn on the questionnaire method for collecting primary data necessary for
the study. The questionnaire list is interested in recognizing SQ and CS at Sadat University in Egypt.
The questionnaire used in the questions list included four pages, besides the introductory page
addressing informants. It aims at introducing them to the nature and aims of the study, besides gaining their
cooperation for answering the questions in the list. The questionnaire included three questions, relating to
SQ, CS, and biographical information of employees at Sadat University in Egypt.
Data collection took approximately two months. About 692 survey questionnaires were distributed
by employing diverse modes of communication, such as in person and post. Multiple follow-ups yielded 470
statistically usable questionnaires. Survey responses were 68%.
3.5. Data Collection Tools
3.5.1. Service Quality Scale
The present study has investigated SQ as an independent variable. The researcher has drawn on the
scale of Cronin & Taylor (1992) for measuring SQ, which has been divided into five main components
(tangibility, reliability, responsiveness, assurance, and empathy). There were 4 statements measuring

Impact Factor 3.582 Case Studies Journal ISSN (2305-509X) – Volume 5, Issue 8–Aug-2016
http://www.casestudiesjournal.com/ Page 174
tangibility, 5 statements handle reliability, 4 statements illustrate responsiveness, 4 statements handle
assurance, and 5 statements illustrate empathy. The survey form has been used as a key tool to collect data
to measure SQ at Sadat University in Egypt.
3.5.2. Customer Satisfaction Scale
The present study has investigated CS as a dependent variable. The researcher will depend on the
scale developed by (Athanassopoulos, et al, 2001), in measuring CS, which has been divided into three
main components (satisfaction with the conduct of the proceedings, satisfaction with the workers, and
satisfaction with the services of the organization). There were 6 items measuring satisfaction with the
conduct of the proceedings, 6 items measuring satisfaction with the workers, and 6 items measuring
satisfaction with the services of the organization. The survey form has been used as a key tool to collect data
to measure CS at Sadat University in Egypt.
Responses to all items scales were anchored on a five (5) point Likert scale for each statement, which
ranges from (5) “full agreement,” (4) for “agree,” (3) for “neutral,” (2) for “disagree,” and (1) for “full
disagreement.”
3.6. Data Analysis and Testing Hypotheses
The researcher has employed the following methods: (1) The Alpha Correlation Coefficient (ACC),
(2) Multiple Regression Analysis (MRA), and (3) the statistical testing of hypotheses which includes F- test
and T-test. They are found in SPSS.
4. Hypotheses Testing
4.1. Evaluating Reliability
Before testing the hypotheses and research questions, the reliability of SQ and CS were assessed to
reduce errors of measuring and maximizing constancy of these scales. To assess the reliability of the data,
Cronbach‟s alpha test was conducted.
Table (3) shows the reliability results for SQ and CS. All items had alphas above 0.70 and were,
therefore, excellent, according to Langdridge‟s (2004) criteria.
Regarding Table (3), the 22 items of SQ are reliable because the ACC is 0.9338. Tangibility, which
consists of 4 items, is reliable because the ACC is 0.6650. Reliability, which consists of 5 items, is reliable
because the ACC is 0.7891. Furthermore, responsiveness which consists of 4 items, is reliable because the
ACC is 0.6325. Assurance, which consists of 4 items, is reliable because the ACC is 0.6378. The 5 items
related to empathy are reliable because ACC is 0.7788. Thus, the internal consistency of SQ can be
acceptable.
Regarding Table (3), the 18 items of CS are reliable because the ACC is 0.9796. Satisfaction with the
conduct of the proceedings, which consists of 6 items, is reliable because the ACC is 0.9091. Satisfaction
with the workers, which consists of 6 items, is reliable because the ACC is 0.9688. Furthermore, satisfaction
with the services of the organization which consists of 6 items, is reliable because the ACC is 0.9363. Thus,
the internal consistency of CS can be acceptable.
Table (3) Reliability of SQ and CS
Variables The Dimension Number of
Statement ACC
SQ
Tangibility 4 0.6650
Reliability 5 0.7891
Responsiveness 4 0.6325
Assurance 4 0.6378
Empathy 5 0.7788
Total Measurement 22 0.9338
CS
Satisfaction with the conduct of the
proceedings 6 0.9091
Satisfaction with the workers 6 0.9688
Satisfaction with the services of the
organization 6 0.9363
Total Measurement 18 0.9796

Impact Factor 3.582 Case Studies Journal ISSN (2305-509X) – Volume 5, Issue 8–Aug-2016
http://www.casestudiesjournal.com/ Page 175
Accordingly, two scales were defined, SQ (22 variables), where ACC represented about 0.9338 and
CS (18 variables) where ACC represented about 0.9796.
4.2. Correlation Analysis
The researcher calculated means and standard deviations for each variable and created a correlation
matrix of all variables used in hypothesis testing. Arithmetic mean and standard deviation values related to
dependent and independent variables of this study and correlation coefficients between these variables are
given in Table (4).
Table (4) Descriptive Statistics and Correlation Matrix of Constructs
6 5 4 3 2 1 Std.
Deviat Mean Variables
1 0.742 3.83 1. Tangibility
1 0.95** 0.766 3.79 2. Reliability
1 0.65** 0.62* 0.789 3.57 3. Responsiveness
1 0.99** 0.65* 0.62** 0.800 3.58 4. Assurance
1 0.65** 0.65** 0.99** 0.95** 0.774 3.78 5. Empathy
1 0.44** 0.30** 0.28** 0.45** 0.50** 0.920 3.56 6. Customer
Satisfaction
Note: ** Correlation is significant at 0.01 level.
According to Table (4), the first issue examined was the different facets of SQ (tangibility,
reliability, responsiveness, assurance, and empathy). According to Table (4), among the various facets of
SQ, those who responded identified the presence of a tangibility (M=3.83, SD=0.742). This was followed by
reliability (M=3.79, SD=0.766), empathy (M=3.78, SD=0.774), assurance (M=3.58, SD=0.800), and
responsiveness (M=3.57, SD=0.789).
The second issue examined was the different facets of CS (satisfaction with the conduct of the
proceedings, satisfaction with the workers, and satisfaction with the services of the organization). Most of
the respondents identified the overall CS (M=3.56, SD=0.920).
According to Table (4), SQ dimensions have positive and significant relation with CS. The
correlation between SQ (tangibility) and CS is 0.509. For reliability and CS, the value is 0.451, whereas
responsiveness and CS show correlation value of 0.287. The correlation between SQ (assurance) and CS is
0.305 whereas empathy and CS show correlation value of 0.444. Finally, Table (4) proves that there is a
significant correlation between SQ and CS at Sadat University in Egypt.
4.3. The Relationship between SQ (Tangibility) and CS
The relationship between SQ (Tangibility) and CS at Sadat University in Egypt is determined. The
first hypothesis to be tested is:
There is no relationship between SQ (Tangibility) and CS at Sadat University in Egypt.

Impact Factor 3.582 Case Studies Journal ISSN (2305-509X) – Volume 5, Issue 8–Aug-2016
http://www.casestudiesjournal.com/ Page 176
Table (5) MRA Results for SQ (Tangibility) and CS
The Variables of SQ
(Tangibility) Beta R R2
1. The presence of equipment and sophisticated
equipment. 0.134
0.246 0.060
2. Convenient and attractive facilities and halls. 0.020 0.358 0.128
3. There is adequate parking space. 0.213
0.359 0.128
4. Appropriate overall appearance of the
organization of the nature and quality of
services provided. 0.393
0.491 0.241
MCC
DC
Calculated F
Degree of Freedom
Indexed F
Level of Significance
0.543
0.295
48.679
4, 465
3.31
0.000
** P < 0.01
Table (5) proves that there is a relationship between SQ (Tangibility) and CS at significance level of
0,000. As a result of the value of R2, the 4 independent variables of SQ (Tangibility) can explain 29.5% of
the total differentiation in CS level. For the results of a structural analysis of the MRA, the direct effect of
SQ (Tangibility) and CS is obtained. Because MCC is 0.543, it is concluded that there is enough empirical
evidence to reject the null hypothesis.
4.4. The Relationship between SQ (Reliability) and CS
The relationship between SQ (Reliability) and CS at Sadat University in Egypt is determined. The
second hypothesis to be tested is:
There is no relationship between SQ (Reliability) and CS at Sadat University in Egypt.
As Table (6) proves, the MRA resulted in the R of 0.528. This means that CS has been significantly
explained by the 5 independent variables of SQ (Reliability). Furthermore, the R2 of 0.279 indicates that the
percentage of the variable interprets the whole model, that is, 27.9%. It is evident that the five independent
variables of SQ (Reliability) justified 27.9% of the total factors of CS. Hence, 72.1% are explained by the
other factors. Therefore, there is enough empirical evidence to reject the null hypothesis.
Table (6) MRA Results for SQ (Reliability) and CS
The Variables of SQ
(Reliability) Beta R R2
1. Commitment to implement the work in the given
time. 0.375
0.480 0.230
2. Attention to the problems of customers by answering
their questions. 0.142
0.326 0.106
3. Care to provide the service correctly, and from the
first time. 0.065 0.356 0.126
4. Providing the service on the dates that have been
identified. 0.095
0.232 0.053
5. Availability of accurate documentation systems and
records. 0.179
0.286 0.081
MCC
DC
Calculated F
Degree of Freedom
Indexed F
Level of Significance
0.528
0.279
35.840
5, 464
3.01
0.000
** P < 0.01 * P < 0.05
4.5. The Relationship between SQ (Responsiveness) and CS

Impact Factor 3.582 Case Studies Journal ISSN (2305-509X) – Volume 5, Issue 8–Aug-2016
http://www.casestudiesjournal.com/ Page 177
The relationship between SQ (Responsiveness) and CS at Sadat University in Egypt is determined.
The third hypothesis to be tested is:
There is no relationship between SQ (Responsiveness) and CS at Sadat University in Egypt.
Table (7) MRA Results for SQ (Responsiveness) and CS
The Variables of SQ
(Responsiveness) Beta R R2
1. Informing customers accurately of dates of
service. 0.194
0.214 0.054
2. Permanent readiness to assist customers. 0.022 0.193 0.037
3. Short waiting period to provide the service to
customers. 0.094
0.181 0.032
4. Responding to customer complaints quickly. 0.137 0.203 0.041
MCC
DC
Calculated F
Degree of Freedom
Indexed F
Level of Significance
0.301
0.091
11.614
4, 465
3.31
0.000
* P < 0.05 * P < 0.05
Table (7) proves that there is a relationship between SQ (Responsiveness) and CS. As a result of the
value of R2, the 4 independent variables of SQ (Responsiveness) can explain 9% of the total differentiation
in CS level. For the results of a structural analysis of the MRA, the direct effect of SQ (Responsiveness) and
CS is obtained. Because MCC is 0.301, there is enough empirical evidence to reject the null hypothesis.
4.6. The Relationship between SQ (Assurance) and CS
The relationship between SQ (Assurance) and CS at Sadat University in Egypt is determined. The
fourth hypothesis to be tested is:
There is no relationship between SQ (Assurance) and CS at Sadat University in Egypt.
Table (8) MRA Results for SQ (Assurance) and CS
The Variables of SQ
(Assurance) Beta R R2
1. Behavior of employees makes customers
feel confident. 0.075 0.181 0.032
2. Clients have a sense of security in dealing
with the institution. 0.202
0.222 0.049
3. Workers deal with customers humanly and
decently. 0.177
0.232 0.053
4. Adequate knowledge to answer customer
questions is available. 0.016 0.208 0.043
MCC
DC
Calculated F
Degree of Freedom
Indexed F
Level of Significance
0.321
0.103
13.311
4, 465
3.31
0.000
** P < 0.01
Table (8) proves that there is a relationship between SQ (Assurance) and CS at significance level of
0,000.

Impact Factor 3.582 Case Studies Journal ISSN (2305-509X) – Volume 5, Issue 8–Aug-2016
http://www.casestudiesjournal.com/ Page 178
As a result of the value of R2, the 4 independent variables of SQ (Assurance) can explain 10.3% of
the total differentiation in CS level. For the results of a structural analysis of the MRA, the direct effect of
SQ (Assurance) and CS is obtained.
Because MCC is 0.321, it is concluded that there is enough empirical evidence to reject the null
hypothesis.
4.7. The Relationship between SQ (Empathy) and CS
The relationship between SQ (Empathy) and CS at Sadat University in Egypt is determined. The fifth
hypothesis to be tested is:
There is no relationship between SQ (Empathy) and CS at Sadat University in Egypt.
As Table (9) proves, the MRA resulted in the R of 0.518. This means that CS has been significantly
explained by the 5 independent variables of SQ (Empathy).
Furthermore, the R2 of 0.268 indicates that the percentage of the variable interprets the whole model,
that is, 26.8%. It is evident that the 5 independent variables SQ (Empathy) justified 26.8% of the total
factors of CS. Hence, 73.2% are explained by the other factors. Therefore, there is enough empirical
evidence to reject the null hypothesis.
Table (9) MRA Results for SQ (Empathy) and CS
The Variables of SQ
(Empathy) Beta R R2
1. Employees are personally interested in
customers. 0.382
0.480 0.230
2. Priorities of management and staff in the
organization include the supreme interests of
the clients. 0.145
0.326 0.106
3. Customers receive good treatment, respect and
appreciation of their circumstances. 0.068 0.356 0.126
4. Working hours are appropriate for each
customer. 0.096
0.232 0.053
5. Needs of customers are known. 0.143
0.246 0.060
MCC
DC
Calculated F
Degree of Freedom
Indexed F
Level of Significance
0.518
0.268
33.986
5, 465
3.01
0.000
** P < 0.01 * P < 0.05
5. Research Findings
The present study on analyzing the relationship between SQ and CS at Sadat University in Egypt
revealed the following results:
1. There is a positive and significant correlation between the SQ and CS. It is clear that there is interest
from the organization to provide services to quality, which is expected. They meet ambitions and CS,
and affect them. Therefore, this is reflected in the satisfaction. This is consistent with the finding about
the significant importance of SQ perceptions and the association between SQ and CS (Cronin, & Taylor,
1992; Taylor, & Baker, 1994). Also, customers have put the criteria of CS towards SQ provided by their
organizations. Fast and efficient service, confidentiality of organization, speed of transaction,
friendliness of organization personnel, accuracy of billing, billing timeliness, billing clarity, competitive
pricing, and SQ are the key factors which significantly affect customer's satisfaction (Hokanson, 1995).
Young customers places more emphasis on factors like the organization's reputation, friendliness of
organization personnel, convenient location, and availability of parking space in selecting their
organizations (Almossawi, 2001). Furthermore, CS is a decision made after experience while quality is
not the same. On the other hand, in CS literature, expectations for goods is “would”, while in SQ
literature, expectations for goods is “should”. Several researches have been done on the relation between

Impact Factor 3.582 Case Studies Journal ISSN (2305-509X) – Volume 5, Issue 8–Aug-2016
http://www.casestudiesjournal.com/ Page 179
SQ and CS: findings of some of these researches show that CS results in SQ (Parasuraman et al., 1988;
1991). In addition to that, there is a two-way relation between CS and SQ. Therefore, some
organizational researchers concluded that SQ is an important indicator of CS intentions. That is,
consumers may be loyal to the organization if it is viewed as generating satisfaction among other
consumers, particularly in credence products and services. This alone may create an amount of
unwillingness to switch. Finally, SQ is a key factor for CS. It is an important tool for organizations for
augmenting their income and market share (Sureshchandar et al., 2002; Muyeed, 2012).
2. There is a positive relationship between SQ and CS. This is consistent with the finding that SQ is one of
the most important aspects of the premium customer experience. Most organizations monitor their SQ on
a regular basis to ensure maximum CS. CS is attained by properly meeting the customer demands and
expectations and providing services which are up to the market standards (Gitomer, 1998). A positive
consumption experience of the customer ensures that his overall feelings for the products or services
consumed are positive. Also, SQ has been suggested as a strong predictor of CS by many organizational
researchers. SQ is a drive of the CS (Cronin et al., 2000).
6. Recommendations
The basic purpose of this research work is to put forward recommendations of practical nature rather
than just proposing research oriented work.
1. The need for credit and interest in improving the SQ provided to customers. This is in order to be able to
compete in the future and live up to the level of ambition of services provided.
2. Sadat University in Egypt should learn customers' point of view through questionnaires, among other
things, business research studies, or specialists in order to provide consulting services in order to check
the quality of services.
3. Sadat University in Egypt should pay much attention to CS, through the selection of skilled workers on
how to provide the service and earn CS, and design a training program for them in order to equip them
with knowledge and skills required to provide services.
4. Sadat University in Egypt is interested in how to facilitate business processes and reduce the time of
service to the customer through motivating employees and giving them the empowerment required for
the performance of their quality.
5. Sadat University in Egypt should know the need to respect the customer, and the staff should try to get
the information and suggestions or problems in order to improve service delivery and CS.
6. Sadat University in Egypt must try to maintain existing customers to gain their satisfaction. This is
because the cost of maintaining the current client is less as a cause of a new customer, and to maintain it
for a longer period. The customer is getting a sense of loyalty to the organization, thereby acting to
promote it and gain new customers. Attention must be paid to CS because it gets reflected on them and
affect their loyalty.
7. Sadat University in Egypt must adopt a win-win SQ strategy through which they provide value to the
customer and customer remains loyal to the organization. The value provided must keep in view the
satisfaction of the customers.
8. Sadat University in Egypt must understand and determine the factors that enhances CS. Surveys must be
conducted to obtain the data from the customers regarding their perceptions, expectations and
recommendations to improve the SQ. In other words, CS is a very much important factor that not only
forces the customers to remain loyal with the organization, but also proves as a marketing mechanism
through which other people are attracted towards the organization.
9. Sadat University in Egypt should look for the contemporary approaches of delivering quality services
through relationship management tactics. These approaches build a long term relationship with the
customer through the provision of premium quality services. In other words, traditional predictors of the
CS such as SQ still have a strong impact on the CS. So, these factors must be the core of the strategy
aiming at enhancing CS.
10. Sadat University in Egypt must think regarding developing a competitive edge which sets apart the
products and services of the organization in a distinctive way. Provision of premium quality services
holds upmost importance among the factors which can enable the organization to have a competitive
edge over the rivals successfully in today‟s market-driven system. In other words, innovating the
services according to the needs and demands of the customers is very much important. Customers must

Impact Factor 3.582 Case Studies Journal ISSN (2305-509X) – Volume 5, Issue 8–Aug-2016
http://www.casestudiesjournal.com/ Page 180
be the focus of every strategy. Sadat University in Egypt must think in terms of end result of their SQ
innovations. The focus should be on the long run.
7. Research Implications
The findings provide several managerial implications. The fundamental premise of the proposed
model was that retailers should understand comprehensively the critical factors necessary to achieve high
SQ that will significantly affect CS, and use them as diagnostic information. By recognizing and analyzing
these diagnostic indicators, retailers will be better able to formulate and implement their strategic plans.
According to Hansen & Bush (1999), a great success will result from a strategy that concentrates on
one targeted dimension of SQ, rather than from one in which the retail firm improves marginally on all of
the dimensions. The interpretation of the research model has the potential to help retailers better understand
how customers assess the SQ and how their service campaigns influence CS. Learning the uncovered
relationships between SQ and CS, retailers can effectively allocate their resources and develop a rational
plan to improve their SQ under specific business circumstances.
It is recognized that with improvement of CS, customers will be more loyal. By the referring of loyal
customers, the organizations can attract more customers. Managers are advised to satisfy and better manage
their relationships through quality product and service offerings to their customers as a competitive policy in
the marketplace. Sadat University is required to offer products/services that meet or surpass consumers‟
expectation.
8. Research Limitations
Although the results presented in this study are useful in understanding the relationships between SQ
and CS, there are several limitations that need to be addressed. They are as follows:
1. The sampling frame includes the employees at Sadat University in Egypt. This may lead to loss of
generalizability. Although the sample used appears homogenous and yielded reliable data, it would be
better to include more demographic control variables, which lead to more generalizable results and allow
possible segmentation in terms of SQ and CS. Further studies should use a more representative sample
of whole retail customers‟ population, which lead to more sound and comprehensive findings.
2. The data was collected at single point in time. Although all the proposed hypotheses were based on
previous research studies and evidences shown in the previous literature, it is not possible to explain
causal relationships among the variables of the study due to the absence of a longitudinal research
design. Hence, the findings of the study are not an evidence for explaining causal relationships among
variables.
3. This study may be of significant importance both in contributing to the literature and as far as
organizations are concerned. An important strategy for 21st century organizations must be the provision
of premium quality services in order to keep the CS and subsequently to survive and compete in today‟s
dynamic and competitive corporate environment effectively.
9. Conclusions
SQ is one of the most important factors in identifying new customer needs and, the key to CS is
providing the customers with their undiscovered needs (Chai & colleagues. 2009).
SQ is an excellent technique for enhancing CS to the organization in today‟s competitive
environment. The main objective of this study is to determine the impact of various SQ dimensions on CS.
While several authors have emphasized the multidimensional nature of SQ and CS, this research sought to
establish the relationship between SQ and CS.
Sadat University in Egypt can benefit from the fact of knowing how customers perceive the SQ and
knowing the way of how to measure SQ. Therefore, the management can use the specific data obtained from
the measurement of SQ in their strategies and plans. This will help Sadat University in Egypt to better
understand various SQ that affect CS. In this way, Sadat University in Egypt can better allocate resources to
provide better service to their customers. Thus, understanding CS with SQ is very important and
challenging.
Sadat University in Egypt is facing so many challenges i.e. increase in customers‟ demands and
expectations coupled with provision of premium quality services (Ettorre, 1994; Joseph & Walker, 1988;
JA, 1983; and Leonard & Sasser, 1982). Moreover, customers are behaving more critically to the SQ
practices prevailing in organizations (Albrecht & Zemke, 1985). Increasing customer demands together with

Impact Factor 3.582 Case Studies Journal ISSN (2305-509X) – Volume 5, Issue 8–Aug-2016
http://www.casestudiesjournal.com/ Page 181
ever growing competition are compelling Sadat University in Egypt to adapt new competitive and
innovative ways which will help them to take the lead in the market place in the form of loyal customer-base
(Sellers, 1989).
A key element of CS is the nature of the relationship between the customer and the provider of the
products and services. Thus, both product and SQ are commonly noted as a critical prerequisite for
satisfying and retaining valued customers. Previous research has identified many factors that determine CS,
but there are differences in how consumers perceive services across countries and cultures that cannot be
generalized.
The organization's ability to deliver these benefits on a continuous basis probably has a significant
impact on the level of CS. Therefore, Sadat University in Egypt has to identify and improve factors that can
increase customer value. It is not sufficient to focus on satisfying customers, as customers switched their
financial institutions because of SQ problems and failures (Gerrard, & Cunningham, 1997), and stop the use
of a financial service provider because of poor service performance (Allred, & Addams, 2000).
This attitude is a significant factor, which influences customer intention to engage in positive or
negative behavior decisions. Consequently, CS is a necessary prerequisite for building long term customer
relationships and likely to increase loyalty (Anthanassopoulos et al., 2001; Selnes, 1993; Bloemer, &
Ruyter, 1998).
SQ and all its dimensions such as tangibility, reliability, responsiveness, assurance and empathy have
significant and positive association with CS towards their respective financial service providing
organizations.
CS is a popular concept in several areas like marketing, consumer research, economic psychology,
welfare-economics, and economics. The most common interpretations obtained from various authors reflect
the notion that satisfaction is a feeling which results from evaluation process of what has been received
against what was expected, including the purchase decision itself and the needs and wants associated with
the purchase (Armstrong & Kotler, 1996). CS secures future revenues (Fornell, 1992; Bolton, 1998), reduces
future transactions costs (Reichheld & Sasser, 1990), decreases price elasticity (Anderson, 1996), and
minimizes the likelihood of customers defecting if quality falters (Anderson & Sullivan, 1993).
SQ has been admired by the organizational researchers all around the globe as a competitive weapon
which differentiates the organization from its rivals in a much positive way by enabling the service
organizations to delight the customers through the provision of premium quality services on consistent basis
and subsequently enhance their CS (Naik et al., 2010; Wisniewski, 2001; Curry & Herbert, 1988; and
Zeithaml, 1988).
CS is the degree to which customer expectations of a products or services are met or exceeded.
Therefore, any business, especially service providers in a competitive environment without a focus on CS,
will remain irrelevant in the marketplace, and experience low customer patronage, poor customer retention,
loyalty and recommendation.
References
Anderson, E. W., Fornell, C. & Lehmann, D. R. (1994). Customer satisfaction, market share, and
profitability: Findings from Sweede. Journal of Marketing, 58(3), 53-66.
http://dx.doi.org/10.2307/1252310
Angelova, B. and Zekiri, J. (2011). Measuring Customer Satisfaction with Service Quality Using American
Customer Satisfaction Model (ACSI Model), International Journal of Academic Research in Business
and Social Sciences Vol. 1, No. 3, 232-258.
Athanassopoulos, A., Gounaris, S., Stathakopoulos, V., (2001) Behavioural responses to customer
satisfaction: an empirical study, European Journal of Marketing, Vol. 35 Iss: 5/6, PP. 687-707.
Aydin, S., & Özer, G. (2005). The analysis of antecedents of customer loyalty in the Turkish mobile
telecommunication market. European Journal of Marketing, 39(7/8), 910-925.
Babakus, E., & Boller, G. W. (1992). An empirical assessment of the SERVQUAL scale. Journal of
Business research, 24(3), 253-268.
Bastos, J A.R., and Gallego, P.M (2008). Pharmacies Customer Satisfaction and Loyalty: A Framework
Analysis. Journal of Marketing. Universidad de Salamanca Bloemer, J. M. M., & Kasper, H. D. P.

Impact Factor 3.582 Case Studies Journal ISSN (2305-509X) – Volume 5, Issue 8–Aug-2016
http://www.casestudiesjournal.com/ Page 182
(1995). The complex relationship between consumer satisfaction and brand loyalty. Journal of
Economic Psychology, 16, 311-329.
Berry, L., Zeithaml, V. and Parasuraman, A., (1988). The Service Quality Puzzle, Business Horizons, 31(5)
35-43.
Beverly K.K., Diane M. Strong, and Richard, Y.W., (2002). Information Quality Benchmarks: Product and
Service Performance. Communications of the ACM, Vol. 45, No. 4ve
Bitner, M. J. & Zeithaml, V. A. (2003). Service Marketing (3rd
ed.), Tata McGraw Hill, New Delhi.
Bloemer, J., DeRuyter, K., and Wetzels, M. (1999). Linking Perceived Service Quality and Service Loyalty:
A Multi-Dimensional Perspective. European Journal of Marketing, 33, 1082–1106.
http://dx.doi.org/10.1108/03090569910292285.
Bolton, R. N., & Drew, J. H. (1991). A multistage model of customers' assessments of service quality and
value. Journal of Consumer Research, 17(4), 375-384.
Bolton, R.N. and Lemon, K.N. (1999). A dynamic model of customers‟ usage of services: Usage as an
antecedent and consequence of satisfaction. Journal of Marketing Research, 36, 171–186.
http://dx.doi.org/10.2307/3152091.
Boselie, P., Hesselink, M. and Wiele, T.V (2002). Empirical evidence for the relationship between
Customer Satisfaction and Business Performance. Managing Service Quality, 12 (3), 184-193.
http://dx.doi.org/10.1108/09604520210429259
Brensinger, R. P., & Lambert, D. M. (1990). Can the SERVQUAL scale be generalized to business-to-
business services?. In Knowledge Development in Marketing, 1990. AMA‟s Summer Educators‟
Conference Proceedings, 289.
Brown, S.W. & Swartz, T. (1989). “A Gap Analysis of Professional Service, Quality” Journal of Marketing,
Vol. 53 (2) pp. 92-8. Cronin, J. J., and Taylor, S. A. (1992). Measuring Service Quality: A
Reexamination and Extension. Journal of Marketing, 56 (3), pp 55–68.
Cardozo, R. N. (1965). Journal of Marketing Research: An Experimental Study of Customer Effort,
Expectation, and Satisfaction. Retrieved 10 November, 2014.
<http://www.jstor.org/discover/10.2307/3150182?sid=21105247870381&uid=3737976&uid=4&uid=2
>
Caruana, A. (2002). Service Loyalty: The Effects of Service Quality and the Mediating role of Customer
Satisfaction. European Journal of Marketing, 36(7), 811-828.
Cavana, R., Corbett, L., & Lo, Y. (2007). Developing zones of tolerance for managing passenger rail
services quality. International Journal of Quality Reliablility Management , 7-31.
Chau, V., & Kao, Y. (2009). Bridge over troubled water or long and winding road? Gap-5 in airline service
quality performance measures. Managing Service Quality , 114-134.
Crompton, J. L., & Mackay, K. J. (1989). Users' perceptions of the relative importance of service quality
dimensions in selected public recreation programs. Leisure Sciences, 11(4), 367-375.
Cronin, J. J. & Taylor, S. A. (1992). Measuring Service Quality: A Reexamination and Extension. Journal
of Marketing, Vol. 56, No. 3, 55-68.
Crosby, P.B. (1984) “Quality without tears: The art of hassle-free management”. McGraw-Hill, New York.
Czepiel, J., (1990). Managing Relationships with Customers: A Differentiation Philosophy of Marketing, in
Service Management Effectiveness, D. E. Bowen, R. B. Chase, and T. G. Cummings, eds. San
Francisco: Jossey-Bass, 299-323..
Dabholkar, P A; Thorpe, D I and Rentz, J O (1996). “A Measure of Service Quality for Retail Stores: Scale
Development and Validation,” Journal of the Academy of Marketing Science, 24(1), 3-16
Davis, G., Yoo, M., and Baker, W., (2003). The Small World of the American Corporate Elite, 1982-2001”
Strategic Organization, 1 (3), 301-326.
Dotchin, J. A. & Oakland, J. S. (1994). “Total Quality Management in Services Part 2: Service. Quality”.
International Journal of Quality & Reliability Management, 11 (3), 27-42.
Eiglier, P and Langeard, E (1987). Servunction, Les Marketing des Services, Paris: McGraw-Hill.
Evans, J. R., & Lindsay, W. M. (1996). The Management and Control of Quality. 3rd ed., St. Paul: West
Publishing Company.
Finn, D. W., & Lamb, C. W. (1991). An evaluation of the SERVQUAL scales in a retailing setting.
Advances in consumer research, 18(1), 483-490.

Impact Factor 3.582 Case Studies Journal ISSN (2305-509X) – Volume 5, Issue 8–Aug-2016
http://www.casestudiesjournal.com/ Page 183
Fornell, C., Johnson, M.D., Anderson, E.W., Cha, J. and Everitt-Bryant, B. (1996). The American Customer
Satisfaction Index: nature, purpose, and findings. Journal of Marketing, 60(4), 7-18.
http://dx.doi.org/10.2307/1251898.
Ganiyu, R. Uche, I. and Elizabeth, A. (2012). Is Customer Satisfaction an Indicator of Customer Loyalty?,
Australian Journal of Business and Management Research, 2 (7), PP. 14-20.
Ganiyu, R. Uche, I. and Elizabeth, A., (2011). Is Customer Satisfaction an Indicator of Customer Loyalty?,
Australian Journal of Business and Management Research, Vol.2 No.07, PP. 14-20.
Gantasala, N., & Prabhakar, S., (2010). Service quality (SERVQUAL) and its effect on customer
satisfaction in retailing. European Journal of Social Sciences, 16(2), 231-243.
Garland, R., & Gendall, P. (2004). Testing Dick and Basu's customer loyalty model. Australasian , 81-87.
Garvin, D. A. (1983). Quality on the line. Harvard Business Review, 61 (September – October), 65-73.
Geyskens, I., J. Steenkamp, L. Scheer, and N. Kumar, (1996). “The Effects of Trust and Interdependence on
Relationship Commitment: a Trans-Atlantic Study,” International Journal of Research in Marketing,
Vol. 13, 4:303-317.
Giese, J. and J. Cote, (2002). Defining consumer satisfaction,” Academy of Marketing Science Review
Volume, 2000 No.1, Available: http://www.amsreview.org/articles/giese01-2000.pdf - Academy of
Marketing Science.
Gitomer, J. (1998). Customer Satisfaction Is Worthless, Customer Loyalty Is Priceless: How to Make
Customers Love You, Keep Them Coming Back and Tell Everyone They Know. Bard Press TX, the
United States of America.
Goodman, J. A. (2009). Strategy Customer Service: managing the customer experience to increase positive
word of mouth, build loyalty, and maximize profits. New York: AMACOM.
Grisaffe, D. (2001). Loyalty - attitude, behavior, and good science: a third take on Neal-Brandt debate.
Journal of Consumer Satisfaction, Dissatisfaction and Complaining Behavior, 14, 55-59.
Gronroos, C. (1984). A service quality model and its marketing implications. European Journal of
Marketing, 18(4), 36-44. http://dx.doi.org/10.1108/EUM0000000004784
Gronroos, C. (1990). Relationship approach to marketing in service contexts. Journal of Business Research,
20(1), 3-11. http://dx.doi.org/10.1016/0148-2963(90)90037-E
Gronroos, C. (1990). Service Management and Marketing: Managing the Moment of Truth in Service
Competition. Lexington: Lexington Books.
Gronroos, C. (2000). Service management and marketing. John Wiley & sons Ltd.
Grönroos, C. (2001). “The perceived service quality concept - a mistake?” Managing Service Quality, 11
(3), 150- 152.
Grönroos, C. (2004). The relationship marketing process: communication, interaction, dialogue, value.
Journal of Business & Industrial Marketing, 19(2), 99-113.
Gummesson, E. (1998). Productivity, quality and relationship marketing in service operations. International
Journal of Contemporary Hospitality Management, 10(1), 4-15. http://dx.doi.
org/10.1108/09596119810199282
Guo, L., Xiao, J. J., & Tang, C. (2009). Understanding the psychological process underlying customer
satisfaction and retention in a relational service. Journal of Business Research, 63, 1152-1159.
Hallowell, R. (1996). The relationships of customer satisfaction, customer loyalty and profitability: An
empirical study. International Journal of Service Industry Management, Vol. 7 No. 4, pp. 27-42.
Hansemark, O. C. & Albinson, M. (2004). Customer Satisfaction and Retention: The Experiences of
Individual with Employees. Managing Service Quality, 14 (1), 40-57.
Henkel, D., Houchaime, N., Locatelli, N., Singh, S., Zeithaml, V., & Bittner. (2006). The Impact of
Emerging WLANs on Incumbent Cellular Service Providers in the U.S. Service Marketing. Singapore:
McGraw-Hill.
Heskett, J. L., Sasser, W. E., & Schlesinger, L. A. (1997). The service profit chain: How leading companies
link profit and growth to loyalty, satisfaction and value. New York, NY: Free Press.
Howard, R. & Sheth, E. (1969). Perception of consumer level of satisfaction. Journal of Business
Management, 3 (2), 101-121.
Hoyer, W. D., & MacInnis, D. J. (2001). Consumer Behaviour. 2nd ed., Boston: Houghton Mifflin
Company.

Impact Factor 3.582 Case Studies Journal ISSN (2305-509X) – Volume 5, Issue 8–Aug-2016
http://www.casestudiesjournal.com/ Page 184
Ismail, I., Haron, H., Ibrahim, D. N., & Isa, S. M. (2006). Service quality, client satisfaction and loyalty
towards audit firms: Perceptions of Malaysian public listed companies. Managerial Auditing Journal,
21(7), 738-756.
Jamal, A., & Naser, K. (2002). Customer satisfaction and retail banking: an Assessment of Some of the Key
Antecedents of Customer Satisfaction in Retail Banking. International Journal o Bank Marketing,
20(4), 146-160.
Johnson, L. L., Dotsm, M., & Dunlap, B. J. (1988). Service quality determinants and effectiveness in the
real estate brokerage industry. Journal of Real Estate Research, 3(2), 21-36.
Johnson, M. D. & Fornell, C. (1991). A framework for comparing customer satisfaction across individuals
and product categories. Journal of Economic Psycholog y, 12(2), 267-286.
http://dx.doi.org/10.1016/0167-4870(91)90016-M
Kotler, P. (2000). Marketing Management. 10th
ed., New Jersey: Prentice-Hall.
Kotler, P. (2006). Marketing management. (12th
ed.). NY: Prentice Hall.
Kotler, P., & Armstrong, G. (2010). Principles of Marketing. New Yersey: Upper Saddle River.
Kotler, P., G. Armstrong, J. Saunders and V. Wong (1999): Principle of Marketing, 2nd European Edition,
Prentice-Hall, London.
Kotler, P., Keller, K. L., Koshy, A., & Jha, M. (2009). Marketing management: A South Asian perspective
(13th ed.). New Delhi, DL: Pearson Prentice Hall.
LaBarbera, P. A., & Mazursky, D. (1983). A Longitudinal Assessment of Consumer Satisfaction,
Dissatisfaction: the Dynamic Aspect of Cognitive Process. Journal of Marketing Research, 20, 393-
404.
Lai, T. L. (2004). Service Quality and Perceived Value's Impact on Satisfaction, Intention and Usage of
Short Message Service (SMS). Information Systems Frontiers: Special Issue: Industrial Information
Systems Frontiers, 6(4), 353-368.
Landrum, H., Prybutok, V. R. Kappelman, L. A., & Zhang, X. (2008). SERVCESS: A parsimonious
instrument to measure service quality and information system success. The Quality Management
Journal, 15(3), 17-25.
Langdridge, D. (2004). Introduction to Research Methods and Data Analysis. Harlow: Pearson Education.
Levesque, T., & McDougall, G. H. G. (1996). Determinants of customer satisfaction in retail banking. Int. J.
Bank. Mark., 14(7), 12-20.
Lewis, B. R. & Mitchell, V. W. (1990). “Defining and measuring the quality of customer service”‟.
Marketing Intelligence & Planning, 8 (6), 11-17.
Lin, J. S. C., & Wu, C. Y. (2011). The role of expected future use in relationship-based service retention.
Managing Service Quality, 2 (5), 535-551.
Liu, C.H and Yen, L.C (2010). The effects of service quality, tourism impact, and tourist satisfaction on
tourist choice of leisure farming types. African Journal Business Management, 4(8), 1529-1545.
Michael, D. C., Christopher, G., Tzu-Hui, K. and Michelle, C. (2008). An empirical analysis of customer
satisfaction in international air travel, Innovative Marketing, 4(2), 2008.
Mittal, V., & Kamakura, W.A. (2001). Satisfaction, Repurchase Intent, and Repurchase Behavior:
Investigating the Moderating Effect of Customer Characteristics, Journal of Marketing Research, Vol.
38(1), 131-142.
Munusamy, J., Chelliah, S. and Mun, H., 2010, Service Quality Delivery and Its Impact on Customer
Satisfaction in the Banking Sector in Malaysia, International Journal of Innovation, Management and
Technology, 1 (4), 398-404.
Naeem, H., & Saif, I. (2009). Service Quality and Its Impact on Customer Satisfaction: An Empirical
Evidence from the Pakistani Banking Sector. The International Business and Economics Research
Journal, 8 (12), 99.
Nitecki, D. A., & Hernon, P. (2000). Measuring service quality at Yale University‟s libraries. Journal of
Academic Librarianship, 26 (4), 259-273.
Nyer, P. (1999). Cathartic complaining as a means of reducing consumer dissatisfaction, Journal of
Complaining Behavior, 12, 15-25.
Oliver, R. L. (1997). Satisfaction: A Behavioral Perspective on the Consumer, McGraw-Hill, New York,
NY.

Impact Factor 3.582 Case Studies Journal ISSN (2305-509X) – Volume 5, Issue 8–Aug-2016
http://www.casestudiesjournal.com/ Page 185
Oliver, R. L. (1999). Whence consumer loyalty? Journal of Marketing, 63, 33-44. http://dx.doi.
org/10.2307/1252099
Oliver, R.L. (1987), An investigation of the interrelationship between consumer dissatisfaction and
complaining reports, in Wallendorf, M. and Anderson, P. (Eds), Advances in Consumer Research,
Vol. 14, Association of Consumer Research, Provo, UT, pp. 218-22.
Oliver, Richard (1981), "Measurement and Evaluation of Satisfaction Process in Retail Settings," Journal of
Retailing, 57, pp 25-48
Parasuraman, A. & Berry, L. L. (1991). Marketing for Services: Competing through Quality. The Free
Press, New York, NY.
Parasuraman, A., Berry, L.L & Zeithaml, V (1985). A conceptual model of service quality and the
implications for future research. Journal of Marketing Management, 49, 41-51.
Parasuraman, A., Zeithaml, V. A. and Berry, L. L. (1988). SERVQUAL: A multipleitem scale for
measuring consumer perceptions of service quality. Journal of Retailing, 64, 12–40.
Parasuraman, A., Zeithaml, V.A. & Berry, L.L. (1994). Alternative scales for measuring service quality: a
comparative assessment based on psychometric and diagnostic criteria. Journal of Retailing, 70(3),
201-230.
Payne, A. (1993). The essence of Services marketing, Prentice-Hall, Hemel Hempstead, UK
Ram, S., and Jung, H. S. (1991). How product usage influences customer satisfaction. Marketing Letters, 2,
403–411. http://dx.doi.org/10.1007/BF00664226.
Rauyruen, P., Miller, K. E., & Barrett, N. J. (2007). Relationship Quality as a Predictor of B2B Loyalty.
Journal of Business Research , 21-32.
Reichheld F, F. (1996) The Loyal Effect, Harvard Business School Press, Boston.
Reichheld FF & Sasser WE, (1990), “Zero Defections: Quality Comes to Services”, Harvard Business
Review, September-October, 105-111
Rust, R. T. & Zahorik, A. J. (1995). Customer Satisfaction, Customer Retention and Market Share. Journal
of Retailing, Vol. 69, No. 2, 193-215.
Sasser W. E., Olsen R. P., Wyckoff D. D. (1978), "Management of Service Operations", Allyn & Bacon,
Boston.
Schmitt, B. H. (2003). Customer Experience Management: A revolutionary approach to connecting with
your customers. New Jersey: John Wiley & Sons.
Sivadas, E, and Baker-Prewitt, J. (2000) An examination of the relationship between service quality,
customer satisfaction, and store loyalty, International Journal of Retail & Distribution Management,
Vol. 28,No 2, pp73-82.
Spohrer, J. & Maglio, P. (2008). The emergence of service science: Toward systematic service innovations
to accelerate co-creation of value. Production and Operations Management, 17(3), 238-246.
Sureshchandar, G. S., Rajendran, C., & Anantharaman, R. N. (2002). Determinants of customer-perceived
service quality: a confirmatory factor analysis approach. Journal of Services Marketing, 16(1), 9-34.
Tse, David K. and Peter C. Wilton. 1988. "Models of Consumer Satisfaction: An Extension," Journal of
Marketing Research , 25 (May:204-212.
Veldhuisen, J. (2011). Ijzersterke universeel toon haarscheurtjes. Aftersales Magazine, PP. 91-92.
Veloutsou, C., Gilbert, G. R. Mountinho, L. A. & Goode, M. M. E. (2005). Measuring transaction specific
satisfaction in services: Are the measures transferable across cultures?European Journal of Marketing
(39).
Webster, C. (1989). Can consumers be segmented on the basis of their service quality expectations?. Journal
of Services marketing, 3(2), 35-53.
Westbrook, Robert A. (1980), “A Rating Scale for Measuring Product/Service Satisfaction,” Journal of
Marketing, 44 (Fall), 68-72.
Wisniewski, M. (2001). Using SERVQUAL to assess customer satisfaction with public sector services.
Managing Service Quality, 11(6), 380-388.
Woodcock, N. & Stone, M. & Foss, B. (2003). The Customer Management Scorecard: Managing CRM for
profit. London: Kogan Page.
Woodside, A. G., Frey, L. L., & Daly, R. T. (1989). Linking service quality, customer satisfaction, and
behavioral intention. Journal of health care marketing, 9(4), 5-17.

Impact Factor 3.582 Case Studies Journal ISSN (2305-509X) – Volume 5, Issue 8–Aug-2016
http://www.casestudiesjournal.com/ Page 186
Yi, Y. (1989). A Critical Review of Consumer Satisfaction, Review of Marketing. V.A. Zeithaml. Chicago,
American Marketing Association: 68-123.
Yi, Y. (1990). “A critical review of consumer satisfaction”, in Zeithaml, V. (Ed.), Review of Marketing,
1990, American Marketing Association, Chicago, IL, pp. 68-123.
Yu, Y.-T., & Dean, A. (2001). The conribution of emotional satisfaction to customer loyalty. International
Journal of Science Industry Management , 234-250.
Zairi, M. (2000). Managing Customer Dissatisfaction Through Effective Complaint Management Systems.
The TQM Magazine, 12 (5), 331-335.
Zeithalm, V. A., Wilson, A., & Bitner, M. J. (2008). Service Marketing. New Dehli: John Wily and Sons,
Inc.
Zeithaml V. A. (1981). How Consumer Evaluation Processes Differ between Goods and Services. Reprinted
in Lovelock, C. (1991). Services Marketing. Prentice Hall: Upper Saddle River, New Jersey.
Zeithaml, V. A. (1988). Consumer perceptions of price, quality, and value: a means- end model and
synthesis of evidence. The Journal of Marketing, 52(3), 2-22.
Zeithaml, V. A., Berry, L. L. & Parasuraman A. (1996). The Behavioral Consequences of Service Quality.
Journal of Marketing, 60(2), 31-46. http://dx.doi.org/10.2307/1251929
Zeithaml, V. A., Parasuraman, A., Berry, L. L. (1990). Delivering Quality Service: Balancing Customer
Perceptions and Expectations, The Free Press, New York: NY.
Zeithaml,V. A., Berry,L. L. and Parasuraman, A. (1996). The behavioral consequences of service quality.
Journal of Marketing, 60, 31–46. http://dx.doi.org/10.2307/1251929.