Embed Size (px)
Citation preview

Volume 47 Number 4
August/September 2016
7 Project Society: Paths and ChallengesRolf A. Lundin
16 Making Sense of Rework Causation in Offshore Hydrocarbon ProjectsPeter E. D. Love, Fran Ackermann, Jim Smith, Zahir Irani, and David J. Edwards
29 A Study on Complexity and Uncertainty Perception and Solution Strategies for the Time/Cost Trade-Off ProblemMathieu Wauters and Mario Vanhoucke
51 The Impact of Residual Risk and Resultant Problems on Information Systems Development Project PerformanceRussell Purvis, Raymond M. Henry, Stefan Tams, Varun Grover, John D. McGregor, and Steve Davis
68 Application of Net Cash Flow at Risk in Project Portfolio SelectionMasoud Mohammad Sharifi and Mojtaba Safari
79 Balancing Open and Closed Innovation in Megaprojects: Insights from CrossrailThomas Worsnop, Stefano Miraglia, and Andrew Davies
95 Expertise Coordination in Information Systems Development Projects: Willingness, Ability, and BehaviorJack Shih-Chieh Hsu, Yu Wen Hung, Sheng-Pao Shih, and Hui-Mei Hsu
PMJ_87569728_47_4_Aug_Sept_2016.indb 1 9/19/16 3:44 PM
PMI is a nonprofit professional orga-nization whose mission is to serve the professional interests of its collective membership by: advancing the state of the art in the leadership and prac-tice of managing projects and pro-grams; fostering professionalism in the management of projects; and advocating acceptance of project management as a profession and discipline.
PublisherDonn Greenberg [email protected]
Product EditorRoberta Storer [email protected]
Copy EditorLinda R. Garber [email protected]
Publications Production AssociateKim Shinners
Publications Production SupervisorBarbara Walsh [email protected]
Book Review EditorKenneth H. Rose, PMP
Manager, Academic ResourcesCarla M. Messikomer, PhD [email protected]
Academic Research AdministratorJake Williams [email protected]
© 2016 Project Management Institute, Inc. All rights reserved.“PMI” the PMI logo, “Making project management indispensable for business results,” “PMI Today,” “PM Network,” “Project Management Journal,” “PMBOK,” “CAPM,” “Certified Associate in Project Management (CAPM),” “PMP,” the PMP logo, “PgMP,” “Program Management Professional (PgMP),” “PMI-RMP,” “PMI Risk Management Professional (PMI-RMP),” “PMI-SP,” “PMI Scheduling Professional (PMI-SP),” and “OPM3” are registered marks of Project Management Institute, Inc.The PMI Educational Foundation logo and “Empowering the future of project management” are registered marks of The PMI Educational Foundation. For a comprehensive list of PMI marks, contact the PMI Legal Department.
Project Management Journal®
Mission StatementThe Project Management Journal’s mission is to shape world thinking on the need for and impact of managing projects by publishing cutting-edge research to advance theory and evidence-based practice.
Projects represent a growing proportion of human activity in large, small, private, or public organizations. Projects are used to execute and sustain today’s organizational activities. They play a fundamental role as the engine of tomorrow’s innovation, value creation, and strategic change. However, pro-jects too often fail to deliver on their promise.
PMJ addresses these multiple challenges and opportunities by encour-aging the development and application of novel theories, concepts, frame-works, research methods, and designs. PMJ embraces contributions both from within and beyond project management to augment and transform theory and practice.
The Journal welcomes articles on projects, programs, project portfolios; megaprojects; project-based organizations, project networks, project busi-ness, and the projectification of society.
It welcomes the following topics, but not limited to: governance; strategy; innovation and entrepreneurship; organizational change, learning, capabili-ties, routines, information systems and technology; complexity and uncer-tainty; ethics; leadership; teams; and stakeholder management in a wide range of contexts.
Editor-in-Chief of Project Management Journal ®
Hans Georg Gemünden, Dr. rer. oec. habil., Dr. h.c. rer. oec. et soc., Professor of Project Management, BI – Norwegian Business SchoolDepartment of Leadership & Organization, Oslo, Norway
The Editors of Project Management Journal ®
Monique Aubry – University of Quebec at MontrealTim Brady – University of Brighton Andrew Davies – University College LondonSerghei Floricel – University of Quebec at MontrealCecil Eng Huang Chua – University of Auckland, Business SchoolCatherine Killen – University of Technology, SydneyGary Klein – University of Colorado, Colorado SpringsAlexander Kock – TU Darmstadt, Law and EconomicsJaakko Kujala – University of OuluChristophe Midler – École PolytechniqueRalf Müller – BI Norwegian Business SchoolFred Niederman – Saint Louis UniversityJonas Söderlund – BI Norwegian Business SchoolJohn Steen – University of Queensland Business School
PMJ_87569728_47_4_Aug_Sept_2016.indb 2 9/19/16 3:44 PM
August/September 2016Volume 47, Number 4
3 From the Editor Hans Georg Gemünden, Dr. rer. oec. habil., Dr. h.c. rer. oec. et soc., Professor of Project
Management, BI – Norwegian Business School Department of Leadership & Organization, Oslo, Norway
PAPERS
7 Project Society: Paths and ChallengesRolf A. Lundin
16 Making Sense of Rework Causation in Offshore Hydrocarbon ProjectsPeter E. D. Love, Fran Ackermann, Jim Smith, Zahir Irani, and David J. Edwards
29 A Study on Complexity and Uncertainty Perception and Solution Strategies for the Time/Cost Trade-Off ProblemMathieu Wauters and Mario Vanhoucke
51 The Impact of Residual Risk and Resultant Problems on Information Systems Development Project PerformanceRussell Purvis, Raymond M. Henry, Stefan Tams, Varun Grover, John D. McGregor, and Steve Davis
68 Application of Net Cash Flow at Risk in Project Portfolio SelectionMasoud Mohammad Sharifi and Mojtaba Safari
79 Balancing Open and Closed Innovation in Megaprojects: Insights from CrossrailThomas Worsnop, Stefano Miraglia, and Andrew Davies
95 Expertise Coordination in Information Systems Development Projects: Willingness, Ability, and BehaviorJack Shih-Chieh Hsu, Yu Wen Hung, Sheng-Pao Shih, and Hui-Mei Hsu
116 Calendar of Events
117 Project Management Journal ® Author Guidelines
The Book Review Section can be found online.
Cover to Cover—Book ReviewsKenneth H. Rose, PMP
T h e P r o f e s s i o n a l R e s e a r c h J o u r n a l o f t h e P r o j e c t M a n a g e m e n t I n s t i t u t e
PMJ_87569728_47_4_Aug_Sept_2016.indb 1 9/19/16 3:44 PM
MANUSCRIPTSAll manuscripts must be submitted electronically via the journal’s Manuscript Central site (http://mc.manuscriptcentral.com/pmj). Questions regarding submission guidelines and manuscript status should be sent to Kim Shinners (kim [email protected])
All manuscripts submitted to the journal via Manuscript Central are assumed for publication and become the copyright property of PMI if pub-lished. All articles in the Journal are the views of the authors and are not necessarily those of PMI.
Subscription rate for members is US$14 per year and is included in the annual dues. Membership in PMI is open to all at an annual dues rate of US$129. For information on PMI pro-grams and membership:
Project Management Institute, 14 Campus Blvd, Newtown Square, PA 19073-3299 USA; Tel: 11-610-356-4600; Fax: 11-610-482-9971; E-mail: [email protected]; Website: PMI.org; Toll-free: 1-855-746-7879 (United States), 1-855- 746-4849 (Canada), 1-800-563-0665 (Mexico)
PMI Asia Pacific Service Centre, Singapore; Tel: 165 6496 5501; E-mail: [email protected]
PMI Europe-Middle East-Africa (EMEA) Service Centre, Lelystad, The Netherlands; Tel: 131 320 239 539; E-mail: [email protected]; Toll-free Numbers: 00-800-7464-8490 for Austria, Belgium*, Bulgaria*, Czech Republic*, Denmark, Estonia*, Finland, France, Germany, Hungary, Iceland, Ireland, Italy, Latvia*, Lithuania*, Luxembourg, Malta*, Netherlands, Norway, Poland, Portugal, Russia*, Slovak Republic*, Slovenia*, Spain, Sweden*, Switzerland, United Kingdom, Vatican City; 00-800-4414-3100 for Cyprus, Greece; 131 320 239 539 (toll number) for Andorra, Belarus, Bosnia and Herzegovina, Croatia, Liechtenstein, Macedonia, Moldova, Monaco, Romania, Serbia and Montenegro, Ukraine.
Use the toll number (131 320 239 539) from mobile phones in these countries.
PMI India Service Centre, New Delhi, India; Tel: 191 124 4517140; E-mail: (membership-related que-ries): [email protected]
Other Locations: Beijing, China; Shenzhen, China; Montevideo, Uruguay; Bengaluru, India; Porto Alegre, Brazil; Mumbai, India; Washington, DC, USA, Brussels, Belgium. See www.pmi.org/AboutUS /Pages?Customer-Care.aspx for con-tact details.
The Project Management Journal (Print ISSN 8756-9728).
Copyright © 2016 Project Management Institute, Inc. All rights reserved. No part of this publication may be repro-duced in any form or by any means, except as permitted under Section 107 or 108 of the 1976 United States Copyright Act, without either the prior written permission of the publisher, or authorization through the Copyright Clearance Center, 222 Rosewood Drive, Danvers, MA 01923; Tel: (978) 750-8400; Fax: (978) 646-8600.
The code and copyright notice appearing on the first page of an item in the Journal indicates the copyright holder’s consent that copies may be made for personal or internal use of specific clients, on the condition that the copier pay for copying beyond that permitted by Sections 107 and 108 of the U.S. Copyright Law.
The per-copy fee is to be paid through the Copyright Clearance Center, Inc. This consent does not extend to other kinds of copying, such as copying for general distribution, for advertising or promotional purposes, for creating new collective works, or for resale. Such permission requests and other permission inquiries should refer to ht t p : / / w w w . p m i . o rg / l e a r n i n g /publications-rights-and-permissions .aspx
NONMEMBER SUBSCRIPTION INFORMATIONPersonal rates: For print in the United States, Canada, and Mexico, US$149.00, rest of world, US$173.00; electronic, all regions, US$149.00; and for print and electronic, in the United States, Canada, and Mexico, US$165.00, rest of world, US$189.00. Institutional rates: For print in the United States, US$493.00, in Canada and Mexico, US$536.00, and rest of world, US$572.00; electronic, all regions, US$493.00; and for print and electronic, in the United States, US$592.00, Canada and Mexico, US$644.00, and rest of world, US$687.00. Claims for undelivered copies will be accepted only after the following issue has been received. Please enclose a copy of the mailing label or cite your subscriber reference number in order to expedite han-dling. Missing copies will be supplied when losses have been sustained in transit and where reserve stock per-mits. All subscription inquiries should refer to http://www.pmi.org/Membership/Membership-Library-Subscription.aspx
Postmaster: Periodical postage paid at Newtown Square, PA 19073 USA and at additional mailing offices. Send address changes to Project Management Journal, 14 Campus Blvd., Newtown Square, PA 19073-3299 USA.
Reprints: Reprint sales and inquiries should refer to http://www.pmi.org/learning/publications-articles-and-reprints.aspx
PMJ_87569728_47_4_Aug_Sept_2016.indb 2 9/19/16 3:44 PM
August/September 2016 ■ Project Management Journal 3
Project Management Journal, Vol. 47, No. 4, 3–6 © 2016 by the Project Management InstitutePublished online at www.pmi.org/PMJ
From the EditorHans Georg Gemünden, Dr. rer. oec. habil., Dr. h.c. rer. oec. et soc., Professor of Project Management, BI – Norwegian Business School Department of Leadership & Organization, Oslo, Norway
Project Management Journal ® Has an Impact!
The new impact factor metrics from Thompson Reuters are out. Project Management Journal® received a 2-year Impact Factor of 1.765 and a 5-year Impact Factor of 2.031, respectively. Last year, the 2-year Impact Factor was 1.14 and just passed the 1.0 threshold. In the years before it was below 1.0. In addition, we have nearly tripled the number of submissions to more than 500 per year since I became Editor-in-Chief in 2013. We are increasing the number of published articles per year, from 36 in 2013 to approximately 50 in 2016. Our strategy is to contribute to the development of project management research and, in particular, to shape the themes and quality of this research and increase its dissemination.
Overall, this is a great success for our journal. I want to thank all our readers, authors, and reviewers; my edito-rial team; and my team members at PMI—from Academic Resources and Publications—who have made this success story possible.
This issue highlights three themes: (1) the PMI awards presented at EURAM in Paris; (2) the new articles in this issue; and (3) a Call-for-Papers for a new special issue on “Innovation in Infrastructure Delivery Models.”
1. AwardsAt EURAM in Paris, Professor Dr. Steward Clegg received the very prestigious PMI Research Award for his life-time achievements. He is one of the most published and cited authors in the top-tier journals in the organization studies field and the only Australian to be recognized by a multi-method ranking as one of the world’s top 200 “Management Gurus” in What’s the Big Idea? Creating and Capitalizing on the Best New Management Thinking by Thomas H. Davenport, Laurence Prusak, and H. James Wilson (Harvard Business Review Press, 2003). He is Research Director of CMOS (Centre for Management and Organization Studies) Research at UTS and holds a small number of visiting professorships at prestigious European universities and research centers. Steward Clegg has been publishing on a broad front, which includes contributions to sociology, organization studies, and strategy. He is the author and editor of over 40 monographs, textbooks, ency-clopedias, and handbooks. His main research theme is
power, which is a central theme in megaprojects. Steward Clegg delivered a fascinating speech at EURAM in Paris on innovation and power issues in major projects, using the Sydney Opera and the new Business School of UTS, designed by Frank Gehry, as examples.
Professor Dr. Erling S. Andersen from BI Norwegian Business School received the newly created PMI Scholar-Practitioner Award. This is an important award for PMI and its work to establish closer links between research and practice. This award recognizes an individual who has contributed significantly both to scholarship in proj-ect management and project management practice, and particularly in establishing better linkages between these two domains. Erling Andersen has authored numerous books on project management, including the bestseller Goal-Directed Project Management, which summarizes research-oriented findings from project management research specifically targeting the practitioner community. He published the book Rethinking Project Management as a way to promote the Scandinavian School of Project Man-agement to the practitioner community. In addition, Erling Andersen has published scholarly papers in the leading project management journals, on topics such as milestone planning, project management maturity, and decision making.
Professor Dr. Sophie Hooge and Professor Dr. Cédric Dalmasso from the Center for Management Science, Ecole des Mines ParisTech in Paris received the 2016 Best Paper Award of the Project Management Journal® for their article, “Breakthrough R&D Stakeholders: The Challenges of Legitimacy in Highly Uncertain Projects” (Project Management Journal® 2015, Volume 46, Issue 6, pp. 54–73). The award-winning article was identified in a two-stage process. During the first stage, all editors of Project Management Journal® assessed a specific number of articles, including all articles published in Project Man-agement Journal®. Then, a short list of seven candidates was identified. These seven articles were then ranked by all editors independently. The article with the most first-place rankings won. The assessment criteria during both rounds were: (1) scientific contribution, (2) practical relevance, and (3) methodological rigor.
The article from Sophie Hooge and Cédric Dalmasso addresses the issue that stakeholders are often prioritized according to the power, urgency, and legitimacy of their claims (Mitchell et al., 1997). However, the benefits of
Project Management Journal, Vol. 44, No. 6, 2–5 © 2013 by the Project Management InstitutePublished online in Wiley Online Library (wileyonlinelibrary.com).DOI: 10.1002/pmj.21383
First, I want to share some very good news with the project management research community and all our readers inter-ested in project management research. The deadline for the submission of papers to the PMI research conference has been prolongated to 13 January 2014.
The PMI® Research and Education Conference, “Standing on the Shoulders of Giants: In Search of Theory and Evidence” will be held on 27–29 July 2014 in Portland, Oregon, USA.
We welcome conceptual, empirical, or theoretical work using project, program, or portfolio management as the subject or context of the research. PMI also solicits papers and sympo-sia on project management education; doctoral students are encouraged to submit their work to the pre-conference doctoral colloquium. For submission guidelines and instruc-tions, please contact PMI.org/REC2014submit. Conference registration is scheduled to open March 2014 and details can be found on PMI.org/REC2014.
The December issue of Project Management Journal® offers a rich variety of articles, each of which delivers a significant contribution to theory building in project organizing and new empirical findings with a high value of theory and practice. The first paper by Dietrich, Kujala, and Artto addresses a fun-damental organizational design question in project manage-ment: How should the interdependencies between different teams in a multi-team project be managed? There are many different coordination mechanisms, but each of them has its advantages and drawbacks and they can be combined in dif-ferent ways, which differ in terms of coherence and potential synergies. The organizational design reflections stated in this article can also be used for the management of programs con-sisting of an array of different projects or for the management of a project portfolio in which the management of interdepen-dencies between projects is also a critical challenge.
The management of interdependencies between proj-ects is an issue that has been neglected in multi-project management. Very often the interdependence is restricted to resource conflicts between projects and the solution is to identify the bottleneck resources and the projects that con-flict with one bottleneck resource. The solution to this prob-lem is often a muddling-through approach that delivers an immediate solution, yet doesn’t acknowledge that typically there are too many projects occurring at the same time, and
that an organization usually experiences a number of bottle-necks simultaneously. This bottleneck obstacle makes it dif-ficult to assess the consequences of measures that have been taken to repair an immediate problem—a problem that may only be a symptom of a much larger and obscure problem.
In addition, there are many kinds of different interdepen-dencies between projects that have not been addressed sys-tematically and simultaneously. Markowitz’s pioneering work showed that the risk of a portfolio of projects can be reduced if the project portfolio mixture combines projects, which in sum show a smaller covariance of cash-flow. Thus, managing risk interdependencies between financial invest-ments, which could have been projects, in such a way that the overall risk of a portfolio of financial investments, which could have been projects, is reduced, has been an essential element of designing portfolios since long.
Organizational design theory made the claim that the kinds of interdependencies matter; in other words, for pooled, sequential, or reciprocal interdependencies, differ-ent kinds of organizational coordination instruments—or more precisely, different kinds of coherent mixes of coordina-tion instruments—should be used. Regarding project portfo-lio management, pooled interdependencies among scarce (human) resources during the development stage of a new product, process, or service, have been the focus of interest. But pooled interdependencies are not restricted to human resources in the development process or to financial resources in a more aggregated view. If potential users of a project can only cope with a limited amount of new products or product releases that are delivered to them, this creates a new, thus far, often neglected type of bottleneck. The ability and willingness of users or intermediaries may also create bottlenecks and thus “pooled” interdependencies. Transfer prices or prioritization systems have been proposed to solve the internal resource coordination problem, but do they also apply to the customer acceptance bottleneck problem? Taking a marketing perspective or a purchasing perspective, additional interdependence aspects have to be considered. If two projects share the same customer as a recipient, or the same supplier as a source, then these two projects need to be coordinated. (This may pertain to the following questions: When should which project be done? What should it deliver to other projects serving the same client?) Or: Do resource
From the EditorHans Georg Gemünden, Dr. rer. oec. habil., Chair for Technology and Innovation Management, Technische Universität Berlin, Berlin, Germany
Photo credit: Markus Bullick
2 December 2013 ■ Project Management Journal ■ DOI: 10.1002/pmj
Photo credit: Markus Bullick
PMJ_87569728_47_4_Aug_Sept_2016.indb 3 9/19/16 3:44 PM
From the Editor: Project Management Journal ® Has an Impact!
4 August/September 2016 ■ Project Management Journal
legitimate stakeholders are difficult to assess in the highly uncertain context of breakthrough R&D projects, where components such as value, design, technological solution and required knowledge, skills, and abilities are highly ambiguous, particularly in the fuzzy front end of the pro-cess. Sophie Hooge and Cédric Dalmasso use a very large and rich longitudinal database to analyze the influence of various internal stakeholder groups in a large portfolio of breakthrough projects at a leading global car manufacturer. The results show that the decision-making process about resource allocations is very complicated and dynamic, where not only rational choices but also over-commitment and disengagement occur. The balancing of expert and business arguments and the assessment of the legitimacy of the dif-ferent kinds of stakeholders turns out to be a very difficult issue in practice.
Professor Dr. Frederik Situmeang, Professor Dr. Claudia Buengeler, Professor Dr. Wendelien van Eerde, and Pro-fessor Dr. Nachoem Wijnberg, all from the University of Amsterdam, received the Joint PMI and IPMA Best Proj-ect Management Paper Award for their conference paper: “Never Change a Winning Team? How Management Team Experience Affects Project Performance, and the Moder-ating Role of Project Innovativeness.” Drawing on a large database of new product development management teams in the gaming industry, the authors document an inverted u-shaped relationship between the continuity of the man-agement team in a subsequent project and project success. As team members work together on an increasing number of projects, they share more knowledge, in particular tacit knowledge, and therefore become better coordinated and can realize efficiency gains. However, they also become less open to new impulses and lose creativity. The tipping point occurs earlier for more innovative developments. This finding is robust for different operationalizations of team continuity.
The PhD student Peter Oeij from Open Univer-sity Netherlands received the Joint PMI and IPMA Best Project Management Paper Award from a PhD Student, along with his coauthors Professor Dr. Steven Dhondt (TNO), Professor Dr. Jeff Gaspersz (Nyenrode Business University), and Professor Dr. Tinka van Vuuren (Open Uni-versity Netherlands) for their paper: “Innovation Resilience Behavior and Critical Incidents: The Relevance for the Management of R&D Projects.” Coming from the theory of high-reliability organizations, the authors develop a frame-work on how a supportive context for resilient behavior should look. They explore which characteristic behaviors resilient R&D teams exhibit when confronted with a criti-cal event that can be interpreted as a setback. In contrast to research about resilient individuals, the research on resilient teams is still at an early stage. Therefore, this stimulating paper was discussed intensively.
Last, but not least, the 2016 Best Reviewer Award in Proj-ect Management was presented to Dr. Tuomas Ahola from Tampere University of Technology, Finland.
Congratulations to all award winners!
2. Articles in this IssueThe first article in this issue from Rolf Lundin: “Project Soci-ety: Paths and Challenges” is an invited contribution. Rolf Lundin describes the changes that project management makes at the society level. He analyzes the societal paths of projectifi-cation and uses the “European Capital of Culture” as an inter-esting example for projectification and also describes emerging difficulties and dilemmas. His very insightful article builds on his most recent book coauthored with five other scholars: Managing and Working in Project Society (Lundin et al., 2015).
We all witness more turbulent and globally more indepen-dent societies that require more flexible, agile, and effective actions. Project management is not only used at the single project, project portfolio, project-oriented organization, and interorganizational project network levels; it has become a societal issue. This means that the domains and stakeholders of project management also change. In Europe, the refugees com-ing from Arabian and African countries are a highly debated problem, and different countries have developed largely differ-ing points of view. But we cannot ignore the problem. Rather, we have to find viable solutions. In order to implement good practical solutions we need to integrate engaged citizens and good project management practices. Our public administra-tions, however, are not sufficiently prepared to meet the new challenges, and the value of project organizing has yet to be demonstrated. In the media, reports about failing megaproj-ects dominate (e.g., there are more articles about the problems of the new Berlin Airport Project or the “Boston Big Dig” than there are about the very successful and ambitious new railway tunnel project through the St. Gotthard in Switzerland. In order to cope with new challenges, project management itself has to change, which is also the reason for our call on “Innovations” in infrastructure delivery models (see following).
The article from Peter E. D. Love, Fran Ackermann, Jim Smith, Zahir Irani, and David J. Edwards, “Making Sense of Rework Causation in Offshore Hydrocarbon Projects,” ana-lyzes how and why rework in offshore hydrocarbon projects occurred. Staff from organizations operating at the blunt end (e.g., clients/design engineers providing finance and infor-mation) as well as those at the sharp end (e.g., contractors at the “coalface”) of a project’s supply chain were interviewed to make sense of rework that occurred. The analysis identi-fied the need for managers to de-emphasize the environment that prioritizes production over other considerations. Rather, mechanisms and factors that shape the performance of peo-ple should be systematically examined.
The article from Mathieu Wauters and Mario Vanhoucke, “A Study on Complexity and Uncertainty Perception and
PMJ_87569728_47_4_Aug_Sept_2016.indb 4 9/19/16 3:44 PM
August/September 2016 ■ Project Management Journal 5
Solution Strategies for the Time/Cost Trade-Off Problem,” analyzes how project complexity and uncertainty influence strategies that are used to manage the time/cost trade-off problem in projects. They collected data using a business game to identify components of solution strategies that are applied to address unexpected changes in the planned project deadline, which are caused by the customer during the project implantation phase. Participants of the business game were 444 management and engineering students from two univer-sities. The authors identify two solution strategies: (1) time strategy in which the goal is to meet the deadline as closely as possible and (2) cost strategy in which the goal is to minimize the sum of activity and the penalty costs. The authors created a computational experiment, which simulates decision making under varying levels of uncertainty and complexity to deter-mine the effectiveness of these two strategies. Additionally, the authors analyze the influence of an assessment error of uncer-tainty or complexity. They conclude that for project managers incapable of correctly assessing complexity and uncertainty, it is better to make a judgment error perceiving the project to be more complex and uncertain than it actually is.
The contribution from Russell Purvis, Raymond M. Henry, Stefan Tams, Varun Grover, John D. McGregor, and Steve Davis investigates “The Impact of Residual Risk and Resultant Problems on Information Systems Development Project Performance.” Their article is particularly interesting because of the implications it has on the amount of effort proj-ect managers spend on managing risk. Risk management is fundamentally a judgment call where we balance the cost and benefit of addressing particular risks. In the end, we do not fully eliminate risk because we deem the cost of managing the remaining risk too expensive. The authors demonstrate that our perceptions of cost and benefit are often out of kilter; the residual risk has a significant impact on project success. The authors suggest this is because we fail to account for the inter-relationships between risks and interrelationships between risks and other project elements. Because we only evaluate the direct effects of risk, but ignore the indirect effects, we spend less effort on risk management than is optimal.
Masoud Mohammad Sharifi and Mojtaba Safari present the “Application of Net Cash Flow at Risk in Project Port-folio Selection.” Their article draws upon financial modeling and incorporates risk measures in project portfolio analysis. The model acknowledges that decision makers have different preferences and incorporates a novel “risk-aversion” param-eter to represent the decision makers’ acceptable level of risk. The modeling also considers the relationships between projects to reflect the complexity inherent in portfolio selec-tion decisions. The findings, based on mathematical model-ing, illustrate how diversification can lead to lower risk in the overall portfolio.
The article from Thomas Worsnop, Stefano Miraglia, and Andrew Davies, “Balancing Open and Closed Innovation in
Megaprojects: Insights from Crossrail,” studied the interplay between open and closed innovation at Crossrail—Europe’s largest civil engineering project—aiming to build a suburban railway system in London. Their findings suggest that open and closed innovation can be combined by creating an appropriate communication and exchange environment, whose elements include organizational arrangements (e.g., team organization and task assignment) and methods and rules of communica-tion. They also found that innovation in megaprojects can be augmented when the contractors are encouraged to search for and implement incremental solutions to minor problems, not just radical and strategically relevant innovations.
Jack Shih-Chieh Hsu, Yu Wen Hung, Sheng-Pao Shih, and Hui-Mei Hsu investigate: “Expertise Coordination in Information Systems Development Projects: Willingness, Ability, and Behavior.” Information systems development (ISD) projects are complex, requiring different areas of exper-tise. Coordinating these areas of expertise helps to manage complexity, increasing the likelihood of the project’s success. The findings of past studies have been inconsistent regarding the benefits of expertise coordination—perhaps, in part, because three different forms of coordination have been used: willingness, ability, and behavior. The authors find that will-ingness and ability are antecedents of coordination behavior, and that coordination behavior fully mediates different forms of project success. Thus, successful expertise coordination requires team members who are both willing and able.
3. Call-for-Papers Special Issue: “Innovation in Infrastructure Delivery Models”
Delivering infrastructure projects is challenging because of the enormous degrees of uncertainty, complexity, and urgency often associated with them. There has been a grow-ing recognition over the past decade that infrastructure projects cannot be successfully defined and executed using traditional models of project delivery, which are often based on lowest-price competitive tendering, fixed-price contract-ing, risk transfer, and inflexible project management pro-cesses. (See Flyvbjerg, 2014, 2016, for the high failure rates.)
Project sponsors (owners and operators of the assets), clients, and their delivery partners (prime contractors and joint venture entities) are exploring innovative new ways of managing large infrastructure projects to achieve successful outcomes and add value over the entire life cycle, from design through project execution to operations.
Project Management Journal® is highly interested in pub-lishing theoretical reasoning and empirical evidence of new concepts about the following developments:
■ Delineating the strategies, structures, and capabilities of new forms of organizations involved in project delivery, such as systems integrators, owners/operators, delivery partners, “pop-up clients,” joint ventures, and public private partnerships.
PMJ_87569728_47_4_Aug_Sept_2016.indb 5 9/19/16 3:44 PM
From the Editor: Project Management Journal ® Has an Impact!
6 August/September 2016 ■ Project Management Journal
■ Defining and managing the risks, uncertainties, stakeholders, and complexities in infrastructure delivery, from front-end planning to project execution and handover.
■ Elaborating on the transformational potential of digital technologies.
■ Exploring the dynamics of value creation and capture in infrastructure delivery.
■ Creating a learning environment, building capabilities, and generating innovation to improve infrastructure delivery models.
■ Managing across organizational boundaries in projects involving multiple parties as well as in programs, portfolios, and the handover from project to operations.
■ Managing and leading new forms of collaborative teams.■ Comparative studies of international infrastructure project
delivery models, including the different institutional struc-ture and stakeholders.
Please take a look at this call, which also includes valuable references, and participate!
ReferencesFlyvbjerg, B. (2014). What you should know about megaprojects and why: An overview. Project Management Journal, 45(2), 6–19.
Flyvbjerg, B. (2016). The fallacy of beneficial ignorance: A test of Hirschman’s hiding hand. World Development, 84, 176–189.
Lundin, R. A., Arvidsson, N., Brady, T., Ekstedt, E., Midler, C., & Sydow. J. (2015). Managing and working in project soci-ety: Institutional challenges and of temporary organizations. Cambridge, England: Cambridge University Press.
Mitchell, R. K., Agle, B. R., & Wood, D. J. (1997). Toward a theory of stakeholder identification and salience: Defining the principle of who and what really counts. Academy of Management Review, 22, 853–886.
PMJ_87569728_47_4_Aug_Sept_2016.indb 6 9/19/16 3:44 PM
PAPERS
August/September 2016 ■ Project Management Journal 7
ABSTRACT ■
Project Society: Paths and ChallengesRolf A. Lundin, Jönköping International Business School, Jönköping, Sweden
The purpose of this article is to present an outline of how Project Society came to be, provide examples of mechanisms driving its development, display illustrations in more detail, and discuss emergent difficulties and dilemmas. Dominating projectification
paths are presented, including challenges for businesses and the public sector. A blunt way of presenting this article’s message is that it calls for a Project Society alert!
Project SocietyThe rationale for this article is simple: Although there are many publications that cover how projects are run and handled individually, in programs and organizational portfolios (see, e.g., Maylor, Brady, Cooke-Davies, & Hodgson, 2006; Turner, 2014), less has been written about projects on the macro or societal level. In this article, the focus is on society or, more specifically, the role of projects on that level. The position taken is that Project Society has arrived and is continuously developing. Issues alluded to include its char-acteristics and the main developments leading to its arrival and integration into society at large. Some major background components can be traced back in history.
In general, projectification has influenced society and transformed it into Project Society. This transformation has changed practice and also influenced theory during later periods. Which mechanisms are at work, not only in terms of how projectification occurs in steps, but also in terms of the challenges in meeting with projectification trends and tendencies? Existing institutions don’t necessarily fit and must be adapted, and new institutions are being formed in accordance with societal trends.
One should be reminded however, that Project Society implies a focus on society and developments at the present time. Learning from history, one should be aware that foci never last forever, thus Project Society is most likely to lose its dominating influence as a leading theme in the long run in the sense that new foci for attention will appear and take over. Most societal foci lead to changes or sediments, which last or are effective a long time after the foci contributing to them have disappeared (cf., the reasoning of Greenwood & Hinings, 1996, which applies to the societal level).
The outline of the following text is historical–logical, beginning with the backgrounds of Project Society, followed by the discernible paths for projecti-fication, including an illustration of one particular trajectory. Next, the focus is on the different contexts for projects and the variations in terms of projec-tification as context dependent. At the present time it appears that various types of networks provide much of the dynamism for projectification. Finally, institutional challenges are brought in together with a discussion of Project Society as being temporary and to be succeeded by other societal movements.
Preamble—A Sketch of the Paths to Project SocietyIn order to understand projectification and its paths and challenges, one needs to go back in time and outline some starting points. The roots of project management and organizing by projects have been described in various ways
Project Management Journal, Vol. 47, No. 4, 7–15
© 2016 by the Project Management Institute
Published online at www.pmi.org/PMJ
In Project Society, organizing by projects
plays a prominent role. This type of society
is already here, but projectification continues
to lead developments and transformations
along a set of paths and trajectories. One
way to describe this trend is to say that
there is societal organizing in which various
types of projects are becoming even more
prevalent and diverse. The projectification
trend seems to be the result of a variety of
mechanisms at work, where a wide set of
traditional institutions—ranging from laws
to mindsets—is constantly challenged and
reformed. Managing, along with the nature
of work, are changing and adapting.
KEYWORDS: projectification; paths;
archetypes; challenges
PMJ_87569728_47_4_Aug_Sept_2016.indb 7 9/19/16 3:44 PM
Project Society: Paths and Challenges
8 August/September 2016 ■ Project Management Journal
PAPERS
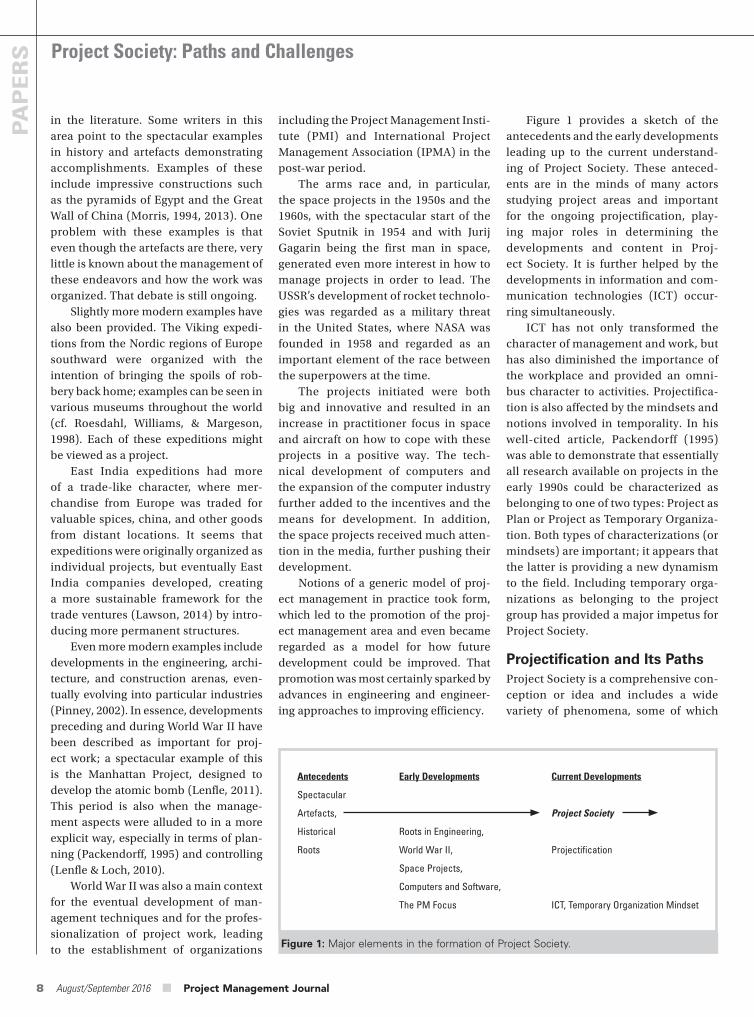
Figure 1 provides a sketch of the antecedents and the early developments leading up to the current understand-ing of Project Society. These anteced-ents are in the minds of many actors studying project areas and important for the ongoing projectification, play-ing major roles in determining the developments and content in Proj-ect Society. It is further helped by the developments in information and com-munication technologies (ICT) occur-ring simultaneously.
ICT has not only transformed the character of management and work, but has also diminished the importance of the workplace and provided an omni-bus character to activities. Projectifica-tion is also affected by the mindsets and notions involved in temporality. In his well-cited article, Packendorff (1995) was able to demonstrate that essentially all research available on projects in the early 1990s could be characterized as belonging to one of two types: Project as Plan or Project as Temporary Organiza-tion. Both types of characterizations (or mindsets) are important; it appears that the latter is providing a new dynamism to the field. Including temporary orga-nizations as belonging to the project group has provided a major impetus for Project Society.
Projectification and Its PathsProject Society is a comprehensive con-ception or idea and includes a wide variety of phenomena, some of which
including the Project Management Insti-tute (PMI) and International Project Management Association (IPMA) in the post-war period.
The arms race and, in particular, the space projects in the 1950s and the 1960s, with the spectacular start of the Soviet Sputnik in 1954 and with Jurij Gagarin being the first man in space, generated even more interest in how to manage projects in order to lead. The USSR’s development of rocket technolo-gies was regarded as a military threat in the United States, where NASA was founded in 1958 and regarded as an important element of the race between the superpowers at the time.
The projects initiated were both big and innovative and resulted in an increase in practitioner focus in space and aircraft on how to cope with these projects in a positive way. The tech-nical development of computers and the expansion of the computer industry further added to the incentives and the means for development. In addition, the space projects received much atten-tion in the media, further pushing their development.
Notions of a generic model of proj-ect management in practice took form, which led to the promotion of the proj-ect management area and even became regarded as a model for how future development could be improved. That promotion was most certainly sparked by advances in engineering and engineer-ing approaches to improving efficiency.
in the literature. Some writers in this area point to the spectacular examples in history and artefacts demonstrating accomplishments. Examples of these include impressive constructions such as the pyramids of Egypt and the Great Wall of China (Morris, 1994, 2013). One problem with these examples is that even though the artefacts are there, very little is known about the management of these endeavors and how the work was organized. That debate is still ongoing.
Slightly more modern examples have also been provided. The Viking expedi-tions from the Nordic regions of Europe southward were organized with the intention of bringing the spoils of rob-bery back home; examples can be seen in various museums throughout the world (cf. Roesdahl, Williams, & Margeson, 1998). Each of these expeditions might be viewed as a project.
East India expeditions had more of a trade-like character, where mer-chandise from Europe was traded for valuable spices, china, and other goods from distant locations. It seems that expeditions were originally organized as individual projects, but eventually East India companies developed, creating a more sustainable framework for the trade ventures (Lawson, 2014) by intro-ducing more permanent structures.
Even more modern examples include developments in the engineering, archi-tecture, and construction arenas, even-tually evolving into particular industries (Pinney, 2002). In essence, developments preceding and during World War II have been described as important for proj-ect work; a spectacular example of this is the Manhattan Project, designed to develop the atomic bomb (Lenfle, 2011). This period is also when the manage-ment aspects were alluded to in a more explicit way, especially in terms of plan-ning (Packendorff, 1995) and controlling (Lenfle & Loch, 2010).
World War II was also a main context for the eventual development of man-agement techniques and for the profes-sionalization of project work, leading to the establishment of organizations Figure 1: Major elements in the formation of Project Society.
Antecedents Early Developments Current Developments
Spectacular
Artefacts, Project Society
Historical Roots in Engineering,
Roots World War II, Projectification
Space Projects,
Computers and Software,
The PM Focus ICT, Temporary Organization Mindset
PMJ_87569728_47_4_Aug_Sept_2016.indb 8 9/19/16 3:44 PM
August/September 2016 ■ Project Management Journal 9
6. Miscellaneous mechanisms related to projectification, such as simpli-fying agendas in organizations by setting controversial issues aside and creating a project related to the controversial issue. (This is almost a standard operating procedure in government.) Another example of this is activities that are simply renamed as projects even though the activities per se might remain more or less unchanged, at least initially. In the long run, the name change to “project” might well lead to mindset changes and new ways of acting.
The mechanisms described here are by no means independent from each other; rather, they illustrate forms of projectification, and sometimes various forms combine into patterns and tra-jectories, as illustrated in the following example.
The “European Capital of Culture”—An Illustration of ProjectificationIn order to list not only the suggested paths for projectification but to con-textualize the paths, the following case on the “European Capital of Culture” serves as an extended example. The case description to come is, however, very simplified in relation to all the events and processes involved.
Every year the European Union selects the “European Capital of Cul-ture” among cities in Europe. Cities apply directly to the EU and, if selected, are supported by the EU with funds to be used during the year. Two cities were selected in 2014: Riga, Latvia and Umeå, Sweden (Wåhlin, Kapsali, Näsholm, & Blomquist, 2013; Näsholm & Blomquist, 2015). The two cities used two fairly dif-ferent approaches to manifesting them-selves as capitals of culture. In Riga, the local authorities developed a temporal organization—the Riga 2014 project—in an effort to be entrepreneurial and con-centrate on being efficient in terms of fast decisions. The cultural part of the
A Guide to the Project Management Body of Knowledge (PMBOK ® Guide) from the Project Management Insti-tute. As a consequence, the poten-tial recipients of EU support (for example, local governments receiv-ing support from the union) also need to live up to the stipulations in order to be eligible for EU support. A related example is when research foundations request a formal proj-ect handling of research projects. In an article by Fowler, Lindahl, and Sköld (2015), it has been described how researchers live up to project expectations when they apply for funds and when they deliver their final reports, but not necessarily so when they do the actual research work. This is a partial fulfillment of the push from the outside.
4. Projects are known for efficiency and for leading to results (pull effects): Projects are organized as projects, because the project model appears good at leading to the aspired results. The world is full of successful projects, and potential project organizers are influenced and inspired by this. At times, proj-ect organizing seems to be a matter of copying previous behaviors and procedures—a fashion or even a fad; nonetheless, even if these projects also fail, the project model is still promoted.
5. Projects are employed for strate-gic purposes: Project organizing is accustomed to implementing or developing a strategic effort for an organization in which sets of proj-ects (or programs) are employed (cf. Pellegrinelli & Bowman, 1994; Kaplan & Orlikowski, 2013). This point covers cases in which strategy is understood to be ‘strategy as prac-tice’ as compared with ‘strategizing as paving a direction for the future.’ Projects can simply be used as a way to experiment with different practical alternatives and/or the aspired strat-egy consists of a portfolio of different projects embodying the strategy.
can be thought of as related to empiri-cal observations, ongoing processes, outcomes of projectification, and roots to the same; thus, Project Society has many “faces” of which none is totally independent of the other.
If we define the word “projectifica-tion” to denote that project organizing is spreading, there are ways to describe those tendencies and what they lead to. Based on previous efforts ( Godenhjelm, Lundin, & Sjöblom, 2015; Lundin, Midler, & Wåhlin, 2015b), the following enumer-ation of paths, causes, and results can be used as examples:
1. Activities previously organized in other ways are transformed into projects: The classical example of this type in the literature is how Renault, the French car manufac-turer, transferred work on new car models from the traditional orga-nizational line to be handled by teams in specific innovation projects (Midler, 1995). Organizing innova-tion efforts these days are most often given the project form.
2. Contexts are adapted to fit project work: In fact, major parts of the Renault organization changed as a result of handling new car mod-els and innovations in projects. The adaptation and transformation of the Renault organization contin-ued also after the first transforma-tion step or event as described later (Midler & Navarre, 2004; Lundin et al., 2015b). This is only one exam-ple of how organizational contexts change and where the change can be related to how projects are handled. In general, project formation is not isolated.
3. Projects are stipulated as a work form (a push effect): For example, the European Union (EU) not only stipulates a project approach when support money from the union is involved (Godenhjelm et al., 2015); in fact, the union also prescribes which model to use; for example, the sum of knowledge presented in
PMJ_87569728_47_4_Aug_Sept_2016.indb 9 9/19/16 3:44 PM
Project Society: Paths and Challenges
10 August/September 2016 ■ Project Management Journal
PAPERS
the Renault organization can be regarded as a push consequence by the initial change, but also pulled by the expec-tations of what the contextual change might lead to. With similar arguments, essentially all elements of the list can be described as consisting of a mixture of push and pull.
Of course the “weights” of the ele-ments in the enumerated list above dif-fer a lot when it comes to their impacts on practices and projectification. This list can also be widened by covering many current changes of varying char-acter as indicated by the miscellaneous point (#6). As already suggested, some of the current changes might be more connected to changes in terminology than to changes in factual behaviors. The project terminology is being spread to various societal fields and applying new words is also powerful for change.
A related and highly important question: Do projects in fact prolifer-ate? There are indeed studies related to this (Pettigrew et al., 2003). Unfor-tunately, there are few direct measures of the prevalence of projects at all, but mostly indirect measures and indica-tions. In one study of German indus-trial work (Wald, Spanuth, Schneider, & Schoper, 2015), it was found that the proportion of working hours in proj-ects increased in a set of industries by over 18% on average between 2009 and 2013. According to the same study, the expectation is that the proportion of project work will continue in the next few years, and project practitioners and researchers share that view (Schoper, Gemünden, & Nguyen, 2015).
Without getting into alternatives and intricacies, it might suffice for now to refer to how the membership of Project Management Institute (PMI) has grown over time. According to data received from PMI, there were approximately 17,000 members in 1995; 20 years later, the total membership had increased to approximately 464,000. In other words, the number has increased by 2,600% over a 20-year period, which points to a strong trend in practice work.
The main point here, however, is that the end result was that a set of proj-ects became the output of both efforts and, essentially, all efforts were run in accordance with the EU stipulations on how to run and report projects, so in case the city administrators were not familiar with those stipulations and procedures before, they had to learn them. One might also suggest that other types of learning were also involved. Later on, Umeå launched an effort to be a sustainable city. Using a similar procedure as in the cultural capital case, that effort is manifested through a set of projects pursuing the sustainability goal. Emphatically put: Capital of cul-ture has turned into something resem-bling a capital of projects!
With support from and/or the demands of the EU the capital of culture ambitions were transformed into a set of projects, which not only affected the manifestation of ambitions as such, but also the city of Umeå itself. The context in the city administration (including the group of local politicians) also had to adapt to the project way of func-tioning by using reporting procedures developed by EU. This is one way of understanding why the work patterns concerning the sustainability ambi-tions in Umeå were also transformed into projects, which also means that projectification leads to new instances of projectification. Based on learning gained from the capital of culture effort, the application procedure as well as the organizing principles could efficiently be designed.
Projectification Paths ResumedReturning to the above list (1 through 6)—they can essentially all be classified as a mixture of “push” and “pull.” The Renault transformation (1) of how to organize work for a new car model was most likely pulled by expectations of what the change might lead to but also pushed by the need to be more efficient than the competition in promoting innovations in the company. Contextual adaptation of
year was orchestrated by six well-known and respected people (profiles) con-nected with cultural activities. In other words, cultural authorities kept the ini-tiative for planning and delivering the capital of culture year with a top-down procedure comprised of cultural themes spread out throughout the entire year.
In the Umeå 2014 project, the approach was different—a bottom-up procedure, which was developed into eight seasons according to the calendar of the Sami people (Sami is a minority group of people in northern Sweden where Umeå is located). The goal was to involve as many citizens, associa-tions, and organizations as possible. For example, businesses and different cul-tural practitioners could come up with ideas and suggestions on how to live up to the capital of culture expectations; however, all initiatives were handled through a specially designated artistic director with both business and cultural experience.
Funds for spending during the year were limited, so in both cases there was a group of decision makers or a person who took responsibility for the selection of what to support. In both Riga and Umeå, it was a matter for city administration; in both cases, one can easily say that the capital of culture year became manifested through a set of projects connected with the culture year. The selection made seems wider in Umeå (where the participants, in fact, redefined what to include in the culture concept) than in Riga (possibly due to how ideas were generated). An illustra-tion of the latter point is the tentative Umeå subproject, which was to follow migrating birds from Northern Sweden to their habitats in the autumn and do so using GPS transmitters attached to the birds, comparing their trajectories to data from the past to find digres-sions from the previous patterns. That subproject was to be financed through “crowd-funding” but had to be aban-doned before completion due to lack of funds; but this example illustrates how the concept of culture was redefined.
PMJ_87569728_47_4_Aug_Sept_2016.indb 10 9/19/16 3:44 PM
August/September 2016 ■ Project Management Journal 11
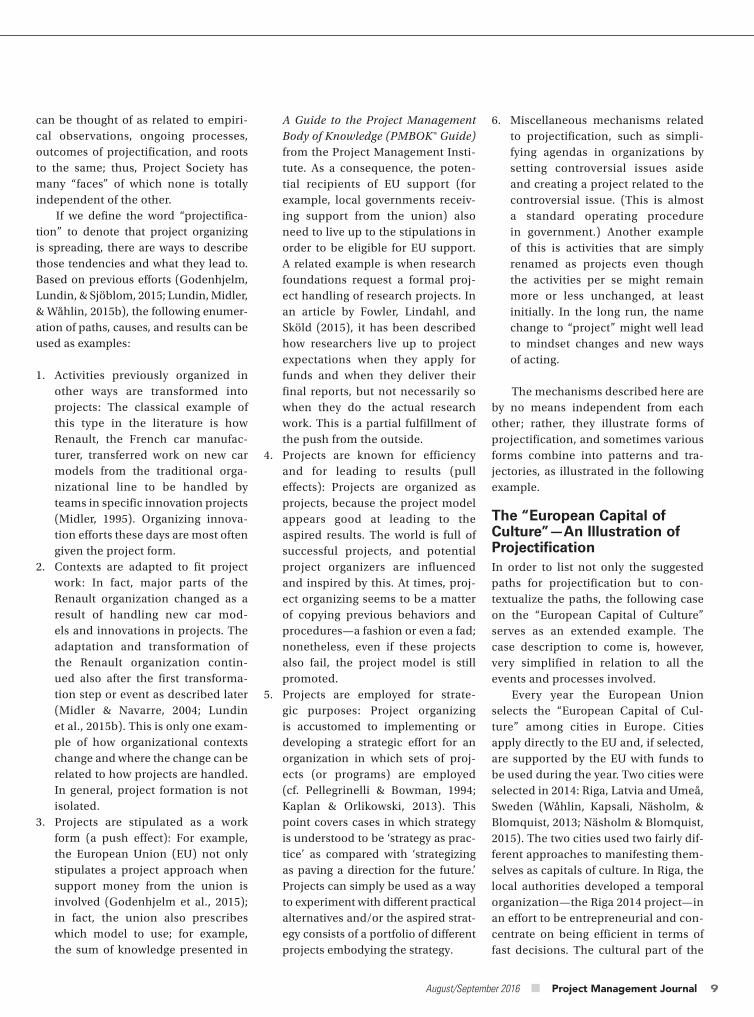
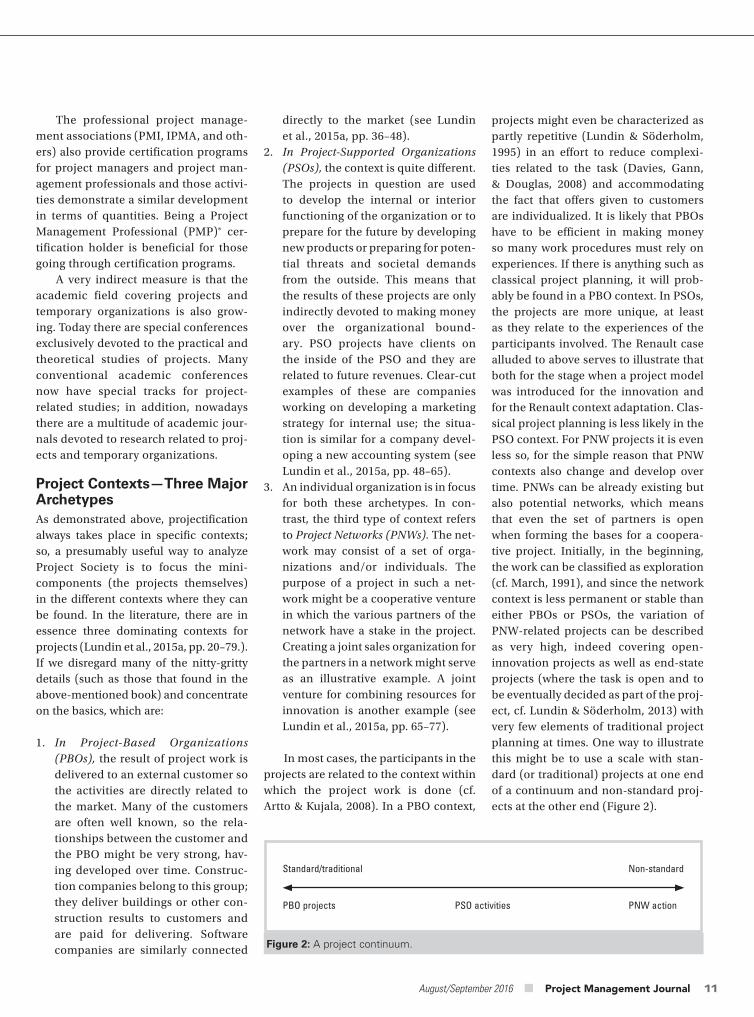
projects might even be characterized as partly repetitive (Lundin & Söderholm, 1995) in an effort to reduce complexi-ties related to the task (Davies, Gann, & Douglas, 2008) and accommodating the fact that offers given to customers are individualized. It is likely that PBOs have to be efficient in making money so many work procedures must rely on experiences. If there is anything such as classical project planning, it will prob-ably be found in a PBO context. In PSOs, the projects are more unique, at least as they relate to the experiences of the participants involved. The Renault case alluded to above serves to illustrate that both for the stage when a project model was introduced for the innovation and for the Renault context adaptation. Clas-sical project planning is less likely in the PSO context. For PNW projects it is even less so, for the simple reason that PNW contexts also change and develop over time. PNWs can be already existing but also potential networks, which means that even the set of partners is open when forming the bases for a coopera-tive project. Initially, in the beginning, the work can be classified as exploration (cf. March, 1991), and since the network context is less permanent or stable than either PBOs or PSOs, the variation of PNW-related projects can be described as very high, indeed covering open-innovation projects as well as end-state projects (where the task is open and to be eventually decided as part of the proj-ect, cf. Lundin & Söderholm, 2013) with very few elements of traditional project planning at times. One way to illustrate this might be to use a scale with stan-dard (or traditional) projects at one end of a continuum and non-standard proj-ects at the other end (Figure 2).
directly to the market (see Lundin et al., 2015a, pp. 36–48).
2. In Project-Supported Organizations (PSOs), the context is quite different. The projects in question are used to develop the internal or interior functioning of the organization or to prepare for the future by developing new products or preparing for poten-tial threats and societal demands from the outside. This means that the results of these projects are only indirectly devoted to making money over the organizational bound-ary. PSO projects have clients on the inside of the PSO and they are related to future revenues. Clear-cut examples of these are companies working on developing a marketing strategy for internal use; the situa-tion is similar for a company devel-oping a new accounting system (see Lundin et al., 2015a, pp. 48–65).
3. An individual organization is in focus for both these archetypes. In con-trast, the third type of context refers to Project Networks (PNWs). The net-work may consist of a set of orga-nizations and/or individuals. The purpose of a project in such a net-work might be a cooperative venture in which the various partners of the network have a stake in the project. Creating a joint sales organization for the partners in a network might serve as an illustrative example. A joint venture for combining resources for innovation is another example (see Lundin et al., 2015a, pp. 65–77).
In most cases, the participants in the projects are related to the context within which the project work is done (cf. Artto & Kujala, 2008). In a PBO context,
The professional project manage-ment associations (PMI, IPMA, and oth-ers) also provide certification programs for project managers and project man-agement professionals and those activi-ties demonstrate a similar development in terms of quantities. Being a Project Management Professional (PMP)® cer-tification holder is beneficial for those going through certification programs.
A very indirect measure is that the academic field covering projects and temporary organizations is also grow-ing. Today there are special conferences exclusively devoted to the practical and theoretical studies of projects. Many conventional academic conferences now have special tracks for project-related studies; in addition, nowadays there are a multitude of academic jour-nals devoted to research related to proj-ects and temporary organizations.
Project Contexts—Three Major ArchetypesAs demonstrated above, projectification always takes place in specific contexts; so, a presumably useful way to analyze Project Society is to focus the mini-components (the projects themselves) in the different contexts where they can be found. In the literature, there are in essence three dominating contexts for projects (Lundin et al., 2015a, pp. 20–79.). If we disregard many of the nitty-gritty details (such as those that found in the above-mentioned book) and concentrate on the basics, which are:
1. In Project-Based Organizations (PBOs), the result of project work is delivered to an external customer so the activities are directly related to the market. Many of the customers are often well known, so the rela-tionships between the customer and the PBO might be very strong, hav-ing developed over time. Construc-tion companies belong to this group; they deliver buildings or other con-struction results to customers and are paid for delivering. Software companies are similarly connected Figure 2: A project continuum.
Standard/traditional Non-standard
PBO projects PSO activities PNW action
PMJ_87569728_47_4_Aug_Sept_2016.indb 11 9/19/16 3:44 PM
Project Society: Paths and Challenges
12 August/September 2016 ■ Project Management Journal
PAPERS
projects demonstrate a much wider range. Is the network driven by a domi-nant key actor or is it driven by a het-erogeneous group of actors (which is a question demonstrating a distinguish-ing range)?
Challenges for Management and WorkEven though the words ‘management’ and ‘work’ have existed for ages, the meanings of the concepts have changed over time. The industrial revolution changed the character of society con-siderably with the gradual change from the typical agrarian society. With this change, the industrial revolution occurred sequentially, originating in England and spreading to the United States and continental Europe, whereby different conceptualizations of man-agement and work co-existed in the stratified societies of those times. Even-tually, the character of management and work adapted to the development of the industrial revolution (or, rather, the industrial revolutions). Mass pro-duction and standardization, including a strive for efficiency, took over from the traditional agrarian society, which led to a capitalistic version in which labor eventually became very much unionized at the same time as managers became the servants of ownership of the production apparatus. Institutions and unions—whether legal, governmental, or educational—were formed to fit the reality of the industrial era (Lundin et al., 2015a, pp. 170–174).
When the new project organization introduced itself—primarily in PBO contexts—the characters of manage-ment and work changed gradually. The time limitation of projects, in principle, has led to a new time perspective for both management and work. Whereas industrial organizations were thought of or treated like eternal entities, proj-ects related to PBOs were ended when the task was fulfilled. This development meant that the traditional institutions of the industrial society were at odds with the ongoing projectification, resulting
used the “Familienähnlichkeit” (family resemblance) concept from Wittgenstein to argue for the existence of a family of projects in which all members of the family are not exactly similar to each other but where you can find members having some traits (but not all) in com-mon. Those family members who have a set of relevant traits in common repre-sent a cluster; then you might be able to make well-grounded statements about that cluster and about the members in that branch of the family (see also Yeung, Chan, & Chan, 2007; Yeung, Chan, & Chan, 2012). Phrased differently: you may learn from practical experiences with other members of the relevant branch of the family (cf., Ekstedt, Lundin, Söderholm, & Wirdenius, 1999).
In a previous publication (Lundin & Söderholm, 1995), four key ingredi-ents of a project/temporary organiza-tion were alluded to: time, task, team, and transition. Suffice it to say that these four ingredients are not necessary conditions for the denomination project if one follows the family resemblance notion. For some types of projects, the time dimension is of less importance or even unimportant, for instance, if the task dominates. In some cases, the task can be vague and imprecise and only provide a direction for what is desirable, yet the work done is still referred to as a project. Finally, we observe the trend of increasing multi-team projects, which means that the “team” metaphor can also lose its dominant significance.
This reasoning in fact relates well to the earlier discussion on prototypical contexts for projects in a specific sense. As mentioned earlier, PBO projects have a high degree of similarity and PNW
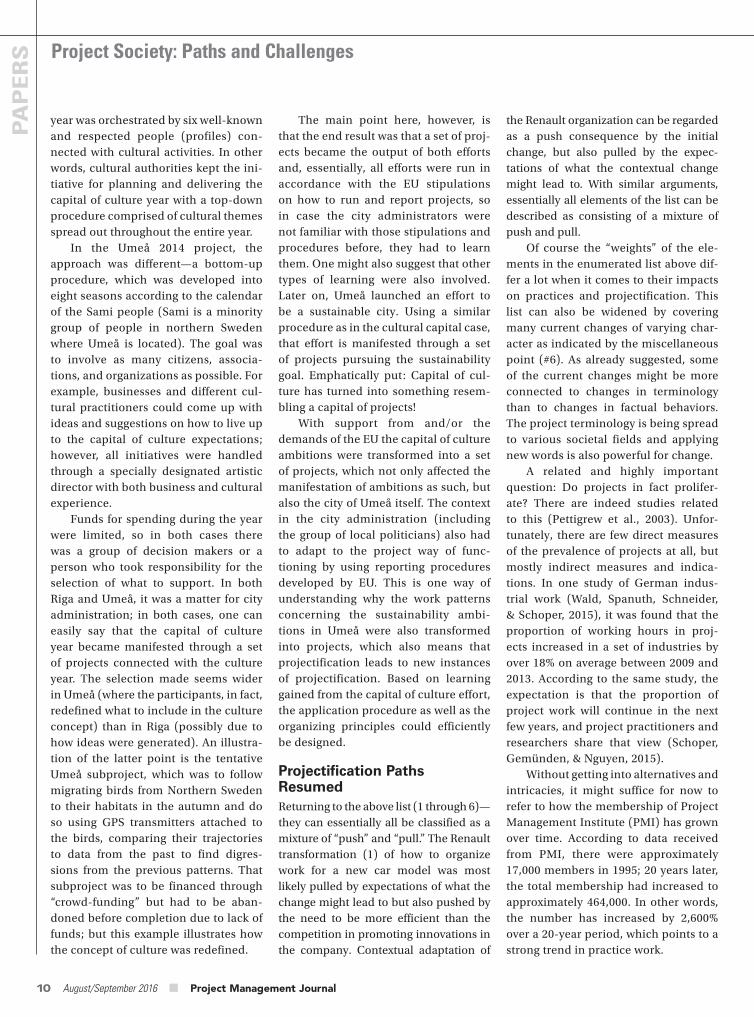
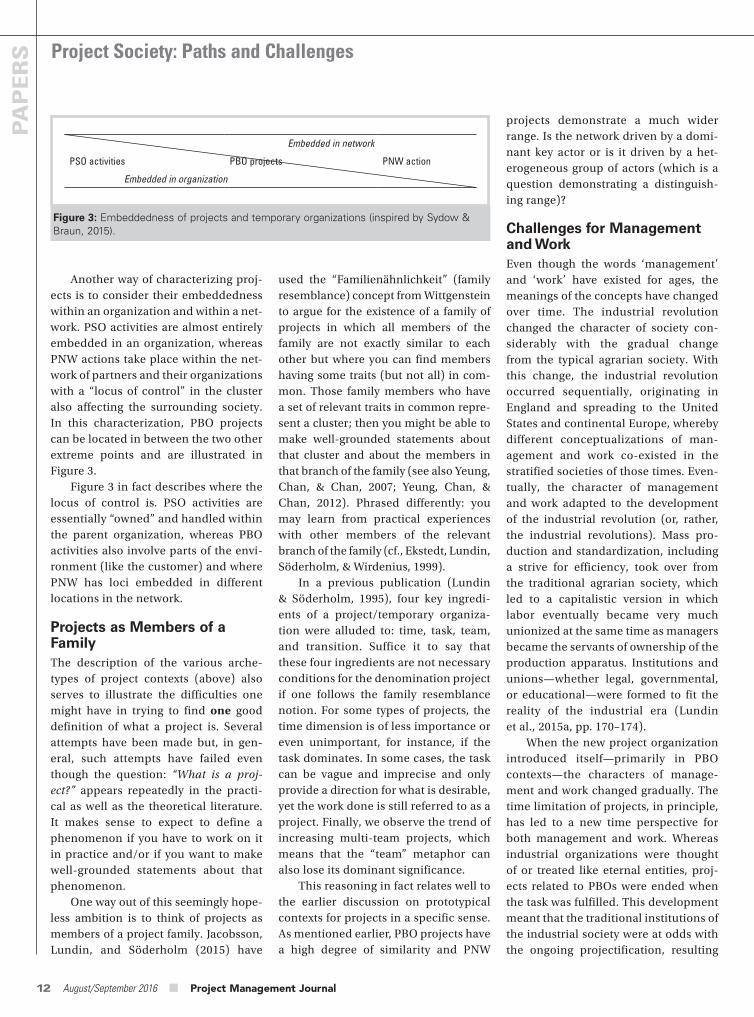
Another way of characterizing proj-ects is to consider their embeddedness within an organization and within a net-work. PSO activities are almost entirely embedded in an organization, whereas PNW actions take place within the net-work of partners and their organizations with a “locus of control” in the cluster also affecting the surrounding society. In this characterization, PBO projects can be located in between the two other extreme points and are illustrated in Figure 3.
Figure 3 in fact describes where the locus of control is. PSO activities are essentially “owned” and handled within the parent organization, whereas PBO activities also involve parts of the envi-ronment (like the customer) and where PNW has loci embedded in different locations in the network.
Projects as Members of a FamilyThe description of the various arche-types of project contexts (above) also serves to illustrate the difficulties one might have in trying to find one good definition of what a project is. Several attempts have been made but, in gen-eral, such attempts have failed even though the question: “What is a proj-ect?” appears repeatedly in the practi-cal as well as the theoretical literature. It makes sense to expect to define a phenomenon if you have to work on it in practice and/or if you want to make well-grounded statements about that phenomenon.
One way out of this seemingly hope-less ambition is to think of projects as members of a project family. Jacobsson, Lundin, and Söderholm (2015) have
Figure 3: Embeddedness of projects and temporary organizations (inspired by Sydow & Braun, 2015).
Embedded in network
PSO activities PBO projects PNW action
Embedded in organization
PMJ_87569728_47_4_Aug_Sept_2016.indb 12 9/19/16 3:44 PM
August/September 2016 ■ Project Management Journal 13
employed by the PBO and normally transferred from one project to the next when the project was completed. In the same manner, project managers were transferred to new projects (if they were not already working on several projects in parallel).
Projects in PSO and PNW contexts represent a diversification of appli-cations of project thinking with less involvement of industrialized behaviors. Whereas project personnel, whether project workers or managers, are trans-ferred to new projects in PBOs, the transfer is less normalized in other con-texts. Some people involved merely go back to line positions within their orga-nizations; yet, as has been illustrated, there as predispositions to initiate and work in other projects in the future also for those people. As illustrated in Figure 2, network projects represent a widening of the project concept within a family of projects of varying types.
In line with the previous reasoning that eras are described in terms of what was focused on at the time the descrip-tion was made, the time has come to conjecture about what the coming steps will consist of. The current stream of projectification developments will most likely continue for some time; eventu-ally, however, the post–Project Society will be here and it will be time to ask the crucial question: What imprints has Project Society left on history? It is prob-ably safe to conjecture that the current passion for projectification will again be attacked, using the arguments that proj-ects are not all that good (cf. Lundin, 1999). How learning takes place and how knowledge is stored are such mat-ters. The loss of continuity is another. In contacts with project organizers, par-ticularly in the public sector, there seem to be many second thoughts about the usefulness of projectification. The ques-tion often raised in conversation is: Is there is an over-projectification of regu-lar activities? Can, in fact, a reliance on projects be of real help in finding sus-tainable solutions for pressing societal problems?
to find new roles for themselves and work less connected to working time itself but more to task focus. As a paral-lel to management, work also differs between the three prototypical contexts (see Lundin et al., 2015a, pp. 129–169, for a more elaborate discussion).
Project Society as TemporaryIn retrospect, the organization of soci-ety has been described in various and changing ways. Sometimes these descriptions are regarded as controver-sial; yet, throughout the generations, it seems like the denominations have stabilized. Dynamic periods are thought of as revolutions; thus, the Industrial Revolution is accepted as a general phenomenon but, at the same time, various stages of the revolution are dis-cerned in order to model how societal change has taken place over the years. The Industrial Revolution is sometimes described as three revolutionary phases (Stine, 1975). The first Industrial Revo-lution is connected with the formation of traditional industrial organizations. The second evolution covers the phase during which industrial thinking and institutions were developed and dif-fused to all parts of society. The third revolution is technology driven and primarily connected with the develop-ment of information and communica-tion technology.
In line with the previous discussion about the development of Project Soci-ety, one might suggest that a first step in Project Society was taken with the development of project management and the tools connected with the intro-duction of project management. The introduction of project management was, in fact, in line with industrial think-ing applied in a project context. The generation of projects involved in that step was essentially projects handled in a project-based organization con-text; the thinking was very much related to engineering in an industrial society vein. In that initial phase, work was to a high degree unionized, meaning that the people doing the physical work were
in clashes with the prevailing notions of management and work. Projects are temporary (at least by definition) but the institutions were established with completely different conceptu-alizations, including organizations as ongoing.
With the widening application areas for project work to environments of the PSO or PNW type, the traditional insti-tutions became even more at odds with the traditional concepts of management and work. Adaptation has essentially meant that management and work have become open to other specifications. Ever since Carlson (1951) published his study of what managers do, there have been several later studies (including studies of project managers) and they demonstrate how managerial work has developed over time in relation to the context of management and societal movements over time. Similarly, the conceptions of work are changing.
The point is that reformed concep-tions of management and work, inspired by Project Society, are at odds with existing institutions at the same time as adapted institutions might be at odds with traditional parts of society. The reformed conceptions of management and work are very different from the traditions of the past. In essence, the reforms have made conceptions more adapted to the circumstances. For one thing, management tasks end in the same way as projects come to a conclu-sion. The management of a set of proj-ects (rather than only one) puts other demands on the managing person. The management of PBOs, PSOs, and PNWs introduces a revised set of conceptions of forms for management (see Lundin et al., 2015a, pp. 80–128, for an elab-orate discussion). Likewise, work and employment regimes suitable for a proj-ect society differ from the correspond-ing institutions formed to fit industrial society and are adapted to the demands of how to handle project work. For one thing, the mass handling of employment regimes and the role of unions have changed, leading to weak unions trying
PMJ_87569728_47_4_Aug_Sept_2016.indb 13 9/19/16 3:44 PM
Project Society: Paths and Challenges
14 August/September 2016 ■ Project Management Journal
PAPERS
Hoboken, NJ: John Wiley & Sons, Inc., pp. 1368–1388.
Morris, P. W. (1994). The management of projects. London, England: Thomas Telford.
Morris, P. W. (2013). Reconstructing project management. Oxford, England: John Wiley & Sons Ltd.
Näsholm, M. H., & Blomquist, T. (2015). Co-creation as a strategy for program management. International Journal of Managing Projects in Business, 8(1), 58–73.
Packendorff, J. (1995). Inquiring into the temporary organization: New directions for project management research. Scandinavian Journal of Management, 11(4), 319–333.
Pellegrinelli, S., & Bowman, C. (1994). Implementing strategy through projects. Long Range Planning, 27(4), 125–132.
Pettigrew, A. M., Whittington, R., Melin, L., Sanchez-Runde, C., Van den Bosch, F. A., Ruigrok, W., & Numagami, T. (Eds.). (2003). Innovative forms of organizing: International perspectives. Thousand Oaks, CA: Sage.
Pinney, B. W. (2002). Projects, management, and protean times: Engineering enterprise in the United States, 1870–1960. Enterprise & Society, 620–626.
Roesdahl, E., Williams, K., & Margeson, S. (1998). The Vikings. London, England: Penguin Books.
Schoper, Y., Gemünden, H., & Nguyen, N. (2015). Future trends for project management in 2025, Working paper, Berlin Institute of Technology, Berlin, Germany.
Stine, G.H. (1975). The third industrial revolution. New York, NY: G. P. Putnam’s Sons.
Sydow, J., & Braun, T. (2015). Von Projekten zu temporären Organisationen: Mehr als neue Begrifflichkeiten? (From projects to temporary organizations: More than new concepts?) In Zeitschrift Führung 1 Organisation, 84(4), 232–237.
International Journal of Project Management, 29(4), 359–373.
Lenfle, S., & Loch, C. (2010). Lost roots: How project management came to emphasize control over flexibility and novelty. California Management Review, 53(1), 32–55.
Lundin, R.A. (1999). If projects are so damned good, how come everything ain’t projects? In Artto, K., Kähkönen, K., & Koskinen, K. (eds), Managing business by projects, Helsinki, Finland: Project Management Association Finland and Nordnet (pp. 189–201).
Lundin, R.A., Arvidsson, N., Brady, T.M., Ekstedt, E., Midler, C., & Sydow, J. (2015a). Managing and working in project society: Institutional challenges of temporary organizations. Cambridge, England: Cambridge University Press.
Lundin, R.A., Midler. C., & Wåhlin, C. (2015b). Projectification Revisited/Revised, Paper presented at the IRNOP conference, UCL, London, England, June 22–24.
Lundin, R.A., & Söderholm, A. (1995). A theory of the temporary organization. Scandinavian Journal of Management, 11(4), 437–455.
Lundin, R.A., & Söderholm, A. (2013). Temporary organizations and end states: A theory is a child of its time and in need of reconsideration and reconstruction. International Journal of Managing Projects in Business, 6(3), 587–594.
March, J. G. (1991). Exploration and exploitation in organizational learning. Organization Science, 2(1), 71–87.
Maylor, H., Brady, T., Cooke-Davies, T., & Hodgson, D. (2006). From projectification to programmification. International Journal of Project Management, 24(8), 663–674.
Midler, C. (1995). Projectification of the firm: The Renault case. Scandinavian Management Journal, 11(4), 363–375.
Midler, C., & Navarre, C. (2004). Project management in automotive industry, in The Wiley guide to managing projects, P. W.G. Morris, J. K. Pinto (eds).
ReferencesArtto, K., & Kujala, J. (2008). Project business as a research field. International Journal of Managing Projects in Business, 1(4), 469–497.
Carlson, S. (1951). Executive behaviour: A study of the work load and the working methods of managing directors. Stockholm, Sweden: Arno Press.
Davies, A., Gann, D., & Douglas, T. (2009). Innovation in megaprojects: Systems integration at London Heathrow Terminal 5. California Management Review, 51(2), 101–125.
Ekstedt, E., Lundin, R. A., Söderholm, A., & Wirdenius H. (1999). Neo-industrial organizing: Action, knowledge formation and renewal in a project-intensive economy. London, England: Routledge.
Fowler, N., Lindahl, M., & Sköld, D. (2015). The projectification of university research: A study of resistance and accommodation of project management tools & techniques. International Journal of Managing Projects in Business, 8(1), 9–32.
Godenhjelm, S., Lundin, R.A., & Sjöblom, S. (2015). Projectification in the public sector: The case of the European Union. International Journal of Managing Projects in Business, 8(2), 324–348.
Greenwood, R., & Hinings, C. R. (1996). Understanding radical organizational change: Bringing together the old and the new institutionalism. Academy of Management Review, 21(4), 1022–1054.
Jacobsson, M., Lundin, R. A., & Söderholm, A. (2015). Researching projects and theorizing families of temporary organizations. Project Management Journal, 46(9), 9–18.
Kaplan, S., & Orlikowski, W. J. (2013). Temporal work in strategy making. Organization Science, 24(4), 965–995.
Lawson, P. (2014). The East India company: A history. London, England: Routledge.
Lenfle, S. (2011). The strategy of parallel approaches in projects with unforeseeable uncertainty: The Manhattan case in retrospect.
PMJ_87569728_47_4_Aug_Sept_2016.indb 14 9/19/16 3:44 PM

August/September 2016 ■ Project Management Journal 15
Rolf A. Lundin is Professor Emeritus of Business Administration at Jönköping International Business School, Jönköping, Sweden, and Courtesy Professor-in-Residence at Umeå School of Business and Economics, Umeå, Sweden. He has received several prizes and awards for his research on projects and temporary organizations, including the 2014 PMI® Research Achievement Award and the IPMA Research Achievement Award in 2010. Professor Lundin has been published widely, with a concentration on temporary organizations, and has edited numerous special issues of journals focusing on the area of projects; his current main focus is on innovative research on projects and temporary organizations. He can be contacted at [email protected]
project management (Vol. 4): Flexibility and innovative capacity, Nürnberg, Germany: GPM Deutsche Gesellschaft für Projektmanagement e. V.
Yeung, J. F., Chan, A. P., & Chan, D. W. (2007). The definition of alliancing in construction as a Wittgenstein family-resemblance concept. International Journal of Project Management, 25(3), 219–231.
Yeung, J. F., Chan, A. P., & Chan, D. W. (2012). Defining relational contracting from the Wittgenstein family-resemblance philosophy. International Journal of Project Management, 30(2), 225–239.
Turner, J. R. (2014). The handbook of project-based management (Vol. 92). New York, NY: McGraw-Hill.
Wåhlin, N., Kapsali, M., Näsholm, M. H., & Blomquist, T. (2013). The case of a self-emerging community, Paper presented at the 8th Organization Studies Workshop, Mykonos, Greece, May 23–25.
Wald, A., Spanuth, T., Schneider, C., & Schoper, Y. (2015). Towards a measurement of ‘projectification:’ A study on the share of project work in the German economy. In Wald, A., Wagner, R., Schneider, C., & Gschwendtner, M. (Eds), Advanced
PMJ_87569728_47_4_Aug_Sept_2016.indb 15 9/19/16 3:44 PM
16 August/September 2016 ■ Project Management Journal
PA
PE
RS
ABSTRACT ■ INTRODUCTION
Rework is a chronic and recurrent problem in construction, engineering, and natural resource (i.e., oil, gas, mineral sands) projects that adversely impacts project performance, productivity, and safety (Robinson-Fayek Dissanayake, & Campero, 2004). Surprisingly, rework has largely been
ignored and deemed to be a normal function of operations (Moore, 2012) and is often deliberately concealed (Ford & Sterman, 2003). Because rework fundamentally pertains to correcting errors arising from unanticipated events, the question is: “How do we anticipate it when, by definition, its occurrence is unanticipated” (Pinto, 2013)? Rework costs are implicitly accommodated within a project’s traditional cost contingency, yet an allowance for it is unacceptable to clients because it is deemed to be something that should not occur. Indeed, contractual tenders that include cost, time, and disruption as a result of rework render consultants and contractors potentially uncompetitive. With increasingly tighter profit margins and lower productivity rates being experienced, particularly in Australia, rework is untenable as business competitiveness is severely jeopardized. To prevent rework, various approaches are being promulgated. These include visualization technologies, modularization, lean construction, and relationship contracting. Such approaches may yield some project performance improvement but they merely abate rework, because human behavior is all too adept at concealing problems and committing errors (Ford & Sterman, 2003).
Studies of rework causation have tended to focus narrowly on identifying specific causal factors (e.g., Hwang, Thomas, Haas, & Caldas, 2009; Zhang, Haas, Goodrum, Caldas, & Granger, 2012). This approach, however, is coun-terintuitive, because rework causation can only be understood by reviewing the whole project system in which it occurs and examining how variables dynamically interact with one another (Ackermann & Eden, 2005). Within this context, an operational system, such as a construction, engineering, or resource project, can be categorized as having “blunt” and “sharp” ends (Dekker, 2006). The “sharp end” represents the project site where people are carrying out the physical work associated with project delivery. The “blunt end,” on the other hand, encompasses the organization(s) that support, drive, and shape the activities of the design and construction process. The blunt end (which includes governments, regulatory bodies, financial institutions, and clients) provides information to facilitate design and construction, but invari-ably introduces project cost and time constraints. Strategic decisions taken at the blunt end can create, shape, and stimulate opportunities for errors to materialize (Dekker, 2006). Too often, time constraints restrict design-related activities and lead to incomplete tasks and/or inadequately prepared
Making Sense of Rework Causation in Offshore Hydrocarbon ProjectsPeter E. D. Love, Department of Civil Engineering, Curtin University, AustraliaFran Ackermann, Curtin Business School, Curtin University, AustraliaJim Smith, Institute of Sustainable Development and Architecture Bond University, AustraliaZahir Irani, Brunel Business School, Brunel University, EnglandDavid J. Edwards, Birmingham City Business School, Birmingham City University, England
Retrospective sensemaking is used to
determine how and why rework in offshore
hydrocarbon projects occurred. Staff from
organizations operating at the blunt end
(e.g., clients/design engineers providing
finance and information) and those at the
sharp end (e.g., contractors at the “coal-
face”) of a project’s supply chain were inter-
viewed to make sense of the rework that
occurred. The analysis identified the need for
managers to de-emphasize an environment
that prioritizes production over other consid-
erations and instead systematically examine
mechanisms and factors that shape people’s
performance. Limitations of the research and
the implications for managerial practice are
also identified.
KEYWORDS: rework; error; offshore
projects; retrospection; production
pressure; learning
Project Management Journal, Vol. 47, No. 4, 16–28
© 2016 by the Project Management Institute
Published online at www.pmi.org/PMJ
PMJ_87569728_47_4_Aug_Sept_2016.indb 16 9/19/16 3:44 PM
August/September 2016 ■ Project Management Journal 17
contexts can help avoid the “blame game” and institute an effective strategy for learning to emerge.
Only the experience acquired from committing an error can engender learning and lower the risk of reoc-currence (Love et al., 2013). Yet, orga-nizations with high reliability may be anxious that errors or potential failures are embedded within ongoing activi-ties, especially because unexpected failure modes and the limitations of foresight may amplify errors (Roberts, 1990). Organizations participating in such projects while trying to maintain a high reliability status need to: (1) continually make sense of their envi-ronment; and (2) learn from reports and identify the risks embedded within processes and systems at the project’s operational, tactical, and strategic lev-els. This task may be particularly ardu-ous when contracts involve multiple organizations, each with potentially conflicting goals, objectives, and orga-nizational cultures. Within the realm of understanding human error, Dekker (2006) suggests that:
• past situations should be reconstructed and documented by other people in a way that considers assertions about unobservable psychological mecha-nisms; and
• there are systemic connections between situations and behavior, that is, between what people did and what actually happened in the environment around them. (p. 71)
The connection between situations and behavior is bidirectional. People change the situation by doing what they do and by managing their processes (Dekker, 2006). Yet, an evolving situa-tion also alters people’s understand-ing and behavior, and allows changes to be undertaken. Under such circum-stances, connections between the situ-ation and behavior can be uncovered, investigated, documented, and repre-sented graphically using techniques such as cause-effect, causal loop, and
a contentious matter. Making mistakes is an innate characteristic of human nature (Reason, 1990). Human errors occur for various reasons, and differ-ent actions are required to prevent or avoid them. Specifically, errors can arise because of mistakes of commis-sion (doing something incorrectly) or mistakes of omission (not doing what should have been done or doing some-thing out of sequence). An individual’s training, experience, or competence does not necessarily prevent errors or omissions (Hagen & Mays, 1981). Admitting errors can, however, lead to blame and may result in legal proceed-ings, which is why design profession-als (e.g., engineers) and contractors have been unable or unwilling to fully realize the potential of learning from errors (Love, Edwards, & Smith, 2013). Edmonson (2011) observed that execu-tives, for example, are often faced with a false dichotomy, that is: “How can they respond constructively to failures without giving rise to an anything goes attitude? If people aren’t blamed for all failure, what will ensure they try as hard as possible to do their best work?” (p. 50)
Commission and omission errors, for example, warrant blame, but a lack of skill and knowledge is attributable to the organization, which should ensure that individuals are occupa-tionally competent. In the case of task orientation, an employee could be stressed and/or fatigued as a result of tight time constraints being imposed. In this case, the individual’s manager is responsible for the employee’s failure. The key research question, therefore, is: What circumstances lead to such time constraints being imposed? In this instance, an understanding of context is needed because context “binds people to actions that they must justify and it affects the saliency of information, and it provides the norms and expectations that constrain explanations” (Salanick & Pfeffer, 1978). A key proposition of this research is that developing a rich understanding of rework causation and
processes (Andi & Minato, 2003). When rework occurs and time constraints are imposed, there is then a propensity for the formation of “vicious circles” to increase significantly (Williams, Eden, Ackermann, & Tait, 1995).
The research presented in this article utilizes the lens of retrospective sensemaking to facilitate a deeper understanding of issues that contribute to rework and provide a means to inform and direct actions to mitigate its occur-rence. A detailed review of the norma-tive rework literature is presented to provide a sense of the extant knowledge and associated gaps that the research aims to fill. Organizations operating at the “blunt” and “sharp” ends are inter-viewed to make sense of the rework that occurred on their projects. Understand-ing rework in this way provides the feed-back required to develop a foundation for learning to occur.
Rework CausationTerms such as quality deviation, non-conformances, quality failures, and defects are often considered to be synonymous with rework ( Josephson, Larsson, & Li, 2002). Because these terms are used interchangeably, a degree of ambiguity with regard to the definition of rework exists (Love & Edwards, 2004). Put simply, rework can be defined as “the unneces-sary effort of re-doing a process or activity that was incorrectly implemented the first time” (Love, 2002a, p.18). The Construc-tion Industry Institute (2001) confines rework to the sharp end and defines it as activities that have to be done more than once or activities that remove work previ-ously installed as part of the project. How-ever, it should be acknowledged that some activities or processes implemented cor-rectly might require adjustment because of changes in client or end-user require-ments (Eden, Ackermann, & Williams, 2005).
Ultimately, errors occur as a result of the physiological and/or psycho-logical limitations of humans (Reason, 1990). However, whether individuals can justifiably be blamed for all errors is
PMJ_87569728_47_4_Aug_Sept_2016.indb 17 9/19/16 3:44 PM
Making Sense of Rework Causation in Offshore Hydrocarbon Projects
18 August/September 2016 ■ Project Management Journal
PAPERS
that summarizes lessons learned into a single narrative. Such an approach can increase people’s confidence and enable them to act more decisively in the future. Weick (1995) suggests that confidence is a key determinant for “environmental enactment;” for exam-ple, managers can utilize workplace sys-tems and processes that they anticipate will reduce and contain the incidence of rework. This approach may trigger a process of unlearning that challenges the underlying concepts, paradigms, and the Weltanschauung (i.e., a par-ticular philosophy or view of the world) that has determined the historical way of thinking.
Design and Construction: The Known and Unknown
Smith and Eppinger (1997) contend that the proportion of money and time spent on rework in the product design phase can be significantly higher than in the construction phase. This is because the design engineering process is inher-ently iterative. It strives to solve coupled problems with complex relationships. The situation within construction is the opposite, as design costs are often less than 1% of the life cycle cost of a proj-ect, or less than 10% of the total con-struction value (Eldin, 1991). Although design cost is minimal, it is the single most important influence on total proj-ect expenditure. It is during the design process that errors and omissions mate-rialize (as contributors to rework), and these occur because of embedded dys-functional organizational practices, “pluralistic ignorance,” unreasonable cost estimates, and schedule con-straints being imposed upon the project team by clients (Love, Edwards, & Irani, 2012). Such unreasonableness may be attributable to clients’ optimism bias and their inexperience with the proj-ect delivery process. This may well be expected, as most clients only ever build once. Even those who construct on a regular basis rarely use the same team to deliver their requirements (Love, Skitmore, & Earl, 1998).
rework costs between light industrial, heavy industrial, and various buildings types—probably because of varying and increased design complexity.
The reported costs of rework identi-fied within the extant literature vary sig-nificantly and range from 3% to 25% of a project’s contract value (Barber, Sheath, Tomkins, & Graves, 2000). Robinson-Fayek et al. (2004) suggest that this is primarily because of a lack of a standard-ized and robust methodology for rework determination. Some studies have excluded change orders and errors as a result of off-site manufacture that result in rework being undertaken (Rogge, Cogliser, Alaman, & McCormack, 2001) and increasing emphasis has been placed on simply determining direct rework costs. However, the intangible costs associated with disruption and schedule delays that arise have been overlooked as an additional cost. Rework may also have a multiplier effect of up to six times the actual (direct) cost of rectification (Love, 2002b). Yet, such costs are not apportioned to the client or contractor but rather “forced” down the supply chain to subcontrac-tors and suppliers. Such additional costs can adversely impact the profitability and survival of these firms, which are typically small- to medium-sized firms that depend upon having a positive cash flow (Love, 2002b).
However, understanding the circum-stances that form the setting in which errors and subsequent rework occurs is a critical part of the process of reducing their occurrence. Dekker (2006) spe-cifically states: “knowledge of context is critical to understanding error. Answers to why people do what they do often lie in the context surrounding their actions. Counting errors and stuffing them away in a measurement instrument removes that context” (p. 68). The establishment of a context that focuses on “retrospec-tive decisiveness” should be stimu-lated, which, according to Weick et al. (2005) is similar to learning in reverse. Through this process, people can learn from their errors or reconstruct a history
fault tree (Battles Dixon, Borotkanics, Rabin-Fastmen, & Kaplan, 2006). To understand human error, knowledge of the individual’s working environ-ment and situation is required (which includes tasks undertaken and the tools and technology used). Answers to the question “What’s the story?” are therefore addressed in such a way that plausible answers gain validity from subsequent activity (Weick, Sutcliffe, & Obstfeld, 2005)
Quantification: The Need for Context
Studies have typically quantified rework according to its cost as a proportion of contract value, its type (e.g., change, error, and omission), or by subcontract trade and building element (e.g., sub-structure, superstructure, internal and external finishes and services) (e.g., Forcada, Macarulla, Gangelells, Casals, Fuertes, & Roca, 2012; Mills, Love, & Williams, 2009). The Construction Industry Development Board (CIDB, 1989) in Singapore estimated that between 5% and 10% of total project costs are associated with doing things erroneously and then rectifying them. The CIDB concluded that adoption of an effective quality management sys-tem would reduce rework to anywhere between 0.1% and 0.5% of the total project cost. The Construction Indus-try Development Agency (1995) in Aus-tralia revealed that projects without a formal quality system in place (and procured using a traditional lump sum contract) experienced rework costs in excess of 15% of their contract value. Contrastingly, an analysis of 260 con-struction and engineering projects revealed that rework costs did not sig-nificantly vary by project size (i.e., con-tract value), procurement method, and project type adopted (Love, Edwards, Smith, & Walker, 2009). Hwang et al. (2009) concurred with Love et al. (2009) and found no significant differences for rework costs by project size and work type (i.e., construct only or design and construct). However, Hwang et al. (2009) identified an increase in
PMJ_87569728_47_4_Aug_Sept_2016.indb 18 9/19/16 3:44 PM
August/September 2016 ■ Project Management Journal 19
period is needed. In practice, activities are executed at varying levels, depend-ing upon individuals’ skill and compe-tence, and this can lead to compromises in quality. Within the rework cycle, it is assumed that inexperienced people are more likely to commit more errors. This assumption may be true, but Reason (1997) contends that often, highly quali-fied and competent individuals com-mit the most mistakes with the worst consequences. Cooper (1993a, 1993b) suggests that the quality and the error discovery rate are important factors that should be considered. Purely bolstering a project with additional resources will not resolve fundamental problems; a more pre-emptive approach should be utilized to reduce the number of errors and the time taken over their detection (Rodrigues & Bowers, 1996).
The rework cycle provides a systemic overview of project behavior, but it fails to contextualize rework causation for organizations to learn from experience. Rather, the underlying contextual condi-tions influence people’s ability to learn from errors (Weick & Ashford, 2001). Dixon (2003) notes that it is the ability to retrospectively find patterns in the con-tinual flow of daily workplace activities that give those events meaning. When insights and knowledge are acquired about rework causation within a given context, changes to prevent and reduce the negative consequences of rework can be implemented (Zhao, 2011). A key obstacle preventing achievement of these goals has been the inability to understand how to specify the contexts in which rework might occur, because previous research has tended to focus on identifying a singular root cause.
Research ApproachTo determine the systemic nature of rework, the ontology of “subjective ide-alism” is adopted because of the lim-ited discourse in this specific field of research, particularly oil and gas proj-ects (Farrell, 1996). For this approach, individuals construct their own views and opinions on the phenomena under
either deemed “to be done,” “in pro-cess,” or “done” (Cooper, 1993a, 1993b). In contrast, the rework cycle is best described as an archetypal dynamic structure. The rework cycle pro-vides a description of workflow that incorporates rework and undiscovered rework. Work rate is determined by staff skills, productivity, and availability; as project time advances, the amount of work remaining reduces. Work is com-pleted or becomes undiscovered rework depending on quality (the proportion of work undertaken completely and cor-rectly). Undiscovered work contains errors that remain undetected and are perceived to have been undertaken. The quality of work produced may fall below the required standards, and errors may still occur. Errors are often not immedi-ately identifiable (latent) and only tran-spire after a period of incubation in the system. As time progresses, these errors are eventually detected and rework is identified, snowballing staff workload (Rodrigues & Williams, 1998).
The extent of rework required is dependent upon how long the latent error has remained undetected. For instance, a dimensional error or spatial conflict contained within the engineer-ing design may not transpire until the project is physically constructed on site. If the error necessitates a major change, the entire perceived progress prior to the error occurring may be considered wasted. Addressing the error not only generates more work for individuals but also increases the possibility of more errors occurring.
The discontinuity of design staff may also significantly impact design pro-cess performance (Rodrigues & Bow-ers, 1996). This is because the inherent project knowledge held by each staff member cannot be seamlessly trans-ferred directly from one individual to another, even if a hand-over “transi-tion” period (and/or debriefing) occurs. Even in-house staff recruited cannot acquire sufficiently detailed knowledge immediately after commencing work on site, and so an initial project absorption
Many of the academic, industry, and government reports produced have acknowledged the need for clients to change their approach to delivering projects in order to enhance produc-tivity and performance. Yet, despite the persuasive arguments put forward, clients generally remain reluctant to embrace the recommendations pro-posed (e.g., shifting away from the use of competitive tendering, using rela-tionship contracting, and technologies that utilize aspects of Building Informa-tion Modeling). Regardless of “value for money” aspirations, clients have a proclivity to steer themselves toward the lowest price, irrespective of the long-term financial consequences. In some instances, therefore, clients may subconsciously trade the lowest price (i.e., both with consultants and con-tractors) with the possibility of scope changes to unconsciously create rework during construction—the extent of which remains unknown at the time of exchanging contracts.
Fixing a project’s governance, deliv-ery strategy (including responsibility and risk allocation), and technology influences the ability to establish an effective generative project culture that focuses on accomplishing a common goal and good team performance (i.e., doing what everyone is supposed to do) (Westrum, 2004). On this point, Love et al. (2012) examined the influ-ence of strategic decisions at the forma-tive stages of a project and proposed the following orthodoxy: “competitive tendering for selecting design consul-tants’ projects establishes an environ-ment where their services are reduced or omitted to maximize profit. The omission of critical tasks and practices such as design audits, reviews and verifications leads to contract docu-mentation being erroneously produced and therefore increases the propensity for rework occurring during construc-tion” (p. 569).
Conventional project planning and monitoring techniques do not acknowl-edge or measure rework, and tasks are
PMJ_87569728_47_4_Aug_Sept_2016.indb 19 9/19/16 3:44 PM
Making Sense of Rework Causation in Offshore Hydrocarbon Projects
20 August/September 2016 ■ Project Management Journal
PAPERS
involved in the delivery of offshore proj-ects. For the oil and gas operator, 23 in-depth interviews were conducted with a variety of personnel who had been involved with constructing offshore floating structures such as floating pro-duction storage and offloading (FPSO) vessels, tension leg platforms and jacket platforms. Interviewees included a gen-eral manager (1), operations managers (2), project managers (10), structural engineers (3), procurement managers (2), business managers (2), and engi-neering managers (3). The contractor was involved in the design, installation, and commissioning of electrical and instrumentation (E&I) engineering sys-tems. Interviews were also undertaken with the managing director, business development manager, engineers (8), and draftsmen (6).
The research team collaborated with a direct contact point within the partici-pating operator and contractor who had an interest in understanding why and how rework emerged in their projects. For reasons of commercial confiden-tially, specific details about the orga-nization and individuals interviewed are not presented. All interviews were conducted at the interviewees’ offices for their convenience. Interviews were digitally recorded and subsequently transcribed verbatim to allow for finer nuances of the discussions to be docu-mented. Handwritten notes were also taken during the interview to record any notable facial expressions, gesticu-lations, or other body language that might assist with the line of inquiry. The interviewees’ details were coded to preserve anonymity, although all inter-viewees were aware that their identities might be revealed from the textural nar-rative. The interview format was kept as consistent as possible and followed the emergent rework themes identified within the extant literature.
The semi-structured interview com-menced by asking individuals about their experience within industry and their current role within the organiza-tion. Interviewees were then invited to
or obvious at the time (Weick, 1995). In this instance, retrospective sense-making implies that errors and subse-quent rework should be anticipated and reduced through a process of “good proj-ect management.” The future is indeter-minate and the past is reconstructed when the outcome is already known; thus, past events are rarely accurately recalled. Reason (1990) asserts that the “knowledge of the outcome of a previ-ous event increases the perceived likeli-hood of that outcome” (p. 91), which can lead people to overestimate their ability to influence future events. This phenomenon is known as the “illusion of control” (Langer, 1975). Organiza-tions with a strong desire and willing-ness to reduce rework within projects require an interpretation of past inde-terminacy that favors order and over-simplifies causality (Reason, 1990). This approach facilitates a meaningful context as to “why” and “how” rework materialized and provides insights that help construct invaluable lessons on how to mitigate future rework.
Face-to-Face Interviews
The more complex the subject matter, the richer the communication medium needs to be, with the richest form being face-to-face interviews (Battles, Dixon, Borotkanics, Rabin-Fastmen, & Kaplan, 2006). Face-to-face interviews provide more clues in terms of tone of voice, facial expression, and body language—all of which assist the interviewee in making informed adjustments about the topic of inquiry. For this reason, Dixon (2003) recommends that sense-making conversations be held face-to-face, as should conversation invitations and the communication of results.
Using this approach, interviews were undertaken with two organizations—an operator (i.e., blunt end) and contrac-tor (i.e., sharp end)—that had extensive involvement and experience in deliver-ing oil and gas projects in Australia. The organizations were systematically selected for this research because they were market leaders and were actively
investigation based upon their expe-riences; an inclination to truth and pragmatism is deemed to prevail. Sense-making is used to underpin the ontology adopted. Meaning is given to experience, dialogue, and narratives about events that have occurred through the pro-cess of retrospection (Weick, 1995) The notion of “retrospective sensemaking” is derived from Schutz’s (1967) analysis of “meaningful experience” where events occur in a moment of time and can exist in pure duration and as discrete seg-ments. Pure duration can be described as a “stream of experience” (James, 1950). Experience is a singular construct that is a “coming-to-be and passing-away that has no contours, no boundaries and no differentiation” (Schutz, 1967).
Experiences in this context, how-ever, imply distinct, separate episodes (Weick, 1995). The creation of mean-ing from experience(s) is reliant upon a temporal process of attention being directed backward to specific time peri-ods; so whatever presently occurs will influence future discoveries when peo-ple analyze the past (Weick et al., 2005). Furthermore, memories are events that occur in a given period of time. Any-thing that affects a person’s ability to remember also affects the same sense that is made of those memories. With this in mind, Weick (1995) refers to Fischoff (1975) who states that “creep determinism” can prevail, especially “when people who already know the outcome of a complex prior history of tangled, indeterminate events remem-ber that history as being much more determinant, leading inevitably to the outcome they already knew” (p. 28). Consequently, determinant histories can be reconstructed differently (Weick, 1995), which is akin to a postmodern cultural view: One person may experi-ence the same phenomenon differently from another person (Alvesson & Deetz, 1996). For example, if an outcome is perceived to be bad, then antecedents are reconstructed to emphasize incor-rect actions and inaccurate percep-tions, even if they were not influential
PMJ_87569728_47_4_Aug_Sept_2016.indb 20 9/19/16 3:44 PM
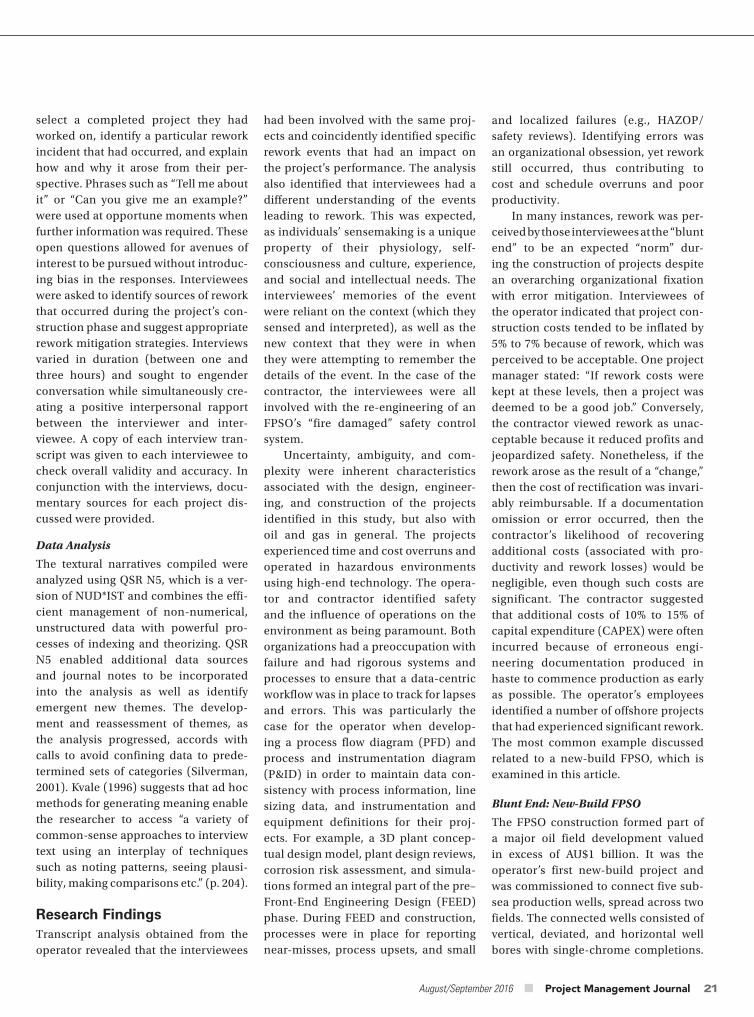
August/September 2016 ■ Project Management Journal 21
and localized failures (e.g., HAZOP/safety reviews). Identifying errors was an organizational obsession, yet rework still occurred, thus contributing to cost and schedule overruns and poor productivity.
In many instances, rework was per-ceived by those interviewees at the “blunt end” to be an expected “norm” dur-ing the construction of projects despite an overarching organizational fixation with error mitigation. Interviewees of the operator indicated that project con-struction costs tended to be inflated by 5% to 7% because of rework, which was perceived to be acceptable. One project manager stated: “If rework costs were kept at these levels, then a project was deemed to be a good job.” Conversely, the contractor viewed rework as unac-ceptable because it reduced profits and jeopardized safety. Nonetheless, if the rework arose as the result of a “change,” then the cost of rectification was invari-ably reimbursable. If a documentation omission or error occurred, then the contractor’s likelihood of recovering additional costs (associated with pro-ductivity and rework losses) would be negligible, even though such costs are significant. The contractor suggested that additional costs of 10% to 15% of capital expenditure (CAPEX) were often incurred because of erroneous engi-neering documentation produced in haste to commence production as early as possible. The operator’s employees identified a number of offshore projects that had experienced significant rework. The most common example discussed related to a new-build FPSO, which is examined in this article.
Blunt End: New-Build FPSO
The FPSO construction formed part of a major oil field development valued in excess of AU$1 billion. It was the operator’s first new-build project and was commissioned to connect five sub-sea production wells, spread across two fields. The connected wells consisted of vertical, deviated, and horizontal well bores with single-chrome completions.
had been involved with the same proj-ects and coincidently identified specific rework events that had an impact on the project’s performance. The analysis also identified that interviewees had a different understanding of the events leading to rework. This was expected, as individuals’ sensemaking is a unique property of their physiology, self-consciousness and culture, experience, and social and intellectual needs. The interviewees’ memories of the event were reliant on the context (which they sensed and interpreted), as well as the new context that they were in when they were attempting to remember the details of the event. In the case of the contractor, the interviewees were all involved with the re-engineering of an FPSO’s “fire damaged” safety control system.
Uncertainty, ambiguity, and com-plexity were inherent characteristics associated with the design, engineer-ing, and construction of the projects identified in this study, but also with oil and gas in general. The projects experienced time and cost overruns and operated in hazardous environments using high-end technology. The opera-tor and contractor identified safety and the influence of operations on the environment as being paramount. Both organizations had a preoccupation with failure and had rigorous systems and processes to ensure that a data-centric workflow was in place to track for lapses and errors. This was particularly the case for the operator when develop-ing a process flow diagram (PFD) and process and instrumentation diagram (P&ID) in order to maintain data con-sistency with process information, line sizing data, and instrumentation and equipment definitions for their proj-ects. For example, a 3D plant concep-tual design model, plant design reviews, corrosion risk assessment, and simula-tions formed an integral part of the pre–Front-End Engineering Design (FEED) phase. During FEED and construction, processes were in place for reporting near-misses, process upsets, and small
select a completed project they had worked on, identify a particular rework incident that had occurred, and explain how and why it arose from their per-spective. Phrases such as “Tell me about it” or “Can you give me an example?” were used at opportune moments when further information was required. These open questions allowed for avenues of interest to be pursued without introduc-ing bias in the responses. Interviewees were asked to identify sources of rework that occurred during the project’s con-struction phase and suggest appropriate rework mitigation strategies. Interviews varied in duration (between one and three hours) and sought to engender conversation while simultaneously cre-ating a positive interpersonal rapport between the interviewer and inter-viewee. A copy of each interview tran-script was given to each interviewee to check overall validity and accuracy. In conjunction with the interviews, docu-mentary sources for each project dis-cussed were provided.
Data Analysis
The textural narratives compiled were analyzed using QSR N5, which is a ver-sion of NUD*IST and combines the effi-cient management of non-numerical, unstructured data with powerful pro-cesses of indexing and theorizing. QSR N5 enabled additional data sources and journal notes to be incorporated into the analysis as well as identify emergent new themes. The develop-ment and reassessment of themes, as the analysis progressed, accords with calls to avoid confining data to prede-termined sets of categories (Silverman, 2001). Kvale (1996) suggests that ad hoc methods for generating meaning enable the researcher to access “a variety of common-sense approaches to interview text using an interplay of techniques such as noting patterns, seeing plausi-bility, making comparisons etc.” (p. 204).
Research FindingsTranscript analysis obtained from the operator revealed that the interviewees
PMJ_87569728_47_4_Aug_Sept_2016.indb 21 9/19/16 3:44 PM
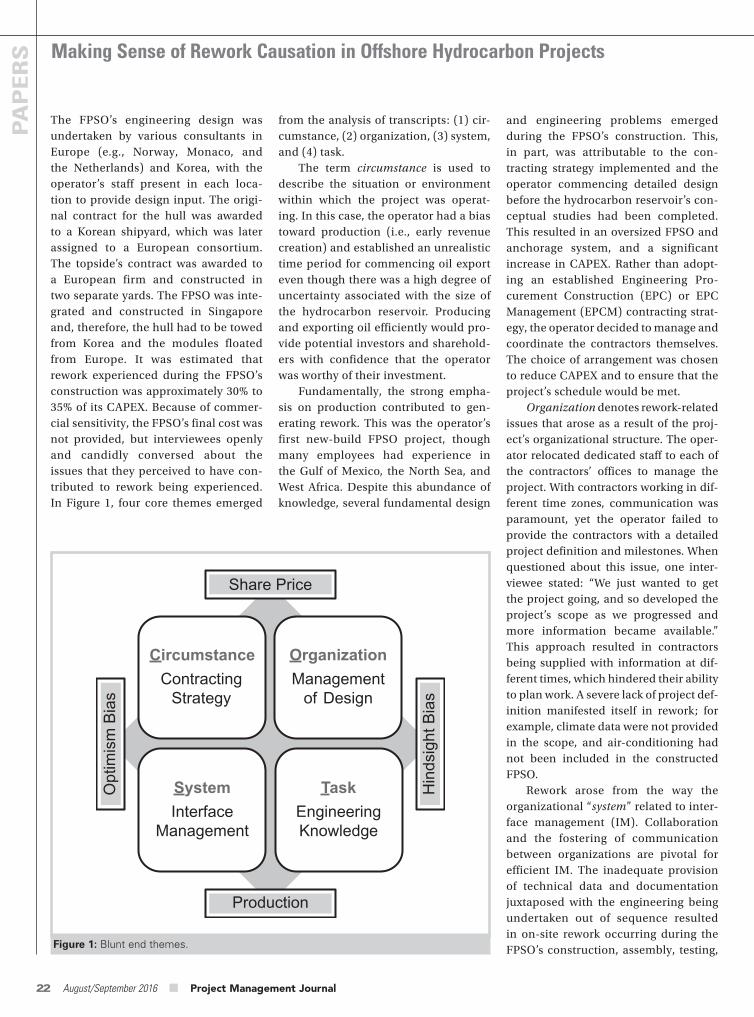
Making Sense of Rework Causation in Offshore Hydrocarbon Projects
22 August/September 2016 ■ Project Management Journal
PAPERS
and engineering problems emerged during the FPSO’s construction. This, in part, was attributable to the con-tracting strategy implemented and the operator commencing detailed design before the hydrocarbon reservoir’s con-ceptual studies had been completed. This resulted in an oversized FPSO and anchorage system, and a significant increase in CAPEX. Rather than adopt-ing an established Engineering Pro-curement Construction (EPC) or EPC Management (EPCM) contracting strat-egy, the operator decided to manage and coordinate the contractors themselves. The choice of arrangement was chosen to reduce CAPEX and to ensure that the project’s schedule would be met.
Organization denotes rework-related issues that arose as a result of the proj-ect’s organizational structure. The oper-ator relocated dedicated staff to each of the contractors’ offices to manage the project. With contractors working in dif-ferent time zones, communication was paramount, yet the operator failed to provide the contractors with a detailed project definition and milestones. When questioned about this issue, one inter-viewee stated: “We just wanted to get the project going, and so developed the project’s scope as we progressed and more information became available.” This approach resulted in contractors being supplied with information at dif-ferent times, which hindered their ability to plan work. A severe lack of project def-inition manifested itself in rework; for example, climate data were not provided in the scope, and air-conditioning had not been included in the constructed FPSO.
Rework arose from the way the organizational “system” related to inter-face management (IM). Collaboration and the fostering of communication between organizations are pivotal for efficient IM. The inadequate provision of technical data and documentation juxtaposed with the engineering being undertaken out of sequence resulted in on-site rework occurring during the FPSO’s construction, assembly, testing,
from the analysis of transcripts: (1) cir-cumstance, (2) organization, (3) system, and (4) task.
The term circumstance is used to describe the situation or environment within which the project was operat-ing. In this case, the operator had a bias toward production (i.e., early revenue creation) and established an unrealistic time period for commencing oil export even though there was a high degree of uncertainty associated with the size of the hydrocarbon reservoir. Producing and exporting oil efficiently would pro-vide potential investors and sharehold-ers with confidence that the operator was worthy of their investment.
Fundamentally, the strong empha-sis on production contributed to gen-erating rework. This was the operator’s first new-build FPSO project, though many employees had experience in the Gulf of Mexico, the North Sea, and West Africa. Despite this abundance of knowledge, several fundamental design
The FPSO’s engineering design was undertaken by various consultants in Europe (e.g., Norway, Monaco, and the Netherlands) and Korea, with the operator’s staff present in each loca-tion to provide design input. The origi-nal contract for the hull was awarded to a Korean shipyard, which was later assigned to a European consortium. The topside’s contract was awarded to a European firm and constructed in two separate yards. The FPSO was inte-grated and constructed in Singapore and, therefore, the hull had to be towed from Korea and the modules floated from Europe. It was estimated that rework experienced during the FPSO’s construction was approximately 30% to 35% of its CAPEX. Because of commer-cial sensitivity, the FPSO’s final cost was not provided, but interviewees openly and candidly conversed about the issues that they perceived to have con-tributed to rework being experienced. In Figure 1, four core themes emerged
Figure 1: Blunt end themes.
ContractingStrategy
CircumstanceManagement
of Design
Organization
InterfaceManagement
SystemEngineeringKnowledge
Task
Production
Hin
dsig
ht B
ias
Opt
imis
m B
ias
Share Price
PMJ_87569728_47_4_Aug_Sept_2016.indb 22 9/19/16 3:44 PM
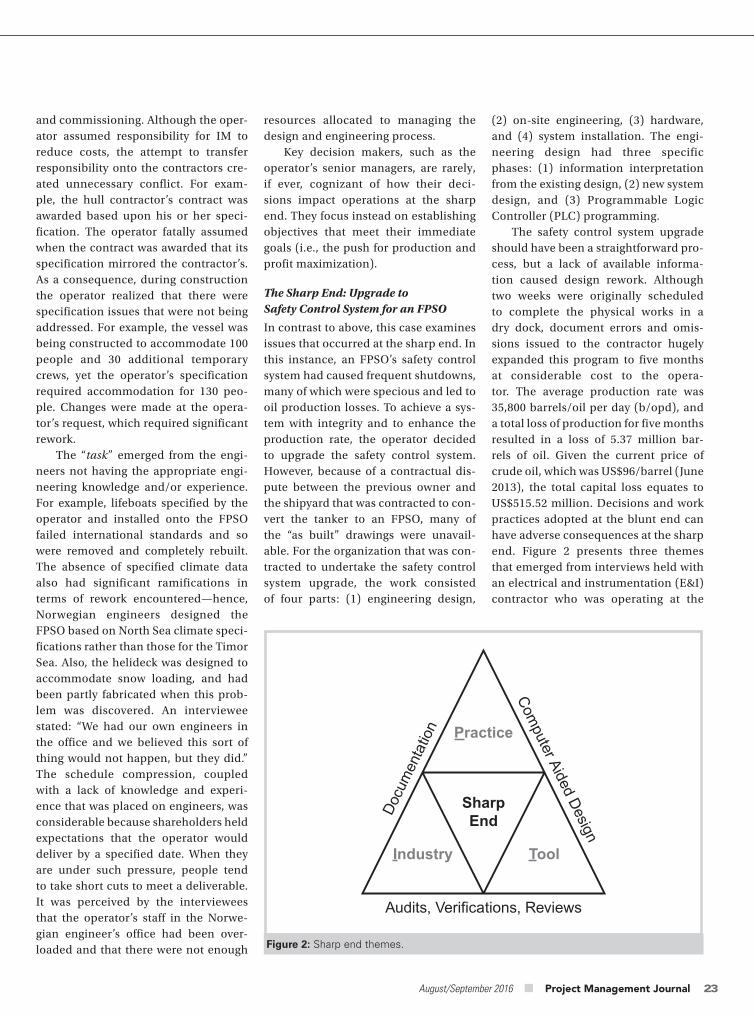
August/September 2016 ■ Project Management Journal 23
(2) on-site engineering, (3) hardware, and (4) system installation. The engi-neering design had three specific phases: (1) information interpretation from the existing design, (2) new system design, and (3) Programmable Logic Controller (PLC) programming.
The safety control system upgrade should have been a straightforward pro-cess, but a lack of available informa-tion caused design rework. Although two weeks were originally scheduled to complete the physical works in a dry dock, document errors and omis-sions issued to the contractor hugely expanded this program to five months at considerable cost to the opera-tor. The average production rate was 35,800 barrels/oil per day (b/opd), and a total loss of production for five months resulted in a loss of 5.37 million bar-rels of oil. Given the current price of crude oil, which was US$96/barrel (June 2013), the total capital loss equates to US$515.52 million. Decisions and work practices adopted at the blunt end can have adverse consequences at the sharp end. Figure 2 presents three themes that emerged from interviews held with an electrical and instrumentation (E&I) contractor who was operating at the
resources allocated to managing the design and engineering process.
Key decision makers, such as the operator’s senior managers, are rarely, if ever, cognizant of how their deci-sions impact operations at the sharp end. They focus instead on establishing objectives that meet their immediate goals (i.e., the push for production and profit maximization).
The Sharp End: Upgrade to Safety Control System for an FPSO
In contrast to above, this case examines issues that occurred at the sharp end. In this instance, an FPSO’s safety control system had caused frequent shutdowns, many of which were specious and led to oil production losses. To achieve a sys-tem with integrity and to enhance the production rate, the operator decided to upgrade the safety control system. However, because of a contractual dis-pute between the previous owner and the shipyard that was contracted to con-vert the tanker to an FPSO, many of the “as built” drawings were unavail-able. For the organization that was con-tracted to undertake the safety control system upgrade, the work consisted of four parts: (1) engineering design,
and commissioning. Although the oper-ator assumed responsibility for IM to reduce costs, the attempt to transfer responsibility onto the contractors cre-ated unnecessary conflict. For exam-ple, the hull contractor’s contract was awarded based upon his or her speci-fication. The operator fatally assumed when the contract was awarded that its specification mirrored the contractor’s. As a consequence, during construction the operator realized that there were specification issues that were not being addressed. For example, the vessel was being constructed to accommodate 100 people and 30 additional temporary crews, yet the operator’s specification required accommodation for 130 peo-ple. Changes were made at the opera-tor’s request, which required significant rework.
The “task” emerged from the engi-neers not having the appropriate engi-neering knowledge and/or experience. For example, lifeboats specified by the operator and installed onto the FPSO failed international standards and so were removed and completely rebuilt. The absence of specified climate data also had significant ramifications in terms of rework encountered—hence, Norwegian engineers designed the FPSO based on North Sea climate speci-fications rather than those for the Timor Sea. Also, the helideck was designed to accommodate snow loading, and had been partly fabricated when this prob-lem was discovered. An interviewee stated: “We had our own engineers in the office and we believed this sort of thing would not happen, but they did.” The schedule compression, coupled with a lack of knowledge and experi-ence that was placed on engineers, was considerable because shareholders held expectations that the operator would deliver by a specified date. When they are under such pressure, people tend to take short cuts to meet a deliverable. It was perceived by the interviewees that the operator’s staff in the Norwe-gian engineer’s office had been over-loaded and that there were not enough Figure 2: Sharp end themes.
Doc
umen
tatio
n
Industry Tool
Audits, Verifications, Reviews
SharpEnd
Practice
Com
puter Aided D
esign
PMJ_87569728_47_4_Aug_Sept_2016.indb 23 9/19/16 3:44 PM
Making Sense of Rework Causation in Offshore Hydrocarbon Projects
24 August/September 2016 ■ Project Management Journal
PAPERS
coalface. From the contractor’s perspec-tive, errors and omissions contained within documentation issued hindered productivity and jeopardized the poten-tial integrity of the safety control sys-tem. For example, a gas detector was designed to trip the Public Address and General Alarm System (PAGA) when it was detected at a 20% Lower Explo-sive Limit (LEL). However, the correct design should have been at a PAGA initiation of 10% LEL for gas detection. As a consequence of this design error, the initiation of the PAGA was delayed and potentially endangered the safety of both the operators and equipment. The contractor’s engineers suggested that robust design audits and reviews would have identified this type of error. Errors and omissions were categorized as “practice” and arose because peo-ple were not executing their roles and duties adequately. Although issues of commercial confidentiality restricted access to the operator, the contractor’s engineers and draftsmen indicated that when the decision was taken to place the FPSO in dry dock, the operator’s dedicated project team “panicked,” as shareholders needed to be informed of any production losses. In an attempt to address the problem, incomplete docu-mentation was issued, envisaging that the contractor would identify any prob-lems while on site and subsequently raise Requests for Information (RFIs).
The term industry was used to describe rework that arose due to the structural properties of the industrial environment, specifically how engineers performed their work. The E&I had been drafted in Computer Aided Design (CAD), and when errors, omissions, or changes were required, a draftsman was needed to manually amend all drawings where they occurred.
It is noteworthy that when a change is required to a 2D CAD drawing, the drawing and each corresponding view has to be manually updated. This can be a very time-consuming and costly process. Furthermore, because draw-ings are manually coordinated between
views in 2D, there is a propensity for documentation errors to arise, particu-larly in the design of complex electrical, control, and instrumentation systems, which comprise of hundreds of draw-ings that are not to scale and have to be represented schematically. In this instance, information is often repeated on several drawings to connect each schematic together. Consequently, the time to prepare the schematics can be a lengthy and tedious process, especially as the design gradually emerges and individual documents are completed. Inconsistencies can manifest between the documents; therefore, they must be re-edited and cross-checked before they can be issued for construction. For example, a heat detector specified in drawings had a 2ooN (two out of N) vot-ing function, whereas in other contrac-tual documentation it was a 1ooN. The issue was clarified through raising an RFI, but these inconsistencies adversely impacted workflow and productivity. Almost all the rework experienced arose from the design and documentation of the safety control system. The general perception among interviewees was that the operator had not devoted enough time to scoping the requirements and had grossly underestimated the extent of work required. The push for produc-tion had become the focal point, and the work that needed to be undertaken had almost become secondary.
Organizations operating at the sharp end are the closest to the errors and omissions that arise and are often left with the responsibility of identify-ing and resolving them before rework occurs. Involving organizations operat-ing at the sharp end in the decision-making process during the project’s formative stages can enable a systemic view of project performance. However, this requires organizations and people to challenge existing views and beliefs and not to accept the notion that rework is simply an isolated incident in the system.
Views at both the blunt and sharp ends acknowledge that rework is a
common problem that receives limited attention. Mitigating rework occurrence requires more than simply implement-ing additional procedures and com-pliance checks. Rather, it requires the unlearning of current beliefs and views about the prevailing system and the engagement in a process of learning and relearning from acquired experiences.
DiscussionLearning from an operational failure such as rework, which is experienced by other organizations, presents a num-ber of important challenges and oppor-tunities (Cannon & Edmonson, 2005). According to Hora and Klassan (2013), the main challenge appears to result from a lack of information that is readily available after an event has occurred. Invariably, only the consequences are identified, rather than the contributory factors that led to rework, thus creating causal ambiguity. Self-confidence in an organization’s own processes increases the likelihood of dismissing the pos-sibility of project rework. Yet, despite these challenges, learning from orga-nizations that have experienced rework provides an opportunity for others to acquire new knowledge in order to pre-vent reoccurrence. Examples presented within this research provide a context to understand the nature of rework. The findings clearly indicate that production pressure triggered an array of unin-tended dynamics, which unknowingly influenced rework; therefore, when the pressure to produce increases, there is often a tendency for the toleration of risk to be high (Goh, Love, Spickett, & Brown, 2012). Such a side effect can adversely influence an organization’s ability to accommodate errors made during FEED and construction. This organizational misconception can be interpreted as “organizational mindless-ness” (Weick, 1995). Goh et al. (2012) assert that the danger of this dynamic is that it forms a vicious cycle that can continuously encourage a stronger management focus on production and further distortion of risk perception.
PMJ_87569728_47_4_Aug_Sept_2016.indb 24 9/19/16 3:44 PM
August/September 2016 ■ Project Management Journal 25
generalizable because only two exam-ples were examined. Further research is therefore required. Second, hindsight bias may have been present, though the line of inquiry was not anchored to outcome knowledge. According to Hendrikson and Kaplan (2003), inves-tigations that are anchored to outcome knowledge run the risk of not captur-ing the complexities and uncertain-ties that people are confronted with at the sharp end and why their actions made sense at the time. Thus, impor-tant lessons may go unlearned if the exercise is merely to retrace someone else’s decision landmarks. Interviews purposefully did not seek to find a specific cause, because often no well-defined starting point exists to deter-mine the essence of a causal chain. Furthermore, progressively working backward through the causal chain is a time-consuming process and pragmatic considerations need to be taken into account such as resources and time constraints. The interviews undertaken did not attempt to establish where the organization or people went wrong, but rather tried to understand why their assessments and actions made sense at the time, if they made sense at all. And finally, retrospective analysis is limited, as systems are rarely static (Leveson, 2003). Organizations and the projects that they are involved with continually experience change, as adaptations are made in response to local pressures, short-term productivity, and cost goals (Rassmussen, 1997). People adapt to their environment or change their envi-ronment to suit their purposes (Senge, 2006). This propensity for systems and people to adapt over the life of a proj-ect reduces managerial effectiveness, particularly when cost efficiency and increased productivity govern decision-making processes.
ConclusionPrevious rework-related research has tended to focus on causal factors and identifying a specific root cause. Yet, rework arises as a result of human error,
that are rational and strategic (Dekker, 2007). In such situations, managers tend to make decisions within familiar and relatively restricted boundaries formed by easily accessible information and available options (Goh et al., 2012). The decisions they make are rational within these familiar boundaries, but not beyond. The dangers of decision making within restricted boundaries can only be exposed if organizations are able to understand the broader systemic struc-ture of the projects within which they operate (Goh et al., 2012) and to learn from acquired experiences. Managers need to recognize that people’s actions and behaviors are influenced by their environment; therefore, changing the environment is a far more effective strat-egy than trying to alter the behavior of employees (Hopkins, 1999). Thus, man-agers should openly de-emphasize an environment that places production at the top of its agenda in favor of one that systematically examines the mechanisms and factors that shape people’s decisions and actions. This approach will ensure that projects are delivered safely, on time, to budget, and at the specified quality.
Learning from errors is a controlled and mindful activity (Weick & Ashford, 2001). Learning requires attentional, motivational, and cognitive resources (Dekker, 2007). Motivational variables drive and direct the allocation of cog-nitive resources in terms of how much and how long they will be allocated for learning (Kanfer & Ackermann, 1989). Thus, managers need to develop and harness an environment where peo-ple are motivated to learn, particularly through external (i.e., direct line man-ager) and task feedback. When design reviews and checks are not adequately undertaken, an organization should ask why people behaved the way they did and examine their mental models and the environmental factors that affect decision making.
LimitationsThe research presented here is not with-out limitations. First, the findings are not
Thus, it acts to deteriorate the organiza-tion’s mindfulness in a cyclic manner. This vicious circle is arguably the core reason that provides fertile conditions for rework to manifest itself.
According to Reason (1997), orga-nizations that possess a bias toward production are more likely to experi-ence organizational accidents. Previous research has revealed that when rework arises during construction, there is a propensity for safety to be overlooked because there is an immediate focus on rectifying the problem at hand and minimizing its impact on the project’s schedule (Love & Edwards, 2004). The organizations participating in this study have impeccable safety records, but if rework occurs, there is the potential for an accident to occur should the error not be identified. Supporting evidence for this claim is apparent within the signifi-cant number of engineering failures that have occurred because of design errors and omissions. For example, the col-lapse of the I-35W Minneapolis bridge, which killed 13 people and injured 145, occurred as a result of gusset plates being incorrectly specified. Operators must have the capability to identify the systemic structure that promotes and gives rise to rework in order to adapt to increasingly complex project environ-ments. An inability to see the broader system at play can lead to an organiza-tion that possesses a “learning disabil-ity” (Senge, 2006). Such a disability often displays the following symptoms: a fixa-tion on events (overemphasis on sudden and recent occurrences), an inability to notice subtle warning signs, and a delu-sion of learning from experience (lack of opportunity for trial and error).
Managerial Implications
To successfully curtail rework, managers who are charged with delivering com-plex projects (such as an FPSO) should adopt a systemic view during the forma-tive stages when critical decision mak-ing happens. Managers are often faced with severe cognition challenges and are not in a position to make decisions
PMJ_87569728_47_4_Aug_Sept_2016.indb 25 9/19/16 3:44 PM
Making Sense of Rework Causation in Offshore Hydrocarbon Projects
26 August/September 2016 ■ Project Management Journal
PAPERS
improve and innovate. Long Range Planning, 38, 299–319.
Construction Industry Development Agency. (1995). Measuring up or muddling through: Best practice in the Australian non-residential construction industry. Sydney, Australia: Construction Industry Development Agency and Masters Builders Australia.
Construction Industry Development Board (CIDB). (1989). Managing construction quality: A CIDB manual on quality management systems for construction operations. Singapore: Construction Industry Development Board.
Construction Industry Institute (CII). (2001, May). The field rework index: Early warning for filed rework and cost growth. Report No. RS 153-1. Austin, TX: The University of Texas at Austin.
Cooper, K. G. (1993a, February). The rework cycle: Why projects are mismanaged. PM Network Magazine, 5–7.
Cooper, K. G. (1993b). The rework cycle: Benchmarks for the project manager. Project Management Journal, 24(1), 17–21.
Dekker, S. (2006). The field guide to understanding human error. Farnham, England: Ashgate.
Dekker, S. (2007). Just culture: Balancing safety and accountability. Farnham, England: Ashgate.
Dixon, N. M. (2003). Sensemaking guidelines: A quality improvement tool. Med QIC Medicare Quality Improvement. Retrieved from www.medqic.org.
Eden, C., Ackermann, F., & Williams, T. M. (2005). The amoebic growth of project costs. Project Management Journal, 36(1), 15–27.
Edmonson, A. C. (2011). Strategies for learning from failure. Harvard Business Review, 4, 49–55.
Eldin, N. N. (1991). Management of engineering/design phase. ASCE Journal of Construction Engineering and Management, 117(1), 163–175.
Farrell, F. B. (1996). Subjectivity, realism, and postmodernism: The recovery of the world in recent philosophy. Cambridge, England: Cambridge University Press.
decisions made during the formative stages of the development process.
Causes are fundamentally con-structed rather than found, so it is sug-gested that future research should focus on explaining people’s behaviors to examine their mental models, environ-mental factors, and the other influences that affect their decision making, which can lead to errors and subsequent rework. To undertake such research effectively, it is suggested that emphasis should be placed on working backward through the causal chain, particularly using causal maps, to obtain a rich understanding of the context in which decisions and behaviors occurred.
ReferencesAckermann, F., & Eden, C. (2005). Using causal mapping with group support systems to elicit an understanding of failure in complex projects: Some implications for organizational research. Group Decision and Negotiation, 14(5), 355–376.
Alvesson, M., & Deetz, S. (1996). Critical theory and postmodernism approaches to organizational studies. In A. R. Clegg, C. Hardy, & W. R. Nord (Eds.), Handbook of organization studies (pp. 191–217). London, England: Sage Publications.
Andi, S., & Minato, T. (2003). Design document quality in the Japanese construction industry: factors influencing and impacts on the construction process. International Journal of Project Management, 21, 537–546.
Barber, P., Sheath, D., Tomkins, C., & Graves, A. (2000). The cost of quality failures in major civil engineering projects. Internal Journal of Quality and Reliability Management, 17(4/5), 479–492.
Battles, J. B., Dixon, N., Borotkanics, R. J., Rabin-Fastmen, B., & Kaplan, H. S. (2006). Sensemaking of patient safety risks and hazards. Health Research and Educational Trust, 41(4), 1555–1575.
Cannon, M. D., & Edmondson, A. C. (2005). Failing to learn and learning to fail (intelligently): How great organizations put failure to work to
which is the effect of symptoms derived from a systems environment where tools, tasks, and operations are inter-dependent. It is impossible to identify a single cause for rework. A complex array of inextricably linked variables and con-ditions interact with one another to produce the event. In the cases studied, it was revealed that production pressure was an underlying latent condition that provided fertile conditions for influ-encing critical decision making and the behavior of people and organiza-tions involved with FPSOs. In one case presented, the operator was an inex-perienced organizational entity in deliv-ering an FPSO, though its managers and engineers had extensive experience in their design and construction, which was acquired with previous employers. Despite such experience, rework still occurred, which resulted in cost and schedule overruns.
This study demonstrates that the pressure to produce oil focused man-agement’s attention onto production, which tended to distort risk perception and led to a further focus on production. This finding aligns with the current the-ory that has been propagated to explain organizational accidents. In the case of rework, the error or omission is identi-fied before an accident occurs. The dan-ger is that if an error or omission is not identified, the propensity for an acci-dent or major catastrophe increases. It is irresponsible for managers and engineers to operate in (or even con-tribute to) unsafe environments, such as those offshore, to consider rework “normal” under operating conditions. Notwithstanding the potential for loss of life and/or environmental damage because of the failure of an offshore facility, there are implications for share-holders and those contractors work-ing at the sharp end. For shareholders, there is the potential for dividends to be adversely impacted, as production may be delayed. For contractors, a reduction in profit margins and productivity may be experienced as they attend to rectify-ing problems that have manifested from
PMJ_87569728_47_4_Aug_Sept_2016.indb 26 9/19/16 3:44 PM

August/September 2016 ■ Project Management Journal 27
Mills, A., Love, P. E. D., & Williams, P. (2009). Defect costs of residential construction. ASCE Journal of Construction, Engineering and Management, 135(1), 12–16.
Moore, P. (2012). Contractors confront the growing costs of rework. Engineering News Record. Retrieved from www://enr/construction.com/business_management
Pinto, J. K. (2013). Lies, damned lies, and project plans: Recurring human errors that can ruin the project planning process. Business Horizons, 56(5), 643–653.
Rasmussen, J. (1997). Risk management in a dynamic society: A modelling problem. Safety Science, 27(2/3), 183–213.
Reason, J. T. (1990). Human error. Cambridge, England: Cambridge University Press.
Reason, J. T. (1997). Managing the risks of organizational accidents. Farnham, England: Ashgate.
Roberts, K. H. (1990). Some characteristics of high-reliability organizations. Organization Science, 1, 160–177.
Robinson-Fayek, A. R., Dissanayake, M., & Campero, O. (2004). Developing a standard methodology for measuring and classifying construction field rework. Canadian Journal of Civil Engineering, 31(6), 1077–1089.
Rodrigues, A., & Bowers, J. (1996). The role of system dynamics in project management. International Journal of Project Management, 14(4), 213–220.
Rodrigues. A., & Williams, T. M. (1998). System dynamics in project management: Assessing the impacts of client behavior on project performance. Journal of the Operational Research Society, 49, 2–15.
Rogge, D. F., Cogliser, C., Alaman, H., & McCormack, S. (2001). An investigation into field rework in industrial construction. Report No.RR153-11. Austin, TX: Construction Industry Institute.
Salanick, G. R., & Pfeffer, J. (1978). A social information processing
industry. ASCE Journal of Management in Engineering, 18(2), 76–83.
Kanfer, R., & Ackermann, P. L. (1989). Motivation and cognitive abilities. An integrative/aptitude treatment interaction approach to skill acquisition. Journal of Applied Psychology, 74, 657–690.
Kvale, S. (1996). Interviews: An introduction to qualitative research interviewing. Thousand Oaks, CA: Sage.
Langer, E. J. (1975). The illusion of control. Journal of Personality and Social Psychology, 7, 185–207.
Leveson, N. (2003). A new accident model for engineering safer systems. Safety Science, 42(4), 237–270.
Love, P. E. D. (2002a). Influence of project type and procurement method on rework costs in building construction projects. ASCE Journal of Construction Engineering and Management, 128(1), 18–29.
Love, P. E. D. (2002b). Auditing the indirect consequences of rework in construction: A case based approach. Managerial Auditing Journal, 17(3), 138–146.
Love, P. E. D., & Edwards, D. J., (2004). Determinants of rework in construction projects. Engineering, Construction and Architectural Management, 11(4), 259–274.
Love, P. E. D, Edwards, D. J., & Irani, Z. (2012). Moving beyond optimism bias and strategic misrepresentation: An explanation for social infrastructure project cost overruns. IEEE Transactions on Engineering Management, 59(4), 560–571.
Love, P. E. D., Edwards, D. J., & Smith, J. (2013). Systemic life cycle design error reduction model for construction and engineering project. Structure and Infrastructure Engineering, 9(7), 689–701.
Love, P. E. D., Edwards, D. J., Smith, J., & Walker, D.H.T. (2009). Congruence or divergence? A path model of rework in building and civil engineering projects. ASCE Journal of Performance of Constructed Facilities, 23(6), 480–488.
Love, P. E. D., Skitmore, R. M., & Earl, G. (1998). Selecting a suitable procurement method for a building project. Construction Management and Economics, 16(2), 221–233.
Fischoff, B. (1975). Hindsight does not equal foresight: The effect of outcome knowledge on judgment under uncertainty. Journal of Experimental Psychology: Human Performance and Perception, 1, 288–299.
Forcada, N., Macarulla, M., Gangolells, M., Casals, M., Fuertes, A., & Roca, X. (2012). Post-handover housing defects: Sources and origins. ASCE Journal of Performance of Constructed Facilities, 27(6), 756–762.
Ford, D. N., & Sterman, J. D. (2003). The lair’s club: Concealing rework in concurrent development. Concurrent Engineering: Research and Applications, 11(3), 211–219.
Goh, Y., Love, P.E.D., Spickett, J., & Brown, H. (2012). Organizational accidents: A systemic model of production versus protection. Journal of Management Studies, 49(1), 52–76.
Hagen, E., & Mays, G. (1981). Human factors engineering in the U.S. nuclear arena. Nuclear Safety, 22, 337–346.
Hendrikson, K., & Kaplan, H. (2003). Hindsight bias, outcome knowledge and adaptive learning. Quality Safety Health Care, 12(Suppl 2): ii46–ii50.
Hopkins, A. (1999). For whom does safety pay? The case of major accidents. Safety Science, 32, 143–153.
Hora, M., & Klassen, R. (2013). Learning from others’ misfortune: Factors influencing Knowledge acquisition to reduce operational risk. Journal of Operations Management, 31, 52–61.
Hwang, B., Thomas, S. R., Haas, C., & Caldas, C. (2009). Measuring the impact of rework on construction cost performance. ASCE Journal of Construction Engineering and Management, 135(3), 187–198.
James, W. (1950). The principles of psychology, Vols. 1 & 2. Dover, NY. In K. E. Weick (1995), Sensemaking in organizations. Thousand Oaks, CA, & London, England: Sage Publications.
Josephson, P.-E., Larsson, B., & Li, H. (2002). Illustrative benchmarking rework and rework costs in Swedish construction
PMJ_87569728_47_4_Aug_Sept_2016.indb 27 9/19/16 3:44 PM
Making Sense of Rework Causation in Offshore Hydrocarbon Projects
28 August/September 2016 ■ Project Management Journal
PAPERS
and Construction with the Faculty of Society and Design at Bond University, Queensland. His research interests include construction economics, public–private partnerships, infrastructure development, and design management. He has co-authored three books and published more than 150 refereed journal and conference papers. He can be contacted at [email protected]
Zahir Irani is the Dean of Business, Arts, and Social Sciences at Brunel University, London. Prior to commencing this role, he was seconded to Whitehall, where he was a senior policy advisor in the Cabinet Office. He is Professor of Operations and Information Management in the Brunel Business School, which he joined in August 2006 as the head. He has also been the Head of the Department of Information Systems and Computing (now the Department of Computer Science) at Brunel. He completed a BEng (Hons) before accepting a research position, where he completed an Mphil and he has a PhD in the area of investment evaluation and undertook his leadership development at the Harvard Business School. He can be contacted at [email protected]
David J. Edwards is a Professor of Plant and Machinery Management at Birmingham City University and has worked in both academia and industry over a 25-year career. His research interests focus mainly upon the management of plant and machinery in business throughout industry. His work has been funded through engineering councils, government bodies, and an extensive network of industrial collaborations. He has published scientific research papers extensively in leading international journals as well as numerous conference contributions and textbooks. Among his many awards, prizes, and accolades, he holds two most dearly: Recipient of the Commander’s coin, U.S. Department of Defense (2011) for his work on hand–arm vibration, and Chief for Education Development, Ashanti Kingdom, Ghana (2015–present) for his ongoing research and education conducted in collaboration with Kwame Nkrumah University of Science and Technology. He can be contacted at [email protected]
reduction for capital facilities. ASCE Journal of Construction, Engineering and Management, 138(12), 1377–1385.
Zhao, B. (2011). Learning from errors: The role of context, emotion and personality. Journal of Organizational Behavior, 32, 435–463.
Peter E.D. Love is a John Curtin Distinguished Professor at Curtin University. He is a fellow of the Royal Institute of Chartered Surveyors. He is a visiting professor to universities in Australia, China, Korea, the United Kingdom, and South Africa. He was awarded a higher doctorate of science (ScD) by Curtin University in recognition of his substantial and sustained contribution to field of civil and construction engineering. His research has been published in a number of leading scholarly journals such as Journal of the Operational Research Society, European Journal of Operations Research, IEEE Transaction on Engineering Management, International Journal of Production Economics, and Journal of Management Studies. He can be contacted at [email protected]
Fran Ackermann is a Professor at Curtin Business School and has been researching complex project management (particularly risk) for the past 20 years. In particular, she has been extensively involved with modelling disruption and delay for litigation on projects that have substantially overrun. Seeking to re-engineer the insights and lessons from these cases, with colleagues she has developed techniques to reduce the likelihood of such outcomes, for example, through the design of risk filters and risk workshops that have been used to great effect in organizations. She has worked extensively with organizations such as Balfour Beatty, Bombardier, Scottish and Southern Energy, and Babcock International, and has written widely on the subject with more than 100 publications. She can be contacted at [email protected]
Jim Smith is a Fellow of the Royal Institution of Chartered Surveyors and a Professor in Property
approach to job attitudes and task design. Administrative Science Quarterly, 23, 224–253. In K. E. Weick (1995), Sensemaking in organizations. Thousand Oaks, CA, & London, England: Sage Publications.
Schutz, A. (1967). The phenomenology of the social world. Evanston, IL: Northwestern University Press. In K. E. Weick (1995), Sensemaking in organizations. Thousand Oaks, CA, & London, England: Sage Publications.
Senge, P. (2006). The fifth discipline—The art and practice of the learning organization. Sydney, NSW, Australia: Random House.
Silverman, D. (2001). Interpreting qualitative data. London, England: Sage.
Smith, R. P., & Eppinger, S. (1997). A predictive of model of sequential iteration in engineering. Management Science, 43(8), 1104–1120.
Weick, K. E. (1995). Sensemaking in organizations. Thousand Oaks, CA, & London, England: Sage Publications.
Weick, K. E., & Ashford, S. J. (2001). Learning in organizations. In F. M. & L. L. Putman (Eds.), The new handbook of organizational communications (pp. 704–731). Thousand Oaks, CA: Sage.
Weick, K. E., Sutcliffe, K., & Obstfeld, D. (2005). Organizing and the process of sensemaking. Organization Science, 16(4), 409–421.
Westrum, R. (2004). A typology of organizational cultures. BMJ, Quality and Safety in Health Care, 13, ii22–ii27.
Williams, T. M., Eden, C., Ackermann, F., & Tait, A. (1995). Vicious circles of parallelism. International Journal of Project Management, 13(3), 151–155.
Zhang, D., Haas, C., Goodrum, P., Caldas, C., & Granger, R. (2012). Construction small-projects rework
PMJ_87569728_47_4_Aug_Sept_2016.indb 28 9/19/16 3:44 PM
August/September 2016 ■ Project Management Journal 29
PA
PE
RS
ABSTRACT ■
A Study on Complexity and Uncertainty Perception and Solution Strategies for the Time/Cost Trade-Off ProblemMathieu Wauters, Faculty of Economics and Business Administration, Ghent University, Ghent, BelgiumMario Vanhoucke, Faculty of Economics and Business Administration, Ghent University, Ghent, Belgium
INTRODUCTION
Time/cost trade-offs in project scheduling find their roots in the Critical Path Method (CPM), which was developed at the duPont Company and at Remington Rand Univac (Kelley & Walker1959; Walker & Sawyer, 1959; Kelley, 1961). CPM is a project scheduling technique
used to analyze and represent the tasks involved in completing a given project. Although this method does not explicitly take resource requirements into account, it assumes that the cost of an activity is a function of its duration. As the duration of an activity is decreased, its associated costs will rise, since more resources will need to be allocated to that activity. Initial research efforts on the time/cost trade-off problem focused on the continuous case and can be found in standard texts, such as those from Elmaghraby (1977) and Moder, Phillips, and Davis (1983). Several techniques were used to solve this type of problem (Robinson, 1975; Hindelang & Muth, 1979; Phillips & Dessouky,1977; Meyer & Shaffer, 1965). An overview of the literature up through the mid-1990s is provided by De, Dunne, Ghosh, and Wells (1995); we will cover the contributions related to the time/cost trade-off problem from the mid-1990s onward. The Discrete Time/Cost Trade-off Problem (DTCTP), shown to be NP-hard by De, Dunne, Ghosh, and Wells (1997), was solved precisely by Demeulemeester, Elmaghraby, and Herroelen (1996). In this article, the authors present two approaches based on dynamic programming for reaching the optimal solution of the three objective functions of the DTCTP. Three possible variants of the time/cost trade-off problem can be identified. The first variant—scheduling project activities with the goal of minimizing the total project costs, while meeting an imposed deadline—is known as the deadline problem (DTCTP-D). The budget problem, which is the second variant, specifies a limit on the budget (DTCTP-B), in which the objective is then to minimize the duration of the project. Finally, the third variant deals with generating a complete and efficient time/cost profile. Demeulemeester, De Reyck, Foubert, Herroelen, and Vanhouke (1998) improved the computational results for solving the DTCTP optimally; this is done using a branch-and-bound procedure, which calculates lower bounds by convex piecewise linear underestimations of the time/cost trade-off curves of the activities. This contribution is of special relevance to this article because it will be used to provide an optimal solution for the data instances of the computational experiment.
Over the last decade, two new research avenues on the time/cost trade-off problem have been examined. The first new direction is the extension of the (D)TCTP, whereas the second direction focuses on the inclusion of stochastic
Project Management Journal, Vol. 47, No. 4, 29–50
© 2016 by the Project Management Institute
Published online at www.pmi.org/PMJ
In this article, the Discrete Time/Cost Tradeoff
Problem (DTCTP) is revisited in light of a
student experiment. Two solution strategies
are distilled from the data of 444 participants
and are structured by means of five build-
ing blocks: focus, activity criticality, ranking,
intensity, and action. The impact of com-
plexity and uncertainty on the cost objec-
tive is quantified in a large computational
experiment. Specific attention is allocated
to the influence of the actual and perceived
complexity and uncertainty and the cost
repercussions when reality and perception
do not coincide.
KEYWORDS: project scheduling game;
simulation; complexity; uncertainty
PMJ_87569728_47_4_Aug_Sept_2016.indb 29 9/19/16 3:44 PM
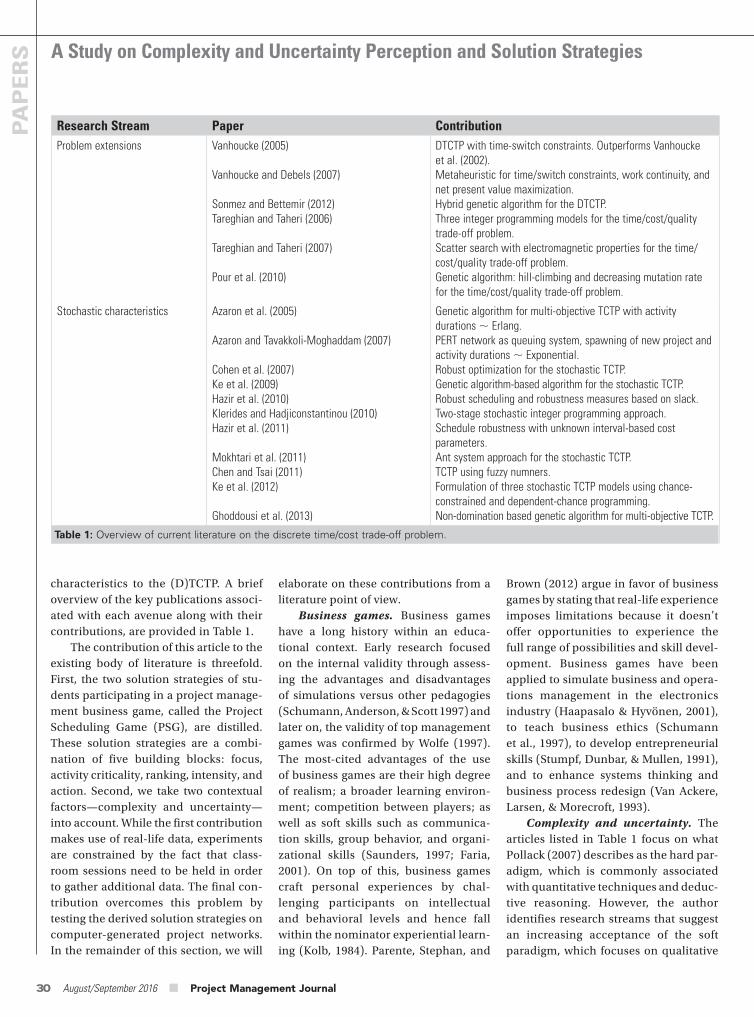
30 August/September 2016 ■ Project Management Journal
PAPERS A Study on Complexity and Uncertainty Perception and Solution Strategies
Brown (2012) argue in favor of business games by stating that real-life experience imposes limitations because it doesn’t offer opportunities to experience the full range of possibilities and skill devel-opment. Business games have been applied to simulate business and opera-tions management in the electronics industry (Haapasalo & Hyvönen, 2001), to teach business ethics (Schumann et al., 1997), to develop entrepreneurial skills (Stumpf, Dunbar, & Mullen, 1991), and to enhance systems thinking and business process redesign (Van Ackere, Larsen, & Morecroft, 1993).
Complexity and uncertainty. The articles listed in Table 1 focus on what Pollack (2007) describes as the hard par-adigm, which is commonly associated with quantitative techniques and deduc-tive reasoning. However, the author identifies research streams that suggest an increasing acceptance of the soft paradigm, which focuses on qualitative
elaborate on these contributions from a literature point of view.
Business games. Business games have a long history within an educa-tional context. Early research focused on the internal validity through assess-ing the advantages and disadvantages of simulations versus other pedagogies (Schumann, Anderson, & Scott 1997) and later on, the validity of top management games was confirmed by Wolfe (1997). The most-cited advantages of the use of business games are their high degree of realism; a broader learning environ-ment; competition between players; as well as soft skills such as communica-tion skills, group behavior, and organi-zational skills (Saunders, 1997; Faria, 2001). On top of this, business games craft personal experiences by chal-lenging participants on intellectual and behavioral levels and hence fall within the nominator experiential learn-ing (Kolb, 1984). Parente, Stephan, and
characteristics to the (D)TCTP. A brief overview of the key publications associ-ated with each avenue along with their contributions, are provided in Table 1.
The contribution of this article to the existing body of literature is threefold. First, the two solution strategies of stu-dents participating in a project manage-ment business game, called the Project Scheduling Game (PSG), are distilled. These solution strategies are a combi-nation of five building blocks: focus, activity criticality, ranking, intensity, and action. Second, we take two contextual factors—complexity and uncertainty—into account. While the first contribution makes use of real-life data, experiments are constrained by the fact that class-room sessions need to be held in order to gather additional data. The final con-tribution overcomes this problem by testing the derived solution strategies on computer-generated project networks. In the remainder of this section, we will
Research Stream Paper ContributionProblem extensions Vanhoucke (2005)
Vanhoucke and Debels (2007)
Sonmez and Bettemir (2012)Tareghian and Taheri (2006)
Tareghian and Taheri (2007)
Pour et al. (2010)
DTCTP with time-switch constraints. Outperforms Vanhoucke et al. (2002).Metaheuristic for time/switch constraints, work continuity, and net present value maximization.Hybrid genetic algorithm for the DTCTP.Three integer programming models for the time/cost/quality trade-off problem.Scatter search with electromagnetic properties for the time/cost/quality trade-off problem.Genetic algorithm: hill-climbing and decreasing mutation rate for the time/cost/quality trade-off problem.
Stochastic characteristics Azaron et al. (2005)
Azaron and Tavakkoli-Moghaddam (2007)
Cohen et al. (2007)Ke et al. (2009)Hazir et al. (2010)Klerides and Hadjiconstantinou (2010)Hazir et al. (2011)
Mokhtari et al. (2011)Chen and Tsai (2011)Ke et al. (2012)
Ghoddousi et al. (2013)
Genetic algorithm for multi-objective TCTP with activity durations Erlang.PERT network as queuing system, spawning of new project and activity durations Exponential.Robust optimization for the stochastic TCTP.Genetic algorithm-based algorithm for the stochastic TCTP.Robust scheduling and robustness measures based on slack.Two-stage stochastic integer programming approach.Schedule robustness with unknown interval-based cost parameters.Ant system approach for the stochastic TCTP.TCTP using fuzzy numners.Formulation of three stochastic TCTP models using chance-constrained and dependent-chance programming.Non-domination based genetic algorithm for multi-objective TCTP.
Table 1: Overview of current literature on the discrete time/cost trade-off problem.
PMJ_87569728_47_4_Aug_Sept_2016.indb 30 9/19/16 3:44 PM
August/September 2016 ■ Project Management Journal 31
five components that make up a solu-tion strategy. The fifth section, “Strate-gic Framework,” introduces the general framework that forms the foundation for the solution strategies and introduces the time-based and cost-based solution strategy. The sixth section, “Compu-tational Experiment,” includes details about the test design. Parameter set-tings are divided, depending on whether they are project-specific or whether they relate to the complexity and uncertainty dimension. The results of the solution strategies are discussed in “Results,” a sub-section of the sixth section, where a distinction is made between the general performance, the performance in case of judgment errors, and an investigation of a varying degree of level of effort. Finally, the seventh section, “Discussion and Conclusion,” a discussion of the results and general conclusions can be found.
Game DescriptionCrowston and Thompson (1967) were among the first authors to stress the importance of the interaction between the planning, scheduling, and control phases of a project. The focus of the Project Scheduling Game presented by Vanhoucke, Vereecke, and Gemmel (2005), lies in the scheduling and con-trol phases of the project life cycle. More precisely, it is the aim of the player to follow an iterative approach—known as reactive scheduling—that compares the project baseline schedule with the current project performance (simulated during the execution phase) in order to control the project and take corrective actions in case the project objective is in danger. The game consists of several phases, which require periodic input from the game player. An overview of the game process is shown in Figure 1.
First of all, the project network, along with a baseline schedule and other input data for the game, such as the trade-off details, are proposed by the course teacher. The baseline sched-ule ends at time T. In order to acquaint students with uncertainty, unexpected events occur. A new deadline, dn ,T, is
still among the top challenges for future research (Hall, 2012).
Simulation. Complexity can be defined from a hard paradigm perspec-tive (see the complexity measures of Pascoe (1966), Mastor (1970), Bein, Kam-burowski, and Stallmann (1992), and De Reyck and Herroelen (1996) or include soft paradigm aspects (such as organiza-tional complexity (Wolfe, 1996) or socio-political complexity (Geraldi, Maylor, & Williams, 2011). In this work, we focus on structural complexity and, more spe-cifically, on system size (Sommer & Loch, 2004). Apart from a large body of work that supports this stance (Dvir, Sadeh, & Malach-Pines, 2006; Geraldi & Adlbrecht, 2007; Müller & Turner, 2007), the main rationale for focusing on system size can be found in the final contribution this article makes. Once the student files are analyzed and turned into solution strategies, these strategies are applied to computer-generated project networks, for which multiple settings are changed. In order to do this, a more technical defi-nition of complexity (and uncertainty) is required. Specific attention will be allocated to the discrepancy between the actual complexity and uncertainty and how these contextual factors are perceived. Individuals perceive reality in their own way (Jaafari, 2003), imply-ing that complexity and uncertainty are also in the eyes of the beholder (Nutt, 1998; Vidal & Marle, 2008; Osman, 2010; Ojiako et al., 2014). Simulations aid deci-sion makers in anticipating and quan-tifying the effects of actions and events (Fang & Marle, 2012) and allow us to generate a wide spectrum of outcomes.
The outline of the article is as fol-lows. In the second section, “Game Description,” a general overview of the Project Scheduling Game is given. The third section, “Date Collection,” focuses on the data collection phase. The build-ing blocks of the solution strategies, the link to the student data of the second section and how the solutions are evalu-ated, are discussed in the fourth sec-tion, “Data Structuring.” An illustrative example is provided to demonstrate the
techniques that emphasize contextual factors and relevance. Examples of soft paradigm publications can be found in work by Turner and Müller (2005), Ojiako et al. (2014), Green (2004), and Yang, Huang, and Wu (2011). The reader is referred to the relationship school and behavioral school of Söderlund (2011) for a literature review on soft paradigm aspects. More and more, researchers are calling for a broader view of project management (Hanisch & Wald, 2011), an increased alignment of research and practice (Hall, 2012), or the inclu-sion of contextual factors (Crawford, Pollack, & England, 2006). With regard to the latter point, Maylor, Vidgen, and Carver (2008) argue that one-size-fits-all approaches are inconsistent with the contextual diversity managers are con-fronted with. In this article, we take two contextual factors—complexity and uncertainty—into account by means of data from students participating in a business game.
The choice for complexity and uncertainty is inspired by two reasons. First, Howell, Windahl, and Seidel (2010) noted that uncertainty was easily the most dominant theme, with com-plexity ranking second. This confirmed the findings of Shenhar (2001) who dis-covered an emergence of uncertainty and complexity based on a review of the classical as well as the more recent literature. It is worth noting that the works dealing with the stochastic char-acteristics shown in Table 1 revolve around uncertainty. Additionally, the works of Thomas and Mengel (2008) and Hanisch and Wald (2011) explic-itly recognize complexity and uncer-tainty as crucial (contextual) factors. Second, integrating contextual factors can be regarded as a response to areas for future research. Hanisch and Wald (2011) argued that the influence of com-plexity on the project outcome needs to be studied, whereas Maylor et al. (2008) wondered whether a quantification of complexity was feasible. Although the research on uncertainty has witnessed a spike in interest from academics, it is
PMJ_87569728_47_4_Aug_Sept_2016.indb 31 9/19/16 3:44 PM
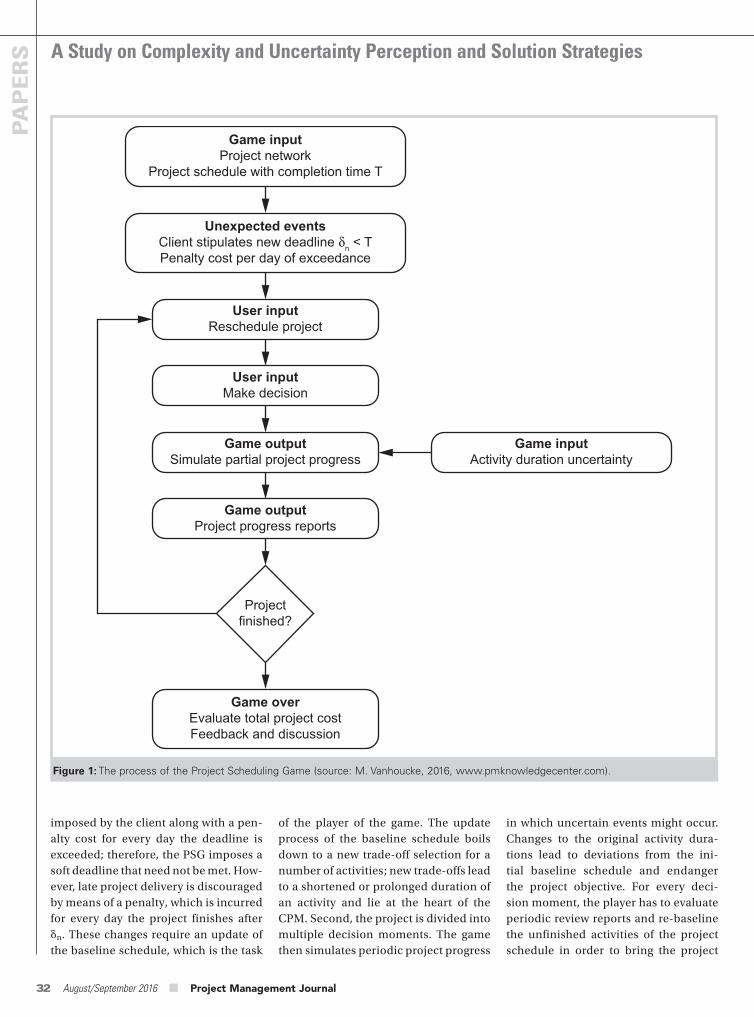
A Study on Complexity and Uncertainty Perception and Solution Strategies
32 August/September 2016 ■ Project Management Journal
PAPERS
in which uncertain events might occur. Changes to the original activity dura-tions lead to deviations from the ini-tial baseline schedule and endanger the project objective. For every deci-sion moment, the player has to evaluate periodic review reports and re-baseline the unfinished activities of the project schedule in order to bring the project
of the player of the game. The update process of the baseline schedule boils down to a new trade-off selection for a number of activities; new trade-offs lead to a shortened or prolonged duration of an activity and lie at the heart of the CPM. Second, the project is divided into multiple decision moments. The game then simulates periodic project progress
imposed by the client along with a pen-alty cost for every day the deadline is exceeded; therefore, the PSG imposes a soft deadline that need not be met. How-ever, late project delivery is discouraged by means of a penalty, which is incurred for every day the project finishes after dn. These changes require an update of the baseline schedule, which is the task
Figure 1: The process of the Project Scheduling Game (source: M. Vanhoucke, 2016, www.pmknowledgecenter.com).
Game inputProject network
Project schedule with completion time T
Unexpected eventsClient stipulates new deadline δn < TPenalty cost per day of exceedance
User inputReschedule project
User inputMake decision
Game outputSimulate partial project progress
Game inputActivity duration uncertainty
Game outputProject progress reports
Projectfinished?
Game overEvaluate total project costFeedback and discussion
PMJ_87569728_47_4_Aug_Sept_2016.indb 32 9/19/16 3:44 PM
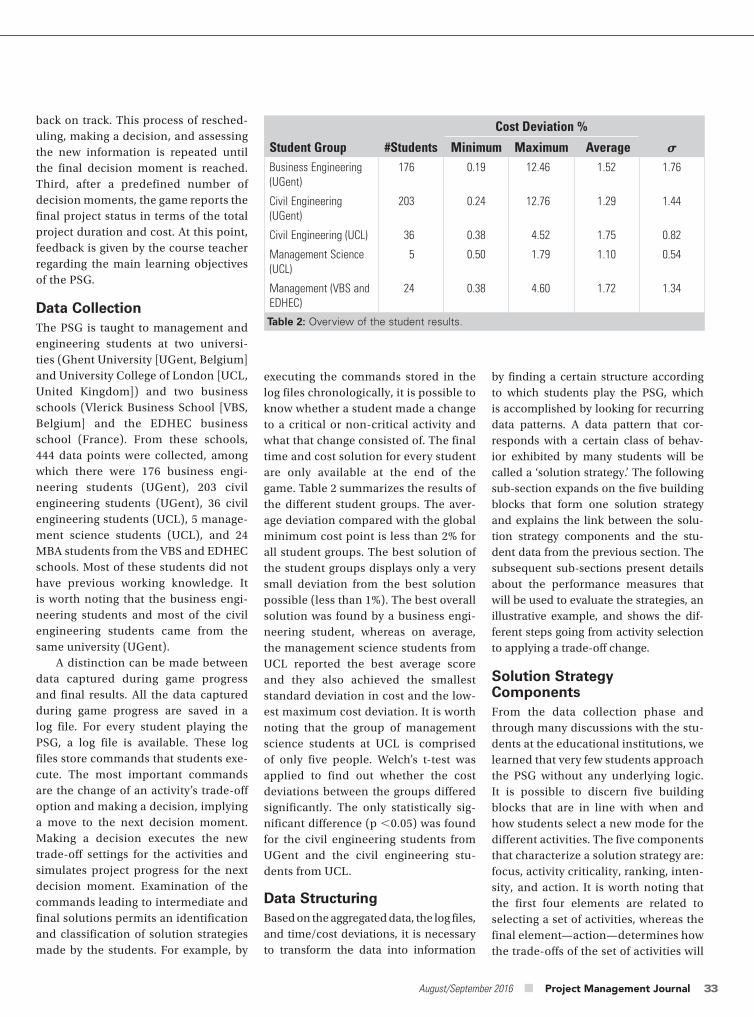
August/September 2016 ■ Project Management Journal 33
by finding a certain structure according to which students play the PSG, which is accomplished by looking for recurring data patterns. A data pattern that cor-responds with a certain class of behav-ior exhibited by many students will be called a ‘solution strategy.’ The following sub-section expands on the five building blocks that form one solution strategy and explains the link between the solu-tion strategy components and the stu-dent data from the previous section. The subsequent sub-sections present details about the performance measures that will be used to evaluate the strategies, an illustrative example, and shows the dif-ferent steps going from activity selection to applying a trade-off change.
Solution Strategy ComponentsFrom the data collection phase and through many discussions with the stu-dents at the educational institutions, we learned that very few students approach the PSG without any underlying logic. It is possible to discern five building blocks that are in line with when and how students select a new mode for the different activities. The five components that characterize a solution strategy are: focus, activity criticality, ranking, inten-sity, and action. It is worth noting that the first four elements are related to selecting a set of activities, whereas the final element—action—determines how the trade-offs of the set of activities will
executing the commands stored in the log files chronologically, it is possible to know whether a student made a change to a critical or non-critical activity and what that change consisted of. The final time and cost solution for every student are only available at the end of the game. Table 2 summarizes the results of the different student groups. The aver-age deviation compared with the global minimum cost point is less than 2% for all student groups. The best solution of the student groups displays only a very small deviation from the best solution possible (less than 1%). The best overall solution was found by a business engi-neering student, whereas on average, the management science students from UCL reported the best average score and they also achieved the smallest standard deviation in cost and the low-est maximum cost deviation. It is worth noting that the group of management science students at UCL is comprised of only five people. Welch’s t-test was applied to find out whether the cost deviations between the groups differed significantly. The only statistically sig-nificant difference (p ,0.05) was found for the civil engineering students from UGent and the civil engineering stu-dents from UCL.
Data StructuringBased on the aggregated data, the log files, and time/cost deviations, it is necessary to transform the data into information
back on track. This process of resched-uling, making a decision, and assessing the new information is repeated until the final decision moment is reached. Third, after a predefined number of decision moments, the game reports the final project status in terms of the total project duration and cost. At this point, feedback is given by the course teacher regarding the main learning objectives of the PSG.
Data CollectionThe PSG is taught to management and engineering students at two universi-ties (Ghent University [UGent, Belgium] and University College of London [UCL, United Kingdom]) and two business schools (Vlerick Business School [VBS, Belgium] and the EDHEC business school (France). From these schools, 444 data points were collected, among which there were 176 business engi-neering students (UGent), 203 civil engineering students (UGent), 36 civil engineering students (UCL), 5 manage-ment science students (UCL), and 24 MBA students from the VBS and EDHEC schools. Most of these students did not have previous working knowledge. It is worth noting that the business engi-neering students and most of the civil engineering students came from the same university (UGent).
A distinction can be made between data captured during game progress and final results. All the data captured during game progress are saved in a log file. For every student playing the PSG, a log file is available. These log files store commands that students exe-cute. The most important commands are the change of an activity’s trade-off option and making a decision, implying a move to the next decision moment. Making a decision executes the new trade-off settings for the activities and simulates project progress for the next decision moment. Examination of the commands leading to intermediate and final solutions permits an identification and classification of solution strategies made by the students. For example, by
Cost Deviation %
Student Group #Students Minimum Maximum Average
Business Engineering (UGent)
176 0.19 12.46 1.52 1.76
Civil Engineering (UGent)
203 0.24 12.76 1.29 1.44
Civil Engineering (UCL) 36 0.38 4.52 1.75 0.82
Management Science (UCL)
5 0.50 1.79 1.10 0.54
Management (VBS and EDHEC)
24 0.38 4.60 1.72 1.34
Table 2: Overview of the student results.
PMJ_87569728_47_4_Aug_Sept_2016.indb 33 9/19/16 3:44 PM
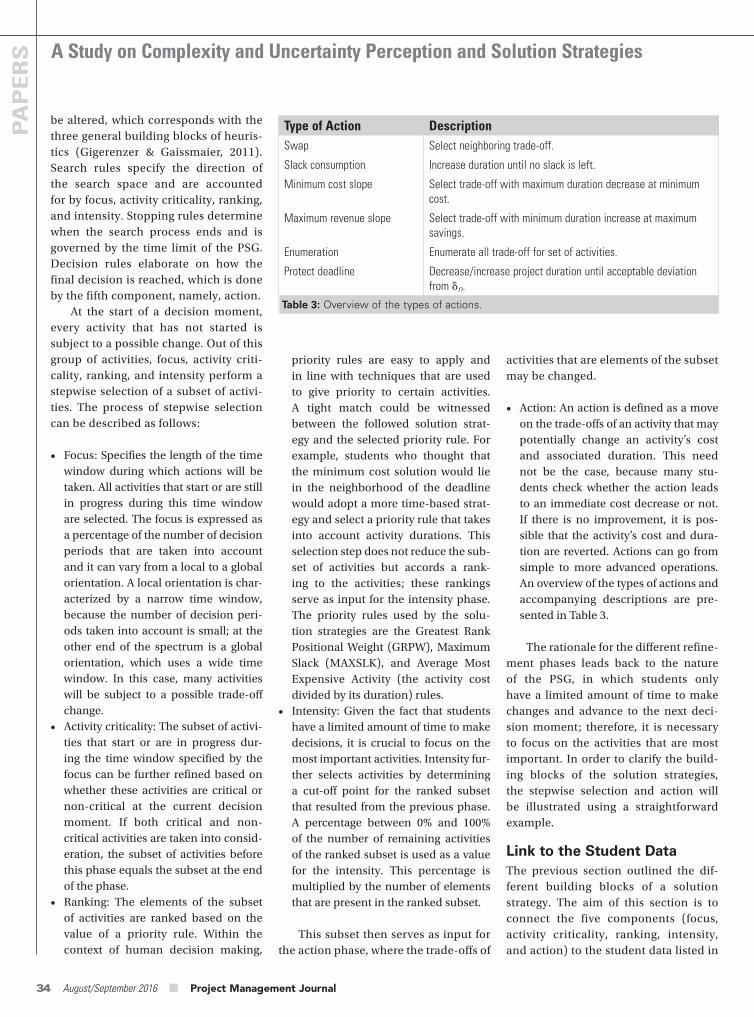
A Study on Complexity and Uncertainty Perception and Solution Strategies
34 August/September 2016 ■ Project Management Journal
PAPERS
activities that are elements of the subset may be changed.
• Action: An action is defined as a move on the trade-offs of an activity that may potentially change an activity’s cost and associated duration. This need not be the case, because many stu-dents check whether the action leads to an immediate cost decrease or not. If there is no improvement, it is pos-sible that the activity’s cost and dura-tion are reverted. Actions can go from simple to more advanced operations. An overview of the types of actions and accompanying descriptions are pre-sented in Table 3.
The rationale for the different refine-ment phases leads back to the nature of the PSG, in which students only have a limited amount of time to make changes and advance to the next deci-sion moment; therefore, it is necessary to focus on the activities that are most important. In order to clarify the build-ing blocks of the solution strategies, the stepwise selection and action will be illustrated using a straightforward example.
Link to the Student DataThe previous section outlined the dif-ferent building blocks of a solution strategy. The aim of this section is to connect the five components (focus, activity criticality, ranking, intensity, and action) to the student data listed in
priority rules are easy to apply and in line with techniques that are used to give priority to certain activities. A tight match could be witnessed between the followed solution strat-egy and the selected priority rule. For example, students who thought that the minimum cost solution would lie in the neighborhood of the deadline would adopt a more time-based strat-egy and select a priority rule that takes into account activity durations. This selection step does not reduce the sub-set of activities but accords a rank-ing to the activities; these rankings serve as input for the intensity phase. The priority rules used by the solu-tion strategies are the Greatest Rank Positional Weight (GRPW), Maximum Slack (MAXSLK), and Average Most Expensive Activity (the activity cost divided by its duration) rules.
• Intensity: Given the fact that students have a limited amount of time to make decisions, it is crucial to focus on the most important activities. Intensity fur-ther selects activities by determining a cut-off point for the ranked subset that resulted from the previous phase. A percentage between 0% and 100% of the number of remaining activities of the ranked subset is used as a value for the intensity. This percentage is multiplied by the number of elements that are present in the ranked subset.
This subset then serves as input for the action phase, where the trade-offs of
be altered, which corresponds with the three general building blocks of heuris-tics (Gigerenzer & Gaissmaier, 2011). Search rules specify the direction of the search space and are accounted for by focus, activity criticality, ranking, and intensity. Stopping rules determine when the search process ends and is governed by the time limit of the PSG. Decision rules elaborate on how the final decision is reached, which is done by the fifth component, namely, action.
At the start of a decision moment, every activity that has not started is subject to a possible change. Out of this group of activities, focus, activity criti-cality, ranking, and intensity perform a stepwise selection of a subset of activi-ties. The process of stepwise selection can be described as follows:
• Focus: Specifies the length of the time window during which actions will be taken. All activities that start or are still in progress during this time window are selected. The focus is expressed as a percentage of the number of decision periods that are taken into account and it can vary from a local to a global orientation. A local orientation is char-acterized by a narrow time window, because the number of decision peri-ods taken into account is small; at the other end of the spectrum is a global orientation, which uses a wide time window. In this case, many activities will be subject to a possible trade-off change.
• Activity criticality: The subset of activi-ties that start or are in progress dur-ing the time window specified by the focus can be further refined based on whether these activities are critical or non-critical at the current decision moment. If both critical and non-critical activities are taken into consid-eration, the subset of activities before this phase equals the subset at the end of the phase.
• Ranking: The elements of the subset of activities are ranked based on the value of a priority rule. Within the context of human decision making,
Type of Action DescriptionSwap Select neighboring trade-off.
Slack consumption Increase duration until no slack is left.
Minimum cost slope Select trade-off with maximum duration decrease at minimum cost.
Maximum revenue slope Select trade-off with minimum duration increase at maximum savings.
Enumeration Enumerate all trade-off for set of activities.
Protect deadline Decrease/increase project duration until acceptable deviation from dn.
Table 3: Overview of the types of actions.
PMJ_87569728_47_4_Aug_Sept_2016.indb 34 9/19/16 3:44 PM
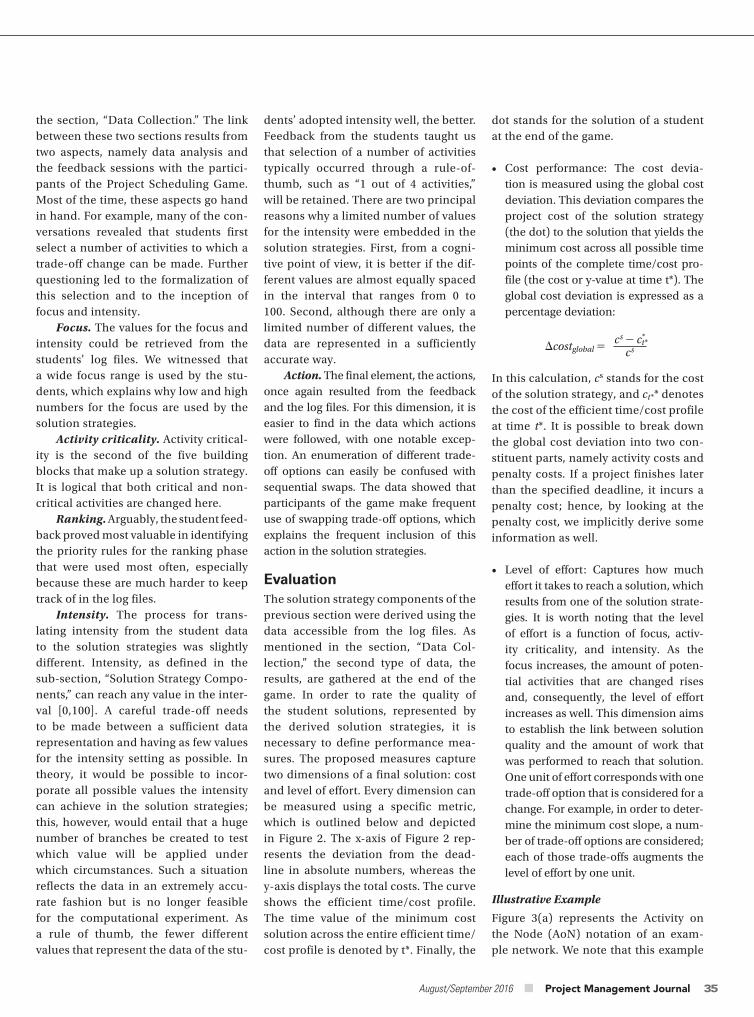
August/September 2016 ■ Project Management Journal 35
dot stands for the solution of a student at the end of the game.
• Cost performance: The cost devia-tion is measured using the global cost deviation. This deviation compares the project cost of the solution strategy (the dot) to the solution that yields the minimum cost across all possible time points of the complete time/cost pro-file (the cost or y-value at time t*). The global cost deviation is expressed as a percentage deviation:
costglobal c s ct **
c s
In this calculation, cs stands for the cost of the solution strategy, and ct ** denotes the cost of the efficient time/cost profile at time t*. It is possible to break down the global cost deviation into two con-stituent parts, namely activity costs and penalty costs. If a project finishes later than the specified deadline, it incurs a penalty cost; hence, by looking at the penalty cost, we implicitly derive some information as well.
• Level of effort: Captures how much effort it takes to reach a solution, which results from one of the solution strate-gies. It is worth noting that the level of effort is a function of focus, activ-ity criticality, and intensity. As the focus increases, the amount of poten-tial activities that are changed rises and, consequently, the level of effort increases as well. This dimension aims to establish the link between solution quality and the amount of work that was performed to reach that solution. One unit of effort corresponds with one trade-off option that is considered for a change. For example, in order to deter-mine the minimum cost slope, a num-ber of trade-off options are considered; each of those trade-offs augments the level of effort by one unit.
Illustrative Example
Figure 3(a) represents the Activity on the Node (AoN) notation of an exam-ple network. We note that this example
dents’ adopted intensity well, the better. Feedback from the students taught us that selection of a number of activities typically occurred through a rule-of-thumb, such as “1 out of 4 activities,” will be retained. There are two principal reasons why a limited number of values for the intensity were embedded in the solution strategies. First, from a cogni-tive point of view, it is better if the dif-ferent values are almost equally spaced in the interval that ranges from 0 to 100. Second, although there are only a limited number of different values, the data are represented in a sufficiently accurate way.
Action. The final element, the actions, once again resulted from the feedback and the log files. For this dimension, it is easier to find in the data which actions were followed, with one notable excep-tion. An enumeration of different trade-off options can easily be confused with sequential swaps. The data showed that participants of the game make frequent use of swapping trade-off options, which explains the frequent inclusion of this action in the solution strategies.
EvaluationThe solution strategy components of the previous section were derived using the data accessible from the log files. As mentioned in the section, “Data Col-lection,” the second type of data, the results, are gathered at the end of the game. In order to rate the quality of the student solutions, represented by the derived solution strategies, it is necessary to define performance mea-sures. The proposed measures capture two dimensions of a final solution: cost and level of effort. Every dimension can be measured using a specific metric, which is outlined below and depicted in Figure 2. The x-axis of Figure 2 rep-resents the deviation from the dead-line in absolute numbers, whereas the y-axis displays the total costs. The curve shows the efficient time/cost profile. The time value of the minimum cost solution across the entire efficient time/cost profile is denoted by t*. Finally, the
the section, “Data Collection.” The link between these two sections results from two aspects, namely data analysis and the feedback sessions with the partici-pants of the Project Scheduling Game. Most of the time, these aspects go hand in hand. For example, many of the con-versations revealed that students first select a number of activities to which a trade-off change can be made. Further questioning led to the formalization of this selection and to the inception of focus and intensity.
Focus. The values for the focus and intensity could be retrieved from the students’ log files. We witnessed that a wide focus range is used by the stu-dents, which explains why low and high numbers for the focus are used by the solution strategies.
Activity criticality. Activity critical-ity is the second of the five building blocks that make up a solution strategy. It is logical that both critical and non-critical activities are changed here.
Ranking. Arguably, the student feed-back proved most valuable in identifying the priority rules for the ranking phase that were used most often, especially because these are much harder to keep track of in the log files.
Intensity. The process for trans-lating intensity from the student data to the solution strategies was slightly different. Intensity, as defined in the sub-section, “Solution Strategy Compo-nents,” can reach any value in the inter-val [0,100]. A careful trade-off needs to be made between a sufficient data representation and having as few values for the intensity setting as possible. In theory, it would be possible to incor-porate all possible values the intensity can achieve in the solution strategies; this, however, would entail that a huge number of branches be created to test which value will be applied under which circumstances. Such a situation reflects the data in an extremely accu-rate fashion but is no longer feasible for the computational experiment. As a rule of thumb, the fewer different values that represent the data of the stu-
PMJ_87569728_47_4_Aug_Sept_2016.indb 35 9/19/16 3:44 PM
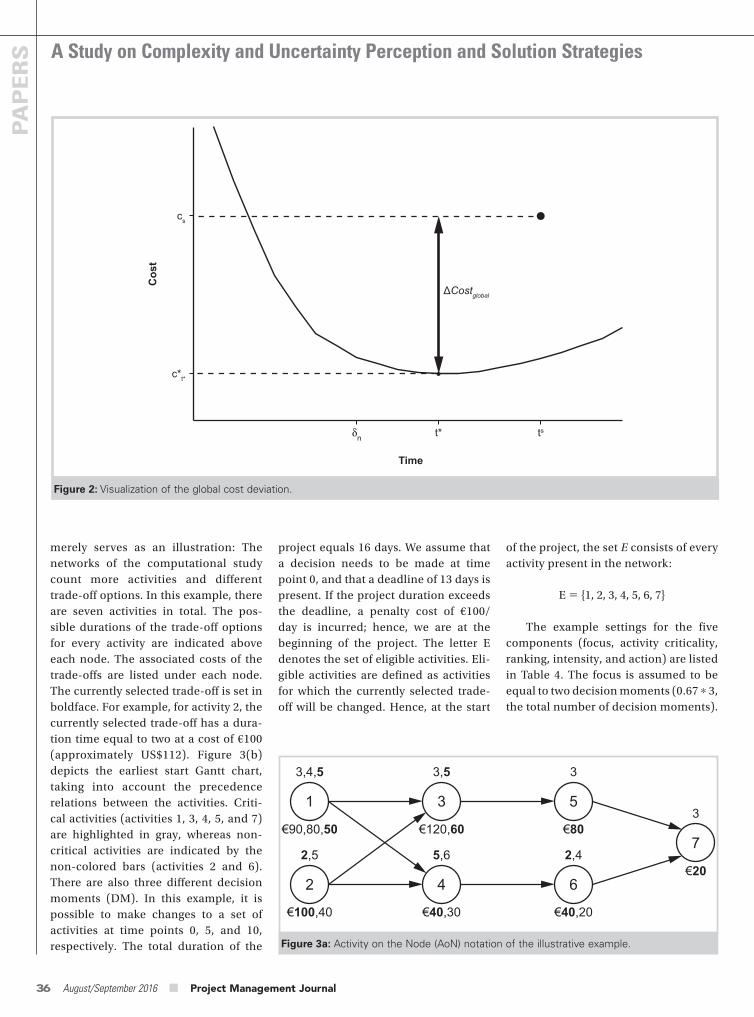
A Study on Complexity and Uncertainty Perception and Solution Strategies
36 August/September 2016 ■ Project Management Journal
PAPERS
of the project, the set E consists of every activity present in the network:
E {1, 2, 3, 4, 5, 6, 7}
The example settings for the five components (focus, activity criticality, ranking, intensity, and action) are listed in Table 4. The focus is assumed to be equal to two decision moments (0.67 3, the total number of decision moments).
project equals 16 days. We assume that a decision needs to be made at time point 0, and that a deadline of 13 days is present. If the project duration exceeds the deadline, a penalty cost of €100/day is incurred; hence, we are at the beginning of the project. The letter E denotes the set of eligible activities. Eli-gible activities are defined as activities for which the currently selected trade-off will be changed. Hence, at the start
merely serves as an illustration: The networks of the computational study count more activities and different trade-off options. In this example, there are seven activities in total. The pos-sible durations of the trade-off options for every activity are indicated above each node. The associated costs of the trade-offs are listed under each node. The currently selected trade-off is set in boldface. For example, for activity 2, the currently selected trade-off has a dura-tion time equal to two at a cost of €100 (approximately US$112). Figure 3(b) depicts the earliest start Gantt chart, taking into account the precedence relations between the activities. Criti-cal activities (activities 1, 3, 4, 5, and 7) are highlighted in gray, whereas non-critical activities are indicated by the non-colored bars (activities 2 and 6). There are also three different decision moments (DM). In this example, it is possible to make changes to a set of activities at time points 0, 5, and 10, respectively. The total duration of the
c*t*
δn t* ts
cs
Time
ΔCostglobal
Cost
Figure 2: Visualization of the global cost deviation.
1
3,4,5
€90,80,50
€100,40 €40,30 €40,20
€20
€120,60 €80
2,5 5,6 2,4
3,5 3
3
2
3
4
5
6
7
Figure 3a: Activity on the Node (AoN) notation of the illustrative example.
PMJ_87569728_47_4_Aug_Sept_2016.indb 36 9/19/16 3:44 PM
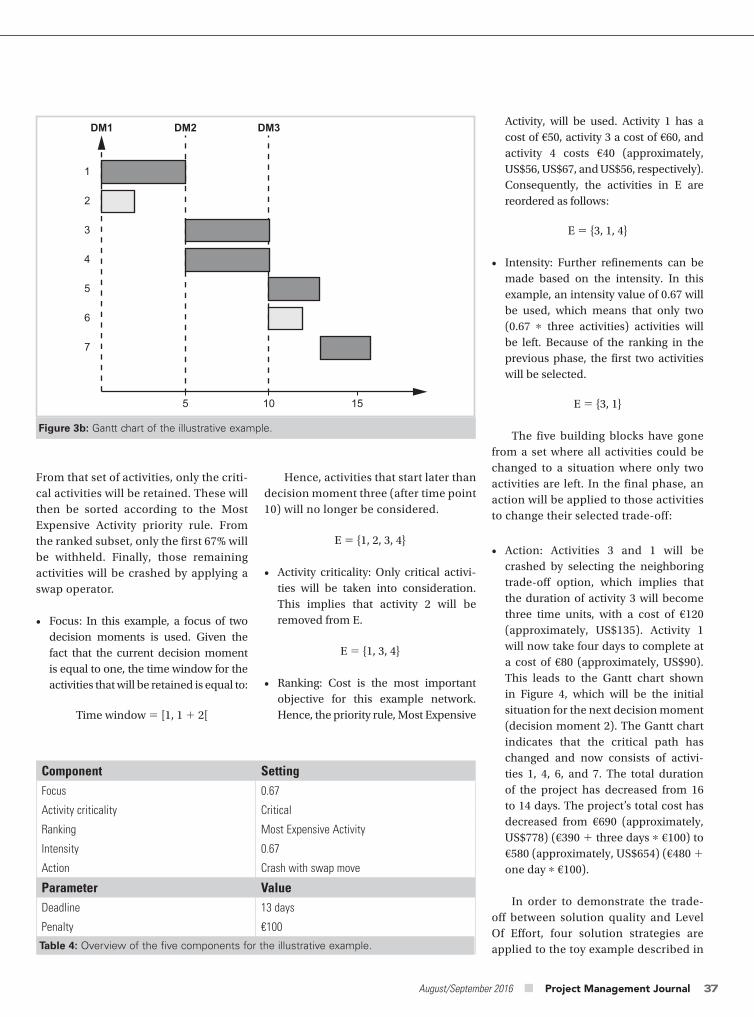
August/September 2016 ■ Project Management Journal 37
Activity, will be used. Activity 1 has a cost of €50, activity 3 a cost of €60, and activity 4 costs €40 (approximately, US$56, US$67, and US$56, respectively). Consequently, the activities in E are reordered as follows:
E {3, 1, 4}
• Intensity: Further refinements can be made based on the intensity. In this example, an intensity value of 0.67 will be used, which means that only two (0.67 three activities) activities will be left. Because of the ranking in the previous phase, the first two activities will be selected.
E {3, 1}
The five building blocks have gone from a set where all activities could be changed to a situation where only two activities are left. In the final phase, an action will be applied to those activities to change their selected trade-off:
• Action: Activities 3 and 1 will be crashed by selecting the neighboring trade-off option, which implies that the duration of activity 3 will become three time units, with a cost of €120 (approximately, US$135). Activity 1 will now take four days to complete at a cost of €80 (approximately, US$90). This leads to the Gantt chart shown in Figure 4, which will be the initial situation for the next decision moment (decision moment 2). The Gantt chart indicates that the critical path has changed and now consists of activi-ties 1, 4, 6, and 7. The total duration of the project has decreased from 16 to 14 days. The project’s total cost has decreased from €690 (approximately, US$778) (€390 1 three days €100) to €580 (approximately, US$654) (€480 1 one day €100).
In order to demonstrate the trade-off between solution quality and Level Of Effort, four solution strategies are applied to the toy example described in
Hence, activities that start later than decision moment three (after time point 10) will no longer be considered.
E {1, 2, 3, 4}
• Activity criticality: Only critical activi-ties will be taken into consideration. This implies that activity 2 will be removed from E.
E {1, 3, 4}
• Ranking: Cost is the most important objective for this example network. Hence, the priority rule, Most Expensive
From that set of activities, only the criti-cal activities will be retained. These will then be sorted according to the Most Expensive Activity priority rule. From the ranked subset, only the first 67% will be withheld. Finally, those remaining activities will be crashed by applying a swap operator.
• Focus: In this example, a focus of two decision moments is used. Given the fact that the current decision moment is equal to one, the time window for the activities that will be retained is equal to:
Time window [1, 1 1 2[
10 155
1
DM1 DM2 DM3
2
3
4
5
6
7
Figure 3b: Gantt chart of the illustrative example.
Component SettingFocus 0.67
Activity criticality Critical
Ranking Most Expensive Activity
Intensity 0.67
Action Crash with swap move
Parameter ValueDeadline 13 days
Penalty €100
Table 4: Overview of the five components for the illustrative example.
PMJ_87569728_47_4_Aug_Sept_2016.indb 37 9/19/16 3:44 PM
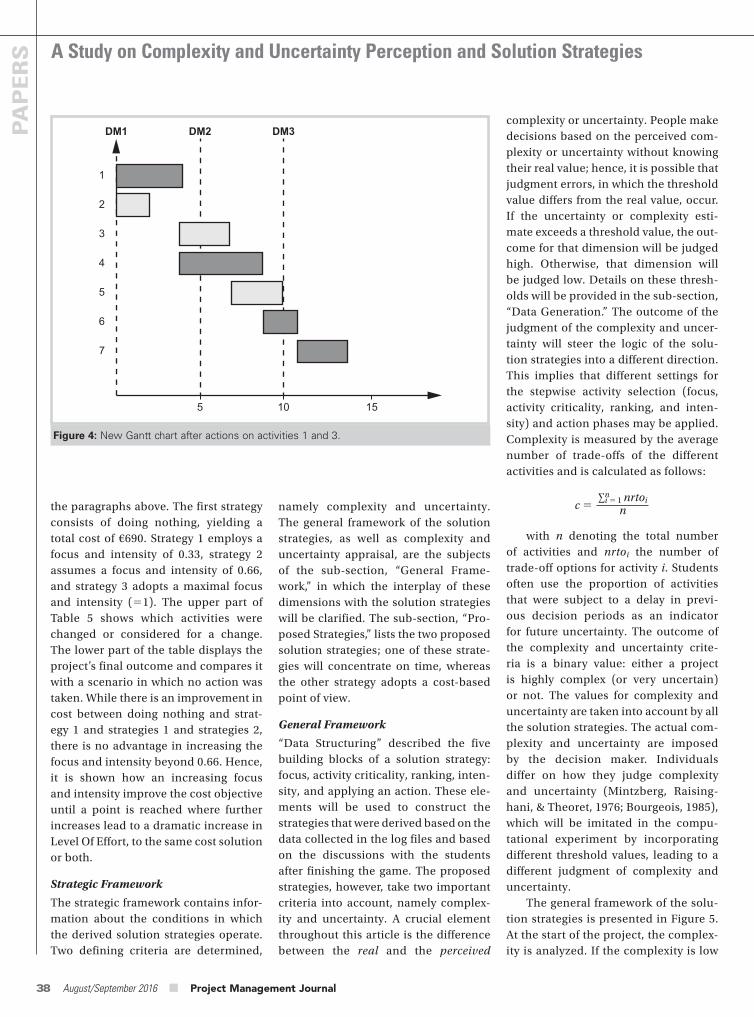
A Study on Complexity and Uncertainty Perception and Solution Strategies
38 August/September 2016 ■ Project Management Journal
PAPERS
complexity or uncertainty. People make decisions based on the perceived com-plexity or uncertainty without knowing their real value; hence, it is possible that judgment errors, in which the threshold value differs from the real value, occur. If the uncertainty or complexity esti-mate exceeds a threshold value, the out-come for that dimension will be judged high. Otherwise, that dimension will be judged low. Details on these thresh-olds will be provided in the sub-section, “Data Generation.” The outcome of the judgment of the complexity and uncer-tainty will steer the logic of the solu-tion strategies into a different direction. This implies that different settings for the stepwise activity selection (focus, activity criticality, ranking, and inten-sity) and action phases may be applied. Complexity is measured by the average number of trade-offs of the different activities and is calculated as follows:
c ∑n
i 1 nrtoin
with n denoting the total number of activities and nrtoi the number of trade-off options for activity i. Students often use the proportion of activities that were subject to a delay in previ-ous decision periods as an indicator for future uncertainty. The outcome of the complexity and uncertainty crite-ria is a binary value: either a project is highly complex (or very uncertain) or not. The values for complexity and uncertainty are taken into account by all the solution strategies. The actual com-plexity and uncertainty are imposed by the decision maker. Individuals differ on how they judge complexity and uncertainty (Mintzberg, Raising-hani, & Theoret, 1976; Bourgeois, 1985), which will be imitated in the compu-tational experiment by incorporating different threshold values, leading to a different judgment of complexity and uncertainty.
The general framework of the solu-tion strategies is presented in Figure 5. At the start of the project, the complex-ity is analyzed. If the complexity is low
the paragraphs above. The first strategy consists of doing nothing, yielding a total cost of €690. Strategy 1 employs a focus and intensity of 0.33, strategy 2 assumes a focus and intensity of 0.66, and strategy 3 adopts a maximal focus and intensity (1). The upper part of Table 5 shows which activities were changed or considered for a change. The lower part of the table displays the project’s final outcome and compares it with a scenario in which no action was taken. While there is an improvement in cost between doing nothing and strat-egy 1 and strategies 1 and strategies 2, there is no advantage in increasing the focus and intensity beyond 0.66. Hence, it is shown how an increasing focus and intensity improve the cost objective until a point is reached where further increases lead to a dramatic increase in Level Of Effort, to the same cost solution or both.
Strategic Framework
The strategic framework contains infor-mation about the conditions in which the derived solution strategies operate. Two defining criteria are determined,
Figure 4: New Gantt chart after actions on activities 1 and 3.
10 155
1
DM1 DM2 DM3
2
3
4
5
6
7
namely complexity and uncertainty. The general framework of the solution strategies, as well as complexity and uncertainty appraisal, are the subjects of the sub-section, “General Frame-work,” in which the interplay of these dimensions with the solution strategies will be clarified. The sub-section, “Pro-posed Strategies,” lists the two proposed solution strategies; one of these strate-gies will concentrate on time, whereas the other strategy adopts a cost-based point of view.
General Framework
“Data Structuring” described the five building blocks of a solution strategy: focus, activity criticality, ranking, inten-sity, and applying an action. These ele-ments will be used to construct the strategies that were derived based on the data collected in the log files and based on the discussions with the students after finishing the game. The proposed strategies, however, take two important criteria into account, namely complex-ity and uncertainty. A crucial element throughout this article is the difference between the real and the perceived
PMJ_87569728_47_4_Aug_Sept_2016.indb 38 9/19/16 3:44 PM
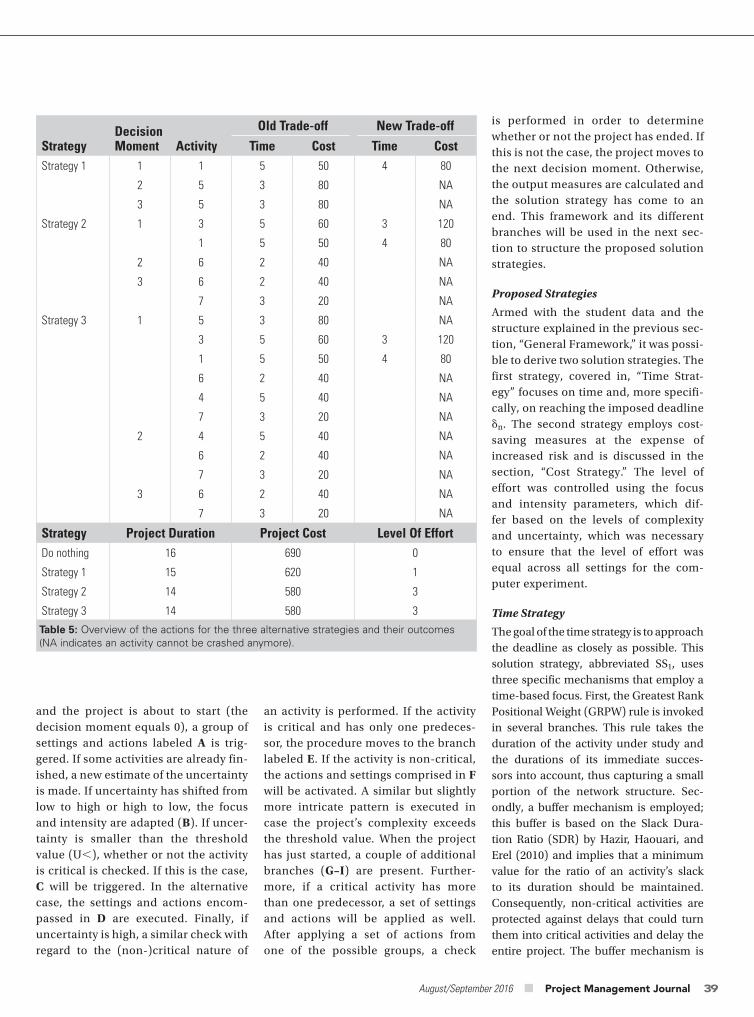
August/September 2016 ■ Project Management Journal 39
is performed in order to determine whether or not the project has ended. If this is not the case, the project moves to the next decision moment. Otherwise, the output measures are calculated and the solution strategy has come to an end. This framework and its different branches will be used in the next sec-tion to structure the proposed solution strategies.
Proposed Strategies
Armed with the student data and the structure explained in the previous sec-tion, “General Framework,” it was possi-ble to derive two solution strategies. The first strategy, covered in, “Time Strat-egy” focuses on time and, more specifi-cally, on reaching the imposed deadline dn. The second strategy employs cost-saving measures at the expense of increased risk and is discussed in the section, “Cost Strategy.” The level of effort was controlled using the focus and intensity parameters, which dif-fer based on the levels of complexity and uncertainty, which was necessary to ensure that the level of effort was equal across all settings for the com-puter experiment.
Time Strategy
The goal of the time strategy is to approach the deadline as closely as possible. This solution strategy, abbreviated SS1, uses three specific mechanisms that employ a time-based focus. First, the Greatest Rank Positional Weight (GRPW) rule is invoked in several branches. This rule takes the duration of the activity under study and the durations of its immediate succes-sors into account, thus capturing a small portion of the network structure. Sec-ondly, a buffer mechanism is employed; this buffer is based on the Slack Dura-tion Ratio (SDR) by Hazir, Haouari, and Erel (2010) and implies that a minimum value for the ratio of an activity’s slack to its duration should be maintained. Consequently, non-critical activities are protected against delays that could turn them into critical activities and delay the entire project. The buffer mechanism is
an activity is performed. If the activity is critical and has only one predeces-sor, the procedure moves to the branch labeled E. If the activity is non-critical, the actions and settings comprised in F will be activated. A similar but slightly more intricate pattern is executed in case the project’s complexity exceeds the threshold value. When the project has just started, a couple of additional branches (G–I) are present. Further-more, if a critical activity has more than one predecessor, a set of settings and actions will be applied as well. After applying a set of actions from one of the possible groups, a check
and the project is about to start (the decision moment equals 0), a group of settings and actions labeled A is trig-gered. If some activities are already fin-ished, a new estimate of the uncertainty is made. If uncertainty has shifted from low to high or high to low, the focus and intensity are adapted (B). If uncer-tainty is smaller than the threshold value (U,), whether or not the activity is critical is checked. If this is the case, C will be triggered. In the alternative case, the settings and actions encom-passed in D are executed. Finally, if uncertainty is high, a similar check with regard to the (non-)critical nature of
StrategyDecision Moment Activity
Old Trade-off New Trade-off
Time Cost Time CostStrategy 1 1 1 5 50 4 80
2 5 3 80 NA
3 5 3 80 NA
Strategy 2 1 3 5 60 3 120
1 5 50 4 80
2 6 2 40 NA
3 6 2 40 NA
7 3 20 NA
Strategy 3 1 5 3 80 NA
3 5 60 3 120
1 5 50 4 80
6 2 40 NA
4 5 40 NA
7 3 20 NA
2 4 5 40 NA
6 2 40 NA
7 3 20 NA
3 6 2 40 NA
7 3 20 NA
Strategy Project Duration Project Cost Level Of EffortDo nothing 16 690 0
Strategy 1 15 620 1
Strategy 2 14 580 3
Strategy 3 14 580 3
Table 5: Overview of the actions for the three alternative strategies and their outcomes (NA indicates an activity cannot be crashed anymore).
PMJ_87569728_47_4_Aug_Sept_2016.indb 39 9/19/16 3:44 PM
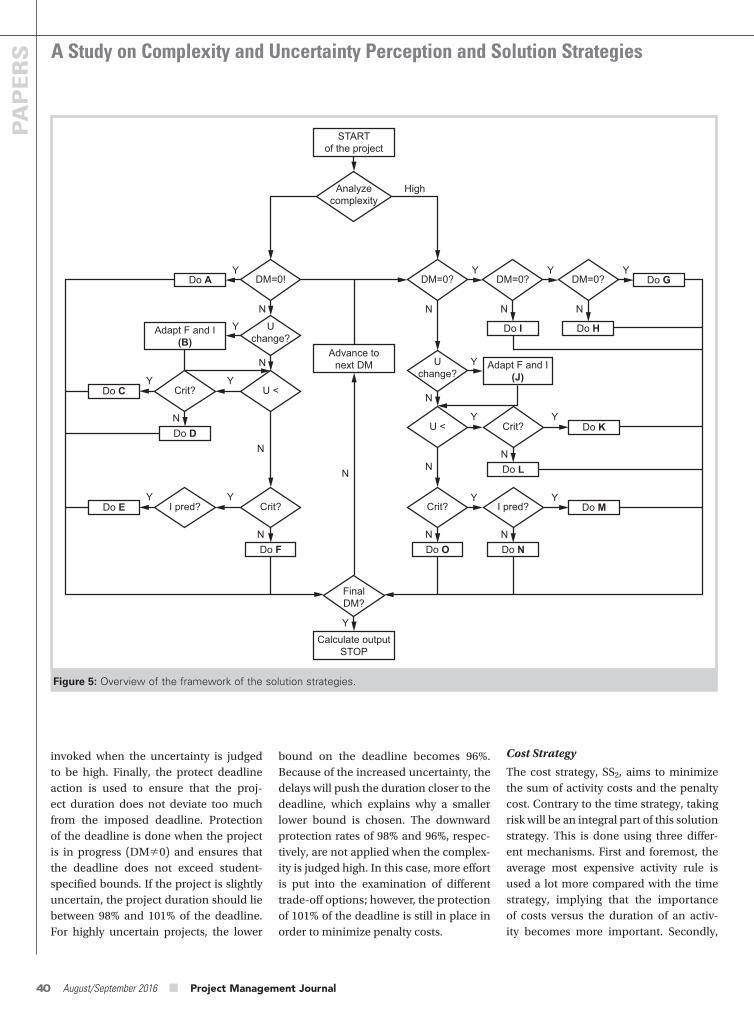
A Study on Complexity and Uncertainty Perception and Solution Strategies
40 August/September 2016 ■ Project Management Journal
PAPERS
Cost Strategy
The cost strategy, SS2, aims to minimize the sum of activity costs and the penalty cost. Contrary to the time strategy, taking risk will be an integral part of this solution strategy. This is done using three differ-ent mechanisms. First and foremost, the average most expensive activity rule is used a lot more compared with the time strategy, implying that the importance of costs versus the duration of an activ-ity becomes more important. Secondly,
bound on the deadline becomes 96%. Because of the increased uncertainty, the delays will push the duration closer to the deadline, which explains why a smaller lower bound is chosen. The downward protection rates of 98% and 96%, respec-tively, are not applied when the complex-ity is judged high. In this case, more effort is put into the examination of different trade-off options; however, the protection of 101% of the deadline is still in place in order to minimize penalty costs.
invoked when the uncertainty is judged to be high. Finally, the protect deadline action is used to ensure that the proj-ect duration does not deviate too much from the imposed deadline. Protection of the deadline is done when the project is in progress (DM0) and ensures that the deadline does not exceed student-specified bounds. If the project is slightly uncertain, the project duration should lie between 98% and 101% of the deadline. For highly uncertain projects, the lower
STARTof the project
Analyzecomplexity
Calculate outputSTOP
DM=0! DM=0? DM=0? DM=0?
Uchange?
Uchange?
U <Crit?
Do A
Adapt F and I(B)
Do C
Crit?I pred?Do E
Do D
Do F
Do G
Adapt F and I(J)
U < Crit? Do K
Do L
Crit? I pred? Do M
Do NDo O
Do I Do H
Advance tonext DM
FinalDM?
High
Y Y
Y
Y Y
Y Y
Y
YY
YY
N N
N
N
N N
N
N N
N
N
N
N
Y
N
Y Y
Figure 5: Overview of the framework of the solution strategies.
PMJ_87569728_47_4_Aug_Sept_2016.indb 40 9/19/16 3:44 PM
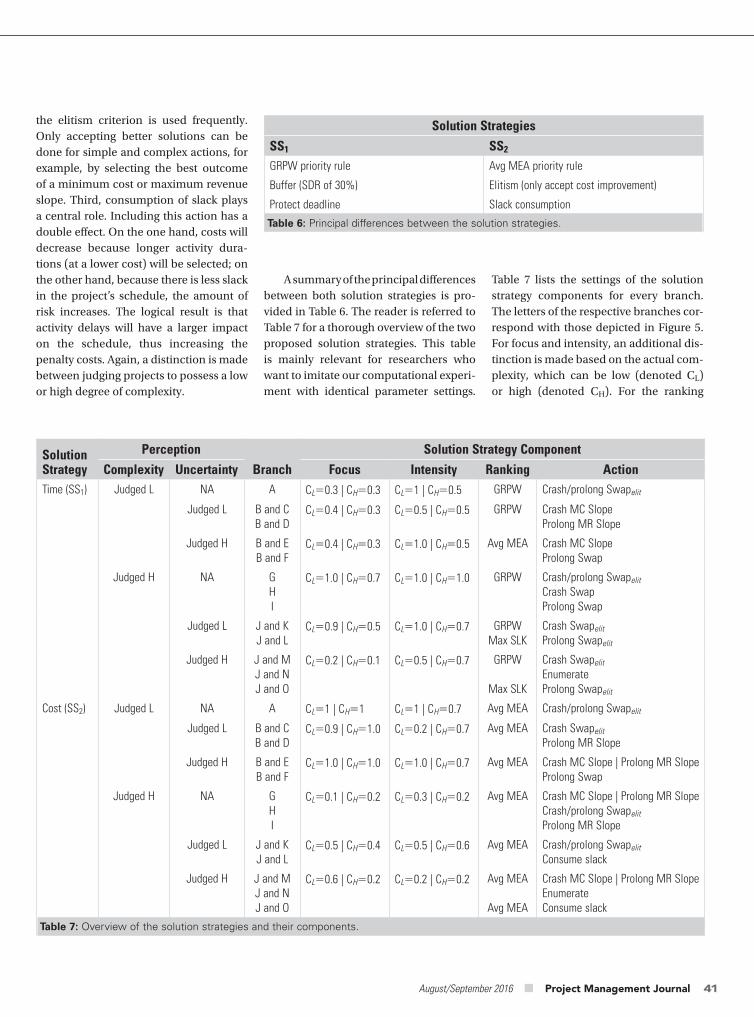
August/September 2016 ■ Project Management Journal 41
Table 7 lists the settings of the solution strategy components for every branch. The letters of the respective branches cor-respond with those depicted in Figure 5. For focus and intensity, an additional dis-tinction is made based on the actual com-plexity, which can be low (denoted CL) or high (denoted CH). For the ranking
A summary of the principal differences between both solution strategies is pro-vided in Table 6. The reader is referred to Table 7 for a thorough overview of the two proposed solution strategies. This table is mainly relevant for researchers who want to imitate our computational experi-ment with identical parameter settings.
the elitism criterion is used frequently. Only accepting better solutions can be done for simple and complex actions, for example, by selecting the best outcome of a minimum cost or maximum revenue slope. Third, consumption of slack plays a central role. Including this action has a double effect. On the one hand, costs will decrease because longer activity dura-tions (at a lower cost) will be selected; on the other hand, because there is less slack in the project’s schedule, the amount of risk increases. The logical result is that activity delays will have a larger impact on the schedule, thus increasing the penalty costs. Again, a distinction is made between judging projects to possess a low or high degree of complexity.
Solution Strategies
SS1 SS2
GRPW priority rule Avg MEA priority rule
Buffer (SDR of 30%) Elitism (only accept cost improvement)
Protect deadline Slack consumption
Table 6: Principal differences between the solution strategies.
Solution Strategy
Perception
Branch
Solution Strategy Component
Complexity Uncertainty Focus Intensity Ranking ActionTime (SS1) Judged L NA A CL0.3 | CH0.3 CL1 | CH0.5 GRPW Crash/prolong Swapelit
Judged L B and CB and D
CL0.4 | CH0.3 CL0.5 | CH0.5 GRPW Crash MC SlopeProlong MR Slope
Judged H B and EB and F
CL0.4 | CH0.3 CL1.0 | CH0.5 Avg MEA Crash MC SlopeProlong Swap
Judged H NA GHI
CL1.0 | CH0.7 CL1.0 | CH1.0 GRPW Crash/prolong Swapelit
Crash SwapProlong Swap
Judged L J and KJ and L
CL0.9 | CH0.5 CL1.0 | CH0.7 GRPWMax SLK
Crash Swapelit
Prolong Swapelit
Judged H J and MJ and NJ and O
CL0.2 | CH0.1 CL0.5 | CH0.7 GRPW
Max SLK
Crash Swapelit
EnumerateProlong Swapelit
Cost (SS2) Judged L NA A CL1 | CH1 CL1 | CH0.7 Avg MEA Crash/prolong Swapelit
Judged L B and CB and D
CL0.9 | CH1.0 CL0.2 | CH0.7 Avg MEA Crash Swapelit
Prolong MR Slope
Judged H B and EB and F
CL1.0 | CH1.0 CL1.0 | CH0.7 Avg MEA Crash MC Slope | Prolong MR SlopeProlong Swap
Judged H NA GHI
CL0.1 | CH0.2 CL0.3 | CH0.2 Avg MEA Crash MC Slope | Prolong MR SlopeCrash/prolong Swapelit
Prolong MR Slope
Judged L J and KJ and L
CL0.5 | CH0.4 CL0.5 | CH0.6 Avg MEA Crash/prolong Swapelit
Consume slack
Judged H J and MJ and NJ and O
CL0.6 | CH0.2 CL0.2 | CH0.2 Avg MEA
Avg MEA
Crash MC Slope | Prolong MR SlopeEnumerateConsume slack
Table 7: Overview of the solution strategies and their components.
PMJ_87569728_47_4_Aug_Sept_2016.indb 41 9/19/16 3:44 PM
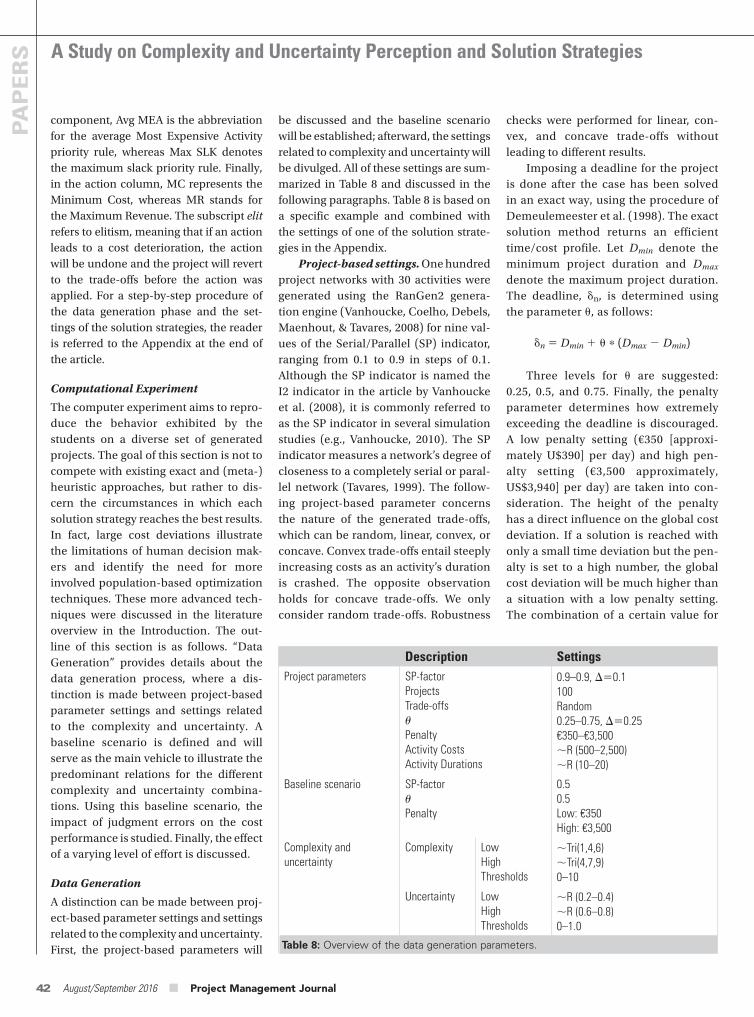
A Study on Complexity and Uncertainty Perception and Solution Strategies
42 August/September 2016 ■ Project Management Journal
PAPERS
checks were performed for linear, con-vex, and concave trade-offs without leading to different results.
Imposing a deadline for the project is done after the case has been solved in an exact way, using the procedure of Demeulemeester et al. (1998). The exact solution method returns an efficient time/cost profile. Let Dmin denote the minimum project duration and Dmax denote the maximum project duration. The deadline, dn, is determined using the parameter u, as follows:
dn Dmin 1 u (Dmax Dmin)
Three levels for u are suggested: 0.25, 0.5, and 0.75. Finally, the penalty parameter determines how extremely exceeding the deadline is discouraged. A low penalty setting (€350 [approxi-mately U$390] per day) and high pen-alty setting (€3,500 approximately, US$3,940] per day) are taken into con-sideration. The height of the penalty has a direct influence on the global cost deviation. If a solution is reached with only a small time deviation but the pen-alty is set to a high number, the global cost deviation will be much higher than a situation with a low penalty setting. The combination of a certain value for
be discussed and the baseline scenario will be established; afterward, the settings related to complexity and uncertainty will be divulged. All of these settings are sum-marized in Table 8 and discussed in the following paragraphs. Table 8 is based on a specific example and combined with the settings of one of the solution strate-gies in the Appendix.
Project-based settings. One hundred project networks with 30 activities were generated using the RanGen2 genera-tion engine (Vanhoucke, Coelho, Debels, Maenhout, & Tavares, 2008) for nine val-ues of the Serial/Parallel (SP) indicator, ranging from 0.1 to 0.9 in steps of 0.1. Although the SP indicator is named the I2 indicator in the article by Vanhoucke et al. (2008), it is commonly referred to as the SP indicator in several simulation studies (e.g., Vanhoucke, 2010). The SP indicator measures a network’s degree of closeness to a completely serial or paral-lel network (Tavares, 1999). The follow-ing project-based parameter concerns the nature of the generated trade-offs, which can be random, linear, convex, or concave. Convex trade-offs entail steeply increasing costs as an activity’s duration is crashed. The opposite observation holds for concave trade-offs. We only consider random trade-offs. Robustness
component, Avg MEA is the abbreviation for the average Most Expensive Activity priority rule, whereas Max SLK denotes the maximum slack priority rule. Finally, in the action column, MC represents the Minimum Cost, whereas MR stands for the Maximum Revenue. The subscript elit refers to elitism, meaning that if an action leads to a cost deterioration, the action will be undone and the project will revert to the trade-offs before the action was applied. For a step-by-step procedure of the data generation phase and the set-tings of the solution strategies, the reader is referred to the Appendix at the end of the article.
Computational Experiment
The computer experiment aims to repro-duce the behavior exhibited by the students on a diverse set of generated projects. The goal of this section is not to compete with existing exact and (meta-)heuristic approaches, but rather to dis-cern the circumstances in which each solution strategy reaches the best results. In fact, large cost deviations illustrate the limitations of human decision mak-ers and identify the need for more involved population-based optimization techniques. These more advanced tech-niques were discussed in the literature overview in the Introduction. The out-line of this section is as follows. “Data Generation” provides details about the data generation process, where a dis-tinction is made between project-based parameter settings and settings related to the complexity and uncertainty. A baseline scenario is defined and will serve as the main vehicle to illustrate the predominant relations for the different complexity and uncertainty combina-tions. Using this baseline scenario, the impact of judgment errors on the cost performance is studied. Finally, the effect of a varying level of effort is discussed.
Data Generation
A distinction can be made between proj-ect-based parameter settings and settings related to the complexity and uncertainty. First, the project-based parameters will
Description SettingsProject parameters SP-factor
ProjectsTrade-offsPenaltyActivity CostsActivity Durations
0.9–0.9, 0.1100Random0.25–0.75, 0.25€350–€3,500R (500–2,500)R (10–20)
Baseline scenario SP-factorPenalty
0.50.5Low: €350High: €3,500
Complexity and uncertainty
Complexity LowHighThresholds
Tri(1,4,6)Tri(4,7,9)0–10
Uncertainty LowHighThresholds
R (0.2–0.4)R (0.6–0.8)0–1.0
Table 8: Overview of the data generation parameters.
PMJ_87569728_47_4_Aug_Sept_2016.indb 42 9/19/16 3:44 PM
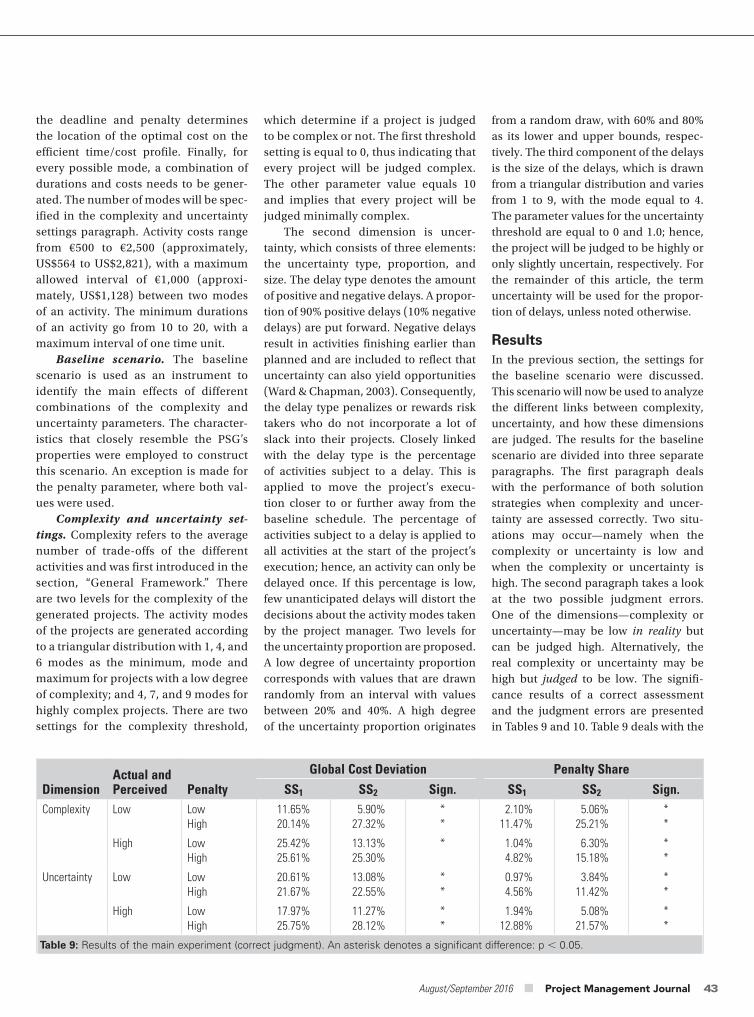
August/September 2016 ■ Project Management Journal 43
from a random draw, with 60% and 80% as its lower and upper bounds, respec-tively. The third component of the delays is the size of the delays, which is drawn from a triangular distribution and varies from 1 to 9, with the mode equal to 4. The parameter values for the uncertainty threshold are equal to 0 and 1.0; hence, the project will be judged to be highly or only slightly uncertain, respectively. For the remainder of this article, the term uncertainty will be used for the propor-tion of delays, unless noted otherwise.
ResultsIn the previous section, the settings for the baseline scenario were discussed. This scenario will now be used to analyze the different links between complexity, uncertainty, and how these dimensions are judged. The results for the baseline scenario are divided into three separate paragraphs. The first paragraph deals with the performance of both solution strategies when complexity and uncer-tainty are assessed correctly. Two situ-ations may occur—namely when the complexity or uncertainty is low and when the complexity or uncertainty is high. The second paragraph takes a look at the two possible judgment errors. One of the dimensions—complexity or uncertainty—may be low in reality but can be judged high. Alternatively, the real complexity or uncertainty may be high but judged to be low. The signifi-cance results of a correct assessment and the judgment errors are presented in Tables 9 and 10. Table 9 deals with the
which determine if a project is judged to be complex or not. The first threshold setting is equal to 0, thus indicating that every project will be judged complex. The other parameter value equals 10 and implies that every project will be judged minimally complex.
The second dimension is uncer-tainty, which consists of three elements: the uncertainty type, proportion, and size. The delay type denotes the amount of positive and negative delays. A propor-tion of 90% positive delays (10% negative delays) are put forward. Negative delays result in activities finishing earlier than planned and are included to reflect that uncertainty can also yield opportunities (Ward & Chapman, 2003). Consequently, the delay type penalizes or rewards risk takers who do not incorporate a lot of slack into their projects. Closely linked with the delay type is the percentage of activities subject to a delay. This is applied to move the project’s execu-tion closer to or further away from the baseline schedule. The percentage of activities subject to a delay is applied to all activities at the start of the project’s execution; hence, an activity can only be delayed once. If this percentage is low, few unanticipated delays will distort the decisions about the activity modes taken by the project manager. Two levels for the uncertainty proportion are proposed. A low degree of uncertainty proportion corresponds with values that are drawn randomly from an interval with values between 20% and 40%. A high degree of the uncertainty proportion originates
the deadline and penalty determines the location of the optimal cost on the efficient time/cost profile. Finally, for every possible mode, a combination of durations and costs needs to be gener-ated. The number of modes will be spec-ified in the complexity and uncertainty settings paragraph. Activity costs range from €500 to €2,500 (approximately, US$564 to US$2,821), with a maximum allowed interval of €1,000 (approxi-mately, US$1,128) between two modes of an activity. The minimum durations of an activity go from 10 to 20, with a maximum interval of one time unit.
Baseline scenario. The baseline scenario is used as an instrument to identify the main effects of different combinations of the complexity and uncertainty parameters. The character-istics that closely resemble the PSG’s properties were employed to construct this scenario. An exception is made for the penalty parameter, where both val-ues were used.
Complexity and uncertainty set-tings. Complexity refers to the average number of trade-offs of the different activities and was first introduced in the section, “General Framework.” There are two levels for the complexity of the generated projects. The activity modes of the projects are generated according to a triangular distribution with 1, 4, and 6 modes as the minimum, mode and maximum for projects with a low degree of complexity; and 4, 7, and 9 modes for highly complex projects. There are two settings for the complexity threshold,
DimensionActual and Perceived Penalty
Global Cost Deviation Penalty Share
SS1 SS2 Sign. SS1 SS2 Sign.Complexity Low Low
High11.65%20.14%
5.90%27.32%
**
2.10%11.47%
5.06%25.21%
**
High LowHigh
25.42%25.61%
13.13%25.30%
* 1.04%4.82%
6.30%15.18%
**
Uncertainty Low LowHigh
20.61%21.67%
13.08%22.55%
**
0.97%4.56%
3.84%11.42%
**
High LowHigh
17.97%25.75%
11.27%28.12%
**
1.94%12.88%
5.08%21.57%
**
Table 9: Results of the main experiment (correct judgment). An asterisk denotes a significant difference: p , 0.05.
PMJ_87569728_47_4_Aug_Sept_2016.indb 43 9/19/16 3:44 PM
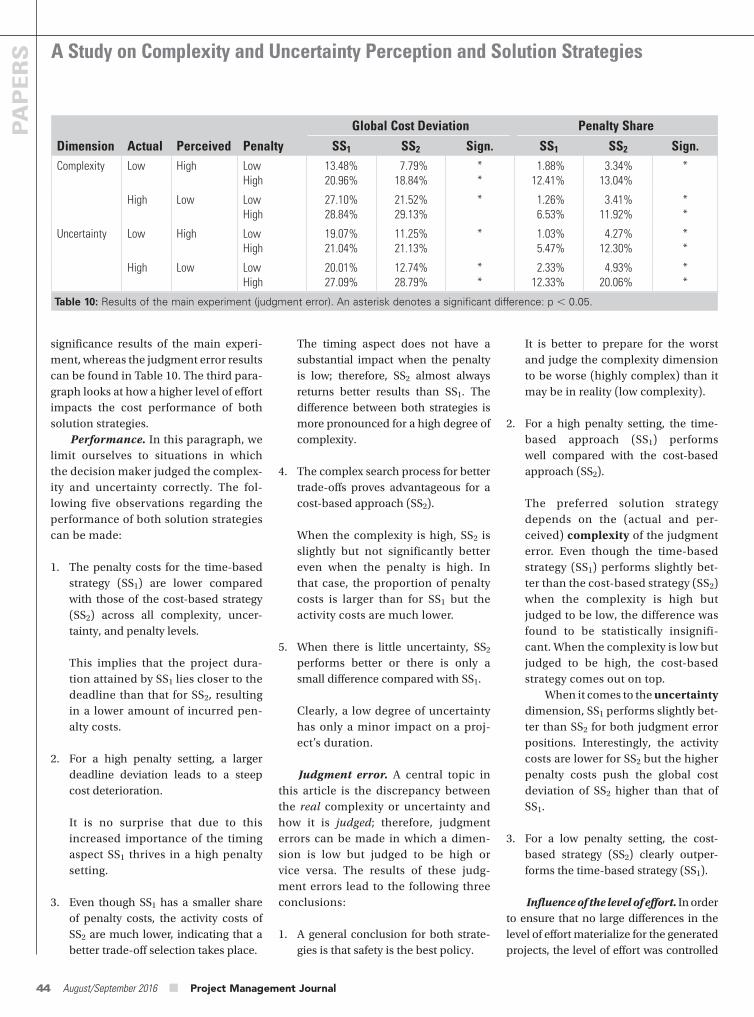
A Study on Complexity and Uncertainty Perception and Solution Strategies
44 August/September 2016 ■ Project Management Journal
PAPERS
It is better to prepare for the worst and judge the complexity dimension to be worse (highly complex) than it may be in reality (low complexity).
2. For a high penalty setting, the time-based approach (SS1) performs well compared with the cost-based approach (SS2).
The preferred solution strategy depends on the (actual and per-ceived) complexity of the judgment error. Even though the time-based strategy (SS1) performs slightly bet-ter than the cost-based strategy (SS2) when the complexity is high but judged to be low, the difference was found to be statistically insignifi-cant. When the complexity is low but judged to be high, the cost-based strategy comes out on top.
When it comes to the uncertainty dimension, SS1 performs slightly bet-ter than SS2 for both judgment error positions. Interestingly, the activity costs are lower for SS2 but the higher penalty costs push the global cost deviation of SS2 higher than that of SS1.
3. For a low penalty setting, the cost-based strategy (SS2) clearly outper-forms the time-based strategy (SS1).
Influence of the level of effort. In order to ensure that no large differences in the level of effort materialize for the generated projects, the level of effort was controlled
significance results of the main experi-ment, whereas the judgment error results can be found in Table 10. The third para-graph looks at how a higher level of effort impacts the cost performance of both solution strategies.
Performance. In this paragraph, we limit ourselves to situations in which the decision maker judged the complex-ity and uncertainty correctly. The fol-lowing five observations regarding the performance of both solution strategies can be made:
1. The penalty costs for the time-based strategy (SS1) are lower compared with those of the cost-based strategy (SS2) across all complexity, uncer-tainty, and penalty levels.
This implies that the project dura-tion attained by SS1 lies closer to the deadline than that for SS2, resulting in a lower amount of incurred pen-alty costs.
2. For a high penalty setting, a larger deadline deviation leads to a steep cost deterioration.
It is no surprise that due to this increased importance of the timing aspect SS1 thrives in a high penalty setting.
3. Even though SS1 has a smaller share of penalty costs, the activity costs of SS2 are much lower, indicating that a better trade-off selection takes place.
The timing aspect does not have a substantial impact when the penalty is low; therefore, SS2 almost always returns better results than SS1. The difference between both strategies is more pronounced for a high degree of complexity.
4. The complex search process for better trade-offs proves advantageous for a cost-based approach (SS2).
When the complexity is high, SS2 is slightly but not significantly better even when the penalty is high. In that case, the proportion of penalty costs is larger than for SS1 but the activity costs are much lower.
5. When there is little uncertainty, SS2 performs better or there is only a small difference compared with SS1.
Clearly, a low degree of uncertainty has only a minor impact on a proj-ect’s duration.
Judgment error. A central topic in this article is the discrepancy between the real complexity or uncertainty and how it is judged; therefore, judgment errors can be made in which a dimen-sion is low but judged to be high or vice versa. The results of these judg-ment errors lead to the following three conclusions:
1. A general conclusion for both strate-gies is that safety is the best policy.
Dimension Actual Perceived Penalty
Global Cost Deviation Penalty Share
SS1 SS2 Sign. SS1 SS2 Sign.Complexity Low High Low
High13.48%20.96%
7.79%18.84%
**
1.88%12.41%
3.34%13.04%
*
High Low LowHigh
27.10%28.84%
21.52%29.13%
* 1.26%6.53%
3.41%11.92%
**
Uncertainty Low High LowHigh
19.07%21.04%
11.25%21.13%
* 1.03%5.47%
4.27%12.30%
**
High Low LowHigh
20.01%27.09%
12.74%28.79%
**
2.33%12.33%
4.93%20.06%
**
Table 10: Results of the main experiment (judgment error). An asterisk denotes a significant difference: p , 0.05.
PMJ_87569728_47_4_Aug_Sept_2016.indb 44 9/19/16 3:44 PM
August/September 2016 ■ Project Management Journal 45
Because heuristics are designed to make a trade-off between effort and accuracy (Gigerenzer & Gaissmaier, 2011), complex situations call for either more advanced solution meth-ods or for an increase in additional resources and managerial attention, as established by Shenhar (2001).
2. The effect of uncertainty greatly depends on its impact.
Uncertainty was defined as a varia-tion in the duration of an activity. Because most variations led to activ-ity delays, a higher degree of uncer-tainty generally led to longer project duration; therefore, a high degree of uncertainty, combined with a severe penalty for deadline overruns, led to steep cost increases.
3. Individuals vary in how they assess complexity and uncertainty.
This variation can be partly due to the experience or capability of the project managers in assessing those contextual factors. In the experi-ment, this was addressed by means of a threshold function, in which the actual and perceived levels of com-plexity and uncertainty were varied. A discrepancy between the actual and perceived levels of complexity or uncertainty led to a judgment error. We came to the conclusion that the direction of judgment errors is crucial. Perceiving a project as highly complex and uncertain, although not true in reality, yields significant advantages compared with the opposite sce-nario. We recommend project man-agers who are incapable of correctly assessing a project’s complexity and/or uncertainty (e.g., through limited information) to err on the safe side.
4. We identified the conditions in which each solution strategy thrives.
The time-based solution strategy per-forms particularly well when deadline
selecting the 25th and 75th percentiles, respectively. Both solution strategies share a decreasing deadline deviation trend as the deadline increases, with-out leading to different conclusions for the overall performance. The SP factor was varied from 0.1 to 0.9 with steps of 0.1. No consistent trend for the solu-tion strategies across the complexity and uncertainty dimensions could be established.
Discussion and ConclusionThree contributions have been made in this article. First, the decisions of stu-dents throughout the Project Scheduling Game were translated into two major solution strategies; these are comprised of five building blocks, namely focus, activity criticality, ranking, intensity, and action. The first solution strategy focuses on time and employs three mechanisms to approach the deadline. The Great-est Rank Positional weight priority rule is used, as well as a buffer based on the slack duration ratio of Hazir et al. (2010), and a final check to protect the deadline is performed. The second solu-tion strategy focuses heavily on costs, at the expense of an increased exposure to risk. The average most expensive prior-ity rule is used to rank activities. Elitism is applied only to accept cost improve-ments, and non-critical activities’ slack is consumed to a larger degree.
Second, complexity and uncertainty were included as contextual factors. The literature overview in the Introduc-tion indicated that these are dominant themes and that a link between com-plexity and project outcome (Hanisch & Wald, 2011) and a continued study of uncertainty (Hall, 2012) were among the challenges for future research. To that end, we have conducted a large computational experiment that allows us to quantify the impact of complexity (Maylor et al., 2008) and uncertainty. The following five conclusions can be drawn from this experiment:
1. A high degree of complexity has a negative effect on the cost deviation.
using focus and intensity. The focus and intensity settings for the baseline scenario were described in the section, “Proposed Strategies.” In this section, the effect of an increased level of effort is studied. Three separate experiments were conducted to study the effect of an increased level of effort on the performance of the solution strategies. The global cost deviations of the three experiments can be found in Table A1 of the Appendix. The main find-ings for each experiment can be summa-rized as follows:
1. Experiment 1 adopted a focus of 100% in absence of any uncertainty (U 0).
The intensity was varied from 0.6 to 1.0 in steps of 0.1. The results indicate that an increased intensity leads to better cost deviations.
2. Experiment 2 adopted an intensity of 100% in absence of any uncertainty (U 0).
The focus was varied from 0.6 to 1.0 in steps of 0.1. Similar to the first experiment, the global cost devi-ation decreased as the focus was increased, but the decrease was less steep compared with the findings of the first experiment.
3. Experiment 3 reintroduced the uncer-tainty settings of the baseline sce-nario, whereas the focus was kept at 100% and the intensity was varied again from 0.6 to 1.0.
Hence, compared with the first experiment, these settings allowed us to explore the influence of the uncer-tainty. As the intensity (and thus the level of effort) increased, the global cost deviation decreased; however, the cost deviations are higher than those of the first experiment, which can be attributed to uncertainty affecting the activity durations.
Finally, we also tested the influ-ence of the deadline and the SP level. The deadline parameter was varied by
PMJ_87569728_47_4_Aug_Sept_2016.indb 45 9/19/16 3:44 PM

A Study on Complexity and Uncertainty Perception and Solution Strategies
46 August/September 2016 ■ Project Management Journal
PAPERS
Demeulemeester, E., De Reyck, B., Foubert, B., Herroelen, W., & Vanhoucke, M. (1998). New computational results on the discrete time/cost trade-off problem in project networks. Journal of the Operational Research Society, 49(11), 1153–1163.
Demeulemeester, E., Elmaghraby, S., & Herroelen, W. (1996). Optimal procedures for the discrete time/cost trade-off problem in project networks. European Journal of Operational Research, 88(1), 50–68.
Dvir, D., Sadeh, A., & Malach-Pines, A. (2006). Projects and project managers: The relationship between project manager’s personality, project, project types, and project success. Project Management Journal, 37(5), 36–48.
Elmaghraby, S. (1977). Activity networks: Project planning and control by network models. New York, NY: John Wiley and Sons, Inc.
Engwall, M., & Westling, G. (2004). Peripety in an R&D drama: Capturing a turnaround in project dynamics. Organization Studies, 25(9), 1557–1578.
Fang, C., & Marle, F. (2012). A simulation-based risk network model for decision support in project risk management. Decision Support Systems, 52(3), 635–644.
Faria, A. (2001). The changing nature of business simulation/gaming research: A brief history. Simulation & Gaming, 32(1), 97–110.
Geraldi, J., & Adlbrecht, G. (2007). On faith, fact and interaction in projects. Project Management Journal, 38(1), 32–43.
Geraldi, J., Maylor, H., & Williams, T. (2011). Now, let’s make it really complex (complicated). International Journal of Operations & Production Management, 31(9), 966–990.
Ghoddousi, P., Eshtehardian, E., Jooybanpour, S., & Javanmardi, A. (2013). Multi-mode resource-constrained discrete time-cost-resource optimization in project scheduling using non-dominated sorting genetic algorithm. Automation in Construction, 30(March), 216–227.
“Fonds voor Wetenschappelijk Onder-zoek (FWO)” under contract number G/0095.10N.
ReferencesAzaron, A., Perkgoz, C., & Sakawa, M. (2005). A genetic algorithm approach for the time-cost trade-off in PERT networks. Applied Mathematics and Computation, 168(2), 1317–1339.
Azaron, A., & Tavakkoli-Moghaddam, R. (2007). Multi-objective time-cost trade-off in dynamic PERT networks using an interactive approach. European Journal of Operational Research, 180(3), 1186–1200.
Bein, W., Kamburowski, J., & Stallmann, M. (1992). Optimal reduction of two-terminal directed acyclic graphs. Siam Journal on Computing, 21(6), 1112–1129.
Bourgeois, L. (1985). Strategic goals, perceived uncertainty, and economic performance in volatile environments. Academy of Management Journal, 28(3), 548–573.
Chang, A. Bordia, P., & Duck, J. (2003). Punctuated equilibrium and linear progression: Toward a new understanding of group development. Academy of Management Journal, 46(1), 106–117.
Cohen, I., Golany, B., & Shtub, A. (2007). The stochastic time-cost tradeoff problem: A robust optimization approach. Networks, 49(2), 175–188.
Crawford, L., Pollack, J., & England, D. (2006). Uncovering the trends in project management: Journal emphases over the last 10 years. International Journal of Project Management, 24(2), 175–184.
De, P., Dunne, E., Ghosh, J., & Wells, C. (1995). The discrete time-cost tradeoff problem revisited. European Journal of Operational Research, 81(2), 225–238.
De, P., Dunne, E., Ghosh, J., & Wells, C. (1997). Complexity of the discrete time/cost trade-off problem for project networks. Operations Research, 45(2), 302–306.
De Reyck, B., & Herroelen, W. (1996). On the use of the complexity index as a measure of complexity in activity networks. European Journal of Operational Research, 91(2), 347–366.
overruns are heavily penalized and in highly uncertain environments. The cost-based solution strategy yields better results in low penalty and highly complex environments.
5. Increasing the level of effort exhibits a positive effect on the capability of the strategies.
In this article, we focused on quan-tifying the effects of complexity and uncertainty on cost outcomes. The limi-tation of this article, therefore, is that little attention was paid to the behavioral and psychological aspects of complexity and uncertainty. For example, one can won-der what the effect of tight deadlines on team motivation is and how this relates to previous research on this topic (Chang, Bordia, & Duck, 2003; Engwall & Westling, 2004). Additionally, demographic vari-ables such as age, background, and proj-ect role (cf. Ojiako et al., 2014) could be included, especially when dealing with complexity and uncertainty judgments.
From a data analysis and model per-spective, two future research avenues can be identified. First of all, although we provided an initial analysis to discern between two major solution strategies, it would be interesting to find out if partic-ipants of the PSG switch between strate-gies throughout the game and by which circumstances this switch is prompted. A similar question arises for niche strat-egies. Second, additional mechanisms can be put into place, which further complicate the decision-making pro-cess. For example, increasing or decreas-ing the time participants have to make decisions throughout the PSG, as well as the presence of a contingency budget, may well lead to different choices. A new round of data collection and modeling should be undertaken to bring this meri-torious extension to fruition.
AcknowledgmentsWe are grateful for the comments made by the editor and referees throughout the review process. Furthermore, we acknowledge the support given by the
PMJ_87569728_47_4_Aug_Sept_2016.indb 46 9/19/16 3:44 PM

August/September 2016 ■ Project Management Journal 47
Nutt, P. (1998). How decision makers evaluate alternative and the influence of complexity. Management Science, 44(8), 1148–1166.
Ojiako, U., Chipulu, M., Gardiner, P., Williams, T., Mota, C., Maguire, S., Shou, Y., & Stamati, T. (2014). Effect of project role, age and gender differences on the formation and revision of project decision judgements. International Journal of Project Management, 32(4), 556–567.
Osman, M. (2010). Controlling uncertainty: A review of human behaviour in complex dynamic environments. Psychological Bulletin, 136(1), 65–86.
Parente, D., Stephan, J., & Brown, R. (2012). Facilitating the acquisition of strategic skills: The role of traditional and soft managerial skills. Management Research Review, 35(11), 1004–1028.
Pascoe, T. (1966). Allocation of resources: CPM. Revue Française de Recherche Op erationnelle, 10(38), 31–38.
Pich, M., Loch, C., & De Meyer, A. (2002). On uncertainty, ambiguity, and complexity in project management. Management Science, 48(8), 1008–1023.
Phillips, S. and Dessouky, M. (1977). Solving the project time/cost tradeoff problem using the minimal cut concept. Management Science, 24(4), 393–400.
Pollack, J. (2007). The changing paradigms of project management. International Journal of Project Management, 25(3), 266–274.
Pour, N., Modarres, M., Aryanejad, M., & Moghadam, R. (2010). The discrete time-cost-quality trade-off problem using a novel hybrid genetic algorithm. Applied Mathematical Sciences, 4(42), 2081–2094.
Robinson, D. (1975). A dynamic programming solution to cost/time trade-off for CPM. Management Science, 22(2), 158–166.
Saunders, P. (1997). Experiential learning, cases, and simulations in business communication. Business Communication Quarterly, 60(1), 97–114.
Schumann, P., Anderson, P., & Scott, T. (1997). Using computer-based simulation exercises to teach business
with time-dependent activity durations. Applied Mathematics and Computation, 218(18), 9462–9469.
Kelley, J. (1961). Critical path planning and scheduling: Mathematical basis. Operations Research, 9(3), 296–320.
Kelley, J., & Walker, M. (1959). Critical path planning and scheduling: An introduction. Ambler, PA: Mauchly Associates.
Klerides, E., & Hadjiconstantinou, E. (2010). A decomposition-based stochastic programming approach for the project scheduling problem under time/cost trade-off settings and uncertain durations. Computers & Operations Research, 37(12), 2131–2140.
Kolb, D. (1984). Experiential learning: Experience as the source of learning and development. New York, NY: Prentice-Hall.
Mastor, A. (1970). An experimental and comparative evaluation of production line balancing techniques. Management Science, 16(11), 728–746.
Maylor, H., Vidgen, R., & Carver, S. (2008). Managerial complexity in project-based operations: A grounded model and its implications for practice. Project Management Journal, 39(S1), S15–S26.
Meyer, W., & Shaffer, L. (1965). Extending CPM for multiform project time-cost curves. Journal of the Construction Division, Proceedings of the ASCE, 91(1), 45–65.
Mintzberg, H., Raisinghani, D., & Theoret, A. (1976). The structure of unstructured decision processes. Administrative Science Quarterly, 21(2), 246–275.
Moder, J., Phillips, C., & Davis, E. (1983). Project management with CPM, PERT and precedence diagramming. New York, NY: Nostrand Reinhold.
Mokhtari, H., Kazemzadeh, R., & Salmasnia, A. (2011). Time-cost tradeoff analysis in project management: An ant system approach. IEEE Transactions on Engineering Management, 58(1), 36–43.
Müller, R., & Turner, J. (2007). Matching the project manager’s leadership style to project type. International Journal of Project Management, 25(1), 21–32.
Gigerenzer, G., & Gaissmaier, W. (2011). Heuristic decision making. Annual Review of Psychology, 62(Jan.), 451–482.
Green, G. (2004). The impact of cognitive complexity on project leadership performance. Information and Software Technology, 46(3), 165–172.
Haapasalo, H., & Hyvönen, J. (2001). Simulating business and operations management: A learning environment for the electronics industry. International Journal of Production Economics, 73(3), 261–272.
Hall, N. (2012). Project management: Recent developments and research opportunities. Journal of Systems Science and Systems Engineering, 21(2), 129–143.
Hanisch, B., & Wald, A. (2011). A project management research framework integrating multiple theoretical perspectives and influencing factors. Project Management Journal, 42(3), 4–22.
Hazir, O., Erel, E., & Günalay, Y. (2011). Robust optimization models for the discrete time/cost trade-off problem. International Journal of Production Economics, 130(1), 87–95.
Hazir, O., Haouari, M., & Erel, E. (2010). Robust scheduling and robustness measures for the discrete time/cost trade-off problem. European Journal of Operations Research, 207(2), 633–643.
Hindelang, T., & Muth, J. (1979). A dynamic programming algorithm for decision CPM networks. Operations Research, 27(2), 225–241.
Howell, D., Windahl, C., & Seidel, R. (2010). A project contingency framework based on uncertainty and its consequences. International Journal of Project Management, 28(3), 256–264.
Jaafari, A. (2003). Project management in the age of complexity and change. Project Management Journal, 34(4), 47–57.
Ke, H., Ma, W., & Ni, Y. (2009). Optimization models and a GA-based algorithm for stochastic time-cost trade-off problem. Applied Mathematics and Computation, 215(1), 308–313.
Ke, H., Ma, W., & Ni, Y. (2012). Modelling stochastic project time-cost trade-offs
PMJ_87569728_47_4_Aug_Sept_2016.indb 47 9/19/16 3:44 PM
A Study on Complexity and Uncertainty Perception and Solution Strategies
48 August/September 2016 ■ Project Management Journal
PAPERS
Yang, L.-R., Huang, C.-F., & Wu, K.-S. (2011). The association among project manager’s leadership style, teamwork and project success. International Journal of Project Management, 29(3), 258–267.
Mathieu Wauters is a Research Assistant in the Operations Management group of the faculty of Economics and Business Administration at Ghent University (Belgium). He obtained a master’s degree in Business Engineering from Ghent University and joined the OR&S group in 2010. Mathieu’s research interest lies in the optimization of time/cost trade-offs in project scheduling and its link to project control using earned value management. He has presented his work at the Project Management and Scheduling Conference and is responsible for the exercise teaching sessions of the Project Management course. He can be contacted at [email protected]
Mario Vanhoucke is a Professor of Business Management and Operations Research at Ghent University (Belgium), Vlerick Leuven Ghent Management School (Belgium, Russia, China) and University College London (United Kingdom). He has a PhD in Operations Management from the University of Leuven (Belgium) and a mas-ter’s degree in Commercial Engineering from the University of Leuven (Belgium). He teaches courses on project management, business statistics, deci-sion sciences for business, and applied operations research.Mario’s main research interest lies in the integration of project scheduling, risk management, and project control using combinatorial optimization models. He is an advisor for several PhD projects, has published papers in various international publications, and is the author of two project management books published by Springer.Mario Vanhoucke is also a founding member and Director of the EVM Europe Association (www.evm-europe.eu). He is also a partner in OR-AS, a company that has released a commercial project management software tool ProTrack 3.0, as well as a research project management software engine P2 Engine. He also works on the online learning tool, PM Knowledge Center. He can be contacted at [email protected]
success factor on projects: A literature review. Project Management Journal, 36(1), 49–61.
Vanhoucke, M. (2010). Using activity sensitivity and network topology information to monitor project time performance. Omega International Journal of Management Science, 38(5), 359–370.
Vanhoucke, M. (2016). Project management knowledge sourcebook: The technical guide to project scheduling, risk and control, 1st ed., Springer, 294 pages.
Vanhoucke, M., Coelho, J., Debels, D., Maenhout, B., & Tavares, L. (2008). An evaluation of the adequacy of project network generators with systematically sampled networks. European Journal of Operational Research, 187(2), 511–524.
Vanhoucke, M., & Debels, D. (2007). The discrete time/cost trade-off problem: Extensions and heuristic procedures. Journal of Scheduling, 10(4–5), 311–326.
Vanhoucke, M., Demeulemeester, E., & Herroelen, W. (2002). Discrete time/cost trade-offs in project scheduling with time-switch constraints. Journal of the Operational Research Society, 53(7), 741–751.
Vanhoucke, M., Vereecke, A., & Gemmel, P. (2005). The project scheduling game (PSG): Simulating time/cost trade-offs in projects. Project Management Journal, 36(1), 51–59.
Vidal, L.-A., & Marle, F. (2008). Understanding project complexity: Implications on project management. Kybernetes, 37(8), 1094–1110.
Walker, M., & Sawyer, J. (1959). Project planning and scheduling. Technical Report Report 6959, E.I. duPont de Nemours and Co., Wilmington, Delaware.
Ward, S., & Chapman, C. (2003). Transforming project risk management into project uncertainty management. International Journal of Project Management, 21(2), 97–105.
Wolfe, J. (1997). The effectiveness of business games in strategic management course work. Simulation & Gaming, 28(4), 360–376.
ethics. Teaching Business Ethics, 1(2), 163–181.
Shenhar, A. (2001). One size does not fit all projects: Exploring classical contingency domains. Management Science, 47(3), 394–414.
Söderlund, J. (2011). Pluralism in project management: Navigating the crossroads of specialization and fragmentation. International Journal of Management Reviews, 13(2), 153–176.
Sommer, S., & Loch, C. (2004). Selectionism and learning in projects with complexity and unforeseeable uncertainty. Management Science, 50(10), 1334–1347.
Sonmez, R., & Bettemir, O. (2012). A hybrid genetic algorithm for the discrete time-cost trade-off problem. Expert Systems with Applications, 39(13), 11428–11434.
Stumpf, S., Dunbar, R., & Mullen, T. (1991). Developing entrepreneurial skills through the use of behavioural simulations. Journal of Management Development, 10(5), 32–45.
Tareghian, H., & Taheri, S. (2006). On the discrete time, cost and quality trade-off problem. Applied Mathematics and Computation, 181(2), 1305–1312.
Tareghian, H., & Taheri, S. (2007). A solution procedure for the discrete time, cost and quality tradeoff problem using electromagnetic scatter search. Applied Mathematics and Computation, 190(2), 1136–1145.
Tavares, L. (1999). Advanced models for project management. Dordrecht, The Netherlands: Kluwer Academic Publishers.
Van Ackere, A., Larsen, E., & Morecroft, J. (1993). Systems thinking and business process redesign: An application to the beer game. European Management Journal, 11(4), 412–423.
Thomas, J., & Mengel, T. (2008). Preparing project managers to deal with complexity: Advanced project management education. International Journal of Project Management, 26(3), 304–315.
Turner, J., & Müller, R. (2005). The project manager’s leadership style as a
PMJ_87569728_47_4_Aug_Sept_2016.indb 48 9/19/16 3:44 PM
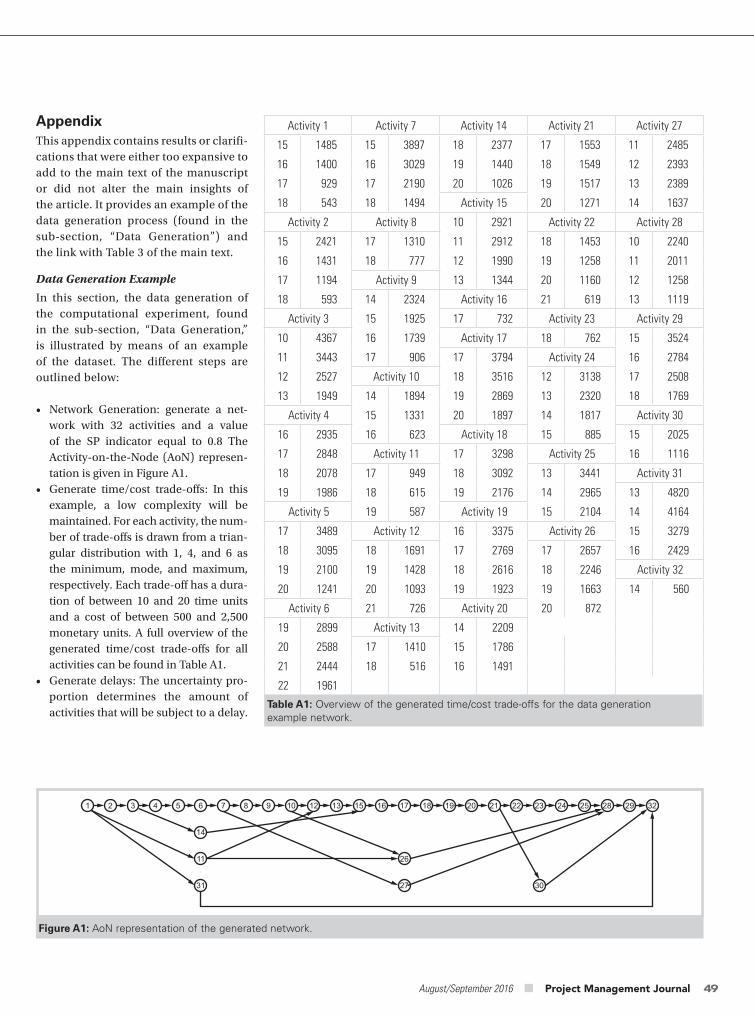
August/September 2016 ■ Project Management Journal 49
AppendixThis appendix contains results or clarifi-cations that were either too expansive to add to the main text of the manuscript or did not alter the main insights of the article. It provides an example of the data generation process (found in the sub-section, “Data Generation”) and the link with Table 3 of the main text.
Data Generation Example
In this section, the data generation of the computational experiment, found in the sub-section, “Data Generation,” is illustrated by means of an example of the dataset. The different steps are outlined below:
• Network Generation: generate a net-work with 32 activities and a value of the SP indicator equal to 0.8 The Activity-on-the-Node (AoN) represen-tation is given in Figure A1.
• Generate time/cost trade-offs: In this example, a low complexity will be maintained. For each activity, the num-ber of trade-offs is drawn from a trian-gular distribution with 1, 4, and 6 as the minimum, mode, and maximum, respectively. Each trade-off has a dura-tion of between 10 and 20 time units and a cost of between 500 and 2,500 monetary units. A full overview of the generated time/cost trade-offs for all activities can be found in Table A1.
• Generate delays: The uncertainty pro-portion determines the amount of activities that will be subject to a delay.
Activity 1 Activity 7 Activity 14 Activity 21 Activity 27
15 1485 15 3897 18 2377 17 1553 11 2485
16 1400 16 3029 19 1440 18 1549 12 2393
17 929 17 2190 20 1026 19 1517 13 2389
18 543 18 1494 Activity 15 20 1271 14 1637
Activity 2 Activity 8 10 2921 Activity 22 Activity 28
15 2421 17 1310 11 2912 18 1453 10 2240
16 1431 18 777 12 1990 19 1258 11 2011
17 1194 Activity 9 13 1344 20 1160 12 1258
18 593 14 2324 Activity 16 21 619 13 1119
Activity 3 15 1925 17 732 Activity 23 Activity 29
10 4367 16 1739 Activity 17 18 762 15 3524
11 3443 17 906 17 3794 Activity 24 16 2784
12 2527 Activity 10 18 3516 12 3138 17 2508
13 1949 14 1894 19 2869 13 2320 18 1769
Activity 4 15 1331 20 1897 14 1817 Activity 30
16 2935 16 623 Activity 18 15 885 15 2025
17 2848 Activity 11 17 3298 Activity 25 16 1116
18 2078 17 949 18 3092 13 3441 Activity 31
19 1986 18 615 19 2176 14 2965 13 4820
Activity 5 19 587 Activity 19 15 2104 14 4164
17 3489 Activity 12 16 3375 Activity 26 15 3279
18 3095 18 1691 17 2769 17 2657 16 2429
19 2100 19 1428 18 2616 18 2246 Activity 32
20 1241 20 1093 19 1923 19 1663 14 560
Activity 6 21 726 Activity 20 20 872
19 2899 Activity 13 14 2209
20 2588 17 1410 15 1786
21 2444 18 516 16 1491
22 1961
Table A1: Overview of the generated time/cost trade-offs for the data generation example network.
Figure A1: AoN representation of the generated network.
1 2 3 4 5 6
14
11
31
26
27 30
7 8 9 10 12 13 15 16 17 18 19 20 21 22 23 24 25 28 29 32
PMJ_87569728_47_4_Aug_Sept_2016.indb 49 9/19/16 3:44 PM
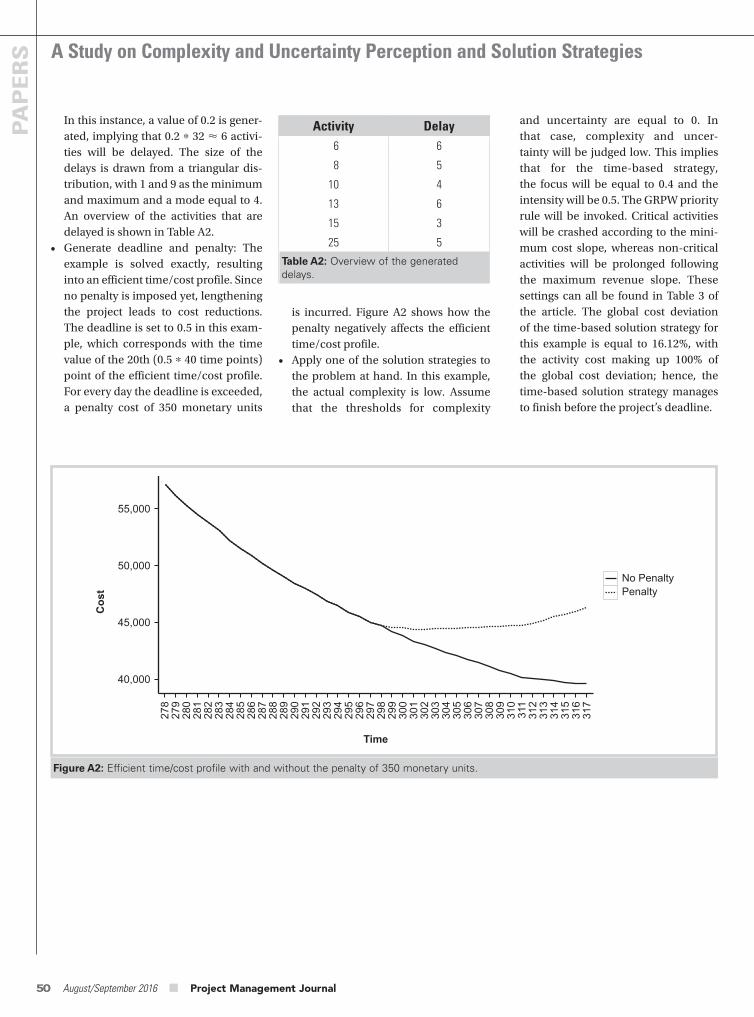
A Study on Complexity and Uncertainty Perception and Solution Strategies
50 August/September 2016 ■ Project Management Journal
PAPERS
In this instance, a value of 0.2 is gener-ated, implying that 0.2 32 6 activi-ties will be delayed. The size of the delays is drawn from a triangular dis-tribution, with 1 and 9 as the minimum and maximum and a mode equal to 4. An overview of the activities that are delayed is shown in Table A2.
• Generate deadline and penalty: The example is solved exactly, resulting into an efficient time/cost profile. Since no penalty is imposed yet, lengthening the project leads to cost reductions. The deadline is set to 0.5 in this exam-ple, which corresponds with the time value of the 20th (0.5 40 time points) point of the efficient time/cost profile. For every day the deadline is exceeded, a penalty cost of 350 monetary units
Activity Delay 6 6
8 5
10 4
13 6
15 3
25 5
Table A2: Overview of the generated delays.
is incurred. Figure A2 shows how the penalty negatively affects the efficient time/cost profile.
• Apply one of the solution strategies to the problem at hand. In this example, the actual complexity is low. Assume that the thresholds for complexity
and uncertainty are equal to 0. In that case, complexity and uncer-tainty will be judged low. This implies that for the time-based strategy, the focus will be equal to 0.4 and the intensity will be 0.5. The GRPW priority rule will be invoked. Critical activities will be crashed according to the mini-mum cost slope, whereas non-critical activities will be prolonged following the maximum revenue slope. These settings can all be found in Table 3 of the article. The global cost deviation of the time-based solution strategy for this example is equal to 16.12%, with the activity cost making up 100% of the global cost deviation; hence, the time-based solution strategy manages to finish before the project’s deadline.
Figure A2: Efficient time/cost profile with and without the penalty of 350 monetary units.
40,000
45,000
50,000
55,000
278
279
280
281
282
283
284
285
286
287
288
289
290
291
292
293
294
295
296
297
317
300
304
308
312
314
302
306
310
315
298
299
303
307
311
313
301
305
309
316
Time
Cost
No PenaltyPenalty
PMJ_87569728_47_4_Aug_Sept_2016.indb 50 9/19/16 3:44 PM
August/September 2016 ■ Project Management Journal 51
PA
PE
RS The Impact of Residual Risk and
Resultant Problems on Information Systems Development Project PerformanceRussell Purvis, Clemson University, Clemson, South CarolinaRaymond M. Henry, Cleveland State University, Cleveland, OhioStefan Tams, HEC Montreal, Montreal, CanadaVarun Grover, Clemson University, Clemson, South CarolinaJohn D. McGregor, Clemson University, Clemson, South CarolinaSteve Davis, Clemson University, Clemson, South Carolina
INTRODUCTION
A recent review of over 50 years of project management journals, texts, curricula, and professional literature, supplemented with interviews with project managers, found project risk management to be institutionalized and a norm within the information systems
(IS) field (Mignerat & Rivard 2012). Yet, the expense and opportunity lost from information systems development (ISD) projects that completely fail or miss critical objectives on schedule, budget, and/or scope are well established (Standish Report, 2014). A summary of the ten most infamous IT project failures within both the public and private sectors highlights that failure in ISD projects is not a result of chance (Nelson & Jansen, 2007); rather these failures are caused by classic project management mistakes, one of which is failure in risk management (Nelson & Jansen, 2007).
So how can such an apparent paradox of findings coexist? How can risk management be an institutional norm within the IS community of practitio-ners, yet ISD projects continue to fail to meet common objectives in schedule, budget, quality, and scope? One potential reason for this is that, while risk management is institutionalized and practiced within the community, risk still remains after risk response strategies have been implemented (Bakker, Boonstra, & Wortmann, 2010). Past research has defined residual risk as risk that exists in the later stages of an ISD project that impact project success (e.g., Jiang, Klein, & Chen, 2006; Na, Li, Simpson, & Kim, 2004; Nidumolo, 1995). This definition assumes, however, that a full cadre of risk intervention strategies were implemented within the project that other research has found is not always true (Bakker et al., 2010).
Consequently, this research considers risk existing after the implementa-tion of a robust inventory of risk response strategies within ISD projects and whether this residual risk has a negative impact on project performance. An extensive array of risk intervention actions are considered, which can be taken by the project team in both the planning and development of ISD projects to eliminate, mitigate, or transfer negative risks (Project Management Institute, 2013; Lyytinen, Mathiassen, & Ropponen, 1998). Another contribution is that this research considers four systemic categories of risks as antecedents
ABSTRACT ■
The research presented in this article con-
siders how residual risk impacts project
performance and: (1) evaluates the impact
of specific categories of residual risks (actor,
technology, task, and structure) on project
performance; and (2) demonstrates the medi-
ation role of categorical problems caused by
residual risk on project performance. Data
from 92 projects analyzed using partial least
squares found support for mediation, and
not direct effects between: (1) actor project
problems and the effects of actor residual
risk; (2) task project problems and the effects
of task residual risk; and (3) technology proj-
ect problems and the effects of technology
residual risk on information systems devel-
opment (ISD) project performance.
KEYWORDS: residual risk; risk categories;
risk problems; project performance;
information systems development projects
Project Management Journal, Vol. 47, No. 4, 51–67
© 2016 by the Project Management Institute
Published online at www.pmi.org/PMJ
PMJ_87569728_47_4_Aug_Sept_2016.indb 51 9/19/16 3:44 PM
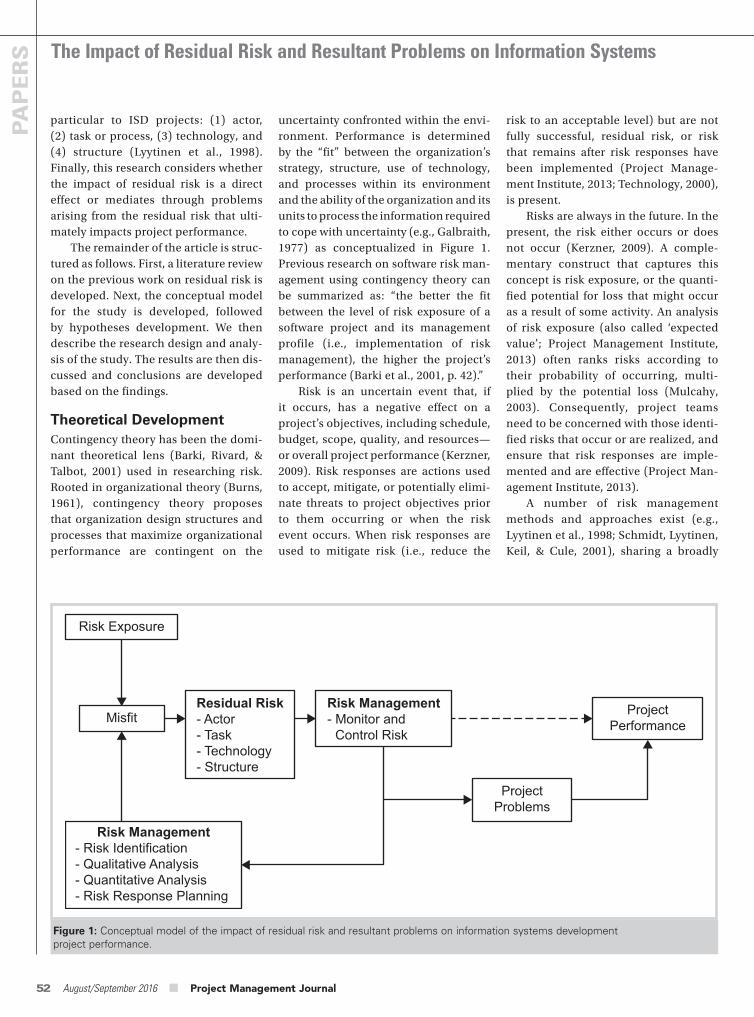
52 August/September 2016 ■ Project Management Journal
PAPERS The Impact of Residual Risk and Resultant Problems on Information Systems
risk to an acceptable level) but are not fully successful, residual risk, or risk that remains after risk responses have been implemented (Project Manage-ment Institute, 2013; Technology, 2000), is present.
Risks are always in the future. In the present, the risk either occurs or does not occur (Kerzner, 2009). A comple-mentary construct that captures this concept is risk exposure, or the quanti-fied potential for loss that might occur as a result of some activity. An analysis of risk exposure (also called ‘expected value’; Project Management Institute, 2013) often ranks risks according to their probability of occurring, multi-plied by the potential loss (Mulcahy, 2003). Consequently, project teams need to be concerned with those identi-fied risks that occur or are realized, and ensure that risk responses are imple-mented and are effective (Project Man-agement Institute, 2013).
A number of risk management methods and approaches exist (e.g., Lyytinen et al., 1998; Schmidt, Lyytinen, Keil, & Cule, 2001), sharing a broadly
uncertainty confronted within the envi-ronment. Performance is determined by the “fit” between the organization’s strategy, structure, use of technology, and processes within its environment and the ability of the organization and its units to process the information required to cope with uncertainty (e.g., Galbraith, 1977) as conceptualized in Figure 1. Previous research on software risk man-agement using contingency theory can be summarized as: “the better the fit between the level of risk exposure of a software project and its management profile (i.e., implementation of risk management), the higher the project’s performance (Barki et al., 2001, p. 42).”
Risk is an uncertain event that, if it occurs, has a negative effect on a project’s objectives, including schedule, budget, scope, quality, and resources—or overall project performance (Kerzner, 2009). Risk responses are actions used to accept, mitigate, or potentially elimi-nate threats to project objectives prior to them occurring or when the risk event occurs. When risk responses are used to mitigate risk (i.e., reduce the
particular to ISD projects: (1) actor, (2) task or process, (3) technology, and (4) structure (Lyytinen et al., 1998). Finally, this research considers whether the impact of residual risk is a direct effect or mediates through problems arising from the residual risk that ulti-mately impacts project performance.
The remainder of the article is struc-tured as follows. First, a literature review on the previous work on residual risk is developed. Next, the conceptual model for the study is developed, followed by hypotheses development. We then describe the research design and analy-sis of the study. The results are then dis-cussed and conclusions are developed based on the findings.
Theoretical DevelopmentContingency theory has been the domi-nant theoretical lens (Barki, Rivard, & Talbot, 2001) used in researching risk. Rooted in organizational theory (Burns, 1961), contingency theory proposes that organization design structures and processes that maximize organizational performance are contingent on the
Figure 1: Conceptual model of the impact of residual risk and resultant problems on information systems development project performance.
Misfit
Risk Exposure
Risk Management- Risk Identification- Qualitative Analysis- Quantitative Analysis- Risk Response Planning
- Actor- Task- Technology- Structure
Residual Risk
ProjectProblems
ProjectPerformance
Risk Management- Monitor and Control Risk
PMJ_87569728_47_4_Aug_Sept_2016.indb 52 9/19/16 3:44 PM
August/September 2016 ■ Project Management Journal 53
strategies and techniques. To resolve this limitation, Lyytinen et al. (1998) used the socio-technical change model to develop “a more systematic account of risk management” (p. 234). The model consists of four constructs: actor, technology, task, and structure in a diamond shape, with arrows in the model emphasizing the dynamic and first and second-order interdependence between the four variables (Leavitt, 1964). Consequently, planned changes and interventions to one variable may result in one or more other variables being impacted as well. This model pro-vides a useful categorization of software risks and risk drivers as well as perfor-mance risk in analyzing four authorita-tive approaches to risk management that provide specific prescriptive stan-dards to risk management (Lyytinen et al., 1998). These categories offer a useful lens for this study in understand-ing the various types of residual risk that impact ISD projects.
Table 1 summarizes the research in the area of residual risk, which has defined the construct as the “extent of perfor-mance risk present in the later stages of the project after project planning and requirements analysis have been com-pleted (i.e., during design, coding, test-ing, and implementation) (Nidumolo, 1995, p. 195).” While informative, previ-ous research on residual risk assumes that the project manager and project team have effectively identified, ana-lyzed, and implemented risk response strategies within the early stages of the project. Risk management is difficult, however—“and not a natural act for humans to perform” (Kaplan & Mikes, 2012). Research on the effective use of risk management suggests that this is a questionable assumption, because risk management is inherently “under-performed” in practice (e.g., Banner-man, 2008). Project managers often struggle with a myriad of issues, includ-ing lack of time, lack of information to analyze risk, and lack of expertise for effective implementation, among oth-ers (Kutsch & Hall, 2009). Further, there
into the budget, schedule, and project management plan to mitigate or elimi-nate the risk. In addition, risk owners are identified and their responsibilities are defined should the risk occur (e.g., Project Management Institute, 2013; Li, 2013). All of the processes discussed above occur during project planning. During project execution, project man-agers focus on risk monitoring and con-trol. Risk monitoring and control is a process that consists of three activi-ties: implementing risk response plans should risks occur, tracking progress of the risk responses, and evaluating risk process effectiveness (e.g., Project Man-agement Institute, 2013; Li, 2013).
Reviewing the conceptual model, one can envision how risk response strategies could develop residual risk. First, the organization can miss a risk during risk identification. Second, a project team could under-estimate the probability and/or impact of the project to a risk dur-ing risk analysis. Third, the organization could implement a mitigation strategy that, due to the project and risk context, is designed to only lower probability or impact, not eliminate the risk (Project Management Institute, 2013). Fourth, the organization can have a risk response that is inadequate for the risk exposure. Fifth, the risk response strategy could be poorly implemented for the risks to which the project is exposed. Sixth, there are often compounding effects between risks (i.e., one risk can have multiple impacts) that could be missed. Seventh, another risk (secondary risk) could arise due to the implementation of a risk strategy (Project Management Institute, 2013). Finally, though not exhaustive, the risk monitoring and controlling process could be inadequately performed and expose the project to avoidable risks or not identify variances and trends that are critical to successful risk management (e.g., Project Management Institute, 2013; Li, 2013).
Performance Impact of Residual Risk
There was a void in the development of theory to understand these various
common set of sequential, inter-related processes to develop a risk management plan (Powell & Klein, 1996). The meth-ods offer more than approaches to risk management because they formalize decision making, ensure disciplined and holistic thinking, encourage involvement by key personnel, and generate atten-tion and commitment (Powell & Klein, 1996). The first process, risk identifica-tion, produces lists of potential project-specific risks (Schmidt et al., 2001). Risk identification can be assisted by a number of tools and techniques, includ-ing checklists; diagramming techniques, such as cause-and-effect diagrams and process flow charts; brainstorming-type approaches; and expert judgment, among others (e.g., Project Manage-ment Institute, 2013; Powell & Klein, 1996). Importantly, this process stimu-lates attention-shaping behaviors, using these risk items to focus managerial cognition to assess their project envi-ronment (Lyytinen et al., 1998). The second process, qualitative risk analy-sis, focuses on a timely prioritization of potential individual risk probabilities and impacts. This process is a subjective evaluation using additional techniques to analyze and organize potential risks in terms of urgency and type to ensure limited time is spent on those risks that possess the highest expected value of negative impact (e.g., Project Manage-ment Institute, 2013; Powell & Klein, 1996). Quantitative analysis is a more objective process of analysis attempt-ing to measure probability and impact (e.g., Project Management Institute, 2013; Powell & Klein, 1996). Quantita-tive analysis uses techniques such as sensitivity analysis, causal modeling, and simulation to shape attention to translate uncertainties into potential impact on project objectives (e.g., Proj-ect Management Institute, 2013; Pow-ell & Klein, 1996). Next, risk response planning is the process of developing options and actions to reduce, if not eliminate, negative threats to project objectives. This includes incorporat-ing additional resources and activities
PMJ_87569728_47_4_Aug_Sept_2016.indb 53 9/19/16 3:44 PM
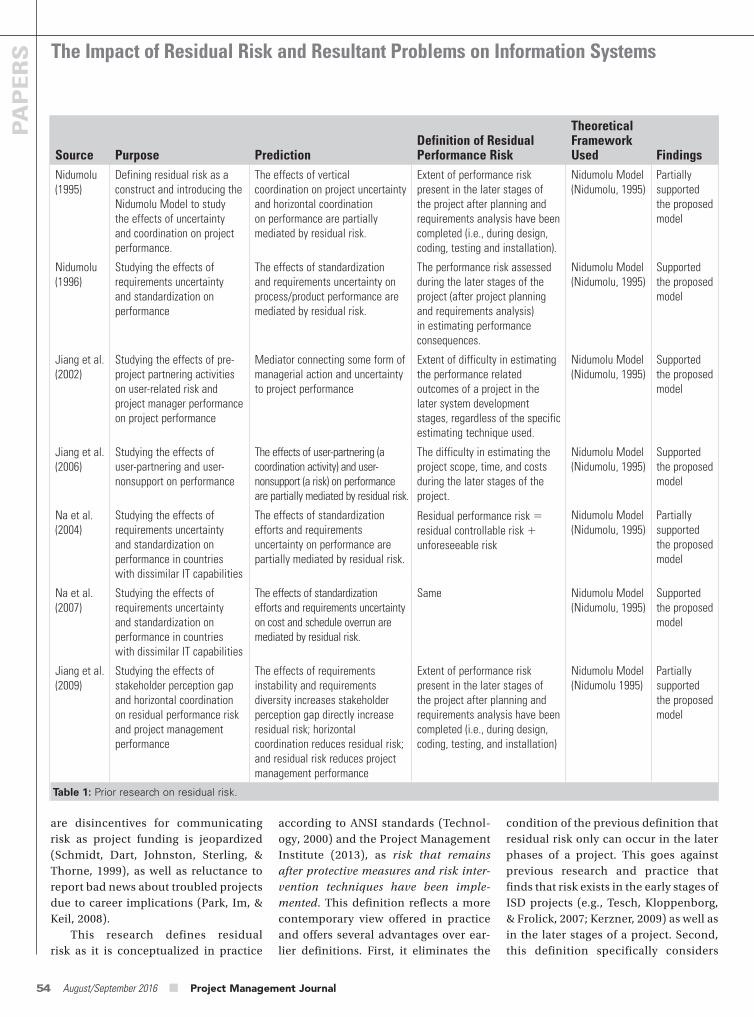
The Impact of Residual Risk and Resultant Problems on Information Systems
54 August/September 2016 ■ Project Management Journal
PAPERS
Source Purpose PredictionDefinition of Residual Performance Risk
Theoretical Framework Used Findings
Nidumolu (1995)
Defining residual risk as a construct and introducing the Nidumolu Model to study the effects of uncertainty and coordination on project performance.
The effects of vertical coordination on project uncertainty and horizontal coordination on performance are partially mediated by residual risk.
Extent of performance risk present in the later stages of the project after planning and requirements analysis have been completed (i.e., during design, coding, testing and installation).
Nidumolu Model (Nidumolu, 1995)
Partially supported the proposed model
Nidumolu (1996)
Studying the effects of requirements uncertainty and standardization on performance
The effects of standardization and requirements uncertainty on process/product performance are mediated by residual risk.
The performance risk assessed during the later stages of the project (after project planning and requirements analysis) in estimating performance consequences.
Nidumolu Model (Nidumolu, 1995)
Supported the proposed model
Jiang et al. (2002)
Studying the effects of pre-project partnering activities on user-related risk and project manager performance on project performance
Mediator connecting some form of managerial action and uncertainty to project performance
Extent of difficulty in estimating the performance related outcomes of a project in the later system development stages, regardless of the specific estimating technique used.
Nidumolu Model (Nidumolu, 1995)
Supported the proposed model
Jiang et al. (2006)
Studying the effects of user-partnering and user-nonsupport on performance
The effects of user-partnering (a coordination activity) and user-nonsupport (a risk) on performance are partially mediated by residual risk.
The difficulty in estimating the project scope, time, and costs during the later stages of the project.
Nidumolu Model (Nidumolu, 1995)
Supported the proposed model
Na et al. (2004)
Studying the effects of requirements uncertainty and standardization on performance in countries with dissimilar IT capabilities
The effects of standardization efforts and requirements uncertainty on performance are partially mediated by residual risk.
Residual performance risk residual controllable risk 1 unforeseeable risk
Nidumolu Model (Nidumolu, 1995)
Partially supported the proposed model
Na et al. (2007)
Studying the effects of requirements uncertainty and standardization on performance in countries with dissimilar IT capabilities
The effects of standardization efforts and requirements uncertainty on cost and schedule overrun are mediated by residual risk.
Same Nidumolu Model (Nidumolu, 1995)
Supported the proposed model
Jiang et al. (2009)
Studying the effects of stakeholder perception gap and horizontal coordination on residual performance risk and project management performance
The effects of requirements instability and requirements diversity increases stakeholder perception gap directly increase residual risk; horizontal coordination reduces residual risk; and residual risk reduces project management performance
Extent of performance risk present in the later stages of the project after planning and requirements analysis have been completed (i.e., during design, coding, testing, and installation)
Nidumolu Model (Nidumolu 1995)
Partially supported the proposed model
Table 1: Prior research on residual risk.
are disincentives for communicating risk as project funding is jeopardized (Schmidt, Dart, Johnston, Sterling, & Thorne, 1999), as well as reluctance to report bad news about troubled projects due to career implications (Park, Im, & Keil, 2008).
This research defines residual risk as it is conceptualized in practice
according to ANSI standards (Technol-ogy, 2000) and the Project Management Institute (2013), as risk that remains after protective measures and risk inter-vention techniques have been imple-mented. This definition reflects a more contemporary view offered in practice and offers several advantages over ear-lier definitions. First, it eliminates the
condition of the previous definition that residual risk only can occur in the later phases of a project. This goes against previous research and practice that finds that risk exists in the early stages of ISD projects (e.g., Tesch, Kloppenborg, & Frolick, 2007; Kerzner, 2009) as well as in the later stages of a project. Second, this definition specifically considers
PMJ_87569728_47_4_Aug_Sept_2016.indb 54 9/19/16 3:44 PM
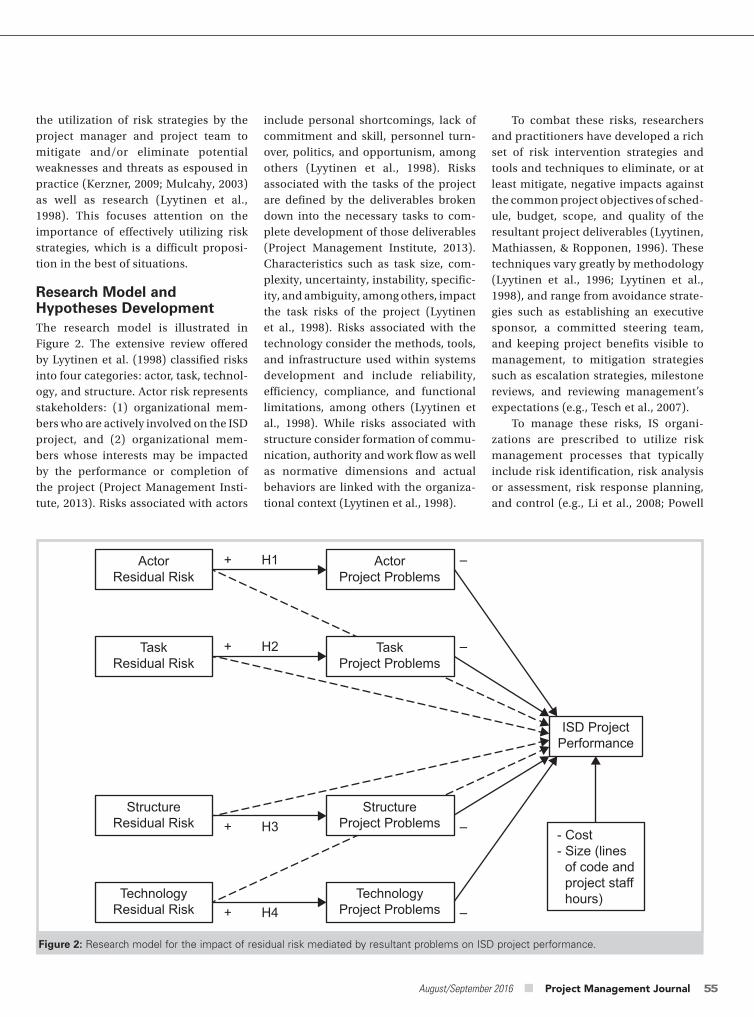
August/September 2016 ■ Project Management Journal 55
To combat these risks, researchers and practitioners have developed a rich set of risk intervention strategies and tools and techniques to eliminate, or at least mitigate, negative impacts against the common project objectives of sched-ule, budget, scope, and quality of the resultant project deliverables (Lyytinen, Mathiassen, & Ropponen, 1996). These techniques vary greatly by methodology (Lyytinen et al., 1996; Lyytinen et al., 1998), and range from avoidance strate-gies such as establishing an executive sponsor, a committed steering team, and keeping project benefits visible to management, to mitigation strategies such as escalation strategies, milestone reviews, and reviewing management’s expectations (e.g., Tesch et al., 2007).
To manage these risks, IS organi-zations are prescribed to utilize risk management processes that typically include risk identification, risk analysis or assessment, risk response planning, and control (e.g., Li et al., 2008; Powell
include personal shortcomings, lack of commitment and skill, personnel turn-over, politics, and opportunism, among others (Lyytinen et al., 1998). Risks associated with the tasks of the project are defined by the deliverables broken down into the necessary tasks to com-plete development of those deliverables (Project Management Institute, 2013). Characteristics such as task size, com-plexity, uncertainty, instability, specific-ity, and ambiguity, among others, impact the task risks of the project (Lyytinen et al., 1998). Risks associated with the technology consider the methods, tools, and infrastructure used within systems development and include reliability, efficiency, compliance, and functional limitations, among others (Lyytinen et al., 1998). While risks associated with structure consider formation of commu-nication, authority and work flow as well as normative dimensions and actual behaviors are linked with the organiza-tional context (Lyytinen et al., 1998).
the utilization of risk strategies by the project manager and project team to mitigate and/or eliminate potential weaknesses and threats as espoused in practice (Kerzner, 2009; Mulcahy, 2003) as well as research (Lyytinen et al., 1998). This focuses attention on the importance of effectively utilizing risk strategies, which is a difficult proposi-tion in the best of situations.
Research Model and Hypotheses DevelopmentThe research model is illustrated in Figure 2. The extensive review offered by Lyytinen et al. (1998) classified risks into four categories: actor, task, technol-ogy, and structure. Actor risk represents stakeholders: (1) organizational mem-bers who are actively involved on the ISD project, and (2) organizational mem-bers whose interests may be impacted by the performance or completion of the project (Project Management Insti-tute, 2013). Risks associated with actors
Figure 2: Research model for the impact of residual risk mediated by resultant problems on ISD project performance.
ActorResidual Risk
+ H1
+ H2
+
–
–
–
–
H3
+ H4
TaskResidual Risk
StructureResidual Risk
TechnologyResidual Risk
ActorProject Problems
TaskProject Problems
ISD ProjectPerformance
- Cost- Size (lines of code and project staff hours)
StructureProject Problems
TechnologyProject Problems
PMJ_87569728_47_4_Aug_Sept_2016.indb 55 9/19/16 3:44 PM
The Impact of Residual Risk and Resultant Problems on Information Systems
56 August/September 2016 ■ Project Management Journal
PAPERS
Consequently, project managers have a host of risk management strate-gies and techniques to combat such risks, which include staffing top tal-ent, seeking champions for the project, morale building, managing expecta-tions, training, using participative techniques, and using team-building programs, among others (Lyytinen et al., 1998). As discussed earlier, however, these techniques are rarely completely effective, leading to actor problems even after implementing risk management techniques; therefore, it is hypothesized:
H1: Actor project problems will mediate the effects of actor residual risk on ISD project performance.
Another component of the socio-technical system is the task. In proj-ect management, complex projects (i.e., ISD projects) are managed by breaking down the overall project ultimately into individual, discrete components comprised of tasks. This hierarchical decomposition provides the necessary framework for detailed cost estimating and control (Kerzner, 2009; Whitten, 2007). Task risks are typi-cally broken down into: (1) complexity, indicated by the project size and novelty of the functions to be developed; and (2) uncertainty signified by the ambi-guity and equivocality of the system and its functions, and the dynamism of the requirements that ultimately trickle down to the tasks (Lyytinen et al., 1996; Lyytinen et al., 1998).
As mentioned, the logical decom-position of the project into tasks is the first line of risk resolution techniques associated with task risk (Lyytinen et al., 1996; Lyytinen et al., 1998). Other resolution techniques include user participation techniques, man-aging scope change, use of pilots to demonstrate the system, and system testing among others (Lyytinen et al., 1998). Again, these techniques are usu-ally not totally effective, leading to task problems even after implementing
for this idea, and sophisticated methods of modeling (Aloini, Dulmin, & Mininno, 2012) and simulation (Houston, Mackulak, & Collofello, 2001) have been proposed for considering the interdependence between risks as well as risks and their effects (or problems). Consequently, this research considers whether residual risk has a direct effect on project performance, or whether this interdependence between residual risks within the various categories will be mediated by the problems that arise from the various residual risks that impact project performance.
Residual Risk and Ensuing Problems
The risk categories defined by Lyytinen et al. (1998) are based on the socio-technical model. The socio-technical model has been a seminal compo-nent of understanding ISD for decades (e.g., Bostrom & Heinen, 1977a, 1977b). The theory views an information system composed of two independent, correla-tive interacting systems. The technical system is “concerned with the processes, tasks, and technology needed to trans-form inputs to outputs. The social sys-tem is concerned with the attributes of people (e.g., attitudes, skills, and val-ues), the relationships among people, reward systems, and authority structures (Bostrom & Heinen, 1977a, p. 17).”
Project failures and the related risks associated with people within the social system (i.e., actors) are infa-mous within ISD projects (Nelson & Jansen, 2007, 2009). Actors include a broad range of stakeholders, including end users, sponsors, business man-agers, and corresponding technical specialists. The risk category includes a host of issues related to the vari-ous stakeholders within an ISD proj-ect (e.g., attitudes, motivations, skills, and knowledge). Risks within this area include turnover; unwillingness to par-ticipate; poor or inappropriate skills and/or experience; as well as political conflicts and power plays, irresponsi-bility, and poor goals, among others (Lyytinen et al., 1998).
& Klein, 1996; Tesch et al., 2007). Proj-ects follow through various processes of project management as the effort is initiated, planned, executed, moni-tored and controlled, and closed out (Nidumolo, 1995, 1996). Within these processes, project risks are identified, analyzed (qualitatively and quantita-tively), and risk responses are devel-oped for negative risks that exceed acceptable thresholds that consider both the risk probability and impact (e.g., Project Management Institute, 2013). To mitigate, if not eliminate such risks project managers apply risk inter-vention and risk response techniques throughout the project. ISD projects have become larger and more complex, however, and IS organizations are also becoming more sophisticated in man-aging risk (see Lyytinen et al., 1998, for an extensive review of the various risk management models and intervention and resolution techniques).
Because of the growing size and sophistication of ISD projects, risk response strategies are rarely fully suc-cessful (Bannerman, 2008; Kutsch & Hall, 2009; Park, Im, & Keil, 2008; Schmidt, 1999). When controllable risk is miti-gated residual risk remains; however, while some residual risk will be elimi-nated through successful fallback plans (e.g., a “work-around” is additional work not planned in advance) or through use of contingency reserve (Project Man-agement Institute, 2013; Kerzner, 2009; Whitten & Bentley, 2007), there will be residual risk that remains to plague the ISD project.
In further contrast to previous research that has considered the direct effect of residual risk on project per-formance (Jiang et al., 2006; Na et al., 2004, 2007; Nidumolo, 1995, 1996), this research considers the interdepen-dency of risks and problems created by the residual risks. Chapman and Ward (2003) find superficial risk analysis that fails to consider risk interdependence as the most common shortcoming lead-ing to failure in risk management. Past research provides ancillary support
PMJ_87569728_47_4_Aug_Sept_2016.indb 56 9/19/16 3:44 PM
August/September 2016 ■ Project Management Journal 57
conduct ISD projects on a regular basis, so this process continued to cascade out to six local chapters in the south-eastern part of the United States. These contacts were then asked to respond to the survey, or if it was an organization that was identified, to find an appro-priate project manager within the IS area working on development projects. Information about the organization and its projects was requested, which enabled us to target medium- to large-sized firms within the southeast part of the United States that performed a variety of ISD projects. We attempted to identify ISD projects that varied in size and complexity and potentially varying amounts of risk. A total of 187 surveys were sent to targeted organizations and 92 usable questionnaires were returned. This equates to approximately a 49% response rate, which is comparable if not higher than most other IS survey response rates (Ravichandran & Rai, 2000; Ravichandran & Rai, 1999).
Survey respondents were asked to provide the following: (1) information about the company (e.g., software-oriented phases completed with the company); (2) control variable informa-tion (e.g., number of employees in your entire company, number of employ-ees involved in software development, annual revenue of your entire com-pany, number of software projects your company commissions in a year, size (person-months) of your company’s largest software project, size (person-months) of a typical project; (3) sur-vey respondents were asked “to identify ONE major project at your firm that: (a) involves some software develop-ment, (b) is complete (i.e., has resulted in the first release of software OR has been terminated), and (c) is one with which you are intimately familiar” and provide the information on the research constructs as given in the Appendix; and, finally (4) brief demographic information on the respondent (e.g., our current title, years in current posi-tion, and years of experience as an IS professional).
techniques are available, including specification standards and methods, task and organizational analysis tech-niques, benchmarking, and prototyp-ing (Lyytinen et al., 1998). As with the other categories, however, problems will persist even after risk resolution tech-niques; therefore, it is hypothesized:
H4: Technology project problems will mediate the effects of technology residual risk on ISD project performance.
While this research focuses on the first order effects of the risk categories, Lyytinen et al. (1998) also considers the interdependencies between actors, task, structure, and technology. The risk management techniques for these inter-dependencies are considered within the risk resolution techniques. Finally, since size and complexity are impor-tant determinants of uncertainty and risk we controlled for project cost and project size (measured as lines of code and project-person hours). Following we describe the research methodology used to test these hypotheses.
RESEARCH METHODOLOGYSurvey data were used for testing the research model. Project managers of software development projects were targeted as respondents because they were the most familiar with proj-ect activities and risks within a proj-ect (Jiang et al., 2006; Na et al., 2004; Nidumolo, 1995). Because of the speci-ficity of software development projects, the need for using risk management processes, and the length of the sur-vey, a purposive sample strategy was used to target individuals with proj-ect management responsibilities in ISD projects. Initially, surveys were given at a conference attended by practicing project managers with limited success. Additional data gathering occurred at PMI chapters in the Southeast to iden-tify members or organizations that con-duct ISD projects on a regular basis. Local chapters had limited success in finding members or organizations who
resolution techniques; therefore, it is hypothesized:
H2: Task project problems will mediate the effects of task residual risk on ISD project performance.
The third component of the socio-technical system is structure, composed of systems of communication, authority, and work flow (Leavitt, 1964; Lyytinen et al., 1996). This category is more at the project or organizational level and includes the dynamics at the team level (e.g., team development, communica-tion skills, and conflict management) as well as organizational level factors that impact individual efforts (e.g., orga-nizational climate, top management support, and resource availability; e.g., Curtis Krasner, & Iscoe, 1988; Nelson, 1990). There are numerous risk reso-lution techniques within this category to (1) improve communications (e.g., user participation, user-led teams, and focusing on critical task topics); (2) re-organize for less risk (e.g., the proj-ect organization, outsource, and using formal procedures); and (3) improve the work flow (e.g., pre-scheduling, cost and schedule estimation techniques, use of incremental approaches) (Lyytinen et al., 1996; Lyytinen et al., 1998). How-ever, problems will often persist even after risk resolution techniques; there-fore, it is hypothesized:
H3: Structure project problems will medi-ate the effects of structure residual risk in ISD project performance.
The final component of the socio-technical system is technology or “the development tools and platform (Lyytinen et al., 1998, p. 238)” and includes the methods and infrastructure used to create as well as implement the information system (Lyytinen et al., 1998). These technologies, combined with a lack of discipline and standard-ization and overall immaturity, carry considerable risks (Kishore, Jackson, & Rao, 2012). As with the other cat-egories, a wide range of risk resolution
PMJ_87569728_47_4_Aug_Sept_2016.indb 57 9/19/16 3:44 PM
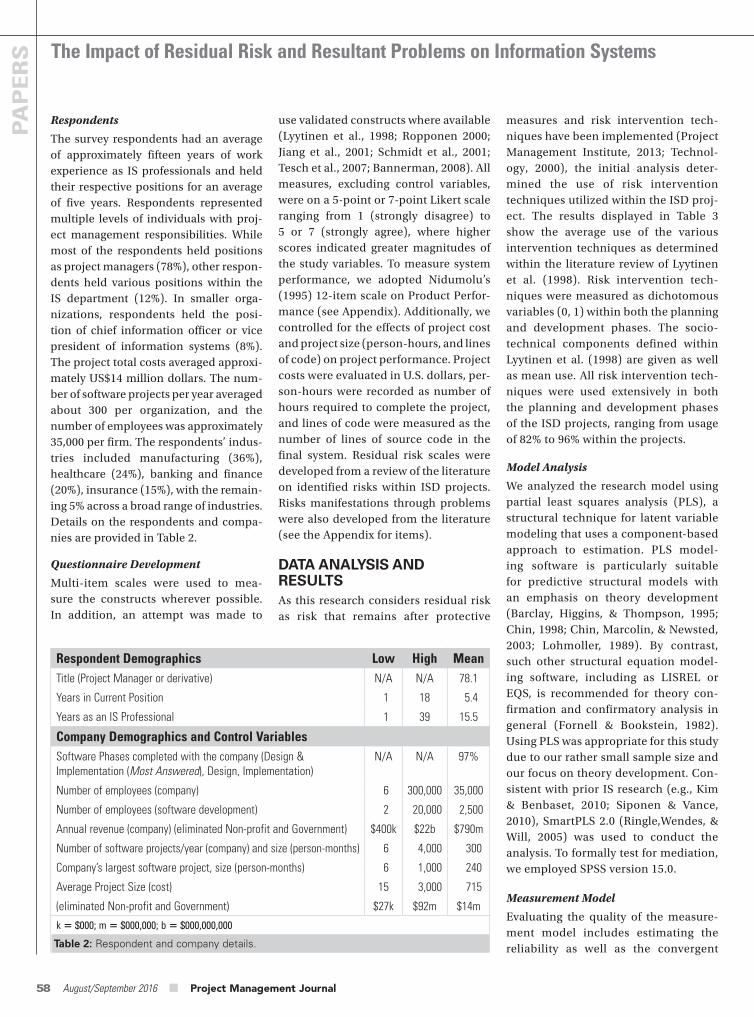
The Impact of Residual Risk and Resultant Problems on Information Systems
58 August/September 2016 ■ Project Management Journal
PAPERS
measures and risk intervention tech-niques have been implemented (Project Management Institute, 2013; Technol-ogy, 2000), the initial analysis deter-mined the use of risk intervention techniques utilized within the ISD proj-ect. The results displayed in Table 3 show the average use of the various intervention techniques as determined within the literature review of Lyytinen et al. (1998). Risk intervention tech-niques were measured as dichotomous variables (0, 1) within both the planning and development phases. The socio-technical components defined within Lyytinen et al. (1998) are given as well as mean use. All risk intervention tech-niques were used extensively in both the planning and development phases of the ISD projects, ranging from usage of 82% to 96% within the projects.
Model Analysis
We analyzed the research model using partial least squares analysis (PLS), a structural technique for latent variable modeling that uses a component-based approach to estimation. PLS model-ing software is particularly suitable for predictive structural models with an emphasis on theory development (Barclay, Higgins, & Thompson, 1995; Chin, 1998; Chin, Marcolin, & Newsted, 2003; Lohmoller, 1989). By contrast, such other structural equation model-ing software, including as LISREL or EQS, is recommended for theory con-firmation and confirmatory analysis in general (Fornell & Bookstein, 1982). Using PLS was appropriate for this study due to our rather small sample size and our focus on theory development. Con-sistent with prior IS research (e.g., Kim & Benbaset, 2010; Siponen & Vance, 2010), SmartPLS 2.0 (Ringle,Wendes, & Will, 2005) was used to conduct the analysis. To formally test for mediation, we employed SPSS version 15.0.
Measurement Model
Evaluating the quality of the measure-ment model includes estimating the reliability as well as the convergent
use validated constructs where available (Lyytinen et al., 1998; Ropponen 2000; Jiang et al., 2001; Schmidt et al., 2001; Tesch et al., 2007; Bannerman, 2008). All measures, excluding control variables, were on a 5-point or 7-point Likert scale ranging from 1 (strongly disagree) to 5 or 7 (strongly agree), where higher scores indicated greater magnitudes of the study variables. To measure system performance, we adopted Nidumolu’s (1995) 12-item scale on Product Perfor-mance (see Appendix). Additionally, we controlled for the effects of project cost and project size (person-hours, and lines of code) on project performance. Project costs were evaluated in U.S. dollars, per-son-hours were recorded as number of hours required to complete the project, and lines of code were measured as the number of lines of source code in the final system. Residual risk scales were developed from a review of the literature on identified risks within ISD projects. Risks manifestations through problems were also developed from the literature (see the Appendix for items).
DATA ANALYSIS AND RESULTSAs this research considers residual risk as risk that remains after protective
Respondents
The survey respondents had an average of approximately fifteen years of work experience as IS professionals and held their respective positions for an average of five years. Respondents represented multiple levels of individuals with proj-ect management responsibilities. While most of the respondents held positions as project managers (78%), other respon-dents held various positions within the IS department (12%). In smaller orga-nizations, respondents held the posi-tion of chief information officer or vice president of information systems (8%). The project total costs averaged approxi-mately US$14 million dollars. The num-ber of software projects per year averaged about 300 per organization, and the number of employees was approximately 35,000 per firm. The respondents’ indus-tries included manufacturing (36%), healthcare (24%), banking and finance (20%), insurance (15%), with the remain-ing 5% across a broad range of industries. Details on the respondents and compa-nies are provided in Table 2.
Questionnaire Development
Multi-item scales were used to mea-sure the constructs wherever possible. In addition, an attempt was made to
Respondent Demographics Low High MeanTitle (Project Manager or derivative) N/A N/A 78.1
Years in Current Position 1 18 5.4
Years as an IS Professional 1 39 15.5
Company Demographics and Control VariablesSoftware Phases completed with the company (Design & Implementation (Most Answered), Design, Implementation)
N/A N/A 97%
Number of employees (company) 6 300,000 35,000
Number of employees (software development) 2 20,000 2,500
Annual revenue (company) (eliminated Non-profit and Government) $400k $22b $790m
Number of software projects/year (company) and size (person-months) 6 4,000 300
Company’s largest software project, size (person-months) 6 1,000 240
Average Project Size (cost) 15 3,000 715
(eliminated Non-profit and Government) $27k $92m $14m
k 5 $000; m 5 $000,000; b 5 $000,000,000
Table 2: Respondent and company details.
PMJ_87569728_47_4_Aug_Sept_2016.indb 58 9/19/16 3:44 PM
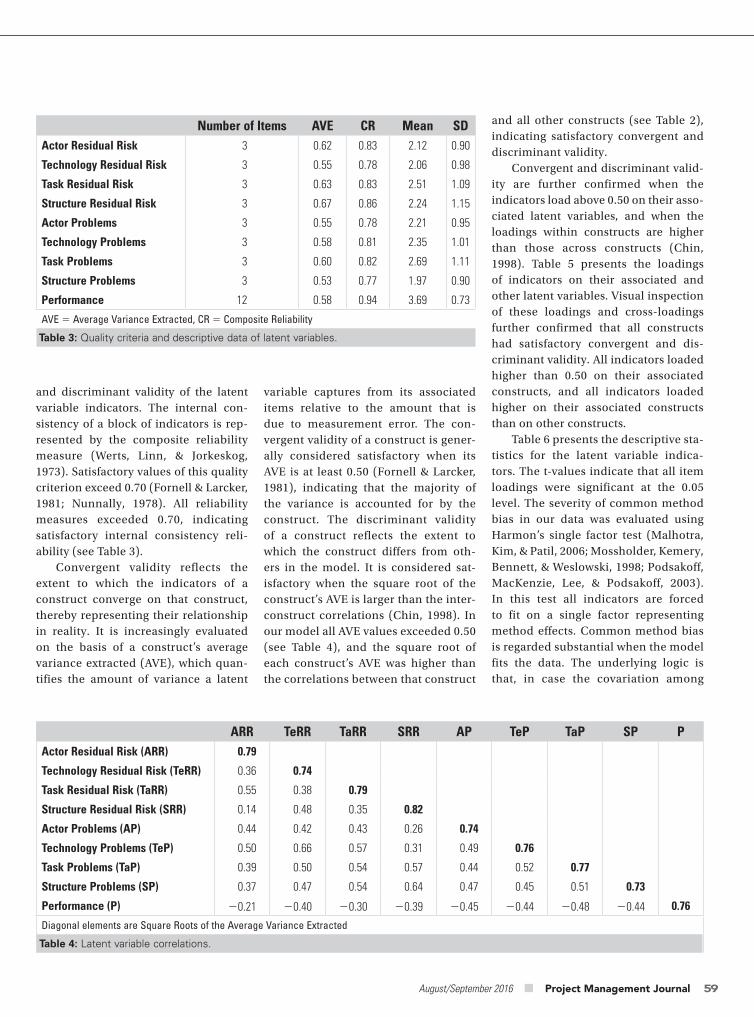
August/September 2016 ■ Project Management Journal 59
and all other constructs (see Table 2), indicating satisfactory convergent and discriminant validity.
Convergent and discriminant valid-ity are further confirmed when the indicators load above 0.50 on their asso-ciated latent variables, and when the loadings within constructs are higher than those across constructs (Chin, 1998). Table 5 presents the loadings of indicators on their associated and other latent variables. Visual inspection of these loadings and cross-loadings further confirmed that all constructs had satisfactory convergent and dis-criminant validity. All indicators loaded higher than 0.50 on their associated constructs, and all indicators loaded higher on their associated constructs than on other constructs.
Table 6 presents the descriptive sta-tistics for the latent variable indica-tors. The t-values indicate that all item loadings were significant at the 0.05 level. The severity of common method bias in our data was evaluated using Harmon’s single factor test (Malhotra, Kim, & Patil, 2006; Mossholder, Kemery, Bennett, & Weslowski, 1998; Podsakoff, MacKenzie, Lee, & Podsakoff, 2003). In this test all indicators are forced to fit on a single factor representing method effects. Common method bias is regarded substantial when the model fits the data. The underlying logic is that, in case the covariation among
variable captures from its associated items relative to the amount that is due to measurement error. The con-vergent validity of a construct is gener-ally considered satisfactory when its AVE is at least 0.50 (Fornell & Larcker, 1981), indicating that the majority of the variance is accounted for by the construct. The discriminant validity of a construct reflects the extent to which the construct differs from oth-ers in the model. It is considered sat-isfactory when the square root of the construct’s AVE is larger than the inter-construct correlations (Chin, 1998). In our model all AVE values exceeded 0.50 (see Table 4), and the square root of each construct’s AVE was higher than the correlations between that construct
and discriminant validity of the latent variable indicators. The internal con-sistency of a block of indicators is rep-resented by the composite reliability measure (Werts, Linn, & Jorkeskog, 1973). Satisfactory values of this quality criterion exceed 0.70 (Fornell & Larcker, 1981; Nunnally, 1978). All reliability measures exceeded 0.70, indicating satisfactory internal consistency reli-ability (see Table 3).
Convergent validity reflects the extent to which the indicators of a construct converge on that construct, thereby representing their relationship in reality. It is increasingly evaluated on the basis of a construct’s average variance extracted (AVE), which quan-tifies the amount of variance a latent
Number of Items AVE CR Mean SDActor Residual Risk 3 0.62 0.83 2.12 0.90
Technology Residual Risk 3 0.55 0.78 2.06 0.98
Task Residual Risk 3 0.63 0.83 2.51 1.09
Structure Residual Risk 3 0.67 0.86 2.24 1.15
Actor Problems 3 0.55 0.78 2.21 0.95
Technology Problems 3 0.58 0.81 2.35 1.01
Task Problems 3 0.60 0.82 2.69 1.11
Structure Problems 3 0.53 0.77 1.97 0.90
Performance 12 0.58 0.94 3.69 0.73
AVE Average Variance Extracted, CR Composite Reliability
Table 3: Quality criteria and descriptive data of latent variables.
ARR TeRR TaRR SRR AP TeP TaP SP PActor Residual Risk (ARR) 0.79
Technology Residual Risk (TeRR) 0.36 0.74
Task Residual Risk (TaRR) 0.55 0.38 0.79
Structure Residual Risk (SRR) 0.14 0.48 0.35 0.82
Actor Problems (AP) 0.44 0.42 0.43 0.26 0.74
Technology Problems (TeP) 0.50 0.66 0.57 0.31 0.49 0.76
Task Problems (TaP) 0.39 0.50 0.54 0.57 0.44 0.52 0.77
Structure Problems (SP) 0.37 0.47 0.54 0.64 0.47 0.45 0.51 0.73
Performance (P) 0.21 0.40 0.30 0.39 0.45 0.44 0.48 0.44 0.76
Diagonal elements are Square Roots of the Average Variance Extracted
Table 4: Latent variable correlations.
PMJ_87569728_47_4_Aug_Sept_2016.indb 59 9/19/16 3:44 PM
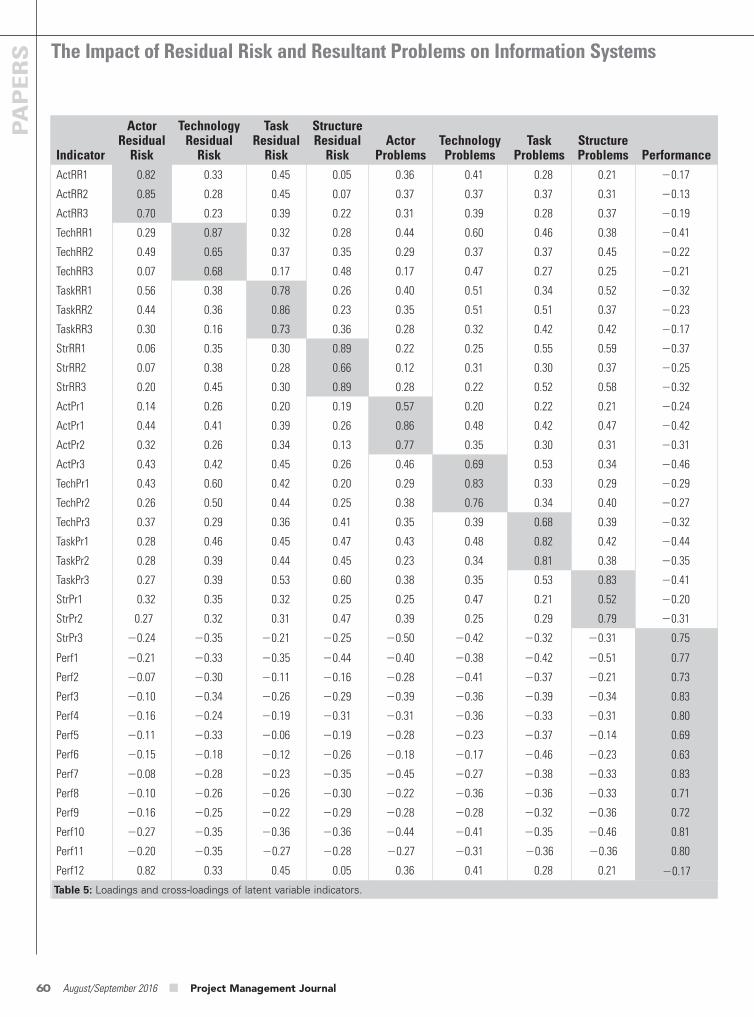
The Impact of Residual Risk and Resultant Problems on Information Systems
60 August/September 2016 ■ Project Management Journal
PAPERS
Indicator
Actor Residual
Risk
Technology Residual
Risk
Task Residual
Risk
Structure Residual
RiskActor
ProblemsTechnology Problems
Task Problems
Structure Problems Performance
ActRR1 0.82 0.33 0.45 0.05 0.36 0.41 0.28 0.21 0.17
ActRR2 0.85 0.28 0.45 0.07 0.37 0.37 0.37 0.31 0.13
ActRR3 0.70 0.23 0.39 0.22 0.31 0.39 0.28 0.37 0.19
TechRR1 0.29 0.87 0.32 0.28 0.44 0.60 0.46 0.38 0.41
TechRR2 0.49 0.65 0.37 0.35 0.29 0.37 0.37 0.45 0.22
TechRR3 0.07 0.68 0.17 0.48 0.17 0.47 0.27 0.25 0.21
TaskRR1 0.56 0.38 0.78 0.26 0.40 0.51 0.34 0.52 0.32
TaskRR2 0.44 0.36 0.86 0.23 0.35 0.51 0.51 0.37 0.23
TaskRR3 0.30 0.16 0.73 0.36 0.28 0.32 0.42 0.42 0.17
StrRR1 0.06 0.35 0.30 0.89 0.22 0.25 0.55 0.59 0.37
StrRR2 0.07 0.38 0.28 0.66 0.12 0.31 0.30 0.37 0.25
StrRR3 0.20 0.45 0.30 0.89 0.28 0.22 0.52 0.58 0.32
ActPr1 0.14 0.26 0.20 0.19 0.57 0.20 0.22 0.21 0.24
ActPr1 0.44 0.41 0.39 0.26 0.86 0.48 0.42 0.47 0.42
ActPr2 0.32 0.26 0.34 0.13 0.77 0.35 0.30 0.31 0.31
ActPr3 0.43 0.42 0.45 0.26 0.46 0.69 0.53 0.34 0.46
TechPr1 0.43 0.60 0.42 0.20 0.29 0.83 0.33 0.29 0.29
TechPr2 0.26 0.50 0.44 0.25 0.38 0.76 0.34 0.40 0.27
TechPr3 0.37 0.29 0.36 0.41 0.35 0.39 0.68 0.39 0.32
TaskPr1 0.28 0.46 0.45 0.47 0.43 0.48 0.82 0.42 0.44
TaskPr2 0.28 0.39 0.44 0.45 0.23 0.34 0.81 0.38 0.35
TaskPr3 0.27 0.39 0.53 0.60 0.38 0.35 0.53 0.83 0.41
StrPr1 0.32 0.35 0.32 0.25 0.25 0.47 0.21 0.52 0.20
StrPr2 0.27 0.32 0.31 0.47 0.39 0.25 0.29 0.79 0.31
StrPr3 0.24 0.35 0.21 0.25 0.50 0.42 0.32 0.31 0.75
Perf1 0.21 0.33 0.35 0.44 0.40 0.38 0.42 0.51 0.77
Perf2 0.07 0.30 0.11 0.16 0.28 0.41 0.37 0.21 0.73
Perf3 0.10 0.34 0.26 0.29 0.39 0.36 0.39 0.34 0.83
Perf4 0.16 0.24 0.19 0.31 0.31 0.36 0.33 0.31 0.80
Perf5 0.11 0.33 0.06 0.19 0.28 0.23 0.37 0.14 0.69
Perf6 0.15 0.18 0.12 0.26 0.18 0.17 0.46 0.23 0.63
Perf7 0.08 0.28 0.23 0.35 0.45 0.27 0.38 0.33 0.83
Perf8 0.10 0.26 0.26 0.30 0.22 0.36 0.36 0.33 0.71
Perf9 0.16 0.25 0.22 0.29 0.28 0.28 0.32 0.36 0.72
Perf10 0.27 0.35 0.36 0.36 0.44 0.41 0.35 0.46 0.81
Perf11 0.20 0.35 0.27 0.28 0.27 0.31 0.36 0.36 0.80
Perf12 0.82 0.33 0.45 0.05 0.36 0.41 0.28 0.21 0.17
Table 5: Loadings and cross-loadings of latent variable indicators.
PMJ_87569728_47_4_Aug_Sept_2016.indb 60 9/19/16 3:44 PM
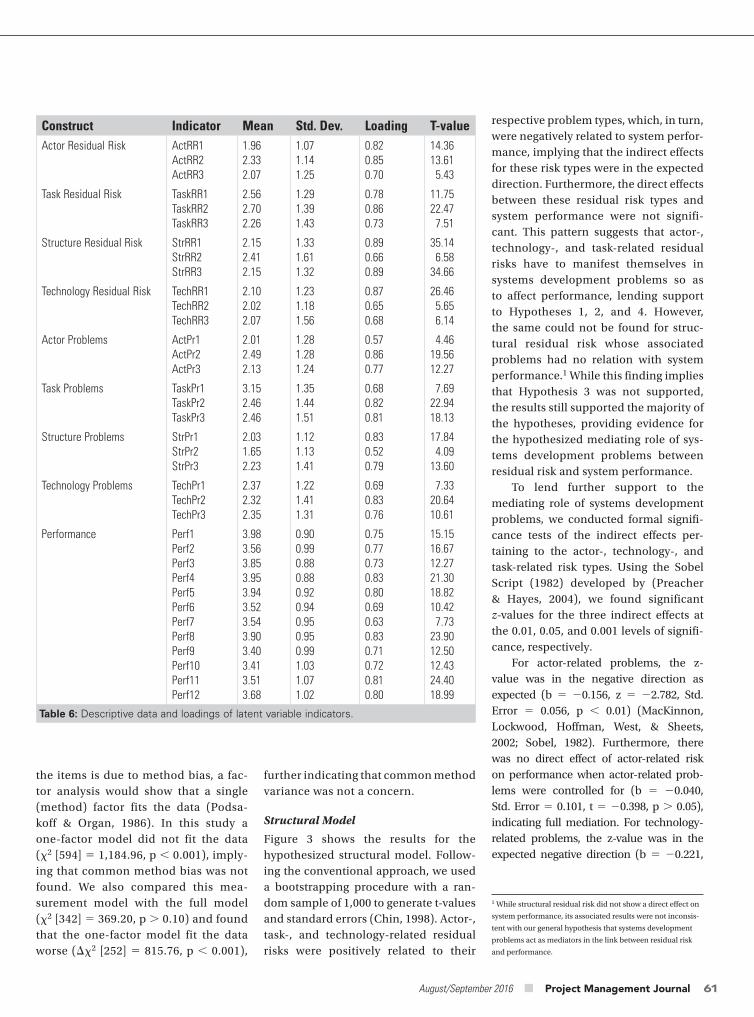
August/September 2016 ■ Project Management Journal 61
Construct Indicator Mean Std. Dev. Loading T-valueActor Residual Risk ActRR1
ActRR2ActRR3
1.962.332.07
1.071.141.25
0.820.850.70
14.3613.61
5.43
Task Residual Risk TaskRR1TaskRR2TaskRR3
2.562.702.26
1.291.391.43
0.780.860.73
11.7522.47
7.51
Structure Residual Risk StrRR1StrRR2StrRR3
2.152.412.15
1.331.611.32
0.890.660.89
35.146.58
34.66
Technology Residual Risk TechRR1TechRR2TechRR3
2.102.022.07
1.231.181.56
0.870.650.68
26.465.656.14
Actor Problems ActPr1ActPr2ActPr3
2.012.492.13
1.281.281.24
0.570.860.77
4.4619.5612.27
Task Problems TaskPr1TaskPr2TaskPr3
3.152.462.46
1.351.441.51
0.680.820.81
7.6922.9418.13
Structure Problems StrPr1StrPr2StrPr3
2.031.652.23
1.121.131.41
0.830.520.79
17.844.09
13.60
Technology Problems TechPr1TechPr2TechPr3
2.372.322.35
1.221.411.31
0.690.830.76
7.3320.6410.61
Performance Perf1Perf2Perf3Perf4Perf5Perf6Perf7Perf8Perf9Perf10Perf11Perf12
3.983.563.853.953.943.523.543.903.403.413.513.68
0.900.990.880.880.920.940.950.950.991.031.071.02
0.750.770.730.830.800.690.630.830.710.720.810.80
15.1516.6712.2721.3018.8210.42
7.7323.9012.5012.4324.4018.99
Table 6: Descriptive data and loadings of latent variable indicators.
the items is due to method bias, a fac-tor analysis would show that a single (method) factor fits the data (Podsa-koff & Organ, 1986). In this study a one-factor model did not fit the data (x2 [594] 1,184.96, p , 0.001), imply-ing that common method bias was not found. We also compared this mea-surement model with the full model (x2 [342] 369.20, p . 0.10) and found that the one-factor model fit the data worse (x2 [252] 815.76, p , 0.001),
further indicating that common method variance was not a concern.
Structural Model
Figure 3 shows the results for the hypothesized structural model. Follow-ing the conventional approach, we used a bootstrapping procedure with a ran-dom sample of 1,000 to generate t-values and standard errors (Chin, 1998). Actor-, task-, and technology-related residual risks were positively related to their
respective problem types, which, in turn, were negatively related to system perfor-mance, implying that the indirect effects for these risk types were in the expected direction. Furthermore, the direct effects between these residual risk types and system performance were not signifi-cant. This pattern suggests that actor-, technology-, and task-related residual risks have to manifest themselves in systems development problems so as to affect performance, lending support to Hypotheses 1, 2, and 4. However, the same could not be found for struc-tural residual risk whose associated problems had no relation with system performance.1 While this finding implies that Hypothesis 3 was not supported, the results still supported the majority of the hypotheses, providing evidence for the hypothesized mediating role of sys-tems development problems between residual risk and system performance.
To lend further support to the mediating role of systems development problems, we conducted formal signifi-cance tests of the indirect effects per-taining to the actor-, technology-, and task-related risk types. Using the Sobel Script (1982) developed by (Preacher & Hayes, 2004), we found significant z-values for the three indirect effects at the 0.01, 0.05, and 0.001 levels of signifi-cance, respectively.
For actor-related problems, the z- value was in the negative direction as expected (b 0.156, z 2.782, Std. Error 0.056, p , 0.01) (MacKinnon, Lockwood, Hoffman, West, & Sheets, 2002; Sobel, 1982). Furthermore, there was no direct effect of actor-related risk on performance when actor-related prob-lems were controlled for (b 0.040, Std. Error 0.101, t 0.398, p . 0.05), indicating full mediation. For technology-related problems, the z-value was in the expected negative direction (b 0.221,
1 While structural residual risk did not show a direct effect on
system performance, its associated results were not inconsis-
tent with our general hypothesis that systems development
problems act as mediators in the link between residual risk
and performance.
PMJ_87569728_47_4_Aug_Sept_2016.indb 61 9/19/16 3:44 PM
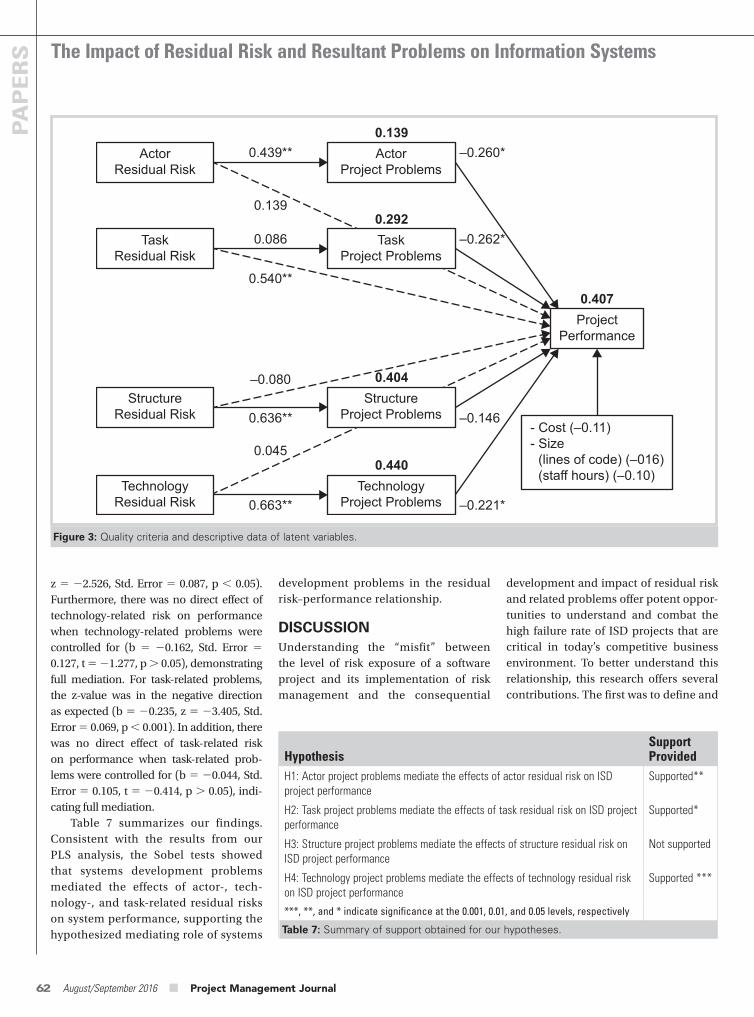
The Impact of Residual Risk and Resultant Problems on Information Systems
62 August/September 2016 ■ Project Management Journal
PAPERS
development and impact of residual risk and related problems offer potent oppor-tunities to understand and combat the high failure rate of ISD projects that are critical in today’s competitive business environment. To better understand this relationship, this research offers several contributions. The first was to define and
development problems in the residual risk–performance relationship.
DISCUSSIONUnderstanding the “misfit” between the level of risk exposure of a software project and its implementation of risk management and the consequential
z 2.526, Std. Error 0.087, p , 0.05). Furthermore, there was no direct effect of technology-related risk on performance when technology-related problems were controlled for (b 0.162, Std. Error 0.127, t 1.277, p . 0.05), demonstrating full mediation. For task-related problems, the z-value was in the negative direction as expected (b 0.235, z 3.405, Std. Error 0.069, p , 0.001). In addition, there was no direct effect of task-related risk on performance when task-related prob-lems were controlled for (b 0.044, Std. Error 0.105, t 0.414, p . 0.05), indi-cating full mediation.
Table 7 summarizes our findings. Consistent with the results from our PLS analysis, the Sobel tests showed that systems development problems mediated the effects of actor-, tech-nology-, and task-related residual risks on system performance, supporting the hypothesized mediating role of systems
Figure 3: Quality criteria and descriptive data of latent variables.
0.139
0.292
0.404
0.440
ActorResidual Risk
0.439**
0.086
0.139
0.540**
–0.221*
–0.146
–0.262*
–0.260*
0.636**
0.663**
–0.080
0.045
TaskResidual Risk
StructureResidual Risk
TechnologyResidual Risk
ActorProject Problems
TaskProject Problems
ProjectPerformance
0.407
- Cost (–0.11)- Size (lines of code) (–016) (staff hours) (–0.10)
StructureProject Problems
TechnologyProject Problems
HypothesisSupport Provided
H1: Actor project problems mediate the effects of actor residual risk on ISD project performance
Supported**
H2: Task project problems mediate the effects of task residual risk on ISD project performance
Supported*
H3: Structure project problems mediate the effects of structure residual risk on ISD project performance
Not supported
H4: Technology project problems mediate the effects of technology residual risk on ISD project performance
Supported ***
***, **, and * indicate significance at the 0.001, 0.01, and 0.05 levels, respectively
Table 7: Summary of support obtained for our hypotheses.
PMJ_87569728_47_4_Aug_Sept_2016.indb 62 9/19/16 3:44 PM
August/September 2016 ■ Project Management Journal 63
pattern of results or the significance of the coefficients. A fourth limitation of the study is that this research focuses on the first order effects of the risk catego-ries. However, Lyytinen et al. (1998) also considers the interdependencies between actors, task, structure, and technology. The risk management techniques for these interdependencies are considered within the risk resolution techniques, but more robust treatment of the interdepen-dencies could be useful in future research.
Finally, risk intervention techniques were measured as dichotomous vari-ables (used or not used), which was considered as appropriate as the model was to initially research the moderating effects of the intervention techniques; however, the lack of variance (almost all the risk intervention techniques were used on average 90% of the time) made this statistically insignificant. Future research should use a Likert scale to consider: (1) the extent of use, and (2) quality of implementation. This would allow additional granulation in the analysis of the research and addi-tional insights into practice.
Implications
Each of the contributions can be expanded to additional questions and opportunities for future research and practice and are considered below, respectively.
First, this research highlights the limitations of existing risk manage-ment and, more specifically, risk inter-vention techniques, as roughly 40% of the variance in ISD project perfor-mance is explained by the problems from the related residual risk catego-ries within the research model. Several future research streams are prompted from this finding. The first could con-sider why such residual problems after risk interventions are implemented. Are the intervention techniques inad-equate in eliminating such problems? Or are the intervention techniques not being adequately implemented to be effective? Again, previous research offers inroads to understanding these
the problems that are manifest from the categories of residual risk. This should prove an important distinction moving forward in understanding and manag-ing the consequences of residual risk.
Limitations
This study informs researchers and practitioners on the impact of residual risks that manifest into problems that ultimately impact ISD project perfor-mance. Like all research efforts, cer-tain calculated compromises have been made in undertaking this study. These limitations are pointed out, which in part, also serve as excellent opportuni-ties for conducting future research.
A potential limitation for this research is that respondents had to reconstruct their experience in order to complete the questions. Reconstruction of this type could be subject to biases; however, reconstruction of past experience is the only feasible way to collect and analyze survey data collected. We tried to limit such biases asking respondents to con-sider “ONE major project at your firm that (1) involves some software development, (2) is complete (i.e., has resulted in the first release of software OR has been ter-minated), and (3) is one with which you are intimately familiar.”
Another limitation of this study is using a purposive sample strategy. This approach was taken due to the focus of the research question on ISD systems development rather than information systems projects overall.
This focus reduced the number of projects within an organization to the extent that targeting respondents was warranted. Another benefit of using a purposive sample was ensuring respon-dents were mostly project managers or had project manager duties for the project; however, more robust research designs should be considered if possible.
A third limitation is that one could argue that some of our constructs are formative rather than reflective; how-ever, rerunning the analyses with forma-tive measures did not change the overall
measure residual risk that is more aligned to the spirit and meaning used within standards and practice of project man-agement. While prior research considers residual risk as all risk found within the later stages of ISD projects, this research defined and measured residual risk as “that risk that remains after protective measures and risk intervention tech-niques have been implemented (Project Management Institute, 2013; Technol-ogy, 2000).” Using this definition and measurement eliminates the artificial boundaries of residual risk only occur-ring in the later phases of a project. This complements previous research in resid-ual risk that finds requirements uncer-tainty occurring within the early stages of an ISD project impacting project perfor-mance (Na, 2004, 2007; Nidumolo, 1996). In addition, this definition of residual risk necessitated considering the implemen-tation of a rich category of risk interven-tion techniques within ISD projects. All 27 risk intervention techniques used in the survey were used extensively in both the planning and development phases of the ISD projects, ranging from usage of 82% to 96% within the projects.
Secondly, this research considered a more extensive and systemic set of categories of risks that can lead to the development of residual risk. The model used risk categories offered within the socio-technical perspective, including actor, task, structure, and technology as defined within four main risk manage-ment approaches (Lyytinen et al., 1996; Lyytinen et al., 1998). This should prove beneficial going forward because it pro-vides a useful structure for understand-ing the critical residual risks and related problems that continue to negatively impact ISD project performance.
Finally, this research found that the impact of residual risks is not a direct effect on project performance. Rather, the relationship is mediated by prob-lems that manifest through residual risks that ultimately impact project per-formance. This shifts focus from consid-ering the categories of residual risks to
PMJ_87569728_47_4_Aug_Sept_2016.indb 63 9/19/16 3:44 PM
The Impact of Residual Risk and Resultant Problems on Information Systems
64 August/September 2016 ■ Project Management Journal
PAPERS
Bostrom, R.P., & Heinen, J. S. (1977a). MIS problems and failures: A socio-technical perspective Part I: The causes. MIS Quarterly, 1(3), 17–32.
Bostrom, R.P., & Heinen, J. S. (1977b). MIS problems and failures: A socio-technical perspective Part II: The appli-cation of socio-technical theory. MIS Quarterly, 1(3), 11–28.
Burns, T.S., G. M. (1961). The management of innovation. London, England: Tavistock.
Chin, W.W. (1998). Issues and opinion on structural equation modeling. MIS Quarterly, 22(1), vii.
Chin, W.W., Marcolin, B. L., & Newsted, P. R. (2003). A partial least squares latent variable modeling approach for measur-ing interaction effects: Results from a Monte Carlo simulation. Information Systems Research, 14(2), 189–217.
Curtis, B., Krasner, H., & Iscoe, N. (1988). A field study of he software design process for large systems. Communications of the ACM, 31(11), 1268–1287.
Fornell, C., & Bookstein, F. L. (1982). Two structural equation models: Lisrel and PLS applied to consumer exit-voice theory. Journal of Marketing Research, 19(4), 440–452.
Fornell, C., & Larcker, D.F. (1981). Evaluating structural equation mod-els with unobservable variables and measurement error. Journal of Marketing Research, 18(1), 39–50.
Galbraith, J.R. (1977). Organizational design. Reading, MA: Addison-Wesley.
Houston, D., Mackulak, G., & Collofello, J. (2001). Stocastic simulation of risk fac-tor potential effects for software develop-ment risk management. The Journal of Systems and Software, 59(3), 247–257.
Jiang, J.J., G. Klein, & Chen, H. (2006). The effects of user partnering and user non-support on project performance. Journal of the Association for Information Systems, 7(2), 68–90.
Kaplan, R. S., & Mikes, A. (2012). Managing risks: A new framework. Harvard Business Review, 90, 48–60.
Finally, this research found that the impact of residual risks is not a direct effect on project performance. Rather, the relationship is mediated by problems that manifest through resid-ual risks that ultimately impact proj-ect performance. While this difference may appear minimal on the surface, it exposes the far more complex relation-ship between risk and problems. A risk may have one or more causes and if the risk is realized, may have more than one associated problem (Project Manage-ment Institute, 2013). As such, this is a “many-to-many” relationship, making all the processes within risk manage-ment (risk identification, risk analysis, risk response planning, and risk moni-toring and control) much more compli-cated. This will be further compounded as ISD projects continue to escalate in size, complexity, and functionality. Future research needs to consider this elevated relationship when researching risk as well as residual risk.
ReferencesAloini, D., Dulmin, R., & Mininno, V. (2012). Modeling and assessing ERP project risks: A Petri net approach. European Journal of Operations Research, 220(2), 484–495.
Bakker, K., Boonstra A., & Wortmann, H. (2010). Does risk management contribute to IT project success? A meta-analysis of empirical evidence. International Journal of Project Management, 28(5), 493–503.
Bannerman, P. (2008). Risk and risk management in software projects: A reassessment. Journal of Systems and Software, 81(12), 2118–2133.
Barclay, D., Higgins, C, & Thompson, R. (1995). The partial least squares (pls) approach to causal modeling: Personal computer adoption and use as an illustration. Technology Studies, 2(2), 285–309.
Barki, H., Rivard, S., & Talbot, J. (2001). An integrative contingency model of software project risk management. Journal of Man-agement Information Systems, 17(4), 37–69.
issues, but there is much still to be considered. Second, what contributes to the remaining variance of ISD project performance? Several options could be considered. First, Na et al. (2004) identi-fied unforeseeable risk (risk that cannot be identified nor controlled a priori). It should be researched as to how preva-lent unforeseeable risk is within ISD projects. Another possibility is second-ary risk, or a risk that arises as a direct result of implementing a risk response (Project Management Institute, 2013). It should be considered and researched whether some risk intervention tech-niques cause more additional problems than were eliminated. In practice, this definition offers opportunities to col-lect important information and “lessons learned” on implemented risk inter-vention techniques and their attributed success or failure in elimination or miti-gation of risks and their problems. This information should prove invaluable in refining not only the use of the risk intervention techniques, but the prob-ability of remaining residual risk. Fur-ther information could be collected on how to eliminate or resolve this residual risk in an efficient and effective manner.
Second, using a more extensive and systemic set of risks as antecedents of residual risk also offer opportunities for additional research. For example, this research considered the direct effects of actor, task, structure, and technol-ogy. However, Lyytinen et al. (1996; 1998) also theorized on the interactions between the categories—task/actor, task/technology, task/structure, actor/technology, actor/structure, and tech-nology/structure. Interactions between these categories could prove more com-plex to resolve as sophisticated hybrid residual risks and arising problems. Categorization of risks is encouraged in practice (Project Management Institute, 2013) because these categories enhance the efficiency and effectiveness of risk identification. It may prove valuable to include interactions between these cat-egories and the effective risk interven-tions to arising problems.
PMJ_87569728_47_4_Aug_Sept_2016.indb 64 9/19/16 3:44 PM
August/September 2016 ■ Project Management Journal 65
Park, C., Im, G., & Keil, M. (2008). Overcoming the mum effect in IT project reporting: Impacts of fault responsibility and time urgency. Journal of Association for Information Systems, 9(7), 409–431.
Podsakoff, P. M., MacKenzie, S. B., Lee, J., & Podsakoff, N. P. (2003). Common method biases in behavioral research: A critical review of the literature and rec-ommended remedies. Journal of Applied Psychology, 88(5), 879–903.
Podsakoff, P. M., & Organ, D. W. (1986). Self-reports in organizational research: Problems and prospects. Journal of Man-agement, 12(4), 531–545.
Powell, P.L., & Klein, J. H. (1996). Risk management for information systems development. Journal of Information Tehcnology, 11(4), 309–319.
Preacher, K. J., & Hayes, A. F. (2004). SPSS and SAS procedures for estimating indirect effects in simple mediation mod-els. Behavior Research Methods, Instru-ments, & Computers, 36(4), 717–731.
Project Management Institute (PMI). (2013). A guide to the project manage-ment body of knowledge (PMBOK ® guide) – Fifth edition. Newtown Square, PA: Author.
Ravichandran, T., & Rai, A. (1999). Total quality management in information sys-tems development: Key constructs and relationships. Journal of Management Information Systems, 16(3), 119–155.
Ravichandran, T., & Rai, A. (2000). Quality management in systems devel-opment: An organizational system perspective. MIS Quarterly, 24(3), 381–415.
Ringle, C., Wendes, S., & Will, A. (2005). Smartpls 2.0, Hamburg, Germany.
Ropponen, J., & Lyytinen, K. (2000). Components of software development risk: How to address them? A project manager survey, IEEE Transactions on Software Engineering, 26(2), 98–112.
Schmidt, C., Dart, P., Johnston, L., Sterling, L., & Thorne, P. (1999). Disincentives for communicating risk: A risk paradox. Information and Software Technology, 41(7), 403–411.
research: A comparison of alternative approaches and a reanalysis of past research. Management Science, 52(12), 1865–1883.
Mignerat, M., & Rivard, S. (2012). The institutionalization of information system project management practices. Informa-tion and Organization, 22(2), 125–153.
Mossholder, K.W., Kemery E.R., Bennett N., & Weslowski, M.A. (1998). Relation-ships between bases of power and work reactions: The mediational role of pro-cedural justice. Journal of Management, 24(4), 533–552.
Mulcahy, R. (2003). Risk management: Tricks of the trade for project managers. Minnetonka, MN: RMC Publications.
Na, K., Li, X., Simpson, J.T., & Kim, K. (2004). Uncertainty profile and software project performance: A cross-national comparison. Journal of Systems and Software, 70(1–2), 155–163.
Na, K., Li, X., Simpson, J., & Kim, K. (2007). Software development risk and project performance measurement: Evi-dence in Korea. Journal of Systems and Software, 80(4), 596–605.
Nelson, D.L. (1990). Individual adjust-ment to information-driven technolo-gies: A critical review. MIS Quarterly, 14(1), 79–98.
Nelson, R.R., & Jansen, K. J. (2007). IT project management: Infamous fail-ures, classic mistakes, and best practices. MIS Quarterly Executive, 6(2), 67–78.
Nelson, R.R., & Jansen, K. J. (2009). Mapping and managing momentum in IT projects. MIS Quarterly Executive, 8(3), 141–148.
Nidumolo, S. (1995). The effect of coor-dination and uncertainty on software project performance: Residual perfor-mance risk as an intervening variable. Information Systems Research, 6(3), 191–219.
Nidumolo, S. (1996). Standardization, requirements uncertainty and software project performance. Information and Management, 31(3), 135–150.
Nunnally, J.C. (1978). Psychometric theory. New York, NY: McGraw-Hill.
Kerzner, H. (2009). Project management: A systems approach to planning, schedul-ing, and controlling. Hoboken, NJ: John Wiley & Sons.
Kim, D., & Benbasat, I. (2010). Trust-assuring arguments in B2C E-commerce: Impact of content, source, and price on trust. Journal of Management Informa-tion Systems, 26(3), 175–206.
Kishore, R.S., M. E., Jackson, E., & Rao, H. R. (2012). A quality-distinction model of IT capabilities: Conceptualization and two-stage empirical validation using CMMi processes. IEEE Transactions on Engineering Management, 59, 457–469.
Kutsch, E., & Hall, M. (2009). The ratio-nal choice of not applying project risk management in information technology projects. Project Management Journal, 40(3), 72–81.
Leavitt, H.J. (1964). Applied organiza-tional change in industry: Structural, technical, and human approaches. New Perspectives in Organizational Research. Chichester, UK: Wiley, pp. 55–71.
Li, J., Conradi, R., Slyngstad, O., Tor-chiano, N., Morisio, M., & Bunse, C. (2008). A state-of-the-practice survey of risk management in development with of-the-shelf software components. IEEE on Software Engineering, 34(2), 271–286.
Lohmoller, J.-B. (1989). Latent variable path modeling with partial least squares. Springer, Heidelberg: Physica; New York.
Lyytinen, K., Mathiassen, L., & Ropponen, J. (1998). Attention shap-ing and software risk: A categorical analysis of four classical risk manage-ment approaches. Information Systems Research, 9(3), 233–255.
Lyytinen, K., Mathiassen, L. & Ropponen, J. (1996). A framework for software risk management. Journal of Information Tehcnology, 11(4), 275–285.
MacKinnon, D.P., Lockwood, C. M., Hoffman, J. M., West, S. G., & Sheets, V. (2002). A comparison of methods to test mediation and other intervening variable effects. Psychological Methods, 7(1), 83–104.
Malhotra, N.K., Kim, S. S., & Patil, A. (2006). Common method variance in is
PMJ_87569728_47_4_Aug_Sept_2016.indb 65 9/19/16 3:44 PM
The Impact of Residual Risk and Resultant Problems on Information Systems
66 August/September 2016 ■ Project Management Journal
PAPERS
Section Editor of JAIS, and Senior Editor (Emeritus) for MIS Quarterly, the Journal of the AIS and Database. He is currently examining the impacts of digitalization on individuals and organizations. He is the recipient of numerous awards from USC, Clemson, AIS, DSI, Anbar, and PriceWaterhouse for his research and teaching. He is a Fellow of the Association for Information Systems. He can be contacted at [email protected]
John D. McGregor is an Associate Professor of Computer Science at Clemson University, a Visiting Scientist at the Software Engineering Institute, and a partner in Luminary Software, a software/systems engineering consulting firm. He regularly engages large software development organizations at all levels from strategic to tactical to the concrete. His research interests include highly reliable software-intensive systems, software product lines, socio-technical ecosystems, model-driven development, and software/system architecture. He has been chair of the steering committee for the Software Product Line Conference and serves on the program committee of six to ten conferences per year. He researches, writes, and practices strategic software engineering. His consulting has included satellite operating systems, telephony infrastructure, cell phones, software certification, and software-defined radios. His latest book is A Practical Guide to Testing Object-Oriented Software (Addison-Wesley, 2001). He can be contacted at [email protected].
Steve Davis earned his PhD from Georgia Institute of Technology, Atlanta, Georgia, USA. He is a Professor Emeritus at Clemson University, where he taught courses in Management Information Systems and Electronic Commerce. His current research interest is investigating effectiveness of practices for developing and implementing information systems. His articles have been published in IEEE Transactions on Software Engineering, IEEE Software, Interfaces, International Journal of Human-Computer Studies, International Journal of Production Research, and others. He has served as principal investigator for projects for the National Science Foundation and Department of Defense. He can be contacted at [email protected]
Management Science, Organization Science, Journal of Management Studies, and IEEE Transactions on Engineering Management among others, as well as in national and international proceedings. He has received various awards for his research, teaching, and service at the college, university, and state levels. He can be contacted at [email protected]
Raymond M. Henry is an Associate Professor in the Information Systems Department and Director of the Business Analytics programs in the Monte Ahuja College of Business at Cleveland State University, Cleveland, Ohio, USA and received his PhD in Information Systems from the University of Pittsburgh, Pittsburgh, Pennsylvania. His research explores topics related to IT governance, information systems development, knowledge management, and human–computer interaction. His work has been published in premier journals, including Information Systems Research, Journal of Management Information Systems, Communications of the ACM, Journal of the AIS, and Journal of Operations Management, among others. He can be contacted at [email protected]
Stefan Tams is an Assistant Professor of Information Systems at HEC Montréal, Canada and received his PhD from the Department of Management at Clemson University. His work has appeared in several scientific journals, including Journal of Strategic Information Systems, Journal of the Association for Information Systems, and European Journal of Work and Organizational Psychology. He can be contacted at [email protected]
Varun Grover is the William S. Lee (Duke Energy) Distinguished Professor of Information Systems at Clemson University. He has published exten-sively in the information systems field, with over 200 publications in major refereed journals. Over ten recent articles have ranked him among the top four researchers based on number of publications in the top information systems journals, as well as citation impact. Dr. Grover has an h-index of 71 and over 22,000 citations in Google Scholar. Thompson Reuters recognized him as a Highly Cited research in 2013. He is Senior Editor for MISQ Executive,
Schmidt, R., Lyytinen, K., Keil, M., & Cule, P. (2001). Identifying software project risks: An international delphi study. Journal of Management Informa-tion Systems, 17(4), 5–36.
Siponen, M., & Vance, A. (2010). Neutralization: New insights into the problem of employee information systems security policy violations. MIS Quarterly, 34(3), 487–502.
Sobel, M.E. (1982). Asymptotic confi-dence intervals for indirect effects in structural equation models. Sociological Methodology, 13, 290–312.
Technology, A.f.M. (2000). Risk assess-ment and reduction: A guideline to estimate, evaluate and reduce risks associated with machine tools. ANSI B11.TR3. AMT, McLean, VA.
Tesch, D., Kloppenborg, T., J., &, Frolick, M. N. (2007). IT project risk factors: The project management professionals perspective. Journal of Com-puter Information Systems, 47(4), 61–69.
Ward, S., & Chapman, C. (2003). Trans-forming project risk management into project uncertainty management. Inter-national Journal of Project Management, 21(2), 97–106.
Werts, C.E., Linn, R.L., & Jorkeskog, K. G. (1973). Intraclass reliability estimates: Testing structural assumptions. Educa-tional and Psychological Measurement, 34, 25–33.
Whitten, J., & Bentley, L. (2007). Systems analysis and design methods. New York, NY: Irwin/McGraw-Hill.
Russell Purvis is an Associate Professor at Clemson University, Clemson, South Carolina, USA and earned his PhD from Florida State University. He teaches courses in the areas of project and technol-ogy management and his current research interests focus on the project management and the develop-ment and implementation of information systems. His articles have been published in MIS Quarterly,
PMJ_87569728_47_4_Aug_Sept_2016.indb 66 9/19/16 3:44 PM
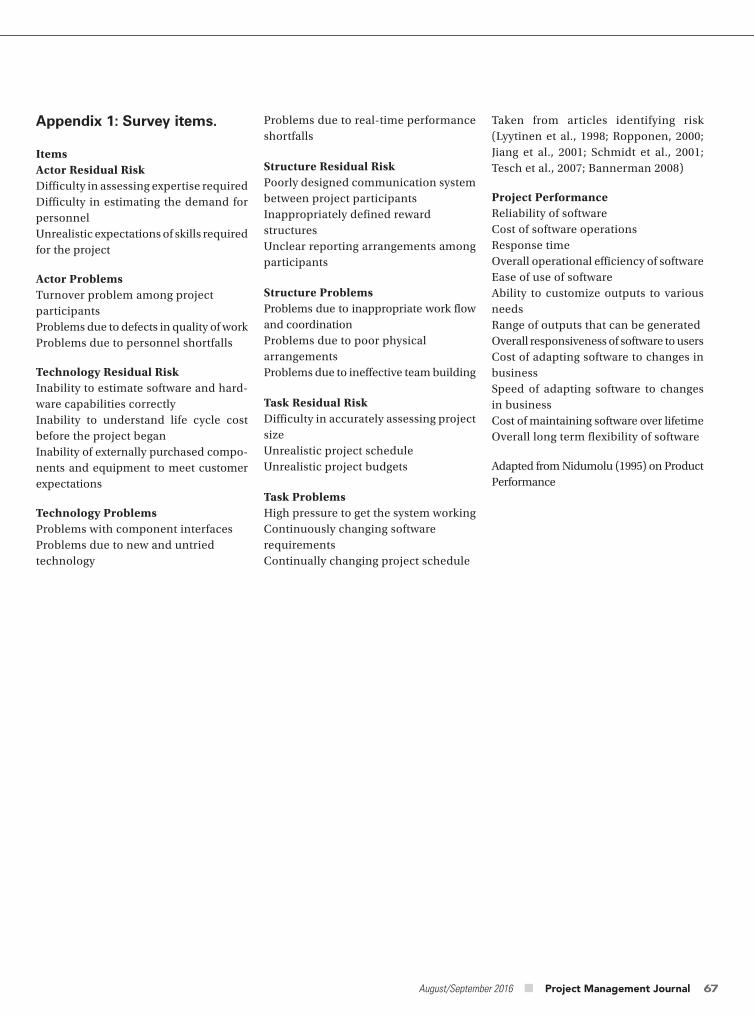
August/September 2016 ■ Project Management Journal 67
Taken from articles identifying risk (Lyytinen et al., 1998; Ropponen, 2000; Jiang et al., 2001; Schmidt et al., 2001; Tesch et al., 2007; Bannerman 2008)
Project PerformanceReliability of softwareCost of software operationsResponse timeOverall operational efficiency of softwareEase of use of softwareAbility to customize outputs to various needsRange of outputs that can be generatedOverall responsiveness of software to usersCost of adapting software to changes in businessSpeed of adapting software to changes in businessCost of maintaining software over lifetimeOverall long term flexibility of software
Adapted from Nidumolu (1995) on Product Performance
Problems due to real-time performance shortfalls
Structure Residual RiskPoorly designed communication system between project participantsInappropriately defined reward structuresUnclear reporting arrangements among participants
Structure ProblemsProblems due to inappropriate work flow and coordinationProblems due to poor physical arrangementsProblems due to ineffective team building
Task Residual RiskDifficulty in accurately assessing project sizeUnrealistic project scheduleUnrealistic project budgets
Task ProblemsHigh pressure to get the system workingContinuously changing software requirementsContinually changing project schedule
Appendix 1: Survey items.
ItemsActor Residual RiskDifficulty in assessing expertise requiredDifficulty in estimating the demand for personnelUnrealistic expectations of skills required for the project
Actor ProblemsTurnover problem among project participantsProblems due to defects in quality of workProblems due to personnel shortfalls
Technology Residual RiskInability to estimate software and hard-ware capabilities correctlyInability to understand life cycle cost before the project beganInability of externally purchased compo-nents and equipment to meet customer expectations
Technology ProblemsProblems with component interfacesProblems due to new and untried technology
PMJ_87569728_47_4_Aug_Sept_2016.indb 67 9/19/16 3:44 PM
PAPERS
68 August/September 2016 ■ Project Management Journal
Project Management Journal, Vol. 47, No. 4, 68–78
© 2016 by the Project Management Institute
Published online at www.pmi.org/PMJ
ABSTRACT ■
Application of Net Cash Flow at Risk in Project Portfolio SelectionMasoud Mohammad Sharifi, Department of Industrial Engineering, Iran University of Science and Technology, Narmak, Tehran, IranMojtaba Safari, Department of Industrial Engineering, Iran University of Science and Technology, Narmak, Tehran, Iran
INTRODUCTION
According to A Guide to the Project Management Body of Knowledge (PMBOK® Guide) – Fifth Edition (Project Management Institute, 2013), a portfolio refers to a collection of projects, programs, sub-portfolios, and operations managed as a group in order to achieve strategic
objectives. Project portfolio management (PPM) deals with the selection, coordination, and control of multiple projects that follow the same goals and compete for shared resources. Decision makers need to prioritize among potential projects to achieve optimal profit (Better & Glover, 2006). Despite the variety of methods that have been developed for portfolio selection, topics such as resource allocation across projects, the alignment of the portfolio with strategy, and evaluation of portfolio success are all regularly investigated in the search for improved methods. In some studies, alternative approaches have been applied to reduce the overall risk of the portfolio. Modern portfolio theory is generally explained by the Markowitz model (Markowitz, 1952). This model shows how combinations of assets with different profiles can lower overall risk. Modern portfolio theory is generally formulated as follows:
min N
i1
N
j1
ijxixj 1
The main assumption of modern portfolio theory is that decisions are made based on a tradeoff between return and risk. Return is the mean of the probability distribution of payoffs for the stock or asset. Risk is the variance or standard devia-tion associated with that payoff distribution. Subject to the weighted sum of expected returns for each asset being greater or equal to the expected portfolio return:
N
i1
rixi rp 2
N
i1
xi 1 3
xi 0 i 1, . . . , N 4
Where N is the number of assets in the investable universe, ri is the expected return of asset i, ij is the covariance between assets i and j, rp is the expected return of the portfolio, and xi is the weight of asset i in the portfolio.
Subbu et al. (2005) proposed the following multi-objective function in order to maximize portfolio value and minimize variance:
{
max Portfolio expected return or max N
i1
rixi
min Variance or min N
i1
N
j1
ijxixj
Project portfolio management deals with
the selection of multiple projects. Because
the number of potential projects that can
be selected is greater than the number of
projects that can be funded, managers face
the problem of selecting a portfolio that
maximizes the expected benefits. In this
article, financial concepts are applied in the
project portfolio and then cash flow at risk, as
a measure in project portfolio optimization,
is developed. Finally, we propose a novel
mathematical model for project selection.
KEYWORDS: portfolio selection; chance
constrained programming; cash flow at risk
(CFaR); optimization; covariance matrix
PMJ_87569728_47_4_Aug_Sept_2016.indb 68 9/19/16 3:44 PM
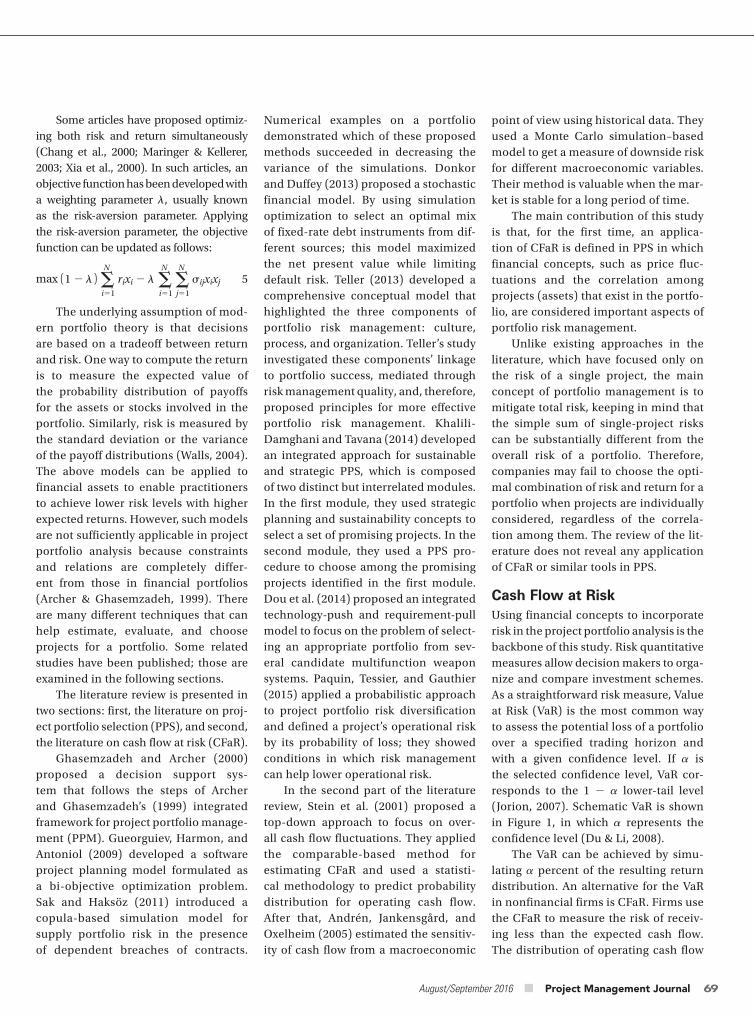
August/September 2016 ■ Project Management Journal 69
point of view using historical data. They used a Monte Carlo simulation–based model to get a measure of downside risk for different macroeconomic variables. Their method is valuable when the mar-ket is stable for a long period of time.
The main contribution of this study is that, for the first time, an applica-tion of CFaR is defined in PPS in which financial concepts, such as price fluc-tuations and the correlation among projects (assets) that exist in the portfo-lio, are considered important aspects of portfolio risk management.
Unlike existing approaches in the literature, which have focused only on the risk of a single project, the main concept of portfolio management is to mitigate total risk, keeping in mind that the simple sum of single-project risks can be substantially different from the overall risk of a portfolio. Therefore, companies may fail to choose the opti-mal combination of risk and return for a portfolio when projects are individually considered, regardless of the correla-tion among them. The review of the lit-erature does not reveal any application of CFaR or similar tools in PPS.
Cash Flow at RiskUsing financial concepts to incorporate risk in the project portfolio analysis is the backbone of this study. Risk quantitative measures allow decision makers to orga-nize and compare investment schemes. As a straightforward risk measure, Value at Risk (VaR) is the most common way to assess the potential loss of a portfolio over a specified trading horizon and with a given confidence level. If is the selected confidence level, VaR cor-responds to the 1 lower-tail level (Jorion, 2007). Schematic VaR is shown in Figure 1, in which represents the confidence level (Du & Li, 2008).
The VaR can be achieved by simu-lating percent of the resulting return distribution. An alternative for the VaR in nonfinancial firms is CFaR. Firms use the CFaR to measure the risk of receiv-ing less than the expected cash flow. The distribution of operating cash flow
Numerical examples on a portfolio demonstrated which of these proposed methods succeeded in decreasing the variance of the simulations. Donkor and Duffey (2013) proposed a stochastic financial model. By using simulation optimization to select an optimal mix of fixed-rate debt instruments from dif-ferent sources; this model maximized the net present value while limiting default risk. Teller (2013) developed a comprehensive conceptual model that highlighted the three components of portfolio risk management: culture, process, and organization. Teller’s study investigated these components’ linkage to portfolio success, mediated through risk management quality, and, therefore, proposed principles for more effective portfolio risk management. Khalili-Damghani and Tavana (2014) developed an integrated approach for sustainable and strategic PPS, which is composed of two distinct but interrelated modules. In the first module, they used strategic planning and sustainability concepts to select a set of promising projects. In the second module, they used a PPS pro-cedure to choose among the promising projects identified in the first module. Dou et al. (2014) proposed an integrated technology-push and requirement-pull model to focus on the problem of select-ing an appropriate portfolio from sev-eral candidate multifunction weapon systems. Paquin, Tessier, and Gauthier (2015) applied a probabilistic approach to project portfolio risk diversification and defined a project’s operational risk by its probability of loss; they showed conditions in which risk management can help lower operational risk.
In the second part of the literature review, Stein et al. (2001) proposed a top-down approach to focus on over-all cash flow fluctuations. They applied the comparable-based method for estimating CFaR and used a statisti-cal methodology to predict probability distribution for operating cash flow. After that, Andrén, Jankensgård, and Oxelheim (2005) estimated the sensitiv-ity of cash flow from a macroeconomic
Some articles have proposed optimiz-ing both risk and return simultaneously (Chang et al., 2000; Maringer & Kellerer, 2003; Xia et al., 2000). In such articles, an objective function has been developed with a weighting parameter , usually known as the risk-aversion parameter. Applying the risk-aversion parameter, the objective function can be updated as follows:
max ( 1 ) N
i1
rixi N
i1
N
j1
ijxixj 5
The underlying assumption of mod-ern portfolio theory is that decisions are based on a tradeoff between return and risk. One way to compute the return is to measure the expected value of the probability distribution of payoffs for the assets or stocks involved in the portfolio. Similarly, risk is measured by the standard deviation or the variance of the payoff distributions (Walls, 2004). The above models can be applied to financial assets to enable practitioners to achieve lower risk levels with higher expected returns. However, such models are not sufficiently applicable in project portfolio analysis because constraints and relations are completely differ-ent from those in financial portfolios (Archer & Ghasemzadeh, 1999). There are many different techniques that can help estimate, evaluate, and choose projects for a portfolio. Some related studies have been published; those are examined in the following sections.
The literature review is presented in two sections: first, the literature on proj-ect portfolio selection (PPS), and second, the literature on cash flow at risk (CFaR).
Ghasemzadeh and Archer (2000) proposed a decision support sys-tem that follows the steps of Archer and Ghasemzadeh’s (1999) integrated framework for project portfolio manage-ment (PPM). Gueorguiev, Harmon, and Antoniol (2009) developed a software project planning model formulated as a bi-objective optimization problem. Sak and Haksöz (2011) introduced a copula-based simulation model for supply portfolio risk in the presence of dependent breaches of contracts.
PMJ_87569728_47_4_Aug_Sept_2016.indb 69 9/19/16 3:44 PM
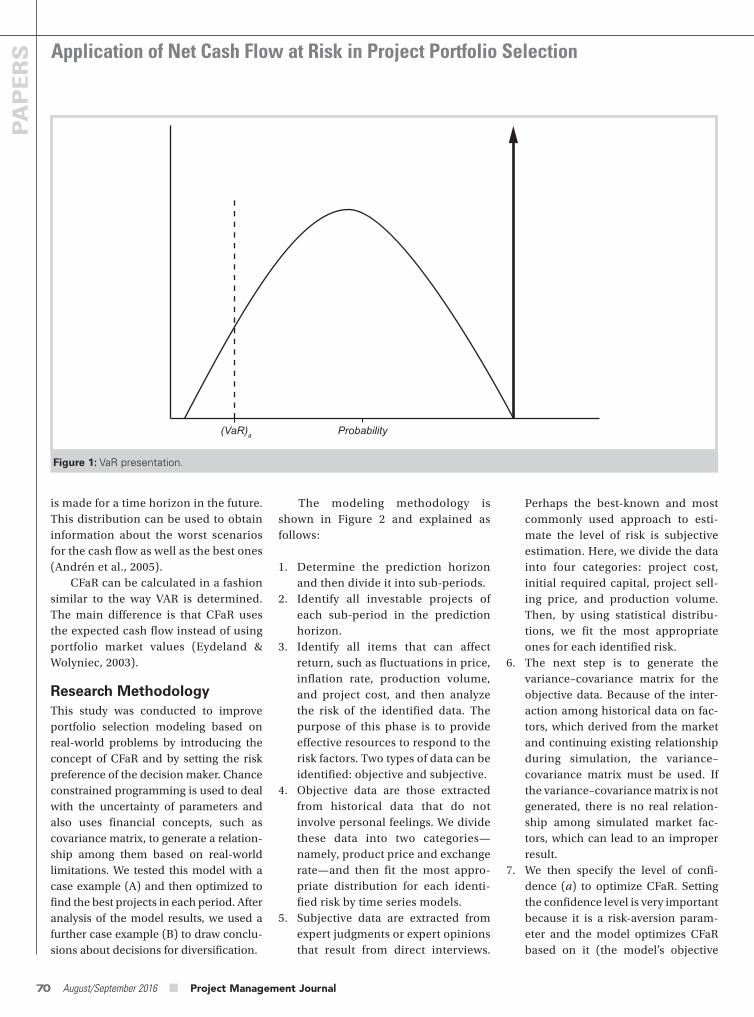
Application of Net Cash Flow at Risk in Project Portfolio Selection
70 August/September 2016 ■ Project Management Journal
PAPERS
Perhaps the best-known and most commonly used approach to esti-mate the level of risk is subjective estimation. Here, we divide the data into four categories: project cost, initial required capital, project sell-ing price, and production volume. Then, by using statistical distribu-tions, we fit the most appropriate ones for each identified risk.
6. The next step is to generate the variance–covariance matrix for the objective data. Because of the inter-action among historical data on fac-tors, which derived from the market and continuing existing relationship during simulation, the variance–covariance matrix must be used. If the variance–covariance matrix is not generated, there is no real relation-ship among simulated market fac-tors, which can lead to an improper result.
7. We then specify the level of confi-dence (a) to optimize CFaR. Setting the confidence level is very important because it is a risk-aversion param-eter and the model optimizes CFaR based on it (the model’s objective
The modeling methodology is shown in Figure 2 and explained as follows:
1. Determine the prediction horizon and then divide it into sub-periods.
2. Identify all investable projects of each sub-period in the prediction horizon.
3. Identify all items that can affect return, such as fluctuations in price, inflation rate, production volume, and project cost, and then analyze the risk of the identified data. The purpose of this phase is to provide effective resources to respond to the risk factors. Two types of data can be identified: objective and subjective.
4. Objective data are those extracted from historical data that do not involve personal feelings. We divide these data into two categories—namely, product price and exchange rate—and then fit the most appro-priate distribution for each identi-fied risk by time series models.
5. Subjective data are extracted from expert judgments or expert opinions that result from direct interviews.
is made for a time horizon in the future. This distribution can be used to obtain information about the worst scenarios for the cash flow as well as the best ones (Andrén et al., 2005).
CFaR can be calculated in a fashion similar to the way VAR is determined. The main difference is that CFaR uses the expected cash flow instead of using portfolio market values (Eydeland & Wolyniec, 2003).
Research MethodologyThis study was conducted to improve portfolio selection modeling based on real-world problems by introducing the concept of CFaR and by setting the risk preference of the decision maker. Chance constrained programming is used to deal with the uncertainty of parameters and also uses financial concepts, such as covariance matrix, to generate a relation-ship among them based on real-world limitations. We tested this model with a case example (A) and then optimized to find the best projects in each period. After analysis of the model results, we used a further case example (B) to draw conclu-sions about decisions for diversification.
Figure 1: VaR presentation.
(VaR)a Probability
PMJ_87569728_47_4_Aug_Sept_2016.indb 70 9/19/16 3:44 PM
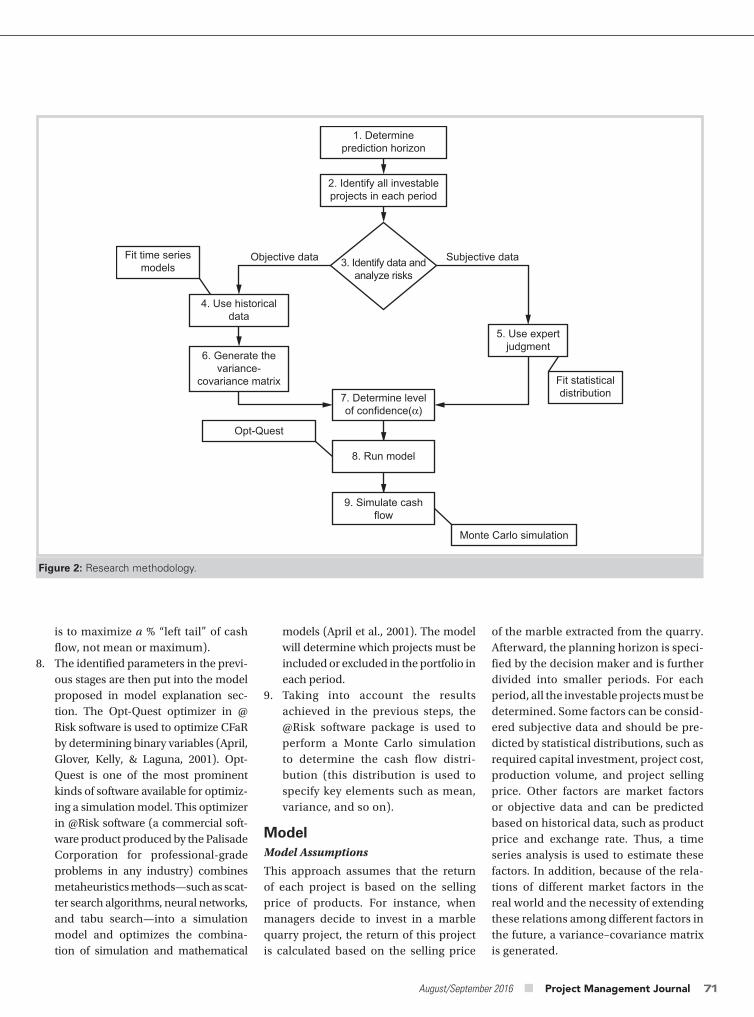
August/September 2016 ■ Project Management Journal 71
of the marble extracted from the quarry. Afterward, the planning horizon is speci-fied by the decision maker and is further divided into smaller periods. For each period, all the investable projects must be determined. Some factors can be consid-ered subjective data and should be pre-dicted by statistical distributions, such as required capital investment, project cost, production volume, and project selling price. Other factors are market factors or objective data and can be predicted based on historical data, such as product price and exchange rate. Thus, a time series analysis is used to estimate these factors. In addition, because of the rela-tions of different market factors in the real world and the necessity of extending these relations among different factors in the future, a variance–covariance matrix is generated.
models (April et al., 2001). The model will determine which projects must be included or excluded in the portfolio in each period.
9. Taking into account the results achieved in the previous steps, the @Risk software package is used to perform a Monte Carlo simulation to determine the cash flow distri-bution (this distribution is used to specify key elements such as mean, variance, and so on).
ModelModel Assumptions
This approach assumes that the return of each project is based on the selling price of products. For instance, when managers decide to invest in a marble quarry project, the return of this project is calculated based on the selling price
is to maximize a % “left tail” of cash flow, not mean or maximum).
8. The identified parameters in the previ-ous stages are then put into the model proposed in model explanation sec-tion. The Opt-Quest optimizer in @Risk software is used to optimize CFaR by determining binary variables (April, Glover, Kelly, & Laguna, 2001). Opt-Quest is one of the most prominent kinds of software available for optimiz-ing a simulation model. This optimizer in @Risk software (a commercial soft-ware product produced by the Palisade Corporation for professional-grade problems in any industry) combines metaheuristics methods—such as scat-ter search algorithms, neural networks, and tabu search—into a simulation model and optimizes the combina-tion of simulation and mathematical
Figure 2: Research methodology.
1. Determineprediction horizon
2. Identify all investableprojects in each period
3. Identify data andanalyze risks
Objective data Subjective data
4. Use historicaldata
6. Generate thevariance-
covariance matrix
5. Use expertjudgment
7. Determine levelof confidence(α)
9. Simulate cashflow
8. Run model
Monte Carlo simulation
Fit statisticaldistribution
Opt-Quest
Fit time seriesmodels
PMJ_87569728_47_4_Aug_Sept_2016.indb 71 9/19/16 3:44 PM
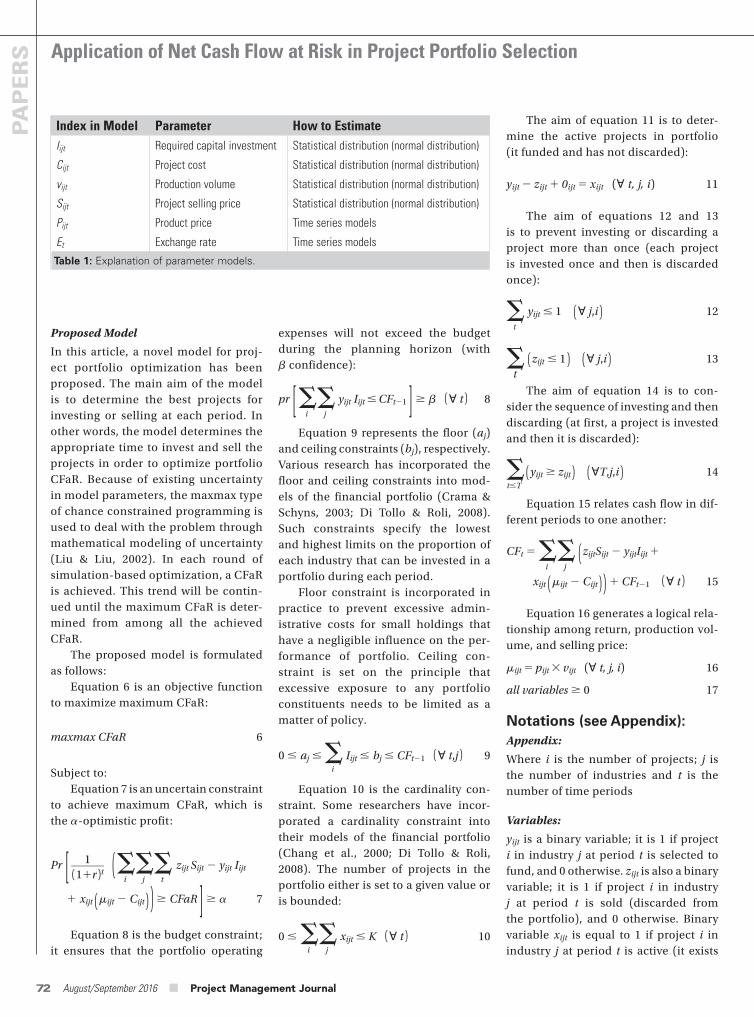
Application of Net Cash Flow at Risk in Project Portfolio Selection
72 August/September 2016 ■ Project Management Journal
PAPERS
The aim of equation 11 is to deter-mine the active projects in portfolio (it funded and has not discarded):
yijt zijt 1 0ijt xijt ( t, j, i) 11
The aim of equations 12 and 13 is to prevent investing or discarding a project more than once (each project is invested once and then is discarded once):
t
yijt 1 ( j,i ) 12
t
( zijt 1 ) ( j,i ) 13
The aim of equation 14 is to con-sider the sequence of investing and then discarding (at first, a project is invested and then it is discarded):
tT
( yijt zijt ) ( T,j,i ) 14
Equation 15 relates cash flow in dif-ferent periods to one another:
CFt i
j
( zijtSijt yijtIijt 1
xijt ( ijt Cijt ) ) 1 CFt1 ( t ) 15
Equation 16 generates a logical rela-tionship among return, production vol-ume, and selling price:
ijt pijt 3 vijt ( t, j, i) 16
all variables 0 17
Notations (see Appendix):Appendix:
Where i is the number of projects; j is the number of industries and t is the number of time periods
Variables:
yijt is a binary variable; it is 1 if project i in industry j at period t is selected to fund, and 0 otherwise. zijt is also a binary variable; it is 1 if project i in industry j at period t is sold (discarded from the portfolio), and 0 otherwise. Binary variable xijt is equal to 1 if project i in industry j at period t is active (it exists
expenses will not exceed the budget during the planning horizon (with confidence):
pr [ i
j
yijt Iijt CFt1 ] ( t ) 8
Equation 9 represents the floor (aj) and ceiling constraints (bj), respectively. Various research has incorporated the floor and ceiling constraints into mod-els of the financial portfolio (Crama & Schyns, 2003; Di Tollo & Roli, 2008). Such constraints specify the lowest and highest limits on the proportion of each industry that can be invested in a portfolio during each period.
Floor constraint is incorporated in practice to prevent excessive admin-istrative costs for small holdings that have a negligible influence on the per-formance of portfolio. Ceiling con-straint is set on the principle that excessive exposure to any portfolio constituents needs to be limited as a matter of policy.
0 aj i
Iijt bj CFt1 ( t,j ) 9
Equation 10 is the cardinality con-straint. Some researchers have incor-porated a cardinality constraint into their models of the financial portfolio (Chang et al., 2000; Di Tollo & Roli, 2008). The number of projects in the portfolio either is set to a given value or is bounded:
0 i
j
xijt K ( t ) 10
Proposed Model
In this article, a novel model for proj-ect portfolio optimization has been proposed. The main aim of the model is to determine the best projects for investing or selling at each period. In other words, the model determines the appropriate time to invest and sell the projects in order to optimize portfolio CFaR. Because of existing uncertainty in model parameters, the maxmax type of chance constrained programming is used to deal with the problem through mathematical modeling of uncertainty (Liu & Liu, 2002). In each round of simulation-based optimization, a CFaR is achieved. This trend will be contin-ued until the maximum CFaR is deter-mined from among all the achieved CFaR.
The proposed model is formulated as follows:
Equation 6 is an objective function to maximize maximum CFaR:
maxmax CFaR 6
Subject to:Equation 7 is an uncertain constraint
to achieve maximum CFaR, which is the -optimistic profit:
Pr [ 1 _ ( 11r ) t
( i
j
t zijt Sijt yijt Iijt
1 xijt ( ijt Cijt ) ) CFaR ] 7
Equation 8 is the budget constraint; it ensures that the portfolio operating
Index in Model Parameter How to EstimateIijt Required capital investment Statistical distribution (normal distribution)
Cijt Project cost Statistical distribution (normal distribution)
vijt Production volume Statistical distribution (normal distribution)
Sijt Project selling price Statistical distribution (normal distribution)
Pijt Product price Time series models
Et Exchange rate Time series models
Table 1: Explanation of parameter models.
PMJ_87569728_47_4_Aug_Sept_2016.indb 72 9/19/16 3:44 PM
August/September 2016 ■ Project Management Journal 73
as steel, copper, and aluminum, and exchange rates such as EUR/US$ and GBP/US$ from the ECOWIN database. Then, by using time series models, we fitted the best model for each factor (product prices and exchange rates). Next, we put these time series models into the proposed model as pijt.
We use AIC (Akaike Information Criterion) measure to evaluate the ade-quacy of several proposed time series models by choosing the one with the minimum AIC.
Next, to consider correlation among risk factors in the past derived from historical data, and to expand the cor-relation to future price (simulated by time series models), we generated a covariance matrix. This matrix is very important for determining the co-movement of market factors.
In the previous steps, we determined all the necessary parameters and put them into the model. Then, we nomi-nated the level of confidence for manage-rial preference regarding optimization of CFaR. For this study, CFaR is optimized at 5% (the model’s objective is to maxi-mize 5% “left tail” of cash flow) and, as mentioned in the proposed model sec-tion, this parameter in determining CFaR is a risk-aversion parameter. Changing its level can change the decision mak-er’s preference between risk and return.
In Table 2, project information is shown. For example, project 1 can be involved in the portfolio from period 1 until period 4. Also, if it is involved in the portfolio during period 2, the port-folio will incur an expenditure to invest in it, which is estimated by the normal distribution (mean is 260000 and 2 is 26000). The Opt-Quest optimizer in @Risk software is performed to deter-mine all the variables that are binary and to optimize CFaR. After running the model, the best time for investing and discarding each project is determined. The result is shown in Table 3.
For example, as you can see in Table 3, y111 1 means that project 1 in indus-try 1 must be invested at period 1 or the probability distribution of the initial
product price and production volume (units are in dollars).
pijt is the product selling price, estimated by time series models, and its unit is dollars per unit of sales. It should be noted that for projects invested abroad in which income is in other currencies (other than dol-lars)—for example, EUR or GBP—the product price must be multiplied in the exchange rate to convert the unit to dollars. Therefore, pijt in this case is replaced with (pijt 3 Et). To illustrate, if a project invested abroad produces zinc, to calculate the return in dollars, we should consider the price of zinc, the exchange rate of the related currency, and the production volume.
vijt is a sample from the probability distribution function of production vol-ume or the quantity of product that will be produced during the period. Its unit is the unit of sales.
Computational Results and DiscussionCase Example A
As a test, the proposed model is applied to maximize CFaR in a simulated case (because of the inaccessibility of real data). The case was developed to include different projects with different start times, returns, and risks in various indus-tries. The planning horizon should be specified. It depends on the accessibility of the data. If a shorter period is chosen, prediction accuracy will increase, and vice versa. Here, we assume that the planning horizon is composed of five periods. According to the research meth-odology for each project, four param-eters must be determined, including required capital investment (Iijt), project cost (Cijt), production volume (vijt), and project selling price (Sijt) in each period. These parameters are estimated by expert judgment, and probability distribution (normal) is applied to estimate them.
For considering price fluctuations in the prediction horizon and forecasting the future trend of prices, a time series analysis is used. We collected the yearly historical prices of different metals, such
in the portfolio or it is selected and has not been discarded yet), and 0 other-wise. 0ijt is another binary variable; it is equal to 1 if xijt yijt, and 0 otherwise. (It should be noted that all the binary variables are unit-less.)
Static Parameters
CFt is the cash flow at period t (at first, CF0
total available budget); aj is the mini-mum fund (capital) that must be invested in industry j; bj is the maximum fund that can be invested in industry j; and K is the maximum number of allowed projects.
and are predetermined con-fidence levels. is considered a risk-aversion parameter; to clarify, if 50%, the investor completely disregards risks and the objective is to maximize returns; also, by decreasing to 0%, the investor becomes increasingly risk-averse until he or she only wants to minimize risks. In addition, is another confidence-level parameter for an uncertainty con-straint that is determined by the decision maker. It ensures that the constraint will be satisfied at the level (in determinis-tic modeling, under a specific situation, a constraint is either satisfied or not sat-isfied; in probabilistic modeling, under a specific situation, because of probabilis-tic parameters in the model, a constraint will be satisfied with different possibility levels—for example, a constraint is satis-fied in a 90% level through simulation and the other constraint is satisfied in an 80% level).
Probabilistic Parameters
Iijt is a sample from the probabil-ity distribution function of the initial required capital (for selecting the proj-ect in the portfolio; units are in dollars). Cijt is a sample from the probability distribution function of the project cost (capital expenses during each period; units are in dollars). Sijt is a sample from the probability distribution function of the project selling price (for discarding project from the portfolio; units are in dollars). r is a probability distribution function of the discount rate. And ijt is the project return, which depends on
PMJ_87569728_47_4_Aug_Sept_2016.indb 73 9/19/16 3:44 PM
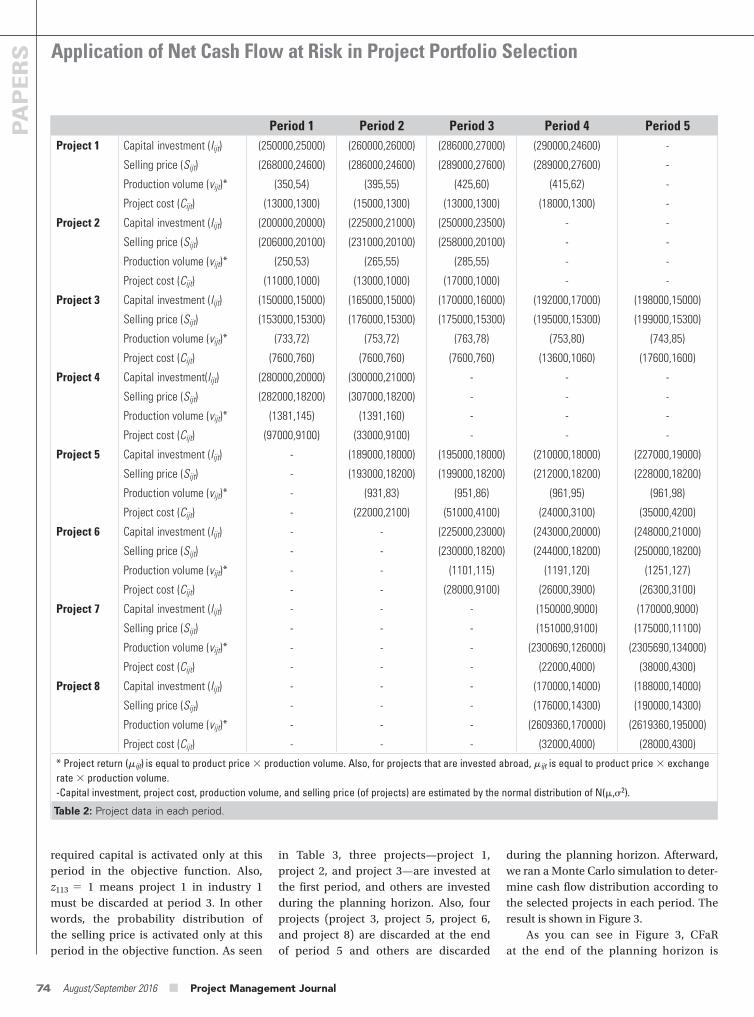
Application of Net Cash Flow at Risk in Project Portfolio Selection
74 August/September 2016 ■ Project Management Journal
PAPERS
Period 1 Period 2 Period 3 Period 4 Period 5Project 1 Capital investment (Iijt) (250000,25000) (260000,26000) (286000,27000) (290000,24600) -
Selling price (Sijt) (268000,24600) (286000,24600) (289000,27600) (289000,27600) -
Production volume (vijt)* (350,54) (395,55) (425,60) (415,62) -
Project cost (Cijt) (13000,1300) (15000,1300) (13000,1300) (18000,1300) -
Project 2 Capital investment (Iijt) (200000,20000) (225000,21000) (250000,23500) - -
Selling price (Sijt) (206000,20100) (231000,20100) (258000,20100) - -
Production volume (vijt)* (250,53) (265,55) (285,55) - -
Project cost (Cijt) (11000,1000) (13000,1000) (17000,1000) - -
Project 3 Capital investment (Iijt) (150000,15000) (165000,15000) (170000,16000) (192000,17000) (198000,15000)
Selling price (Sijt) (153000,15300) (176000,15300) (175000,15300) (195000,15300) (199000,15300)
Production volume (vijt)* (733,72) (753,72) (763,78) (753,80) (743,85)
Project cost (Cijt) (7600,760) (7600,760) (7600,760) (13600,1060) (17600,1600)
Project 4 Capital investment(Iijt) (280000,20000) (300000,21000) - - -
Selling price (Sijt) (282000,18200) (307000,18200) - - -
Production volume (vijt)* (1381,145) (1391,160) - - -
Project cost (Cijt) (97000,9100) (33000,9100) - - -
Project 5 Capital investment (Iijt) - (189000,18000) (195000,18000) (210000,18000) (227000,19000)
Selling price (Sijt) - (193000,18200) (199000,18200) (212000,18200) (228000,18200)
Production volume (vijt)* - (931,83) (951,86) (961,95) (961,98)
Project cost (Cijt) - (22000,2100) (51000,4100) (24000,3100) (35000,4200)
Project 6 Capital investment (Iijt) - - (225000,23000) (243000,20000) (248000,21000)
Selling price (Sijt) - - (230000,18200) (244000,18200) (250000,18200)
Production volume (vijt)* - - (1101,115) (1191,120) (1251,127)
Project cost (Cijt) - - (28000,9100) (26000,3900) (26300,3100)
Project 7 Capital investment (Iijt) - - - (150000,9000) (170000,9000)
Selling price (Sijt) - - - (151000,9100) (175000,11100)
Production volume (vijt)* - - - (2300690,126000) (2305690,134000)
Project cost (Cijt) - - - (22000,4000) (38000,4300)
Project 8 Capital investment (Iijt) - - - (170000,14000) (188000,14000)
Selling price (Sijt) - - - (176000,14300) (190000,14300)
Production volume (vijt)* - - - (2609360,170000) (2619360,195000)
Project cost (Cijt) - - - (32000,4000) (28000,4300)
* Project return (ijt) is equal to product price 3 production volume. Also, for projects that are invested abroad, ijt is equal to product price 3 exchange rate 3 production volume.-Capital investment, project cost, production volume, and selling price (of projects) are estimated by the normal distribution of N(m,2).
Table 2: Project data in each period.
required capital is activated only at this period in the objective function. Also, z113 1 means project 1 in industry 1 must be discarded at period 3. In other words, the probability distribution of the selling price is activated only at this period in the objective function. As seen
in Table 3, three projects—project 1, project 2, and project 3—are invested at the first period, and others are invested during the planning horizon. Also, four projects (project 3, project 5, project 6, and project 8) are discarded at the end of period 5 and others are discarded
during the planning horizon. Afterward, we ran a Monte Carlo simulation to deter-mine cash flow distribution according to the selected projects in each period. The result is shown in Figure 3.
As you can see in Figure 3, CFaR at the end of the planning horizon is
PMJ_87569728_47_4_Aug_Sept_2016.indb 74 9/19/16 3:44 PM
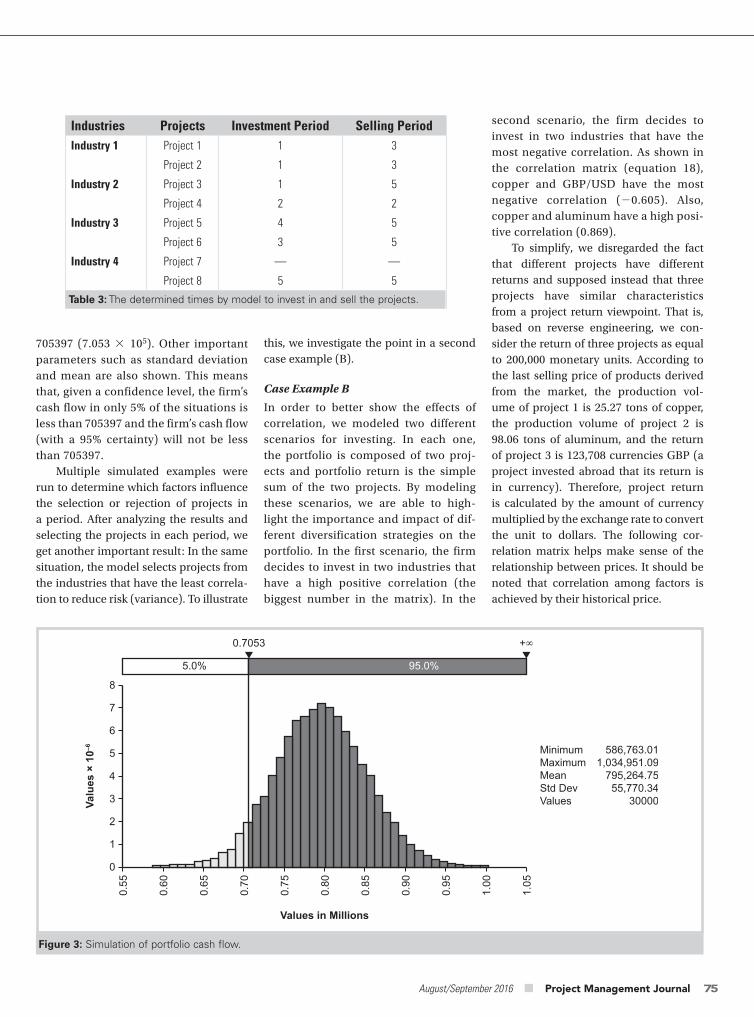
August/September 2016 ■ Project Management Journal 75
second scenario, the firm decides to invest in two industries that have the most negative correlation. As shown in the correlation matrix (equation 18), copper and GBP/USD have the most negative correlation (0.605). Also, copper and aluminum have a high posi-tive correlation (0.869).
To simplify, we disregarded the fact that different projects have different returns and supposed instead that three projects have similar characteristics from a project return viewpoint. That is, based on reverse engineering, we con-sider the return of three projects as equal to 200,000 monetary units. According to the last selling price of products derived from the market, the production vol-ume of project 1 is 25.27 tons of copper, the production volume of project 2 is 98.06 tons of aluminum, and the return of project 3 is 123,708 currencies GBP (a project invested abroad that its return is in currency). Therefore, project return is calculated by the amount of currency multiplied by the exchange rate to convert the unit to dollars. The following cor-relation matrix helps make sense of the relationship between prices. It should be noted that correlation among factors is achieved by their historical price.
this, we investigate the point in a second case example (B).
Case Example B
In order to better show the effects of correlation, we modeled two different scenarios for investing. In each one, the portfolio is composed of two proj-ects and portfolio return is the simple sum of the two projects. By modeling these scenarios, we are able to high-light the importance and impact of dif-ferent diversification strategies on the portfolio. In the first scenario, the firm decides to invest in two industries that have a high positive correlation (the biggest number in the matrix). In the
705397 (7.053 3 105). Other important parameters such as standard deviation and mean are also shown. This means that, given a confidence level, the firm’s cash flow in only 5% of the situations is less than 705397 and the firm’s cash flow (with a 95% certainty) will not be less than 705397.
Multiple simulated examples were run to determine which factors influence the selection or rejection of projects in a period. After analyzing the results and selecting the projects in each period, we get another important result: In the same situation, the model selects projects from the industries that have the least correla-tion to reduce risk (variance). To illustrate
Industries Projects Investment Period Selling PeriodIndustry 1 Project 1 1 3
Project 2 1 3
Industry 2 Project 3 1 5
Project 4 2 2
Industry 3 Project 5 4 5
Project 6 3 5
Industry 4 Project 7 — —
Project 8 5 5
Table 3: The determined times by model to invest in and sell the projects.
Figure 3: Simulation of portfolio cash flow.
Values in Millions
0.55
1.00
0.95
0.90
0.85
0.80
0.75
0.70
0.65
0.60
1.05
7
8
6
5
4
3
2
1
0
Valu
es ×
10–6
5.0% 95.0%
0.7053 +∞
MinimumMaximumMeanStd DevValues
586,763.011,034,951.09
795,264.7555,770.34
30000
PMJ_87569728_47_4_Aug_Sept_2016.indb 75 9/19/16 3:44 PM
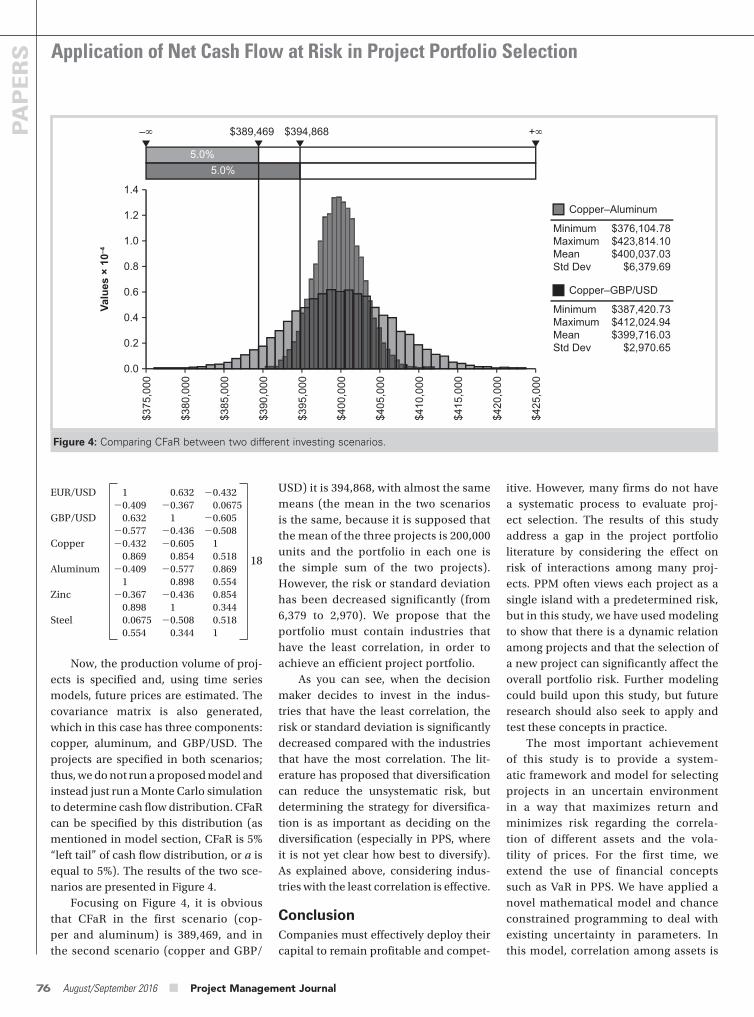
Application of Net Cash Flow at Risk in Project Portfolio Selection
76 August/September 2016 ■ Project Management Journal
PAPERS
itive. However, many firms do not have a systematic process to evaluate proj-ect selection. The results of this study address a gap in the project portfolio literature by considering the effect on risk of interactions among many proj-ects. PPM often views each project as a single island with a predetermined risk, but in this study, we have used modeling to show that there is a dynamic relation among projects and that the selection of a new project can significantly affect the overall portfolio risk. Further modeling could build upon this study, but future research should also seek to apply and test these concepts in practice.
The most important achievement of this study is to provide a system-atic framework and model for selecting projects in an uncertain environment in a way that maximizes return and minimizes risk regarding the correla-tion of different assets and the vola-tility of prices. For the first time, we extend the use of financial concepts such as VaR in PPS. We have applied a novel mathematical model and chance constrained programming to deal with existing uncertainty in parameters. In this model, correlation among assets is
USD) it is 394,868, with almost the same means (the mean in the two scenarios is the same, because it is supposed that the mean of the three projects is 200,000 units and the portfolio in each one is the simple sum of the two projects). However, the risk or standard deviation has been decreased significantly (from 6,379 to 2,970). We propose that the portfolio must contain industries that have the least correlation, in order to achieve an efficient project portfolio.
As you can see, when the decision maker decides to invest in the indus-tries that have the least correlation, the risk or standard deviation is significantly decreased compared with the industries that have the most correlation. The lit-erature has proposed that diversification can reduce the unsystematic risk, but determining the strategy for diversifica-tion is as important as deciding on the diversification (especially in PPS, where it is not yet clear how best to diversify). As explained above, considering indus-tries with the least correlation is effective.
ConclusionCompanies must effectively deploy their capital to remain profitable and compet-
EUR/USD 1 0.632 0.4320.409 0.367 0.0675
GBP/USD 0.632 1 0.6050.577 0.436 0.508
Copper 0.432 0.605 10.869 0.854 0.518
Aluminum 0.409 0.577 0.8691 0.898 0.554
Zinc 0.367 0.436 0.8540.898 1 0.344
Steel 0.0675 0.508 0.5180.554 0.344 1
18
Now, the production volume of proj-ects is specified and, using time series models, future prices are estimated. The covariance matrix is also generated, which in this case has three components: copper, aluminum, and GBP/USD. The projects are specified in both scenarios; thus, we do not run a proposed model and instead just run a Monte Carlo simulation to determine cash flow distribution. CFaR can be specified by this distribution (as mentioned in model section, CFaR is 5% “left tail” of cash flow distribution, or a is equal to 5%). The results of the two sce-narios are presented in Figure 4.
Focusing on Figure 4, it is obvious that CFaR in the first scenario (cop-per and aluminum) is 389,469, and in the second scenario (copper and GBP/
Figure 4: Comparing CFaR between two different investing scenarios.
$425
,000
$415
,000
$410
,000
$405
,000
$400
,000
$395
,000
$390
,000
$385
,000
$380
,000
$375
,000
$420
,000
1.4
1.2
1.0
0.8
0.6
0.4
0.2
0.0
Valu
es ×
10–4
5.0%5.0%
$394,868$389,469 +∞–∞
MinimumMaximumMeanStd Dev
$376,104.78$423,814.10$400,037.03
$6,379.69
Copper–Aluminum
MinimumMaximumMeanStd Dev
$387,420.73$412,024.94$399,716.03
$2,970.65
Copper–GBP/USD
PMJ_87569728_47_4_Aug_Sept_2016.indb 76 9/19/16 3:44 PM
August/September 2016 ■ Project Management Journal 77
cornerstones of Markowitz’s theory of the optimal portfolio. From a financial perspective, a covariance matrix is used to establish a link between the risk factors originated from the market variables. In other words, the covariance matrix con-siders price fluctuations and their corre-lations. The matrix is based on historical data series of market price movements, collected from the ECOWIN database.
This matrix provides us not only with the variability of individual mar-ket factors, but also the CO-movement (the correlated or similar movement) of the market factors. Thus, it would contribute to our understanding of the price process of the portfolio and con-sequently the model’s ability to provide accurate and reliable volatility forecasts. It should be noted that the covariance matrix is considered and generated only for the market factors and not for proj-ects. Therefore, the number of com-ponents of this matrix is equal to the number of historical data points that have been obtained from the market.
This matrix catches the variance and correlation in data (Alexander, 2008). Variance and covariance are often dis-played together in a variance-covariance matrix. The variances appear along the diagonal and covariance appears in the off-diagonal elements, as shown below.
variance-covariance matrix
var(1) cov(1, 2) . . . cov(1, k)
cov(2, 1) var(2) . . . cov(2, k)
. . . . . . . . . . . .
cov(k, 1) cov(k, 2) . . . var(k)
A.1
Simulation-Based Optimization
ReferencesAlexander, C. (2008). Moving average models for volatility and correlation, and covariance matrices. Handbook of finance. New York, NY: John Wiley & Sons.
Andrén, N., Jankensgård, H., & Oxelheim, L. (2005). Exposure-based cash-flow-at-risk: An alternative to VaR for industrial companies. Journal of Applied Corporate Finance, 17(3), 76–86.
model is a generalized autoregressive conditional (GARCH) model. Applica-tions of GARCH models are widespread in situations where the volatility of return is mainly considered. GARCH models, especially in financial applications, have become important tools for the analysis of time series data. They are particularly useful when the goal of the study is to analyze and forecast volatility.
A GARCH (p, q) model is more suit-able for capturing the dynamics of a time series conditional variance. Generally, a GARCH (p, q) model is expressed as:
t _ t1
N ( 0,t ) (A.1)
t √ _
tut , ut N ( 0,1 ) (A.2)
t 1 p
t1 i
2ti 1
q
j1 j tj (A.3)
Where p 0, q 0, . 0, i 0 (i 1, 2, . . . p), j 0 (j 1, 2, . . . q), p is the order of GARCH terms and q is the order of the terms 2. An autoregres-sive integrated moving average (ARIMA) model is used widely for forecasting non-stationary time series, expressed as fol-lows (Tan et al., 2010):
0(B)(1B)dXt (B)t (A.4)
Where Xt is a nonstationary time series at time t, t is white noise (with constant variance and zero mean), and d is the order of differencing. B is a back-ward shift operator defined by BXt
Xt1, 0(B) 101B02B2. . . 0pBp, and (B) is the moving average operator defined as (B) 101B02B2. . . 0qBq
(Tan et al., 2010) AIC measure is used to evaluate the adequacy of the model by choosing the one that minimizes AIC from several possible models.
Covariance Matrix
A covariance matrix (variance-covariance matrix) is a matrix whose element in the ith row and jth column is the covariance between the ith row and jth elements. The covariance matrix has a long history in financial analytics, and it is one of the
considered by covariance matrix, and time series models are used to fore-cast the volatility of prices. Moreover, a new risk-aversion parameter (a) is applied that enables the decision maker to determine the desirable level of risk. Analysis of the results indicates that the best outcomes occur when projects are selected from industries that have the least correlation (all else being equal). In other words, this study suggests that decision makers should invest in indus-tries with the lowest levels of correlation to decrease overall risk.
LimitationsThe result of this study should be evalu-ated keeping in mind the limitations of modeling and the fact that the choice of methods and the assumptions will affect the outcomes. For example, in this study we proposed that some data should be estimated by expert judgment and we applied a probabilistic distribution (such as the normal distribution); such estimations, however, may decrease the estimation accuracy.
AcknowledgmentMasoud Mohammad Sharifi would spe-cifically like to emphasize the ongoing and undeniable support of Saeide Bah-rani during the completion of this study, and to whom he dedicates this article.
AppendixPrice Volatility
Financial markets are affected by unex-pected changes both in the money supply and in the fluctuations of money. There-fore, the prediction of price volatility seems to be an essential part of ana-lyzing these markets. Management can use a history analysis (like a time series analysis) to make current decisions and plans based on long-term forecasting. A time series is a set of observations, each recorded at time span t. Autoregressive-moving-average (ARMA) models prepare a parsimonious description of a (weakly) stationary stochastic process. If an autoregressive-moving-average model is assumed for the error variance, the
PMJ_87569728_47_4_Aug_Sept_2016.indb 77 9/19/16 3:44 PM
Application of Net Cash Flow at Risk in Project Portfolio Selection
78 August/September 2016 ■ Project Management Journal
PAPERS
for non-financial firms. Journal of Applied Corporate Finance, 13(4), 100–109.
Subbu, R., Bonnissone, P.P., Eklund, N., Bollapragada, S., & Chalermkraivuth, K. (2005). Multiobjective financial portfolio design: A hybrid evolutionary approach. In The 2005 IEEE Congress on Evolutionary Computation (pp. 1722–1729). IEEE.
Tan, Z., Zhang, J., Wang, J., & Zu, J. (2010). Day-ahead electricity price forecasting using wavelet transform combined with ARIMA and GARCH models. Applied Energy, 87(11), 3606–3610.
Teller, J. (2013). Portfolio risk management and its contribution to project portfolio success: An investigation of organization, process, and culture. Project Management Journal, 44(2), 36–51.
Walls, M.R. (2004). Combining decision analysis and portfolio management to improve project selection in the exploration and production firm. Journal of Petroleum Science and Engineering, 44(1), 55–65.
Xia, Y., Liu, B., Wang, J., & Lai, K. (2000). A model for portfolio selection with order of expected returns. Computers & Operations Research, 27(5), 409–422.
Masoud Mohammad Sharifi studied metallurgical engineering at Islamic Azad University of Najafabad, known as one of the best private sector universities in Iran. Working in different companies while attending school gave him the opportunity to become more familiar with real-world managerial problems. Because of his great desire to continue his studies, Masoud decided to return to the university. With his combined interests in both management and mathematics, he transferred to industrial engineering to take courses closer to managerial concepts and in the final year of his program, he became interested in operations research and studied the topic widely. Masoud completed his master’s degree and is interested in pursuing his PhD in the United States. He can be contacted at [email protected]
Mojtaba Safari received his master’s degree in industrial engineering from Iran University of Science and Technology, Tehran, Iran and is interested in pursuing his PhD in the United States. His main fields of interest are project management, OR, and operation management. Mojtaba lives in Isfahan, Iran. He can be contacted at [email protected]
Ghasemzadeh, F., & Archer, N.P. (2000). Project portfolio selection through decision support. Decision Support Systems, 29(1), 73–88.
Gueorguiev, S., Harman, M., & Antoniol, G. (2009). Software project planning for robustness and completion time in the presence of uncertainty using multi objective search based software engineering. In Proceedings of the 11th Annual conference on genetic and evolutionary computation (pp. 1673–1680). New York, NY: Association for Computing Machinery.
Jorion, P. (2007). Value at risk: The new benchmark for managing financial risk. New York, NY: McGraw-Hill.
Khalili-Damghani, K., & Tavana, M. (2014). A comprehensive framework for sustainable project portfolio selection based on structural equation modeling. Project Management Journal, 45(2), 83–97.
Kleijnen, J.P.C., & Wan, J. (2007). Optimization of simulated systems: OptQuest and alternatives. Simulation Modelling Practice and Theory, 15(3), 354–362.
Liu, B., & Liu, B. (2002). Theory and practice of uncertain programming. New York, NY: Springer.
Maringer, D., & Kellerer, H. (2003). Optimization of cardinality constrained portfolios with a hybrid local search algorithm. OR Spectrum, 25(4),481–495.
Markowitz, H. (1952). Portfolio selection. The Journal of Finance, 7(1), 77–91.
Paquin, J.P., Tessier, D., & Gauthier, C. (2015). The effectiveness of portfolio risk diversification: An additive approach by project replication. Project Management Journal, 46(5), 94–110.
Project Management Institute. (2013). A guide to the project management body of knowledge (PMBOK® guide) – Fifth edition. Newtown Square, PA: Author.
Sak, H., & Haksöz, Ç. (2011). A copula-based simulation model for supply portfolio risk. The Journal of Operational Risk, 6(3), 15–38.
Stein, J.C., Usher, S.E., LaGattuta, D., & Youngen, J. (2001). A comparables approach to measuring cashflow-at-risk
April, J., Glover, F., Kelly, J., & Laguna, M. (2001). Simulation/optimization using. In Simulation Conference, 2001. Proceedings of the 33nd conference on Winter simulation (pp. 134–138). Washington, DC: IEEE Computer Society.
Ghasemzadeh, F. & Archer, N.P. (2000). Project portfolio selection through decision support. Decision Support Systems, 29(1), 73–88.
Better, M., & Glover, F. (2006). Selecting project portfolios by optimizing simulations. The Engineering Economist, 51(2), 81–97.
Chang, T.J., Meade, N., Beasley, J.R., & Sharaiha, Y.M. (2000). Heuristics for cardinality constrained portfolio optimisation. Computers & Operations Research, 27(13), 1271–1302.
Crama, Y., & Schyns, M. (2003). Simulated annealing for complex portfolio selection problems. European Journal of Operational Research, 150(3), 546–571.
Di Tollo, G., & Roli, A. (2008). Metaheuristics for the portfolio selection problem. International Journal of Operations Research, 5(1), 13–35.
Donkor, E.A., & Duffey, M. (2013). Optimal capital structure and financial risk of project finance investments: A simulation optimization model with chance constraints. The Engineering Economist, 58(1), 19–34.
Dou, Y., Zhang, P., Bingfeng, G., Jiang, J., & Yingwu, C. (2014). An integrated technology pushing and requirement pulling model for weapon system portfolio selection in defence acquisition and manufacturing. Proceedings of the Institution of Mechanical Engineers, Part B: Journal of Engineering Manufacture. DOI: 10.1177/0954405414534640
Du, X. & Li, A.N. (2008). Monte Carlo simulation and a value-at-risk of concessionary project: The case study of the Guangshen Freeway in China. Management Research News, 31(12), 912–921.
Eydeland, A., & Wolyniec, K. (2003). Energy and power risk management: New developments in modeling, pricing, and hedging (Vol. 206). New York, NY: John Wiley & Sons.
PMJ_87569728_47_4_Aug_Sept_2016.indb 78 9/19/16 3:44 PM
August/September 2016 ■ Project Management Journal 79
PA
PE
RS Balancing Open and Closed Innovation in
Megaprojects: Insights from CrossrailThomas Worsnop, Ove Arup & Partners, London, England Stefano Miraglia, University College London, England Andrew Davies, University College London, England
INTRODUCTION
Megaprojects are large-scale investments aiming to design and build, under varying degrees of public and private control, physical infrastructures such as transport, water, energy, and other utility systems (Altshuler & Luberoff, 2003; Flyvbjerg,
Bruzelius, & Rothengatter, 2003; Merrow, 2011). Led by a combination of a large client and a prime contractor, or joint-venture delivery partner (Brady & Davies, 2014), a megaproject is a complex temporary organization comprising a large number of firms, all contributing to realize investments that range from US$250 million to US$1 billion and more (Altshuler & Luberoff, 2003; Flyvbjerg et al., 2003). Given their complexity, and the involvement of a large number of organizational and individual participants, megaprojects represent ideal settings for fostering innovation in the construction industry (Davies, MacAulay, DeBarro, & Thurston, 2014; DeBarro et al., 2015); however, researchers have only started to investigate how innovation occurs in megaprojects. In particular, a group of studies has begun to address different but related problems associated with the pursuit of innovation in these settings. Davies et al. (2014) have identified the process by which project managers can organize for and manage innovation in megaprojects. DeBarro et al. (2015) have examined the challenges involved and illustrated the organizational structure and procedures that can be put in place to overcome them. Davies, Gann, and Douglas (2009) have proposed a model of system integration through which organizations involved in megaprojects can learn to overcome difficulties and improve project performance. Finally, Dodgson, Gann, MacAulay, and Davies (2015) have investigated the bundles of capabilities needed to run an innovation program and implement innovative ideas successfully. In this study, we addressed a complementary problem, and sought to understand how two types of innovation, open and closed, can be balanced within innovation programs in megaprojects.
Innovation is defined as the development, implementation, and exploita-tion of a novel idea, scheme, or formula (Dodgson, Gann, & Salter, 2008; Van de Ven, 1986). But how innovation is developed and implemented depends on the specific characteristics of the organizational setting. Studies of innovation have largely focused on the firm—that is, the permanent organization—to examine how it develops the capabilities to leverage innovative ideas gen-erated in-house, through research and development (R&D), or captured from external sources (Dodgson, Gann, & Phillips, 2013). Yet, innovation in megaprojects involves more complex processes (Dodgson et al., 2015), which often unfold beyond the boundaries of individual organizations, as large coalitions of temporary (joint-ventures, special-purpose vehicles, or delivery partners) and permanent organizations (client, contractors, subcontractors) are established to achieve a specific goal and then disbanded when that goal
Project Management Journal, Vol. 47, No. 4, 79–94
© 2016 by the Project Management Institute
Published online at www.pmi.org/PMJ
We studied the interplay between open and
closed innovation at Crossrail, Europe’s larg-
est civil engineering project—aiming to build
a suburban railway system in London. Our
findings suggest that open and closed inno-
vation can be combined by creating an
appropriate communication and exchange
environment, whose elements include orga-
nizational arrangements (e.g., team organi-
zation and task assignment) and methods
and rules of communication. We also found
that innovation in megaprojects can be suc-
cessfully driven when the contractors are
encouraged to search for and implement
incremental solutions to minor problems,
not just radical and strategically relevant
innovations.
KEYWORDS: sources of innovation;
open innovation; megaprojects; temporary
organizations
ABSTRACT ■
PMJ_87569728_47_4_Aug_Sept_2016.indb 79 9/19/16 3:44 PM
Balancing Open and Closed Innovation in Megaprojects: Insights from Crossrail
80 August/September 2016 ■ Project Management Journal
PAPERS
uncertain environments by encouraging learning through creativity and impro-visation (Loch, DeMeyer, & Pich, 2011). Extant literature has investigated several dimensions of innovation in the construc-tion industry (Manseau & Shields, 2005), including the several types and scopes of innovation (Slaughter, 1998), the inherent complexity (Gil, 2007; Shenhar & Dvir, 2013), and the related processes (Tether & Metcalfe, 2003; Winch, 1998; Winch & Carr, 2001), challenges (Gann et al., 1998; Slaughter, 1998), and impediments (Bernstein & Lemer, 1996). However, innovation in megaprojects is a relatively new and not fully understood phenom-enon. A traditional concern with mini-mizing costs and avoiding additional risk has discouraged efforts aiming to improve project performance through experimen-tation and learning (van Marrewijk, Clegg, Pitsis, & Veenswijk, 2008). In fact, while innovation management tends to offset the risks and opportunities of experimen-tation, project management tends to asso-ciate risks with negative outcomes, such as higher costs and delays (Macaulay, Davies, & Dodgson, 2014). Therefore, innovations are traditionally pursued and implemented within firms—that is, rela-tively permanent organizations—but for-mal innovation strategies do not usually exist for megaprojects intended as auton-omous but temporary organizational set-tings (Davies et al., 2014; Dodgson et al., 2008). Although many large contractors involved in megaprojects have developed strategies and capabilities to exploit firm-level innovative ideas across projects, and improve their chances of survival and long-term growth (Dodgson et al., 2008), the transitory nature of project activities restricts the opportunities for innovating within megaprojects (Davies et al., 2014). Moreover, the temporary organizations set up for delivering megaprojects are usually not endowed with independent innova-tion capabilities, and do not have specific incentives to develop them. As a result, innovation in megaprojects has gener-ally been limited to seeking new ways of controlling and reducing costs and risk, or enabling earlier project completion.
2011; Shenhar & Dvir, 2013). A client, often a public authority, is responsible for setting up a temporary organization with the purpose of coordinating a large network of firms involved in the design, construction, and handover of the phys-ical infrastructure, and managing the relationships with external stakeholders. To do so, the client may rely on capabili-ties available in-house, and/or appoint a prime contractor or delivery partner (a joint venture, or “special-purpose vehicle”). The delivery of each of the individual projects within the overall program is assigned to permanent orga-nizations, such as contractors and sub-contractors.
Megaprojects represent ideal set-tings for fostering innovation in the construction industry. The complex exchanges taking place within these large networks of individuals and firms often encourage the adoption of novel modes of organizing and foster experi-mentation with new products and practices. Such innovations often have industry-wide impacts beyond perfor-mance improvements (cf. Gann, Wang, & Hawkins, 1998). For example, pioneer-ing megaprojects recently delivered in the United Kingdom, such as Heathrow Terminal 5 and the London 2012 Olym-pics and Paralympics construction pro-gram, have shown that innovation and learning can improve project perfor-mance substantially (Davies et al., 2009; Davies & Mackenzie, 2014). Although the London 2012 Olympics program did not have a formal innovation strategy, the motivational impact that working on the Olympics had on project teams (the “Olympic effect”), and the sense of urgency associated with unnegotiable deadlines imposed by the fixed opening date, encouraged innovative ideas and solutions, as exemplified by the note-worthy re-design of the Velodrome roof (Mackenzie & Davies, 2011).
Innovation is generally regarded as the “successful commercial exploita-tion of new ideas” (Dodgson et al., 2013; Dodgson et al., 2008) and it allows orga-nizations to thrive in fast-changing and
has been achieved. Therefore, while business firms develop and implement innovation strategies to survive and compete in the long run, innovation in megaprojects involves attracting new ideas from multiple sources—including temporary and permanent organiza-tions that form the supply chain—and leveraging them as effectively as pos-sible for the duration of the project (Davies et al., 2014; DeBarro et al., 2015). The inherent innovation pro-cesses can be ‘closed,’ when occurring internally to individual firms, or ‘open,’ that is, undertaken in collaboration with large networks of actors, including individuals, businesses, universities, and public bodies (Chesbrough, 2006).
We referred to these two dimensions—openness and closeness—to investigate the interplay between different sources of innovation in Crossrail, Europe’s largest civil engineering project, aiming to build a £14.8 billion (approximately US$22 bil-lion) suburban railway system in London by 2019. Previous research has explicated how Crossrail Limited, a wholly owned subsidiary and special-purpose vehicle of Transport for London (the client), developed and implemented an innova-tion strategy to help the main contractors involved in the project to generate new ideas, practices, and technologies (Davies et al., 2014). For the purposes of this arti-cle, we studied the early outcomes of such innovation strategy to identify drivers and sources of innovation within the over-all program. Our findings highlight the potential advantages of adopting open innovation in megaprojects. Specifically, we illustrate the challenges and benefits associated with managing at the program level the interplay between open and closed models of innovation, and striking the right balance between the two.
Innovation in MegaprojectsMegaprojects and Innovation Strategies
A megaproject is a temporary inter-organizational setting (Jones & Lichten-stein, 2008; Winch, 2014) established to build a complex, large-scale system or “system of systems” (Dvir & Shenhar,
PMJ_87569728_47_4_Aug_Sept_2016.indb 80 9/19/16 3:44 PM
August/September 2016 ■ Project Management Journal 81
to where, within the complex megapro-ject organization, innovative ideas are generated—that is, the sources of inno-vation. We know that innovative ideas can originate from users, manufactur-ers, or suppliers, depending on the specific relationship the potential inno-vators have with the product, process, or service being innovated (von Hippel, 1988). In certain industries, users play a key role in bringing forth new ideas and promoting improvements of exist-ing products and services that solve problems for a limited number of ben-eficiaries (von Hippel, 1988, 2005). In projects, however, it is the producer layer—that is, the firms responsible for carrying out the project, as well as their suppliers—that generally drives most innovations (Dodgson et al., 2015; Gann, 2001), although user-driven innovations can still arise from the parties involved in the use of the project output, such as operators, consumers, and end-users. Extant literature has underlined that in multi-firm collaborative settings—of which megaprojects are a noteworthy example—certain organizations play a fundamental role as lead innovators (Baldwin & von Hippel, 2011), in that they guide the innovation process for the development of novel products and/or the discovery of new functions (von Hippel, 2005). Although it is reason-able to expect that within the complex setting of a megaproject lead innova-tors will certainly exist, little is known about the interplay between ideas gen-erated within the individual projects and ideas borrowed from other projects, or from the external environment. And this makes it difficult to predict exactly where the most valuable innovations arise and how it can be leveraged (von Hippel, 2005).
Until recently, internal R&D capa-bilities were viewed as a key strate-gic asset for organizations, because they are often able to erect barriers to entry in a given market or whole industry (Chesbrough, 2004). This form of closed innovation usually involves seeking and generating ideas from
Researchers have started to dem-onstrate that a different approach can be adopted. Recent empirical stud-ies have found that the performance of megaprojects can be enhanced by embedding in the project activities and routines the technologies and best practices developed on other programs, and devising specific mechanisms for fostering innovation, such as new pro-curement, contract, and organizational strategies (Davies et al., 2009). For example, the use of integrated project teams, and appropriate procurement routes, such as the NEC3 Engineering and Construction Contract,1 play an important role in stimulating contrac-tor-led innovation (Hansford & Pitcher, 2013). Early engagement of contrac-tors at the design stage encourages the proposal and evaluation of innovative solutions, incentivizes collaborative behaviors, and mitigates adversarial relationships, conflict, and opportun-ism. The use of target-cost forms of contracts also provides the opportu-nity to attain greater rewards, and sets incentives to implementing innova-tions. These findings are encouraging scholars and practitioners alike to fur-ther investigate the factors that enable innovation in megaprojects.
Closed and Open Innovation in Megaprojects
Innovation can be studied along several dimensions. With regard to its mag-nitude and impact, it can range from minor, incremental improvements (von Hippel, 2005) to the pursuit of funda-mentally different approaches leading to radical breakthroughs (Bayus, 2013). A second dimension concerns the entity being innovated, which can be a firm’s product, service, process, or overall business model. A third dimension par-ticularly relevant to this study pertains
within the organization, in a way that makes firms self-reliant in terms of availability, capability, and quality of the new ideas (Chesbrough, 2006). The development and increasing com-plexity of modern technologies have driven the transition toward an open and distributed form of innovation process (Chesbrough, 2003; von Hip-pel, 2005), which involves attracting and implementing ideas from other firms and organizations, or even large and dispersed “crowds” of non-experts (Bayus, 2013). Introducing ideas from outside the firm not only increases the possible sources of innovation, it also places emphasis on a new range of capabilities required to establish and develop weak-tie collaborations (Chesbrough, 2004), manage external proponents of unsolicited innovations, allow intellectual property and ideas to flow freely, strengthen problem-solving capabilities, and maintain an overall nimble and proactive organization (Chesbrough, 2003). On the one hand, open innovation can lead to transac-tion cost advantages over organizations with large in-house R&D capabilities (Baldwin & von Hippel, 2011). On the other hand, it also entails the chal-lenge of controlling a large amount of potentially innovative ideas, many of which are low quality (Alexy, Criscuolo, & Ammon, 2012). In fact, an important precondition for open innovation is the focal firm’s engagement with its organi-zational ecosystem (Alexy, Criscuolo, & Ammon, 2012). By voluntarily and stra-tegically revealing its own innovative knowledge and ideas to the ecosystems, the firm can source creative solutions to particular problems or obtain sup-port to overcoming specific obstacles (Alexy, George, & Salter, 2013). Open-ing up innovative ideas also raises issues over intellectual property, and entails that the firm put in place appro-priate mechanisms of protection—for example, patents, copyright manage-ment systems, trademarks, industrial designs, and so forth—without which securing successfully the economic
1The NEC3 Engineering and Construction Contract is a
standard contract created by the Institution of Civil Engineers
to stimulate good project management practice on civil
engineering and construction projects.
PMJ_87569728_47_4_Aug_Sept_2016.indb 81 9/19/16 3:44 PM
Balancing Open and Closed Innovation in Megaprojects: Insights from Crossrail
82 August/September 2016 ■ Project Management Journal
PAPERS
benefits of innovations can be com-plicated and expensive. Despite the inherent challenges, individuals and organizations are increasingly willing to reveal innovative ideas to their eco-system and the public domain (Alexy, Criscuolo, & Salter, 2009). As a result, innovation management is increasingly becoming a social endeavor, whose effectiveness and success depend on a focal organization’s ability to pursue high quality innovations (as opposed to the quantity of new ideas), and put in place organizational mechanisms that help individuals and teams to dis-cuss, select, and improve their ideas before implementing them (Kijkuit & van den Ende, 2010). Although extant literature has investigated the different sources of innovation extensively, our understanding of how closed and open innovation interact in large multi-organizational programs is still limited. Hence we ask: How can the interplay between sources of innovation be man-aged and leveraged in megaprojects?
In the remainder of the article, we provide an account of the research design and methods adopted to answer this question, illustrate the findings from our analysis, and discuss the inter-play between sources of innovation at Crossrail. Because Crossrail was in the construction phase at the time of data collection, we could not include in our analysis innovations implemented by end-users when the railway became operational. We focused on the major sources of innovative ideas on the producer’s side (the network of firms involved in the delivery of the megapro-ject), investigating the drivers behind such innovative ideas, and paying par-ticular attention to how the interplay between closed and open innovation was managed and leveraged across the program.
MethodsTo answer the above question, we stud-ied Crossrail, the first megaproject in the United Kingdom’s construction indus-try to introduce a formal innovation
strategy, known as the Crossrail Inno-vation Program. Previous innovations in megaprojects have aimed to enact unique delivery mechanisms, such as the “T5 Agreement” for Heathrow Ter-minal 5, but have not sought to develop and implement innovations as a stra-tegic priority of the megaproject itself. Crossrail has challenged previous approaches by devising a groundbreak-ing innovation strategy, and putting in place specific organizational arrange-ments for encouraging, funding, and implementing innovations in each of the projects that were parts of the pro-gram (Davies et al., 2014). To create opportunities for value creation during the delivery of the megaproject, the innovation program incentivized the generation of innovative ideas within each project, as well as the implementa-tion of ideas proposed by other projects, in two ways: (1) through a system of competitions and awards, the Crossrail Innovation Competitions; and (2) by formally documenting each innovation, and publishing it on a web-based repos-itory (or portal) called “Innovate18.”
Adopting a case study design (Yin, 2013), we focused on the temporary organizations that generated, devel-oped, and implemented innovative ideas on site, during the execution phase: these were Crossrail Limited (with its various functions and depart-ments), and 17 projects that were being delivered as part of the overall pro-gram at the time of our data collection and analysis. For this purpose, we used a database through which Crossrail Limited2 captured innovative ideas gen-erated within its own departments and in each of the projects and monitored their adoption and implementation across the program.
The database was a particularly rich source of data. For each innovation, it
reported: (1) a title, reference number, and date of submission; (2) a detailed description of the innovative idea (up to a few hundred words); (3) an illustra-tion of the innovation context, that is, how the project by which the innovation was put forward as well as the program overall could benefit from its imple-mentation (up to a few hundred words); and (4) information about the submitter (full name, parent company, and con-tact details). Innovations were grouped by theme and subthemes. For example, the theme “Sustainable solutions” com-prised subthemes such as “Environmen-tal,” “Economic,” and “Social,” whereas the theme “Digital-physical integration” included the subthemes “Smart tech-nologies,” and “Building Information Management” (BIM). Specific functions of the database allowed program man-agers to monitor whether and how the innovation progressed from submission to implementation, and insert updated information and comments about the process. Another important feature of the database was the record of when innovations submitted by a given proj-ect were also implemented by other projects. Labeled as “Pinch with Pride,” the replication of innovations from project to project was seen by program managers as particularly beneficial to the Crossrail program overall. Conse-quently, it was possible for a project to have the greatest number of imple-mented ideas simply by “pinching” and replicating innovations from other projects. Sustaining “Pinch with Pride” practices allowed the project teams to raise and explore in advance any issues concerning, for example, the intellec-tual property of successful innovations.
We performed a qualitative and quantitative content analysis of the information contained in the database, especially concerning the description of innovative ideas, the illustration of the innovation context, and the anticipa-tion of expected benefits. This allowed us to identify patterns and trends of the innovativeness of specific projects and their principal contractors. Specifically,
2We refer to both Crossrail Limited and its program delivery
partner, Transcend (a joint-venture of AECOM, CH2M Hill,
and Nichols Group), as one organization, which was respon-
sible for managing the Crossrail megaproject and, particularly
relevant to this study, the Crossrail Innovation Program.
PMJ_87569728_47_4_Aug_Sept_2016.indb 82 9/19/16 3:44 PM
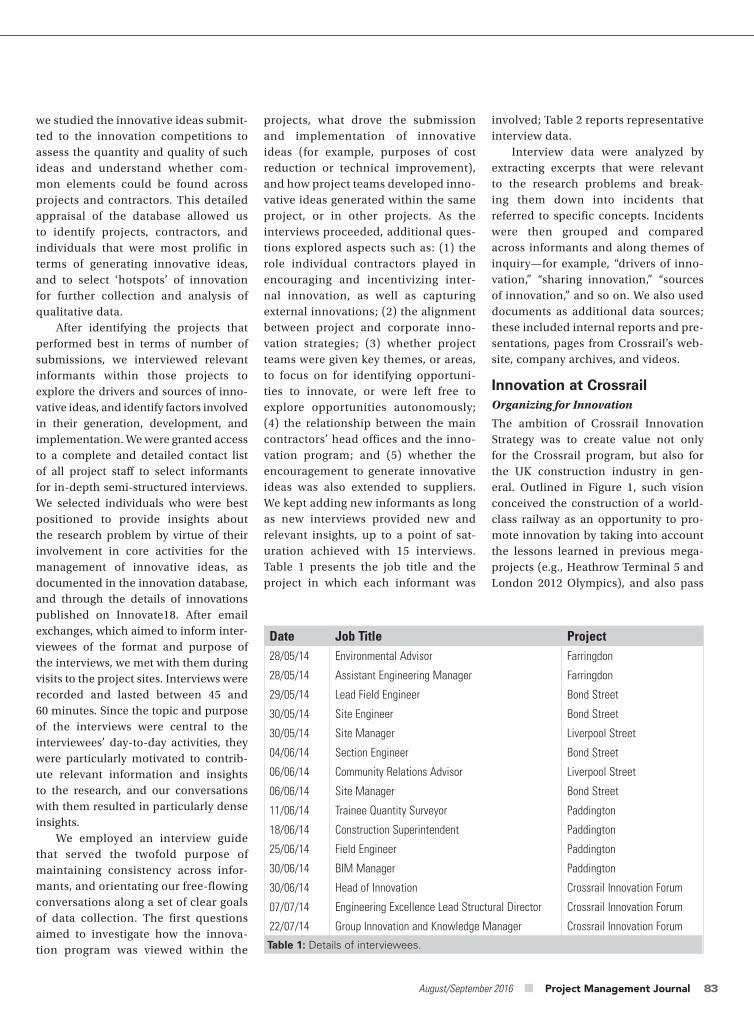
August/September 2016 ■ Project Management Journal 83
we studied the innovative ideas submit-ted to the innovation competitions to assess the quantity and quality of such ideas and understand whether com-mon elements could be found across projects and contractors. This detailed appraisal of the database allowed us to identify projects, contractors, and individuals that were most prolific in terms of generating innovative ideas, and to select ‘hotspots’ of innovation for further collection and analysis of qualitative data.
After identifying the projects that performed best in terms of number of submissions, we interviewed relevant informants within those projects to explore the drivers and sources of inno-vative ideas, and identify factors involved in their generation, development, and implementation. We were granted access to a complete and detailed contact list of all project staff to select informants for in-depth semi-structured interviews. We selected individuals who were best positioned to provide insights about the research problem by virtue of their involvement in core activities for the management of innovative ideas, as documented in the innovation database, and through the details of innovations published on Innovate18. After email exchanges, which aimed to inform inter-viewees of the format and purpose of the interviews, we met with them during visits to the project sites. Interviews were recorded and lasted between 45 and 60 minutes. Since the topic and purpose of the interviews were central to the interviewees’ day-to-day activities, they were particularly motivated to contrib-ute relevant information and insights to the research, and our conversations with them resulted in particularly dense insights.
We employed an interview guide that served the twofold purpose of maintaining consistency across infor-mants, and orientating our free-flowing conversations along a set of clear goals of data collection. The first questions aimed to investigate how the innova-tion program was viewed within the
projects, what drove the submission and implementation of innovative ideas (for example, purposes of cost reduction or technical improvement), and how project teams developed inno-vative ideas generated within the same project, or in other projects. As the interviews proceeded, additional ques-tions explored aspects such as: (1) the role individual contractors played in encouraging and incentivizing inter-nal innovation, as well as capturing external innovations; (2) the alignment between project and corporate inno-vation strategies; (3) whether project teams were given key themes, or areas, to focus on for identifying opportuni-ties to innovate, or were left free to explore opportunities autonomously; (4) the relationship between the main contractors’ head offices and the inno-vation program; and (5) whether the encouragement to generate innovative ideas was also extended to suppliers. We kept adding new informants as long as new interviews provided new and relevant insights, up to a point of sat-uration achieved with 15 interviews. Table 1 presents the job title and the project in which each informant was
involved; Table 2 reports representative interview data.
Interview data were analyzed by extracting excerpts that were relevant to the research problems and break-ing them down into incidents that referred to specific concepts. Incidents were then grouped and compared across informants and along themes of inquiry—for example, “drivers of inno-vation,” “sharing innovation,” “sources of innovation,” and so on. We also used documents as additional data sources; these included internal reports and pre-sentations, pages from Crossrail’s web-site, company archives, and videos.
Innovation at CrossrailOrganizing for Innovation
The ambition of Crossrail Innovation Strategy was to create value not only for the Crossrail program, but also for the UK construction industry in gen-eral. Outlined in Figure 1, such vision conceived the construction of a world-class railway as an opportunity to pro-mote innovation by taking into account the lessons learned in previous mega-projects (e.g., Heathrow Terminal 5 and London 2012 Olympics), and also pass
Date Job Title Project28/05/14 Environmental Advisor Farringdon
28/05/14 Assistant Engineering Manager Farringdon
29/05/14 Lead Field Engineer Bond Street
30/05/14 Site Engineer Bond Street
30/05/14 Site Manager Liverpool Street
04/06/14 Section Engineer Bond Street
06/06/14 Community Relations Advisor Liverpool Street
06/06/14 Site Manager Bond Street
11/06/14 Trainee Quantity Surveyor Paddington
18/06/14 Construction Superintendent Paddington
25/06/14 Field Engineer Paddington
30/06/14 BIM Manager Paddington
30/06/14 Head of Innovation Crossrail Innovation Forum
07/07/14 Engineering Excellence Lead Structural Director Crossrail Innovation Forum
22/07/14 Group Innovation and Knowledge Manager Crossrail Innovation Forum
Table 1: Details of interviewees.
PMJ_87569728_47_4_Aug_Sept_2016.indb 83 9/19/16 3:44 PM
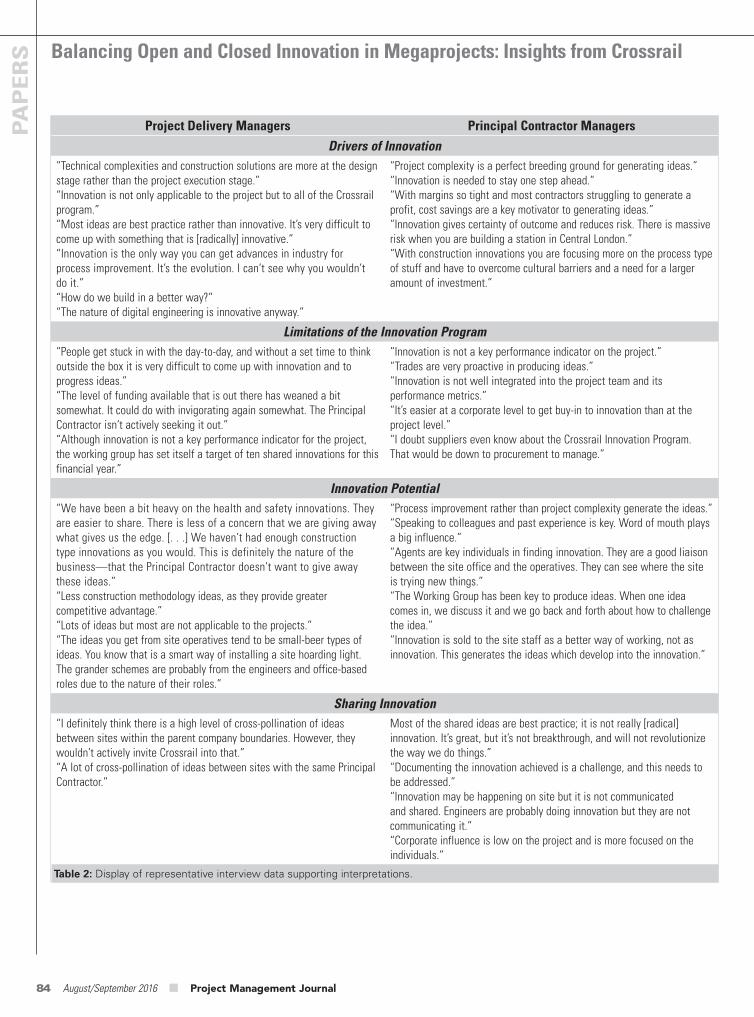
Balancing Open and Closed Innovation in Megaprojects: Insights from Crossrail
84 August/September 2016 ■ Project Management Journal
PAPERS
Project Delivery Managers Principal Contractor Managers
Drivers of Innovation“Technical complexities and construction solutions are more at the design stage rather than the project execution stage.”“Innovation is not only applicable to the project but to all of the Crossrail program.”“Most ideas are best practice rather than innovative. It’s very difficult to come up with something that is [radically] innovative.”“Innovation is the only way you can get advances in industry for process improvement. It’s the evolution. I can’t see why you wouldn’t do it.”“How do we build in a better way?”“The nature of digital engineering is innovative anyway.”
“Project complexity is a perfect breeding ground for generating ideas.”“Innovation is needed to stay one step ahead.”“With margins so tight and most contractors struggling to generate a profit, cost savings are a key motivator to generating ideas.”“Innovation gives certainty of outcome and reduces risk. There is massive risk when you are building a station in Central London.”“With construction innovations you are focusing more on the process type of stuff and have to overcome cultural barriers and a need for a larger amount of investment.”
Limitations of the Innovation Program“People get stuck in with the day-to-day, and without a set time to think outside the box it is very difficult to come up with innovation and to progress ideas.”“The level of funding available that is out there has weaned a bit somewhat. It could do with invigorating again somewhat. The Principal Contractor isn’t actively seeking it out.”“Although innovation is not a key performance indicator for the project, the working group has set itself a target of ten shared innovations for this financial year.”
“Innovation is not a key performance indicator on the project.”“Trades are very proactive in producing ideas.”“Innovation is not well integrated into the project team and its performance metrics.”“It’s easier at a corporate level to get buy-in to innovation than at the project level.”“I doubt suppliers even know about the Crossrail Innovation Program. That would be down to procurement to manage.”
Innovation Potential“We have been a bit heavy on the health and safety innovations. They are easier to share. There is less of a concern that we are giving away what gives us the edge. [. . .] We haven’t had enough construction type innovations as you would. This is definitely the nature of the business—that the Principal Contractor doesn’t want to give away these ideas.”“Less construction methodology ideas, as they provide greater competitive advantage.”“Lots of ideas but most are not applicable to the projects.”“The ideas you get from site operatives tend to be small-beer types of ideas. You know that is a smart way of installing a site hoarding light. The grander schemes are probably from the engineers and office-based roles due to the nature of their roles.”
“Process improvement rather than project complexity generate the ideas.”“Speaking to colleagues and past experience is key. Word of mouth plays a big influence.”“Agents are key individuals in finding innovation. They are a good liaison between the site office and the operatives. They can see where the site is trying new things.”“The Working Group has been key to produce ideas. When one idea comes in, we discuss it and we go back and forth about how to challenge the idea.”“Innovation is sold to the site staff as a better way of working, not as innovation. This generates the ideas which develop into the innovation.”
Sharing Innovation“I definitely think there is a high level of cross-pollination of ideas between sites within the parent company boundaries. However, they wouldn’t actively invite Crossrail into that.”“A lot of cross-pollination of ideas between sites with the same Principal Contractor.”
Most of the shared ideas are best practice; it is not really [radical] innovation. It’s great, but it’s not breakthrough, and will not revolutionize the way we do things.”“Documenting the innovation achieved is a challenge, and this needs to be addressed.”“Innovation may be happening on site but it is not communicated and shared. Engineers are probably doing innovation but they are not communicating it.”“Corporate influence is low on the project and is more focused on the individuals.”
Table 2: Display of representative interview data supporting interpretations.
PMJ_87569728_47_4_Aug_Sept_2016.indb 84 9/19/16 3:44 PM
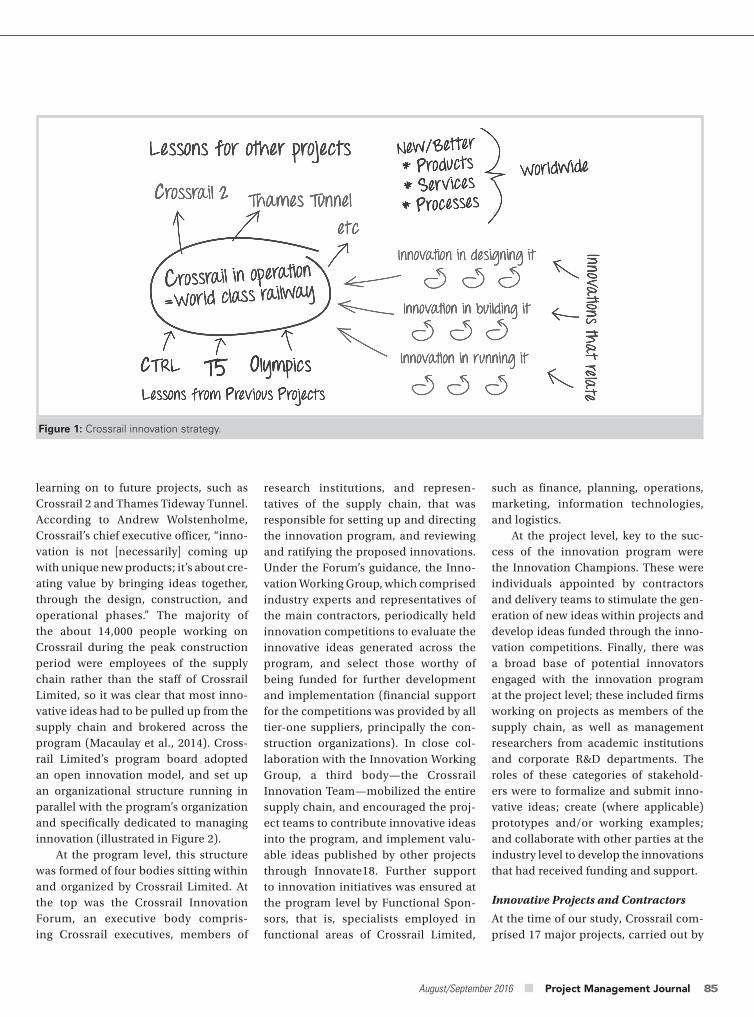
August/September 2016 ■ Project Management Journal 85
research institutions, and represen-tatives of the supply chain, that was responsible for setting up and directing the innovation program, and reviewing and ratifying the proposed innovations. Under the Forum’s guidance, the Inno-vation Working Group, which comprised industry experts and representatives of the main contractors, periodically held innovation competitions to evaluate the innovative ideas generated across the program, and select those worthy of being funded for further development and implementation (financial support for the competitions was provided by all tier-one suppliers, principally the con-struction organizations). In close col-laboration with the Innovation Working Group, a third body—the Crossrail Innovation Team—mobilized the entire supply chain, and encouraged the proj-ect teams to contribute innovative ideas into the program, and implement valu-able ideas published by other projects through Innovate18. Further support to innovation initiatives was ensured at the program level by Functional Spon-sors, that is, specialists employed in functional areas of Crossrail Limited,
such as finance, planning, operations, marketing, information technologies, and logistics.
At the project level, key to the suc-cess of the innovation program were the Innovation Champions. These were individuals appointed by contractors and delivery teams to stimulate the gen-eration of new ideas within projects and develop ideas funded through the inno-vation competitions. Finally, there was a broad base of potential innovators engaged with the innovation program at the project level; these included firms working on projects as members of the supply chain, as well as management researchers from academic institutions and corporate R&D departments. The roles of these categories of stakehold-ers were to formalize and submit inno-vative ideas; create (where applicable) prototypes and/or working examples; and collaborate with other parties at the industry level to develop the innovations that had received funding and support.
Innovative Projects and Contractors
At the time of our study, Crossrail com-prised 17 major projects, carried out by
learning on to future projects, such as Crossrail 2 and Thames Tideway Tunnel. According to Andrew Wolstenholme, Crossrail’s chief executive officer, “inno-vation is not [necessarily] coming up with unique new products; it’s about cre-ating value by bringing ideas together, through the design, construction, and operational phases.” The majority of the about 14,000 people working on Crossrail during the peak construction period were employees of the supply chain rather than the staff of Crossrail Limited, so it was clear that most inno-vative ideas had to be pulled up from the supply chain and brokered across the program (Macaulay et al., 2014). Cross-rail Limited’s program board adopted an open innovation model, and set up an organizational structure running in parallel with the program’s organization and specifically dedicated to managing innovation (illustrated in Figure 2).
At the program level, this structure was formed of four bodies sitting within and organized by Crossrail Limited. At the top was the Crossrail Innovation Forum, an executive body compris-ing Crossrail executives, members of
Figure 1: Crossrail innovation strategy.
PMJ_87569728_47_4_Aug_Sept_2016.indb 85 9/19/16 3:44 PM
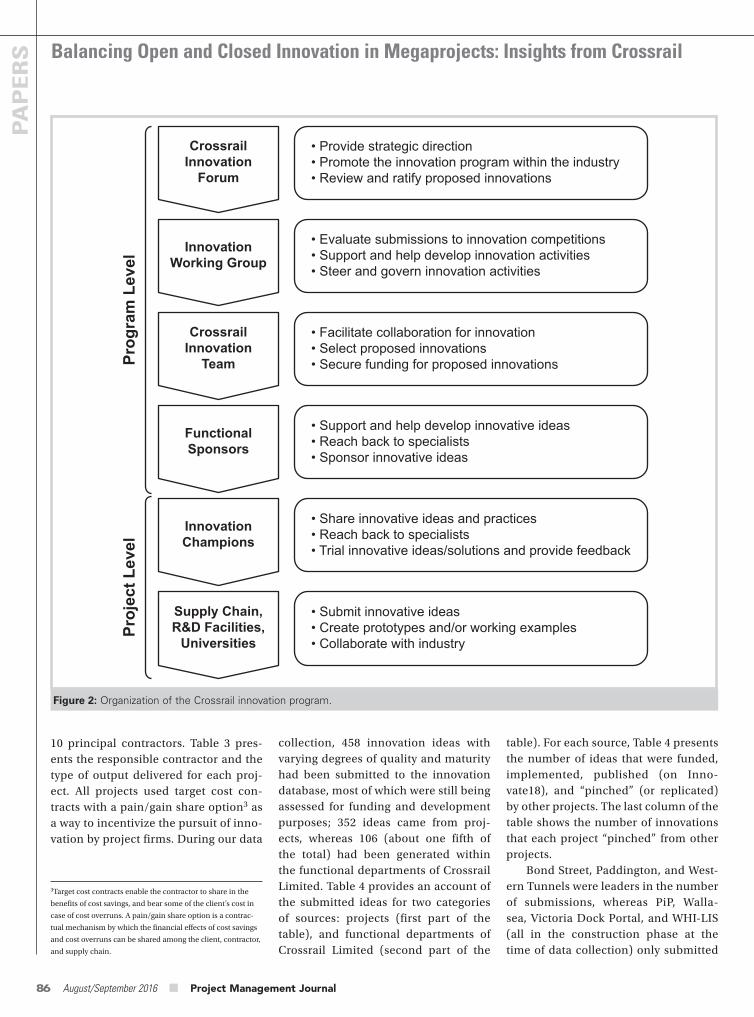
Balancing Open and Closed Innovation in Megaprojects: Insights from Crossrail
86 August/September 2016 ■ Project Management Journal
PAPERS
10 principal contractors. Table 3 pres-ents the responsible contractor and the type of output delivered for each proj-ect. All projects used target cost con-tracts with a pain/gain share option3 as a way to incentivize the pursuit of inno-vation by project firms. During our data
collection, 458 innovation ideas with varying degrees of quality and maturity had been submitted to the innovation database, most of which were still being assessed for funding and development purposes; 352 ideas came from proj-ects, whereas 106 (about one fifth of the total) had been generated within the functional departments of Crossrail Limited. Table 4 provides an account of the submitted ideas for two categories of sources: projects (first part of the table), and functional departments of Crossrail Limited (second part of the
table). For each source, Table 4 presents the number of ideas that were funded, implemented, published (on Inno-vate18), and “pinched” (or replicated) by other projects. The last column of the table shows the number of innovations that each project “pinched” from other projects.
Bond Street, Paddington, and West-ern Tunnels were leaders in the number of submissions, whereas PiP, Walla-sea, Victoria Dock Portal, and WHI-LIS (all in the construction phase at the time of data collection) only submitted
Figure 2: Organization of the Crossrail innovation program.
CrossrailInnovation
Forum
• Provide strategic direction• Promote the innovation program within the industry• Review and ratify proposed innovations
• Evaluate submissions to innovation competitions• Support and help develop innovation activities• Steer and govern innovation activities
Prog
ram
Lev
elPr
ojec
t Lev
el
• Facilitate collaboration for innovation• Select proposed innovations• Secure funding for proposed innovations
• Support and help develop innovative ideas• Reach back to specialists• Sponsor innovative ideas
• Share innovative ideas and practices• Reach back to specialists• Trial innovative ideas/solutions and provide feedback
• Submit innovative ideas• Create prototypes and/or working examples• Collaborate with industry
InnovationWorking Group
CrossrailInnovation
Team
FunctionalSponsors
InnovationChampions
Supply Chain,R&D Facilities,
Universities
3Target cost contracts enable the contractor to share in the
benefits of cost savings, and bear some of the client’s cost in
case of cost overruns. A pain/gain share option is a contrac-
tual mechanism by which the financial effects of cost savings
and cost overruns can be shared among the client, contractor,
and supply chain.
PMJ_87569728_47_4_Aug_Sept_2016.indb 86 9/19/16 3:44 PM
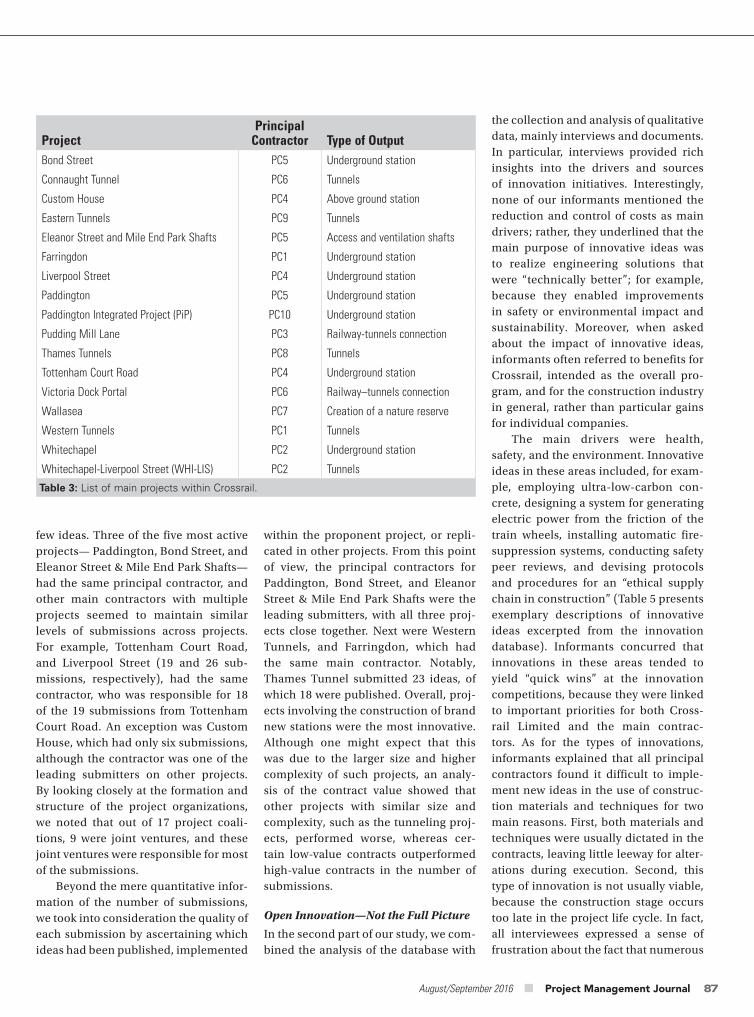
August/September 2016 ■ Project Management Journal 87
few ideas. Three of the five most active projects— Paddington, Bond Street, and Eleanor Street & Mile End Park Shafts—had the same principal contractor, and other main contractors with multiple projects seemed to maintain similar levels of submissions across projects. For example, Tottenham Court Road, and Liverpool Street (19 and 26 sub-missions, respectively), had the same contractor, who was responsible for 18 of the 19 submissions from Tottenham Court Road. An exception was Custom House, which had only six submissions, although the contractor was one of the leading submitters on other projects. By looking closely at the formation and structure of the project organizations, we noted that out of 17 project coali-tions, 9 were joint ventures, and these joint ventures were responsible for most of the submissions.
Beyond the mere quantitative infor-mation of the number of submissions, we took into consideration the quality of each submission by ascertaining which ideas had been published, implemented
within the proponent project, or repli-cated in other projects. From this point of view, the principal contractors for Paddington, Bond Street, and Eleanor Street & Mile End Park Shafts were the leading submitters, with all three proj-ects close together. Next were Western Tunnels, and Farringdon, which had the same main contractor. Notably, Thames Tunnel submitted 23 ideas, of which 18 were published. Overall, proj-ects involving the construction of brand new stations were the most innovative. Although one might expect that this was due to the larger size and higher complexity of such projects, an analy-sis of the contract value showed that other projects with similar size and complexity, such as the tunneling proj-ects, performed worse, whereas cer-tain low-value contracts outperformed high-value contracts in the number of submissions.
Open Innovation—Not the Full Picture
In the second part of our study, we com-bined the analysis of the database with
the collection and analysis of qualitative data, mainly interviews and documents. In particular, interviews provided rich insights into the drivers and sources of innovation initiatives. Interestingly, none of our informants mentioned the reduction and control of costs as main drivers; rather, they underlined that the main purpose of innovative ideas was to realize engineering solutions that were “technically better”; for example, because they enabled improvements in safety or environmental impact and sustainability. Moreover, when asked about the impact of innovative ideas, informants often referred to benefits for Crossrail, intended as the overall pro-gram, and for the construction industry in general, rather than particular gains for individual companies.
The main drivers were health, safety, and the environment. Innovative ideas in these areas included, for exam-ple, employing ultra-low-carbon con-crete, designing a system for generating electric power from the friction of the train wheels, installing automatic fire-suppression systems, conducting safety peer reviews, and devising protocols and procedures for an “ethical supply chain in construction” (Table 5 presents exemplary descriptions of innovative ideas excerpted from the innovation database). Informants concurred that innovations in these areas tended to yield “quick wins” at the innovation competitions, because they were linked to important priorities for both Cross-rail Limited and the main contrac-tors. As for the types of innovations, informants explained that all principal contractors found it difficult to imple-ment new ideas in the use of construc-tion materials and techniques for two main reasons. First, both materials and techniques were usually dictated in the contracts, leaving little leeway for alter-ations during execution. Second, this type of innovation is not usually viable, because the construction stage occurs too late in the project life cycle. In fact, all interviewees expressed a sense of frustration about the fact that numerous
ProjectPrincipal
Contractor Type of OutputBond Street PC5 Underground station
Connaught Tunnel PC6 Tunnels
Custom House PC4 Above ground station
Eastern Tunnels PC9 Tunnels
Eleanor Street and Mile End Park Shafts PC5 Access and ventilation shafts
Farringdon PC1 Underground station
Liverpool Street PC4 Underground station
Paddington PC5 Underground station
Paddington Integrated Project (PiP) PC10 Underground station
Pudding Mill Lane PC3 Railway-tunnels connection
Thames Tunnels PC8 Tunnels
Tottenham Court Road PC4 Underground station
Victoria Dock Portal PC6 Railway–tunnels connection
Wallasea PC7 Creation of a nature reserve
Western Tunnels PC1 Tunnels
Whitechapel PC2 Underground station
Whitechapel-Liverpool Street (WHI-LIS) PC2 Tunnels
Table 3: List of main projects within Crossrail.
PMJ_87569728_47_4_Aug_Sept_2016.indb 87 9/19/16 3:44 PM
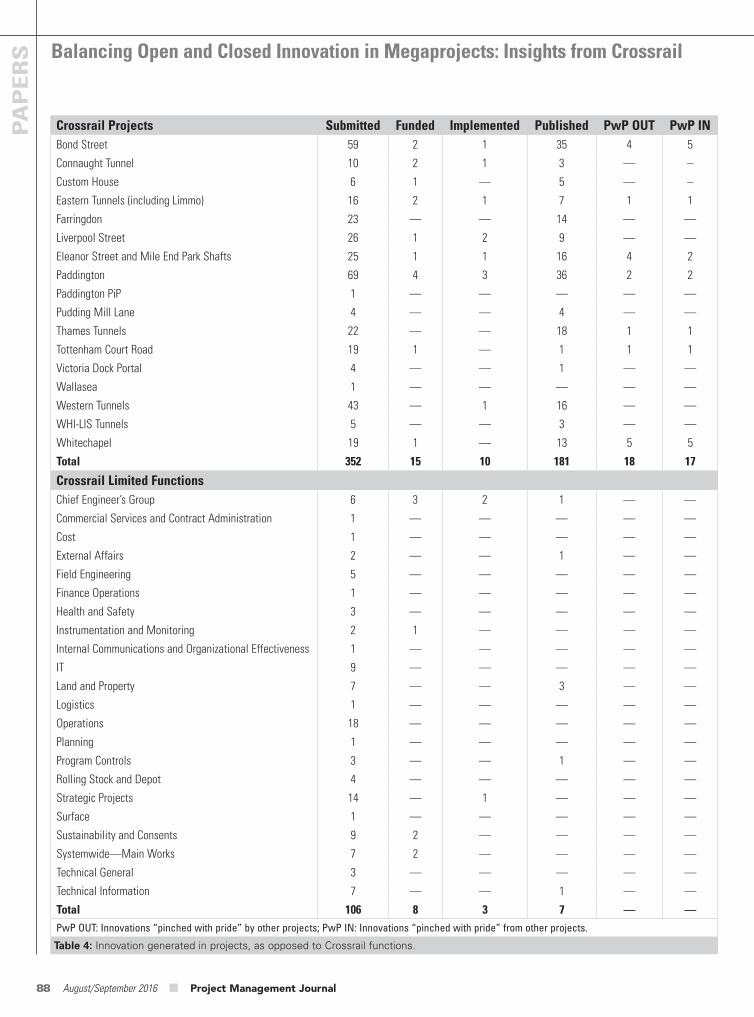
Balancing Open and Closed Innovation in Megaprojects: Insights from Crossrail
88 August/September 2016 ■ Project Management Journal
PAPERS
Crossrail Projects Submitted Funded Implemented Published PwP OUT PwP INBond Street 59 2 1 35 4 5
Connaught Tunnel 10 2 1 3 — –
Custom House 6 1 — 5 — –
Eastern Tunnels (including Limmo) 16 2 1 7 1 1
Farringdon 23 — — 14 — —
Liverpool Street 26 1 2 9 — —
Eleanor Street and Mile End Park Shafts 25 1 1 16 4 2
Paddington 69 4 3 36 2 2
Paddington PiP 1 — — — — —
Pudding Mill Lane 4 — — 4 — —
Thames Tunnels 22 — — 18 1 1
Tottenham Court Road 19 1 — 1 1 1
Victoria Dock Portal 4 — — 1 — —
Wallasea 1 — — — — —
Western Tunnels 43 — 1 16 — —
WHI-LIS Tunnels 5 — — 3 — —
Whitechapel 19 1 — 13 5 5
Total 352 15 10 181 18 17
Crossrail Limited FunctionsChief Engineer’s Group 6 3 2 1 — —
Commercial Services and Contract Administration 1 — — — — —
Cost 1 — — — — —
External Affairs 2 — — 1 — —
Field Engineering 5 — — — — —
Finance Operations 1 — — — — —
Health and Safety 3 — — — — —
Instrumentation and Monitoring 2 1 — — — —
Internal Communications and Organizational Effectiveness 1 — — — — —
IT 9 — — — — —
Land and Property 7 — — 3 — —
Logistics 1 — — — — —
Operations 18 — — — — —
Planning 1 — — — — —
Program Controls 3 — — 1 — —
Rolling Stock and Depot 4 — — — — —
Strategic Projects 14 — 1 — — —
Surface 1 — — — — —
Sustainability and Consents 9 2 — — — —
Systemwide—Main Works 7 2 — — — —
Technical General 3 — — — — —
Technical Information 7 — — 1 — —
Total 106 8 3 7 — —PwP OUT: Innovations “pinched with pride” by other projects; PwP IN: Innovations “pinched with pride” from other projects.
Table 4: Innovation generated in projects, as opposed to Crossrail functions.
PMJ_87569728_47_4_Aug_Sept_2016.indb 88 9/19/16 3:44 PM
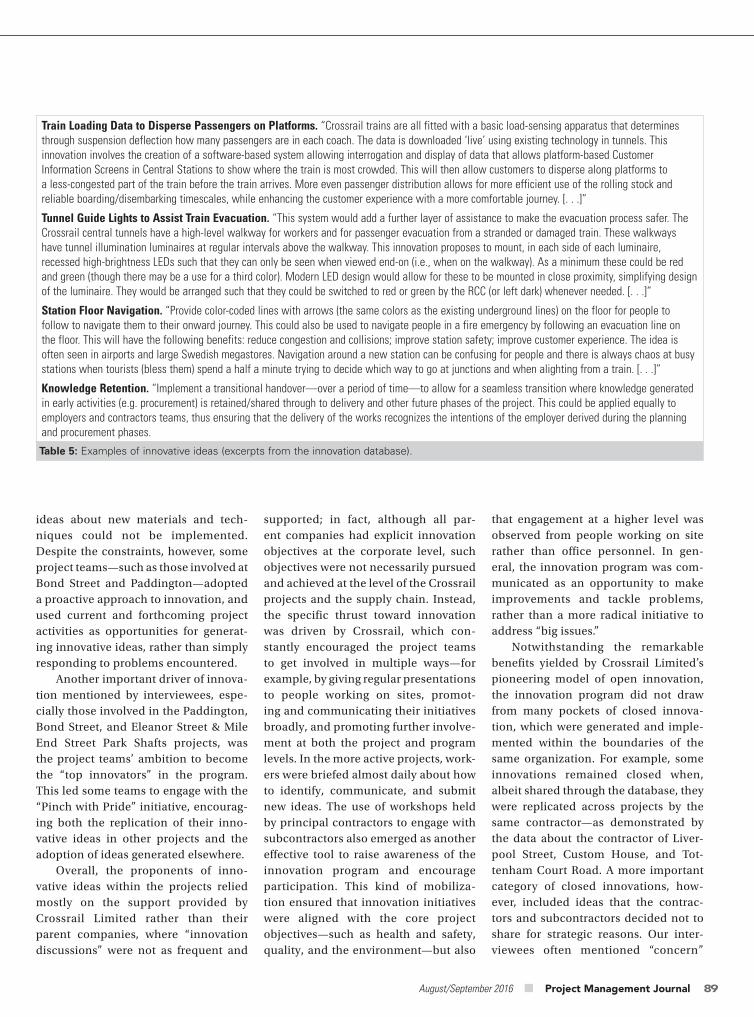
August/September 2016 ■ Project Management Journal 89
ideas about new materials and tech-niques could not be implemented. Despite the constraints, however, some project teams—such as those involved at Bond Street and Paddington—adopted a proactive approach to innovation, and used current and forthcoming project activities as opportunities for generat-ing innovative ideas, rather than simply responding to problems encountered.
Another important driver of innova-tion mentioned by interviewees, espe-cially those involved in the Paddington, Bond Street, and Eleanor Street & Mile End Street Park Shafts projects, was the project teams’ ambition to become the “top innovators” in the program. This led some teams to engage with the “Pinch with Pride” initiative, encourag-ing both the replication of their inno-vative ideas in other projects and the adoption of ideas generated elsewhere.
Overall, the proponents of inno-vative ideas within the projects relied mostly on the support provided by Crossrail Limited rather than their parent companies, where “innovation discussions” were not as frequent and
supported; in fact, although all par-ent companies had explicit innovation objectives at the corporate level, such objectives were not necessarily pursued and achieved at the level of the Crossrail projects and the supply chain. Instead, the specific thrust toward innovation was driven by Crossrail, which con-stantly encouraged the project teams to get involved in multiple ways—for example, by giving regular presentations to people working on sites, promot-ing and communicating their initiatives broadly, and promoting further involve-ment at both the project and program levels. In the more active projects, work-ers were briefed almost daily about how to identify, communicate, and submit new ideas. The use of workshops held by principal contractors to engage with subcontractors also emerged as another effective tool to raise awareness of the innovation program and encourage participation. This kind of mobiliza-tion ensured that innovation initiatives were aligned with the core project objectives—such as health and safety, quality, and the environment—but also
that engagement at a higher level was observed from people working on site rather than office personnel. In gen-eral, the innovation program was com-municated as an opportunity to make improvements and tackle problems, rather than a more radical initiative to address “big issues.”
Notwithstanding the remarkable benefits yielded by Crossrail Limited’s pioneering model of open innovation, the innovation program did not draw from many pockets of closed innova-tion, which were generated and imple-mented within the boundaries of the same organization. For example, some innovations remained closed when, albeit shared through the database, they were replicated across projects by the same contractor—as demonstrated by the data about the contractor of Liver-pool Street, Custom House, and Tot-tenham Court Road. A more important category of closed innovations, how-ever, included ideas that the contrac-tors and subcontractors decided not to share for strategic reasons. Our inter-viewees often mentioned “concern”
Train Loading Data to Disperse Passengers on Platforms. “Crossrail trains are all fitted with a basic load-sensing apparatus that determines through suspension deflection how many passengers are in each coach. The data is downloaded ‘live’ using existing technology in tunnels. This innovation involves the creation of a software-based system allowing interrogation and display of data that allows platform-based Customer Information Screens in Central Stations to show where the train is most crowded. This will then allow customers to disperse along platforms to a less-congested part of the train before the train arrives. More even passenger distribution allows for more efficient use of the rolling stock and reliable boarding/disembarking timescales, while enhancing the customer experience with a more comfortable journey. [. . .]”
Tunnel Guide Lights to Assist Train Evacuation. “This system would add a further layer of assistance to make the evacuation process safer. The Crossrail central tunnels have a high-level walkway for workers and for passenger evacuation from a stranded or damaged train. These walkways have tunnel illumination luminaires at regular intervals above the walkway. This innovation proposes to mount, in each side of each luminaire, recessed high-brightness LEDs such that they can only be seen when viewed end-on (i.e., when on the walkway). As a minimum these could be red and green (though there may be a use for a third color). Modern LED design would allow for these to be mounted in close proximity, simplifying design of the luminaire. They would be arranged such that they could be switched to red or green by the RCC (or left dark) whenever needed. [. . .]”
Station Floor Navigation. “Provide color-coded lines with arrows (the same colors as the existing underground lines) on the floor for people to follow to navigate them to their onward journey. This could also be used to navigate people in a fire emergency by following an evacuation line on the floor. This will have the following benefits: reduce congestion and collisions; improve station safety; improve customer experience. The idea is often seen in airports and large Swedish megastores. Navigation around a new station can be confusing for people and there is always chaos at busy stations when tourists (bless them) spend a half a minute trying to decide which way to go at junctions and when alighting from a train. [. . .]”
Knowledge Retention. “Implement a transitional handover—over a period of time—to allow for a seamless transition where knowledge generated in early activities (e.g. procurement) is retained/shared through to delivery and other future phases of the project. This could be applied equally to employers and contractors teams, thus ensuring that the delivery of the works recognizes the intentions of the employer derived during the planning and procurement phases.
Table 5: Examples of innovative ideas (excerpts from the innovation database).
PMJ_87569728_47_4_Aug_Sept_2016.indb 89 9/19/16 3:44 PM
Balancing Open and Closed Innovation in Megaprojects: Insights from Crossrail
90 August/September 2016 ■ Project Management Journal
PAPERS
about unveiling innovative solutions, especially in the area of construction methodologies, which were likely to give the firm a considerable advantage over competitors.
The supply chain was another important source of innovations, but its contribution varied depending on whether the contractors needed the contributions of suppliers to carry out project activities. Notably, limited sup-plier involvement existed for all of the projects, so that innovative ideas tended to originate from subcontractors rather than suppliers. Site personnel, such as operatives and superintendents and site supervisors, played an important role in identifying ideas and imagining possible applications. In some proj-ects, innovation groups were formed to stimulate and support project staff to put forward new ideas and then help advance them through discussions and collective evaluations. This allowed for increases in both the quantity and quality of new ideas. Some projects had rather large innovation groups with more individuals involved, and a greater number of innovative ideas generated. In other projects—such as Bond Street and Paddington—regu-lar project staff (i.e., employees who weren’t members of innovation groups) represented the main source of innova-tive ideas.
Replicated Innovation
The “Pinch with Pride” scheme encour-aged the mutual sharing of innovative ideas among projects, with the purpose of multiplying the opportunities for the adoption and implementation of inno-vations deemed particularly valuable. The scheme enhanced the project inno-vativeness by reducing cross-project transaction costs and also helped improved performance by creating con-ditions for evolutionary development of innovative ideas. As Table 4 shows, not all projects engaged with “Pinch with Pride” and many projects played no role in either generating new ideas useful to other projects or replicating
ideas generated elsewhere. For the most innovative projects, the scheme did not play a significant role in terms of cumu-latively increasing the number of inno-vations, but noticeable engagement existed within the project teams and the contractors involved. For example, the main contractor for Liverpool Street was one of the leading submitters of ideas then replicated elsewhere; in this case, however, the “pinching” is partially explained by the fact that the contrac-tor was involved in two other projects (Custom House and Tottenham Court Road), so that some of the cross-project implementations might be seen as bro-kered by the contractor itself. Liverpool Street was highly prolific of ideas that were replicated elsewhere, but had not yet implemented any ideas from other projects at the time of our study. In general, station projects were the most active ones in replicating innovations, probably due to the complexity of these types of projects, and the related need to integrate the numerous systems typi-cally present in train stations.
Our informants underlined that the Crossrail Innovation Team played a key role in encouraging the replica-tion of innovations and providing the support that was often lacking on the contractors’ side. Indeed, Crossrail Limited had committed people’s time and other organizational resources to nurturing and implementing innova-tions, whereas the project companies encountered several problems and constraints such as the scarce commu-nication between the head office and the project teams, particularly about the opportunities to replicate innova-tions. Furthermore, corporate influence on the innovation program tended to be weak because replicating innova-tions was seen as a more demanding task compared with implementing ideas that had been generated and developed within the project. An additional con-straint was the lack of guidance about how to engage with the supply chain, particularly how to participate in inno-vation competitions.
The principal contractor for Pad-dington, Bond Street, and Eleanor Street & Mile End Street Park Shafts was the most active in sharing innovation across projects. This contractor had signifi-cant corporate support for replication. Workshops were held quarterly among the projects’ innovation groups, with the aim of sharing knowledge, circulat-ing successful ideas, and discussing the problems experienced and the possible solutions. Replication thus “facilitated learning and idea discovery” and often “prevented repeating the same mistakes across projects.” Replication practices were sustained through the central innovation database and the innovation competitions. For example, to identify innovations potentially applicable to forthcoming project activities, the Pad-dington, Bond Street, and Eleanor Street & Mile End Street Park Shafts projects searched the Crossrail innovation data-base recurrently, which allowed Pad-dington to achieve a rather high number of replicated innovations. The purpose of the innovation competitions was to award financial funding for the devel-opment of proposed innovations, either through the competition scheme or via a Delegated Authority from the innova-tion program. Table 6 details the funds awarded during the first year of the program.
Station projects dominated the com-petitions, whereas tunnel projects only had four awards. The most prominent project was Paddington, with funding awarded in all three rounds. This suc-cess is partly explained by the fact that Paddington incentivized project staff with non-monetary rewards such as gift cards. The main contractor for Padding-ton, Bond Street, and Eleanor Street & Mile End Street Park Shafts won eight awards in total. The outstanding engage-ment of this contractor was underscored by its participation in all rounds of com-petitions, an overall awarded amount equal to 46% of allocations, and the highest single award (£59,000 or approx-imately US$84,600). The main contrac-tor for Custom House, Liverpool Street,
PMJ_87569728_47_4_Aug_Sept_2016.indb 90 9/19/16 3:44 PM
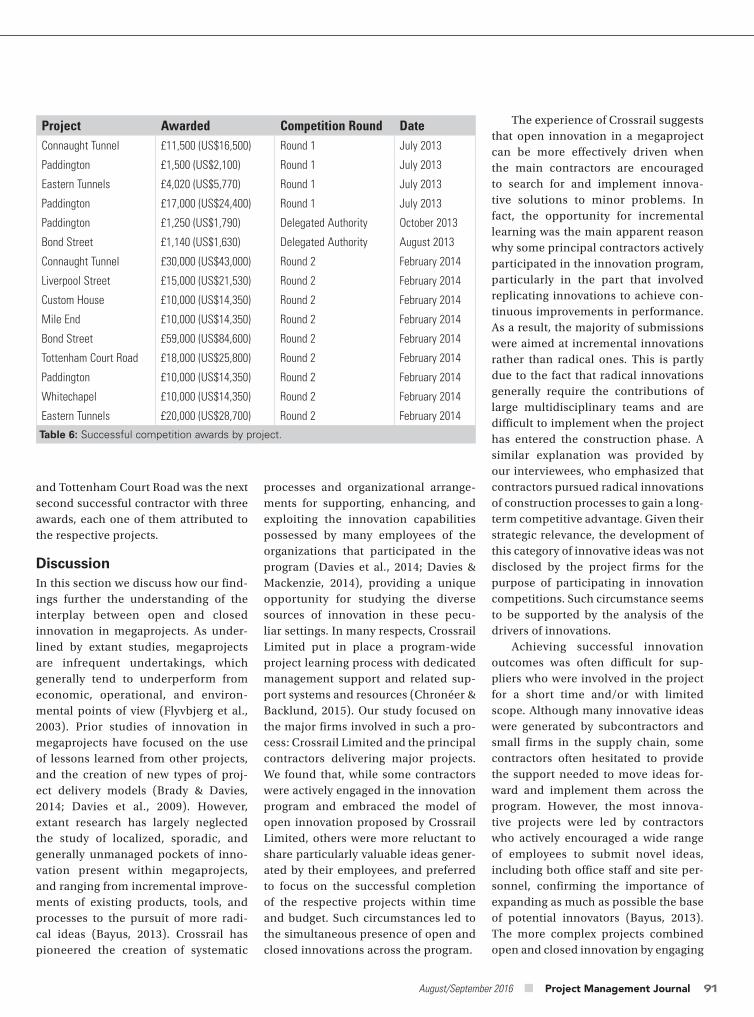
August/September 2016 ■ Project Management Journal 91
and Tottenham Court Road was the next second successful contractor with three awards, each one of them attributed to the respective projects.
DiscussionIn this section we discuss how our find-ings further the understanding of the interplay between open and closed innovation in megaprojects. As under-lined by extant studies, megaprojects are infrequent undertakings, which generally tend to underperform from economic, operational, and environ-mental points of view (Flyvbjerg et al., 2003). Prior studies of innovation in megaprojects have focused on the use of lessons learned from other projects, and the creation of new types of proj-ect delivery models (Brady & Davies, 2014; Davies et al., 2009). However, extant research has largely neglected the study of localized, sporadic, and generally unmanaged pockets of inno-vation present within megaprojects, and ranging from incremental improve-ments of existing products, tools, and processes to the pursuit of more radi-cal ideas (Bayus, 2013). Crossrail has pioneered the creation of systematic
processes and organizational arrange-ments for supporting, enhancing, and exploiting the innovation capabilities possessed by many employees of the organizations that participated in the program (Davies et al., 2014; Davies & Mackenzie, 2014), providing a unique opportunity for studying the diverse sources of innovation in these pecu-liar settings. In many respects, Crossrail Limited put in place a program-wide project learning process with dedicated management support and related sup-port systems and resources (Chronéer & Backlund, 2015). Our study focused on the major firms involved in such a pro-cess: Crossrail Limited and the principal contractors delivering major projects. We found that, while some contractors were actively engaged in the innovation program and embraced the model of open innovation proposed by Crossrail Limited, others were more reluctant to share particularly valuable ideas gener-ated by their employees, and preferred to focus on the successful completion of the respective projects within time and budget. Such circumstances led to the simultaneous presence of open and closed innovations across the program.
The experience of Crossrail suggests that open innovation in a megaproject can be more effectively driven when the main contractors are encouraged to search for and implement innova-tive solutions to minor problems. In fact, the opportunity for incremental learning was the main apparent reason why some principal contractors actively participated in the innovation program, particularly in the part that involved replicating innovations to achieve con-tinuous improvements in performance. As a result, the majority of submissions were aimed at incremental innovations rather than radical ones. This is partly due to the fact that radical innovations generally require the contributions of large multidisciplinary teams and are difficult to implement when the project has entered the construction phase. A similar explanation was provided by our interviewees, who emphasized that contractors pursued radical innovations of construction processes to gain a long-term competitive advantage. Given their strategic relevance, the development of this category of innovative ideas was not disclosed by the project firms for the purpose of participating in innovation competitions. Such circumstance seems to be supported by the analysis of the drivers of innovations.
Achieving successful innovation outcomes was often difficult for sup-pliers who were involved in the project for a short time and/or with limited scope. Although many innovative ideas were generated by subcontractors and small firms in the supply chain, some contractors often hesitated to provide the support needed to move ideas for-ward and implement them across the program. However, the most innova-tive projects were led by contractors who actively encouraged a wide range of employees to submit novel ideas, including both office staff and site per-sonnel, confirming the importance of expanding as much as possible the base of potential innovators (Bayus, 2013). The more complex projects combined open and closed innovation by engaging
Project Awarded Competition Round DateConnaught Tunnel £11,500 (US$16,500) Round 1 July 2013
Paddington £1,500 (US$2,100) Round 1 July 2013
Eastern Tunnels £4,020 (US$5,770) Round 1 July 2013
Paddington £17,000 (US$24,400) Round 1 July 2013
Paddington £1,250 (US$1,790) Delegated Authority October 2013
Bond Street £1,140 (US$1,630) Delegated Authority August 2013
Connaught Tunnel £30,000 (US$43,000) Round 2 February 2014
Liverpool Street £15,000 (US$21,530) Round 2 February 2014
Custom House £10,000 (US$14,350) Round 2 February 2014
Mile End £10,000 (US$14,350) Round 2 February 2014
Bond Street £59,000 (US$84,600) Round 2 February 2014
Tottenham Court Road £18,000 (US$25,800) Round 2 February 2014
Paddington £10,000 (US$14,350) Round 2 February 2014
Whitechapel £10,000 (US$14,350) Round 2 February 2014
Eastern Tunnels £20,000 (US$28,700) Round 2 February 2014
Table 6: Successful competition awards by project.
PMJ_87569728_47_4_Aug_Sept_2016.indb 91 9/19/16 3:44 PM
Balancing Open and Closed Innovation in Megaprojects: Insights from Crossrail
92 August/September 2016 ■ Project Management Journal
PAPERS
ideas, and use information systems to foster innovation (Winch, 2010; Winch, 2015) and enhance “network con-nectivity” (Björk & Magnusson, 2009) within and across the organizations of the megaproject. The projects that were most successful in the innovation sub-missions had the largest and most active working groups. Overall, we learned that open and closed innovation can be com-bined and leveraged together by creating an appropriate communication environ-ment, whose elements include not only organizational arrangements (e.g., team organization and task assignment) but also the definitions of methods and rules of communication (Phillips, 2014).
ReferencesAlexy, O., Criscuolo, P., & Salter, A. (2009). Does IP strategy have to cripple open innovation? MIT Sloan Management Review, 51(1), 71–77.
Alexy, O., Criscuolo, P., & Ammon, S. (2012). Managing unsolicited ideas for R&D. California Management Review, 54(3), 116–139.
Alexy, O., George, G., & Salter, A. J. (2013). Cui Bono? The selective revealing of knowledge and its implications for innovative activity. Academy of Management Review, 38(2), 270–291.
Altshuler, A. A., & Luberoff, D. (2003). Mega-projects: The changing politics of urban public investment. Washington, DC: Brookings Institution Press.
Baldwin, C., & von Hippel, E. (2011). Modeling a paradigm shift: From producer innovation to user and open collaborative innovation. Organization Science, 22(6), 1399–1417.
Bayus, B. L. (2013). Crowdsourcing new product ideas over time: An analysis of the dell ideastorm community. Management Science, 59(1), 226–244.
Bernstein, H. M., & Lemer, A. C. (1996). Solving the innovation puzzle: challenges facing the U.S. design & construction industry. Reston, VA: ASCE Press.
Björk, J., & Magnusson, M. (2009). Where do good innovation ideas come from? Exploring the influence of
organization to support innovation. Indeed, our findings suggest that inno-vation strategies for megaprojects are more likely to succeed when individual projects “pinch” innovations from other projects, which is greatly facilitated when the main contractors undertake multiple projects within the same program.
Interestingly, the sources of inno-vation (both open and closed) that we identified were within the control of the principal contractors, as well as Cross-rail Limited. This supports the idea that contractors have great influence on the outcomes of innovative efforts in megaprojects (Gann, 2000; Hansford & Pitcher, 2013), and suggests that these firms should probably be more actively involved in deciding the features and shaping the organization of an innovation program than they were on Crossrail. As a matter of fact, the projects that consis-tently raised awareness of the innovation program among their employees were the most successful in submitting new ideas and obtaining funding through the innovation competitions. The literature does not provide precise insights into the importance of raising awareness among employees about generating and captur-ing innovations, but in temporary orga-nizations this seemed to emerge as an essential means to ensuring successful engagement with structured innovation initiatives.
The fact that the ideas submitted to the program were discussed and filtered through multiple layers of assessment, from the project up to the program level, implied the involvement of many people performing different roles to develop each new idea. Extant literature has found that particularly strong personal ties between people in different parts of a large organization expand the chances of successful adoption and implemen-tation of new ideas (Kijkuit & van den Ende, 2010). Although the temporary nature of projects might not allow suf-ficient time for establishing such ties, the experience of Crossrail shows that managers can effectively create the con-ditions for communicating and sharing
with subcontractors and involving non-project actors too. This allowed the project teams to draw from large crowds of potential innovators and benefit from a wide range of technical disciplines and competences.
Indeed, Crossrail’s innovation activ-ities supported a temporary coalition of organizations that functioned as a busi-ness ecosystem. Business ecosystems are settings where multiple players hold ambiguous relationships of cooperation and competition while contributing to a common goal, generally without direct contractual arrangements (Moore, 1993; Moore, 1996; Moore, 2006). Although all the organizations in the megaprojects were interconnected through contracts, innovation was not measured by per-formance indicators, nor was it used to regulate the relationships between the parties. Rather, the success of the innovation program rested on Crossrail Limited’s ability to create a coopera-tive culture, possibly supported, but not necessarily enforced, by the use of col-laborative forms of contracts (notably, elements such as intellectual property were not raised by any of the interview-ees as barriers to innovation).
Our findings, therefore, suggest that innovation can be harnessed within a large project coalition when the pro-gram management shapes the coalition as a community of practice and builds it around the common goal of innova-tion so that individual advantages are combined with program-level organi-zational benefits (Lee, Reinicke, Sarkar, & Anderson, 2015). Figure 2 shows that, despite the boundaries between proj-ects, and the typical reluctance of con-tractors to share innovative ideas that have strategic impact, formal and infor-mal practices of communication can still be put in place to encourage knowledge exchange and sharing between teams and projects (Mueller, 2015). From a project and program management point of view, this provides insights into the relationship between the program and the projects and the most suitable struc-ture and composition of the program
PMJ_87569728_47_4_Aug_Sept_2016.indb 92 9/19/16 3:44 PM

August/September 2016 ■ Project Management Journal 93
practice. Project Management Journal, 46(1), 40–52.
Loch, C. H., DeMeyer, A., & Pich, M. (2011). Managing the unknown: A new approach to managing high uncertainty and risk in projects. Hoboken, NJ: Wiley.
MacAulay, S., Davies, A., & Dodgson, M. (2014). Managing the unknown: A new approach to managing high uncertainty and risk in projects, 30th European Group for Organizational Studies. Rotterdam, The Netherlands.
Mackenzie, I., & Davies, A. (2011). Lessons learned from the London 2012 Olympic and Paralympic Games construction programme. In O. D. Authority (Ed.), Vol. London Olympics Learning Legacy. London, England.
Manseau, A., & Shields, R. (2005). Building tomorrow: Innovation in construction and engineering. Farnham, UK: Ashgate.
Merrow, E. W. (2011). Industrial megaprojects: Concepts, strategies, and practices for success. Hoboken, NJ: Wiley.
Moore, J. F. (1993). Predators and prey: A new ecology of competition. Harvard Business Review, 71(3), 75–86.
Moore, J. F. (1996). The death of competition; Leadership & strategy in the age of business ecosystems. Hoboken, NJ: Wiley.
Moore, J. F. (2006). Business ecosystems and the view from the firm. Antitrust Bulletin, 51(1), 31–75.
Mueller, J. (2015). Formal and informal practices of knowledge sharing between project teams and enacted cultural characteristics. Project Management Journal, 46(1), 53–68.
Phillips, M. (2014). Reinventing communication: How to design, lead and manage high performing projects. Farnham, UK: Ashgate Publishing Limited.
Shenhar, A. J., & Dvir, D. (2013). Reinventing project management: The diamond approach to successful growth and innovation Boston, MA: Harvard Business Review Press.
Slaughter, E. S. (1998). Models of construction innovation. Journal
innovation management. Oxford, England: Oxford University Press.
Dodgson, M., Gann, D., MacAulay, S., & Davies, A. (2015). Innovation strategy in new transportation systems: The case of Crossrail. Transportation Research Part A: Policy and Practice, 77, 261–275.
Dvir, D. O. V., & Shenhar, A. J. (2011). What great projects have in common. MIT Sloan Management Review, 52(3), 19–21.
Flyvbjerg, B., Bruzelius, N., & Rothengatter, W. (2003). Megaprojects and risk: An anatomy of ambition. Cambridge, UK: Cambridge University Press.
Gann, D. (2000). Building innovation: Complex constructs in a changing world. London, England: Thomas Telford.
Gann, D. (2001). Putting academic ideas into practice: Technological progress and the absorptive capacity of construction organizations. Construction Management and Economics, 19(3), 321–330.
Gann, D. M., Wang, Y., & Hawkins, R. (1998). Do regulations encourage innovation? The case of energy efficiency in housing. Building Research & Information, 26(5), 280–296.
Gil, N. (2007). On the value of project safeguards: Embedding real options in complex products and systems. Research Policy, 36(7), 980–999.
Hansford, M., & Pitcher, G. (2013). High Speed Two boss attacks government’s economic tests. New Civil Engineer.
Jones, C., & Lichtenstein, B. B. (2008). Temporary inter-organizational projects: How temporal and social embeddedness enhance coordination and manage uncertainty. In S. Cropper & C. Huxham & M. Ebers & P. Smith Ring (Eds.), The Oxford handbook of inter-organizational relations. Oxford, UK: Oxford University Press.
Kijkuit, B., & van den Ende, J. (2010). With a little help from our colleagues: A longitudinal study of social networks for innovation. Organization Studies, 31(4), 451–479.
Lee, L., Reinicke, B., Sarkar, R., & Anderson, R. (2015). Learning through interactions: Improving project management through communities of
network connectivity on innovation idea quality. Journal of Product Innovation Management, 26(6), 662–670.
Brady, T., & Davies, A. (2014). Managing structural and dynamic complexity: A tale of two projects. Project Management Journal, 45(4), 21–38.
Chesbrough, H. (2004). Managing open innovation. Research-Technology Management, 47(1), 23–26(24).
Chesbrough, H. W. (2003). A better way to innovate. Harvard Business Review, 81(7), 12–13.
Chesbrough, H. W. (2006). Open Innovation: The New Imperative for Creating and Profiting from Technology. Boston, MA: Harvard Business School Press.
Chronéer, D., & Backlund, F. (2015). A holistic view on learning in project-based organizations. Project Management Journal, 46(3), 61–74.
Davies, A., Gann, D., & Douglas, T. (2009). Innovation in megaprojects: Systems integration at London Heathrow Terminal 5. California Management Review, 51(2), 101–125.
Davies, A., MacAulay, S., DeBarro, T., & Thurston, M. (2014). Making innovation happen in a megaproject: London’s Crossrail Suburban Railway System. Project Management Journal, 45(6), 25–37.
Davies, A., & Mackenzie, I. (2014). Project complexity and systems integration: Constructing the London 2012 Olympics and Paralympics Games. International Journal of Project Management, 32(5), 773–790.
DeBarro, T., MacAulay, S., Davies, A., Pelton, J., Wolstenholme, W., & Gann, D. M. (2015). From mantra to method: Lessons from managing innovation at Crossrail. Proceedings of the Institution of Civil Engineers, Civil Engineering, 168(4), 171–178, November 2015.
Dodgson, M., Gann, D. M., & Salter, A. (2008). The management of technological innovation: Strategy and practice. Oxford, England: Oxford University Press.
Dodgson, M., Gann, D. M., & Phillips, N. (2013). The Oxford handbook of
PMJ_87569728_47_4_Aug_Sept_2016.indb 93 9/19/16 3:44 PM
Balancing Open and Closed Innovation in Megaprojects: Insights from Crossrail
94 August/September 2016 ■ Project Management Journal
PAPERS
of Construction Engineering and Management, 124(3), 226–231.
Tether, B. S., & Metcalfe, J. S. (2003). Horndal at Heathrow? Capacity creation through co-operation and system evolution. Industrial and Corporate Change, 12(3), 437–476.
Van de Ven, A. H. (1986). Central problems in the management of innovation. Management Science, 32(5), 590–607.
van Marrewijk, A., Clegg, S. R., Pitsis, T. S., & Veenswijk, M. (2008). Managing public–private megaprojects: Paradoxes, complexity, and project design. International Journal of Project Management, 26(6), 591–600.
von Hippel, E. (1988). The sources of innovation. Oxford, UK: Oxford University Press.
von Hippel, E. (2005). Democratizing inovation. Cambridge, MA: MIT Press.
Winch, G. (1998). Zephyrs of creative destruction: Understanding the management of innovation in construction. Building Research & Information, 26(5), 268–279.
Winch, G. M., & Carr, B. (2001). Processes, maps and protocols: Understanding
the shape of the construction process. Construction Management and Economics, 19(5), 519–531.
Winch, G. M. (2010). Managing construction projects. Hoboken, NJ: John Wiley & Sons.
Winch, G. M. (2014. Three domains of project organising. International Journal of Project Management, 32(5), 721–731.
Winch, G. M. (2015). Project organizing as a problem in information. Construction Management and Economics, 33(2), 106–116.
Yin, R. K. (2013). Case study research: Design and methods (5th ed.). Thousand Oaks, CA: SAGE Publications.
Thomas Worsnop is a civil engineer and Project Manager at Arup, London, England, in the Programme and Project Management group. His work focuses on the infrastructure sector and he has a specific interest in major projects and how to introduce innovation. He can be contacted at [email protected]
Stefano Miraglia is a Lecturer in Strategic Management at University College London, England. His research addresses the challenges faced by
multinational corporations in the areas of technology and innovation management, strategic knowledge management, business model innovation, and competition in business ecosystems. He can be contacted at [email protected]
Andrew Davies is Professor of the Management of Projects in the School of Construction and Project Management, the Bartlett Faculty of the Built Environment, University College London, England. He is author of The Business of Projects: Managing Innovation in Complex Products and Systems (Cambridge University Press, 2005) co-authored with Michael Hobday and The Business of Systems Integration (Oxford University Press, 2003, 2005) co-edited with Andrea Prencipe and Michael Hobday. He has published in a range of leading management journals, including California Management Review, MIT Sloan Management Review, Research Policy, Organization Studies, Industrial Marketing Management, International Journal of Project Management and Industrial and Corporate Change. He is on the Editorial Board of the Project Management Journal® and an Associate Editor of Journal of Management, Industrial and Corporate Change, IEEE Transactions of Engineering Management, and Engineering Project Organization Journal. He can be contacted at [email protected]
PMJ_87569728_47_4_Aug_Sept_2016.indb 94 9/19/16 3:44 PM
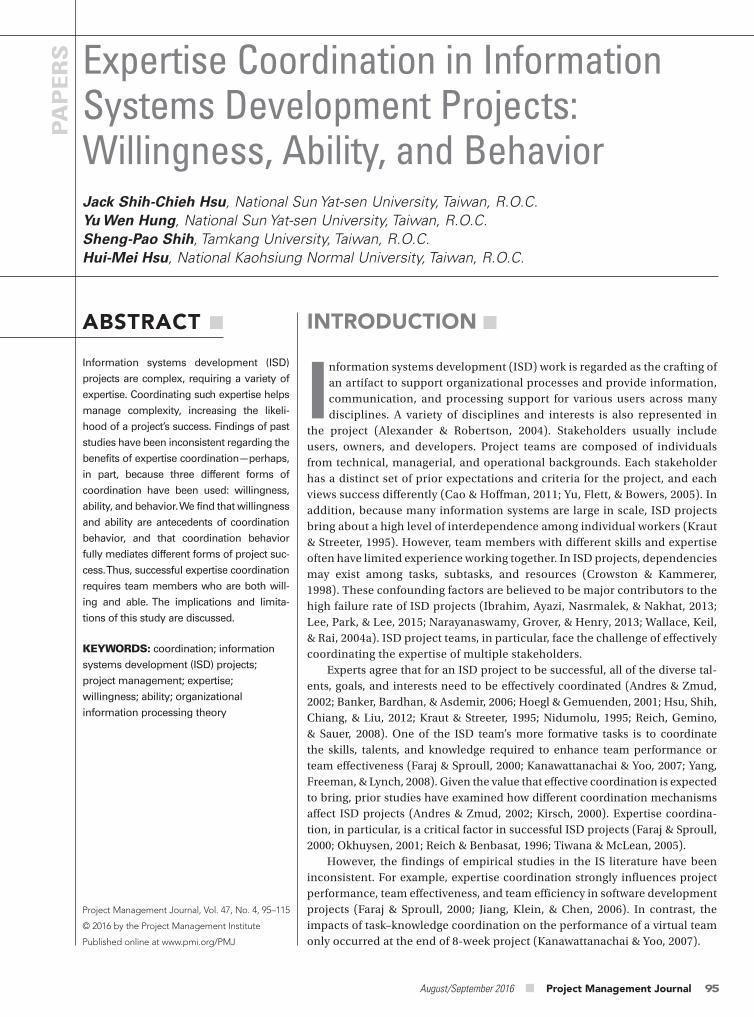
August/September 2016 ■ Project Management Journal 95
PA
PE
RS
ABSTRACT ■
Expertise Coordination in Information Systems Development Projects: Willingness, Ability, and BehaviorJack Shih-Chieh Hsu, National Sun Yat-sen University, Taiwan, R.O.C.Yu Wen Hung, National Sun Yat-sen University, Taiwan, R.O.C.Sheng-Pao Shih, Tamkang University, Taiwan, R.O.C.Hui-Mei Hsu, National Kaohsiung Normal University, Taiwan, R.O.C.
INTRODUCTION
Information systems development (ISD) work is regarded as the crafting of an artifact to support organizational processes and provide information, communication, and processing support for various users across many disciplines. A variety of disciplines and interests is also represented in
the project (Alexander & Robertson, 2004). Stakeholders usually include users, owners, and developers. Project teams are composed of individuals from technical, managerial, and operational backgrounds. Each stakeholder has a distinct set of prior expectations and criteria for the project, and each views success differently (Cao & Hoffman, 2011; Yu, Flett, & Bowers, 2005). In addition, because many information systems are large in scale, ISD projects bring about a high level of interdependence among individual workers (Kraut & Streeter, 1995). However, team members with different skills and expertise often have limited experience working together. In ISD projects, dependencies may exist among tasks, subtasks, and resources (Crowston & Kammerer, 1998). These confounding factors are believed to be major contributors to the high failure rate of ISD projects (Ibrahim, Ayazi, Nasrmalek, & Nakhat, 2013; Lee, Park, & Lee, 2015; Narayanaswamy, Grover, & Henry, 2013; Wallace, Keil, & Rai, 2004a). ISD project teams, in particular, face the challenge of effectively coordinating the expertise of multiple stakeholders.
Experts agree that for an ISD project to be successful, all of the diverse tal-ents, goals, and interests need to be effectively coordinated (Andres & Zmud, 2002; Banker, Bardhan, & Asdemir, 2006; Hoegl & Gemuenden, 2001; Hsu, Shih, Chiang, & Liu, 2012; Kraut & Streeter, 1995; Nidumolu, 1995; Reich, Gemino, & Sauer, 2008). One of the ISD team’s more formative tasks is to coordinate the skills, talents, and knowledge required to enhance team performance or team effectiveness (Faraj & Sproull, 2000; Kanawattanachai & Yoo, 2007; Yang, Freeman, & Lynch, 2008). Given the value that effective coordination is expected to bring, prior studies have examined how different coordination mechanisms affect ISD projects (Andres & Zmud, 2002; Kirsch, 2000). Expertise coordina-tion, in particular, is a critical factor in successful ISD projects (Faraj & Sproull, 2000; Okhuysen, 2001; Reich & Benbasat, 1996; Tiwana & McLean, 2005).
However, the findings of empirical studies in the IS literature have been inconsistent. For example, expertise coordination strongly influences project performance, team effectiveness, and team efficiency in software development projects (Faraj & Sproull, 2000; Jiang, Klein, & Chen, 2006). In contrast, the impacts of task–knowledge coordination on the performance of a virtual team only occurred at the end of 8-week project (Kanawattanachai & Yoo, 2007).
Project Management Journal, Vol. 47, No. 4, 95–115
© 2016 by the Project Management Institute
Published online at www.pmi.org/PMJ
Information systems development (ISD)
projects are complex, requiring a variety of
expertise. Coordinating such expertise helps
manage complexity, increasing the likeli-
hood of a project’s success. Findings of past
studies have been inconsistent regarding the
benefits of expertise coordination—perhaps,
in part, because three different forms of
coordination have been used: willingness,
ability, and behavior. We find that willingness
and ability are antecedents of coordination
behavior, and that coordination behavior
fully mediates different forms of project suc-
cess. Thus, successful expertise coordination
requires team members who are both will-
ing and able. The implications and limita-
tions of this study are discussed.
KEYWORDS: coordination; information
systems development (ISD) projects;
project management; expertise;
willingness; ability; organizational
information processing theory
PMJ_87569728_47_4_Aug_Sept_2016.indb 95 9/19/16 3:44 PM
96 August/September 2016 ■ Project Management Journal
PAPERS Expertise Coordination in Information Systems Development Projects
Many characteristics of ISD projects require team members to coordinate in order to solve problems and create the final product. First, many information systems are large in scale and cannot be implemented or even understood by a single small group (Hsu, Hung, Chen, & Huang, 2013). Second, both the rapidly changing business environ-ment and the increasingly rapid rate of technological innovations create an inherent uncertainty to which the team must respond effectively (Shih, Shaw, Fu, & Cheng, 2013). Third, ISD projects usually involve originality and creativ-ity, so the content of the project is most likely new to the team members (Kwak & Stoddard, 2004; Reich et al., 2008). Fourth, ISD projects still suffer from a high rate of failure (Ibrahim et al., 2013; Narayanaswamy et al., 2013). Research conducted by McKinsey and the Univer-sity of Oxford reported that 45% of large IT projects run over budget, 7% run over time, and 56% deliver less value than expected (Bloch, Blumberg, & Laartz, 2012). Lastly, ISD projects lead to a high level of interdependence among individual workers (Kraut & Streeter, 1995), and team members with different levels of skill and expertise often have limited experience working together. In ISD projects, dependencies may exist between subtasks, between tasks and resources, and between resources (Crowston & Kammerer, 1998). These conditions make ISD projects a unique environment worthy of independent study, and also highlight the impor-tance of coordination in such projects.
Coordination can be viewed as the management of interdependencies (Van de Ven et al., 1976). Effective coordina-tion is particularly critical to the suc-cess of a software project (Strode et al., 2012). The degree of effective coordi-nation in a project is determined by how well team members can manage the interdependencies (Faraj & Sproull, 2000). Effective coordination allows the work to be completed efficiently, without redundancy (Kraut & Streeter, 1995). It can also enhance the working climate
Overall, this study aims to investigate the impact of expertise coordination on ISD projects. Expertise coordination is broken down into three components: ability, willingness, and behavior. Fur-thermore, we examine the relationships among these three dimensions. We col-lected our data via a survey of 525 team members from 104 project teams. The results confirm the model and dem-onstrate how distinguishing coordina-tion components is important for future research studying the effects of coordina-tion behavior on multiple success indica-tors. This study provides insights for the impact of coordination on ISD projects and helps researchers understand how subdividing coordination has caused inconsistent results across past studies.
BackgroundMalone and Crowston (1990) defined coordination theory as a body of prin-ciples about how activities can be coordinated—that is, about how actors can work together harmoniously. Coor-dination among team members rep-resents the act of working together in harmony as the team deals with a series of problems. This coordination is necessary for the team’s daily activi-ties, such as the subdivision of goals into actions, assigning actions to actors, resource allocation among different actors, and information sharing among actors to help achieve the overall goals. Organization theory describes coordi-nation as the act of managing inter-dependencies between activities that are performed to achieve a common goal. These interdependencies include shared resources, prerequisites and usability constraints, simultaneous con-straints, and task/subtask relationships (Malone & Crowston, 1994). Specifically, Van de Ven, Delbecq, and Koenig (1976) defined coordination as “the integra-tion of different parts of an organization to accomplish a collective set of tasks (p. 322)” and argued that the impact of coordination on the project outcome depends on how effectively the team performs coordination behavior.
The inconclusive results regarding the relationship between coordination and performance might be caused by the measures of coordination. Prior IS studies have tended to mix measures of coordination willingness, coordina-tion ability, and coordination behavior (Collins & Smith, 2006). Coordination ability refers to the extent to which proj-ect team members are able to manage interdependencies, whereas coordina-tion willingness refers to how much project team members are willing to exchange, combine, and integrate their unique expertise or knowledge to solve a problem. Factors that describe team members’ cognitive, motivational, and affective states (e.g., willingness, cog-nitive ability) should be distinguished from team coordination behavior and activities (Marks, Mathieu, & Zaccaro, 2001). Constructs are contaminated when behavior and motivational or affective states are mixed together (Collins & Smith, 2006). Such ambigu-ous measurements tend to weaken the relationships between coordination and its antecedents and consequences (Gerwin, 2004). We propose three expertise coordination components: ability, willingness, and behavior. Thus, our first research question is: How are expertise coordination ability, expertise coordination willingness, and expertise coordination behavior interrelated?
More specifically, based upon the theory of planned behavior (Ajzen & Fishbein, 1980), we propose that exper-tise coordination behavior is affected by both the cognitive and affective factors of coordination, and that effective coor-dination behavior is an important ante-cedent of the success of an ISD project (Strode, Huff, Hope, & Link, 2012). For completeness, we model all three coor-dination components and consider suc-cess (i.e., project performance, system quality, and personal work satisfaction) from the viewpoints of various stake-holders. Thus, our second research question is: What impact does effective coordination behavior have on the suc-cess of an ISD project?
PMJ_87569728_47_4_Aug_Sept_2016.indb 96 9/19/16 3:44 PM
August/September 2016 ■ Project Management Journal 97
factor that decreases the effectiveness of knowledge exchange (Hislop, 2003; Stenmark, 2000; Wiewiora, Murphy, Trigunarsyah, & Brown, 2014; Wiewiora, Trigunarsyah, Murphy, & Coffey, 2013).
Multiple dimensions of success must be considered in order to represent the perspectives of various stakeholders in the project (Schwalbe, 2009). In the team and group research streams, team performance and attitudinal perception have been used as two major measures of success (Cohen & Bailey, 1997). Team performance often indicates how effi-ciently and effectively the team arrives at the final outcome. A high-performance ISD team will meet or exceed the stan-dard measures of scope, cost, and sched-ule for its project (Jiang, Motwani, & Margulis, 1997). System quality has also been used by many researchers to evalu-ate system success and project team-work effectiveness (DeLone & McLean, 1992; Nidumolu, 1995, 1996a, 1996b; Pitt, Watson, & Kavan, 1995). Attitudinal per-ception has also been considered impor-tant to success (Mathieu, Maynard, Rapp, & Gilson, 2008; Muller & Turner, 2007). Team processes include interpersonal interaction and task performance, both of which result in personal perceptions of satisfaction. To summarize, measuring personal work satisfaction can capture individual attitudes, measuring software quality can capture the interests of users and the organization, and measuring project performance reflects the views of project management. Prior literature has considered these forms of success impor-tant in the evaluation of the develop-ment process (Aladwani, 2002; DeLone & McLean, 2003; Markus & Mao, 2004).
We conclude that coordination is an important factor influencing ISD project performance. However, the measures of coordination (i.e., coordination ability, coordination willingness, or coordina-tion behavior) in previous research have varied. Thus, as we mentioned above, the inconclusive results regarding coordination and performance might be caused by inconsistent measures of coordination. Table 1 summarizes
The impact of coordination effectiveness and process implementation on a software development team’s performance is so significant that it outweighs the impact of more traditional team factors (e.g., group resources, professional experience, and use of software development methods) (Faraj & Sproull, 2000). In the extant IS literature, however, findings regarding the relationship between coordination and ISD performance have been inconclusive.
According to variations of the the-ory of planned behavior, coordination behavior is dependent upon individuals’ ability and willingness to coordinate. Past studies have adopted perceived behavioral control to indicate that indi-viduals perform certain behaviors when they have a high level of ability to per-form those behaviors (Ajzen, 2002). Studies of global software develop-ment teams and outsourcing have also indicated that members’ abilities (such as client-specific knowledge, shared knowledge, or absorptive capacity) are critical for reducing coordination costs and improving coordination effective-ness (Dibbern et al., 2008; Espinosa et al., 2007). Expertise coordination ability refers to the extent to which team members are able to manage interde-pendencies. As an important anteced-ent to coordination behavior, the ability to coordinate expertise is the ability to manage information through the pro-cesses of exchange, integration, and uti-lization (Faraj & Sproull, 2000; Tiwana & McLean, 2005). Ability is a critical deter-minant of actual coordination behavior (Qu, Ji, & Nsakanda, 2012). For example, the effectiveness of knowledge integra-tion is limited by the ability of two par-ties to exchange knowledge (Szulanski, 1996). In addition, expertise coordina-tion willingness implies mutual con-sent among the team members to unify their efforts through the exchange and integration of knowledge and expertise (Gerwin, 2004). Team members’ coor-dination willingness is one factor that determines their coordination behavior. In fact, a lack of willingness to exchange knowledge has been cited as one critical
between users and IS developers (Li, Jiang, & Klein, 2003). Inter-function and inter-organization supply chain integra-tion can also be enhanced by coordi-nation efforts (Bharadwaj, Bharadwaj, & Bendoly, 2007). With sufficient informa-tion exchange, team members can cope with environmental uncertainty and variety (Nidumolu, 1995, 1996a). Exper-tise coordination is generally believed to serve as an important factor for cre-ative and successful system development (Faraj & Sproull, 2000; Kanawattanachai & Yoo, 2007; Mitchell, 2006; Reich et al., 2008; Tiwana & McLean, 2005). This holds true for both physical and virtual teams (Cummings, Espinosa, & Pickering, 2009; Espinosa, Slaughter, Kraut, & Herbsleb, 2007). Successful expertise coordination leads to higher levels of productivity, satisfaction with the process, and sat-isfaction with the product (Andres & Zmud, 2002; Jiang et al., 2006). These results are achieved via better-quality teamwork (Hoegl & Gemuenden, 2001) and better resolution of goal conflicts (Sherif, Zmud, & Browne, 2006). Other studies have explored how shared knowl-edge and increased member capacity can enhance coordination (Dibbern, Winkler, & Heinzl, 2008; Espinosa et al., 2007).
In particular, expertise coordination is considered one key to ISD project suc-cess (Tiwana & McLean, 2005). Expertise coordination is the process of knowledge integration and the outcome of exchang-ing and combining knowledge through interactions among team members (Faraj & Sproull, 2000; Okhuysen, 2001; Reich & Benbasat, 1996). Although the term knowledge integration captures the trans-fer of knowledge between individuals, expertise coordination is the process of knowledge integration that facilitates a common understanding of project objec-tives and the approaches for reaching those objectives (Mitchell, 2006). It is the coordinated application of individually held expertise in the accomplishment of tasks at the project level. The integration of individuals’ specialized expertise to perform ISD-related tasks is the essence of the team’s capability (Grant, 1996).
PMJ_87569728_47_4_Aug_Sept_2016.indb 97 9/19/16 3:44 PM
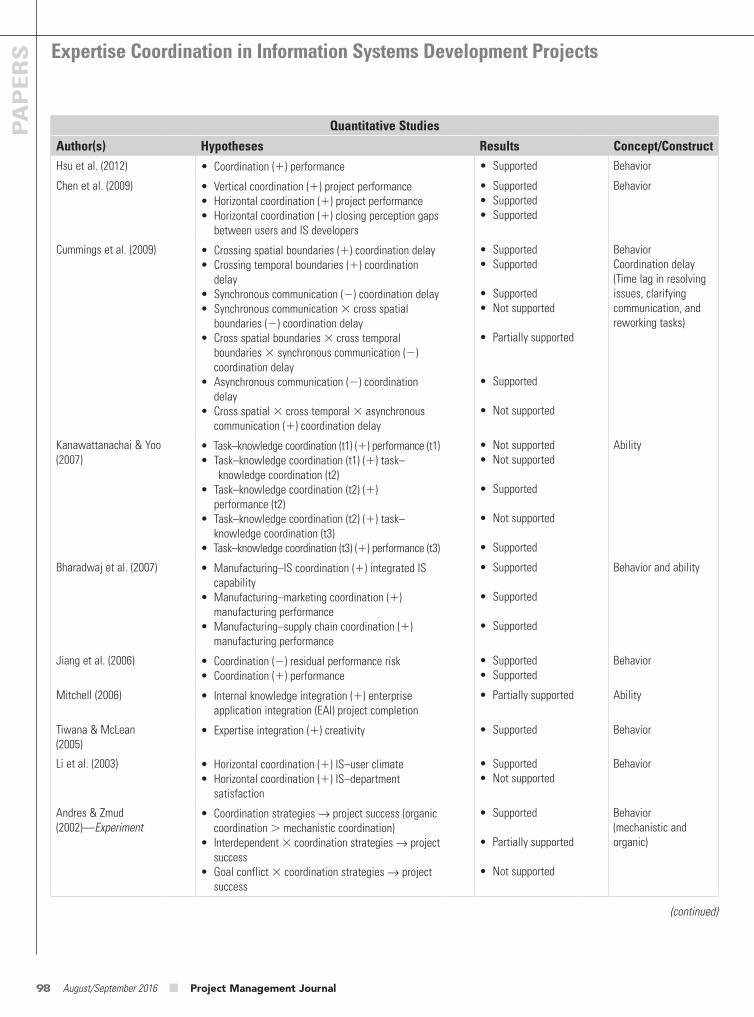
Expertise Coordination in Information Systems Development Projects
98 August/September 2016 ■ Project Management Journal
PAPERS
Quantitative Studies
Author(s) Hypotheses Results Concept/ConstructHsu et al. (2012) • Coordination (1) performance • Supported Behavior
Chen et al. (2009) • Vertical coordination (1) project performance• Horizontal coordination (1) project performance• Horizontal coordination (1) closing perception gaps
between users and IS developers
• Supported• Supported• Supported
Behavior
Cummings et al. (2009) • Crossing spatial boundaries (1) coordination delay• Crossing temporal boundaries (1) coordination
delay• Synchronous communication () coordination delay• Synchronous communication 3 cross spatial
boundaries () coordination delay• Cross spatial boundaries 3 cross temporal
boundaries 3 synchronous communication () coordination delay
• Asynchronous communication () coordination delay
• Cross spatial 3 cross temporal 3 asynchronous communication (1) coordination delay
• Supported• Supported
• Supported• Not supported
• Partially supported
• Supported
• Not supported
BehaviorCoordination delay (Time lag in resolving issues, clarifying communication, and reworking tasks)
Kanawattanachai & Yoo (2007)
• Task–knowledge coordination (t1) (1) performance (t1)• T ask–knowledge coordination (t1) (1) task–
knowledge coordination (t2)• Task–knowledge coordination (t2) (1)
performance (t2)• Task–knowledge coordination (t2) (1) task–
knowledge coordination (t3)• Task–knowledge coordination (t3) (1) performance (t3)
• Not supported• Not supported
• Supported
• Not supported
• Supported
Ability
Bharadwaj et al. (2007) • Manufacturing–IS coordination (1) integrated IS capability
• Manufacturing–marketing coordination (1) manufacturing performance
• Manufacturing–supply chain coordination (1) manufacturing performance
• Supported
• Supported
• Supported
Behavior and ability
Jiang et al. (2006) • Coordination () residual performance risk• Coordination (1) performance
• Supported• Supported
Behavior
Mitchell (2006) • Internal knowledge integration (1) enterprise application integration (EAI) project completion
• Partially supported Ability
Tiwana & McLean (2005)
• Expertise integration (1) creativity • Supported Behavior
Li et al. (2003) • Horizontal coordination (1) IS–user climate• Horizontal coordination (1) IS–department
satisfaction
• Supported• Not supported
Behavior
Andres & Zmud (2002)—Experiment
• Coordination strategies → project success (organic coordination . mechanistic coordination)
• Interdependent 3 coordination strategies → project success
• Goal conflict 3 coordination strategies → project success
• Supported
• Partially supported
• Not supported
Behavior(mechanistic and organic)
(continued)
PMJ_87569728_47_4_Aug_Sept_2016.indb 98 9/19/16 3:44 PM
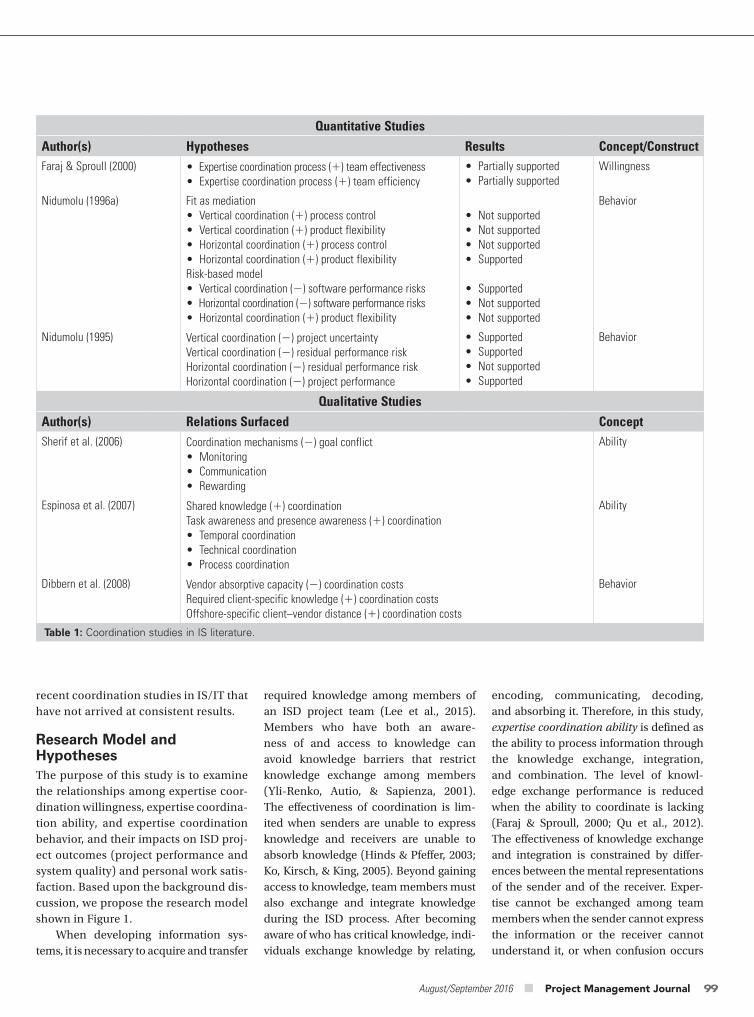
August/September 2016 ■ Project Management Journal 99
Quantitative Studies
Author(s) Hypotheses Results Concept/ConstructFaraj & Sproull (2000) • Expertise coordination process (1) team effectiveness
• Expertise coordination process (1) team efficiency• Partially supported• Partially supported
Willingness
Nidumolu (1996a) Fit as mediation• Vertical coordination (1) process control• Vertical coordination (1) product flexibility• Horizontal coordination (1) process control• Horizontal coordination (1) product flexibilityRisk-based model• Vertical coordination () software performance risks• Horizontal coordination () software performance risks• Horizontal coordination (1) product flexibility
• Not supported• Not supported• Not supported• Supported
• Supported• Not supported• Not supported
Behavior
Nidumolu (1995) Vertical coordination () project uncertaintyVertical coordination () residual performance riskHorizontal coordination () residual performance riskHorizontal coordination () project performance
• Supported• Supported• Not supported• Supported
Behavior
Qualitative Studies
Author(s) Relations Surfaced ConceptSherif et al. (2006) Coordination mechanisms () goal conflict
• Monitoring• Communication• Rewarding
Ability
Espinosa et al. (2007) Shared knowledge (1) coordinationTask awareness and presence awareness (1) coordination• Temporal coordination• Technical coordination• Process coordination
Ability
Dibbern et al. (2008) Vendor absorptive capacity () coordination costsRequired client-specific knowledge (1) coordination costsOffshore-specific client–vendor distance (1) coordination costs
Behavior
Table 1: Coordination studies in IS literature.
recent coordination studies in IS/IT that have not arrived at consistent results.
Research Model and HypothesesThe purpose of this study is to examine the relationships among expertise coor-dination willingness, expertise coordina-tion ability, and expertise coordination behavior, and their impacts on ISD proj-ect outcomes (project performance and system quality) and personal work satis-faction. Based upon the background dis-cussion, we propose the research model shown in Figure 1.
When developing information sys-tems, it is necessary to acquire and transfer
required knowledge among members of an ISD project team (Lee et al., 2015). Members who have both an aware-ness of and access to knowledge can avoid knowledge barriers that restrict knowledge exchange among members (Yli-Renko, Autio, & Sapienza, 2001). The effectiveness of coordination is lim-ited when senders are unable to express knowledge and receivers are unable to absorb knowledge (Hinds & Pfeffer, 2003; Ko, Kirsch, & King, 2005). Beyond gaining access to knowledge, team members must also exchange and integrate knowledge during the ISD process. After becoming aware of who has critical knowledge, indi-viduals exchange knowledge by relating,
encoding, communicating, decoding, and absorbing it. Therefore, in this study, expertise coordination ability is defined as the ability to process information through the knowledge exchange, integration, and combination. The level of knowl-edge exchange performance is reduced when the ability to coordinate is lacking (Faraj & Sproull, 2000; Qu et al., 2012). The effectiveness of knowledge exchange and integration is constrained by differ-ences between the mental representations of the sender and of the receiver. Exper-tise cannot be exchanged among team members when the sender cannot express the information or the receiver cannot understand it, or when confusion occurs
PMJ_87569728_47_4_Aug_Sept_2016.indb 99 9/19/16 3:44 PM
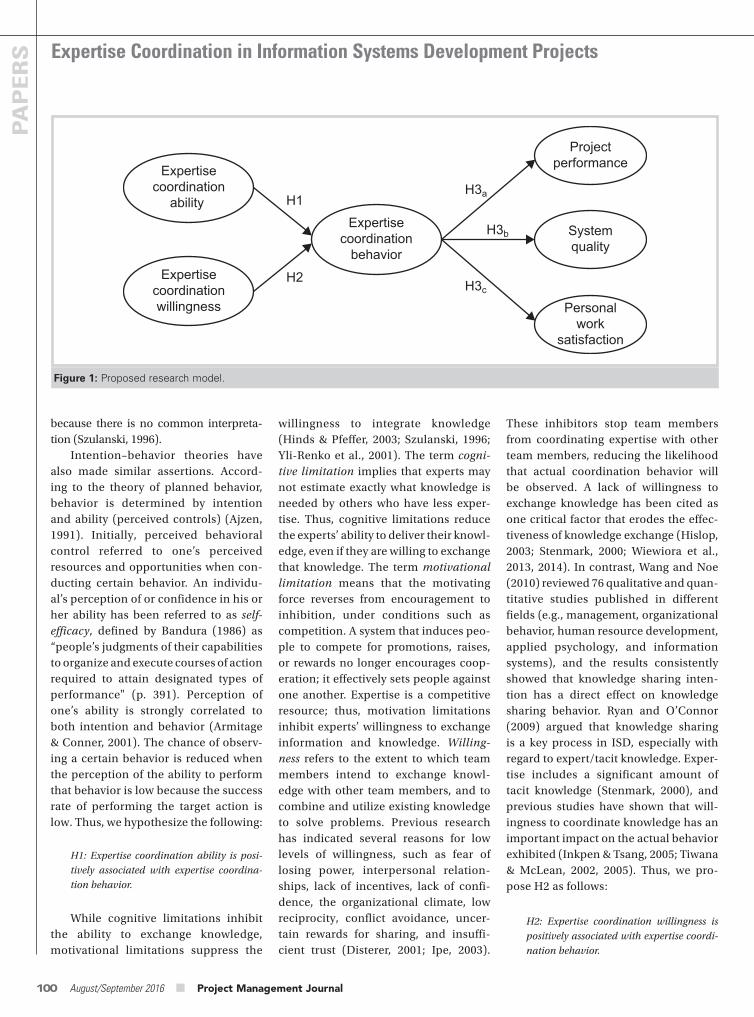
Expertise Coordination in Information Systems Development Projects
100 August/September 2016 ■ Project Management Journal
PAPERS
These inhibitors stop team members from coordinating expertise with other team members, reducing the likelihood that actual coordination behavior will be observed. A lack of willingness to exchange knowledge has been cited as one critical factor that erodes the effec-tiveness of knowledge exchange (Hislop, 2003; Stenmark, 2000; Wiewiora et al., 2013, 2014). In contrast, Wang and Noe (2010) reviewed 76 qualitative and quan-titative studies published in different fields (e.g., management, organizational behavior, human resource development, applied psychology, and information systems), and the results consistently showed that knowledge sharing inten-tion has a direct effect on knowledge sharing behavior. Ryan and O’Connor (2009) argued that knowledge sharing is a key process in ISD, especially with regard to expert/tacit knowledge. Exper-tise includes a significant amount of tacit knowledge (Stenmark, 2000), and previous studies have shown that will-ingness to coordinate knowledge has an important impact on the actual behavior exhibited (Inkpen & Tsang, 2005; Tiwana & McLean, 2002, 2005). Thus, we pro-pose H2 as follows:
H2: Expertise coordination willingness is positively associated with expertise coordi-nation behavior.
willingness to integrate knowledge (Hinds & Pfeffer, 2003; Szulanski, 1996; Yli-Renko et al., 2001). The term cogni-tive limitation implies that experts may not estimate exactly what knowledge is needed by others who have less exper-tise. Thus, cognitive limitations reduce the experts’ ability to deliver their knowl-edge, even if they are willing to exchange that knowledge. The term motivational limitation means that the motivating force reverses from encouragement to inhibition, under conditions such as competition. A system that induces peo-ple to compete for promotions, raises, or rewards no longer encourages coop-eration; it effectively sets people against one another. Expertise is a competitive resource; thus, motivation limitations inhibit experts’ willingness to exchange information and knowledge. Willing-ness refers to the extent to which team members intend to exchange knowl-edge with other team members, and to combine and utilize existing knowledge to solve problems. Previous research has indicated several reasons for low levels of willingness, such as fear of losing power, interpersonal relation-ships, lack of incentives, lack of confi-dence, the organizational climate, low reciprocity, conflict avoidance, uncer-tain rewards for sharing, and insuffi-cient trust (Disterer, 2001; Ipe, 2003).
because there is no common interpreta-tion (Szulanski, 1996).
Intention–behavior theories have also made similar assertions. Accord-ing to the theory of planned behavior, behavior is determined by intention and ability (perceived controls) (Ajzen, 1991). Initially, perceived behavioral control referred to one’s perceived resources and opportunities when con-ducting certain behavior. An individu-al’s perception of or confidence in his or her ability has been referred to as self-efficacy, defined by Bandura (1986) as “people’s judgments of their capabilities to organize and execute courses of action required to attain designated types of performance" (p. 391). Perception of one’s ability is strongly correlated to both intention and behavior (Armitage & Conner, 2001). The chance of observ-ing a certain behavior is reduced when the perception of the ability to perform that behavior is low because the success rate of performing the target action is low. Thus, we hypothesize the following:
H1: Expertise coordination ability is posi-tively associated with expertise coordina-tion behavior.
While cognitive limitations inhibit the ability to exchange knowledge, motivational limitations suppress the
Figure 1: Proposed research model.
Expertisecoordination
behavior
Projectperformance
Systemquality
Personalwork
satisfaction
H1
H2
H3a
H3b
H3cExpertise
coordinationwillingness
Expertisecoordination
ability
PMJ_87569728_47_4_Aug_Sept_2016.indb 100 9/19/16 3:44 PM
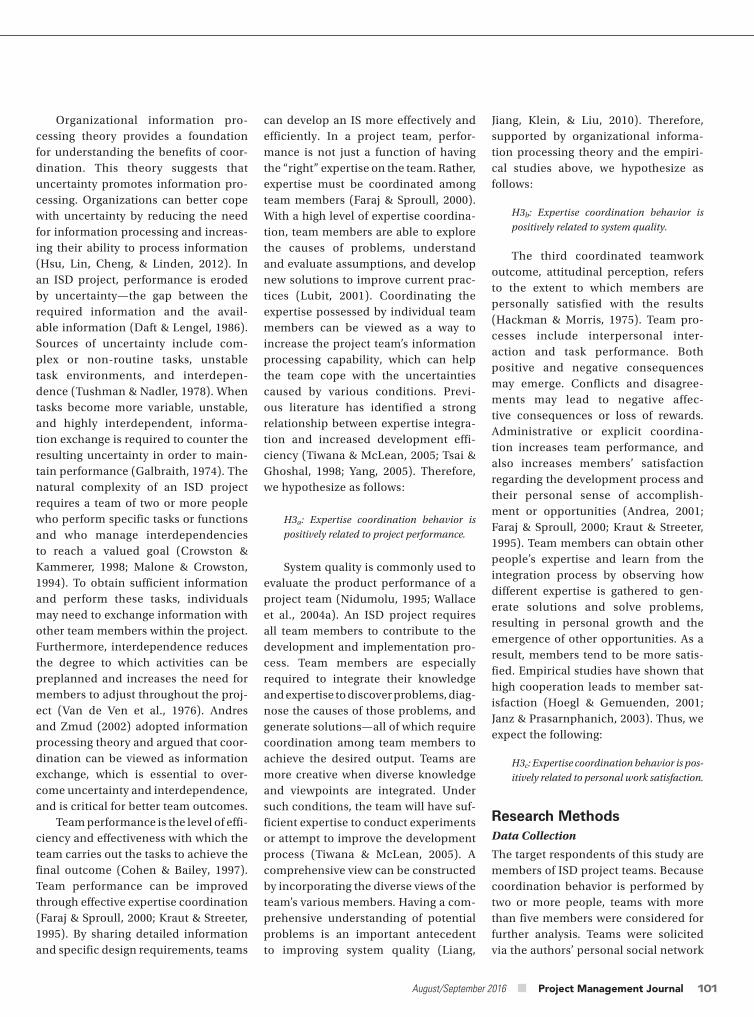
August/September 2016 ■ Project Management Journal 101
Jiang, Klein, & Liu, 2010). Therefore, supported by organizational informa-tion processing theory and the empiri-cal studies above, we hypothesize as follows:
H3b: Expertise coordination behavior is positively related to system quality.
The third coordinated teamwork outcome, attitudinal perception, refers to the extent to which members are personally satisfied with the results (Hackman & Morris, 1975). Team pro-cesses include interpersonal inter-action and task performance. Both positive and negative consequences may emerge. Conflicts and disagree-ments may lead to negative affec-tive consequences or loss of rewards. Administrative or explicit coordina-tion increases team performance, and also increases members’ satisfaction regarding the development process and their personal sense of accomplish-ment or opportunities (Andrea, 2001; Faraj & Sproull, 2000; Kraut & Streeter, 1995). Team members can obtain other people’s expertise and learn from the integration process by observing how different expertise is gathered to gen-erate solutions and solve problems, resulting in personal growth and the emergence of other opportunities. As a result, members tend to be more satis-fied. Empirical studies have shown that high cooperation leads to member sat-isfaction (Hoegl & Gemuenden, 2001; Janz & Prasarnphanich, 2003). Thus, we expect the following:
H3c: Expertise coordination behavior is pos-itively related to personal work satisfaction.
Research MethodsData Collection
The target respondents of this study are members of ISD project teams. Because coordination behavior is performed by two or more people, teams with more than five members were considered for further analysis. Teams were solicited via the authors’ personal social network
can develop an IS more effectively and efficiently. In a project team, perfor-mance is not just a function of having the “right” expertise on the team. Rather, expertise must be coordinated among team members (Faraj & Sproull, 2000). With a high level of expertise coordina-tion, team members are able to explore the causes of problems, understand and evaluate assumptions, and develop new solutions to improve current prac-tices (Lubit, 2001). Coordinating the expertise possessed by individual team members can be viewed as a way to increase the project team’s information processing capability, which can help the team cope with the uncertainties caused by various conditions. Previ-ous literature has identified a strong relationship between expertise integra-tion and increased development effi-ciency (Tiwana & McLean, 2005; Tsai & Ghoshal, 1998; Yang, 2005). Therefore, we hypothesize as follows:
H3a: Expertise coordination behavior is positively related to project performance.
System quality is commonly used to evaluate the product performance of a project team (Nidumolu, 1995; Wallace et al., 2004a). An ISD project requires all team members to contribute to the development and implementation pro-cess. Team members are especially required to integrate their knowledge and expertise to discover problems, diag-nose the causes of those problems, and generate solutions—all of which require coordination among team members to achieve the desired output. Teams are more creative when diverse knowledge and viewpoints are integrated. Under such conditions, the team will have suf-ficient expertise to conduct experiments or attempt to improve the development process (Tiwana & McLean, 2005). A comprehensive view can be constructed by incorporating the diverse views of the team’s various members. Having a com-prehensive understanding of potential problems is an important antecedent to improving system quality (Liang,
Organizational information pro-cessing theory provides a foundation for understanding the benefits of coor-dination. This theory suggests that uncertainty promotes information pro-cessing. Organizations can better cope with uncertainty by reducing the need for information processing and increas-ing their ability to process information (Hsu, Lin, Cheng, & Linden, 2012). In an ISD project, performance is eroded by uncertainty—the gap between the required information and the avail-able information (Daft & Lengel, 1986). Sources of uncertainty include com-plex or non-routine tasks, unstable task environments, and interdepen-dence (Tushman & Nadler, 1978). When tasks become more variable, unstable, and highly interdependent, informa-tion exchange is required to counter the resulting uncertainty in order to main-tain performance (Galbraith, 1974). The natural complexity of an ISD project requires a team of two or more people who perform specific tasks or functions and who manage interdependencies to reach a valued goal (Crowston & Kammerer, 1998; Malone & Crowston, 1994). To obtain sufficient information and perform these tasks, individuals may need to exchange information with other team members within the project. Furthermore, interdependence reduces the degree to which activities can be preplanned and increases the need for members to adjust throughout the proj-ect (Van de Ven et al., 1976). Andres and Zmud (2002) adopted information processing theory and argued that coor-dination can be viewed as information exchange, which is essential to over-come uncertainty and interdependence, and is critical for better team outcomes.
Team performance is the level of effi-ciency and effectiveness with which the team carries out the tasks to achieve the final outcome (Cohen & Bailey, 1997). Team performance can be improved through effective expertise coordination (Faraj & Sproull, 2000; Kraut & Streeter, 1995). By sharing detailed information and specific design requirements, teams
PMJ_87569728_47_4_Aug_Sept_2016.indb 101 9/19/16 3:44 PM
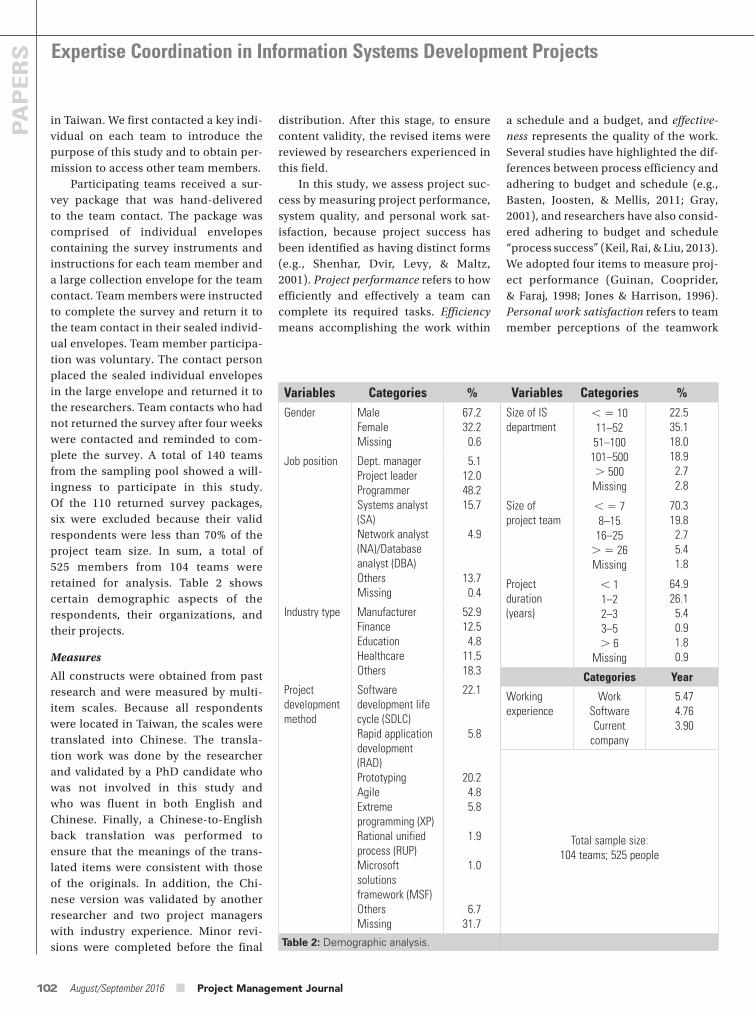
Expertise Coordination in Information Systems Development Projects
102 August/September 2016 ■ Project Management Journal
PAPERS
a schedule and a budget, and effective-ness represents the quality of the work. Several studies have highlighted the dif-ferences between process efficiency and adhering to budget and schedule (e.g., Basten, Joosten, & Mellis, 2011; Gray, 2001), and researchers have also consid-ered adhering to budget and schedule “process success” (Keil, Rai, & Liu, 2013). We adopted four items to measure proj-ect performance (Guinan, Cooprider, & Faraj, 1998; Jones & Harrison, 1996). Personal work satisfaction refers to team member perceptions of the teamwork
distribution. After this stage, to ensure content validity, the revised items were reviewed by researchers experienced in this field.
In this study, we assess project suc-cess by measuring project performance, system quality, and personal work sat-isfaction, because project success has been identified as having distinct forms (e.g., Shenhar, Dvir, Levy, & Maltz, 2001). Project performance refers to how efficiently and effectively a team can complete its required tasks. Efficiency means accomplishing the work within
in Taiwan. We first contacted a key indi-vidual on each team to introduce the purpose of this study and to obtain per-mission to access other team members.
Participating teams received a sur-vey package that was hand-delivered to the team contact. The package was comprised of individual envelopes containing the survey instruments and instructions for each team member and a large collection envelope for the team contact. Team members were instructed to complete the survey and return it to the team contact in their sealed individ-ual envelopes. Team member participa-tion was voluntary. The contact person placed the sealed individual envelopes in the large envelope and returned it to the researchers. Team contacts who had not returned the survey after four weeks were contacted and reminded to com-plete the survey. A total of 140 teams from the sampling pool showed a will-ingness to participate in this study. Of the 110 returned survey packages, six were excluded because their valid respondents were less than 70% of the project team size. In sum, a total of 525 members from 104 teams were retained for analysis. Table 2 shows certain demographic aspects of the respondents, their organizations, and their projects.
Measures
All constructs were obtained from past research and were measured by multi-item scales. Because all respondents were located in Taiwan, the scales were translated into Chinese. The transla-tion work was done by the researcher and validated by a PhD candidate who was not involved in this study and who was fluent in both English and Chinese. Finally, a Chinese-to-English back translation was performed to ensure that the meanings of the trans-lated items were consistent with those of the originals. In addition, the Chi-nese version was validated by another researcher and two project managers with industry experience. Minor revi-sions were completed before the final
Variables Categories %Gender Male
FemaleMissing
67.232.2
0.6
Job position Dept. managerProject leaderProgrammerSystems analyst (SA)Network analyst (NA)/Database analyst (DBA)OthersMissing
5.112.048.215.7
4.9
13.70.4
Industry type ManufacturerFinanceEducationHealthcareOthers
52.912.5
4.811.518.3
Project development method
Software development life cycle (SDLC)Rapid application development (RAD)PrototypingAgileExtreme programming (XP)Rational unified process (RUP)Microsoft solutions framework (MSF)OthersMissing
22.1
5.8
20.24.85.8
1.9
1.0
6.731.7
Table 2: Demographic analysis.
Variables Categories %Size of IS department
, 1011–5251–100101–500. 500
Missing
22.535.118.018.92.72.8
Size of project team
, 78–1516–25
. 26Missing
70.319.82.75.41.8
Project duration(years)
, 11–22–33–5. 6
Missing
64.926.15.40.91.80.9
Categories Year
Working experience
WorkSoftwareCurrent
company
5.474.763.90
Total sample size:104 teams; 525 people
PMJ_87569728_47_4_Aug_Sept_2016.indb 102 9/19/16 3:44 PM
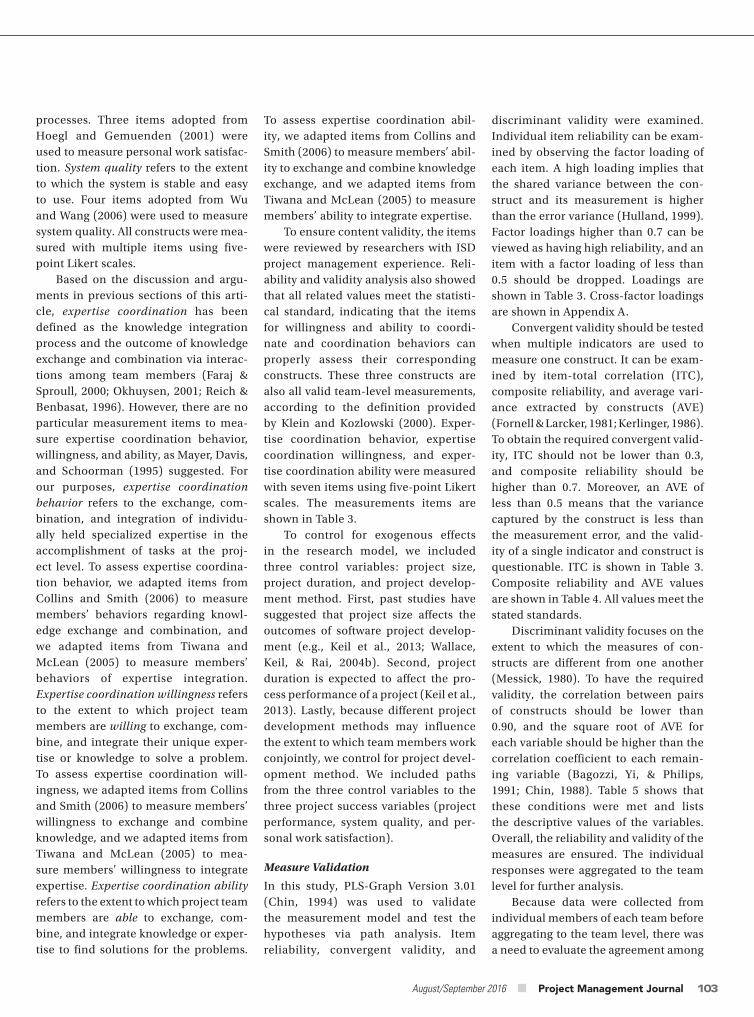
August/September 2016 ■ Project Management Journal 103
discriminant validity were examined. Individual item reliability can be exam-ined by observing the factor loading of each item. A high loading implies that the shared variance between the con-struct and its measurement is higher than the error variance (Hulland, 1999). Factor loadings higher than 0.7 can be viewed as having high reliability, and an item with a factor loading of less than 0.5 should be dropped. Loadings are shown in Table 3. Cross-factor loadings are shown in Appendix A.
Convergent validity should be tested when multiple indicators are used to measure one construct. It can be exam-ined by item-total correlation (ITC), composite reliability, and average vari-ance extracted by constructs (AVE) (Fornell & Larcker, 1981; Kerlinger, 1986). To obtain the required convergent valid-ity, ITC should not be lower than 0.3, and composite reliability should be higher than 0.7. Moreover, an AVE of less than 0.5 means that the variance captured by the construct is less than the measurement error, and the valid-ity of a single indicator and construct is questionable. ITC is shown in Table 3. Composite reliability and AVE values are shown in Table 4. All values meet the stated standards.
Discriminant validity focuses on the extent to which the measures of con-structs are different from one another (Messick, 1980). To have the required validity, the correlation between pairs of constructs should be lower than 0.90, and the square root of AVE for each variable should be higher than the correlation coefficient to each remain-ing variable (Bagozzi, Yi, & Philips, 1991; Chin, 1988). Table 5 shows that these conditions were met and lists the descriptive values of the variables. Overall, the reliability and validity of the measures are ensured. The individual responses were aggregated to the team level for further analysis.
Because data were collected from individual members of each team before aggregating to the team level, there was a need to evaluate the agreement among
To assess expertise coordination abil-ity, we adapted items from Collins and Smith (2006) to measure members’ abil-ity to exchange and combine knowledge exchange, and we adapted items from Tiwana and McLean (2005) to measure members’ ability to integrate expertise.
To ensure content validity, the items were reviewed by researchers with ISD project management experience. Reli-ability and validity analysis also showed that all related values meet the statisti-cal standard, indicating that the items for willingness and ability to coordi-nate and coordination behaviors can properly assess their corresponding constructs. These three constructs are also all valid team-level measurements, according to the definition provided by Klein and Kozlowski (2000). Exper-tise coordination behavior, expertise coordination willingness, and exper-tise coordination ability were measured with seven items using five-point Likert scales. The measurements items are shown in Table 3.
To control for exogenous effects in the research model, we included three control variables: project size, project duration, and project develop-ment method. First, past studies have suggested that project size affects the outcomes of software project develop-ment (e.g., Keil et al., 2013; Wallace, Keil, & Rai, 2004b). Second, project duration is expected to affect the pro-cess performance of a project (Keil et al., 2013). Lastly, because different project development methods may influence the extent to which team members work conjointly, we control for project devel-opment method. We included paths from the three control variables to the three project success variables (project performance, system quality, and per-sonal work satisfaction).
Measure Validation
In this study, PLS-Graph Version 3.01 (Chin, 1994) was used to validate the measurement model and test the hypotheses via path analysis. Item reliability, convergent validity, and
processes. Three items adopted from Hoegl and Gemuenden (2001) were used to measure personal work satisfac-tion. System quality refers to the extent to which the system is stable and easy to use. Four items adopted from Wu and Wang (2006) were used to measure system quality. All constructs were mea-sured with multiple items using five-point Likert scales.
Based on the discussion and argu-ments in previous sections of this arti-cle, expertise coordination has been defined as the knowledge integration process and the outcome of knowledge exchange and combination via interac-tions among team members (Faraj & Sproull, 2000; Okhuysen, 2001; Reich & Benbasat, 1996). However, there are no particular measurement items to mea-sure expertise coordination behavior, willingness, and ability, as Mayer, Davis, and Schoorman (1995) suggested. For our purposes, expertise coordination behavior refers to the exchange, com-bination, and integration of individu-ally held specialized expertise in the accomplishment of tasks at the proj-ect level. To assess expertise coordina-tion behavior, we adapted items from Collins and Smith (2006) to measure members’ behaviors regarding knowl-edge exchange and combination, and we adapted items from Tiwana and McLean (2005) to measure members’ behaviors of expertise integration. Expertise coordination willingness refers to the extent to which project team members are willing to exchange, com-bine, and integrate their unique exper-tise or knowledge to solve a problem. To assess expertise coordination will-ingness, we adapted items from Collins and Smith (2006) to measure members’ willingness to exchange and combine knowledge, and we adapted items from Tiwana and McLean (2005) to mea-sure members’ willingness to integrate expertise. Expertise coordination ability refers to the extent to which project team members are able to exchange, com-bine, and integrate knowledge or exper-tise to find solutions for the problems.
PMJ_87569728_47_4_Aug_Sept_2016.indb 103 9/19/16 3:44 PM
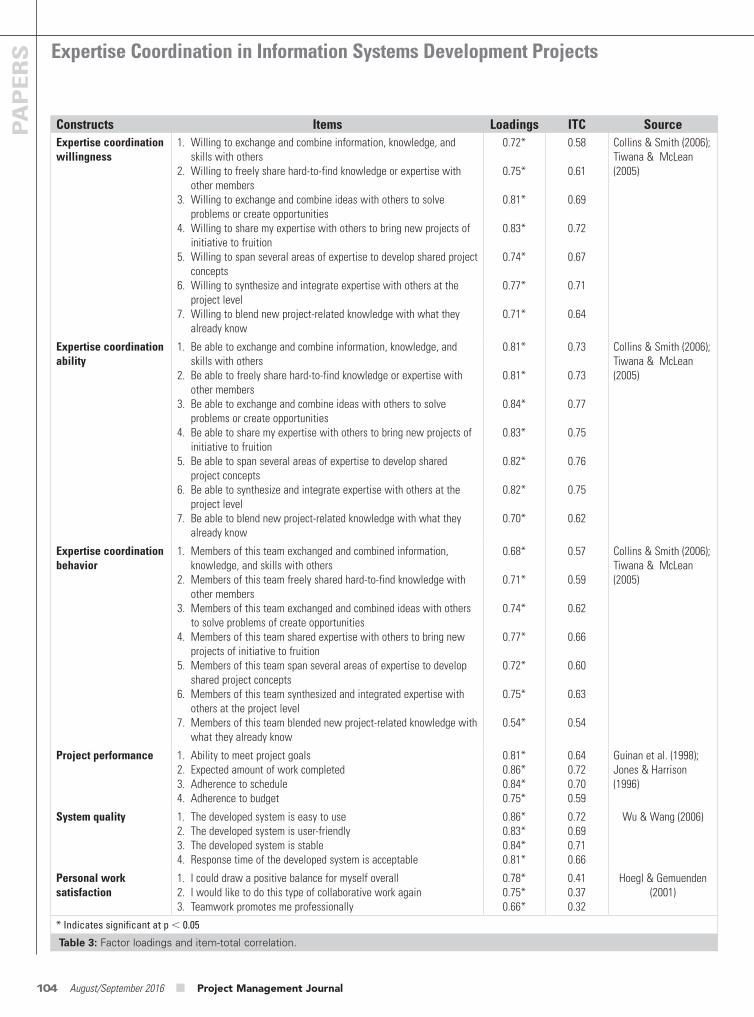
Expertise Coordination in Information Systems Development Projects
104 August/September 2016 ■ Project Management Journal
PAPERS
Constructs Items Loadings ITC SourceExpertise coordination willingness
1. Willing to exchange and combine information, knowledge, and skills with others
2. Willing to freely share hard-to-find knowledge or expertise with other members
3. Willing to exchange and combine ideas with others to solve problems or create opportunities
4. Willing to share my expertise with others to bring new projects of initiative to fruition
5. Willing to span several areas of expertise to develop shared project concepts
6. Willing to synthesize and integrate expertise with others at the project level
7. Willing to blend new project-related knowledge with what they already know
0.72*
0.75*
0.81*
0.83*
0.74*
0.77*
0.71*
0.58
0.61
0.69
0.72
0.67
0.71
0.64
Collins & Smith (2006); Tiwana & McLean (2005)
Expertise coordination ability
1. Be able to exchange and combine information, knowledge, and skills with others
2. Be able to freely share hard-to-find knowledge or expertise with other members
3. Be able to exchange and combine ideas with others to solve problems or create opportunities
4. Be able to share my expertise with others to bring new projects of initiative to fruition
5. Be able to span several areas of expertise to develop shared project concepts
6. Be able to synthesize and integrate expertise with others at the project level
7. Be able to blend new project-related knowledge with what they already know
0.81*
0.81*
0.84*
0.83*
0.82*
0.82*
0.70*
0.73
0.73
0.77
0.75
0.76
0.75
0.62
Collins & Smith (2006); Tiwana & McLean (2005)
Expertise coordination behavior
1. Members of this team exchanged and combined information, knowledge, and skills with others
2. Members of this team freely shared hard-to-find knowledge with other members
3. Members of this team exchanged and combined ideas with others to solve problems of create opportunities
4. Members of this team shared expertise with others to bring new projects of initiative to fruition
5. Members of this team span several areas of expertise to develop shared project concepts
6. Members of this team synthesized and integrated expertise with others at the project level
7. Members of this team blended new project-related knowledge with what they already know
0.68*
0.71*
0.74*
0.77*
0.72*
0.75*
0.54*
0.57
0.59
0.62
0.66
0.60
0.63
0.54
Collins & Smith (2006); Tiwana & McLean (2005)
Project performance 1. Ability to meet project goals2. Expected amount of work completed3. Adherence to schedule4. Adherence to budget
0.81*0.86*0.84*0.75*
0.640.720.700.59
Guinan et al. (1998); Jones & Harrison (1996)
System quality 1. The developed system is easy to use2. The developed system is user-friendly3. The developed system is stable4. Response time of the developed system is acceptable
0.86*0.83*0.84*0.81*
0.720.690.710.66
Wu & Wang (2006)
Personal work satisfaction
1. I could draw a positive balance for myself overall2. I would like to do this type of collaborative work again3. Teamwork promotes me professionally
0.78*0.75*0.66*
0.410.370.32
Hoegl & Gemuenden (2001)
* Indicates significant at p , 0.05
Table 3: Factor loadings and item-total correlation.
PMJ_87569728_47_4_Aug_Sept_2016.indb 104 9/19/16 3:44 PM
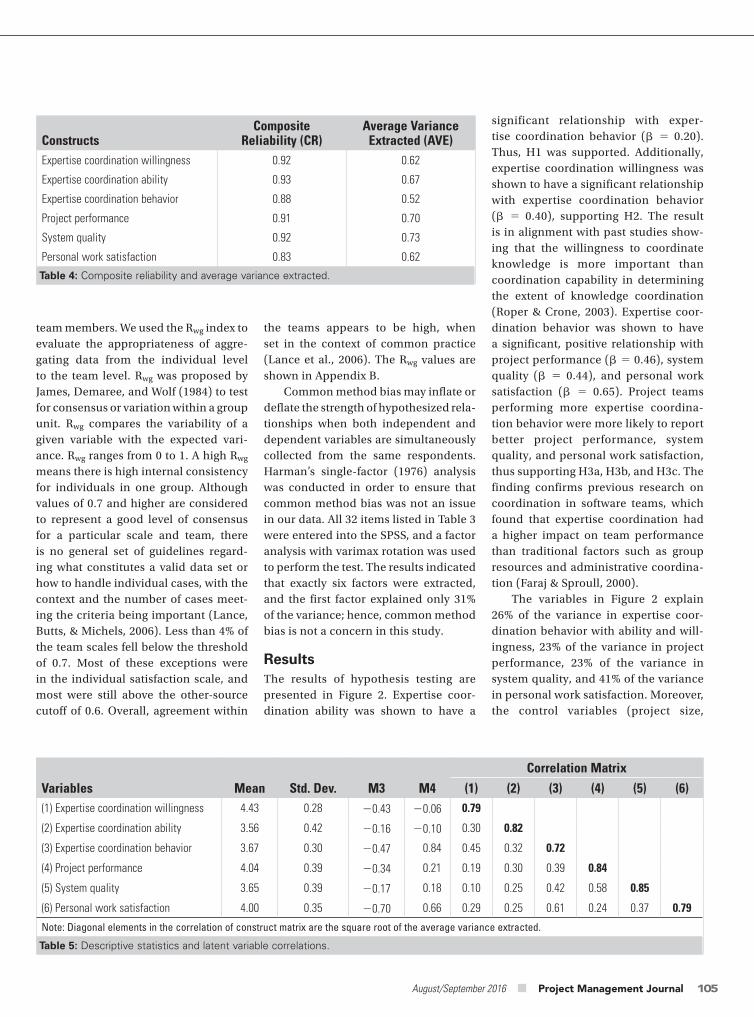
August/September 2016 ■ Project Management Journal 105
significant relationship with exper-tise coordination behavior (b 0.20). Thus, H1 was supported. Additionally, expertise coordination willingness was shown to have a significant relationship with expertise coordination behavior (b 0.40), supporting H2. The result is in alignment with past studies show-ing that the willingness to coordinate knowledge is more important than coordination capability in determining the extent of knowledge coordination (Roper & Crone, 2003). Expertise coor-dination behavior was shown to have a significant, positive relationship with project performance (b 0.46), system quality (b 0.44), and personal work satisfaction (b 0.65). Project teams performing more expertise coordina-tion behavior were more likely to report better project performance, system quality, and personal work satisfaction, thus supporting H3a, H3b, and H3c. The finding confirms previous research on coordination in software teams, which found that expertise coordination had a higher impact on team performance than traditional factors such as group resources and administrative coordina-tion (Faraj & Sproull, 2000).
The variables in Figure 2 explain 26% of the variance in expertise coor-dination behavior with ability and will-ingness, 23% of the variance in project performance, 23% of the variance in system quality, and 41% of the variance in personal work satisfaction. Moreover, the control variables (project size,
the teams appears to be high, when set in the context of common practice (Lance et al., 2006). The Rwg values are shown in Appendix B.
Common method bias may inflate or deflate the strength of hypothesized rela-tionships when both independent and dependent variables are simultaneously collected from the same respondents. Harman’s single-factor (1976) analysis was conducted in order to ensure that common method bias was not an issue in our data. All 32 items listed in Table 3 were entered into the SPSS, and a factor analysis with varimax rotation was used to perform the test. The results indicated that exactly six factors were extracted, and the first factor explained only 31% of the variance; hence, common method bias is not a concern in this study.
ResultsThe results of hypothesis testing are presented in Figure 2. Expertise coor-dination ability was shown to have a
team members. We used the Rwg index to evaluate the appropriateness of aggre-gating data from the individual level to the team level. Rwg was proposed by James, Demaree, and Wolf (1984) to test for consensus or variation within a group unit. Rwg compares the variability of a given variable with the expected vari-ance. Rwg ranges from 0 to 1. A high Rwg means there is high internal consistency for individuals in one group. Although values of 0.7 and higher are considered to represent a good level of consensus for a particular scale and team, there is no general set of guidelines regard-ing what constitutes a valid data set or how to handle individual cases, with the context and the number of cases meet-ing the criteria being important (Lance, Butts, & Michels, 2006). Less than 4% of the team scales fell below the threshold of 0.7. Most of these exceptions were in the individual satisfaction scale, and most were still above the other-source cutoff of 0.6. Overall, agreement within
ConstructsComposite
Reliability (CR)Average Variance
Extracted (AVE)Expertise coordination willingness 0.92 0.62
Expertise coordination ability 0.93 0.67
Expertise coordination behavior 0.88 0.52
Project performance 0.91 0.70
System quality 0.92 0.73
Personal work satisfaction 0.83 0.62
Table 4: Composite reliability and average variance extracted.
Variables Mean Std. Dev. M3 M4
Correlation Matrix
(1) (2) (3) (4) (5) (6)(1) Expertise coordination willingness 4.43 0.28 0.43 0.06 0.79
(2) Expertise coordination ability 3.56 0.42 0.16 0.10 0.30 0.82
(3) Expertise coordination behavior 3.67 0.30 0.47 0.84 0.45 0.32 0.72
(4) Project performance 4.04 0.39 0.34 0.21 0.19 0.30 0.39 0.84
(5) System quality 3.65 0.39 0.17 0.18 0.10 0.25 0.42 0.58 0.85
(6) Personal work satisfaction 4.00 0.35 0.70 0.66 0.29 0.25 0.61 0.24 0.37 0.79
Note: Diagonal elements in the correlation of construct matrix are the square root of the average variance extracted.
Table 5: Descriptive statistics and latent variable correlations.
PMJ_87569728_47_4_Aug_Sept_2016.indb 105 9/19/16 3:44 PM
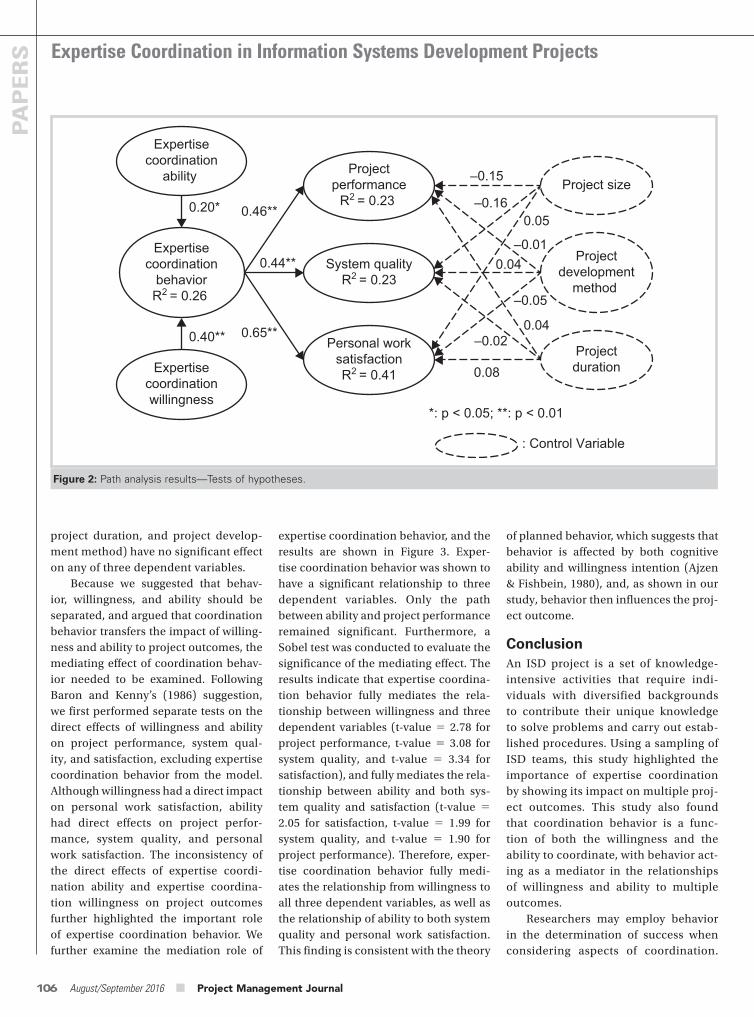
Expertise Coordination in Information Systems Development Projects
106 August/September 2016 ■ Project Management Journal
PAPERS
of planned behavior, which suggests that behavior is affected by both cognitive ability and willingness intention (Ajzen & Fishbein, 1980), and, as shown in our study, behavior then influences the proj-ect outcome.
ConclusionAn ISD project is a set of knowledge-intensive activities that require indi-viduals with diversified backgrounds to contribute their unique knowledge to solve problems and carry out estab-lished procedures. Using a sampling of ISD teams, this study highlighted the importance of expertise coordination by showing its impact on multiple proj-ect outcomes. This study also found that coordination behavior is a func-tion of both the willingness and the ability to coordinate, with behavior act-ing as a mediator in the relationships of willingness and ability to multiple outcomes.
Researchers may employ behavior in the determination of success when considering aspects of coordination.
expertise coordination behavior, and the results are shown in Figure 3. Exper-tise coordination behavior was shown to have a significant relationship to three dependent variables. Only the path between ability and project performance remained significant. Furthermore, a Sobel test was conducted to evaluate the significance of the mediating effect. The results indicate that expertise coordina-tion behavior fully mediates the rela-tionship between willingness and three dependent variables (t-value 2.78 for project performance, t-value 3.08 for system quality, and t-value 3.34 for satisfaction), and fully mediates the rela-tionship between ability and both sys-tem quality and satisfaction (t-value 2.05 for satisfaction, t-value 1.99 for system quality, and t-value 1.90 for project performance). Therefore, exper-tise coordination behavior fully medi-ates the relationship from willingness to all three dependent variables, as well as the relationship of ability to both system quality and personal work satisfaction. This finding is consistent with the theory
project duration, and project develop-ment method) have no significant effect on any of three dependent variables.
Because we suggested that behav-ior, willingness, and ability should be separated, and argued that coordination behavior transfers the impact of willing-ness and ability to project outcomes, the mediating effect of coordination behav-ior needed to be examined. Following Baron and Kenny’s (1986) suggestion, we first performed separate tests on the direct effects of willingness and ability on project performance, system qual-ity, and satisfaction, excluding expertise coordination behavior from the model. Although willingness had a direct impact on personal work satisfaction, ability had direct effects on project perfor-mance, system quality, and personal work satisfaction. The inconsistency of the direct effects of expertise coordi-nation ability and expertise coordina-tion willingness on project outcomes further highlighted the important role of expertise coordination behavior. We further examine the mediation role of
Figure 2: Path analysis results—Tests of hypotheses.
Expertisecoordinationwillingness
Expertisecoordination
ability
Expertisecoordination
behaviorR2 = 0.26
Projectperformance
R2 = 0.23
System qualityR2 = 0.23
0.20*
0.40**
0.46**
0.44**
Personal worksatisfactionR2 = 0.41
0.65**
*: p < 0.05; **: p < 0.01
: Control Variable
Project size
Projectduration
–0.15
–0.160.05
0.04–0.02
0.08
Projectdevelopment
method
–0.01
–0.05
0.04
PMJ_87569728_47_4_Aug_Sept_2016.indb 106 9/19/16 3:44 PM
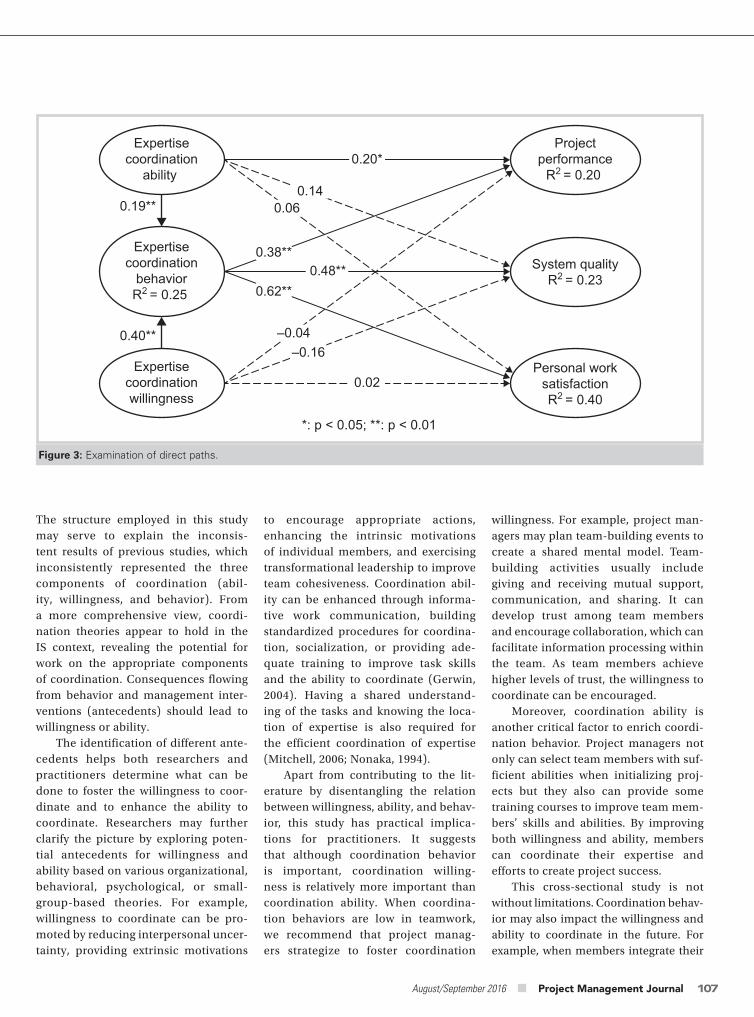
August/September 2016 ■ Project Management Journal 107
willingness. For example, project man-agers may plan team-building events to create a shared mental model. Team-building activities usually include giving and receiving mutual support, communication, and sharing. It can develop trust among team members and encourage collaboration, which can facilitate information processing within the team. As team members achieve higher levels of trust, the willingness to coordinate can be encouraged.
Moreover, coordination ability is another critical factor to enrich coordi-nation behavior. Project managers not only can select team members with suf-ficient abilities when initializing proj-ects but they also can provide some training courses to improve team mem-bers’ skills and abilities. By improving both willingness and ability, members can coordinate their expertise and efforts to create project success.
This cross-sectional study is not without limitations. Coordination behav-ior may also impact the willingness and ability to coordinate in the future. For example, when members integrate their
to encourage appropriate actions, enhancing the intrinsic motivations of individual members, and exercising transformational leadership to improve team cohesiveness. Coordination abil-ity can be enhanced through informa-tive work communication, building standardized procedures for coordina-tion, socialization, or providing ade-quate training to improve task skills and the ability to coordinate (Gerwin, 2004). Having a shared understand-ing of the tasks and knowing the loca-tion of expertise is also required for the efficient coordination of expertise (Mitchell, 2006; Nonaka, 1994).
Apart from contributing to the lit-erature by disentangling the relation between willingness, ability, and behav-ior, this study has practical implica-tions for practitioners. It suggests that although coordination behavior is important, coordination willing-ness is relatively more important than coordination ability. When coordina-tion behaviors are low in teamwork, we recommend that project manag-ers strategize to foster coordination
The structure employed in this study may serve to explain the inconsis-tent results of previous studies, which inconsistently represented the three components of coordination (abil-ity, willingness, and behavior). From a more comprehensive view, coordi-nation theories appear to hold in the IS context, revealing the potential for work on the appropriate components of coordination. Consequences flowing from behavior and management inter-ventions (antecedents) should lead to willingness or ability.
The identification of different ante-cedents helps both researchers and practitioners determine what can be done to foster the willingness to coor-dinate and to enhance the ability to coordinate. Researchers may further clarify the picture by exploring poten-tial antecedents for willingness and ability based on various organizational, behavioral, psychological, or small-group-based theories. For example, willingness to coordinate can be pro-moted by reducing interpersonal uncer-tainty, providing extrinsic motivations
Expertisecoordinationwillingness
Expertisecoordination
ability
Expertisecoordination
behaviorR2 = 0.25
Projectperformance
R2 = 0.20
System qualityR2 = 0.23
0.19**
0.40**
Personal worksatisfactionR2 = 0.40
*: p < 0.05; **: p < 0.01
0.20*
0.140.06
0.38**0.48**
0.62**
–0.04–0.16
0.02
Figure 3: Examination of direct paths.
PMJ_87569728_47_4_Aug_Sept_2016.indb 107 9/19/16 3:44 PM
Expertise Coordination in Information Systems Development Projects
108 August/September 2016 ■ Project Management Journal
PAPERS
delivering_large-scale_it_projects_on_time_on_budget_and_on_value
Cao, Q., & Hoffman, J. J. (2011). A case study approach for developing a project performance evaluation system. International Journal of Project Management, 29(2), 155–164.
Chin, W. W. (1988). Issues and opinion on structural equation modeling. MIS Quarterly, 22(1), vii–xvi.
Chin, W. W. (1994). PLS-graph manual version 2.7. Calgary, Alberta, Canada: University of Calgary.
Cohen, S. G., & Bailey, D. E. (1997). What makes teams work: Group effectiveness research from the shop floor to the executive suite. Journal of Management, 23(3), 239–290.
Collins, C. J., & Smith, K. (2006). Knowledge exchange and combination: The role of human resource practices in the performance of high-technology firms. Academy of Management Journal, 49(3), 544–560.
Crowston, K., & Kammerer, E. E. (1998). Coordination and collective mind in software requirements development. IBM Systems Journal, 37(2), 227–245.
Cummings, J. N., Espinosa, J. A., & Pickering, C. K. (2009). Crossing spatial and temporal boundaries in globally distributed projects: A relational model of coordination delay. Information Systems Research, 20(3), 420–439.
Daft, R. L., & Lengel, R. H. (1986). Organizational information requirements, media richness and structural design. Management Science, 32(5), 554–571.
DeLone, W. H., & McLean, E. R. (1992). Information systems success: The quest for the dependent variable. Information Systems Research, 3(1), 60–95.
DeLone, W. H., & McLean, E. R. (2003). The DeLone and McLean model of information systems success: A ten-year update. Journal of Management Information Systems, 19(4), 9–30.
Dibbern, J., Winkler, J., & Heinzl, A. (2008). Explaining variations in client extra costs between software projects
modeling stakeholders. IEEE Software, 21(1), 23–27.
Andrea, B. H. (2001). Cognitive interdependence and convergent expectations in transactive memory. Journal of Personality and Social Psychology, 81(6), 1080–1089.
Andres, H. P., & Zmud, R. W. (2002). A contingency approach to software project coordination. Journal of Management Information Systems, 18(3), 41–70.
Armitage, C. J., & Conner, M. (2001). Efficacy of the theory of planned behaviour: A meta-analytic review. British Journal of Social Psychology, 40(4), 471–499.
Bagozzi, R. P., Yi, Y., & Philips, L. (1991). Assessing construct validity in organizational research. Administrative Science Quarterly, 36(3), 421–436.
Bandura, A. (1986). Social foundations of thought and action: A social cognitive theory Englewood Cliffs, NJ: Prentice-Hall.
Banker, R. D., Bardhan, I., & Asdemir, O. (2006). Understanding the impact of collaboration software on product design and development. Information Systems Research, 17(4), 352–373.
Baron, R. M., & Kenny, D. A. (1986). The moderator-mediator variable distinction in social psychological research: Conceptual, strategic, and statistical considerations. Journal of Personality and Social Psychology, 51(6), 1173–1182.
Basten, D., Joosten, D., & Mellis, W. (2011). Managers’ perceptions of information system project success. Journal of Computer Information Systems, 52(2), 12–21.
Bharadwaj, S., Bharadwaj, A., & Bendoly, E. (2007). The performance effects of complementarities between information systems, marketing, manufacturing, and supply chain processes. Information Systems Research, 18(4), 437–453.
Bloch, M., Blumberg, S., & Laartz, J. (2012). Delivering large-scale IT projects on time, on budget, and on value, Retrieved from http://www.mckinsey.com/insights/business_technology/
knowledge to solve problems success-fully, members may generate more confidence and self-efficacy regard-ing conducting similar activities in the future. If conflicts or difficulties emerge during the coordination process, nega-tive emotional consequences may be generated and may inhibit the willing-ness to coordinate in the future. Second, this study did not examine what could or should have been done to improve the willingness and ability to coordinate. Future research should explore potential antecedents, based on different theories. Third, we choose the cross-sectional sur-vey as our research method because the purpose of a cross-sectional study is to find the prevalence of the result of inter-est (i.e., in this study, the relationships among expertise coordination willing-ness, abilities, behaviors, and project success) (Levin, 2006). Based on the results of our study, a future longitudinal study may further advance our under-standings of the complicated expertise coordination willingness, abilities, and behaviors among team members during the ISD process. Finally, our data were taken from teams in Asia, limiting the generalizability of our findings.
ReferencesAjzen, I. (1991). The theory of planned behavior. Organizational Behavior and Human Decision Processes, 50(2), 179–211.
Ajzen, I. (2002). Perceived behavioral control, self-efficacy, locus of control, and the theory of planned behavior. Journal of Applied Social Psychology, 32(4), 665–683.
Ajzen, I., & Fishbein, M. (1980). Understanding attitudes and predicting social behavior. Englewood Cliffs, NJ: Prentice-Hall.
Aladwani, A. M. (2002). An integrated performance model information systems projects. Journal of Management Information Systems, 19(1), 185–210.
Alexander, I., & Robertson, S. (2004). Understanding project sociology by
PMJ_87569728_47_4_Aug_Sept_2016.indb 108 9/19/16 3:44 PM
August/September 2016 ■ Project Management Journal 109
transfer. Academy of Management Review, 30(1), 146–165.
Ipe, M. (2003). Knowledge sharing in organizations: A conceptual framework. Human Resource Development Review, 2(4), 337–359.
James, L. R., Demaree, R. G., & Wolf, G. (1984). Estimating within-group interrater reliability with and without rater bias. Journal of Applied Psychology, 69(1), 85–98.
Janz, B. D., & Prasarnphanich, P. (2003). Understanding the antecedents of effective knowledge management: The importance of a knowledge-centered culture. Decision Sciences, 34(2), 351–384.
Jiang, J. J., Klein, G., & Chen, H. G. (2006). The effects of user partnering and user non-support on project performance. Journal of the Association for Information Systems, 7(2), 68–90.
Jiang, J. J., Motwani, J., & Margulis, S. T. (1997). IS team projects: IS professionals rate six criteria for assessing effectiveness. Team Performance Management, 3(4), 235–243.
Jones, M. C., & Harrison, A. W. (1996). IS project team performance: An empirical assessment. Information & Management, 31(2), 57–65.
Kanawattanachai, P., & Yoo, Y. (2007). The impact of knowledge coordination on virtual team performance over time. MIS Quarterly, 31(4), 783–808.
Keil, M., Rai, A., & Liu, S. (2013). How user risk and requirements risk moderate the effects of formal and informal control on the process performance of IT projects. European Journal of Information Systems, 22(6), 650–672.
Kerlinger, F. N. (1986). Foundations of behavioral research. Belmont, CA: Cengage Learning.
Kirsch, L. J. (2000). Software project management: An integrated perspective for an emerging paradigm. In R. W. Zmud (Ed.), Framing the domains of IT management: Projecting the future through the past (pp. 285–304). Cincinnati, OH: Pinnaflex.
Harman, H.H. (1976). Modern factor analysis. Chicago, IL: University of Chicago Press.
Hinds, P. J., & Pfeffer, J. (2003). Why organizations don’t “know what they know:” Cognitive and motivational factors affecting the transfer of expertise. In M. S. Ackerman, V. Pipek, & V. Wulf (Eds.), Sharing expertise: Beyond knowledge management (pp. 3–26). Cambridge, MA: MIT Press.
Hislop, D. (2003). Linking human resource management and knowledge management via commitment. Employee Relations, 25(2), 182–202.
Hoegl, M., & Gemuenden, H. G. (2001). Teamwork quality and the success of innovative projects: A theoretical concept and empirical evidence. Organization Science, 12(4), 435–449.
Hsu, J. S.-C., Hung, Y. W., Chen, Y.-H., & Huang, H.-H. (2013). Antecedents and consequences of user coproduction in information system development projects. Project Management Journal, 44(2), 67–87.
Hsu, J. S.-C., Lin, T.-C., Cheng, K.-T., & Linden, L. P. (2012). Reducing requirement incorrectness and coping with its negative impact in information system development projects. Decision Sciences, 43(5), 929–955.
Hsu, J. S.-C., Shih, S.-P., Chiang, J. C., & Liu, J. Y.-C. (2012). The impact of transactive memory systems on IS development teams’ coordination, communication, and performance. International Journal of Project Management, 30(3), 329–340.
Hulland, J. (1999). Use of partial lest squares (PLS) in strategic management research: A review of four recent studies. Strategic Management Journal, 20(2), 195–204.
Ibrahim, R., Ayazi, E., Nasrmalek, S., & Nakhat, S. (2013). An investigation of critical failure factors in information technology projects. Journal of Business and Management, 10(3), 87–92.
Inkpen, A. C., & Tsang, E. W. K. (2005). Social capital, networks, and knowledge
offshored to India. MIS Quarterly, 32(2), 333–366.
Disterer, G. (2001). Individual and social barriers to knowledge transfer. Paper presented at the 34th Annual Hawaii International Conference on System Sciences (HICSS-34), Los Alamitos, CA.
Espinosa, J. A., Slaughter, S. A., Kraut, R. E., & Herbsleb, J. D. (2007). Team knowledge and coordination in geographically distributed software development. Journal of Management Information Systems, 24(1), 135–169.
Faraj, S., & Sproull, L. (2000). Coordinating expertise in software development teams. Management Science, 46(12), 1554–1568.
Fornell, C., & Larcker, D. (1981). Evaluating structural equation models with unobservable variables and measurement error. Journal of Marketing Research, 18(3), 39–50.
Galbraith, J. R. (1974). Organization design: An information processing view. Interfaces, 4(3), 28–36.
Gerwin, D. (2004). Coordinating new product development in strategic alliances. Academy of Management Review, 29(2), 241–257.
Grant, R. M. (1996). Prospering in dynamically-competitive environments: Organizational capability as knowledge integration. Organization Science, 7(4), 375–387.
Gray, R. J. (2001). Organisational climate and project success. International Journal of Project Management, 19(2), 103–109.
Guinan, P. J., Cooprider, J. G., & Faraj, S. (1998). Enabling software development team performance during requirements definition: A behavioral versus technical approach. Information Systems Research, 9(2), 101–125.
Hackman, J. R., & Morris, C. G. (1975). Group tasks, group interaction process, and group performance effectiveness: A review and proposed integration. In L. Berkowitz (Ed.), Advances in experimental social psychology (pp. 45–99). New York, NY, San Francisco, CA, and London, England: Academic Press.
PMJ_87569728_47_4_Aug_Sept_2016.indb 109 9/19/16 3:44 PM
Expertise Coordination in Information Systems Development Projects
110 August/September 2016 ■ Project Management Journal
PAPERS
perspectives on coordination in software-development projects. Journal of Management Information Systems, 13(2), 77–113.
Nidumolu, S. (1996b). Standardization, requirements uncertainty and software project performance. Information and Management, 31(3), 135–150.
Nonaka, I. (1994). A dynamic theory of organizational knowledge creation. Organization Science, 5(1), 14–37.
Okhuysen, G. A. (2001). Structuring change: Familiarity and formal interventions in problem-solving groups. Academy of Management Journal, 44(4), 794.
Pitt, L. F., Watson, R. T., & Kavan, C. B. (1995). Service quality: A measure of information systems effectiveness. MIS Quarterly, 19(2), 173–187.
Qu, G., Ji, S., & Nsakanda, A. (2012). Project complexity and knowledge transfer in global software outsourcing project teams: A transactive memory systems perspective. Paper presented at the 45th Hawaii International Conference on System Science (HICSS), Maui, HI.
Reich, B. H., & Benbasat, I. (1996). Measuring the linkage between business and information technology objectives. MIS Quarterly, 20(1), 55–81.
Reich, B. H., Gemino, A., & Sauer, C. (2008). Modeling the knowledge perspective of IT projects. Project Management Journal, 39(S1), S4–S14.
Roper, S., & Crone, M. (2003). Knowledge complementarity and coordination in the local supply chain: Some empirical evidence. British Journal of Management, 14(4), 339–355.
Ryan, S., & O’Connor, R. V. (2009). Development of a team measure for tacit knowledge in software development teams. Journal of Systems and Software, 82(2), 229–240.
Schwalbe, K. (2009). Information technology project management (6th ed.). Boston, MA: Thomson Course Technology.
Shenhar, A. J., Dvir, D., Levy, O., & Maltz, A. C. (2001). Project success: A
Computer-supported Cooperative Work, Los Angeles, CA.
Malone, T. W., & Crowston, K. (1994). The interdisciplinary study of coordination. ACM Computing Surveys, 26(1), 87–119.
Marks, M. A., Mathieu, J. E., & Zaccaro, S. J. (2001). A temporally based framework and taxonomy of team processes. Academy of Management Review, 26(3), 356–376.
Markus, M. L., & Mao, J.-Y. (2004). Participation in development and implementation: Updating an old, tired concept for today’s IS contexts. Journal of the Association for Information Systems, 5(11), 514–544.
Mathieu, J., Maynard, M. T., Rapp, T., & Gilson, L. (2008). Team effectiveness 1997–2007: A review of recent advancements and a glimpse into the future. Journal of Management, 34(3), 410–476.
Mayer, R. C., Davis, J. H., & Schoorman, F. D. (1995). An integrative model of organizational trust. Academy of Management Review, 20(3), 709–734.
Messick, S. (1980). Test validity and the ethics of assessment. American Psychologist, 35(11), 1012–1027.
Mitchell, V. L. (2006). Knowledge integration and information technology project performance. MIS Quarterly, 30(4), 919–939.
Muller, R., & Turner, R. (2007). The influence of project managers on project success criteria and project success by type of project. European Management Journal, 25(4), 298–309.
Narayanaswamy, R., Grover, V., & Henry, R. M. (2013). The impact of influence tactics in information system development projects: A control-loss perspective. Journal of Management Information Systems, 30(1), 191–226.
Nidumolu, S. (1995). The effect of coordination and uncertainty on software project performance: Residual performance risk as an intervening variable. Information Systems Research, 6(3), 191–219.
Nidumolu, S. (1996a). A comparison of the structural contingency and risk-based
Klein, K. J., & Kozlowski, S. W. (2000). From micro to meso: Critical steps in conceptualizing and conducting multilevel research. Organizational Research Methods, 3(3), 211–236.
Ko, D. G., Kirsch, L. J., & King, W. R. (2005). Antecedents of knowledge transfer from consultants to clients in enterprise system implementations. MIS Quarterly, 29(1), 59–85.
Kraut, R. E., & Streeter, L. A. (1995). Coordination in software development. Communications of the ACM, 38(3), 69–81.
Kwak, Y. H., & Stoddard, J. (2004). Project risk management: Lessons learned from software development environment. Technovation, 24(11), 915–920.
Lance, C. E., Butts, M. M., & Michels, L. C. (2006). The sources of four commonly reported cutoff criteria: What did they really say? Organizational Research Methods, 9(2), 202–220.
Lee, J., Park, J.-G., & Lee, S. (2015). Raising team social capital with knowledge and communication in information systems development projects. International Journal of Project Management, 33(4), 797–807.
Levin, K. A. (2006). Study design III: Cross-sectional studies. Evidence-based Dentistry, 7(1), 24–25.
Li, E. Y., Jiang, J. J., & Klein, G. (2003). The impact of organizational coordination and climate on marketing executives’ satisfaction with information systems services. Journal of the Association for Information Systems, 4(1), 99–117.
Liang, T. P., Jiang, J., Klein, G. S., & Liu, J. S. G. (2010). Software quality as influenced by informational diversity, task conflict, and learning in project teams. IEEE Transactions on Engineering Management, 57(3), 477–487.
Lubit, R. (2001). The keys to sustainable competitive advantage: Tacit knowledge and knowledge management. Organizational Dynamics, 29(3), 164–178.
Malone, T. W., & Crowston, K. (1990). What is coordination theory and how can it help design cooperative work systems? Paper presented at the Conference on
PMJ_87569728_47_4_Aug_Sept_2016.indb 110 9/19/16 3:44 PM
August/September 2016 ■ Project Management Journal 111
Dr. Jack Shih-Chieh Hsu is an Associate Professor at the Department of Information Management, National Sun Yat-sen Unversity, Taiwan. He received his PhD in management information systems from the University of Central Florida, Orlando, Florida, USA. He has had articles published or accepted in Information Systems Research, Decision Sciences, Information Systems Journal, Information & Management, Decision Support Systems, and others. His research interests include various behavioral issues in electronic commerce, information security, and software project management areas. He can be contacted at [email protected]
Yu Wen Hung is a PhD candidate in Information Management at National Sun Yat-sen University, Taiwan. Her research focuses on behavioral issues in information systems development manage-ment and control and electronic commerce. Her research has been published in academic journals (e.g., Information Systems Research, Information & Management, International Journal of Information Management, Project Management Journal ®) and in international conference proceedings (e.g., PACIS, ECIS, Pre-ICIS WISP). She can be contacted at [email protected]
Dr. Sheng-Pao Shih is an Associate Professor in the Department of Information Management at Tamkang University, Taiwan. He obtained his PhD in informa-tion management from National Central University, Taiwan and was a visiting scholar at the University of Central Florida. His work has been published in Project Management Journal ®, Information Systems Research, Information & Management, Computers in Human Behavior, and others. His research interests include software project management, behavioral information security, and information technology per-sonnel. He can be contacted at [email protected]
Dr. Hui-Mei Hsu is an Assistant Professor in the Business Management Department at National Kaohsiung Normal University, Taiwan. She received her PhD in management information systems from National Chung Cheng University, Taiwan. Her research interests include healthcare informa-tion systems, electronic commerce, healthcare management, and electronic medical records. Her published works have appeared in Telemedicine and e-Health, Journal of Medical Systems, and Journal of Information Management. She can be contacted at [email protected]
Wallace, L., Keil, M., & Rai, A. (2004a). How software project risk affects project performance: An investigation of the dimensions of risk and an exploratory model. Decision Sciences, 35(2), 289–321.
Wallace, L., Keil, M., & Rai, A. (2004b). Understanding software project risk: A cluster analysis. Information & Management, 42(1), 115–125.
Wang, S., & Noe, R. A. (2010). Knowledge sharing: A review and directions for future research. Human Resource Management Review, 20(2), 115–131.
Wiewiora, A., Murphy, G., Trigunarsyah, B., & Brown, K. (2014). Interactions between organizational culture, trustworthiness, and mechanisms for interproject knowledge sharing. Project Management Journal, 45(2), 48–65.
Wiewiora, A., Trigunarsyah, B., Murphy, G., & Coffey, V. (2013). Organizational culture and willingness to share knowledge: A competing values perspective in Australian context. International Journal of Project Management, 31(8), 1163–1174.
Wu, J. H., & Wang, Y. M. (2006). Measuring KMS success: A respecification of the DeLone and McLean’s model. Information & Management, 43(6), 728–739.
Yang, J. (2005). Knowledge integration and innovation: Securing new product advantage in high technology industry. Journal of High Technology Management Research, 16(1), 121–135.
Yang, P., Freeman, R., & Lynch, K. M. (2008). Multi-agent coordination by decentralized estimation and control. Automatic Control, IEEE Transactions on, 53(11), 2480–2496.
Yli-Renko, H., Autio, E., & Sapienza, H. J. (2001). Social capital, knowledge acquisition, and knowledge exploitation in young technology-based firms. Strategic Management Journal, 22(6-7), 587–613.
Yu, A. G., Flett, P. D., & Bowers, J. A. (2005). Developing a value-centred proposal for assessing project success. International Journal of Project Management, 23(6), 428–436.
multidimensional strategic concept. Long Range Planning, 34(6), 699–725.
Sherif, K., Zmud, R. W., & Browne, G. J. (2006). Managing peer-to-peer conflicts in disruptive information technology innovations: The case of software reuse. MIS Quarterly, 30(2), 339–356.
Shih, S.-P., Shaw, R.-S., Fu, T.-Y., & Cheng, C.-P. (2013). A systematic study of change management during CMMI implementation: A modified activity theory perspective. Project Management Journal, 44(4), 84–100.
Stenmark, D. (2000). Leveraging tacit organizational knowledge. Journal of Management Information Systems, 17(3), 9–24.
Strode, D. E., Huff, S. L., Hope, B., & Link, S. (2012). Coordination in co-located agile software development projects. Journal of Systems and Software, 85(6), 1222–1238.
Szulanski, G. (1996). Exploring internal stickiness: Impediments to the transfer of best practice within the firm. Strategic Management Journal, 17(1), 27–43.
Tiwana, A., & McLean, E. R. (2002). Knowledge integration and individual expertise development in e-business project teams: Prom the pod to the peas. Paper presented at the ACM Special Interest Group on Computer Personnel Research (SIG-CPR), Kristiansaand, Norway.
Tiwana, A., & McLean, E. R. (2005). Expertise integration and creativity in information systems development. Journal of Management Information Systems, 22(1), 13–43.
Tsai, W., & Ghoshal, S. (1998). Social capital and value creation: The role of intrafirm networks. Academy of Management Journal, 41(4), 464–476.
Tushman, M. L., & Nadler, D. A. (1978). Information processing as an integrating concept in organizational design. Academy of Management Review, 3(3), 613–624.
Van de Ven, A. H., Delbecq, A. L., & R. Koenig, J. (1976). Determinants of coordination modes within organizations. American Sociological Review, 41(2), 322–338.
PMJ_87569728_47_4_Aug_Sept_2016.indb 111 9/19/16 3:44 PM
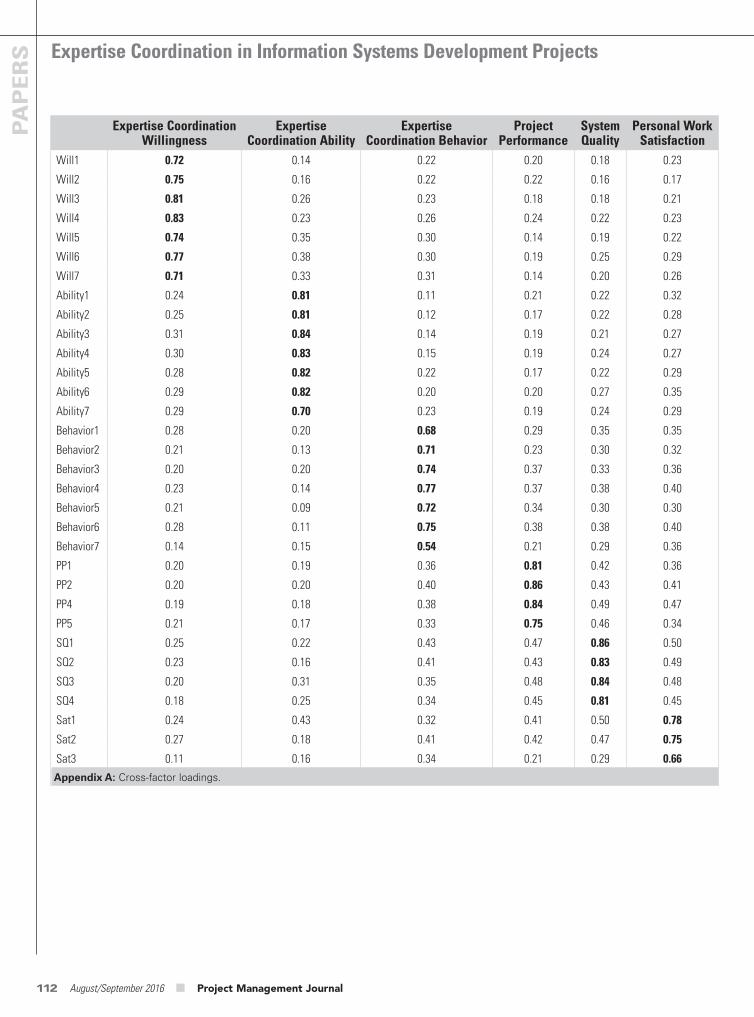
Expertise Coordination in Information Systems Development Projects
112 August/September 2016 ■ Project Management Journal
PAPERS
Expertise Coordination Willingness
Expertise Coordination Ability
Expertise Coordination Behavior
Project Performance
System Quality
Personal Work Satisfaction
Will1 0.72 0.14 0.22 0.20 0.18 0.23
Will2 0.75 0.16 0.22 0.22 0.16 0.17
Will3 0.81 0.26 0.23 0.18 0.18 0.21
Will4 0.83 0.23 0.26 0.24 0.22 0.23
Will5 0.74 0.35 0.30 0.14 0.19 0.22
Will6 0.77 0.38 0.30 0.19 0.25 0.29
Will7 0.71 0.33 0.31 0.14 0.20 0.26
Ability1 0.24 0.81 0.11 0.21 0.22 0.32
Ability2 0.25 0.81 0.12 0.17 0.22 0.28
Ability3 0.31 0.84 0.14 0.19 0.21 0.27
Ability4 0.30 0.83 0.15 0.19 0.24 0.27
Ability5 0.28 0.82 0.22 0.17 0.22 0.29
Ability6 0.29 0.82 0.20 0.20 0.27 0.35
Ability7 0.29 0.70 0.23 0.19 0.24 0.29
Behavior1 0.28 0.20 0.68 0.29 0.35 0.35
Behavior2 0.21 0.13 0.71 0.23 0.30 0.32
Behavior3 0.20 0.20 0.74 0.37 0.33 0.36
Behavior4 0.23 0.14 0.77 0.37 0.38 0.40
Behavior5 0.21 0.09 0.72 0.34 0.30 0.30
Behavior6 0.28 0.11 0.75 0.38 0.38 0.40
Behavior7 0.14 0.15 0.54 0.21 0.29 0.36
PP1 0.20 0.19 0.36 0.81 0.42 0.36
PP2 0.20 0.20 0.40 0.86 0.43 0.41
PP4 0.19 0.18 0.38 0.84 0.49 0.47
PP5 0.21 0.17 0.33 0.75 0.46 0.34
SQ1 0.25 0.22 0.43 0.47 0.86 0.50
SQ2 0.23 0.16 0.41 0.43 0.83 0.49
SQ3 0.20 0.31 0.35 0.48 0.84 0.48
SQ4 0.18 0.25 0.34 0.45 0.81 0.45
Sat1 0.24 0.43 0.32 0.41 0.50 0.78
Sat2 0.27 0.18 0.41 0.42 0.47 0.75
Sat3 0.11 0.16 0.34 0.21 0.29 0.66
Appendix A: Cross-factor loadings.
PMJ_87569728_47_4_Aug_Sept_2016.indb 112 9/19/16 3:44 PM

August/September 2016 ■ Project Management Journal 113
# will ability behav pp sq sat 1 0.93 0.97 0.97 0.97 0.97 0.97
2 0.95 0.88 0.96 0.96 0.99 0.94
3 0.97 0.95 0.94 0.85 0.87 0.86
4 0.95 0.96 0.95 0.96 0.95 0.9
5 0.98 0.95 0.95 0.72 0.81 0.08
6 0.95 0.95 0.88 0.91 0.92 0.87
7 0.97 0.91 0.95 0.86 0.89 0.88
8 0.96 0.89 0.93 0.81 0.92 0.45
9 0.96 0.96 0.92 0.91 0.92 0.93
10 0.95 0.49 0.97 0.95 0.92 0.77
11 0.95 0.95 0.98 0.97 0.95 0.94
12 0.85 0.86 0.92 0.89 0.93 0.86
13 0.98 0.93 0.96 0.94 0.95 0.94
14 0.99 0.95 0.95 0.95 0.92 0.9
15 0.96 0.74 0.94 0.88 0.91 0.84
16 0.8 0.94 0.95 0.82 0.88 0.65
17 0.97 0.97 0.97 0.96 0.81 0.83
18 0.97 0.95 0.91 0.94 0.94 0.9
19 0.98 0.91 0.95 0.89 0.94 0.8
20 0.94 0.91 0.92 0.96 0.94 0.96
21 0.96 0.87 0.92 0.97 0.93 0.91
22 0.96 0.91 0.69 0.95 0.98 0.81
23 0.98 0.91 0.91 0.95 0.98 0.99
24 0.91 0.67 0.77 0.89 0.91 0.93
25 0.98 0.78 0.91 0.91 0.89 0.8
26 0.89 0.9 0.93 0.95 0.9 0.89
27 0.97 0.93 0.86 0.9 0.92 0.68
28 0.94 0.97 0.96 0.97 0.88 0.9
29 0.89 0.79 0.95 0.91 0.85 0.91
30 0.92 0.95 0.95 0.93 0.96 0.88
31 0.98 0.95 0.92 0.92 0.84 0.87
32 0.95 0.98 0.96 0.97 0.92 0.87
33 0.99 0.59 0.9 0.9 0.91 0.96
34 0.94 0.78 0.97 0.96 0.85 0.95
35 0.85 0.84 0.97 0.71 0.86 0.92
36 0.98 0.9 0.97 0.95 0.97 0.95
37 0.91 0.58 0.76 0.89 0.8 0.86
38 0.94 0.8 0.94 0.94 0.9 0.91
39 0.92 0.88 0.78 0.6 0.66 0.4
40 0.88 0.68 0.93 0.88 0.88 0.8
41 0.98 0.96 0.8 0.84 0.81 0.83
Appendix B: Inter-rater agreement (Rwg). (continued)
PMJ_87569728_47_4_Aug_Sept_2016.indb 113 9/19/16 3:44 PM
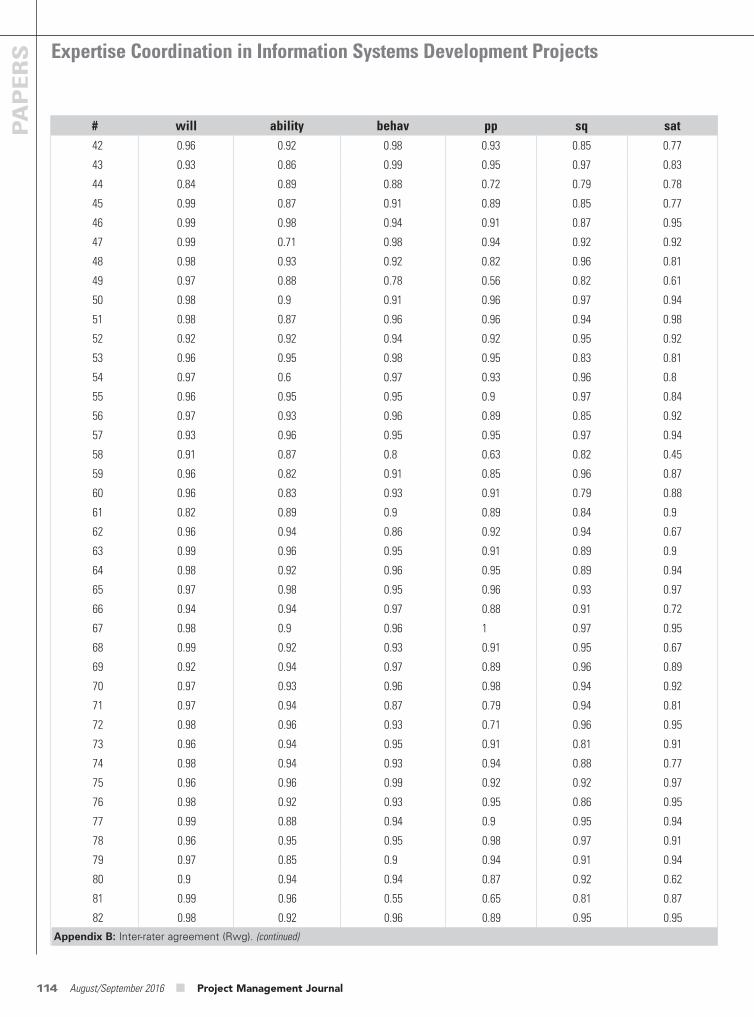
Expertise Coordination in Information Systems Development Projects
114 August/September 2016 ■ Project Management Journal
PAPERS
# will ability behav pp sq sat 42 0.96 0.92 0.98 0.93 0.85 0.77
43 0.93 0.86 0.99 0.95 0.97 0.83
44 0.84 0.89 0.88 0.72 0.79 0.78
45 0.99 0.87 0.91 0.89 0.85 0.77
46 0.99 0.98 0.94 0.91 0.87 0.95
47 0.99 0.71 0.98 0.94 0.92 0.92
48 0.98 0.93 0.92 0.82 0.96 0.81
49 0.97 0.88 0.78 0.56 0.82 0.61
50 0.98 0.9 0.91 0.96 0.97 0.94
51 0.98 0.87 0.96 0.96 0.94 0.98
52 0.92 0.92 0.94 0.92 0.95 0.92
53 0.96 0.95 0.98 0.95 0.83 0.81
54 0.97 0.6 0.97 0.93 0.96 0.8
55 0.96 0.95 0.95 0.9 0.97 0.84
56 0.97 0.93 0.96 0.89 0.85 0.92
57 0.93 0.96 0.95 0.95 0.97 0.94
58 0.91 0.87 0.8 0.63 0.82 0.45
59 0.96 0.82 0.91 0.85 0.96 0.87
60 0.96 0.83 0.93 0.91 0.79 0.88
61 0.82 0.89 0.9 0.89 0.84 0.9
62 0.96 0.94 0.86 0.92 0.94 0.67
63 0.99 0.96 0.95 0.91 0.89 0.9
64 0.98 0.92 0.96 0.95 0.89 0.94
65 0.97 0.98 0.95 0.96 0.93 0.97
66 0.94 0.94 0.97 0.88 0.91 0.72
67 0.98 0.9 0.96 1 0.97 0.95
68 0.99 0.92 0.93 0.91 0.95 0.67
69 0.92 0.94 0.97 0.89 0.96 0.89
70 0.97 0.93 0.96 0.98 0.94 0.92
71 0.97 0.94 0.87 0.79 0.94 0.81
72 0.98 0.96 0.93 0.71 0.96 0.95
73 0.96 0.94 0.95 0.91 0.81 0.91
74 0.98 0.94 0.93 0.94 0.88 0.77
75 0.96 0.96 0.99 0.92 0.92 0.97
76 0.98 0.92 0.93 0.95 0.86 0.95
77 0.99 0.88 0.94 0.9 0.95 0.94
78 0.96 0.95 0.95 0.98 0.97 0.91
79 0.97 0.85 0.9 0.94 0.91 0.94
80 0.9 0.94 0.94 0.87 0.92 0.62
81 0.99 0.96 0.55 0.65 0.81 0.87
82 0.98 0.92 0.96 0.89 0.95 0.95
Appendix B: Inter-rater agreement (Rwg). (continued)
PMJ_87569728_47_4_Aug_Sept_2016.indb 114 9/19/16 3:44 PM

August/September 2016 ■ Project Management Journal 115
# will ability behav pp sq sat 83 0.87 0.84 0.87 0.96 0.87 0.83
84 0.96 0.95 0.96 0.96 0.88 0.84
85 0.95 0.95 0.95 0.97 0.9 0.95
86 0.97 0.49 0.94 0.95 0.93 0.97
87 0.98 0.98 0.98 0.94 0.87 0.99
88 0.95 0.86 0.92 0.76 0.86 0.94
89 0.92 0.85 0.88 0.95 0.94 0.84
90 0.99 0.8 0.81 0.88 0.89 0.88
91 0.92 0.92 0.94 0.84 0.82 0.92
92 0.97 0.97 0.96 0.86 0.79 0.81
93 0.93 0.85 0.94 0.9 0.95 0.9
94 0.96 0.94 0.94 0.95 0.97 0.88
95 0.98 0.97 0.93 0.97 0.96 0.94
96 0.96 0.92 0.85 0.97 0.96 0.95
97 0.96 0.96 0.97 0.93 0.92 0.94
98 0.97 0.96 0.96 0.86 0.94 0.87
99 0.99 0.62 0.93 0.95 0.82 0.88
100 0.99 0.97 0.52 0.74 0.83 0.85
101 0.92 0.91 0.85 0.9 0.94 0.92
102 0.97 0.98 0.96 0.95 0.95 0.92
103 0.95 0.9 0.97 0.94 0.98 0.96
104 0.95 0.96 0.9 0.79 0.66 0.89
Note: will: Expertise coordination willingness; ability: Expertise coordination ability; behave: Expertise coordination behavior; pp: project performance; sq: system quality; sat: Personal work satisfaction
Appendix B: Inter-rater agreement (Rwg).
PMJ_87569728_47_4_Aug_Sept_2016.indb 115 9/19/16 3:44 PM

Au
gu
st 2
016
Project Management Journal, Vol. 47, No. 4 © 2016 by the Project Management Institute Published online at www.pmi.org/PMJ
116 August/September ■ Project Management Journal
Calendar of Events
AUGUST6 AugustPMI Central Mississippi Chapter, Cen-tral Mississippi Professional Develop-ment Day, Jackson, Mississippi, USA. The theme for the event is “Everything is a Project,” as there are individuals who lead or manage things, yet are never called project managers. This event is designed to develop a way of thinking and a structure that makes it easier to advance decisions and increase the likelihood for success. It will also pro-vide continuing education for certified project managers. The day features more than 10 speakers representing the public and private sectors. pmicms.org
30 August–1 SeptemberPMI Ghana Chapter 2016 PMI Africa Conference, Accra, Ghana. The sec-ond PMI Africa Conference will focus on achieving greater business results through project management. More than 700 delegates are expected from all over Africa and the world. Come join attendees from industry, government, and academia who are determined to advance Africa as an emerging global economy through project deliveries and initiatives. pmiafricaconference.com
SEPTEMBER8 SeptemberPMI Honolulu, Hawaii Chapter, Pro-fessional Development Day, Hono-lulu, Hawaii, USA. Themed “Rock the PMI Talent Triangle™,” tracks will be organized by leadership, strategic and
business management, technical proj-ect management, business analysis, and career development. Featured key-note speakers are Jeff Tobe, MEd, CSP, on “Coloring Outside the Lines,” and Andy Crowe, PMP, PgMP, on “Managing Your Own Talent.” sites.google.com/ a/pmihnl.org/pdd/home/2016pdd
10 SeptemberPMI Orange County Chapter, Build-ing Leaders for Business, Anaheim, California, USA. PMI Orange County Chapter presents its 2016 conference, “Building Leaders for Business.” This event will expose, inform, educate, and bring together practitioners to learn about PMI Talent Triangle™–aligned topics. pmi-oc.org/conference
OCTOBER3–4 OctoberPMI Silicon Valley, CA Chapter, PMI Silicon Valley Chapter Annual Symposium, Santa Clara, California, USA. “Managing Uncertainty in Mod-ern Projects: Risks in Your Project Are Closer Than They Appear” is the theme for project managers to share their knowledge with like-minded pro-fessionals and participate in an event where they will learn from others facing similar challenges. Presentation sub-mittal deadline is 11 July. pmisv.org
14 OctoberPMI Eastern Iowa Chapter, 9th Annual Professional Development Day, Cedar Rapids, Iowa, USA. The 2016 Annual Professional Development Day is a day-long event. The program includes
workshops and exhibits from our local sponsors. It is the perfect forum for net-working. pmieasterniowa.org
Upcoming PMI® Global Congresses and EventsPMI® Global Congress 2016—North America, San Diego, California, USA, 25–27 September 2016. congresses.pmi.org/northamerica2016
PMO Symposium® 2016. San Diego, California, USA 6–9 November 2016. PMOSymposium.org
SeminarsWorld® EventsLeading subject matter experts share their experience and deep knowl-edge on a variety of emerging topics. Whether you are looking to build your leadership skills, work on soft skills such as communications and collab-oration, or delve deeper into agile, these events provide unique oppor-tunities to learn and connect with the project management community.
Date Location8–11 August Baltimore,
Maryland, USA12–13 September Athens, Greece21–24 and28–29 September San Diego,
California, USA10–13 October Chicago, Illinois,
USA
Learn more about SeminarsWorld® courses being held in these locations and throughout the world. Use PMI’s search tool for project management training matched to your specific needs. Visit learning.PMI.org
PMJ_87569728_47_4_Aug_Sept_2016.indb 116 9/19/16 3:44 PM
August/September 2016 ■ Project Management Journal 117
Project Management Journal ® Author Guidelines
Project Management Journal® publishes research relevant to researchers, reflective practitioners, and organizations from the project, program, and portfolio management fields. Project Management Journal® seeks papers that are of interest to a broad audience.
Due to the integrative and interdisciplinary nature of these fields, Project Management Journal® publishes the best papers from a number of other disciplines, including, but not limited to, organizational behavior and theory, strategic management, marketing, accounting, finance, operations research, technology and innovation manage-ment, entrepreneurship, economics, political science, his-tory, sociology, psychology, information science, decision science, systems theory, and communication theory.
Project Management Journal® publishes qualitative papers as well as quantitative works and purely concep-tual or theoretical papers, including diverse research methods and approaches. Our aim is to integrate the vari-ous types of project, program, and portfolio management research.
Project Management Journal® neither approves nor disapproves, nor does it guarantee the validity or accu-racy of any data, claim, opinion, or conclusion presented in either editorial content, articles, From the Editor, or advertisements.
Project Management Journal® is a journal to dissemi-nate and discuss project management research. It is not a platform to discuss the content or quality of PMI stan-dards, credentials, or certifications, and those of other standard-setting organizations.
Authors’ GuidelinesPapers published in Project Management Journal® must relate to research and provide new contributions to project management theory and/or project management prac-tices. Each paper should contain clear research questions, which the author should be able to state in one para-graph. Authors are expected to describe the knowledge and foundations underlying their research approach, and theoretical concepts that give meaning to data or to pro-posed decision support methods, and to demonstrate how they are relevant to organizations in the realm of project management. Papers that speculate beyond current think-ing are more desirable than papers that use tried-and-true methods to study routine problems, or papers motivated strictly by data collection and analysis.
Authors should strive to be original, insightful, and theoretically bold; demonstration of a significant value-added advance to the understanding of an issue or topic
is crucial to acceptance for publication. Multiple-study papers that feature diverse methodological approaches may be more likely to make such contributions.
Authors should make contributions of specialized research to project, program, and portfolio management theory and to the theory of the project-oriented organization or project network. They should define any specialized terms and analytic techniques used. Papers should be well argued and well written, avoiding jargon at all times. Project Management Journal® does not prefer subjects of study, as long as they are in the project, pro-gram, or portfolio management field, or in the field of the project-oriented organization or project network, nor do we attach a greater significance to one methodological style than another does.
Avoid Use of CommercialismPapers should be balanced, objective assessments that contribute to the project management profession or pro-vide a constructive review of the methodology. Papers that are commercial in nature (e.g., those that endorse or disparage specific products) will not be published.
Editing the PaperMake sure papers adhere to the theme or question to be answered. Write in clear and concise English, using active rather than passive voice. Manuscripts should not exceed 12,000 words, inclusive of figures, tables, and references. Count each figure and table as 300 words.
Manuscript Format/StyleAll manuscripts submitted for consideration should meet the following guidelines:
• All papers must be written in the English language (Ameri-can spelling).
• Title page of the manuscript should only include the title of the paper.
• To permit objective double blind reviews by two ref-erees, the abstract, first page and text must not reveal the author(s) and/or affiliation(s). When authors cite their own work, they should refer to themselves in the third person. Any papers not adhering to this will be returned.
Formatting the Paper
Papers must be formatted in an electronic format using a current version Microsoft Word. For Mac users, convert the file to a Windows format. If the conversion does not work, Mac users should save files as Word (.doc) files.
PMJ_87569728_47_4_Aug_Sept_2016.indb 117 9/19/16 3:44 PM
Author Guidelines
118 August/September 2016 ■ Project Management Journal
• Helvetica or Arial font should be used for text within the graphics and tables.
• Figure numbers and titles are centered and appear in boldface type below the figure.
• Table numbers and titles are centered and appear in boldface type above the table.
• Figures and tables should be cited and numbered consecutively in the order in which they appear in the text.
• Tables with lines separating columns and rows are acceptable.
Use an appendix to provide more detailed information, when necessary.
Submission PolicySubmit manuscripts electronically using Project Management Journal® ’s Manuscript Central site.
https://mc.manuscriptcentral.com/pmjManuscript Central is a web-based peer review system
(a product of ScholarOne). Authors will be asked to create an account (unless one already exists) prior to submitting a paper. Step-by-step instructions are provided online. The progress of the review process can be obtained via Manuscript Central.
Manuscripts should include the following in the order listed:
• Title page. Include only the title of the manuscript (do not include authors’ names).
• Abstract. Outline the purpose, scope, and conclusions of the manuscript in 100 words or less.
• Keywords. Select 4 to 8 keywords.• Headings. Use 1st, 2nd, and 3rd-level, unnumbered headings.• Text. To permit objective reviews by two referees, the abstract,
first page and the rest of the text should not reveal the authors and/or affiliations.
• References. Use author-date format.• Illustrations and tables. These should be titled, numbered (in
Arabic numerals), and placed on a separate sheet, with the preferred location indicated within the body of the text.
• Biographical details for each author. Upon manuscript acceptance, authors must also provide a signed copyright agreement.
By submitting a manuscript, the author certifies that it is not under consideration by any other publication; that nei-ther the manuscript nor any portion of it is copyrighted; and that it has not been published elsewhere. Exceptions must be noted at the time of submission.
Authors using their own previously published or submit-ted material as the basis for a new submission are required to cite the previous work and explain how the new submis-sion differs from the previously published work. Any poten-tial data overlap with previous studies should be noted and
Fonts
Use a 12-point Times or Times New Roman font for the text. You may use bold and italics in the text, but do not underline. Use 10-point Helvetica or Arial font for text within tables and graphics.
Margins
Papers should be double-spaced and in a single-column for-mat. All margins should be 1 inch.
Headings
Use 1st, 2nd, and 3rd-level headings only. Do not number headings.
References, Footnotes, Tables, Figures, and AppendicesAlways acknowledge the work of others used to advance a point in your paper. For questions regarding reference for-mat, refer to the current edition of Publication Manual of the American Psychological Association. Identify text citations with the author name and publication date in parentheses, (e.g., Cleland & King, 1983), and listed in alphabetical order as references at the end of the manuscript. Include page num-bers for all quotations (page numbers should be separated by an en dash, not a hyphen).
Follow the formats in the examples shown below:
Baker, B. (1993). The project manager and the media: Some lessons from the stealth bomber program. Project Manage-ment Journal, 24(3), 11–14. Cleland, D. I., & King, W. R. (1983). Systems analysis and project management. New York, NY: McGraw-Hill. Hartley, J. R. (1992). Concurrent engineering. Cambridge, MA: Productivity Press.
It is the author´s responsibility to obtain permission to include (or quote) copyrighted material, unless the author owns the copyright. Use the permission form, which is avail-able at the Manuscript Central site.
Graphics and IllustrationsBe sure to number tables and figures with Arabic numerals, include titles for each, and insert them in their preferred loca-tion within the body of the text. In addition, provide artwork in 300-dpi jpg, tiff, or PowerPoint formats.
Tips for creating graphics:
• Provide only the essential details (too much information can be difficult to display).
• Color graphics are acceptable for submission, although Project Management Journal® is published in grayscale.
PMJ_87569728_47_4_Aug_Sept_2016.indb 118 9/19/16 3:44 PM
August/September 2016 ■ Project Management Journal 119
of the writing, which may be fixable, and the quality of the ideas that the writing conveys.
Respectful Reviews
PMI recognizes that authors have spent a great deal of time and effort on every submission. Reviewers will always treat an author’s work with respect, even when the reviewer disagrees or finds fault with what has been written.
Double-Blind Reviews
Submissions are subjected to a double-blind review, whereby the identity of the reviewer and the author are not disclosed. In the event that a reviewer is unable to be objective about a specific paper, another reviewer will be selected for that paper. Reviewers will not discuss any manuscript with any-one (other than the Project Management Journal® Editor) at any time.
Pointers on the Substance of the Review Theory
• Does the paper have a well-articulated theory that provides conceptual insight and guides hypotheses formulation?
• Does the study inform or improve our understanding of that theory?
• Are the concepts clearly defined?• Does the paper cite appropriate literature and provide proper
credit to existing work on the topic? Has the author offered critical references? Does the paper contain an appropriate number of references?
• Do the sample, measures, methods, observations, procedures, and statistical analyses ensure internal and external validity? Are the statistical procedures used correctly and appropri-ately? Are the author’s major assumptions reasonable?
• Does the empirical study provide a good test of the theory and hypotheses? Is the method chosen appropriate for the research question and theory?
• Does the paper make a new and meaningful contribution to the management literature in terms of theory, empirical knowledge, and management practice?
• Has the author given proper citation to the original source of all information given in the work or in others’ work that was cited?
Adherence to the Spirit of the Guidelines
Papers that severely violate the spirit of the guidelines (e.g., papers that are single-spaced, papers that use footnotes rather than conventional referencing formats, papers that greatly exceed 40 pages), or which do not clearly fit the mis-sion of the Journal will be returned to authors without being reviewed.
described in the letter to the Editor. The editorial team makes software-supported checks for identifying plagiarism and self-plagiarism.
Accepted manuscripts become the property of PMI, which holds the copyright for materials that it publishes. Mate-rial published in Project Management Journal® may not be reprinted or published elsewhere, in whole or part, without the written permission of PMI.
Accepted manuscripts may be subject to editorial changes made by the Editor. The author is solely responsible for all statements made in his or her work, including changes made by the editor. Submitted manuscripts are not returned to the author; however, reviewer comments will be furnished.
Review ProcessThe reputation of Project Management Journal® and contribu-tion to the field depend upon our attracting and publishing the best research. Project Management Journal® competes for the best available manuscripts by having the largest and widest readership among all project management journals. Equally important, we also compete by offering high-quality feedback. The timeliness and quality of our review process reflect well upon all who participate in it.
Developmental Reviews
It is important that authors learn from the reviews and feel that they have benefited from the Project Management Jour-nal® review process. Therefore, reviewers will strive to:
• Be Specific. Reviewers point out the positives about the paper, possible problems, and how any problems can be addressed. Specific comments, reactions, and suggestions are required.
• Be Constructive. In the event that problems cannot be fixed in the current study, suggestions are made to authors on how to improve the paper on their next attempt. Reviewers docu-ment as to whether the issue is with the underlying research, the research conclusions, or the way the information is being communicated in the submission.
• Identify Strengths. One of the most important tasks for a reviewer is to identify the portions of the paper that can be improved in a revision. Reviewers strive to help an author shape a mediocre manuscript into an insightful contribution.
• Consider the Contribution of the Manuscript. Technical cor-rectness and theoretical coherence are obvious issues for a review, but the overall contribution that the paper offers is also considered. Papers will not be accepted if the contribu-tion it offers is not meaningful or interesting. Reviewers will address uncertainties in the paper by checking facts; there-fore, review comments will be as accurate as possible.
• Consider Submissions from Authors Whose Native Language Is Not English. Reviewers will distinguish between the quality
PMJ_87569728_47_4_Aug_Sept_2016.indb 119 9/19/16 3:44 PM
CALL FOR PROPOSALS PROJECT MANAGEMENT JOURNAL® SPECIAL ISSUE
Process Studies of Project OrganizingGUEST EDITORS:Viviane Sergi, ESG UQAM, Montréal, Canada Lucia Crevani, Mälardalen University, Västerås, Sweden Monique Aubry, ESG UQAM, Montréal, Canada
DEADLINE FOR PAPER SUBMISSIONS: 31 JANUARY 2017No one will be surprised to hear the term process in the context of project management, where processes are often thought of in terms of finite stages following each other in a certain sequence. But what if processes were more than building blocks of project management, but rather, represented a way of viewing the world? This call wants to go beyond the traditional understanding of processes, to instead explore processes from an ontological point of view, as a means of foregrounding change, becoming, and fluidity—putting ongoing action and emergent activity at the fore of inquiry (Chia, 1997; Rescher, 2012). Indeed, in the context of project management, process ontology can “[invite] us to think about movement and transformation as defining what these endeavors are all about—which is, in fact, quite close to the actual experience of doing and managing projects.” (Sergi, 2012, p. 349).
This special issue, therefore, has two main objectives for contribution to the project management research field. The first aim is to enrich the theoretical foundations of the field. The second aim is to produce rich accounts of project activity in order to challenge reflective practitioners to question how and why things happen when they are involved in projects in their own organizations.
With this special issue, we seek submissions that are inspired by the premises of process ontology and apply process thinking to document and reveal the intricacies of project management and organizing. Scholars interested in process studies and, in particular, those building on a process ontology, are thus invited to submit contributions that may be informed by a number of theoretical approaches, such as the practice perspective, posthumanist views, relational perspectives, discursive approaches, and sociomaterial views, to name some. Submitted papers should be built on theoretically informed and empirically rigorous research.
SUBMISSIONSFull papers must be submitted by 31 January 2017 via the journal submission site. Papers accepted for publication, but not included in the special issue will be published later in a regular issue of the journal. For further information about this special issue, please contact Viviane Sergi at [email protected].
For additional details about this call for proposals, please visit PMI.org/learning/publications-project-management-journal.aspx
®2016 Project Management Institute, Inc. All rights reserved. PUB-009-2016 (03/16)
PMJ_87569728_47_4_Aug_Sept_2016.indb 2 9/19/16 3:44 PM
CALL FOR PROPOSALS PROJECT MANAGEMENT JOURNAL® SPECIAL ISSUE
Innovation in Infrastructure Delivery ModelsSPECIAL ISSUE EDITORSAndrew Davies (Senior Editor) | Tim Brady | Samuel C. MacAulay | John Steen
Deadline for paper submissions: 28 February 2017
BACKGROUNDLarge infrastructure projects create the assets, systems, and networks—such as transport, energy, water, waste, ICT, hospitals, and schools—that underpin and enable a nation’s social and economic development. But these projects are notorious for cost and time overruns and many fail to achieve their original specifications. Delivering infrastructure projects is challenging due to the high degree of uncertainty, complexity, and urgency often associated with them. Over the past decade or so, there has been a growing recognition that infrastructure cannot be successfully defined and executed using traditional models of project delivery. Sponsors (owners and operators of the assets), clients, and their delivery partners (prime contractors and joint venture entities) are exploring innovative ways of managing infrastructure to add value over the whole life cycle, from front-end planning through project execution to operations. There have been significant changes in the identities of organizations involved in the infrastructure ecosystem, new forms of project governance, and novel mechanisms to improve cooperation and coordination. This special issue invites papers that address different aspects of innovation in infrastructure delivery models, including but not restricted to:
■ Delineating the strategies, structures, and capabilities of new forms of organizations involved in project delivery, such as systems integrators, owners/operators, delivery partners, “pop-up clients,” joint ventures, and public private partnerships (e.g., Davies, Gann, & Douglas, 2009; Kwak, Chih, & Ibbs, 2009; Kent & Becerik-Gerber, 2010; Davies & Mackenzie, 2014; Winch & Leiringer, 2016).
■ Defining and managing the risks, uncertainties, stakeholders, and complexities in infrastructure delivery, from front-end planning to project execution and handover (e.g., Miller & Lessard, 2001; Gil & Tether, 2011; Henisz, Levitt, & Scott, 2012; Flyvbjerg, 2014, 2016; Davies & Brady, 2014).
■ Elaborating on the transformational potential of digital technologies (e.g., Whyte & Lobo, 2010; Whyte, Stasis, & Lindkvist, 2016). ■ Exploring the dynamics of value creation and capture in infrastructure delivery (e.g., Davies, 2004; Brady, Davies, & Gann, 2005; Mathur
& Smith, 2013). ■ Creating a learning environment, building capabilities, and generating innovation to improve infrastructure delivery models (e.g., Gil,
2007; Davies, MacAulay, DeBarro, & Thurston, 2014; Dodgson, Gann, MacAulay, & Davies, 2015). ■ Managing across organizational boundaries in projects involving multiple parties as well as in programs, portfolios, and the handover
from project to operations (e.g., Brady & Davies, 2010; Whyte, Lindkvist, & Ibrahim, 2012; Morris, 2013). ■ Managing and leading new forms of collaborative teams (Edmondson, 2012). ■ Comparative studies of international infrastructure project delivery models, including the different institutional structures and
stakeholders (Henisz, 2002; Scott, Levitt, & Orr, 2011).
Empirical and conceptual contributions, using a range of social scientific methods, are welcome.
SUBMISSIONSPlease submit papers at PMI.org/PMJ and specify the name of the special issue: Innovation in Infrastructure Delivery Models. For further information please contact one of the guest editors for this special issue: [email protected]
AUTHOR AND REVIEWER GUIDELINESSpecial issues follow the same guidelines as those for regular articles; however, we expect the authors and reviewers to react promptly with their revisions and reviews. A special issue is a project with a scheduled deadline. While some variance may arise, timeliness still matters more than in a regular submission.
®2016 Project Management Institute, Inc. All rights reserved. PUB-014-2016 (05/16)
PMJ_87569728_47_4_Aug_Sept_2016.indb 3 9/19/16 3:44 PM