Embed Size (px)
Citation preview
Volume-4, Issue-1, June-2017 ISSN No: 2349-5677
88
PERFORMANCE EVALUATION OF TWO WHEELER FIRMS ON THE BASIS OF
DU PONT MODEL
Amit Joshi, Associate Professor, Department of Management Studies
Kumaun University, Nainital, India [email protected]
Saurabh Joshi, Assistant Professor, School of Management Studies
Swami Rama Himalayan University Jollygrant, Dehradun, India
Abstract
It is essential for an organization to measure performance at regular intervals to ensure that the organization is on track, in tune with the objectives and goals. Strategic decisions take into account the current performance and immediate decisions in the form of corrective actions if required. Du-Pont analysis serves the purpose of examining the financial profile of organizations. This paper attempts to test the significance of the above mentioned tool on the basis of financial results obtained from the annual reports of firms. For the purpose of study, two prominent two wheeler companies were selected from the automobile sector. Financial performance has been evaluated on the basis of three parameters namely operating efficiency, asset utilization and financial leverage. Efforts have been made to locate the areas, where improvement is required. The primary purpose is to identify the factors responsible for maximization of Return on Equity (ROE). Index Terms— Analysis, ROE, Financial performance, Profitability, Turnover
I. INTRODUCTION
Du- Pont Analysis is the basic tool for performance measurement initiated by Du-Pont Corporation in 1920. In this analysis the ROE (Return on Equity) is further divided into three distinct elements, profit margin, assets turnover and equity multiplier (to measure financial leverage).A far as organizational performance is concerned; it is confined to the above
Volume-4, Issue-1, June-2017 ISSN No: 2349-5677
89
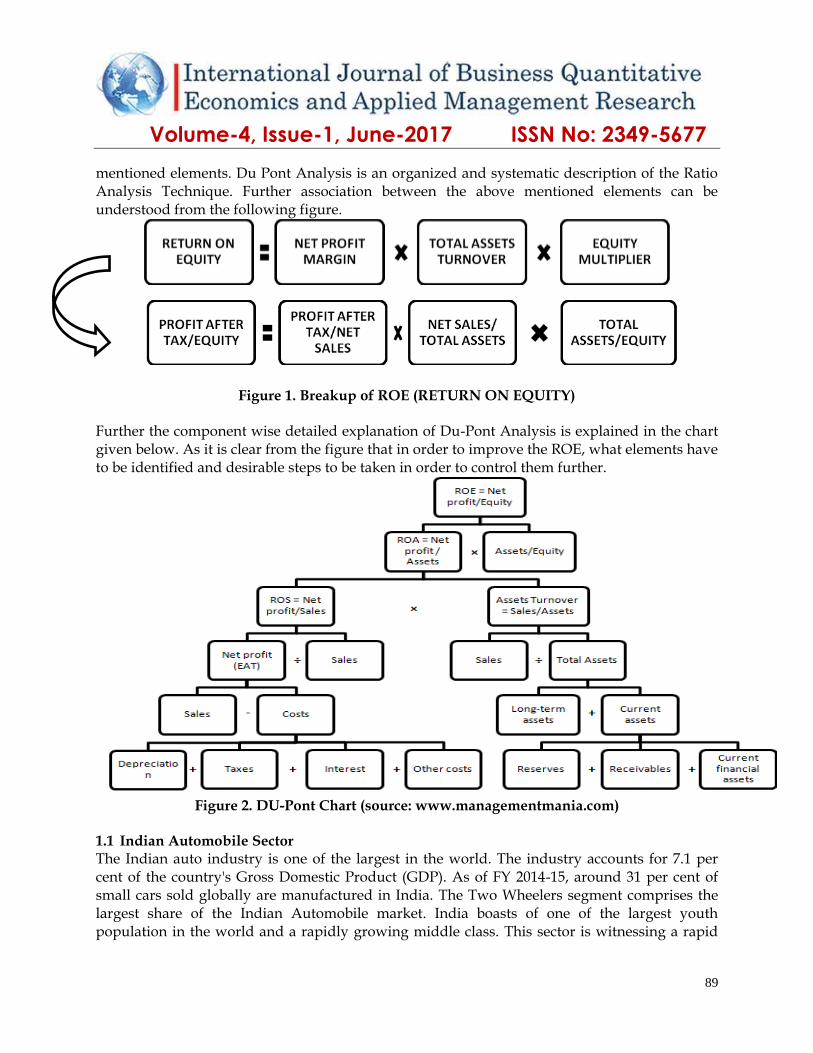
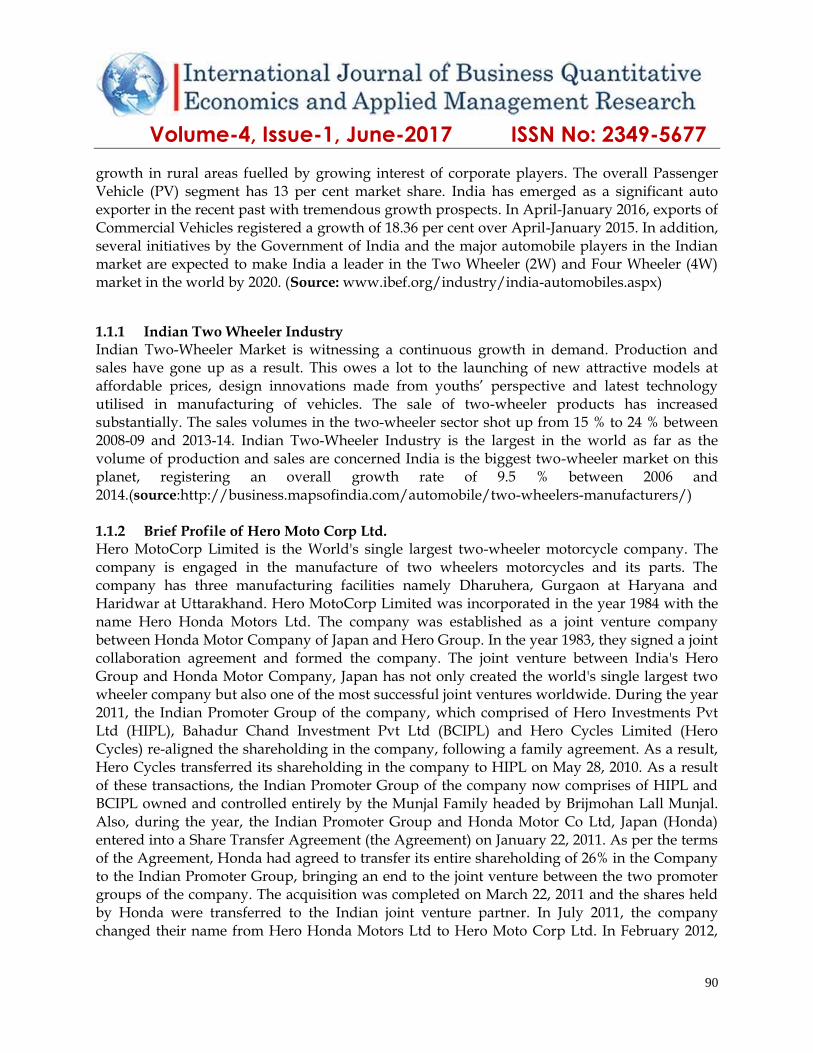
mentioned elements. Du Pont Analysis is an organized and systematic description of the Ratio Analysis Technique. Further association between the above mentioned elements can be understood from the following figure.
Figure 1. Breakup of ROE (RETURN ON EQUITY)
Further the component wise detailed explanation of Du-Pont Analysis is explained in the chart given below. As it is clear from the figure that in order to improve the ROE, what elements have to be identified and desirable steps to be taken in order to control them further.
Figure 2. DU-Pont Chart (source: www.managementmania.com)
1.1 Indian Automobile Sector The Indian auto industry is one of the largest in the world. The industry accounts for 7.1 per cent of the country's Gross Domestic Product (GDP). As of FY 2014-15, around 31 per cent of small cars sold globally are manufactured in India. The Two Wheelers segment comprises the largest share of the Indian Automobile market. India boasts of one of the largest youth population in the world and a rapidly growing middle class. This sector is witnessing a rapid
Volume-4, Issue-1, June-2017 ISSN No: 2349-5677
90
growth in rural areas fuelled by growing interest of corporate players. The overall Passenger Vehicle (PV) segment has 13 per cent market share. India has emerged as a significant auto exporter in the recent past with tremendous growth prospects. In April-January 2016, exports of Commercial Vehicles registered a growth of 18.36 per cent over April-January 2015. In addition, several initiatives by the Government of India and the major automobile players in the Indian market are expected to make India a leader in the Two Wheeler (2W) and Four Wheeler (4W) market in the world by 2020. (Source: www.ibef.org/industry/india-automobiles.aspx)
1.1.1 Indian Two Wheeler Industry Indian Two-Wheeler Market is witnessing a continuous growth in demand. Production and sales have gone up as a result. This owes a lot to the launching of new attractive models at affordable prices, design innovations made from youths’ perspective and latest technology utilised in manufacturing of vehicles. The sale of two-wheeler products has increased substantially. The sales volumes in the two-wheeler sector shot up from 15 % to 24 % between 2008-09 and 2013-14. Indian Two-Wheeler Industry is the largest in the world as far as the volume of production and sales are concerned India is the biggest two-wheeler market on this planet, registering an overall growth rate of 9.5 % between 2006 and 2014.(source:http://business.mapsofindia.com/automobile/two-wheelers-manufacturers/)
1.1.2 Brief Profile of Hero Moto Corp Ltd. Hero MotoCorp Limited is the World's single largest two-wheeler motorcycle company. The company is engaged in the manufacture of two wheelers motorcycles and its parts. The company has three manufacturing facilities namely Dharuhera, Gurgaon at Haryana and Haridwar at Uttarakhand. Hero MotoCorp Limited was incorporated in the year 1984 with the name Hero Honda Motors Ltd. The company was established as a joint venture company between Honda Motor Company of Japan and Hero Group. In the year 1983, they signed a joint collaboration agreement and formed the company. The joint venture between India's Hero Group and Honda Motor Company, Japan has not only created the world's single largest two wheeler company but also one of the most successful joint ventures worldwide. During the year 2011, the Indian Promoter Group of the company, which comprised of Hero Investments Pvt Ltd (HIPL), Bahadur Chand Investment Pvt Ltd (BCIPL) and Hero Cycles Limited (Hero Cycles) re-aligned the shareholding in the company, following a family agreement. As a result, Hero Cycles transferred its shareholding in the company to HIPL on May 28, 2010. As a result of these transactions, the Indian Promoter Group of the company now comprises of HIPL and BCIPL owned and controlled entirely by the Munjal Family headed by Brijmohan Lall Munjal. Also, during the year, the Indian Promoter Group and Honda Motor Co Ltd, Japan (Honda) entered into a Share Transfer Agreement (the Agreement) on January 22, 2011. As per the terms of the Agreement, Honda had agreed to transfer its entire shareholding of 26% in the Company to the Indian Promoter Group, bringing an end to the joint venture between the two promoter groups of the company. The acquisition was completed on March 22, 2011 and the shares held by Honda were transferred to the Indian joint venture partner. In July 2011, the company changed their name from Hero Honda Motors Ltd to Hero Moto Corp Ltd. In February 2012,
Volume-4, Issue-1, June-2017 ISSN No: 2349-5677
91
the company entered into a strategic partnership with Erik Buell Racing (EBR) Of USA for contemporary technology and design inputs to enable the company to launch high end bikes for the domestic and international markets. (source:www.business-standard.com/company/hero-otocorp237/information/company-history)
1.1.3 Brief Profile of Bajaj Auto Ltd. Bajaj Auto Limited is an Indian two-wheeler and three-wheeler manufacturing company. Bajaj Auto manufactures and sells motorcycles, scooters and auto rickshaws. Bajaj Auto is a part of the Bajaj Group. It was founded by Jamnalal Bajaj in Rajasthan in the 1930s. It is based in Pune, Mumbai, with plants in Chakan (Pune), Waluj (near Aurangabad) and Pantnagar in Uttarakhand. The oldest plant at Akurdi (Pune) now houses the R&D centre 'Ahead'. Bajaj Auto is the world's sixth-largest manufacturer of motorcycles and the fourth-largest in India. It is the world’s largest three-wheeler manufacturer. On May 2015, its market capitalisation was Rs 640 billion (US$9.5 billion), making it India's 23rd largest publicly traded company by market value. Bajaj Auto came into existence on 29 November 1944 as M/s Bachraj Trading Corporation Private Limited. It started off by selling imported two- and three-wheelers in India. In 1959, it obtained a licence from the Government of India to manufacture two-wheelers and three-wheelers and it became a public limited company in 1960.[8] In 1970, it rolled out its 100,000th vehicle. In 1977, it sold 100,000 vehicles in a financial year. In 1985, it started producing at Waluj near Aurangabad. In 1986, it sold 500,000 vehicles in a financial year. In 1995, it rolled out its ten millionth vehicle and produced and sold one million vehicles in a year.With the launch of motorcycles in 1986, the company has changed its image from a scooter manufacturer to a two-wheeler manufacturer.According to the authors of Globality: Competing with Everyone from Everywhere for Everything, Bajaj has operations in 50 countries creating a line of bikes targeted to the preferences of entry-level buyers.The demerger of Bajaj Auto Ltd into three corporate entities—Bajaj Finserv Ltd (BFL), Bajaj Auto Ltd (BAL), and Bajaj Holdings and Investment Ltd (BHIL)—was completed with the shares listing on 26 May 2008. (Source: https://en.wikipedia.org/wiki/Bajaj_Auto)
II. RATIONALE OF THE STUDY
Analysis and interpretation of the income and financial statements on the basis of traditional financial techniques like ratio analysis, trend analysis and common size statement etc. is very common. Here authors strived to pick one of the very simple techniques to analyse the financial results for the maximization of the shareholders earnings. Beauty of Du-Pont analysis lies in its simplicity. Here the significance of different ratios can collectively be understood in a much synchronized and organized way. Identification of check points is also much easier. The focus is on analysing the significance of Du-Pont Model in identifying the key elements required to be controlled, and to observe the impact of alterations in the above elements over the ROE (Return on Equity).
2.1 Justification for the selection of Manufacturing Industry Application of Du Pont Model is best suitable and relevant in the manufacturing industry. Elements of the model like, current assets, current liabilities, depreciation are very clearly
Volume-4, Issue-1, June-2017 ISSN No: 2349-5677
92
observed in the manufacturing units. Application of the model is very much meaningful in the manufacturing industry. Hence selection of manufacturing industry has been made by the authors because it possesses the highest degree of relevance from the perspective of applicability of the model. 2.2 Justification for the selection of two wheeler companies from the Automobile sector. Two wheeler companies from the Indian Automobile sector were selected because of the following facts: Seventh largest producer in the world with an average annual production of 23.36 Million vehicles.
Third largest automotive market by volume, by 2016.
Four large auto manufacturing hubs across the country.
7.1% of the country’s GDP by volume.
Six Million-plus vehicles to be sold annually, by 2020.
Domestic Market Share 2014-15: 1. Passenger Vehicles 13%.
2. Commercial Vehicles 3%. 3. Three-wheelers 3%. 4. Two-wheelers 81%.
The automotive industry accounts for 45% of the country's manufacturing gross domestic product (GDP), 7.1% of the country's GDP and employs about 19 Million people both directly and indirectly.
India is currently the seventh largest producer in the world with an average annual production of 23.36 Million vehicles, of which 3.57 Million are exported.
The Indian automobile market is estimated to become the third largest in the world by 2016 and will account for more than 5% of global vehicle sales.
India is the second largest two-wheeler manufacturer, the largest motorcycle manufacturer and the fifth largest commercial vehicle manufacturer in the world.
(Source: www.makeinindia.com/sector/automobiles)
2.3 Justification for the selection of Hero Moto Corp Ltd. and Bajaj Auto Ltd. Both the companies were selected on the basis of size of their huge market capitalization. Market capitalization of Bajaj Auto Ltd. and Hero Moto Corp Ltd. were Rs.77521.42 crores and Rs.61024.05 crores respectively (as on 24th June 2016), which is far ahead than rest of the business rivals. (www.moneycontrol.com) III. REVIEW OF LITERATURE
Sean Ross has considered equity multiplier bit confusing for those experts who are accustomed with traditional leverage ratios like Debt-Equity Ratio in his article
Volume-4, Issue-1, June-2017 ISSN No: 2349-5677
93
(www.investopedia.com/ask/answers/042315/what-equity-multipliers-affect-return-equity-
roe.asp). On the other hand as per the views of S N Maheshwari, Du-Pont chart helps in concentrating attention on different forces affecting profits (Sultan Chand & Sons /Financial
Management/Ratio Analysis /B.90). The DuPont analysis is a modification on calculating return on equity (ROE), but it uses a gross value for assets, where accumulated depreciation is ignored. The DuPont analysis method renders a higher ROE. Basic ROE analysis may provide a misleading ROE. The three-step analysis of ROE used in the DuPont method allows an investor to determine the reason the total ROE number changed. (www.investopedia.com/video/play/dupont-analysis/)
IV. LIMITATIONS OF THE STUDY
Following limitations were encountered during the course of study:
Financial figures were exclusively obtained from the annual reports of the company
Relevance of the study could have been much accurate, if the internal financial statements like cost sheets were considered.
Chances of window dressing cannot be out rightly rejected, when the figures are exclusively obtained from financial reports published by the company.
Capital Market is highly volatile and dynamic in nature. Therefore sole dependence upon the conclusion derived from the Du-Pont Analysis may lead to misleading decisions.
Du Pont Analysis is a further extension of Ratio Analysis but not a unique methodology in itself.
Performance criteria cannot be generalized; it varies from industry to industry.
Lastly research work was confined to three steps Du Pont analysis. Effect of taxation was ignored.
Du Pont analysis is confined to the fundamental analysis of the companies. Market performance of the company’s stock remains indifferent from the outcomes of Du Pont Model.
Scooters and commercial vehicles are the product range that are not manufactured by BAJAJ AUTO & HERO MOTORS respectively, but the financial figures of both the companies are inclusive of above mentioned product ranges. Hence the possibilities of absolute comparative analysis become bit feeble.
Only listed companies (BSE) were selected for the research purpose. Thus the role of HONDA MOTORS in influencing the two-wheeler market could not be analysed.
V. RESEARCH OBJECTIVES & HYPOTHESIS DEVELOPMENT
Following objectives were developed for the analytical purpose:
To evaluate the financial performance of the companies on the basis of Du Pont Analysis.
To locate the area of corrections in order to improve the ROE on the basis of above model.
Volume-4, Issue-1, June-2017 ISSN No: 2349-5677
94
Following hypothesis were developed to evaluate the significance of the above model:
There is a correlation between Assets Turnover and EPS (Earning Per Share).
Both the companies are the close competitor of each other.
VI. RESEARCH METHODOLOGY Figures were collected from the quarterly results of the selected companies starting from June 2011 to March 2016 (20 quarters). Accuracy of the research outcome is enhanced, when the data is recent and frequency is high. Type of data is purely secondary by nature and published by the companies. Ratio analysis technique has been applied as a prominent financial tool and the validity of the different ratios has been tested on Du Pont model. Aid of tables and graphs (Prepared with the help of SPSS and MS Excel) have been taken for data presentation wherever found necessary. 6.1 Criteria of Performance Measurement Practically performance of nay business cannot be measured with limited or specified parameters. Keeping in mind the prerequisites of Du Pont Model, performance of the selected companies has been evaluated and comparative analysis carried out on the basis of following parameters.
Profitability, on the basis of NET PROFIT MARGIN
Asset Management, on the basis of ASSETS TURNOVER RATIO
Returns on Investment, on the basis RETURN ON ASSETS(ROA)
Shareholders Returns, on the basis of RETURN ON EQUITY(ROE)
Leverage (affecting ROE), on the basis of EQUITY MULTIPLIER
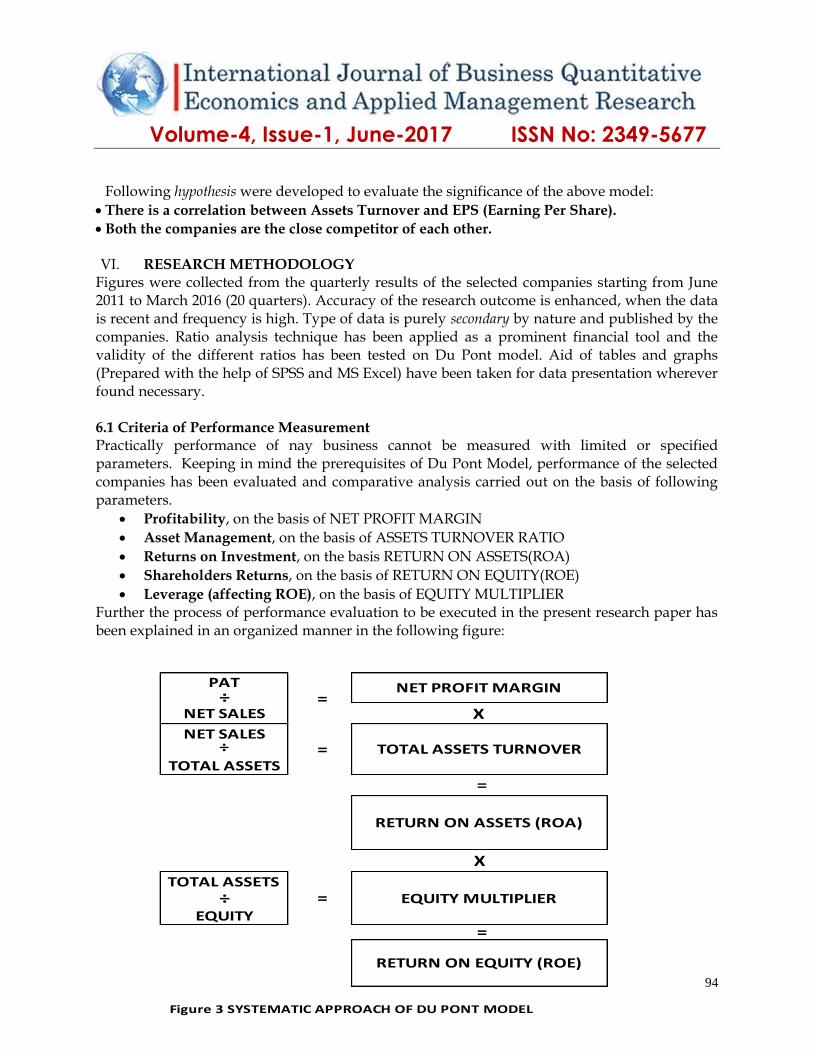
Further the process of performance evaluation to be executed in the present research paper has been explained in an organized manner in the following figure:
Figure 3 SYSTEMATIC APPROACH OF DU PONT MODEL
TOTAL ASSETS TURNOVERNET SALES
÷
TOTAL ASSETS
TOTAL ASSETS
RETURN ON ASSETS (ROA)
X
X =
=
÷EQUITY
÷NET SALES
PAT
EQUITY MULTIPLIER =
=
RETURN ON EQUITY (ROE)
=
NET PROFIT MARGIN
Volume-4, Issue-1, June-2017 ISSN No: 2349-5677
95
6.2 Assumptions & Supportive Arguments Certain assumptions were made during the course of study for the feasibility of the analysis. Details of such assumptions and supportive arguments are as follows:
One complete financial year broken into four quarters were considered for the sample selection as authors believe in the proposition” Larger the sample size, more accurate will be the result”. By stretching the data, detailed observation becomes possible.
Since quarterly results of the selected companies were not reflecting the status of net worth and total assets. Hence the quarterly figures for the former and latter were estimated on the basis of ratio of Quarterly Sales Volume to Annual Sales Volume for the particular year. Argument laid down beneath the above approach is that, efficiency of assets is measured by its turnover and on the other hand primary source funds for the investment in assets is arranged through the equity. Hence this justifies the cause of estimation of quarterly figures of equity and assets on the basis of ratio of quarterly sales volume to total sales volume.
Computation of Ratios was confined to Du Pont Analysis and possibilities of variance between one computed by the researchers and another being mentioned in the financial statements released by the companies shall be observed. It is due to the difference in methodology of ratio computations mentioned in the above argument.
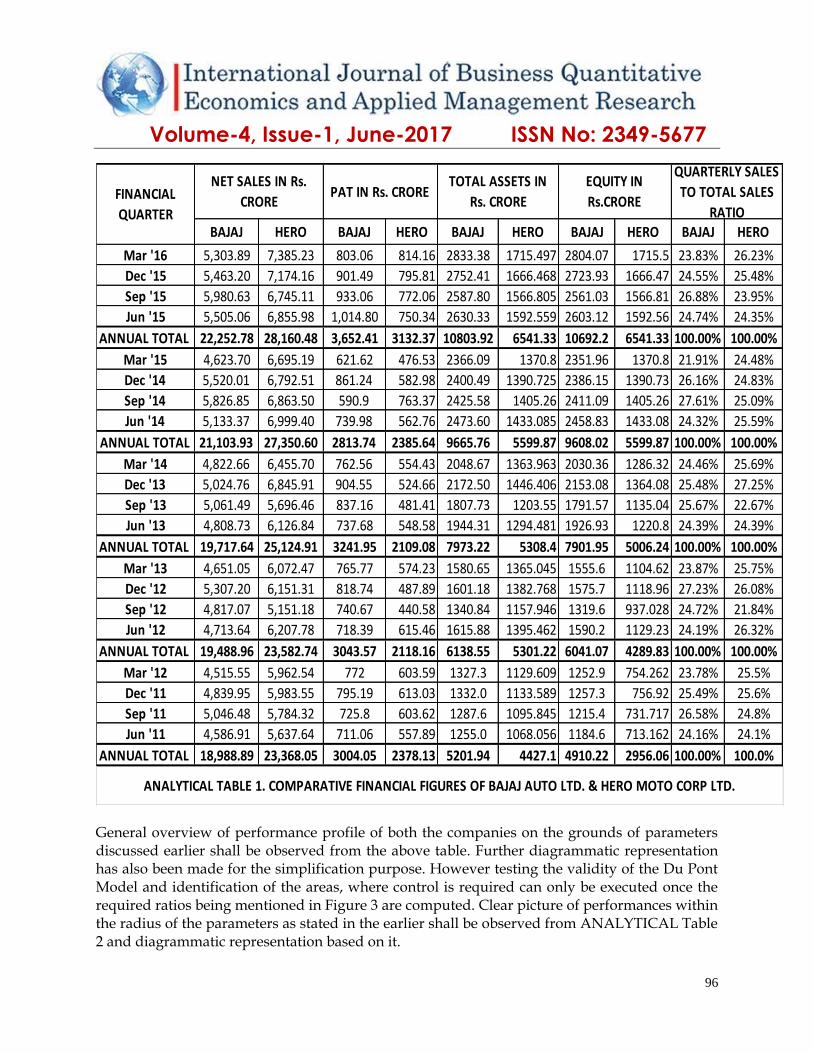
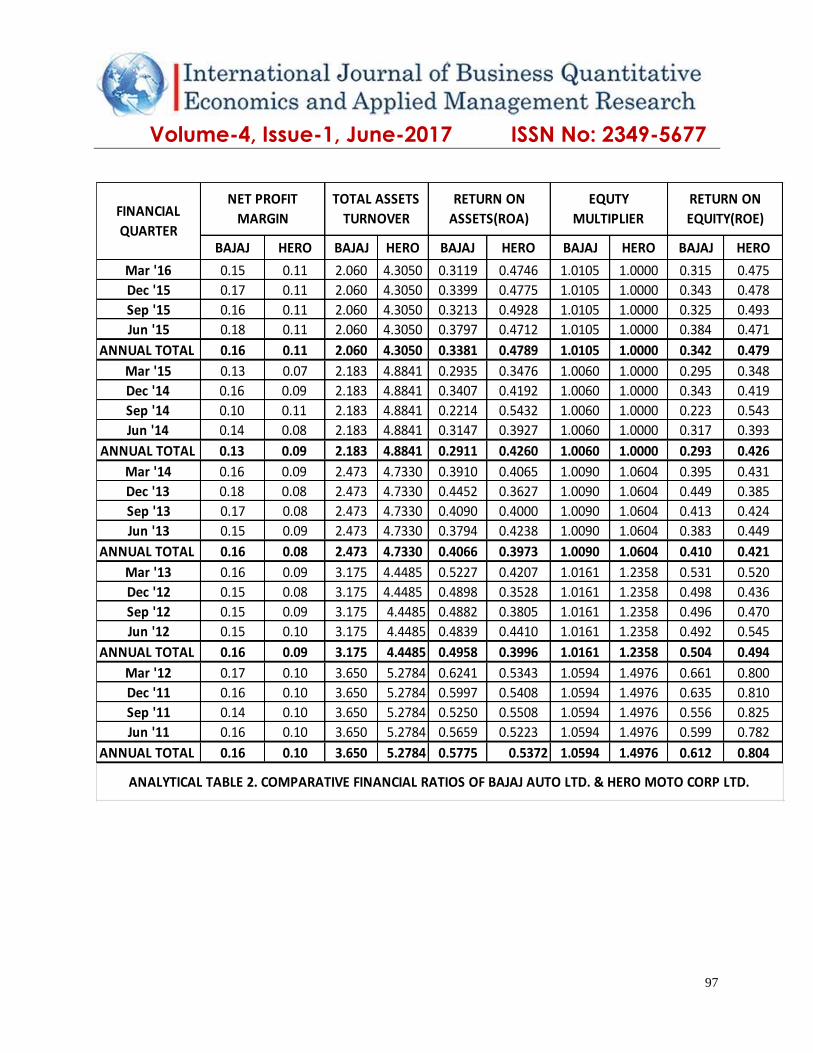
6.3 Data Organization, Analysis and Interpretation Figures collected from the financial statements of the selected companies have been organized and compared in the TABLE 1. Ratios computed on the basis of financial extracts as shown in ANALYTICAL TABLE 1 are presented in ANALYTICAL TABLE 2in the similar pattern.
Volume-4, Issue-1, June-2017 ISSN No: 2349-5677
96
BAJAJ HERO BAJAJ HERO BAJAJ HERO BAJAJ HERO BAJAJ HERO
Mar '16 5,303.89 7,385.23 803.06 814.16 2833.38 1715.497 2804.07 1715.5 23.83% 26.23%
Dec '15 5,463.20 7,174.16 901.49 795.81 2752.41 1666.468 2723.93 1666.47 24.55% 25.48%
Sep '15 5,980.63 6,745.11 933.06 772.06 2587.80 1566.805 2561.03 1566.81 26.88% 23.95%
Jun '15 5,505.06 6,855.98 1,014.80 750.34 2630.33 1592.559 2603.12 1592.56 24.74% 24.35%
ANNUAL TOTAL 22,252.78 28,160.48 3,652.41 3132.37 10803.92 6541.33 10692.2 6541.33 100.00% 100.00%
Mar '15 4,623.70 6,695.19 621.62 476.53 2366.09 1370.8 2351.96 1370.8 21.91% 24.48%
Dec '14 5,520.01 6,792.51 861.24 582.98 2400.49 1390.725 2386.15 1390.73 26.16% 24.83%
Sep '14 5,826.85 6,863.50 590.9 763.37 2425.58 1405.26 2411.09 1405.26 27.61% 25.09%
Jun '14 5,133.37 6,999.40 739.98 562.76 2473.60 1433.085 2458.83 1433.08 24.32% 25.59%
ANNUAL TOTAL 21,103.93 27,350.60 2813.74 2385.64 9665.76 5599.87 9608.02 5599.87 100.00% 100.00%
Mar '14 4,822.66 6,455.70 762.56 554.43 2048.67 1363.963 2030.36 1286.32 24.46% 25.69%
Dec '13 5,024.76 6,845.91 904.55 524.66 2172.50 1446.406 2153.08 1364.08 25.48% 27.25%
Sep '13 5,061.49 5,696.46 837.16 481.41 1807.73 1203.55 1791.57 1135.04 25.67% 22.67%
Jun '13 4,808.73 6,126.84 737.68 548.58 1944.31 1294.481 1926.93 1220.8 24.39% 24.39%
ANNUAL TOTAL 19,717.64 25,124.91 3241.95 2109.08 7973.22 5308.4 7901.95 5006.24 100.00% 100.00%
Mar '13 4,651.05 6,072.47 765.77 574.23 1580.65 1365.045 1555.6 1104.62 23.87% 25.75%
Dec '12 5,307.20 6,151.31 818.74 487.89 1601.18 1382.768 1575.7 1118.96 27.23% 26.08%
Sep '12 4,817.07 5,151.18 740.67 440.58 1340.84 1157.946 1319.6 937.028 24.72% 21.84%
Jun '12 4,713.64 6,207.78 718.39 615.46 1615.88 1395.462 1590.2 1129.23 24.19% 26.32%
ANNUAL TOTAL 19,488.96 23,582.74 3043.57 2118.16 6138.55 5301.22 6041.07 4289.83 100.00% 100.00%
Mar '12 4,515.55 5,962.54 772 603.59 1327.3 1129.609 1252.9 754.262 23.78% 25.5%
Dec '11 4,839.95 5,983.55 795.19 613.03 1332.0 1133.589 1257.3 756.92 25.49% 25.6%
Sep '11 5,046.48 5,784.32 725.8 603.62 1287.6 1095.845 1215.4 731.717 26.58% 24.8%
Jun '11 4,586.91 5,637.64 711.06 557.89 1255.0 1068.056 1184.6 713.162 24.16% 24.1%
ANNUAL TOTAL 18,988.89 23,368.05 3004.05 2378.13 5201.94 4427.1 4910.22 2956.06 100.00% 100.0%
ANALYTICAL TABLE 1. COMPARATIVE FINANCIAL FIGURES OF BAJAJ AUTO LTD. & HERO MOTO CORP LTD.
NET SALES IN Rs.
CROREFINANCIAL
QUARTER
PAT IN Rs. CRORETOTAL ASSETS IN
Rs. CRORE
EQUITY IN
Rs.CRORE
QUARTERLY SALES
TO TOTAL SALES
RATIO
General overview of performance profile of both the companies on the grounds of parameters discussed earlier shall be observed from the above table. Further diagrammatic representation has also been made for the simplification purpose. However testing the validity of the Du Pont Model and identification of the areas, where control is required can only be executed once the required ratios being mentioned in Figure 3 are computed. Clear picture of performances within the radius of the parameters as stated in the earlier shall be observed from ANALYTICAL Table 2 and diagrammatic representation based on it.
Volume-4, Issue-1, June-2017 ISSN No: 2349-5677
97
BAJAJ HERO BAJAJ HERO BAJAJ HERO BAJAJ HERO BAJAJ HERO
Mar '16 0.15 0.11 2.060 4.3050 0.3119 0.4746 1.0105 1.0000 0.315 0.475
Dec '15 0.17 0.11 2.060 4.3050 0.3399 0.4775 1.0105 1.0000 0.343 0.478
Sep '15 0.16 0.11 2.060 4.3050 0.3213 0.4928 1.0105 1.0000 0.325 0.493
Jun '15 0.18 0.11 2.060 4.3050 0.3797 0.4712 1.0105 1.0000 0.384 0.471
ANNUAL TOTAL 0.16 0.11 2.060 4.3050 0.3381 0.4789 1.0105 1.0000 0.342 0.479
Mar '15 0.13 0.07 2.183 4.8841 0.2935 0.3476 1.0060 1.0000 0.295 0.348
Dec '14 0.16 0.09 2.183 4.8841 0.3407 0.4192 1.0060 1.0000 0.343 0.419
Sep '14 0.10 0.11 2.183 4.8841 0.2214 0.5432 1.0060 1.0000 0.223 0.543
Jun '14 0.14 0.08 2.183 4.8841 0.3147 0.3927 1.0060 1.0000 0.317 0.393
ANNUAL TOTAL 0.13 0.09 2.183 4.8841 0.2911 0.4260 1.0060 1.0000 0.293 0.426
Mar '14 0.16 0.09 2.473 4.7330 0.3910 0.4065 1.0090 1.0604 0.395 0.431
Dec '13 0.18 0.08 2.473 4.7330 0.4452 0.3627 1.0090 1.0604 0.449 0.385
Sep '13 0.17 0.08 2.473 4.7330 0.4090 0.4000 1.0090 1.0604 0.413 0.424
Jun '13 0.15 0.09 2.473 4.7330 0.3794 0.4238 1.0090 1.0604 0.383 0.449
ANNUAL TOTAL 0.16 0.08 2.473 4.7330 0.4066 0.3973 1.0090 1.0604 0.410 0.421
Mar '13 0.16 0.09 3.175 4.4485 0.5227 0.4207 1.0161 1.2358 0.531 0.520
Dec '12 0.15 0.08 3.175 4.4485 0.4898 0.3528 1.0161 1.2358 0.498 0.436
Sep '12 0.15 0.09 3.175 4.4485 0.4882 0.3805 1.0161 1.2358 0.496 0.470
Jun '12 0.15 0.10 3.175 4.4485 0.4839 0.4410 1.0161 1.2358 0.492 0.545
ANNUAL TOTAL 0.16 0.09 3.175 4.4485 0.4958 0.3996 1.0161 1.2358 0.504 0.494
Mar '12 0.17 0.10 3.650 5.2784 0.6241 0.5343 1.0594 1.4976 0.661 0.800
Dec '11 0.16 0.10 3.650 5.2784 0.5997 0.5408 1.0594 1.4976 0.635 0.810
Sep '11 0.14 0.10 3.650 5.2784 0.5250 0.5508 1.0594 1.4976 0.556 0.825
Jun '11 0.16 0.10 3.650 5.2784 0.5659 0.5223 1.0594 1.4976 0.599 0.782
ANNUAL TOTAL 0.16 0.10 3.650 5.2784 0.5775 0.5372 1.0594 1.4976 0.612 0.804
ANALYTICAL TABLE 2. COMPARATIVE FINANCIAL RATIOS OF BAJAJ AUTO LTD. & HERO MOTO CORP LTD.
FINANCIAL
QUARTER
NET PROFIT
MARGIN
TOTAL ASSETS
TURNOVER
RETURN ON
ASSETS(ROA)
RETURN ON
EQUITY(ROE)
EQUTY
MULTIPLIER
Volume-4, Issue-1, June-2017 ISSN No: 2349-5677
98
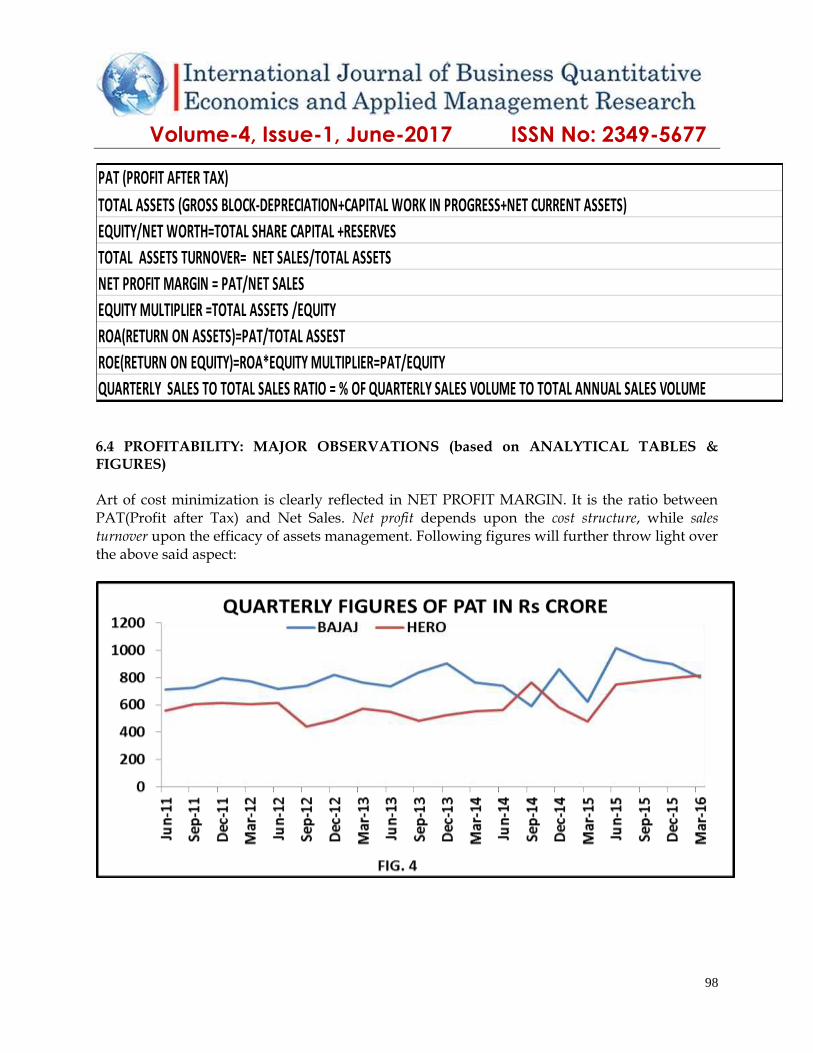
QUARTERLY SALES TO TOTAL SALES RATIO = % OF QUARTERLY SALES VOLUME TO TOTAL ANNUAL SALES VOLUME
TOTAL ASSETS (GROSS BLOCK-DEPRECIATION+CAPITAL WORK IN PROGRESS+NET CURRENT ASSETS)
PAT (PROFIT AFTER TAX)
EQUITY/NET WORTH=TOTAL SHARE CAPITAL +RESERVES
TOTAL ASSETS TURNOVER= NET SALES/TOTAL ASSETS
NET PROFIT MARGIN = PAT/NET SALES
EQUITY MULTIPLIER =TOTAL ASSETS /EQUITY
ROA(RETURN ON ASSETS)=PAT/TOTAL ASSEST
ROE(RETURN ON EQUITY)=ROA*EQUITY MULTIPLIER=PAT/EQUITY
6.4 PROFITABILITY: MAJOR OBSERVATIONS (based on ANALYTICAL TABLES & FIGURES) Art of cost minimization is clearly reflected in NET PROFIT MARGIN. It is the ratio between PAT(Profit after Tax) and Net Sales. Net profit depends upon the cost structure, while sales turnover upon the efficacy of assets management. Following figures will further throw light over the above said aspect:
Volume-4, Issue-1, June-2017 ISSN No: 2349-5677
99
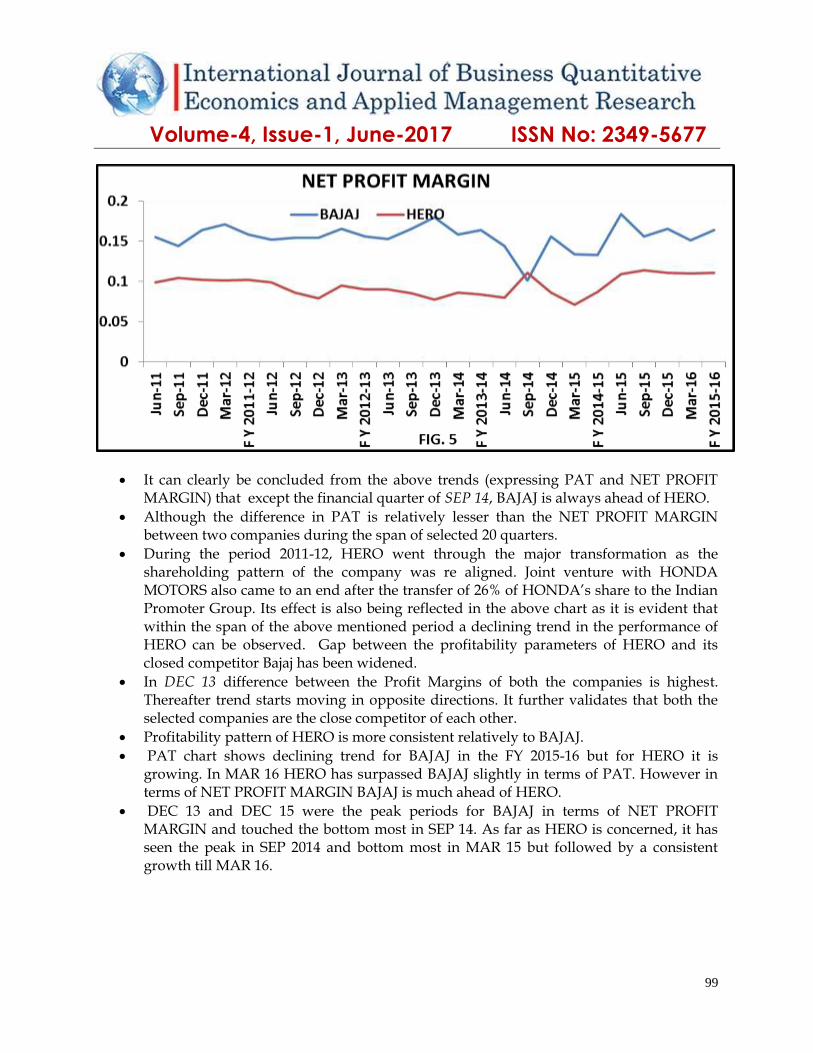
It can clearly be concluded from the above trends (expressing PAT and NET PROFIT MARGIN) that except the financial quarter of SEP 14, BAJAJ is always ahead of HERO.
Although the difference in PAT is relatively lesser than the NET PROFIT MARGIN between two companies during the span of selected 20 quarters.
During the period 2011-12, HERO went through the major transformation as the shareholding pattern of the company was re aligned. Joint venture with HONDA MOTORS also came to an end after the transfer of 26% of HONDA’s share to the Indian Promoter Group. Its effect is also being reflected in the above chart as it is evident that within the span of the above mentioned period a declining trend in the performance of HERO can be observed. Gap between the profitability parameters of HERO and its closed competitor Bajaj has been widened.
In DEC 13 difference between the Profit Margins of both the companies is highest. Thereafter trend starts moving in opposite directions. It further validates that both the selected companies are the close competitor of each other.
Profitability pattern of HERO is more consistent relatively to BAJAJ.
PAT chart shows declining trend for BAJAJ in the FY 2015-16 but for HERO it is growing. In MAR 16 HERO has surpassed BAJAJ slightly in terms of PAT. However in terms of NET PROFIT MARGIN BAJAJ is much ahead of HERO.
DEC 13 and DEC 15 were the peak periods for BAJAJ in terms of NET PROFIT MARGIN and touched the bottom most in SEP 14. As far as HERO is concerned, it has seen the peak in SEP 2014 and bottom most in MAR 15 but followed by a consistent growth till MAR 16.
Volume-4, Issue-1, June-2017 ISSN No: 2349-5677
100
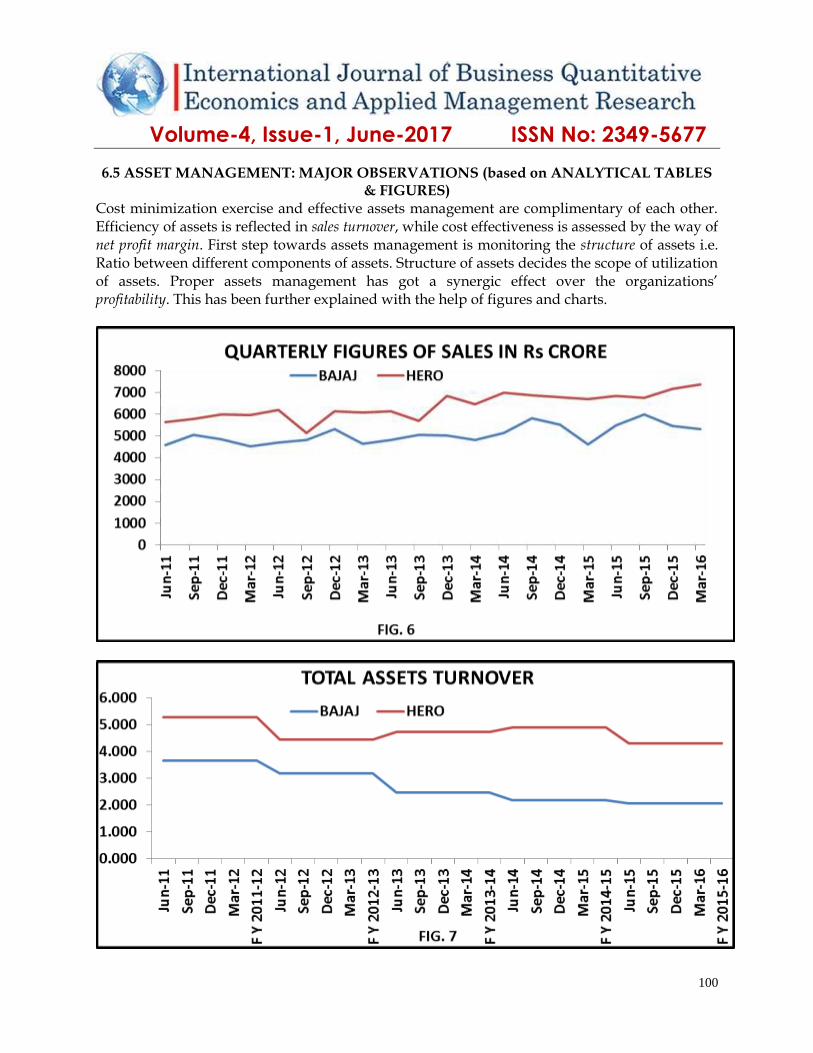
6.5 ASSET MANAGEMENT: MAJOR OBSERVATIONS (based on ANALYTICAL TABLES & FIGURES)
Cost minimization exercise and effective assets management are complimentary of each other. Efficiency of assets is reflected in sales turnover, while cost effectiveness is assessed by the way of net profit margin. First step towards assets management is monitoring the structure of assets i.e. Ratio between different components of assets. Structure of assets decides the scope of utilization of assets. Proper assets management has got a synergic effect over the organizations’ profitability. This has been further explained with the help of figures and charts.
Volume-4, Issue-1, June-2017 ISSN No: 2349-5677
101
Throughout the entire span of five years HERO has always been ahead of BAJAJ in terms of sales.
In terms of assets turnover also HERO is being ahead of BAJAJ throughout the years.
During the years 2011-12 shareholding pattern of HERO was going through the process of realignment. Therefore it experienced the hence in the quarter SEP 12, sales were dipped to their lowest but still it was slightly ahead of BAJAJ.
As far as consistency with respect to sales volume is concerned, HERO is ahead particularly from DEC 2103 onwards.
Assets Turnover Ratio shows the declining trend for BAJAJ. As far as HERO is concerned, its performance is slightly declined in the FY 2015-16. However it is relatively better than BAJAJ.
Between the FY 2013-14 to FY 2014-15, difference between the Assets Turnover Ratios of HERO and BAJAJ has been the highest.
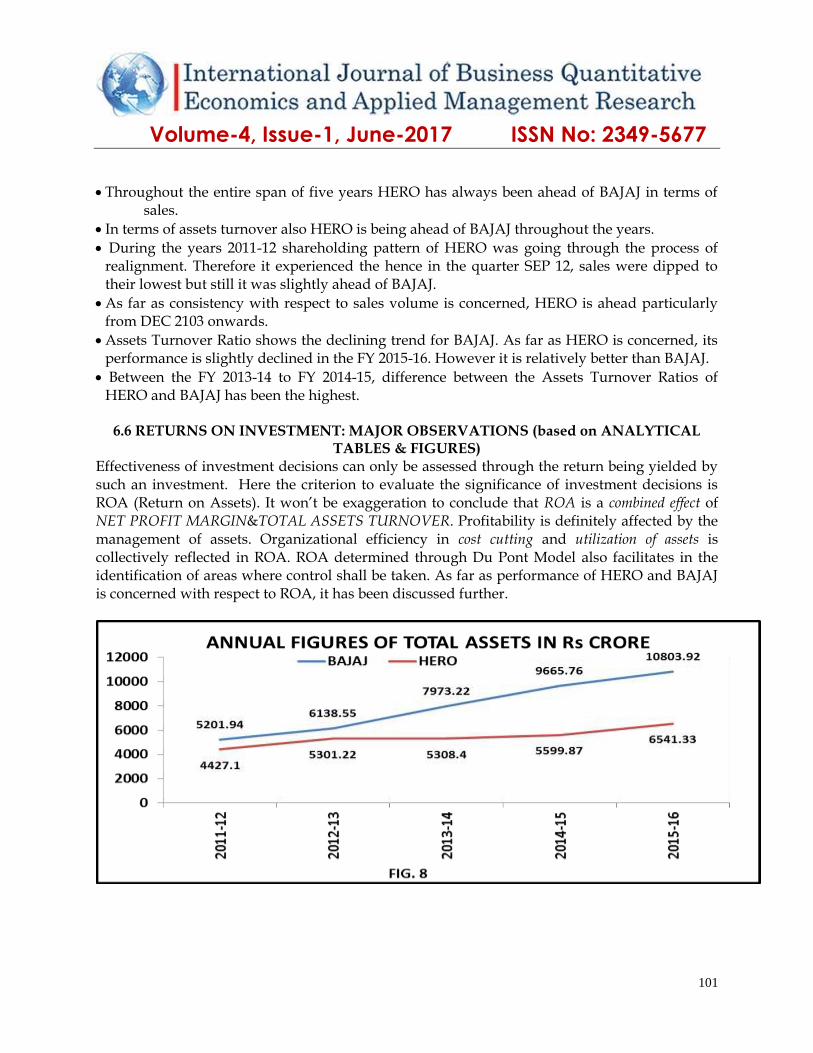
6.6 RETURNS ON INVESTMENT: MAJOR OBSERVATIONS (based on ANALYTICAL
TABLES & FIGURES) Effectiveness of investment decisions can only be assessed through the return being yielded by such an investment. Here the criterion to evaluate the significance of investment decisions is ROA (Return on Assets). It won’t be exaggeration to conclude that ROA is a combined effect of NET PROFIT MARGIN&TOTAL ASSETS TURNOVER. Profitability is definitely affected by the management of assets. Organizational efficiency in cost cutting and utilization of assets is collectively reflected in ROA. ROA determined through Du Pont Model also facilitates in the identification of areas where control shall be taken. As far as performance of HERO and BAJAJ is concerned with respect to ROA, it has been discussed further.
Volume-4, Issue-1, June-2017 ISSN No: 2349-5677
102
Linear growth can be observed in the figures of total assets of both the companies during the financial year 2011-12. However after that growth rate of BAJAJ becomes more rapid relatively to HERO.
Gap between investment in total assets of HERO and BAJAJ is also being increased from the FY 2012-13 onwards. Total assets of HERO are growing at a slower rate.
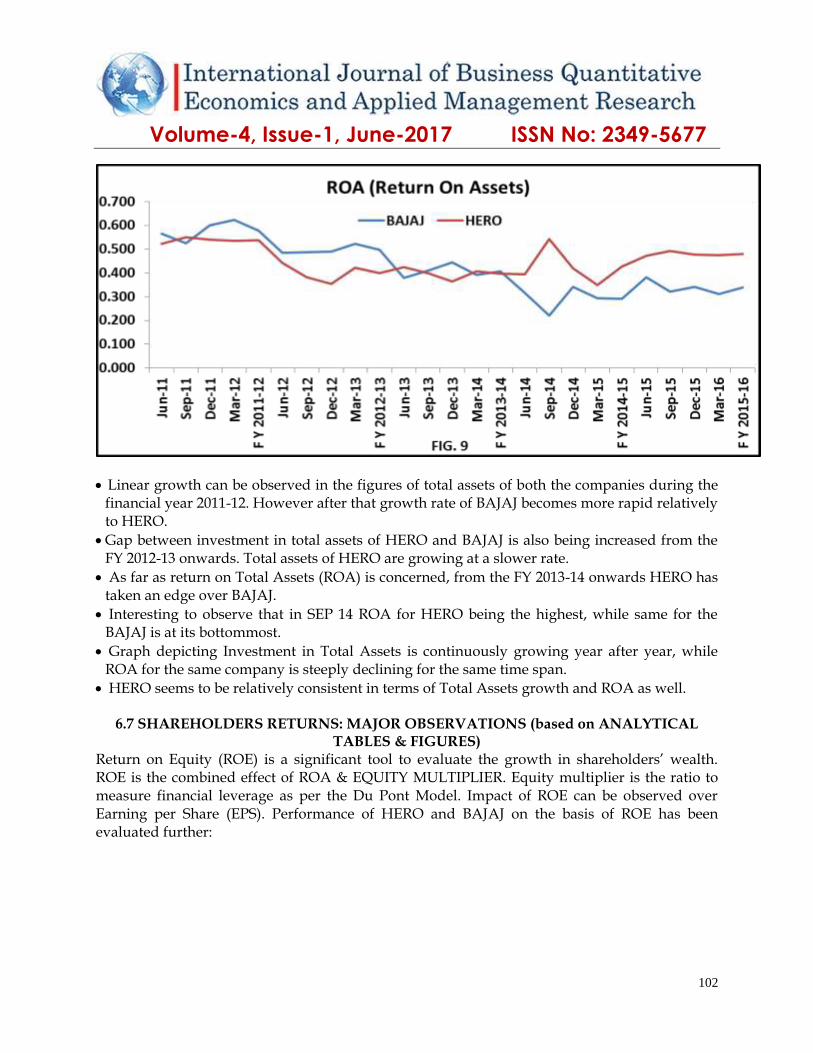
As far as return on Total Assets (ROA) is concerned, from the FY 2013-14 onwards HERO has taken an edge over BAJAJ.
Interesting to observe that in SEP 14 ROA for HERO being the highest, while same for the BAJAJ is at its bottommost.
Graph depicting Investment in Total Assets is continuously growing year after year, while ROA for the same company is steeply declining for the same time span.
HERO seems to be relatively consistent in terms of Total Assets growth and ROA as well.
6.7 SHAREHOLDERS RETURNS: MAJOR OBSERVATIONS (based on ANALYTICAL TABLES & FIGURES)
Return on Equity (ROE) is a significant tool to evaluate the growth in shareholders’ wealth. ROE is the combined effect of ROA & EQUITY MULTIPLIER. Equity multiplier is the ratio to measure financial leverage as per the Du Pont Model. Impact of ROE can be observed over Earning per Share (EPS). Performance of HERO and BAJAJ on the basis of ROE has been evaluated further:
Volume-4, Issue-1, June-2017 ISSN No: 2349-5677
103
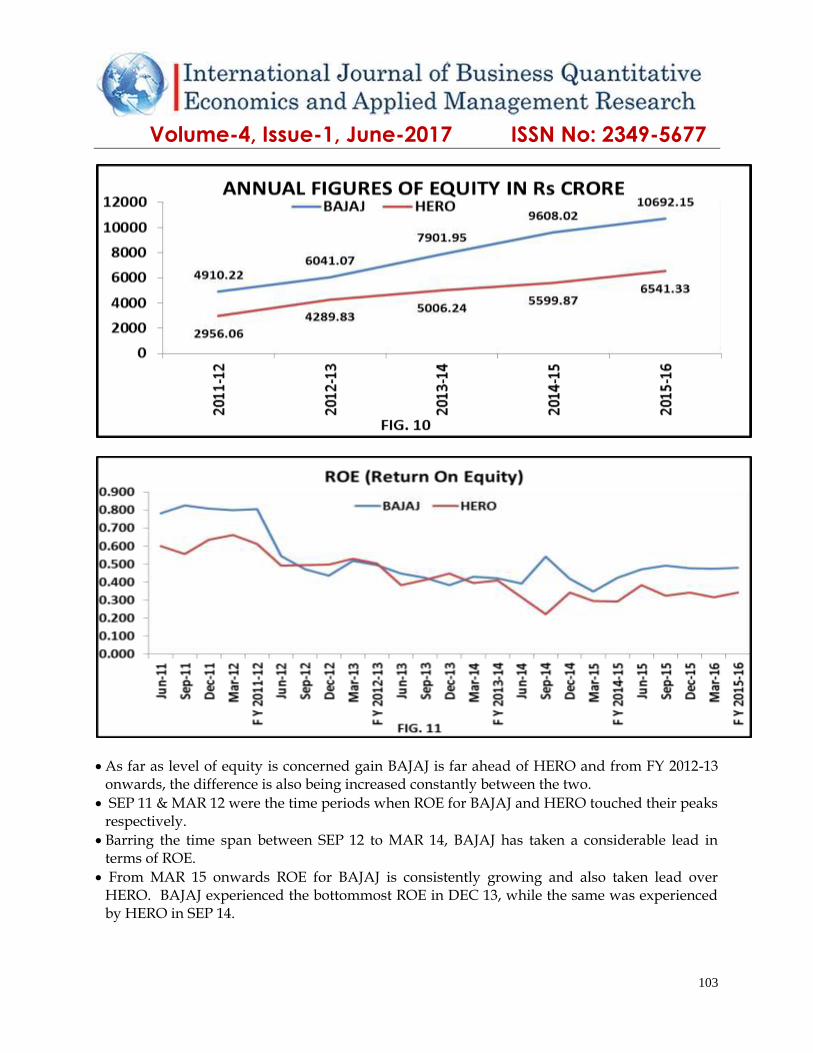
As far as level of equity is concerned gain BAJAJ is far ahead of HERO and from FY 2012-13 onwards, the difference is also being increased constantly between the two.
SEP 11 & MAR 12 were the time periods when ROE for BAJAJ and HERO touched their peaks respectively.
Barring the time span between SEP 12 to MAR 14, BAJAJ has taken a considerable lead in terms of ROE.
From MAR 15 onwards ROE for BAJAJ is consistently growing and also taken lead over HERO. BAJAJ experienced the bottommost ROE in DEC 13, while the same was experienced by HERO in SEP 14.
Volume-4, Issue-1, June-2017 ISSN No: 2349-5677
104
As far as ROE is considered performance of BAJAJ seems to be more consistent and thus better than that of HERO.
On SEP 14 ROE for both the companies are contradictory. When BAJAJ has shown remarkable growth, while the same for HERO has been dipped relatively to the previous quarter.
VII. TESTING OF HYPOTHESIS During the course of study following two hypotheses were developed.
i. There is a correlation between Assets Turnover and EPS (Earning Per Share)
ii. Both the companies are the close competitors of each other. 7.1. ANALYSIS OF DEGREE OF ASSOCIATION BETWEEN TURNOVER OF ASSETS&
EPS So far the discussion has been confined to the perspective of organization. However it would be wise to visualize the things from the investors (shareholders) aspect. Ultimately each and every normal investor intends to maximize his wealth. Profitability is one aspect, but for investor it is like perceiving the things from the managements’ angle. Eventually investor is interested in what he has earned at the end of the period.EPS is the aspect, which could be of more interest for an investor relatively to net profit margin.Net Profit Margin indicates the earning capacity of the organization, while EPS reflects what investor has earned on his investments over the period. Earnings may sometimes also include the larger portion of non-operating incomes. i.e. incomes generated from sources other than the sales. Investors usually do not have any particular tool to check the significance of assets utilization in generating earnings on their investments. Possibilities of higher returns over the investments exist even when performance of the organization in terms of assets management is mediocre. Precisely possibilities of other non-operating incomes responsible behind the EPS growth cannot be out rightly rejected. If the potential of organization pertaining to the assets management can be assessed, it may perhaps affect the investors’ decision regarding retention of stock. Efficiency of assets management should be reflected in sales turnover and thus on EPS. Authors strive to assess the degree of correlation between the TOTAL ASSETS TURNOVER (being the indicator of efficiency of assets) and EPS (being the indicator of earnings on investments) of the organizations. For the purpose of study, diluted EPS after extra ordinary items (for the selected time span) and TOTAL ASSETS TURNOVER RATIO against it have been taken for both the companies. ASSETS TURNOVER RATIO and EPS are considered as two variables for the purpose of computational work. Aid of SPSS software has been taken for statistical calculations and the descriptive tables have been moderated. Correlations have been calculated by Pearson’s method. Besides that means and standard deviations of the variables have also been computed. When expressed in terms of hypothesis it is as such:
Volume-4, Issue-1, June-2017 ISSN No: 2349-5677
105
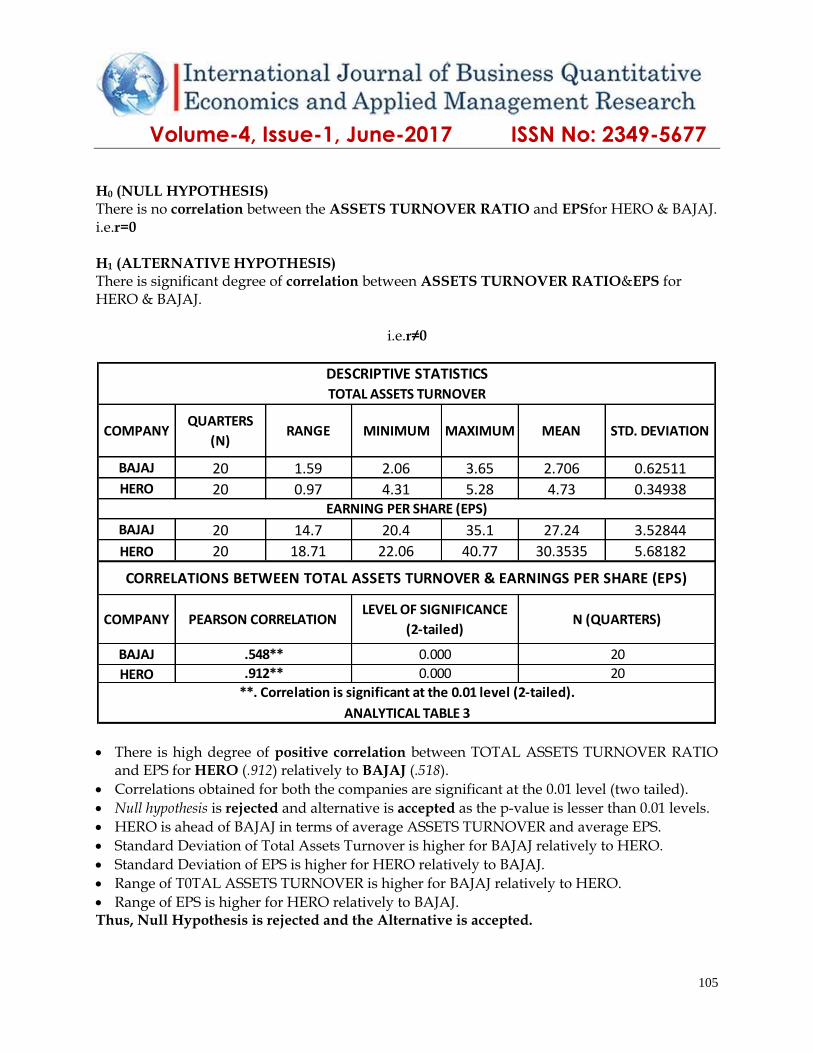
H0 (NULL HYPOTHESIS) There is no correlation between the ASSETS TURNOVER RATIO and EPSfor HERO & BAJAJ. i.e.r=0 H1 (ALTERNATIVE HYPOTHESIS) There is significant degree of correlation between ASSETS TURNOVER RATIO&EPS for HERO & BAJAJ.
i.e.r≠0
COMPANYQUARTERS
(N)RANGE MINIMUM MAXIMUM MEAN STD. DEVIATION
BAJAJ 20 1.59 2.06 3.65 2.706 0.62511
HERO 20 0.97 4.31 5.28 4.73 0.34938
BAJAJ 20 14.7 20.4 35.1 27.24 3.52844
HERO 20 18.71 22.06 40.77 30.3535 5.68182
COMPANY
BAJAJ
HERO
EARNING PER SHARE (EPS)
DESCRIPTIVE STATISTICS
CORRELATIONS BETWEEN TOTAL ASSETS TURNOVER & EARNINGS PER SHARE (EPS)
PEARSON CORRELATIONLEVEL OF SIGNIFICANCE
(2-tailed)N (QUARTERS)
TOTAL ASSETS TURNOVER
**. Correlation is significant at the 0.01 level (2-tailed).
ANALYTICAL TABLE 3
.548**
.912**
0.000
0.000
20
20
There is high degree of positive correlation between TOTAL ASSETS TURNOVER RATIO and EPS for HERO (.912) relatively to BAJAJ (.518).
Correlations obtained for both the companies are significant at the 0.01 level (two tailed).
Null hypothesis is rejected and alternative is accepted as the p-value is lesser than 0.01 levels.
HERO is ahead of BAJAJ in terms of average ASSETS TURNOVER and average EPS.
Standard Deviation of Total Assets Turnover is higher for BAJAJ relatively to HERO.
Standard Deviation of EPS is higher for HERO relatively to BAJAJ.
Range of T0TAL ASSETS TURNOVER is higher for BAJAJ relatively to HERO.
Range of EPS is higher for HERO relatively to BAJAJ. Thus, Null Hypothesis is rejected and the Alternative is accepted.
Volume-4, Issue-1, June-2017 ISSN No: 2349-5677
106
7.2 ANALYSIS OF DEGREE OF COMPETITION BETWEEN BAJAJ & HERO There is nothing unusual about that both the companies are arch rivals of each other, still some questions arise like whether both the companies are struggling to capture the new market segment? Or both the companies are eating each other’s share? Whether both the companies are preferred by the different segments of customers? There are other two-wheeler manufactures too performing in the market for a quite long period. Before the correlation is developed in order to check the degree of competition between the selected companies, it would be prudent to check the effect of sales of other companies over the sales of HERO and BAJAJ. Further authors strived to develop correlation between the sales volumes of HERO and BAJAJ controlled by the sales volume of TVS Motors. TVS motors are the third largest company in Two Wheeler sector in terms of market capitalization after BAJAJ and HERO (www.moneycontrol.com). Hence market competition in terms of sales volumes between the selected companies is definitely affected by the strong presence of TVS motors. Sales volume (in Rs.) of the selected companies for the selected 20 quarters has been considered. Partial correlation has been applied as a quantitative tool in order to test the validity of hypothesis. Authors have strived to develop the correlation between the sales volume of HERO and BAJAJ under the effect of sales volume of TVS. At the same time degree of significance (two tailed) has also been tested. Sales volume of TVS has been considered as the control variable. Hypothesis has been developed in the following manner: H0 (NULL HYPOTHESIS) Sales volumes of HERO & BAJAJ are independent of each other. i.e. HERO & BAJAJ are not the close competitors of each other. i.e. r=0 H1 (ALTERNATIVE HYPOTHESIS) Sales volumes of HERO & BAJAJ are not independent of each other. i.e. HERO & BAJAJ are the close competitors of each other. i.e. r≠0
Volume-4, Issue-1, June-2017 ISSN No: 2349-5677
107
COMPANY QUARTERS(N) RANGE MINIMUM MAXIMUM MEANSTD.
DEVIATION
HERO 20 1465.08 4515.55 5980.63 5077.6100 420.13664
BAJAJ 20 2234.05 5151.18 7385.23 6379.3390 587.85959
TVS 20 1305.93 1602.90 2908.83 2142.6145 446.31482
CONTROL
VARIABLE -.876**
-.434**
-.544**
TVS -.375**
DESCRIPTIVE STATISTICS OF SALES VOLUME
a. Cells contain zero-order (Pearson) correlations.ANALYTICAL TABLE 4
OBSERVATIONS FOR 20
FINANCIAL QUARTERS
(FY 2011-12-FY 2015-16)
CORRELATIONS BETWEEN THE SALES VOLUME OF COMPANIES
**. Correlation is significant at 0.01 level
HERO & BAJAJ
HERO & TVS
TVS & BAJAJ
HERO & BAJAJ
-none-a
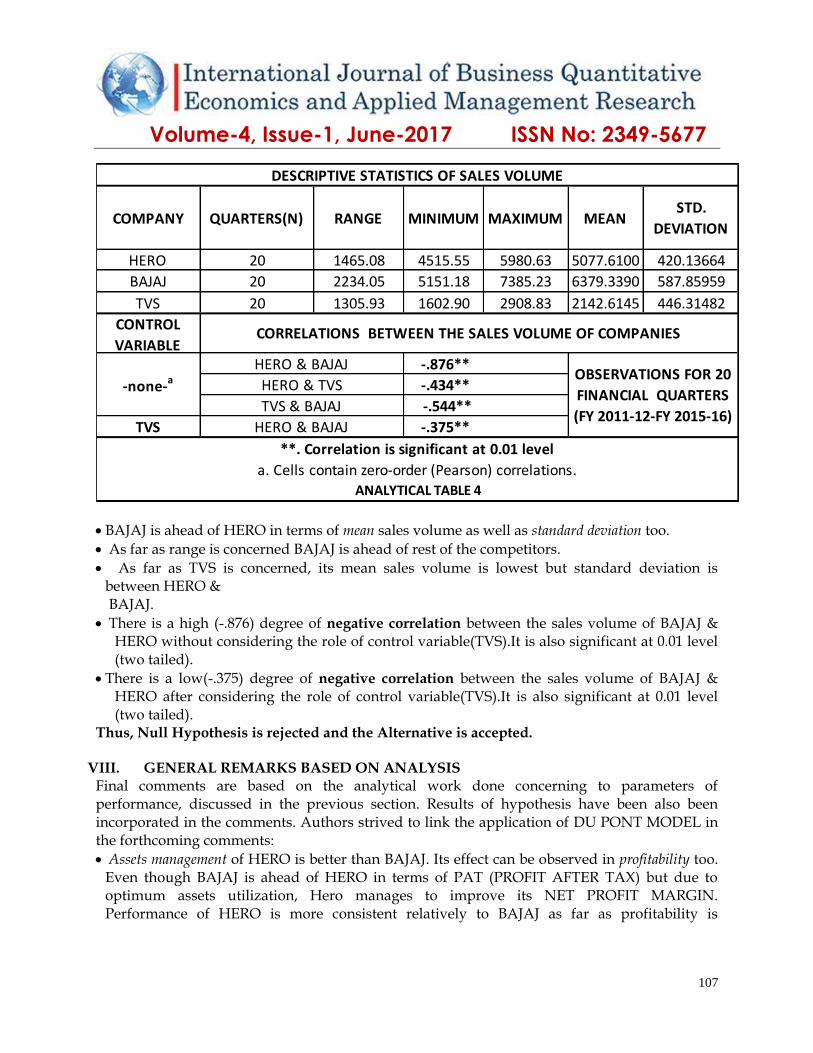
BAJAJ is ahead of HERO in terms of mean sales volume as well as standard deviation too.
As far as range is concerned BAJAJ is ahead of rest of the competitors.
As far as TVS is concerned, its mean sales volume is lowest but standard deviation is between HERO & BAJAJ.
There is a high (-.876) degree of negative correlation between the sales volume of BAJAJ & HERO without considering the role of control variable(TVS).It is also significant at 0.01 level (two tailed).
There is a low(-.375) degree of negative correlation between the sales volume of BAJAJ & HERO after considering the role of control variable(TVS).It is also significant at 0.01 level (two tailed).
Thus, Null Hypothesis is rejected and the Alternative is accepted.
VIII. GENERAL REMARKS BASED ON ANALYSIS Final comments are based on the analytical work done concerning to parameters of performance, discussed in the previous section. Results of hypothesis have been also been incorporated in the comments. Authors strived to link the application of DU PONT MODEL in the forthcoming comments:
Assets management of HERO is better than BAJAJ. Its effect can be observed in profitability too. Even though BAJAJ is ahead of HERO in terms of PAT (PROFIT AFTER TAX) but due to optimum assets utilization, Hero manages to improve its NET PROFIT MARGIN. Performance of HERO is more consistent relatively to BAJAJ as far as profitability is
Volume-4, Issue-1, June-2017 ISSN No: 2349-5677
108
concerned. HERO has improved its position remarkably after the separation from HONDA MOTORS.
Hero seems to be not just better but more reliable than BAJAJ as far as management of assets is concerned. Impact of better utilization of assets is reflected in multiple areas. Investments in assets are rising year after year for BAJAJ more rapidly than that of HERO but still latter is better in terms of turnover than the former.
BAJAJ is better than HERO in terms of cost effectiveness. Even though former is behind the latter when the question of optimum utilization of assets is concerned, but with its capability of controlling the cost in an effective manner it successfully manages to maintain the profitability level. However the component of other incomes also plays the major role in improving the profitability.
BAJAJ is exclusively involved in the manufacturing of motorcycles while HERO also manufactures scooters, besides motorbikes. This is reflected in the higher sales turnover and thus it becomes the cause of higher ASSETS TURNOVER ratio. During the festival season (SEPTEMBER to DECEMBER) too HERO has exploited the market better than BAJAJ. One of the prominent causes of higher ASSETS TURNOVER RATIO is the diversification in product range by HERO.
HERO is more capable in generating returns from investments than BAJAJ as the ROA (Return on Assets) of former is better than the latter. ROA for BAJAJ is steeply declining time after time, but for HERO it is consistent. Investments of HERO are generating more returns than BAJAJ. Again better assets management has resulted in the higher ROA. Gestation period for return on investment for BAJAJ is greater than HERO.
Equity funds of BAJAJ are growing with a rapid rate relatively to HERO. Though HERO generates better return on assets (ROA) but as far as return on shareholders’ fund (ROE) is concerned BAJAJ has got an edge over HERO. Capital structure of BAJAJ is more levered than HERO, due to which it manages to generate higher returns on shareholders’ funds. However authors realized that equity-multiplier may not the perfect substitute of debt-equity ratio in order to measure the degree of financial leverage.
Besides cost effectiveness, presence of financial leverage in the capital structure is one of the prominent reasons of generating higher ROE for BAJAJ. On the other hand HERO had realigned its capital structure after a separation from the HONDA MOTORS. Hence in the initial stage HERO played the safe policy by avoiding the debt funds up to some extent and decided to depend more upon the equity funds as a result its ROE becomes lower than BAJAJ.
As far as operational efficiency is concerned where the parameter of cost effectiveness is concerned BAJAJ is ahead of HERO, but when it comes to assets utilization part, HERO leads. It is not necessary that effectiveness of assets is always evaluated through the sales turnover. If component of assets includes indirect investments in the form of holdings of subsidiaries or investments in capital markets or loans & advances then the impact of returns generated through such sort of investments shall not be reflected in the sales turnover but it will definitely improve the return on assets (ROA) and thus ROE. In a nutshell structure of assets has an impact not just over the TOTAL ASSETS TURNOVER but directly upon ROA too.
Volume-4, Issue-1, June-2017 ISSN No: 2349-5677
109
IX. INTERPRETATION OF HYPOTHESIS TEST Association between performance measurement parameters (as per DU PONT MODEL) and shareholders earnings was analyzed. At the same time extent of degree of business rivalry existing within the two wheelers market and among the automobiles manufacturers has also been analyzed. Following are the comments after hypothesis test.
Efficient asset management by HERO is reflected in the earnings (EPS) of shareholders too as there is high degree of positive correlation between the TOTAL ASSETS TURNOVER RATIO & EPS. On the other hand BAJAJ is behind HERO in turning the efficacy in assets management into the shareholders earnings.
While HERO is exclusively involved in the manufacturing of two wheelers while BAJAJ also manufactures commercial vehicles besides motor bikes. Hence two wheeler market is more influenced by HERO relatively to BAJAJ. In the recent years sale of commercial vehicles has been declined (information as obtained from the annual report of BAJAJ AUTO for 2015-16) and its effect is observed in the average EPS.
There are other factors like indirect incomes obtained by the way of returns on assets rather than the operating incomes which are responsible for shareholders earnings for BAJAJ as there is low degree of positive correlation between the TOTAL ASSETS TURNOVER & EPS. Precisely there is more contribution of indirect incomes in the earnings generated by BAJAJ rather than sales turnover.
As far as reliability factor is concerned mean HERO is more reliable than BAJAJ when it comes to the effectiveness in assets management. However latter seems to be more reliable in maintaining the EPS level. However possibilities of maximization of shareholders earnings are higher in HERO relatively to BAJAJ. Again manufacturing of commercial vehicles by BAJAJ is one of the major causes.
HERO and BAJAJ are close competitors of BAJAJ as a very high degree of negative correlation exists between the sales volumes of two. More emphasis is over grabbing the share of each other rather than creating the new market segments for them. However above results have been obtained without considering the role of TVS.
When the sales volume of TVS is set as the control variable, then the degree of correlation between the sales volume of BAJAJ and HERO has been declined significantly though it is negative. Simply speaking TVS is putting tough competition for HERO and BAJAJ as the sales of both the companies are being affected by that of TVS. However the impact of performance of TVS is more over the BAJAJ relatively to HERO.TVS is eating more of BAJAJ’s share.
Sales figures of HERO are more reliable relatively to BAJAJ. Since sales volume of commercial vehicles segment being manufactured by BAJAJ has declined while on the other hand market of automatic scooters being manufactured by HERO has picked up the growth in the recent past. Therefore variations in the sales volume of HERO are low relatively to BAJAJ.
Du Pont Analysis, basic but very essential tool for analysts, investors, academicians or whosoever who has an inclination towards the financial performance analysis of the organizations. It helps in locating the areas wherever control is required in order to enhance the financial performance of companies. BAJAJ manages to keep it NET PROFIT MARGIN high by
Volume-4, Issue-1, June-2017 ISSN No: 2349-5677
110
controlling the cost and including the other non-operating incomes component in its income structure. On the other hand HERO has proved its efficiency in management of assets which is reflected in TOTAL ASSETS TURNOVER. By revising the structure of assets TURNOVER ON TOTAL ASSETS can be optimized. Further such assets which are neither contributing towards turnover improvement nor towards returns generation must be identified and should either be replaced or disposed off. Steps should also be taken to complete the investment projects timely so that declination in TOTAL ASSETS TURNOVER could be avoided. Investors seeking short term gains in from their stock must focus upon the NET PROFIT MARGIN and ROA while those seeking capital gains over their investments must regularly watch TOTAL ASSETS TURNOVER and ROE. Investors should thoroughly assess the impact of NET PROFIT MARGIN, ROA and EQUITY MULTIPLIER over ROE before making decisions related to investment. Though it’s just a recommendation based on analysis but not the condition. Appropriate evaluation of financial as well as business risk is a must by the management before giving leverage to funds in order to enhance the ROE. However proper asset management plays the pivotal role in enhancing the overall performance of the organization. Ratio Analysis is one of the very common tool used to evaluate the overall financial performance of the organizations. Further Du-Pont Analysis helps to integrate different kinds of ratios in a single frame and thus the impact of one component over the other can easily understood. By putting the different variables in a single model, weak areas can be identified and appropriate corrective measures may be taken. When detailed fundamental analysis of various business concerns, sometimes, becomes a complex exercise or where quick decision making is required; Du Pont Model could be of great help. REFERENCES [1] Annual Reports of Hero MotoCorp and Bajaj Auto Ltd.