Embed Size (px)
Citation preview
Volume 29 • No. 3 • Fall 2015
THE NATIONAL MARINE EDUCATORS ASSOCIATION brings together those interested in the study and enjoyment of the world of water. Affiliated with the National Science Teachers Association, NMEA includes professionals with backgrounds in education, science, business, government, museums, aquariums, and marine research, among others. Members receive Current: The Journal of Marine Education, NMEA News Online, and discounts at annual conferences. Membership information is available from: NMEA National Office/Attention: Jeannette Connors, 4321 Hartwick Road, Suite 300, College Park, MD 20740, or visit our website online at www.marine-ed.org/. Phone: 844-OUR-NMEA (844-687-6632); Email: [email protected].
N A T I O N A L M A R I N E E D U C A T O R S A S S O C I A T I O N
Lisa M. Tooker, Nora L. Deans, Editors Lonna Laiti, Eric Cline, Design
Editorial Board:Vicki Clark VIMS/Virginia Sea Grant
Elizabeth Day-Miller BridgeWater Education Consulting, LLC
John Dindo Dauphin Island Sea Lab
Paula Keener NOAA Ofiice of Ocean Exploration and Research Program
Meghan Marrero, Ph.D. Mercy College, New York
Maryellen Timmons University of Georgia-MES
Lisa Tossey NMEA Social Media Community Manager & Editor
Lynn Tran Lawrence Hall of Science, UC Berkeley
Current is published up to four times a year for members of the National Marine Educators Association. Library subscriptions to Current are available for $50 a year. Individual issues are available from the editors for $15.
Editorial and advertising offices: NMEA, c/o Jeannette Connors, 4321 Hartwick Road, Suite 300; College Park, MD 20740
© 2015 by Current: The Journal of Marine Education (ISSN 0889-5546). Publication of the National Marine Educators Association. The opinions expressed by authors do not necessarily reflect those of NMEA.
Permission is granted by NMEA for libraries and other users to make reprographic copies for their own or their client’s personal or non-commercial use. This permission does not extend to copying for advertising or promotional purposes, creating new collective works, resale, or any material not copyrighted to NMEA. For more information, email the editor of Current: The Journal of Marine Education at [email protected] for permission-related or other editorial questions or comments regarding the journal; or visit us online at www.marine-ed.org.
Front Cover: Photos Courtesy of Matthew Landau (top left and bottom left); Jeff Thomas and Jill M. Raisor (top right); Jamie Caldwell (middle right); Olivia April Sheffield (bottom right)
“... to make known the world of water, both fresh and salt.”
Volume 29 • No. 3 • Fall 2015
NMEA Officers:President Robert Rocha New Bedford Whaling Museum New Bedford, MA
Past President E. Howard Rutherford University of South Florida College of Marine Science, St. Petersburg, FL
President–Elect Tami Lunsford Newark Charter Jr/Sr High School Newark, DE
Treasurer Jacqueline U. Takacs Central Maryland Research and Education Center Upper Marlboro, MD
Secretary Sarah Richards Saint Ann’s School, Brooklyn, NY
NMEA National Office:Office Manager Jeannette Connors
Membership Secretary Adam Frederick
Social Media Community Manager & Editor Lisa Tossey
Current Editors Lisa M. Tooker Nora L. Deans
NMEA Board of Directors:Kate Achilles, Ph.D. NOAA Fisheries Service, La Jolla, CA
Dave Bader Aquarium of the Pacific, Long Beach, CA
David Christopher National Aquarium in Baltimore, Baltimore, MD
Laura Diederick Smithsonian Marine Station, Ft. Pierce, FL
Geraldine Fauville University of Gothenburg, Sweden
Catherine Halversen Lawrence Hall of Science, Berkeley, CA
Meghan E. Marrero Mercy College, Dobbs Ferry, NY
George I. Matsumoto, Ph.D. Monterey Bay Aquarium Research Institute, Moss Landing, CA
Sean Russell Youth Ocean Conservation Summit, Englewood, FL
Jim Wharton Seattle Aquarium, Seattle, WA
NMEA Chapter Representatives: Martin A. Keeley Caribbean and Western Atlantic (CARIBWA) email: [email protected]
Mellie Lewis Florida Marine Science Educators Association (FMSEA) email: [email protected]
Gale R. Lizana Georgia Association of Marine Education (GAME) email: [email protected]
Lyndsey Manzo Great Lakes Educators of Aquatic and Marine Science (GLEAMS) email: [email protected]
Carol Steingart Gulf of Maine Marine Education Association (GOMMEA) email: [email protected]
Erin Hobbs Massachusetts Marine Educators (MME) email: [email protected]
William Hanshumaker, Ph.D. Northwest Aquatic and Marine Educators (NAME) email: [email protected]
Melanie Reding New Jersey Marine Educators Association (NJMEA) email: [email protected]
Dale Stanley New York State Marine Educators Association (NYSMEA) email: [email protected]
Mark Heckman OCEANIA (Hawai’i and Pacific Islands) email: [email protected]
Jessica Kastler, Ph.D. Southern Association of Marine Educators (SAME) email: [email protected]
Jaime Thom South Carolina Marine Educators Association (SCMEA) email: [email protected]
Lauren Rader Southeastern New England Marine Educators (SENEME) email: [email protected]
Judith Coats Southwest Marine Educators Association (SWMEA) email: [email protected]
Becky J. Cox, Ed.D. Tennessee Educators of Aquatic and Marine Science (TEAMS) email: [email protected]
Marolyn Smith Texas Marine Educators Association (TMEA) email: [email protected]
Volume 29 • No. 3 • Fall 2015
CURRENT LOG – We’re excited to bring you another general issue of Current featuring articles by members from all over the country and overseas. In this issue, you’ll find a variety of engaging articles and activities, ranging from a program led by California Sea Grant that explores the RESTOR project at Ormond Beach, to hands-on activities highlighting marine debris and its harmful effects on marine organisms, to coral disease research conducted at the Hawai’i Institute of Marine Biology, as well as many other exciting topics that provide new ways to discover “the world of water.”
During the summer of 2016, marine educators from near and far will gather for our 2016 annual conference, Making Waves: Current Connections in Marine Science, hosted by the Southeastern Florida Marine Science Educators Association (FMSEA), June 25 through July 1, in Orlando, Florida. The conference brings together formal and informal educators, scientists, students, and government and industry members to share ideas on the world of water. The conference hosts general and concurrent sessions, workshops, field trips, and evening events. Interested in joining the conference committee or exhibiting at NMEA16? Please contact the FMSEA conference coordinators at [email protected]. More details to follow so continue to check back in at www.fmsea.org/NMEA16 for the latest registration information.
We publish four digital issues of Current each year, so please continue to send in your original manuscripts on research, lessons, resources, or strategies focused on marine and aquatic science, education, art, literature, and maritime history. Look for contributor guidelines on our website under Current: The Journal of Marine Education. The deadlines for articles for general issues in 2016 are November 16, 2015, April 25, July 18, and October 3, 2016.
Remember to stay connected to the NMEA by liking us on Facebook and following us on Twitter for the latest news and updates.
Cheers,
Lisa M. Tooker, Nora L. Deans Editors
2 Underserved Youth and an Over-Used Wetland: The RESTOR Project Promotes a Win-Win Relationship at Ormond Beach by monique r. myers
5 Activity: Litter isn’t Glitter: Beaches Should Be Clean by kelsey r. cramer, michele b. sherman, and mary carla curran
16 Reel in Students: Using Real World Learning Objects (RWLO) and Real-Time Data in Ocean Science by jeff thomas and jill m. raisor
22 Activity: Corals: The Essence of Fluorescence by jamie m. caldwell, carlie wiener, mark heckman, and judith d. lemus
30 Teaching An Undergraduate “Tropical Marine Biology” Course by matthew landau
35 Ocean Literacy: Can Students Learn the Essential Principles? by laura guertin and nina clements
39 New Books and Media
41 2016 National Marine Educators Association Conference
CONTENTS
2
Volume 29 • No. 3 • Fall 2015
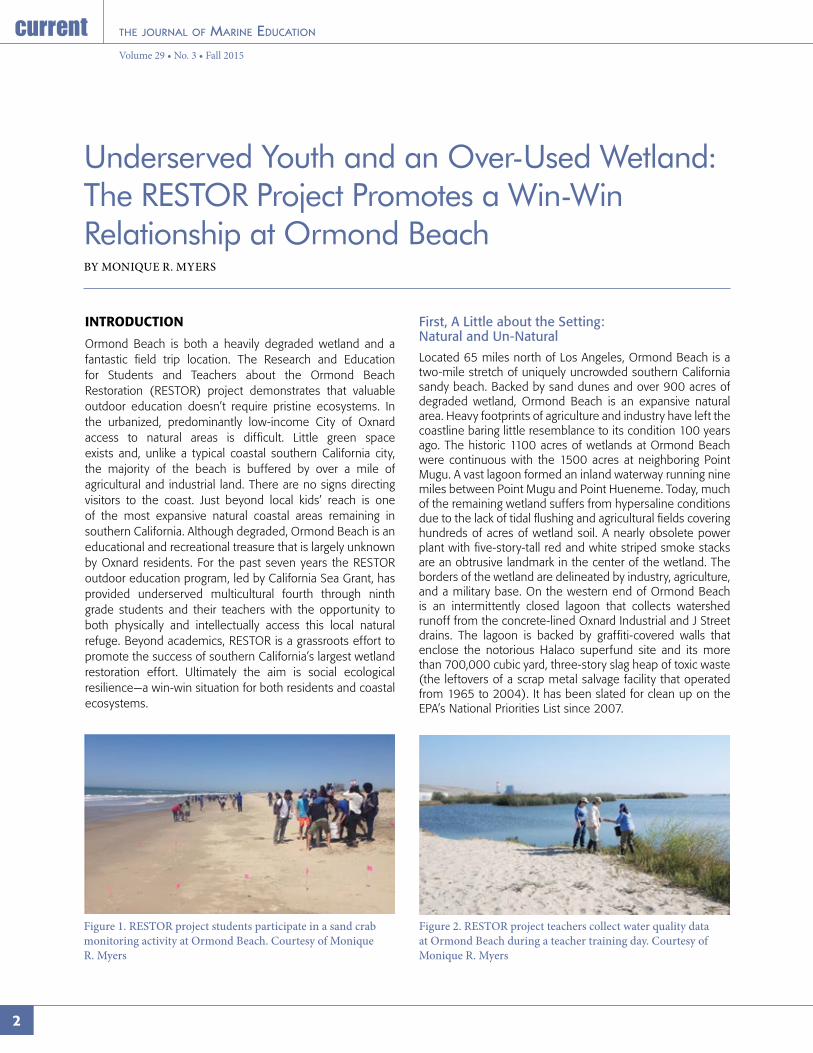
Underserved Youth and an Over-Used Wetland: The RESTOR Project Promotes a Win-Win Relationship at Ormond BeachBY MONIQUE R. MYERS
INTRODUCTION
Ormond Beach is both a heavily degraded wetland and a fantastic field trip location. The Research and Education for Students and Teachers about the Ormond Beach Restoration (RESTOR) project demonstrates that valuable outdoor education doesn’t require pristine ecosystems. In the urbanized, predominantly low-income City of Oxnard access to natural areas is difficult. Little green space exists and, unlike a typical coastal southern California city, the majority of the beach is buffered by over a mile of agricultural and industrial land. There are no signs directing visitors to the coast. Just beyond local kids’ reach is one of the most expansive natural coastal areas remaining in southern California. Although degraded, Ormond Beach is an educational and recreational treasure that is largely unknown by Oxnard residents. For the past seven years the RESTOR outdoor education program, led by California Sea Grant, has provided underserved multicultural fourth through ninth grade students and their teachers with the opportunity to both physically and intellectually access this local natural refuge. Beyond academics, RESTOR is a grassroots effort to promote the success of southern California’s largest wetland restoration effort. Ultimately the aim is social ecological resilience—a win-win situation for both residents and coastal ecosystems.
First, A Little about the Setting: Natural and Un-Natural
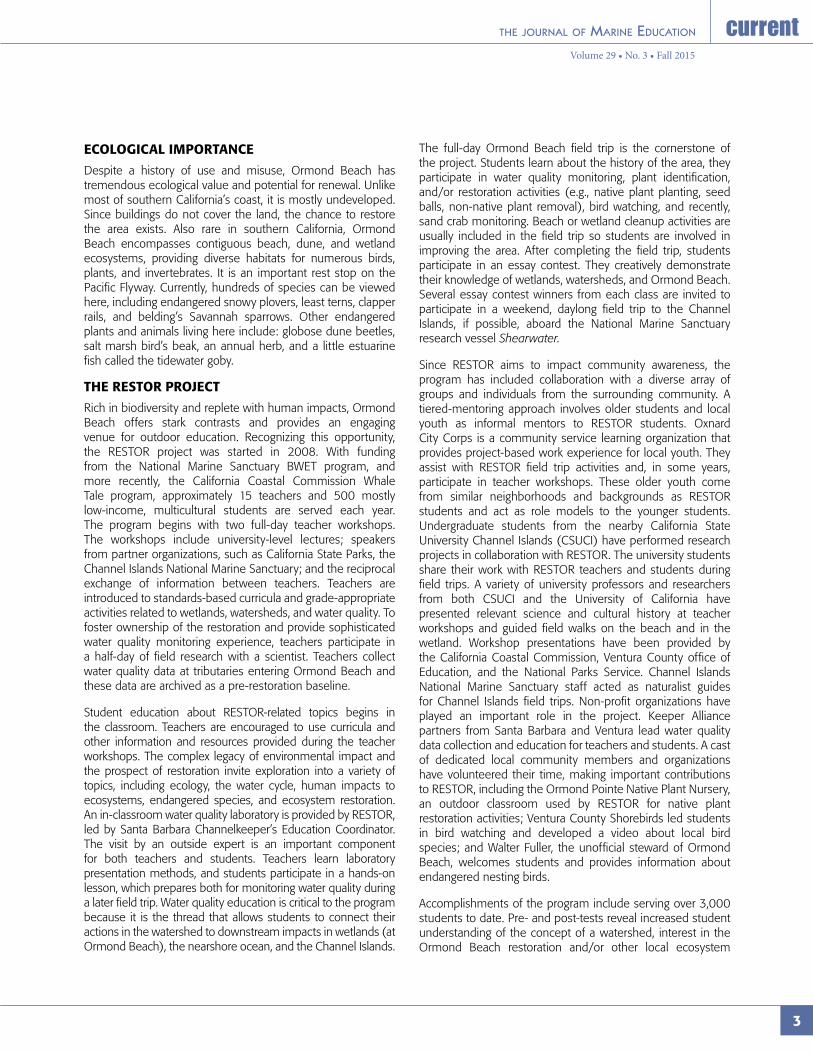
Located 65 miles north of Los Angeles, Ormond Beach is a two-mile stretch of uniquely uncrowded southern California sandy beach. Backed by sand dunes and over 900 acres of degraded wetland, Ormond Beach is an expansive natural area. Heavy footprints of agriculture and industry have left the coastline baring little resemblance to its condition 100 years ago. The historic 1100 acres of wetlands at Ormond Beach were continuous with the 1500 acres at neighboring Point Mugu. A vast lagoon formed an inland waterway running nine miles between Point Mugu and Point Hueneme. Today, much of the remaining wetland suffers from hypersaline conditions due to the lack of tidal flushing and agricultural fields covering hundreds of acres of wetland soil. A nearly obsolete power plant with five-story-tall red and white striped smoke stacks are an obtrusive landmark in the center of the wetland. The borders of the wetland are delineated by industry, agriculture, and a military base. On the western end of Ormond Beach is an intermittently closed lagoon that collects watershed runoff from the concrete-lined Oxnard Industrial and J Street drains. The lagoon is backed by graffiti-covered walls that enclose the notorious Halaco superfund site and its more than 700,000 cubic yard, three-story slag heap of toxic waste (the leftovers of a scrap metal salvage facility that operated from 1965 to 2004). It has been slated for clean up on the EPA’s National Priorities List since 2007.
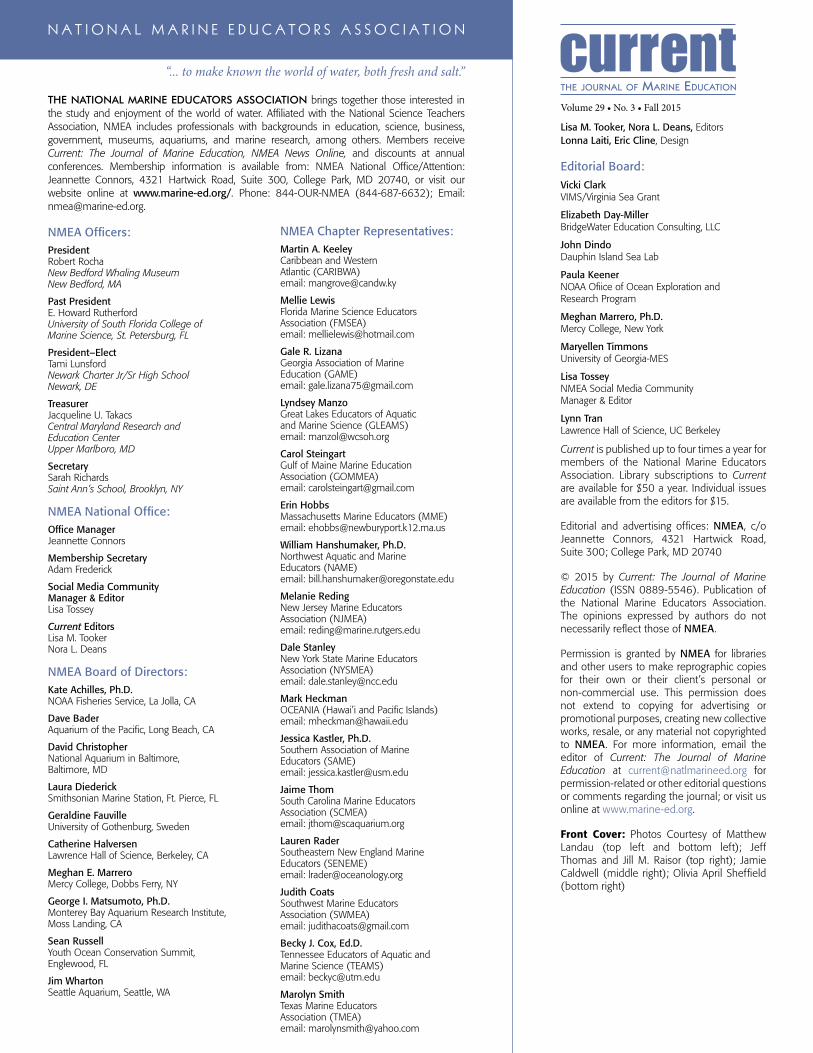
Figure 1. RESTOR project students participate in a sand crab monitoring activity at Ormond Beach. Courtesy of Monique R. Myers
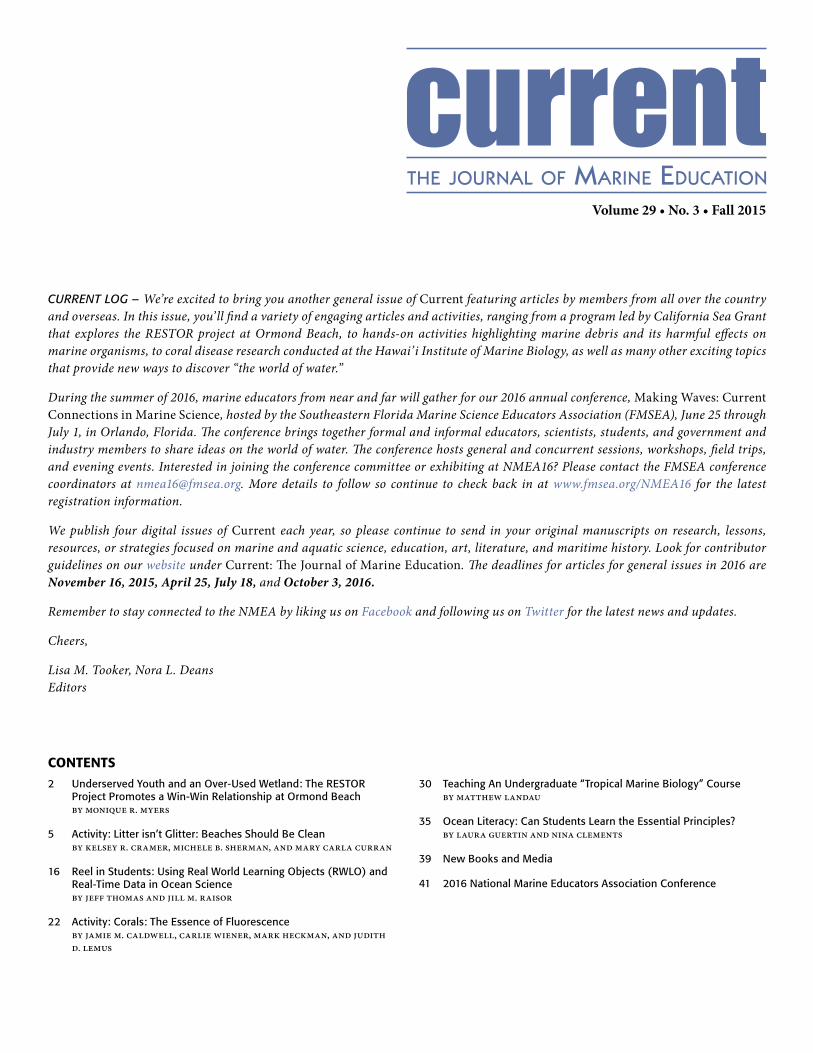
Figure 2. RESTOR project teachers collect water quality data at Ormond Beach during a teacher training day. Courtesy of Monique R. Myers
3
Volume 29 • No. 3 • Fall 2015
ECOLOGICAL IMPORTANCE
Despite a history of use and misuse, Ormond Beach has tremendous ecological value and potential for renewal. Unlike most of southern California’s coast, it is mostly undeveloped. Since buildings do not cover the land, the chance to restore the area exists. Also rare in southern California, Ormond Beach encompasses contiguous beach, dune, and wetland ecosystems, providing diverse habitats for numerous birds, plants, and invertebrates. It is an important rest stop on the Pacific Flyway. Currently, hundreds of species can be viewed here, including endangered snowy plovers, least terns, clapper rails, and belding’s Savannah sparrows. Other endangered plants and animals living here include: globose dune beetles, salt marsh bird’s beak, an annual herb, and a little estuarine fish called the tidewater goby.
THE RESTOR PROJECT
Rich in biodiversity and replete with human impacts, Ormond Beach offers stark contrasts and provides an engaging venue for outdoor education. Recognizing this opportunity, the RESTOR project was started in 2008. With funding from the National Marine Sanctuary BWET program, and more recently, the California Coastal Commission Whale Tale program, approximately 15 teachers and 500 mostly low-income, multicultural students are served each year. The program begins with two full-day teacher workshops. The workshops include university-level lectures; speakers from partner organizations, such as California State Parks, the Channel Islands National Marine Sanctuary; and the reciprocal exchange of information between teachers. Teachers are introduced to standards-based curricula and grade-appropriate activities related to wetlands, watersheds, and water quality. To foster ownership of the restoration and provide sophisticated water quality monitoring experience, teachers participate in a half-day of field research with a scientist. Teachers collect water quality data at tributaries entering Ormond Beach and these data are archived as a pre-restoration baseline.
Student education about RESTOR-related topics begins in the classroom. Teachers are encouraged to use curricula and other information and resources provided during the teacher workshops. The complex legacy of environmental impact and the prospect of restoration invite exploration into a variety of topics, including ecology, the water cycle, human impacts to ecosystems, endangered species, and ecosystem restoration. An in-classroom water quality laboratory is provided by RESTOR, led by Santa Barbara Channelkeeper’s Education Coordinator. The visit by an outside expert is an important component for both teachers and students. Teachers learn laboratory presentation methods, and students participate in a hands-on lesson, which prepares both for monitoring water quality during a later field trip. Water quality education is critical to the program because it is the thread that allows students to connect their actions in the watershed to downstream impacts in wetlands (at Ormond Beach), the nearshore ocean, and the Channel Islands.
The full-day Ormond Beach field trip is the cornerstone of the project. Students learn about the history of the area, they participate in water quality monitoring, plant identification, and/or restoration activities (e.g., native plant planting, seed balls, non-native plant removal), bird watching, and recently, sand crab monitoring. Beach or wetland cleanup activities are usually included in the field trip so students are involved in improving the area. After completing the field trip, students participate in an essay contest. They creatively demonstrate their knowledge of wetlands, watersheds, and Ormond Beach. Several essay contest winners from each class are invited to participate in a weekend, daylong field trip to the Channel Islands, if possible, aboard the National Marine Sanctuary research vessel Shearwater.
Since RESTOR aims to impact community awareness, the program has included collaboration with a diverse array of groups and individuals from the surrounding community. A tiered-mentoring approach involves older students and local youth as informal mentors to RESTOR students. Oxnard City Corps is a community service learning organization that provides project-based work experience for local youth. They assist with RESTOR field trip activities and, in some years, participate in teacher workshops. These older youth come from similar neighborhoods and backgrounds as RESTOR students and act as role models to the younger students. Undergraduate students from the nearby California State University Channel Islands (CSUCI) have performed research projects in collaboration with RESTOR. The university students share their work with RESTOR teachers and students during field trips. A variety of university professors and researchers from both CSUCI and the University of California have presented relevant science and cultural history at teacher workshops and guided field walks on the beach and in the wetland. Workshop presentations have been provided by the California Coastal Commission, Ventura County office of Education, and the National Parks Service. Channel Islands National Marine Sanctuary staff acted as naturalist guides for Channel Islands field trips. Non-profit organizations have played an important role in the project. Keeper Alliance partners from Santa Barbara and Ventura lead water quality data collection and education for teachers and students. A cast of dedicated local community members and organizations have volunteered their time, making important contributions to RESTOR, including the Ormond Pointe Native Plant Nursery, an outdoor classroom used by RESTOR for native plant restoration activities; Ventura County Shorebirds led students in bird watching and developed a video about local bird species; and Walter Fuller, the unofficial steward of Ormond Beach, welcomes students and provides information about endangered nesting birds.
Accomplishments of the program include serving over 3,000 students to date. Pre- and post-tests reveal increased student understanding of the concept of a watershed, interest in the Ormond Beach restoration and/or other local ecosystem

4
Volume 29 • No. 3 • Fall 2015
projects, and, for some, improved environmental stewardship. RESTOR teachers from science and non-science backgrounds learn about water quality monitoring and share their experiences back in their classrooms with their students. Most indicated they would visit Ormond Beach again and continue to incorporate Ormond Beach in their teaching after their participation in RESTOR concluded. Several participants have acquired their own funding or have worked with students to write grants to expand the work at Ormond Beach or on other related projects.
The Jewel of Oxnard: The People, The Vision, The Work In Progress
Fittingly, the first champions of Ormond Beach were two schoolteachers: Jean Harris and Roma Armbrust. As early as the 197Os, Jean recognized Ormond Beach as the ‘Jewel of Oxnard’ and advocated to stop its destruction which eventually led to restoring the area. In 2002, the first parcel of land was purchased for restoration by the California Coastal Conservancy. Roma passed away the following year, but Jean lived to see over 500 acres purchased and a strong core team of advocates and technical professionals preserve the land. RESTOR carries on this legacy through educating others and encouraging an appreciation for Ormond Beach through environmental awareness and action.
Current State and Future Goals
The promise of the largest coastal wetland restoration in southern California is on the horizon, but still a long way off. A variety of potential restoration designs exist for the wetland, developed by environmental consultants and a scientific advisory panel. The ideal scenario involves connecting approximately 900 acres at Ormond Beach with the 1,500 acres at the neighboring Mugu Lagoon (Naval Base, Ventura County) property to form an impressive wetland complex, which would be the largest such system in southern California. For now restoration efforts are awaiting acquisition of critical land parcels currently used for agriculture. Landowners are requiring a higher price than offered by the California Coastal Commission.
The prospect of the restored wetland continues to fuel excitement. There is a vision for social as well as ecological renewal. If the restoration gains community support, there will be public access and a visitor’s center, complete with educational resources. The local community will have a large, easily accessible coastal reserve. The restored ecosystem also plays a role in providing resilience to climate change. Dunes buffer against rising seas, and the extensive natural beach-dune-wetland complex provides the opportunity for ecosystems to migrate inland as sea level rises. (Even today, when large storms and high tides coincide, the agricultural fields that are targeted for restoration are inundated with seawater.) Ecosystems and people both benefit with improved resilience from the restoration.
MONIQUE R. MYERS is a California Sea Grant Specialist at the University of California, Santa Barbara. Her work includes applied research on coastal ecosystems, outreach education, and collaboration with a diverse array of community members. She is passionate about involving coastal communities in conservation of the natural world.
Figure 3. Teachers, students, parents, and community members remove non-native species during a RESTOR project community event. Courtesy of Monique R. Myers
Figure 4. A sign left in the sand by RESTOR project students during an Ormond Beach field trip. Courtesy of Monique R. Myers

5
Volume 29 • No. 3 • Fall 2015
Activity: Litter isn’t Glitter: Beaches Should Be CleanBY KELSEY R. CRAMER, MICHELE B. SHERMAN, AND MARY CARLA CURRAN
ABSTRACT
Activities designed around an issue of global concern, such as marine debris, increase ocean literacy of students. Furthermore, hands-on activities that are created to support learning allow students to retain information and apply the lessons to their everyday life better than classroom lectures alone. In “Litter isn’t Glitter: Beaches Should Be Clean,” middle school students learn about marine debris and its harmful effects on marine organisms. Students then analyze data collected by scientists during litter surveys on a beach in Georgia. This activity addresses the Next Generation Science Standard of applying scientific principles for monitoring and minimizing human impacts on the environment.
Keywords: beach, marine debris, litter, transects, quadrats, NGSS
INTRODUCTION
Classroom lectures that are paired with hands-on activities are a more effective method of learning than textbook studying alone (Oliveira et al. 2013). In this activity, middle school students in sixth grade learn how litter becomes marine debris and the harmful effects that it has on marine organisms. They complete an exercise to learn how scientists assess litter on beaches using quadrats and transect lines. Transects are straight lines along which systematic observations or measurements are made. They are a good tool for determining linear trends along an environmental gradient, such as seashore, and are commonly used to study litter on sandy beaches (Ivar do Sul and Costa 2007). Quadrats are small plots used to isolate a standard unit of area from which the distribution of an object over a larger area can be estimated. They are used when an area is too large to sample entirely. Quadrats have been used successfully in K-12 activities to assess the health of coastal areas (Curran and Fogleman 2007).
Once students have learned about marine debris and how litter is assessed, they are given actual data collected by scientists who conducted litter surveys on a beach in coastal Georgia. They are asked to analyze the data in the same way as a scientist. Students are actively involved by collecting and analyzing data. The direct involvement of students in scientific practices promotes the ability of students to develop suitable ideas for a solution by applying general knowledge to a specific topic in a constructive way. Examples of other
K-12 activities designed to facilitate student engagement in scientific practices while focusing on coastal issues can be found in Aultman et al. (2010) and Siler and Curran (2011).
BACKGROUND: LITTER AND MARINE DEBRIS
When trash is not recycled or disposed of properly, it becomes litter. This in turn becomes marine debris when it is carried into the oceans and waterways via wind, rain, and snowmelt (Sheavly and Register 2007). Litter can also be introduced directly into the marine environment from boats, jet skis, commercial fishing and shipping vessels, recreational boats, and other watercraft (Sheavly and Register 2007). Qualifying the origins of marine debris as land- or water-based is difficult because it can travel long distances before washing up on shorelines, or settling on the bottom of oceans or riverbeds (Sheavly 2007). A national five-year study was conducted as part of the National Marine Debris Monitoring Program between 2001 and 2006, and it was determined that 49% of marine debris was from land-based sources, followed by 18% from ocean-based sources, and 33% from general sources— meaning it could not be classified as land—or water based (Sheavly 2007).
Marine debris can have several negative effects on marine organisms. Animals can become entangled in marine debris and die from strangulation, suffocation, or drowning (Sheavly and Register 2007). Entanglement in debris can also result in the inability of animals to eat or move freely (Sheavly and Register 2007). In addition, the ingestion of debris is very harmful to marine organisms and it happens frequently as a result of it being mistaken for food (Sheavly and Register 2007). Ingested debris often becomes stuck in either the throat or digestive tract of animals, which prevents them from being able to eat and eventually leads to starvation (Sheavly and Register 2007). In addition, animals that ingest marine debris can die as a result of toxicity from contaminants (EPA 2012) that are in and/or have accumulated on plastics.
Due to the deleterious effects of marine debris, the Ocean Conservancy hosts the International Coastal Cleanup each year in efforts to remove litter from beaches (Ocean Conservancy 2015). During the 2015 cleanup alone, more than 16 million pounds of litter were collected along 13,360 miles of coastline. The most abundant item was cigarette butts, with 2,248,065 collected. Food wrappers (1,376,133), plastic beverage bottles (988,965), plastic bottle caps (811,871), and plastic bags
6
Volume 29 • No. 3 • Fall 2015
(489,968) were also among the top 10 items collected (Ocean Conservancy 2015).
In addition to the efforts of the Ocean Conservancy, several studies were conducted to assess the amount and types of litter on beaches. Taffs and Cullen (2005) conducted a litter survey on five beaches in Australia and found that plastic was the most abundant type of litter collected (72-86%), with the majority consisting of soft drink and water bottle lids. Cigarette butts were the second most abundant category of litter (1-11%), and they were found in the highest densities on beaches with the highest public usage (Taffs and Cullen 2005). In addition to plastics and cigarette butts, other common types of litter found are glass, paper, cloth, rubber, metal, and wood (NOAA 2015).
The presence of litter on beaches is of great concern, as it can be washed or blown into the ocean and become marine debris. However, there are economic consequences as well. Litter on beaches can deter users from visiting, which could adversely affect the economy of towns that rely on tourism (Ballance et al. 2000). In a study conducted in Cape Peninsula, South Africa, tourists frequently rated cleanliness as the most important factor when choosing a beach, and 85% of tourists and residents reported that they would not visit a beach with more than four pieces of litter per m2 (Ballance et al. 2000). In addition, residents said that they would travel at least 31 miles to visit a beach that was clean, despite having a beach within a closer proximity (Ballance et al. 2000).
In “Litter isn’t Glitter: Beaches Should Be Clean,” students analyze data collected by a scientist during a litter survey conducted on a beach in coastal Georgia between May-August 2013. The study was conducted as part of an internship that was funded by the National Science Foundation (NSF) Opportunities for Enhancing Diversity in Geosciences (OEDG). A total of 12 surveys were conducted, within two hours of low tide, to compare the amount of litter before a weekend to after a weekend. Six surveys were conducted on Fridays and six on the subsequent Mondays. The area in which surveys were conducted was chosen as it seemed to receive more visitors than any other area along the ~7 km long beach. We found no significant difference between the two days so the data were combined. We also surveyed a less busy area and found a significant difference between the two locations. The area with more beach goers had more litter.
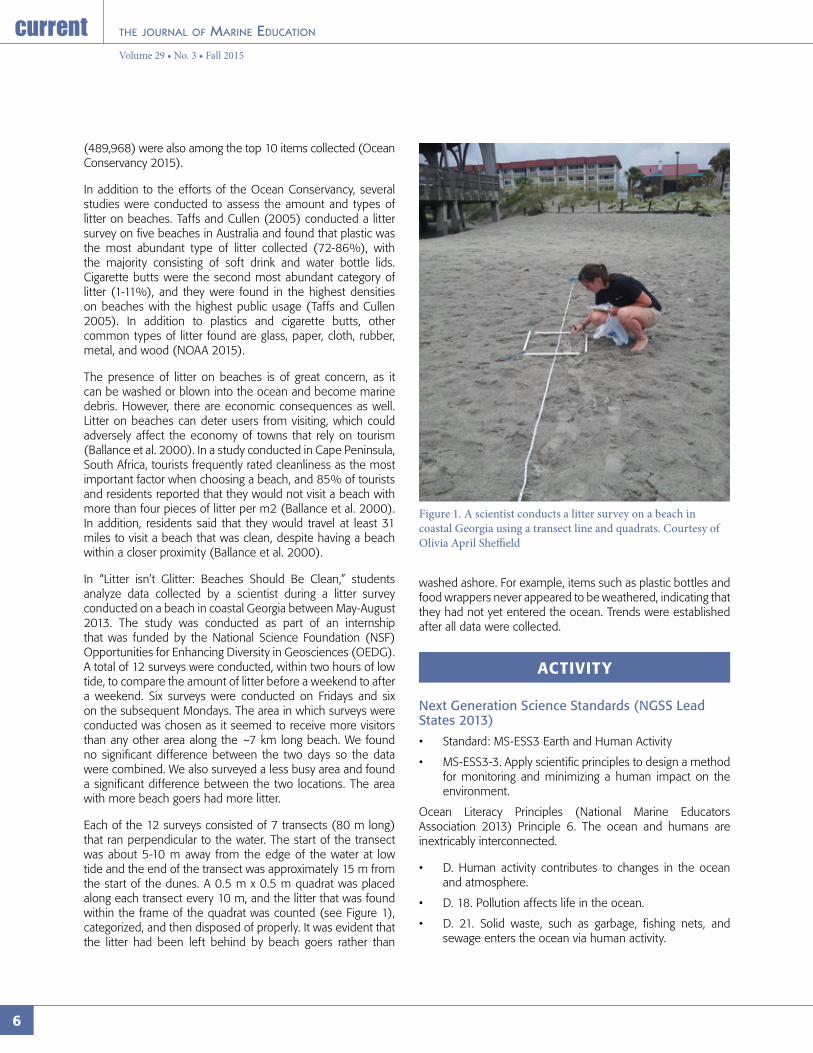
Each of the 12 surveys consisted of 7 transects (80 m long) that ran perpendicular to the water. The start of the transect was about 5-10 m away from the edge of the water at low tide and the end of the transect was approximately 15 m from the start of the dunes. A 0.5 m x 0.5 m quadrat was placed along each transect every 10 m, and the litter that was found within the frame of the quadrat was counted (see Figure 1), categorized, and then disposed of properly. It was evident that the litter had been left behind by beach goers rather than
washed ashore. For example, items such as plastic bottles and food wrappers never appeared to be weathered, indicating that they had not yet entered the ocean. Trends were established after all data were collected.
Figure 1. A scientist conducts a litter survey on a beach in coastal Georgia using a transect line and quadrats. Courtesy of Olivia April Sheffield
ACTIVITY
Next Generation Science Standards (NGSS Lead States 2013)
• Standard: MS-ESS3 Earth and Human Activity
• MS-ESS3-3. Apply scientific principles to design a method for monitoring and minimizing a human impact on the environment.
Ocean Literacy Principles (National Marine Educators Association 2013) Principle 6. The ocean and humans are inextricably interconnected.
• D. Human activity contributes to changes in the ocean and atmosphere.
• D. 18. Pollution affects life in the ocean.
• D. 21. Solid waste, such as garbage, fishing nets, and sewage enters the ocean via human activity.

7
Volume 29 • No. 3 • Fall 2015
SAFETY
The square quadrats should only be used to place along the transect; playing with the quadrats could result in tripping or other injuries. The tape measure could be a tripping hazard if it is not flat against the floor or ground.
MATERIALS
• Metric tape measure (1 per group)
• Ruler or piece of yarn/string (1 per group)
• Fake litter that represents 3 different categories: plastic, paper, and cigarette butts (See “Material Preparation” below for suggestions)
• Small bag to hold fake litter (1 per group)
• One 0.5 m x 0.5 m square quadrat per group (See “Material Preparation” below for assembly instructions)
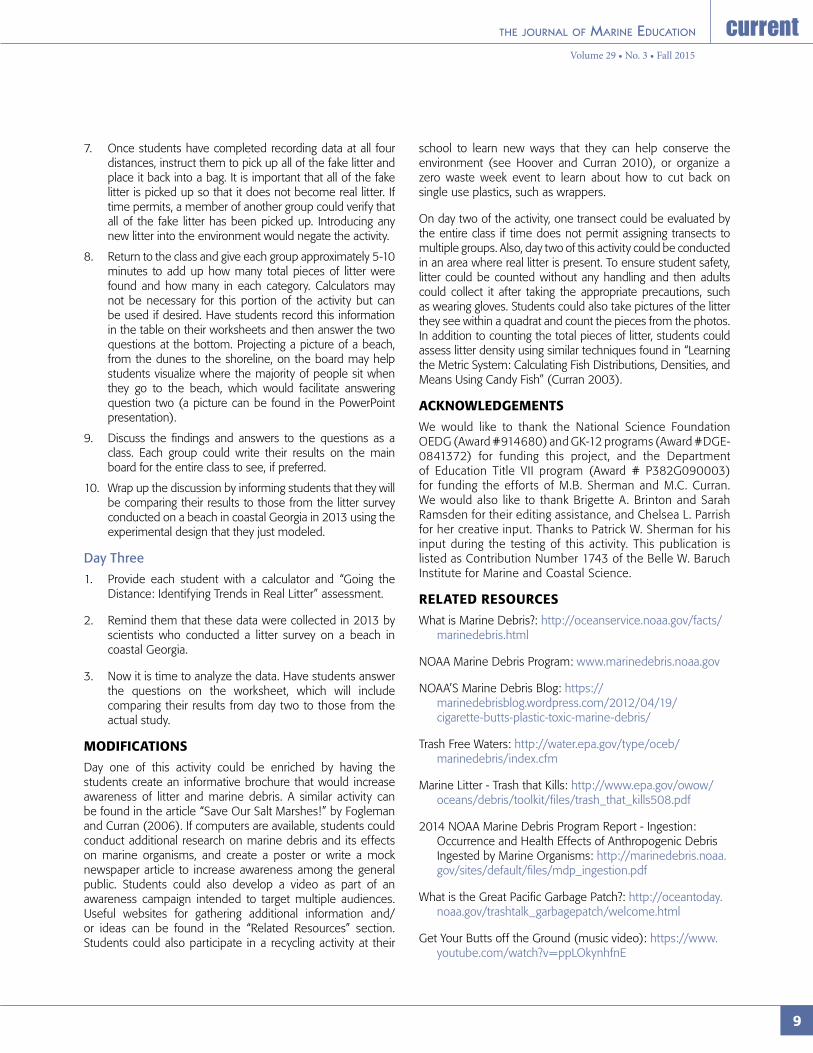
• “What do You See?” assessment (1 per student; see page 10)
• Clipboard for data sheet (1 per student; optional)
• Pencil (1 per student + 1 per group)
• “Going the Distance: Identifying Trends in Real Litter” assessment (1 per student; see pages 11-12)
• Calculator (1 per student)
MATERIAL PREPARATION
Quadrats
Each group of students will need a 0.5 m x 0.5 m quadrat (see Figure 2), which can be constructed using thin wooden rods, sticks, narrow pieces of cardboard, or other long, rigid, thin materials. Measure four pieces of the chosen material out to at least 0.6 m long so that a 0.5 m x 0.5 m square can be created when the pieces are attached together. Attach the pieces using glue, tape, or other appropriate materials. PVC
Activity Objectives Science and Engineering Practices Disciplinary Core Ideas Crosscutting Concepts
Model a scientific method used to assess litter on beaches Analyze data collected during a litter survey on a beach in coastal Georgia and identify trends
Compare results obtained while modeling a scientific method to those collected during an actual study conducted by a scientist
Applying and Interpreting Data
Analyze and interpret data to determine similarities and differ-ences in findings (MS-ESS3-2)
ESS3.C: Human Impacts on Earth Systems
Human activities have significantly altered the biosphere, sometimes damaging or destroying natural habitats and causing the extinc-tion of other species. But changes to Earth’s environments can have different impacts (negative and positive) for different living things (MS-ESS3-3)
Cause and Effect
Relationships can be classified as causal or correlational, and correla-tion does not necessarily imply causation (MS-ESS3-3)
pipes and elbows or meter sticks can also be used to make quadrats, though a hacksaw is required.
Fake Litter
Day two of this activity was designed as a hands-on supplement using fake litter so that the safety of students was not compromised. However, if appropriate precautions are taken, students could conduct this portion of the activity using real litter if the teacher prefers (see “Modifications” on page 9).
Each group of students will need a bag containing items that represent the three different litter categories (plastic, paper, and cigarette butts). Some items that can be used to represent
Figure 2. A (0.5 m x 0.5 m) quadrat constructed using PVC pipes and elbows. Courtesy of Michele B. Sherman
8
Volume 29 • No. 3 • Fall 2015
the different litter categories are buttons for plastic (20 pieces per group), paper clips for paper (10 pieces per group), and pencil eraser caps for cigarette butts (25 pieces per group).
CONDUCTING THE ACTIVITY
Day One
1. Share the PowerPoint presentation, “Litter isn’t Glitter: Beaches Should Be Clean” about litter and marine debris with students, accessible at: http://savannahstate.edu/docs/litter-isnt-glitter.pptx. The information provided in the “Background: Litter and Marine Debris” on pages 5-6 of this activity can be shared verbally with the students or in print as handouts in lieu of presenting the PowerPoint, if desired.
2. Show the pictures at the end of the presentation of a scientist using transect lines and quadrats to conduct a litter survey on a beach in coastal Georgia, and inform the students that they will be modeling that sampling method on day two of the activity.
Day Two
1. Remind students of the pictures they saw of a scientist conducting a litter survey on a beach in coastal Georgia at the end of the PowerPoint presentation on day one. Explain to them that they will now be modeling that experimental design using transect lines, quadrats, and fake litter.
2. Place students into groups of 2-5. Provide each group with a tape measure, ruler or piece of yarn/string, bag of fake litter, a quadrat, and the “What Do You See” assessment. Each group will be responsible for collecting data for 1 transect line. The number of transects is based on how many groups are assigned (ex., 5 groups = 5 transects). Refer to the “Modifications” on page 9 if time does not permit doing several transects.
3. Bring students to an area with minimal obstructions, and to a location that is at least 8 m (26.2 ft.) in length and wide enough for each group to place a transect line 2 m away from each other and the walls. This activity generally works best in a gymnasium or an outside area, but it can be conducted anywhere with enough space to lay transect lines based on the specifications provided above.
4. Instruct students to measure a 6 m transect using their tape measures. Have each group place a ruler or piece of string/yarn at the 0 m mark. This mark will represent the edge of the water. Ask the students to place a pencil at the 6 m mark.
5. Before having students place the fake litter, inform them that no litter should be placed in the first 2 m of the transect nearest the waterline. Next, have one person in each group stand at the 2 m mark and walk away from the edge of the water while scattering one-third of the fake litter between there and 4 m. Instruct another student to
scatter the remaining two-thirds of the fake litter between 4-6 m. Setting the fake litter up in this manner, as opposed to allowing students to scatter the litter anywhere they desire, will model the trends presented in the real data that students will analyze on day three, but it is not abso-lutely necessary as the main point of the exercise is for students to learn how transects and quadrats are used to conduct litter surveys.
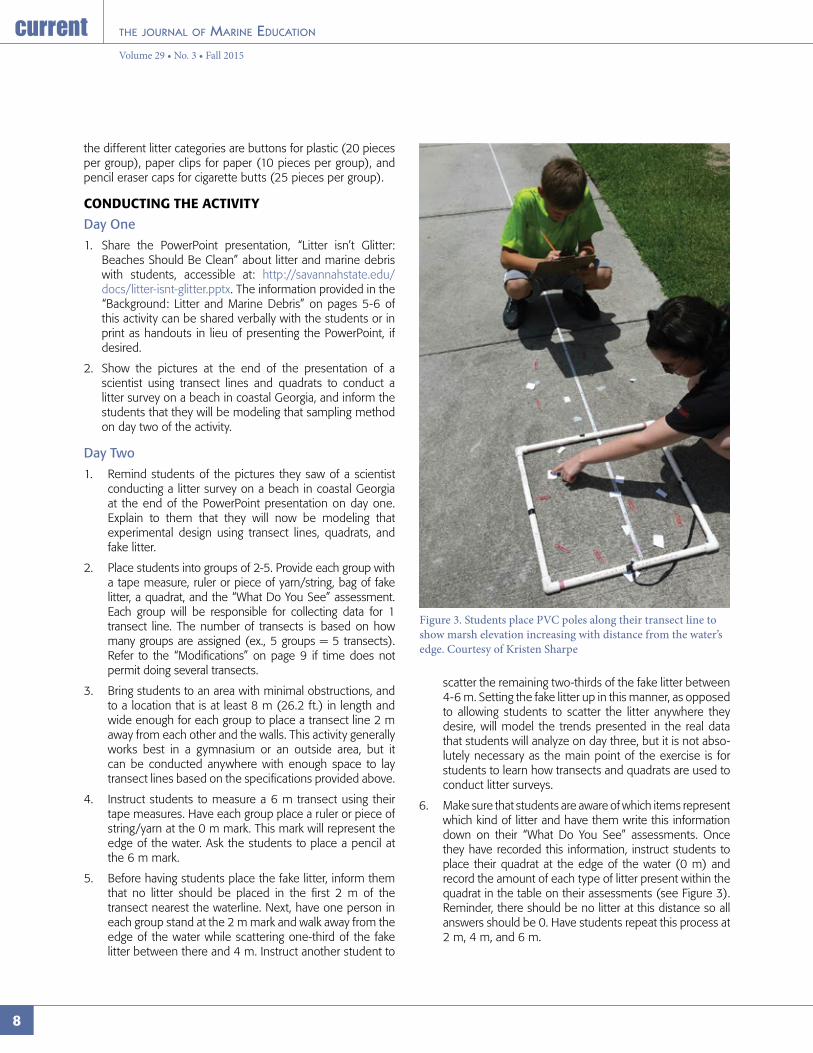
6. Make sure that students are aware of which items represent which kind of litter and have them write this information down on their “What Do You See” assessments. Once they have recorded this information, instruct students to place their quadrat at the edge of the water (0 m) and record the amount of each type of litter present within the quadrat in the table on their assessments (see Figure 3). Reminder, there should be no litter at this distance so all answers should be 0. Have students repeat this process at 2 m, 4 m, and 6 m.
Figure 3. Students place PVC poles along their transect line to show marsh elevation increasing with distance from the water’s edge. Courtesy of Kristen Sharpe
9
Volume 29 • No. 3 • Fall 2015
7. Once students have completed recording data at all four distances, instruct them to pick up all of the fake litter and place it back into a bag. It is important that all of the fake litter is picked up so that it does not become real litter. If time permits, a member of another group could verify that all of the fake litter has been picked up. Introducing any new litter into the environment would negate the activity.
8. Return to the class and give each group approximately 5-10 minutes to add up how many total pieces of litter were found and how many in each category. Calculators may not be necessary for this portion of the activity but can be used if desired. Have students record this information in the table on their worksheets and then answer the two questions at the bottom. Projecting a picture of a beach, from the dunes to the shoreline, on the board may help students visualize where the majority of people sit when they go to the beach, which would facilitate answering question two (a picture can be found in the PowerPoint presentation).
9. Discuss the findings and answers to the questions as a class. Each group could write their results on the main board for the entire class to see, if preferred.
10. Wrap up the discussion by informing students that they will be comparing their results to those from the litter survey conducted on a beach in coastal Georgia in 2013 using the experimental design that they just modeled.
Day Three
1. Provide each student with a calculator and “Going the Distance: Identifying Trends in Real Litter” assessment.
2. Remind them that these data were collected in 2013 by scientists who conducted a litter survey on a beach in coastal Georgia.
3. Now it is time to analyze the data. Have students answer the questions on the worksheet, which will include comparing their results from day two to those from the actual study.
MODIFICATIONS
Day one of this activity could be enriched by having the students create an informative brochure that would increase awareness of litter and marine debris. A similar activity can be found in the article “Save Our Salt Marshes!” by Fogleman and Curran (2006). If computers are available, students could conduct additional research on marine debris and its effects on marine organisms, and create a poster or write a mock newspaper article to increase awareness among the general public. Students could also develop a video as part of an awareness campaign intended to target multiple audiences. Useful websites for gathering additional information and/or ideas can be found in the “Related Resources” section. Students could also participate in a recycling activity at their
school to learn new ways that they can help conserve the environment (see Hoover and Curran 2010), or organize a zero waste week event to learn about how to cut back on single use plastics, such as wrappers.
On day two of the activity, one transect could be evaluated by the entire class if time does not permit assigning transects to multiple groups. Also, day two of this activity could be conducted in an area where real litter is present. To ensure student safety, litter could be counted without any handling and then adults could collect it after taking the appropriate precautions, such as wearing gloves. Students could also take pictures of the litter they see within a quadrat and count the pieces from the photos. In addition to counting the total pieces of litter, students could assess litter density using similar techniques found in “Learning the Metric System: Calculating Fish Distributions, Densities, and Means Using Candy Fish” (Curran 2003).
ACKNOWLEDGEMENTS
We would like to thank the National Science Foundation OEDG (Award #914680) and GK-12 programs (Award #DGE-0841372) for funding this project, and the Department of Education Title VII program (Award # P382G090003) for funding the efforts of M.B. Sherman and M.C. Curran. We would also like to thank Brigette A. Brinton and Sarah Ramsden for their editing assistance, and Chelsea L. Parrish for her creative input. Thanks to Patrick W. Sherman for his input during the testing of this activity. This publication is listed as Contribution Number 1743 of the Belle W. Baruch Institute for Marine and Coastal Science.
RELATED RESOURCES
What is Marine Debris?: http://oceanservice.noaa.gov/facts/marinedebris.html
NOAA Marine Debris Program: www.marinedebris.noaa.gov
NOAA’S Marine Debris Blog: https://marinedebrisblog.wordpress.com/2012/04/19/cigarette-butts-plastic-toxic-marine-debris/
Trash Free Waters: http://water.epa.gov/type/oceb/marinedebris/index.cfm
Marine Litter - Trash that Kills: http://www.epa.gov/owow/oceans/debris/toolkit/files/trash_that_kills508.pdf
2014 NOAA Marine Debris Program Report - Ingestion: Occurrence and Health Effects of Anthropogenic Debris Ingested by Marine Organisms: http://marinedebris.noaa.gov/sites/default/files/mdp_ingestion.pdf
What is the Great Pacific Garbage Patch?: http://oceantoday.noaa.gov/trashtalk_garbagepatch/welcome.html
Get Your Butts off the Ground (music video): https://www.youtube.com/watch?v=ppLOkynhfnE
10
Volume 29 • No. 3 • Fall 2015
Group Members:
Plastic is represented by:
Paper is represented by:
Cigarette butts are represented by:
1. Which category of litter (plastic, paper, or cigarette butts) contributed most to all of the litter collected?
2. At what distance from the edge of the water did you find the most litter? Why do you think that is? Think about where people sit when they go to the beach, and what happens to litter near/at the water’s edge where waves continually hit the shore.
WHAT DO YOU SEE? ASSESSMENT
Distance from edge of the water (m)
A Plastic
B Paper
C Cigarette butts
D Sum
0 Sum of 3 categories at 0 m
2 Sum of 3 categories at 2 m
4 Sum of 3 categories at 4 m
6 Sum of 3 categories at 6 m
Sum Sum of A Sum of B Sum of C Sum of D
11
Volume 29 • No. 3 • Fall 2015
Name:
Use the table below to answer questions 1 and 4.
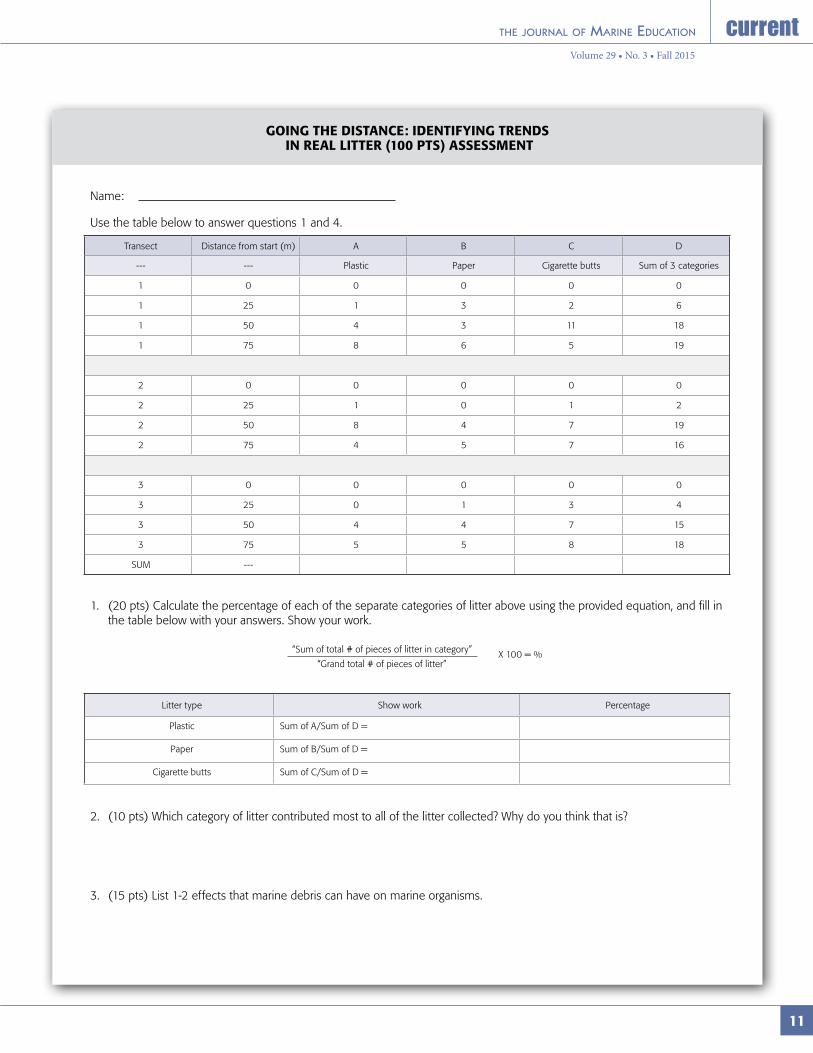
1. (20 pts) Calculate the percentage of each of the separate categories of litter above using the provided equation, and fill in the table below with your answers. Show your work.
2. (10 pts) Which category of litter contributed most to all of the litter collected? Why do you think that is?
3. (15 pts) List 1-2 effects that marine debris can have on marine organisms.
GOING THE DISTANCE: IDENTIFYING TRENDS IN REAL LITTER (100 PTS) ASSESSMENT
Transect Distance from start (m) A B C D
--- --- Plastic Paper Cigarette butts Sum of 3 categories
1 0 0 0 0 0
1 25 1 3 2 6
1 50 4 3 11 18
1 75 8 6 5 19
2 0 0 0 0 0
2 25 1 0 1 2
2 50 8 4 7 19
2 75 4 5 7 16
3 0 0 0 0 0
3 25 0 1 3 4
3 50 4 4 7 15
3 75 5 5 8 18
SUM ---
“Sum of total # of pieces of litter in category” “Grand total # of pieces of litter”
X 100 = %
Litter type Show work Percentage
Plastic Sum of A/Sum of D =
Paper Sum of B/Sum of D =
Cigarette butts Sum of C/Sum of D =

12
Volume 29 • No. 3 • Fall 2015
CONT. GOING THE DISTANCE: IDENTIFYING TRENDS IN REAL LITTER (100 PTS) ASSESSMENT
4. (20 pts) Calculate the mean number of pieces of litter per m2 for each distance using the equation below. The area of each 0.5 m x 0.5 m quadrat was only 0.25 m2, so you need to convert the total number of pieces per 0.25 m2 to pieces per 1 m2 by multiplying the number of pieces in each transect x 4. Show your work and write your answers in the table provided. The first one was completed for you. (Sum of total # of pieces of litter) X 4
# of transects= pieces
m2
Distance from start (m) Show work Average pieces per m2
0 0/m2
25
50
75
0 + 0 + 0) x 4 3
= 0
5. (10 pts) At which distance was the most litter found? Least? Why do you think that is? Remember: 0 m is the closest to the edge of the water and 75 m is the farthest from the water.
6. (5 pts) Were there any trends with distance or categories in the real data set that are the same as those you found when counting the fake litter? Explain.
7. (20 pts) Now that you have had a chance to think about the trends in the data provided, come up with a creative idea that might help minimize the litter found on beaches.

13
Volume 29 • No. 3 • Fall 2015
ANSWER KEY: GOING THE DISTANCE: IDENTIFYING TRENDS IN REAL LITTER (100 PTS)
1. (20 pts) Calculate the percentage of each of the separate categories of litter above using the provided equation and fill in the table below with your answers. Show your work. Sum of total # of pieces of litter in category
Grand total # of pieces of litter X 100 = %
Litter type Show work: Percentage
Plastic Sum of A/Sum of D = 35/117 = 0.299 x 100 = 29.9 29.9%
Paper Sum of B/Sum of D = 31/117 = 0.265 x 100 = 26.5 26.5%
Cigarette butts Sum of C/Sum of D = 51/117 = 0.436 x 100 = 43.6 43.6%
2. (10 pts) Which category of litter contributed most to all of the litter collected? Cigarette butts Why do you think that is? People may: 1) Smoke multiple cigarettes but only eat 1 snack or drink or 1 beverage at the beach; 2) Have the miscon-ception that cigarette butts are biodegradable and less harmful for the environment than plastic. In fact, cigarette butts are actually made of plastic, do not biodegrade, and can persist in the environment for a long time.
3. (15 pts) List 1-2 effects that marine debris can have on marine organisms.
Possible answers: Organisms could become entangled in it and die from strangulation, suffocation, or drowning. Entangled animals could also be unable to eat or move freely. Ingested debris could become stuck in the throat or digestive tract of the animals, preventing them from eating and eventually causing them to starve to death. Ingestion of marine debris could also cause animals to die as a result of toxicity from contaminants.
Use the table below to answer questions 1 and 4.
Transect Distance from start (m) A B C D
--- --- Plastic Paper Cigarette butts Sum of 3 categories
1 0 0 0 0 0
1 25 1 3 2 6
1 50 4 3 11 18
1 75 8 6 5 19
2 0 0 0 0 0
2 25 1 0 1 2
2 50 8 4 7 19
2 75 4 5 7 16
3 0 0 0 0 0
3 25 0 1 3 4
3 50 4 4 7 15
3 75 5 5 8 18
SUM ---
14
Volume 29 • No. 3 • Fall 2015
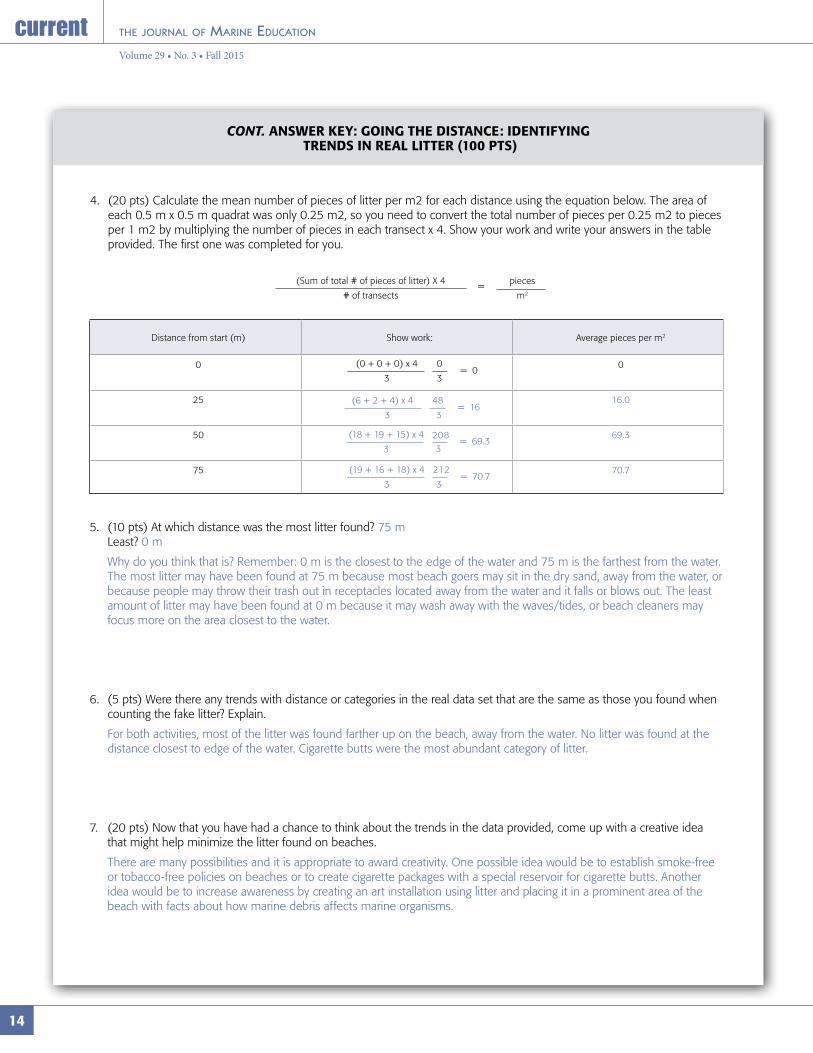
CONT. ANSWER KEY: GOING THE DISTANCE: IDENTIFYING TRENDS IN REAL LITTER (100 PTS)
4. (20 pts) Calculate the mean number of pieces of litter per m2 for each distance using the equation below. The area of each 0.5 m x 0.5 m quadrat was only 0.25 m2, so you need to convert the total number of pieces per 0.25 m2 to pieces per 1 m2 by multiplying the number of pieces in each transect x 4. Show your work and write your answers in the table provided. The first one was completed for you.
(Sum of total # of pieces of litter) X 4 # of transects
= pieces m2
Distance from start (m) Show work: Average pieces per m2
0 0
25 16.0
50 69.3
75 70.7
(0 + 0 + 0) x 4 3
0 3
= 0
(6 + 2 + 4) x 4 48 3 3
= 16
(18 + 19 + 15) x 4 3
= 69.3 208 3
(19 + 16 + 18) x 4 3
212 3
= 70.7
5. (10 pts) At which distance was the most litter found? 75 m Least? 0 m
Why do you think that is? Remember: 0 m is the closest to the edge of the water and 75 m is the farthest from the water. The most litter may have been found at 75 m because most beach goers may sit in the dry sand, away from the water, or because people may throw their trash out in receptacles located away from the water and it falls or blows out. The least amount of litter may have been found at 0 m because it may wash away with the waves/tides, or beach cleaners may focus more on the area closest to the water.
6. (5 pts) Were there any trends with distance or categories in the real data set that are the same as those you found when counting the fake litter? Explain.
For both activities, most of the litter was found farther up on the beach, away from the water. No litter was found at the distance closest to edge of the water. Cigarette butts were the most abundant category of litter.
7. (20 pts) Now that you have had a chance to think about the trends in the data provided, come up with a creative idea that might help minimize the litter found on beaches.
There are many possibilities and it is appropriate to award creativity. One possible idea would be to establish smoke-free or tobacco-free policies on beaches or to create cigarette packages with a special reservoir for cigarette butts. Another idea would be to increase awareness by creating an art installation using litter and placing it in a prominent area of the beach with facts about how marine debris affects marine organisms.

15
Volume 29 • No. 3 • Fall 2015
REFERENCES
Aultman, T., M.C. Curran, and M. Partridge. (2010). Bringing scientific inquiry alive using real grass shrimp research. Science Scope, 33(7):54-60.
Ballance, A., P.G. Ryan, and J.K. Turpie. (2000). How much is a clean beach worth? The impact of litter on beach users in the Cape Peninsula, South Africa. South African Journal of Science, 96:210-213.
Corbin, C.J., and J.G. Singh. (1993). Marine debris contamination of beaches in St. Lucia and Dominica. Marine Pollution Bulletin, 26(6):325-328.
Curran, M.C. (2003). Learning the metric system: Calculating fish distributions, densities, and means using candy fish. Current: The Journal of Marine Education, 18(4):28-31.
Curran, M.C., and T. Fogleman. (2007). Unraveling the mystery of the marsh: Training students to be salt marsh scientists. Current: The Journal of Marine Education, 23(2):25-30.
EPA. 2012. Marine debris impacts. Available online at: http://water.epa.gov/type/oceb/marinedebris/md_impacts.cfm
Fogleman, T., and M.C. Curran. (2006). Save our salt marshes! Using educational brochures to increase student awareness of salt marsh ecology. Current: The Journal of Marine Education, 22(3):23-25.
Hoover, K.M., and M.C. Curran. (2010). It’s easy being green. Current: The Journal of Marine Education, 26(3):18-24.
Ivar do Sul, J.A., and M.F. Costa. (2007). Marine debris review for Latin America and the wider Caribbean region: From the 1970s until now, and where do we go from here? Marine Pollution Bulletin, 54:1087-1104.
National Marine Educators Association. (2013). Ocean literacy: The essential principles and fundamental concepts of ocean sciences for learners of all ages. 13 pp. Available online: at http://www.coexploration.org/oceanliteracy/documents/OceanLitChart.pdf
NGSS Lead States. (2013). Next Generation Science Standards: For States, By States. The National Academies Press: Washington, DC.
NOAA. (2015). Marine debris program: Types and sources. Available online at: http://marinedebris.noaa.gov/discover-issue/types-and-sources
Ocean Conservancy. (2015). International coastal cleanup: 2015 trash free seas report, by the numbers. Available online at: http://www.oceanconservancy.org/our-work/international-coastal-cleanup/2015-by-the-numbers.html
Oliveira, A.W., J. Angelis, and V. Amodeo. (2013). Best practice in middle school science. Journal of Science Teacher Education, 24:297-322.
Siler, A., and M.C. Curran. (2011). The learning cycle: Engaging children in the scientific method. Current: The Journal of Marine Education, 27(3):24-32.
Sheavly, S.B. (2007). National Marine Debris Monitoring Program: Final Program Report, Data Analysis and Summary. Prepared for U.S. Environmental Protection Agency by Ocean Conservancy, Grant Number X83053401-02. 76 pp.
Sheavly, S.B., and K.M. Register. (2007). Marine debris and plastics: Environmental concerns, sources, impacts, and solutions. Journal of Polymers and the Environment, 15:301-305.
Taffs, K.H., and M.C. Cullen. (2005). The distribution and abundance of marine debris on isolated beaches of northern New South Wales, Australia. Australian Journal of Environmental Management, 12(4):244-250.
KELSEY R. CRAMER obtained her bachelor’s of science degree in marine sciences from Savannah State University (SSU). Her areas of interest include marine debris and the effects that the debris has on different organisms.
MICHELE B. SHERMAN obtained her master’s of science degree in marine sciences from Savannah State University (SSU). She is currently a Marine Sciences Technician at SSU. Her areas of interest include parasite-host relationships and marine policy.
DR. MARY CARLA CURRAN is a Full Professor in the Marine Sciences Program at Savannah State University. She obtained her doctorate in biological oceanography from the Joint Program of the Woods Hole Oceanographic Institution and the Massachusetts Institute of Technology. Dr. Curran is passionate about outreach activities and encourages her students to remain interested in the sciences. Her areas of research include fish biology, parasite-host interactions, and estuarine ecology.
16
Volume 29 • No. 3 • Fall 2015
Reel in Students: Using Real World Learning Objects (RWLO) and Real-Time Data in Ocean ScienceBY JEFF THOMAS AND JILL M. RAISOR
ABSTRACT
Ocean environments are critically important in understanding Earth’s ecosystems. The biotic and abiotic factors associated with them have dramatic impacts on humans and provide the contexts for valuable student learning. However, for many educators, significant physical and temporal barriers exist to create learning opportunities to study ocean sciences while modeling the processes of science. To partially overcome these barriers, teachers can utilize the Internet to implement real world learning objects (RWLO) that use real-time (or near real-time) data and learning experiences. This article describes several appropriate RWLO Internet resources and activities that can be used with K-12 students. Possible connections to the Next Generation Science Standards (NGSS) and the National Common Core Standards (NCCS) for literacy and mathematics are highlighted.
Keywords: ocean, real world learning objects, real-time data, technology
INTRODUCTION AND BACKGROUND
Ocean environments play a vital role in our daily lives, yet there are challenges in incorporating that vitality into classrooms. Making real-time ocean study come alive for students is now possible through the advanced use of technology in classrooms. In the paragraphs below, activities focused on ocean exploration using real world events and real-time or near real-time data for K-12 students are described.
The National Science Teachers Association’s (NSTA) benchmark position statements on Elementary School Science and Science Education for Middle Level Students clearly state what science should look like in classrooms today. For example, “The elementary science program must provide opportunities for students to develop understandings and skills necessary to function productively as problem-solvers in a scientific and technological world” (National Science Teachers Association 2002). The statements also encourage the use of themes in relation to all disciplines of science, mathematics, communication, and interdisciplinary teaching. The NSTA’s Quality Science Education and 21st—Century Skills position statement calls for “a wide range of
technologies [that should] serve as tools to engage students with real world problem solving, conceptual development, and critical thinking” (National Science Teachers Association 2011). Activities that incorporate real world learning objects (RWLO) are ideal to accomplish the goals and outcomes from these position statements. RWLOs are problem-solving activities that incorporate real-time data (or near real-time data) provided by primary sources to explore phenomena while answering real life questions. An important element becomes apparent to students with such exercises. The answer is unknown at the beginning of the exercise, and they must determine an answer through their own analysis of the data that might be affected by any number of variables. Such complexities and “in the moment” teaching mirror the processes of science, model the best practices of science teaching, and are explicitly stated in the Next Generation Science Standards (NGSS) and the National Common Core Standards (NCCS).
THE IMPORTANCE OF THE OCEAN
Earth’s ocean is critically important to humans. Covering 70% of the Earth’s surface, the ocean possesses a nexus of important biological, chemical, and geophysical processes that impact life in the ocean and humans and other organisms on land. Important biogeochemical processes at the surface and within the deepest reaches of the ocean, including within the ocean subseafloor are plentiful. One example is the net uptake of carbon dioxide (CO2) at the sea surface interface as the ocean acts as a larger buffering agent to help regulate the planet’s carbon cycle. Another example is the growth of primary producers in the water column as they convert energy in the initial steps of many food chains. The sea surface heat exchange helps regulate physical phenomena such as global wind patterns, hurricane generation, and movement of heat as the planet’s mechanism to move and exchange warm and cool water across Earth’s surface and between its surface and depths. Lastly, coastal regions serve as vital economic, ecological, and recreational interests. Using 2011 U.S. Census data, the National Oceanic and Atmospheric Association (NOAA) determined that coastal counties comprise less than 10% of the continental total land area, yet 39% of the population lives in one of these counties (National Oceanic and

17
Volume 29 • No. 3 • Fall 2015
Atmospheric Association 2015). Because of its importance, beauty, and locked mysteries, the ocean provides a fascinating opportunity when learning about science, the environment, and society.
However, for many teachers there are significant temporal and spatial boundaries that exist with creating learning opportunities that focus upon the ocean. These challenges are exacerbated for the many schools that serve students away from coastlines. One alternative to these challenges is to incorporate RWLOs that employ real-time data with students. Access to real-time data is made possible by primary data source organizations and available through their websites. And, for teachers and students, RWLO exercises can be linked to current standards and assessment guidelines.
RWLOs Support the Next Generation Science Standards
The National Research Council of the National Academy of Sciences drafted A Framework for K-12 Science Education in 2010. It identifies the science all K-12 students should know. Three years later various entities used the Framework to create the NGSS. The Framework, and subsequent NGSS are built around 1.) scientific and engineering practices; 2.) crosscutting concepts; and 3.) four core subject domains (the physical sciences, the life sciences, the earth/space sciences, and the engineering, technology, and applications of science) to integrated learning (NGSS Lead States 2013). The following NGSS standards exemplify connections to ocean study by students.
• Elementary: 3-LS4-4. Make a claim about the merit of a solution to a problem caused when the environment changes, and the types of plants and animals that live there may change.
• Elementary: 5-ESS2-1. Develop a model using an example to describe ways the geosphere, biosphere, hydrosphere, and/or atmosphere interact.
• Middle School: MS-LS2-1. Analyze and interpret data to provide evidence for the effects of resource availability on organisms and populations of organisms in an ecosystem.
• Middle School: MS-ESS2-6. Develop and use a model to describe how unequal heating and rotation of the Earth cause patterns of atmospheric and oceanic circulation that determine regional climates.
• High School: HS-ESS2-2 Analyze geoscience data to make the claim that one change to Earth’s surface can create feedbacks that cause changes to other Earth systems.
RWLOs Linked to the National Common Core Standards
The NCCS provide generous opportunities to fuse student learning and the ocean sciences. Though there are no science standards included in the NCSS, there are multiple literacy and
mathematic standards that can be addressed that mirror part of the process needed to perform real world science utilized by RWLO investigations. Three examples include:
• Elementary: CCSS.ELA-Literacy.RI.4.7 Interpret informa-tion presented visually, orally, or quantitatively (e.g., in charts, graphs, diagrams, time lines, animations, or inter-active elements on web pages), and explain how the information contributes to an understanding of the text in which it appears.
• Middle School: CCSS.Math.Content.7.SP.A.1 Understand that statistics can be used to gain information about a population by examining a sample of the population; generalizations about a population from a sample are valid only if the sample is representative of that popula-tion. Understand that random sampling tends to produce representative samples and support valid inferences.
• High School: CCSS.ELA-Literacy.RST.9-10.1 Cite specific textual evidence to support analysis of science and technical texts, attending to the precise details of expla-nations or descriptions (National Governors Association Center for Best Practices and Council of Chief State School 2010).
RWLOs Promote Digital Literacy
When teachers use RWLOs, students develop their skills in digital literacy, often referred to as the New Literacies. The New Literacies expand the traditional ways in which students learn to comprehend text and information by incorporating learning in a digital environment. The NSTA expresses avid support of teachers incorporating the New Literacies through digital learning. Their position statement, The Role of E-Learning in Science Education, lists nine elements and six approaches to incorporate digital learning into students’ curricula (National Science Teachers Association 2008). These approaches to teaching provide students with vital skills in their abilities to access, interact, process, and form meaning from information and data. Therefore, RWLOs emphasize the skills and processes students need to become life-long critical thinkers.
Activities in Real World Learning Objects (RWLO) in the Ocean Sciences
While there are many sites on the Internet that provide resources, information, and activities related to studying the ocean, the following sites have developmentally appropriate activities for K-12 students that incorporate RWLOs into inquiry-based activities and real world exploration. The five sites identified here are chosen because they:
• are sponsored by a reputable source;
• contain content-centered data and material;
• provide helpful background and teaching ideas as well as resources for teachers; and
• have a history of being used in K-12 classrooms.

18
Volume 29 • No. 3 • Fall 2015
The first three sites (Center for Innovation in Engineering and Science Education [CIESE], Journey North, and Sea Turtle Conservancy) offer topic-specific lessons that teachers can easily download to use with students. Also, teaching guides are provided to help with this facilitation. The last two sites (The Global Learning and Observations to Benefit the Environment [GLOBE] Program and the National Data Buoy Center [NDBC]) are more data centered, where students and teachers use data while answering questions they have developed. The GLOBE site also offers teachers and students an opportunity to upload data from locally researched investigations for contribution to a worldwide database.
Figure 1. Two fourth grade students track gray whales as the whales migrate in the Pacific Ocean as the seasons change. Courtesy of Jeff Thomas and Jill M. Raisor
Table 1. List of suggested RWLO websites on ocean exploration.
Title Sponsoring Organization(s)Elementary
SchoolMiddle School
High School Lesson PlansSupplemental
Material
The Center for Innovation in Engineering and Science Education (CIESE)
Stevens Institute of Technology a a a a a
Journey North Annenberg Media a a a a a
Sea Turtle Conservancy
Sea Turtle Conservancy a a a a a
Global Learning and Observation to Benefit the Environment (GLOBE)
Interagency program between National Aeronautics and Space Administration (NASA), the National Oceanic and Atmospheric Administration (NOAA), and the National Science Foundation (NSF)
a a
a a a
National Data Buoy Center
National Oceanic and Atmospheric Administration (NOAA)
a a a a a

19
Volume 29 • No. 3 • Fall 2015
Center for Innovation in Engineering and Science Education (CIESE)
Program description: The Center for Innovation in Engineering and Science Education (CIESE) “sponsors and designs interdisciplinary projects that teachers throughout the world can use to enhance their curriculum through compelling use of the Internet. We focus on projects that utilize real-time data available from the Internet, and collaborative projects that utilize the Internet’s potential to reach peers and experts around the world” (Stevens Institute of Technology 2015). The following investigations related to oceans are found at CIESE’s website.
1. The Stowaway Adventure: Adventures on the High Seas – Students can use real-time data to track a ship currently at sea. Using this information, the students determine its destination and approximate arrival time. This learning experience offers a teacher’s guide, connection to national and local standards, and an example of an assessment.
2. Gulf Stream Voyage – In this learning experience students can use real-time data and primary sources to work with authentic, real world issues. Examples include using real-time data to determine the present location of the GSC, impact of the GSC on climate when comparing temperatures of different cities, using satellite imagery to determine the amount of primary productivity in the ocean, and using environmental data collected from ships to make decisions about fish migration and the impact on industry.
3. Tsunami Surge – Students can research what tsunamis are, differentiate them from other forms of waves, and use real-time data to determine where they are most likely to begin. Students can also learn how to prepare and protect against these potential natural disasters.
standards-based lesson plans, activities, and information help students make local observations and fit them into a global context” (Annenberg Learner 2015). The following investigations relate to ocean study and can be found at the Journey South website.
1. Gray Whales – Students can monitor whale-sighting data along a 10,000-mile migratory route that ranges from the Arctic Ocean to the west coast of Mexico. During the experience, students learn a method of sampling called, “point count” to gather data about the migration. Students make predictions and analyze data for a wide range of variables like population numbers, peak migration times, and migration patterns.
2. Whooping Cranes – Students take part in exploring the characteristics, life cycle, ecology, and conservation of whooping cranes. Whooping cranes were on the verge of extinction and are now being reintroduced. Students watch as this process occurs noting the successes and challenges involved in assisting an endangered species recover. The importance and diversity of wetlands is explored during their migration. Photos and videos are available.
Annenberg Learner’s Journey North
Program description: “Journey North engages students in a global study of wildlife migration and seasonal change. K-12 students share their own field observations with classmates across North America…migration maps, pictures,
Sea Turtle Conservancy’s Sea Turtle Tracking Project
Program description: “Through this website, you can view a regularly updated map showing the migratory movements of endangered sea turtles being tracked by satellite. It is hoped that by providing this unique look at the migratory habits of sea turtles, you will also be compelled to learn more about sea turtle biology, the threats they face, and the ways in which you can help protect marine turtles” (Sea Turtle Conservancy 2015). The following investigations related to oceans can be found at the conservancy’s website.
1. Students can “Track a Sea Turtle”, obtain “Sea Turtle Information”, and access numerous “Programs and Projects” when they adopt turtles to study, follow, and plot during their migrations. This site offers a search of previously tracked sea turtles and examples of data sets for plotting sea turtle migration.
20
Volume 29 • No. 3 • Fall 2015
Global Learning and Observations to Benefit the Environment (GLOBE)
Program description: “The Global Learning and Observations to Benefit the Environment (GLOBE) Program is an international science and education program that provides students and the public worldwide with the opportunity to participate in data collection and the scientific process, and contribute meaningfully to our understanding of the Earth system and global environment. GLOBE’s vision promotes and supports students, teachers, and scientists working together…” (National Aeronautics and Space Administration and National Science Foundation 2015).
GLOBE is one of the more complex resources described in this article, but offers a varied and interactive way to explore environmental issues with students across the world. To actively participate in GLOBE, a teacher must become certified through trainings at conferences and similar on-site trainings, or through an online e-teacher certification program. After completion, teachers work with their students to solve a local environmental question and contribute the data to the worldwide database. Teachers can also access other data found on the site for using with students to answer many types of questions about the ocean. The following investigations are related to oceans and can be conducted by utilizing data found at GLOBE’s website.
1. Students can investigate the temperature fluctuations between coastal and non-coastal regions to understand the heating capacities of soil and water, and the establishment of coastal breezes.
2. Students can determine the difference in average annual precipitation for coastal and non-coastal regions. Many teachers have access to local data about precipitation and can use this data for comparison to other parts of the country or world. This type of exercise can help students comprehend more about their location in the world and related ecosystems.
3. Students can compare air and soil temperatures in coastal regions, intercontinental regions, and open ocean regions to better understand the role of water’s mediating impact on temperature.
National Oceanic and Atmospheric Administration’s National Data Buoy Center
Program description: For teachers that are able to guide students in answering self-developed research questions, there is a rich source of real world data through the National Data Buoy Center (NDBC). The NDBC’s mission is to “provide comprehensive, reliable systems and marine observations to support the missions of the National Weather Service (NWS) and National Oceanic and Atmospheric Association (NOAA), promote public safety, and satisfy the future needs of our customers” (National Weather Service and National Oceanic and Atmospheric Administration 2015). To accomplish this, they maintain a worldwide buoy array where teachers and students can access data. The following investigations related to oceans can be conducted by utilizing data found at the center’s website.
1. Students can investigate wind patterns along coastlines around the world. Linking these wind patterns to ocean current movement would be an effective way to connect atmospheric and hydrospheric dynamics.
2. Students can analyze the change in barometric pressure, water temperature, and other weather conditions as active hurricanes move into and out of oceanic and coastal areas. Using this data to compare hurricanes and their impact upon societies and coastal ecosystems become a natural extension.
3. Students can compare the height of the water column in the Atlantic Ocean, Pacific Ocean, Indian Ocean, Arctic Ocean, and Antarctic Ocean to determine which is the deepest.
CONCLUSION
RWLOs that use real-time, or near real-time data are one of the many resources available to students. These real world science activities designed for K-12 students provide authentic opportunities to model the processes of science, while combining “our” synergistic relationship with the ocean, its impact on weather and climate, and its ecological importance for Earth.

21
Volume 29 • No. 3 • Fall 2015
REFERENCES
Annenberg Learner. (2015). About Journey North. Retrieved June 13, 2015 from http://www.learner.org/jnorth/about.html.
National Aeronautics and Space Administration & National Science Foundation. (2015). About GLOBE. Retrieved June 13, 2015 from http://www.globe.gov/about/overview.
National Governors Association Center for Best Practices & Council of Chief State School. (2010). Common core state standards. Washington, DC: National Governors Association Center for Best Practices and Council of Chief State School Officers. http://www.corestandards.org/ (accessed June 13, 2015).
National Oceanic and Atmospheric Administration. (2015). The U.S. population living at the coast. Retrieved June 13, 2015 from http://stateofthecoast.noaa.gov/population/welcome.html.
National Science Teachers Association. (2002). Elementary school science position statement. Arlington, VA: National Science Teachers Association. http://www.nsta.org/about/positions/elementary.aspx (accessed June 13, 2015).
National Science Teachers Association. (2008). The role of E-learning in science education. Arlington, VA: National Science Teachers Association. http://www.nsta.org/about/positions/e-learning.aspx (accessed June 13, 2015).
National Science Teachers Association. (2011). Quality science education and 21st—century skills position statement. Arlington, VA: National Science Teachers Association. http://www.nsta.org/about/positions/middlelevel.aspx (accessed June 13, 2015).
National Weather Service & National Oceanic and Atmospheric Administration. (2015). NDBC general information. Retrieved June 13, 2015 from http://www.ndbc.noaa.gov/ndbc.shtml#Mission.
NGSS lead states. (2013). Next generation science standards: For states, by states. Washington, DC: The National Academies Press.
Sea Turtle Conservancy. (2015). Tracking sea turtles. Retrieved June 13, 2015 from http://www.conserveturtles.org/seaturtletracking.php.
Stevens Institute of Technology. (2015). K-12 curricula. Retrieved June 13, 2015 from http://www.ciese.org/materials/k12/.
JEFF THOMAS is a Professor of Teacher Education at the University of Southern Indiana. His teaching and research interests are how to meaningfully integrate technology, engineering, and science in K-12 classrooms.
JILL M. RAISOR is an Assistant Professor at the University of Southern Indiana. Her teaching and research interests are in designing developmentally appropriate lessons around authentic learning and play in P-6 classrooms.
We invite you to join us and share your ideas, resources, expertise, and inspiration with like-minded professionals. We have exciting initiatives happening both locally and globally and would love to collaborate with you!
Every level of NMEA membership includes these benefits:
• Reduced registration fee for our annual conference
• Opportunity to apply for scholarships to attend the annual conference
• Subscription to Current: The Journal of Marine Education
• Access to the “Members Only” section of our website
• Discounts at aquariums and science centers around the country
• Opportunity to be nominated for member awards
• Develop leadership skills by serving on the Board of Directors
• Opportunity to join over 15 working committees within NMEA
Go to the NMEA website at www.marine-ed.org and click on the “Join Us” link to choose your membership category and start the sign-up process.
JOIN NMEA
22
Volume 29 • No. 3 • Fall 2015
Activity: Corals: The Essence of FluorescenceBY JAMIE M. CALDWELL, CARLIE WIENER, MARK HECKMAN, AND JUDITH D. LEMUS
ABSTRACT
Coral reefs are important ecosystems ecologically, culturally, and economically. Current research gives us new tools to understand how environmental stress impacts coral reef health. “Corals: The Essence of Fluorescence” activity was designed to engage students in grades five through eight in marine conservation through exercises based on coral disease research conducted at the Hawai‘i Institute of Marine Biology. Students will learn how scientists explore patterns in the natural fluorescence of coral to investigate coral health. This activity helps students practice science observation skills, teaches aspects of disease and coral ecology, introduces students to optical properties associated with color and fluorescence, and introduces students to authentic scientific approaches to solve real world problems. The topics introduced in this exercise foster discussion about coral reef ecosystem health and conservation. Coral reefs are some of the most unique and important ecosystems in the world. The lesson targets learners with multiple entry points over the course of approximately one to two class periods (35-75 minutes total).
ACTIVITY AT A GLANCE
Students learn to identify infected corals based on the color patterns revealed when ultraviolet light is shined on them, causing them to auto-fluoresce (show their natural fluorescent colors). In this activity, students will learn about optical properties of color (on land and in the ocean) and fluorescence. Students will then use fluorescence to differentiate between healthy and unhealthy corals, and use that information to draw conclusions about disease in the coral population. In the process, students gain an understanding of coral biology, scientific inquiry, and observations using visual stimuli. This activity is aligned with the Next Generation Middle School Science Standard MS-LS2-4: construct an argument supported by empirical evidence that changes to physical or biological components of an ecosystem affect populations.
KEY CONCEPTS
• Color results when a substance absorbs certain wave-lengths of light from the electromagnetic spectrum and reflects (or transmits) the remaining wavelength(s) of light. The reflected light is the color we see with our eyes.
• Auto- or natural fluorescence occurs when an organism absorbs one wavelength of light or radiation from the electromagnetic spectrum and then naturally reemits it at a slightly lower and longer wavelength.
• Many marine organisms naturally fluoresce, but typically at very low intensities or at wavelengths longer than what humans can perceive. Many marine animals are able to see these wavelengths without assistance; but humans must use special filters and lights to make it visible to us.
• In the ocean, different wavelengths of light are absorbed at different depths making some colors and wavelengths more available than others. Marine organisms interact with color and pattern in their environment to hide, mate, and find and/or avoid becoming food.
• Scientists are exploring differences in the patterns of coral natural fluorescence as a possible method for early disease detection.
• Scientific inquiry can be used to make predictions (hypotheses) about how and why infection could alter natural fluorescence patterns.
• Information can be extrapolated from a subset of a popu-lation (taken during a survey) to better understand the influence of disease in a population (inference).
• Coral and other marine organisms are more likely to get infections when they experience environmental stress, thus, marine conservation is important to keep coral reefs healthy.
ASSESSMENT
• Students will explain why we see different colors, and the order in which colors are absorbed at depth in the ocean.
• Students will describe the basic principles of fluorescence (more advanced students can produce a graph to show the changes in energy state associated with fluorescence).
• Students will make inferences about population level impacts of disease based on survey calculations (e.g., disease prevalence, differences in disease prevalence among morphologies).
• Students will apply their understanding of why some marine organisms fluoresce to make hypotheses about how fluorescence relates to animal physiology, specifi-cally in terms of coral health.
SKILLS
• Observation - Recognizing and comparing color patterns - Recognizing and comparing coral shapes - Associating patterns with health state
23
Volume 29 • No. 3 • Fall 2015
• Using scientific vocabulary applied to real world science/scenarios
• Critical thinking (explaining how and why color patterns emerge in animals)
• Math
• Calculating disease prevalence using simple addition and division
VOCABULARY
Auto-fluorescence/natural fluorescence: The result of an organism’s natural absorbance of one wavelength of electromagnetic radiation followed by reemission at a lower and longer wavelength.
Coral: Marine animal that lives in colonies made up of individual polyps within a calcareous skeleton.
Coral reef ecosystems: A community of living organisms, including coral colonies, along with the non-living (abiotic) components of the environment.
Disease: A deviation from the normal functioning of a part, organ, or system of an organism.
Fluorescence: Light that is emitted during absorption of radiation. The light emitted is of a lower energy than what is absorbed.
Host: An organism that harbors another organism in its tissue.
Laser-scanning confocal microscopy: A technique for obtaining high resolution, three-dimensional imagery by scanning a sample with lasers.
Pathogen: A living microorganism that can cause disease.
Physiology: The study of how living organisms, organ systems, cells, and molecules function.
Wavelength: The spatial period of an electromagnetic wave; the distance between one wave peak and the next which is directly related to the energy of the wave.
Zooxanthellae: A unicellular algae that lives in the cells of coral tissue; zooxanthellae photosynthesize light and provide the coral host with nutrients, while the coral provides protection for zooxanthellae.
TEACHER BACKGROUND
Coral reefs are an important habitat for marine organisms and are culturally, economically, and ecologically valuable to people. Corals are colonial organisms made of hundreds to thousands of individual animals called polyps. Corals, along with a diverse community of living organisms, interact with each other and the physical environment to create coral reef ecosystems. Coral reefs are generally found in tropical and
subtropical shallow water. Reefs provide habitat and food for thousands of marine species (Hoegh-Guldberg et al. 2011). Culturally, corals are significant in the lives of many Pacific Islanders, especially in Hawai‘i, as evidenced by their foundational role in the Hawaiian creation chant, the Kumulipo (Beckwith 1951). In addition, coral reef ecosystems contribute ~$30 billion to the world economies annually through tourism, fisheries, and coastline protection, and provide a source of food and livelihoods for over 500 million people worldwide (Reed et al. 2009).
Despite the importance of coral reefs, coral cover is declining globally and one of the major contributors to coral reef declines is disease outbreaks. Pathogens such as bacteria, fungi, and viruses and/or environmental stress (i.e., increased water temperatures, pollution) cause coral diseases. Some of the most dramatic effects of coral diseases are seen in the Caribbean and the Florida Keys, which are hotspots for black band disease, white band disease, and white plague (Sutherland, Porter, and Torres 2004). Disease outbreaks during the 1970s and 1980s in the Caribbean caused widespread mortality, changing the structure and composition of the historic coral reefs by removing common and locally abundant species (Green and Bruckner 2000). More recently, diseases have emerged across the Indo-Pacific. In Hawai‘i, there have been 10 coral disease outbreaks over the past decade resulting in localized mass mortality of certain important types of coral (Aeby et al. 2010). Warming ocean temperatures are projected to increase the frequency and severity of disease outbreaks worldwide by stressing corals physiologically, and increasing the growth and abundance of pathogenic microorganisms (Burge et al. 2013).
Many coral diseases are difficult to diagnose in the field. For instance, six “white tissue” diseases are similarly characterized by “spreading tissue loss that exposes white coral skeleton with a distinct line separating healthy and infected tissue.” Definitive diagnosis of the specific pathogen responsible for each disease requires extensive lab work. The inability of scientists to easily detect and diagnose disease in the field is a critical barrier to monitoring and managing coral disease. However, new technology (laser-scanning confocal microscopy, LSCM; see Figure 1 on page 24) suggests that changes in coral natural fluorescence could be used as an indicator of coral health. In general, fluorescence refers to absorption of one wavelength of electromagnetic radiation, which is then reemitted at a longer wavelength and lower energy. Auto-fluorescence (also called natural fluorescence) occurs when an organism fluoresces on its own with proteins naturally made inside its tissues. Auto-fluorescence is highly prevalent in corals through their natural fluorescent proteins and in photosynthetic pigments such as chlorophyll. While the specific role of auto-fluorescence in corals is not well understood, previous studies have suggested several possible functions such as the ability of fluorescent proteins to protect coral and their symbiotic algae (zooxanthellae) from UV damage (similar to
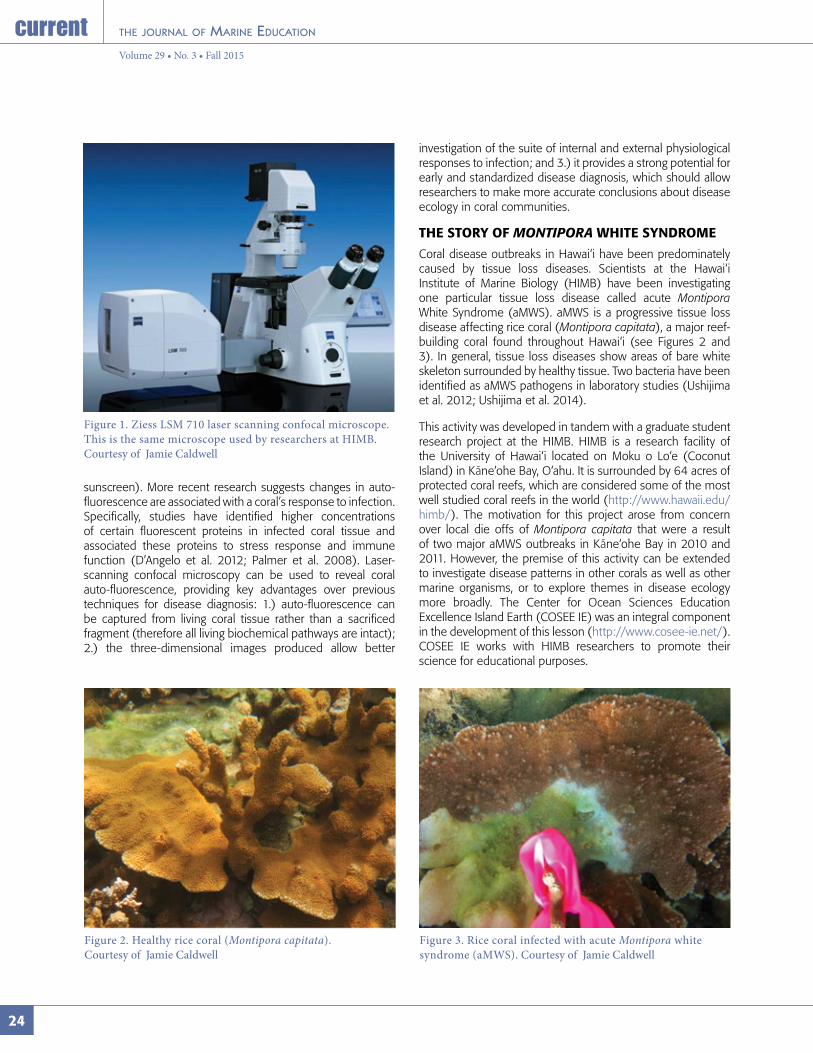
24
Volume 29 • No. 3 • Fall 2015
sunscreen). More recent research suggests changes in auto-fluorescence are associated with a coral’s response to infection. Specifically, studies have identified higher concentrations of certain fluorescent proteins in infected coral tissue and associated these proteins to stress response and immune function (D’Angelo et al. 2012; Palmer et al. 2008). Laser-scanning confocal microscopy can be used to reveal coral auto-fluorescence, providing key advantages over previous techniques for disease diagnosis: 1.) auto-fluorescence can be captured from living coral tissue rather than a sacrificed fragment (therefore all living biochemical pathways are intact); 2.) the three-dimensional images produced allow better
Figure 1. Ziess LSM 710 laser scanning confocal microscope. This is the same microscope used by researchers at HIMB. Courtesy of Jamie Caldwell
Figure 2. Healthy rice coral (Montipora capitata). Courtesy of Jamie Caldwell
Figure 3. Rice coral infected with acute Montipora white syndrome (aMWS). Courtesy of Jamie Caldwell
investigation of the suite of internal and external physiological responses to infection; and 3.) it provides a strong potential for early and standardized disease diagnosis, which should allow researchers to make more accurate conclusions about disease ecology in coral communities.
THE STORY OF MONTIPORA WHITE SYNDROME
Coral disease outbreaks in Hawai‘i have been predominately caused by tissue loss diseases. Scientists at the Hawai‘i Institute of Marine Biology (HIMB) have been investigating one particular tissue loss disease called acute Montipora White Syndrome (aMWS). aMWS is a progressive tissue loss disease affecting rice coral (Montipora capitata), a major reef-building coral found throughout Hawai‘i (see Figures 2 and 3). In general, tissue loss diseases show areas of bare white skeleton surrounded by healthy tissue. Two bacteria have been identified as aMWS pathogens in laboratory studies (Ushijima et al. 2012; Ushijima et al. 2014).
This activity was developed in tandem with a graduate student research project at the HIMB. HIMB is a research facility of the University of Hawai‘i located on Moku o Lo‘e (Coconut Island) in Kāne‘ohe Bay, O‘ahu. It is surrounded by 64 acres of protected coral reefs, which are considered some of the most well studied coral reefs in the world (http://www.hawaii.edu/himb/). The motivation for this project arose from concern over local die offs of Montipora capitata that were a result of two major aMWS outbreaks in Kāne‘ohe Bay in 2010 and 2011. However, the premise of this activity can be extended to investigate disease patterns in other corals as well as other marine organisms, or to explore themes in disease ecology more broadly. The Center for Ocean Sciences Education Excellence Island Earth (COSEE IE) was an integral component in the development of this lesson (http://www.cosee-ie.net/). COSEE IE works with HIMB researchers to promote their science for educational purposes.
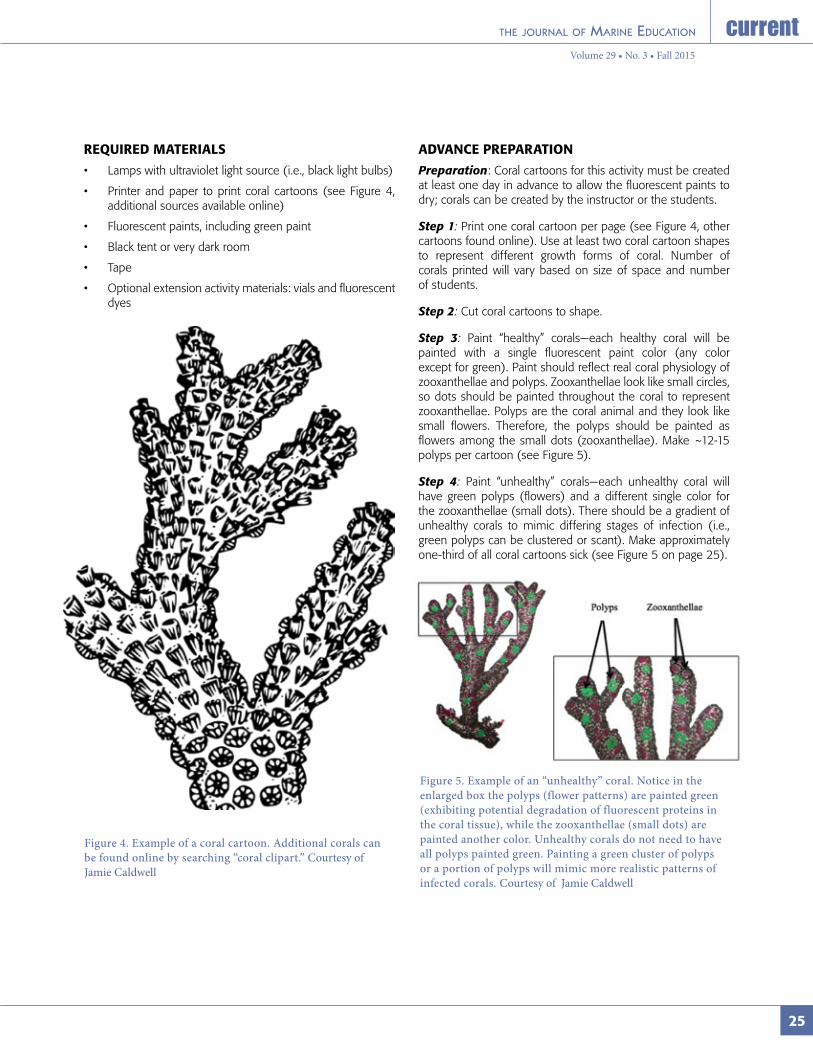
25
Volume 29 • No. 3 • Fall 2015
REQUIRED MATERIALS
• Lamps with ultraviolet light source (i.e., black light bulbs)
• Printer and paper to print coral cartoons (see Figure 4, additional sources available online)
• Fluorescent paints, including green paint
• Black tent or very dark room
• Tape
• Optional extension activity materials: vials and fluorescent dyes
Figure 4. Example of a coral cartoon. Additional corals can be found online by searching “coral clipart.” Courtesy of Jamie Caldwell
Figure 5. Example of an “unhealthy” coral. Notice in the enlarged box the polyps (flower patterns) are painted green (exhibiting potential degradation of fluorescent proteins in the coral tissue), while the zooxanthellae (small dots) are painted another color. Unhealthy corals do not need to have all polyps painted green. Painting a green cluster of polyps or a portion of polyps will mimic more realistic patterns of infected corals. Courtesy of Jamie Caldwell
ADVANCE PREPARATION
Preparation: Coral cartoons for this activity must be created at least one day in advance to allow the fluorescent paints to dry; corals can be created by the instructor or the students.
Step 1: Print one coral cartoon per page (see Figure 4, other cartoons found online). Use at least two coral cartoon shapes to represent different growth forms of coral. Number of corals printed will vary based on size of space and number of students.
Step 2: Cut coral cartoons to shape.
Step 3: Paint “healthy” corals—each healthy coral will be painted with a single fluorescent paint color (any color except for green). Paint should reflect real coral physiology of zooxanthellae and polyps. Zooxanthellae look like small circles, so dots should be painted throughout the coral to represent zooxanthellae. Polyps are the coral animal and they look like small flowers. Therefore, the polyps should be painted as flowers among the small dots (zooxanthellae). Make ~12-15 polyps per cartoon (see Figure 5).
Step 4: Paint “unhealthy” corals—each unhealthy coral will have green polyps (flowers) and a different single color for the zooxanthellae (small dots). There should be a gradient of unhealthy corals to mimic differing stages of infection (i.e., green polyps can be clustered or scant). Make approximately one-third of all coral cartoons sick (see Figure 5 on page 25).
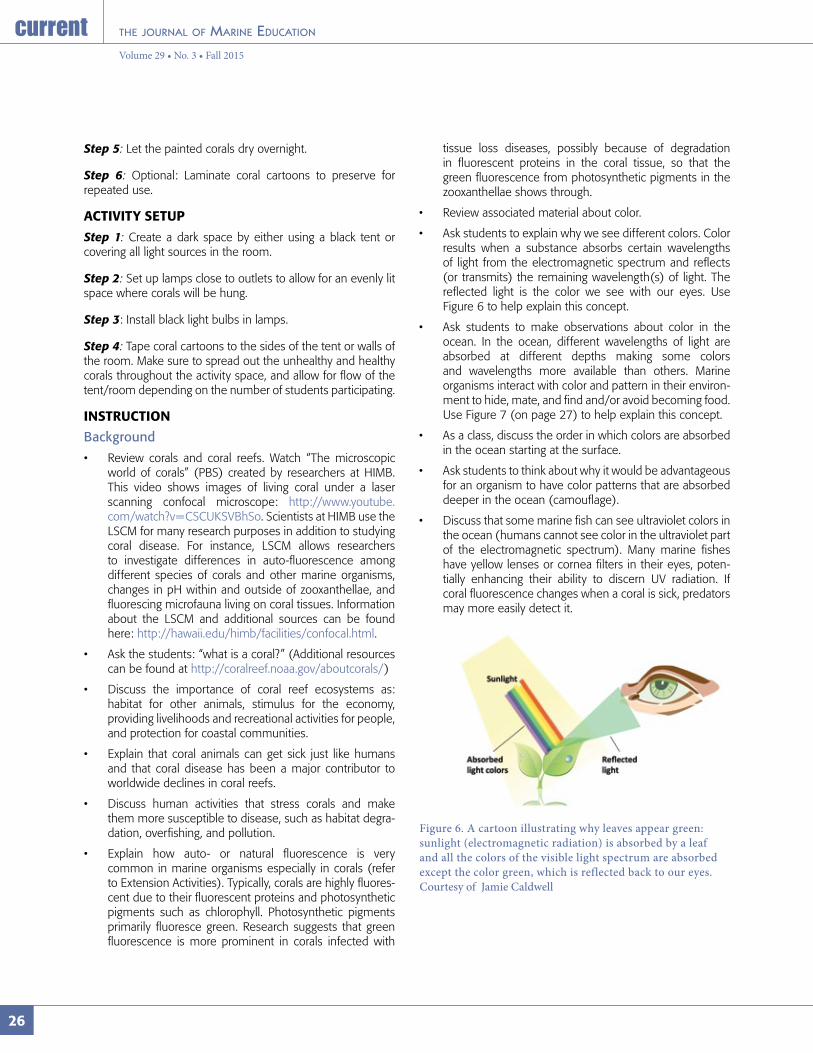
26
Volume 29 • No. 3 • Fall 2015
Step 5: Let the painted corals dry overnight.
Step 6: Optional: Laminate coral cartoons to preserve for repeated use.
ACTIVITY SETUP
Step 1: Create a dark space by either using a black tent or covering all light sources in the room.
Step 2: Set up lamps close to outlets to allow for an evenly lit space where corals will be hung.
Step 3: Install black light bulbs in lamps.
Step 4: Tape coral cartoons to the sides of the tent or walls of the room. Make sure to spread out the unhealthy and healthy corals throughout the activity space, and allow for flow of the tent/room depending on the number of students participating.
INSTRUCTION
Background
• Review corals and coral reefs. Watch “The microscopic world of corals” (PBS) created by researchers at HIMB. This video shows images of living coral under a laser scanning confocal microscope: http://www.youtube.com/watch?v=CSCUKSVBhSo. Scientists at HIMB use the LSCM for many research purposes in addition to studying coral disease. For instance, LSCM allows researchers to investigate differences in auto-fluorescence among different species of corals and other marine organisms, changes in pH within and outside of zooxanthellae, and fluorescing microfauna living on coral tissues. Information about the LSCM and additional sources can be found here: http://hawaii.edu/himb/facilities/confocal.html.
• Ask the students: “what is a coral?” (Additional resources can be found at http://coralreef.noaa.gov/aboutcorals/)
• Discuss the importance of coral reef ecosystems as: habitat for other animals, stimulus for the economy, providing livelihoods and recreational activities for people, and protection for coastal communities.
• Explain that coral animals can get sick just like humans and that coral disease has been a major contributor to worldwide declines in coral reefs.
• Discuss human activities that stress corals and make them more susceptible to disease, such as habitat degra-dation, overfishing, and pollution.
• Explain how auto- or natural fluorescence is very common in marine organisms especially in corals (refer to Extension Activities). Typically, corals are highly fluores-cent due to their fluorescent proteins and photosynthetic pigments such as chlorophyll. Photosynthetic pigments primarily fluoresce green. Research suggests that green fluorescence is more prominent in corals infected with
tissue loss diseases, possibly because of degradation in fluorescent proteins in the coral tissue, so that the green fluorescence from photosynthetic pigments in the zooxanthellae shows through.
• Review associated material about color.
• Ask students to explain why we see different colors. Color results when a substance absorbs certain wavelengths of light from the electromagnetic spectrum and reflects (or transmits) the remaining wavelength(s) of light. The reflected light is the color we see with our eyes. Use Figure 6 to help explain this concept.
• Ask students to make observations about color in the ocean. In the ocean, different wavelengths of light are absorbed at different depths making some colors and wavelengths more available than others. Marine organisms interact with color and pattern in their environ-ment to hide, mate, and find and/or avoid becoming food. Use Figure 7 (on page 27) to help explain this concept.
• As a class, discuss the order in which colors are absorbed in the ocean starting at the surface.
• Ask students to think about why it would be advantageous for an organism to have color patterns that are absorbed deeper in the ocean (camouflage).
• Discuss that some marine fish can see ultraviolet colors in the ocean (humans cannot see color in the ultraviolet part of the electromagnetic spectrum). Many marine fishes have yellow lenses or cornea filters in their eyes, poten-tially enhancing their ability to discern UV radiation. If coral fluorescence changes when a coral is sick, predators may more easily detect it.
Figure 6. A cartoon illustrating why leaves appear green: sunlight (electromagnetic radiation) is absorbed by a leaf and all the colors of the visible light spectrum are absorbed except the color green, which is reflected back to our eyes.Courtesy of Jamie Caldwell
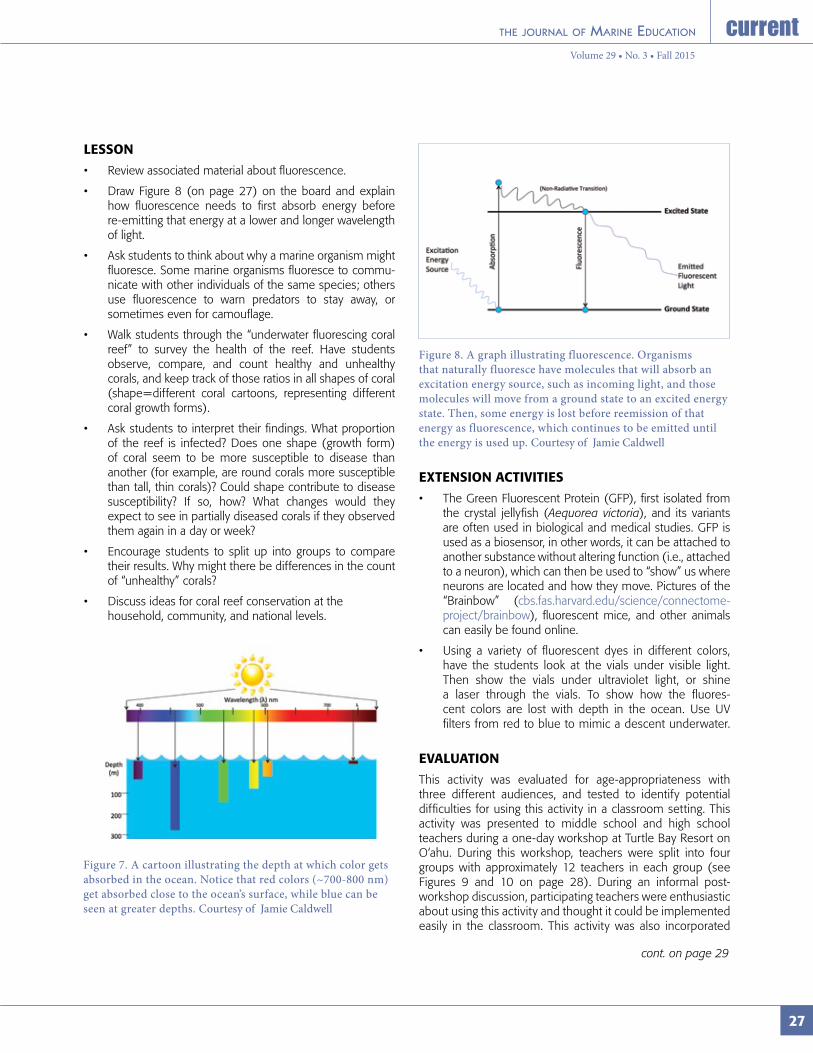
27
Volume 29 • No. 3 • Fall 2015
LESSON
• Review associated material about fluorescence.
• Draw Figure 8 (on page 27) on the board and explain how fluorescence needs to first absorb energy before re-emitting that energy at a lower and longer wavelength of light.
• Ask students to think about why a marine organism might fluoresce. Some marine organisms fluoresce to commu-nicate with other individuals of the same species; others use fluorescence to warn predators to stay away, or sometimes even for camouflage.
• Walk students through the “underwater fluorescing coral reef” to survey the health of the reef. Have students observe, compare, and count healthy and unhealthy corals, and keep track of those ratios in all shapes of coral (shape=different coral cartoons, representing different coral growth forms).
• Ask students to interpret their findings. What proportion of the reef is infected? Does one shape (growth form) of coral seem to be more susceptible to disease than another (for example, are round corals more susceptible than tall, thin corals)? Could shape contribute to disease susceptibility? If so, how? What changes would they expect to see in partially diseased corals if they observed them again in a day or week?
• Encourage students to split up into groups to compare their results. Why might there be differences in the count of “unhealthy” corals?
• Discuss ideas for coral reef conservation at the household, community, and national levels.
Figure 7. A cartoon illustrating the depth at which color gets absorbed in the ocean. Notice that red colors (~700-800 nm) get absorbed close to the ocean’s surface, while blue can be seen at greater depths. Courtesy of Jamie Caldwell
Figure 8. A graph illustrating fluorescence. Organisms that naturally fluoresce have molecules that will absorb an excitation energy source, such as incoming light, and those molecules will move from a ground state to an excited energy state. Then, some energy is lost before reemission of that energy as fluorescence, which continues to be emitted until the energy is used up. Courtesy of Jamie Caldwell
EXTENSION ACTIVITIES
• The Green Fluorescent Protein (GFP), first isolated from the crystal jellyfish (Aequorea victoria), and its variants are often used in biological and medical studies. GFP is used as a biosensor, in other words, it can be attached to another substance without altering function (i.e., attached to a neuron), which can then be used to “show” us where neurons are located and how they move. Pictures of the “Brainbow” (cbs.fas.harvard.edu/science/connectome-project/brainbow), fluorescent mice, and other animals can easily be found online.
• Using a variety of fluorescent dyes in different colors, have the students look at the vials under visible light. Then show the vials under ultraviolet light, or shine a laser through the vials. To show how the fluores-cent colors are lost with depth in the ocean. Use UV filters from red to blue to mimic a descent underwater.
EVALUATION
This activity was evaluated for age-appropriateness with three different audiences, and tested to identify potential difficulties for using this activity in a classroom setting. This activity was presented to middle school and high school teachers during a one-day workshop at Turtle Bay Resort on O‘ahu. During this workshop, teachers were split into four groups with approximately 12 teachers in each group (see Figures 9 and 10 on page 28). During an informal post-workshop discussion, participating teachers were enthusiastic about using this activity and thought it could be implemented easily in the classroom. This activity was also incorporated
cont. on page 29

28
Volume 29 • No. 3 • Fall 2015
Figure 9. At an “underwater fluorescing coral reef ” tent at a workshop in Turtle Bay Resort. Courtesy of Jamie Caldwell
Figure 10. At a tent during a teacher’s workshop at Turtle Bay Resort. Note the fluorescing red and green dots on “healthy” and “unhealthy” corals. Courtesy of Jamie Caldwell
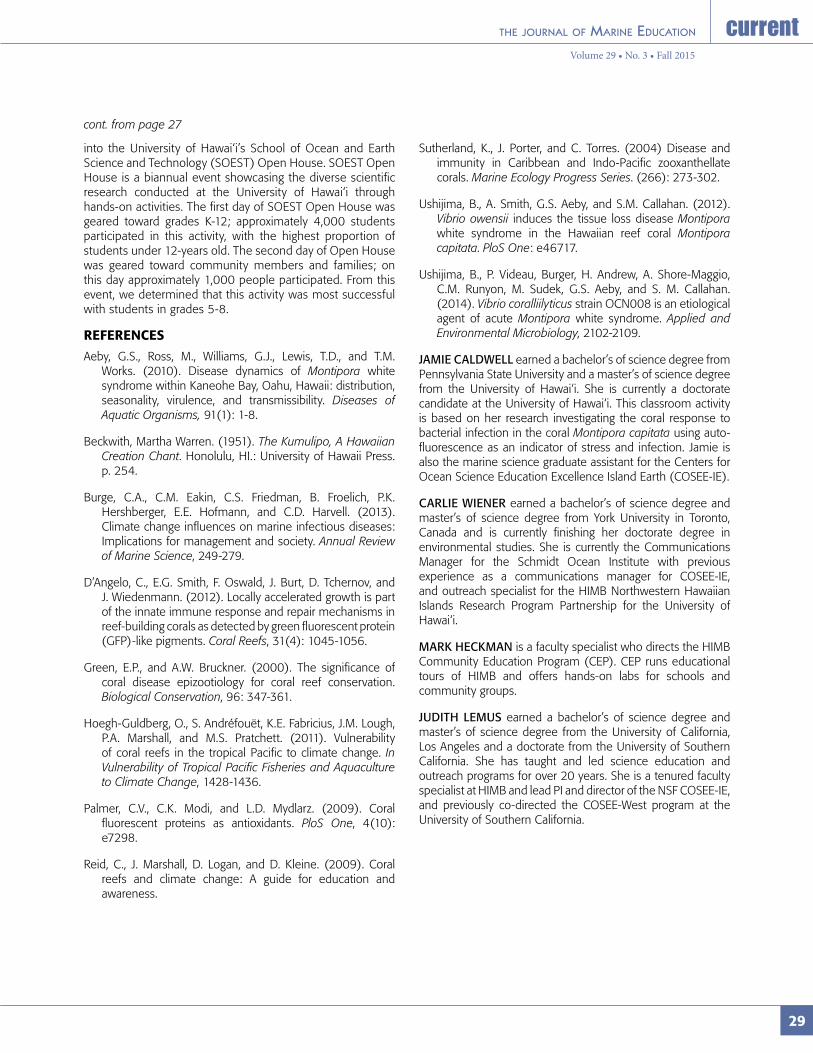
29
Volume 29 • No. 3 • Fall 2015
into the University of Hawai‘i’s School of Ocean and Earth Science and Technology (SOEST) Open House. SOEST Open House is a biannual event showcasing the diverse scientific research conducted at the University of Hawai‘i through hands-on activities. The first day of SOEST Open House was geared toward grades K-12; approximately 4,000 students participated in this activity, with the highest proportion of students under 12-years old. The second day of Open House was geared toward community members and families; on this day approximately 1,000 people participated. From this event, we determined that this activity was most successful with students in grades 5-8.
REFERENCES
Aeby, G.S., Ross, M., Williams, G.J., Lewis, T.D., and T.M. Works. (2010). Disease dynamics of Montipora white syndrome within Kaneohe Bay, Oahu, Hawaii: distribution, seasonality, virulence, and transmissibility. Diseases of Aquatic Organisms, 91(1): 1-8.
Beckwith, Martha Warren. (1951). The Kumulipo, A Hawaiian Creation Chant. Honolulu, HI.: University of Hawaii Press. p. 254.
Burge, C.A., C.M. Eakin, C.S. Friedman, B. Froelich, P.K. Hershberger, E.E. Hofmann, and C.D. Harvell. (2013). Climate change influences on marine infectious diseases: Implications for management and society. Annual Review of Marine Science, 249-279.
D’Angelo, C., E.G. Smith, F. Oswald, J. Burt, D. Tchernov, and J. Wiedenmann. (2012). Locally accelerated growth is part of the innate immune response and repair mechanisms in reef-building corals as detected by green fluorescent protein (GFP)-like pigments. Coral Reefs, 31(4): 1045-1056.
Green, E.P., and A.W. Bruckner. (2000). The significance of coral disease epizootiology for coral reef conservation. Biological Conservation, 96: 347-361.
Hoegh-Guldberg, O., S. Andréfouët, K.E. Fabricius, J.M. Lough, P.A. Marshall, and M.S. Pratchett. (2011). Vulnerability of coral reefs in the tropical Pacific to climate change. In Vulnerability of Tropical Pacific Fisheries and Aquaculture to Climate Change, 1428-1436.
Palmer, C.V., C.K. Modi, and L.D. Mydlarz. (2009). Coral fluorescent proteins as antioxidants. PloS One, 4(10): e7298.
Reid, C., J. Marshall, D. Logan, and D. Kleine. (2009). Coral reefs and climate change: A guide for education and awareness.
Sutherland, K., J. Porter, and C. Torres. (2004) Disease and immunity in Caribbean and Indo-Pacific zooxanthellate corals. Marine Ecology Progress Series. (266): 273-302.
Ushijima, B., A. Smith, G.S. Aeby, and S.M. Callahan. (2012). Vibrio owensii induces the tissue loss disease Montipora white syndrome in the Hawaiian reef coral Montipora capitata. PloS One: e46717.
Ushijima, B., P. Videau, Burger, H. Andrew, A. Shore-Maggio, C.M. Runyon, M. Sudek, G.S. Aeby, and S. M. Callahan. (2014). Vibrio coralliilyticus strain OCN008 is an etiological agent of acute Montipora white syndrome. Applied and Environmental Microbiology, 2102-2109.
JAMIE CALDWELL earned a bachelor’s of science degree from Pennsylvania State University and a master’s of science degree from the University of Hawai‘i. She is currently a doctorate candidate at the University of Hawai‘i. This classroom activity is based on her research investigating the coral response to bacterial infection in the coral Montipora capitata using auto-fluorescence as an indicator of stress and infection. Jamie is also the marine science graduate assistant for the Centers for Ocean Science Education Excellence Island Earth (COSEE-IE).
CARLIE WIENER earned a bachelor’s of science degree and master’s of science degree from York University in Toronto, Canada and is currently finishing her doctorate degree in environmental studies. She is currently the Communications Manager for the Schmidt Ocean Institute with previous experience as a communications manager for COSEE-IE, and outreach specialist for the HIMB Northwestern Hawaiian Islands Research Program Partnership for the University of Hawai‘i.
MARK HECKMAN is a faculty specialist who directs the HIMB Community Education Program (CEP). CEP runs educational tours of HIMB and offers hands-on labs for schools and community groups.
JUDITH LEMUS earned a bachelor’s of science degree and master’s of science degree from the University of California, Los Angeles and a doctorate from the University of Southern California. She has taught and led science education and outreach programs for over 20 years. She is a tenured faculty specialist at HIMB and lead PI and director of the NSF COSEE-IE, and previously co-directed the COSEE-West program at the University of Southern California.
cont. from page 27
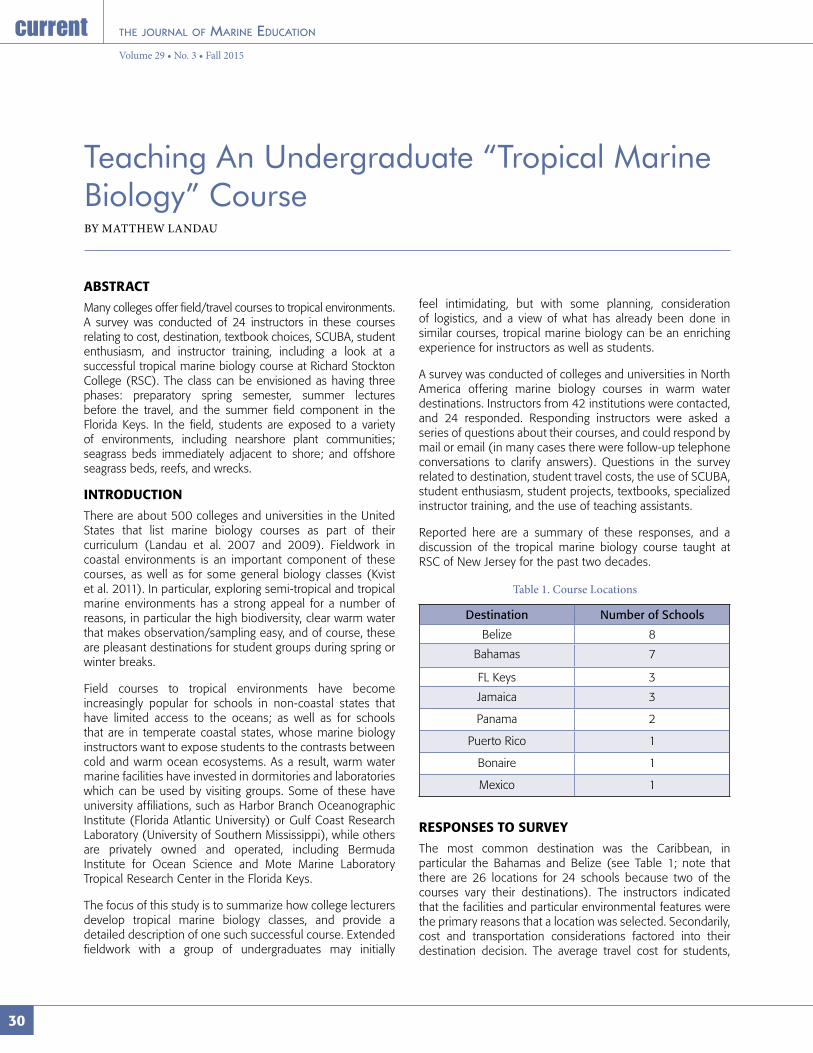
30
Volume 29 • No. 3 • Fall 2015
Teaching An Undergraduate “Tropical Marine Biology” CourseBY MATTHEW LANDAU
ABSTRACT
Many colleges offer field/travel courses to tropical environments. A survey was conducted of 24 instructors in these courses relating to cost, destination, textbook choices, SCUBA, student enthusiasm, and instructor training, including a look at a successful tropical marine biology course at Richard Stockton College (RSC). The class can be envisioned as having three phases: preparatory spring semester, summer lectures before the travel, and the summer field component in the Florida Keys. In the field, students are exposed to a variety of environments, including nearshore plant communities; seagrass beds immediately adjacent to shore; and offshore seagrass beds, reefs, and wrecks.
INTRODUCTION
There are about 500 colleges and universities in the United States that list marine biology courses as part of their curriculum (Landau et al. 2007 and 2009). Fieldwork in coastal environments is an important component of these courses, as well as for some general biology classes (Kvist et al. 2011). In particular, exploring semi-tropical and tropical marine environments has a strong appeal for a number of reasons, in particular the high biodiversity, clear warm water that makes observation/sampling easy, and of course, these are pleasant destinations for student groups during spring or winter breaks.
Field courses to tropical environments have become increasingly popular for schools in non-coastal states that have limited access to the oceans; as well as for schools that are in temperate coastal states, whose marine biology instructors want to expose students to the contrasts between cold and warm ocean ecosystems. As a result, warm water marine facilities have invested in dormitories and laboratories which can be used by visiting groups. Some of these have university affiliations, such as Harbor Branch Oceanographic Institute (Florida Atlantic University) or Gulf Coast Research Laboratory (University of Southern Mississippi), while others are privately owned and operated, including Bermuda Institute for Ocean Science and Mote Marine Laboratory Tropical Research Center in the Florida Keys.
The focus of this study is to summarize how college lecturers develop tropical marine biology classes, and provide a detailed description of one such successful course. Extended fieldwork with a group of undergraduates may initially
feel intimidating, but with some planning, consideration of logistics, and a view of what has already been done in similar courses, tropical marine biology can be an enriching experience for instructors as well as students.
A survey was conducted of colleges and universities in North America offering marine biology courses in warm water destinations. Instructors from 42 institutions were contacted, and 24 responded. Responding instructors were asked a series of questions about their courses, and could respond by mail or email (in many cases there were follow-up telephone conversations to clarify answers). Questions in the survey related to destination, student travel costs, the use of SCUBA, student enthusiasm, student projects, textbooks, specialized instructor training, and the use of teaching assistants.
Reported here are a summary of these responses, and a discussion of the tropical marine biology course taught at RSC of New Jersey for the past two decades.
RESPONSES TO SURVEY
The most common destination was the Caribbean, in particular the Bahamas and Belize (see Table 1; note that there are 26 locations for 24 schools because two of the courses vary their destinations). The instructors indicated that the facilities and particular environmental features were the primary reasons that a location was selected. Secondarily, cost and transportation considerations factored into their destination decision. The average travel cost for students,
Destination Number of Schools
Belize 8
Bahamas 7
FL Keys 3
Jamaica 3
Panama 2
Puerto Rico 1
Bonaire 1
Mexico 1
Table 1. Course Locations
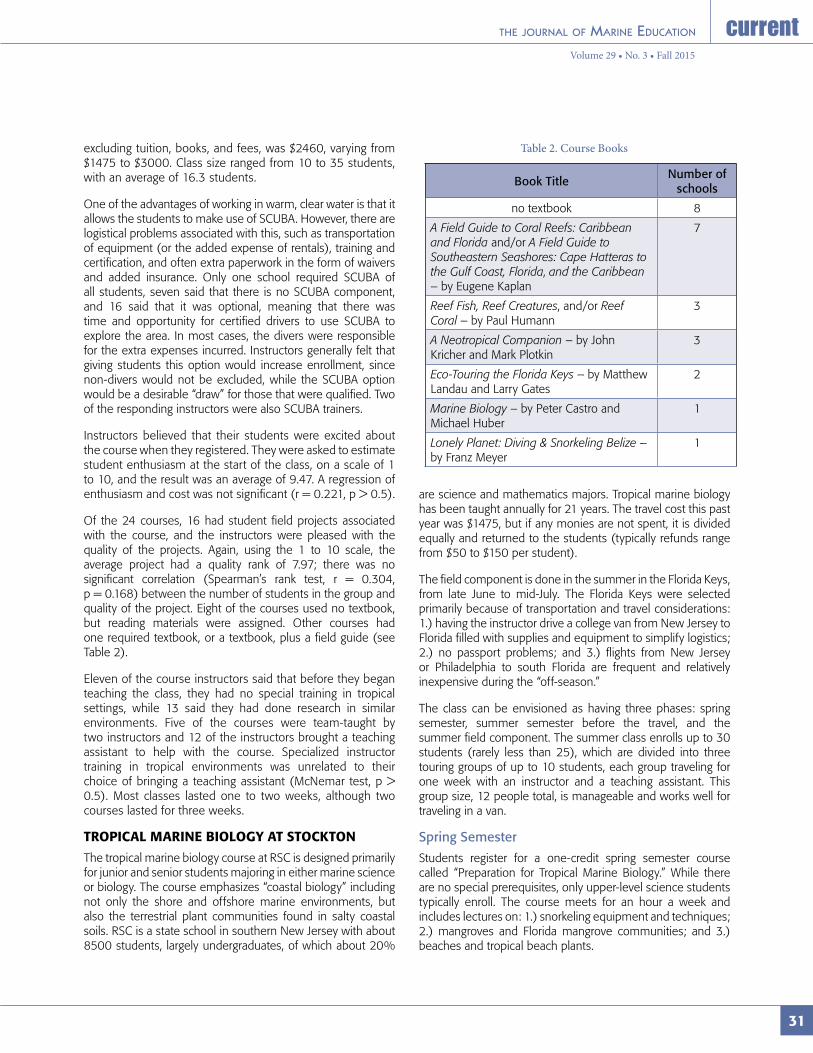
31
Volume 29 • No. 3 • Fall 2015
excluding tuition, books, and fees, was $2460, varying from $1475 to $3000. Class size ranged from 10 to 35 students, with an average of 16.3 students.
One of the advantages of working in warm, clear water is that it allows the students to make use of SCUBA. However, there are logistical problems associated with this, such as transportation of equipment (or the added expense of rentals), training and certification, and often extra paperwork in the form of waivers and added insurance. Only one school required SCUBA of all students, seven said that there is no SCUBA component, and 16 said that it was optional, meaning that there was time and opportunity for certified drivers to use SCUBA to explore the area. In most cases, the divers were responsible for the extra expenses incurred. Instructors generally felt that giving students this option would increase enrollment, since non-divers would not be excluded, while the SCUBA option would be a desirable “draw” for those that were qualified. Two of the responding instructors were also SCUBA trainers.
Instructors believed that their students were excited about the course when they registered. They were asked to estimate student enthusiasm at the start of the class, on a scale of 1 to 10, and the result was an average of 9.47. A regression of enthusiasm and cost was not significant (r = 0.221, p > 0.5).
Of the 24 courses, 16 had student field projects associated with the course, and the instructors were pleased with the quality of the projects. Again, using the 1 to 10 scale, the average project had a quality rank of 7.97; there was no significant correlation (Spearman’s rank test, r = 0.304, p = 0.168) between the number of students in the group and quality of the project. Eight of the courses used no textbook, but reading materials were assigned. Other courses had one required textbook, or a textbook, plus a field guide (see Table 2).
Eleven of the course instructors said that before they began teaching the class, they had no special training in tropical settings, while 13 said they had done research in similar environments. Five of the courses were team-taught by two instructors and 12 of the instructors brought a teaching assistant to help with the course. Specialized instructor training in tropical environments was unrelated to their choice of bringing a teaching assistant (McNemar test, p > 0.5). Most classes lasted one to two weeks, although two courses lasted for three weeks.
TROPICAL MARINE BIOLOGY AT STOCKTON
The tropical marine biology course at RSC is designed primarily for junior and senior students majoring in either marine science or biology. The course emphasizes “coastal biology” including not only the shore and offshore marine environments, but also the terrestrial plant communities found in salty coastal soils. RSC is a state school in southern New Jersey with about 8500 students, largely undergraduates, of which about 20%
Book TitleNumber of
schools
no textbook 8
A Field Guide to Coral Reefs: Caribbean and Florida and/or A Field Guide to Southeastern Seashores: Cape Hatteras to the Gulf Coast, Florida, and the Caribbean – by Eugene Kaplan
7
Reef Fish, Reef Creatures, and/or Reef Coral – by Paul Humann
3
A Neotropical Companion – by John Kricher and Mark Plotkin
3
Eco-Touring the Florida Keys – by Matthew Landau and Larry Gates
2
Marine Biology – by Peter Castro and Michael Huber
1
Lonely Planet: Diving & Snorkeling Belize – by Franz Meyer
1
are science and mathematics majors. Tropical marine biology has been taught annually for 21 years. The travel cost this past year was $1475, but if any monies are not spent, it is divided equally and returned to the students (typically refunds range from $50 to $150 per student).
The field component is done in the summer in the Florida Keys, from late June to mid-July. The Florida Keys were selected primarily because of transportation and travel considerations: 1.) having the instructor drive a college van from New Jersey to Florida filled with supplies and equipment to simplify logistics; 2.) no passport problems; and 3.) flights from New Jersey or Philadelphia to south Florida are frequent and relatively inexpensive during the “off-season.”
The class can be envisioned as having three phases: spring semester, summer semester before the travel, and the summer field component. The summer class enrolls up to 30 students (rarely less than 25), which are divided into three touring groups of up to 10 students, each group traveling for one week with an instructor and a teaching assistant. This group size, 12 people total, is manageable and works well for traveling in a van.
Spring Semester
Students register for a one-credit spring semester course called “Preparation for Tropical Marine Biology.” While there are no special prerequisites, only upper-level science students typically enroll. The course meets for an hour a week and includes lectures on: 1.) snorkeling equipment and techniques; 2.) mangroves and Florida mangrove communities; and 3.) beaches and tropical beach plants.
Table 2. Course Books

32
Volume 29 • No. 3 • Fall 2015
The spring semester gives students an extended period to complete health forms and college waivers, consider if they really want to participate in the trip as well as make arrangements for financing, and to ask any questions they or their parents have between January and May. Some students use the spring semester to become SCUBA certified. It also gives the instructor time to make plans including arranging housing, chartering vessels, and buying airline tickets for the students.
Summer Semester: Before Travel
Students in the summer meet six times prior to traveling. There are four lectures, each two and a half hours long, on the Everglades, pineland and hardwood hammocks, seagrass beds, and coral reefs. Each lecture covers general principles and common plants and animals found in these environments. On the first day, in addition to a lecture, students are: 1.) assigned term papers on different ecosystems; and 2.) given access to a PowerPoint file that includes photographs and descriptions of about 80 common coral reef organisms. The sixth meeting consists of an exam on the lectures, a visual test on identification of coral reef organisms, and collection of the student’s term paper.
The fifth meeting, between the lectures and the exam day, is a “game day.” The students come to class and fill out a sheet that asks what is their favorite exotic food, favorite movie, favorite TV show, favorite musician or group, and a hobby or favorite sport. The students are asked to complete the sheets quickly, leave the room for about 45 minutes, and not discuss their answers. They then return to class where each travel group makes a circle of desks. For three to six minutes within each group, every person is questioned about things unrelated to the questions on the sheet they answered earlier. After all the members of the group have been questioned, the students try to match the answers given to the questions on the sheet to each other. The purpose is to make students comfortable,
so when they begin to travel together a few weeks later they develop a more cohesive unit.
Summer Semester –Travel
A typical travel week is intensive and leaves little time for extra activities. Students are picked up at the airport and transported to their accommodations. We stay in a chain motel in Florida City which provides a small, free breakfast buffet. All other meals are at local restaurants that can accommodate groups of up to 12 people (usually during off-hours, e.g., lunch at 11:00 a.m.). An outline of a week’s specific activities is given in Table 3 (on page 33) and Figures 1a-1f. At night, after each of the in-water days (days 3-6), we meet as a group to create a list of all the marine organisms the group encountered using field guides (see Figure 2 on page 34).
Marine environments we visit which don’t require boat travel include two nearshore seagrass beds (Sombrero Beach and Long Key State Park), and an old marina now converted to a dive site (Jules Underwater Lodge). Other marine sites require chartering a vessel and include travel to: an offshore seagrass bed (Grecian Rocks); a patch reef in Hawk Channel (often Rose’s Reef or the Canon Patch); an intermediate reef (most often visited are White Banks and North-North Dry Rocks); a site along the outer reef line (especially Pickles Reef, Molasses Reef, French Reef, Elbow Reef, or Carysfort Reef); and a wreck (primarily the City of Washington or the Benwood). Because the groups are often a mix of SCUBA divers and snorkelers, we go to locations that are within easy viewing of all the students, usually 20-40 feet depths. On rare occasions a group may include all divers and we can go to sites as deep as 65 feet.
The destinations listed in Table 3 (on page 33) are the most commonly visited, but other sites our groups have visited include plant identification walks at: 1.) Key Largo Hammocks State Botanical Site; 2.) John Pennekamp State
Figure 1a. Plant walk in Everglades National Park. Courtesy of Matthew Landau
Figure 1b. National Key Deer Refuge on Big Pine Key. Courtesy of Matthew Landau
Figure 1c. Lagoon at Jules Underwater Lodge in Key Largo. Courtesy of Matthew Landau
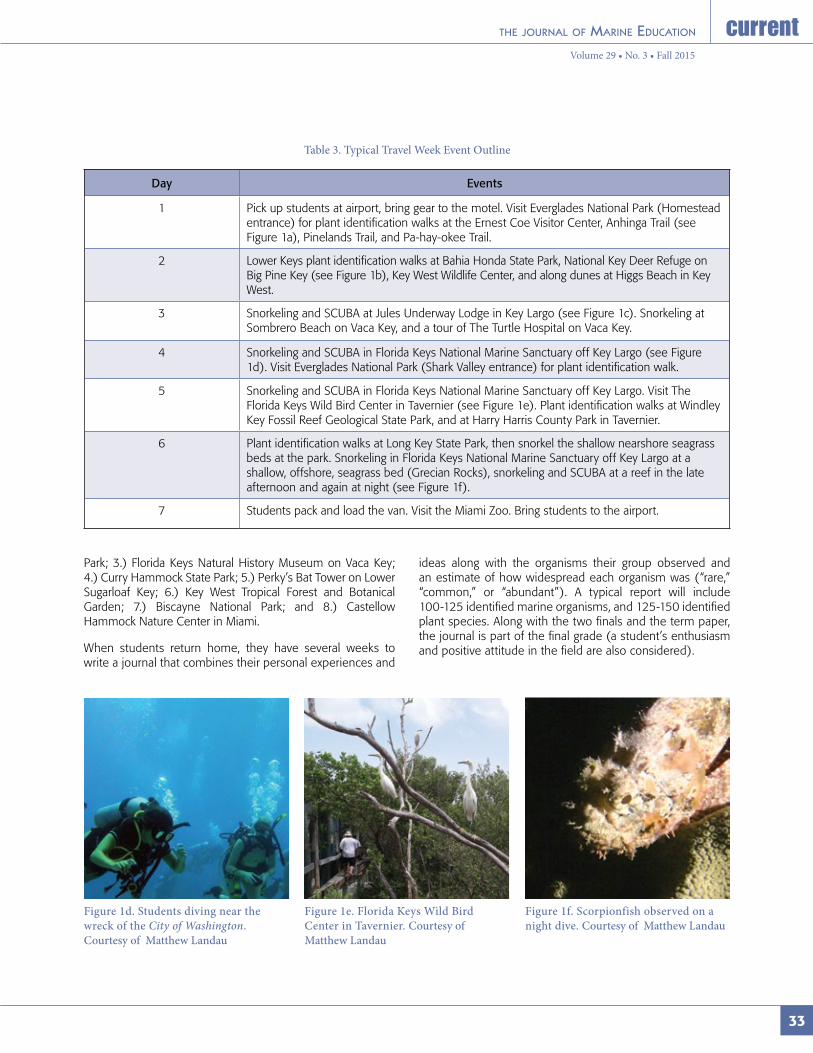
33
Volume 29 • No. 3 • Fall 2015
Day Events
1 Pick up students at airport, bring gear to the motel. Visit Everglades National Park (Homestead entrance) for plant identification walks at the Ernest Coe Visitor Center, Anhinga Trail (see Figure 1a), Pinelands Trail, and Pa-hay-okee Trail.
2 Lower Keys plant identification walks at Bahia Honda State Park, National Key Deer Refuge on Big Pine Key (see Figure 1b), Key West Wildlife Center, and along dunes at Higgs Beach in Key West.
3 Snorkeling and SCUBA at Jules Underway Lodge in Key Largo (see Figure 1c). Snorkeling at Sombrero Beach on Vaca Key, and a tour of The Turtle Hospital on Vaca Key.
4 Snorkeling and SCUBA in Florida Keys National Marine Sanctuary off Key Largo (see Figure 1d). Visit Everglades National Park (Shark Valley entrance) for plant identification walk.
5 Snorkeling and SCUBA in Florida Keys National Marine Sanctuary off Key Largo. Visit The Florida Keys Wild Bird Center in Tavernier (see Figure 1e). Plant identification walks at Windley Key Fossil Reef Geological State Park, and at Harry Harris County Park in Tavernier.
6 Plant identification walks at Long Key State Park, then snorkel the shallow nearshore seagrass beds at the park. Snorkeling in Florida Keys National Marine Sanctuary off Key Largo at a shallow, offshore, seagrass bed (Grecian Rocks), snorkeling and SCUBA at a reef in the late afternoon and again at night (see Figure 1f).
7 Students pack and load the van. Visit the Miami Zoo. Bring students to the airport.
Table 3. Typical Travel Week Event Outline
Figure 1e. Florida Keys Wild Bird Center in Tavernier. Courtesy of Matthew Landau
Figure 1f. Scorpionfish observed on a night dive. Courtesy of Matthew Landau
Figure 1d. Students diving near the wreck of the City of Washington. Courtesy of Matthew Landau
Park; 3.) Florida Keys Natural History Museum on Vaca Key; 4.) Curry Hammock State Park; 5.) Perky’s Bat Tower on Lower Sugarloaf Key; 6.) Key West Tropical Forest and Botanical Garden; 7.) Biscayne National Park; and 8.) Castellow Hammock Nature Center in Miami.
When students return home, they have several weeks to write a journal that combines their personal experiences and
ideas along with the organisms their group observed and an estimate of how widespread each organism was (“rare,” “common,” or “abundant”). A typical report will include 100-125 identified marine organisms, and 125-150 identified plant species. Along with the two finals and the term paper, the journal is part of the final grade (a student’s enthusiasm and positive attitude in the field are also considered).
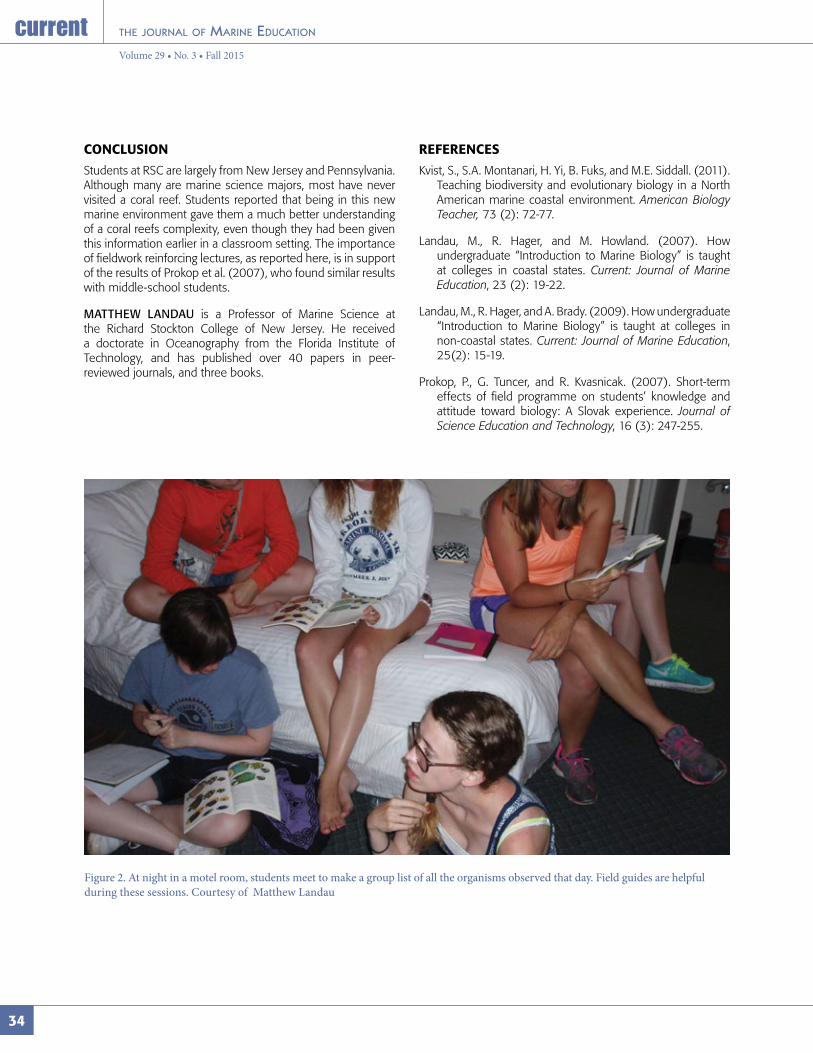
34
Volume 29 • No. 3 • Fall 2015
CONCLUSION
Students at RSC are largely from New Jersey and Pennsylvania. Although many are marine science majors, most have never visited a coral reef. Students reported that being in this new marine environment gave them a much better understanding of a coral reefs complexity, even though they had been given this information earlier in a classroom setting. The importance of fieldwork reinforcing lectures, as reported here, is in support of the results of Prokop et al. (2007), who found similar results with middle-school students.
MATTHEW LANDAU is a Professor of Marine Science at the Richard Stockton College of New Jersey. He received a doctorate in Oceanography from the Florida Institute of Technology, and has published over 40 papers in peer-reviewed journals, and three books.
REFERENCES
Kvist, S., S.A. Montanari, H. Yi, B. Fuks, and M.E. Siddall. (2011). Teaching biodiversity and evolutionary biology in a North American marine coastal environment. American Biology Teacher, 73 (2): 72-77.
Landau, M., R. Hager, and M. Howland. (2007). How undergraduate “Introduction to Marine Biology” is taught at colleges in coastal states. Current: Journal of Marine Education, 23 (2): 19-22.
Landau, M., R. Hager, and A. Brady. (2009). How undergraduate “Introduction to Marine Biology” is taught at colleges in non-coastal states. Current: Journal of Marine Education, 25(2): 15-19.
Prokop, P., G. Tuncer, and R. Kvasnicak. (2007). Short-term effects of field programme on students’ knowledge and attitude toward biology: A Slovak experience. Journal of Science Education and Technology, 16 (3): 247-255.
Figure 2. At night in a motel room, students meet to make a group list of all the organisms observed that day. Field guides are helpful during these sessions. Courtesy of Matthew Landau
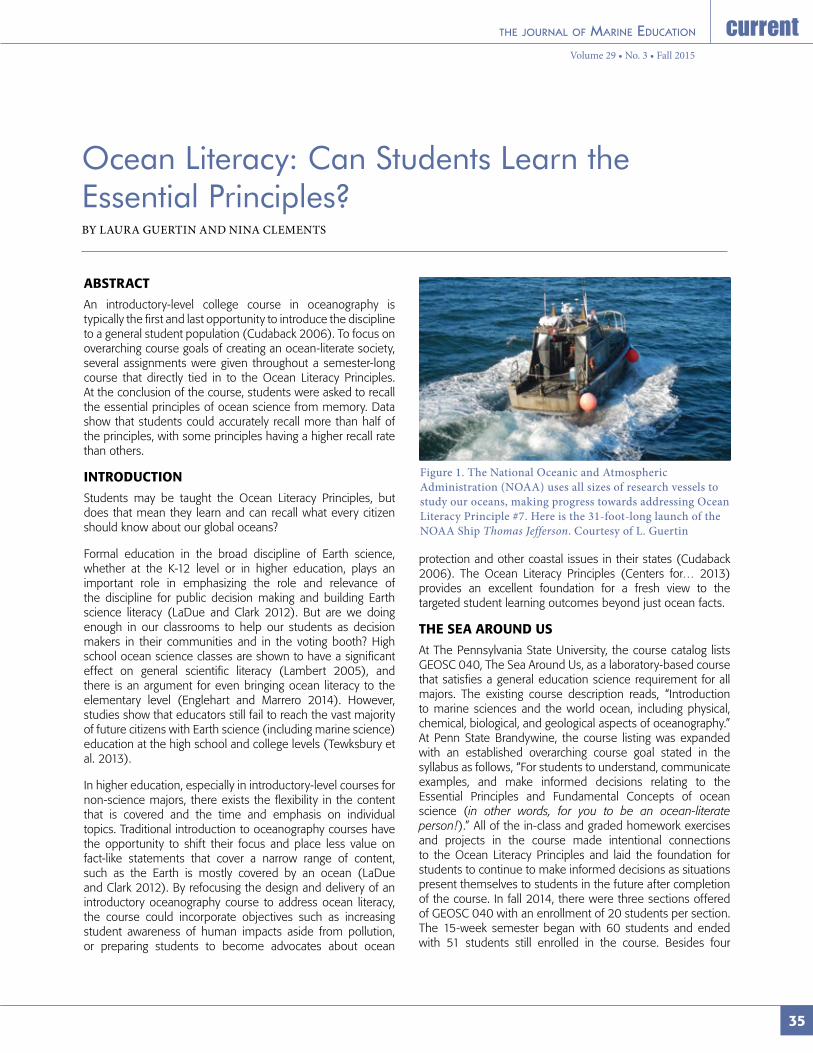
35
Volume 29 • No. 3 • Fall 2015
Ocean Literacy: Can Students Learn the Essential Principles?BY LAURA GUERTIN AND NINA CLEMENTS
ABSTRACT
An introductory-level college course in oceanography is typically the first and last opportunity to introduce the discipline to a general student population (Cudaback 2006). To focus on overarching course goals of creating an ocean-literate society, several assignments were given throughout a semester-long course that directly tied in to the Ocean Literacy Principles. At the conclusion of the course, students were asked to recall the essential principles of ocean science from memory. Data show that students could accurately recall more than half of the principles, with some principles having a higher recall rate than others.
INTRODUCTION
Students may be taught the Ocean Literacy Principles, but does that mean they learn and can recall what every citizen should know about our global oceans?
Formal education in the broad discipline of Earth science, whether at the K-12 level or in higher education, plays an important role in emphasizing the role and relevance of the discipline for public decision making and building Earth science literacy (LaDue and Clark 2012). But are we doing enough in our classrooms to help our students as decision makers in their communities and in the voting booth? High school ocean science classes are shown to have a significant effect on general scientific literacy (Lambert 2005), and there is an argument for even bringing ocean literacy to the elementary level (Englehart and Marrero 2014). However, studies show that educators still fail to reach the vast majority of future citizens with Earth science (including marine science) education at the high school and college levels (Tewksbury et al. 2013).
In higher education, especially in introductory-level courses for non-science majors, there exists the flexibility in the content that is covered and the time and emphasis on individual topics. Traditional introduction to oceanography courses have the opportunity to shift their focus and place less value on fact-like statements that cover a narrow range of content, such as the Earth is mostly covered by an ocean (LaDue and Clark 2012). By refocusing the design and delivery of an introductory oceanography course to address ocean literacy, the course could incorporate objectives such as increasing student awareness of human impacts aside from pollution, or preparing students to become advocates about ocean
protection and other coastal issues in their states (Cudaback 2006). The Ocean Literacy Principles (Centers for… 2013) provides an excellent foundation for a fresh view to the targeted student learning outcomes beyond just ocean facts.
THE SEA AROUND US
At The Pennsylvania State University, the course catalog lists GEOSC 040, The Sea Around Us, as a laboratory-based course that satisfies a general education science requirement for all majors. The existing course description reads, “Introduction to marine sciences and the world ocean, including physical, chemical, biological, and geological aspects of oceanography.” At Penn State Brandywine, the course listing was expanded with an established overarching course goal stated in the syllabus as follows, “For students to understand, communicate examples, and make informed decisions relating to the Essential Principles and Fundamental Concepts of ocean science (in other words, for you to be an ocean-literate person!).” All of the in-class and graded homework exercises and projects in the course made intentional connections to the Ocean Literacy Principles and laid the foundation for students to continue to make informed decisions as situations present themselves to students in the future after completion of the course. In fall 2014, there were three sections offered of GEOSC 040 with an enrollment of 20 students per section. The 15-week semester began with 60 students and ended with 51 students still enrolled in the course. Besides four
Figure 1. The National Oceanic and Atmospheric Administration (NOAA) uses all sizes of research vessels to study our oceans, making progress towards addressing Ocean Literacy Principle #7. Here is the 31-foot-long launch of the NOAA Ship Thomas Jefferson. Courtesy of L. Guertin
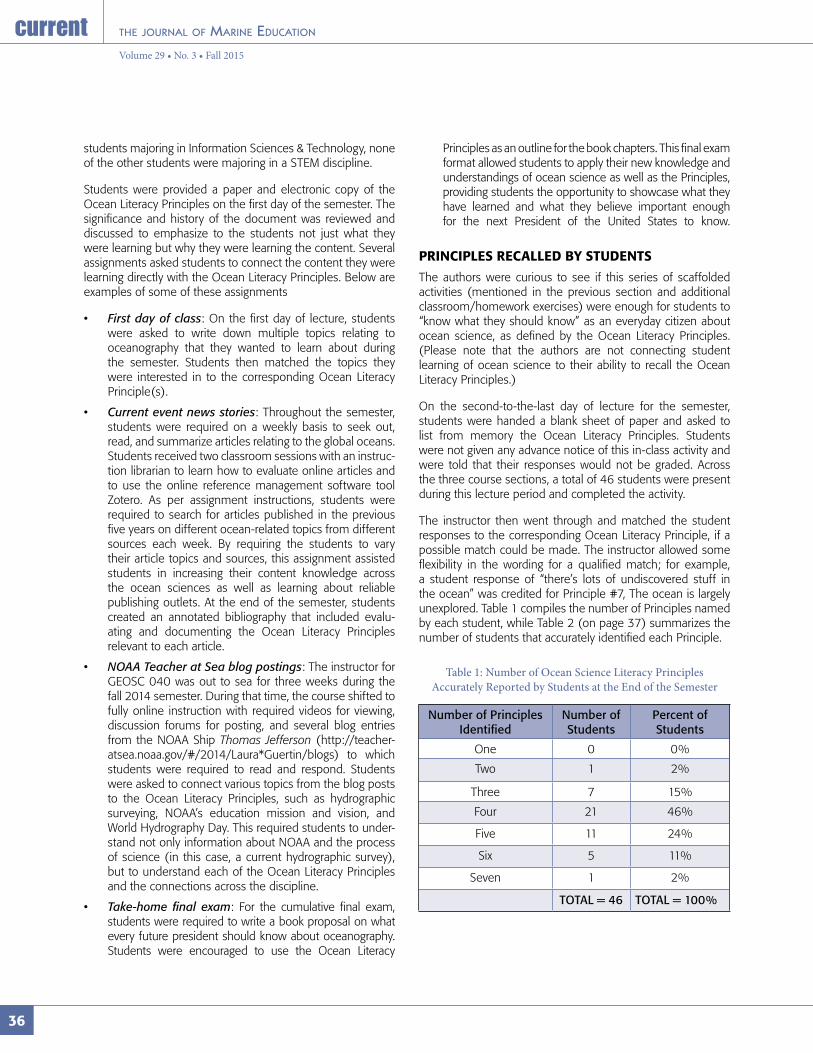
36
Volume 29 • No. 3 • Fall 2015
students majoring in Information Sciences & Technology, none of the other students were majoring in a STEM discipline.
Students were provided a paper and electronic copy of the Ocean Literacy Principles on the first day of the semester. The significance and history of the document was reviewed and discussed to emphasize to the students not just what they were learning but why they were learning the content. Several assignments asked students to connect the content they were learning directly with the Ocean Literacy Principles. Below are examples of some of these assignments
• First day of class: On the first day of lecture, students were asked to write down multiple topics relating to oceanography that they wanted to learn about during the semester. Students then matched the topics they were interested in to the corresponding Ocean Literacy Principle(s).
• Current event news stories: Throughout the semester, students were required on a weekly basis to seek out, read, and summarize articles relating to the global oceans. Students received two classroom sessions with an instruc-tion librarian to learn how to evaluate online articles and to use the online reference management software tool Zotero. As per assignment instructions, students were required to search for articles published in the previous five years on different ocean-related topics from different sources each week. By requiring the students to vary their article topics and sources, this assignment assisted students in increasing their content knowledge across the ocean sciences as well as learning about reliable publishing outlets. At the end of the semester, students created an annotated bibliography that included evalu-ating and documenting the Ocean Literacy Principles relevant to each article.
• NOAA Teacher at Sea blog postings: The instructor for GEOSC 040 was out to sea for three weeks during the fall 2014 semester. During that time, the course shifted to fully online instruction with required videos for viewing, discussion forums for posting, and several blog entries from the NOAA Ship Thomas Jefferson (http://teacher-atsea.noaa.gov/#/2014/Laura*Guertin/blogs) to which students were required to read and respond. Students were asked to connect various topics from the blog posts to the Ocean Literacy Principles, such as hydrographic surveying, NOAA’s education mission and vision, and World Hydrography Day. This required students to under-stand not only information about NOAA and the process of science (in this case, a current hydrographic survey), but to understand each of the Ocean Literacy Principles and the connections across the discipline.
• Take-home final exam: For the cumulative final exam, students were required to write a book proposal on what every future president should know about oceanography. Students were encouraged to use the Ocean Literacy
Principles as an outline for the book chapters. This final exam format allowed students to apply their new knowledge and understandings of ocean science as well as the Principles, providing students the opportunity to showcase what they have learned and what they believe important enough for the next President of the United States to know.
PRINCIPLES RECALLED BY STUDENTS
The authors were curious to see if this series of scaffolded activities (mentioned in the previous section and additional classroom/homework exercises) were enough for students to “know what they should know” as an everyday citizen about ocean science, as defined by the Ocean Literacy Principles. (Please note that the authors are not connecting student learning of ocean science to their ability to recall the Ocean Literacy Principles.)
On the second-to-the-last day of lecture for the semester, students were handed a blank sheet of paper and asked to list from memory the Ocean Literacy Principles. Students were not given any advance notice of this in-class activity and were told that their responses would not be graded. Across the three course sections, a total of 46 students were present during this lecture period and completed the activity.
The instructor then went through and matched the student responses to the corresponding Ocean Literacy Principle, if a possible match could be made. The instructor allowed some flexibility in the wording for a qualified match; for example, a student response of “there’s lots of undiscovered stuff in the ocean” was credited for Principle #7, The ocean is largely unexplored. Table 1 compiles the number of Principles named by each student, while Table 2 (on page 37) summarizes the number of students that accurately identified each Principle.
Number of Principles Identified
Number of Students
Percent of Students
One 0 0%
Two 1 2%
Three 7 15%
Four 21 46%
Five 11 24%
Six 5 11%
Seven 1 2%
TOTAL = 46 TOTAL = 100%
Table 1: Number of Ocean Science Literacy Principles Accurately Reported by Students at the End of the Semester
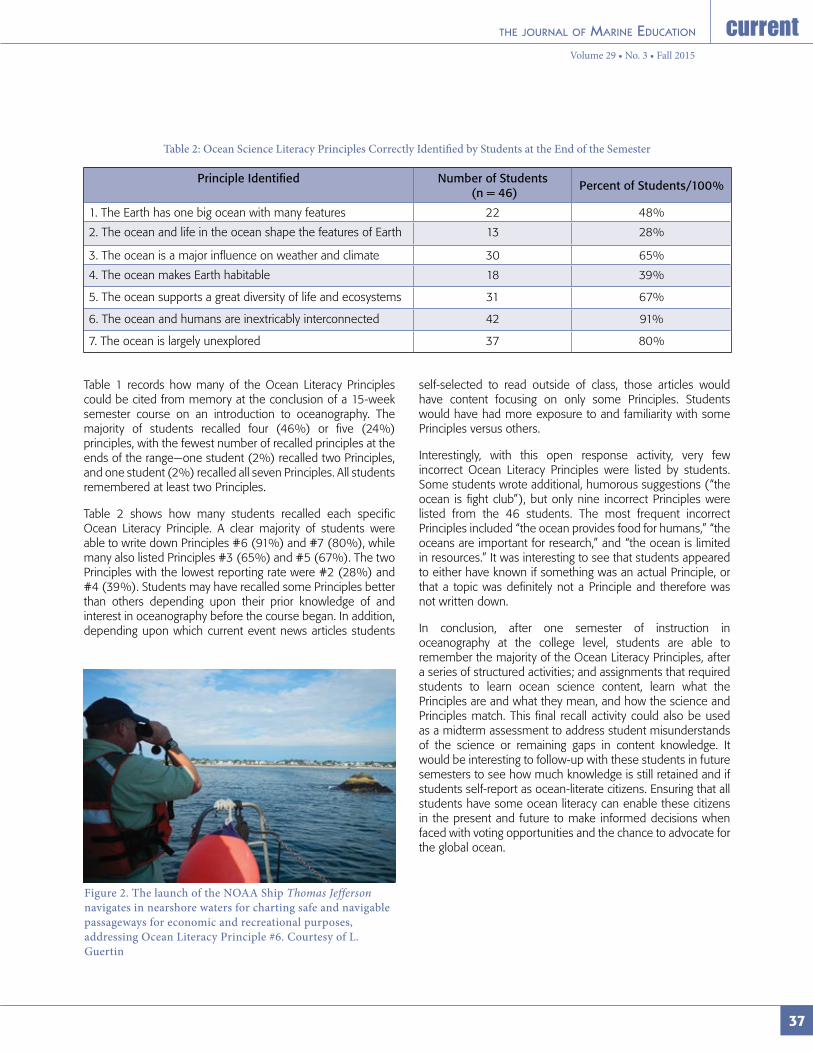
37
Volume 29 • No. 3 • Fall 2015
Principle Identified Number of Students (n = 46)
Percent of Students/100%
1. The Earth has one big ocean with many features 22 48%
2. The ocean and life in the ocean shape the features of Earth 13 28%
3. The ocean is a major influence on weather and climate 30 65%
4. The ocean makes Earth habitable 18 39%
5. The ocean supports a great diversity of life and ecosystems 31 67%
6. The ocean and humans are inextricably interconnected 42 91%
7. The ocean is largely unexplored 37 80%
Table 1 records how many of the Ocean Literacy Principles could be cited from memory at the conclusion of a 15-week semester course on an introduction to oceanography. The majority of students recalled four (46%) or five (24%) principles, with the fewest number of recalled principles at the ends of the range—one student (2%) recalled two Principles, and one student (2%) recalled all seven Principles. All students remembered at least two Principles.
Table 2 shows how many students recalled each specific Ocean Literacy Principle. A clear majority of students were able to write down Principles #6 (91%) and #7 (80%), while many also listed Principles #3 (65%) and #5 (67%). The two Principles with the lowest reporting rate were #2 (28%) and #4 (39%). Students may have recalled some Principles better than others depending upon their prior knowledge of and interest in oceanography before the course began. In addition, depending upon which current event news articles students
self-selected to read outside of class, those articles would have content focusing on only some Principles. Students would have had more exposure to and familiarity with some Principles versus others.
Interestingly, with this open response activity, very few incorrect Ocean Literacy Principles were listed by students. Some students wrote additional, humorous suggestions (“the ocean is fight club”), but only nine incorrect Principles were listed from the 46 students. The most frequent incorrect Principles included “the ocean provides food for humans,” “the oceans are important for research,” and “the ocean is limited in resources.” It was interesting to see that students appeared to either have known if something was an actual Principle, or that a topic was definitely not a Principle and therefore was not written down.
In conclusion, after one semester of instruction in oceanography at the college level, students are able to remember the majority of the Ocean Literacy Principles, after a series of structured activities; and assignments that required students to learn ocean science content, learn what the Principles are and what they mean, and how the science and Principles match. This final recall activity could also be used as a midterm assessment to address student misunderstands of the science or remaining gaps in content knowledge. It would be interesting to follow-up with these students in future semesters to see how much knowledge is still retained and if students self-report as ocean-literate citizens. Ensuring that all students have some ocean literacy can enable these citizens in the present and future to make informed decisions when faced with voting opportunities and the chance to advocate for the global ocean.
Figure 2. The launch of the NOAA Ship Thomas Jefferson navigates in nearshore waters for charting safe and navigable passageways for economic and recreational purposes, addressing Ocean Literacy Principle #6. Courtesy of L. Guertin
Table 2: Ocean Science Literacy Principles Correctly Identified by Students at the End of the Semester

38
Volume 29 • No. 3 • Fall 2015
REFERENCES
Centers for Ocean Science Education Excellence, National Geographic Society, National Oceanic and Atmospheric Administration, and College of Exploration. (2013). Ocean Literacy: The Essential Principles of Ocean Sciences For Learners of All Ages, Version 2, a jointly published brochure: http://oceanservice.noaa.gov/education/literacy/ocean_literacy.pdf.
Cudaback, C. (2006). What do college students know about the ocean? Eos Trans. AGU, 87(40): 418-421, doi:10.1029/2006EO400003.
Englehart, D. S., and M.E. Marrero. (2014). The ocean planet: Ocean literacy with young children. Current: The Journal of Marine Education, 29(1): 36-41.
LaDue, N.D., and S.K. Clark. (2012). Educator perspectives on Earth system science literacy: Challenges and priorities. Journal of Geoscience Education, 60(4): 372-383.
Lambert, J. (2005). Students’ conceptual understandings of science after participating in a high school marine science course. Journal of Geoscience Education, 53(5): 531-539.
Tewksbury, B.J., C.A. Manduca, D.W. Mogk, and R.H. Macdonald. (2013). Geoscience education for the Anthropocene, in Buckford, M. W., ed., The Impact of the Geological Sciences on Society: Geological Society of America Special Paper, 501: p.189-201.
LAURA GUERTIN, PH.D., is a Professor of Earth Science at Penn State Brandywine and NOAA Teacher at Sea Alum. Her teaching and research interests include enhancing the scientific literacy of non-science majors enrolling in introductory-level Earth science courses at the college level.
NINA CLEMENTS is a Reference and Instruction Librarian at Penn State Brandywine. In addition to instruction, her research interests include gender and creativity in libraries.
SHARE YOUR IDEAS, LESSONS, or RESEARCH in Marine Education!
The editors of Current: The Journal of Marine Education are seeking articles for upcoming general issues. We hope to review and publish articles on topics related to marine education. We seek original manuscripts that describe research, lessons, resources, or strategies for teaching marine and aquatic lessons to a variety of audiences, including science, art, literature, and maritime history.
Please submit manuscripts to the Editors at [email protected] for consideration. The deadlines for submitting articles to general issues for 2016 are November 16, 2015, April 25, 2016, July 18, 2016, and October 3, 2016.
For information on submitting articles to Current, please visit our Guide for contributors.

39
Volume 29 • No. 3 • Fall 2015
New Books and Media
One of the greatest wildlife conservation success stories on the planet was recently featured in a live TV and multi-platform three-part event, Big Blue Live.
A co-production between the world’s leading public service broadcasters, PBS, and BBC, the event was anchored from the open-air studios based at the Monterey Bay Aquarium and aboard National Oceanic and Atmospheric Administration (NOAA) research ships on the Monterey Bay National Marine Sanctuary. In each live segment and on social and streaming platforms viewers saw one of nature’s great reality shows through state-of-the-art filming technology, and with live reports from the air, sea, and below the waves.
Concurrently, the series inspired the largest and most diverse digital and social engagement integration in PBS history and one of the largest ever for a natural history program. Elements include a robust multimedia presence on numerous social and digital platforms, additional as-it-happens content on pbs.org/bigbluelive, and integration of social and digital elements into the three-night live broadcast.
PBS LearningMedia, a media-on-demand digital service that provides PreK-12 educators free access to more than 100,000 digital resources, developed a marine science collection, marine word search, and marine bingo that could be played alongside the broadcast at home or in classrooms. The group hosted a wildly successful Twitter Party—the hashtag #BigBlueClass reached 2,866,121 users.
Science collaborators such as the National Science Teachers Association (NSTA) added a promotional shout out to tune-in to Big Blue Live and join our Twitter Party to their national events calendar and promoted to their teacher network.
Continued on next page
Send review copies and news about books, videos, apps, and other new media to the Current Editor at [email protected].
Big Blue Live!
©M
onte
rey
Bay
Aqu
ariu
m, p
hoto
by
Tyso
n V.
Rin
inge
r
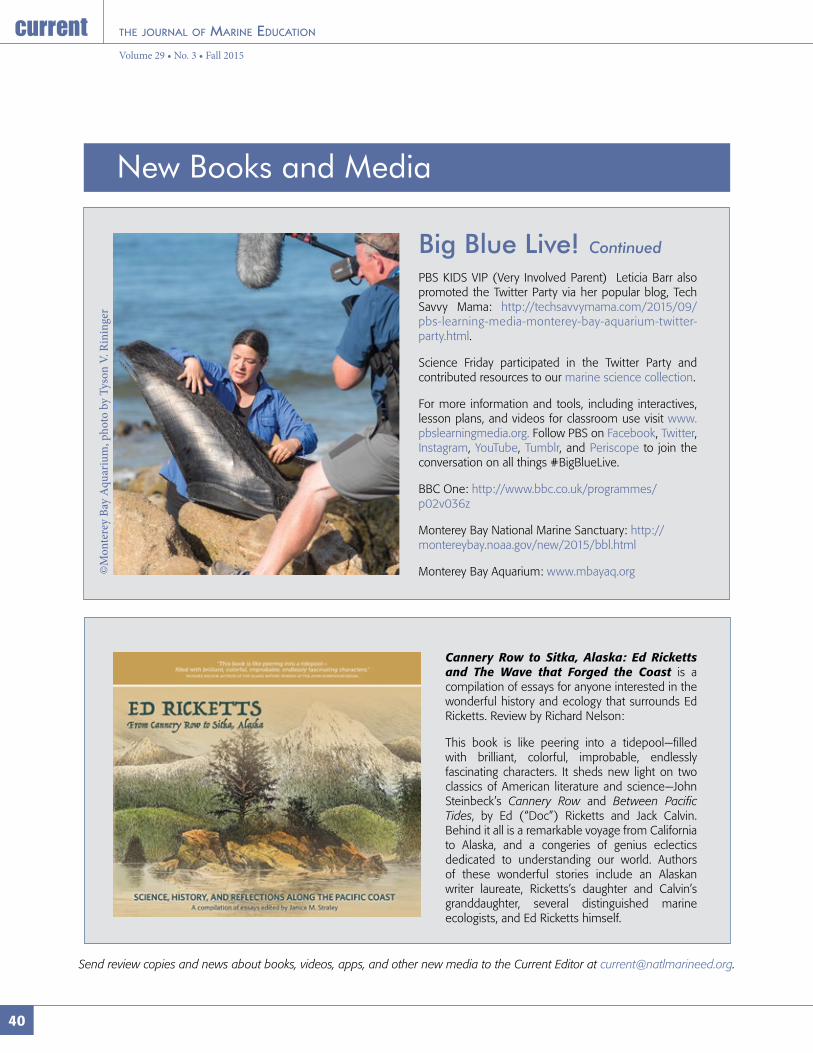
40
Volume 29 • No. 3 • Fall 2015
New Books and Media
Cannery Row to Sitka, Alaska: Ed Ricketts and The Wave that Forged the Coast is a compilation of essays for anyone interested in the wonderful history and ecology that surrounds Ed Ricketts. Review by Richard Nelson:
This book is like peering into a tidepool—filled with brilliant, colorful, improbable, endlessly fascinating characters. It sheds new light on two classics of American literature and science—John Steinbeck’s Cannery Row and Between Pacific Tides, by Ed (“Doc”) Ricketts and Jack Calvin. Behind it all is a remarkable voyage from California to Alaska, and a congeries of genius eclectics dedicated to understanding our world. Authors of these wonderful stories include an Alaskan writer laureate, Ricketts’s daughter and Calvin’s granddaughter, several distinguished marine ecologists, and Ed Ricketts himself.
PBS KIDS VIP (Very Involved Parent) Leticia Barr also promoted the Twitter Party via her popular blog, Tech Savvy Mama: http://techsavvymama.com/2015/09/pbs-learning-media-monterey-bay-aquarium-twitter-party.html.
Science Friday participated in the Twitter Party and contributed resources to our marine science collection.
For more information and tools, including interactives, lesson plans, and videos for classroom use visit www.pbslearningmedia.org. Follow PBS on Facebook, Twitter, Instagram, YouTube, Tumblr, and Periscope to join the conversation on all things #BigBlueLive.
BBC One: http://www.bbc.co.uk/programmes/p02v036z
Monterey Bay National Marine Sanctuary: http://montereybay.noaa.gov/new/2015/bbl.html
Monterey Bay Aquarium: www.mbayaq.org
Big Blue Live! Continued
Send review copies and news about books, videos, apps, and other new media to the Current Editor at [email protected].
©M
onte
rey
Bay
Aqu
ariu
m, p
hoto
by
Tyso
n V.
Rin
inge
r

Join us June 25th through July 1st in Orlando, Florida. The theme of this year’s conference is
“Making Waves: Current Connections in Marine Science.”
The conference brings together formal and informal educators, scientists, students, and government and industry members to share ideas on the world of water.
Committees and Exhibits: Interested in joining the conference committee or exhibiting at NMEA16? Please contact us at [email protected].
Accommodations: NMEA16 room rates at the Renaissance Orlando start at $129.00 per night and reservations can be made now at
https://resweb.passkey.com/go/NationalMarineEducators (be sure to mention the National Marine Educators Association 2016 Conference).
NMEA16 Registration Opening Soon! More details to follow and are available at www.fmsea.org/NMEA16.
41

national marine educators associationc/o Jeannette Connors4321 Hartwick Road, Suite 300College Park, MD 20740
inside Volume 29 • No. 3 • Fall 2015
Underserved Youth and an Over-Used Wetland: The RESTOR Project Promotes a Win-Win Relationship at Ormond Beach
Activity: Litter isn’t Glitter: Beaches Should Be Clean
Reel in Students: Using Real World Learning Objects (RWLO) and Real-Time Data in Ocean Science
Activity: Corals: The Essence of Fluorescence
Teaching An Undergraduate “Tropical Marine Biology” Course
Ocean Literacy: Can Students Learn the Essential Principles?
New Books and Media
2016 National Marine Educators Association Conference
Printed on Recycled Paper