Embed Size (px)
Citation preview
WOOD DESIGN FOCUS V. 25, N. 1 1
Woo
d D
esig
n A JOURNAL OF
CONTEMPORARY
WOOD ENGINEERING
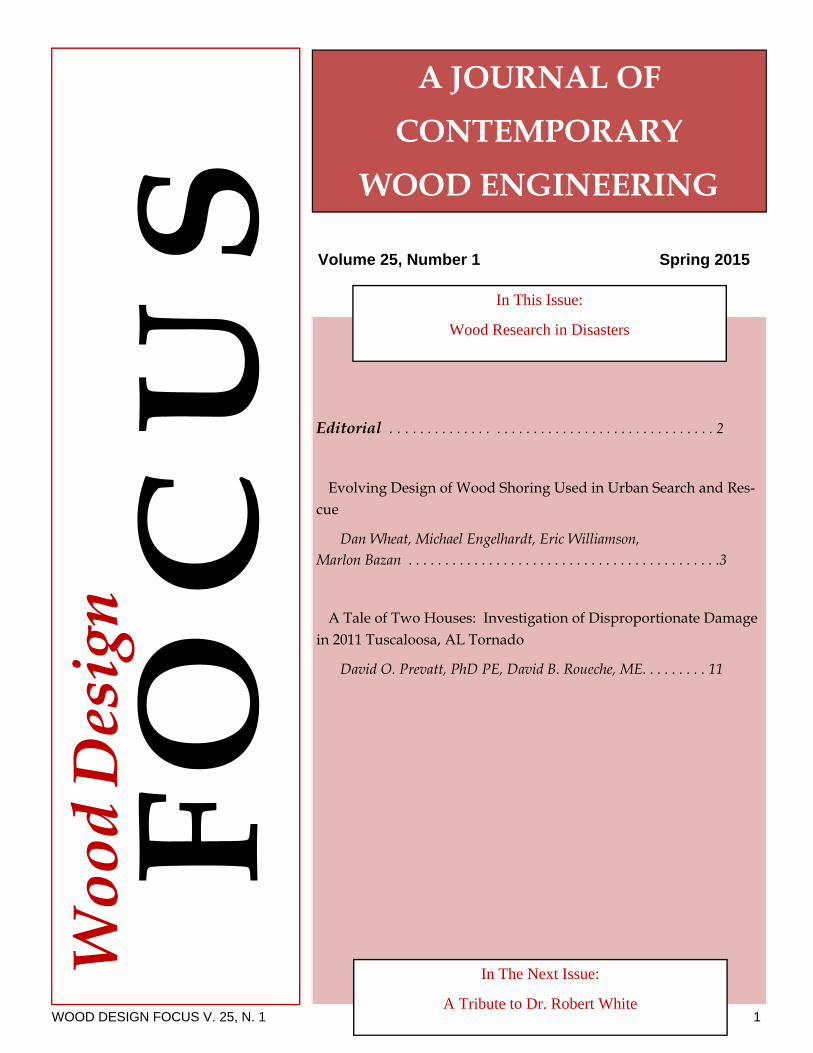
Editorial . . . . . . . . . . . . . . . . . . . . . . . . . . . . . . . . . . . . . . . . . . . . 2
Evolving Design of Wood Shoring Used in Urban Search and Res-cue
Dan Wheat, Michael Engelhardt, Eric Williamson, Marlon Bazan . . . . . . . . . . . . . . . . . . . . . . . . . . . . . . . . . . . . . . . . . . .3
A Tale of Two Houses: Investigation of Disproportionate Damage in 2011 Tuscaloosa, AL Tornado
David O. Prevatt, PhD PE, David B. Roueche, ME. . . . . . . . . 11
In This Issue:
Wood Research in Disasters
Volume 25, Number 1 Spring 2015
In The Next Issue:
A Tribute to Dr. Robert White
WOOD DESIGN FOCUS V. 25, N. 1 2
Editorial WOOD DESIGN FOCUS
Published by the Forest Products Society
EDITORIAL BOARD CHAIR
Daniel P. Hindman, Ph.D.
EDITORIAL COMMITTEE Larry Beineke, P.E., Ph.D. Don Bender, P.E., Ph.D.
Chris Brandt, P.E. Cheryl Cieko, AIA CSI Robert Leichti, Ph.D.
Joseph R. Loferski, Ph.D. John “Buddy” Showalter, P.E.
Thomas D. Skaggs, P.E., Ph.D Frank Woeste, P.E., Ph.D.
Wood Design Focus (ISSN 1066-5757)
is published quarterly by: Forest Products Society
15 Technology Parkway South Peachtree Corners, GA 30092
Phone: (855) 475-0291 Fax: (301) 604-0158 www.forestprod.org
The annual subscription rate is free to members of the Forest Products Society and $125 USD for Institutions who are members. For nonmembers, the subscription rate is $155USD for individuals and $199USD for institutions and libraries. The Forest Products Society and its agents are not responsible for the views expressed by the authors. Individual readers of this journal, and nonprofit libraries acting for them, are permitted to make fair use of the material in it, such as copying an article for use in teaching or research. Permission is granted to quote from this journal with the customary acknowledgement of the source.
© 2015 Forest Products Society
This issue of Wood Design Focus presents two papers related to disaster engineering. After a disaster such as an earthquake, tornado or the like, when a building is left standing or partially standing, how can it be reinforced so that it is safe for rescuers to enter? The question is addressed by Professor Dan Wheat of University of Texas and his co-authors in the first article in which they present improved design procedures for light-frame wood shoring used in urban search and rescue. They used field observations and laboratory experiments combined with finite element modeling to develop improved load carrying capacity of various shoring designs. The importance of the ductility of the nails used to connect the plywood panels to the columns of the shores is shown. They show six different shoring designs that can be built using wood columns and various bracings methods consisting of diagonal braces or plywood panels to reinforce the shores.
The second paper in this issue, by Professor David Prevatt and David Roueche of the University of Florida, presents two case studies of wood framed houses that were damaged during the 2011 tornado that hit Tuscaloosa Alabama. The homes sustained damage that appeared to be disproportionate compared to the damage suffered by surrounding buildings. The authors investigate the evidence and develop several theories to explain the observed damage. For example, the roof overhangs which are excellent for protecting the building from weathering may have contributed to the loss of the roof during the tornado which then lead to the collapse of the walls. Another example is the lack of adequate connections between the wood framed house and the foundation which allowed the house to leave its foundation and come to rest nearly 40 feet away. The presence of diagonal board sheathing meant that many nails were used to fasten the sheathing to the framing and this produced a strong structure that moved as rigid body during the high winds. The authors discuss how can we use this information to improve modern houses that use plywood or OBS sheathing.
On behalf of the many authors that contributed to this issue, I hope you find this information useful. Your comments and questions are welcome.
Joseph R. Loferski, PhD, Department of Sustainable Biomaterials, Virginia Tech. [email protected].
WOOD DESIGN FOCUS V. 25, N. 1 3
Abstract
This paper traces the path toward improved design procedures for light-frame wood shoring used in urban search and rescue. It begins with field observations and field tests and a design procedure that resulted from them, then laboratory tests and validated finite element modeling that expanded the prior work in such a way that interpolations and extrapolations of current design could be made, all in an effort to improve the load-carrying capacity. The outcomes include recommended geometric design, or configuration, changes based on laboratory observations blended with rational analysis.
Introduction
Structures that have been damaged from either man-made or natural phenomena often need temporary stabilization in order to prevent further collapse, to accommodate shifting loads in various directions, and to provide safety for rescue personnel. While there are several types of shores for various applications, two of the more reliable types of wood shoring used for supporting higher load levels are the laced post—mostly wood framing members—and the plywood laced post—wood framing combined with plywood. This paper addresses design challenges by starting with the initial basic ideas supporting the design, summarizing observed laboratory behavior as well as finite element studies, then suggesting new designs configurations based on a synthesis of the laboratory and computational efforts. Thus, it encompasses a relatively comprehensive look at the evolution of shore design characterized by field observation, laboratory observation, computer modeling, and informed design detail changes.
Laced post, or LP shores, are unique wood constructions that resemble a small-scale 3-story
skeletally-framed building with continuous columns, but with no floor diaphragm and possessing “soft” connections. Plywood laced post, or PLP shores, also resemble a skeletal structure with unbraced, or barely-braced, shear walls, no floor diaphragms, and, again, “soft” connections. Both are characterized by continuous vertical corner posts acting as continuous columns. The LP shore consists completely of lumber framing around the perimeter; the only lumber in the PLP, other than that used at the top and the base in contact with the damaged structure, are the corner posts. Under the presence of vertical forces and/or lateral forces, these structures offer unique design challenges. The wood shore is an unusual structure and it is one that few engineers would face in a design scenario, but that obviates neither greater understanding of its behavior nor developing more rational design procedures.
Current Construction Details and Design
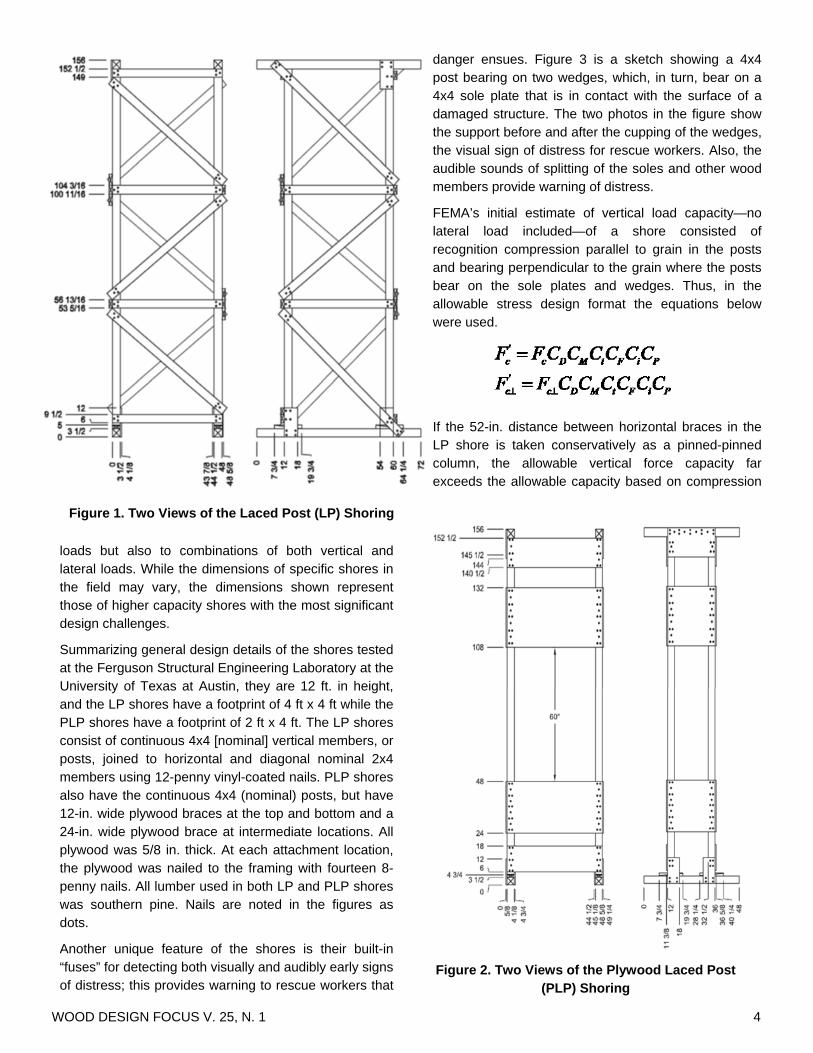
Since wood shores that are used in urban search and rescue are not a common type of structure, some construction features are given in Figure 1 for an LP shore and Figure 2 for a PLP shore. The shores illustrated in the Figures 1 and 2 are similar in their dimensions to shores tested by FEMA Urban Search and Rescue, and summarized in Testing of US&R Shoring Systems Under Non-Ideal Conditions (Protection Engineering Consultants, 2011), in an effort to estimate vertical load capacities and to assess design assumptions in the U.S. Army Corps of Engineers Field Operations Guide (FEMA 2009). As well, they have the same dimensions as shores tested at the University of Texas at Austin in a program (Bazan, 2012 and McCord, 2012) aimed at broadening the understanding of the structural behavior to include the measured response of shores not simply to vertical
WOOD DESIGN FOCUS V. 25, N. 1 4
loads but also to combinations of both vertical and lateral loads. While the dimensions of specific shores in the field may vary, the dimensions shown represent those of higher capacity shores with the most significant design challenges.
Summarizing general design details of the shores tested at the Ferguson Structural Engineering Laboratory at the University of Texas at Austin, they are 12 ft. in height, and the LP shores have a footprint of 4 ft x 4 ft while the PLP shores have a footprint of 2 ft x 4 ft. The LP shores consist of continuous 4x4 [nominal] vertical members, or posts, joined to horizontal and diagonal nominal 2x4 members using 12-penny vinyl-coated nails. PLP shores also have the continuous 4x4 (nominal) posts, but have 12-in. wide plywood braces at the top and bottom and a 24-in. wide plywood brace at intermediate locations. All plywood was 5/8 in. thick. At each attachment location, the plywood was nailed to the framing with fourteen 8-penny nails. All lumber used in both LP and PLP shores was southern pine. Nails are noted in the figures as dots.
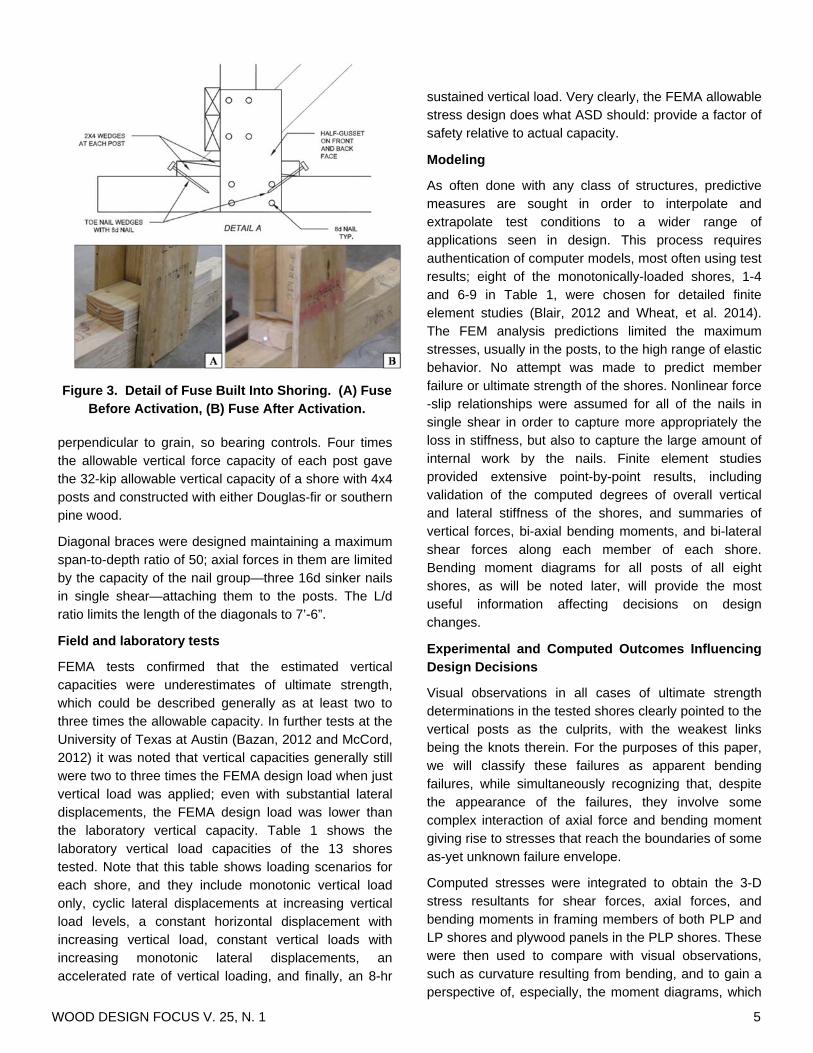
Another unique feature of the shores is their built-in “fuses” for detecting both visually and audibly early signs of distress; this provides warning to rescue workers that
danger ensues. Figure 3 is a sketch showing a 4x4 post bearing on two wedges, which, in turn, bear on a 4x4 sole plate that is in contact with the surface of a damaged structure. The two photos in the figure show the support before and after the cupping of the wedges, the visual sign of distress for rescue workers. Also, the audible sounds of splitting of the soles and other wood members provide warning of distress.
FEMA’s initial estimate of vertical load capacity—no lateral load included—of a shore consisted of recognition compression parallel to grain in the posts and bearing perpendicular to the grain where the posts bear on the sole plates and wedges. Thus, in the allowable stress design format the equations below were used.
If the 52-in. distance between horizontal braces in the LP shore is taken conservatively as a pinned-pinned column, the allowable vertical force capacity far exceeds the allowable capacity based on compression
Figure 1. Two Views of the Laced Post (LP) Shoring
Figure 2. Two Views of the Plywood Laced Post (PLP) Shoring
WOOD DESIGN FOCUS V. 25, N. 1 5
perpendicular to grain, so bearing controls. Four times the allowable vertical force capacity of each post gave the 32-kip allowable vertical capacity of a shore with 4x4 posts and constructed with either Douglas-fir or southern pine wood.
Diagonal braces were designed maintaining a maximum span-to-depth ratio of 50; axial forces in them are limited by the capacity of the nail group—three 16d sinker nails in single shear—attaching them to the posts. The L/d ratio limits the length of the diagonals to 7’-6”.
Field and laboratory tests
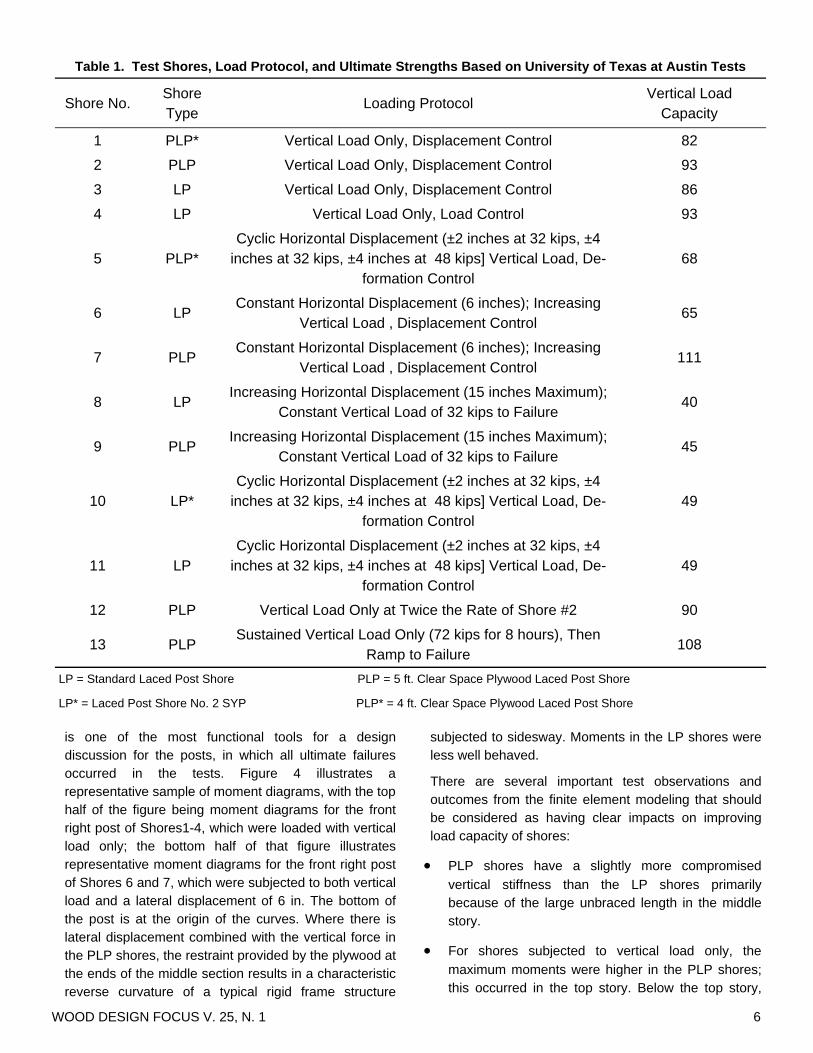
FEMA tests confirmed that the estimated vertical capacities were underestimates of ultimate strength, which could be described generally as at least two to three times the allowable capacity. In further tests at the University of Texas at Austin (Bazan, 2012 and McCord, 2012) it was noted that vertical capacities generally still were two to three times the FEMA design load when just vertical load was applied; even with substantial lateral displacements, the FEMA design load was lower than the laboratory vertical capacity. Table 1 shows the laboratory vertical load capacities of the 13 shores tested. Note that this table shows loading scenarios for each shore, and they include monotonic vertical load only, cyclic lateral displacements at increasing vertical load levels, a constant horizontal displacement with increasing vertical load, constant vertical loads with increasing monotonic lateral displacements, an accelerated rate of vertical loading, and finally, an 8-hr
sustained vertical load. Very clearly, the FEMA allowable stress design does what ASD should: provide a factor of safety relative to actual capacity.
Modeling
As often done with any class of structures, predictive measures are sought in order to interpolate and extrapolate test conditions to a wider range of applications seen in design. This process requires authentication of computer models, most often using test results; eight of the monotonically-loaded shores, 1-4 and 6-9 in Table 1, were chosen for detailed finite element studies (Blair, 2012 and Wheat, et al. 2014). The FEM analysis predictions limited the maximum stresses, usually in the posts, to the high range of elastic behavior. No attempt was made to predict member failure or ultimate strength of the shores. Nonlinear force-slip relationships were assumed for all of the nails in single shear in order to capture more appropriately the loss in stiffness, but also to capture the large amount of internal work by the nails. Finite element studies provided extensive point-by-point results, including validation of the computed degrees of overall vertical and lateral stiffness of the shores, and summaries of vertical forces, bi-axial bending moments, and bi-lateral shear forces along each member of each shore. Bending moment diagrams for all posts of all eight shores, as will be noted later, will provide the most useful information affecting decisions on design changes.
Experimental and Computed Outcomes Influencing Design Decisions
Visual observations in all cases of ultimate strength determinations in the tested shores clearly pointed to the vertical posts as the culprits, with the weakest links being the knots therein. For the purposes of this paper, we will classify these failures as apparent bending failures, while simultaneously recognizing that, despite the appearance of the failures, they involve some complex interaction of axial force and bending moment giving rise to stresses that reach the boundaries of some as-yet unknown failure envelope.
Computed stresses were integrated to obtain the 3-D stress resultants for shear forces, axial forces, and bending moments in framing members of both PLP and LP shores and plywood panels in the PLP shores. These were then used to compare with visual observations, such as curvature resulting from bending, and to gain a perspective of, especially, the moment diagrams, which
Figure 3. Detail of Fuse Built Into Shoring. (A) Fuse Before Activation, (B) Fuse After Activation.
WOOD DESIGN FOCUS V. 25, N. 1 6
Table 1. Test Shores, Load Protocol, and Ultimate Strengths Based on University of Texas at Austin Tests
Shore No. Shore Type
Loading Protocol Vertical Load
Capacity
1 PLP* Vertical Load Only, Displacement Control 82
2 PLP Vertical Load Only, Displacement Control 93
3 LP Vertical Load Only, Displacement Control 86
4 LP Vertical Load Only, Load Control 93
5 PLP* Cyclic Horizontal Displacement (±2 inches at 32 kips, ±4
inches at 32 kips, ±4 inches at 48 kips] Vertical Load, De-formation Control
68
6 LP Constant Horizontal Displacement (6 inches); Increasing
Vertical Load , Displacement Control 65
7 PLP Constant Horizontal Displacement (6 inches); Increasing
Vertical Load , Displacement Control 111
8 LP Increasing Horizontal Displacement (15 inches Maximum);
Constant Vertical Load of 32 kips to Failure 40
9 PLP Increasing Horizontal Displacement (15 inches Maximum);
Constant Vertical Load of 32 kips to Failure 45
10 LP* Cyclic Horizontal Displacement (±2 inches at 32 kips, ±4
inches at 32 kips, ±4 inches at 48 kips] Vertical Load, De-formation Control
49
11 LP Cyclic Horizontal Displacement (±2 inches at 32 kips, ±4
inches at 32 kips, ±4 inches at 48 kips] Vertical Load, De-formation Control
49
12 PLP Vertical Load Only at Twice the Rate of Shore #2 90
13 PLP Sustained Vertical Load Only (72 kips for 8 hours), Then
Ramp to Failure 108
LP = Standard Laced Post Shore PLP = 5 ft. Clear Space Plywood Laced Post Shore
LP* = Laced Post Shore No. 2 SYP PLP* = 4 ft. Clear Space Plywood Laced Post Shore
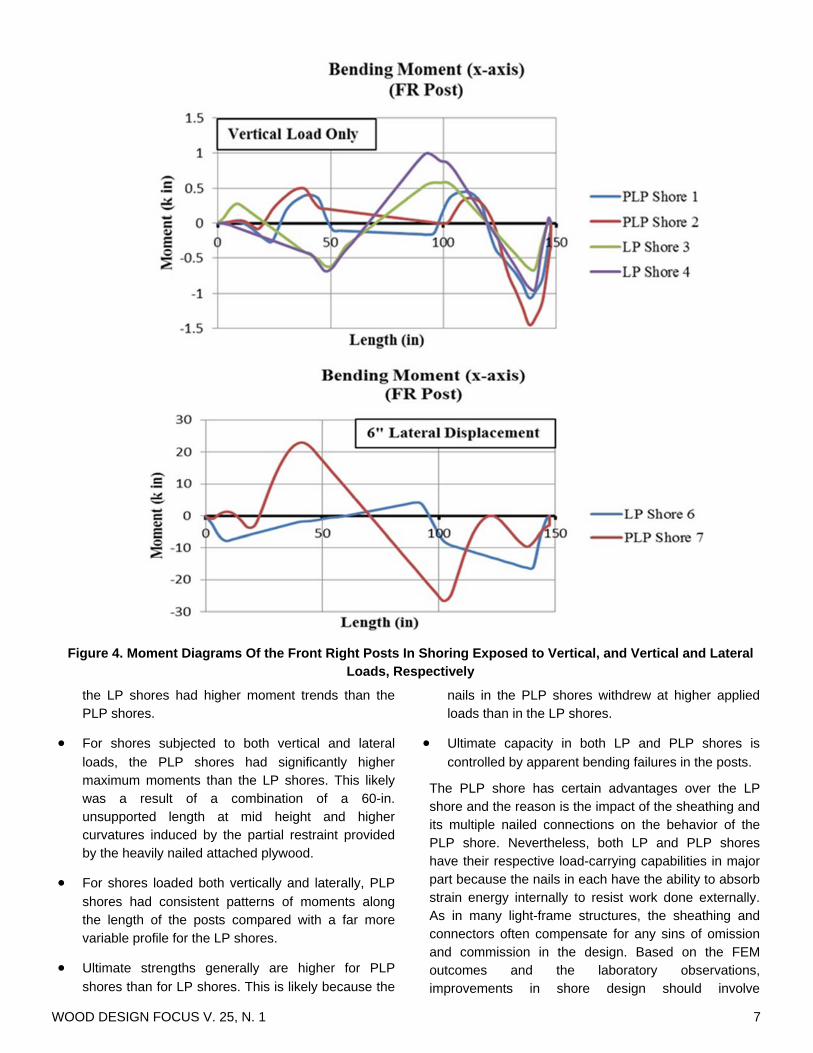
is one of the most functional tools for a design discussion for the posts, in which all ultimate failures occurred in the tests. Figure 4 illustrates a representative sample of moment diagrams, with the top half of the figure being moment diagrams for the front right post of Shores1-4, which were loaded with vertical load only; the bottom half of that figure illustrates representative moment diagrams for the front right post of Shores 6 and 7, which were subjected to both vertical load and a lateral displacement of 6 in. The bottom of the post is at the origin of the curves. Where there is lateral displacement combined with the vertical force in the PLP shores, the restraint provided by the plywood at the ends of the middle section results in a characteristic reverse curvature of a typical rigid frame structure
subjected to sidesway. Moments in the LP shores were less well behaved.
There are several important test observations and outcomes from the finite element modeling that should be considered as having clear impacts on improving load capacity of shores:
PLP shores have a slightly more compromised
vertical stiffness than the LP shores primarily because of the large unbraced length in the middle story.
For shores subjected to vertical load only, the
maximum moments were higher in the PLP shores; this occurred in the top story. Below the top story,
WOOD DESIGN FOCUS V. 25, N. 1 7
the LP shores had higher moment trends than the PLP shores.
For shores subjected to both vertical and lateral
loads, the PLP shores had significantly higher maximum moments than the LP shores. This likely was a result of a combination of a 60-in. unsupported length at mid height and higher curvatures induced by the partial restraint provided by the heavily nailed attached plywood.
For shores loaded both vertically and laterally, PLP
shores had consistent patterns of moments along the length of the posts compared with a far more variable profile for the LP shores.
Ultimate strengths generally are higher for PLP
shores than for LP shores. This is likely because the
nails in the PLP shores withdrew at higher applied loads than in the LP shores.
Ultimate capacity in both LP and PLP shores is
controlled by apparent bending failures in the posts.
The PLP shore has certain advantages over the LP shore and the reason is the impact of the sheathing and its multiple nailed connections on the behavior of the PLP shore. Nevertheless, both LP and PLP shores have their respective load-carrying capabilities in major part because the nails in each have the ability to absorb strain energy internally to resist work done externally. As in many light-frame structures, the sheathing and connectors often compensate for any sins of omission and commission in the design. Based on the FEM outcomes and the laboratory observations, improvements in shore design should involve
Figure 4. Moment Diagrams Of the Front Right Posts In Shoring Exposed to Vertical, and Vertical and Lateral Loads, Respectively
WOOD DESIGN FOCUS V. 25, N. 1 8
investigating more judicious placements of plywood to the posts of PLP shores in order to minimize unsupported lengths in them. As well, plywood should be considered in the LP shores.
Design Modifications
Figures 1 and 2 illustrated the configurations for the tested and modeled shores. Recalling the advantages provided by plywood and nails, a total of six design refinements or modifications were explored. The first five design modifications were for the PLP shores; the last was for the LP shores, and all are shown in Figure 5. Each PLP shore was analyzed for each design modification; the LP shores were analyzed for just one. A description of each modification follows.
Modification #1
The first design change was to affect behavior of the PLP shore by simply moving the two levels of plywood braces toward the vertical center of the tower; the result was three equidistant unbraced lengths for the posts. As noted earlier, the PLP shores had compromised vertical stiffness because of the large unbraced center story, so a lesson was borrowed from the LP configuration with equal story heights.
Modification #2
The second design refinement for the PLP shore was the addition of 12-in. wide plywood braces at mid-height of the shore while keeping all other members in their original positions. The idea behind this modification was that these braces would help to increase the average vertical stiffness of the shore and mitigate the bending effect in the mid height of the posts.
Modification #3
In order to compare the effectiveness of adding different bracing systems to the posts of the PLP shores, an LP-like set of horizontal and diagonal lumber braces were added between the plywood braces configuration was added for the third design change. The major goal in this design change was to decrease the bending moments developed in the posts during lateral loading.
Modification #4
The fourth design change was implemented to demonstrate what happens when the plywood braces from the original PLP design were combined at mid-height of the shore to form a single level of bracing. It was anticipated that nail slips could be reduced and outward bowing of the posts in the middle of the shore would be minimized, but the risk is that the stiffer brace may attract higher moments in the posts.
Modification #5
The fifth and final design change made to the PLP shores consisted of full-sheathing on all four sides of the shore. To maximize the effect of the plywood braces, each member was fastened to intermediate framing members. Consequently, the system mimicked that of a shear wall, providing enormous lateral stiffness to the shore. Of particular concern was the response of this shore to lateral loading at the top.
Modification #6
The only design modification investigated for the LP shores consisted of replacing the diagonal braces in the second story with sheathing. Each plywood brace in this
Figure 5. Modified PLP and LP Shoring, Respectively, Based on University Texas at Austin Testing and Modeling
WOOD DESIGN FOCUS V. 25, N. 1 9
design is fastened to the neighboring posts using the same layout as the PLP shores. Also, a small gap separated the top and bottom edges of each plywood brace from the adjacent horizontal braces. Of particular interest was the nail-slip behavior under lateral loading.
A Brief View at Moments
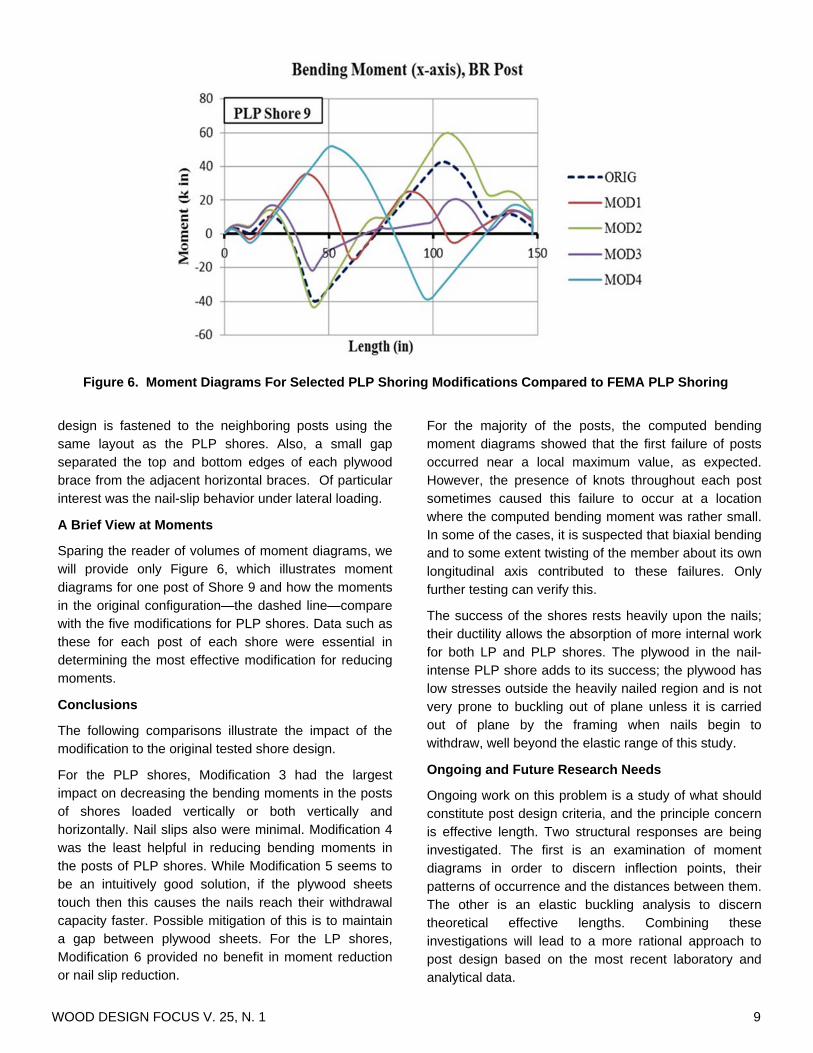
Sparing the reader of volumes of moment diagrams, we will provide only Figure 6, which illustrates moment diagrams for one post of Shore 9 and how the moments in the original configuration—the dashed line—compare with the five modifications for PLP shores. Data such as these for each post of each shore were essential in determining the most effective modification for reducing moments.
Conclusions
The following comparisons illustrate the impact of the modification to the original tested shore design.
For the PLP shores, Modification 3 had the largest impact on decreasing the bending moments in the posts of shores loaded vertically or both vertically and horizontally. Nail slips also were minimal. Modification 4 was the least helpful in reducing bending moments in the posts of PLP shores. While Modification 5 seems to be an intuitively good solution, if the plywood sheets touch then this causes the nails reach their withdrawal capacity faster. Possible mitigation of this is to maintain a gap between plywood sheets. For the LP shores, Modification 6 provided no benefit in moment reduction or nail slip reduction.
For the majority of the posts, the computed bending moment diagrams showed that the first failure of posts occurred near a local maximum value, as expected. However, the presence of knots throughout each post sometimes caused this failure to occur at a location where the computed bending moment was rather small. In some of the cases, it is suspected that biaxial bending and to some extent twisting of the member about its own longitudinal axis contributed to these failures. Only further testing can verify this.
The success of the shores rests heavily upon the nails; their ductility allows the absorption of more internal work for both LP and PLP shores. The plywood in the nail-intense PLP shore adds to its success; the plywood has low stresses outside the heavily nailed region and is not very prone to buckling out of plane unless it is carried out of plane by the framing when nails begin to withdraw, well beyond the elastic range of this study.
Ongoing and Future Research Needs
Ongoing work on this problem is a study of what should constitute post design criteria, and the principle concern is effective length. Two structural responses are being investigated. The first is an examination of moment diagrams in order to discern inflection points, their patterns of occurrence and the distances between them. The other is an elastic buckling analysis to discern theoretical effective lengths. Combining these investigations will lead to a more rational approach to post design based on the most recent laboratory and analytical data.
Figure 6. Moment Diagrams For Selected PLP Shoring Modifications Compared to FEMA PLP Shoring
WOOD DESIGN FOCUS V. 25, N. 1 10
Our research had its limitations, but it gave direction to possible future laboratory and FEM studies. Three topics are essential. One is both laboratory and FEM analysis of shores with loads and lateral displacements applied obliquely with respect to the sides of the shores. Another is to use in-grade test data to simulate ultimate strength in shores, or at least the first apparent bending failure. The third is, of course, laboratory testing of the suggested design modifications.
Acknowledgments
The authors must acknowledge the advice given to us by David Hammond and John O’Connell, both with vast experience and associations with FEMA Urban Search and Rescue. Their counsel during the laboratory testing was invaluable. As well, the authors also want to thank the Department of Homeland Security, which funded most of the laboratory testing. Finally, we wish to acknowledge the thought, labor, ideas and technical talents of the two graduate students who worked on this project: Steven Blair and Scott McCord.
References
Blair, Robert Stevenson. 2012. “Finite Element Analysis of Wood Shoring Towers used in Urban Search and Rescue.” Thesis submitted at the University of Texas at Austin, in partial fulfilment of the requirements for the Master of Science degree.
Bazan, M., Engelhardt, M.D., Wheat, D.L., and Hammond, D.: Testing of US&R shoring systems under non-Ideal conditions. In: Proceedings of the 6th Congress on Forensic Engineering, 1024-1033, 2012.
FEMA Urban Search and Rescue Structures Sub-group, Urban Search and Rescue Specialist Field Operations Guide (FOG), 6th Edition, February 2009.
McCord, S.J. 2012. “Testing of Emergency Wood Shoring Towers for Use in Urban Search and rescue
Operations.” Thesis submitted at the University of Texas at Austin, in partial fulfilment of the requirements for the Master of Science degree.
Protection Engineering Consultants. 2011. “Testing of US&R Shoring Systems Under Non-Ideal Conditions.” Test Report No. 10-086 prepared for the U.S. Department of Homeland Security.
Wheat, D.L., Engelhardt, M.D., Williamson, E.B., and Bazan, M., “Informed Design from FEM Analysis of Wood Shoring Used in Urban Search and Rescue,” Proceedings of the World Conference on Timber Engineering, Quebec City, Canada, August 2014.
Dan Wheat, Ph.D. PE is Associate Professor, Department of Civil, Architectural and Environmental Engineering, University of Texas at Austin. [email protected].
Michael Engelhardt Ph.D. PE is Professor, Department of Civil, Architectural and Environmental Engineering, University of Texas at Austin. [email protected].
Eric Williamson Ph.D. PE is Professor, Department of Civil, Architectural and Environmental Engineering, University of Texas at Austin. [email protected].
Marlon Bazan PhD is Project Engineer, Protection Engineering Consultants. [email protected].
WOOD DESIGN FOCUS V. 25, N. 1 11
Introduction
In the aftermath of particularly destructive tornadoes, it is common for teams of investigators to assess the damage to individual structures. Those efforts further our understanding of tornadoes and their interaction with the built environment, with the objective of reducing the potential for such destruction. Despite over a hundred years of documented engineering assessments however, much remains unknown about tornadoes and tornado-structure interaction, and as a result tornado damage can sometimes be difficult to explain based upon observations of the aftermath only. This has led to many unusual phenomena encountered in tornadoes being attributed to the inherent “randomness” of tornadoes. For example, when one structure is completely destroyed in while several adjacent structures suffer only minor damage, the destruction is often attributed to wandering of the tornado’s vortex, or the presence of a sub-vortex striking one house but leaving the other undamaged. However, structural damage is due to a combination of factors; meteorological, geometric (e.g., location, orientation, shape, topography), and structural (material strength and construction) factors. Our reliance on the final observable damage state contributes to greater uncertainty in determining the predominant causes of damage among the various factors.
The approach to engineering damage assessments is changing as new technology have become more affordable. With the availability of pre- and post-aerial imagery for many tornadoes, software such as Google Streetview, and ubiquitous presence of smartphones and GPS cameras, it is becoming easier to compile a body of evidence using multiple sources. This information is valuable to determine causes of seemingly random or disproportionate damage. This
paper presents two case studies of wood-frame homes that were damage during the 2011 tornado which struck Tuscaloosa, AL. The homes sustained damage that appeared to be disproportionate to the surrounding damage. Evidence is gathered from pre- and post-tornado aerial imagery, Google Streetview, damage photographs and notes. Meteorological, geometric and structural factors are considered for each home based upon the available evidence to conclude the primary cause of the disproportionate final damage states. Recommendations are then made based upon these conclusions. The study will demonstrate a methodology for damage investigations that considers the entire multi-sourced body of evidence in the determination of final damage states.
Background on the 2011 Tornado in Tuscaloosa, AL
April 27, 2011 was one of the most active tornado days in US history, with 211 tornadoes confirmed, including a record 53 in Alabama alone (SPC, 2011). Some of the heaviest damage was caused by a tornado within a single supercell that began in Mississippi, and tracked across three states, Alabama, Georgia and North Carolina. The tornado remained on the ground for approximately 80 miles and it directly impacted the university town of Tuscaloosa, AL. The Tuscaloosa tornado caused 44 fatalities and left an estimated 2,520 homes uninhabitable (ACRE, 2011). The damage to these homes from the tornado resulted in an estimated insured loss of $3 billion (Prevatt et al., 2012b). The majority of the homes in Tuscaloosa were light-framed wood structures, and 65% were at least 30 years old (US Census, 2005). At the time of the tornado, Alabama had no statewide residential building code and no enforcement requirements, although specific counties near the coast did adopt residential building codes (IBHS, 2012). As a result, homes of any age in
WOOD DESIGN FOCUS V. 25, N. 1 12
Tuscaloosa likely do not have wind-resistant measures and are highly vulnerable to extreme winds.
Summary of the Damage Survey following the 2011 Tuscaloosa, AL Tornado
After the Tuscaloosa tornado occurred on April 27, 2011, a forensic investigation team consisting of structural engineering faculty, consultants, scientists and university students assembled. The team arrived within days of the event to make observations and document the perishable damage data on the performance of residential structures under extreme wind loads. Over a four-day period the team collected data, in the form of geo-referenced photographs and supplemental notes, for 1,408 damaged residential structures. Several papers provide details of the assessment methodologies and results of the study, (Prevatt et al., 2011a; Prevatt et al., 2011b; Prevatt et al., 2012a; Prevatt et al., 2012b).
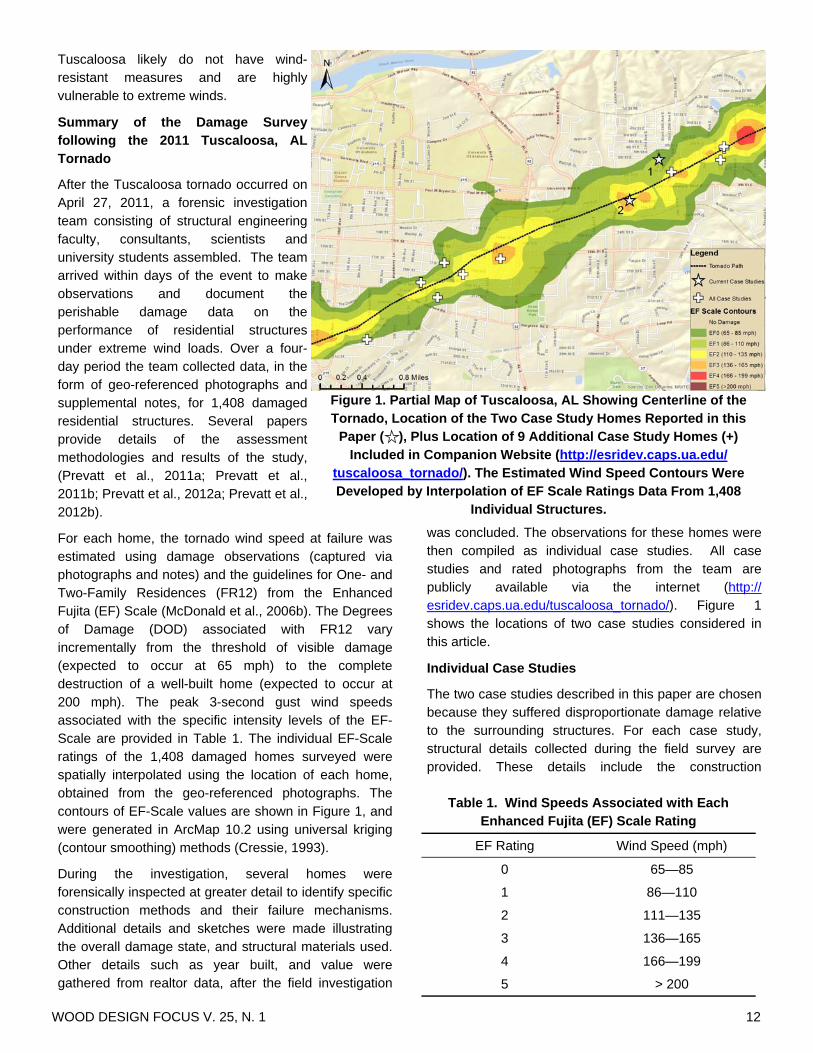
For each home, the tornado wind speed at failure was estimated using damage observations (captured via photographs and notes) and the guidelines for One- and Two-Family Residences (FR12) from the Enhanced Fujita (EF) Scale (McDonald et al., 2006b). The Degrees of Damage (DOD) associated with FR12 vary incrementally from the threshold of visible damage (expected to occur at 65 mph) to the complete destruction of a well-built home (expected to occur at 200 mph). The peak 3-second gust wind speeds associated with the specific intensity levels of the EF-Scale are provided in Table 1. The individual EF-Scale ratings of the 1,408 damaged homes surveyed were spatially interpolated using the location of each home, obtained from the geo-referenced photographs. The contours of EF-Scale values are shown in Figure 1, and were generated in ArcMap 10.2 using universal kriging (contour smoothing) methods (Cressie, 1993).
During the investigation, several homes were forensically inspected at greater detail to identify specific construction methods and their failure mechanisms. Additional details and sketches were made illustrating the overall damage state, and structural materials used. Other details such as year built, and value were gathered from realtor data, after the field investigation
was concluded. The observations for these homes were then compiled as individual case studies. All case studies and rated photographs from the team are publicly available via the internet (http://esridev.caps.ua.edu/tuscaloosa_tornado/). Figure 1 shows the locations of two case studies considered in this article.
Individual Case Studies
The two case studies described in this paper are chosen because they suffered disproportionate damage relative to the surrounding structures. For each case study, structural details collected during the field survey are provided. These details include the construction
Figure 1. Partial Map of Tuscaloosa, AL Showing Centerline of the Tornado, Location of the Two Case Study Homes Reported in this
Paper ( ), Plus Location of 9 Additional Case Study Homes (+) Included in Companion Website (http://esridev.caps.ua.edu/
tuscaloosa_tornado/). The Estimated Wind Speed Contours Were Developed by Interpolation of EF Scale Ratings Data From 1,408
Individual Structures.
EF Rating Wind Speed (mph)
0 65—85
1 86—110
2 111—135
3 136—165
4 166—199
Table 1. Wind Speeds Associated with Each Enhanced Fujita (EF) Scale Rating
5 > 200
WOOD DESIGN FOCUS V. 25, N. 1 13
materials used, dimensions of structural members when available, roof shape, and layout of the structure. The real estate service www.Zillow.com was used to determine the age of each structure. Pre- and post-tornado photographs are presented. The pre-tornado images were obtained from Google Streetview©, to compare with photographs of post-tornado damage taken by the field survey team. All of the ground survey photographs for these two homes are publicly available at http://windhazard.davidoprevatt.com/chasing-the-wind/pictures/gallery/. Post-tornado aerial imagery was obtained from the National Oceanic and Atmospheric Administration (NOAA), which used a King Air 350CER aircraft flying at 5,000 feet altitude to capture the images at ground sample distance for each pixel of 10 inches (NOAA, 2011).
For each case study, the failure details are first presented, including the primary damage observations. A discussion is then given as to the disproportionate nature of the damage relative to surrounding buildings. The study then constructs a possible sequence of failure, from which conclusions are provided regarding the cause of the damage. Based upon the conclusions, general recommendations presented to address any design weaknesses that may have contributed to the disproportionate damage.
Case Study #1
Description of House
This home was located at 521 24th Ave, Tuscaloosa, AL, approximately 1,000 feet north of the tornado centerline. It was a one story, 1,297 sq. ft., single family home built in 1964. The foundation consisted of a masonry knee-wall, with 2x6 floor joists and 1x8 diagonal wood planks for the base flooring. No details on the foundation anchorage were recorded. The stud walls were framed on top of this floor structure using 2x4 base plates, nailed at 30 inches on center. The dimensions of nails were not recorded during the survey, although nail failures at foundation are not related to failure mode. The wall structure consisted of 2x4 wood stud framing at 16” on centers and ½ inch-thick fiberboard sheathing overlaid with a brick façade. Irregularly spaced metal brick ties were installed between the single-wythe brick façade and wood stud wall. The roof structure consisted of wood rafters and ceiling joists (evidenced by a few roof joists which remained attached to the walls), connected to the wall top plate by means of two approximately 3-1/2 inch long by 0.16 inch diameter nails nominally 16 inches on center. The front of the house faced west into the oncoming tornado and included a front porch canopy and carport. The carport was open on two sides but covered under the primary
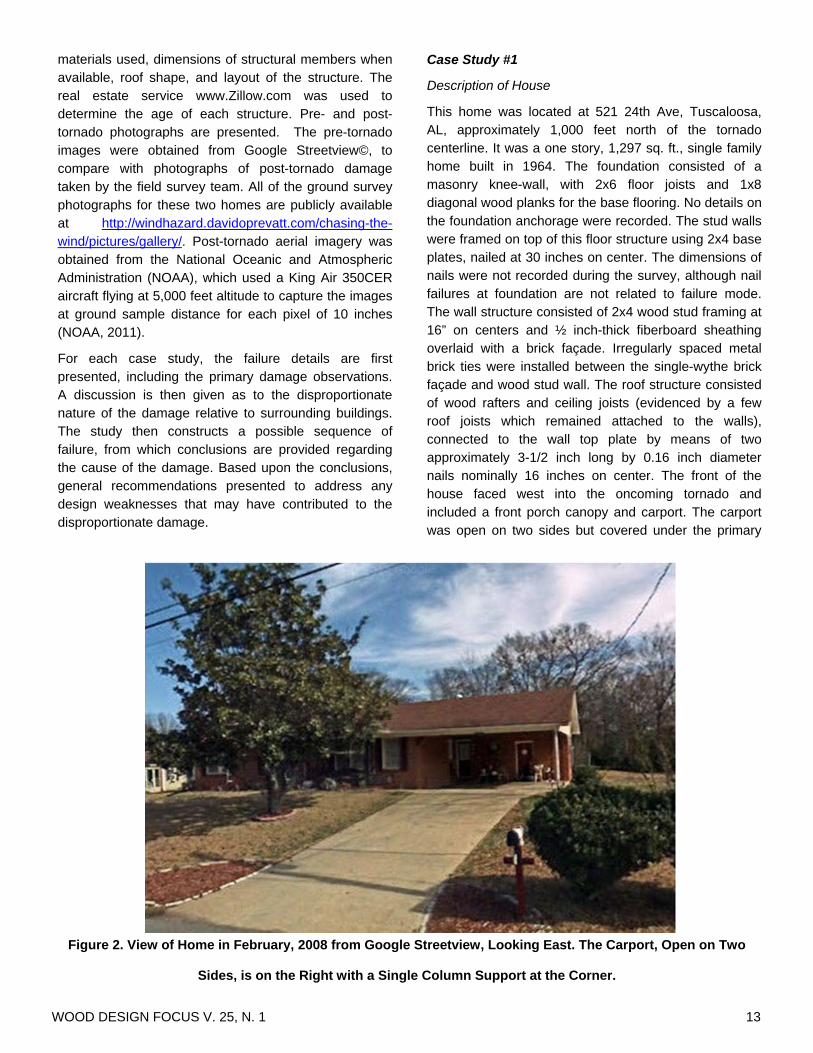
Figure 2. View of Home in February, 2008 from Google Streetview, Looking East. The Carport, Open on Two
Sides, is on the Right with a Single Column Support at the Corner.
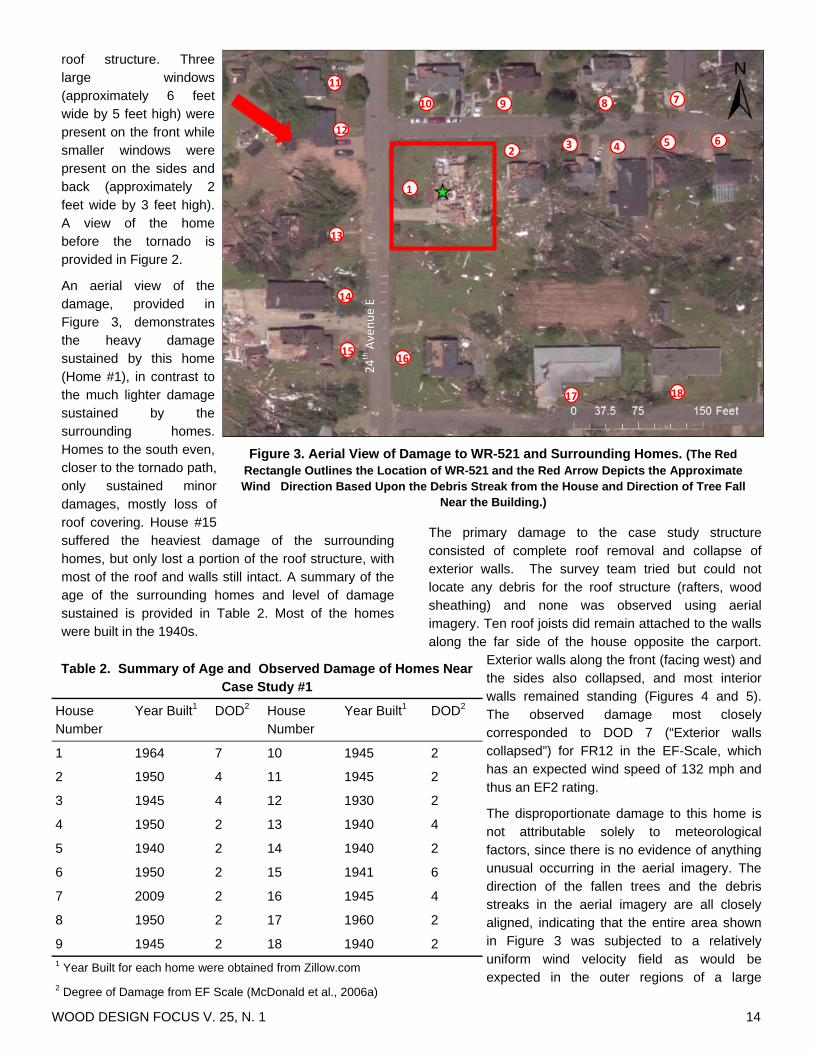
WOOD DESIGN FOCUS V. 25, N. 1 14
roof structure. Three large windows (approximately 6 feet wide by 5 feet high) were present on the front while smaller windows were present on the sides and back (approximately 2 feet wide by 3 feet high). A view of the home before the tornado is provided in Figure 2.
An aerial view of the damage, provided in Figure 3, demonstrates the heavy damage sustained by this home (Home #1), in contrast to the much lighter damage sustained by the surrounding homes. Homes to the south even, closer to the tornado path, only sustained minor damages, mostly loss of roof covering. House #15 suffered the heaviest damage of the surrounding homes, but only lost a portion of the roof structure, with most of the roof and walls still intact. A summary of the age of the surrounding homes and level of damage sustained is provided in Table 2. Most of the homes were built in the 1940s.
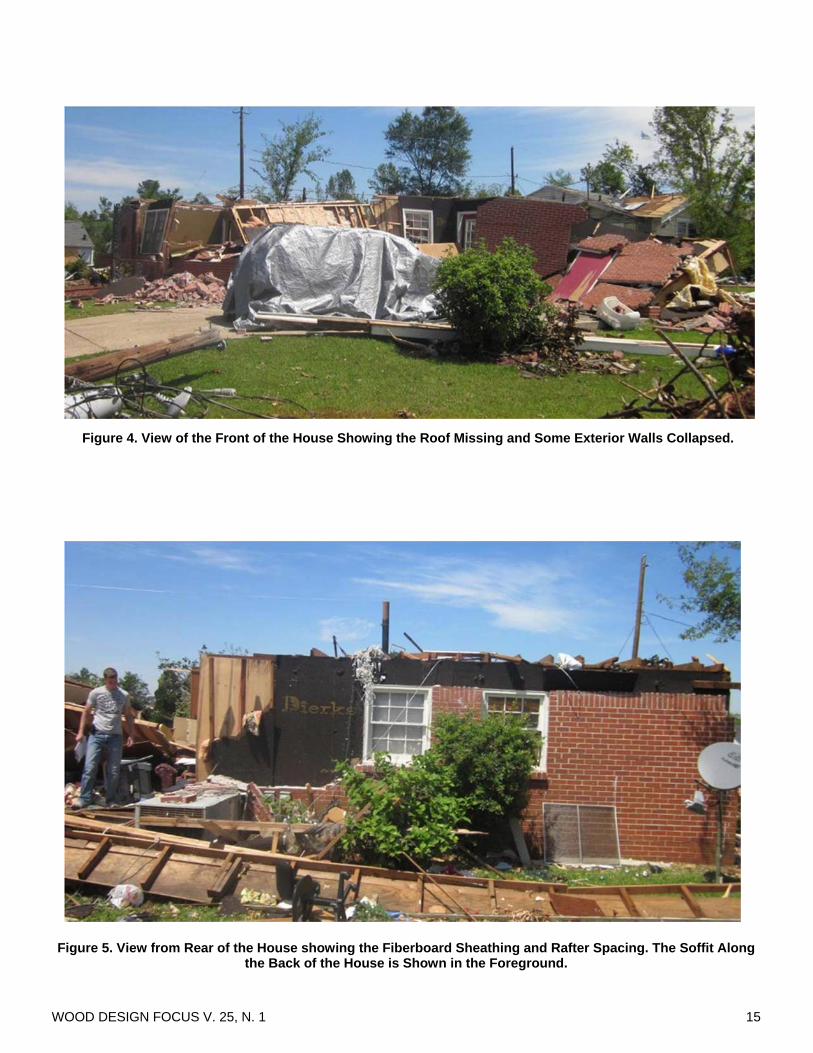
The primary damage to the case study structure consisted of complete roof removal and collapse of exterior walls. The survey team tried but could not locate any debris for the roof structure (rafters, wood sheathing) and none was observed using aerial imagery. Ten roof joists did remain attached to the walls along the far side of the house opposite the carport.
Exterior walls along the front (facing west) and the sides also collapsed, and most interior walls remained standing (Figures 4 and 5). The observed damage most closely corresponded to DOD 7 (“Exterior walls collapsed”) for FR12 in the EF-Scale, which has an expected wind speed of 132 mph and thus an EF2 rating.
The disproportionate damage to this home is not attributable solely to meteorological factors, since there is no evidence of anything unusual occurring in the aerial imagery. The direction of the fallen trees and the debris streaks in the aerial imagery are all closely aligned, indicating that the entire area shown in Figure 3 was subjected to a relatively uniform wind velocity field as would be expected in the outer regions of a large
Figure 3. Aerial View of Damage to WR-521 and Surrounding Homes. (The Red Rectangle Outlines the Location of WR-521 and the Red Arrow Depicts the Approximate Wind Direction Based Upon the Debris Streak from the House and Direction of Tree Fall
Near the Building.)
Table 2. Summary of Age and Observed Damage of Homes Near Case Study #1
House Number
Year Built1 DOD2 House Number
Year Built1 DOD2
1 1964 7 10 1945 2
2 1950 4 11 1945 2
3 1945 4 12 1930 2
4 1950 2 13 1940 4
5 1940 2 14 1940 2
6 1950 2 15 1941 6
7 2009 2 16 1945 4
8 1950 2 17 1960 2
9 1945 2 18 1940 2 1 Year Built for each home were obtained from Zillow.com
2 Degree of Damage from EF Scale (McDonald et al., 2006a)
15
14
12
11
10 9 8
1
16
17 18
2 3 4 5 6
7
13
24th Avenue E
WOOD DESIGN FOCUS V. 25, N. 1 15
Figure 4. View of the Front of the House Showing the Roof Missing and Some Exterior Walls Collapsed.
Figure 5. View from Rear of the House showing the Fiberboard Sheathing and Rafter Spacing. The Soffit Along the Back of the House is Shown in the Foreground.
WOOD DESIGN FOCUS V. 25, N. 1 16
tornado. The geometry and orientation of the home were significant factors in the great extent of structural damage. The front porch canopy and carport were located on the windward side of the house and the house was located atop a gently rising elevation change (i.e. 15 feet in 500 feet). The slope of the rise was aligned with the wind direction. The structural framing of the front porch canopy was tied directly into the main roof structure – a condition that has been documented previously that can lead to early failure of the roof (FEMA, 2005; Graettinger et al., 2006)
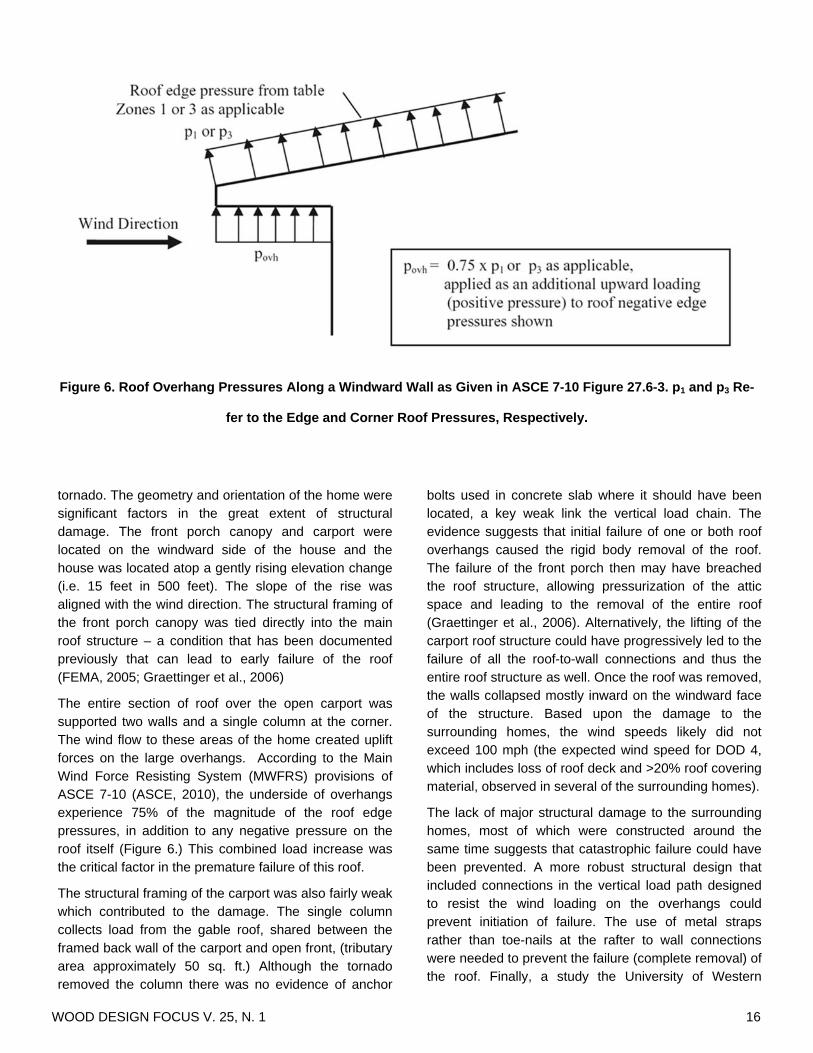
The entire section of roof over the open carport was supported two walls and a single column at the corner. The wind flow to these areas of the home created uplift forces on the large overhangs. According to the Main Wind Force Resisting System (MWFRS) provisions of ASCE 7-10 (ASCE, 2010), the underside of overhangs experience 75% of the magnitude of the roof edge pressures, in addition to any negative pressure on the roof itself (Figure 6.) This combined load increase was the critical factor in the premature failure of this roof.
The structural framing of the carport was also fairly weak which contributed to the damage. The single column collects load from the gable roof, shared between the framed back wall of the carport and open front, (tributary area approximately 50 sq. ft.) Although the tornado removed the column there was no evidence of anchor
bolts used in concrete slab where it should have been located, a key weak link the vertical load chain. The evidence suggests that initial failure of one or both roof overhangs caused the rigid body removal of the roof. The failure of the front porch then may have breached the roof structure, allowing pressurization of the attic space and leading to the removal of the entire roof (Graettinger et al., 2006). Alternatively, the lifting of the carport roof structure could have progressively led to the failure of all the roof-to-wall connections and thus the entire roof structure as well. Once the roof was removed, the walls collapsed mostly inward on the windward face of the structure. Based upon the damage to the surrounding homes, the wind speeds likely did not exceed 100 mph (the expected wind speed for DOD 4, which includes loss of roof deck and >20% roof covering material, observed in several of the surrounding homes).
The lack of major structural damage to the surrounding homes, most of which were constructed around the same time suggests that catastrophic failure could have been prevented. A more robust structural design that included connections in the vertical load path designed to resist the wind loading on the overhangs could prevent initiation of failure. The use of metal straps rather than toe-nails at the rafter to wall connections were needed to prevent the failure (complete removal) of the roof. Finally, a study the University of Western
Figure 6. Roof Overhang Pressures Along a Windward Wall as Given in ASCE 7-10 Figure 27.6-3. p1 and p3 Re-
fer to the Edge and Corner Roof Pressures, Respectively.
WOOD DESIGN FOCUS V. 25, N. 1 17
Ontario, (Stedman (2014)) suggests that construction detail changes in the framing of exterior walls, for example using a minimum member overlap in the double top plate, and by strengthening (or providing) a structural connection between the exterior walls and abutting interior a walls could limit the extent of damage. The changes increase interior to exterior wall connection strength and also increase the torsional rigidity of the corners.
Case Study #2
House Description
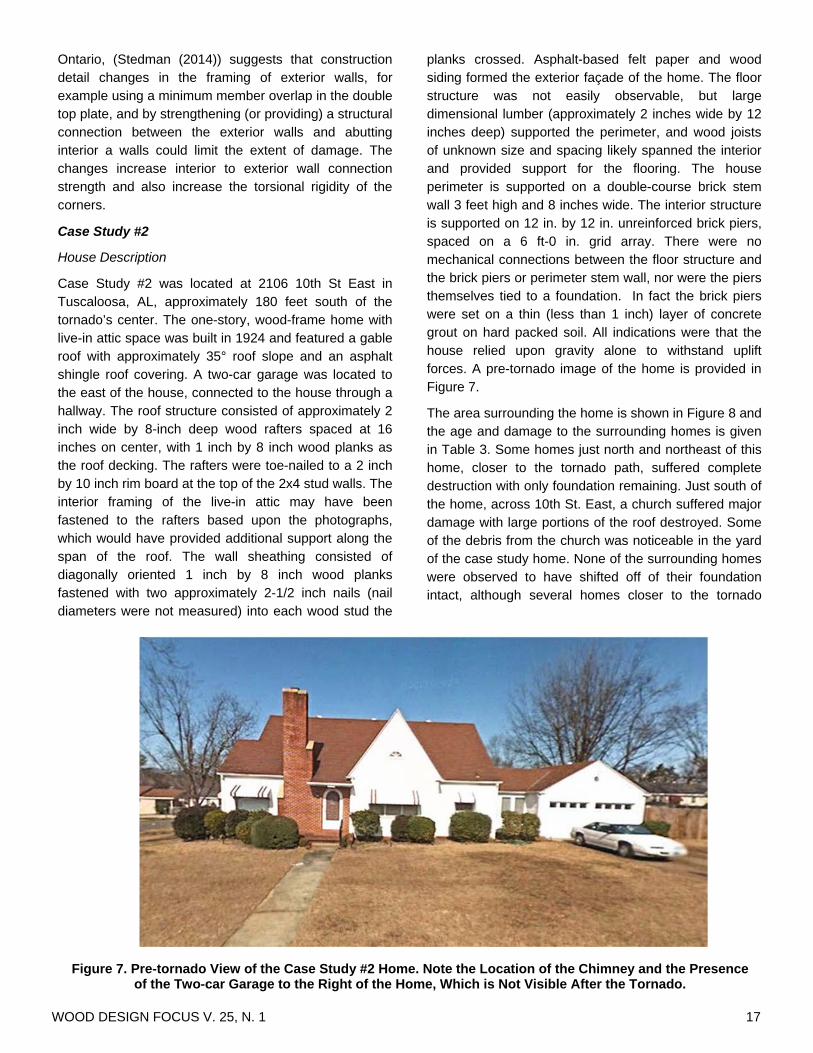
Case Study #2 was located at 2106 10th St East in Tuscaloosa, AL, approximately 180 feet south of the tornado’s center. The one-story, wood-frame home with live-in attic space was built in 1924 and featured a gable roof with approximately 35° roof slope and an asphalt shingle roof covering. A two-car garage was located to the east of the house, connected to the house through a hallway. The roof structure consisted of approximately 2 inch wide by 8-inch deep wood rafters spaced at 16 inches on center, with 1 inch by 8 inch wood planks as the roof decking. The rafters were toe-nailed to a 2 inch by 10 inch rim board at the top of the 2x4 stud walls. The interior framing of the live-in attic may have been fastened to the rafters based upon the photographs, which would have provided additional support along the span of the roof. The wall sheathing consisted of diagonally oriented 1 inch by 8 inch wood planks fastened with two approximately 2-1/2 inch nails (nail diameters were not measured) into each wood stud the
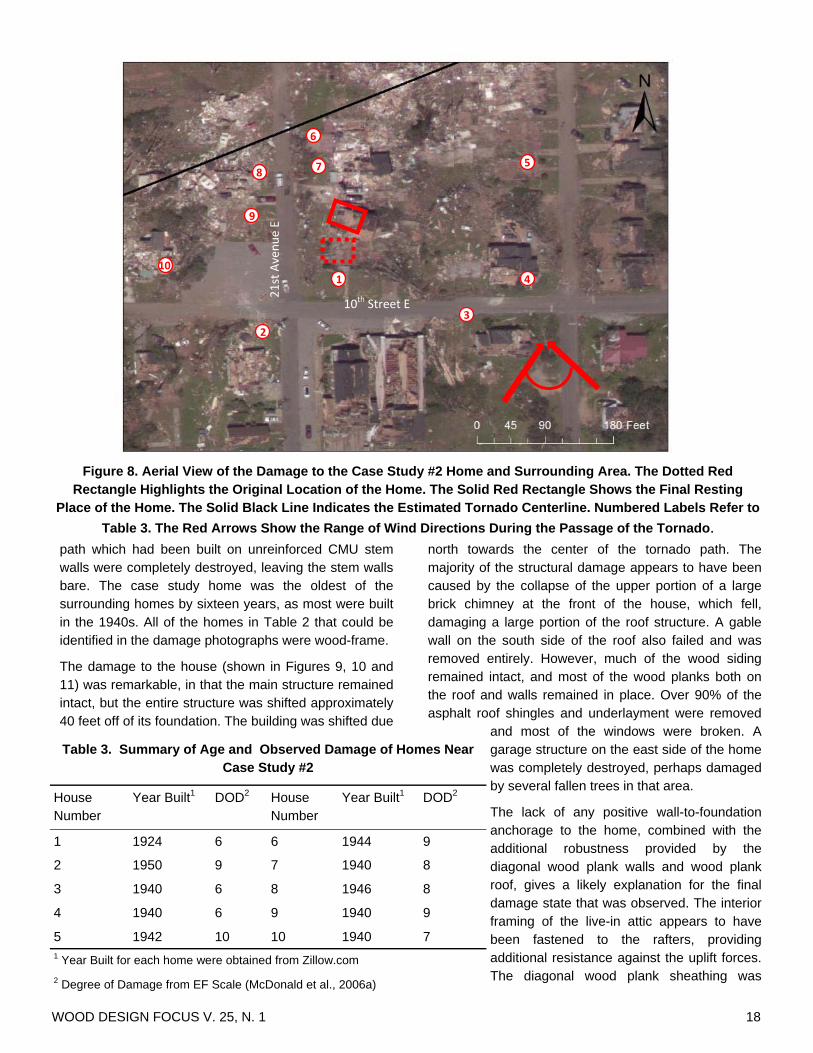
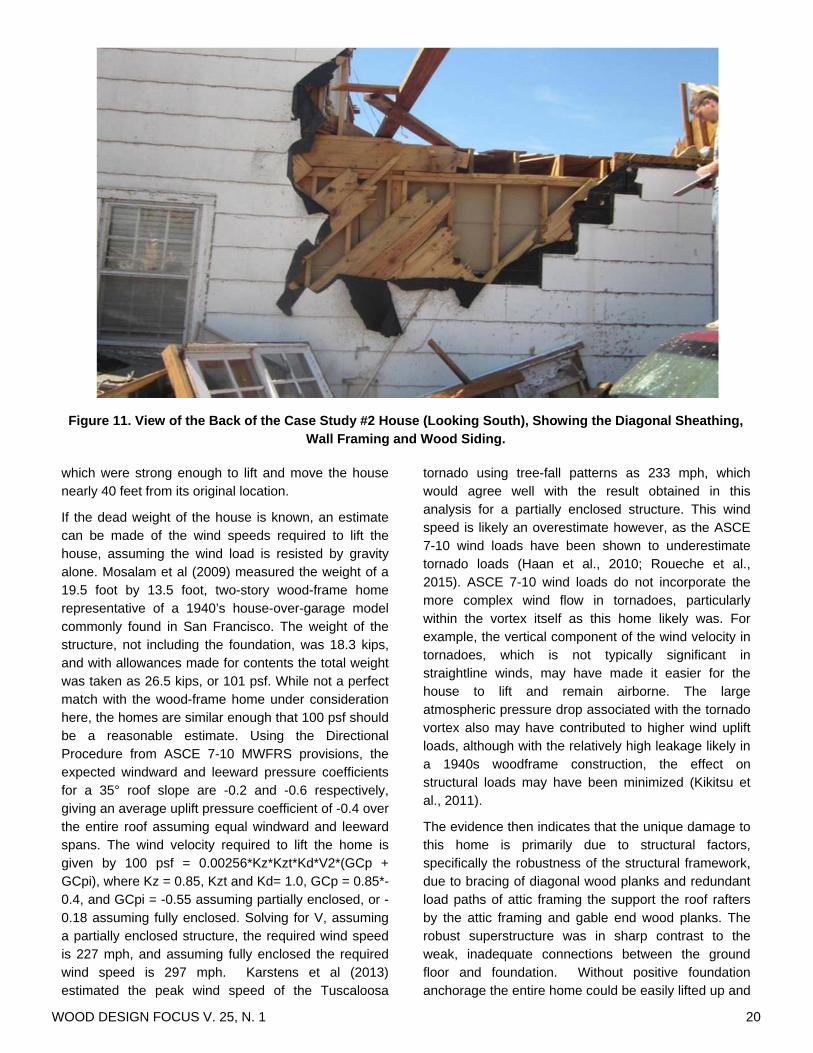
planks crossed. Asphalt-based felt paper and wood siding formed the exterior façade of the home. The floor structure was not easily observable, but large dimensional lumber (approximately 2 inches wide by 12 inches deep) supported the perimeter, and wood joists of unknown size and spacing likely spanned the interior and provided support for the flooring. The house perimeter is supported on a double-course brick stem wall 3 feet high and 8 inches wide. The interior structure is supported on 12 in. by 12 in. unreinforced brick piers, spaced on a 6 ft-0 in. grid array. There were no mechanical connections between the floor structure and the brick piers or perimeter stem wall, nor were the piers themselves tied to a foundation. In fact the brick piers were set on a thin (less than 1 inch) layer of concrete grout on hard packed soil. All indications were that the house relied upon gravity alone to withstand uplift forces. A pre-tornado image of the home is provided in Figure 7.
The area surrounding the home is shown in Figure 8 and the age and damage to the surrounding homes is given in Table 3. Some homes just north and northeast of this home, closer to the tornado path, suffered complete destruction with only foundation remaining. Just south of the home, across 10th St. East, a church suffered major damage with large portions of the roof destroyed. Some of the debris from the church was noticeable in the yard of the case study home. None of the surrounding homes were observed to have shifted off of their foundation intact, although several homes closer to the tornado
Figure 7. Pre-tornado View of the Case Study #2 Home. Note the Location of the Chimney and the Presence of the Two-car Garage to the Right of the Home, Which is Not Visible After the Tornado.
WOOD DESIGN FOCUS V. 25, N. 1 18
path which had been built on unreinforced CMU stem walls were completely destroyed, leaving the stem walls bare. The case study home was the oldest of the surrounding homes by sixteen years, as most were built in the 1940s. All of the homes in Table 2 that could be identified in the damage photographs were wood-frame.
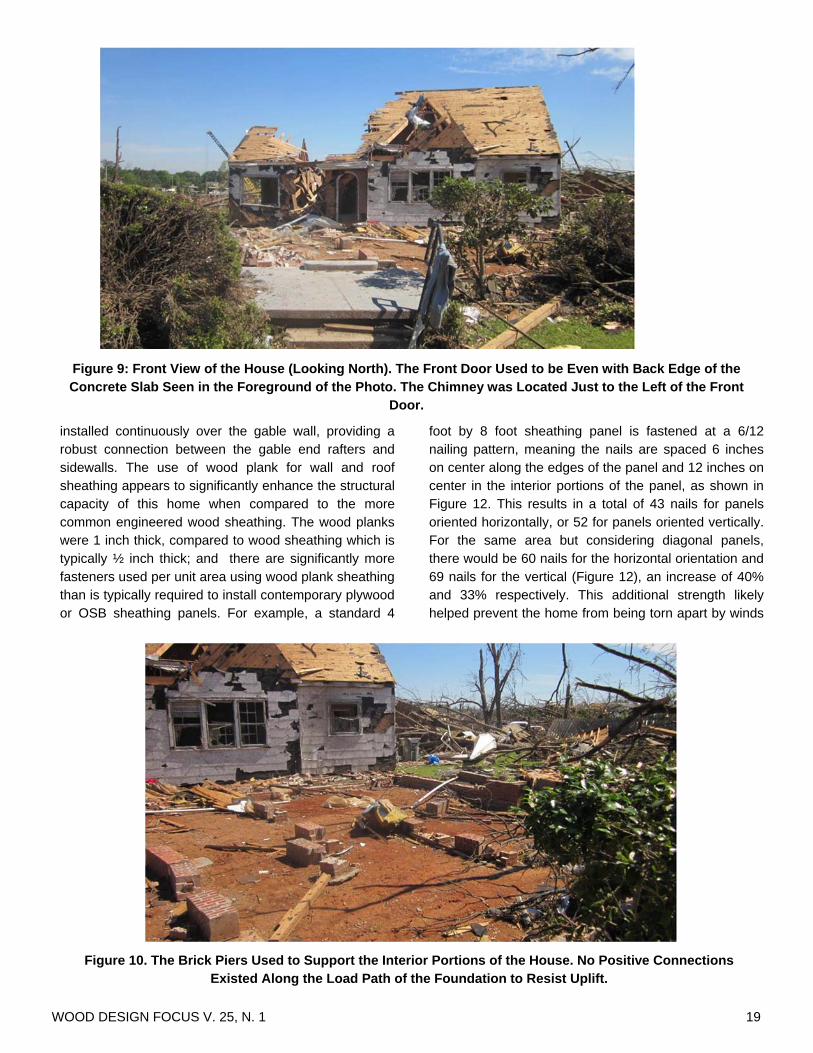
The damage to the house (shown in Figures 9, 10 and 11) was remarkable, in that the main structure remained intact, but the entire structure was shifted approximately 40 feet off of its foundation. The building was shifted due
north towards the center of the tornado path. The majority of the structural damage appears to have been caused by the collapse of the upper portion of a large brick chimney at the front of the house, which fell, damaging a large portion of the roof structure. A gable wall on the south side of the roof also failed and was removed entirely. However, much of the wood siding remained intact, and most of the wood planks both on the roof and walls remained in place. Over 90% of the asphalt roof shingles and underlayment were removed
and most of the windows were broken. A garage structure on the east side of the home was completely destroyed, perhaps damaged by several fallen trees in that area.
The lack of any positive wall-to-foundation anchorage to the home, combined with the additional robustness provided by the diagonal wood plank walls and wood plank roof, gives a likely explanation for the final damage state that was observed. The interior framing of the live-in attic appears to have been fastened to the rafters, providing additional resistance against the uplift forces. The diagonal wood plank sheathing was
Table 3. Summary of Age and Observed Damage of Homes Near Case Study #2
House Number
Year Built1 DOD2 House Number
Year Built1 DOD2
1 1924 6 6 1944 9
2 1950 9 7 1940 8
3 1940 6 8 1946 8
4 1940 6 9 1940 9
5 1942 10 10 1940 7 1 Year Built for each home were obtained from Zillow.com
2 Degree of Damage from EF Scale (McDonald et al., 2006a)
Figure 8. Aerial View of the Damage to the Case Study #2 Home and Surrounding Area. The Dotted Red Rectangle Highlights the Original Location of the Home. The Solid Red Rectangle Shows the Final Resting
Place of the Home. The Solid Black Line Indicates the Estimated Tornado Centerline. Numbered Labels Refer to
Table 3. The Red Arrows Show the Range of Wind Directions During the Passage of the Tornado.
10 1 4
5 7
6
9
8
2
3 10th Street E
21st Avenue E
WOOD DESIGN FOCUS V. 25, N. 1 19
installed continuously over the gable wall, providing a robust connection between the gable end rafters and sidewalls. The use of wood plank for wall and roof sheathing appears to significantly enhance the structural capacity of this home when compared to the more common engineered wood sheathing. The wood planks were 1 inch thick, compared to wood sheathing which is typically ½ inch thick; and there are significantly more fasteners used per unit area using wood plank sheathing than is typically required to install contemporary plywood or OSB sheathing panels. For example, a standard 4
foot by 8 foot sheathing panel is fastened at a 6/12 nailing pattern, meaning the nails are spaced 6 inches on center along the edges of the panel and 12 inches on center in the interior portions of the panel, as shown in Figure 12. This results in a total of 43 nails for panels oriented horizontally, or 52 for panels oriented vertically. For the same area but considering diagonal panels, there would be 60 nails for the horizontal orientation and 69 nails for the vertical (Figure 12), an increase of 40% and 33% respectively. This additional strength likely helped prevent the home from being torn apart by winds
Figure 10. The Brick Piers Used to Support the Interior Portions of the House. No Positive Connections Existed Along the Load Path of the Foundation to Resist Uplift.
Figure 9: Front View of the House (Looking North). The Front Door Used to be Even with Back Edge of the Concrete Slab Seen in the Foreground of the Photo. The Chimney was Located Just to the Left of the Front
Door.
WOOD DESIGN FOCUS V. 25, N. 1 20
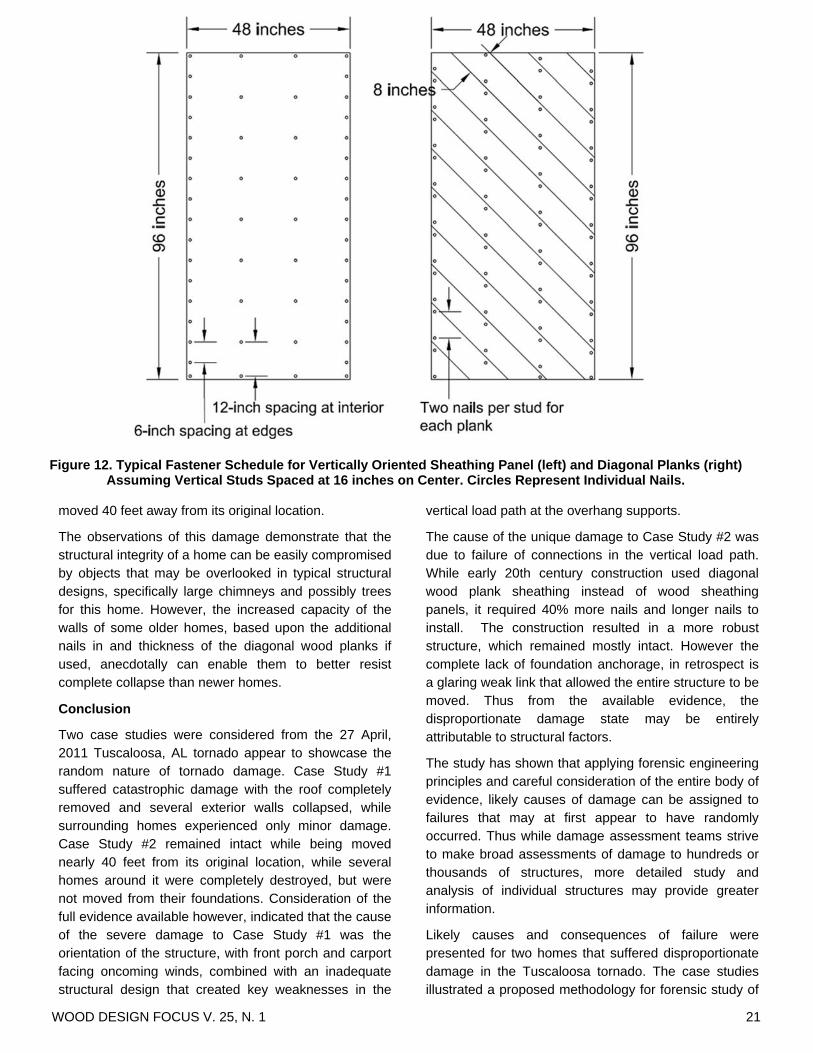
Figure 11. View of the Back of the Case Study #2 House (Looking South), Showing the Diagonal Sheathing, Wall Framing and Wood Siding.
which were strong enough to lift and move the house nearly 40 feet from its original location.
If the dead weight of the house is known, an estimate can be made of the wind speeds required to lift the house, assuming the wind load is resisted by gravity alone. Mosalam et al (2009) measured the weight of a 19.5 foot by 13.5 foot, two-story wood-frame home representative of a 1940’s house-over-garage model commonly found in San Francisco. The weight of the structure, not including the foundation, was 18.3 kips, and with allowances made for contents the total weight was taken as 26.5 kips, or 101 psf. While not a perfect match with the wood-frame home under consideration here, the homes are similar enough that 100 psf should be a reasonable estimate. Using the Directional Procedure from ASCE 7-10 MWFRS provisions, the expected windward and leeward pressure coefficients for a 35° roof slope are -0.2 and -0.6 respectively, giving an average uplift pressure coefficient of -0.4 over the entire roof assuming equal windward and leeward spans. The wind velocity required to lift the home is given by 100 psf = 0.00256*Kz*Kzt*Kd*V2*(GCp + GCpi), where Kz = 0.85, Kzt and Kd= 1.0, GCp = 0.85*-0.4, and GCpi = -0.55 assuming partially enclosed, or -0.18 assuming fully enclosed. Solving for V, assuming a partially enclosed structure, the required wind speed is 227 mph, and assuming fully enclosed the required wind speed is 297 mph. Karstens et al (2013) estimated the peak wind speed of the Tuscaloosa
tornado using tree-fall patterns as 233 mph, which would agree well with the result obtained in this analysis for a partially enclosed structure. This wind speed is likely an overestimate however, as the ASCE 7-10 wind loads have been shown to underestimate tornado loads (Haan et al., 2010; Roueche et al., 2015). ASCE 7-10 wind loads do not incorporate the more complex wind flow in tornadoes, particularly within the vortex itself as this home likely was. For example, the vertical component of the wind velocity in tornadoes, which is not typically significant in straightline winds, may have made it easier for the house to lift and remain airborne. The large atmospheric pressure drop associated with the tornado vortex also may have contributed to higher wind uplift loads, although with the relatively high leakage likely in a 1940s woodframe construction, the effect on structural loads may have been minimized (Kikitsu et al., 2011).
The evidence then indicates that the unique damage to this home is primarily due to structural factors, specifically the robustness of the structural framework, due to bracing of diagonal wood planks and redundant load paths of attic framing the support the roof rafters by the attic framing and gable end wood planks. The robust superstructure was in sharp contrast to the weak, inadequate connections between the ground floor and foundation. Without positive foundation anchorage the entire home could be easily lifted up and
WOOD DESIGN FOCUS V. 25, N. 1 21
Figure 12. Typical Fastener Schedule for Vertically Oriented Sheathing Panel (left) and Diagonal Planks (right) Assuming Vertical Studs Spaced at 16 inches on Center. Circles Represent Individual Nails.
moved 40 feet away from its original location.
The observations of this damage demonstrate that the structural integrity of a home can be easily compromised by objects that may be overlooked in typical structural designs, specifically large chimneys and possibly trees for this home. However, the increased capacity of the walls of some older homes, based upon the additional nails in and thickness of the diagonal wood planks if used, anecdotally can enable them to better resist complete collapse than newer homes.
Conclusion
Two case studies were considered from the 27 April, 2011 Tuscaloosa, AL tornado appear to showcase the random nature of tornado damage. Case Study #1 suffered catastrophic damage with the roof completely removed and several exterior walls collapsed, while surrounding homes experienced only minor damage. Case Study #2 remained intact while being moved nearly 40 feet from its original location, while several homes around it were completely destroyed, but were not moved from their foundations. Consideration of the full evidence available however, indicated that the cause of the severe damage to Case Study #1 was the orientation of the structure, with front porch and carport facing oncoming winds, combined with an inadequate structural design that created key weaknesses in the
vertical load path at the overhang supports.
The cause of the unique damage to Case Study #2 was due to failure of connections in the vertical load path. While early 20th century construction used diagonal wood plank sheathing instead of wood sheathing panels, it required 40% more nails and longer nails to install. The construction resulted in a more robust structure, which remained mostly intact. However the complete lack of foundation anchorage, in retrospect is a glaring weak link that allowed the entire structure to be moved. Thus from the available evidence, the disproportionate damage state may be entirely attributable to structural factors.
The study has shown that applying forensic engineering principles and careful consideration of the entire body of evidence, likely causes of damage can be assigned to failures that may at first appear to have randomly occurred. Thus while damage assessment teams strive to make broad assessments of damage to hundreds or thousands of structures, more detailed study and analysis of individual structures may provide greater information.
Likely causes and consequences of failure were presented for two homes that suffered disproportionate damage in the Tuscaloosa tornado. The case studies illustrated a proposed methodology for forensic study of
WOOD DESIGN FOCUS V. 25, N. 1 22
tornado damage. The use of modern technology and multiple data sources was shown to be essential to understanding the sequences of failure and their consequences. While it is difficult to know for sure which failure mechanisms dominate, a logical systematic approach to the problem usually will yield plausible results. The case studies have highlighted that inherent weaknesses of well-known structural details can result in damage that is disproportionately large relative to other homes within the immediate neighborhood of the house.
References
ACRE, 2011. Tuscaloosa residential real estate: Short-term impact and analysis of April 27th disaster. In: A.C.f.R. Estate (Editor). University of Alabama, Tuscaloosa, AL.
ASCE, 2010. Minimum design loads for buildings and other structures. ASCE/SEI, Reston, VA.
Cressie, N.A.C., 1993. Statistics for spatial data. Wiley series in probability and mathematical statistics. Applied probability and statistics. J. Wiley, New York.
FEMA, 2005. Summary report on building performance: 2004 hurricane season, Federal Emergency Management Agency.
Graettinger, A.J. et al., 2006. Overview of wind damage to woodframe structure caused by hurricane katrina. Structures Congress 2006, May 18, 2006 - May 21, 2006, St. Louis, MO, United states, p.^pp. 57.
Haan, F.L., Balaramudu, V.K. and Sarkar, P.P., 2010. Tornado-induced wind loads on a low-rise building. Journal of Structural Engineering, 136(Compendex): 106-116.
Karstens, C.D., Gallus, W.A., Lee, B.D. and Finley, C.A., 2013. Analysis of tornado-induced tree fall using aerial photography from the Joplin, Missouri, and Tuscaloosa-Birmingham, Alabama, tornadoes of 2011. Journal of Applied Meteorology & Climatology, 52(5).
Kikitsu, H., Sarkar, P.P. and Haan, F.L., 2011. Experimental study on tornado-induced loads of low-rise buildings using a large tornado simulator, 13th International Conference on Wind Engineering Amsterdam, Netherlands.
McDonald, J.R., Mehta, K.C. and Mani, S., 2006a. A recommendation for an enhanced Fujita scale (EF-scale), revision 2. Wind Science and Engineering, Texas Tech University, Lubbock, TX, pp. 111.
McDonald, J.R., Mehta, K.C. and Mani, S., 2006b. A recommendation for an enhanced fujita scale (ef-scale), revision 2. Wind science and engineering, Texas Tech. Univ., Lubbock, TX, 111 pp.
Mosalam, K.M., Takhirov, S.M. and Hashemi, A., 2009. Seismic evaluation of 1940s asymmetric wood-frame building using conventional measurements and high-definition laser scanning. Earthquake Engineering & Structural Dynamics, 38(10): 1175-1197.
NOAA, 2011. Aerial photography: Tornado response imagery of the surrounding regions.
Prevatt, D. et al., 2011a. Tuscaloosa tornado of 2011, National Science Foundation.
Prevatt, D.O., Lindt, J.v.d., Gupta, R. and Coulbourne, B., 2011b. Tuscaloosa tornado: Preliminary observations on wood-frame buildings damage assessment. Structure Magazine.
Prevatt, D.O. et al., 2012a. Building damage observations and EF classifications from the Tuscaloosa, AL, and Joplin, MO, tornadoes. Structures Congress, Chicago, IL, USA, p.^pp. 999-1010.
Prevatt, D.O. et al., 2012b. Making the case for improved structural design: Tornado outbreaks of 2011. Leadership and Management in Engineering, 12(4): 254-270.
Roueche, D.B., Prevatt, D.O., Haan, F.L. and Datin, P.L., 2015. An estimate of tornado loads on a wood-frame building using database-assisted design methodology. Journal of Wind Engineering and Industrial Aerodynamics, 138(0): 27-35.
SPC, 2011. 2011 tornado information. Storm Prediction Center.
David O. Prevatt, Ph.D, PE is Associate Professor, Department of Civil and Coastal Engineering, University of Florida. [email protected].
David B. Roueche, ME is NSF Graduate Research Fellow, Department of Civil and Coastal Engineering, University of Florida.


![0 Engelhardt FIRST HALF - ppt[1] [Lecture seule]€¦ · Richard A Engelhardt Regional Advisor for Culture in Asia and the Pacific UNESCO UNESCO Expert Symposium on Arts Education](https://img.pdfslide.us/doc/110x75/5fa613d7c2a7be403a72f211/0-engelhardt-first-half-ppt1-lecture-seule-richard-a-engelhardt-regional-advisor.jpg)