Embed Size (px)
Citation preview

Devon NEC Corporation Pike 1 Project Volume 2 – Environmental Impact Assessment June 2012
Table of Contents – Page i
SECTION 8.0 – SURFACE WATER QUALITY TABLE OF CONTENTS
PAGE
8.0 SURFACE WATER QUALITY ....................................................................................... 8-1 8.1 Introduction ......................................................................................................... 8-1
8.2 Study Area .......................................................................................................... 8-1
8.3 Assessment Approach ....................................................................................... 8-1
8.4 Methods .............................................................................................................. 8-3 8.4.1 Review of Existing Information ........................................................... 8-3 8.4.2 Field Survey ....................................................................................... 8-3 8.4.3 Quality Assurance/Quality Control ..................................................... 8-5 8.4.4 Acid Emissions Methods .................................................................... 8-5
8.5 Baseline Case .................................................................................................... 8-8 8.5.1 Water Quality in the ALSA ................................................................. 8-8 8.5.2 Sediment Quality in the ALSA .......................................................... 8-18 8.5.3 Water Quality in the ARSA ............................................................... 8-19 8.5.4 Sediment Quality in the ARSA ......................................................... 8-21 8.5.5 Acid Sensitivity of Lakes .................................................................. 8-22
8.6 Application Case .............................................................................................. 8-22 8.6.1 Subsurface Operations .................................................................... 8-23 8.6.2 Surface Disturbances and Changes in Runoff ................................. 8-24 8.6.3 Wastewater Releases ...................................................................... 8-26 8.6.4 Accidental Releases ........................................................................ 8-27 8.6.5 Acid Deposition ................................................................................ 8-27 8.6.6 Summary of Mitigation Measures .................................................... 8-28
8.7 Planned Development Case ............................................................................. 8-29 8.7.1 Changes in Surface Water Quality ................................................... 8-29 8.7.2 Acid Deposition ................................................................................ 8-29
8.8 Monitoring ......................................................................................................... 8-29
8.9 Assessment Summary...................................................................................... 8-30
8.10 References ....................................................................................................... 8-32

Devon NEC Corporation Pike 1 Project Volume 2 – Environmental Impact Assessment June 2012
Table of Contents – Page ii
TABLE OF CONTENTS (cont)
PAGE
LIST OF TABLES
Table 8.4-1: Baseline Water Quality Sampling Regime .......................................................... 8-4 Table 8.9-1: Application Case Impacts to Surface Water Quality ......................................... 8-31
LIST OF FIGURES
Figure 8.2-1: Aquatics Local and Regional Study Areas ......................................................... 8-2 Figure 8.4-1: Deposition Study Locations ................................................................................ 8-6 Figure 8.5-1: Sampling Locations ............................................................................................ 8-9 Figure 8.5-2: Kirby Lake Profiles ........................................................................................... 8-11 Figure 8.5-3: Hay Lake Profiles ............................................................................................. 8-13

Devon NEC Corporation Pike 1 Project Volume 2 – Environmental Impact Assessment June 2012
Page 8-1
8.0 SURFACE WATER QUALITY 8.1 Introduction This section presents a description of existing surface water quality based upon historical data and data obtained specifically for the Pike 1 Project (the Project) from watercourses and waterbodies near the Project. The potential impacts of the Project on surface water quality within the study area are assessed. 8.2 Study Area The aquatics local study area (ALSA) and aquatics regional study area (ARSA) are shown on Figure 8.2-1. The ALSA includes the Hay and Kirby lakes catchment, the Monday Creek catchment and the Sandy River catchment. These catchments are nearest the Project and hence, have the greatest potential to experience water quality effects as a result of the Project. The ARSA includes the ALSA as well as the Sunday Creek catchment, Christina Lake and Winefred Lake. It was delineated to determine the potential of the Project to contribute to the cumulative impacts on water quality in combination with other existing, approved and planned projects. The air quality regional study area (AQRSA) (Volume 2, Section 4.0) was used in the evaluation of acid deposition to regional lakes. Delineation of the ALSA and ARSA is also discussed in Volume 2, Section 3.2. 8.3 Assessment Approach Construction and operation of the Project has the potential to affect the water quality of watercourses and waterbodies within the ALSA. The water quality assessment considers Project activities with the potential to cause a physical or chemical change in water quality. Identification of water quality issues is based on public and regulatory consultation, as well as professional experience related to other developments within the oil sands region. The Project could potentially affect the surface water quality within the study area due to:
• changes in background water quality as a result of withdrawal of groundwater and effects on surface water/ground water interactions;
• changes in water quality due to changes in runoff characteristics, stream flow, and erosion potential as a result of land disturbance;
• changes in the surface water chemistry due to wastewater releases;
• accidental releases of liquids; and
• changes in water chemistry as a result of acidifying air emissions following deposition on to waterbodies.
!(
Kirby RoadMonday
HayLake
KirbyLake
Sandy River
WinefredLake
GristLake
ChristinaLake
!!881
Cree
k
Creek
Sunday
IpiatikLake
Chris
Paul's
Roa
d
Conklin
R6W4R7W4R8W4R9W4 R3W4R3W4R4W4R5W4Legend
Aquatics RSA
Aquatics LSA
Cold Lake Air Weapons Range
Open Water
Watercourse
Road
Aquatics Regional and Local Study Areas
Pike 1 Project
May 31, 2012
Figure8.2-1
PROVIDED BY:
AMECFINAL MAPPING BY:
AMEC
Fig08.02-01 Aquatics LSA RSA.mxd
±M
ap P
ath:
S:\G
is\P
roje
cts\
CE
\Dev
on\0
4050
_Pik
e\A
rcG
IS P
roje
cts\
Volu
me
02 -
Sec
tion
08 S
urfa
ce W
ater
Qua
lity\
Fig0
8.02
-01
Aqu
atic
s LS
A R
SA
.mxd
A
naly
st -
Trev
or R
ober
tson
2 0 2 41
Kilometres1:300000
Source: © Department of Natural Resources Canada. All rightsreserved, Devon, GeoBase®, Spatial Data Warehouse Ltd.
R3W4

Devon NEC Corporation Pike 1 Project Volume 2 – Environmental Impact Assessment June 2012
Page 8-3
Assessment criteria used in evaluating effects on surface water quality were based on current provincial and federal water quality guidelines for the protection of aquatic life and drinking water quality guidelines. Water quality data were compared to the federal Canadian Environmental Quality Guidelines (CEQG) for the protection of aquatic life (CCME 2011a), the provincial Surface Water Quality Guidelines for Use in Alberta (ASWQG) (AENV 1999), as well as the federal Guidelines for Canadian Drinking Water Quality (CDWQG) (Health Canada 2010). Sediment quality parameters were compared to CCME interim sediment quality guidelines (ISQG) (CCME 2002). Changes to surface water quality were assessed with consideration of the planned mitigation measures where appropriate. The results of the air quality cumulative effects assessment (Volume 2, Section 4.0) were used to evaluate the acid sensitivity of lakes in the ALSA, ARSA and AQRSA.
8.4 Methods
8.4.1 Review of Existing Information
A baseline assessment was conducted that included a review of existing information from:
• the Devon applications for approval of the Jackfish 1, 2 and 3 projects (Devon 2004, 2006, 2010);
• monitoring reports for the Devon Jackfish 1 and 2 projects (Matrix Solutions 2007, 2008, 2009, 2011);
• the EnCana application for approval of the Christina Lake Thermal Expansion Project, Phases 1E, 1F and 1G (EnCana 2009);
• the MEG Energy application for approval of the Christina Lake Regional Project, Phase 3 (MEG 2008); and
• the Cenovus application for approval of the Narrows Lake Project (Cenovus 2010). Historical data were also collected from the Atlas of Alberta Lakes (Mitchell and Prepas 1990), and Western Resource Solutions (WRS 2004). Additional seasonal field surveys were conducted in 2010 through 2012 to supplement the existing data.
8.4.2 Field Survey
A field survey program was designed to fill gaps in the data within the study areas. Water and sediment samples were collected for laboratory analyses using standard AMEC collection, calibration, and QA/QC procedures to ensure sample quality that are based on federal (CCME 2011b) and provincial (AENV 2006a, AENV 2006b) guidelines. Stream and sediment sampling was conducted by grab sampling, while lake sampling was conducted using composite sampling.

Devon NEC Corporation Pike 1 Project Volume 2 – Environmental Impact Assessment June 2012
Page 8-4
Water quality parameters that were analyzed for include:
• field measurement of temperature, dissolved oxygen (DO), specific conductivity, and pH;
• conventional water chemistry constituents;
• nutrients;
• total and dissolved metals;
• hydrocarbons; and
• polycyclic aromatic hydrocarbons (PAHs). Sediments were sampled and analyzed for the following parameters:
• texture (sand, silt, clay);
• hydrocarbons;
• total organic carbon; and
• metals. Sites were sampled in spring (May), summer (July/August), fall (October) and winter (March). Specific seasons and years are shown in Table 8.4-1. Samples were analyzed by the AMEC laboratory in Edmonton except for biochemical oxygen demand, naphthenic acids and low-level mercury samples, which were analyzed by Maxxam Analytics.
Table 8.4-1: Baseline Water Quality Sampling Regime
Site 2010 2011 2012
Spring Summer Fall Winter Spring Summer Fall WinterKirby Lake X X X X Hay Lake X X
HC1 X X X X HC2 X X X X SR1 X X X X SR2 X X X X SR3 X X X X SR41 X TSR1 X X X X TSR2 X X X X TSR3 X X X X TSR4 X X X X
Note: 1 Site SR4 replaced by site SR3.

Devon NEC Corporation Pike 1 Project Volume 2 – Environmental Impact Assessment June 2012
Page 8-5
8.4.3 Quality Assurance/Quality Control
Quality assurance/quality control methods were utilized to ensure accuracy and reliability of the laboratory data, including the following:
• field blanks, used to detect sample contamination during the collection, shipping and analysis of samples;
• trip blanks, used to detect sample contamination during transport;
• duplicate field samples, used to detect variability at a site and as a check on field sampling methodology;
• duplicate laboratory samples, used to assess the reproducibility of the laboratory results (i.e., lab methodology and analyses). At least 10% of the samples submitted to the laboratory were analyzed as duplicates by the laboratory; and
• standard laboratory quality assurance/quality control methods (including method blanks, the use of spike samples, etc.), used by the laboratory as internal checks on the accuracy of their methodology and confirm the absence of contamination in their methodology and equipment.
8.4.4 Acid Emissions Methods
A critical load for each lake shown on Figure 8.4-1 in the AQRSA was calculated using the Henriksen steady state water chemistry ratio (Henriksen et al. 1992):
CL = ([BC]*0 – [ANClim]) * Q
where:
CL = critical loading level of acidity [keq H+/ha/y]; [BC]*0 = pre-industrial non-marine base cation concentration in the lake [µeq/L]; [ANClim] = critical value for the acid neutralizing capacity in the water for an indicator
organism [µeq/L]; and Q = mean annual runoff [L/ha/y].
This critical load concept assumes the existence of a dose-response relationship between a water quality variable and an aquatic indicator organism. In this assessment, the acid neutralizing capacity was used as the water quality variable, and a healthy fish population was used as the indicator. Consistent with the Cumulative Effects Management Association (CEMA) framework, an acid neutralizing capacity of 75 µeq/L was applied in the assessment (CEMA 2005). Runoff to each lake was calculated from a regional hydrological analysis, based on long-term data from gauged catchments in the ALSA (Volume 2, Section 7.0). A mean annual runoff of 89.1 mm was estimated for the ALSA. This value was used to calculate the critical load.

XW
XW
XWXW
XW
XW
XW
XW
XW
XW
XW
XW
XW
XW
XW
XW
XW
XWXW
XW
XW
XW
XW
XWXW
XW
XWXW
XW XW
XW
XW
XW
XWXW
XW
XW
XW
XW
XW
XWXW
XW
XW XW
XW
XW
XWXW
XW
XWXWXW
XW
XW
XWXW
XW
XW
XW
XW
XW
XW
XW
XWXW XW
XW
XW
XWXW
XWXW
XW
XW
XWXW
XWXW XWXWXWXW
XWXW
XWXWXW
XWXW
XW XWXW
XWXWXW
XW XWXW
XW
XWXW XW
XW
XWXW
XW
XW
XW
XWXW XWXWXWXWXW
XW
WinefredLake
PrimroseLake
Saskatchewan
Alberta
A490
A493
A496A492
A441A498
A486
A495
A436
Source: Devon, GeoBase®, Spatial Data Warehouse Ltd.
¬«881¬«63
A502
A500
A494
A491
A487
A463 A462A461
A460A459
A458
A456A454A453 A451
A450
A448A447
A446A445
A444A443
A442
A440
A439A438A437
A435
A433
A432
A431
A429
A428
A427
A426
A388
A384
A383
A379
A377
A308
A235A233
A231
A230
A228 A227 A226
A225
A224
A223
A221
A220
A219A218
A217
A216
A215
A214
A212
A210
A208
A204
A203A202
A200
A174
A173
A172A171
A169
A168
A162A161
A160
A115
A113
A106
A103
A099
A095
A094
A093
A092
A084
A081
A078
A071
A068
A066
A065
A064
A062
A029
A028
A005
A455
A449
A140
A001
A167A166
A027
A026 A009
A007
A006 A025
A008
LegendAir Quality RSA
Aquatics RSA
Aquatics LSA
Cold Lake Air Weapons Range
Open Water
Watercourse
Road
XW Deposition Study Location
XW Deposition Location Exceeding Critical LoadDeposition Study Locations
Pike 1 Project
May 24, 2012
Figure8.4-1
PROVIDED BY:
AMECFINAL MAPPING BY:
AMEC
Fig08.04-01 Deposition Study Locs.mxd
±M
ap P
ath:
S:\G
is\P
roje
cts\
CE
\Dev
on\0
4050
_Pik
e\A
rcG
IS P
roje
cts\
Volu
me
02 -
Sec
tion
08 S
urfa
ce W
ater
Qua
lity\
Fig0
8.04
-01
Dep
ositi
on S
tudy
Loc
s.m
xd
Ana
lyst
- Ja
y B
outin
10 0 10 205
Kilometres1:850000
Devon NEC Corporation Pike 1 Project Volume 2 – Environmental Impact Assessment June 2012
Page 8-7
Base cations were calculated using the concentrations of calcium, magnesium, sodium and potassium. The lake database initially developed by Saffran and Trew (1996) and updated by WRS (2004) was used as a basis for selecting lake receptors to be assessed for acidifying deposition effects. This information was supplemented by baseline water quality data from several environmental impact assessments (EIAs) completed within the study areas as noted above, as well as:
• Alberta Environment Unpublished Water Chemistry Data (AENV 2012); and
• Alberta Lake Management Society Water Quality Reports (ALMS 2007). Water quality data for lakes in the ALSA (Hay, Kirby and Christina) were obtained from the baseline field surveys described above. The rates of deposition, expressed as potential acid input (keq H+/ha/y), nitrogen (kg N/ha/y) and sulphur (kg S/ha/y), were obtained from CALPUFF modeling (Volume 3, Appendix C6) and determined for each lake. If the potential acid input value predicted was greater than the calculated critical load, the potential exists for acidification of the lake. If the critical load was not exceeded, the buffering capacity was deemed to be sufficient to prevent lake acidification. The calculated lake critical loads were evaluated against a seasonal deposition pattern. During winter conditions, acidic substances accumulate on the snow. During spring snow melt, substances accumulated over the winter are released. Because the ground is still frozen during this period and plants do not assimilate nitrate (NO3
-), it is assumed that the entire quantity of accumulated acidic substances enters the receiving lakes and ponds. During open water conditions, it is assumed that all sulphur (SO2 and SO4
2-) deposited will ultimately enter a receiving waterbody but that nitrate will be taken up by vegetation, thus reducing its acidification effects. Several ranges have been suggested for nitrate uptake in the Athabasca oil sands region and in similar ecosystems: 8 to 24 kg N/ha/y for 100 years (CEMA 2005), 9 kg/ha/y (Sullivan 2000), and 10 to 20 kg N/ha/y (Laxton et al. 2010). A value of 8 kg N/ha/y was adopted as the most conservative estimate for this assessment; thus, nitrate deposition over 8 kg N/ha/y was included in the total deposition during summer. Where nitrate deposition is predicted to be less than or equal to 8 kg N/ha/y, contribution of nitrate deposition is considered during the winter months only. For all waterbodies with a predicted nitrate deposition value greater than 8 kg/ha/y, the excess is considered to leach into receiving waterbodies during the summer and is included as an acidifying agent in the assessment. For other forms of nitrogen, such as nitrite or nitrogen monoxide, it is assumed that the full deposition will ultimately enter a receiving waterbody.

Devon NEC Corporation Pike 1 Project Volume 2 – Environmental Impact Assessment June 2012
Page 8-8
8.5 Baseline Case
8.5.1 Water Quality in the ALSA
8.5.1.1 Monday Creek Catchment
Monday Creek
Water quality data for Monday Creek are provided in Volume 3, Appendix G, Table G-1. Monday Creek was sampled at site WQ3 for the Devon Jackfish 1 EIA; at site MC1 for the Devon Jackfish 1 EIA (named site WQ4) and the Devon Jackfish 3 EIA, and at site SWQ3 for the Devon Jackfish 1 wetland monitoring program (Figures 8.5-1). Monday Creek flows north through the western portion of the study area before entering Sunday Creek. Monday Creek was generally well oxygenated except during the winter, when most concentrations were below the CEQG and ASWQG of 6.5 mg/L. Values for pH ranged from 4.6 to 8.4, however, the field measurement of 4.6 was likely due to equipment malfunction as the lab pH reading for the same sampling event was 8.0. Two other field pH measurements were outside of the CEQG range of 6.5 to 9.0 and the ASWQG range of 6.5 to 8.5, one in spring of 2010 at 6.3 and one in spring of 2011 at 8.6. The field-measured specific conductivity ranged from 86 to 620 µS/cm, with the highest values observed in winter, particularly in winter of 2002, indicating that flow was likely composed primarily of groundwater in winter. As well, the highest values of total dissolved solids (TDS) were also observed in winter, and concentrations ranged from 50 to 348 mg/L. The highest total suspended solids (TSS) concentration was observed during spring freshet and concentrations ranged from below the detection limit of 2 to 63 mg/L. Nitrogen concentrations were generally low in Monday Creek, nitrate and nitrite concentrations were below detection limits in most samples. Ammonia concentrations ranged from below the detection limit of 0.03 to 0.4 mg/L. Total phosphorus concentrations were generally high in the creek and were above the ASWQG of 0.05 mg/L in 10 of 23 samples. Concentrations ranged from below the detection limit of 0.03 to 0.4 mg/L with a median concentration of 0.07 mg/L. One total phenol sample was above the CEQG of 0.004 mg/L with a concentration of 0.005 mg/L, while four samples were at the guideline. Hydrocarbon and PAH concentrations were generally below detection limits, however, one toluene sample was at the CEQG of 0.002 mg/L and one naphthalene concentration was measured at 0.08 µg/L.

!(
!(
!(
!( !(
!(!(!(
!(
!(
!(
!(
!(!(
!(
!(
!(
!( !(
!(
!(
!(
!(
Kirby Road
HayLake
KirbyLake
Paul'
s Roa
dSandy Rive
r
WinefredLake
ChristinaLake
!!881
Birch
Cree
k
Mon
day
CreekSunday
Creek
GristLake
IpiatikLake
SU3
WQ3
SU1
CL-3CL-1 CL-1
WB-WL
HL
KL
SR1 SR3SR4
SR2
HC1
HC2
TSR1
TSR4TSR3
TSR2
Conklin
SW1
SW3
SW10
T73
T74
T72
T71
T77
T76
T75
R6W4R7W4 R3W4R4W4R8W4R9W4 R4W4R5W4Legend
Aquatics RSA
Aquatics LSA
Pike Project Footprint
Cold Lake Air Weapons Range
Open Water
Watercourse
Road
!( Jackfish Wetland Monitoring
!( Pike Sampling Program
Historical Sampling Location!( Devon (2004, 2006, 2010)
!( Cenovus 2010
!( Encana 2009
!( MEG 2008
Sampling Locations
Pike 1 Project
June 05, 2012
Figure8.5-1
PROVIDED BY:
AMECFINAL MAPPING BY:
AMEC
Fig08.05-01 Sampling Locations.mxd
±M
ap P
ath:
S:\G
is\P
roje
cts\
CE
\Dev
on\0
4050
_Pik
e\A
rcG
IS P
roje
cts\
Volu
me
02 -
Sec
tion
08 S
urfa
ce W
ater
Qua
lity\
Fig0
8.05
-01
Sam
plin
g Lo
catio
ns.m
xd
Ana
lyst
- C
laud
ia F
uent
es
2 0 2 41
Kilometres1:300000
Source: Devon, © Department of Natural Resources Canada.All rights Reserved, GeoBase®, Spatial Data Warehouse Ltd.
R4W4 R3W4

Devon NEC Corporation Pike 1 Project Volume 2 – Environmental Impact Assessment June 2012
Page 8-10
Total metals concentrations were generally low in Monday Creek and often below detection limits. However, several guideline exceedances were noted. Thirteen of the 23 total aluminum concentrations were above the CEQG of 100 µg/L with concentrations ranging from 17 to 1 580 µg/L. Cadmium exceeded the CEQG of 0.02 µg/L five times, while chromium concentrations exceeded the CEQG of 1 µg/L three times. Total copper exceeded the CEQG of 2 µg/L four times. Total silver concentrations exceeded the CEQG of 0.1 µg/L four times. Total thallium concentrations exceeded CEQG of 0.8 µg/L three times. Total iron concentrations exceeded the CEQG guideline of 300 µg/L in 20 of the 23 samples with concentrations ranging from 105 to 1 600 µg/L. Two total iron concentrations of 3 270 µg/L and 6 900 µg/L were measured in winter of 2002 and it is likely that this is due to higher influences of groundwater at the time due to low flows, as all other values for total iron are much lower. Total manganese concentrations exceeded the CDWQG of 50 µg/L twelve times with concentrations ranging from 12 to 370 µg/L. As with total iron, two elevated manganese values were observed in winter of 2002 of 2 010 µg/L and 2 252 µg/L, and are thought to be due to a larger influence of groundwater at the time due to low flows, as all other total manganese values were much lower.
8.5.1.2 Hay and Kirby Lakes Catchment
Kirby Lake
Kirby Lake has a surface area of approximately 537 ha and is the largest waterbody in the ALSA. The lake has a maximum depth of 11 m. Water quality data for Kirby Lake are presented in Volume 3, Appendix G, Table G-2 and were obtained during the 2010 to 2012 field programs. Kirby Lake is well oxygenated with surface DO measurements ranging from 8.2 to 12.9 mg/L. Profile data collected during the Project fisheries surveys suggest that in the fall DO concentrations were fairly consistent through the water column, however, in spring, summer, and winter, concentrations were anoxic close to bottom sediments (Figure 8.5-2). Profiles show no thermocline was present during the survey period (Figure 8.5-2). Field measurements of pH ranged from 7.8 to 8.5 with the measurement of 8.5 being at the upper end of the ASWQG range of 6.5 to 8.5. Specific conductivity measurements ranged from 197 to 260 µS/cm. TDS ranged from 120 to 160 mg/L. TSS ranged from below the detection limit of 2 mg/L to 21 mg/L. The dominant ions in the lake were bicarbonate and calcium. Nitrogen concentrations in Kirby Lake were low, with ammonia, nitrate and nitrite concentrations generally below detection limits. Total Kjeldahl nitrogen (TKN) concentrations ranged from below the detection limits of 0.08 mg/L to 0.49 mg/L. Total phosphorus concentrations ranged from below the detection limit of 0.02 mg/L to 1.1 mg/L, with the value of 1.1 being above the ASWQG of 0.05 mg/L. All hydrocarbon and PAHs constituents were below their respective detection limits in all samples.

Dissolved Oxygen
Spring 2010 DO (mg/L)
Summer 2010 DO (mg/L)
Fall 2011 DO (mg/L)
Winter 2011 DO (mg/L)
Spring 2010 Temperature (ºC)
Summer 2010 Temperature (ºC)
Fall 2010 Temperature (ºC)
Winter 2010 Temperature (ºC)
Temperature
Dep
th (m
)D
epth
(m)
Kirby Lake Profiles
Pike 1 Project
May 17, 2012
Figure8.5-2
PROVIDED BY:
AMECFINAL MAPPING BY:
AMEC
Fig08.05-02 Kirby Lake Profiles.mxd
Map
Pat
h: S
:\Gis
\Pro
ject
s\C
E\D
evon
\040
50_P
ike\
Arc
GIS
Pro
ject
s\Vo
lum
e 02
- S
ectio
n 08
Sur
face
Wat
er Q
ualit
y\Fi
g08.
05-0
2 K
irby
Lake
Pro
files
.mxd
A
naly
st -
Jay
Bou
tin
Source: AMEC.
R4W4 R3W4

Devon NEC Corporation Pike 1 Project Volume 2 – Environmental Impact Assessment June 2012
Page 8-12
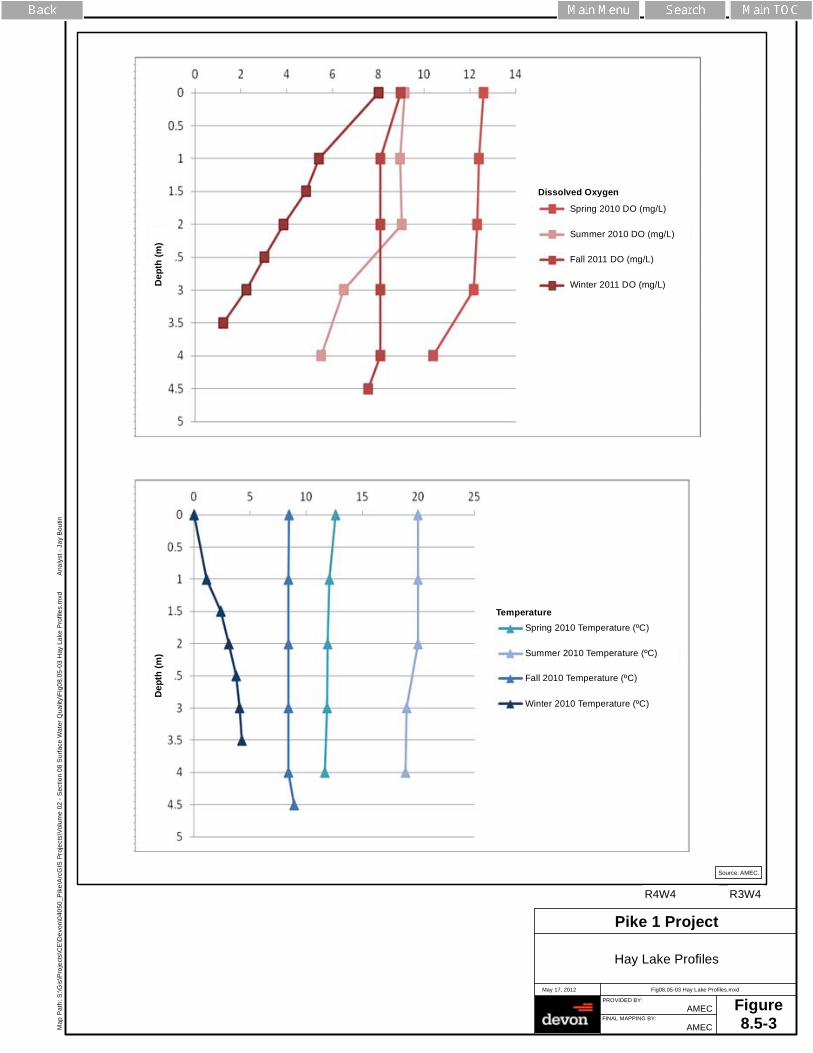
Total metals concentrations were generally low in Kirby Lake and often below detection limits. Only three guideline exceedances were noted: two total iron concentrations of 400 µg/L were above the CEQG and CDWQG of 300 µg/L in summer and winter samples, and one fall total manganese concentration was at the CDWQG of 50 µg/L. Hay Lake Hay Lake has a surface area of about 297 ha and is the second largest waterbody in the ALSA. The maximum depth is approximately 5 m with an average depth of 3.4 m (Devon 2004). Water quality data for Hay Lake are provided in Volume 3, Appendix G, Table G-3 and were obtained from the Devon Jackfish 1 EIA (Devon 2004), the EnCana Application for Approval of the Christina Lake Thermal Expansion Project (EnCana 2009); and from the 2011/2012 sampling program. Hay Lake was well oxygenated, even in winter, with DO concentrations ranging from 7.8 to 10 mg/L. However, profile data collected during the Project fisheries surveys showed that the water column becomes anoxic close to the bottom in winter (Figure 8.5-3). Field measured pH ranged from 7.4 to 9.2. The measurement of 9.2 being outside of the CEQG and ASWQG ranges of 6.5 to 9.0 and 6.5 to 8.5, respectively. Specific conductivity ranged from 160 to 279 µS/cm. TDS ranged from 130 to 163 mg/L and TSS ranged from below the detection limit of 3 to 6 mg/L. The concentration of nitrogen constituents was generally below detection limits in Hay Lake. Total phosphorus concentrations exceeded the ASWQG of 0.05 mg/L twice (n=4). Total organic carbon ranged from 11 to 12.4 mg/L. All hydrocarbons and PAHs were below their respective detection limits in all samples. Total metals concentrations were generally low, and often below detection limits. No guideline exceedances were noted. Hay Lake Drainage An Unnamed Drainage is the outlet stream for Hay Lake and flows north into Christina Lake. It is a small, deep, slow flowing creek with several sections dammed by beavers. The substrate consists primarily of silt and organic matter. Water quality data for Unnamed Drainage are provided in Volume 3, Appendix G, Table G-4. Data were obtained from the Devon Jackfish 1 EIA (named site HL1) (Devon 2004) (Figure 8.5-1), the Devon Jackfish 2 wetland monitoring program (named site SW10) (Figure 8.5-1), and from the 2010/2011 sampling program (sites HC1 and HC2) (Figure 8.5-1). Unnamed Drainage was generally well oxygenated, with only one winter measurement of 5.5 mg/L observed below the CEQG of 6.5 mg/L. Field measured pH ranged from 7.4 to 8.3. Specific conductivity ranged from 153 to 300 µS/cm, with lowest measurements generally observed during the spring freshet. TDS ranged from 60 to 164 mg/L. TSS ranged from below the detection limit of 2 mg/L to 18 mg/L. Hardness ranged from 68 to 160 mg/L. Dominant ions in the creek were bicarbonate and calcium.
Dep
th (m
)D
epth
(m)
Dissolved Oxygen
Spring 2010 DO (mg/L)
Summer 2010 DO (mg/L)
Fall 2011 DO (mg/L)
Winter 2011 DO (mg/L)
Spring 2010 Temperature (ºC)
Summer 2010 Temperature (ºC)
Fall 2010 Temperature (ºC)
Winter 2010 Temperature (ºC)
Temperature
Dep
th (m
)D
epth
(m)
Hay Lake Profiles
Pike 1 Project
May 17, 2012
Figure8.5-3
PROVIDED BY:
AMECFINAL MAPPING BY:
AMEC
Fig08.05-03 Hay Lake Profiles.mxd
Map
Pat
h: S
:\Gis
\Pro
ject
s\C
E\D
evon
\040
50_P
ike\
Arc
GIS
Pro
ject
s\Vo
lum
e 02
- S
ectio
n 08
Sur
face
Wat
er Q
ualit
y\Fi
g08.
05-0
3 H
ay L
ake
Pro
files
.mxd
A
naly
st -
Jay
Bou
tin
Source: AMEC.
R4W4 R3W4

Devon NEC Corporation Pike 1 Project Volume 2 – Environmental Impact Assessment June 2012
Page 8-14
Nitrogen concentrations are generally low in Unnamed Drainage. Ammonia concentrations ranged from below the detection limit of 0.02 to 0.15 mg/L. Most nitrate and nitrite samples were below the detection limit of 0.05 mg/L. Total phosphorus ranged from below the detection limit of 0.02 to 0.09 mg/L with the 0.09 mg/L value being above the CEQG of 0.05 mg/L. Two total phenol concentrations were at or exceeded the CEQG of 0.004 mg/L with values of 0.004 and 0.005 mg/L. Only one sample for naphthenic acids was above the detection limit of 1 mg/L with a concentration of 1.3 mg/L. All hydrocarbon and PAHs constituents were below their respective detection limits in all samples. Total metals were generally low and often below detection limits. A few guideline exceedances were noted. Total aluminum concentrations exceeded the CEQG of 100 µg/L once in spring, with a concentration of 234 µg/L. Total copper concentrations exceeded the CEQG of 2 µg/L once in winter, with a concentration of 7 µg/L. Total iron concentrations exceeded the CEQG and CDWQG of 300 µg/L in all seasons at site HC2 and once in fall at site SW10. Two total manganese concentrations were at or above the CDWQG of 50 µg/L, with a maximum concentration of 225 µg/L. Three total mercury exceedances were noted. Two samples were at the chronic ASWQG of 0.005 µg/L, and one sample exceeded the CEQG of 0.026 µg/L with a concentration of 0.06 µg/L.
8.5.1.3 Sandy River Catchment
Sandy River
The Sandy River flows through the southern portion of the ALSA and drains to Winefred Lake. Water quality at this site was measured at sites SR1, SR2, SR3 and SR4 during the 2010/2011 sampling program (Figure 8.5-1). Data for the Sandy River are presented in Volume 3, Appendix G, Table G-5. The river was well oxygenated with only one sample, in winter, below the CEQG of 6.5 mg/L and the ASWQG of 5.0 mg/L, with a value of 2.2 mg/L. Insitu measurements of pH ranged from 7.1 to 8.8, with the value of 8.8 observed outside the ASWQG range of 6.5 to 8.5. Specific conductivity ranged from 99 to 289 µS/cm, while TDS ranged from 52 to 224 mg/L. TSS concentrations ranged from below the detection limit of 2 mg/L to 42 mg/L. Highest TSS values were observed in the spring. Hardness values ranged from 48 to 177 mg/L. The dominant ions in the river were calcium and bicarbonate. Ammonia, nitrate and nitrite concentrations were generally low in the river, with most values below detection limits. TKN concentrations ranged from 0.1 to 2 mg/L. Total phosphorus concentrations ranged from below the detection limit of 0.02 mg/L to 0.1 mg/L with three

Devon NEC Corporation Pike 1 Project Volume 2 – Environmental Impact Assessment June 2012
Page 8-15
measurements being above the ASWQG of 0.05 mg/L (n=12). Phenols concentrations were either at or above the CEQG of 0.004 mg/L three times however all other samples were below detection limits. Most hydrocarbons and PAHs were below detection limits; however, naphthalene was detected in one winter sample at a concentration of 0.1 µg/L. While many metals concentrations were above detection limits, most concentrations were low. However, several exceedances of total metals guidelines were noted. Total aluminum concentrations exceeded the CEQG and CDWQG of 100 µg/L three times in spring, and concentrations ranged from 34 to 1 230 µg/L. Total chromium concentrations exceeded the CEQG of 1 µg/L once in spring, with a concentration of 1.1 µg/L. Total iron concentrations exceeded the CEQG and CDWQG of 300 µg/L in all samples, with a median concentration of 845 µg/L. Total manganese concentrations met or exceeded the CDWQG of 50 µg/L in 7 of 12 samples, and concentrations ranged from below the detection limit of 50 to 270 µg/L. Total mercury concentrations met or exceeded the chronic ASWQG of 0.005 µg/L twice, and concentrations ranged from below the detection limit of 0.002 to 0.006 µg/L.
Unnamed Tributary of the Sandy River #1
Unnamed tributary of the Sandy River #1 (Site TSR1) flows from the southwestern corner of the ALSA and drains in to a series of small lakes, before it then flows in to the Sandy River (Figure 8.5-1). This tributary was sampled during the 2010/2011 sampling program and data are provided in Volume 3, Appendix G, Table G-6. The creek was well oxygenated with only one measurement, during winter, being below the CEQG of 6.5 mg/L with a value of 5.9 mg/L. Field measurements of pH ranged from 7.1 to 8.1, and specific conductivity ranged from 1.6 to 4.9 µS/cm, with highest values observed in winter. Total dissolved solids followed the same pattern as specific conductivity, with highest values observed in winter, and values ranged from 56 to 280 mg/L. TSS was highest in spring and values ranged from below the detection limit of 2 mg/L to 9 mg/L. Hardness values ranged from 49 to 199 mg/L and the dominant ions in the creek were calcium and bicarbonate. Most nitrogen constituents were below detection limits in the creek. TKN values ranged from 0.2 to 0.7 mg/L. Total phosphorus concentrations ranged from below the detection limit of 0.02 mg/L to 0.09 mg/L, with the 0.09 mg/L measurement being above the ASWQG of 0.05 mg/L. One total phenol concentration was at the CEQG of 0.004 mg/L in fall. All hydrocarbons and PAHs were below their respective detection limits in all seasons. Metal concentrations were low in the creek, and often below detection limits. However, a few guideline exceedances were noted. One total aluminum concentration of 136 µg/L exceeded the CEQG of 100 µg/L in spring. As with other waterbodies in the area, total iron concentrations

Devon NEC Corporation Pike 1 Project Volume 2 – Environmental Impact Assessment June 2012
Page 8-16
exceeded the CEQG and CDWQG of 300 µg/L in all samples, with concentrations ranging from 440 to 2 450 µg/L. One total manganese concentration in winter of 400 µg/L exceeded the CDWQG of 50 µg/L.
Unnamed Tributary of the Sandy River #2
Unnamed Tributary of the Sandy River #2 (Site TSR2) flows in a southwesterly direction from a small unnamed lake to the Sandy River (Figure 8.5-1). The tributary was sampled during the 2010/2011 sampling program and data are provided in Volume 3, Appendix G; Table G-7. DO concentrations were below the CEQG of 6.5 mg/L twice, once in winter with a concentration of 2.2 mg/L and once in summer with a concentration of 5.7 mg/L. Field measured pH ranged from 7.1 to 8.4. Specific conductivity ranged from 126 to 183 µS/cm. TDS concentrations ranged from 88 to 188 mg/L while TSS ranged from below the detection limit of 2 to 16 mg/L. Hardness ranged from 54 to 123 mg/L. Dominant ions in the creek were bicarbonate and calcium. Nitrate and nitrite concentrations were below detection limits in all samples. Ammonia concentrations ranged from below the detection limit of 0.02 to 0.1 mg/L. TKN concentrations ranged from 0.6 to 0.9 mg/L. Total phosphorus ranged from below the detection limit of 0.02 to 0.04 mg/L. All PAHs and hydrocarbon constituents were below their respective detection limits in all samples. Metals concentrations were low in this creek and often below detection limits. Total aluminum concentrations exceeded the CEQG of 100 µg/L once in summer with a concentration of 108 µg/L. Total copper concentrations were quite high in summer with a concentration of 68 µg/L, which exceeded the CEQG of 2 µg/L. The dissolved concentration of copper, which is the bioavailable form, was low at 0.1 µg/L. As with other sites in the ALSA, total iron concentrations frequently exceeded the CEQG and CDWQG of 300 µg/L, and concentrations ranged from 190 to 1 830 µg/L. One total manganese concentration, in winter, exceeded the CDWQG of 50 µg/L with a concentration of 180 µg/L. One total mercury concentration in spring was measured at the ASWQG of 0.005 µg/L.
Unnamed Tributary of the Sandy River #3
Unnamed Tributary of the Sandy River #3 (Site TSR3) is a small creek that flows south from a small unnamed lake to the Sandy River (Figure 8.5-1). The tributary was sampled during the 2010/2011 sampling program and data are provided in Volume 3, Appendix G, Table G-8. The creek was frozen to depth in winter. DO concentrations ranged from 6.2 to 10.0 mg/L with the 6.2 mg/L measurement being slightly below the CEQG of 6.5 mg/L. Field measured pH ranged from 7.4 to 8.0.

Devon NEC Corporation Pike 1 Project Volume 2 – Environmental Impact Assessment June 2012
Page 8-17
Specific conductivity ranged from 137 to 180 µS/cm, with the highest measurements observed in fall. TDS followed the same pattern and concentrations ranged from 134 to 187 mg/L. TSS concentrations were low and ranged from below the detection limit of 2 to 3 mg/L. Hardness ranged from 69 to 94 mg/L. The dominant ions in the creek were bicarbonate and calcium. Nutrient concentrations in the creek were low and often below detection limits. TKN concentrations were measured at 0.3 mg/L in all seasons. Total phosphorus concentrations ranged from 0.03 to 0.04 mg/L. All hydrocarbon and PAHs constituents were below their respective detection limits in all samples. Total metals concentrations were low and often below guidelines. As with other sites in the ALSA, total iron and total manganese concentrations exceeded guidelines in all samples. Total iron concentrations ranged from 960 to 1 720 µg/L which exceeded the CEQG and CDWQG of 300 µg/L. Total manganese concentrations ranged from 60 to 130 µg/L, which exceeded the CDWQG of 50 µg/L.
Unnamed Tributary of the Sandy River #4
Unnamed Tributary of the Sandy River #4 (Site TSR4) flows south from a small unnamed lake to the Sandy River (Figure 8.5-1). The tributary was sampled during the 2010/2011 sampling program and data are provided in Volume 3, Appendix G, Table G-9. The creek was dry in winter likely due to a frozen beaver impoundment upstream preventing water from flowing downstream. Numerous beaver impoundments were noted in the vicinity of site TSR4. The creek was well oxygenated with dissolved oxygen concentrations ranging from 7.0 to 12.4 mg/L. Field measured pH ranged from 7.6 to 8.2. Specific conductivity ranged from 129 to 181 µS/cm and was highest in fall. TDS followed the same pattern with concentrations ranging from 96 to 124 mg/L. TSS concentrations were low and ranged from 2 to 3 mg/L. Hardness ranged from 60 to 84 mg/L. Dominant ions in the creek were calcium and bicarbonate. Nutrient concentrations were low at site TSR4 and often below detection limits. TKN concentrations ranged from 0.3 to 0.6 mg/L, while total phosphorus, ammonia, nitrate, and nitrite concentrations were below detection limits in all samples. Total metals concentrations were low and often below guidelines. As with other sites in the area, total iron concentrations exceeded guidelines in all samples. Total iron concentrations ranged from 370 to 650 µg/L which exceeded the CEQG and CDWQG of 300 µg/L. Total manganese concentrations reached or exceeded the CDWQG of 50 µg/L in two samples with concentrations of 50 and 80 µg/L.

Devon NEC Corporation Pike 1 Project Volume 2 – Environmental Impact Assessment June 2012
Page 8-18
8.5.2 Sediment Quality in the ALSA
Results of sediment quality analyses are summarized below. Detailed results for all sample sites in the ALSA are provided in Volume 3, Appendix G, Table G-10.
8.5.2.1 Monday Creek Catchment
Monday Creek
Sediment in Monday Creek is comprised mostly of sand (98%) with a small amount of silt (2%) and less than 1% clay. Total organic carbon content was low at 0.1%. All hydrocarbon and PAHs constituents were below their respective detection limits in Monday Creek sediment. No ISQG exceedances for metals were noted.
8.5.2.2 Hay and Kirby Lakes Catchment
Kirby Lake
The sediment samples collected at Kirby Lake consisted of 100% sand. No ISQG exceedances for PAHs or metals constituents were noted.
Unnamed Drainage
Sediment quality samples were taken at sites HC1 and HC2 (Figure 8.5-1) as part of the 2010 sampling program. Sediment texture at site JE1 was composed primarily of sand (96%) with smaller amounts of silt (4%) and less than 1% clay. At site HC1, sediment was composed of 60% sand, 36% silt and 4% clay. Total organic carbon was much higher at HC1 than HC2 (i.e., 9.23% vs. 0.4%). At site HC2, all hydrocarbon constituents were below their respective detection limits. At site HC1, the F3 and F4 hydrocarbon fractions were above detection limits with concentrations of 343 and 216 µg/g, respectively. All PAHs constituents were below detection limits at both sites. No guideline exceedances were noted for any of the metals.
8.5.2.3 Sandy River Catchment
Sandy River
Sediment quality samples were collected at three sites on the Sandy River: SR1, SR2 and SR3 (Figure 8.5-1). At site SR1, texture was characterized as 84% sand, 14% silt and 4% clay. At SR2, texture was characterized as 95% sand, 5% silt and less than 1% clay. At SR3, texture was 100% sand. At site SR3, all hydrocarbons and PAHs were below their respective detection limits. At site SR1, the F3 and F4 hydrocarbon fractions were measured at 108 and 60 µg/g, respectively. At site SR2, they were measured at 33 and 35 µg/g, respectively. All other hydrocarbons and PAHs were below detection limits in the Sandy River. No ISQG exceedances for metals were noted at any of the sites on Sandy River.
Devon NEC Corporation Pike 1 Project Volume 2 – Environmental Impact Assessment June 2012
Page 8-19
Unnamed Tributary of the Sandy River #1
Sediment quality data were obtained at site TSR1 for this watercourse. Sediment texture at this site was comprised mostly of sand (78%) with smaller amounts of silt (14%) and clay (8%). Most hydrocarbons and PAHs were below detection limits, however, as with other sites in the area, the F3 and F4 fraction of hydrocarbons were detected, with concentrations of 147 and 134 µg/g, respectively. No exceedances of the ISQG were noted.
Unnamed Tributary of the Sandy River #2
Sediment quality data were obtained at site TSR2 for unnamed tributary #2. Sediment texture at this site was comprised primarily of sand (95%) with smaller amounts of silt (5%) and less than 1% clay. All hydrocarbon and PAHs constituents were below detection limits. No exceedances of the ISQGs were noted.
Unnamed Tributary of the Sandy River #4
Sediment quality data were obtained at site TSR4 on this watercourse. Sediment texture at this site was primarily sand (90%) with smaller amounts of silt (8%) and clay (2%). Most hydrocarbons and PAHs were below detection limits however, as with other sites in the area, the F3 and F4 fractions of hydrocarbons were detected, with concentrations of 59 and 34 µg/g, respectively. No exceedances of the ISQGs were noted.
8.5.3 Water Quality in the ARSA
8.5.3.1 Sunday Creek Catchment
Sunday Creek
Water quality data for Sunday Creek are provided in Volume 3, Appendix G, Table G-11. Sunday Creek was sampled at sites SU1 and SU3 for the Devon Jackfish 1, 2 and 3 EIAs, and for the Jackfish 1 wetland monitoring program (site SW1) (Figures 8.5-1). The data show that Sunday Creek at site SW1 was generally well oxygenated with only two winter DO exceedances noted, with concentrations of 4.2 mg/L; below the CEQG and ASWQG of 6.5 mg/L. The pH ranged from 4.9 to 8.5 with the 4.9 measurement being below the CEQG range of 6.5 to 9.0 and the 8.5 measurement being at the upper limit of the ASWQG range of 6.5 to 8.5. It is suspected that the 4.9 measurement was due to instrument error as the laboratory measurement was 8.0. Specific conductivity ranged from 107 to 330 µS/cm. TDS concentrations ranged from 107 to 510 mg/L, while TSS concentrations ranged from below the detection limit of 1 mg/L to 175 mg/L. The highest levels of TSS were observed in spring.

Devon NEC Corporation Pike 1 Project Volume 2 – Environmental Impact Assessment June 2012
Page 8-20
Nitrogen concentrations were generally low in Sunday Creek and frequently below detection limits. TKN ranged from 0.1 to 1.5 mg/L. Total phosphorus concentrations exceeded the ASWQG of 0.05 mg/L 14 times (n=35) and concentrations ranged from below the detection limit of 0.05 mg/L to 0.4 mg/L. All hydrocarbon and PAHs concentrations were below their respective detection limits. Total metals concentrations were generally low in Sunday Creek, though a number of guideline exceedances were noted. Eighteen total aluminum samples exceeded the CEQG and CDWQG of 100 µg/L (n=35) and concentrations ranged from below the detection limit of 20 µg/L to 1 500 µg/L. Three total cadmium samples met or exceeded the CEQG of 0.02 µg/L. Five total chromium samples exceeded the CEQG of 1 µg/L. Six total copper samples exceeded the CEQG of 2 µg/L. Total iron concentrations exceeded the CEQG and CDWQG of 300 µg/L in all samples but three (n=35), and concentrations ranged from 78 to 2 720 µg/L. Eleven exceedances of the CDWQG for total manganese of 50 µg/L were noted with concentrations ranging from 7 to 283 µg/L. Four total silver concentrations met or exceeded the CEQG of 0.1 µg/L. Two total thallium concentrations exceeded the CEQG of 0.8 µg/L.
8.5.3.2 Christina Lake
Christina Lake is a long, narrow waterbody located north of the Project boundary (Figure 8.5-1). Much of the lake’s catchment lies to the south of the lake, which is drained by Sunday and Birch creeks. The lake outlet is the Jackfish River on the western edge of the lake, which then drains to the Christina River. The lake has three relatively deep basins with maximum depths of 33 m, 26 m, and 24 m. The lake also has two shallower basins, one with a depth of 12.2 m and the other with a depth of 1.5 m (Mitchell and Prepas 1990). Available water quality data for Christina Lake were obtained from the EnCana Application for Approval of the Christina Lake Thermal Expansion Project, Phases 1E, 1F, and 1G (EnCana 2009); the MEG Energy Application for Approval of the Christina Lake Regional Project, Phase 3 (MEG 2008); and the Cenovus Application for the Narrows Lake Project (Cenovus 2010), and are provided in Volume 3, Appendix G, Table G-12. Because of its depth, the lake becomes strongly thermally stratified in the summer and dissolved oxygen declines steadily with depth (MEG 2008). Data suggest that the lake is well buffered and that the dominant ions are bicarbonate and calcium. Hardness ranged from 86 to 107 mg/L. Specific conductivity ranged from 137 to 237 µS/cm while TDS ranged from 120 to 151 mg/L. TSS ranged from below the detection limit of 3 to 13 mg/L. Nutrient concentrations were generally low in Christina Lake. Ammonia concentrations were below detection limits. TKN concentrations ranged between 0.5 and 1.0 mg/L. One total phosphorus concentration was at the ASWQG of 0.05 mg/L.

Devon NEC Corporation Pike 1 Project Volume 2 – Environmental Impact Assessment June 2012
Page 8-21
Several total phenols concentrations were above the CEQG of 0.004 mg/L, and concentrations ranged from 0.003 to 0.01 mg/L. Total metals concentrations were generally low in Christina Lake and few guideline exceedances were noted. Total aluminum concentrations exceeded the CEQG and CDWQG of 100 µg/L once with a concentration of 510 µg/L. Total arsenic concentrations exceeded the CEQG of 5 µg/L three times, and concentrations ranged from 0.5 to 36 µg/L. Total cadmium concentrations exceeded the CEQG of 0.02 µg/L once with a concentration of 1.4 µg/L. One total copper concentration was at the CEQG of 2 µg/L.
8.5.3.3 Winefred Lake
The surface area of Winefred Lake is 122.8 km2 with an average depth of 8 m and a maximum depth of 15 m (AENV 2000) (Figure 8.5-1). Available water quality data for Winefred Lake were obtained from the MEG Energy Application for Approval of the Christina Lake Regional Project, Phase 3 (MEG 2008); and are provided in Volume 3, Appendix G, Table G-13. The Sandy River flows in to the southwestern corner of the lake. It is not known whether the lake thermally stratifies. DO concentrations were measured at 11.2 and 13.2 mg/L. Field measured pH was measured at 8.1 and 8.5. Specific conductivity was measured at 176 and 173 µS/cm. TDS concentrations ranged from 119 to 135 mg/L and hardness ranged from 89 to 100 mg/L. TSS concentrations ranged from 3 to 6 mg/L. Dominant ions in the lake were calcium and bicarbonate. All ammonia concentrations were below the detection limit of 0.05 mg/L. TKN concentrations ranged from 0.4 to 0.8 mg/L and total phosphorus concentrations ranged from 0.02 to 0.04 mg/L. Two total phenol concentrations exceeded the CEQG of 0.004 mg/L with concentrations of 0.005 and 0.006 mg/L. Total metals concentrations were low in Winefred lake and often below detection limits. Only one guideline exceedance was noted, a total manganese concentration that was at the CDWQG of 50 µg/L.
8.5.4 Sediment Quality in the ARSA
Sediment quality data are summarized below, and complete data for all sites in the ARSA are provided in Volume 3, Appendix G, Table G-14.
8.5.4.1 Sunday Creek
Sediment quality data were obtained at sites SU1, SU3 and SW1 on Sunday Creek. Sediment texture data was not collected at site SW1. At SU1 texture was comprised of 98% sand, 2% silt, and less than 1% clay. At SU3, texture was comprised of 78% sand, 18% silt and 4% clay. All

Devon NEC Corporation Pike 1 Project Volume 2 – Environmental Impact Assessment June 2012
Page 8-22
PAHs constituents were below detection limits for all three sites. At site SU3, as with other sites in the area, the F3 and F4 fraction of hydrocarbons were detected, with concentrations of 80 and 41 µg/g, respectively. No exceedances of the ISQG were noted.
8.5.4.2 Christina Lake
Available sediment quality data for Christina Lake were obtained from the Cenovus Application for the Narrows Lake Project (Cenovus 2010). Sediment texture in Christina Lake is composed primarily of sand (84 to 98%) with smaller amount of silt (1 to 9%) and clay (less than 1 to 8%). Most hydrocarbons and PAHs were below detection limits and no guideline exceedances were noted. One ISQG exceedance was noted for total arsenic; a concentration of 8.3 µg/g exceeded the ISQG of 5.9 µg/g.
8.5.4.3 Winefred Lake
Available sediment quality data for Winefred Lake were obtained from the MEG Energy Application for Approval of the Christina Lake Regional Project, Phase 3 (MEG 2008). Sediment texture in Winefred Lake is composed of 20% sand, 43% silt, and 37% clay. No hydrocarbon or PAHs samples were collected for Winefred Lake. No exceedances of the ISQGs were noted.
8.5.5 Acid Sensitivity of Lakes
The baseline conditions and critical loads are shown in Volume 3, Appendix G, Table G-15. Modeling indicates that all lakes in the ALSA and ARSA are sufficiently buffered against acid deposition to remain below critical load thresholds for the Baseline Case. In the AQRSA, a total of nine lakes were identified to be receiving depositions greater than the critical loads. These lakes are labelled on the map (Figure 8-4.1), as the following: A006, A007, A008, A009, A025, A026, A027, A166 and A167.
8.6 Application Case
The Project could potentially affect the surface water quality within the study area through the following:
• changes in background water quality as a result of withdrawal of groundwater and effects on surface water/ground water interactions;
• changes in water quality due to changes in runoff characteristics, stream flow, and erosion potential as a result of land disturbance;
• changes in the surface water chemistry due to wastewater releases;
• accidental releases of liquids; and
• changes in water chemistry as a result of acidifying air emissions following deposition on to waterbodies.

Devon NEC Corporation Pike 1 Project Volume 2 – Environmental Impact Assessment June 2012
Page 8-23
8.6.1 Subsurface Operations
Groundwater withdrawal and wastewater disposal have the potential to affect groundwater levels, which can in turn affect discharge to or from surface waterbodies, resulting in potential changes to water quality. As described in Volume 2.0, Section 6.6.2, the Project potable and utility water for the CPF is planned to be sourced from the Empress Terrace Aquifer. The Project saline water for makeup water use is planned to be sourced from a combination of saline water from the Lower Grand Rapids and the McMurray aquifers. Wastewater is planned to be disposed into the McMurray Aquifer, and drilling water from temporary wells is planned to be sourced from the Bonnyville Sand Aquifer. The potential impact of groundwater withdrawal and wastewater disposal on surface water quantity is predicted to be low (i.e., no greater than a 0.54% decrease in winter low flow) (Volume 2, Section 7.0), and would result in low impacts on water quality. As stated in Volume 2, Section 6.6.3, Project operations may affect the thermal regime of groundwater aquifers because the steam will be injected at a temperature of 261°C. High temperature steam in the wellbore may result in the development of a thermal plume in all hydrostratigraphic units intersected by the steam assisted gravity drainage wellbores. As temperature in the subsurface increases, mineral solubilities may change and a new thermodynamic equilibrium will be achieved. For some minerals, the solubility will increase resulting in increased concentrations in the pore water of the aquifers and aquitards. Once temperature conditions return to baseline conditions, the baseline thermodynamic equilibrium should re-establish. To date, approximately five years after steaming at Jackfish 1 Well Pad B, the Groundwater Monitoring Program has not detected changes in temperatures, water levels, or water quality, approximately 30 m downgradient of the steam assisted gravity drainage injection wells. Given that the characteristics of the formations are the same as in the Jackfish 2 and Jackfish 3 assessments, the assessment of potential extent of thermal effects associated with the Project is expected to be similar. Devon is committed to monitor groundwater in the vicinity of a representative well pad in the Project where steam injection will occur and will leverage the monitoring results to build on the information from the Jackfish projects. Devon’s Groundwater Monitoring Program will be designed to detect changes in water quality due to subsurface thermal plumes, and to plan appropriately to prevent exposure to downgradient receptors (Volume 2, Section 16.6). Potential effects to surface water quality associated with subsurface thermal plumes are expected to be negative and moderate, and are expected to cease following operations, when baseline temperature conditions re-establish (Volume 2, Section 6.6.3). Monitoring and development of appropriate risk management measures, if required, will minimize potential effects to surface water quality and surface water users. The final impact rating for the effect to surface water quality due to changes in groundwater quality is moderate (Volume 2, Section 6.0).

Devon NEC Corporation Pike 1 Project Volume 2 – Environmental Impact Assessment June 2012
Page 8-24
8.6.2 Surface Disturbances and Changes in Runoff
8.6.2.1 Construction Activities
The construction of roads, the CPF, well pads, pipelines and water crossings has the potential to directly impact the water quality of local waterbodies. Potential impacts include the introduction of constituents into waterbodies through transport in soil runoff. Other contaminants, such as nutrients and metals, can also be introduced, as they are often associated with high sediment yield. Appropriate planning, management and construction practices will be used to minimize erosion and sediment yields to waterbodies. These include the following:
• a 100 m buffer zone was applied to waterbodies during the constraints mapping process in siting Project facilities (Volume 2, Section 3.0);
• a 300 m buffer zone was applied to Kirby Lake during the constraints mapping process in siting Project facilities in order to address community concerns;
• transportation and utilities corridors were selected based on minimizing area disturbance by maximizing the use of existing corridors, minimizing habitat disruption, and minimizing water crossings;
• the design and installation of pipeline and road crossings will be in accordance with AENV’s Codes of Practice for Pipelines and Telecommunications Line Crossing a Water Body (AENV 2003a) and Code of Practice for Watercourse Crossings (AENV 2003b) under the Water Act;
• directional drilling will be the construction method utilized for underground pipeline crossings to prevent instream disturbance. Water quality will be monitored during installation;
• appropriate sediment control techniques, such as silt fences, will be used during the construction of roads, drainage ditches and pipelines to minimize sediment runoff;
• appropriate stabilization techniques will be implemented during soil stockpiling to minimize deposition from wind and water erosion; and
• all drilling waste will be managed and disposed of in accordance with Energy Resources Conservation Board (ERCB) Directive 050: Drilling Waste Management and all other Project wastes in accordance with ERCB Directive 058: Oilfield Waste Management Requirements for the Upstream Petroleum Industry.
With the implementation of these mitigation measures, impacts due to construction activities are considered to be low.

Devon NEC Corporation Pike 1 Project Volume 2 – Environmental Impact Assessment June 2012
Page 8-25
8.6.2.2 Runoff from the CPF and Well Pads
During plant operations, runoff from the CPF and well pads could directly impact surface water quality. A description and assessment of the disturbed areas that may be potential sources of runoff are provided in Volume 2, Section 7.0. Mitigation measures that will be implemented to minimize the impacts of runoff from these facilities include:
• construction of a system of drainage ditches and culverts to collect runoff from the CPF and direct it to the CPF stormwater retention ponds:
• construction of stormwater containment ponds at the CPF that will be designed to manage runoff from a 1:100 year precipitation event; and
• construction of a perimeter berm for well pads to ensure runoff is controlled and collected onsite prior to testing and discharge.
If release of the accumulated stormwater is required, the water will be tested and released to comply with ERCB Directive 055: Storage Requirements for the Upstream Petroleum Industry requirements and the requirements of the facility Alberta Environment and Water Approval or will be disposed offsite at an approved facility if release conditions are not met. Runoff collection in the stormwater ponds/areas will attenuate the overall concentration of TSS prior to discharge. Water will be discharged in a controlled manner to minimize erosion. No discharge from the stormwater containment ponds/areas will occur prior to water quality testing. The impacts of runoff from disturbed areas on the water quality of the receiving streams are expected to be low given implementation of the planned mitigation measures.
8.6.2.3 Runoff from Roads and Utility Corridors
Runoff from roads and utility corridors can potentially impact surface water quality by introducing suspended matter into local waterbodies through increased sediment load. Mitigation measures and appropriate road maintenance will be employed to control road runoff. These include:
• constructing and vegetating roadside ditches to collect and contain local road runoff;
• installing bridges at watercourse crossings; and
• installing culverts and/or rock drains at drainage lows and wetlands. The Project will include the temporary alteration of surface runoff through the incorporation of appropriate sediment control techniques to prevent sediments from entering watercourses. Wet areas mapping will be used to plan the locations for roads, which will assist in siting facilities to blend with natural drainage patterns and minimize the need for interventions (culverts) to maintain flows. Vegetated roadsides will help to collect and contain local road runoff. Thus, the impact of runoff from transportation and utility corridors on the surface water quality of the local waterbodies is rated as low.

Devon NEC Corporation Pike 1 Project Volume 2 – Environmental Impact Assessment June 2012
Page 8-26
8.6.2.4 Changes in Flow
Potential changes in stream water quality are associated with changes in the hydrological regime in the ALSA. Changes in stream flow may impact water quality through changes in the proportion between surface runoff and groundwater inflow. Impact from changes in disturbances within the catchment and the resulting decrease or increase in the runoff was assessed in Volume 2, Section 7.6. Annual total discharges in the Sandy River, Monday Creek and Kirby and Hay Lake drainages in the ALSA were evaluated as well as annual total runoff, peak flow, and low flow. The following maximum changes in flow due to the Project were identified in Volume 2, Section 7.6:
• the mean annual runoff was anticipated to increase by up to 1.4% in the upper Sandy River catchment;
• the 1:10 peak discharge is anticipated to increase by up to 3.5% in the upper Sandy River and the Hay and Kirby Lake catchments;
• the 1:100 peak flow is anticipated to increase by up to 2.3% in the Hay and Kirby Lake catchment; and
• winter low flow volumes are expected to decrease by up to 0.5% in Monday Creek. The magnitude of changes in flows due to the Project is predicted as low (Volume 2, Section 7.6). The estimated impacts on average annual runoff, peak flows and low flows are below detectable levels in all catchments. Because predicted impacts to flows range between 0 and 3.5%, which is well within the range of natural variability (Volume 2, Section 7.6), water quality is expected to also remain within natural variability and the impact to surface water quality is predicted to be low.
8.6.3 Wastewater Releases
The wastewater streams generated by the Project and their handling considerations are summarized as follows:
• produced water that can no longer be recycled will go to disposal wells;
• stormwater from the CPF and well pads will be collected onsite and released to the surrounding catchment in a controlled manner after testing; and
• domestic wastewater generated at the CPF during construction and operations will be collected and transported offsite for disposal at an approved location.

Devon NEC Corporation Pike 1 Project Volume 2 – Environmental Impact Assessment June 2012
Page 8-27
During operations, the permanent domestic wastewater system will be designed to hold five days of peak demand wastewater storage in wastewater collection tanks. The collection tanks will be located according to the 2009 Alberta Private Sewage Systems Standard of Practice as follows:
• 10 m from a water source;
• 10 m from a watercourse;
• 1 m from a property line; and
• 1 m from a building. Following implementation of the mitigation measures described in this section, no releases of process waters or other chemicals to surface waterbodies are expected. The final impact for wastewater releases is rated as neutral.
8.6.4 Accidental Releases
Devon will implement spill prevention control and response programs for Pike similar to those currently being implemented on their Jackfish project (Volume 1, Section 2.0). These programs include corrosion and protection management, as well as tank and pipeline inspection and repair components. Facility and well pad design will incorporate surface run-off control. All tanks at well pads and the CPF will have secondary containment and spill prevention devices installed in compliance with ERCB Directive 055. Devon maintains membership in the Western Canadian Spill Services Spill CO-OP. The Project is within Area Y of the CO-OP. Membership in the CO-OP provides access to the Spill Contingency Plan and the spill response equipment for Area Y. Devon will also maintain spill response equipment onsite at the CPF. Following implementation of the mitigation measures described in this section, the impact of accidental releases is rated as low.
8.6.5 Acid Deposition
The Application Case acid deposition and critical loads are provided in Volume 3, Appendix G, Table G-15. Modeling indicates that all lakes in the ALSA and ARSA have sufficient buffering capacity to remain below critical load thresholds for the Application Case. Within the AQRSA, Baseline Case acid deposition concentrations for nine lakes are greater than their respective critical loads. These lakes are labelled on the map (Figure 8.4-1), as the following: A006, A007, A008, A009, A025, A026, A027, A166 and A167. One lake, labelled as A169, is at its critical load threshold in the Baseline Case and exceeds the critical load in the Application Case with an incremental Project contribution of 0.002 (keq H+/ha/y). All modeled results including the exceedance at A169, are conservative estimates in terms of predicted depositions and lake buffering capacity (see Volume 2, Sections 4.4 and 4.6). Therefore, potential for lake acidification in the Application Case is predicted to be low.

Devon NEC Corporation Pike 1 Project Volume 2 – Environmental Impact Assessment June 2012
Page 8-28
8.6.6 Summary of Mitigation Measures
The following provides a summary of the mitigation measures described for the water quality assessment:
• a 100 m buffer zone was applied to waterbodies (300 m buffer on Kirby Lake) during the constraints mapping process in siting Project facilities (Volume 2, Section 3.0);
• transportation and utilities corridors were selected based on minimizing area disturbance by maximizing the use of existing corridors, minimizing habitat disruption, and minimizing water crossings;
• design and installation of pipeline and road crossings will be in accordance with AENV’s Codes of Practice for Pipelines and Telecommunications Line Crossing a Water Body (AENV 2003a) and Code of Practice for Watercourse Crossings (AENV 2003b) under the Water Act;
• directional drilling will be the construction method utilized for underground pipeline crossings to prevent instream disturbance. Water quality will be monitored during installation;
• appropriate sediment control techniques, such as silt fences, will be used during the construction of roads, drainage ditches and pipelines to minimize sediment runoff;
• appropriate stabilization techniques will be implemented during soil stockpiling to minimize deposition from wind and water erosion;
• all drilling waste will be managed and disposed of in accordance with ERCB Directive 050 and all other Project wastes in accordance with ERCB Directive 58;
• constructing and vegetating roadside ditches to collect and contain local road runoff;
• installing bridges, culverts and/or rock drains at drainage lows, wetlands and watercourse crossings;
• produced water that can no longer be recycled will go to disposal wells;
• stormwater from the CPF will be collected by a system of drainage ditches and culverts and directed to the stormwater retention ponds and tested prior to discharge;
• runoff from well pads will be detained and released to the surrounding catchment after testing;
• a temporary domestic wastewater system will be installed at the CPF to accommodate the sanitary sewage requirements during construction; and
• during operations, the permanent domestic wastewater system will be designed to hold five days of peak demand wastewater storage in wastewater collection tanks. Waste will be trucked offsite to be disposed at an approved facility.

Devon NEC Corporation Pike 1 Project Volume 2 – Environmental Impact Assessment June 2012
Page 8-29
8.7 Planned Development Case
8.7.1 Changes in Surface Water Quality
The Planned Development Case (PDC) assesses the cumulative effects of the Project in combination with the effects of all existing, approved and planned projects in the ARSA. The projects associated with the PDC in the ARSA are listed in Volume 2, Section 3.6. The classification of effects for the Application Case indicated potential effects to water quality would be low. The approved and planned projects from the list above also had potential impacts to water quality that were rated as neutral to low and local in extent. Consequently, effects of the Project were not considered to operate cumulatively with other projects in the PDC. Therefore, the results of the PDC assessment are the same as those for the Application Case for the ARSA and ALSA.
8.7.2 Acid Deposition
Lakes in the AQRSA for which critical loads were exceeded in the Application Case remain above their critical loads in the PDC. Deposition is estimated to exceed the critical loads for two additional lakes in the AQRSA, labelled A162, and A435 in the PDC (Figure 8.4-1). The Project will contribute 6.5% and 11% of the depositions to these lakes. Potential for lake acidification in the PDC is predicted to be low in the in the AQRSA.
8.8 Monitoring
Existing monitoring stations installed as part of the Devon Jackfish project will be maintained on Sunday and Monday creeks. The existing Jackfish monitoring program will be expanded to include additional sites within the ALSA. This program will include water quality monitoring in streams and lakes at representative locations within the ALSA in accordance with anticipated Environmental Protection and Enhancement Act approval conditions. The program will be implemented to ensure that mitigation measures are effectively reducing or eliminating potential impacts of the Project and that water quality within the ALSA is within the range of natural variability. Devon is currently developing a monitoring program for the Jackfish projects to assess potential changes to fish and fish habitat associated with steam assisted gravity drainage-related thermal heave. This program will include hydrology and water quality components. Once finalized, it will be the basis for developing a similar program for the Project if required. Devon is also an active member of Regional Aquatics Monitoring Program (RAMP) and has been working with RAMP to extend the monitoring network into the southern region. In 2012, RAMP monitoring stations are planned for installation on Sunday Creek, Jackfish River and Christina Lake. Acid sensitive waterbodies are a component of RAMP.

Devon NEC Corporation Pike 1 Project Volume 2 – Environmental Impact Assessment June 2012
Page 8-30
8.9 Assessment Summary
The potential impacts of the Project on surface water quality are summarized in Table 8.9-1. The water quality in waterbodies in the ALSA is typical of streams and lakes in the region. The water quality is within the range of natural variability and represents healthy aquatic ecosystems. In baseline conditions, most of the water quality constituents tested were below applicable guideline concentrations. The mitigation measures which will be applied during construction and operation will ensure surface water quality protection from Project activities. Domestic wastewater will be held in tanks then trucked and disposed of offsite at an approved facility. Process waters will be recycled when possible or sent to a disposal well. Pipeline inspections will be completed on a regular basis to monitor for integrity. Spill management measures will be implemented as discussed in Volume 1, Section 2.0. Within the ARSA and ALSA the impacts of the Project on surface water quality are predicted to be low and localized with no interactions with other existing, approved or publicly disclosed developments; hence no cumulative impacts are anticipated within the ARSA. Acidifying emissions from the Project do not directly increase acid deposition to lakes in the ALSA or ARSA to levels above baseline conditions.

Devon NEC Corporation Pike 1 Project Volume 2 – Environmental Impact Assessment June 2012
Page 8-31
Table 8.9-1: Application Case Impacts to Surface Water Quality
Project Activity Direction Magnitude GeographicExtent Duration Frequency Reversibility Confidence Final Impact
Rating
Subsurface Operations Negative Moderate Local Long-Term Continuous Reversible Moderate Moderate
Construction Activities Negative Low Local Short-Term Infrequent Reversible Good Low
Runoff from CPF and Well Pads Negative Low Local Long-Term Seasonal Reversible Good Low
Runoff From Roads and Utility Corridors Negative Low Local Long-Term Seasonal Reversible Good Low
Changes in Runoff Neutral to Negative Low Local Long-Term Continuous Reversible Good Low
Wastewater Release Neutral – – – – – – Neutral
Acid Deposition Negative Low Regional Long-Term Continuous Reversible Good Low

Devon NEC Corporation Pike 1 Project Volume 2 – Environmental Impact Assessment June 2012
Page 8-32
8.10 References
Alberta Environment (AENV). 1999. Surface Water Quality Guidelines for Use in Alberta. November 1999. Environmental Service, Environmental Sciences Division and Natural Resources Service, Water Management Division. Alberta Environment Report. Publication No. T/483. ISBN 0-7785-0897-8. Edmonton. Alberta.
Alberta Environment (AENV). 2000. Winefred Lake and Grist Lake: Regional Integrated Decision. Edmonton, AB.
Alberta Environment (AENV). 2003a. Code of Practice for Watercourse Crossings. Alberta Environment, Edmonton, Alberta.
Alberta Environment (AENV). 2003b. Code of Practice for Pipelines and Telecommunication Lines Crossing a Water Body. Alberta Environment, Edmonton, Alberta.
Alberta Environment (AENV). 2006a. Aquatic Ecosystems Field Sampling Protocols. Environmental Assurance Division, Environmental Monitoring and Evaluation Branch. Edmonton, AB.
Alberta Environment (AENV). 2006b. Guidelines for Quality Assurance and Quality Control in Surface Water Quality Programs in Alberta. Environmental Assurance Division, Environmental Monitoring and Evaluation Branch. Edmonton, AB.
Alberta Environment (AENV). 2012. Unpublished Water Chemistry Data for Canoe Lake, Caribou Lake, and Primrose Lake. Edmonton, AB.
Alberta Lake Management Society (ALMS). 2007. Alberta Lakewatch Reports (2001-2005). Accessed 1 March 2011. http://www.alms.ca/Pages-Main/LakeWatch.htm#Data.
Canadian Council of Ministers for the Environment (CCME). 2002. Canadian Environmental Quality Guidelines (CEQG): Sediment Quality Guidelines for the Protection of Aquatic Life. Winnipeg, Manitoba.
Canadian Council of Ministers for the Environment (CCME). 2011a. Canadian Environmental Quality Guidelines (CEQG): Water Quality Guidelines for the Protection of Aquatic Life. Winnipeg, Manitoba.
Canadian Council of Ministers for the Environment (CCME). 2011b. Protocols Manual for Sampling Water Quality in Canada. Winnipeg, Manitoba.
Cenovus FCCL Ltd. (Cenovus). 2010. Narrows Lake Project. Prepared by Golder Associates Ltd. for Cenovus Ltd. Calgary, AB.
Cumulative Effects Management Association (CEMA). 2005. Nitrogen Sinks in Boreal Ecosystems. Prepared for Cumulative Environmental Management Association – Wood Buffalo Region by I. Callesen and P. Gundersen, Forest and Landscape Denmark, Danish Centre for Forest, Landscape and Planning, Royal Veterinarian and Agricultural University (KVL). Frederiksberg, Denmark.

Devon NEC Corporation Pike 1 Project Volume 2 – Environmental Impact Assessment June 2012
Page 8-33
Devon Canada Corporation (Devon). 2004. Application for the Approval of the Devon Jackfish 1 Project Including Supplementary Information Request. Prepared by AMEC Earth & Environmental for Devon. Calgary, AB.
Devon Canada Corporation (Devon). 2006. Application for Approval of the Devon J2 Project. Prepared by AMEC Earth & Environmental for Devon. Calgary, AB.
Devon Canada Corporation (Devon). 2010. Application for the Approval of the Devon J3 Project Including Supplementary Information Request. Prepared by AMEC Earth & Environmental For Devon. Calgary, AB.
EnCana. 2009. Amended Application for Approval of the Christina Lake Thermal Expansion Project, Phases 1E, 1F and 1G. Prepared by Golder Associates for EnCana. Calgary, AB.
Health Canada. 2010. Guidelines for Canadian Drinking Water Quality (CDWQG). Prepared by the Federal-Provincial-Territorial Committee on Drinking Water of the Federal-Provincial-Territorial Committee on Environmental and Occupational Health. Ottawa, Ontario.
Henriksen, A., J. Kamari, M. Posch, and A. Welander. 1992. Critical Loads of Acidity: Nordic Surface Waters. Ambio 21:356-363.
Laxton, D.L., S.A. Wathough, J. Aherne, and J. Straker. 2010. An Assessment of Nitrogen Saturation in Pinkus banksiana Plots in the Athabasca Oil Sands Region, Alberta. Journal of Limnology 69: 171-180.
Matrix Solutions Inc. 2007. 2006 Wetland Monitoring Devon Jackfish 1 Project. Calgary, AB.
Matrix Solutions Inc. 2008. 2007 Wetland Monitoring Devon Jackfish 1 Project. Calgary, AB.
Matrix Solutions Inc. 2009. 2008 Wetland Monitoring Devon Jackfish 1 Project. Calgary, AB.
Matrix Solutions Inc. 2011. 2010-2011 Wetland Monitoring Devon Jackfish 1 and 2 Projects (Draft). Calgary, AB.
MEG Energy Corporation (MEG). 2008. Application for Approval of the Christina Lake Regional Project – Phase 3. Volume 4: Aquatic Resources. Prepared by Golder Associates for MEG. Calgary, AB.
Mitchell, P. and E. Prepas. 1990. Atlas of Alberta Lakes. University of Alberta Press. Edmonton, AB.
Saffran, K. and D. Trew. 1996. Sensitivity of Alberta Lakes to Acidifying Deposition: An Update of Sensitivity Maps with Emphasis on 109 Northern Lakes. Special report prepared by Water Sciences Branch, Water Management Division, Alberta Environment Protection. Edmonton, Alberta.
Sullivan, T.J. 2000. Aquatic Effects of Acidic Deposition. CRC Press LCC. Boca Raton, Florida. 373 pp.
Western Resource Solutions (WRS). 2004 Calculation of Critical Loads of Acidity to Lakes in the Oil Sands Region. Report to the NOX-SOX Committee. Fort McMurray, Alberta.


![HEALTH PROFESSIONS COUNCIL OF SOUTH AFRICA - pike-law… · 2017/04/21 · [INSTRUCTED BY PIKE LAW] DR C ZINN MR A PIKE MS B KELL MS C BASSON VOLUME 25 PAGES 3765 - 3849 [MATTER](https://img.pdfslide.us/doc/110x75/5f1f10efd30f6a2986613dc7/health-professions-council-of-south-africa-pike-law-20170421-instructed.jpg)