Embed Size (px)
Citation preview

Volume 2: Environmental and Sturgeon Upgrader ProjectSocio-economic Impact Assessment Appendix 17A: Terrain and Soil Data
December 2006
Page 17A-1
APPENDIX 17A TERRAIN AND SOIL DETAILED DATA AND CALCULATIONS

Sturgeon Upgrader Project Volume 2: Environmental and Appendix 17A: Terrain and Soil Data Socio-economic Impact Assessment
December 2006 Page 17A-2

Volume 2: Environmental and Sturgeon Upgrader ProjectSocio-economic Impact Assessment Appendix 17A: Terrain and Soil Data
December 2006
Page 17A-3
17A.1 Soils Inspections Data
Table 17A-1: Descriptions of Symbols Used in Table 17A-2
Soil Series Variant Soil Subgroup Slope
Position Surface
Expression Drainage C – Crest U – Upper M – Mid L – Lower T – Toe D – Depression E – Level
ARM - Armena BAK – Bard Lake BVH – Beaverhills BWF - Bawlf DKN – Daken DUG – Duagh EDG - Edburg GRZ - Gratz HGT- Haight HRL – Hercules HYL – Hairy Hill HBM – Hobbema JFF - Jeffery JVE – Jarvie KSY- Kerensky MAK - Menaik MDR – Mundare MLT – Millet MMO - Malmo MNTaa – Manatokan MPV – Mapova NRM – Norma NTV - Northern Valley NVR – Navarre ONW - Onoway PHS- Peace Hills POK- Ponoka PRM- Primula RVN- Raven STE - Sante UKT- Ukalta WKN - Wetaskawin ZER – Misc. Eroded ZGW – Misc. Gleysol ZOR – Misc. Organic
pt – peaty zz – atypical subgroup zg – Rego and gleysolic xc – clay at 30-99 cm zr – Rego cr – carbonated tk – thick A horizon gl – Gleyed xs- sand at 30-99 cm co – coarse fi – fine ca – calcareous aa – not modal correlation area er - eroded
O.BLC – Orthic Black Chernozem R.BLC – Rego Black Chernozem CA.BLC-Calcareous Black Chernozem GL.BLC- Gleyed Black Chernozem GLCA.BLC – Gleyed Calcareous Black Chernozem GLR.BLC-Gleyed Rego Black Chernozem O.HG – Orthic Humic Gleysol R.HG – Rego Humic Gleysol T.M. – Terric Mesisol CU.HR – Cumulic Humic Regosol GLCU. HR – Gleyed Cumulic Humic Regosol
Slope Length Class
1 – 0-25 m 2 – 25-50 m 3 – 50-100 m 4 – 100-500 m 5 – 500-1000 m 6 - >1000 m
F – Fan H – Hummocky I – Inclined L – Level M – Rolling R – Ridged S – Steep T – Terraced U – Undulating NA – not applicable
VR – Very rapidly R – Rapidly W – Well MW – Moderately well I – Imperfectly P – Poorly VP – Poorly NA – not applicable

Sturgeon Upgrader Project Volume 2: Environmental and Appendix 17A: Terrain and Soil Data Socio-economic Impact Assessment
December 2006 Page 17A-4
Table 17A-2: Summary of Soil Inspection Sites for the Local Study Area
Site No.
Soil Code
Series Code
Surface Expression
Slope Position
(Site)
Slope Gradient
(%)
Slope Length Class
Drainage
Topsoil Depth
(A horizon) (cm)
Subsoil Depth(cm)
1 O.BLC UKT U U 5 4 W 36 74 10 GLR.BLC NVR-zr U L 3 2 I 26 14 100 HU.LG JVE-caxt U L 2 3 I 29 42 1000 GLCA.BLC HBM-glca U U 3 2 MW 78 17 1001 R.BLC PHS-zr U – 3 3 W 59 12 1002 R.BLC POK-zrcr U L 2 3 MW 54 10 1003 GLR.BLC HBM-zgcr U L 2 2 MW 49 13 1004 O.BLC BVH U M 3 3 MW 34 20 1005 HU.LG MPV-aa U L 2 3 I 28 35 1006 R.BLC MDR-zrcr U – 3 2 MW 56 0 1007 R.BLC PHS-zr U M 3 2 MW 90 20 1008 CA.BLC UKT-ca – M 3 3 W 32 49 1009 E.BLC POK-cr U T 3 3 MW 32 25 101 O.HG ONW-ca U L 1 – I 15 40 1010 R.HG KSY-cr U D 2 1 I 28 0 1011 R.BLC POK-zrcr U M 3 3 MW 56 0 1012 HU.LG JVE-ca U L 2 3 I 34 46 1013 O.HG MLT-xt U M 3 3 I 23 32 1014 HU.LG MLT-zlxt U D 1 - I 39 31 1015 R.BLC BVH-zrcr U L 4 3 MW 81 0 1016 GLCA.BLC HBM-glca U L 3 3 MW 24 42 1017 O.BLC UKT U U 2 3 W 44 61 1018 GL.BLC MDR-gl U M 3 2 MW 48 47 1019 HU.LG MPV-aa U L 2 3 I 32 33 102 O.BLC PHS U L 1 3 MW 58 20 1020 GLR.BLC UKT-zgcr U M 3 2 MW 45 14 1021 CA.BLC POK-ca U U 3 3 MW 60 45
Volume 2: Environmental and Sturgeon Upgrader ProjectSocio-economic Impact Assessment Appendix 17A: Terrain and Soil Data
December 2006
Page 17A-5
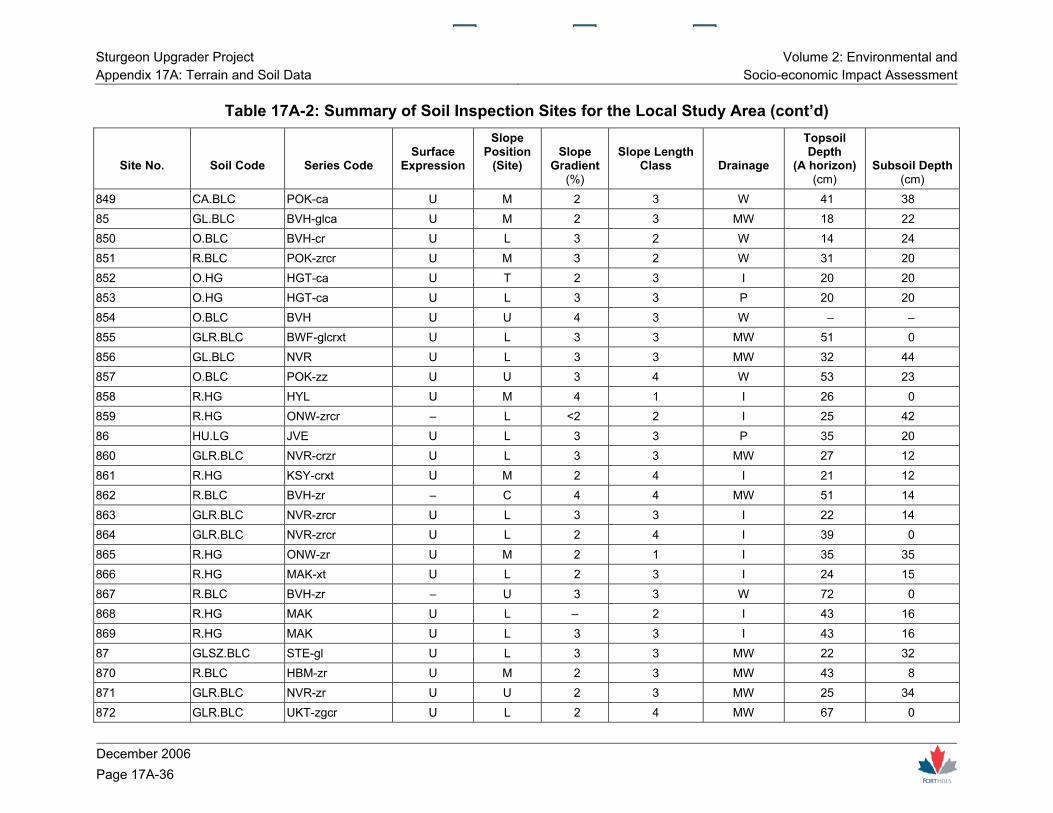
Table 17A-2: Summary of Soil Inspection Sites for the Local Study Area (cont’d)
Site No.
Soil Code
Series Code
Surface Expression
Slope Position
(Site)
Slope Gradient
(%)
Slope Length Class
Drainage
Topsoil Depth
(A horizon) (cm)
Subsoil Depth(cm)
1022 R.BLC POK-zrcr U L 2 4 MW 51 0 1023 GLR.BLC PHS-zgcr U L 2 3 I 32 0 1024 R.HG KSY-cr U L 2 4 I 20 21 1025 GLR.BLC NVR-zrcr U M 2 3 MW 38 25 1026 R.HG KSY U L 3 2 I 45 0 1027 GLR.BLC MDR-zg U M 2 4 MW 39 32 1028 R.BLC POK-zrcr U L 3 3 MW 54 31 1029 GLCA.BLC BVH-glca U M 3 3 MW 18 29 103 E.BLC POK-cr U D 0 2 MW 33 0 1030 HU.LG MLT-zl U M 3 3 I 39 27 1031 R.HG DKN – L 3 2 I 48 0 1032 GL.BLC NVR-cr U L 2 3 MW 30 45 1033 O.BLC BVH U U 2 3 W 24 46 1034 GL.BLC PHS-gl U M 3 2 I 54 29 1035 GLR.BLC MDR-glzr U L 2 4 I 45 17 1036 R.BLC MDR-zr U U 3 3 MW 75 32 1037 O.HG HGT-caxt U T 3 3 I 18 27 1038 R.BLC UKT-zrcr U L 3 4 MW 54 0 1039 CA.BLC UKT-ca U L 2 4 MW 59 21 104 CA.BLC PHS-caxc U M 2 4 W 57 32 1040 HU.LG JVE-ca U L 1 6 I 22 48 1041 GL.BLC HBM-zzgl U L 2 3 MW 33 28 105 CA.BLC UKT-ca U M 1 2 MW 34 46 106 CA.BLC HBM-ca U M 2 3 MW 48 52 107 CA.BLC UKT-ca U M <2 4 W 50 37 108 GL.BLC HBM-zzgl U L 2 4 I 23 37 109 R.BLC HBM-zr U L 2 4 MW 35 17
Sturgeon Upgrader Project Volume 2: Environmental and Appendix 17A: Terrain and Soil Data Socio-economic Impact Assessment
December 2006 Page 17A-6
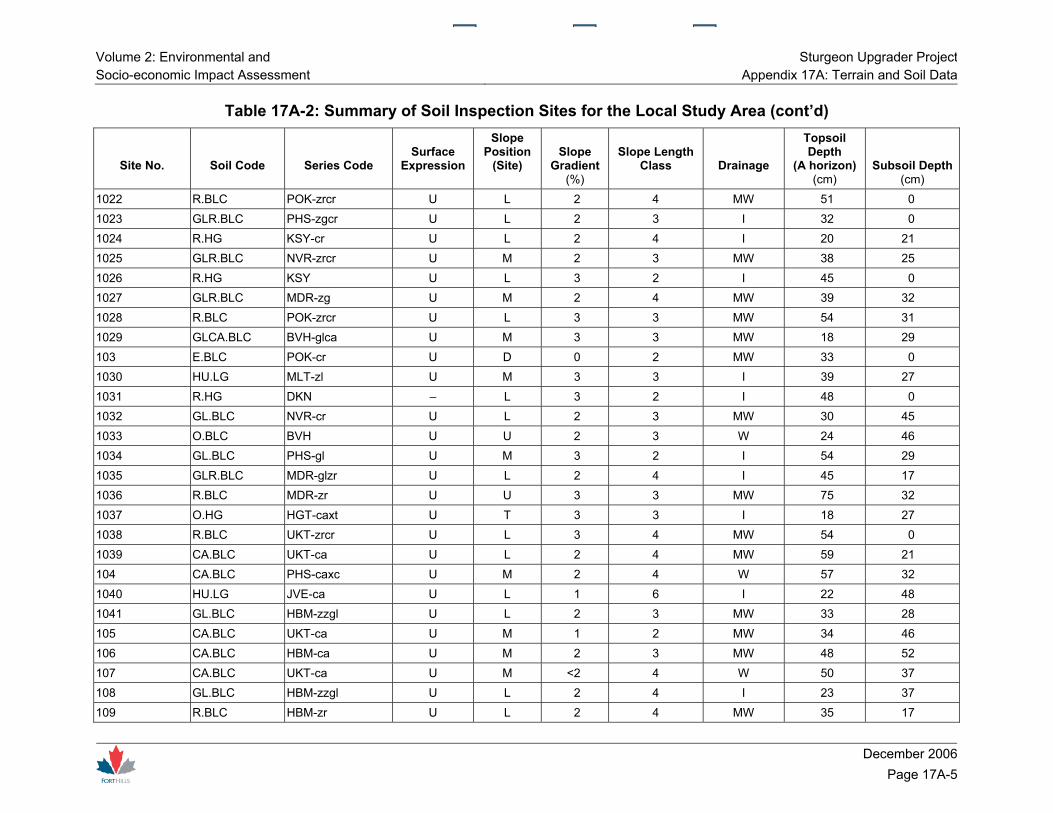
Table 17A-2: Summary of Soil Inspection Sites for the Local Study Area (cont’d)
Site No.
Soil Code
Series Code
Surface Expression
Slope Position
(Site)
Slope Gradient
(%)
Slope Length Class
Drainage
Topsoil Depth
(A horizon) (cm)
Subsoil Depth(cm)
11 CA.BLC PHS-ca U L 3 3 MW 25 35 110 CA.BLC POK-ca U C 2 2 W 18 38 111 O.BLC PHS U M 2 2 W 43 29 112 R.BLC BWF-xs U U 2 2 W 50 12 113 O.BLC MDR U U 3 – R 19 42 114 R.HG DKN-xt U L 2 2 I 21 17 115 GLCA.BLC BVH-cagl U M 2 3 MW 28 14 116 O.BLC PHS U U 3 2 W 16 11 117 SZ.BLC STE-ca U M 3 2 W 39 36 118 O.BLC BVH U M 3 3 W 17 21 119 SZ.BLC NRM U M 3 2 MW 12 17 12 O.BLC HBM-zz U M 2 2 MW 56 15 120 R.HG KSY U L <1 2 I 22 25 121 SZ.BLC STE U E 2 1 MW 18 49 122 GL.BLC NVR U M 2 4 MW 18 25 123 O.BLC HBM-zz U M 2 4 MW 21 46 124 O.BLC BVH-cr U U 3 4 MW 15 29 125 O.BLC UKT U D 3 2 MW 17 0 126 O.BLC PHS U M 2 4 W 32 48 127 R.BLC UKT-zr U M 3 2 MW 40 25 128 GLCA.BLC UKT-glca U L 3 2 I 20 30 129 R.HG DKN-cr U D 1 2 I 17 0 13 GLR.BLC BVH-zg U M 5 2 MW 35 0 130 GLR.BLC NVR-zrcr U L 3 2 I 22 0 131 HU.LG MLT-zlcr L E 2 1 I 42 19 132 R.BLC BVH-zrcr U M 2 3 MW 22 38 133 O.BLC HBM-zz U M 3 – MW 40 28
Volume 2: Environmental and Sturgeon Upgrader ProjectSocio-economic Impact Assessment Appendix 17A: Terrain and Soil Data
December 2006
Page 17A-7
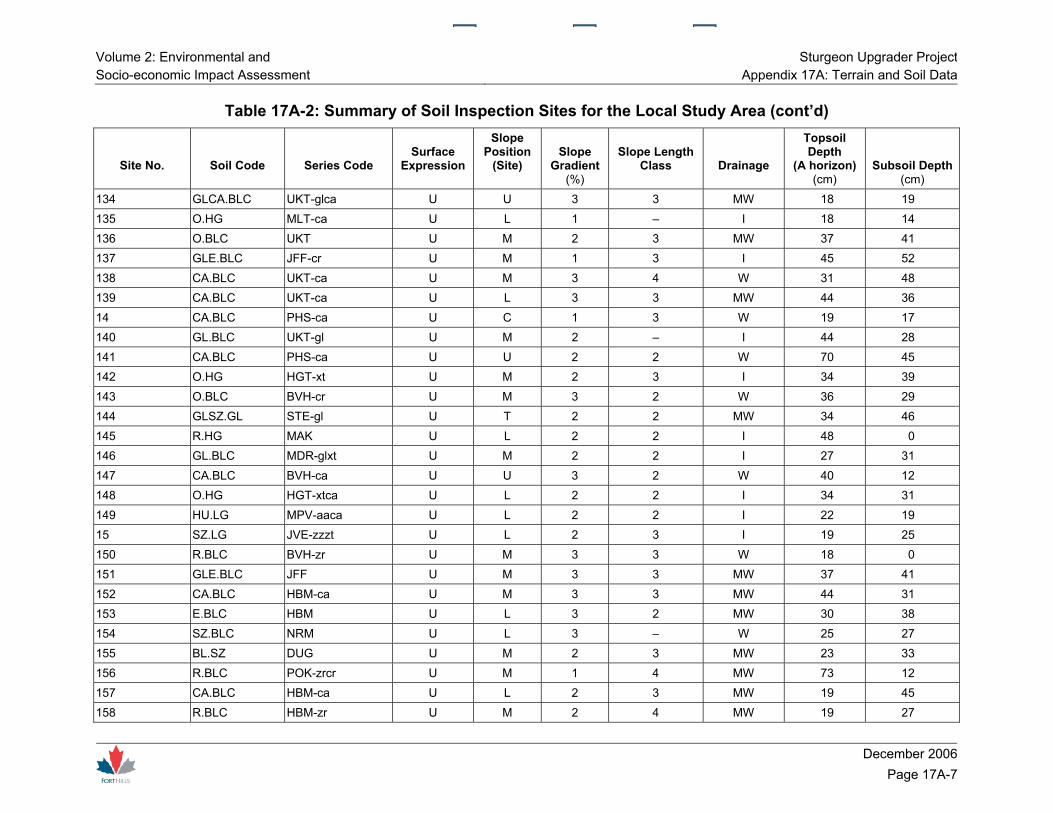
Table 17A-2: Summary of Soil Inspection Sites for the Local Study Area (cont’d)
Site No.
Soil Code
Series Code
Surface Expression
Slope Position
(Site)
Slope Gradient
(%)
Slope Length Class
Drainage
Topsoil Depth
(A horizon) (cm)
Subsoil Depth(cm)
134 GLCA.BLC UKT-glca U U 3 3 MW 18 19 135 O.HG MLT-ca U L 1 – I 18 14 136 O.BLC UKT U M 2 3 MW 37 41 137 GLE.BLC JFF-cr U M 1 3 I 45 52 138 CA.BLC UKT-ca U M 3 4 W 31 48 139 CA.BLC UKT-ca U L 3 3 MW 44 36 14 CA.BLC PHS-ca U C 1 3 W 19 17 140 GL.BLC UKT-gl U M 2 – I 44 28 141 CA.BLC PHS-ca U U 2 2 W 70 45 142 O.HG HGT-xt U M 2 3 I 34 39 143 O.BLC BVH-cr U M 3 2 W 36 29 144 GLSZ.GL STE-gl U T 2 2 MW 34 46 145 R.HG MAK U L 2 2 I 48 0 146 GL.BLC MDR-glxt U M 2 2 I 27 31 147 CA.BLC BVH-ca U U 3 2 W 40 12 148 O.HG HGT-xtca U L 2 2 I 34 31 149 HU.LG MPV-aaca U L 2 2 I 22 19 15 SZ.LG JVE-zzzt U L 2 3 I 19 25 150 R.BLC BVH-zr U M 3 3 W 18 0 151 GLE.BLC JFF U M 3 3 MW 37 41 152 CA.BLC HBM-ca U M 3 3 MW 44 31 153 E.BLC HBM U L 3 2 MW 30 38 154 SZ.BLC NRM U L 3 – W 25 27 155 BL.SZ DUG U M 2 3 MW 23 33 156 R.BLC POK-zrcr U M 1 4 MW 73 12 157 CA.BLC HBM-ca U L 2 3 MW 19 45 158 R.BLC HBM-zr U M 2 4 MW 19 27
Sturgeon Upgrader Project Volume 2: Environmental and Appendix 17A: Terrain and Soil Data Socio-economic Impact Assessment
December 2006 Page 17A-8
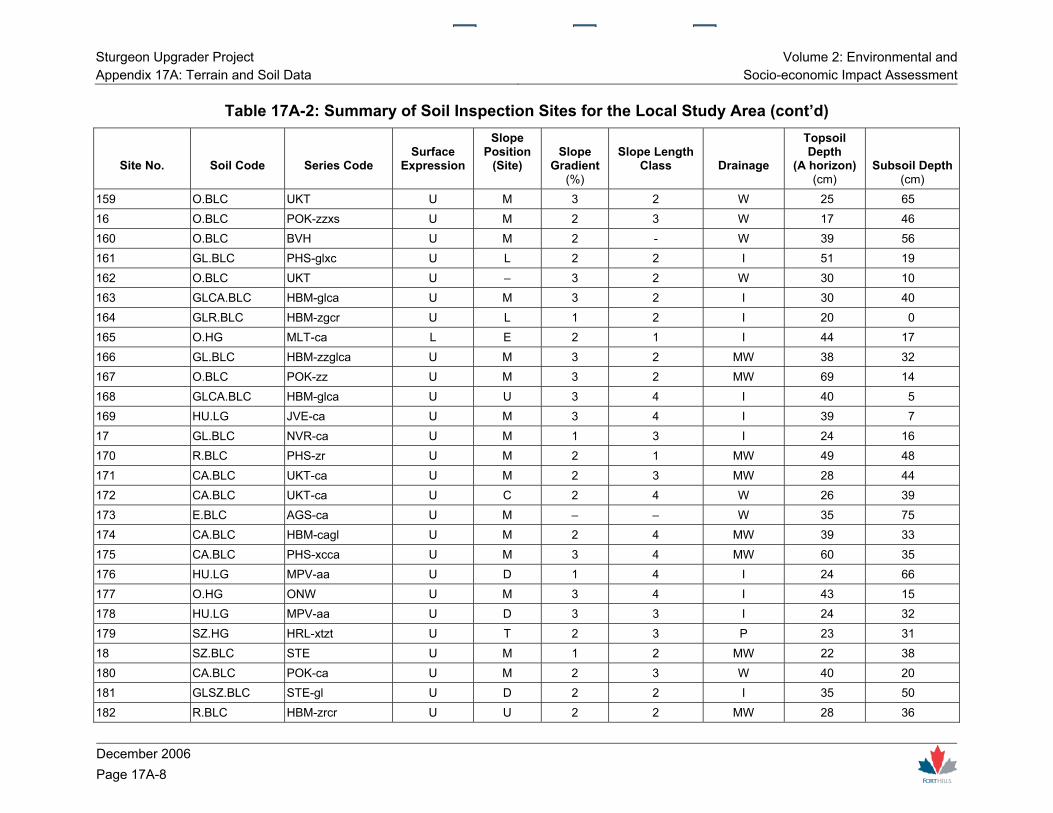
Table 17A-2: Summary of Soil Inspection Sites for the Local Study Area (cont’d)
Site No.
Soil Code
Series Code
Surface Expression
Slope Position
(Site)
Slope Gradient
(%)
Slope Length Class
Drainage
Topsoil Depth
(A horizon) (cm)
Subsoil Depth(cm)
159 O.BLC UKT U M 3 2 W 25 65 16 O.BLC POK-zzxs U M 2 3 W 17 46 160 O.BLC BVH U M 2 - W 39 56 161 GL.BLC PHS-glxc U L 2 2 I 51 19 162 O.BLC UKT U – 3 2 W 30 10 163 GLCA.BLC HBM-glca U M 3 2 I 30 40 164 GLR.BLC HBM-zgcr U L 1 2 I 20 0 165 O.HG MLT-ca L E 2 1 I 44 17 166 GL.BLC HBM-zzglca U M 3 2 MW 38 32 167 O.BLC POK-zz U M 3 2 MW 69 14 168 GLCA.BLC HBM-glca U U 3 4 I 40 5 169 HU.LG JVE-ca U M 3 4 I 39 7 17 GL.BLC NVR-ca U M 1 3 I 24 16 170 R.BLC PHS-zr U M 2 1 MW 49 48 171 CA.BLC UKT-ca U M 2 3 MW 28 44 172 CA.BLC UKT-ca U C 2 4 W 26 39 173 E.BLC AGS-ca U M – – W 35 75 174 CA.BLC HBM-cagl U M 2 4 MW 39 33 175 CA.BLC PHS-xcca U M 3 4 MW 60 35 176 HU.LG MPV-aa U D 1 4 I 24 66 177 O.HG ONW U M 3 4 I 43 15 178 HU.LG MPV-aa U D 3 3 I 24 32 179 SZ.HG HRL-xtzt U T 2 3 P 23 31 18 SZ.BLC STE U M 1 2 MW 22 38 180 CA.BLC POK-ca U M 2 3 W 40 20 181 GLSZ.BLC STE-gl U D 2 2 I 35 50 182 R.BLC HBM-zrcr U U 2 2 MW 28 36
Volume 2: Environmental and Sturgeon Upgrader ProjectSocio-economic Impact Assessment Appendix 17A: Terrain and Soil Data
December 2006
Page 17A-9
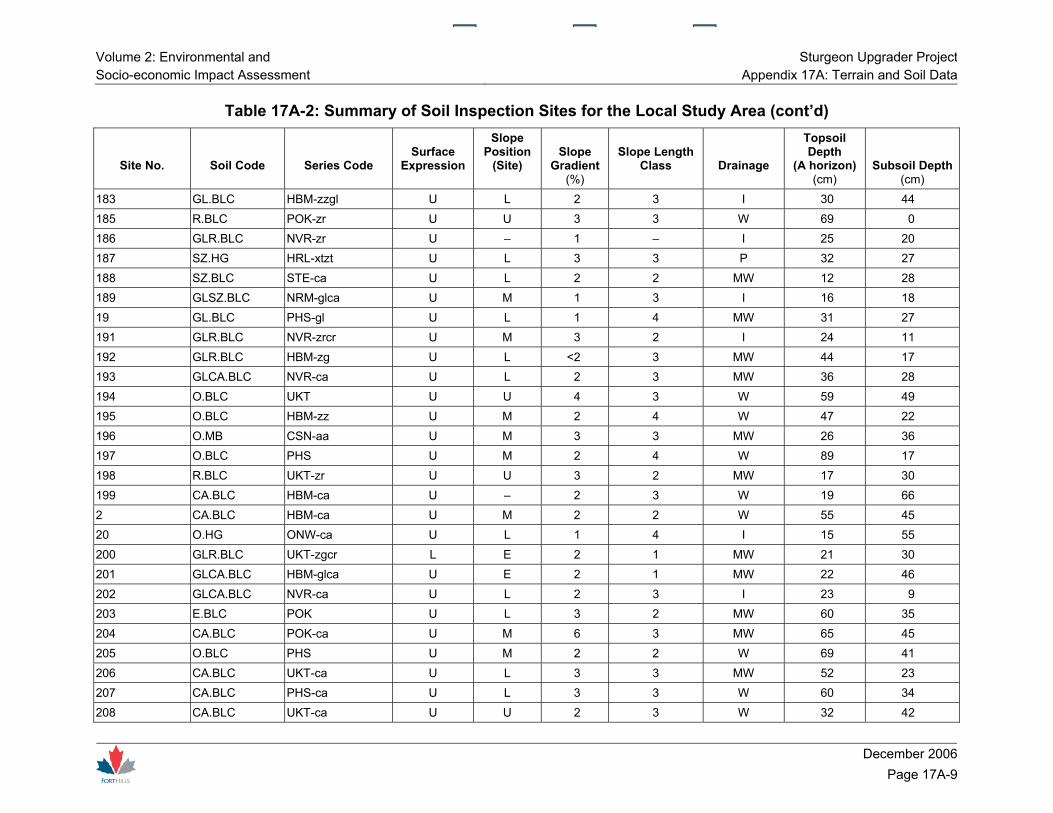
Table 17A-2: Summary of Soil Inspection Sites for the Local Study Area (cont’d)
Site No.
Soil Code
Series Code
Surface Expression
Slope Position
(Site)
Slope Gradient
(%)
Slope Length Class
Drainage
Topsoil Depth
(A horizon) (cm)
Subsoil Depth(cm)
183 GL.BLC HBM-zzgl U L 2 3 I 30 44 185 R.BLC POK-zr U U 3 3 W 69 0 186 GLR.BLC NVR-zr U – 1 – I 25 20 187 SZ.HG HRL-xtzt U L 3 3 P 32 27 188 SZ.BLC STE-ca U L 2 2 MW 12 28 189 GLSZ.BLC NRM-glca U M 1 3 I 16 18 19 GL.BLC PHS-gl U L 1 4 MW 31 27 191 GLR.BLC NVR-zrcr U M 3 2 I 24 11 192 GLR.BLC HBM-zg U L <2 3 MW 44 17 193 GLCA.BLC NVR-ca U L 2 3 MW 36 28 194 O.BLC UKT U U 4 3 W 59 49 195 O.BLC HBM-zz U M 2 4 W 47 22 196 O.MB CSN-aa U M 3 3 MW 26 36 197 O.BLC PHS U M 2 4 W 89 17 198 R.BLC UKT-zr U U 3 2 MW 17 30 199 CA.BLC HBM-ca U – 2 3 W 19 66 2 CA.BLC HBM-ca U M 2 2 W 55 45 20 O.HG ONW-ca U L 1 4 I 15 55 200 GLR.BLC UKT-zgcr L E 2 1 MW 21 30 201 GLCA.BLC HBM-glca U E 2 1 MW 22 46 202 GLCA.BLC NVR-ca U L 2 3 I 23 9 203 E.BLC POK U L 3 2 MW 60 35 204 CA.BLC POK-ca U M 6 3 MW 65 45 205 O.BLC PHS U M 2 2 W 69 41 206 CA.BLC UKT-ca U L 3 3 MW 52 23 207 CA.BLC PHS-ca U L 3 3 W 60 34 208 CA.BLC UKT-ca U U 2 3 W 32 42
Sturgeon Upgrader Project Volume 2: Environmental and Appendix 17A: Terrain and Soil Data Socio-economic Impact Assessment
December 2006 Page 17A-10
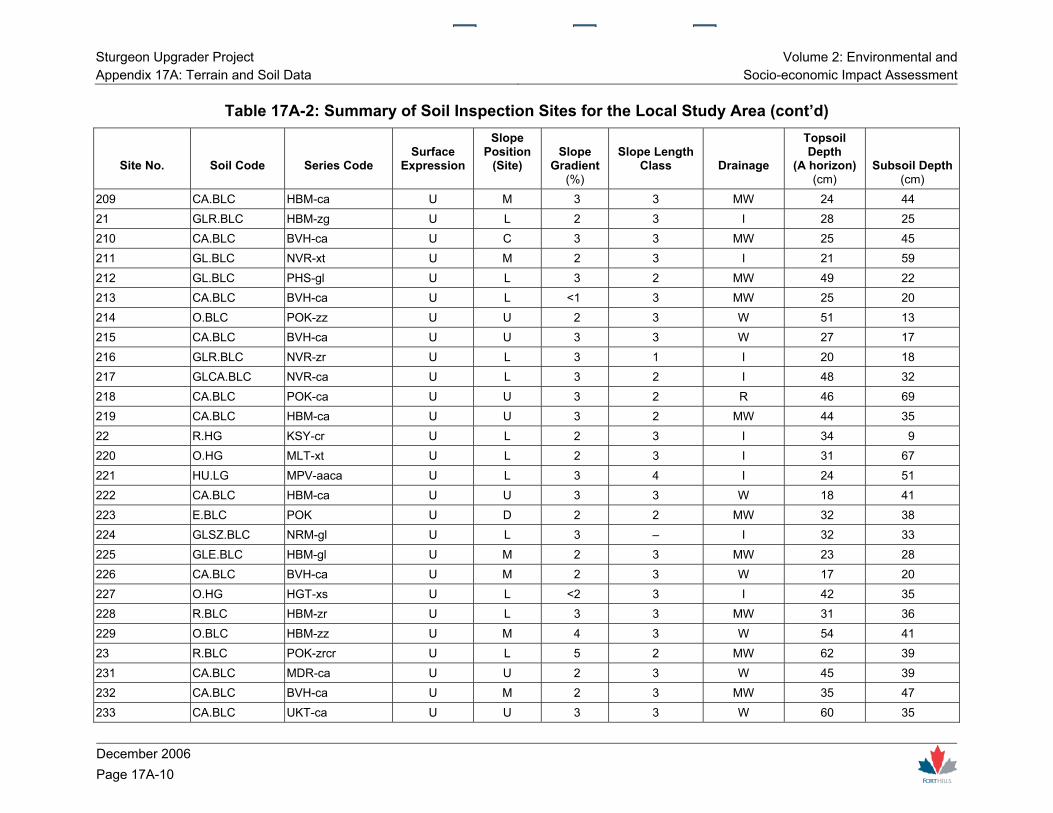
Table 17A-2: Summary of Soil Inspection Sites for the Local Study Area (cont’d)
Site No.
Soil Code
Series Code
Surface Expression
Slope Position
(Site)
Slope Gradient
(%)
Slope Length Class
Drainage
Topsoil Depth
(A horizon) (cm)
Subsoil Depth(cm)
209 CA.BLC HBM-ca U M 3 3 MW 24 44 21 GLR.BLC HBM-zg U L 2 3 I 28 25 210 CA.BLC BVH-ca U C 3 3 MW 25 45 211 GL.BLC NVR-xt U M 2 3 I 21 59 212 GL.BLC PHS-gl U L 3 2 MW 49 22 213 CA.BLC BVH-ca U L <1 3 MW 25 20 214 O.BLC POK-zz U U 2 3 W 51 13 215 CA.BLC BVH-ca U U 3 3 W 27 17 216 GLR.BLC NVR-zr U L 3 1 I 20 18 217 GLCA.BLC NVR-ca U L 3 2 I 48 32 218 CA.BLC POK-ca U U 3 2 R 46 69 219 CA.BLC HBM-ca U U 3 2 MW 44 35 22 R.HG KSY-cr U L 2 3 I 34 9 220 O.HG MLT-xt U L 2 3 I 31 67 221 HU.LG MPV-aaca U L 3 4 I 24 51 222 CA.BLC HBM-ca U U 3 3 W 18 41 223 E.BLC POK U D 2 2 MW 32 38 224 GLSZ.BLC NRM-gl U L 3 – I 32 33 225 GLE.BLC HBM-gl U M 2 3 MW 23 28 226 CA.BLC BVH-ca U M 2 3 W 17 20 227 O.HG HGT-xs U L <2 3 I 42 35 228 R.BLC HBM-zr U L 3 3 MW 31 36 229 O.BLC HBM-zz U M 4 3 W 54 41 23 R.BLC POK-zrcr U L 5 2 MW 62 39 231 CA.BLC MDR-ca U U 2 3 W 45 39 232 CA.BLC BVH-ca U M 2 3 MW 35 47 233 CA.BLC UKT-ca U U 3 3 W 60 35

Volume 2: Environmental and Sturgeon Upgrader ProjectSocio-economic Impact Assessment Appendix 17A: Terrain and Soil Data
December 2006
Page 17A-11
Table 17A-2: Summary of Soil Inspection Sites for the Local Study Area (cont’d)
Site No.
Soil Code
Series Code
Surface Expression
Slope Position
(Site)
Slope Gradient
(%)
Slope Length Class
Drainage
Topsoil Depth
(A horizon) (cm)
Subsoil Depth(cm)
234 GL.BLC HBM-zzgl U L 2 4 I 27 43 235 O.BLC POK-zz U M 1 3 W 54 15 236 R.HG KSY U D 3 3 P 38 50 237 GLE.BLC JFF U U 2 3 MW 48 12 238 CA.BLC BVH-ca U U 3 2 W 52 15 239 CA.BLC BVH-ca U U 3 3 W 24 30 24 O.BLC PHS U M 2 4 W 26 84 240 HU.LG MPV-aaca U M – 3 I 21 32 241 O.BLC MDR U M 1 3 R 59 59 242 R.BLC PHS-zrcr U L 3 2 MW 56 14 243 GLSZ.BLC NRM-gl U M 2 3 MW 16 44 244 GLBL.SS WKN-gl U D 3 2 I 18 24 245 CA.BLC BVH-ca U M 2 2 MW 44 23 246 GLE.BLC JFF U L 2 1 MW 32 40 247 R.HG HYL U L 3 2 I 23 11 248 GLR.BLC EDG-cr U M <1 3 I 25 0 249 GLE.BLC JFF-xt U M 2 2 MW 42 68 25 O.BLC UKT U M 3 3 MW 17 53 250 O.BLC BVH U L 2 1 MW 18 28 251 CA.BLC UKT-ca U L 3 1 W 27 24 252 R.BLC UKT-zr U M 3 2 W 49 0 253 GLR.BLC HBM-zgcr U L 1 2 I 20 24 254 GLR.BLC BVH-zgcr U L 2 2 I 20 16 255 GLR.BLC UKT-zgcr U M 2 3 MW 43 24 256 R.BLC BVH-zrcr U U 2 3 W 48 9 257 R.BLC BWF-cr U M 2 2 W 51 14 258 R.HG KSY U D <1 2 P 32 0

Sturgeon Upgrader Project Volume 2: Environmental and Appendix 17A: Terrain and Soil Data Socio-economic Impact Assessment
December 2006 Page 17A-12
Table 17A-2: Summary of Soil Inspection Sites for the Local Study Area (cont’d)
Site No.
Soil Code
Series Code
Surface Expression
Slope Position
(Site)
Slope Gradient
(%)
Slope Length Class
Drainage
Topsoil Depth
(A horizon) (cm)
Subsoil Depth(cm)
259 R.BLC POK-zrcr U M 3 2 W 47 0 26 O.BLC PHS U E 1 3 MW 64 26 260 CA.BLC HBM-ca U L 1 – MW 30 11 261 GL.BLC HBM-zzgl U M 2 3 I 40 40 262 O.BLC POK-zz U C 3 3 W 22 18 263 R.HG KSY-xt U L 3 3 I 15 25 264 GLE.BLC JFF-cr U L 2 3 MW 30 36 265 R.BLC HBM-zr U L 2 2 MW 19 91 266 CA.BLC POK-ca U U 2 2 W 50 34 267 HU.LG HGT-zz U L <1 3 I 36 64 268 GLE.BLC JFF U L 2 4 I 23 22 269 O.BLC HBM-zz U U 2 2 W 25 39 27 GLCA.BLC PHS-glca U M 1 3 I 35 17 270 CA.BLC UKT-ca U L 3 1 W 29 10 271 R.HG MAK U – <1 – I 47 0 272 R.BLC PHS-zrcr U M 2 3 W 38 0 273 R.BLC PHS-zr U U 2 3 MW 44 30 274 R.BLC HBM-zrcr U M 2 2 W 40 0 275 R.BLC HBM-zr U M 3 4 W 53 0 276 O.BLC HBM-zz U M <1 2 W 47 19 277 CA.BLC UKT-ca U M 3 3 W 74 46 278 HU.LG MPV-aaca U L 3 3 I 20 28 279 R.HG HYL U L 2 4 I 70 12 28 R.BLC PHS-zr U T 0 – MW 19 11 280 O.BLC UKT U M 2 3 MW 17 10 281 SZ.BLC STE-ca U L 3 2 W 42 10 282 HU.LG MLT-zl U D <1 3 I 21 79
Volume 2: Environmental and Sturgeon Upgrader ProjectSocio-economic Impact Assessment Appendix 17A: Terrain and Soil Data
December 2006
Page 17A-13
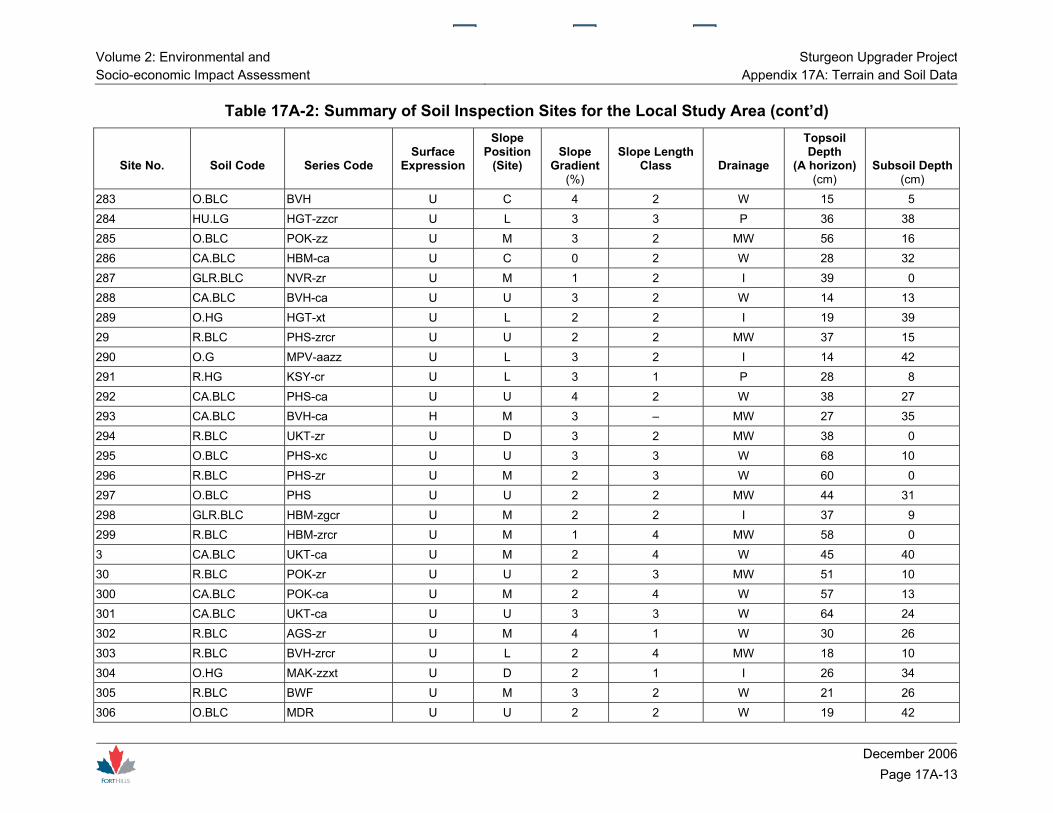
Table 17A-2: Summary of Soil Inspection Sites for the Local Study Area (cont’d)
Site No.
Soil Code
Series Code
Surface Expression
Slope Position
(Site)
Slope Gradient
(%)
Slope Length Class
Drainage
Topsoil Depth
(A horizon) (cm)
Subsoil Depth(cm)
283 O.BLC BVH U C 4 2 W 15 5 284 HU.LG HGT-zzcr U L 3 3 P 36 38 285 O.BLC POK-zz U M 3 2 MW 56 16 286 CA.BLC HBM-ca U C 0 2 W 28 32 287 GLR.BLC NVR-zr U M 1 2 I 39 0 288 CA.BLC BVH-ca U U 3 2 W 14 13 289 O.HG HGT-xt U L 2 2 I 19 39 29 R.BLC PHS-zrcr U U 2 2 MW 37 15 290 O.G MPV-aazz U L 3 2 I 14 42 291 R.HG KSY-cr U L 3 1 P 28 8 292 CA.BLC PHS-ca U U 4 2 W 38 27 293 CA.BLC BVH-ca H M 3 – MW 27 35 294 R.BLC UKT-zr U D 3 2 MW 38 0 295 O.BLC PHS-xc U U 3 3 W 68 10 296 R.BLC PHS-zr U M 2 3 W 60 0 297 O.BLC PHS U U 2 2 MW 44 31 298 GLR.BLC HBM-zgcr U M 2 2 I 37 9 299 R.BLC HBM-zrcr U M 1 4 MW 58 0 3 CA.BLC UKT-ca U M 2 4 W 45 40 30 R.BLC POK-zr U U 2 3 MW 51 10 300 CA.BLC POK-ca U M 2 4 W 57 13 301 CA.BLC UKT-ca U U 3 3 W 64 24 302 R.BLC AGS-zr U M 4 1 W 30 26 303 R.BLC BVH-zrcr U L 2 4 MW 18 10 304 O.HG MAK-zzxt U D 2 1 I 26 34 305 R.BLC BWF U M 3 2 W 21 26 306 O.BLC MDR U U 2 2 W 19 42
Sturgeon Upgrader Project Volume 2: Environmental and Appendix 17A: Terrain and Soil Data Socio-economic Impact Assessment
December 2006 Page 17A-14
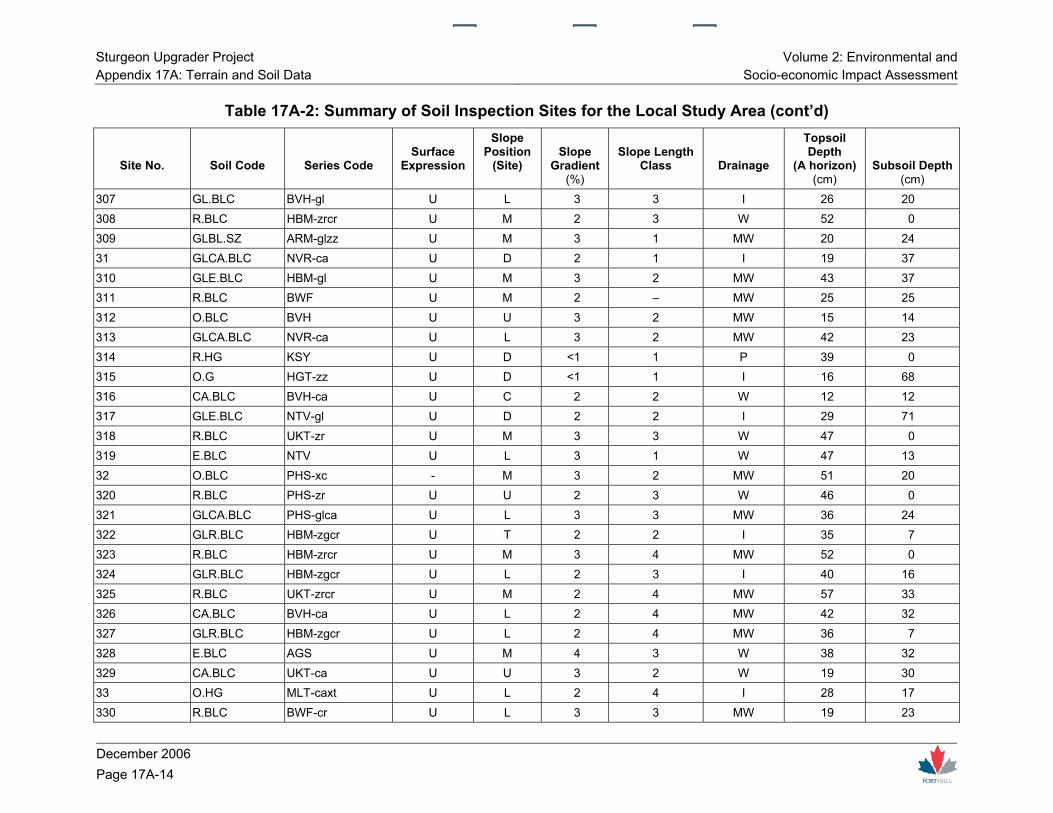
Table 17A-2: Summary of Soil Inspection Sites for the Local Study Area (cont’d)
Site No.
Soil Code
Series Code
Surface Expression
Slope Position
(Site)
Slope Gradient
(%)
Slope Length Class
Drainage
Topsoil Depth
(A horizon) (cm)
Subsoil Depth(cm)
307 GL.BLC BVH-gl U L 3 3 I 26 20 308 R.BLC HBM-zrcr U M 2 3 W 52 0 309 GLBL.SZ ARM-glzz U M 3 1 MW 20 24 31 GLCA.BLC NVR-ca U D 2 1 I 19 37 310 GLE.BLC HBM-gl U M 3 2 MW 43 37 311 R.BLC BWF U M 2 – MW 25 25 312 O.BLC BVH U U 3 2 MW 15 14 313 GLCA.BLC NVR-ca U L 3 2 MW 42 23 314 R.HG KSY U D <1 1 P 39 0 315 O.G HGT-zz U D <1 1 I 16 68 316 CA.BLC BVH-ca U C 2 2 W 12 12 317 GLE.BLC NTV-gl U D 2 2 I 29 71 318 R.BLC UKT-zr U M 3 3 W 47 0 319 E.BLC NTV U L 3 1 W 47 13 32 O.BLC PHS-xc - M 3 2 MW 51 20 320 R.BLC PHS-zr U U 2 3 W 46 0 321 GLCA.BLC PHS-glca U L 3 3 MW 36 24 322 GLR.BLC HBM-zgcr U T 2 2 I 35 7 323 R.BLC HBM-zrcr U M 3 4 MW 52 0 324 GLR.BLC HBM-zgcr U L 2 3 I 40 16 325 R.BLC UKT-zrcr U M 2 4 MW 57 33 326 CA.BLC BVH-ca U L 2 4 MW 42 32 327 GLR.BLC HBM-zgcr U L 2 4 MW 36 7 328 E.BLC AGS U M 4 3 W 38 32 329 CA.BLC UKT-ca U U 3 2 W 19 30 33 O.HG MLT-caxt U L 2 4 I 28 17 330 R.BLC BWF-cr U L 3 3 MW 19 23

Volume 2: Environmental and Sturgeon Upgrader ProjectSocio-economic Impact Assessment Appendix 17A: Terrain and Soil Data
December 2006
Page 17A-15
Table 17A-2: Summary of Soil Inspection Sites for the Local Study Area (cont’d)
Site No.
Soil Code
Series Code
Surface Expression
Slope Position
(Site)
Slope Gradient
(%)
Slope Length Class
Drainage
Topsoil Depth
(A horizon) (cm)
Subsoil Depth(cm)
331 R.BLC POK-zr U L 2 2 MW 31 14 332 HU.LG JVE U L 4 3 P 39 29 334 CA.BLC POK-ca U M 3 3 W 43 37 335 GLR.BLC NVR-zr U – 3 – – 13 13 336 R.HG KSY-cr U L 3 2 I 15 25 337 GLR.BLC NVR-zrcr U L 3 4 MW 41 18 338 CA.BLC HBM-ca U M 3 3 MW 24 18 339 CA.BLC HBM-ca U M 2 – MW 19 27 34 GL.BLC PHS-gl U L 1 3 I 48 27 340 CA.BLC HBM-ca U U 2 2 MW 34 39 341 O.BLC BVH U M 3 2 MW 30 31 342 CA.BLC PHS-ca U U 3 2 W 48 20 343 CA.BLC MDR-ca H M 3 1 MW 36 28 344 CA.BLC UKT-cr H M 3 3 MW 35 37 345 O.BLC HBM-zz U U 3 2 W 33 32 346 R.BLC UKT-zr U U 3 2 W 38 17 347 R.BLC PHS-zr U U 2 4 W 38 20 348 R.BLC PHS-zrcr U M 2 4 W 44 24 349 GLR.BLC HBM-zgcr U L 1 4 I 25 12 35 CA.BLC BVH-ca U M 3 – W 22 26 350 GLR.BLC NVR-zrcr U M 3 2 I 44 11 351 GLE.BLC HBM-gl U L 3 3 I 36 33 352 CA.BLC UKT-ca U M 2 4 MW 59 25 353 CA.BLC HBM-ca U U 3 2 MW 30 44 354 GLR.BLC NVR-zrcr U L 2 4 MW 33 11 355 O.BLC BVH U M 2 4 W 14 40 356 GLR.BLC BWF-xtglcr U L 2 2 I 36 19

Sturgeon Upgrader Project Volume 2: Environmental and Appendix 17A: Terrain and Soil Data Socio-economic Impact Assessment
December 2006 Page 17A-16
Table 17A-2: Summary of Soil Inspection Sites for the Local Study Area (cont’d)
Site No.
Soil Code
Series Code
Surface Expression
Slope Position
(Site)
Slope Gradient
(%)
Slope Length Class
Drainage
Topsoil Depth
(A horizon) (cm)
Subsoil Depth(cm)
357 GLR.BLC BWF-glxt U L 2 – I 42 0 358 O.BLC BVH U M 4 2 W 22 15 359 R.HG MAK-crxt U D 1 3 I 19 35 36 CA.BLC MDR-ca U L 2 4 W 35 41 361 GLE.BLC HBM-glcr U L 3 1 I 41 26 362 R.BLC BWF U U 3 2 W 14 0 363 R.BLC BWF U L 3 2 W 30 10 364 CA.BLC HBM-ca U D 3 3 MW 35 34 365 O.HG KSY-zzxtca U D 2 1 I 31 37 366 CA.BLC HBM-ca U U 2 2 W 21 34 367 O.HG RVN-xt U L 2 2 I 32 38 368 R.BLC POK-zrcr U M 3 3 W 45 0 369 CA.BLC MDR-caxt L L 3 1 MW 32 38 37 CA.BLC UKT-ca U M 4 – W 58 32 370 R.BLC MDR-zrcr U M 3 4 W 37 37 371 CA.BLC UKT-ca U M 3 4 MW 58 34 372 R.BLC UKT-zrcr U M 3 3 W 32 24 373 R.BLC PHS-zr U M 2 4 W 53 17 374 R.BLC PHS-zr U C 2 1 W 27 17 375 GLR.BLC HBM-zg U M 3 4 I 24 24 376 GLR.BLC HBM-zgcr U M 3 4 MW 22 40 377 CA.BLC POK-ca U U – 4 W 52 48 378 CA.BLC UKT-ca H M 3 4 W 54 36 379 R.BLC PHS-zrcrxc U C 3 4 W 45 15 38 CA.BLC MDR-caxt U M 3 4 W 57 35 380 GL.BLC PHS-gl U L 2 4 MW 34 33 381 GLR.BLC NVR-zrxt U D 2 1 MW 23 17

Volume 2: Environmental and Sturgeon Upgrader ProjectSocio-economic Impact Assessment Appendix 17A: Terrain and Soil Data
December 2006
Page 17A-17
Table 17A-2: Summary of Soil Inspection Sites for the Local Study Area (cont’d)
Site No.
Soil Code
Series Code
Surface Expression
Slope Position
(Site)
Slope Gradient
(%)
Slope Length Class
Drainage
Topsoil Depth
(A horizon) (cm)
Subsoil Depth(cm)
382 SZ.BLC STE-ca U U 2 1 MW 21 28 383 CA.BLC HBM-ca U M 2 – W 19 23 384 O.HG KSY-zzca U D 0 2 I 31 40 385 O.BLC BVH U M 4 3 W 15 20 386 SZ.BLC STE-xt U U 3 1 W 31 29 387 O.BLC BVH U U 3 2 MW 32 23 388 R.BLC BWF U M 3 2 MW 12 68 389 O.BLC BVH U M 3 3 W 15 20 39 E.BLC PHS-zzcaxc U L 3 4 W 64 8 390 CA.BLC BVH-ca U M 3 4 W 47 20 391 GL.BLC BVH-glca L L 2 3 MW 36 29 392 CA.BLC POK-caxs U M 2 2 MW 41 24 393 O.HG KSY-zzxt U D <1 2 I 18 38 394 CA.BLC PHS-ca U U 3 2 W 43 31 395 R.BLC POK-zrcr H L 3 4 – 57 21 396 E.BLC AGS-cr U M 2 4 MW 22 40 397 R.BLC UKT-zrcr U M 3 4 – 65 45 398 GLCA.BLC BVH-glca U L 3 3 MW 46 19 399 R.BLC PHS-zr U M 2 2 W 66 27 4 CA.BLC UKT-ca U U 4 4 W 43 27 40 R.HG ONW-zr U L 2 4 I 28 10 400 CA.BLC UKT-ca U M 2 4 W 39 71 401 GLR.BLC NVR-zr U L 1 3 I 43 9 402 R.BLC HBM-zrcr U U 3 2 MW 31 20 403 CA.BLC BVH-ca U C 3 2 W 27 43 404 GLCA.BLC HBM-glca U D 3 4 I 19 33 405 CA.BLC UKT-ca U L 3 2 MW 45 55
Sturgeon Upgrader Project Volume 2: Environmental and Appendix 17A: Terrain and Soil Data Socio-economic Impact Assessment
December 2006 Page 17A-18
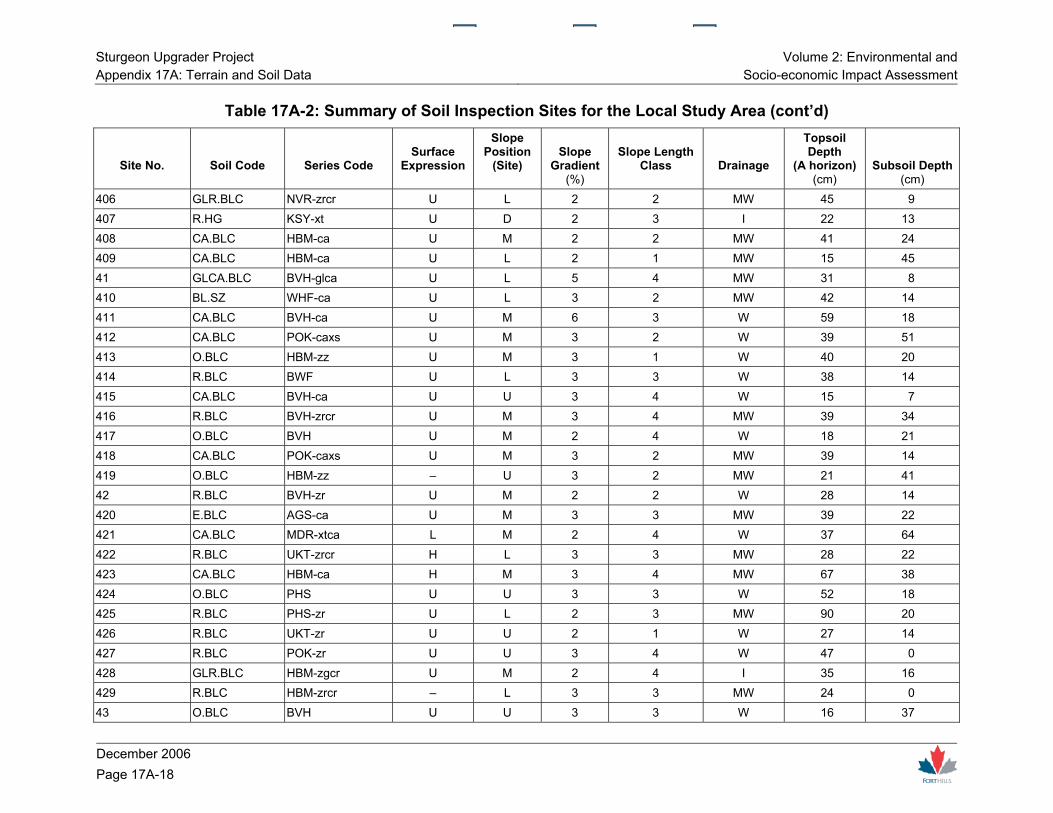
Table 17A-2: Summary of Soil Inspection Sites for the Local Study Area (cont’d)
Site No.
Soil Code
Series Code
Surface Expression
Slope Position
(Site)
Slope Gradient
(%)
Slope Length Class
Drainage
Topsoil Depth
(A horizon) (cm)
Subsoil Depth(cm)
406 GLR.BLC NVR-zrcr U L 2 2 MW 45 9 407 R.HG KSY-xt U D 2 3 I 22 13 408 CA.BLC HBM-ca U M 2 2 MW 41 24 409 CA.BLC HBM-ca U L 2 1 MW 15 45 41 GLCA.BLC BVH-glca U L 5 4 MW 31 8 410 BL.SZ WHF-ca U L 3 2 MW 42 14 411 CA.BLC BVH-ca U M 6 3 W 59 18 412 CA.BLC POK-caxs U M 3 2 W 39 51 413 O.BLC HBM-zz U M 3 1 W 40 20 414 R.BLC BWF U L 3 3 W 38 14 415 CA.BLC BVH-ca U U 3 4 W 15 7 416 R.BLC BVH-zrcr U M 3 4 MW 39 34 417 O.BLC BVH U M 2 4 W 18 21 418 CA.BLC POK-caxs U M 3 2 MW 39 14 419 O.BLC HBM-zz – U 3 2 MW 21 41 42 R.BLC BVH-zr U M 2 2 W 28 14 420 E.BLC AGS-ca U M 3 3 MW 39 22 421 CA.BLC MDR-xtca L M 2 4 W 37 64 422 R.BLC UKT-zrcr H L 3 3 MW 28 22 423 CA.BLC HBM-ca H M 3 4 MW 67 38 424 O.BLC PHS U U 3 3 W 52 18 425 R.BLC PHS-zr U L 2 3 MW 90 20 426 R.BLC UKT-zr U U 2 1 W 27 14 427 R.BLC POK-zr U U 3 4 W 47 0 428 GLR.BLC HBM-zgcr U M 2 4 I 35 16 429 R.BLC HBM-zrcr – L 3 3 MW 24 0 43 O.BLC BVH U U 3 3 W 16 37
Volume 2: Environmental and Sturgeon Upgrader ProjectSocio-economic Impact Assessment Appendix 17A: Terrain and Soil Data
December 2006
Page 17A-19
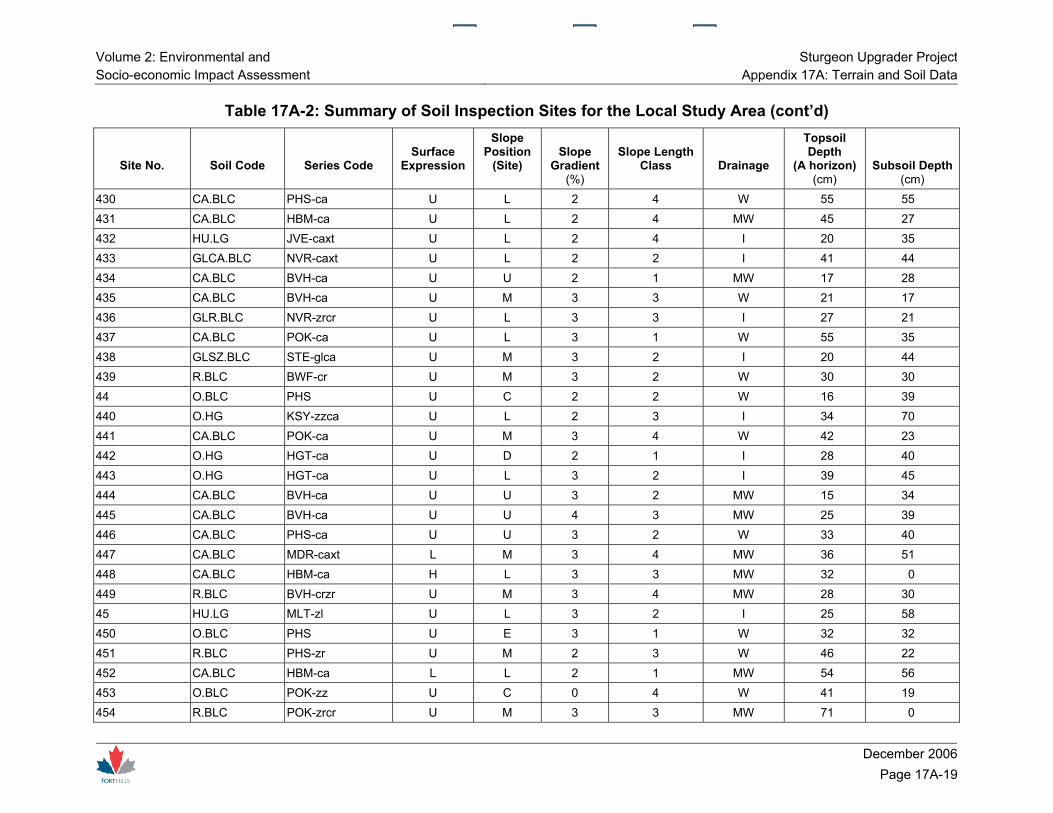
Table 17A-2: Summary of Soil Inspection Sites for the Local Study Area (cont’d)
Site No.
Soil Code
Series Code
Surface Expression
Slope Position
(Site)
Slope Gradient
(%)
Slope Length Class
Drainage
Topsoil Depth
(A horizon) (cm)
Subsoil Depth(cm)
430 CA.BLC PHS-ca U L 2 4 W 55 55 431 CA.BLC HBM-ca U L 2 4 MW 45 27 432 HU.LG JVE-caxt U L 2 4 I 20 35 433 GLCA.BLC NVR-caxt U L 2 2 I 41 44 434 CA.BLC BVH-ca U U 2 1 MW 17 28 435 CA.BLC BVH-ca U M 3 3 W 21 17 436 GLR.BLC NVR-zrcr U L 3 3 I 27 21 437 CA.BLC POK-ca U L 3 1 W 55 35 438 GLSZ.BLC STE-glca U M 3 2 I 20 44 439 R.BLC BWF-cr U M 3 2 W 30 30 44 O.BLC PHS U C 2 2 W 16 39 440 O.HG KSY-zzca U L 2 3 I 34 70 441 CA.BLC POK-ca U M 3 4 W 42 23 442 O.HG HGT-ca U D 2 1 I 28 40 443 O.HG HGT-ca U L 3 2 I 39 45 444 CA.BLC BVH-ca U U 3 2 MW 15 34 445 CA.BLC BVH-ca U U 4 3 MW 25 39 446 CA.BLC PHS-ca U U 3 2 W 33 40 447 CA.BLC MDR-caxt L M 3 4 MW 36 51 448 CA.BLC HBM-ca H L 3 3 MW 32 0 449 R.BLC BVH-crzr U M 3 4 MW 28 30 45 HU.LG MLT-zl U L 3 2 I 25 58 450 O.BLC PHS U E 3 1 W 32 32 451 R.BLC PHS-zr U M 2 3 W 46 22 452 CA.BLC HBM-ca L L 2 1 MW 54 56 453 O.BLC POK-zz U C 0 4 W 41 19 454 R.BLC POK-zrcr U M 3 3 MW 71 0

Sturgeon Upgrader Project Volume 2: Environmental and Appendix 17A: Terrain and Soil Data Socio-economic Impact Assessment
December 2006 Page 17A-20
Table 17A-2: Summary of Soil Inspection Sites for the Local Study Area (cont’d)
Site No.
Soil Code
Series Code
Surface Expression
Slope Position
(Site)
Slope Gradient
(%)
Slope Length Class
Drainage
Topsoil Depth
(A horizon) (cm)
Subsoil Depth(cm)
455 CA.BLC HBM-ca U M 3 3 W 60 35 456 R.BLC HBM-crzr – L 3 3 MW 55 27 457 CA.BLC UKT-ca H M 2 3 MW 48 42 458 CA.BLC HBM-ca U M 3 2 W 28 30 459 R.BLC POK-zrcr U M 1 3 W 48 0 46 R.HG KSY-xt U L <1 – I 19 15 460 GL.BLC NVR-xs U U 3 2 MW 34 20 461 CA.BLC PHS-ca U U 3 2 MW 48 28 462 R.BLC BWF U M 3 1 W 45 0 463 GLR.BLC NVR-zr U D 3 1 I 40 15 466 GLCA.BLC HBM-glca U L 3 2 MW 34 35 467 GLR.BLC HBM-zg U M 2 2 I 18 43 468 CA.BLC HBM-ca U M 3 3 – 29 33 469 R.HG HYL U L 2 2 I 29 10 47 GLCA.BLC BVH-glca U D 3 2 MW 20 17 470 R.BLC POK-zr U M 3 2 W 41 15 471 O.HG HGT-ca U T 3 3 I 29 36 472 GLR.BLC PHS-zgcr U E 2 1 MW 36 28 473 GLR.BLC PHS-zgcr U M 2 3 MW 52 29 474 CA.BLC PHS-ca U M 2 3 MW 32 20 475 CA.BLC UKT-ca U M 2 3 W 39 33 476 R.HG DKN-cr U U 2 3 I 47 0 477 GLCA.BLC PHS-glxcca U M 2 3 – 46 15 478 R.BLC PHS-zr U U 3 3 MW 37 29 479 R.BLC PHS-zrcr U M 3 3 W 61 14 48 GLR.BLC BVH-zgcr U L 2 3 I 23 0 480 CA.BLC HBM-ca U L 3 4 MW 30 37

Volume 2: Environmental and Sturgeon Upgrader ProjectSocio-economic Impact Assessment Appendix 17A: Terrain and Soil Data
December 2006
Page 17A-21
Table 17A-2: Summary of Soil Inspection Sites for the Local Study Area (cont’d)
Site No.
Soil Code
Series Code
Surface Expression
Slope Position
(Site)
Slope Gradient
(%)
Slope Length Class
Drainage
Topsoil Depth
(A horizon) (cm)
Subsoil Depth(cm)
481 CA.BLC POK-ca U M 3 4 W 36 9 482 GLR.BLC NVR-zrcr U L 2 4 I 35 8 483 GLR.BLC PHS-zg U L 1 3 I 26 18 484 O.HG MAK-zz U L 3 4 I 53 51 485 CA.BLC PHS-ca U M 2 3 W 68 24 486 CA.BLC BVH-ca U M 3 4 MW 24 38 487 E.BLC HBM U M 3 4 W 43 14 488 GLR.BLC BVH-zgcr U L 2 3 MW 70 0 489 O.BLC BVH U L 3 2 W 20 10 49 GLSZ.BLC STE-glca U M 3 3 MW 20 28 490 GLR.BLC BVH-zgcr U D <2 2 I 44 20 491 R.BLC POK-zr U L 1 3 MW 70 0 492 R.HG BAK U D 3 3 P 44 0 493 O.HG HGT-ca U L 3 3 I 32 50 494 O.HG HGT-xt U T 3 2 I 26 14 495 O.BLC HBM-zz U U 2 3 W 30 30 496 R.BLC HBM-zr U U 2 3 W 35 13 497 GLR.BLC UKT-zgcr U U 3 3 MW 48 0 498 GLSZ.BLC NRM-gl U L 2 2 MW 34 28 499 GL.BLC HBM-zzgl U L 2 2 MW 34 41 5 CA.BLC POK-ca U M 2 4 MW 70 55 50 HU.LG JVE-xs U T 3 3 P 34 21 500 CA.BLC HBM-ca U M 3 3 W 34 44 501 CA.BLC BVH-ca U U 3 2 W 62 48 502 R.HG KSY U D 0 1 I 33 14 503 GLE.BLC JFF U L 1 3 MW 37 28 504 GLR.BLC NVR-zr U M 2 2 I 55 0
Sturgeon Upgrader Project Volume 2: Environmental and Appendix 17A: Terrain and Soil Data Socio-economic Impact Assessment
December 2006 Page 17A-22
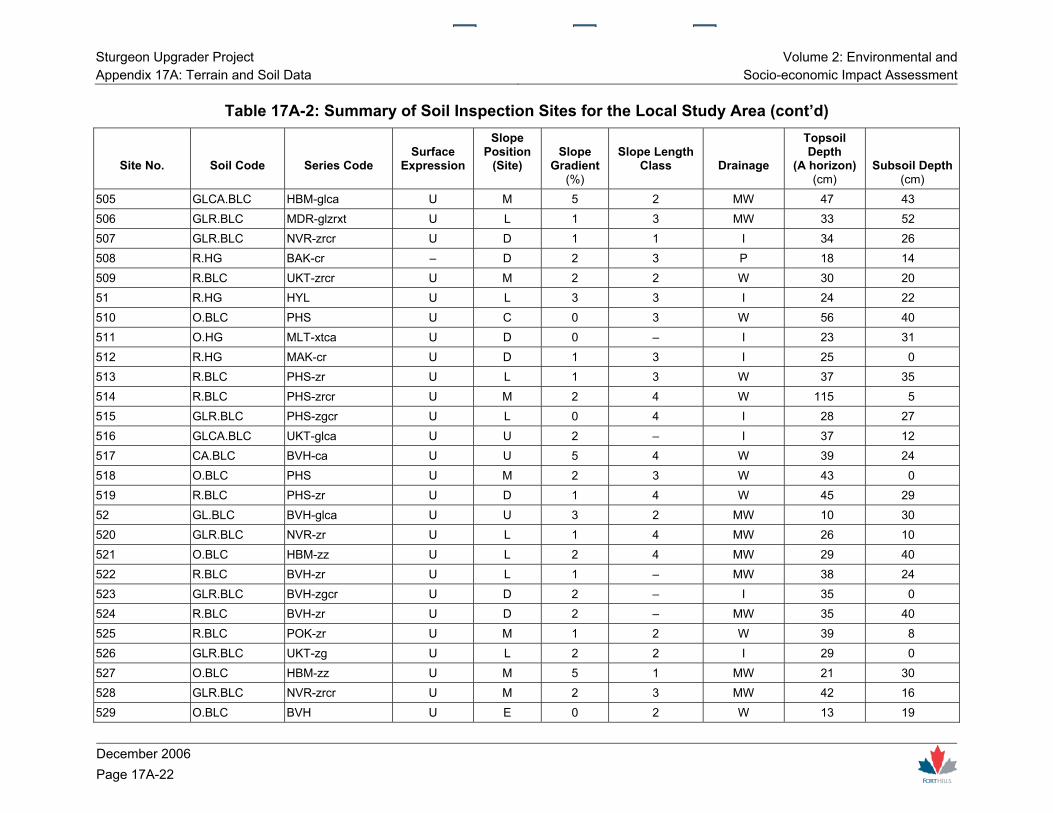
Table 17A-2: Summary of Soil Inspection Sites for the Local Study Area (cont’d)
Site No.
Soil Code
Series Code
Surface Expression
Slope Position
(Site)
Slope Gradient
(%)
Slope Length Class
Drainage
Topsoil Depth
(A horizon) (cm)
Subsoil Depth(cm)
505 GLCA.BLC HBM-glca U M 5 2 MW 47 43 506 GLR.BLC MDR-glzrxt U L 1 3 MW 33 52 507 GLR.BLC NVR-zrcr U D 1 1 I 34 26 508 R.HG BAK-cr – D 2 3 P 18 14 509 R.BLC UKT-zrcr U M 2 2 W 30 20 51 R.HG HYL U L 3 3 I 24 22 510 O.BLC PHS U C 0 3 W 56 40 511 O.HG MLT-xtca U D 0 – I 23 31 512 R.HG MAK-cr U D 1 3 I 25 0 513 R.BLC PHS-zr U L 1 3 W 37 35 514 R.BLC PHS-zrcr U M 2 4 W 115 5 515 GLR.BLC PHS-zgcr U L 0 4 I 28 27 516 GLCA.BLC UKT-glca U U 2 – I 37 12 517 CA.BLC BVH-ca U U 5 4 W 39 24 518 O.BLC PHS U M 2 3 W 43 0 519 R.BLC PHS-zr U D 1 4 W 45 29 52 GL.BLC BVH-glca U U 3 2 MW 10 30 520 GLR.BLC NVR-zr U L 1 4 MW 26 10 521 O.BLC HBM-zz U L 2 4 MW 29 40 522 R.BLC BVH-zr U L 1 – MW 38 24 523 GLR.BLC BVH-zgcr U D 2 – I 35 0 524 R.BLC BVH-zr U D 2 – MW 35 40 525 R.BLC POK-zr U M 1 2 W 39 8 526 GLR.BLC UKT-zg U L 2 2 I 29 0 527 O.BLC HBM-zz U M 5 1 MW 21 30 528 GLR.BLC NVR-zrcr U M 2 3 MW 42 16 529 O.BLC BVH U E 0 2 W 13 19

Volume 2: Environmental and Sturgeon Upgrader ProjectSocio-economic Impact Assessment Appendix 17A: Terrain and Soil Data
December 2006
Page 17A-23
Table 17A-2: Summary of Soil Inspection Sites for the Local Study Area (cont’d)
Site No.
Soil Code
Series Code
Surface Expression
Slope Position
(Site)
Slope Gradient
(%)
Slope Length Class
Drainage
Topsoil Depth
(A horizon) (cm)
Subsoil Depth(cm)
53 O.BLC POK-zz U M 2 4 W 18 30 530 R.BLC POK-zr U L 1 – MW 32 16 531 R.BLC PHS-zr U M 3 3 W 46 0 532 GLE.BLC JFF-cr U – 2 3 MW 42 42 533 GLCA.BLC NVR-caxs U L 2 2 I 45 50 534 O.BLC BVH U M 2 3 – 17 34 535 GLCA.BLC BVH-glcaxs U L 3 3 I 39 33 536 E.BLC HBM U M 2 3 MW 52 13 537 O.HG MLT-ca – T 1 2 I 45 40 538 R.HG KSY-cr U D 0 – I 18 0 539 R.BLC MDR-zr U M 6 3 W 12 118 54 GL.BLC NVR U M 3 4 MW 29 51 540 R.BLC MDR-zrcr U M 3 4 R 105 25 541 GLCA.BLC PHS-glca U L 1 4 MW 33 17 542 R.BLC UKT-zrcr U M 1 4 MW 49 17 543 O.BLC POK-zzca U U 1 4 W 38 77 544 R.BLC UKT-zr U M 3 4 W 52 21 545 R.BLC PHS-zrcrxc U C 0 1 MW 33 7 546 GLR.BLC BVH-zgcr U T 2 3 I 16 15 547 R.BLC AGS-zrcr U D 2 – MW 68 12 548 R.BLC MMO-zr U M 3 4 W 28 0 549 O.BLC BVH U – 4 3 W 13 47 55 O.BLC HBM-zz U M 3 4 MW 39 23 550 O.HG ONW-ca U T 1 2 I 18 42 551 O.BLC POK-zz U U 2 2 W 23 18 552 R.BLC HBM-zrcr U M 3 2 MW 36 6 553 R.BLC HBM-zrcr U M 1 4 MW 25 12

Sturgeon Upgrader Project Volume 2: Environmental and Appendix 17A: Terrain and Soil Data Socio-economic Impact Assessment
December 2006 Page 17A-24
Table 17A-2: Summary of Soil Inspection Sites for the Local Study Area (cont’d)
Site No.
Soil Code
Series Code
Surface Expression
Slope Position
(Site)
Slope Gradient
(%)
Slope Length Class
Drainage
Topsoil Depth
(A horizon) (cm)
Subsoil Depth(cm)
554 CA.BLC BVH-ca U C 0 2 W 18 15 555 GLR.BLC HBM-zgcr U L – 2 I 42 11 556 O.BLC HBM-zz U M 3 3 W 41 35 557 O.HG MLT-xt U D 2 2 I 18 60 558 R.HG KSY-xt U D 1 2 I 17 20 559 R.HG HYL U D 0 1 I 22 6 56 GLR.BLC HBM-zg U M 3 3 MW 34 12 560 GLE.BLC JFF-cr U M 1 4 MW 45 25 561 O.BLC BVH U U 1 3 W 20 25 562 CA.BLC HBM-ca U L 5 4 W 45 12 563 GL.BLC PHS-glcr U M 2 4 MW 44 20 564 R.BLC PHS-zrcr U U 1 3 MW 52 22 565 R.BLC MDR-zr U M 2 3 MW 68 12 566 R.BLC HBM-zr U M 3 5 MW 42 28 567 GLR.BLC HBM-zgcr U L 2 5 I 21 0 568 O.HG MLT-ca U M 1 3 I 27 16 569 GLCA.BLC MDR-glcaxc U M 1 3 MW 42 21 57 R.BLC HBM-zrcr U L 3 3 MW 45 47 570 R.BLC PHS-zrcr U E 0 1 MW 69 31 571 R.BLC PHS-zrxc U L 6 3 MW 75 10 572 R.BLC MDR-zr U U 4 4 R 30 110 573 GLR.BLC NVR-zrcr U L 2 4 I 28 14 574 R.HG MAK-cr U E 0 – I 28 17 575 R.HG KSY-cr U M 1 3 I 31 0 576 R.HG KSY-cr U M 3 3 I 25 17 577 R.BLC POK-zrcr U U 3 – MW 20 15 578 CA.BLC HBM-ca U M 2 – W 25 40
Volume 2: Environmental and Sturgeon Upgrader ProjectSocio-economic Impact Assessment Appendix 17A: Terrain and Soil Data
December 2006
Page 17A-25
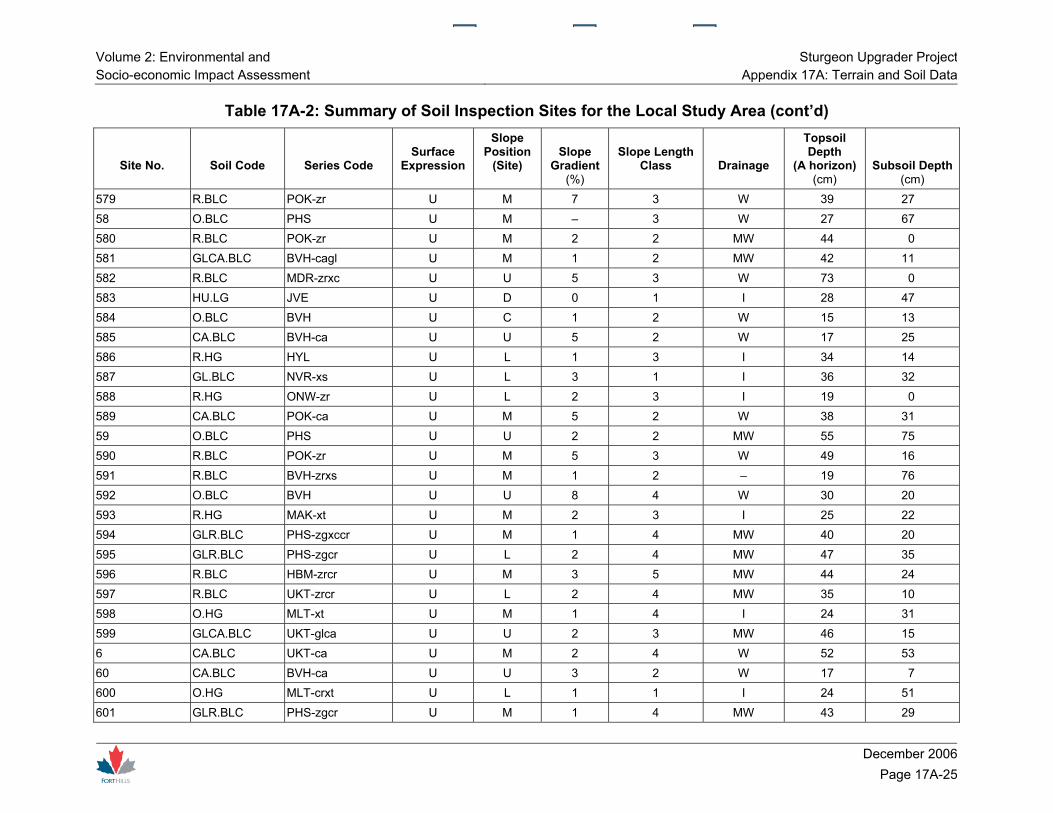
Table 17A-2: Summary of Soil Inspection Sites for the Local Study Area (cont’d)
Site No.
Soil Code
Series Code
Surface Expression
Slope Position
(Site)
Slope Gradient
(%)
Slope Length Class
Drainage
Topsoil Depth
(A horizon) (cm)
Subsoil Depth(cm)
579 R.BLC POK-zr U M 7 3 W 39 27 58 O.BLC PHS U M – 3 W 27 67 580 R.BLC POK-zr U M 2 2 MW 44 0 581 GLCA.BLC BVH-cagl U M 1 2 MW 42 11 582 R.BLC MDR-zrxc U U 5 3 W 73 0 583 HU.LG JVE U D 0 1 I 28 47 584 O.BLC BVH U C 1 2 W 15 13 585 CA.BLC BVH-ca U U 5 2 W 17 25 586 R.HG HYL U L 1 3 I 34 14 587 GL.BLC NVR-xs U L 3 1 I 36 32 588 R.HG ONW-zr U L 2 3 I 19 0 589 CA.BLC POK-ca U M 5 2 W 38 31 59 O.BLC PHS U U 2 2 MW 55 75 590 R.BLC POK-zr U M 5 3 W 49 16 591 R.BLC BVH-zrxs U M 1 2 – 19 76 592 O.BLC BVH U U 8 4 W 30 20 593 R.HG MAK-xt U M 2 3 I 25 22 594 GLR.BLC PHS-zgxccr U M 1 4 MW 40 20 595 GLR.BLC PHS-zgcr U L 2 4 MW 47 35 596 R.BLC HBM-zrcr U M 3 5 MW 44 24 597 R.BLC UKT-zrcr U L 2 4 MW 35 10 598 O.HG MLT-xt U M 1 4 I 24 31 599 GLCA.BLC UKT-glca U U 2 3 MW 46 15 6 CA.BLC UKT-ca U M 2 4 W 52 53 60 CA.BLC BVH-ca U U 3 2 W 17 7 600 O.HG MLT-crxt U L 1 1 I 24 51 601 GLR.BLC PHS-zgcr U M 1 4 MW 43 29

Sturgeon Upgrader Project Volume 2: Environmental and Appendix 17A: Terrain and Soil Data Socio-economic Impact Assessment
December 2006 Page 17A-26
Table 17A-2: Summary of Soil Inspection Sites for the Local Study Area (cont’d)
Site No.
Soil Code
Series Code
Surface Expression
Slope Position
(Site)
Slope Gradient
(%)
Slope Length Class
Drainage
Topsoil Depth
(A horizon) (cm)
Subsoil Depth(cm)
602 R.BLC MMO-zrcr U M 5 3 W 77 28 603 R.BLC MDR-zr U M 5 4 W 52 58 604 R.BLC POK-zrcr U L 1 4 MW 26 37 605 GLE.BLC MDR-glzzcr U – 1 – MW 26 19 606 R.HG KSY-cr U L 2 4 I 31 18 607 CA.BLC UKT-ca U M 2 4 W 41 14 608 CA.BLC UKT-ca U M 1 4 W 42 38 609 O.BLC UKT L E 2 1 MW 55 25 61 R.BLC PHS-zrcr U M 3 2 MW 40 10 610 R.BLC POK-zrcr U U 3 – MW 33 20 611 R.BLC HBM-zrcr U T 2 – MW 30 13 612 R.BLC PHS-zr U D 0 3 MW 20 21 613 HU.LG JVE-xt U D 0 - P 27 63 614 O.R ZRG U U 2 2 W 8 44 615 GLR.BLC PHS-zgxc U L 2 3 MW 26 0 616 E.BLC AGS-ca U L 3 1 MW 30 50 617 CA.BLC BVH-ca U T 5 2 W 61 5 618 R.BLC BVH-zrcr U M 2 2 MW 57 33 619 R.BLC BVH-zrcr U L 3 1 MW 29 0 62 R.BLC BVH-zrcr U M 3 2 MW 27 29 620 R.BLC BWF-xt U M 2 2 MW 17 0 621 GLE.BLC JFF-crxt U C 1 2 MW 24 13 622 CA.BLC POK-ca U T 0 1 W 43 37 623 E.BLC POK U M 3 3 W 47 13 624 O.BLC UKT U U 1 3 W 36 31 625 O.BLC POK-zz U M 1 4 MW 47 21 626 GLR.BLC MDR-glzr U U 4 3 MW 36 39

Volume 2: Environmental and Sturgeon Upgrader ProjectSocio-economic Impact Assessment Appendix 17A: Terrain and Soil Data
December 2006
Page 17A-27
Table 17A-2: Summary of Soil Inspection Sites for the Local Study Area (cont’d)
Site No.
Soil Code
Series Code
Surface Expression
Slope Position
(Site)
Slope Gradient
(%)
Slope Length Class
Drainage
Topsoil Depth
(A horizon) (cm)
Subsoil Depth(cm)
627 R.BLC PHS-zr U M 1 3 MW 57 0 628 CA.BLC BVH-ca U U 6 3 MW 44 22 629 GLR.BLC UKT-zgcr U L 3 5 I 47 27 63 R.HG KSY-cr L M 2 3 I 19 15 630 GLR.BLC HBM-zgcr U L 2 4 I 30 0 631 R.HG ZOR U D 0 3 P 60 0 632 GLCA.BLC MDR-glca U L 2 3 I 42 25 633 GL.BLC PHS-glxc U U 3 3 MW 42 46 634 GLR.BLC PHS-zgcrxc U L 3 3 MW 39 28 635 GLR.BLC UKT-zgcr U E 1 4 I 28 67 636 GLR.BLC HBM-zgcr U M 2 3 I 38 27 637 R.HG MAK-cr U L 1 3 I 23 17 638 E.BLC POK U U 2 3 MW 26 74 639 R.BLC UKT-zr U U 2 4 W 53 17 64 CA.BLC HBM-ca U M 3 1 MW 40 12 640 R.BLC UKT-zrcr U M 1 4 W 28 23 642 CA.BLC BVH-ca U U 4 2 W 25 50 643 R.BLC POK-zr U L 2 4 MW 32 0 644 CA.BLC POK-ca U M 2 2 MW 38 57 645 CA.BLC HBM-ca U L 3 2 MW 27 8 646 R.BLC POK-zr U L 1 4 MW 70 0 647 R.HG KSY-cr U L 1 2 I 33 19 648 R.HG HYL U L 2 3 I 19 8 649 GL.BLC NVR U L 2 2 I 48 34 65 GLCA.BLC NVR-ca U M 3 3 MW 31 36 650 GLE.BLC JFF-cr U L 3 2 MW 32 43 651 R.BLC POK-zrcr U M 2 3 W 51 10
Sturgeon Upgrader Project Volume 2: Environmental and Appendix 17A: Terrain and Soil Data Socio-economic Impact Assessment
December 2006 Page 17A-28
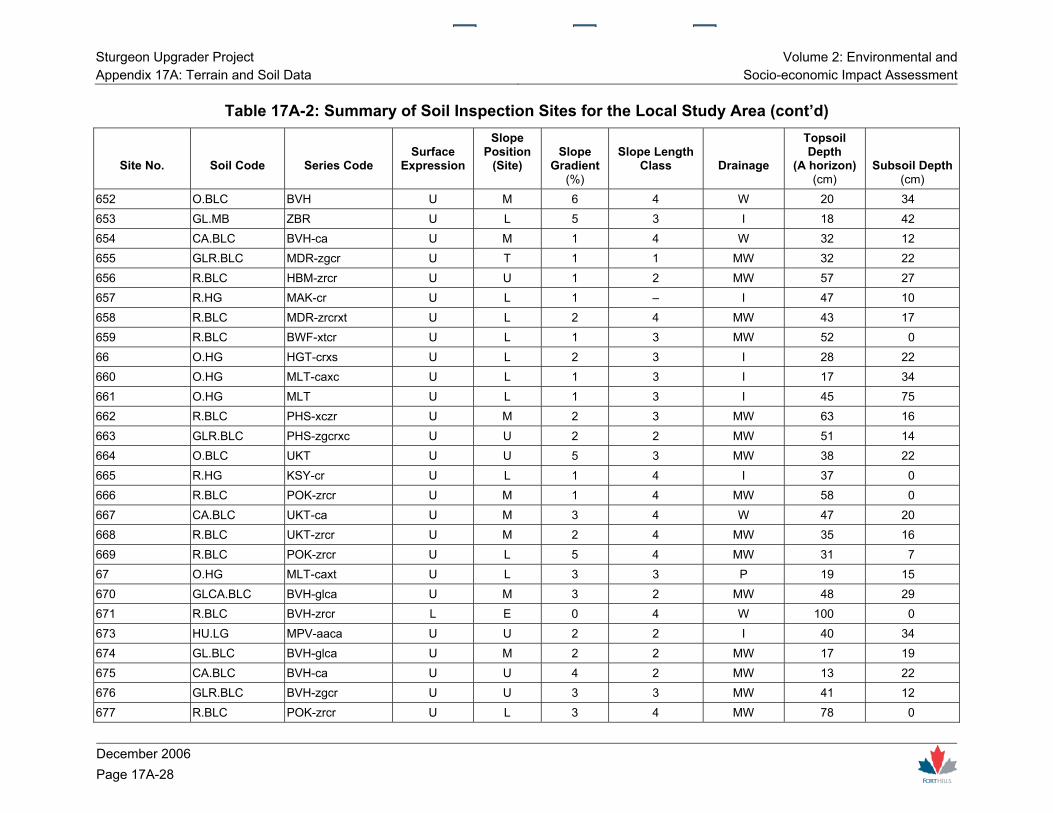
Table 17A-2: Summary of Soil Inspection Sites for the Local Study Area (cont’d)
Site No.
Soil Code
Series Code
Surface Expression
Slope Position
(Site)
Slope Gradient
(%)
Slope Length Class
Drainage
Topsoil Depth
(A horizon) (cm)
Subsoil Depth(cm)
652 O.BLC BVH U M 6 4 W 20 34 653 GL.MB ZBR U L 5 3 I 18 42 654 CA.BLC BVH-ca U M 1 4 W 32 12 655 GLR.BLC MDR-zgcr U T 1 1 MW 32 22 656 R.BLC HBM-zrcr U U 1 2 MW 57 27 657 R.HG MAK-cr U L 1 – I 47 10 658 R.BLC MDR-zrcrxt U L 2 4 MW 43 17 659 R.BLC BWF-xtcr U L 1 3 MW 52 0 66 O.HG HGT-crxs U L 2 3 I 28 22 660 O.HG MLT-caxc U L 1 3 I 17 34 661 O.HG MLT U L 1 3 I 45 75 662 R.BLC PHS-xczr U M 2 3 MW 63 16 663 GLR.BLC PHS-zgcrxc U U 2 2 MW 51 14 664 O.BLC UKT U U 5 3 MW 38 22 665 R.HG KSY-cr U L 1 4 I 37 0 666 R.BLC POK-zrcr U M 1 4 MW 58 0 667 CA.BLC UKT-ca U M 3 4 W 47 20 668 R.BLC UKT-zrcr U M 2 4 MW 35 16 669 R.BLC POK-zrcr U L 5 4 MW 31 7 67 O.HG MLT-caxt U L 3 3 P 19 15 670 GLCA.BLC BVH-glca U M 3 2 MW 48 29 671 R.BLC BVH-zrcr L E 0 4 W 100 0 673 HU.LG MPV-aaca U U 2 2 I 40 34 674 GL.BLC BVH-glca U M 2 2 MW 17 19 675 CA.BLC BVH-ca U U 4 2 MW 13 22 676 GLR.BLC BVH-zgcr U U 3 3 MW 41 12 677 R.BLC POK-zrcr U L 3 4 MW 78 0
Volume 2: Environmental and Sturgeon Upgrader ProjectSocio-economic Impact Assessment Appendix 17A: Terrain and Soil Data
December 2006
Page 17A-29
Table 17A-2: Summary of Soil Inspection Sites for the Local Study Area (cont’d)
Site No.
Soil Code
Series Code
Surface Expression
Slope Position
(Site)
Slope Gradient
(%)
Slope Length Class
Drainage
Topsoil Depth
(A horizon) (cm)
Subsoil Depth(cm)
678 GLBL.SZ ARM-zzgl U L 2 2 MW 70 15 679 R.HG DKN U M 1 3 I 23 20 68 O.BLC PHS U L 2 3 MW 38 57 680 O.BLC MDR U U 1 3 W 52 13 681 R.BLC MDR-zr U U 2 3 W 22 18 682 GLR.BLC MDR-zg U M 2 4 MW 19 34 683 GLR.BLC PHS-zgcr U L 1 3 MW 44 23 684 R.BLC PHS-zr U L 2 3 MW 58 22 685 R.HG KSY-xt L E 0 5 I 25 0 686 R.BLC UKT-zrcr U U 2 4 W 71 0 688 R.BLC BWF-cr U L 2 3 MW 43 0 689 O.BLC BVH U U 3 3 W 22 22 69 GLCA.BLC BVH-glca U L 1 2 I 41 46 690 CA.BLC POK-ca U M 3 – W 38 29 691 R.BLC POK-zrcr U M 2 4 MW 26 10 692 CA.BLC UKT-ca U M 2 3 R 47 90 693 GLR.BLC MDR-zg U – 0 3 MW 22 9 694 O.HG MLT-caxc U U 1 2 I 34 19 695 GLR.BLC NVR-zrcr U M 1 4 MW 36 13 696 R.BLC POK-zrcr U M 2 2 MW 72 0 697 CA.BLC HBM-ca U U 2 2 W 52 35 698 R.BLC POK-zrcr U M 1 4 MW 39 17 699 GLR.BLC NVR-zr U L 3 3 I 46 5 7 O.HG ONW-ca U L 1 – I 30 32 70 R.BLC HBM-zrcr L D 0 2 MW 72 0 700 R.BLC BWF U L 3 3 W 68 0 701 O.BLC POK-zz U U 3 3 W 42 24
Sturgeon Upgrader Project Volume 2: Environmental and Appendix 17A: Terrain and Soil Data Socio-economic Impact Assessment
December 2006 Page 17A-30
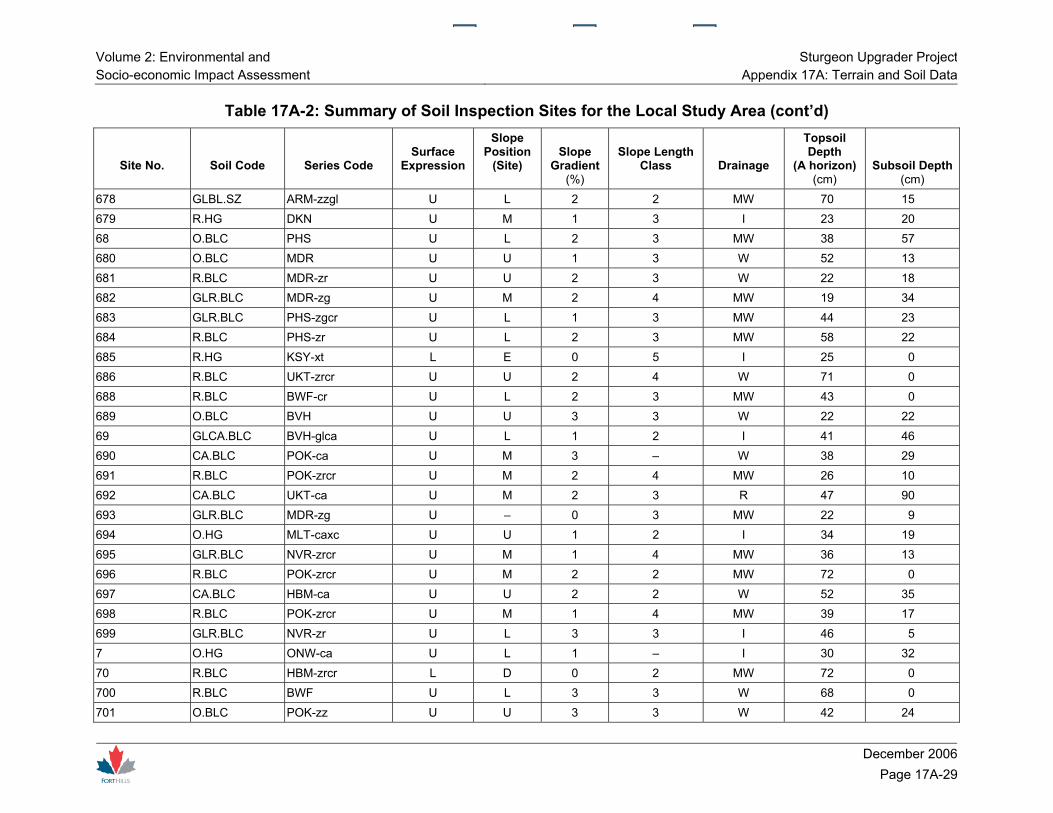
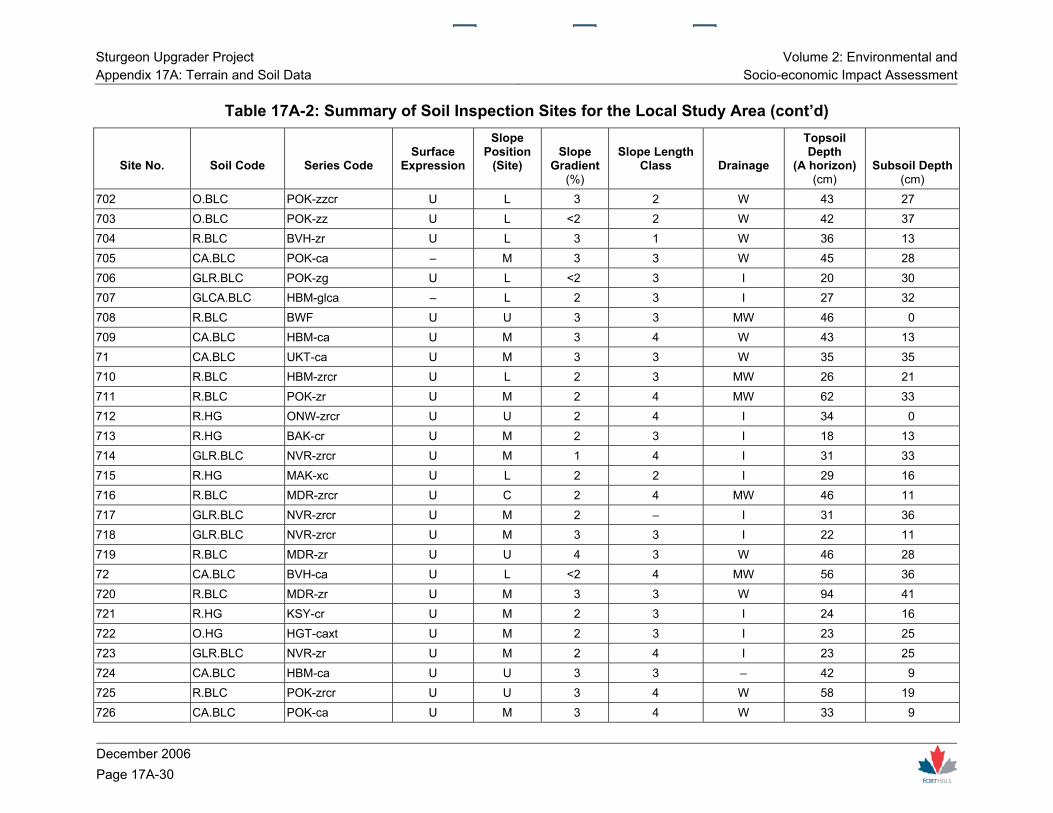
Table 17A-2: Summary of Soil Inspection Sites for the Local Study Area (cont’d)
Site No.
Soil Code
Series Code
Surface Expression
Slope Position
(Site)
Slope Gradient
(%)
Slope Length Class
Drainage
Topsoil Depth
(A horizon) (cm)
Subsoil Depth(cm)
702 O.BLC POK-zzcr U L 3 2 W 43 27 703 O.BLC POK-zz U L <2 2 W 42 37 704 R.BLC BVH-zr U L 3 1 W 36 13 705 CA.BLC POK-ca – M 3 3 W 45 28 706 GLR.BLC POK-zg U L <2 3 I 20 30 707 GLCA.BLC HBM-glca – L 2 3 I 27 32 708 R.BLC BWF U U 3 3 MW 46 0 709 CA.BLC HBM-ca U M 3 4 W 43 13 71 CA.BLC UKT-ca U M 3 3 W 35 35 710 R.BLC HBM-zrcr U L 2 3 MW 26 21 711 R.BLC POK-zr U M 2 4 MW 62 33 712 R.HG ONW-zrcr U U 2 4 I 34 0 713 R.HG BAK-cr U M 2 3 I 18 13 714 GLR.BLC NVR-zrcr U M 1 4 I 31 33 715 R.HG MAK-xc U L 2 2 I 29 16 716 R.BLC MDR-zrcr U C 2 4 MW 46 11 717 GLR.BLC NVR-zrcr U M 2 – I 31 36 718 GLR.BLC NVR-zrcr U M 3 3 I 22 11 719 R.BLC MDR-zr U U 4 3 W 46 28 72 CA.BLC BVH-ca U L <2 4 MW 56 36 720 R.BLC MDR-zr U M 3 3 W 94 41 721 R.HG KSY-cr U M 2 3 I 24 16 722 O.HG HGT-caxt U M 2 3 I 23 25 723 GLR.BLC NVR-zr U M 2 4 I 23 25 724 CA.BLC HBM-ca U U 3 3 – 42 9 725 R.BLC POK-zrcr U U 3 4 W 58 19 726 CA.BLC POK-ca U M 3 4 W 33 9
Volume 2: Environmental and Sturgeon Upgrader ProjectSocio-economic Impact Assessment Appendix 17A: Terrain and Soil Data
December 2006
Page 17A-31
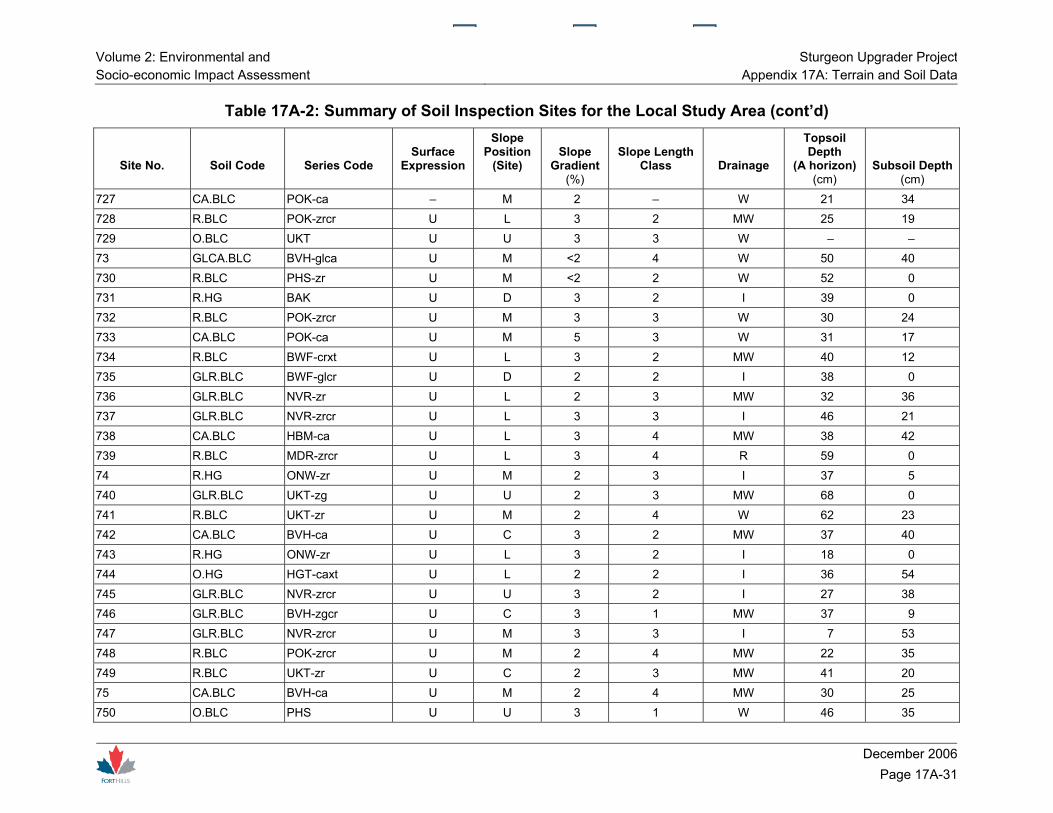
Table 17A-2: Summary of Soil Inspection Sites for the Local Study Area (cont’d)
Site No.
Soil Code
Series Code
Surface Expression
Slope Position
(Site)
Slope Gradient
(%)
Slope Length Class
Drainage
Topsoil Depth
(A horizon) (cm)
Subsoil Depth(cm)
727 CA.BLC POK-ca – M 2 – W 21 34 728 R.BLC POK-zrcr U L 3 2 MW 25 19 729 O.BLC UKT U U 3 3 W – – 73 GLCA.BLC BVH-glca U M <2 4 W 50 40 730 R.BLC PHS-zr U M <2 2 W 52 0 731 R.HG BAK U D 3 2 I 39 0 732 R.BLC POK-zrcr U M 3 3 W 30 24 733 CA.BLC POK-ca U M 5 3 W 31 17 734 R.BLC BWF-crxt U L 3 2 MW 40 12 735 GLR.BLC BWF-glcr U D 2 2 I 38 0 736 GLR.BLC NVR-zr U L 2 3 MW 32 36 737 GLR.BLC NVR-zrcr U L 3 3 I 46 21 738 CA.BLC HBM-ca U L 3 4 MW 38 42 739 R.BLC MDR-zrcr U L 3 4 R 59 0 74 R.HG ONW-zr U M 2 3 I 37 5 740 GLR.BLC UKT-zg U U 2 3 MW 68 0 741 R.BLC UKT-zr U M 2 4 W 62 23 742 CA.BLC BVH-ca U C 3 2 MW 37 40 743 R.HG ONW-zr U L 3 2 I 18 0 744 O.HG HGT-caxt U L 2 2 I 36 54 745 GLR.BLC NVR-zrcr U U 3 2 I 27 38 746 GLR.BLC BVH-zgcr U C 3 1 MW 37 9 747 GLR.BLC NVR-zrcr U M 3 3 I 7 53 748 R.BLC POK-zrcr U M 2 4 MW 22 35 749 R.BLC UKT-zr U C 2 3 MW 41 20 75 CA.BLC BVH-ca U M 2 4 MW 30 25 750 O.BLC PHS U U 3 1 W 46 35

Sturgeon Upgrader Project Volume 2: Environmental and Appendix 17A: Terrain and Soil Data Socio-economic Impact Assessment
December 2006 Page 17A-32
Table 17A-2: Summary of Soil Inspection Sites for the Local Study Area (cont’d)
Site No.
Soil Code
Series Code
Surface Expression
Slope Position
(Site)
Slope Gradient
(%)
Slope Length Class
Drainage
Topsoil Depth
(A horizon) (cm)
Subsoil Depth(cm)
751 R.HG KSY-crxt U M 2 3 I 32 8 752 CA.BLC POK-ca U M 2 3 MW 56 26 753 CA.BLC POK-ca U M 3 4 W 49 12 754 GLR.BLC NVR-zrcr U L 3 2 I 42 0 755 O.HG KSY-zzcrxs U L 3 3 I 22 19 756 O.BLC POK-zz U M 4 4 W 15 42 757 R.BLC POK-zrcr U M 2 4 W 43 15 758 R.BLC POK-zrcr U U – 3 MW 43 15 759 CA.BLC HBM-ca U U 2 3 W 28 32 76 O.BLC PHS U M 3 3 MW 33 16 760 CA.BLC POK-ca U M 2 3 W 45 34 761 CA.BLC POK-ca – M 3 3 W 32 28 762 GLR.BLC EDG U L 3 1 I 29 10 763 R.BLC BWF U L <1 2 MW 34 22 764 HU.LG JVE U D 0 3 P 18 47 765 CA.BLC HBM-ca U U 3 3 W 50 20 766 GLCA.BLC NVR-caxt U L 2 3 MW 34 30 767 R.BLC BWF-cr U L 2 3 MW 52 0 768 R.BLC HBM-zrcr U C 2 3 MW 27 31 769 GLCA.BLC NVR-ca U – 1 – I 39 23 77 HU.LG JVE-xt U L 2 2 I 34 18 770 R.BLC HBM-zrcr U U 3 4 MW 47 23 771 GLR.BLC NVR-zrcr U L 3 4 I 25 6 772 GLR.BLC HBM-zgcr U M 2 3 MW 61 0 773 R.BLC MDR-zrcr U L 2 4 MW 54 26 774 GLCA.BLC HBM-glca U M 2 3 I 34 48 775 CA.BLC HBM-ca U U 3 3 W 70 22

Volume 2: Environmental and Sturgeon Upgrader ProjectSocio-economic Impact Assessment Appendix 17A: Terrain and Soil Data
December 2006
Page 17A-33
Table 17A-2: Summary of Soil Inspection Sites for the Local Study Area (cont’d)
Site No.
Soil Code
Series Code
Surface Expression
Slope Position
(Site)
Slope Gradient
(%)
Slope Length Class
Drainage
Topsoil Depth
(A horizon) (cm)
Subsoil Depth(cm)
776 GLR.BLC BVH-zgcr U M 3 3 I 20 12 777 GLR.BLC NVR-zrcr U M 2 4 I 22 37 778 R.BLC MDR-zrcr U U 3 3 W 37 48 779 R.BLC UKT-zr U M 1 3 MW 40 12 78 O.BLC MDR U U 2 2 W 22 23 780 R.BLC PHS-zrxc U U 3 3 W 95 0 781 R.BLC MDR-zr U M 2 4 MW 51 22 782 O.MB PRM-zz U U 3 2 W 23 19 783 R.BLC MDR-zr U U 2 2 W 58 34 784 R.HG KSY-cr U M 2 2 I 46 0 785 R.HG KSY-crxt U M 2 2 I 29 0 786 GLR.BLC HBM-zgcr U L 2 3 I 32 24 787 R.HG KSY-cr U – 2 4 I 54 0 788 R.BLC POK-zr U L 3 – MW 62 0 789 R.BLC POK-zr U U 4 4 W 39 24 79 O.BLC PHS U U 3 3 W 23 27 790 R.BLC POK-zrcr U M 3 3 MW 41 12 791 R.HG KSY U L <2 2 I 16 0 792 SZ.BLC STE-ca U U <2 – MW 20 50 793 CA.BLC HBM-ca U M 2 3 W 26 14 794 R.BLC POK-zrxs U M – 2 MW 27 21 795 O.HG HGT-ca U C <2 – I 32 12 796 CA.BLC HBM-ca U – 2 3 MW 35 15 797 O.BLC HBM-zz U U 5 3 W 33 30 798 GLCA.BLC HBM-glca U L 3 3 MW 36 15 799 CA.BLC HBM-glca U M 2 3 MW 35 40 8 O.HG MLT-caxt U T 1 3 I 23 19
Sturgeon Upgrader Project Volume 2: Environmental and Appendix 17A: Terrain and Soil Data Socio-economic Impact Assessment
December 2006 Page 17A-34
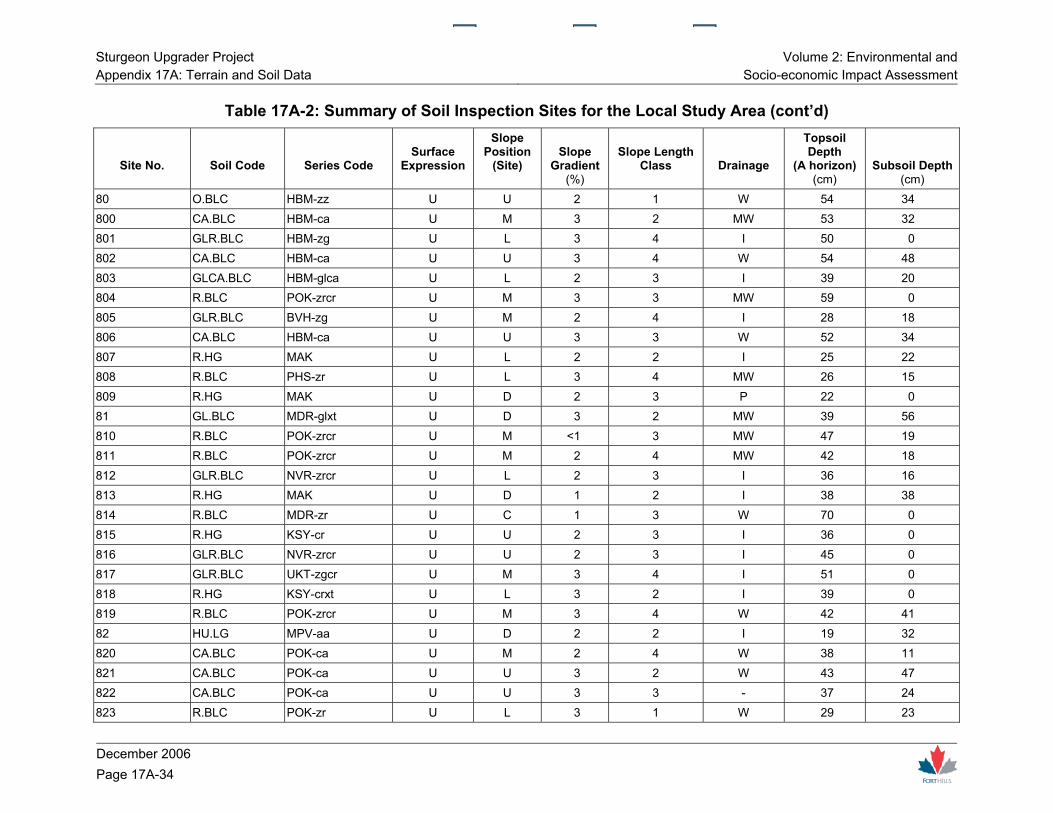
Table 17A-2: Summary of Soil Inspection Sites for the Local Study Area (cont’d)
Site No.
Soil Code
Series Code
Surface Expression
Slope Position
(Site)
Slope Gradient
(%)
Slope Length Class
Drainage
Topsoil Depth
(A horizon) (cm)
Subsoil Depth(cm)
80 O.BLC HBM-zz U U 2 1 W 54 34 800 CA.BLC HBM-ca U M 3 2 MW 53 32 801 GLR.BLC HBM-zg U L 3 4 I 50 0 802 CA.BLC HBM-ca U U 3 4 W 54 48 803 GLCA.BLC HBM-glca U L 2 3 I 39 20 804 R.BLC POK-zrcr U M 3 3 MW 59 0 805 GLR.BLC BVH-zg U M 2 4 I 28 18 806 CA.BLC HBM-ca U U 3 3 W 52 34 807 R.HG MAK U L 2 2 I 25 22 808 R.BLC PHS-zr U L 3 4 MW 26 15 809 R.HG MAK U D 2 3 P 22 0 81 GL.BLC MDR-glxt U D 3 2 MW 39 56 810 R.BLC POK-zrcr U M <1 3 MW 47 19 811 R.BLC POK-zrcr U M 2 4 MW 42 18 812 GLR.BLC NVR-zrcr U L 2 3 I 36 16 813 R.HG MAK U D 1 2 I 38 38 814 R.BLC MDR-zr U C 1 3 W 70 0 815 R.HG KSY-cr U U 2 3 I 36 0 816 GLR.BLC NVR-zrcr U U 2 3 I 45 0 817 GLR.BLC UKT-zgcr U M 3 4 I 51 0 818 R.HG KSY-crxt U L 3 2 I 39 0 819 R.BLC POK-zrcr U M 3 4 W 42 41 82 HU.LG MPV-aa U D 2 2 I 19 32 820 CA.BLC POK-ca U M 2 4 W 38 11 821 CA.BLC POK-ca U U 3 2 W 43 47 822 CA.BLC POK-ca U U 3 3 - 37 24 823 R.BLC POK-zr U L 3 1 W 29 23
Volume 2: Environmental and Sturgeon Upgrader ProjectSocio-economic Impact Assessment Appendix 17A: Terrain and Soil Data
December 2006
Page 17A-35
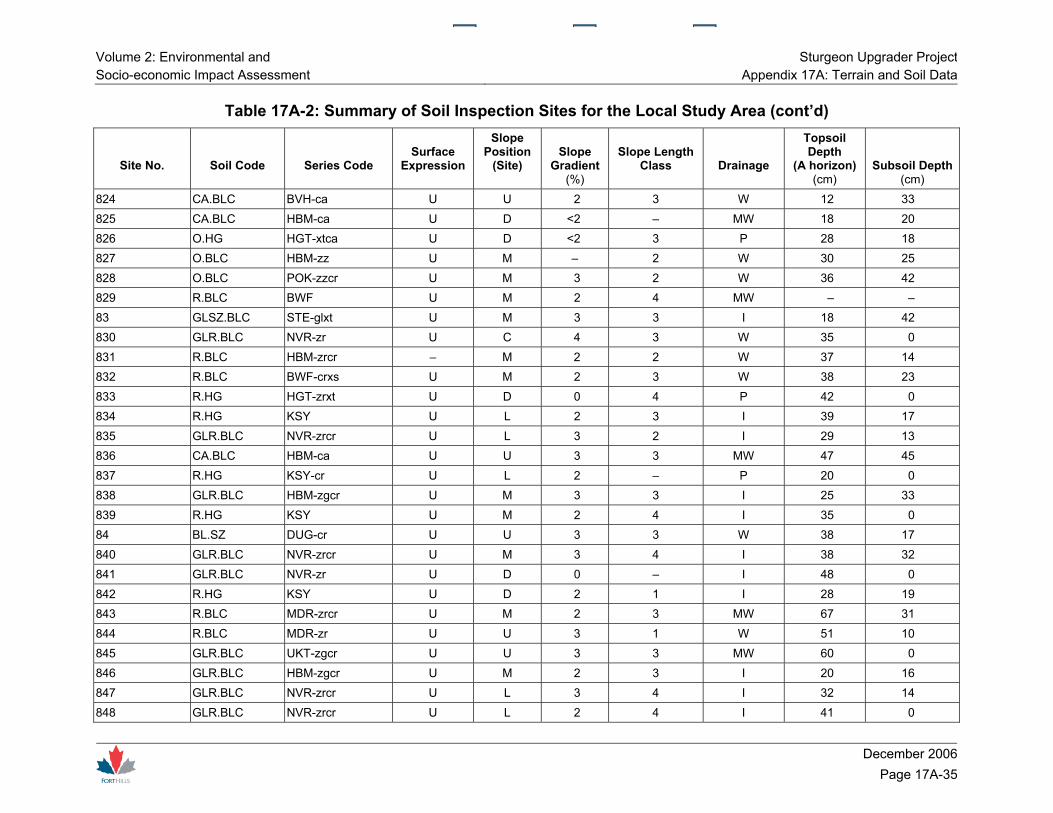
Table 17A-2: Summary of Soil Inspection Sites for the Local Study Area (cont’d)
Site No.
Soil Code
Series Code
Surface Expression
Slope Position
(Site)
Slope Gradient
(%)
Slope Length Class
Drainage
Topsoil Depth
(A horizon) (cm)
Subsoil Depth(cm)
824 CA.BLC BVH-ca U U 2 3 W 12 33 825 CA.BLC HBM-ca U D <2 – MW 18 20 826 O.HG HGT-xtca U D <2 3 P 28 18 827 O.BLC HBM-zz U M – 2 W 30 25 828 O.BLC POK-zzcr U M 3 2 W 36 42 829 R.BLC BWF U M 2 4 MW – – 83 GLSZ.BLC STE-glxt U M 3 3 I 18 42 830 GLR.BLC NVR-zr U C 4 3 W 35 0 831 R.BLC HBM-zrcr – M 2 2 W 37 14 832 R.BLC BWF-crxs U M 2 3 W 38 23 833 R.HG HGT-zrxt U D 0 4 P 42 0 834 R.HG KSY U L 2 3 I 39 17 835 GLR.BLC NVR-zrcr U L 3 2 I 29 13 836 CA.BLC HBM-ca U U 3 3 MW 47 45 837 R.HG KSY-cr U L 2 – P 20 0 838 GLR.BLC HBM-zgcr U M 3 3 I 25 33 839 R.HG KSY U M 2 4 I 35 0 84 BL.SZ DUG-cr U U 3 3 W 38 17 840 GLR.BLC NVR-zrcr U M 3 4 I 38 32 841 GLR.BLC NVR-zr U D 0 – I 48 0 842 R.HG KSY U D 2 1 I 28 19 843 R.BLC MDR-zrcr U M 2 3 MW 67 31 844 R.BLC MDR-zr U U 3 1 W 51 10 845 GLR.BLC UKT-zgcr U U 3 3 MW 60 0 846 GLR.BLC HBM-zgcr U M 2 3 I 20 16 847 GLR.BLC NVR-zrcr U L 3 4 I 32 14 848 GLR.BLC NVR-zrcr U L 2 4 I 41 0
Sturgeon Upgrader Project Volume 2: Environmental and Appendix 17A: Terrain and Soil Data Socio-economic Impact Assessment
December 2006 Page 17A-36
Table 17A-2: Summary of Soil Inspection Sites for the Local Study Area (cont’d)
Site No.
Soil Code
Series Code
Surface Expression
Slope Position
(Site)
Slope Gradient
(%)
Slope Length Class
Drainage
Topsoil Depth
(A horizon) (cm)
Subsoil Depth(cm)
849 CA.BLC POK-ca U M 2 3 W 41 38 85 GL.BLC BVH-glca U M 2 3 MW 18 22 850 O.BLC BVH-cr U L 3 2 W 14 24 851 R.BLC POK-zrcr U M 3 2 W 31 20 852 O.HG HGT-ca U T 2 3 I 20 20 853 O.HG HGT-ca U L 3 3 P 20 20 854 O.BLC BVH U U 4 3 W – – 855 GLR.BLC BWF-glcrxt U L 3 3 MW 51 0 856 GL.BLC NVR U L 3 3 MW 32 44 857 O.BLC POK-zz U U 3 4 W 53 23 858 R.HG HYL U M 4 1 I 26 0 859 R.HG ONW-zrcr – L <2 2 I 25 42 86 HU.LG JVE U L 3 3 P 35 20 860 GLR.BLC NVR-crzr U L 3 3 MW 27 12 861 R.HG KSY-crxt U M 2 4 I 21 12 862 R.BLC BVH-zr – C 4 4 MW 51 14 863 GLR.BLC NVR-zrcr U L 3 3 I 22 14 864 GLR.BLC NVR-zrcr U L 2 4 I 39 0 865 R.HG ONW-zr U M 2 1 I 35 35 866 R.HG MAK-xt U L 2 3 I 24 15 867 R.BLC BVH-zr – U 3 3 W 72 0 868 R.HG MAK U L – 2 I 43 16 869 R.HG MAK U L 3 3 I 43 16 87 GLSZ.BLC STE-gl U L 3 3 MW 22 32 870 R.BLC HBM-zr U M 2 3 MW 43 8 871 GLR.BLC NVR-zr U U 2 3 MW 25 34 872 GLR.BLC UKT-zgcr U L 2 4 MW 67 0

Volume 2: Environmental and Sturgeon Upgrader ProjectSocio-economic Impact Assessment Appendix 17A: Terrain and Soil Data
December 2006
Page 17A-37
Table 17A-2: Summary of Soil Inspection Sites for the Local Study Area (cont’d)
Site No.
Soil Code
Series Code
Surface Expression
Slope Position
(Site)
Slope Gradient
(%)
Slope Length Class
Drainage
Topsoil Depth
(A horizon) (cm)
Subsoil Depth(cm)
873 GLR.BLC UKT-zgcr U U 2 3 MW 39 36 874 O.HG HGT-ca U E 0 – I 33 21 875 GLCA.BLC NVR-ca U M 2 - I 36 16 876 R.HG KSY-cr U L 3 1 P 56 0 877 R.BLC HBM-zrcr U – 2 4 W 19 16 879 GLR.BLC NVR-zr U L 2 3 I 40 15 88 O.BLC BVH U M 2 3 MW 10 16 880 GLCA.BLC HBM-glca U U 2 3 MW 38 25 881 GLR.BLC NVR-zrcr U L 1 2 I 21 29 882 R.HG KSY U D 0 1 P 24 0 883 O.BLC BVH U C 3 3 W 34 38 884 CA.BLC HBM-ca U L 3 2 MW 34 58 885 CA.BLC UKT-ca U C 0 3 W 17 25 886 R.BLC POK-zr U M 2 3 W 24 12 887 R.BLC HBM-zr U M 2 3 W 24 22 888 O.BLC BVH U U 3 2 W 37 53 889 R.BLC POK-zrcr U U 2 2 W 65 0 89 SZ.BLC STE-xt U U 2 4 W 25 38 890 R.BLC POK-zrcr U L 2 2 MW 37 18 891 R.HG ONW-zrcr U U 6 3 I 21 9 892 R.HG MAK U – 1 3 I 30 16 893 GLR.BLC NVR-zrcr U L 2 – I 39 0 894 CA.BLC BVH-ca U U 3 3 W 44 36 895 R.HG MAK-crxt I L 2 1 P 35 20 896 R.HG ONW-zr U C 2 3 I 37 15 897 GLR.BLC NVR-zrcr – L 2 4 I 32 21 898 GLR.BLC NVR-zrcr U L 1 4 I 45 9

Sturgeon Upgrader Project Volume 2: Environmental and Appendix 17A: Terrain and Soil Data Socio-economic Impact Assessment
December 2006 Page 17A-38
Table 17A-2: Summary of Soil Inspection Sites for the Local Study Area (cont’d)
Site No.
Soil Code
Series Code
Surface Expression
Slope Position
(Site)
Slope Gradient
(%)
Slope Length Class
Drainage
Topsoil Depth
(A horizon) (cm)
Subsoil Depth(cm)
899 GLR.BLC POK-zg U L 1 – I 40 8 9 CA.BLC PHS-ca U M 3 2 MW 49 22 90 O.BLC HBM-zz U – 2 4 MW 31 18 900 GLCA.BLC HBM-glca U M 2 4 MW 39 31 901 R.BLC PHS-zrxc U M 2 3 MW 59 17 902 GL.BLC MDR-glxt U M 2 2 MW 37 35 903 GLR.BLC UKT-zgcr U M 2 2 MW 41 13 904 GL.BLC UKT-gl U M 2 2 I 33 21 905 R.HG BAK U D 0 – P 74 0 906 R.BLC BVH-zrcr U M 3 1 W 28 0 907 R.BLC HBM-zrcr U M 1 3 W 22 10 908 O.HG KSY-zzca U E 2 1 I 39 37 909 R.BLC HBM-zr U U 3 4 W 44 14 91 O.BLC PHS U M 3 3 W 37 52 910 HU.LG DMY-zz U M 2 2 I 29 31 911 R.BLC POK-zrcr U U 2 2 W 45 0 912 R.HG KSY-crxt U L 3 3 I 43 0 913 R.BLC POK-zrcr U U 3 3 W 42 30 914 R.BLC HBM-zrcr U M 3 4 W 14 30 9149 E.BLC AGS-cagr U U 2 3 W 26 41 915 GLR.BLC NVR-zrcr U M 2 3 MW 49 10 916 CA.BLC POK-ca U M 3 4 MW 31 31 917 GLE.BLC UKT-glzz U M 2 3 MW 35 15 918 GLR.BLC HBM-zgcr U M 2 3 MW 31 10 919 GLR.BLC NVR-zrcr U M 3 3 MW 39 9 92 HU.LG JVE U D 0 3 I 37 46 920 O.BLC PHS U U 3 3 W 52 48

Volume 2: Environmental and Sturgeon Upgrader ProjectSocio-economic Impact Assessment Appendix 17A: Terrain and Soil Data
December 2006
Page 17A-39
Table 17A-2: Summary of Soil Inspection Sites for the Local Study Area (cont’d)
Site No.
Soil Code
Series Code
Surface Expression
Slope Position
(Site)
Slope Gradient
(%)
Slope Length Class
Drainage
Topsoil Depth
(A horizon) (cm)
Subsoil Depth(cm)
921 GLR.BLC NVR-zrcr U L 2 3 I 32 16 922 R.BLC HBM-zrcr U M 5 4 W 34 0 923 O.BLC HBM-zz U M 3 4 W 19 38 924 GLR.BLC NVR-zrcr U E 2 1 MW 52 23 925 GLE.BLC JFF-xs U L 2 3 MW 43 19 926 O.HG HGT-ca – M 3 2 I 33 55 927 O.BLC PHS U M 3 3 MW 29 31 928 GL.BLC NVR U L 2 3 I 33 22 929 GLR.BLC HBM-zgcr U L 3 4 I 37 24 93 R.BLC UKT-zrcr U M 3 2 MW 71 5 930 O.BLC POK-zz U M 3 4 W 18 41 931 O.BLC HBM-zz U M 3 3 W 31 36 932 GLE.BLC JFF-cr U E 2 1 MW 40 21 933 GLE.BLC JFF-cr U M 3 3 MW 48 34 934 R.HG KSY-crxt U M 3 3 I 22 14 935 O.HG MLT-ca U U 2 3 I 18 50 936 R.BLC POK-zr U L 2 3 MW 45 0 937 O.BLC POK-zz U U 3 4 W 45 7 938 CA.BLC MDR-ca U M 3 3 W 13 13 939 GLR.BLC PHS-zg U M 2 3 MW 37 23 94 O.HG MLT-caxt U D 3 2 P 30 20 940 CA.BLC PHS-ca U U 2 3 W 15 14 941 O.HG MLT-ca U M 3 3 I 14 18 942 O.HG MLT-crxt U M 2 3 I 16 49 943 O.HG HGT U M 3 2 I 30 18 944 R.BLC MDR-zr U M 2 4 MW 26 0 945 GLR.BLC NVR-zrcr U L 3 3 MW 58 27

Sturgeon Upgrader Project Volume 2: Environmental and Appendix 17A: Terrain and Soil Data Socio-economic Impact Assessment
December 2006 Page 17A-40
Table 17A-2: Summary of Soil Inspection Sites for the Local Study Area (cont’d)
Site No.
Soil Code
Series Code
Surface Expression
Slope Position
(Site)
Slope Gradient
(%)
Slope Length Class
Drainage
Topsoil Depth
(A horizon) (cm)
Subsoil Depth(cm)
9452 R.BLC UKT-zr U D 2 1 MW 57 43 946 GLR.BLC NVR-zrcr U E 2 1 MW 46 21 947 CA.BLC PHS-ca U M 3 3 W 34 50 948 GLR.BLC UKT-zg U M 3 3 MW 32 0 949 GLCA.BLC PHS-glca U M 2 2 I 27 38 95 R.HG ONW-zrcr U T <2 – P 20 10 950 R.BLC MDR-zr U E 0 3 MW 15 37 951 R.BLC HBM-zrcr U M 3 4 MW 25 11 952 O.BLC HBM-zz U M 2 3 MW 43 35 953 GLR.BLC HBM-zgcr U E 2 1 MW 39 12 954 R.BLC HBM-zr U M 2 3 MW 52 11 955 CA.BLC UKT-ca U U 3 3 W 42 24 956 R.HG DKN U L 3 2 I 18 0 957 R.HG DKN U L 2 4 I 15 15 958 GLR.BLC UKT-zg U M 2 3 MW 32 0 959 GLR.BLC MDR-zg U M 2 3 MW 49 12 96 GLR.BLC HBM-zgcr U M 2 2 I 25 37 960 GLCA.BLC BVH-glca U M 4 4 MW 24 32 961 O.BLC UKT U M 3 4 MW 21 26 962 HU.LG JVE U E 2 1 I 31 11 963 GL.BLC PHS-gl U M 6 4 I 20 25 964 CA.BLC MDR-ca U U 4 – W 19 39 965 SZ.BLC STE-caxt U E 0 1 MW 19 36 966 CA.BLC MDR-ca U C 2 3 W 15 8 967 R.BLC POK-zr U T 2 1 MW 44 10 968 CA.BLC BVH-ca – L 3 3 MW 18 47 969 CA.BLC BVH-ca U M 3 3 W 31 16

Volume 2: Environmental and Sturgeon Upgrader ProjectSocio-economic Impact Assessment Appendix 17A: Terrain and Soil Data
December 2006
Page 17A-41
Table 17A-2: Summary of Soil Inspection Sites for the Local Study Area (cont’d)
Site No.
Soil Code
Series Code
Surface Expression
Slope Position
(Site)
Slope Gradient
(%)
Slope Length Class
Drainage
Topsoil Depth
(A horizon) (cm)
Subsoil Depth(cm)
97 O.HG MLT-ca L E 2 1 I 20 7 970 GLCA.BLC PHS-glca U M 3 3 I 18 35 971 O.BLC HBM-zz U U 3 4 W 13 47 972 R.HG MAK-cr U D 2 2 I 110 0 973 CA.BLC MDR-caxc U M 3 4 W 43 37 974 R.BLC MMO-zrxt U M 2 3 W 34 14 975 CA.BLC POK-caxs U M 3 1 W 50 40 976 O.BLC HBM-zz U M 2 2 W 57 22 977 CA.BLC HBM-ca U – <2 2 – 16 35 978 HU.LG MPV-aaca U L 2 2 I 28 67 979 R.HG MAK-cr U M 2 3 I 38 14 98 GLR.BLC HBM-zgcr U M 2 1 MW 30 35 980 GLR.BLC BVH-zgcr U U 3 2 MW 35 0 981 R.BLC BVH-zrcr U M 2 2 MW 30 13 982 CA.BLC POK-ca U U 3 3 MW 46 21 983 O.HG KSY-zzca U L 2 4 I 19 35 984 O.HG ONW-ca U T 2 3 I 15 33 985 O.HG HGT-ca U L 2 3 I 21 23 986 O.HG KSY-zzcrxt U D 2 1 I 20 50 987 O.HG MLT U D 0 – I 30 60 988 R.BLC POK-zrcr U M 3 2 MW 56 13 989 R.BLC HBM-zr U M 2 3 W 63 11 99 O.BLC PHS-cr U U 2 3 W 63 42 990 GLCA.BLC HBM-glca U M 3 2 I 32 21 991 O.BLC HBM-zz U U 2 3 W 30 24 992 R.HG DKN-crxt U M 2 3 I 39 0 993 CA.BLC POK-ca U U 3 2 MW 56 29

Sturgeon Upgrader Project Volume 2: Environmental and Appendix 17A: Terrain and Soil Data Socio-economic Impact Assessment
December 2006 Page 17A-42
Table 17A-2: Summary of Soil Inspection Sites for the Local Study Area (cont’d)
Site No.
Soil Code
Series Code
Surface Expression
Slope Position
(Site)
Slope Gradient
(%)
Slope Length Class
Drainage
Topsoil Depth
(A horizon) (cm)
Subsoil Depth(cm)
994 GLCA.BLC HBM-glca U U 3 2 I 49 16 995 GL.BLC BVH-gl U U 3 2 I 27 29 996 HU.LG JVE-caxt – L 2 3 I 19 46 997 GLCA.BLC BVH-cagl U M 3 2 I 19 37 998 GLE.BLC JFF U M 3 4 MW 30 45 999 R.BLC PHS-zr U M 3 3 W 66 39 W1 O.BLC POK-zz T U 4 2 W 78 68 W2 GL.BLC NVR U M 3 3 I 42 28 W3 O.BLC POK-zz U U 3 – MW 36 39 W4 R.BLC POK-zr U L 4 – MW 70 0 W5 O.BLC BVH U C 3 3 MW 17 51 W6 CA.BLC POK-ca U L 1 4 W 65 20
NOTE: - no data
Volume 2: Environmental and Sturgeon Upgrader ProjectSocio-economic Impact Assessment Appendix 17A: Terrain and Soil Data
December 2006
Page 17A-43
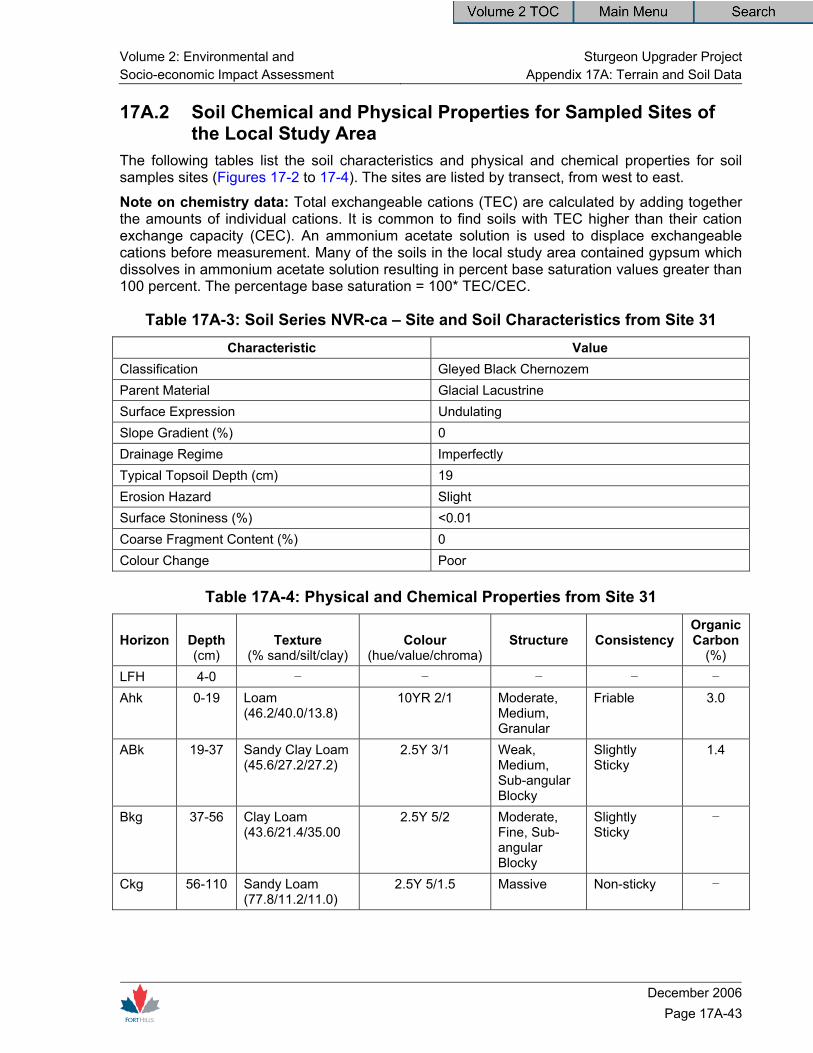
17A.2 Soil Chemical and Physical Properties for Sampled Sites of the Local Study Area
The following tables list the soil characteristics and physical and chemical properties for soil samples sites (Figures 17-2 to 17-4). The sites are listed by transect, from west to east.
Note on chemistry data: Total exchangeable cations (TEC) are calculated by adding together the amounts of individual cations. It is common to find soils with TEC higher than their cation exchange capacity (CEC). An ammonium acetate solution is used to displace exchangeable cations before measurement. Many of the soils in the local study area contained gypsum which dissolves in ammonium acetate solution resulting in percent base saturation values greater than 100 percent. The percentage base saturation = 100* TEC/CEC.
Table 17A-3: Soil Series NVR-ca – Site and Soil Characteristics from Site 31 Characteristic Value
Classification Gleyed Black Chernozem Parent Material Glacial Lacustrine Surface Expression Undulating Slope Gradient (%) 0 Drainage Regime Imperfectly Typical Topsoil Depth (cm) 19 Erosion Hazard Slight Surface Stoniness (%) <0.01 Coarse Fragment Content (%) 0 Colour Change Poor
Table 17A-4: Physical and Chemical Properties from Site 31
Horizon
Depth (cm)
Texture (% sand/silt/clay)
Colour (hue/value/chroma)
Structure
Consistency
Organic Carbon
(%) LFH 4-0 – – – – –
Ahk 0-19 Loam (46.2/40.0/13.8)
10YR 2/1 Moderate, Medium, Granular
Friable 3.0
ABk 19-37 Sandy Clay Loam (45.6/27.2/27.2)
2.5Y 3/1 Weak, Medium, Sub-angular Blocky
Slightly Sticky
1.4
Bkg 37-56 Clay Loam (43.6/21.4/35.00
2.5Y 5/2 Moderate, Fine, Sub-angular Blocky
Slightly Sticky
–
Ckg 56-110 Sandy Loam (77.8/11.2/11.0)
2.5Y 5/1.5 Massive Non-sticky –

Sturgeon Upgrader Project Volume 2: Environmental and Appendix 17A: Terrain and Soil Data Socio-economic Impact Assessment
December 2006 Page 17A-44
Table 17A-4: Physical and Chemical Properties from Site 31 (cont’d)
Horizon
Depth (cm)
pH (Saturated Paste)
Electrical Conductivity (dS/m at 25◦)
Saturation (%)
Sodium Adsorption
Ratio
Base Saturation
(%) LFH 4-0 Ahk 019 7.5 1 142 0.7 136 ABk 19-37 7.9 1.19 45 2.7 279 Bkg 37-56 8.3 1.05 42 5.9 375 Ckg 56-110 8.1 1.3 33 7.2 280
Exchangeable Cations (cmol+/Kg)
Horizon
Depth (cm)
Cation Exchange Capacity (cmol+/Kg)
Calcium
Magnesium
Sodium
Potassium
LFH 4-0 Ahk 019 92.2 105 18.3 0.77 0.73 ABk 19-37 16.8 38.5 7.43 0.77 0.1 Bkg 37-56 11.3 34.3 6.88 1.26 0.05 Ckg 56-110 7.29 16.1 3.26 1.01 0.1
NOTE: – no data
Table 17A-5: Soil Series JVE-xt – Site and Soil Characteristics from Site 77 Characteristic Value
Classification Humic Luvic Gleysol Parent Material Glacial Lacustrine Surface Expression Undulating Slope Gradient (%) 1 Drainage Regime Imperfectly Typical Topsoil Depth (cm) 26 Erosion Hazard Wind: Low, Water: Severe Surface Stoniness (%) <0.01 Coarse Fragment Content (%) 2 Colour Change Poor

Volume 2: Environmental and Sturgeon Upgrader ProjectSocio-economic Impact Assessment Appendix 17A: Terrain and Soil Data
December 2006
Page 17A-45
Table 17A-6: Physical and Chemical Properties from Site 77
Horizon
Depth (cm)
Texture (% sand/silt/clay)
Colour (hue/value/chroma)
Structure
Consistency
Organic Carbon
(%) Ap 0-15 Loam
(48.4/36.6/15.0) 10YR 2/1 Weak, Medium,
Sub-angular Blocky
Friable 2.3
Ah 15-34 Loam (41.8/43.4/14.8)
10YR 2/1 Moderate, Medium, Sub-angular Blocky
Friable 2.3
Aegj 34-42 Silt Loam (37.6/52.6/9.8)
10YR 4/2 Weak, Coarse, Platy
Friable 0.2
Btg 42-52 Clay Loam (37.8/35.0/27.2)
2.5Y 5/2 Weak, Medium, Sub-angular Blocky
Friable -
Cg 52-88 Sandy Loam (69.0/18.2/12.8)
2.5Y 3/1 Massive Friable -
II Ckg 88-120 Clay Loam (38.4/29.8/31.8)
2.5Y 3/1 Massive Firm -
Horizon
Depth (cm)
pH (Saturated Paste)
Electrical Conductivity (dS/m at 25◦)
Saturation (%)
Sodium Adsorption
Ratio
Base Saturation
(%) Ap 0-15 5.3 1.1 51 0.2 73 Ah 15-34 5.5 0.64 58 0.2 80 Aegj 34-42 6.3 0.45 31 0.1 100 Btg 42-52 6 0.37 40 0.1 82 Cg 52-88 6.1 0.49 31 0.2 84 II Ckg 88-120 5.7 0.12 43 0.4 86
Exchangeable Cations (cmol+/Kg)
Horizon
Depth (cm)
Cation Exchange Capacity (cmol+/Kg)
Calcium
Magnesium
Sodium
Potassium
Ap 0-15 18 11.2 1.2 0.07 0.65 Ah 15-34 17.5 12.4 1.2 0.08 0.3 Aegj 34-42 3.4 2.77 0.48 0.05 0.2 Btg 42-52 16.1 10.2 2.57 0.06 0.4 Cg 52-88 8.7 5.63 1.4 0.06 0.2 II Ckg 88-120 15.2 8.84 3.84 0.08 0.4
NOTE: – no data
Sturgeon Upgrader Project Volume 2: Environmental and Appendix 17A: Terrain and Soil Data Socio-economic Impact Assessment
December 2006 Page 17A-46
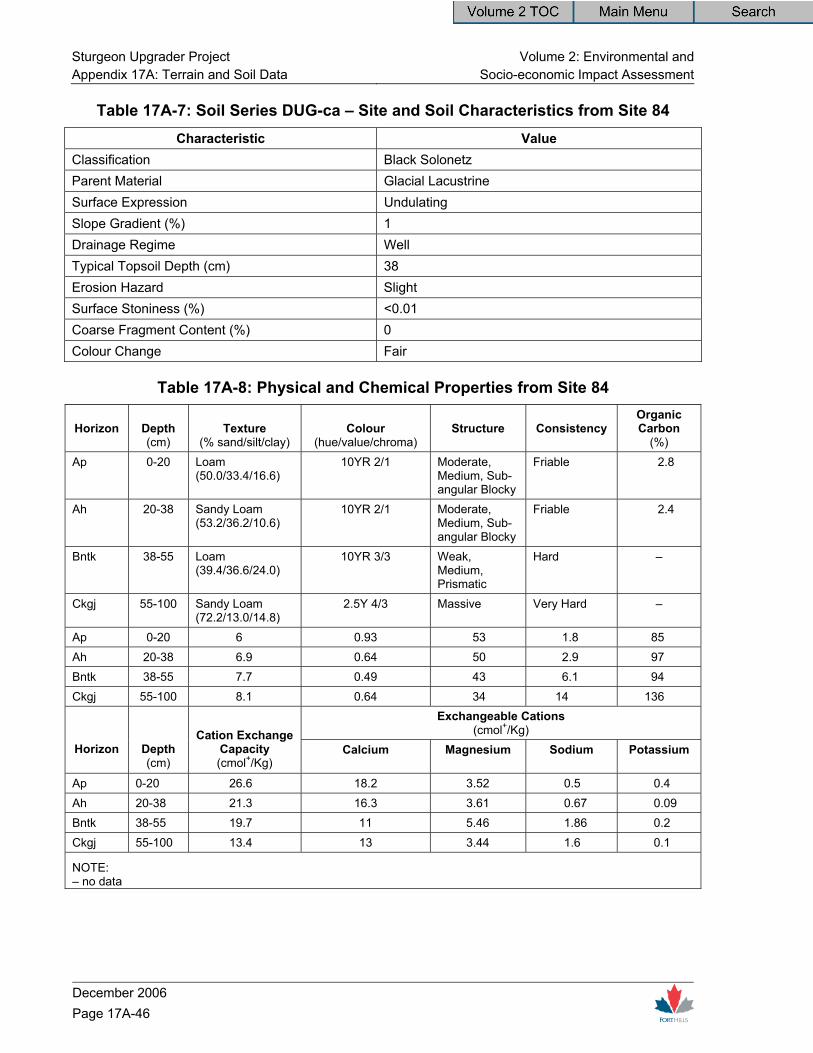
Table 17A-7: Soil Series DUG-ca – Site and Soil Characteristics from Site 84 Characteristic Value
Classification Black Solonetz Parent Material Glacial Lacustrine Surface Expression Undulating Slope Gradient (%) 1 Drainage Regime Well Typical Topsoil Depth (cm) 38 Erosion Hazard Slight Surface Stoniness (%) <0.01 Coarse Fragment Content (%) 0 Colour Change Fair
Table 17A-8: Physical and Chemical Properties from Site 84
Horizon
Depth (cm)
Texture (% sand/silt/clay)
Colour (hue/value/chroma)
Structure
Consistency
Organic Carbon
(%) Ap 0-20 Loam
(50.0/33.4/16.6) 10YR 2/1 Moderate,
Medium, Sub-angular Blocky
Friable 2.8
Ah 20-38 Sandy Loam (53.2/36.2/10.6)
10YR 2/1 Moderate, Medium, Sub-angular Blocky
Friable 2.4
Bntk 38-55 Loam (39.4/36.6/24.0)
10YR 3/3 Weak, Medium, Prismatic
Hard –
Ckgj 55-100 Sandy Loam (72.2/13.0/14.8)
2.5Y 4/3 Massive Very Hard –
Ap 0-20 6 0.93 53 1.8 85 Ah 20-38 6.9 0.64 50 2.9 97 Bntk 38-55 7.7 0.49 43 6.1 94 Ckgj 55-100 8.1 0.64 34 14 136
Exchangeable Cations (cmol+/Kg)
Horizon
Depth (cm)
Cation Exchange Capacity (cmol+/Kg)
Calcium
Magnesium
Sodium
Potassium
Ap 0-20 26.6 18.2 3.52 0.5 0.4 Ah 20-38 21.3 16.3 3.61 0.67 0.09 Bntk 38-55 19.7 11 5.46 1.86 0.2 Ckgj 55-100 13.4 13 3.44 1.6 0.1
NOTE: – no data

Volume 2: Environmental and Sturgeon Upgrader ProjectSocio-economic Impact Assessment Appendix 17A: Terrain and Soil Data
December 2006
Page 17A-47
Table 17A-9: Soil Series POK-cr– Site and Soil Characteristics from Site 103 Characteristic Value
Classification Eluviated Black Chernozem Parent Material Glacial Lacustrine Surface Expression Undulating Slope Gradient (%) 0 Drainage Regime Imperfectly Typical Topsoil Depth (cm) 33 Erosion Hazard Slight Surface Stoniness (%) <0.01 Coarse Fragment Content (%) 1 Colour Change Poor
Table 17A-10: Physical and Chemical Properties from Site 103
Horizon
Depth (cm)
Texture (% sand/silt/clay)
Colour (hue/value/chroma)
Structure
Consistency
Organic Carbon
(%) Apk 0-33 Sandy Loam
(57.0/32.4/10.6) 10YR 2/1 Moderate,
Medium, Granular
Friable 2.8
Aejk 33-63 Sandy Loam (65.0/24.6/10.4)
10YR 5/2 Moderate, Medium, Platy
Friable –
Btjkgj 63-95 Sandy Loam (69.0/17.2/13.8)
2.5Y 3/2 Moderate, Medium, Sub-angular Blocky
Friable –
Ckg 95-120 Sandy Loam (55.0/25.2/19.8)
2.5Y 4/1 Massive Firm –
Horizon
Depth (cm)
pH (Saturated Paste)
Electrical Conductivity (dS/m at 25◦)
Saturation (%)
Sodium Adsorption
Ratio
Base Saturation
(%) Apk 0-33 7.6 0.74 58 0.7 155 Aejk 33-63 8.1 0.59 36 2.9 160 Btjkgj 63-95 7.9 0.54 35 4 114 Ckg 95-120 7.6 0.94 45 3 110
Sturgeon Upgrader Project Volume 2: Environmental and Appendix 17A: Terrain and Soil Data Socio-economic Impact Assessment
December 2006 Page 17A-48
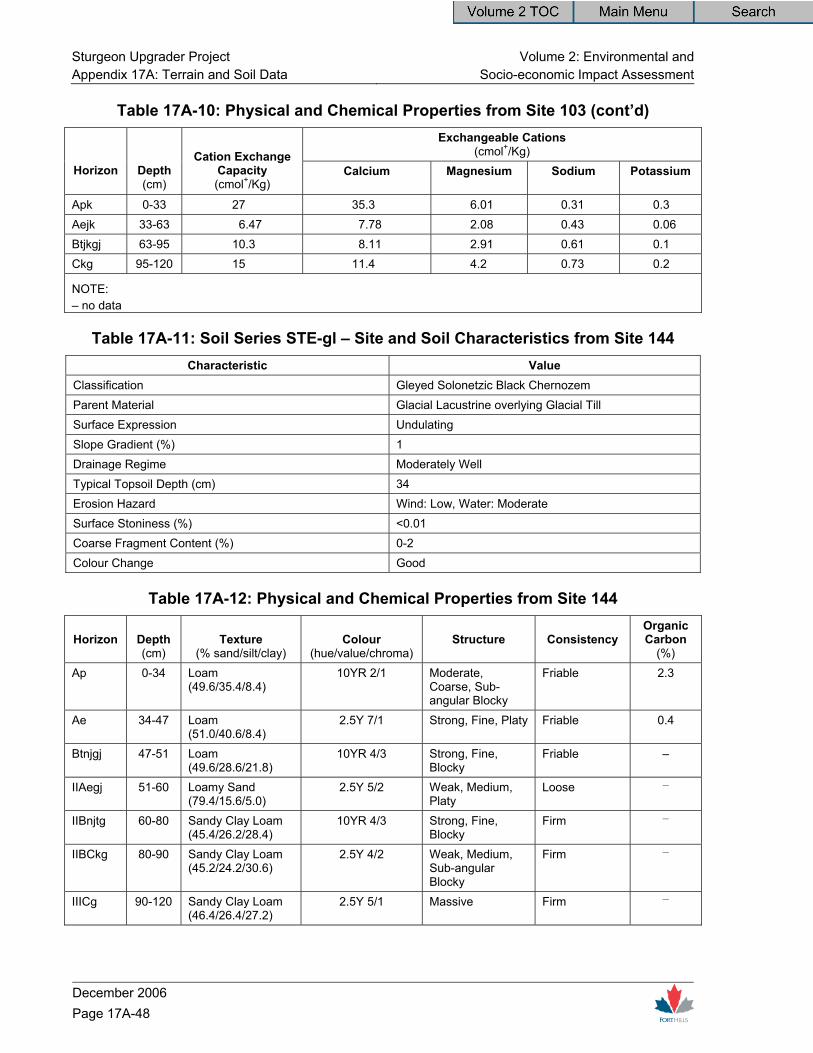
Table 17A-10: Physical and Chemical Properties from Site 103 (cont’d) Exchangeable Cations
(cmol+/Kg) Horizon
Depth (cm)
Cation Exchange Capacity (cmol+/Kg)
Calcium
Magnesium
Sodium
Potassium
Apk 0-33 27 35.3 6.01 0.31 0.3 Aejk 33-63 6.47 7.78 2.08 0.43 0.06 Btjkgj 63-95 10.3 8.11 2.91 0.61 0.1 Ckg 95-120 15 11.4 4.2 0.73 0.2
NOTE: – no data
Table 17A-11: Soil Series STE-gl – Site and Soil Characteristics from Site 144 Characteristic Value
Classification Gleyed Solonetzic Black Chernozem Parent Material Glacial Lacustrine overlying Glacial Till Surface Expression Undulating Slope Gradient (%) 1 Drainage Regime Moderately Well Typical Topsoil Depth (cm) 34 Erosion Hazard Wind: Low, Water: Moderate Surface Stoniness (%) <0.01 Coarse Fragment Content (%) 0-2 Colour Change Good
Table 17A-12: Physical and Chemical Properties from Site 144
Horizon
Depth (cm)
Texture (% sand/silt/clay)
Colour (hue/value/chroma)
Structure
Consistency
Organic Carbon
(%) Ap 0-34 Loam
(49.6/35.4/8.4) 10YR 2/1 Moderate,
Coarse, Sub-angular Blocky
Friable 2.3
Ae 34-47 Loam (51.0/40.6/8.4)
2.5Y 7/1 Strong, Fine, Platy Friable 0.4
Btnjgj 47-51 Loam (49.6/28.6/21.8)
10YR 4/3 Strong, Fine, Blocky
Friable –
IIAegj 51-60 Loamy Sand (79.4/15.6/5.0)
2.5Y 5/2 Weak, Medium, Platy
Loose –
IIBnjtg 60-80 Sandy Clay Loam (45.4/26.2/28.4)
10YR 4/3 Strong, Fine, Blocky
Firm –
IIBCkg 80-90 Sandy Clay Loam (45.2/24.2/30.6)
2.5Y 4/2 Weak, Medium, Sub-angular Blocky
Firm –
IIICg 90-120 Sandy Clay Loam (46.4/26.4/27.2)
2.5Y 5/1 Massive Firm –

Volume 2: Environmental and Sturgeon Upgrader ProjectSocio-economic Impact Assessment Appendix 17A: Terrain and Soil Data
December 2006
Page 17A-49
Table 17A-12: Physical and Chemical Properties from Site 144 (cont’d)
Horizon
Depth (cm)
pH (Saturated Paste)
Electrical Conductivity (dS/m at 25◦)
Saturation (%)
Sodium Adsorption
Ratio
Base Saturatio
n (%)
Ap 0-34 6.1 0.21 49 0.6 86 Ae 34-47 6.7 0.58 33 1.7 110 Btnjgj 47-51 6.1 1.8 36 2.5 108 IIAegj 51-60 6.8 0.2 32 1.6 100 IIBnjtg 60-80 6.2 0.29 39 2.5 95 IIBCkg 80-90 6.1 0.3 38 2.8 98 IIICg 90-120 6.8 1.16 47 1.8 135 Ap 0-34 19.2 13.4 2.87 0.15 0.2 Ae 34-47 3.18 2.11 1.1 0.2 0.1 Btnjgj 47-51 9.54 6.19 3.37 0.52 0.2 IIAegj 51-60 2.7 1.7 0.81 0.12 0.09 Bnjtg 60-80 15.7 8.97 5.16 0.47 0.4 BCkg 80-90 16.1 9.48 5.52 0.46 0.3 IIICg 90-120 12.1 10.2 5.42 0.49 0.3
NOTE:
– no data
Table 17A-13: Soil Series DUG – Site and Soil Characteristics from Site 155 Characteristic Value
Classification Black Solonetz Parent Material Glacial Lacustrine overlying Till Surface Expression Undulating Slope Gradient (%) 2 Drainage Regime Moderately Well Typical Topsoil Depth (cm) 23 Erosion Hazard Slight Surface Stoniness (%) <0.01 Coarse Fragment Content (%) 0-1 Colour Change Poor
Sturgeon Upgrader Project Volume 2: Environmental and Appendix 17A: Terrain and Soil Data Socio-economic Impact Assessment
December 2006 Page 17A-50
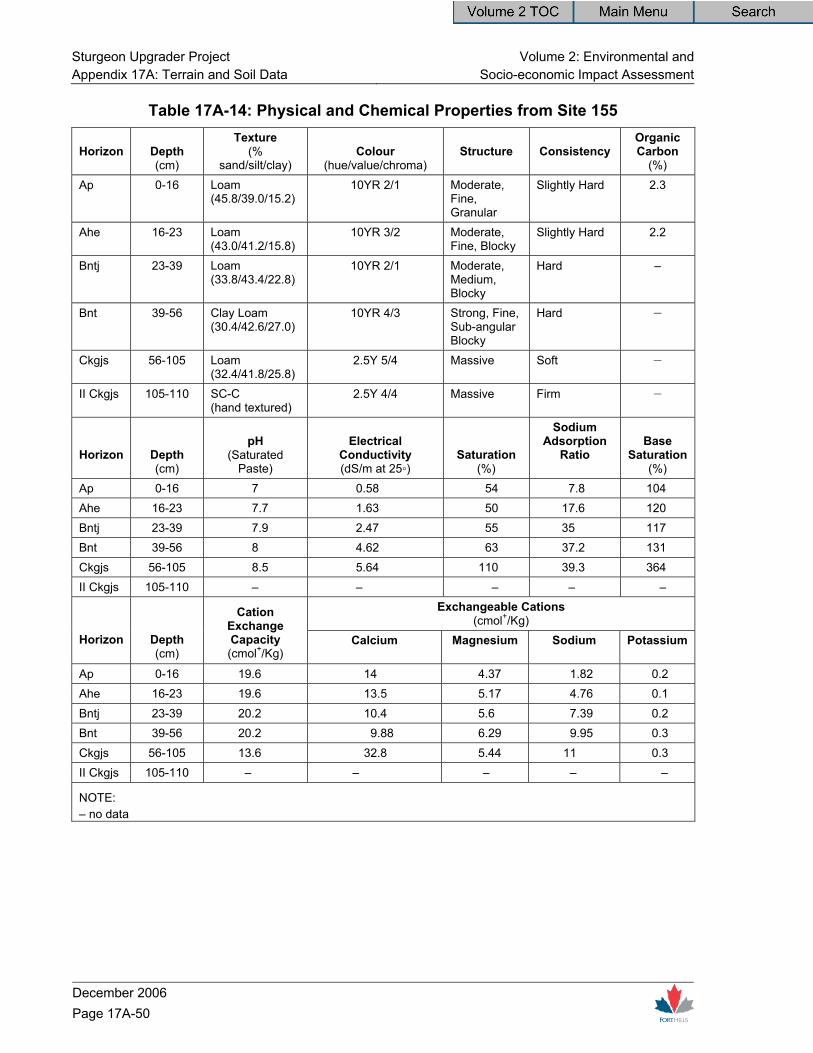
Table 17A-14: Physical and Chemical Properties from Site 155
Horizon
Depth (cm)
Texture (%
sand/silt/clay) Colour
(hue/value/chroma) Structure
Consistency
Organic Carbon
(%) Ap 0-16 Loam
(45.8/39.0/15.2) 10YR 2/1 Moderate,
Fine, Granular
Slightly Hard 2.3
Ahe 16-23 Loam (43.0/41.2/15.8)
10YR 3/2 Moderate, Fine, Blocky
Slightly Hard 2.2
Bntj 23-39 Loam (33.8/43.4/22.8)
10YR 2/1 Moderate, Medium, Blocky
Hard –
Bnt 39-56 Clay Loam (30.4/42.6/27.0)
10YR 4/3 Strong, Fine, Sub-angular Blocky
Hard –
Ckgjs 56-105 Loam (32.4/41.8/25.8)
2.5Y 5/4 Massive Soft –
II Ckgjs 105-110 SC-C (hand textured)
2.5Y 4/4 Massive Firm –
Horizon
Depth (cm)
pH (Saturated
Paste)
Electrical Conductivity (dS/m at 25◦)
Saturation (%)
Sodium Adsorption
Ratio
Base Saturation
(%) Ap 0-16 7 0.58 54 7.8 104 Ahe 16-23 7.7 1.63 50 17.6 120 Bntj 23-39 7.9 2.47 55 35 117 Bnt 39-56 8 4.62 63 37.2 131 Ckgjs 56-105 8.5 5.64 110 39.3 364 II Ckgjs 105-110 – – – – –
Exchangeable Cations (cmol+/Kg)
Horizon
Depth (cm)
Cation Exchange Capacity (cmol+/Kg)
Calcium
Magnesium
Sodium
Potassium
Ap 0-16 19.6 14 4.37 1.82 0.2 Ahe 16-23 19.6 13.5 5.17 4.76 0.1 Bntj 23-39 20.2 10.4 5.6 7.39 0.2 Bnt 39-56 20.2 9.88 6.29 9.95 0.3 Ckgjs 56-105 13.6 32.8 5.44 11 0.3 II Ckgjs 105-110 – – – – –
NOTE: – no data

Volume 2: Environmental and Sturgeon Upgrader ProjectSocio-economic Impact Assessment Appendix 17A: Terrain and Soil Data
December 2006
Page 17A-51
Table 17A-15: Soil Series MPV-aa – Site and Soil Characteristics from Site 176 Characteristic Value
Classification Humic Luvic Gleysol Parent Material Glacial Till Surface Expression Undulating Slope Gradient (%) 1 Drainage Regime Imperfectly Typical Topsoil Depth (cm) 24 Erosion Hazard Wind: Low, Water: Severe Surface Stoniness (%) 0.01-0.1 Coarse Fragment Content (%) 0-2 Colour Change Good
Table 17A-16: Physical and Chemical Properties from Site 176
Horizon
Depth (cm)
Texture (% sand/silt/clay)
Colour (hue/value/chroma)
Structure
Consistency
Organic Carbon
(%) Ap 0-24 Loam
(46.4/37.0/16.6) 10YR 2/1 Moderate,
Medium, Granular
Friable 2.1
Aeg 24-40 Loam (45.4/41.2/13.4)
10YR 6/1 Moderate, Coarse, Platy
Friable 0.4
Btgj 40-90 Sandy Clay Loam (46.4/25.2/28.4)
10YR 6/1 Moderate, Medium, Sub-angular Blocky
Friable –
Cg 90-100 Sandy Clay Loam (55.6/22.2/22.2)
10YR 4/2 Massive Firm –
Horizon
Depth (cm)
pH (Saturated Paste)
Electrical Conductivity (dS/m at 25◦)
Saturation (%)
Sodium Adsorption
Ratio
Base Saturation
(%) Ap 0-24 5.5 0.36 44 0.2 80 Aeg 24-40 6.4 0.36 29 0.2 68 Btgj 40-90 6.6 0.25 37 0.3 82 Cg 90-100 6.8 0.16 37 0.4 64
Exchangeable Cations (cmol+/Kg)
Horizon
Depth (cm)
Cation Exchange Capacity (cmol+/Kg)
Calcium
Magnesium
Sodium
Potassium
Ap 0-24 16.9 11.6 1.6 0.06 0.3 Aeg 24-40 7.71 4 1 0.06 0.2 Btgj 40-90 18.6 10 4.82 0.087 0.3 Cg 90-100 15.9 6.77 3.16 0.094 0.2
NOTE: – no data

Sturgeon Upgrader Project Volume 2: Environmental and Appendix 17A: Terrain and Soil Data Socio-economic Impact Assessment
December 2006 Page 17A-52
Table 17A-17: Soil Series HRL-ztxt – Site and Soil Characteristics from Site 179 Characteristic Value
Classification Solonetzic Humic Gleysol Parent Material Glacial Lacustrine overlying Glacial Till Surface Expression Undulating Slope Gradient (%) 1 Drainage Regime Poorly Typical Topsoil Depth (cm) 23 Erosion Hazard Slight Surface Stoniness (%) <0.01 Coarse Fragment Content (%) 0-2 Colour Change Good
Table 17A-18: Physical and Chemical Properties from Site 179
Horizon
Depth (cm)
Texture (%
sand/silt/clay) Colour
(hue/value/chroma) Structure
Consistency
Organic Carbon
(%) Ap 0-23 47.0/36.4/16.6 10YR 2/1 Strong, Coarse,
Granular Soft 2.3
Aeg 23-35 49.4/38.0/12.6 2.5Y 6/2 Strong, Medium, Platy
Soft 1.0
Bnjtg 35-54 50.8/27.8/21.4 10YR 3/2 Strong, Fine, Blocky
Soft –
Cgs 54-110 31.4/44.2/24.4 2.5Y 6/1 Massive Firm – IICgs 110-120 47.27.0/26.0 2.5 Y 4/2 Massive Firm –
Horizon
Depth (cm)
pH (Saturated
Paste)
Electrical Conductivity (dS/m at 25◦)
Saturation (%)
Sodium Adsorption
Ratio
Base Saturation
(%) Ap 0-23 6.3 0.18 47 0.4 98 Aeg 23-35 7.1 0.15 32 1 111 Bnjtg 35-54 6.8 0.18 38 1.3 103 Cgs 54-110 6.7 0.34 44 6.8 103 IICgs 110-120 6.8 0.35 43 8.9 103
Exchangeable Cations (cmol+/Kg)
Horizon
Depth (cm)
Cation Exchange Capacity (cmol+/Kg)
Calcium
Magnesium
Sodium
Potassium
Ap 0-23 21 16.6 3.72 0.12 0.2 Aeg 23-35 6.19 4.97 1.67 0.12 0.1 Bnjtg 35-54 14 9.54 4.48 0.23 0.2 Cgs 54-110 15.2 10 4.56 0.873 0.2 IICgs 110-120 15.1 10.1 4.33 0.883 0.2
NOTE: – no data
Volume 2: Environmental and Sturgeon Upgrader ProjectSocio-economic Impact Assessment Appendix 17A: Terrain and Soil Data
December 2006
Page 17A-53
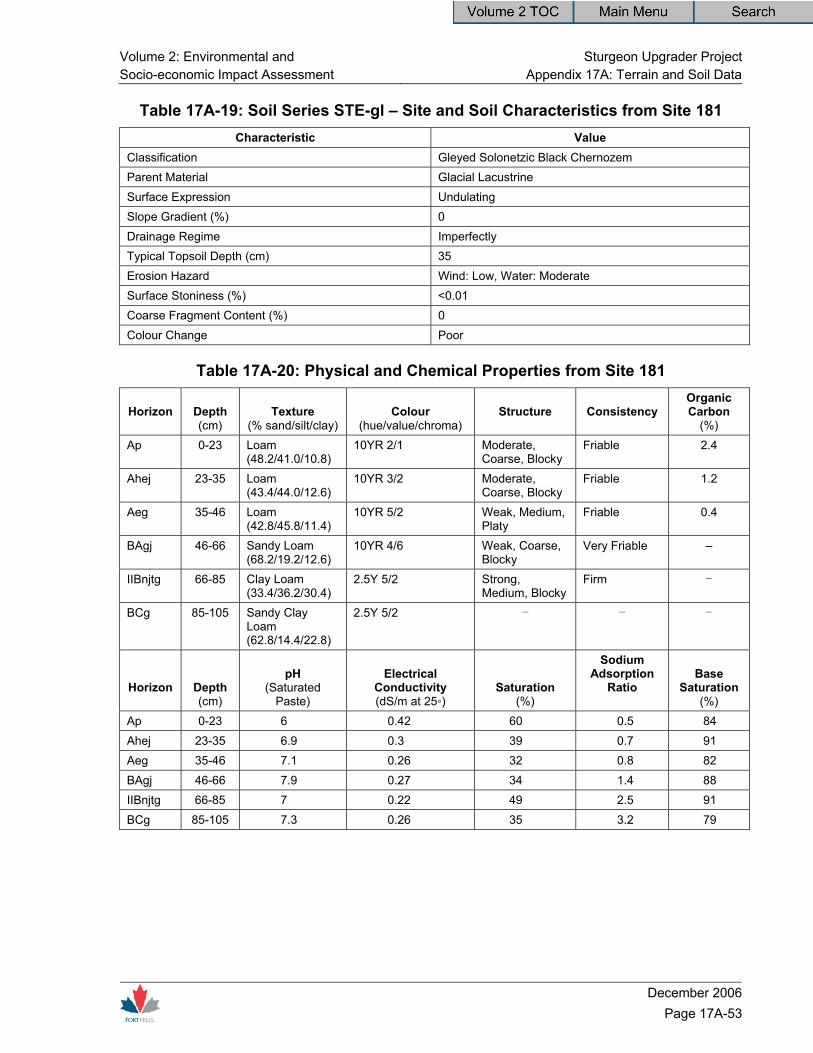
Table 17A-19: Soil Series STE-gl – Site and Soil Characteristics from Site 181 Characteristic Value
Classification Gleyed Solonetzic Black Chernozem Parent Material Glacial Lacustrine Surface Expression Undulating Slope Gradient (%) 0 Drainage Regime Imperfectly Typical Topsoil Depth (cm) 35 Erosion Hazard Wind: Low, Water: Moderate Surface Stoniness (%) <0.01 Coarse Fragment Content (%) 0 Colour Change Poor
Table 17A-20: Physical and Chemical Properties from Site 181
Horizon
Depth (cm)
Texture (% sand/silt/clay)
Colour (hue/value/chroma)
Structure
Consistency
Organic Carbon
(%) Ap 0-23 Loam
(48.2/41.0/10.8) 10YR 2/1 Moderate,
Coarse, Blocky Friable 2.4
Ahej 23-35 Loam (43.4/44.0/12.6)
10YR 3/2 Moderate, Coarse, Blocky
Friable 1.2
Aeg 35-46 Loam (42.8/45.8/11.4)
10YR 5/2 Weak, Medium, Platy
Friable 0.4
BAgj 46-66 Sandy Loam (68.2/19.2/12.6)
10YR 4/6 Weak, Coarse, Blocky
Very Friable –
IIBnjtg 66-85 Clay Loam (33.4/36.2/30.4)
2.5Y 5/2 Strong, Medium, Blocky
Firm –
BCg 85-105 Sandy Clay Loam (62.8/14.4/22.8)
2.5Y 5/2 – – –
Horizon
Depth (cm)
pH (Saturated
Paste)
Electrical Conductivity (dS/m at 25◦)
Saturation (%)
Sodium Adsorption
Ratio
Base Saturation
(%) Ap 0-23 6 0.42 60 0.5 84 Ahej 23-35 6.9 0.3 39 0.7 91 Aeg 35-46 7.1 0.26 32 0.8 82 BAgj 46-66 7.9 0.27 34 1.4 88 IIBnjtg 66-85 7 0.22 49 2.5 91 BCg 85-105 7.3 0.26 35 3.2 79
Sturgeon Upgrader Project Volume 2: Environmental and Appendix 17A: Terrain and Soil Data Socio-economic Impact Assessment
December 2006 Page 17A-54
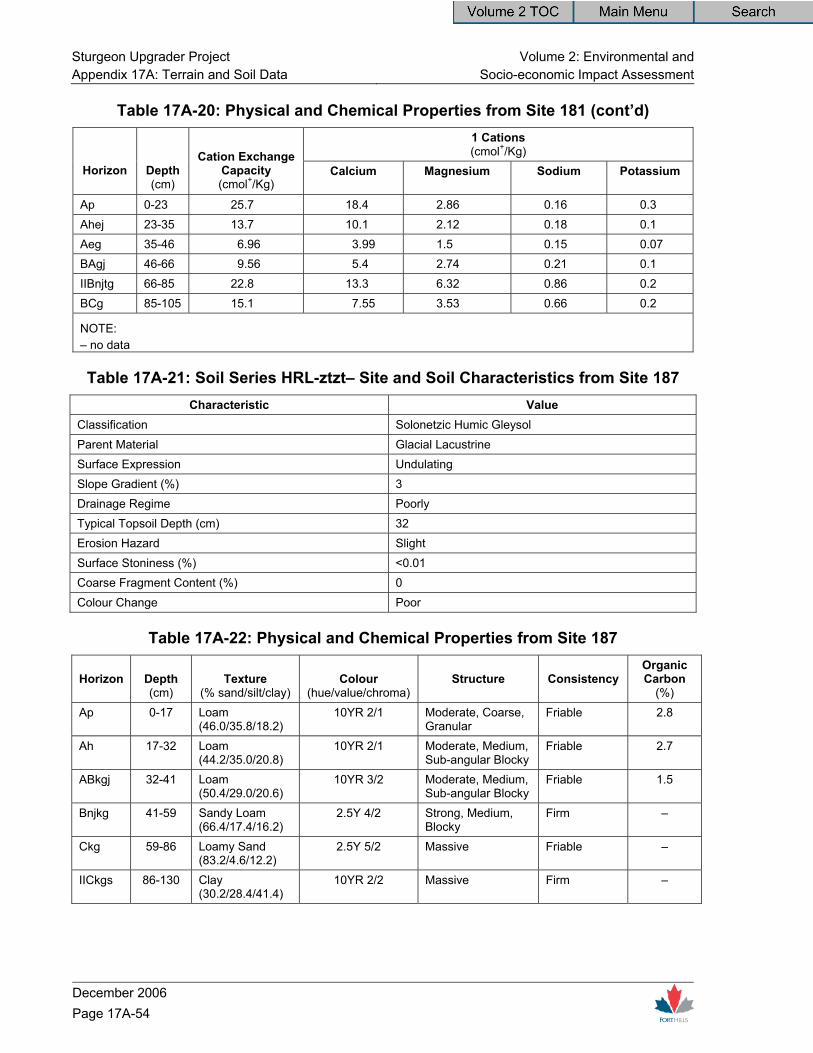
Table 17A-20: Physical and Chemical Properties from Site 181 (cont’d) 1 Cations (cmol+/Kg)
Horizon
Depth (cm)
Cation Exchange Capacity (cmol+/Kg)
Calcium
Magnesium
Sodium
Potassium
Ap 0-23 25.7 18.4 2.86 0.16 0.3 Ahej 23-35 13.7 10.1 2.12 0.18 0.1 Aeg 35-46 6.96 3.99 1.5 0.15 0.07 BAgj 46-66 9.56 5.4 2.74 0.21 0.1 IIBnjtg 66-85 22.8 13.3 6.32 0.86 0.2 BCg 85-105 15.1 7.55 3.53 0.66 0.2
NOTE: – no data
Table 17A-21: Soil Series HRL-ztzt– Site and Soil Characteristics from Site 187 Characteristic Value
Classification Solonetzic Humic Gleysol Parent Material Glacial Lacustrine Surface Expression Undulating Slope Gradient (%) 3 Drainage Regime Poorly Typical Topsoil Depth (cm) 32 Erosion Hazard Slight Surface Stoniness (%) <0.01 Coarse Fragment Content (%) 0 Colour Change Poor
Table 17A-22: Physical and Chemical Properties from Site 187
Horizon
Depth (cm)
Texture (% sand/silt/clay)
Colour (hue/value/chroma)
Structure
Consistency
Organic Carbon
(%) Ap 0-17 Loam
(46.0/35.8/18.2) 10YR 2/1 Moderate, Coarse,
Granular Friable 2.8
Ah 17-32 Loam (44.2/35.0/20.8)
10YR 2/1 Moderate, Medium, Sub-angular Blocky
Friable 2.7
ABkgj 32-41 Loam (50.4/29.0/20.6)
10YR 3/2 Moderate, Medium, Sub-angular Blocky
Friable 1.5
Bnjkg 41-59 Sandy Loam (66.4/17.4/16.2)
2.5Y 4/2 Strong, Medium, Blocky
Firm –
Ckg 59-86 Loamy Sand (83.2/4.6/12.2)
2.5Y 5/2 Massive Friable –
IICkgs 86-130 Clay (30.2/28.4/41.4)
10YR 2/2 Massive Firm –

Volume 2: Environmental and Sturgeon Upgrader ProjectSocio-economic Impact Assessment Appendix 17A: Terrain and Soil Data
December 2006
Page 17A-55
Table 17A-22: Physical and Chemical Properties from Site 187 (cont’d)
Horizon
Depth (cm)
pH (Saturated Paste)
Electrical Conductivity (dS/m at 25◦)
Saturation (%)
Sodium Adsorption
Ratio
Base Saturation
(%) Ap 0-17 6.3 0.3 52 1.1 93 Ah 17-32 7.3 0.65 49 2.5 120 ABkgj 32-41 7.9 0.51 41 6.6 190 Bnjkg 41-59 8.3 0.67 35 19 249 Ckg 59-86 8.6 0.8 44 13.1 178 IICkgs 86-130 8.5 1.66 113 30.1 206
Exchangeable Cations (cmol+/Kg)
Horizon
Depth (cm)
Cation Exchange Capacity (cmol+/Kg)
Calcium
Magnesium
Sodium
Potassium
Ap 0-17 22.8 16.2 4.09 0.27 0.52 Ah 17-32 27.5 26.6 5.52 0.78 0.1 ABkgj 32-41 19.1 30 5.03 1.07 0.1 Bnjkg 41-59 11.5 23.4 3.49 1.64 0.1 Ckg 59-86 8.79 11 2.53 2.02 0.09 IICkgs 86-130 22.4 30.9 6.33 8.52 0.3
NOTE: – no data
Table 17A-23: Soil Series CSN-aa – Site and Soil Characteristics from Site 196 Characteristic Value
Classification Orthic Melanic Brunisol Parent Material Glacial Fluvial overlying Glacial Till Surface Expression Undulating Slope Gradient (%) 3 Drainage Regime Moderately Well Typical Topsoil Depth (cm) 26 Erosion Hazard Slight Surface Stoniness (%) 0.01-0.1 Coarse Fragment Content (%) 1-2 Colour Change Fair

Sturgeon Upgrader Project Volume 2: Environmental and Appendix 17A: Terrain and Soil Data Socio-economic Impact Assessment
December 2006 Page 17A-56
Table 17A-24: Physical and Chemical Properties from Site 196
Horizon
Depth (cm)
Texture (% sand/silt/clay)
Colour (hue/value/chroma)
Structure
Consistency
Organic Carbon
(%) Ap 0-26 Sandy Loam
(66.4/21.0/12.6) 10YR 2/1 Moderate,
Medium, Granular
Friable 2.3
Bm 26-37 Sandy Loam (68.0/19.0/13.0)
10YR 3/3 Moderate, Medium, Sub-angular Blocky
Friable 1.0
Bgj 37-62 Sandy Loam (76.4/12.4/11.2)
10YR 4/4 – Friable –
II Cgj 62-92 Sandy Clay Loam (47.0/28.0/25.0)
10YR 3/1 – Friable –
Ckg 92-105 Sandy Clay Loam (49.6/26.6/23.8)
10YR 5/2 Moderate, Medium, Platy
Firm –
Horizon
Depth (cm)
pH (Saturated Paste)
Electrical Conductivity (dS/m at 25)
Saturation (%)
Sodium Adsorption
Ratio
Base Saturation
(%) Ap 0-26 5.5 0.74 40 0.1 35 Bm 26-37 7.1 0.28 34 0.2 51 Bgj 37-62 7.3 0.18 35 0.2 37 II Cgj 62-92 7.4 0.24 36 0.3 54 Ckg 92-105 7.9 0.33 36 0.2 259
Exchangeable Cations (cmol+/Kg)
Horizon
Depth (cm)
Cation Exchange Capacity
(cmol+/Kg) Calcium
Magnesium
Sodium
Potassium
Ap 0-26 37.2 11.9 1 0.05 0.2 Bm 26-37 20.4 9.15 1.2 0.05 0.2 Bgj 37-62 19 5.87 1.1 0.05 0.1 II Cgj 62-92 26.2 11.5 2.34 0.05 0.3 IICkg 92-105 9.73 22.6 2.3 0.11 0.2
NOTE: – no data
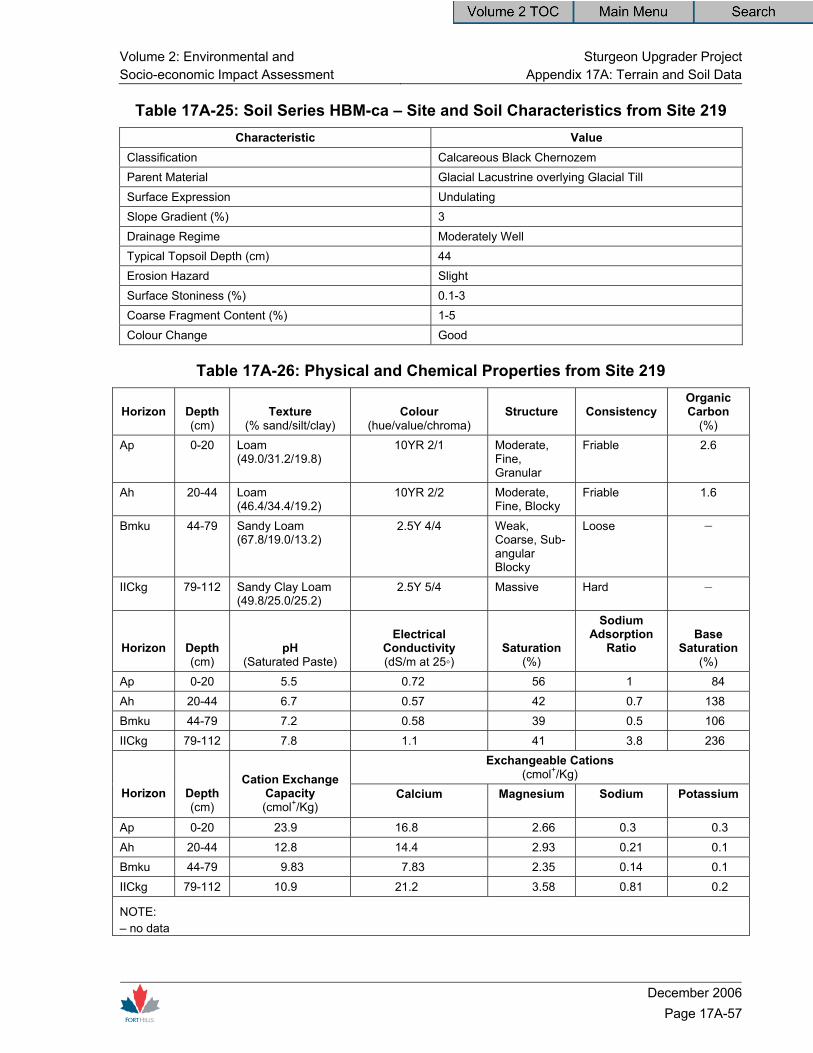
Volume 2: Environmental and Sturgeon Upgrader ProjectSocio-economic Impact Assessment Appendix 17A: Terrain and Soil Data
December 2006
Page 17A-57
Table 17A-25: Soil Series HBM-ca – Site and Soil Characteristics from Site 219 Characteristic Value
Classification Calcareous Black Chernozem Parent Material Glacial Lacustrine overlying Glacial Till Surface Expression Undulating Slope Gradient (%) 3 Drainage Regime Moderately Well Typical Topsoil Depth (cm) 44 Erosion Hazard Slight Surface Stoniness (%) 0.1-3 Coarse Fragment Content (%) 1-5 Colour Change Good
Table 17A-26: Physical and Chemical Properties from Site 219
Horizon
Depth (cm)
Texture (% sand/silt/clay)
Colour (hue/value/chroma)
Structure
Consistency
Organic Carbon
(%) Ap 0-20 Loam
(49.0/31.2/19.8) 10YR 2/1 Moderate,
Fine, Granular
Friable 2.6
Ah 20-44 Loam (46.4/34.4/19.2)
10YR 2/2 Moderate, Fine, Blocky
Friable 1.6
Bmku 44-79 Sandy Loam (67.8/19.0/13.2)
2.5Y 4/4 Weak, Coarse, Sub-angular Blocky
Loose –
IICkg 79-112 Sandy Clay Loam (49.8/25.0/25.2)
2.5Y 5/4 Massive Hard –
Horizon
Depth (cm)
pH (Saturated Paste)
Electrical Conductivity (dS/m at 25◦)
Saturation (%)
Sodium Adsorption
Ratio
Base Saturation
(%) Ap 0-20 5.5 0.72 56 1 84 Ah 20-44 6.7 0.57 42 0.7 138 Bmku 44-79 7.2 0.58 39 0.5 106 IICkg 79-112 7.8 1.1 41 3.8 236
Exchangeable Cations (cmol+/Kg)
Horizon
Depth (cm)
Cation Exchange Capacity (cmol+/Kg)
Calcium
Magnesium
Sodium
Potassium
Ap 0-20 23.9 16.8 2.66 0.3 0.3 Ah 20-44 12.8 14.4 2.93 0.21 0.1 Bmku 44-79 9.83 7.83 2.35 0.14 0.1 IICkg 79-112 10.9 21.2 3.58 0.81 0.2
NOTE: – no data

Sturgeon Upgrader Project Volume 2: Environmental and Appendix 17A: Terrain and Soil Data Socio-economic Impact Assessment
December 2006 Page 17A-58
Table 17A-27: Soil Series NRM-gl – Site and Soil Characteristics from Site 224 Characteristic Value
Classification Gleyed Solonetzic Black Chernozem Parent Material Glacial Till Surface Expression Undulating Slope Gradient (%) 2 Drainage Regime Imperfectly Typical Topsoil Depth (cm) 32 Erosion Hazard Wind: High, Water: Low Surface Stoniness (%) 0.01/0.1 Coarse Fragment Content (%) 2-10 Colour Change Good
Table 17A-28: Physical and Chemical Properties from Site 224
Horizon
Depth (cm)
Texture (% sand/silt/clay)
Colour (hue/value/chroma)
Structure
Consistency
Organic Carbon
(%) Ap 0-24 Loam
(48.4/36.8/14.8) 10YR 2/1 Weak, Medium,
Granular Friable 2.3
Ah 24-32 Loam (43.8/42.0/14.2)
10YR 2/1 Moderate, Medium, Sub-angular Blocky
Friable 2.2
Ae 32-42 Sandy Loam (58.0/30.6/11.4)
10YR 5/2 Moderate, Fine, Platy
Friable 0.3
Bnjtgj 42-65 Clay Loam (44.4/21.2/34.4)
10YR 3/2.5 Strong, Fine, Sub-angular Blocky
Firm –
Ckg 65-110 Sandy Clay Loam (50.8/23.2/26.0)
2.5Y 4/2 Massive Very Firm –
Horizon
Depth (cm)
pH (Saturated Paste)
Electrical Conductivity (dS/m at 25◦)
Saturation (%)
Sodium Adsorption
Ratio
Base Saturation
(%) Ap 0-24 7.4 0.95 57 0.3 134 Ah 24-32 7.3 0.88 53 0.9 112 Ae 32-42 7.5 0.57 32 1.6 120 Bnjtgj 42-65 7.2 0.45 48 3.3 92 Ckg 65-110 7.8 0.74 46 7.8 109

Volume 2: Environmental and Sturgeon Upgrader ProjectSocio-economic Impact Assessment Appendix 17A: Terrain and Soil Data
December 2006
Page 17A-59
Table 17A-28: Physical and Chemical Properties from Site 224 (cont’d) Exchangeable Cations
(cmol+/Kg) Horizon
Depth (cm)
Cation Exchange Capacity (cmol+/Kg)
Calcium
Magnesium Sodium
Potassium
Ap 0-24 24.5 28.6 3.41 0.13 0.55 Ah 24-32 21.5 19.9 3.67 0.32 0.2 Ae 32-42 4.74 4.12 1.2 0.2 0.06 Bnjtgj 42-65 24.6 14.8 6.51 1.06 0.3 Ckg 65-110 15.3 10 4.82 1.58 0.3
NOTE: – no data
Table 17A-29: Soil Series WKN-gl – Site and Soil Characteristics from Site 244 Characteristic Value
Classification Gleyed Black Solodized Solonetz Parent Material Glacial Lacustrine Surface Expression Undulating Slope Gradient (%) 0 Drainage Regime Imperfectly Typical Topsoil Depth (cm) 20 Erosion Hazard Slight Surface Stoniness (%) <0.01 Coarse Fragment Content (%) 0 Colour Change Good
Table 17A-30: Physical and Chemical Properties from Site 244
Horizon
Depth (cm)
Texture (% sand/silt/clay)
Colour (hue/value/chroma)
Structure
Consistency
Organic Carbon
(%) Ap 0-18 Loam
(45.4/35.8/18.8) 10YR 3/1 Moderate,
Coarse, Blocky Friable 2.0
Aejgj 18-20 Loam (47.8/41.4/10.8)
10YR 5/2 Weak, Fine, Platy
Friable 0.5
Bntgj 20-42 Sandy Clay Loam (45.4/26.4/28.2)
10YR 3/1 Strong, Medium, Columnar
Friable –
BCgj 42-67 Sandy Clay Loam (52.2/24.4/23.4)
10YR 4/1.5 Weak, Coarse, Blocky
Friable –
Csg 67-100 Clay Loam (36.8/32.6/30.6)
10YR 4/1 Massive Firm –
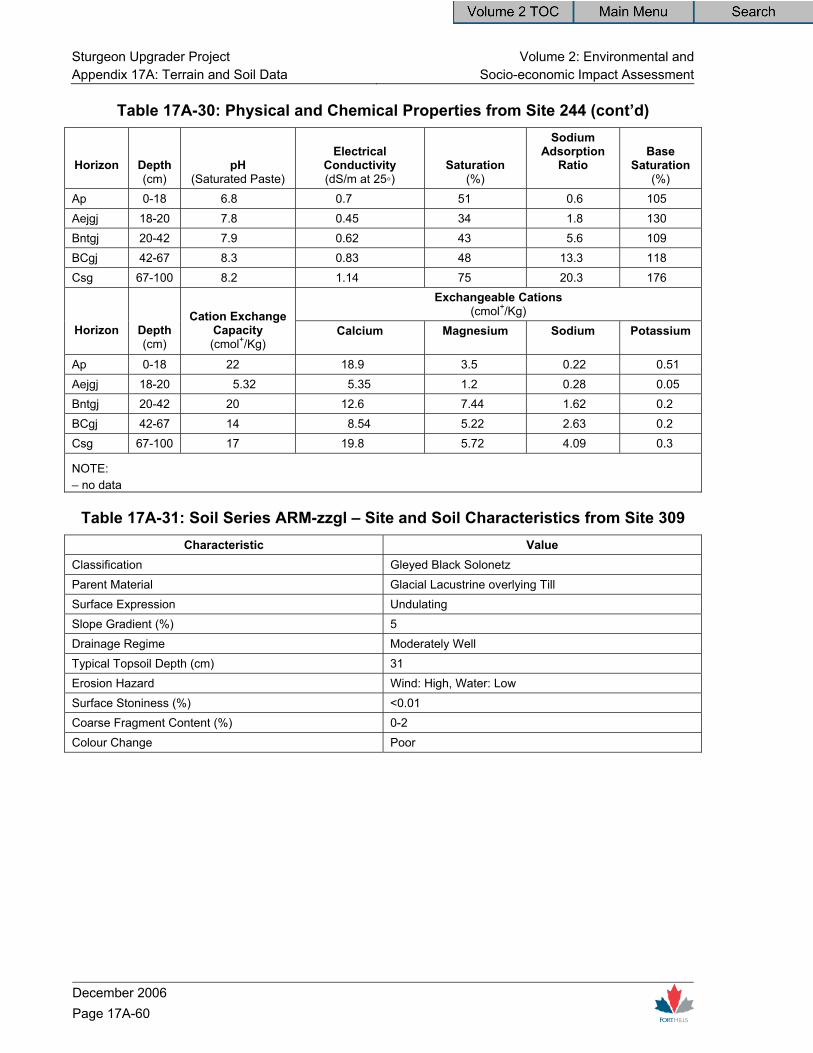
Sturgeon Upgrader Project Volume 2: Environmental and Appendix 17A: Terrain and Soil Data Socio-economic Impact Assessment
December 2006 Page 17A-60
Table 17A-30: Physical and Chemical Properties from Site 244 (cont’d)
Horizon
Depth (cm)
pH (Saturated Paste)
Electrical Conductivity (dS/m at 25◦)
Saturation (%)
Sodium Adsorption
Ratio
Base Saturation
(%) Ap 0-18 6.8 0.7 51 0.6 105 Aejgj 18-20 7.8 0.45 34 1.8 130 Bntgj 20-42 7.9 0.62 43 5.6 109 BCgj 42-67 8.3 0.83 48 13.3 118 Csg 67-100 8.2 1.14 75 20.3 176
Exchangeable Cations (cmol+/Kg)
Horizon
Depth (cm)
Cation Exchange Capacity (cmol+/Kg)
Calcium
Magnesium
Sodium
Potassium
Ap 0-18 22 18.9 3.5 0.22 0.51 Aejgj 18-20 5.32 5.35 1.2 0.28 0.05 Bntgj 20-42 20 12.6 7.44 1.62 0.2 BCgj 42-67 14 8.54 5.22 2.63 0.2 Csg 67-100 17 19.8 5.72 4.09 0.3
NOTE: – no data
Table 17A-31: Soil Series ARM-zzgl – Site and Soil Characteristics from Site 309 Characteristic Value
Classification Gleyed Black Solonetz Parent Material Glacial Lacustrine overlying Till Surface Expression Undulating Slope Gradient (%) 5 Drainage Regime Moderately Well Typical Topsoil Depth (cm) 31 Erosion Hazard Wind: High, Water: Low Surface Stoniness (%) <0.01 Coarse Fragment Content (%) 0-2 Colour Change Poor
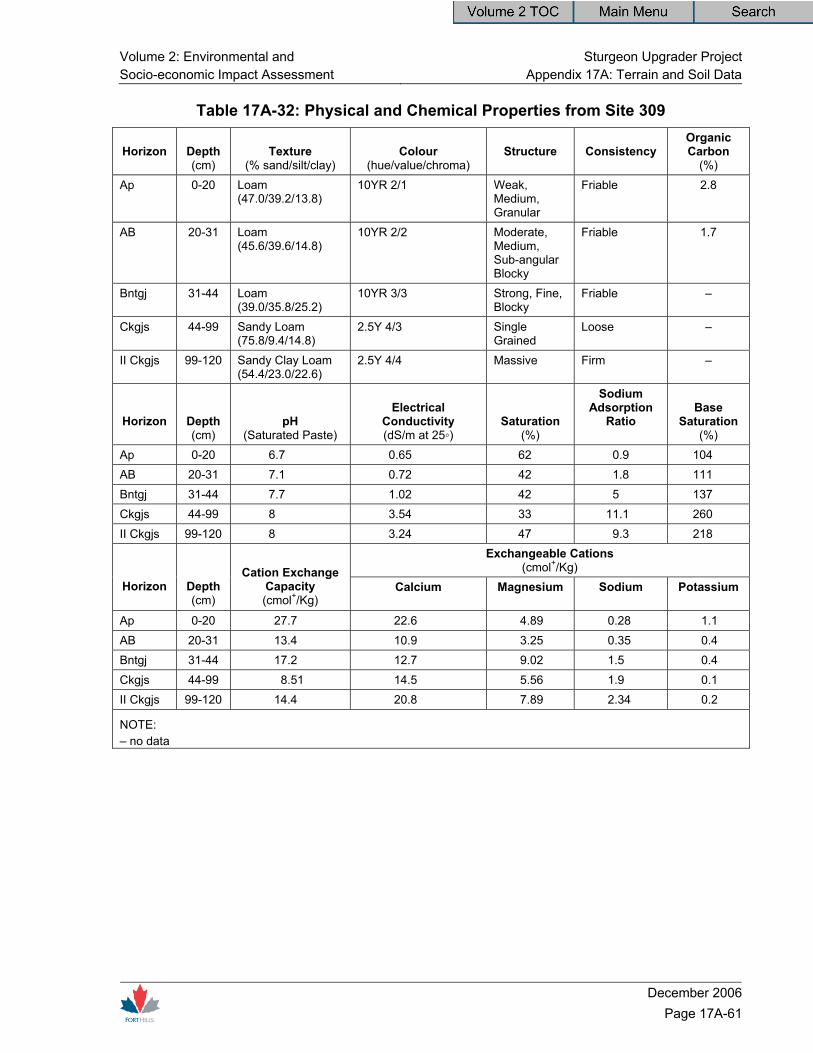
Volume 2: Environmental and Sturgeon Upgrader ProjectSocio-economic Impact Assessment Appendix 17A: Terrain and Soil Data
December 2006
Page 17A-61
Table 17A-32: Physical and Chemical Properties from Site 309
Horizon
Depth (cm)
Texture (% sand/silt/clay)
Colour (hue/value/chroma)
Structure
Consistency
Organic Carbon
(%) Ap 0-20 Loam
(47.0/39.2/13.8) 10YR 2/1 Weak,
Medium, Granular
Friable 2.8
AB 20-31 Loam (45.6/39.6/14.8)
10YR 2/2 Moderate, Medium, Sub-angular Blocky
Friable 1.7
Bntgj 31-44 Loam (39.0/35.8/25.2)
10YR 3/3 Strong, Fine, Blocky
Friable –
Ckgjs 44-99 Sandy Loam (75.8/9.4/14.8)
2.5Y 4/3 Single Grained
Loose –
II Ckgjs 99-120 Sandy Clay Loam (54.4/23.0/22.6)
2.5Y 4/4 Massive Firm –
Horizon
Depth (cm)
pH (Saturated Paste)
Electrical Conductivity (dS/m at 25◦)
Saturation (%)
Sodium Adsorption
Ratio
Base Saturation
(%) Ap 0-20 6.7 0.65 62 0.9 104 AB 20-31 7.1 0.72 42 1.8 111 Bntgj 31-44 7.7 1.02 42 5 137 Ckgjs 44-99 8 3.54 33 11.1 260 II Ckgjs 99-120 8 3.24 47 9.3 218
Exchangeable Cations (cmol+/Kg)
Horizon
Depth (cm)
Cation Exchange Capacity (cmol+/Kg)
Calcium
Magnesium
Sodium
Potassium
Ap 0-20 27.7 22.6 4.89 0.28 1.1 AB 20-31 13.4 10.9 3.25 0.35 0.4 Bntgj 31-44 17.2 12.7 9.02 1.5 0.4 Ckgjs 44-99 8.51 14.5 5.56 1.9 0.1 II Ckgjs 99-120 14.4 20.8 7.89 2.34 0.2
NOTE: – no data
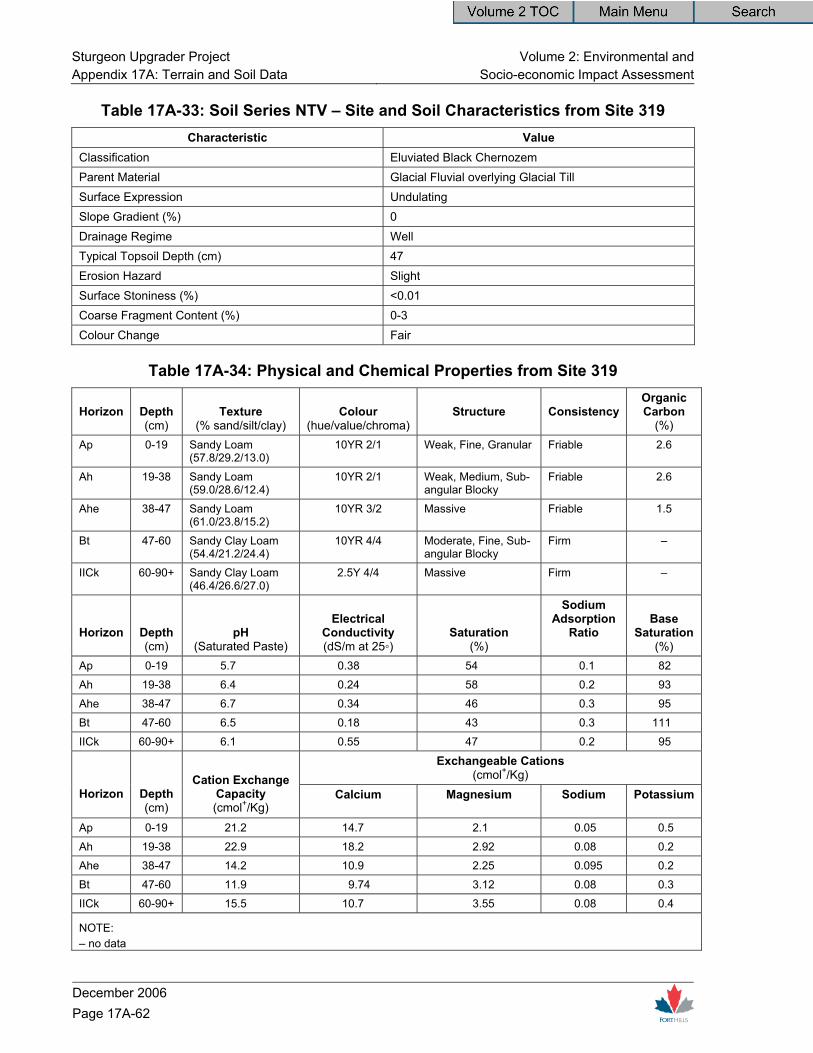
Sturgeon Upgrader Project Volume 2: Environmental and Appendix 17A: Terrain and Soil Data Socio-economic Impact Assessment
December 2006 Page 17A-62
Table 17A-33: Soil Series NTV – Site and Soil Characteristics from Site 319 Characteristic Value
Classification Eluviated Black Chernozem Parent Material Glacial Fluvial overlying Glacial Till Surface Expression Undulating Slope Gradient (%) 0 Drainage Regime Well Typical Topsoil Depth (cm) 47 Erosion Hazard Slight Surface Stoniness (%) <0.01 Coarse Fragment Content (%) 0-3 Colour Change Fair
Table 17A-34: Physical and Chemical Properties from Site 319
Horizon
Depth (cm)
Texture (% sand/silt/clay)
Colour (hue/value/chroma)
Structure
Consistency
Organic Carbon
(%) Ap 0-19 Sandy Loam
(57.8/29.2/13.0) 10YR 2/1 Weak, Fine, Granular Friable 2.6
Ah 19-38 Sandy Loam (59.0/28.6/12.4)
10YR 2/1 Weak, Medium, Sub-angular Blocky
Friable 2.6
Ahe 38-47 Sandy Loam (61.0/23.8/15.2)
10YR 3/2 Massive Friable 1.5
Bt 47-60 Sandy Clay Loam (54.4/21.2/24.4)
10YR 4/4 Moderate, Fine, Sub-angular Blocky
Firm –
IICk 60-90+ Sandy Clay Loam (46.4/26.6/27.0)
2.5Y 4/4 Massive Firm –
Horizon
Depth (cm)
pH (Saturated Paste)
Electrical Conductivity (dS/m at 25◦)
Saturation (%)
Sodium Adsorption
Ratio
Base Saturation
(%) Ap 0-19 5.7 0.38 54 0.1 82
Ah 19-38 6.4 0.24 58 0.2 93
Ahe 38-47 6.7 0.34 46 0.3 95
Bt 47-60 6.5 0.18 43 0.3 111
IICk 60-90+ 6.1 0.55 47 0.2 95
Exchangeable Cations (cmol+/Kg)
Horizon
Depth (cm)
Cation Exchange Capacity (cmol+/Kg)
Calcium
Magnesium
Sodium
Potassium
Ap 0-19 21.2 14.7 2.1 0.05 0.5
Ah 19-38 22.9 18.2 2.92 0.08 0.2
Ahe 38-47 14.2 10.9 2.25 0.095 0.2
Bt 47-60 11.9 9.74 3.12 0.08 0.3
IICk 60-90+ 15.5 10.7 3.55 0.08 0.4
NOTE: – no data
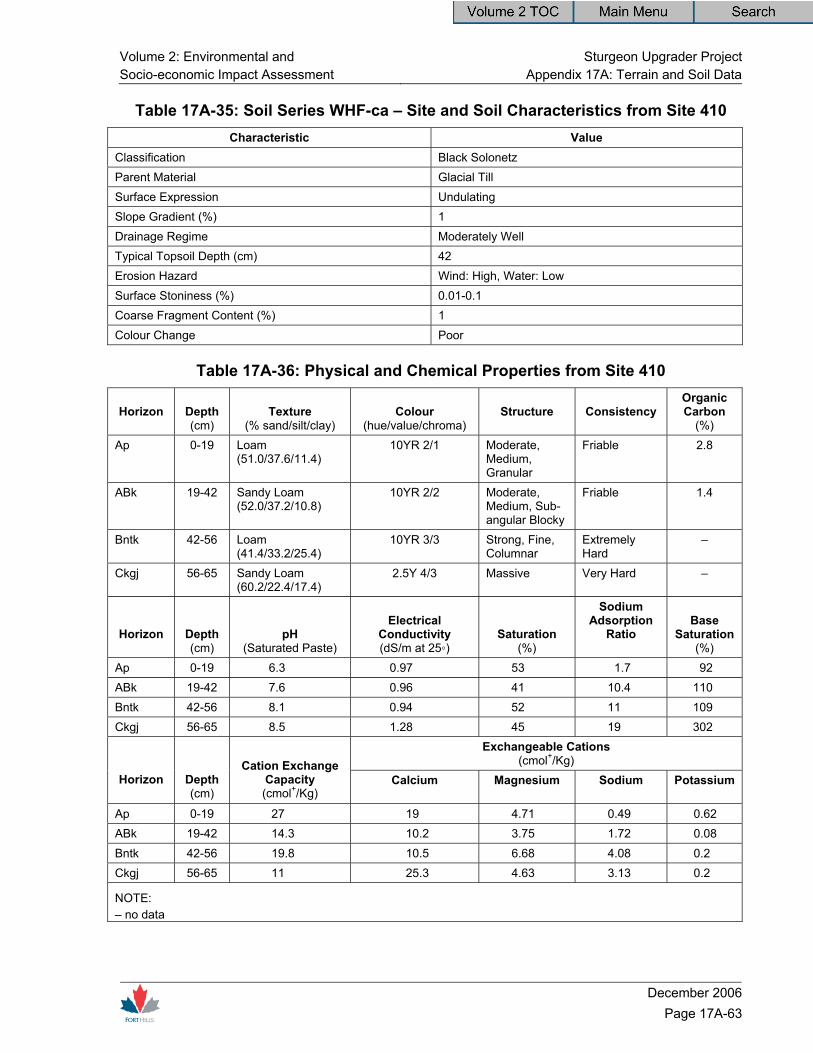
Volume 2: Environmental and Sturgeon Upgrader ProjectSocio-economic Impact Assessment Appendix 17A: Terrain and Soil Data
December 2006
Page 17A-63
Table 17A-35: Soil Series WHF-ca – Site and Soil Characteristics from Site 410 Characteristic Value
Classification Black Solonetz Parent Material Glacial Till Surface Expression Undulating Slope Gradient (%) 1 Drainage Regime Moderately Well Typical Topsoil Depth (cm) 42 Erosion Hazard Wind: High, Water: Low Surface Stoniness (%) 0.01-0.1 Coarse Fragment Content (%) 1 Colour Change Poor
Table 17A-36: Physical and Chemical Properties from Site 410
Horizon
Depth (cm)
Texture (% sand/silt/clay)
Colour (hue/value/chroma)
Structure
Consistency
Organic Carbon
(%) Ap 0-19 Loam
(51.0/37.6/11.4) 10YR 2/1 Moderate,
Medium, Granular
Friable 2.8
ABk 19-42 Sandy Loam (52.0/37.2/10.8)
10YR 2/2 Moderate, Medium, Sub-angular Blocky
Friable 1.4
Bntk 42-56 Loam (41.4/33.2/25.4)
10YR 3/3 Strong, Fine, Columnar
Extremely Hard
–
Ckgj 56-65 Sandy Loam (60.2/22.4/17.4)
2.5Y 4/3 Massive Very Hard –
Horizon
Depth (cm)
pH (Saturated Paste)
Electrical Conductivity (dS/m at 25◦)
Saturation (%)
Sodium Adsorption
Ratio
Base Saturation
(%) Ap 0-19 6.3 0.97 53 1.7 92 ABk 19-42 7.6 0.96 41 10.4 110 Bntk 42-56 8.1 0.94 52 11 109 Ckgj 56-65 8.5 1.28 45 19 302
Exchangeable Cations (cmol+/Kg)
Horizon
Depth (cm)
Cation Exchange Capacity (cmol+/Kg)
Calcium
Magnesium
Sodium
Potassium
Ap 0-19 27 19 4.71 0.49 0.62 ABk 19-42 14.3 10.2 3.75 1.72 0.08 Bntk 42-56 19.8 10.5 6.68 4.08 0.2 Ckgj 56-65 11 25.3 4.63 3.13 0.2
NOTE: – no data

Sturgeon Upgrader Project Volume 2: Environmental and Appendix 17A: Terrain and Soil Data Socio-economic Impact Assessment
December 2006 Page 17A-64
Table 17A-37: Soil Series STE-glca – Site and Soil Characteristics from Site 438 Characteristic Value
Classification Gleyed Solonetzic Black Chernozem Parent Material Glacial Lacustrine overlying Glacial Till Surface Expression Undulating Slope Gradient (%) 2 Drainage Regime Imperfectly Typical Topsoil Depth (cm) 20 Erosion Hazard Wind: Low, Water: Moderate Surface Stoniness (%) <0.01 Coarse Fragment Content (%) 0-1 Colour Change Poor
Table 17A-38: Physical and Chemical Properties from Site 438
Horizon
Depth (cm)
Texture (% sand/silt/clay)
Colour (hue/value/chroma)
Structure
Consistency
Organic Carbon
(%) Ah 0-20 Loam (43.6/38.0/18.4) 10YR 2/1 Weak, Fine,
Granular Friable 2.8
Bnjtk 20-34 Loam (43.4/32.2/24.4) 10YR 3/2 Moderate, Medium, Sub-angular Blocky
Friable –
Bkgj 34-64 Sandy Loam (66.4/14.2/19.4)
2.5Y 4/3 Weak, Coarse, Sub-angular Blocky
Friable –
Ckgj 64-105 Loam (46.0/35.4/18.6) 2.5Y 5/2 Massive Friable – IICkgj 105-120 Loam (33.8/40.0/26.2) 2.5Y 4/2 Massive Firm –
Horizon
Depth (cm)
pH (Saturated Paste)
Electrical Conductivity (dS/m at 25◦)
Saturation (%)
Sodium Adsorption
Ratio
Base Saturation
(%) Ah 0-20 7 1.02 57 1.9 183 Bnjtk 20-34 7.8 0.81 43 1 200 Bkgj 34-64 8.1 0.72 36 2.3 377 Ckgj 64-105 8.6 0.92 49 33 392 IICkgj 105-120 8.5 0.96 72 23 207

Volume 2: Environmental and Sturgeon Upgrader ProjectSocio-economic Impact Assessment Appendix 17A: Terrain and Soil Data
December 2006
Page 17A-65
Table 17A-38: Physical and Chemical Properties from Site 438 (cont’d) Exchangeable Cations
(cmol+/Kg) Horizon
Depth (cm)
Cation Exchange Capacity (cmol+/Kg)
Calcium
Magnesium
Sodium
Potassium
Ah 0-20 18.9 27.2 5.89 0.62 0.85 Bnjtk 20-34 17.6 26.2 8.36 0.32 0.2 Bkgj 34-64 8.44 24.6 6.63 0.44 0.1 Ckgj 64-105 9.2 27.4 6.02 2.57 0.1 IICkgj 105-120 15.3 20.3 7.08 4.06 0.2
NOTE: – no data
Table 17A-39: Soil Series PHS – Site and Soil Characteristics from Site 518 Characteristic Value
Classification Orthic Black Chernozem Parent Material Eolian overlying Fluvial Surface Expression Undulating Slope Gradient (%) 2 Drainage Regime Well Typical Topsoil Depth (cm) 43 Erosion Hazard Wind: High, Water: Low Surface Stoniness (%) <0.01 Coarse Fragment Content (%) 0 Colour Change Good
Table 17A-40: Physical and Chemical Properties from Site 518
Horizon
Depth (cm)
Texture (% sand/silt/clay)
Colour (hue/value/chroma)
Structure
Consistency
Organic Carbon
(%) Ap 0-28 Sandy Loam
(hand textured) 10YR 2/2 – – –
Ah 28-43 Sandy Loam (56.4/31.0/12.6)
10YR 2/2 – – 2.3
Bm 43-95 Sandy Loam (72.8/17.2/10.0)
10YR 4/4 – – 0.8
IICg 95-143 Silt Loam (20.8/54.8/24.4)
10YR 5/6 – – –
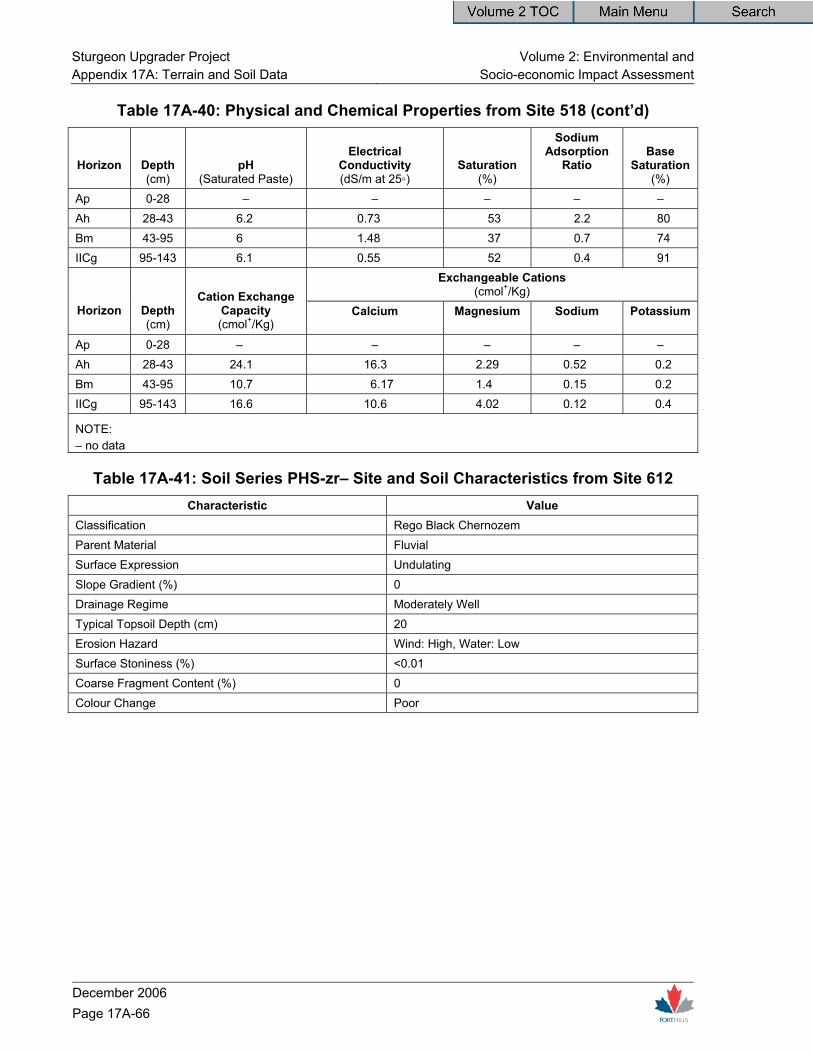
Sturgeon Upgrader Project Volume 2: Environmental and Appendix 17A: Terrain and Soil Data Socio-economic Impact Assessment
December 2006 Page 17A-66
Table 17A-40: Physical and Chemical Properties from Site 518 (cont’d)
Horizon
Depth (cm)
pH (Saturated Paste)
Electrical Conductivity (dS/m at 25◦)
Saturation (%)
Sodium Adsorption
Ratio
Base Saturation
(%) Ap 0-28 – – – – – Ah 28-43 6.2 0.73 53 2.2 80 Bm 43-95 6 1.48 37 0.7 74 IICg 95-143 6.1 0.55 52 0.4 91
Exchangeable Cations (cmol+/Kg)
Horizon
Depth (cm)
Cation Exchange Capacity (cmol+/Kg)
Calcium
Magnesium
Sodium
Potassium
Ap 0-28 – – – – – Ah 28-43 24.1 16.3 2.29 0.52 0.2 Bm 43-95 10.7 6.17 1.4 0.15 0.2 IICg 95-143 16.6 10.6 4.02 0.12 0.4
NOTE: – no data
Table 17A-41: Soil Series PHS-zr– Site and Soil Characteristics from Site 612 Characteristic Value
Classification Rego Black Chernozem Parent Material Fluvial Surface Expression Undulating Slope Gradient (%) 0 Drainage Regime Moderately Well Typical Topsoil Depth (cm) 20 Erosion Hazard Wind: High, Water: Low Surface Stoniness (%) <0.01 Coarse Fragment Content (%) 0 Colour Change Poor
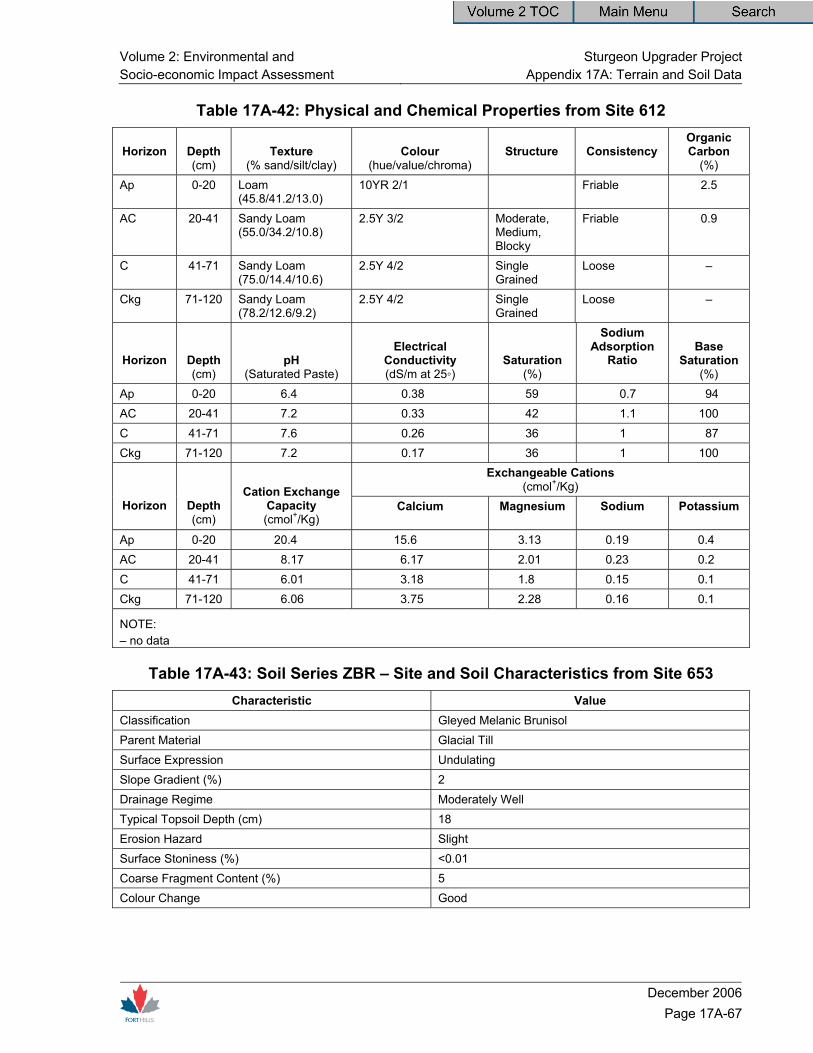
Volume 2: Environmental and Sturgeon Upgrader ProjectSocio-economic Impact Assessment Appendix 17A: Terrain and Soil Data
December 2006
Page 17A-67
Table 17A-42: Physical and Chemical Properties from Site 612
Horizon
Depth (cm)
Texture (% sand/silt/clay)
Colour (hue/value/chroma)
Structure
Consistency
Organic Carbon
(%) Ap 0-20 Loam
(45.8/41.2/13.0) 10YR 2/1 Friable 2.5
AC 20-41 Sandy Loam (55.0/34.2/10.8)
2.5Y 3/2 Moderate, Medium, Blocky
Friable 0.9
C 41-71 Sandy Loam (75.0/14.4/10.6)
2.5Y 4/2 Single Grained
Loose –
Ckg 71-120 Sandy Loam (78.2/12.6/9.2)
2.5Y 4/2 Single Grained
Loose –
Horizon
Depth (cm)
pH (Saturated Paste)
Electrical Conductivity (dS/m at 25◦)
Saturation (%)
Sodium Adsorption
Ratio
Base Saturation
(%) Ap 0-20 6.4 0.38 59 0.7 94 AC 20-41 7.2 0.33 42 1.1 100 C 41-71 7.6 0.26 36 1 87 Ckg 71-120 7.2 0.17 36 1 100
Exchangeable Cations (cmol+/Kg)
Horizon
Depth (cm)
Cation Exchange Capacity (cmol+/Kg)
Calcium
Magnesium
Sodium
Potassium
Ap 0-20 20.4 15.6 3.13 0.19 0.4 AC 20-41 8.17 6.17 2.01 0.23 0.2 C 41-71 6.01 3.18 1.8 0.15 0.1 Ckg 71-120 6.06 3.75 2.28 0.16 0.1
NOTE: – no data
Table 17A-43: Soil Series ZBR – Site and Soil Characteristics from Site 653 Characteristic Value
Classification Gleyed Melanic Brunisol Parent Material Glacial Till Surface Expression Undulating Slope Gradient (%) 2 Drainage Regime Moderately Well Typical Topsoil Depth (cm) 18 Erosion Hazard Slight Surface Stoniness (%) <0.01 Coarse Fragment Content (%) 5 Colour Change Good

Sturgeon Upgrader Project Volume 2: Environmental and Appendix 17A: Terrain and Soil Data Socio-economic Impact Assessment
December 2006 Page 17A-68
Table 17A-44: Physical and Chemical Properties from Site 653
Horizon
Depth (cm)
Texture (% sand/silt/clay)
Colour (hue/value/chroma)
Structure
Consistency
Organic Carbon
(%) Ap 0-18 Loam
(35.8/39.8/24.4) 10YR 2/1 Moderate,
Fine, Sub-angular Blocky
Friable 2.6
Bm 18-38 Loam (41.4/34.8/23.8)
10YR 3/4 Moderate, Medium, Sub-angular Blocky
Friable –
Bmkgj 38-60 Loam (44.8/28.6/26.6)
2.5Y 3/3 Moderate, Medium, Sub-angular Blocky
Friable –
BCkg 60-85 Clay Loam (40.8/31.4/27.8)
2.5Y 4/3 Weak, Fine, Sub-angular Blocky
Friable –
Ckg 85-120 Loam (46.6/28.4/25.0)
2.5Y 4/3 Massive Friable –
Horizon
Depth (cm)
pH (Saturated
Paste)
Electrical Conductivity (dS/m at 25)
Saturation (%)
Sodium Adsorption
Ratio
Base Saturation
(%) Ap 0-18 6.2 0.77 51 0.2 61 Bm 18-38 7 0.48 42 0.2 51 Bmkgj 38-60 7.2 0.39 41 0.2 53 BCkg 60-85 7.6 0.36 43 0.2 78 Ckg 85-120 7.8 0.32 43 0.4 141
Exchangeable Cations (cmol+/Kg)
Horizon
Depth (cm)
Cation Exchange Capacity (cmol+/Kg)
Calcium
Magnesium
Sodium
Potassium
Ap 0-18 41.5 21.7 2.82 0.06 0.59 Bm 18-38 31.2 12.6 2.95 0.05 0.3 Bmkgj 38-60 28.6 11.8 3.09 0.05 0.3 BCkg 60-85 32 21.4 3.28 0.06 0.3 Ckg 85-120 22.6 28.4 3.03 0.08 0.4
NOTE: – no data
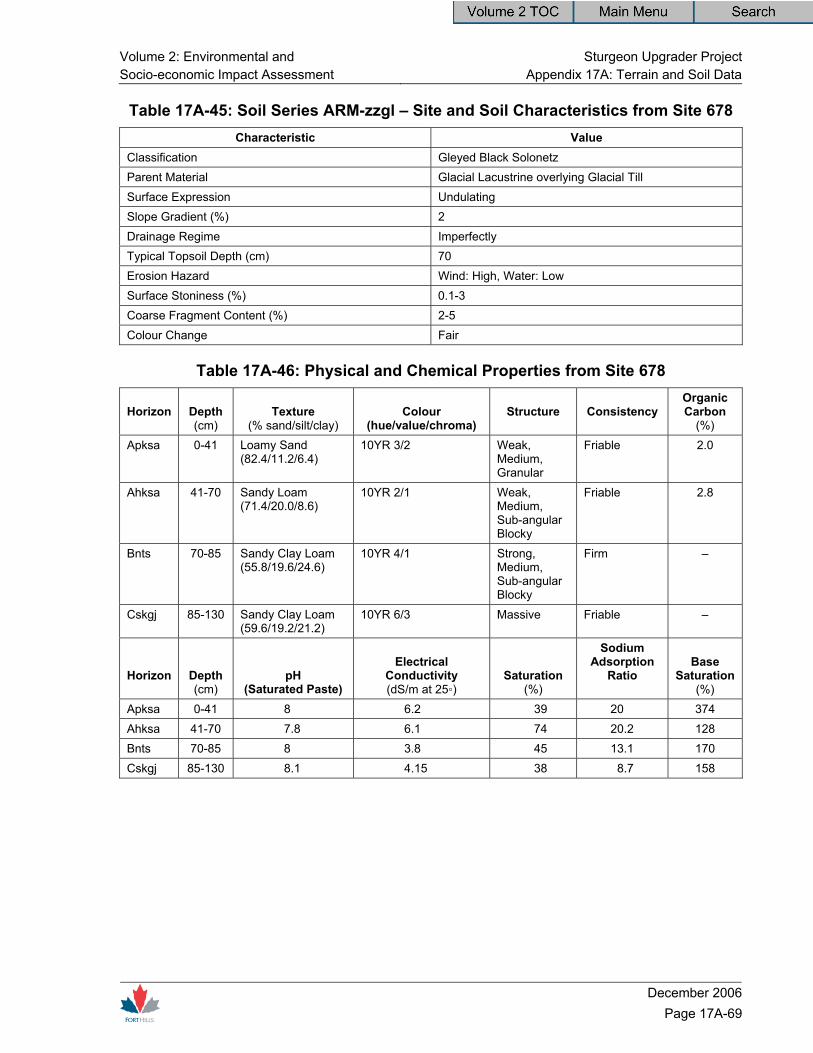
Volume 2: Environmental and Sturgeon Upgrader ProjectSocio-economic Impact Assessment Appendix 17A: Terrain and Soil Data
December 2006
Page 17A-69
Table 17A-45: Soil Series ARM-zzgl – Site and Soil Characteristics from Site 678 Characteristic Value
Classification Gleyed Black Solonetz Parent Material Glacial Lacustrine overlying Glacial Till Surface Expression Undulating Slope Gradient (%) 2 Drainage Regime Imperfectly Typical Topsoil Depth (cm) 70 Erosion Hazard Wind: High, Water: Low Surface Stoniness (%) 0.1-3 Coarse Fragment Content (%) 2-5 Colour Change Fair
Table 17A-46: Physical and Chemical Properties from Site 678
Horizon
Depth (cm)
Texture (% sand/silt/clay)
Colour (hue/value/chroma)
Structure
Consistency
Organic Carbon
(%) Apksa 0-41 Loamy Sand
(82.4/11.2/6.4) 10YR 3/2 Weak,
Medium, Granular
Friable 2.0
Ahksa 41-70 Sandy Loam (71.4/20.0/8.6)
10YR 2/1 Weak, Medium, Sub-angular Blocky
Friable 2.8
Bnts 70-85 Sandy Clay Loam (55.8/19.6/24.6)
10YR 4/1 Strong, Medium, Sub-angular Blocky
Firm –
Cskgj 85-130 Sandy Clay Loam (59.6/19.2/21.2)
10YR 6/3 Massive Friable –
Horizon
Depth (cm)
pH (Saturated Paste)
Electrical Conductivity (dS/m at 25◦)
Saturation (%)
Sodium Adsorption
Ratio
Base Saturation
(%) Apksa 0-41 8 6.2 39 20 374 Ahksa 41-70 7.8 6.1 74 20.2 128 Bnts 70-85 8 3.8 45 13.1 170 Cskgj 85-130 8.1 4.15 38 8.7 158

Sturgeon Upgrader Project Volume 2: Environmental and Appendix 17A: Terrain and Soil Data Socio-economic Impact Assessment
December 2006 Page 17A-70
Table 17A-46: Physical and Chemical Properties from Site 678 (cont’d) Exchangeable Cations
(cmol+/Kg) Horizon
Depth (cm)
Cation Exchange Capacity (cmol+/Kg)
Calcium
Magnesium
Sodium
Potassium
Apksa 0-41 8.88 22.0 5.71 5.37 0.2 Ahksa 41-70 52.5 44.8 11.8 10.7 0.1 Bnts 70-85 25.6 33.8 5.48 4.11 0.1 Cskgj 85-130 15.8 20.0 3.22 1.28 0.1
NOTE: – no data
Table 17A-47: Soil Series PRM-zz – Site and Soil Characteristics from Site 782 Characteristic Value Classification Orthic Melanic Brunisol Parent Material Eolian Surface Expression Undulating Slope Gradient (%) 2 Drainage Regime Well Typical Topsoil Depth (cm) 23 Erosion Hazard Wind: High, Water: Low Surface Stoniness (%) <0.01 Coarse Fragment Content (%) 0 Colour Change Good
Table 17A-48: Physical and Chemical Properties from Site 782
Horizon
Depth (cm)
Texture (% sand/silt/clay)
Colour (hue/value/chroma)
Structure
Consistency
Organic Carbon
(%) Ah 0-23 Sand
(88.0/7.4/4.6) 10YR 2/2 Weak, Fine,
Granular Friable 2.1
Bm 23-42 Sand (94.0/1.4/4.6)
2.5Y 4/4 Weak, Medium, Sub-angular Blocky
Loose –
C 42-104 Sand (96.2/0.1/4.4)
2.5Y 6/4 Single Grained
Loose 0.4
Cg 104-120 Sand (hand textured)
2.5Y 6/4 Single Grained
Loose –

Volume 2: Environmental and Sturgeon Upgrader ProjectSocio-economic Impact Assessment Appendix 17A: Terrain and Soil Data
December 2006
Page 17A-71
Table 17A-48: Physical and Chemical Properties from Site 782 (cont’d)
Horizon
Depth (cm)
pH (Saturated Paste)
Electrical Conductivity (dS/m at 25◦)
Saturation (%)
Sodium Adsorption
Ratio
Base Saturation
(%) Ah 0-23 5.8 0.18 46 0.1 67 Bm 23-42 6.2 0.07 33 0.3 57 C 42-104 6.4 0.07 34 0.3 49 Cg 104-120 – – – – –
Exchangeable Cations (cmol+/Kg)
Horizon
Depth (cm)
Cation Exchange Capacity (cmol+/Kg)
Calcium
Magnesium
Sodium
Potassium
Ah 0-23 9.56 5.58 0.64 0.05 0.2 Bm 23-42 4.57 2.13 0.34 0.05 0.1 C 42-104 4.74 1.82 0.41 0.05 0.1 Cg 104-120 – – – – –
NOTE: – no data
Table 17A-49: Soil Series HBM-glca – Site and Soil Characteristics from Site 900 Characteristic Value
Classification Gleyed Calcareous Black Chernozem Parent Material Glacial Lacustrine overlying Glacial Till Surface Expression Undulating Slope Gradient (%) 3 Drainage Regime Imperfectly Typical Topsoil Depth (cm) 39 Erosion Hazard Slight Surface Stoniness (%) <0.01 Coarse Fragment Content (%) 0-2 Colour Change Poor
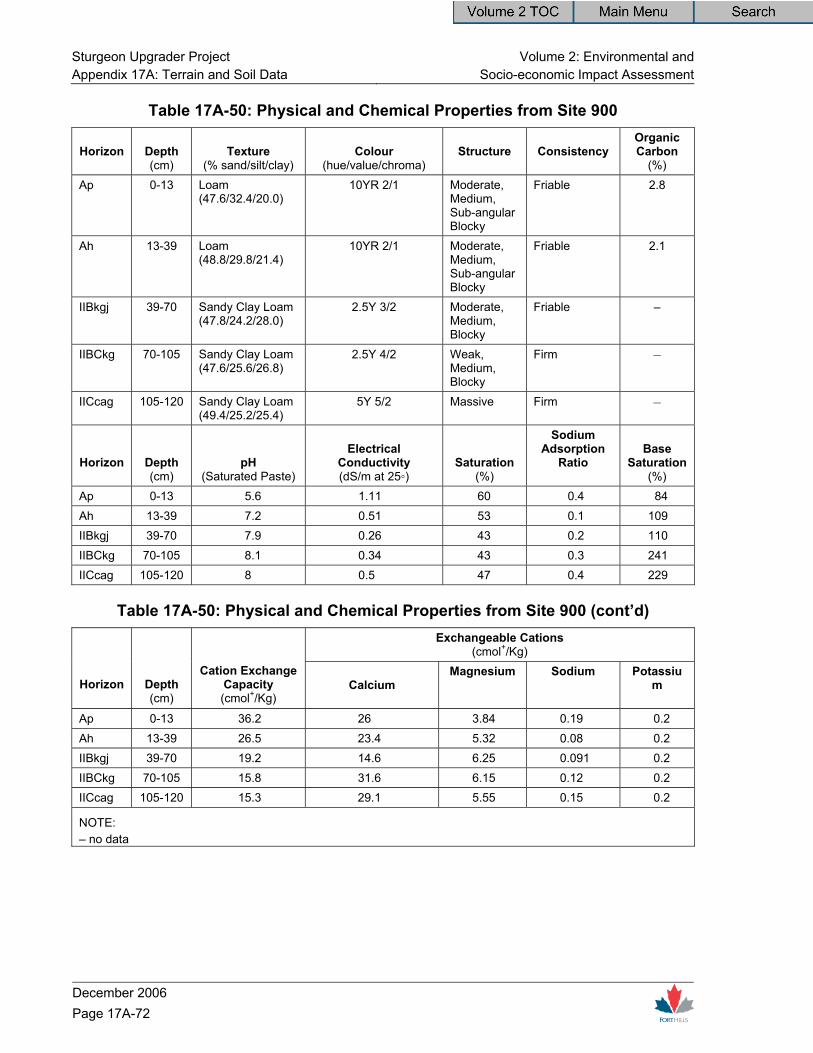
Sturgeon Upgrader Project Volume 2: Environmental and Appendix 17A: Terrain and Soil Data Socio-economic Impact Assessment
December 2006 Page 17A-72
Table 17A-50: Physical and Chemical Properties from Site 900
Horizon
Depth (cm)
Texture (% sand/silt/clay)
Colour (hue/value/chroma)
Structure
Consistency
Organic Carbon
(%) Ap 0-13 Loam
(47.6/32.4/20.0) 10YR 2/1 Moderate,
Medium, Sub-angular Blocky
Friable 2.8
Ah 13-39 Loam (48.8/29.8/21.4)
10YR 2/1 Moderate, Medium, Sub-angular Blocky
Friable 2.1
IIBkgj 39-70 Sandy Clay Loam (47.8/24.2/28.0)
2.5Y 3/2 Moderate, Medium, Blocky
Friable –
IIBCkg 70-105 Sandy Clay Loam (47.6/25.6/26.8)
2.5Y 4/2 Weak, Medium, Blocky
Firm –
IICcag 105-120 Sandy Clay Loam (49.4/25.2/25.4)
5Y 5/2 Massive Firm –
Horizon
Depth (cm)
pH (Saturated Paste)
Electrical Conductivity (dS/m at 25◦)
Saturation(%)
Sodium Adsorption
Ratio
Base Saturation
(%) Ap 0-13 5.6 1.11 60 0.4 84 Ah 13-39 7.2 0.51 53 0.1 109 IIBkgj 39-70 7.9 0.26 43 0.2 110 IIBCkg 70-105 8.1 0.34 43 0.3 241 IICcag 105-120 8 0.5 47 0.4 229
Table 17A-50: Physical and Chemical Properties from Site 900 (cont’d) Exchangeable Cations
(cmol+/Kg)
Horizon
Depth (cm)
Cation Exchange Capacity (cmol+/Kg)
Calcium
Magnesium
Sodium
Potassium
Ap 0-13 36.2 26 3.84 0.19 0.2 Ah 13-39 26.5 23.4 5.32 0.08 0.2 IIBkgj 39-70 19.2 14.6 6.25 0.091 0.2 IIBCkg 70-105 15.8 31.6 6.15 0.12 0.2 IICcag 105-120 15.3 29.1 5.55 0.15 0.2
NOTE: – no data

Volume 2: Environmental and Sturgeon Upgrader ProjectSocio-economic Impact Assessment Appendix 17A: Terrain and Soil Data
December 2006
Page 17A-73
Table 17A-51: Soil Series MDR-ca – Site and Soil Characteristics from Site 966 Characteristic Value
Classification Calcareous Black Chernozem Parent Material Eolian Surface Expression Undulating Slope Gradient (%) 0 Drainage Regime Well Typical Topsoil Depth (cm) 15 Erosion Hazard Wind: High, Water: Low Surface Stoniness (%) <0.01 Coarse Fragment Content (%) 0 Colour Change Good
Table 17A-52: Physical and Chemical Properties from Site 966
Horizon
Depth (cm)
Texture (% sand/silt/clay)
Colour (hue/value/chroma)
Structure
Consistency
Organic Carbon
(%) Apk 0-15 Sandy Loam
(64.8/20.6/14.6) 10YR 3/2 Weak,
Medium, Sub-angular Blocky
Friable 1.5
Bmks 15-23 Sandy Loam (58.2/27.2/14.6)
10YR 4/5 Moderate, Medium, Sub-angular Blocky
Friable 0.9
BCk 23-43 Sandy Loam (65.4/20.4/14.2)
2.5Y 4/3 Weak, Medium, Sub-angular Blocky
Friable –
Cca 43-120 Loamy Sand (82.2/9.4/8.4)
2.5Y 5/3 Single Grained Loose –
Horizon
Depth (cm)
pH (Saturated Paste)
Electrical Conductivity (dS/m at 25◦)
Saturation (%)
Sodium Adsorption
Ratio
Base Saturation
(%) Apk 0-15 7.4 1.29 33 0.1 153 Bmks 15-23 7.5 3.85 38 0.1 263 BCk 23-43 8 0.9 37 0.1 298 Cca 43-120 8.4 0.29 32 0.3 345
Exchangeable Cations (cmol+/Kg)
Horizon
Depth (cm)
Cation Exchange Capacity (cmol+/Kg)
Calcium
Magnesium
Sodium
Potassium
Apk 0-15 13.2 18.8 0.97 0.06 0.4 Bmks 15-23 11 27.1 1.4 0.06 0.2 BCk 23-43 8 22.2 1.4 0.06 0.1 Cca 43-120 5.67 17.5 1.67 0.06 0.3
NOTE: – no data
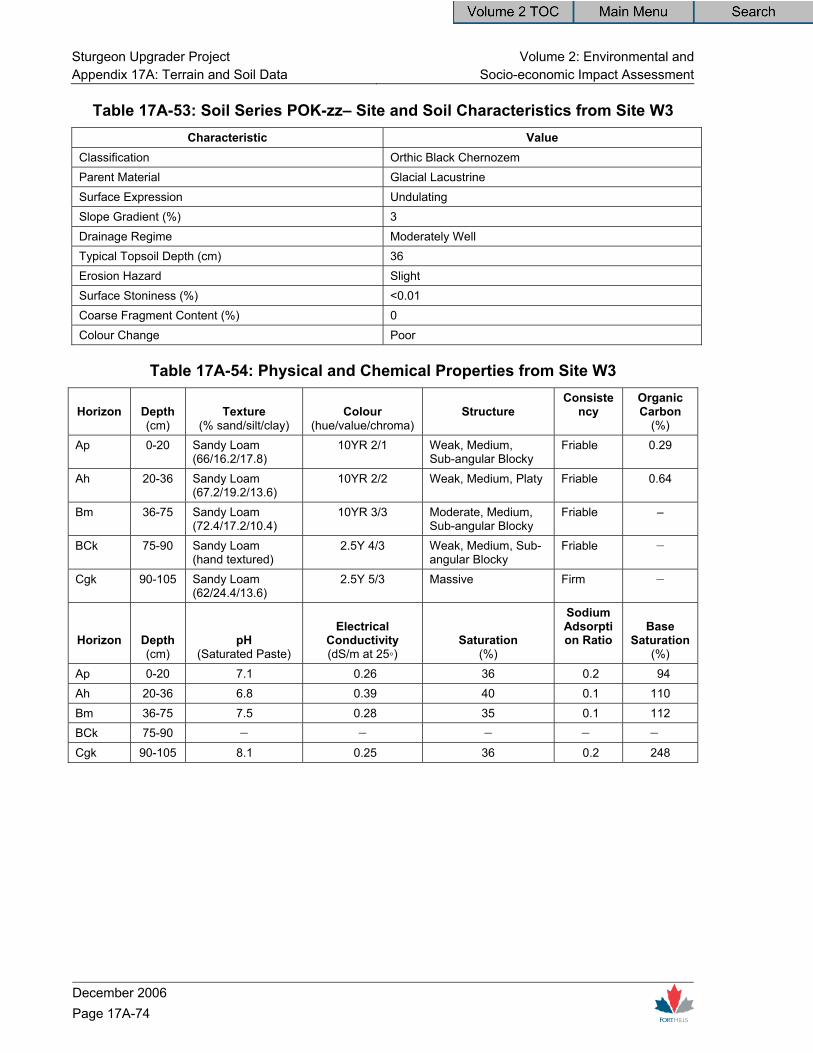
Sturgeon Upgrader Project Volume 2: Environmental and Appendix 17A: Terrain and Soil Data Socio-economic Impact Assessment
December 2006 Page 17A-74
Table 17A-53: Soil Series POK-zz– Site and Soil Characteristics from Site W3 Characteristic Value
Classification Orthic Black Chernozem Parent Material Glacial Lacustrine Surface Expression Undulating Slope Gradient (%) 3 Drainage Regime Moderately Well Typical Topsoil Depth (cm) 36 Erosion Hazard Slight Surface Stoniness (%) <0.01 Coarse Fragment Content (%) 0 Colour Change Poor
Table 17A-54: Physical and Chemical Properties from Site W3
Horizon
Depth (cm)
Texture (% sand/silt/clay)
Colour (hue/value/chroma)
Structure
Consistency
Organic Carbon
(%) Ap 0-20 Sandy Loam
(66/16.2/17.8) 10YR 2/1 Weak, Medium,
Sub-angular Blocky Friable 0.29
Ah 20-36 Sandy Loam (67.2/19.2/13.6)
10YR 2/2 Weak, Medium, Platy Friable 0.64
Bm 36-75 Sandy Loam (72.4/17.2/10.4)
10YR 3/3 Moderate, Medium, Sub-angular Blocky
Friable –
BCk 75-90 Sandy Loam (hand textured)
2.5Y 4/3 Weak, Medium, Sub-angular Blocky
Friable –
Cgk 90-105 Sandy Loam (62/24.4/13.6)
2.5Y 5/3 Massive Firm –
Horizon
Depth (cm)
pH (Saturated Paste)
Electrical Conductivity (dS/m at 25◦)
Saturation (%)
Sodium Adsorption Ratio
Base Saturation
(%) Ap 0-20 7.1 0.26 36 0.2 94 Ah 20-36 6.8 0.39 40 0.1 110 Bm 36-75 7.5 0.28 35 0.1 112 BCk 75-90 – – – – – Cgk 90-105 8.1 0.25 36 0.2 248
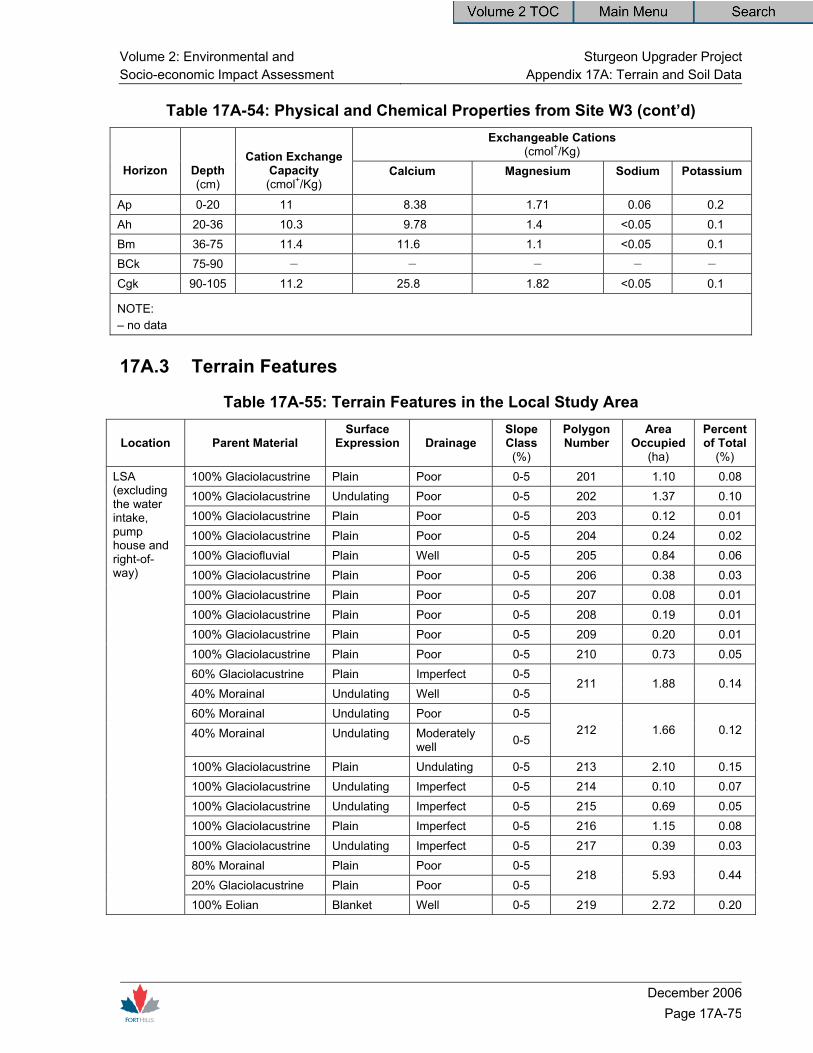
Volume 2: Environmental and Sturgeon Upgrader ProjectSocio-economic Impact Assessment Appendix 17A: Terrain and Soil Data
December 2006
Page 17A-75
Table 17A-54: Physical and Chemical Properties from Site W3 (cont’d) Exchangeable Cations
(cmol+/Kg) Horizon
Depth (cm)
Cation Exchange Capacity (cmol+/Kg)
Calcium
Magnesium
Sodium
Potassium
Ap 0-20 11 8.38 1.71 0.06 0.2 Ah 20-36 10.3 9.78 1.4 <0.05 0.1 Bm 36-75 11.4 11.6 1.1 <0.05 0.1 BCk 75-90 – – – – – Cgk 90-105 11.2 25.8 1.82 <0.05 0.1
NOTE: – no data
17A.3 Terrain Features
Table 17A-55: Terrain Features in the Local Study Area
Location
Parent Material
Surface Expression
Drainage
Slope Class (%)
Polygon Number
Area Occupied
(ha)
Percent of Total
(%) 100% Glaciolacustrine Plain Poor 0-5 201 1.10 0.08 100% Glaciolacustrine Undulating Poor 0-5 202 1.37 0.10 100% Glaciolacustrine Plain Poor 0-5 203 0.12 0.01 100% Glaciolacustrine Plain Poor 0-5 204 0.24 0.02 100% Glaciofluvial Plain Well 0-5 205 0.84 0.06 100% Glaciolacustrine Plain Poor 0-5 206 0.38 0.03 100% Glaciolacustrine Plain Poor 0-5 207 0.08 0.01 100% Glaciolacustrine Plain Poor 0-5 208 0.19 0.01 100% Glaciolacustrine Plain Poor 0-5 209 0.20 0.01 100% Glaciolacustrine Plain Poor 0-5 210 0.73 0.05 60% Glaciolacustrine Plain Imperfect 0-5 40% Morainal Undulating Well 0-5
211 1.88 0.14
60% Morainal Undulating Poor 0-5 40% Morainal Undulating Moderately
well 0-5 212 1.66 0.12
100% Glaciolacustrine Plain Undulating 0-5 213 2.10 0.15 100% Glaciolacustrine Undulating Imperfect 0-5 214 0.10 0.07 100% Glaciolacustrine Undulating Imperfect 0-5 215 0.69 0.05 100% Glaciolacustrine Plain Imperfect 0-5 216 1.15 0.08 100% Glaciolacustrine Undulating Imperfect 0-5 217 0.39 0.03 80% Morainal Plain Poor 0-5 20% Glaciolacustrine Plain Poor 0-5
218 5.93 0.44
LSA (excluding the water intake, pump house and right-of-way)
100% Eolian Blanket Well 0-5 219 2.72 0.20
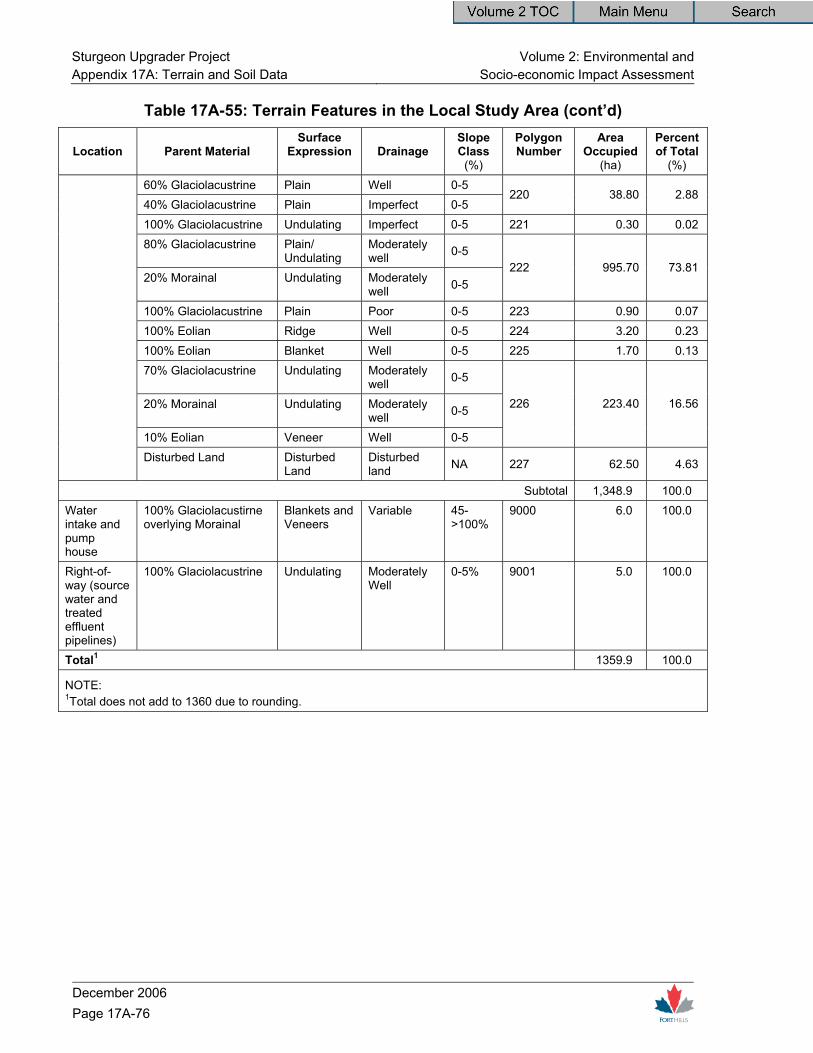
Sturgeon Upgrader Project Volume 2: Environmental and Appendix 17A: Terrain and Soil Data Socio-economic Impact Assessment
December 2006 Page 17A-76
Table 17A-55: Terrain Features in the Local Study Area (cont’d)
Location
Parent Material
Surface Expression
Drainage
Slope Class (%)
Polygon Number
Area Occupied
(ha)
Percent of Total
(%) 60% Glaciolacustrine Plain Well 0-5 40% Glaciolacustrine Plain Imperfect 0-5
220 38.80 2.88
100% Glaciolacustrine Undulating Imperfect 0-5 221 0.30 0.02 80% Glaciolacustrine Plain/
Undulating Moderately well 0-5
20% Morainal Undulating Moderately well 0-5
222 995.70 73.81
100% Glaciolacustrine Plain Poor 0-5 223 0.90 0.07 100% Eolian Ridge Well 0-5 224 3.20 0.23 100% Eolian Blanket Well 0-5 225 1.70 0.13 70% Glaciolacustrine Undulating Moderately
well 0-5
20% Morainal Undulating Moderately well 0-5
10% Eolian Veneer Well 0-5
226 223.40 16.56
Disturbed Land Disturbed Land
Disturbed land NA 227 62.50 4.63
Subtotal 1,348.9 100.0 Water intake and pump house
100% Glaciolacustirne overlying Morainal
Blankets and Veneers
Variable 45->100%
9000 6.0 100.0
Right-of-way (source water and treated effluent pipelines)
100% Glaciolacustrine Undulating Moderately Well
0-5% 9001 5.0 100.0
Total1 1359.9 100.0
NOTE: 1Total does not add to 1360 due to rounding.
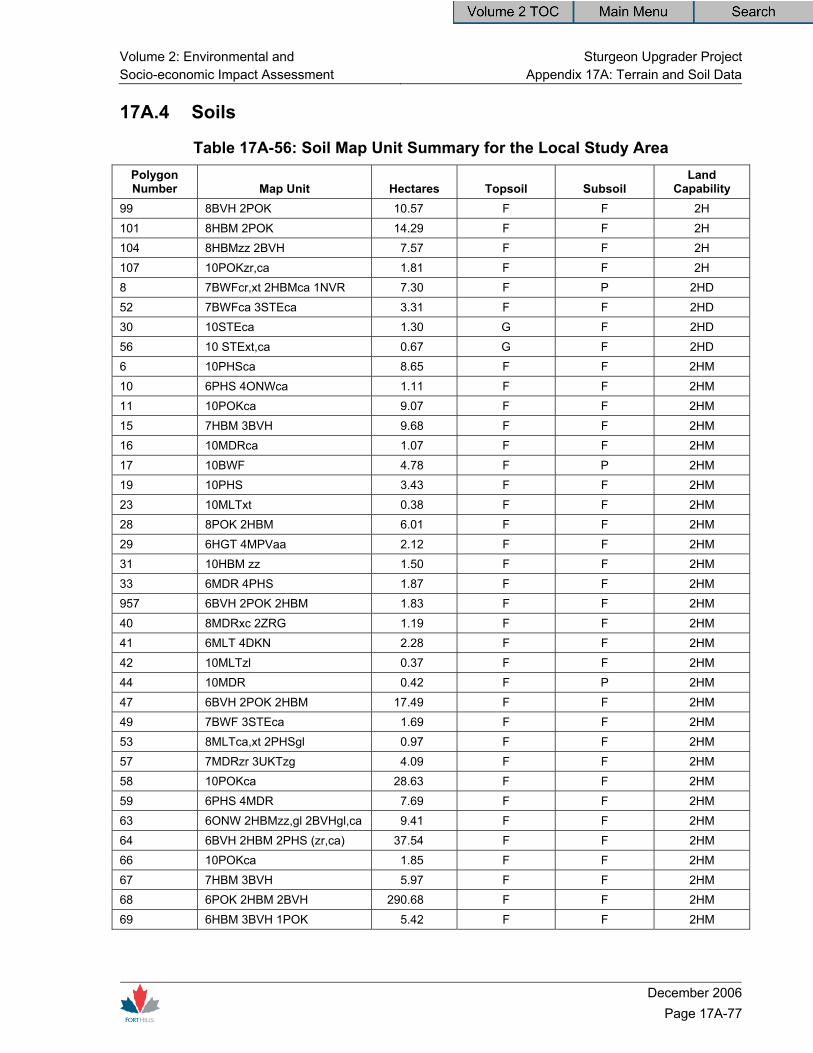
Volume 2: Environmental and Sturgeon Upgrader ProjectSocio-economic Impact Assessment Appendix 17A: Terrain and Soil Data
December 2006
Page 17A-77
17A.4 Soils
Table 17A-56: Soil Map Unit Summary for the Local Study Area Polygon Number Map Unit Hectares Topsoil Subsoil
Land Capability
99 8BVH 2POK 10.57 F F 2H 101 8HBM 2POK 14.29 F F 2H 104 8HBMzz 2BVH 7.57 F F 2H 107 10POKzr,ca 1.81 F F 2H 8 7BWFcr,xt 2HBMca 1NVR 7.30 F P 2HD 52 7BWFca 3STEca 3.31 F F 2HD 30 10STEca 1.30 G F 2HD 56 10 STExt,ca 0.67 G F 2HD 6 10PHSca 8.65 F F 2HM 10 6PHS 4ONWca 1.11 F F 2HM 11 10POKca 9.07 F F 2HM 15 7HBM 3BVH 9.68 F F 2HM 16 10MDRca 1.07 F F 2HM 17 10BWF 4.78 F P 2HM 19 10PHS 3.43 F F 2HM 23 10MLTxt 0.38 F F 2HM 28 8POK 2HBM 6.01 F F 2HM 29 6HGT 4MPVaa 2.12 F F 2HM 31 10HBM zz 1.50 F F 2HM 33 6MDR 4PHS 1.87 F F 2HM 957 6BVH 2POK 2HBM 1.83 F F 2HM 40 8MDRxc 2ZRG 1.19 F F 2HM 41 6MLT 4DKN 2.28 F F 2HM 42 10MLTzl 0.37 F F 2HM 44 10MDR 0.42 F P 2HM 47 6BVH 2POK 2HBM 17.49 F F 2HM 49 7BWF 3STEca 1.69 F F 2HM 53 8MLTca,xt 2PHSgl 0.97 F F 2HM 57 7MDRzr 3UKTzg 4.09 F F 2HM 58 10POKca 28.63 F F 2HM 59 6PHS 4MDR 7.69 F F 2HM 63 6ONW 2HBMzz,gl 2BVHgl,ca 9.41 F F 2HM 64 6BVH 2HBM 2PHS (zr,ca) 37.54 F F 2HM 66 10POKca 1.85 F F 2HM 67 7HBM 3BVH 5.97 F F 2HM 68 6POK 2HBM 2BVH 290.68 F F 2HM 69 6HBM 3BVH 1POK 5.42 F F 2HM
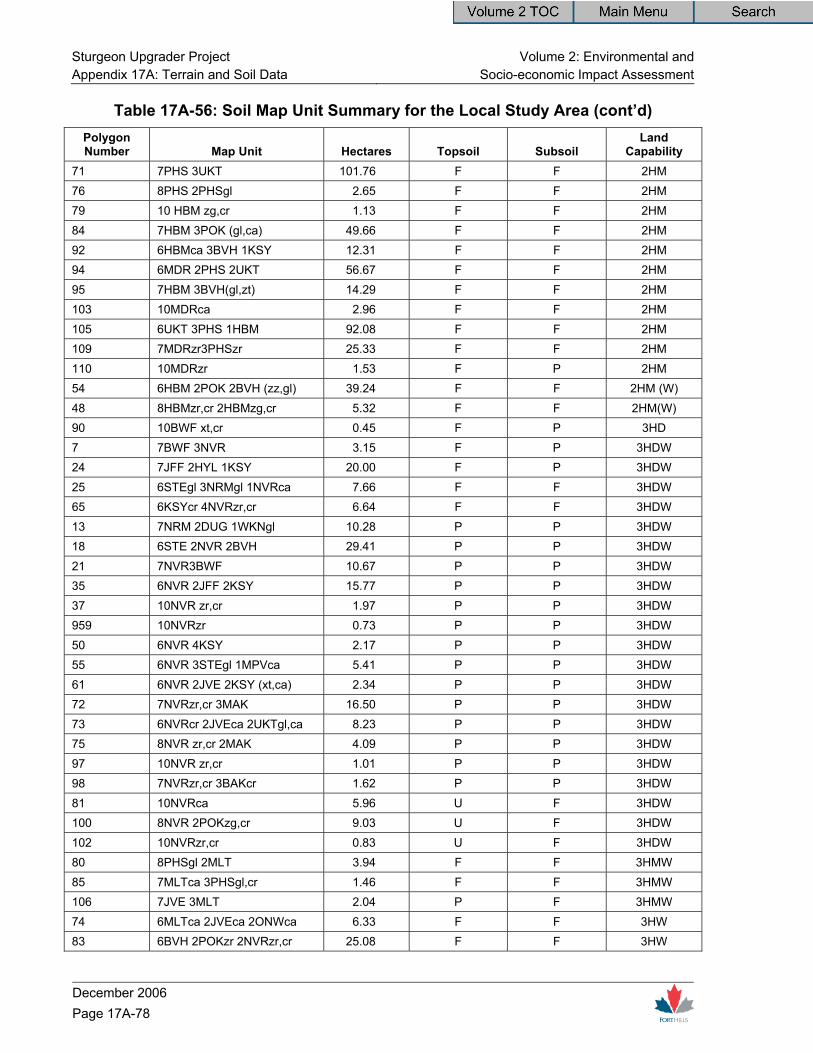
Sturgeon Upgrader Project Volume 2: Environmental and Appendix 17A: Terrain and Soil Data Socio-economic Impact Assessment
December 2006 Page 17A-78
Table 17A-56: Soil Map Unit Summary for the Local Study Area (cont’d) Polygon Number Map Unit Hectares Topsoil Subsoil
Land Capability
71 7PHS 3UKT 101.76 F F 2HM 76 8PHS 2PHSgl 2.65 F F 2HM 79 10 HBM zg,cr 1.13 F F 2HM 84 7HBM 3POK (gl,ca) 49.66 F F 2HM 92 6HBMca 3BVH 1KSY 12.31 F F 2HM 94 6MDR 2PHS 2UKT 56.67 F F 2HM 95 7HBM 3BVH(gl,zt) 14.29 F F 2HM 103 10MDRca 2.96 F F 2HM 105 6UKT 3PHS 1HBM 92.08 F F 2HM 109 7MDRzr3PHSzr 25.33 F F 2HM 110 10MDRzr 1.53 F P 2HM 54 6HBM 2POK 2BVH (zz,gl) 39.24 F F 2HM (W) 48 8HBMzr,cr 2HBMzg,cr 5.32 F F 2HM(W) 90 10BWF xt,cr 0.45 F P 3HD 7 7BWF 3NVR 3.15 F P 3HDW 24 7JFF 2HYL 1KSY 20.00 F P 3HDW 25 6STEgl 3NRMgl 1NVRca 7.66 F F 3HDW 65 6KSYcr 4NVRzr,cr 6.64 F F 3HDW 13 7NRM 2DUG 1WKNgl 10.28 P P 3HDW 18 6STE 2NVR 2BVH 29.41 P P 3HDW 21 7NVR3BWF 10.67 P P 3HDW 35 6NVR 2JFF 2KSY 15.77 P P 3HDW 37 10NVR zr,cr 1.97 P P 3HDW 959 10NVRzr 0.73 P P 3HDW 50 6NVR 4KSY 2.17 P P 3HDW 55 6NVR 3STEgl 1MPVca 5.41 P P 3HDW 61 6NVR 2JVE 2KSY (xt,ca) 2.34 P P 3HDW 72 7NVRzr,cr 3MAK 16.50 P P 3HDW 73 6NVRcr 2JVEca 2UKTgl,ca 8.23 P P 3HDW 75 8NVR zr,cr 2MAK 4.09 P P 3HDW 97 10NVR zr,cr 1.01 P P 3HDW 98 7NVRzr,cr 3BAKcr 1.62 P P 3HDW 81 10NVRca 5.96 U F 3HDW 100 8NVR 2POKzg,cr 9.03 U F 3HDW 102 10NVRzr,cr 0.83 U F 3HDW 80 8PHSgl 2MLT 3.94 F F 3HMW 85 7MLTca 3PHSgl,cr 1.46 F F 3HMW 106 7JVE 3MLT 2.04 P F 3HMW 74 6MLTca 2JVEca 2ONWca 6.33 F F 3HW 83 6BVH 2POKzr 2NVRzr,cr 25.08 F F 3HW

Volume 2: Environmental and Sturgeon Upgrader ProjectSocio-economic Impact Assessment Appendix 17A: Terrain and Soil Data
December 2006
Page 17A-79
Table 17A-56: Soil Map Unit Summary for the Local Study Area (cont’d) Polygon Number Map Unit Hectares Topsoil Subsoil
Land Capability
87 8MPVaa 2JVE 3.63 F F 3HW 108 7MAK 2NVR 1PHSgl 1.34 F F 3HW 26 10JVEzt,zz 1.97 P F 3HW 32 6JVE 4MAK 2.30 P F 3HW 45 10JVExt 0.58 P F 3HW 77 7JVE ca,xt 3UKTgl,ca 1.51 P F 3HW 39 6PHSgl 3MDR 1DKN 17.63 F F 3MH 2 10MMO zr,xt 4.18 F P 4HD 22 7STEca 2MPVaa 1HRLxt,zt 7.65 F P 4HDW 70 6MAK 2NVR 2HGT 24.12 F F 4HDW 5 8NVRzr,ca 2HYL 4.81 P P 4HDW 93 6MLT 3HGT 1PHSgl 23.53 F F 4HM 88 7MLT 3DKN 4.52 F F 4HW 38 7NVRzr 3HGT (sa) 4.84 P P 5HDW 91 10ARM zz,gl 3.14 F F 5HMN 27 6ARM gl,zz 2POKca 2STExt 3.39 P P 5HMN 9 8JFF 2HYL 1.18 F P 5HMW 86 8ONWzr 2HBM 2.81 F F 5HW 96 6HGT 3NVR 1KSY 2.87 F F 5HW 20 7KSYcr 2NVRzr 1HGT 13.50 P F 5HW 62 10HYL 0.66 P P 5HW 60 6MPVaa 2KSY 2JFF 1.74 F F 6HW 1 10HGT 1.88 F F 7HW 3 10HGT 1.81 F F 7HW 4 10HGTca 0.88 F F 7HW 12 7KSY 2HGT 1JFF 2.16 F F 7HW 34 10KSY xt 0.67 F F 7HW 36 10HGTzz,cr 1.12 F F 7HW 43 10KSY 0.19 F F 7HW 46 6HGT 4BAK 2.00 F F 7HW 51 10MAK zz,xt 0.43 F F 7HW 82 7MAK 2HGT 1KSY 7.57 F F 7HW 78 10MAK xc 1.11 G P 7HW 111 10MAK 7.78 G F 7HW 14 7HGTca 3JVE 2.85 F F 7WH 89 8ZOR 2DKN 3.33 P P 7ZBV 0 Disturbed Land 62.46 D D NR

Sturgeon Upgrader Project Volume 2: Environmental and Appendix 17A: Terrain and Soil Data Socio-economic Impact Assessment
December 2006 Page 17A-80
17A.5 Soil Reclamation Suitability Ratings for Series Data
Table 17A-57: Ratings Calculated from Soils Collected for the Local Study Area Reclamation Suitability Rating
Soil Series
Soil Inspection
Site Topsoil Subsoil Main Limitations in
the Topsoil
Main Limitations in
the Subsoil ARM-zzgl 678 Unsuitable Unsuitable SAR SAR ARM-zzgl 309 Fair Fair Saturation
Percentage pH, SAR
CSN-aa 196 Fair Good pH None DUG 155 Unsuitable Unsuitable SAR SAR DUG-cr 84 Good Fair None pH, SAR,
Consistency HBM-ca 219 Fair Fair pH, Stoniness class Consistency HBM-glca 900 Fair Fair pH pH, Texture HRL-ztxt 179 Fair Fair pH Texture,
Consistency HRL-ztxt 187 Fair Unsuitable pH SAR JVE-xt 77 Poor Fair pH pH, Texture MDR-cr 966 Fair Fair Organic Carbon,
Calcium Carbonate Equivalent
EC
MPV-aa 176 Fair Fair pH pH, Saturation Percentage, Texture
NRM-gl 224 Good Fair None Texture, Consistency
NTV 319 Fair Fair pH, Organic Carbon Texture, Consistency
NVR-ca 31 Unsuitable Fair Saturation Percentage
pH, SAR, Texture
PHS 518 Fair Fair pH pH PHS-zr 612 Good Fair None pH, Consistency POK-cr 103 Fair Fair pH pH, SAR POK-zz W-3 Poor Good Organic Carbon None PRM- zz 782 Poor Poor Texture Texture STE-gl 144 Good Good None None STE-gl 181 Fair Fair pH, Organic Carbon pH, Texture,
Consistency STE-glca 438 Good Fair None pH WHF-ca 410 Fair Poor pH SAR WKN-gl 244 Good Fair None pH, SAR,
Texture ZRB 653 Fair Good pH None
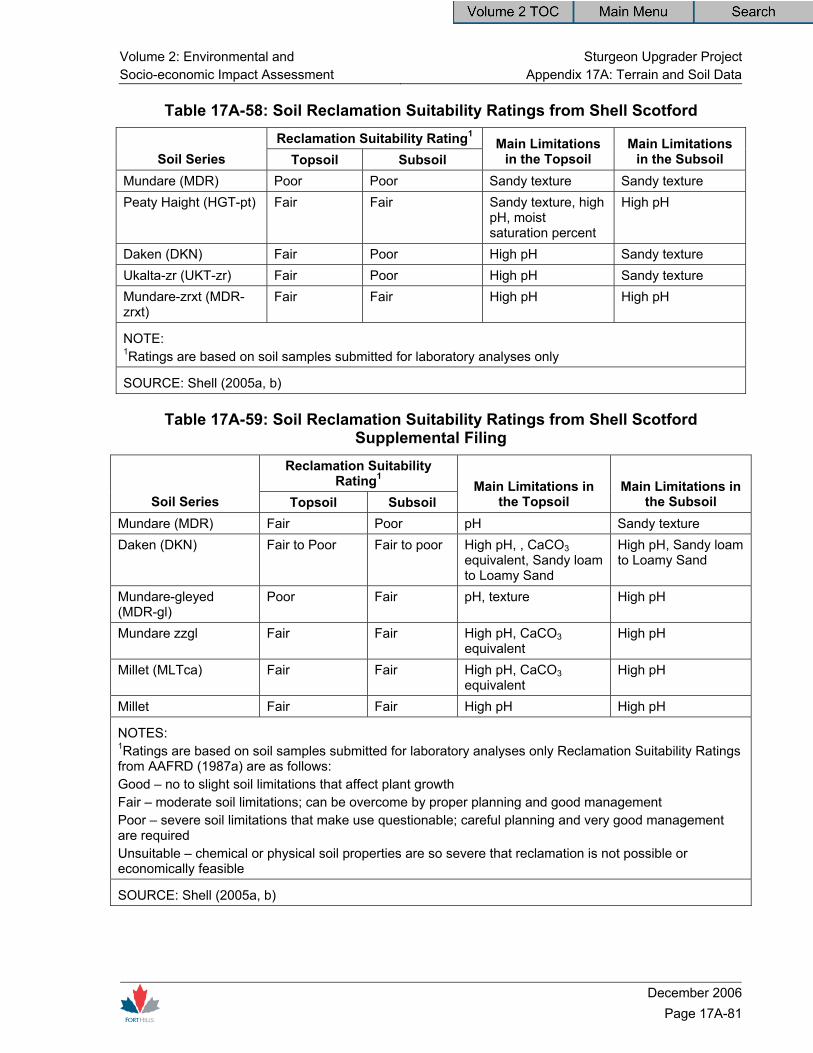
Volume 2: Environmental and Sturgeon Upgrader ProjectSocio-economic Impact Assessment Appendix 17A: Terrain and Soil Data
December 2006
Page 17A-81
Table 17A-58: Soil Reclamation Suitability Ratings from Shell Scotford Reclamation Suitability Rating1
Soil Series Topsoil Subsoil Main Limitations
in the Topsoil Main Limitations
in the Subsoil Mundare (MDR) Poor Poor Sandy texture Sandy texture Peaty Haight (HGT-pt) Fair Fair Sandy texture, high
pH, moist saturation percent
High pH
Daken (DKN) Fair Poor High pH Sandy texture Ukalta-zr (UKT-zr) Fair Poor High pH Sandy texture Mundare-zrxt (MDR-zrxt)
Fair Fair High pH High pH
NOTE: 1Ratings are based on soil samples submitted for laboratory analyses only
SOURCE: Shell (2005a, b)
Table 17A-59: Soil Reclamation Suitability Ratings from Shell Scotford Supplemental Filing
Reclamation Suitability Rating1
Soil Series Topsoil Subsoil Main Limitations in
the Topsoil Main Limitations in
the Subsoil Mundare (MDR) Fair Poor pH Sandy texture Daken (DKN) Fair to Poor Fair to poor High pH, , CaCO3
equivalent, Sandy loam to Loamy Sand
High pH, Sandy loam to Loamy Sand
Mundare-gleyed (MDR-gl)
Poor Fair pH, texture High pH
Mundare zzgl Fair Fair High pH, CaCO3 equivalent
High pH
Millet (MLTca) Fair Fair High pH, CaCO3 equivalent
High pH
Millet Fair Fair High pH High pH
NOTES: 1Ratings are based on soil samples submitted for laboratory analyses only Reclamation Suitability Ratings from AAFRD (1987a) are as follows: Good – no to slight soil limitations that affect plant growth Fair – moderate soil limitations; can be overcome by proper planning and good management Poor – severe soil limitations that make use questionable; careful planning and very good management are required Unsuitable – chemical or physical soil properties are so severe that reclamation is not possible or economically feasible
SOURCE: Shell (2005a, b)

Sturgeon Upgrader Project Volume 2: Environmental and Appendix 17A: Terrain and Soil Data Socio-economic Impact Assessment
December 2006 Page 17A-82
Table 17A-60: Soil Reclamation Suitability Ratings from Agrasid 3.0 Reclamation Suitability Rating1
Soil Series Topsoil Subsoil
Main Limitations in
the Topsoil Main Limitations
in the Subsoil Malmo (MMO) Fair Poor Texture Texture Ukalta (UKT) Good Fair None Consistency Beaver Hills (BVH) Fair Fair pH Consistency Kerensky (KSY) Fair Fair pH, CaCO3
equivalent pH
Jeffery (JFF) Good Fair None Consistency Menaik (MAK) Good Fair None pH Hairy Hill (HYL) Poor Poor EC EC Onoway (ONW) Fair Poor Texture Texture Bawlf (BWF) Fair Not Applicable pH Not Applicable Norma (NRM) Good Fair None pH, Texture,
Consistency Jarvie (JVE) Good Fair None pH, Texture Navarre (NVR) Poor Poor Texture Texture
NOTES: 1Ratings are based on soil samples submitted for laboratory analyses only Reclamation Suitability Ratings from AAFRD (1987a) are as follows: Good – no to slight soil limitations that affect plant growth Fair – moderate soil limitations; can be overcome by proper planning and good management Poor – severe soil limitations that make use questionable; careful planning and very good management are required Unsuitable – chemical or physical soil properties are so severe that reclamation is not possible or economically feasible
SOURCE: Shell (2005a, b)
17A.6 Agricultural Capability Ratings
Table 17A-61: Agricultural Land Capability Rating from Soil Samples from the Local Study Area
Soil Series
Soil Inspection
Site Soil
Classification
Index Points (Climate Rating)
Index Points(Mineral Soil
Rating)
Index Points (Landscape
Rating)
Agricultural Capability
Rating ARM-zzgl 678 Gleyed Black
Solonetz 60 (2) 22 (5) 90 (1) 5 HMN
ARM-zzgl 309 Gleyed Black Solonetz
60 (2) 62 (2) 90 (1) 2 HMD
CSN-aa 196 Orthic Melanic Brunisol
60 (2) 63 (2) 90 (1) 2 HM
DUG 155 Black Solonetz 60 (2) 41 (4) 90 (1) 4 HD DUG-cr 84 Black Solonetz 60 (2) 70 (2) 90 (1) 2 HD
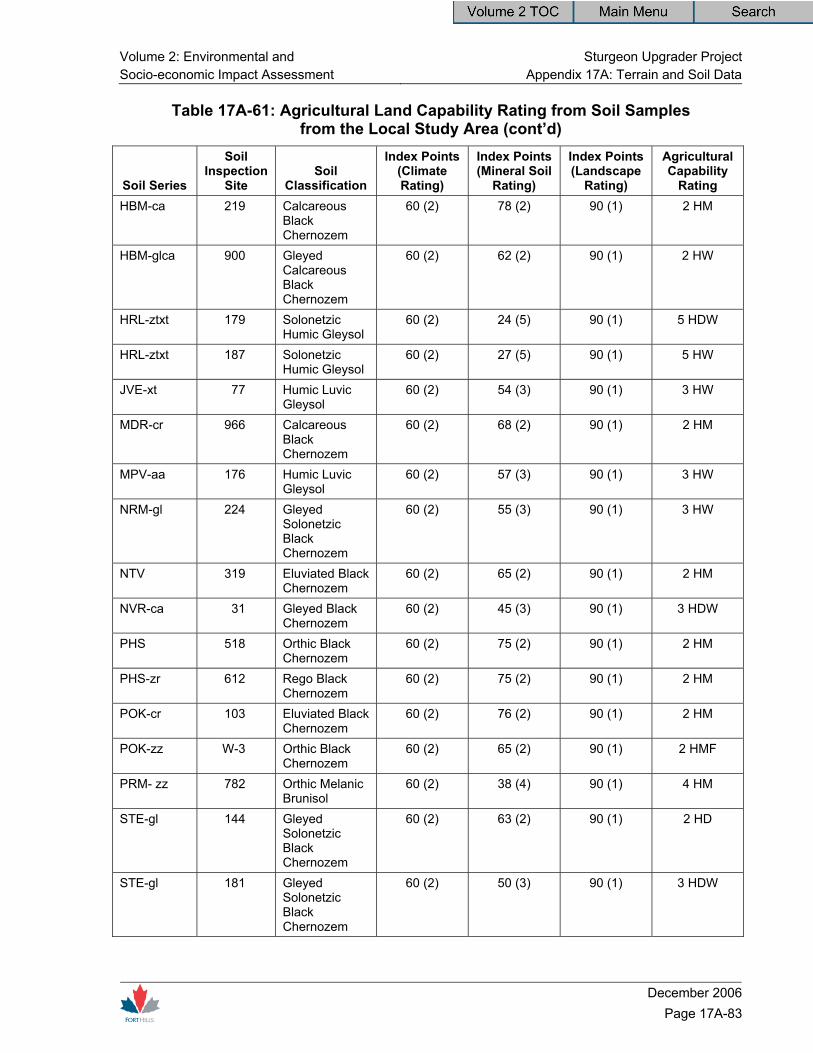
Volume 2: Environmental and Sturgeon Upgrader ProjectSocio-economic Impact Assessment Appendix 17A: Terrain and Soil Data
December 2006
Page 17A-83
Table 17A-61: Agricultural Land Capability Rating from Soil Samples from the Local Study Area (cont’d)
Soil Series
Soil Inspection
Site Soil
Classification
Index Points (Climate Rating)
Index Points(Mineral Soil
Rating)
Index Points (Landscape
Rating)
Agricultural Capability
Rating HBM-ca 219 Calcareous
Black Chernozem
60 (2) 78 (2) 90 (1) 2 HM
HBM-glca 900 Gleyed Calcareous Black Chernozem
60 (2) 62 (2) 90 (1) 2 HW
HRL-ztxt 179 Solonetzic Humic Gleysol
60 (2) 24 (5) 90 (1) 5 HDW
HRL-ztxt 187 Solonetzic Humic Gleysol
60 (2) 27 (5) 90 (1) 5 HW
JVE-xt 77 Humic Luvic Gleysol
60 (2) 54 (3) 90 (1) 3 HW
MDR-cr 966 Calcareous Black Chernozem
60 (2) 68 (2) 90 (1) 2 HM
MPV-aa 176 Humic Luvic Gleysol
60 (2) 57 (3) 90 (1) 3 HW
NRM-gl 224 Gleyed Solonetzic Black Chernozem
60 (2) 55 (3) 90 (1) 3 HW
NTV 319 Eluviated Black Chernozem
60 (2) 65 (2) 90 (1) 2 HM
NVR-ca 31 Gleyed Black Chernozem
60 (2) 45 (3) 90 (1) 3 HDW
PHS 518 Orthic Black Chernozem
60 (2) 75 (2) 90 (1) 2 HM
PHS-zr 612 Rego Black Chernozem
60 (2) 75 (2) 90 (1) 2 HM
POK-cr 103 Eluviated Black Chernozem
60 (2) 76 (2) 90 (1) 2 HM
POK-zz W-3 Orthic Black Chernozem
60 (2) 65 (2) 90 (1) 2 HMF
PRM- zz 782 Orthic Melanic Brunisol
60 (2) 38 (4) 90 (1) 4 HM
STE-gl 144 Gleyed Solonetzic Black Chernozem
60 (2) 63 (2) 90 (1) 2 HD
STE-gl 181 Gleyed Solonetzic Black Chernozem
60 (2) 50 (3) 90 (1) 3 HDW

Sturgeon Upgrader Project Volume 2: Environmental and Appendix 17A: Terrain and Soil Data Socio-economic Impact Assessment
December 2006 Page 17A-84
Table 17A-61: Agricultural Land Capability Rating from Soil Samples from the Local Study Area (cont’d)
Soil Series
Soil Inspection
Site Soil
Classification
Index Points
(Climate Rating)
Index Points(Mineral Soil
Rating)
Index Points (Landscape
Rating)
Agricultural Capability
Rating STE-glca 438 Gleyed Solonetzic
Black Chernozem 60 (2) 62 (2) 90 (1) 2 HW
WHF-ca 410 Black Solonetz 60 (2) 64 (2) 90 (1) 2 HMD WKN-gl 244 Gleyed Black
Solodized Solonetz
60 (2) 56 (3) 90 (1) 3 HW
ZRB 653 Gleyed Melanic Brunisol
60 (2) 79 (2) 90 (1) 2 H
Table 17A-62: Agricultural Capability Ratings from Shell Scotford 2005 Application
Soil Series Soil Classification
Index Points
(Climate Rating)
Index Points (Mineral Soil
Rating)
Index Points (Landscape
Rating)
Agricultural Capability
Rating Daken (DKN) Rego Gleysol 60 32 100 4WH Millet (MLT) Orthic Humic Gleysol 60 35 100 4WH Peaty Haight (HGT-pt)
Orthic Humic Gleysol 60 5 100 7WH
Gleyed Peace Hills (PHS-gl)
Gleyed Black Chernozem 60 58 100 3MH
Peace Hills –zr (PHS-zr)
Rego Black Chernozem 60 85 100 2MH
Mundare (MDR) Orthic Black Chernozem 60 60 100 2MH Mundare-zr (MDR-zr)
Rego Black Chernozem 60 75 100 2MH
Mundare-zrgl (MDR-zrgl)
Gleyed Rego Black Chernozem
60 59 100 3WMH
Mundare-zrxt (MDR-zrxt)
Rego Black Chernozem 60 80 100 2MH
Bawlf-xtgl (BWF-xtgl)
Gleyed Rego Black Chernozem
60 62 100 2WH
Unnamed Gleyed Calcareous Black Chernozem
60 58 100 3WH
Ukalta (UKT-zr) Rego Black Chernozem 60 80 100 2MH Miscellaneous Gleysol (ZGW)
Rego Humic Gleysol 60 35 100 4WH
SOURCE: Shell (2005a, b)

Volume 2: Environmental and Sturgeon Upgrader ProjectSocio-economic Impact Assessment Appendix 17A: Terrain and Soil Data
December 2006
Page 17A-85
Table 17A-63: Agricultural Land Capability Ratings from Supplemental Shell Scotford Filing
Site Number Soil Series
Soil Classification
Index Points (Climate Rating)
Index Points(Mineral Soil
Rating)
Index Points (Landscape
Rating)
Agricultural Capability
Rating 2 Daken
(calcareous) Rego Humic Gleysol
60 70 95 2HM
5 Daken Rego Humic Gleysol
60 48 95 3HM
6 Mundare-gl Gleyed Black Chernozem
60 50 95 3HM
8 Millet Orthic Humic Gleysol
60 67 95 2HM
9 Mundare-zz Rego Black Chernozem
60 75 95 2HM
13 Millet-ca Orthic Humic Gleysol
60 71 95 2HM
16 Mundare Orthic Black Chernozem
60 70 95 2HM
20 Mundare-zzgl
Gleyed Rego Black Chernozem
60 66 95 2HM
24 Mundare-zzgl
Gleyed Calcareous Black Chernozem
60 53 95 3HMW
27 Millet Orthic Humic Gleysol
60 43 95 3HM
SOURCE: Shell (2005a, b)

Sturgeon Upgrader Project Volume 2: Environmental and Appendix 17A: Terrain and Soil Data Socio-economic Impact Assessment
December 2006 Page 17A-86
17A.6.1 Agricultural Capability Calculations
CLIMATE (C) Sturgeon Area – for all sites
1. Moisture component (A) P – PE index = 200 10
A = 100 - 10 = 90 2. Temperature factor (H) EGDD index = 1200 40
H = 100 - 40 = 60 Basic Climatic Rating is (lower of A or H) = 60 a) 3. Modifiers - spring moisture - - fall moisture - - fall frost - Modification deduction - % of a) = - b)
NOTE: individual modifiers should not exceed 10% deduction 4. FINAL CLIMATE RATING = a) 60 -b) 0 = 60
= Class 2 , H subclass(es)

Volume 2: Environmental and Sturgeon Upgrader ProjectSocio-economic Impact Assessment Appendix 17A: Terrain and Soil Data
December 2006
Page 17A-87
LANDSCAPE (L) Sturgeon Area – for all sites
1. Region (from Fig. 6.1) 2 percent slope most <2 landscape type complex 5 most slopes less than 100 m Basic landscaping rating (T) = 100 - 5 = 95 a) Percent Deduction 2. Coarse fragment modification - stoniness (P) Class 1 0 - coarse fragments (P) <10 0 - wood content (J) 0 0 - coarse fragment deduction = 0 % a) = 0 b) 95 Interim landscape rating = a) 95 - b) 0 = 95 c) 3. Other modifications 5? 5 - pattern (K) 0 0 - flooding (I) 0 Other deductions = 5 % c) = 4.75 d)
4. FINAL LANDSCAPE RATING (L) = a) 95 -b) 0 - d) 4.75 = 90
= Class 1 , subclass(es)

Sturgeon Upgrader Project Volume 2: Environmental and Appendix 17A: Terrain and Soil Data Socio-economic Impact Assessment
December 2006 Page 17A-88
Mineral Soil (S) Site: MAK- Menaik
Factor Value Deduction 1. Moisture Factor (M) - P-PE index (from map 1) 200 - AWHC/surface texture L 10 - subsurface texture L 0 Texture deduction = 10 a) - water table depth VP 100 % a) = 10 b Moisture deduction = a) 10 - b) 10 = 0 c) Point Deduction 2. Surface Factors - structure/consistence (D) GR 0 - OM context (color) (F) 5 0 - depth of top soil (E) 20 0 - reaction (pH) (V) = 7.6 0 - salinity (EC) (N) 0 0 - sodicity (SAR) (Y) <1 0 - peat depth (O) 0 0 fibre 0 0
Interim soil rating = 0 – c) 0 - 0 = d) 100 Percent Deduction 3. Subsurface Factors - impeding layer (D,R) - texture L - structure/ density 40 - depth - 0 - contrasting texture 7.5 - - reaction (V) 1 0 - salinity (N) 0 0 - sodicity (Y) - 0 Subsurface deduction = 100 0 % d) = 0 e)0 Basic Soil Rating = d) 100 -e) 0 = 100 f) 4. Drainage Factor (W) - drainage class or depth to water table VP 95 Drainage deduction = L 95 % f) = 95 g) 5. FINAL SOIL RATING (S) = f) 100 - g) 95 = 5
= Class 7 , H W subclass(es)
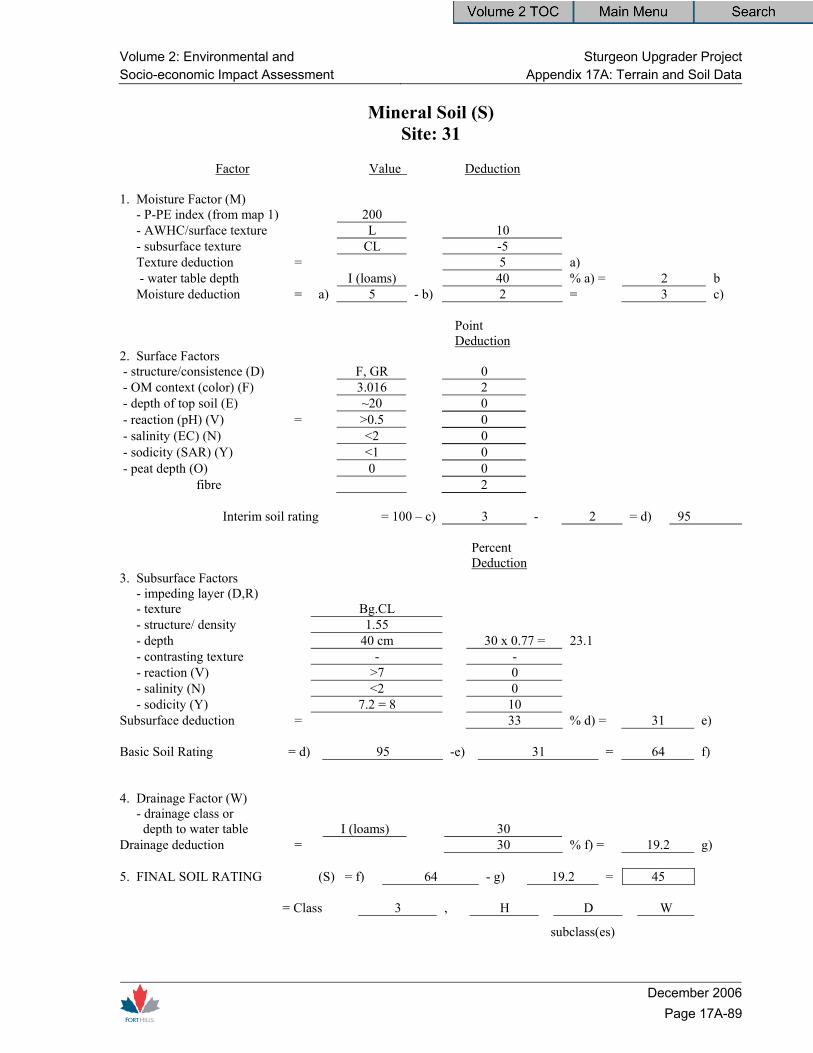
Volume 2: Environmental and Sturgeon Upgrader ProjectSocio-economic Impact Assessment Appendix 17A: Terrain and Soil Data
December 2006
Page 17A-89
Mineral Soil (S) Site: 31
Factor Value Deduction 1. Moisture Factor (M) - P-PE index (from map 1) 200 - AWHC/surface texture L 10 - subsurface texture CL -5 Texture deduction = 5 a) - water table depth I (loams) 40 % a) = 2 b Moisture deduction = a) 5 - b) 2 = 3 c) Point Deduction 2. Surface Factors - structure/consistence (D) F, GR 0 - OM context (color) (F) 3.016 2 - depth of top soil (E) ~20 0 - reaction (pH) (V) = >0.5 0 - salinity (EC) (N) <2 0 - sodicity (SAR) (Y) <1 0 - peat depth (O) 0 0 fibre 2
Interim soil rating = 100 – c) 3 - 2 = d) 95 Percent Deduction 3. Subsurface Factors - impeding layer (D,R) - texture Bg.CL - structure/ density 1.55 - depth 40 cm 30 x 0.77 = 23.1 - contrasting texture - - - reaction (V) >7 0 - salinity (N) <2 0 - sodicity (Y) 7.2 = 8 10 Subsurface deduction = 33 % d) = 31 e) Basic Soil Rating = d) 95 -e) 31 = 64 f) 4. Drainage Factor (W) - drainage class or depth to water table I (loams) 30 Drainage deduction = 30 % f) = 19.2 g) 5. FINAL SOIL RATING (S) = f) 64 - g) 19.2 = 45
= Class 3 , H D W
subclass(es)

Sturgeon Upgrader Project Volume 2: Environmental and Appendix 17A: Terrain and Soil Data Socio-economic Impact Assessment
December 2006 Page 17A-90
Mineral Soil (S) Site: 77
Factor Value Deduction 1. Moisture Factor (M) - P-PE index (from map 1) 200 - AWHC/surface texture Loam 10 - subsurface texture ~Loam - Texture deduction = 10 a) - water table depth I 40 % a) = 4 b Moisture deduction = a) 10 - b) 4 = 6 c) Point Deduction 2. Surface Factors - structure/consistence (D) Friable 0 - OM context (color) (F) 2.32 = 2 5 - depth of top soil (E) >20 0 - reaction (pH) (V) = 5.3, 5.5 5 - salinity (EC) (N) <2 0 - sodicity (SAR) (Y) <2 0 - peat depth (O) 0 0 fibre 10
Interim soil rating = 100 – c) 6 - 10 = d) 84 Percent Deduction 3. Subsurface Factors - impeding layer (D,R) - texture Btg.CL - structure/ density CL - depth ~40 10 x 0.77 = 7.7 - contrasting texture - - - reaction (V) gen. 7.6 0 - salinity (N) <2 0 - sodicity (Y) <2 0 Subsurface deduction = 7.7 % d) = 6.5 e) Basic Soil Rating = d) 84 -e) 6.5 = 77.5 f) 4. Drainage Factor (W) - drainage class or depth to water table I 30 Drainage deduction = 30 % f) = 23.25 g) 5. FINAL SOIL RATING (S) = f) 77.5 - g) 23.25 = 54
= Class 3 , H W subclass(es)

Volume 2: Environmental and Sturgeon Upgrader ProjectSocio-economic Impact Assessment Appendix 17A: Terrain and Soil Data
December 2006
Page 17A-91
Mineral Soil (S) Site: 84
Factor Value Deduction 1. Moisture Factor (M) - P-PE index (from map 1) 200 - AWHC/surface texture L 10 - subsurface texture SL +5 Texture deduction = 15 a) - water table depth Well 0 % a) = 0 b Moisture deduction = a) 15 - b) 0 = 15 c) Point Deduction 2. Surface Factors - structure/consistence (D) SB/F 0 - OM context (color) (F) 2.842 2 - depth of top soil (E) 20 0 - reaction (pH) (V) = 6.0 0 - salinity (EC) (N) <1 0 - sodicity (SAR) (Y) Not Recl. n/a - peat depth (O) 0 0 fibre 2
Interim soil rating = 100 – c) 15 - 2 = d) 83 Percent Deduction 3. Subsurface Factors - impeding layer (D,R) - texture Bnt - structure/ density Loam - 1.55 - depth ~40 20 x 0.77 = 15.4 - contrasting texture - - - reaction (V) <6 0 - salinity (N) <1 0 - sodicity (Y) Not Recl. n/a Subsurface deduction = 15.4 % d) = 12.8 e) Basic Soil Rating = d) 83 -e) 12.8 = 70.2 f) 4. Drainage Factor (W) - drainage class or depth to water table Well 0 Drainage deduction = 0 % f) = 0 g) 5. FINAL SOIL RATING (S) = f) 70.2 - g) 0 = 70.2
= Class 2 , H D subclass(es)
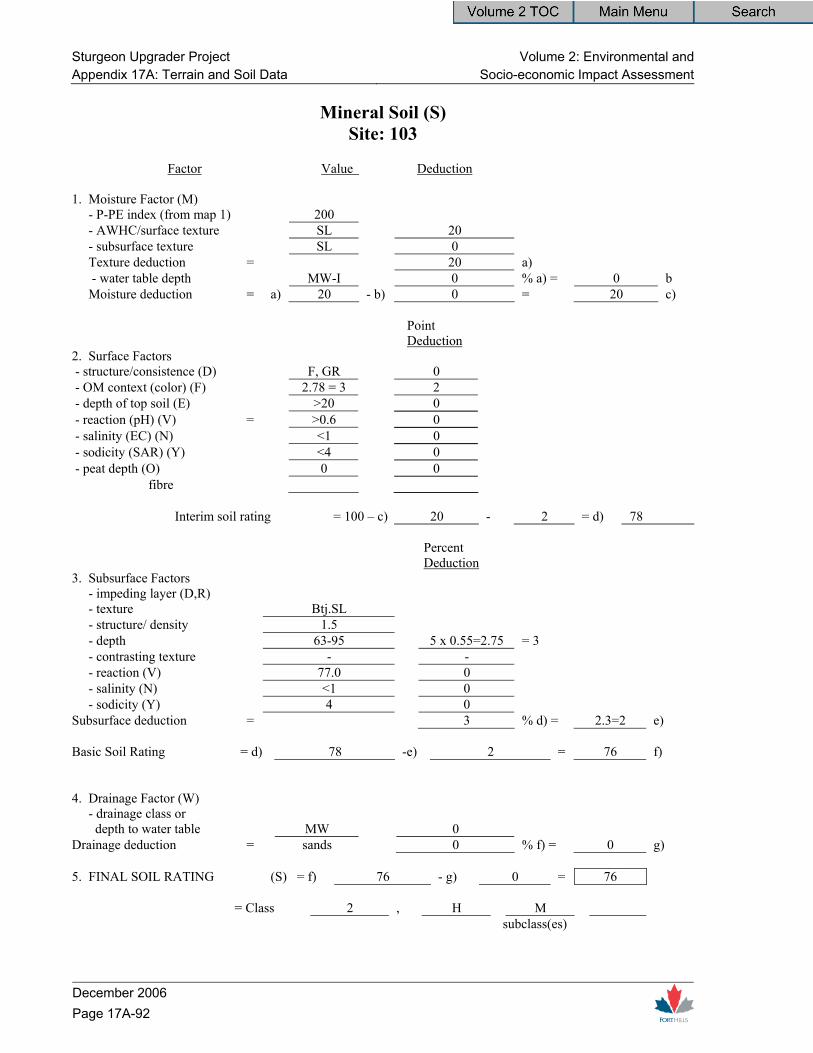
Sturgeon Upgrader Project Volume 2: Environmental and Appendix 17A: Terrain and Soil Data Socio-economic Impact Assessment
December 2006 Page 17A-92
Mineral Soil (S) Site: 103
Factor Value Deduction 1. Moisture Factor (M) - P-PE index (from map 1) 200 - AWHC/surface texture SL 20 - subsurface texture SL 0 Texture deduction = 20 a) - water table depth MW-I 0 % a) = 0 b Moisture deduction = a) 20 - b) 0 = 20 c) Point Deduction 2. Surface Factors - structure/consistence (D) F, GR 0 - OM context (color) (F) 2.78 = 3 2 - depth of top soil (E) >20 0 - reaction (pH) (V) = >0.6 0 - salinity (EC) (N) <1 0 - sodicity (SAR) (Y) <4 0 - peat depth (O) 0 0 fibre
Interim soil rating = 100 – c) 20 - 2 = d) 78 Percent Deduction 3. Subsurface Factors - impeding layer (D,R) - texture Btj.SL - structure/ density 1.5 - depth 63-95 5 x 0.55=2.75 = 3 - contrasting texture - - - reaction (V) 77.0 0 - salinity (N) <1 0 - sodicity (Y) 4 0 Subsurface deduction = 3 % d) = 2.3=2 e) Basic Soil Rating = d) 78 -e) 2 = 76 f) 4. Drainage Factor (W) - drainage class or depth to water table MW 0 Drainage deduction = sands 0 % f) = 0 g) 5. FINAL SOIL RATING (S) = f) 76 - g) 0 = 76
= Class 2 , H M subclass(es)

Volume 2: Environmental and Sturgeon Upgrader ProjectSocio-economic Impact Assessment Appendix 17A: Terrain and Soil Data
December 2006
Page 17A-93
Mineral Soil (S) Site: 144
Factor Value Deduction 1. Moisture Factor (M) - P-PE index (from map 1) 200 - AWHC/surface texture loam 10 - subsurface texture loam 10 Texture deduction = 10 a) - water table depth mod.well 0 % a) = 0 b Moisture deduction = a) 10 - b) = c) Point Deduction 2. Surface Factors - structure/consistence (D) SB/F 0 - OM context (color) (F) 2.32% 5 - depth of top soil (E) >20 0 - reaction (pH) (V) = 6.1 0 - salinity (EC) (N) 9.21 0 - sodicity (SAR) (Y) 0.6 0 - peat depth (O) 0 0 fibre
Interim soil rating = 100 – c) 10 - 5 = d) 85 Percent Deduction 3. Subsurface Factors - impeding layer (D,R) Bn.tg 30 - texture SCL x .55 - structure/ density 1.55 - depth 60 cm 16.5 ~ 17 - contrasting texture - reaction (V) all >5.5 0 - salinity (N) √ - sodicity (Y) √ 0 Subsurface deduction = 17 % d) = 14.5 e) Basic Soil Rating = d) 85 -e) 15 = 70 f) 4. Drainage Factor (W) - drainage class or depth to water table mod. well 10 Drainage deduction = 10 % f) = 7 g) 5. FINAL SOIL RATING (S) = f) 70 - g) 7 = 63
= Class 2 , H D subclass(es)
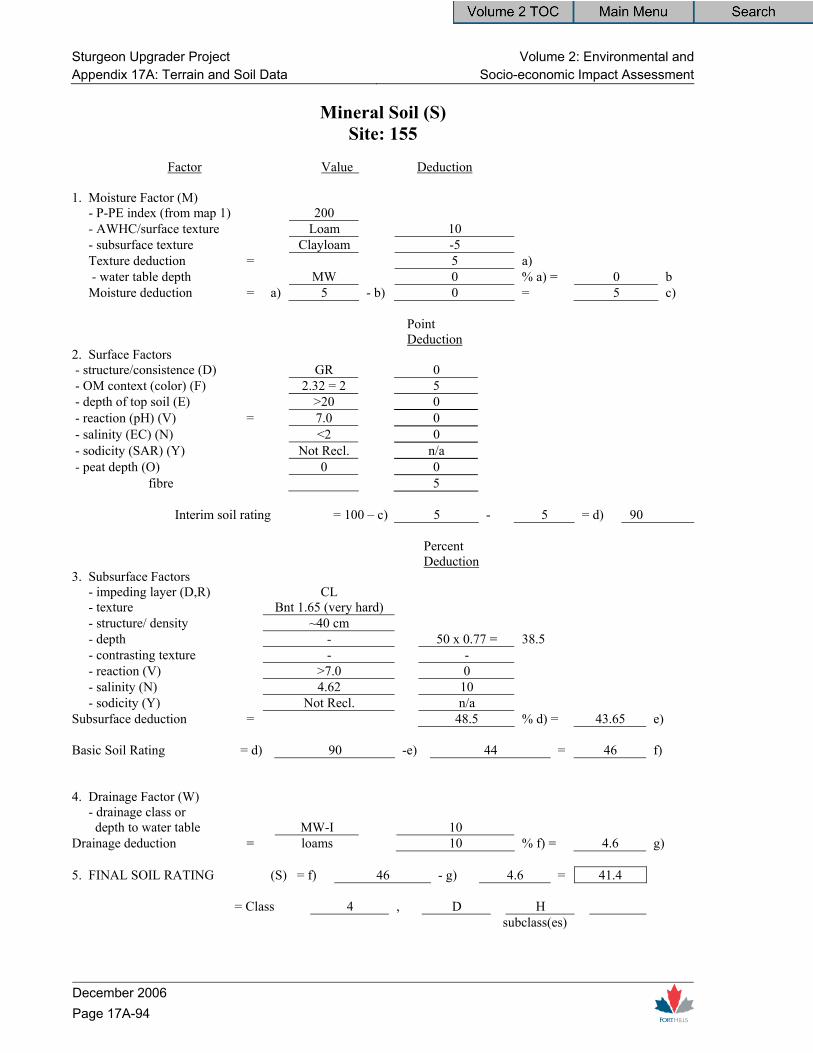
Sturgeon Upgrader Project Volume 2: Environmental and Appendix 17A: Terrain and Soil Data Socio-economic Impact Assessment
December 2006 Page 17A-94
Mineral Soil (S) Site: 155
Factor Value Deduction 1. Moisture Factor (M) - P-PE index (from map 1) 200 - AWHC/surface texture Loam 10 - subsurface texture Clayloam -5 Texture deduction = 5 a) - water table depth MW 0 % a) = 0 b Moisture deduction = a) 5 - b) 0 = 5 c) Point Deduction 2. Surface Factors - structure/consistence (D) GR 0 - OM context (color) (F) 2.32 = 2 5 - depth of top soil (E) >20 0 - reaction (pH) (V) = 7.0 0 - salinity (EC) (N) <2 0 - sodicity (SAR) (Y) Not Recl. n/a - peat depth (O) 0 0 fibre 5
Interim soil rating = 100 – c) 5 - 5 = d) 90 Percent Deduction 3. Subsurface Factors - impeding layer (D,R) CL - texture Bnt 1.65 (very hard) - structure/ density ~40 cm - depth - 50 x 0.77 = 38.5 - contrasting texture - - - reaction (V) >7.0 0 - salinity (N) 4.62 10 - sodicity (Y) Not Recl. n/a Subsurface deduction = 48.5 % d) = 43.65 e) Basic Soil Rating = d) 90 -e) 44 = 46 f) 4. Drainage Factor (W) - drainage class or depth to water table MW-I 10 Drainage deduction = loams 10 % f) = 4.6 g) 5. FINAL SOIL RATING (S) = f) 46 - g) 4.6 = 41.4
= Class 4 , D H subclass(es)

Volume 2: Environmental and Sturgeon Upgrader ProjectSocio-economic Impact Assessment Appendix 17A: Terrain and Soil Data
December 2006
Page 17A-95
Mineral Soil (S) Site: 176
Factor Value Deduction 1. Moisture Factor (M) - P-PE index (from map 1) 200 - AWHC/surface texture L 10 - subsurface texture ~SCL-L 0 Texture deduction = 10 a) - water table depth I 40 % a) = 4 b Moisture deduction = a) 10 - b) 4 = 6 c) Point Deduction 2. Surface Factors - structure/consistence (D) GR/FR 0 - OM context (color) (F) 2.08 5 - depth of top soil (E) >20 0 - reaction (pH) (V) = 5.5 5 - salinity (EC) (N) <1 0 - sodicity (SAR) (Y) <1 0 - peat depth (O) 0 0 fibre 10
Interim soil rating = 100 – c) 6 - 10 = d) 84 Percent Deduction 3. Subsurface Factors - impeding layer (D,R) - texture Btg friable SCL - structure/ density ~1.45 - depth 40 5 x 0.77 = 3.85 - contrasting texture - - - reaction (V) >6 0 - salinity (N) <1 0 - sodicity (Y) <1 0 Subsurface deduction = 3.85 % d) = 3.3 e) Basic Soil Rating = d) 84 -e) 3.3 = 80.7 f) 4. Drainage Factor (W) - drainage class or depth to water table I 30 Drainage deduction = ~ loams 30 % f) = 24.2 g) 5. FINAL SOIL RATING (S) = f) 80.7 - g) 24.2 = 56.5
= Class 3 , H W subclass(es)

Sturgeon Upgrader Project Volume 2: Environmental and Appendix 17A: Terrain and Soil Data Socio-economic Impact Assessment
December 2006 Page 17A-96
Mineral Soil (S) Site: 179
Factor Value Deduction 1. Moisture Factor (M) - P-PE index (from map 1) 200 - AWHC/surface texture Loam 10 - subsurface texture SCL/L - Texture deduction = 10 a) - water table depth Poor 90 % a) = 9 b Moisture deduction = a) 10 - b) 9 = 1 c) Point Deduction 2. Surface Factors - structure/consistence (D) GR/FR 0 - OM context (color) (F) 2.32 5 - depth of top soil (E) >20 0 - reaction (pH) (V) = 6.3 0 - salinity (EC) (N) <1 - sodicity (SAR) (Y) Not Recl. n/a - peat depth (O) 0 0 fibre 5
Interim soil rating = 100 – c) 1 - 5 = d) 94 Percent Deduction 3. Subsurface Factors - impeding layer (D,R) - texture Bnjtg (firm) - structure/ density SCL = 1.55 - depth 35 ~ 40 20 x 0.77 = 15.4 - contrasting texture - - reaction (V) >6.0 0 - salinity (N) <4 0 - sodicity (Y) Not Recl. n/a Subsurface deduction = 15.4 % d) = 14.47 e) Basic Soil Rating = d) 94 -e) 14.47 = 79.53 f) 4. Drainage Factor (W) - drainage class or depth to water table Poor 70 Drainage deduction = 70 % f) = 55.67 g) 5. FINAL SOIL RATING (S) = f) 79.53 - g) 55.7 = 23.8
= Class 5 , H D W subclass(es)
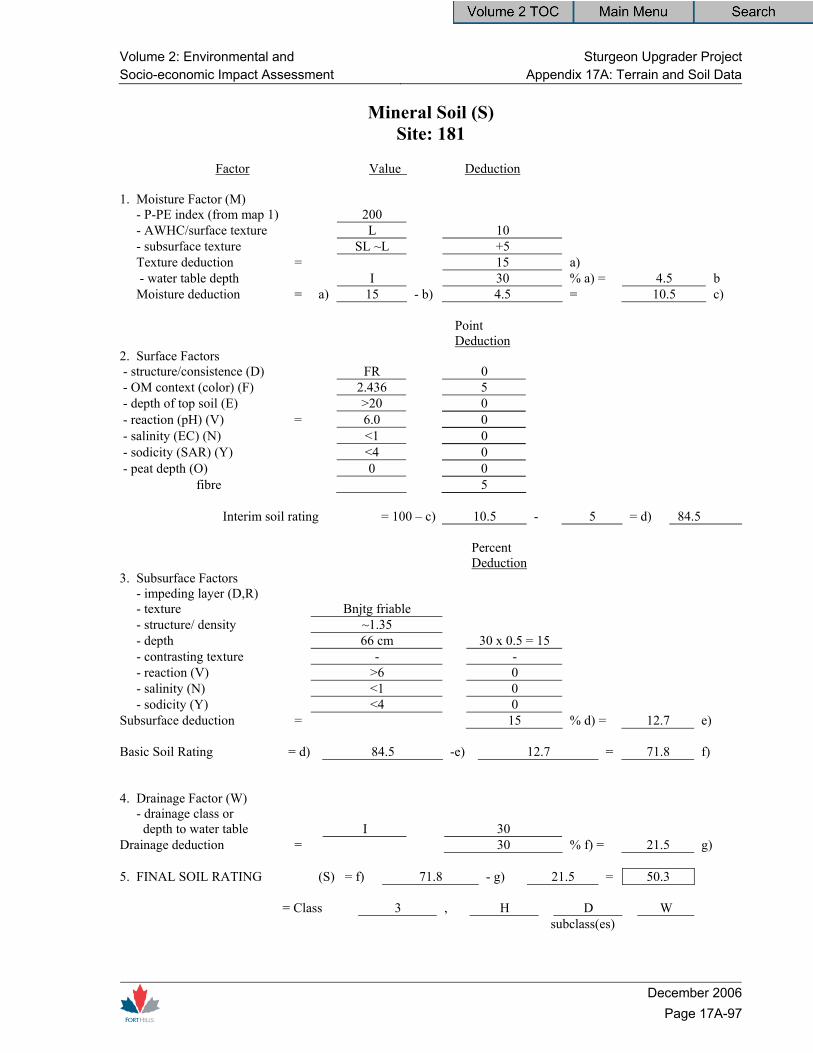
Volume 2: Environmental and Sturgeon Upgrader ProjectSocio-economic Impact Assessment Appendix 17A: Terrain and Soil Data
December 2006
Page 17A-97
Mineral Soil (S) Site: 181
Factor Value Deduction 1. Moisture Factor (M) - P-PE index (from map 1) 200 - AWHC/surface texture L 10 - subsurface texture SL ~L +5 Texture deduction = 15 a) - water table depth I 30 % a) = 4.5 b Moisture deduction = a) 15 - b) 4.5 = 10.5 c) Point Deduction 2. Surface Factors - structure/consistence (D) FR 0 - OM context (color) (F) 2.436 5 - depth of top soil (E) >20 0 - reaction (pH) (V) = 6.0 0 - salinity (EC) (N) <1 0 - sodicity (SAR) (Y) <4 0 - peat depth (O) 0 0 fibre 5
Interim soil rating = 100 – c) 10.5 - 5 = d) 84.5 Percent Deduction 3. Subsurface Factors - impeding layer (D,R) - texture Bnjtg friable - structure/ density ~1.35 - depth 66 cm 30 x 0.5 = 15 - contrasting texture - - - reaction (V) >6 0 - salinity (N) <1 0 - sodicity (Y) <4 0 Subsurface deduction = 15 % d) = 12.7 e) Basic Soil Rating = d) 84.5 -e) 12.7 = 71.8 f) 4. Drainage Factor (W) - drainage class or depth to water table I 30 Drainage deduction = 30 % f) = 21.5 g) 5. FINAL SOIL RATING (S) = f) 71.8 - g) 21.5 = 50.3
= Class 3 , H D W subclass(es)

Sturgeon Upgrader Project Volume 2: Environmental and Appendix 17A: Terrain and Soil Data Socio-economic Impact Assessment
December 2006 Page 17A-98
Mineral Soil (S) Site: 187
Factor Value Deduction 1. Moisture Factor (M) - P-PE index (from map 1) 200 - AWHC/surface texture Loam 10 - subsurface texture SL-LS +10 Texture deduction = 20 a) - water table depth Poor 90 % a) = 18 b Moisture deduction = a) 20 - b) 18 = 2 c) Point Deduction 2. Surface Factors - structure/consistence (D) GR/FR 0 - OM context (color) (F) 2.8 2 - depth of top soil (E) >20 0 - reaction (pH) (V) = 6.3 0 - salinity (EC) (N) <2 0 - sodicity (SAR) (Y) Not Recl. n/a - peat depth (O) 0 0 fibre 2
Interim soil rating = 100 – c) 2 - 2 = d) 96 Percent Deduction 3. Subsurface Factors - impeding layer (D,R) - texture SL - structure/ density 1.55 - depth 40 cm 8 x 0.77 = 6.16 - contrasting texture - - - reaction (V) >6.0 0 - salinity (N) <2 0 - sodicity (Y) Not Recl. n/a Subsurface deduction = 6.16 % d) = 5.91 e) Basic Soil Rating = d) -e) = f) 4. Drainage Factor (W) - drainage class or depth to water table Poor 70 Drainage deduction = 70 % f) = 62.9 g) 5. FINAL SOIL RATING (S) = f) 89.8 - g) 62.9 = 27
= Class 5 , H W subclass(es)

Volume 2: Environmental and Sturgeon Upgrader ProjectSocio-economic Impact Assessment Appendix 17A: Terrain and Soil Data
December 2006
Page 17A-99
Mineral Soil (S) Site: 196
Factor Value Deduction 1. Moisture Factor (M) - P-PE index (from map 1) 200 - AWHC/surface texture SL 20 - subsurface texture SL/SCL 0 Texture deduction = 20 a) - water table depth MW - 7 0 % a) = 0 b Moisture deduction = a) 20 - b) 0 = 20 c) Point Deduction 2. Surface Factors - structure/consistence (D) Friable 0 - OM context (color) (F) 2.32 = 2 5 - depth of top soil (E) >20 0 - reaction (pH) (V) = 5.5 5 - salinity (EC) (N) <1 0 - sodicity (SAR) (Y) <1 0 - peat depth (O) 0 0 fibre 10
Interim soil rating = 100 – c) 20 - 10 = d) 70 Percent Deduction 3. Subsurface Factors - impeding layer (D,R) Bm/Bgj - texture SL - structure/ density 1.45 - depth 62 cm 0 - contrasting texture - - - reaction (V) >7.0 0 - salinity (N) <1 0 - sodicity (Y) <1 0 Subsurface deduction = 0 % d) = 0 e) Basic Soil Rating = d) 70 -e) 0 = 70 f) 4. Drainage Factor (W) sandy loams - drainage class or SCL depth to water table 10 Drainage deduction = MW 10 % f) = 7 g) 5. FINAL SOIL RATING (S) = f) 70 - g) 7 = 63
= Class 2 , H M subclass(es)

Sturgeon Upgrader Project Volume 2: Environmental and Appendix 17A: Terrain and Soil Data Socio-economic Impact Assessment
December 2006 Page 17A-100
Mineral Soil (S) Site: 219
Factor Value Deduction 1. Moisture Factor (M) - P-PE index (from map 1) 200 - AWHC/surface texture Loam 10 - subsurface texture SL +5 Texture deduction = 15 a) - water table depth MW 0 % a) = 0 b Moisture deduction = a) 15 - b) 0 = 15 c) Point Deduction 2. Surface Factors - structure/consistence (D) Friable/GR 0 - OM context (color) (F) 2.55 = 3 2 - depth of top soil (E) >20 0 - reaction (pH) (V) = 5.5 5 - salinity (EC) (N) <2 0 - sodicity (SAR) (Y) <4 0 - peat depth (O) 0 0 fibre 7
Interim soil rating = 100 – c) 15 - 7 = d) 78 Percent Deduction 3. Subsurface Factors - impeding layer (D,R) - texture SL-Bm - structure/ density 1.45 - depth - 0 - contrasting texture - - - reaction (V) >6.5 0 - salinity (N) <2 0 - sodicity (Y) <4 0 Subsurface deduction = 0 % d) = 0 e) Basic Soil Rating = d) 78 -e) 0 = 78 f) 4. Drainage Factor (W) - drainage class or depth to water table Loams 0 Drainage deduction = NW 0 % f) = 0 g) 5. FINAL SOIL RATING (S) = f) 78 - g) 0 = 78
= Class 2 , H M subclass(es)
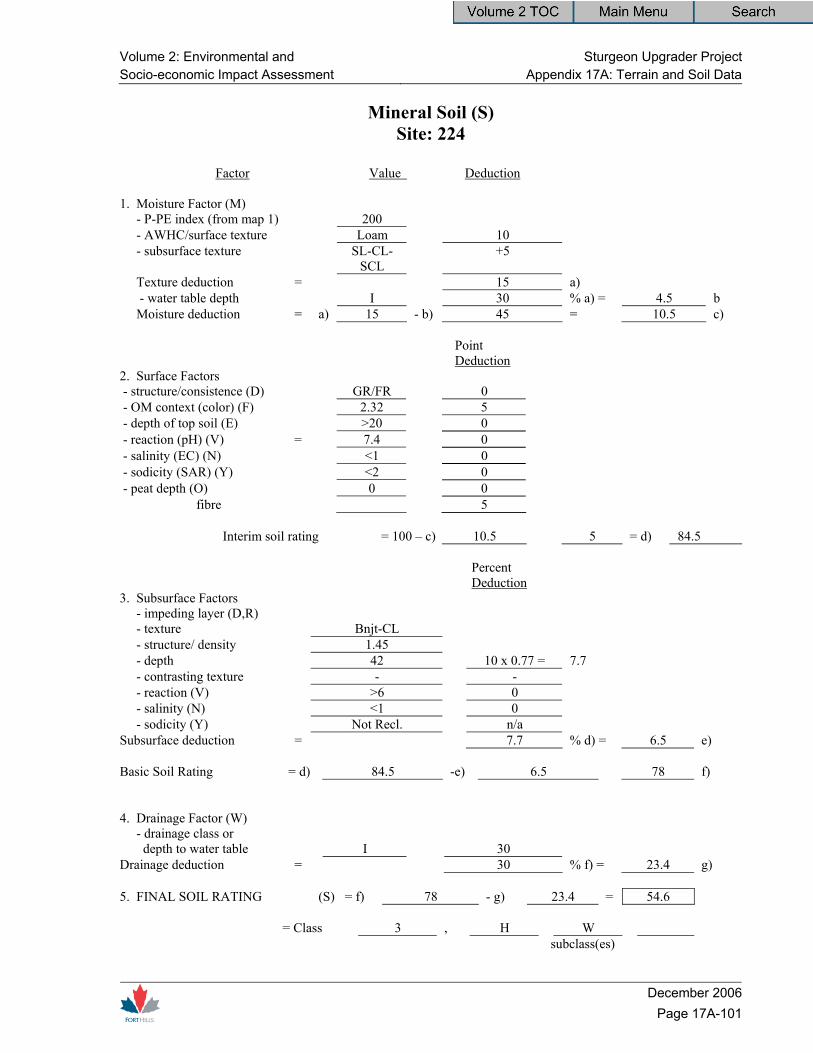
Volume 2: Environmental and Sturgeon Upgrader ProjectSocio-economic Impact Assessment Appendix 17A: Terrain and Soil Data
December 2006
Page 17A-101
Mineral Soil (S) Site: 224
Factor Value Deduction 1. Moisture Factor (M) - P-PE index (from map 1) 200 - AWHC/surface texture Loam 10 - subsurface texture SL-CL-
SCL +5
Texture deduction = 15 a) - water table depth I 30 % a) = 4.5 b Moisture deduction = a) 15 - b) 45 = 10.5 c) Point Deduction 2. Surface Factors - structure/consistence (D) GR/FR 0 - OM context (color) (F) 2.32 5 - depth of top soil (E) >20 0 - reaction (pH) (V) = 7.4 0 - salinity (EC) (N) <1 0 - sodicity (SAR) (Y) <2 0 - peat depth (O) 0 0 fibre 5
Interim soil rating = 100 – c) 10.5 5 = d) 84.5 Percent Deduction 3. Subsurface Factors - impeding layer (D,R) - texture Bnjt-CL - structure/ density 1.45 - depth 42 10 x 0.77 = 7.7 - contrasting texture - - - reaction (V) >6 0 - salinity (N) <1 0 - sodicity (Y) Not Recl. n/a Subsurface deduction = 7.7 % d) = 6.5 e) Basic Soil Rating = d) 84.5 -e) 6.5 78 f) 4. Drainage Factor (W) - drainage class or depth to water table I 30 Drainage deduction = 30 % f) = 23.4 g) 5. FINAL SOIL RATING (S) = f) 78 - g) 23.4 = 54.6
= Class 3 , H W subclass(es)

Sturgeon Upgrader Project Volume 2: Environmental and Appendix 17A: Terrain and Soil Data Socio-economic Impact Assessment
December 2006 Page 17A-102
Mineral Soil (S) Site: 244
Factor Value Deduction 1. Moisture Factor (M) - P-PE index (from map 1) 200 - AWHC/surface texture L 10 - subsurface texture L ~ SL 0 Texture deduction = 10 a) - water table depth I 40 % a) = 4.0 b Moisture deduction = a) 10 - b) 4.0 = 6 c) Point Deduction 2. Surface Factors - structure/consistence (D) FR 0 - OM context (color) (F) 1.9 5 - depth of top soil (E) ~20 0 - reaction (pH) (V) = 6.8 0 - salinity (EC) (N) <2 0 - sodicity (SAR) (Y) <2 0 - peat depth (O) 0 0 fibre - 5
Interim soil rating = 100 – c) 6 - 5 = d) 89 Percent Deduction 3. Subsurface Factors - impeding layer (D,R) - texture Bntgj friable - structure/ density SCL - 1.5 - depth 20 cm 10 x 0.97 = 9.7 - contrasting texture - - - reaction (V) >6 0 - salinity (N) <2 0 - sodicity (Y) Not Recl. n/a Subsurface deduction = 9.7 % d) = 8.6 e) Basic Soil Rating = d) 89 -e) 8.6 = 80.4 f) 4. Drainage Factor (W) - drainage class or depth to water table I 30 Drainage deduction = 30 % f) = 24.12 g) 5. FINAL SOIL RATING (S) = f) 80.4 - g) 24.12 = 56.3
= Class 3 , H W subclass(es)

Volume 2: Environmental and Sturgeon Upgrader ProjectSocio-economic Impact Assessment Appendix 17A: Terrain and Soil Data
December 2006
Page 17A-103
Mineral Soil (S) Site: 309
Factor Value Deduction 1. Moisture Factor (M) - P-PE index (from map 1) 200 - AWHC/surface texture Loam 10 - subsurface texture ~SL +5 Texture deduction = 15 a) - water table depth MW - I 0 % a) = 0 b Moisture deduction = a) 15 - b) 0 = 15 c) Point Deduction 2. Surface Factors - structure/consistence (D) G, F 0 - OM context (color) (F) 2.78 = 3 2 - depth of top soil (E) 20 0 - reaction (pH) (V) = 6.7 0 - salinity (EC) (N) <1 0 - sodicity (SAR) (Y) <2 0 - peat depth (O) 0 0 fibre 2
Interim soil rating = 100 – c) 15 - 2 = d) 83 Percent Deduction 3. Subsurface Factors - impeding layer (D,R) - texture Bnt - structure/ density Loam 1.55 - depth 31 20 x 0.85 = 17 - contrasting texture - - - reaction (V) >7.0 0 - salinity (N) <4.0 0 - sodicity (Y) Not Recl. n/a Subsurface deduction = 17 % d) = 14.11 e) Basic Soil Rating = d) 83 -e) 14 = 69 f) 4. Drainage Factor (W) - drainage class or depth to water table MW-I 10 Drainage deduction = 10 % f) = 6.9 g) 5. FINAL SOIL RATING (S) = f) 69 - g) 6.9 = 62
= Class 2 , H M D subclass(es)
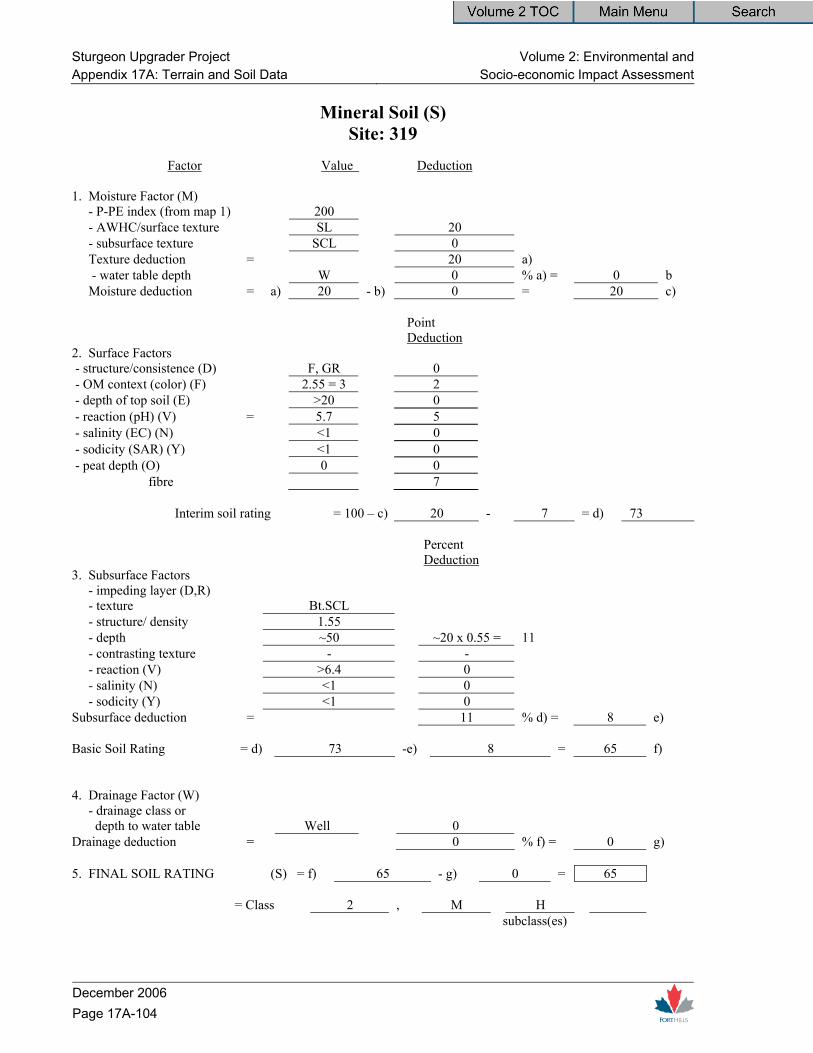
Sturgeon Upgrader Project Volume 2: Environmental and Appendix 17A: Terrain and Soil Data Socio-economic Impact Assessment
December 2006 Page 17A-104
Mineral Soil (S) Site: 319
Factor Value Deduction 1. Moisture Factor (M) - P-PE index (from map 1) 200 - AWHC/surface texture SL 20 - subsurface texture SCL 0 Texture deduction = 20 a) - water table depth W 0 % a) = 0 b Moisture deduction = a) 20 - b) 0 = 20 c) Point Deduction 2. Surface Factors - structure/consistence (D) F, GR 0 - OM context (color) (F) 2.55 = 3 2 - depth of top soil (E) >20 0 - reaction (pH) (V) = 5.7 5 - salinity (EC) (N) <1 0 - sodicity (SAR) (Y) <1 0 - peat depth (O) 0 0 fibre 7
Interim soil rating = 100 – c) 20 - 7 = d) 73 Percent Deduction 3. Subsurface Factors - impeding layer (D,R) - texture Bt.SCL - structure/ density 1.55 - depth ~50 ~20 x 0.55 = 11 - contrasting texture - - - reaction (V) >6.4 0 - salinity (N) <1 0 - sodicity (Y) <1 0 Subsurface deduction = 11 % d) = 8 e) Basic Soil Rating = d) 73 -e) 8 = 65 f) 4. Drainage Factor (W) - drainage class or depth to water table Well 0 Drainage deduction = 0 % f) = 0 g) 5. FINAL SOIL RATING (S) = f) 65 - g) 0 = 65
= Class 2 , M H subclass(es)

Volume 2: Environmental and Sturgeon Upgrader ProjectSocio-economic Impact Assessment Appendix 17A: Terrain and Soil Data
December 2006
Page 17A-105
Mineral Soil (S) Site: 410
Factor Value Deduction 1. Moisture Factor (M) - P-PE index (from map 1) 200 - AWHC/surface texture L 10 - subsurface texture C-SL +5 Texture deduction = 15 a) - water table depth MW 0 % a) = 0 b Moisture deduction = a) 15 - b) 0 = 15 c) Point Deduction 2. Surface Factors - structure/consistence (D) G, F 0 - OM context (color) (F) 2.8 2 - depth of top soil (E) 20 0 - reaction (pH) (V) = 6.3 0 - salinity (EC) (N) <2 0 - sodicity (SAR) (Y) Not Recl. n/a - peat depth (O) 0 0 fibre 2
Interim soil rating = 100 – c) 15 - 2 = d) 83 Percent Deduction 3. Subsurface Factors - impeding layer (D,R)
- texture Bnt extreme. [email protected]
- structure/ density Loam - 1.6 - depth 40 30 x 0.77 = 23.1 - contrasting texture - - - reaction (V) >6 0 - salinity (N) <2 0 - sodicity (Y) Not Recl. n/a Subsurface deduction = 23.1 % d) = 19.17 e) Basic Soil Rating = d) 83 -e) 19.17 = 63.8 f) 4. Drainage Factor (W) - drainage class or depth to water table NW 0 Drainage deduction = 0 % f) = 0 g) 5. FINAL SOIL RATING (S) = f) 63.8 - g) 0 = 63.8
= Class 3 , H M D subclass(es)

Sturgeon Upgrader Project Volume 2: Environmental and Appendix 17A: Terrain and Soil Data Socio-economic Impact Assessment
December 2006 Page 17A-106
Mineral Soil (S) Site: 438
Factor Value Deduction 1. Moisture Factor (M) - P-PE index (from map 1) 200 - AWHC/surface texture Loam 10 - subsurface texture SL/Loam +5 Texture deduction = 15 a) - water table depth I 40 % a) = 6 b Moisture deduction = a) 15 - b) 6 = 9 c) Point Deduction 2. Surface Factors - structure/consistence (D) GR/F 0 - OM context (color) (F) 2.84 2 - depth of top soil (E) 20 cm 0 - reaction (pH) (V) = 7.0 0 - salinity (EC) (N) <2 0 - sodicity (SAR) (Y) Not Recl. - - peat depth (O) 0 0 fibre 2
Interim soil rating = 100 – c) 9 - 2 = d) 89 Percent Deduction 3. Subsurface Factors - impeding layer (D,R) - texture Bnj (friable) - structure/ density ~1.40 - depth 0 - contrasting texture - - - reaction (V) >1 0 - salinity (N) <1 0 - sodicity (Y) Not Recl. n/a Subsurface deduction = 0 % d) = 0 e) Basic Soil Rating = d) 89 -e) 0 = 89 f) 4. Drainage Factor (W) - drainage class or depth to water table I 30 Drainage deduction = 30 % f) = 26.7 g) 5. FINAL SOIL RATING (S) = f) 89 - g) 26.7 = 62.3
= Class 2 , H W subclass(es)

Volume 2: Environmental and Sturgeon Upgrader ProjectSocio-economic Impact Assessment Appendix 17A: Terrain and Soil Data
December 2006
Page 17A-107
Mineral Soil (S) Site: 518
Factor Value Deduction 1. Moisture Factor (M) - P-PE index (from map 1) 200 - AWHC/surface texture SL 20 - subsurface texture SL 0 Texture deduction = 20 a) - water table depth MW 0 % a) = 0 b Moisture deduction = a) 20 - b) 0 = 20 c) Point Deduction 2. Surface Factors - structure/consistence (D) GR 0 - OM context (color) (F) 2.32 5 - depth of top soil (E) >20 0 - reaction (pH) (V) = 6.2 0 - salinity (EC) (N) <2 0 - sodicity (SAR) (Y) <3 0 - peat depth (O) 0 0 fibre 5
Interim soil rating = 100 – c) 20 - 5 = d) 75 Percent Deduction 3. Subsurface Factors - impeding layer (D,R) - texture - - structure/ density 1.45 - depth 43 0 - contrasting texture - 0 - reaction (V) >7 0 - salinity (N) <1 0 - sodicity (Y) <2 0 Subsurface deduction = 0 % d) = 0 e) Basic Soil Rating = d) 75 -e) 0 = 75 f) 4. Drainage Factor (W) - drainage class or depth to water table MW 0 Drainage deduction = SL 0 % f) = 0 g) 5. FINAL SOIL RATING (S) = f) 75 - g) 0 = 75
= Class 2 , H M subclass(es)

Sturgeon Upgrader Project Volume 2: Environmental and Appendix 17A: Terrain and Soil Data Socio-economic Impact Assessment
December 2006 Page 17A-108
Mineral Soil (S) Site: 612
Factor Value Deduction 1. Moisture Factor (M) - P-PE index (from map 1) 200 - AWHC/surface texture L 10 - subsurface texture SL/LS +10 Texture deduction = 20 a) - water table depth MW 0 % a) = 0 b Moisture deduction = a) 20 - b) 0 = 20 c) Point Deduction 2. Surface Factors - structure/consistence (D) F, GR 0 - OM context (color) (F) 2.49 = 2 5 - depth of top soil (E) 20 0 - reaction (pH) (V) = 6.4 0 - salinity (EC) (N) <1 0 - sodicity (SAR) (Y) <2 0 - peat depth (O) 0 5 fibre
Interim soil rating = 100 – c) 20 - 5 = d) 75 Percent Deduction 3. Subsurface Factors - impeding layer (D,R) - texture SL - structure/ density Loose - depth - 0 - contrasting texture - - - reaction (V) >7.0 0 - salinity (N) <1 0 - sodicity (Y) <2 0 Subsurface deduction = 0 % d) = 0 e) Basic Soil Rating = d) 75 -e) 0 75 f) 4. Drainage Factor (W) - drainage class or depth to water table MW-I 0 Drainage deduction = 0 % f) = 0 g) 5. FINAL SOIL RATING (S) = f) 75 - g) 0 = 75
= Class 2 , H M subclass(es)

Volume 2: Environmental and Sturgeon Upgrader ProjectSocio-economic Impact Assessment Appendix 17A: Terrain and Soil Data
December 2006
Page 17A-109
Mineral Soil (S) Site: 653
Factor Value Deduction 1. Moisture Factor (M) - P-PE index (from map 1) 200 - AWHC/surface texture L 10 - subsurface texture L 0 Texture deduction = 10 a) - water table depth I-MW 0 % a) = 0 b Moisture deduction = a) 10 - b) 0 = 10 c) Point Deduction 2. Surface Factors - structure/consistence (D) 0 - OM context (color) (F) 2.55% 2 - depth of top soil (E) 18-no RR 0 - reaction (pH) (V) = 6.2 0 - salinity (EC) (N) 4 0 - sodicity (SAR) (Y) 4 0 - peat depth (O) 0 0 fibre
Interim soil rating = 100 – c) 10 - 2 = d) 88 Percent Deduction 3. Subsurface Factors - impeding layer (D,R) - texture 1.4 - structure/ density 0 - depth - 0 - contrasting texture - - - reaction (V) >7.0 0 - salinity (N) <1 0 - sodicity (Y) <1 0 Subsurface deduction = 0 % d) = 0 e) Basic Soil Rating = d) 88 -e) 0 = 88 f) 4. Drainage Factor (W) - drainage class or depth to water table I-MW 10 Drainage deduction = 10 % f) = 9 g) 5. FINAL SOIL RATING (S) = f) 88 - g) 9 = 79
= Class 2 , H subclass(es)

Sturgeon Upgrader Project Volume 2: Environmental and Appendix 17A: Terrain and Soil Data Socio-economic Impact Assessment
December 2006 Page 17A-110
Mineral Soil (S) Site: 678
Factor Value Deduction 1. Moisture Factor (M) - P-PE index (from map 1) 200 - AWHC/surface texture LS 40 - subsurface texture SL -5 Texture deduction = 35 a) - water table depth MW-I 0 % a) = 0 b Moisture deduction = a) 35 - b) 0 = 35 c) Point Deduction 2. Surface Factors - structure/consistence (D) Friable 0 - OM context (color) (F) 1-9 5 - depth of top soil (E) >20 0 - reaction (pH) (V) = 8-0 5 - salinity (EC) (N) 6-2 35 - sodicity (SAR) (Y) Not Recl. n/a - peat depth (O) 0 0 fibre
Interim soil rating = 100 – c) 35 - 40 = d) 25 Percent Deduction 3. Subsurface Factors - impeding layer (D,R) Bnts - firm - texture SCL - block stony - structure/ density 1.6 - depth 70 cm 20x0.42=8.4 - contrasting texture - - reaction (V) >6 0 - salinity (N) less than surface - - sodicity (Y) Not Recl. n/a Subsurface deduction = 8.4 % d) = 2.1 e) Basic Soil Rating = d) 25 -e) 2.1 = 22.9 f) 4. Drainage Factor (W) - drainage class or depth to water table MW-I 5 Drainage deduction = 5 % f) = 1.15 g) 5. FINAL SOIL RATING (S) = f) 22.9 - g) 1.15 21.75
= Class 5 , H M N subclass(es)
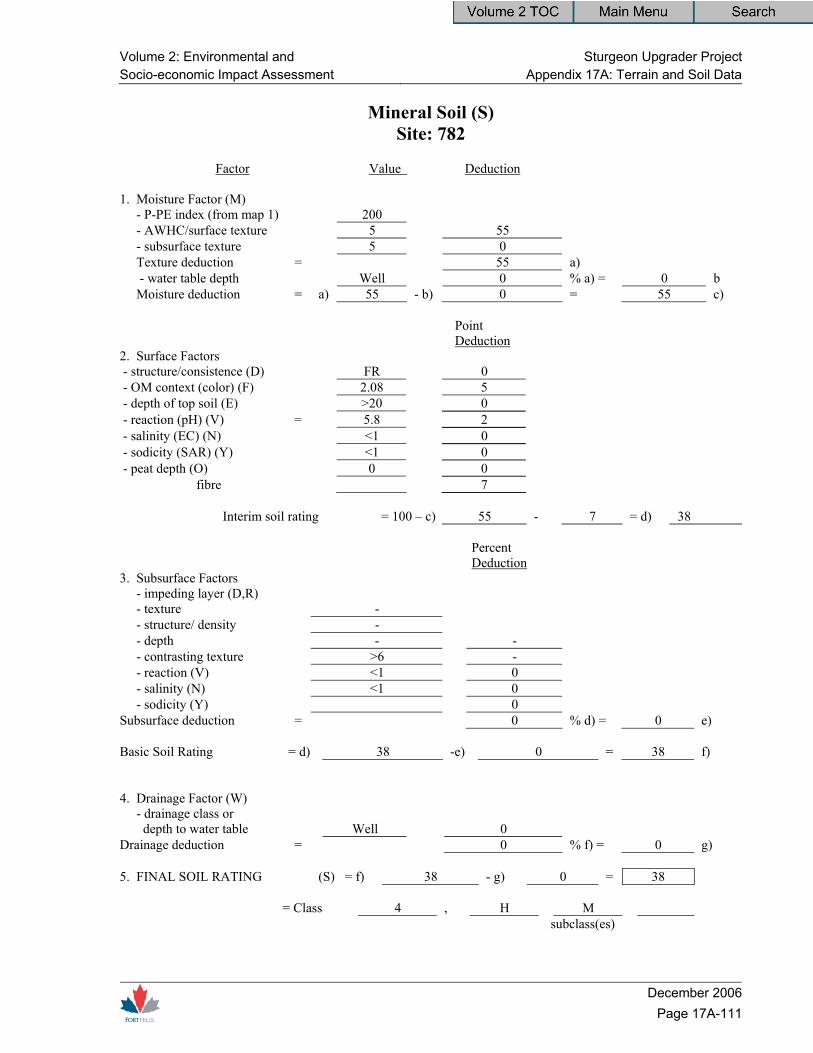
Volume 2: Environmental and Sturgeon Upgrader ProjectSocio-economic Impact Assessment Appendix 17A: Terrain and Soil Data
December 2006
Page 17A-111
Mineral Soil (S) Site: 782
Factor Value Deduction 1. Moisture Factor (M) - P-PE index (from map 1) 200 - AWHC/surface texture 5 55 - subsurface texture 5 0 Texture deduction = 55 a) - water table depth Well 0 % a) = 0 b Moisture deduction = a) 55 - b) 0 = 55 c) Point Deduction 2. Surface Factors - structure/consistence (D) FR 0 - OM context (color) (F) 2.08 5 - depth of top soil (E) >20 0 - reaction (pH) (V) = 5.8 2 - salinity (EC) (N) <1 0 - sodicity (SAR) (Y) <1 0 - peat depth (O) 0 0 fibre 7
Interim soil rating = 100 – c) 55 - 7 = d) 38 Percent Deduction 3. Subsurface Factors - impeding layer (D,R) - texture - - structure/ density - - depth - - - contrasting texture >6 - - reaction (V) <1 0 - salinity (N) <1 0 - sodicity (Y) 0 Subsurface deduction = 0 % d) = 0 e) Basic Soil Rating = d) 38 -e) 0 = 38 f) 4. Drainage Factor (W) - drainage class or depth to water table Well 0 Drainage deduction = 0 % f) = 0 g) 5. FINAL SOIL RATING (S) = f) 38 - g) 0 = 38
= Class 4 , H M subclass(es)

Sturgeon Upgrader Project Volume 2: Environmental and Appendix 17A: Terrain and Soil Data Socio-economic Impact Assessment
December 2006 Page 17A-112
Mineral Soil (S) Site: 900
Factor Value Deduction 1. Moisture Factor (M) - P-PE index (from map 1) 200 - AWHC/surface texture L 10 - subsurface texture L-SL 0 Texture deduction = 10 a) - water table depth I 40 % a) = 4.0 b Moisture deduction = a) 10 - b) 4.0 = 6 c) Point Deduction 2. Surface Factors - structure/consistence (D) FR/SB 0 - OM context (color) (F) 2.78 2 - depth of top soil (E) >20 0 - reaction (pH) (V) = ~6.16 0 - salinity (EC) (N) <2 0 - sodicity (SAR) (Y) <1 0 - peat depth (O) 0 0 fibre
Interim soil rating = 100 – c) 6 - 2 = d) 92 Percent Deduction 3. Subsurface Factors - impeding layer (D,R) friable - texture Bgj-SCL, blocky - structure/ density 1.45 - depth 40 5 x 0.77 = 3.85 - contrasting texture - - - reaction (V) >6 0 - salinity (N) <1 0 - sodicity (Y) <1 0 Subsurface deduction = 3.85 % d) = 3.5 e) Basic Soil Rating = d) 92 -e) 3.5 = 88.5 f) 4. Drainage Factor (W) - drainage class or depth to water table I 30 Drainage deduction = 30 % f) = 26.55 g) 5. FINAL SOIL RATING (S) = f) 88.5 - g) 26.55 = 61.95
= Class 2 , H W subclass(es)

Volume 2: Environmental and Sturgeon Upgrader ProjectSocio-economic Impact Assessment Appendix 17A: Terrain and Soil Data
December 2006
Page 17A-113
Mineral Soil (S) Site: 966
Factor Value Deduction 1. Moisture Factor (M) - P-PE index (from map 1) 200 - AWHC/surface texture SL 20 - subsurface texture ~LS +5 Texture deduction = 25 a) - water table depth W 0 % a) = 0 b Moisture deduction = a) 25 - b) 0 = 25 c) Point Deduction 2. Surface Factors - structure/consistence (D) SB/FR 0 - OM context (color) (F) 1.5 7 - depth of top soil (E) ~20 0 - reaction (pH) (V) = 7.4, 7.5 0 - salinity (EC) (N) <2 0 - sodicity (SAR) (Y) <1 0 - peat depth (O) 0 0 fibre 7
Interim soil rating = 100 – c) 75 - 7 = d) 68 Percent Deduction 3. Subsurface Factors - impeding layer (D,R) - texture Bm.SL friable - structure/ density 1.45 - depth - 0 - contrasting texture - - - reaction (V) >6 0 - salinity (N) <1 0 - sodicity (Y) <1 Subsurface deduction = 0 % d) = 0 e) Basic Soil Rating = d) 68 -e) 0 = 68 f) 4. Drainage Factor (W) - drainage class or depth to water table W 0 Drainage deduction = 0 % f) = 0 g) 5. FINAL SOIL RATING (S) = f) 68 - g) 0 = 68
= Class 2 , H M subclass(es)
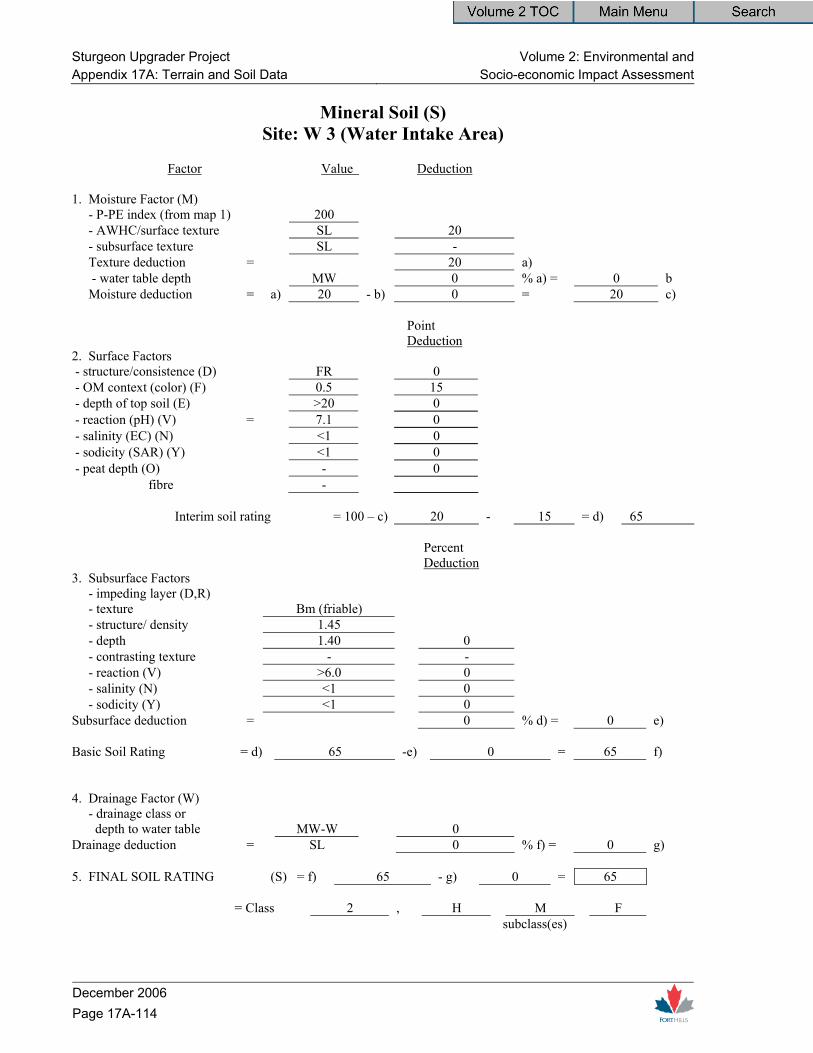
Sturgeon Upgrader Project Volume 2: Environmental and Appendix 17A: Terrain and Soil Data Socio-economic Impact Assessment
December 2006 Page 17A-114
Mineral Soil (S) Site: W 3 (Water Intake Area)
Factor Value Deduction 1. Moisture Factor (M) - P-PE index (from map 1) 200 - AWHC/surface texture SL 20 - subsurface texture SL - Texture deduction = 20 a) - water table depth MW 0 % a) = 0 b Moisture deduction = a) 20 - b) 0 = 20 c) Point Deduction 2. Surface Factors - structure/consistence (D) FR 0 - OM context (color) (F) 0.5 15 - depth of top soil (E) >20 0 - reaction (pH) (V) = 7.1 0 - salinity (EC) (N) <1 0 - sodicity (SAR) (Y) <1 0 - peat depth (O) - 0 fibre -
Interim soil rating = 100 – c) 20 - 15 = d) 65 Percent Deduction 3. Subsurface Factors - impeding layer (D,R) - texture Bm (friable) - structure/ density 1.45 - depth 1.40 0 - contrasting texture - - - reaction (V) >6.0 0 - salinity (N) <1 0 - sodicity (Y) <1 0 Subsurface deduction = 0 % d) = 0 e) Basic Soil Rating = d) 65 -e) 0 = 65 f) 4. Drainage Factor (W) - drainage class or depth to water table MW-W 0 Drainage deduction = SL 0 % f) = 0 g) 5. FINAL SOIL RATING (S) = f) 65 - g) 0 = 65
= Class 2 , H M F subclass(es)

Volume 2: Environmental and Sturgeon Upgrader ProjectSocio-economic Impact Assessment Appendix 17A: Terrain and Soil Data
December 2006
Page 17A-115
Mineral Soil (S) Site: KSY- Kerensky
Factor Value Deduction 1. Moisture Factor (M) - P-PE index (from map 1) 200 - AWHC/surface texture L 10 - subsurface texture SiL -5 Texture deduction = 5 a) - water table depth VP 100 % a) = 5 b Moisture deduction = a) 5 - b) 5 = 0 c) Point Deduction 2. Surface Factors - structure/consistence (D) GR 0 - OM context (color) (F) 2.9 2 - depth of top soil (E) 25 0 - reaction (pH) (V) = 7.7 0 - salinity (EC) (N) 0 0 - sodicity (SAR) (Y) 0 0 - peat depth (O) 0 0 fibre 0
Interim soil rating = 0 – c) 2 - 2 = d) 98 Percent Deduction 3. Subsurface Factors - impeding layer (D,R) - texture SiL - structure/ density 1.4 - depth - 0 - contrasting texture - 0 - reaction (V) 7.7 0 - salinity (N) 0 0 - sodicity (Y) - 0 Subsurface deduction = 0 % d) = 0 e) Basic Soil Rating = d) 98 -e) 0 = 98 f) 4. Drainage Factor (W) - drainage class or depth to water table VP 95 Drainage deduction = % f) = 93.1 g) 5. FINAL SOIL RATING (S) = f) 98 - g) 93.1 = 4.9
= Class 7 , H W
subclass(es)

Sturgeon Upgrader Project Volume 2: Environmental and Appendix 17A: Terrain and Soil Data Socio-economic Impact Assessment
December 2006 Page 17A-116
Table 17A-64: AGRASID 3.0 Map Unit Descriptions for Polygons Occurring within the Regional Study Area
Polygon Number
Soil Series
Symbol 1
Soil Dominance
1
Soil Series
Symbol 2
Soil Dominance
2
Soil Series
Symbol 3
Soil Dominance
3
Soil Series
Symbol 4
Soil Dominance
4
Soil Series
Symbol 5
Soil Dominance
5
Polygon Area (ha)
14100 PHS C2 WTB S1 MDR C1 592.19 14113 PHS S2 ZOR S1 MDR D 1712.57 14086 MDR C2 CMO C1 123.43 14104 PRM S1 MDR D 104.61 14122 PHSgl S1 PHS D PRM S2 650.31 11710 ZWA C2 ZUN C1 1382.68 14098 MDR C2 PHS C1 369.76 14133 ZOR C2 PRM C1 4854.50 14094 ZGW S1 HBM C1 POK C2 734.63 14135 ZGW D ZUN S2 ZOR S1 6.66 14117 HLW S1 MDR C2 UKT C1 13.65 14109 MDR D POK S2 ZGW S3 FTH S1 335.66 14084 POK S1 AGS D 199.45 11707 ZWA C3 ZGW C2 ZUN C1 130.81 14087 ZGW S2 AGS S1 CMO D 2.61 19748 ELP S1 PHS D 18.62 14089 PHS S1 FTH C2 POK C1 236.17 16029 PHS D ZGW S1 55.18 14140 ZUN D 27.69 14132 ZOR S1 PRM D 203.27 14127 PHS D AGS S1 0.02 14120 PRM C1 MNTaa C2 330.96 16028 PHS D ZGW S2 POK S1 19.18 14107 PRM S1 MDR D 836.70 14119 MNTaa C2 PRM C1 1853.13 14085 ZGW S2 AGS D POK S1 307.38 14116 MDR D ZERzbl S1 718.33

Volume 2: Environmental and Sturgeon Upgrader ProjectSocio-economic Impact Assessment Appendix 17A: Terrain and Soil Data
December 2006
Page 17A-117
Table 17A-64: AGRASID 3.0 Map Unit Descriptions for Polygons Occurring within the Regional Study Area (cont’d)
Polygon Number
Soil Series
Symbol 1
Soil Dominance
1
Soil Series
Symbol 2
Soil Dominance
2
Soil Series
Symbol 3
Soil Dominance
3
Soil Series
Symbol 4
Soil Dominance
4
Soil Series
Symbol 5
Soil Dominance
5
Polygon Area (ha)
16037 ZUN D 84.85 14115 MDR D ZERzbl S1 1134.84 14139 ZUN D 319.90 14091 ZGW S3 AGS S1 POK S2 CMO S4 HBM D 1162.52 14276 MMO D NVR S1 5.88 14237 ZGW S1 ZUN D 673.07 14093 HBM C2 POK C1 1218.49 14112 ZGW S1 MDR D 702.56 14126 PHS D POK S1 679.52 14123 PHSgl S1 PHS D PRM S2 330.03 14121 PHS C2 RDW C1 66.13 14222 RMY C2 WTB C1 154.53 14272 ZSZzbl S2 ZGW S1 MMO C1 NVR C2 698.99 14040 MMOxt S1 AGS D ZGW S2 1205.88 14217 KVG S2 POKxp S1 POK D 333.02 14283 HBM S2 ZGW S1 POK D 1212.87 15078 CMO S2 HBM S1 AGS D 421.42 14182 MCO S1 MMO D 1797.21 14148 AGS D 144.88 14141 ZUN D 486.84 14246 ZUN D 250.82 15082 CMO D KVG S1 357.93 14102 PRM S1 MDR D 1591.49 14162 ZUN S1 ZGW S2 KVG D 2181.62 14239 RLV S1 AGS D 2489.10 14160 HBM C1 POK C2 MMO S1 1758.92
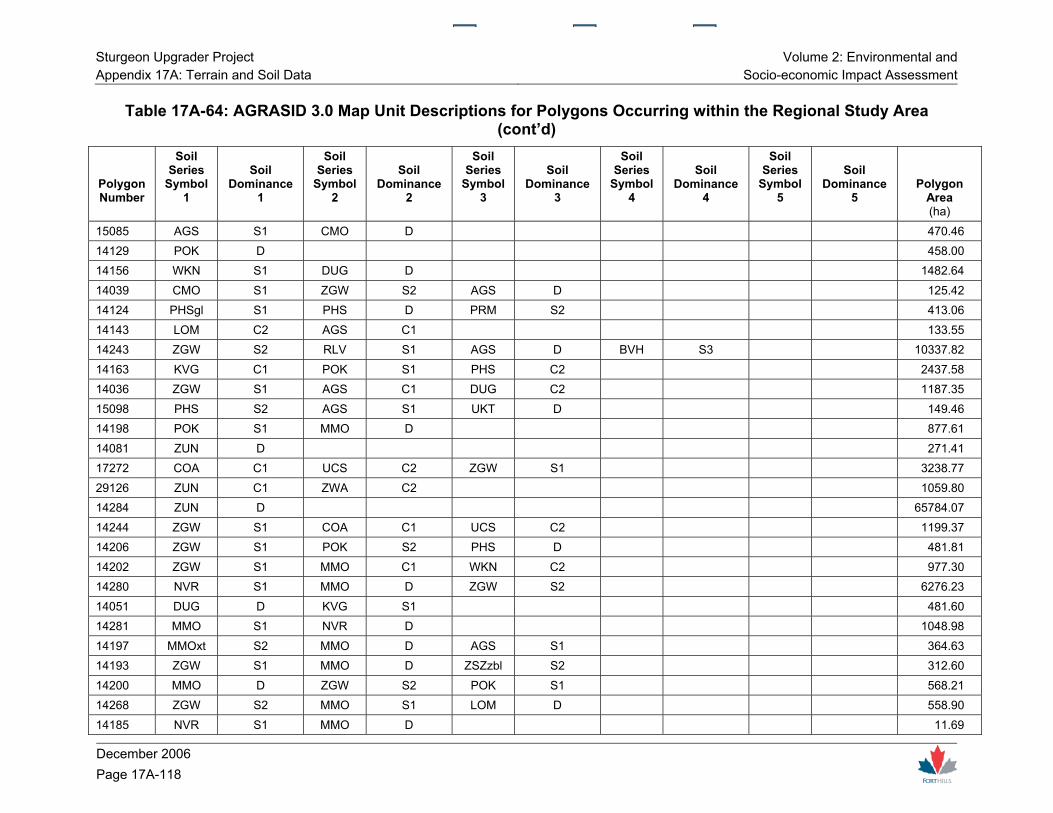
Sturgeon Upgrader Project Volume 2: Environmental and Appendix 17A: Terrain and Soil Data Socio-economic Impact Assessment
December 2006 Page 17A-118
Table 17A-64: AGRASID 3.0 Map Unit Descriptions for Polygons Occurring within the Regional Study Area (cont’d)
Polygon Number
Soil Series
Symbol 1
Soil Dominance
1
Soil Series
Symbol 2
Soil Dominance
2
Soil Series
Symbol 3
Soil Dominance
3
Soil Series
Symbol 4
Soil Dominance
4
Soil Series
Symbol 5
Soil Dominance
5
Polygon Area (ha)
15085 AGS S1 CMO D 470.46 14129 POK D 458.00 14156 WKN S1 DUG D 1482.64 14039 CMO S1 ZGW S2 AGS D 125.42 14124 PHSgl S1 PHS D PRM S2 413.06 14143 LOM C2 AGS C1 133.55 14243 ZGW S2 RLV S1 AGS D BVH S3 10337.82 14163 KVG C1 POK S1 PHS C2 2437.58 14036 ZGW S1 AGS C1 DUG C2 1187.35 15098 PHS S2 AGS S1 UKT D 149.46 14198 POK S1 MMO D 877.61 14081 ZUN D 271.41 17272 COA C1 UCS C2 ZGW S1 3238.77 29126 ZUN C1 ZWA C2 1059.80 14284 ZUN D 65784.07 14244 ZGW S1 COA C1 UCS C2 1199.37 14206 ZGW S1 POK S2 PHS D 481.81 14202 ZGW S1 MMO C1 WKN C2 977.30 14280 NVR S1 MMO D ZGW S2 6276.23 14051 DUG D KVG S1 481.60 14281 MMO S1 NVR D 1048.98 14197 MMOxt S2 MMO D AGS S1 364.63 14193 ZGW S1 MMO D ZSZzbl S2 312.60 14200 MMO D ZGW S2 POK S1 568.21 14268 ZGW S2 MMO S1 LOM D 558.90 14185 NVR S1 MMO D 11.69

Volume 2: Environmental and Sturgeon Upgrader ProjectSocio-economic Impact Assessment Appendix 17A: Terrain and Soil Data
December 2006
Page 17A-119
Table 17A-64: AGRASID 3.0 Map Unit Descriptions for Polygons Occurring within the Regional Study Area (cont’d)
Polygon Number
Soil Series
Symbol 1
Soil Dominance
1
Soil Series
Symbol 2
Soil Dominance
2
Soil Series
Symbol 3
Soil Dominance
3
Soil Series
Symbol 4
Soil Dominance
4
Soil Series
Symbol 5
Soil Dominance
5
Polygon Area (ha)
17251 COA D ZWA S4 UCS S1 ZGW S2 ZCOzbl S3 14146.23 14159 ZGW S2 MMO S1 WKN C2 DUG C1 677.90 14210 RMY S1 POK D 169.73 14242 AGS D ZGW S1 239.30 14191 MNK S1 MMO D ZGW S2 1334.03 17288 ELP C1 GBL C2 203.55 17305 UCS C1 ZGW S2 COA S1 RMY C2 549.95 14245 MMO S1 NVR D 506.39 14240 RLV S1 AGS D 1559.44 17324 ZWA D 591.14 17275 UCS C2 ZGW S1 COA C1 984.05 14184 MCO S1 MMO D 919.87 14199 POK S1 MMO D ZGW S2 767.75 14233 ZUN D 231.94 14278 MMO D NVR S1 307.26 14236 ZGW S1 ZUN D 130.79 14187 NVR S1 MMO D 90.93 14241 AGS D ZGW S1 4067.89 14265 AGS C1 MMO C2 1073.86 14275 MMO D NVR S1 325.48 17245 ZWA S2 ZGW S3 MIQ S1 COA D 1229.63 17260 ZGW S1 COA C2 MIQ C1 498.99 14183 MCO S1 MMO D 367.40 14269 MMO S2 ZGW S3 AGS S1 LOM D 573.54 14270 MCO C2 AGS C3 ZGW S1 LOM C1 1580.98 14277 MMO D NVR S1 1447.42
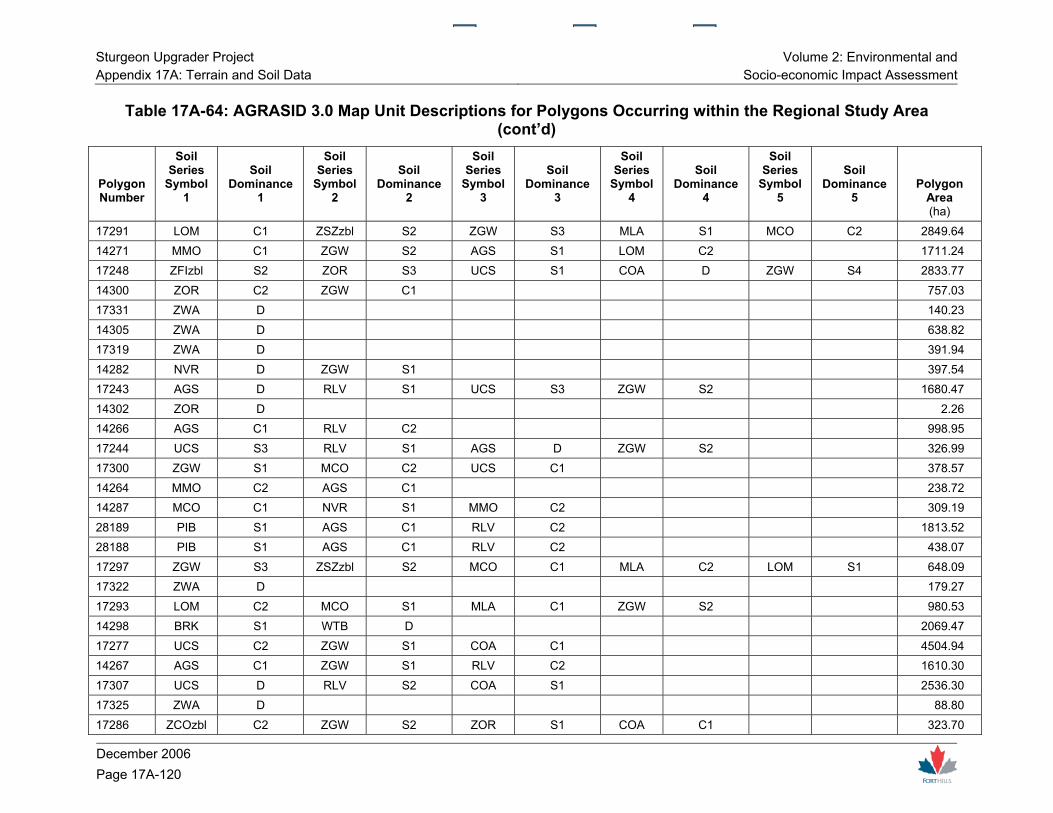
Sturgeon Upgrader Project Volume 2: Environmental and Appendix 17A: Terrain and Soil Data Socio-economic Impact Assessment
December 2006 Page 17A-120
Table 17A-64: AGRASID 3.0 Map Unit Descriptions for Polygons Occurring within the Regional Study Area (cont’d)
Polygon Number
Soil Series
Symbol 1
Soil Dominance
1
Soil Series
Symbol 2
Soil Dominance
2
Soil Series
Symbol 3
Soil Dominance
3
Soil Series
Symbol 4
Soil Dominance
4
Soil Series
Symbol 5
Soil Dominance
5
Polygon Area (ha)
17291 LOM C1 ZSZzbl S2 ZGW S3 MLA S1 MCO C2 2849.64 14271 MMO C1 ZGW S2 AGS S1 LOM C2 1711.24 17248 ZFIzbl S2 ZOR S3 UCS S1 COA D ZGW S4 2833.77 14300 ZOR C2 ZGW C1 757.03 17331 ZWA D 140.23 14305 ZWA D 638.82 17319 ZWA D 391.94 14282 NVR D ZGW S1 397.54 17243 AGS D RLV S1 UCS S3 ZGW S2 1680.47 14302 ZOR D 2.26 14266 AGS C1 RLV C2 998.95 17244 UCS S3 RLV S1 AGS D ZGW S2 326.99 17300 ZGW S1 MCO C2 UCS C1 378.57 14264 MMO C2 AGS C1 238.72 14287 MCO C1 NVR S1 MMO C2 309.19 28189 PIB S1 AGS C1 RLV C2 1813.52 28188 PIB S1 AGS C1 RLV C2 438.07 17297 ZGW S3 ZSZzbl S2 MCO C1 MLA C2 LOM S1 648.09 17322 ZWA D 179.27 17293 LOM C2 MCO S1 MLA C1 ZGW S2 980.53 14298 BRK S1 WTB D 2069.47 17277 UCS C2 ZGW S1 COA C1 4504.94 14267 AGS C1 ZGW S1 RLV C2 1610.30 17307 UCS D RLV S2 COA S1 2536.30 17325 ZWA D 88.80 17286 ZCOzbl C2 ZGW S2 ZOR S1 COA C1 323.70

Volume 2: Environmental and Sturgeon Upgrader ProjectSocio-economic Impact Assessment Appendix 17A: Terrain and Soil Data
December 2006
Page 17A-121
Table 17A-64: AGRASID 3.0 Map Unit Descriptions for Polygons Occurring within the Regional Study Area (cont’d)
Polygon Number
Soil Series
Symbol 1
Soil Dominance
1
Soil Series
Symbol 2
Soil Dominance
2
Soil Series
Symbol 3
Soil Dominance
3
Soil Series
Symbol 4
Soil Dominance
4
Soil Series
Symbol 5
Soil Dominance
5
Polygon Area (ha)
14600 UCS C2 RLV C1 COA S1 346.47 17269 COA C1 UCS C2 ZGW S1 3604.28 17258 COA D ZGW S2 ZOR S1 1143.45 17294 LOM C2 MLA C1 AGS S1 ZOR S3 ZGW S2 598.50 17301 ZGW S1 ZWA C3 MYW C2 MLA C1 931.87 14610 UCS S1 ZGW S2 RLV D 77.55 14295 WTB D 139.21 14293 WTB C2 POK C1 153.06 17252 ZOR S1 ZGW S2 COA D 93.93 17296 LOM C1 MCO S3 ZGW S2 ZWA S1 UCS C2 771.28 14612 ZGW S3 COA S2 LOM S4 UCS D RLV S1 2423.49 17321 ZWA D 99.12 17290 UCS C2 MCO C3 KWO C1 ZGW S1 900.69 14611 COA S1 UCS D RLV S2 162.91 17253 COA D ZOR S1 ZGW S2 544.14 17317 ZWA D 239.32 14301 ZWA S1 ZGW C2 ZOR C1 155.28 14294 PRM D ZOR S2 HLW S1 777.88 14594 COA C1 UCS C2 RLV S1 ZGW S2 378.48 17315 ZWA D 130.35 17284 ZGW S1 COA C1 ZWA S2 ZCOzbl S3 UCS C2 108.61 Total 215195.46
NOTES: D – Dominant soil C – Co-dominant soil S – Significant soil

Sturgeon Upgrader Project Volume 2: Environmental and Appendix 17A: Terrain and Soil Data Socio-economic Impact Assessment
December 2006 Page 17A-122