Embed Size (px)
Citation preview
2007 Estimated 2006 Estimated % Change Procedures Procedures 2006-2007
Hip 423,050 408,200 + 3.6%
Total 263,060 259,350 + 1.4% Partial 98,710 97,150 + 1.6% Revision 51,230 49,410 + 3.7% Resurfacing 10,050 2,290 + 338.9%
Knee 602,600 583,600 + 3.3%
Primary 4 506,200 492,000 + 2.9% Unicondylar 47,800 46,300 + 3.2% Revision 48,600 45,300 + 7.3%
Total hips & knees 1,025,650 991,800 + 3.4%
2007 2006 2005 % Chg % Chg DRG Cases Cases Cases 06-07 05-06
Major joint DRGs 483,495 486,586 491,311 - 0.6% - 1.0% Bilateral joint 14,380 15,412 15,677 - 6.7% - 1.7%
Total cases 497,875 501,998 506,988 - 0.8% - 1.0%
2 Editorial—Auto dealerships and orthopedics
3 Top 10 Hip and Knee hospitals
4 2009 CMS Medicare’s payment update
6 The 2007 Hip and Knee Implant market
9 2008 Hip and Knee Implant Price Comparison
13 Hospital Resources and Implant Cost Management
Volume 19, Number 3July 2008
Inside This Issue
continued on page 3
2008 Hip and Knee Implant ReviewThe number of US hip and knee implant procedures performed on inpatients in the United States increased between 2006 and 2007 by 3.5% according estimates from Millennium Research Group (MRG) of Toronto, Ontario. The growth in hip implants exceeded that of knees, however, this was largely because of the 338% increase in resurfacing hips between 2006 and 2007. Also of significance is the growth in the number of revision joint procedures. Revision knee procedures increased 7.3% between 2006 and 2007 according to MRG. There were almost as many revision knee procedures as revision hip procedures in 2007.
However, statistics provided by the Centers for Medicare and Medicaid (CMS) point to a year-to-year decline in the number of DRG-paid cases for hip and knee replacements between their 2006 and 2007 fiscal years, similar to the decline reported between 2005 and 2006. It should be stated that the decrease is relatively small (about 1%), and there are states and areas where the number of joint replacements are increasing, however, the
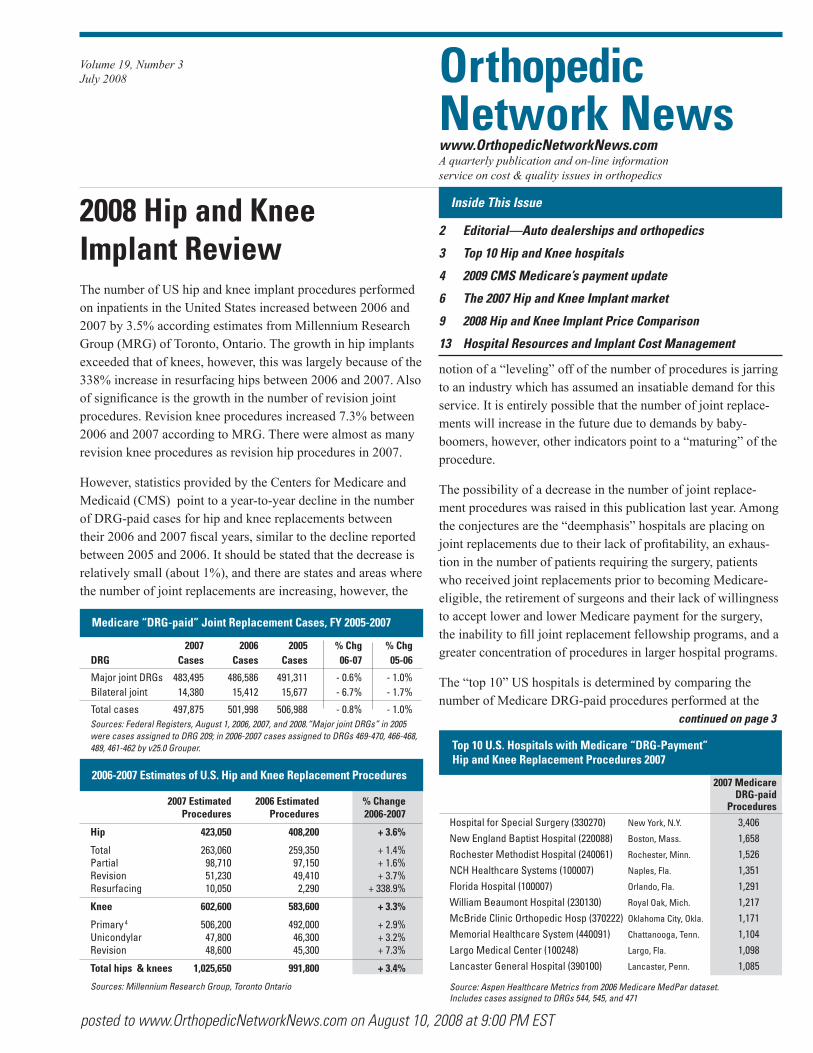
Source: Aspen Healthcare Metrics from 2006 Medicare MedPar dataset.Includes cases assigned to DRGs 544, 545, and 471
Orthopedic Network Newswww.OrthopedicNetworkNews.comA quarterly publication and on-line information service on cost & quality issues in orthopedics
notion of a “leveling” off of the number of procedures is jarring to an industry which has assumed an insatiable demand for this service. It is entirely possible that the number of joint replace-ments will increase in the future due to demands by baby-boomers, however, other indicators point to a “maturing” of the procedure.
The possibility of a decrease in the number of joint replace-ment procedures was raised in this publication last year. Among the conjectures are the “deemphasis” hospitals are placing on joint replacements due to their lack of profitability, an exhaus-tion in the number of patients requiring the surgery, patients who received joint replacements prior to becoming Medicare-eligible, the retirement of surgeons and their lack of willingness to accept lower and lower Medicare payment for the surgery, the inability to fill joint replacement fellowship programs, and a greater concentration of procedures in larger hospital programs.
The “top 10” US hospitals is determined by comparing the number of Medicare DRG-paid procedures performed at the
Top 10 U.S. Hospitals with Medicare “DRG-Payment” Hip and Knee Replacement Procedures 2007
Sources: Millennium Research Group, Toronto Ontario
2006-2007 Estimates of U.S. Hip and Knee Replacement Procedures
Medicare “DRG-paid” Joint Replacement Cases, FY 2005-2007
Sources: Federal Registers, August 1, 2006, 2007, and 2008.“Major joint DRGs” in 2005 were cases assigned to DRG 209; in 2006-2007 cases assigned to DRGs 469-470, 466-468, 489, 461-462 by v25.0 Grouper.
2007 Medicare DRG-paid ProceduresHospital for Special Surgery (330270) New York, N.Y. 3,406New England Baptist Hospital (220088) Boston, Mass. 1,658Rochester Methodist Hospital (240061) Rochester, Minn. 1,526NCH Healthcare Systems (100007) Naples, Fla. 1,351Florida Hospital (100007) Orlando, Fla. 1,291William Beaumont Hospital (230130) Royal Oak, Mich. 1,217McBride Clinic Orthopedic Hosp (370222) Oklahoma City, Okla. 1,171Memorial Healthcare System (440091) Chattanooga, Tenn. 1,104Largo Medical Center (100248) Largo, Fla. 1,098Lancaster General Hospital (390100) Lancaster, Penn. 1,085
posted to www.OrthopedicNetworkNews.com on August 10, 2008 at 9:00 PM EST
2 Orthopedic Network News, Vol. 19, No. 3, July 2008 © 2008 Mendenhall Associates, Inc.
posted to www.OrthopedicNetworkNews.com on August 10, 2008 at 9:00 PM EST
Stan MendenhallEditor
Orthopedic Network News
Editorial
Auto Dealerships and OrthopedicsLast week I had to drive out to pick up a new computer along Jackson Road on the west side of Ann Arbor. This part of the city has become the new mecca for automobile dealerships. Each one occupies large swaths of real estate, and sports rows of unsold cars, streamers, balloons, and other eye-catching gimmicks.
I also heard a story on the radio last week about auto dealer-ships. A number of years ago, independent auto dealerships banded together to get laws passed in each state that essentially required consumers to buy a car through them, and not directly from a manufacturer.
Since most consumers have access to the internet, most car-shoppers research the automobile they wish to purchase on line, and come armed with sattistics before they even go to a showroom. At one point, car dealerships had all the informa-tion about their own and competitor’s products. You could also test drive a car, and of course, an auto dealer could give you the “new car smell,” an essential ingredient in many car sales. I’m not sure that makes sense anymore with empowered consumers.
Which brings me to orthopedics. The largest category of expense for an orthopedic company is “selling, general, and administrative expenses.” Although that category contains expenses other than than the distributor, about half of it relates directly to the orthopedic distributors.
The distributorships that most of the major orthopedic compa-nies have can be huge. Although some independent distributors may be small (less than one million in sales annually), many may gross at least ten million dollars a year and a large one may approach $100 million in sales each year.
I have a great deal of respect for orthopedic distributors and their staffs, which often include sales reps, technical support, transportation, and office support. Many have decades of expe-rience in orthopedics and are often the missing link in surgeon education for new procedures and technology. I have often heard how hospitals use their orthopedic distributors as “free” labor to offset staffing short falls in the operating room.
Hospitals often blindly begin negotiating with a manufacturer in Warsaw or Memphis assuming that the local distributor will comply with whatever deal they are able to put together. Not true. The orthopedic companies are dependent on their distribu-tors for their success. An orthopedic company cannot negotiate a deal with a hospital without incurring the wrath (or worse) of a local distributor. Hospital negotiations risk upsetting the deli-cate relationships that have been developed over years.
A preview of how public this can get are the negotiations for “capped pricing,” currently underway, at Lee Memorial Hos-pital in Fort Myers, Florida. (Go to www.news-press.com and search for “Orthopedics”) Lee Memorial has been ranked in the “top 10” joint programs in the country for a number of years. It is currently faced with a deadly combination of high implant costs, large Medicare patient population, and low Medicare payment. During the negotiations which began earlier this year, many parties have aired the specifics of the negotiations in the local newspaper. Board members have weighed in as has the president of the hospital; a letter to the editor was signed by 30 surgeons who voiced their opposition to the attempts of the hospital to “force us to use products that we feel use outdated technology.”
In my experience, I haven’t seen such a “public airing of the laundry” any place else. Since Lee Memorial has publicly elected board of directors and is the only game in town, it will certainly be more public than it would be in communities where hospitals are privately held. [One 24-year-old board member resigned because he wanted to finish school.] Nevertheless, the surgeons, manufacturers, and hospitals public statements are probably giving the public more information about this issue than they are ready to handle.
As hospitals become more adept at negotiating with the dis-tributors, they will have to assume that any discount is going to come out of the pocket of the local distributor, whether or not he is involved in the negotiations. Which means they will fight tooth and nail to preserve their income stream. Distribu-tors should be aware of how they “add value” to the healthcare equation, and how their customers are paid. Otherwise they risk going the way of automobile distributor_balloons, streamers, and the “new-car smell.”
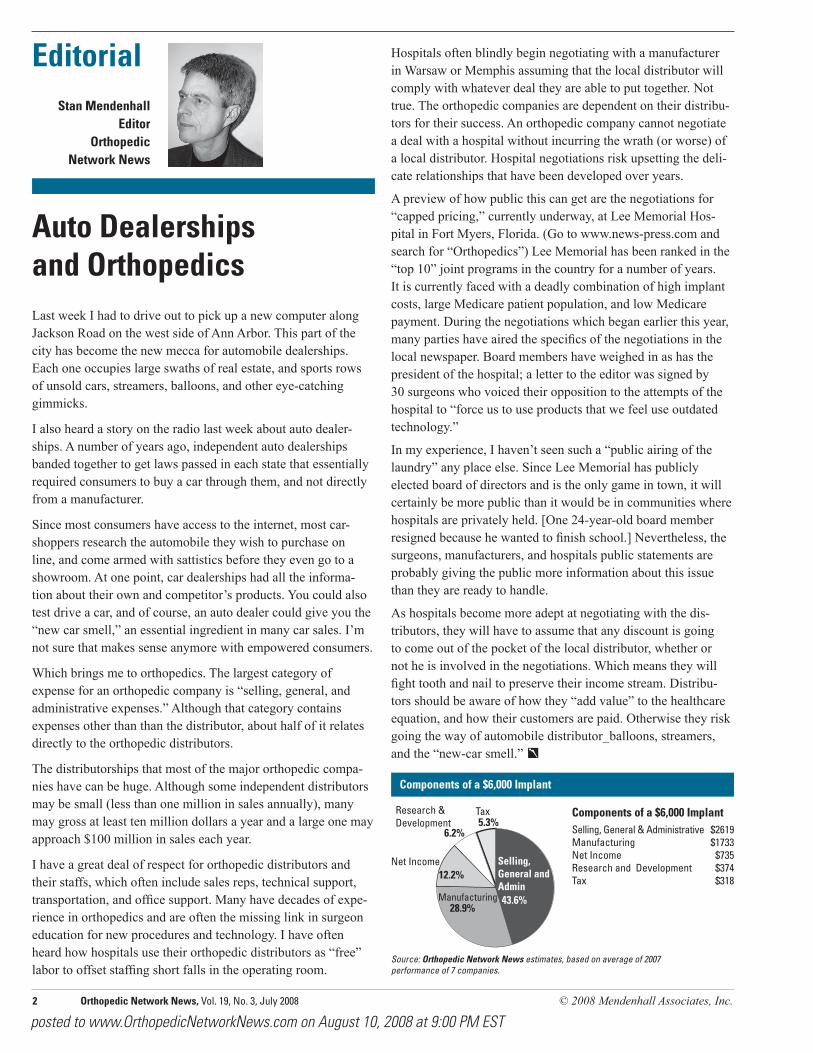
Components of a $6,000 Implant
Net Income
Tax
Selling, General and Admin
Research & Development
Manufacturing
28.9%43.6%
6.2%
12.2%
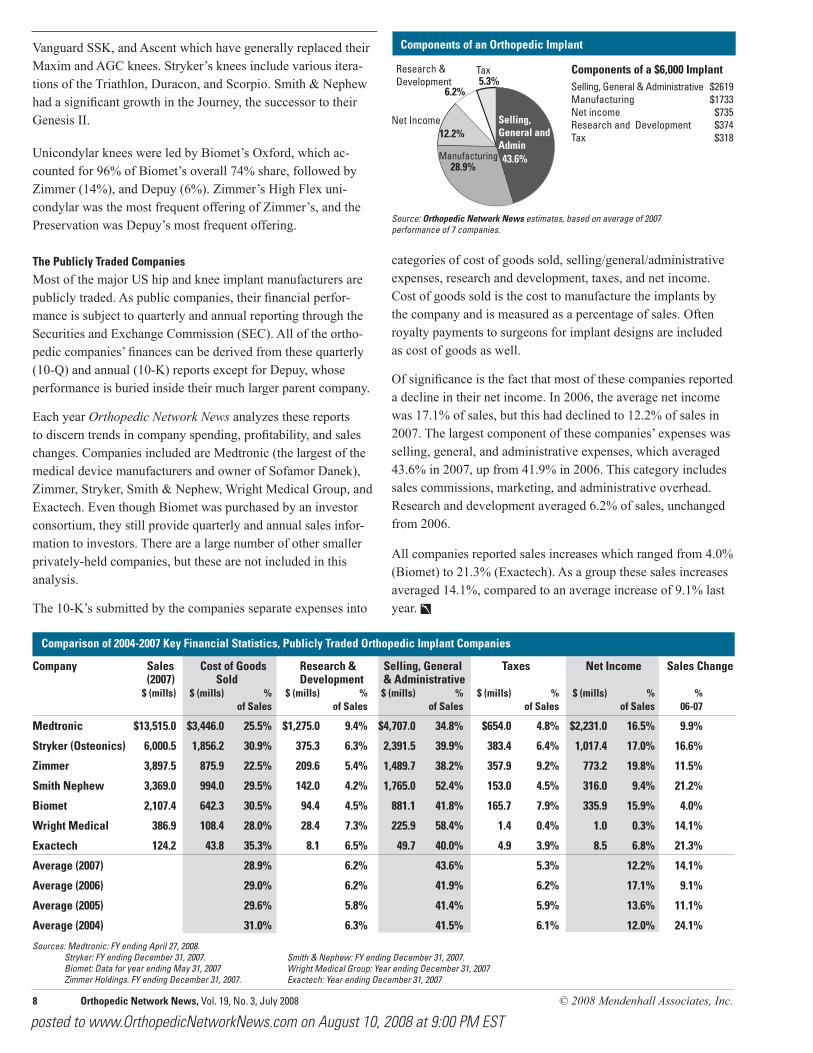
5.3% Components of a $6,000 ImplantSelling, General & Administrative $2619 Manufacturing $1733 Net Income $735 Research and Development $374 Tax $318
Source: Orthopedic Network News estimates, based on average of 2007performance of 7 companies.

© 2008 Mendenhall Associates, Inc. Orthopedic Network News, Vol. 19, No. 3, July 2008 3
posted to www.OrthopedicNetworkNews.com on August 10, 2008 at 9:00 PM EST
The percentage of Medicare cases was estimated based on the number of Medicare cases reported by Aspen from the MedPar dataset divided by the total number of cases reported by the hos-pital. This estimate may differ from an individual hospital’s ex-perience for a number of reasons including hospital’s inclusion of Medicare managed care cases, treatment of bilateral cases, among other issues. Based on this caveat, Medicare penetration ranged from 42% of the cases at New England Baptist to 69% at the McBride Clinic in Oklahoma City.
Revision cases as a percentage of all joint replacements re-mained relatively stable—the greatest number of revisions as a percentage of cases remained Rochester Methodist Hospital with 20% of cases; the fewest revisions as a percent of all joint replacements was Naples Community Hospital of Naples, Florida. Nationally, the percentage of hip and knee revisions is about 10% of all hip and knee replacements.
The manufacturers used by the large hospitals generally reflect national market shares with Stryker, Depuy, Zimmer, and Smith & Nephew prevalent among them. However many of the top 10 have relatively small manufacturers among their suppliers: in prior years, the Hospital for Special Surgery has reported the use of Exactech, this year, NCH reports the use of Exactech and Endotec, the McBride Clinic reports the use of Encore and Omni Life Sciences.
Institution Year Procedures Medicare 1 % Revisions 2 Hips Knees Implant Providers Major SurgeonsHospital for Special Surgery 06 5,556 60% 10% na na na naNew York City 07 5,879 58% 10% na na na
New England Baptist Hospital 06 3,877 42% 11% na na Stryker, DePuy, S&N, Wright 12 SurgeonsBoston, Mass. 07 3,944 42% 11% na na
Rochester Methodist Hospital 06 2,974 51% 22% na na na naRochester, Minn. 07 3,171 48% 20% na na NCH Healthcare Systems 06 1,812 67% 6% $3320-5400 $4450 Zimmer, Stryker, DePuy, Endotec 9 SurgeonsNaples, Florida 07 1,833 68% 8% $3192-5300 $4400 Zimmer, Stryker, Exactech, Depuy, Endotec
Florida Hospital 06 na na na na na na naOrlando, Fla. 07 na na na na na na na
William Beaumont Hospital 06 2,412 55% 7% na na Stryker, DePuy, Zimmer na Royal Oak, Mich. 07 2,585 47% 10% na na na
McBride Clinic Orthopedic Hosp 06 na na na na Encore, Zimmer, Omni Life Science,S&N naOklahoma City, Oklahoma 07 1,694 69% 10% na Encore, Zimmer, Omni Life Science,S&N na Memorial Healthcare System 06 na na na na na na naChattanooga, Tennessee 07 na na na na na na na Largo Medical Center 06 na na na na na na naLargo, Fla. 07 na na na na na Lancaster General 06 na na na na na na naLancaster, Penn. 07 na na na na na
Top 10 Medicare Hip and Knee Replacement Hospitals (2007), Procedures, Revisions, and Implant Cost/Procedure, All Payers
na: Data not available, incomplete data1 % Medicare estimated from Medicare DRG-paid cases (reported by CMS) divided by procedures reported by individual hospitals unless otherwise noted.
1
2
3
4
5
6
7
8
9
10
2 Number of hip and knee revisions reported by hospital divided by total procedures.
continued from page 1
hospitals for the year ending September 30, 2007, which was provided by Aspen Healthcare Metrics of Englewood, Colo-rado. Medicare managed-care cases are not included in this total—hence states such as California with high Medicare managed care penetration won’t have hospitals reported in the “top 10”. In addition, the statistics reported here are for a single Medicare-provider identifier. Many programs now encompass multiple hospitals which are not included.
Questionaires were sent to these “top 10” and this year, respons-es were obtained from six. The only difference between this year’s top 10 and last year’s is the addition of Largo Medical Center from Florida and Lancaster General from Pennsylvania. These replaced Lee Memorial in Fort Myers, Florida and Spec-trum Health in Grand Rapids, Michigan.
According to self-reported statistics, the Hospital for Special Surgery reported over 5,000 hip and knee replacements, which would mean that that hospital singlehandedly performed more procedures than twelve entire states. Following HSS was New England Baptist in Boston, Rochester Methodist Hospital (the Mayo clinic), NCH Healthcare Systems of Naples, Florida, Florida Hospital of Orlando, William Beaumont Hospital of Royal Oak, Michigan, McBride Clinic in Oklahoma City, Memorial Healthcare System of Chattanooga, Tennessee, Largo Medical Center in Largo, Florida, and Lancaster General in Lancaster, Pennsylvania.
Implant $/Procedure
4 Orthopedic Network News, Vol. 19, No. 3, July 2008 © 2008 Mendenhall Associates, Inc.
posted to www.OrthopedicNetworkNews.com on August 10, 2008 at 9:00 PM EST
2009 CMS payment updateThe Center for Medicare and Medicaid Services (CMS) an-nounced their payment rates for hospitals treating Medicare pa-tients, effective for patients discharged between October 1, 2008 and September 30, 2009. The document, at a slumber-inducing 1,745 pages, was posted to the CMS web site on July 31st, 2008. This contained all of the rules, rationales, and discussions of requests by hospitals, device and drug manufacturers, and physicians to change Medicare’s policies, definitions, and tables for payment under the DRG system.
The system continues to pay 745 different DRGs which were stratified into 3 severity levels: MCC (major complication/co-morbid condition), CC (complication/comorbid condition), and no complication or comorbid condition.
In short, this update contained few changes from last year’s ground-breaking changes to the DRG payment system. There were requests from the American Academy of Hip and Knee Surgeons (AAHKS) to change the DRG assignments for revi-sions, requests from spinal device manufacturers to reassign new implants to higher paying DRGs, among other requests. All of these requests were denied.
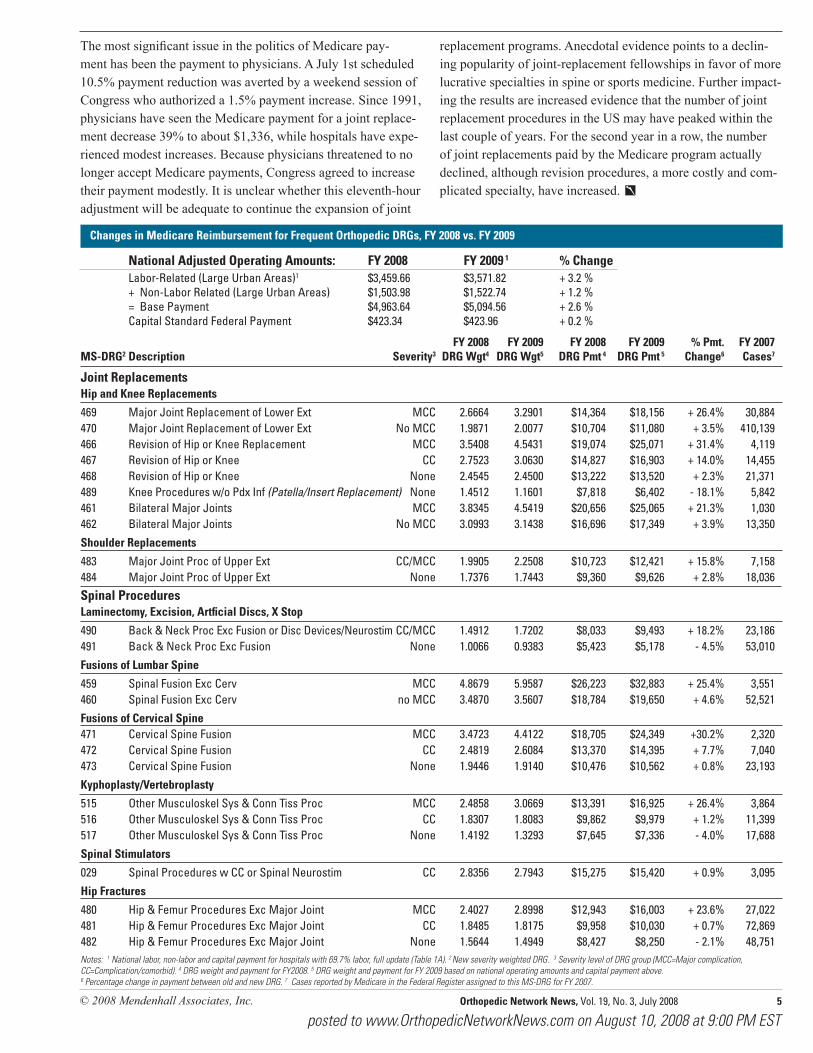
Specific to orthopedics, the MS-DRGs most often attributed to joint replacement (MS-DRG 470) and joint revisions (MS-DRG 468) showed modest payment increases to $11,080 and $13,520, which are 3.5% and 2.3% increases respectively. Most spine procedures showed modest increases as well: cervical fusions increased 0.8% for the most frequently occurring DRG, and lumbar fusions increased 4.6%. The MS-DRG assigned to all of the new spinal technology (MS-DRG 490) such as artificial discs, dynamic stabilization, facet joint replacement, had a 18.2% increase to $9,434, among the largest of any spinal DRG. Ironically, hospitals still receive a higher payment from Medicare for older fusion technology than they do for newer spinal devices.
There are six other MS-DRGs assigned to specific types of spi-nal fusions—anterior-posterior fusions and fusion for scoliosis, which collectively accounted for less than 10,000 cases. These cases (MS-DRG 453-458) had payments of $25,000 to $54,000. (These are not included in the table on page 5.)
Treatment of hip fractures, one of the most common orthopedic procedures in the Medicare-aged population had mixed results. The payment for the MS-DRG for hip fractures with an MCC (480) increased 23.6%, while the MS-DRG for a hip fracture with a CC increased 0.7%, and with no CC declined 2.1%. The number of cases assigned to the most severe of this group increased while the others declined.
CMS Payment Highlights for Orthopedics
• Modest (3.5%) payment increase for joint replacement (DRG 470)
• No changes in MS-DRG definitions for joint replacements
• New spinal devices assigned to MS-DRG 490 (Dynamic stabilization, artificial disc, interspinous process, among others. No change from current policy and MS-DRG assignment.)
• No add-on payments for new orthopedic technologies
Source: Federal Register, August 1, 2008, www.cms.gov
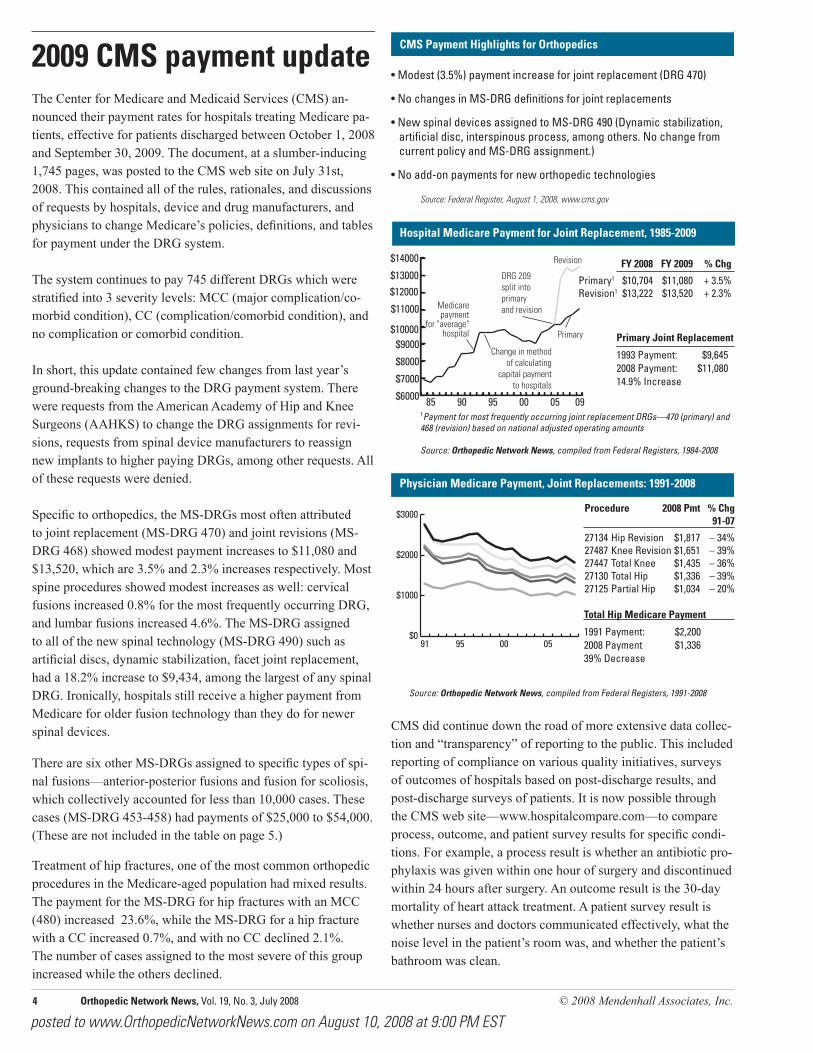
Hospital Medicare Payment for Joint Replacement, 1985-2009
$6000
$7000
$8000
$9000$10000
$11000
$12000$13000
$14000
090500959085
Change in methodof calculating
capital paymentto hospitals
Medicarepayment
for "average"hospital
DRG 209 split intoprimaryand revision
Revision
Primary
FY 2008 FY 2009 % Chg
Primary1 $10,704 $11,080 + 3.5% Revision1 $13,222 $13,520 + 2.3%
1Payment for most frequently occurring joint replacement DRGs—470 (primary) and 468 (revision) based on national adjusted operating amounts
Source: Orthopedic Network News, compiled from Federal Registers, 1984-2008
Primary Joint Replacement
1993 Payment: $9,645 2008 Payment: $11,080 14.9% Increase
Total Hip Medicare Payment
1991 Payment: $2,200 2008 Payment $1,336 39% Decrease
Procedure 2008 Pmt % Chg 91-07
27134 Hip Revision $1,817 – 34% 27487 Knee Revision $1,651 – 39% 27447 Total Knee $1,435 – 36% 27130 Total Hip $1,336 – 39% 27125 Partial Hip $1,034 – 20%
Source: Orthopedic Network News, compiled from Federal Registers, 1991-2008
Physician Medicare Payment, Joint Replacements: 1991-2008
$0
$1000
$2000
$3000
05009591
CMS did continue down the road of more extensive data collec-tion and “transparency” of reporting to the public. This included reporting of compliance on various quality initiatives, surveys of outcomes of hospitals based on post-discharge results, and post-discharge surveys of patients. It is now possible through the CMS web site—www.hospitalcompare.com—to compare process, outcome, and patient survey results for specific condi-tions. For example, a process result is whether an antibiotic pro-phylaxis was given within one hour of surgery and discontinued within 24 hours after surgery. An outcome result is the 30-day mortality of heart attack treatment. A patient survey result is whether nurses and doctors communicated effectively, what the noise level in the patient’s room was, and whether the patient’s bathroom was clean.
© 2008 Mendenhall Associates, Inc. Orthopedic Network News, Vol. 19, No. 3, July 2008 5
posted to www.OrthopedicNetworkNews.com on August 10, 2008 at 9:00 PM EST
The most significant issue in the politics of Medicare pay-ment has been the payment to physicians. A July 1st scheduled 10.5% payment reduction was averted by a weekend session of Congress who authorized a 1.5% payment increase. Since 1991, physicians have seen the Medicare payment for a joint replace-ment decrease 39% to about $1,336, while hospitals have expe-rienced modest increases. Because physicians threatened to no longer accept Medicare payments, Congress agreed to increase their payment modestly. It is unclear whether this eleventh-hour adjustment will be adequate to continue the expansion of joint
National Adjusted Operating Amounts: FY 2008 FY 2009 1 % Change Labor-Related (Large Urban Areas)1 $3,459.66 $3,571.82 + 3.2 % + Non-Labor Related (Large Urban Areas) $1,503.98 $1,522.74 + 1.2 % = Base Payment $4,963.64 $5,094.56 + 2.6 % Capital Standard Federal Payment $423.34 $423.96 + 0.2 %
FY 2008 FY 2009 FY 2008 FY 2009 % Pmt. FY 2007MS-DRG2 Description Severity3 DRG Wgt4 DRG Wgt5 DRG Pmt 4 DRG Pmt 5 Change6 Cases7
Joint Replacements Hip and Knee Replacements
469 Major Joint Replacement of Lower Ext MCC 2.6664 3.2901 $14,364 $18,156 + 26.4% 30,884 470 Major Joint Replacement of Lower Ext No MCC 1.9871 2.0077 $10,704 $11,080 + 3.5% 410,139 466 Revision of Hip or Knee Replacement MCC 3.5408 4.5431 $19,074 $25,071 + 31.4% 4,119 467 Revision of Hip or Knee CC 2.7523 3.0630 $14,827 $16,903 + 14.0% 14,455 468 Revision of Hip or Knee None 2.4545 2.4500 $13,222 $13,520 + 2.3% 21,371 489 Knee Procedures w/o Pdx Inf (Patella/Insert Replacement) None 1.4512 1.1601 $7,818 $6,402 - 18.1% 5,842 461 Bilateral Major Joints MCC 3.8345 4.5419 $20,656 $25,065 + 21.3% 1,030 462 Bilateral Major Joints No MCC 3.0993 3.1438 $16,696 $17,349 + 3.9% 13,350
Shoulder Replacements
483 Major Joint Proc of Upper Ext CC/MCC 1.9905 2.2508 $10,723 $12,421 + 15.8% 7,158 484 Major Joint Proc of Upper Ext None 1.7376 1.7443 $9,360 $9,626 + 2.8% 18,036
Spinal Procedures Laminectomy, Excision, Artficial Discs, X Stop
490 Back & Neck Proc Exc Fusion or Disc Devices/Neurostim CC/MCC 1.4912 1.7202 $8,033 $9,493 + 18.2% 23,186 491 Back & Neck Proc Exc Fusion None 1.0066 0.9383 $5,423 $5,178 - 4.5% 53,010
Fusions of Lumbar Spine
459 Spinal Fusion Exc Cerv MCC 4.8679 5.9587 $26,223 $32,883 + 25.4% 3,551 460 Spinal Fusion Exc Cerv no MCC 3.4870 3.5607 $18,784 $19,650 + 4.6% 52,521
Fusions of Cervical Spine 471 Cervical Spine Fusion MCC 3.4723 4.4122 $18,705 $24,349 +30.2% 2,320 472 Cervical Spine Fusion CC 2.4819 2.6084 $13,370 $14,395 + 7.7% 7,040 473 Cervical Spine Fusion None 1.9446 1.9140 $10,476 $10,562 + 0.8% 23,193
Kyphoplasty/Vertebroplasty
515 Other Musculoskel Sys & Conn Tiss Proc MCC 2.4858 3.0669 $13,391 $16,925 + 26.4% 3,864 516 Other Musculoskel Sys & Conn Tiss Proc CC 1.8307 1.8083 $9,862 $9,979 + 1.2% 11,399 517 Other Musculoskel Sys & Conn Tiss Proc None 1.4192 1.3293 $7,645 $7,336 - 4.0% 17,688
Spinal Stimulators
029 Spinal Procedures w CC or Spinal Neurostim CC 2.8356 2.7943 $15,275 $15,420 + 0.9% 3,095
Hip Fractures
480 Hip & Femur Procedures Exc Major Joint MCC 2.4027 2.8998 $12,943 $16,003 + 23.6% 27,022 481 Hip & Femur Procedures Exc Major Joint CC 1.8485 1.8175 $9,958 $10,030 + 0.7% 72,869 482 Hip & Femur Procedures Exc Major Joint None 1.5644 1.4949 $8,427 $8,250 - 2.1% 48,751
Changes in Medicare Reimbursement for Frequent Orthopedic DRGs, FY 2008 vs. FY 2009
Notes: 1 National labor, non-labor and capital payment for hospitals with 69.7% labor, full update (Table 1A). 2 New severity weighted DRG. 3 Severity level of DRG group (MCC=Major complication, CC=Complication/comorbid). 4 DRG weight and payment for FY2008. 5 DRG weight and payment for FY 2009 based on national operating amounts and capital payment above. 6 Percentage change in payment between old and new DRG. 7 Cases reported by Medicare in the Federal Register assigned to this MS-DRG for FY 2007.
replacement programs. Anecdotal evidence points to a declin-ing popularity of joint-replacement fellowships in favor of more lucrative specialties in spine or sports medicine. Further impact-ing the results are increased evidence that the number of joint replacement procedures in the US may have peaked within the last couple of years. For the second year in a row, the number of joint replacements paid by the Medicare program actually declined, although revision procedures, a more costly and com-plicated specialty, have increased.

6 Orthopedic Network News, Vol. 19, No. 3, July 2008 © 2008 Mendenhall Associates, Inc.
posted to www.OrthopedicNetworkNews.com on August 10, 2008 at 9:00 PM EST
Total US 2007 Hips/Knees Market Value: $5,684.8 MillionTotal US 2006 Hips/Knees Market Value: $5,200.6 Million2006-2007 Increase 9.3%
U.S. Hip and Knee Implant Markets and Shares, 2006-2007
Knees
Hips
Hips $2,318.9
Knees $3,365.9
US 2007 Hip and Knee Implant MarketTotal: $5,684.8 Million
Sales ($ mill) US 2007 2006 Share Company 2007 2006 Growth Share Share Change
Zimmer $1,503.9 $1,415.3 6.3% 26.5% 27.2% -0.7% DePuy 1,371.3 1,246.7 10.0% 24.1% 24.0% 0.1% Stryker 1,191.6 1,070.7 11.3% 21.0% 20.6% 0.4% Biomet 684.5 656.7 4.2% 12.0% 12.6% -0.6% Smith & Nephew 589.4 496.0 18.8% 10.4% 9.5% 0.9% Wright Medical 140.3 134.0 4.7% 2.5% 2.6% -0.1% Exactech 67.1 55.8 20.3% 1.2% 1.1% 0.1% Other 136.7 125.4 9.0% 2.4% 2.4% 0.0%
U.S. Market $5,688.8 $5,200.6 9.3%
Sales ($ mill) US 2007 2006 Share Company 2007 2006 Growth Share Share Change
DePuy $540.2 $491.1 10.0% 23.3% 23.2% 0.1% Zimmer 534.3 513.4 4.1% 23.0% 24.2% -1.2% Stryker 524.5 490.6 6.9% 22.6% 23.1% -0.5% Smith & Nephew 273.0 199.0 37.2% 11.8% 9.4% 2.4% Biomet 259.9 252.3 3.0% 11.2% 11.9% -0.7% Wright Medical 77.9 75.7 2.9% 3.4% 3.6% -0.2% Exactech 17.6 14.0 25.7% 0.8% 0.7% 0.1% Other 91.5 83.9 9.1% 3.9% 4.0% -0.1%
U.S. Market $2,318.9 $2,120.0 9.4%
Sales ($ mill) US 2007 2006 Share Company 2007 2006 Growth Share Share Change
Zimmer $969.6 $901.9 7.5% 28.8% 29.3% -0.5% DePuy 831.1 755.6 10.0% 24.7% 24.5% 0.2% Stryker 667.1 580.1 15.0% 19.8% 18.8% 1.0% Biomet 424.6 404.4 5.0% 12.6% 13.1% -0.5% Smith & Nephew 316.4 297.0 6.5% 9.4% 9.6% -0.2% Wright Medical 62.4 58.3 7.0% 1.9% 1.9% 0.0% Exactech 49.5 41.8 18.4% 1.5% 1.4% 0.1% Other 45.2 41.5 8.9% 1.3% 1.3% 0.0%
U.S. Market $3,365.9 $3,080.6 9.3%
Hip and Knee Implants
Hip Implants
Knee Implants
The 2007 U.S. Hip & Knee Implant MarketThe US hip and knee implant market grew about 9.4% between 2006 and 2007 to about $5.7 billion, according to data com-piled by Orthopedic Network News. This growth is more than the 7.2% reported between 2005 and 2006 but about half of the 15.6% growth reported between 2004 and 2005 in this publi-cation last year. Sales of hip implants increased 9.4% to $2.3 billion and sales of knee implants rose 9.3% to $3.4 billion.
The largest manufacturer of hip and knee implants in the US is Zimmer with 28.8% of the knee market, and 23.3% of the hip market for an overall 26.5 share. Following Zimmer is DePuy, which reported 23.3% of the hip market and 24.7% of the knee implant market, and Stryker, with a 22.6% share of the hip market and 19.8% share of the knee market. These three manu-facturers together accounted for over 70% of the sales of hip and knee implants to US hospitals. Other manufacturers include Biomet (11.2% of hips and 12.6% of knees), Smith & Nephew (11.8% of hips and 9.4% of knees), Wright Medical (3.4% of hips and 1.9% of knees), and Exactech (0.8% of hips and 1.5% of knees). There are a number of other privately held companies whose statistics aren’t readily available such as Stelkast, Endo-tec, Biopro, Encore Medical, and others which are estimated to account for 3.9% of hips and 1.3% of knees.
The biggest share changes were reported by Smith & Nephew, with a 2.4% increase in the US share of their hip implants, largely because of the introduction of the Birmingham total re-surfacing hip into the United States. Statistics from Orthopedic Research Network (ORN) reported that Smith & Nephew had in excess of 75% of this segment, the fastest growing segment in hip implants. Smith & Nephew also included the sales of Plus Orthopedics which contributed to their increase.
Stryker also reported a 1% share increase in knee implants which partially offset their 0.5% decrease in hip share. Other share changes include a 0.8% decrease by Zimmer, the market leader, and a 0.6% decrease by Biomet. Other changes include a 0.1% increase by Depuy and Exactech, and a 0.1% decline at Wright Medical Technology.
A further breakdown of the companies’ sales of hip and knee implants is derived from the HPD (Hospital Purchasing Data-base), maintained by this publication (see page 19 for a de-scription of this database and methodology). The data are not projected to a national sample so they may not agree with the company market shares reported on this page. In addition, the classification and product name identification used in the HPD
Source: Orthopedic Network News estimates

© 2008 Mendenhall Associates, Inc. Orthopedic Network News, Vol. 19, No. 3, July 2008 7
posted to www.OrthopedicNetworkNews.com on August 10, 2008 at 9:00 PM EST
may not be the same as that used by manufacturers for their own products. Therefore it is possible (and likely) that informa-tion derived from HPD may conflict with other sources.
An analysis of the market leaders and corresponding product lines for these major segments is displayed at right. In the 2007 HPD, Depuy accounted for 26% of the sales of coated hip stems (GIC® 11), and the largest product lines of this segment for Depuy were Summit, (49%), Corail (27%), and AML (14%). These three product lines accounted for 90% of their coated hip stem sales. Note that the Corail stem, which is implanted anteriorally, had a significant share increase which came at the expense of the Summit and AML product lines.
The 2007 HPD reported Biomet with a 24% share of the coated hip stem market, led by their Taperloc, Mallory-Head, and Taperloc Microplasty product lines. The Taperloc Microplasty, designed for minimally invasive hip surgery, had a 14-point share growth within Biomet’s market.
Stryker was reported to have 22% of the coated hip stem market in 2007 (down from 25% in 2006). The Accolade Plus TMZF had a significant growth within this segment with a 17 point increase to 50% of their stems. The Secur-Fit was second with a 23% share, followed by the Secur-Fit Plus with an 11% share in 2007, down from 23% in 2006. Zimmer’s leading product lines for coated hip stems were the Versys, M/L Taper, and Trabecular metal systems.
The uncoated hip stem segment (GIC® 12) was led by Depuy with a 40% share in the 2007 HPD with their SROM, Summit, and Ultima product lines leading, followed by Zimmer, Stryker, and Smith & Nephew. Note that DePuy’s SROM is often mar-ried with a proximal collar thus rendering the uncoated stem into either a coated stem or revision stem.
The resurfacing femoral components were limited to Smith & Nephew (Birmingham Hip), Stryker’s Cormet, and Biomet’s Recap. The Birmingham Hip accounted for 90% of sales of this category in 2007 up from 80% in 2006. This sales growth was at the expense of Wright’s Conserve which did not appear in the HPD in 2007. Stryker’s newest entry was the Cormet system which captured 4% share in 2007 and Biomet’s Recap with 3% share.
Zimmer led the market for femoral components of the knee with an overall share of 34% with the product lines of NexGen, Nex-Gen LPS Flex GSF (Gender knee), and Natural Knee II. These three lines accounted for 83% of Zimmer’s femur sales in 2007. Following Zimmer was Depuy with an 18% share, Biomet with 18%, Stryker with 15%, and Smith & Nephew with 12%. DePuy’s leading lines were the PFC Sigma, Sigma RP-F, and the LCS. Biomet’s were the Vanguard,
Distribution of Sales, Selected Hip and Knee Implants 2006-07 Mfg Product Line 07 $ Share 06 $ Share % Change
Depuy 26% 29% - 3% Summit 49 57 - 7 Corail 27 13 + 14 AML 14 19 - 5Biomet 24 14 + 10 Taperloc 48 41 + 7 Mallory-Head 19 26 - 7 Taperloc Microplasty 15 1 + 14Stryker 22 25 - 3 Accolade Plus TMZF 50 33 + 17 Secur-Fit 23 19 + 4 Secur-Fit Plus 11 23 - 12Zimmer 19 22 - 3 Versys 32 48 - 16 M/L Taper 27 23 + 4 Trabecular Metal 16 14 + 2
Depuy 40 31 + 9 SROM 50 41 + 9 Summit 38 38 nc Ultima 3 6 - 3Zimmer 22 23 - 1 Versys 35 35 nc Versys Advocate 18 17 + 1 CPT 16 12 + 4Stryker 17 22 - 5 Omnifit Hfx 31 22 + 9 Omnifit Eon 23 27 - 4 Accolade C 14 9 + 5Smith & Nephew 16 16 nc SL Plus 39 20 + 19 Echelon 33 27 + 6 Conquest fx 10 18 - 8
S & N BHR 90 80 + 10Stryker Cormet 4 0 + 4Biomet Recap 3 2 + 1
Zimmer 34 36 - 2 NexGen 40 66 + 26 NexGen LPS Flex GSF 25 9 + 16 NK II 18 10 + 8Depuy 18 25 - 7 PFC Sigma 75 79 - 4 Sigma RP-F 8 1 + 7 LCS 7 10 - 3Biomet 18 11 + 7 Vanguard 80 73 + 7 Vanguard SSK 12 4 + 8 Ascent 4 4 ncStryker 15 14 + 1 Triathlon 70 54 + 16 Scorpio 14 33 - 19 Duracon 10 13 - 3Smith & Nephew 12 11 + 1 Journey 38 5 + 33 Genesis II 34 53 - 19 Legion 10 9 + 1 SNR 9 20 - 11
Biomet 74 63 + 11 Oxford 96 93 + 3 Vanguard M 3 4 - 1Zimmer 14 21 - 7 High Flex 76 78 -2 MG 19 20 - 1 NK II 3 0 + 2Depuy 6 8 - 2 Preservation 96 93 +4
Source: HPD, 2006, 2007. Dollar share represents percentage of sales of that product line for the listed company.
GIC 11: Coated Hip Stems
GIC 12: Uncoated Hip Stems
Resurfacing Hip
GIC 31 & GIC 32:Knee Femurs
GIC 38-40:Unicondylar knees
Note: Com-pany figures are shares of category (e.g. Depuy has 26% of the share of GIC 11;Product line shares are shares within the company.
8 Orthopedic Network News, Vol. 19, No. 3, July 2008 © 2008 Mendenhall Associates, Inc.
posted to www.OrthopedicNetworkNews.com on August 10, 2008 at 9:00 PM EST
Company Sales Cost of Goods Research & Selling, General Taxes Net Income Sales Change (2007) Sold Development & Administrative $ (mills) $ (mills) % $ (mills) % $ (mills) % $ (mills) % $ (mills) % % of Sales of Sales of Sales of Sales of Sales 06-07
Medtronic $13,515.0 $3,446.0 25.5% $1,275.0 9.4% $4,707.0 34.8% $654.0 4.8% $2,231.0 16.5% 9.9%
Stryker (Osteonics) 6,000.5 1,856.2 30.9% 375.3 6.3% 2,391.5 39.9% 383.4 6.4% 1,017.4 17.0% 16.6%
Zimmer 3,897.5 875.9 22.5% 209.6 5.4% 1,489.7 38.2% 357.9 9.2% 773.2 19.8% 11.5%
Smith Nephew 3,369.0 994.0 29.5% 142.0 4.2% 1,765.0 52.4% 153.0 4.5% 316.0 9.4% 21.2%
Biomet 2,107.4 642.3 30.5% 94.4 4.5% 881.1 41.8% 165.7 7.9% 335.9 15.9% 4.0%
Wright Medical 386.9 108.4 28.0% 28.4 7.3% 225.9 58.4% 1.4 0.4% 1.0 0.3% 14.1%
Exactech 124.2 43.8 35.3% 8.1 6.5% 49.7 40.0% 4.9 3.9% 8.5 6.8% 21.3%
Average (2007) 28.9% 6.2% 43.6% 5.3% 12.2% 14.1%
Average (2006) 29.0% 6.2% 41.9% 6.2% 17.1% 9.1%
Average (2005) 29.6% 5.8% 41.4% 5.9% 13.6% 11.1%
Average (2004) 31.0% 6.3% 41.5% 6.1% 12.0% 24.1%
Vanguard SSK, and Ascent which have generally replaced their Maxim and AGC knees. Stryker’s knees include various itera-tions of the Triathlon, Duracon, and Scorpio. Smith & Nephew had a significant growth in the Journey, the successor to their Genesis II.
Unicondylar knees were led by Biomet’s Oxford, which ac-counted for 96% of Biomet’s overall 74% share, followed by Zimmer (14%), and Depuy (6%). Zimmer’s High Flex uni-condylar was the most frequent offering of Zimmer’s, and the Preservation was Depuy’s most frequent offering.
The Publicly Traded CompaniesMost of the major US hip and knee implant manufacturers are publicly traded. As public companies, their financial perfor-mance is subject to quarterly and annual reporting through the Securities and Exchange Commission (SEC). All of the ortho-pedic companies’ finances can be derived from these quarterly (10-Q) and annual (10-K) reports except for Depuy, whose performance is buried inside their much larger parent company.
Each year Orthopedic Network News analyzes these reports to discern trends in company spending, profitability, and sales changes. Companies included are Medtronic (the largest of the medical device manufacturers and owner of Sofamor Danek), Zimmer, Stryker, Smith & Nephew, Wright Medical Group, and Exactech. Even though Biomet was purchased by an investor consortium, they still provide quarterly and annual sales infor-mation to investors. There are a large number of other smaller privately-held companies, but these are not included in this analysis.
The 10-K’s submitted by the companies separate expenses into
Components of an Orthopedic Implant
Net Income
Tax
Selling, General and Admin
Research & Development
Manufacturing
28.9%43.6%
6.2%
12.2%
5.3%
Source: Orthopedic Network News estimates, based on average of 2007performance of 7 companies.
Comparison of 2004-2007 Key Financial Statistics, Publicly Traded Orthopedic Implant Companies
Sources: Medtronic: FY ending April 27, 2008. Stryker: FY ending December 31, 2007. Biomet: Data for year ending May 31, 2007 Zimmer Holdings. FY ending December 31, 2007.
categories of cost of goods sold, selling/general/administrative expenses, research and development, taxes, and net income. Cost of goods sold is the cost to manufacture the implants by the company and is measured as a percentage of sales. Often royalty payments to surgeons for implant designs are included as cost of goods as well.
Of significance is the fact that most of these companies reported a decline in their net income. In 2006, the average net income was 17.1% of sales, but this had declined to 12.2% of sales in 2007. The largest component of these companies’ expenses was selling, general, and administrative expenses, which averaged 43.6% in 2007, up from 41.9% in 2006. This category includes sales commissions, marketing, and administrative overhead. Research and development averaged 6.2% of sales, unchanged from 2006.
All companies reported sales increases which ranged from 4.0% (Biomet) to 21.3% (Exactech). As a group these sales increases averaged 14.1%, compared to an average increase of 9.1% last year.
Smith & Nephew: FY ending December 31, 2007. Wright Medical Group: Year ending December 31, 2007 Exactech: Year ending December 31, 2007
Components of a $6,000 ImplantSelling, General & Administrative $2619 Manufacturing $1733 Net income $735 Research and Development $374 Tax $318
© 2008 Mendenhall Associates, Inc. Orthopedic Network News, Vol. 19, No. 3, July 2008 9
posted to www.OrthopedicNetworkNews.com on August 10, 2008 at 9:00 PM EST
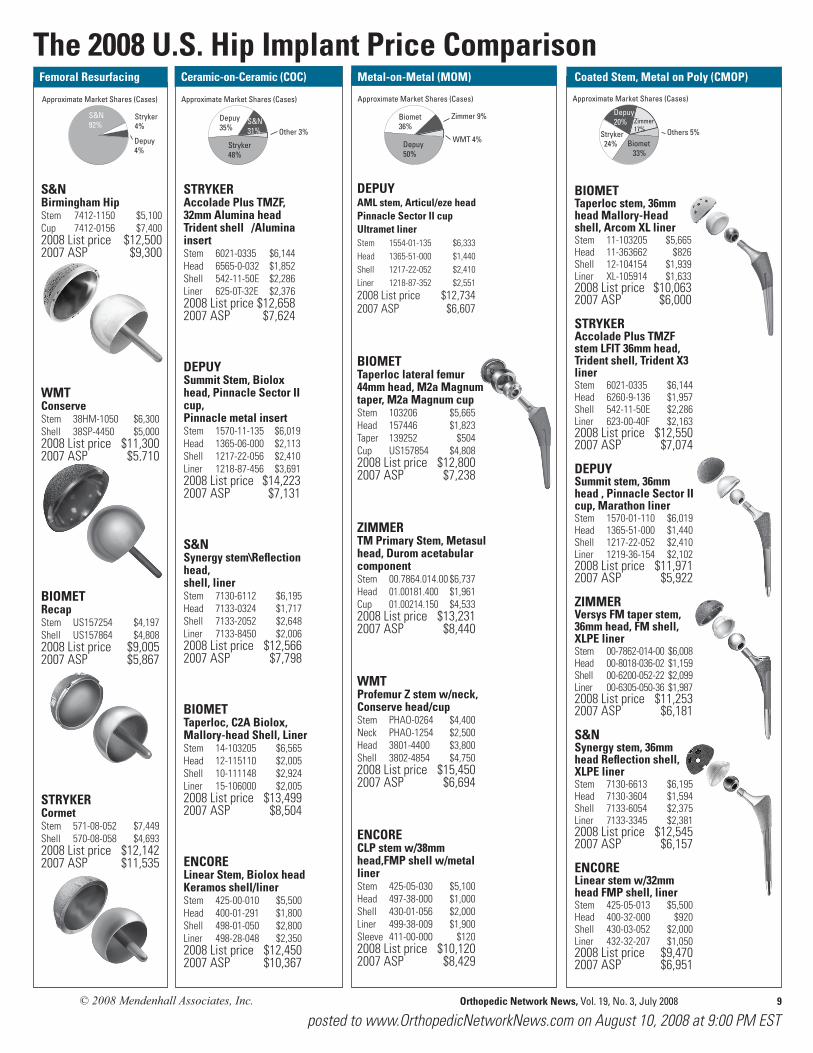
S&N Birmingham Hip Stem 7412-1150 $5,100 Cup 7412-0156 $7,400 2008 List price $12,500 2007 ASP $9,300
WMT Conserve Stem 38HM-1050 $6,300 Shell 38SP-4450 $5,000 2008 List price $11,300 2007 ASP $5,710
BIOMET Recap Stem US157254 $4,197 Shell US157864 $4,808 2008 List price $9,005 2007 ASP $5,867
STRYKER Cormet Stem 571-08-052 $7,449 Shell 570-08-058 $4,693 2008 List price $12,142 2007 ASP $11,535
BIOMET Taperloc stem, 36mm head Mallory-Head shell, Arcom XL liner Stem 11-103205 $5,665 Head 11-363662 $826 Shell 12-104154 $1,939 Liner XL-105914 $1,633 2008 List price $10,063 2007 ASP $6,000
STRYKER Accolade Plus TMZF stem LFIT 36mm head, Trident shell, Trident X3 liner Stem 6021-0335 $6,144 Head 6260-9-136 $1,957 Shell 542-11-50E $2,286 Liner 623-00-40F $2,163 2008 List price $12,550 2007 ASP $7,074
DEPUY Summit stem, 36mm head , Pinnacle Sector II cup, Marathon liner Stem 1570-01-110 $6,019 Head 1365-51-000 $1,440 Shell 1217-22-052 $2,410 Liner 1219-36-154 $2,102 2008 List price $11,971 2007 ASP $5,922
ZIMMER Versys FM taper stem, 36mm head, FM shell, XLPE liner Stem 00-7862-014-00 $6,008 Head 00-8018-036-02 $1,159 Shell 00-6200-052-22 $2,099 Liner 00-6305-050-36 $1,987 2008 List price $11,253 2007 ASP $6,181
S&N Synergy stem, 36mm head Reflection shell, XLPE liner Stem 7130-6613 $6,195 Head 7130-3604 $1,594 Shell 7133-6054 $2,375 Liner 7133-3345 $2,381 2008 List price $12,545 2007 ASP $6,157
ENCORE Linear stem w/32mm head FMP shell, liner Stem 425-05-013 $5,500 Head 400-32-000 $920 Shell 430-03-052 $2,000 Liner 432-32-207 $1,050 2008 List price $9,470 2007 ASP $6,951
The 2008 U.S. Hip Implant Price ComparisonFemoral Resurfacing
STRYKER Accolade Plus TMZF, 32mm Alumina head Trident shell /Alumina insert Stem 6021-0335 $6,144 Head 6565-0-032 $1,852 Shell 542-11-50E $2,286 Liner 625-0T-32E $2,376 2008 List price $12,658 2007 ASP $7,624
DEPUY Summit Stem, Biolox head, Pinnacle Sector II cup, Pinnacle metal insert Stem 1570-11-135 $6,019 Head 1365-06-000 $2,113 Shell 1217-22-056 $2,410 Liner 1218-87-456 $3,691 2008 List price $14,223 2007 ASP $7,131
S&N Synergy stem\Reflection head, shell, liner Stem 7130-6112 $6,195 Head 7133-0324 $1,717 Shell 7133-2052 $2,648 Liner 7133-8450 $2,006 2008 List price $12,566 2007 ASP $7,798
BIOMET Taperloc, C2A Biolox, Mallory-head Shell, Liner Stem 14-103205 $6,565 Head 12-115110 $2,005 Shell 10-111148 $2,924 Liner 15-106000 $2,005 2008 List price $13,499 2007 ASP $8,504
ENCORE Linear Stem, Biolox head Keramos shell/liner Stem 425-00-010 $5,500 Head 400-01-291 $1,800 Shell 498-01-050 $2,800 Liner 498-28-048 $2,350 2008 List price $12,450 2007 ASP $10,367
DEPUY AML stem, Articul/eze head Pinnacle Sector II cup Ultramet liner Stem 1554-01-135 $6,333 Head 1365-51-000 $1,440 Shell 1217-22-052 $2,410 Liner 1218-87-352 $2,551 2008 List price $12,734 2007 ASP $6,607
BIOMET Taperloc lateral femur 44mm head, M2a Magnum taper, M2a Magnum cup Stem 103206 $5,665 Head 157446 $1,823 Taper 139252 $504 Cup US157854 $4,808 2008 List price $12,800 2007 ASP $7,238
ZIMMER TM Primary Stem, Metasul head, Durom acetabular component Stem 00.7864.014.00 $6,737 Head 01.00181.400 $1,961 Cup 01.00214.150 $4,533 2008 List price $13,231 2007 ASP $8,440
WMT Profemur Z stem w/neck, Conserve head/cup Stem PHAO-0264 $4,400 Neck PHAO-1254 $2,500 Head 3801-4400 $3,800 Shell 3802-4854 $4,750 2008 List price $15,450 2007 ASP $6,694
ENCORE CLP stem w/38mm head,FMP shell w/metal liner Stem 425-05-030 $5,100 Head 497-38-000 $1,000 Shell 430-01-056 $2,000 Liner 499-38-009 $1,900 Sleeve 411-00-000 $120 2008 List price $10,120 2007 ASP $8,429
Ceramic-on-Ceramic (COC) Metal-on-Metal (MOM) Coated Stem, Metal on Poly (CMOP)
Depuy
Stryker
S&N
S&N92%
Depuy4%
Stryker4%
Approximate Market Shares (Cases)
WMT
Zimmer
Biomet
Depuy
WMT 4%Depuy50%
Biomet36%
Approximate Market Shares (Cases)
Zimmer 9%Others
S&N
Depuy
StrykerOther 3%
S&N31%
Depuy35%
Stryker48%
Approximate Market Shares (Cases)others
zimmer
depuy
stryker
Biomet
Others 5%
Depuy20%
Biomet 33%
Approximate Market Shares (Cases)
Zimmer 17%
Stryker 24%
10 Orthopedic Network News, Vol. 19, No. 3, July 2008 © 2008 Mendenhall Associates, Inc.
posted to www.OrthopedicNetworkNews.com on August 10, 2008 at 9:00 PM EST
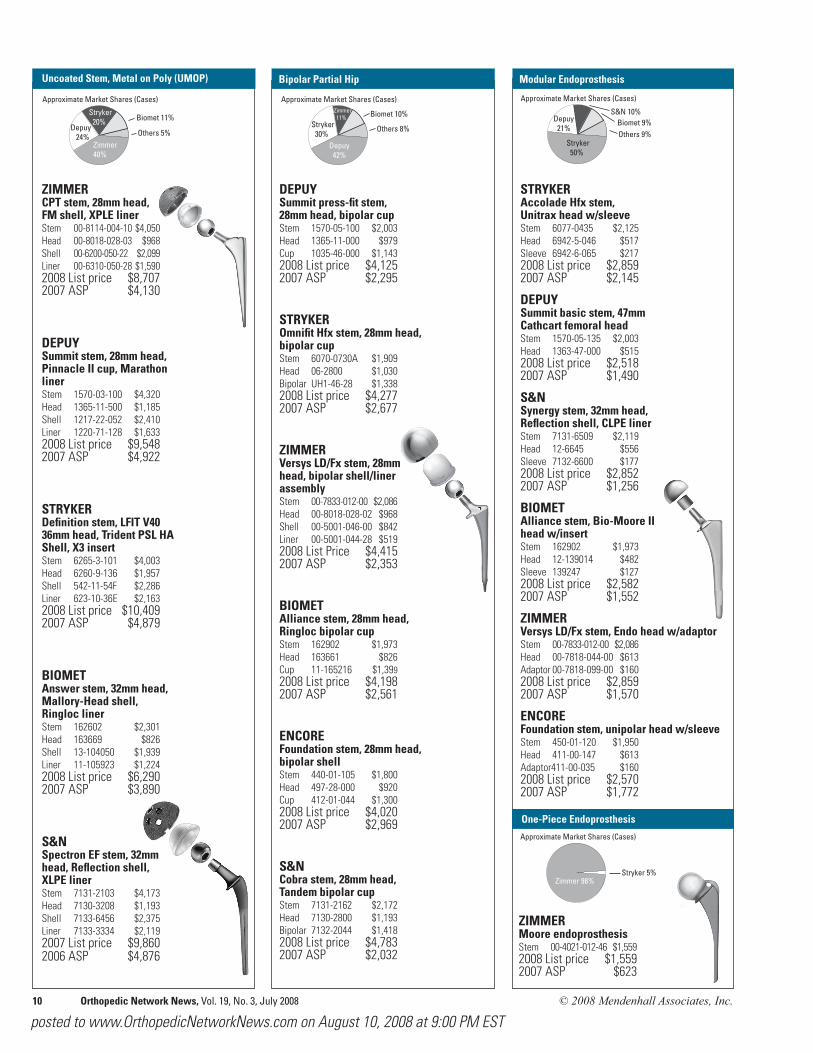
Bipolar partial hipBb
ZIMMER CPT stem, 28mm head, FM shell, XPLE liner Stem 00-8114-004-10 $4,050 Head 00-8018-028-03 $968 Shell 00-6200-050-22 $2,099 Liner 00-6310-050-28 $1,590 2008 List price $8,707 2007 ASP $4,130
DEPUY Summit stem, 28mm head, Pinnacle II cup, Marathon liner Stem 1570-03-100 $4,320 Head 1365-11-500 $1,185 Shell 1217-22-052 $2,410 Liner 1220-71-128 $1,633 2008 List price $9,548 2007 ASP $4,922
STRYKER Definition stem, LFIT V40 36mm head, Trident PSL HA Shell, X3 insert Stem 6265-3-101 $4,003 Head 6260-9-136 $1,957 Shell 542-11-54F $2,286 Liner 623-10-36E $2,163 2008 List price $10,409 2007 ASP $4,879
BIOMET Answer stem, 32mm head, Mallory-Head shell, Ringloc liner Stem 162602 $2,301 Head 163669 $826 Shell 13-104050 $1,939 Liner 11-105923 $1,224 2008 List price $6,290 2007 ASP $3,890
S&N Spectron EF stem, 32mm head, Reflection shell, XLPE liner Stem 7131-2103 $4,173 Head 7130-3208 $1,193 Shell 7133-6456 $2,375 Liner 7133-3334 $2,119 2007 List price $9,860 2006 ASP $4,876
STRYKER Accolade Hfx stem, Unitrax head w/sleeve Stem 6077-0435 $2,125 Head 6942-5-046 $517 Sleeve 6942-6-065 $217 2008 List price $2,859 2007 ASP $2,145
DEPUY Summit basic stem, 47mm Cathcart femoral head Stem 1570-05-135 $2,003 Head 1363-47-000 $515 2008 List price $2,518 2007 ASP $1,490
S&N Synergy stem, 32mm head, Reflection shell, CLPE liner Stem 7131-6509 $2,119 Head 12-6645 $556 Sleeve 7132-6600 $177 2008 List price $2,852 2007 ASP $1,256
BIOMET Alliance stem, Bio-Moore II head w/insert Stem 162902 $1,973 Head 12-139014 $482 Sleeve 139247 $127 2008 List price $2,582 2007 ASP $1,552
ZIMMER Versys LD/Fx stem, Endo head w/adaptor Stem 00-7833-012-00 $2,086 Head 00-7818-044-00 $613 Adaptor 00-7818-099-00 $160 2008 List price $2,859 2007 ASP $1,570
ENCORE Foundation stem, unipolar head w/sleeve Stem 450-01-120 $1,950 Head 411-00-147 $613 Adaptor411-00-035 $160 2008 List price $2,570 2007 ASP $1,772
Modular Endoprosthesis
One-Piece Endoprosthesis
ZIMMER Moore endoprosthesis Stem 00-4021-012-46 $1,5592008 List price $1,5592007 ASP $623
Bipolar Partial Hip
DEPUY Summit press-fit stem, 28mm head, bipolar cup Stem 1570-05-100 $2,003 Head 1365-11-000 $979 Cup 1035-46-000 $1,143 2008 List price $4,125 2007 ASP $2,295
STRYKER Omnifit Hfx stem, 28mm head, bipolar cup Stem 6070-0730A $1,909 Head 06-2800 $1,030 Bipolar UH1-46-28 $1,338 2008 List price $4,277 2007 ASP $2,677
ZIMMER Versys LD/Fx stem, 28mm head, bipolar shell/liner assembly Stem 00-7833-012-00 $2,086 Head 00-8018-028-02 $968 Shell 00-5001-046-00 $842 Liner 00-5001-044-28 $519 2008 List Price $4,415 2007 ASP $2,353
BIOMET Alliance stem, 28mm head, Ringloc bipolar cup Stem 162902 $1,973 Head 163661 $826 Cup 11-165216 $1,399 2008 List price $4,198 2007 ASP $2,561
ENCORE Foundation stem, 28mm head, bipolar shell Stem 440-01-105 $1,800 Head 497-28-000 $920 Cup 412-01-044 $1,300 2008 List price $4,020 2007 ASP $2,969
S&N Cobra stem, 28mm head, Tandem bipolar cup Stem 7131-2162 $2,172 Head 7130-2800 $1,193 Bipolar 7132-2044 $1,418 2008 List price $4,783 2007 ASP $2,032
Uncoated Stem, Metal on Poly (UMOP)
others
biomet
stryker
depuy
Zimmer
Others 5%Depuy 24%
Biomet 11%
Approximate Market Shares (Cases)
Zimmer 40%
Stryker 20%
others
Biomet
Zimmer
Stryker
Depuy
Others 8%
Depuy 42%
Biomet 10%
Approximate Market Shares (Cases)Zimmer 11%
Stryker 30%
ohters
Biomet
s&n
depuy
Stryker
Depuy 21%
Biomet 9%
Approximate Market Shares (Cases)
Others 9%Stryker 50%
S&N 10%
stryker
zimmer
Biomet 9%
Approximate Market Shares (Cases)
Zimmer 98%Stryker 5%
S&N20%

© 2008 Mendenhall Associates, Inc. Orthopedic Network News, Vol. 19, No. 3, July 2008 11
posted to www.OrthopedicNetworkNews.com on August 10, 2008 at 9:00 PM EST
For more information on specific components, see www.OrthopedicNetworkNews.com, Find-a-part
DEPUY PFC Sigma: CS femur, tibial tray, stabilized insert, patella Femur 96-0043 $3,969 Tibia 1581-25-000 $3,033 Insert 96-2131 $1,966 Patella 96-0102 $955 2008 List price $9,923 2007 ASP $4,589
BIOMET Vanguard CR femur Maxim I-Beam tibia, Van-guard insert, Arcom patella Femur 183006 $4,498 Tibia 141223 $2,327 Insert 183440 $1,618 Patella 11-150842 $899 2008 List price $9,342 2007 ASP $4,647
ZIMMER NexGen LPS flex GSF option femur, precoat tibia, LPS flex insert, patella Femur 00-5764-015-52 $5,831 Tibia 00-5980-047-01 $2,537 Insert 00-5964-032-10 $1,849 Patella 00-5972-065-35 $1,014
2008 List price $11,231 2007 ASP $5,876
STRYKER Triathlon PS femur, tibia, X3 insert and patella Femur 5515-F-401 $4,015 Tibia 5520-B-400 $2,443 Insert 5532-G-411 $2,764 Patella 5551-G-320 $1,371 2008 List price $10,593 2007 ASP $5,525
ZIMMER NexGen CR-Flex porous, Trabecular metal tibia Trabecular metal patella Femur 00-5952-015-02 $6,404 Tibia 00-5886-044-10 $5,122 Patella 00-5878-065-35 $2,160 2008 List price $13,686 2007 ASP $7,602
STRYKER Scorpio PS PA femur w/peri-appatite, X3 insert and patella Femur 71-5207R $5,754 Tibia 7145-0007-8 $3,599 Insert 72-25-0710 $2,634 Patella 73-20-3708 $1,181 2008 List price $13,168 2007 ASP $6,677
BIOMET Vanguard femur, Maxim tibia Femur 183048 $5,360 Tibia 141263 $2,978 Insert 183440 $1,618 Patella 11-150842 $899 2008 List price $10,855 2007 ASP $6,265
DEPUY LCS Complete Femur 1294-04-040 $5,502 Tibia 1294-34-140 $3,757 Insert 1294-05-410 $1,641 Patella 1294-09-640 $2,097 2008 List price $12,997 2007 ASP $7,049
S&N Profix System Femur 7150-2140 $4,534 Tibia 7150-4120 $3,078 Insert 7150-7121 $1,307 Patella 7152-5020 $877 2008 List price $9,796 2007 ASP $9,362
The 2008 U.S. Knee Implant Price comparisonS&N Genesis II zirconium femur, tibia, insert, patella Femur 7142-0152 $4,678 Tibia 7142-0184 $2,295 Insert 7142-0766 $1,604 Patella 7142-0566 $949 2008 List price $9,526 2007 ASP $5,159
WMT Advance NP femur, tibial baseplate, insert, patella Femur KFTC-NP4R $3,810 Tibia KTCC-NP40 $3,150 Insert KIMP-312R $1,940 Patella KPON-TP35 $1,000 2008 List price $9,900 2007 ASP $4,633
EXACTECH Optetrak CR femur, tray, insert, patella Femur 230-03-03 $3,670 Tibia 200-04-33 $2,535 Insert 200-23-09 $1,325 Patella 200-05-29 $970 2008 List price $8,500 2007 ASP $3,913
ENCORE 3D knee w/femur, baseplate, insert, patella Femur 233-02-106 $3,818 Tibia 323-01-104 $2,449 Insert 329-11-606 $1,843 Patella 130-03-032 $1.061
2008 List price $9,171 2007 ASP $6,461
Coated Femur/Coated Tibia Uncoated Femur/Uncoated Tibia
others
biomet
stryker
zimmerOthers 9%
Biomet 7%
Approximate Market Shares (Cases)
Zimmer 73%
Stryker 11%
Other
s&n
stryker
zimmer
biomet
depuy
Depuy 28%
Biomet 24%
Approximate Market Shares (Cases)
Zimmer 21%
Stryker 18%
S&N 8%
Other 4%
S&N 13%
The part constructs appearing on these pages are the most frequent constructs for each of the manufacturers and system constructs from the ORN (Orthopedic Research Network), a group of about 35 hospitals that submitted data through one of several systems marketed by Mendenhall Associates, Inc. There were a total of over 15,000 hip and knee procedures from this group for 2007.
The “List price” is the 2008 list price from the manufacturers, obtained from their annual price lists. The price lists are those effective for January 1, 2008. The “ASP” (average selling price) is the average price for each of the components from the Hospital Purchasing Database (HPD) which includes the hospitals of the ORN and is supplemented with about 80 other hospitals in 2007.
Given the virtually limitless combinations of constructs that are possible by mixing and matching various components with each other, only the most fre-quently occurring construct for the major manufacturers is included. List prices and average selling prices for other components are available on www.OrthopedicNetworkNews.com under “Find-a-Part”.
The classification of hip and knee implant components uses the GIC ® classification developed by Orthopedic Network News.
12 Orthopedic Network News, Vol. 19, No. 3, July 2008 © 2008 Mendenhall Associates, Inc.
posted to www.OrthopedicNetworkNews.com on August 10, 2008 at 9:00 PM EST
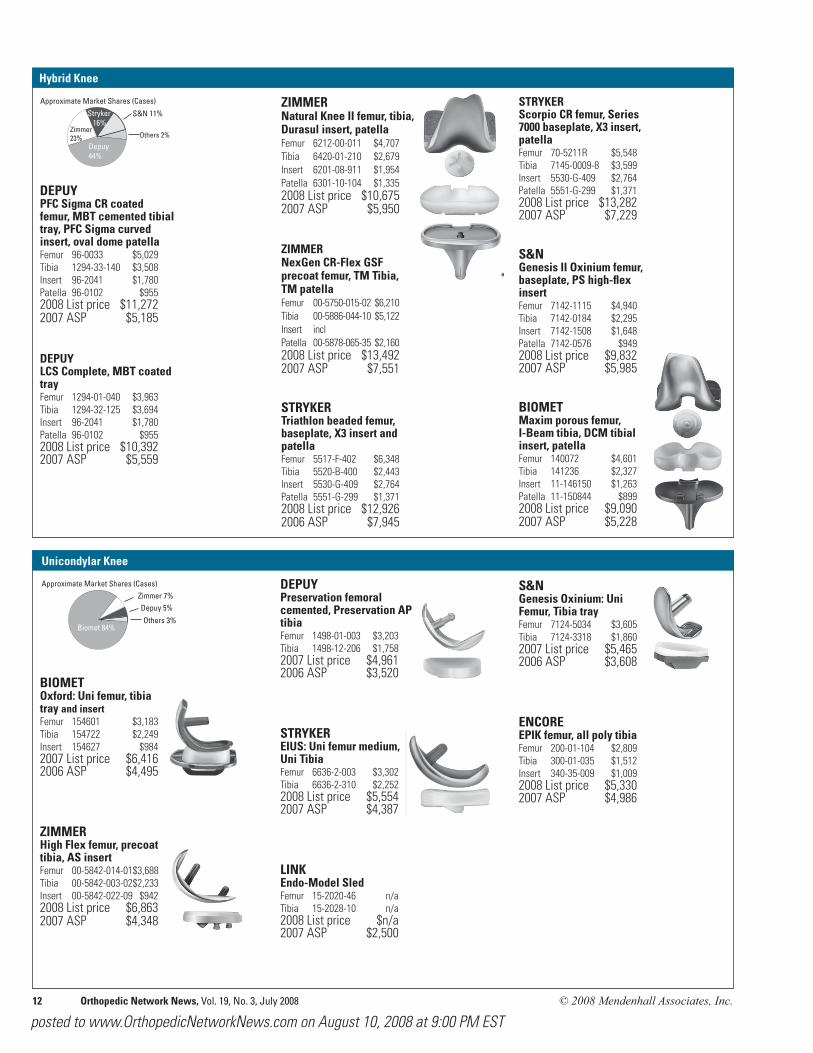
STRYKER Scorpio CR femur, Series 7000 baseplate, X3 insert, patella Femur 70-5211R $5,548 Tibia 7145-0009-8 $3,599 Insert 5530-G-409 $2,764 Patella 5551-G-299 $1,371 2008 List price $13,282 2007 ASP $7,229
S&N Genesis II Oxinium femur, baseplate, PS high-flex insert Femur 7142-1115 $4,940 Tibia 7142-0184 $2,295 Insert 7142-1508 $1,648 Patella 7142-0576 $949 2008 List price $9,832 2007 ASP $5,985
BIOMET Maxim porous femur, I-Beam tibia, DCM tibial insert, patella Femur 140072 $4,601 Tibia 141236 $2,327 Insert 11-146150 $1,263 Patella 11-150844 $899 2008 List price $9,090 2007 ASP $5,228
DEPUY PFC Sigma CR coated femur, MBT cemented tibial tray, PFC Sigma curved insert, oval dome patella Femur 96-0033 $5,029 Tibia 1294-33-140 $3,508 Insert 96-2041 $1,780 Patella 96-0102 $955 2008 List price $11,272 2007 ASP $5,185
DEPUY LCS Complete, MBT coated tray Femur 1294-01-040 $3,963 Tibia 1294-32-125 $3,694 Insert 96-2041 $1,780 Patella 96-0102 $955 2008 List price $10,392 2007 ASP $5,559
Hybrid Knee
ZIMMER Natural Knee II femur, tibia, Durasul insert, patella Femur 6212-00-011 $4,707 Tibia 6420-01-210 $2,679 Insert 6201-08-911 $1,954 Patella 6301-10-104 $1,335 2008 List price $10,675 2007 ASP $5,950
ZIMMER NexGen CR-Flex GSF precoat femur, TM Tibia, TM patella Femur 00-5750-015-02 $6,210 Tibia 00-5886-044-10 $5,122 Insert incl Patella 00-5878-065-35 $2,160 2008 List price $13,492 2007 ASP $7,551
STRYKER Triathlon beaded femur, baseplate, X3 insert and patella Femur 5517-F-402 $6,348 Tibia 5520-B-400 $2,443 Insert 5530-G-409 $2,764 Patella 5551-G-299 $1,371 2008 List price $12,926 2006 ASP $7,945
S&N Genesis Oxinium: Uni Femur, Tibia tray Femur 7124-5034 $3,605 Tibia 7124-3318 $1,860 2007 List price $5,465 2006 ASP $3,608
ENCORE EPIK femur, all poly tibia Femur 200-01-104 $2,809 Tibia 300-01-035 $1,512 Insert 340-35-009 $1,009 2008 List price $5,330 2007 ASP $4,986
Unicondylar Knee
BIOMET Oxford: Uni femur, tibia tray and insert Femur 154601 $3,183 Tibia 154722 $2,249 Insert 154627 $984 2007 List price $6,416 2006 ASP $4,495
ZIMMER High Flex femur, precoat tibia, AS insert Femur 00-5842-014-01 $3,688 Tibia 00-5842-003-02 $2,233 Insert 00-5842-022-09 $942 2008 List price $6,863 2007 ASP $4,348
DEPUY Preservation femoral cemented, Preservation AP tibia Femur 1498-01-003 $3,203 Tibia 1498-12-206 $1,758 2007 List price $4,961 2006 ASP $3,520
STRYKER EIUS: Uni femur medium, Uni Tibia Femur 6636-2-003 $3,302 Tibia 6636-2-310 $2,252 2008 List price $5,554 2007 ASP $4,387
LINK Endo-Model Sled Femur 15-2020-46 n/a Tibia 15-2028-10 n/a 2008 List price $n/a 2007 ASP $2,500
other
depuy
zimmer
biomet
Depuy 5%
Biomet 84%
Approximate Market Shares (Cases)Zimmer 7%
Others 3%
others
s&n
stryker
zimmer
depuy
Exactech 1%
Depuy 44%
Approximate Market Shares (Cases)
Zimmer 23%
Stryker 16%
S&N 11%
WMT 1%
Others 2%
© 2008 Mendenhall Associates, Inc. Orthopedic Network News, Vol. 19, No. 3, July 2008 13
posted to www.OrthopedicNetworkNews.com on August 10, 2008 at 9:00 PM EST
Average Cost of Implant Components by Procedure 1992-2007
$2000
$3000
$4000
$5000
All
0705009592
All ORNMembers$5,663 in 2007Up 3% From 2006
Implant Cost/Procedure
% of Cases by Construct Type, 1999-2007
0%
20%
40%
60%
80%
100%Other
Cemented Stem/Poly Cup 13%
Coated Stem/Poly Cup 42%
Metal on Metal 37%
Ceramic on Ceramic 6%070605040302010099
54%
36%
% 2006 2007 ChgOverall $5,484 $5,663 +3%
Total Hip 6,687 6,580 -2% Primary Knee 5,519 5,448 -1%Partial Hip 3,285 3,327 +1%Resurfacing Hip 10,048 10,031 0% Revision Hip 6,081 6,107 0%Revision Knee 6,015 7,650 27%
Trends in Total Hip Implant Construct Type, 1999-2007
Source: Orthopedic Research Network (ORN), 1999-2006
Total Hip
$0
$2000
$4000
$6000
$8000
Uncoated Femur/Poly Liner
Coated Femur/Poly Liner
Metal/Metal
Ceramic/Ceramic
070605040302010099
$7,503 -11%
$5,264 -7%
Average Selling Price by Construct Type 1999-2007
$2,661
$6,945 -3%
$6,568 -1%
Note: Construct types:Ceramic/ceramic has any type of stem with ceramic head and ceramic or metal liner Metal on metal has any type of stem with metal head and liner, or all metal cupCoated femur/poly liner has coated or revision femur, head, poly linerUncoated femur/poly liner has uncoated femur, femoral head, poly linerRemaining cases are misclassified, miscoded or cases that weren’t billed for all components.
Summary 1999 2006 2007 Coated Stem/Hard Liner Systems 40% 72% 85%Uncoated Hip Systems 54% 20% 13%
Market Share by Procedure, 2006-07
0%
25%
50%
75%
100% Resurfacing Hip 0.4%Revision Hip 3.7%Revision Knee 5.3%
Partial Hip 9.6%Total Hip 23.5%Primary Knee 57.5%0706
Note: 2006 prices reported here may be different from those reported in the July 2007 newsletter because of incomplete data submission by hospitals
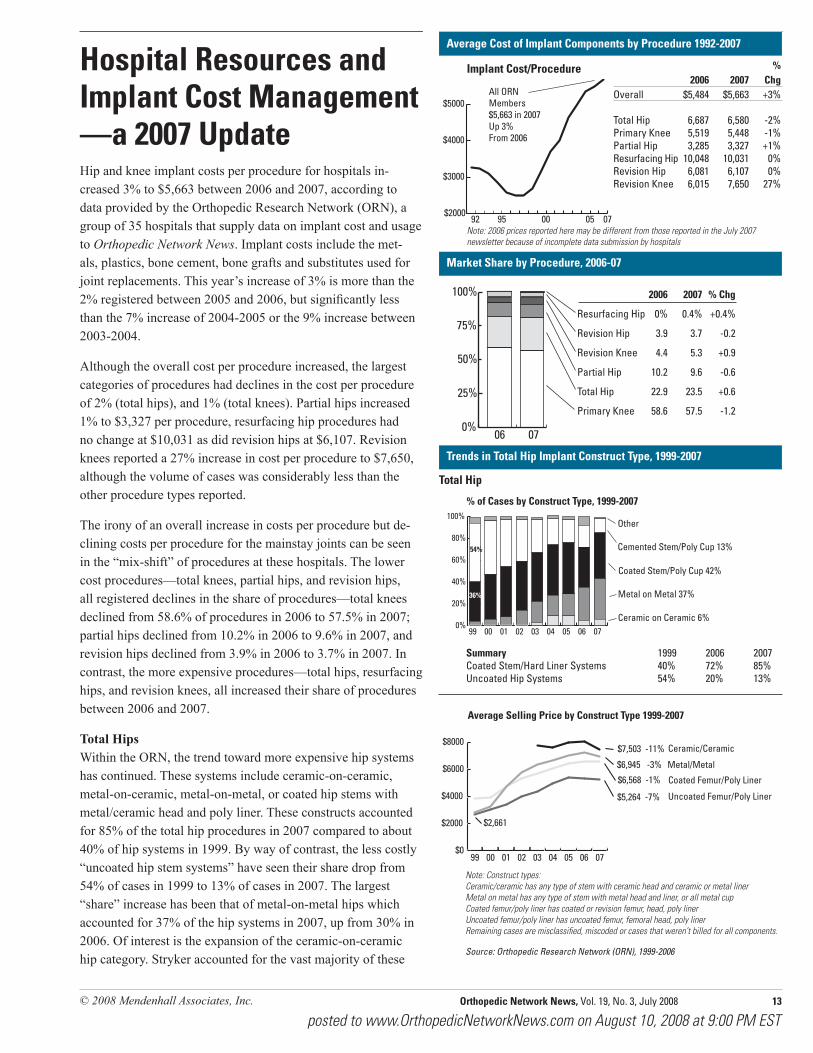
Hospital Resources and Implant Cost Management —a 2007 UpdateHip and knee implant costs per procedure for hospitals in-creased 3% to $5,663 between 2006 and 2007, according to data provided by the Orthopedic Research Network (ORN), a group of 35 hospitals that supply data on implant cost and usage to Orthopedic Network News. Implant costs include the met-als, plastics, bone cement, bone grafts and substitutes used for joint replacements. This year’s increase of 3% is more than the 2% registered between 2005 and 2006, but significantly less than the 7% increase of 2004-2005 or the 9% increase between 2003-2004.
Although the overall cost per procedure increased, the largest categories of procedures had declines in the cost per procedure of 2% (total hips), and 1% (total knees). Partial hips increased 1% to $3,327 per procedure, resurfacing hip procedures had no change at $10,031 as did revision hips at $6,107. Revision knees reported a 27% increase in cost per procedure to $7,650, although the volume of cases was considerably less than the other procedure types reported.
The irony of an overall increase in costs per procedure but de-clining costs per procedure for the mainstay joints can be seen in the “mix-shift” of procedures at these hospitals. The lower cost procedures—total knees, partial hips, and revision hips, all registered declines in the share of procedures—total knees declined from 58.6% of procedures in 2006 to 57.5% in 2007; partial hips declined from 10.2% in 2006 to 9.6% in 2007, and revision hips declined from 3.9% in 2006 to 3.7% in 2007. In contrast, the more expensive procedures—total hips, resurfacing hips, and revision knees, all increased their share of procedures between 2006 and 2007.
Total Hips Within the ORN, the trend toward more expensive hip systems has continued. These systems include ceramic-on-ceramic, metal-on-ceramic, metal-on-metal, or coated hip stems with metal/ceramic head and poly liner. These constructs accounted for 85% of the total hip procedures in 2007 compared to about 40% of hip systems in 1999. By way of contrast, the less costly “uncoated hip stem systems” have seen their share drop from 54% of cases in 1999 to 13% of cases in 2007. The largest “share” increase has been that of metal-on-metal hips which accounted for 37% of the hip systems in 2007, up from 30% in 2006. Of interest is the expansion of the ceramic-on-ceramic hip category. Stryker accounted for the vast majority of these
2006 2007 % Chg
Resurfacing Hip 0% 0.4% +0.4%
Revision Hip 3.9 3.7 -0.2
Revision Knee 4.4 5.3 +0.9
Partial Hip 10.2 9.6 -0.6
Total Hip 22.9 23.5 +0.6
Primary Knee 58.6 57.5 -1.2

14 Orthopedic Network News, Vol. 19, No. 3, July 2008 © 2008 Mendenhall Associates, Inc.
posted to www.OrthopedicNetworkNews.com on August 10, 2008 at 9:00 PM EST
Profile of Total Hip Cases, Components, 1999-2007
Types of Femoral Heads
0%
25%
50%
75%
100% Ceramic12%
Metal88%
070605040302010099
85
15
0%
20%
40%
60%
80%
100%
OA
Fracture
AVN070605040302010099
% of Cases by Principal Diagnosis
90.4%
3.5%
6.2% 0%
20%
40%
60%
80%
100%
<455%
>6458%<6542%
070605040302010099
% of Cases by Age
41%
59%
Total Hip Cases
Source: ORN
Source: Hospital Purchasing Database (HPD)
Average Selling PricesFemoral Stems
$0
$1000
$2000
$3000
$4000
Resurfacing $4,407 +7%
Revision $3,919 -1%
Uncoated $1,858 +8
Coated $3,269 +3%
070605040302010099
Types of Hip Stems
0%
25%
50%
75%
100% Endo 1%
Long 7%
Cemented 30%
Coated 59%
070605040302010099
20%
Resurfacing 3%
Source: HPD
0%
25%
50%
75%
100%>32mm 53%
32mm 24%
28mm 20%
26mm 2%
22mm 1%070605040302010099
Femoral Head Size
$0
$500
$1000
$1500
Metal >32mm$1,056 +17%
Metal <=32mm$560 +12%
Ceramic $1,379 0%
All Metal$828 +30%
070605040302010099
Femoral Heads ASP
implants. They had an expensive DTC (direct-to-consumer) campaign with golfer Jack Nicklaus as a spokesjock. Stryker’s share of this segment was 75% in 2003, however in 2007, their share had declined to 49% and Depuy’s had increased to 34% in the ORN. This was largely because of their sales of “ceramic on metal” systems which ONN classifies along with ceramic on ceramic. (Depuy also sells a metal-on-metal system.)
The cost of these systems is largely down: the average selling price (ASP) of ceramic-on-ceramic systems was $7,503, down 11% from 2006; the price of metal on metal systems was down 3% to $6,945 in 2007, and a coated stem/poly liner system was $6,568, down 1% from 2006. An uncoated stem/poly liner had an ASP of $5,264 in 2007, down 7% from 2006.
Although most manufacturers have touted the need to provide these high-end systems to patients with higher activity levels, younger demographics, with higher paying insurance, the demo-graphic of total hip implant cases has not changed significantly over the last several years. Osteoarthritis has been the principal diagnosis for patients receiving total hips in 90% of the cases. The age of the patients is about the same as in 1999, with 59% of the cases over age 64 in 1999, and 58% in 2007. The percent-age of cases less than 45 is about 5% in 2007, and 7% in 1999. It should be stated that different samples may report a significant-ly different age distribution for these procedures.
Within the category of total hips, the average age of patients for the least expensive construct—uncoated hip stem and poly liner was 72 years, the oldest of any construct. A coated hip stem with a poly liner averaged 70 years in 2007, while the metal on metal and ceramic on ceramic hip systems averaged 62 and 56 years respectively. It should be noted that the age of metal-on-metal systems has increased significantly since 2004, arguing that the systems designed for “younger, more active patients” may be implanted for older patients on a more routine basis.
A second source of data, the HPD, is used to report average selling prices and mix of components. The HPD includes the hospitals of the ORN in addition to about 80 other hospitals, whose data is only being included for the first year. Hence some of the figures reported may not match those from the ORN. According to the HPD, the percentage of hip stems designated as coated has ballooned to 59% of the stems, compared to 30% uncoated, 7% long or revision stems, 3% resurfacing stems, and 1% endoprosthesis stems. This reflects the movement toward higher technology and prices. The resurfacing stem averaged $4,407 in 2007, up 7% over 2006. Revision hip stems averaged $3,919, down 1% from 2006; coated hip stems averaged $3269, up 3% from 2006, and uncoated hip stems averaged $1,858, up 8% from 2006. The seldom used endoprosthesis declined 10% between 2006 and 2007 to $675.
50
55
60
65
70
75
Metal-on-Metal (MOM)
Ceramic-on-Ceramic (COC)
Uncoated Stem/Poly Liner
Porous Stem/Poly Liner
07060504
56
62
Age of Total Hip Patients by Construct Type
70
72Years
© 2008 Mendenhall Associates, Inc. Orthopedic Network News, Vol. 19, No. 3, July 2008 15
posted to www.OrthopedicNetworkNews.com on August 10, 2008 at 9:00 PM EST
0%
25%
50%
75%
100%Unknown5%Ceramic5%Metal9%X-linked Poly71%Regular Poly10%070605040302010099
Types of Acetabular LinersAll Manufacturers
0%
25%
50%
75%
100% All poly0%
2 piece77%
1-piece23%
070605040302010099
Acetabular Cup Types
Source: HPD
Profile of Total Hip Cases, Components, 1999-2007, Con’t
$0
$1000
$2000
$3000
Poly$950+40%
Shell$1,400+5%
1 Piece$3,401+9%
070605040302010099
Average Selling PricesAcetabular Shells
0%
25%
50%
75%
100%
Revision Knee 69%
Total Knee87%
Revision Hip 17%
Partial Hip31%
Total Hip14%
070605040302010099
% of Cases with Bone Cement by Procedure
Cement Usage by Procedure
Source: ORN
% of Cases by Construct Type, 1999-2007
0%
20%
40%
60%
80%
100%Other 3%
Coated Mod Endo 9%
Endo 4%
Modular Endo/Unipolar 15%
Bipolar/Uncoated Stem 45%
Bipolar/Coated Stem 24%
070605040302010099
43%
31%
18%
$0
$1000
$2000
$3000
$4000
$5000
1 Piece Endo $685 -10%
Mod Endo/Unipolar $1,893* -2%
Bipolar/Uncoated Stem $3,090 +5%
Bipolar/Coated Stem $4,674 -4%
070605040302010099
Average Selling Price by Construct Type 1999-2007
$1,069
$426
$1,822
$3,302
* Excludes 9% of partial hip cases with a coated femur and modular endoprosthesis with an average cost/case of $3,983
Construct types: Bipolar coated stem: Coated stem, head, and bipolar componentBipolar uncoated stem: Uncoated stem, head, and bipolar componentModular endo/unipolar: Uncoated stem, unipolar head1 piece endo: Endoprosthesis: Source: ORN
Trends in Partial Hip Implant Construct Type, 1999-2007
$0
$500
$1000
$1500
$2000 Ceramic $1,702 -3%
Metal $1,564 +12%
X-linked Poly $1,140 +8%
Regular Poly$820 +28%
070605040302010099
Average Selling Prices Acetabular Liners
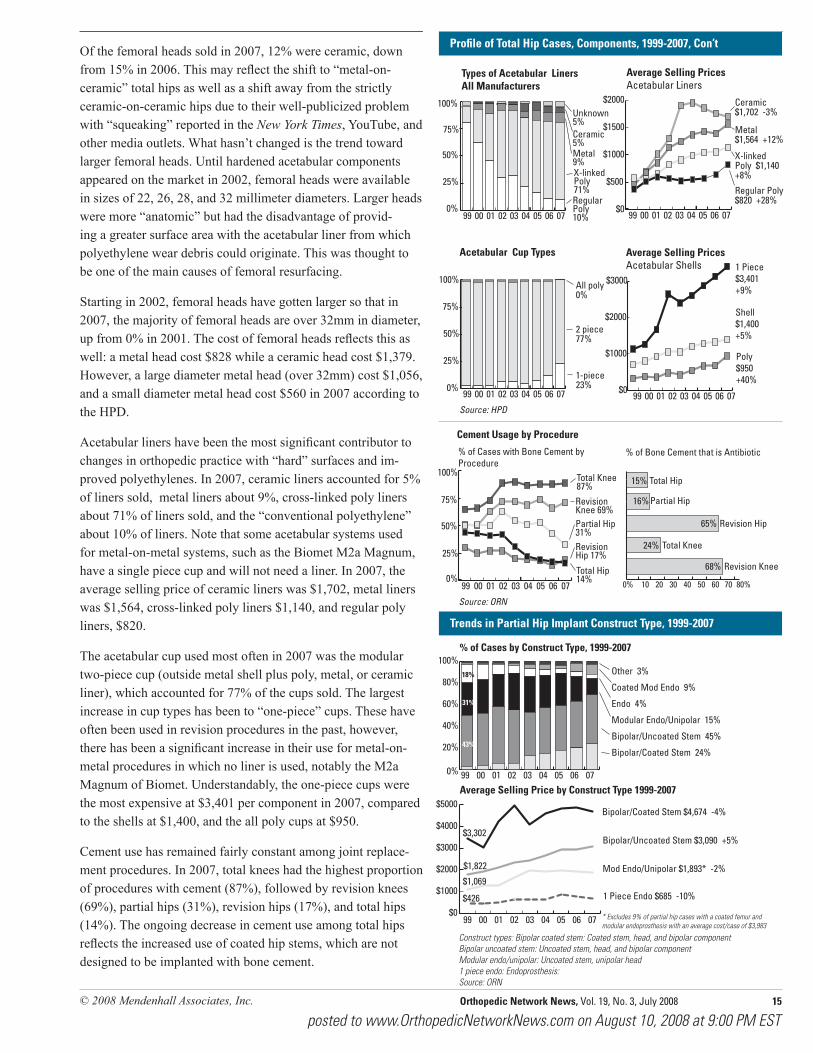
Of the femoral heads sold in 2007, 12% were ceramic, down from 15% in 2006. This may reflect the shift to “metal-on-ceramic” total hips as well as a shift away from the strictly ceramic-on-ceramic hips due to their well-publicized problem with “squeaking” reported in the New York Times, YouTube, and other media outlets. What hasn’t changed is the trend toward larger femoral heads. Until hardened acetabular components appeared on the market in 2002, femoral heads were available in sizes of 22, 26, 28, and 32 millimeter diameters. Larger heads were more “anatomic” but had the disadvantage of provid-ing a greater surface area with the acetabular liner from which polyethylene wear debris could originate. This was thought to be one of the main causes of femoral resurfacing.
Starting in 2002, femoral heads have gotten larger so that in 2007, the majority of femoral heads are over 32mm in diameter, up from 0% in 2001. The cost of femoral heads reflects this as well: a metal head cost $828 while a ceramic head cost $1,379. However, a large diameter metal head (over 32mm) cost $1,056, and a small diameter metal head cost $560 in 2007 according to the HPD.
Acetabular liners have been the most significant contributor to changes in orthopedic practice with “hard” surfaces and im-proved polyethylenes. In 2007, ceramic liners accounted for 5% of liners sold, metal liners about 9%, cross-linked poly liners about 71% of liners sold, and the “conventional polyethylene” about 10% of liners. Note that some acetabular systems used for metal-on-metal systems, such as the Biomet M2a Magnum, have a single piece cup and will not need a liner. In 2007, the average selling price of ceramic liners was $1,702, metal liners was $1,564, cross-linked poly liners $1,140, and regular poly liners, $820.
The acetabular cup used most often in 2007 was the modular two-piece cup (outside metal shell plus poly, metal, or ceramic liner), which accounted for 77% of the cups sold. The largest increase in cup types has been to “one-piece” cups. These have often been used in revision procedures in the past, however, there has been a significant increase in their use for metal-on-metal procedures in which no liner is used, notably the M2a Magnum of Biomet. Understandably, the one-piece cups were the most expensive at $3,401 per component in 2007, compared to the shells at $1,400, and the all poly cups at $950.
Cement use has remained fairly constant among joint replace-ment procedures. In 2007, total knees had the highest proportion of procedures with cement (87%), followed by revision knees (69%), partial hips (31%), revision hips (17%), and total hips (14%). The ongoing decrease in cement use among total hips reflects the increased use of coated hip stems, which are not designed to be implanted with bone cement.
0% 10 20 30 40 50 60 70 80%
Revision Knee
Total Knee
Revision Hip
Partial Hip
Total Hip
68%
24%
% of Bone Cement that is Antibiotic
65%
16%
15%
16 Orthopedic Network News, Vol. 19, No. 3, July 2008 © 2008 Mendenhall Associates, Inc.
posted to www.OrthopedicNetworkNews.com on August 10, 2008 at 9:00 PM EST
Revision Hips, ORN, 1999-2007
$0
$250
$500
$750
$1000
Unipolar $316 +1%
Endo $675 -8%
Bipolar $731 +7%
070605040302010099
Source: ORN
Femoral heads for partial hips
0%
25%
50%
75%
100% Endo2%
Bipolar63%
Unipolar34%
070605040302010099
Profile of Partial Hip Cases, Components, 1999-2007
85%
90%
95%
Fracture
070605040302010099
Principal Diagnosis of Fracture
93%
89%
85%
90%
95%>64
070605040302010099
% of Cases Over 64 Years Old
93%
ASP
0%
1%
2%
3%
4%
5%
6%% of Liners
070605040302010099
2.8%
6.0%
2.6%
3.6%
3.0%
Constrained Liners
Unipolar
Bipolar
0%
25%
50%
75%
100%
None31%
Pelvic27%
Femur19%
Pelvic+Femur22%
070605040302010099
$0
$2000
$4000
$6000
$8000
$10000
Minimal$3,514 +20%
Acetabular Only$5,871 +10%
Femoral Only$6,746 -12%
Femoral + Acetabular$9,591 -5%
070605040302010099
Trends in Type of “Disruption” for Revision Hips
ASPs of Revision Hips
Source: HPD
Source: ORN
Source: HPD
10.0%
12.5%
15.0%
% of hips
070605040302010099
% of Hips That Are Revisions in the Orthopedic Research Network
14.5%
11.2%
Others
Zimmer
Stryker
Depuy
Biomet
24% Depuy29%
Biomet26%
Osteonics20%
Zimmer17%
Other 8%
2007 Market Share of Hip Revisions (Cases)
“Endo” includes GIC 22 excluding Type1=Resurface and Type1=Temp
Of particular note is the use of antibiotic bone cement in joint procedures, a device virtually unheard of in the US until several years ago. Of the bone cement used on revision knees, 68% was antibiotic, for revision hips, 65% of bone cement was antibiotic impregnated, followed by total knees (24%), partial hips (16%), and total hips (15%). It should be noted that some hospitals may be concocting their own antibiotic bone cement by mixing an antibiotic with conventional bone cement, thus saving some money on the more expensive bone cement.
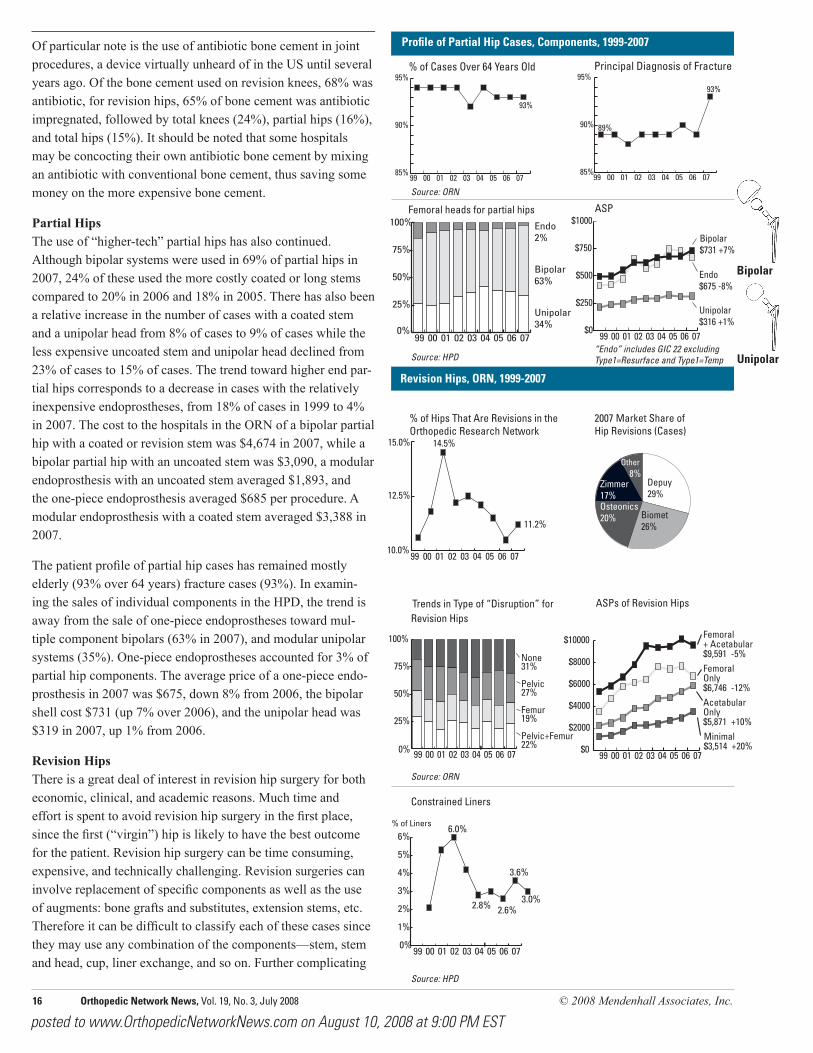
Partial Hips The use of “higher-tech” partial hips has also continued. Although bipolar systems were used in 69% of partial hips in 2007, 24% of these used the more costly coated or long stems compared to 20% in 2006 and 18% in 2005. There has also been a relative increase in the number of cases with a coated stem and a unipolar head from 8% of cases to 9% of cases while the less expensive uncoated stem and unipolar head declined from 23% of cases to 15% of cases. The trend toward higher end par-tial hips corresponds to a decrease in cases with the relatively inexpensive endoprostheses, from 18% of cases in 1999 to 4% in 2007. The cost to the hospitals in the ORN of a bipolar partial hip with a coated or revision stem was $4,674 in 2007, while a bipolar partial hip with an uncoated stem was $3,090, a modular endoprosthesis with an uncoated stem averaged $1,893, and the one-piece endoprosthesis averaged $685 per procedure. A modular endoprosthesis with a coated stem averaged $3,388 in 2007.
The patient profile of partial hip cases has remained mostly elderly (93% over 64 years) fracture cases (93%). In examin-ing the sales of individual components in the HPD, the trend is away from the sale of one-piece endoprostheses toward mul-tiple component bipolars (63% in 2007), and modular unipolar systems (35%). One-piece endoprostheses accounted for 3% of partial hip components. The average price of a one-piece endo-prosthesis in 2007 was $675, down 8% from 2006, the bipolar shell cost $731 (up 7% over 2006), and the unipolar head was $319 in 2007, up 1% from 2006.
Revision Hips There is a great deal of interest in revision hip surgery for both economic, clinical, and academic reasons. Much time and effort is spent to avoid revision hip surgery in the first place, since the first (“virgin”) hip is likely to have the best outcome for the patient. Revision hip surgery can be time consuming, expensive, and technically challenging. Revision surgeries can involve replacement of specific components as well as the use of augments: bone grafts and substitutes, extension stems, etc. Therefore it can be difficult to classify each of these cases since they may use any combination of the components—stem, stem and head, cup, liner exchange, and so on. Further complicating
© 2008 Mendenhall Associates, Inc. Orthopedic Network News, Vol. 19, No. 3, July 2008 17
posted to www.OrthopedicNetworkNews.com on August 10, 2008 at 9:00 PM EST
% of Cases With a Stem Extension and a Hip Femur
Trends in Primary Knee Implants, 1999-2007
0%
20%
40%
60%
80%
<45 Years 3%
>64 Years 61%
070605040302010099
% of Cases
0%
20%
40%
60%
80%
100%
OA99%
Fracture0%
AVN0%
070605040302010099
Principal Diagnosis
Revision Hips, 1999-2007
Modular Stems Used in Hip Procedures
Use of Bone Graft in Revision Hips and Knees
0%
5%
10%
15%
20%
25%
Revision Knee4%
Revision Hip9%
0706050403020100990%
5%
10%
15%Revision hips12%
Total hips10%
070605040302010099Source: ORN
Source: ORN
% of Cases By Construct Type, 1999-2007
0%
20%
40%
60%
80%
100% Other 2%
Uncoated Femur/Uncoated Tibia 77%
Hybrid 7%Coated Femur/Coated Tibia 6%Unicondylar 8%
070605040302010099
$0
$2000
$4000
$6000
$8000
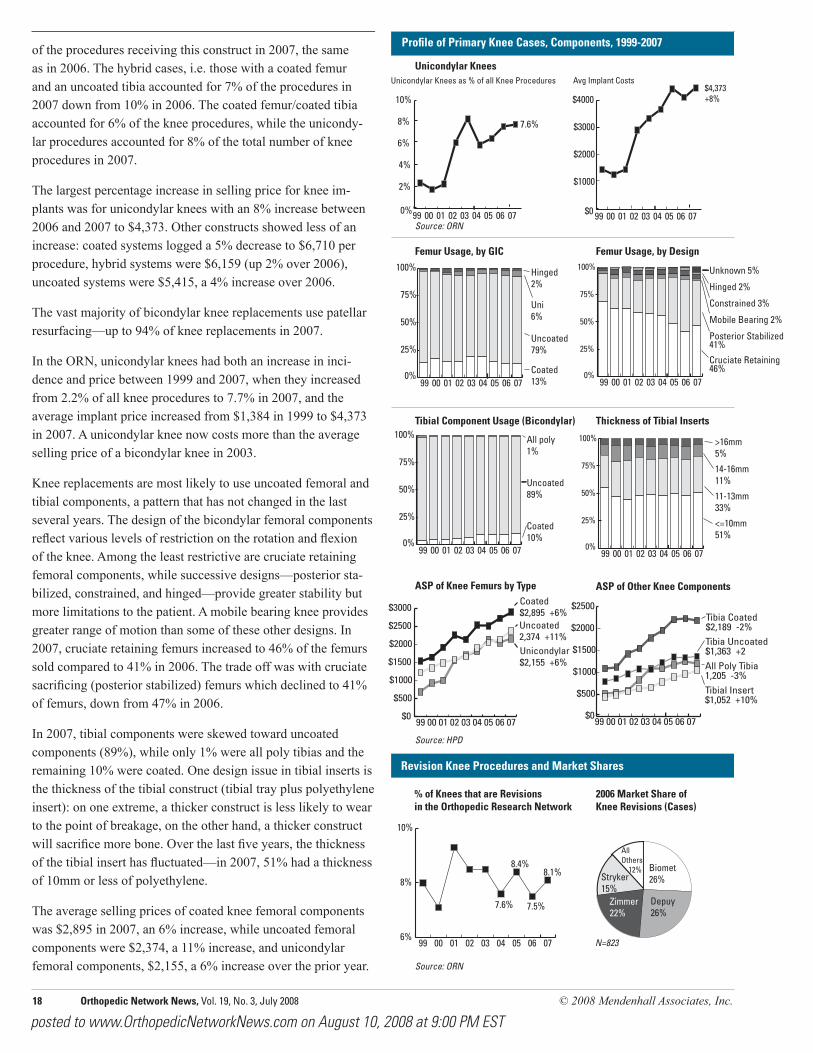
Unicondylar $4,373 +8%
Uncoated Femur/Uncoated Tibia $5,415 +4%
Hybrid $6,159 +2%
Coated Femur/Coated Tibia $6,710 -5%
070605040302010099
Average Selling Price By Construct Type 1999-2007
$2,827
$1,384
$3,126
$3,809
90%
92%
94%
96%
98%
100%
070605040302010099
% of Bicondylar Knees With Patella
94%
Source: ORN
statistics is the treatment of the so-called “two-stage” revisions in which an antibiotic-laden prosthesis is implanted for several weeks followed by a second surgery in which this prosthesis is removed and new implants are placed.
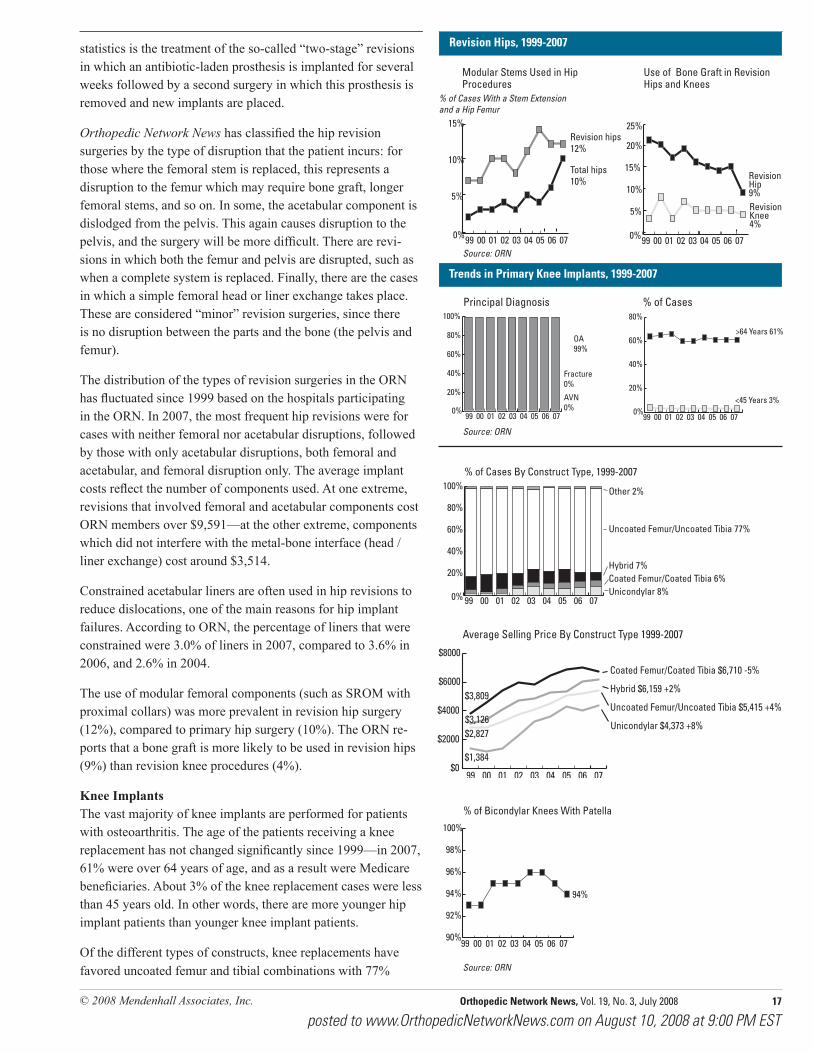
Orthopedic Network News has classified the hip revision surgeries by the type of disruption that the patient incurs: for those where the femoral stem is replaced, this represents a disruption to the femur which may require bone graft, longer femoral stems, and so on. In some, the acetabular component is dislodged from the pelvis. This again causes disruption to the pelvis, and the surgery will be more difficult. There are revi-sions in which both the femur and pelvis are disrupted, such as when a complete system is replaced. Finally, there are the cases in which a simple femoral head or liner exchange takes place. These are considered “minor” revision surgeries, since there is no disruption between the parts and the bone (the pelvis and femur).
The distribution of the types of revision surgeries in the ORN has fluctuated since 1999 based on the hospitals participating in the ORN. In 2007, the most frequent hip revisions were for cases with neither femoral nor acetabular disruptions, followed by those with only acetabular disruptions, both femoral and acetabular, and femoral disruption only. The average implant costs reflect the number of components used. At one extreme, revisions that involved femoral and acetabular components cost ORN members over $9,591—at the other extreme, components which did not interfere with the metal-bone interface (head /liner exchange) cost around $3,514.
Constrained acetabular liners are often used in hip revisions to reduce dislocations, one of the main reasons for hip implant failures. According to ORN, the percentage of liners that were constrained were 3.0% of liners in 2007, compared to 3.6% in 2006, and 2.6% in 2004.
The use of modular femoral components (such as SROM with proximal collars) was more prevalent in revision hip surgery (12%), compared to primary hip surgery (10%). The ORN re-ports that a bone graft is more likely to be used in revision hips (9%) than revision knee procedures (4%).
Knee Implants The vast majority of knee implants are performed for patients with osteoarthritis. The age of the patients receiving a knee replacement has not changed significantly since 1999—in 2007, 61% were over 64 years of age, and as a result were Medicare beneficiaries. About 3% of the knee replacement cases were less than 45 years old. In other words, there are more younger hip implant patients than younger knee implant patients.
Of the different types of constructs, knee replacements have favored uncoated femur and tibial combinations with 77%
18 Orthopedic Network News, Vol. 19, No. 3, July 2008 © 2008 Mendenhall Associates, Inc.
posted to www.OrthopedicNetworkNews.com on August 10, 2008 at 9:00 PM EST
$0
$1000
$2000
$3000
$4000
Avg Implant Costs
070605040302010099
$4,373 +8%
0%
2%
4%
6%
8%
10%
Unicondylar Knees as % of all Knee Procedures
070605040302010099
7.6%
Source: ORN
ASP of Knee Femurs by Type
$0
$500
$1000
$1500
$2000
$2500Tibia Coated$2,189 -2%
All Poly Tibia1,205 -3%Tibial Insert$1,052 +10%
Tibia Uncoated$1,363 +2
070605040302010099$0
$500
$1000
$1500
$2000
$2500
$3000
Unicondylar$2,155 +6%
Uncoated2,374 +11%
Coated$2,895 +6%
070605040302010099
ASP of Other Knee Components
Source: HPD
Source: ORN
Revision Knee Procedures and Market Shares
Profile of Primary Knee Cases, Components, 1999-2007
Femur Usage, by GIC
0%
25%
50%
75%
100% Hinged 2%
Uni 6%
Uncoated 79%
Coated 13%070605040302010099
0%
25%
50%
75%
100% Unknown 5%
Hinged 2%
Constrained 3%
Mobile Bearing 2%
Posterior Stabilized 41%
Cruciate Retaining 46%
070605040302010099
0%
25%
50%
75%
100% >16mm5%
14-16mm11%
11-13mm33%
<=10mm51%
070605040302010099
Tibial Component Usage (Bicondylar) Thickness of Tibial Inserts
0%
25%
50%
75%
100% All poly1%
Uncoated89%
Coated10%
070605040302010099
N=8236%
8%
10%
070605040302010099
8.4%
7.5%
66%
7.6%
8.1%
2006 Market Share of Knee Revisions (Cases)
AllOthers 12%
Stryker15%
Zimmer22%
Depuy26%
Biomet26%
Unicondylar Knees
Femur Usage, by Design
% of Knees that are Revisions in the Orthopedic Research Network
of the procedures receiving this construct in 2007, the same as in 2006. The hybrid cases, i.e. those with a coated femur and an uncoated tibia accounted for 7% of the procedures in 2007 down from 10% in 2006. The coated femur/coated tibia accounted for 6% of the knee procedures, while the unicondy-lar procedures accounted for 8% of the total number of knee procedures in 2007.
The largest percentage increase in selling price for knee im-plants was for unicondylar knees with an 8% increase between 2006 and 2007 to $4,373. Other constructs showed less of an increase: coated systems logged a 5% decrease to $6,710 per procedure, hybrid systems were $6,159 (up 2% over 2006), uncoated systems were $5,415, a 4% increase over 2006.
The vast majority of bicondylar knee replacements use patellar resurfacing—up to 94% of knee replacements in 2007.
In the ORN, unicondylar knees had both an increase in inci-dence and price between 1999 and 2007, when they increased from 2.2% of all knee procedures to 7.7% in 2007, and the average implant price increased from $1,384 in 1999 to $4,373 in 2007. A unicondylar knee now costs more than the average selling price of a bicondylar knee in 2003.
Knee replacements are most likely to use uncoated femoral and tibial components, a pattern that has not changed in the last several years. The design of the bicondylar femoral components reflect various levels of restriction on the rotation and flexion of the knee. Among the least restrictive are cruciate retaining femoral components, while successive designs—posterior sta-bilized, constrained, and hinged—provide greater stability but more limitations to the patient. A mobile bearing knee provides greater range of motion than some of these other designs. In 2007, cruciate retaining femurs increased to 46% of the femurs sold compared to 41% in 2006. The trade off was with cruciate sacrificing (posterior stabilized) femurs which declined to 41% of femurs, down from 47% in 2006.
In 2007, tibial components were skewed toward uncoated components (89%), while only 1% were all poly tibias and the remaining 10% were coated. One design issue in tibial inserts is the thickness of the tibial construct (tibial tray plus polyethylene insert): on one extreme, a thicker construct is less likely to wear to the point of breakage, on the other hand, a thicker construct will sacrifice more bone. Over the last five years, the thickness of the tibial insert has fluctuated—in 2007, 51% had a thickness of 10mm or less of polyethylene.
The average selling prices of coated knee femoral components was $2,895 in 2007, an 6% increase, while uncoated femoral components were $2,374, a 11% increase, and unicondylar femoral components, $2,155, a 6% increase over the prior year.
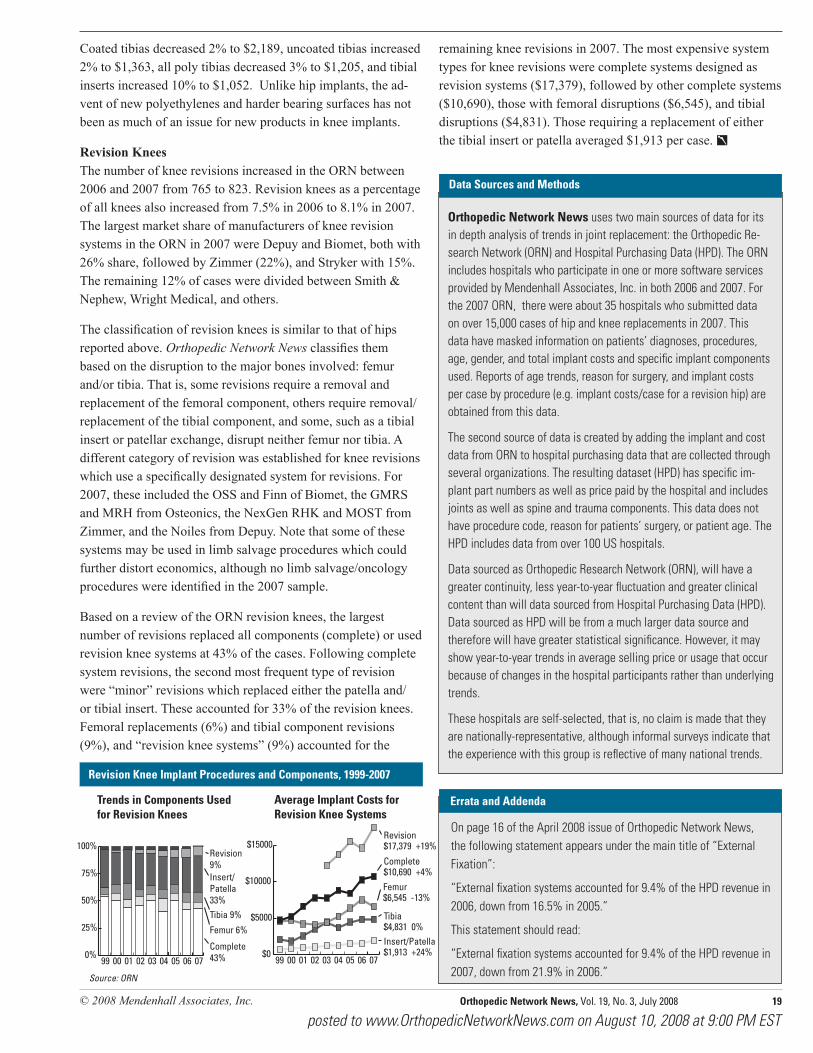
© 2008 Mendenhall Associates, Inc. Orthopedic Network News, Vol. 19, No. 3, July 2008 19
posted to www.OrthopedicNetworkNews.com on August 10, 2008 at 9:00 PM EST
$0
$5000
$10000
$15000Revision$17,379 +19%
Tibia$4,831 0%
Femur$6,545 -13%
Insert/Patella$1,913 +24%
Complete$10,690 +4%
070605040302010099
Trends in Components Used for Revision Knees
Average Implant Costs for Revision Knee Systems
0%
25%
50%
75%
100%Revision 9%Insert/Patella33%Tibia 9%
Femur 6%
Complete 43%070605040302010099
remaining knee revisions in 2007. The most expensive system types for knee revisions were complete systems designed as revision systems ($17,379), followed by other complete systems ($10,690), those with femoral disruptions ($6,545), and tibial disruptions ($4,831). Those requiring a replacement of either the tibial insert or patella averaged $1,913 per case.
Data Sources and Methods
Source: ORN
Revision Knee Implant Procedures and Components, 1999-2007
Errata and Addenda
Coated tibias decreased 2% to $2,189, uncoated tibias increased 2% to $1,363, all poly tibias decreased 3% to $1,205, and tibial inserts increased 10% to $1,052. Unlike hip implants, the ad-vent of new polyethylenes and harder bearing surfaces has not been as much of an issue for new products in knee implants.
Revision Knees The number of knee revisions increased in the ORN between 2006 and 2007 from 765 to 823. Revision knees as a percentage of all knees also increased from 7.5% in 2006 to 8.1% in 2007. The largest market share of manufacturers of knee revision systems in the ORN in 2007 were Depuy and Biomet, both with 26% share, followed by Zimmer (22%), and Stryker with 15%. The remaining 12% of cases were divided between Smith & Nephew, Wright Medical, and others.
The classification of revision knees is similar to that of hips reported above. Orthopedic Network News classifies them based on the disruption to the major bones involved: femur and/or tibia. That is, some revisions require a removal and replacement of the femoral component, others require removal/replacement of the tibial component, and some, such as a tibial insert or patellar exchange, disrupt neither femur nor tibia. A different category of revision was established for knee revisions which use a specifically designated system for revisions. For 2007, these included the OSS and Finn of Biomet, the GMRS and MRH from Osteonics, the NexGen RHK and MOST from Zimmer, and the Noiles from Depuy. Note that some of these systems may be used in limb salvage procedures which could further distort economics, although no limb salvage/oncology procedures were identified in the 2007 sample.
Based on a review of the ORN revision knees, the largest number of revisions replaced all components (complete) or used revision knee systems at 43% of the cases. Following complete system revisions, the second most frequent type of revision were “minor” revisions which replaced either the patella and/or tibial insert. These accounted for 33% of the revision knees. Femoral replacements (6%) and tibial component revisions (9%), and “revision knee systems” (9%) accounted for the
Orthopedic Network News uses two main sources of data for its in depth analysis of trends in joint replacement: the Orthopedic Re-search Network (ORN) and Hospital Purchasing Data (HPD). The ORN includes hospitals who participate in one or more software services provided by Mendenhall Associates, Inc. in both 2006 and 2007. For the 2007 ORN, there were about 35 hospitals who submitted data on over 15,000 cases of hip and knee replacements in 2007. This data have masked information on patients’ diagnoses, procedures, age, gender, and total implant costs and specific implant components used. Reports of age trends, reason for surgery, and implant costs per case by procedure (e.g. implant costs/case for a revision hip) are obtained from this data.
The second source of data is created by adding the implant and cost data from ORN to hospital purchasing data that are collected through several organizations. The resulting dataset (HPD) has specific im-plant part numbers as well as price paid by the hospital and includes joints as well as spine and trauma components. This data does not have procedure code, reason for patients’ surgery, or patient age. The HPD includes data from over 100 US hospitals.
Data sourced as Orthopedic Research Network (ORN), will have a greater continuity, less year-to-year fluctuation and greater clinical content than will data sourced from Hospital Purchasing Data (HPD). Data sourced as HPD will be from a much larger data source and therefore will have greater statistical significance. However, it may show year-to-year trends in average selling price or usage that occur because of changes in the hospital participants rather than underlying trends.
These hospitals are self-selected, that is, no claim is made that they are nationally-representative, although informal surveys indicate that the experience with this group is reflective of many national trends.
On page 16 of the April 2008 issue of Orthopedic Network News, the following statement appears under the main title of “External Fixation”:
“External fixation systems accounted for 9.4% of the HPD revenue in 2006, down from 16.5% in 2005.”
This statement should read:
“External fixation systems accounted for 9.4% of the HPD revenue in 2007, down from 21.9% in 2006.”

20 Orthopedic Network News, Vol. 19, No. 3, July 2008 © 2008 Mendenhall Associates, Inc.
posted to www.OrthopedicNetworkNews.com on August 10, 2008 at 9:00 PM EST
Future Newsletter Topics
For subscriptions, renewals, billing inquiries, or changes of address, please contact the subscription office:Orthopedic Network NewsSubscription OfficeP.O. Box 830430Birmingham, AL 35283-0430
phone fax 1-800-633-4931 205-995-1588
Editor Stan MendenhallIllustration and Graphic DesignRobin Wilt, Annie Gallup
Editorial Office Mendenhall Associates, Inc.1500 Cedar Bend DriveAnn Arbor, MI [email protected] 734 741-4710
Volume 19, Number 3July 2008
© 2008 Mendenhall Associates, Inc.All rights reserved. Printed in the U.S.A.ISSN # 1059-311XAnnual subscription: Print (1) On-line Print + on-lineHospitals $300 $275 (2) $350 (2)
Others $275 Call (3) Call (3)
(1) Hospitals receive three copies of each issue.(2) Hospitals have limited access to online databases.(3) Non-hospitals should inquire about price for ac-cess to online databases.Unauthorized duplication or reprinting is prohib-ited. Duplication inquiries may be directed to the publisher.
OrthopedicNetwork Newswww.OrthopedicNetworkNews.com
A quarterly publication and on-line information service on cost & quality issues in orthopedics
October 2008— Spinal surgery
2008 OrthOlympics
Great Wall Bird’s Nest Action Figures