Embed Size (px)
Citation preview
h t t p : // n c e s . e d . g o v / n a t i o n s r e p o r t c a r d
Measure UpAssessment news for high school teachers
Volume 16, Issue 2-12
Winter 2012
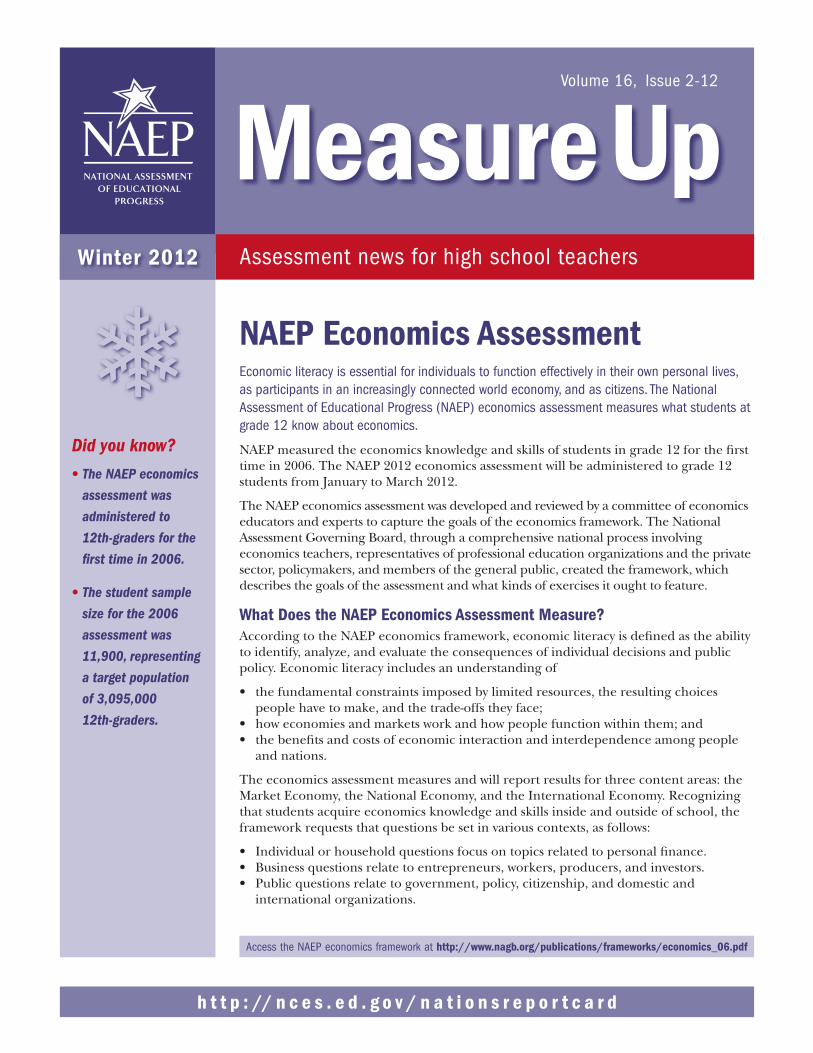
NAEP Economics AssessmentEconomic literacy is essential for individuals to function effectively in their own personal lives, as participants in an increasingly connected world economy, and as citizens. The National Assessment of Educational Progress (NAEP) economics assessment measures what students at grade 12 know about economics.
NAEP measured the economics knowledge and skills of students in grade 12 for the first time in 2006. The NAEP 2012 economics assessment will be administered to grade 12 students from January to March 2012.
The NAEP economics assessment was developed and reviewed by a committee of economics educators and experts to capture the goals of the economics framework. The National Assessment Governing Board, through a comprehensive national process involving economics teachers, representatives of professional education organizations and the private sector, policymakers, and members of the general public, created the framework, which describes the goals of the assessment and what kinds of exercises it ought to feature.
What Does the NAEP Economics Assessment Measure?According to the NAEP economics framework, economic literacy is defined as the ability to identify, analyze, and evaluate the consequences of individual decisions and public policy. Economic literacy includes an understanding of
• thefundamentalconstraintsimposedbylimitedresources,theresultingchoicespeople have to make, and the trade-offs they face;
• howeconomiesandmarketsworkandhowpeoplefunctionwithinthem;and• thebenefitsandcostsofeconomicinteractionandinterdependenceamongpeople
and nations.
The economics assessment measures and will report results for three content areas: the Market Economy, the National Economy, and the International Economy. Recognizing that students acquire economics knowledge and skills inside and outside of school, the framework requests that questions be set in various contexts, as follows:
• Individualorhouseholdquestionsfocusontopicsrelatedtopersonalfinance.• Businessquestionsrelatetoentrepreneurs,workers,producers,andinvestors.• Publicquestionsrelatetogovernment,policy,citizenship,anddomesticand
international organizations.
Did you know?
• The NAEP economics
assessment was
administered to
12th-graders for the
first time in 2006.
• The student sample
size for the 2006
assessment was
11,900, representing
a target population
of 3,095,000
12th-graders.
Access the NAEP economics framework at http://www.nagb.org/publications/frameworks/economics_06.pdf
Measure Up WINTER 2012
h t t p : // n c e s . e d . g o v / n a t i o n s r e p o r t c a r d2
NAEP 2006 Economics Achievement-Level ResultsThere are three achievement levels for each grade assessed by NAEP (4, 8, and 12): Basic, Proficient, and Advanced. The following definitions apply to all subjects and all grades assessed by NAEP:
Following are highlights from the 2006 economics assessment:• Moststudentsatgrade12haveatleastaBasic understanding of economics.• Malestudents,onaverage,outperformedfemalestudentsonthefirsteverNAEP
economics assessment.• WhiteandAsian/Pacific-Islanderstudents,onaverage,scoredhigherthanallother
racial/ethnicgroups.• Most12th-gradersreportedsomeexposuretoeconomicscontentduring
high school.
Market Economy Sample QuestionThe constructed-response question on this page measured analysis and interpretation skills for the content area Market Economy. Student responses were scored according to a 3-point scale as “Correct,” “Partially Correct,” or “Incorrect.” The sample response below is an example of a “Correct” response.
Overall, 72 percent of 12th-graders were scored as having a “Correct” response on thissamplequestion.WhenonlythestudentsattheProficient level are considered, 87 percent scored “Correct.”
Luisa has decided to give up her full-time job to go back to school. Identify one potential economic risk and one potential economic benefit that Luisa might have considered in making her decision.
A risk would be that Luisa will not get her yearly income making it hard to pay
bills, feed herself, or drive. An economic benefit would be that with furthering
her education, she may be promoted in position with the company she goes to
work for, or find a new job that allows her to increase her salary.
Achievement Level Achievement-Level Policy Definitions
Basic Partial mastery of prerequisite knowledge and skills that are fundamental for proficient work at each grade.
Proficient Solid academic performance for each grade assessed. Students reaching this level have demonstrated competency over challenging subject matter, including subject-matter knowledge, application of such knowledge to real-world situations, and analytical skills appropriate to the subject matter.
Advanced Superior performance.
h t t p : // n c e s . e d . g o v / n a t i o n s r e p o r t c a r d 3
Measure Up WINTER 2012
Students were sampled to participate in the assessment regardless of whether or not they had taken an economics course.
International Economy Sample QuestionThe following multiple-choice question from the grade 12 economics assessment measured student knowledge of the content area International Economy.
Overall, 61 percent of 12th-graders were scored as having a “Correct” response onthissamplequestion.WhenonlythestudentsattheProficient level are considered, 76 percent answered correctly.
A
B
C
D
Because Country A has no domestic sources of wood, it imports all its wood from wood-producing countries. If the price of wood in wood-producing countries rises substantially, which of the following is most likely to occur?
Country A will import more wood to meet rising demand.
Country A will impose a tariff on wood imports.
Housing prices in Country A will increase as wood imports become more expensive.
Profits in other wood-producing countries will increase because of exports to Country A.
National Economy Sample QuestionThe multiple-choice question below from the grade 12 economics assessment measured student knowledge of the content area National Economy.
Overall, 36 percent of 12th-graders were scored as having a “Correct” response on this samplequestion.WhenonlythestudentsattheProficient level are considered, 48 percent answered correctly.
A
B
C
D
In the United States, which of the following forms of taxation currently represents the largest source of tax revenue for the federal government?
Property tax
Sales tax
Corporate income tax
Personal income tax
More information is available in The Nation’s Report Card: Economics 2006 at http://nces.ed.gov/nationsreportcard/pdf/main2006/2007475.pdf.
Measure Up WINTER 2012
h t t p : // n c e s . e d . g o v / n a t i o n s r e p o r t c a r d4
What Is The Nation’s Report Card?The Nation’s Report Card informs the public about the academic achievement of elementary and secondary students in the United States. Report cards communicate the findings of the National Assessment of Educational Progress (NAEP), a continuing and nationally representative measure of achievement in various subjects over time.
Since 1969, NAEP assessments have been conducted periodically in reading, mathematics, science, writing, U.S. history, civics, geography, and other subjects. By collecting and reporting information on student performance at the national, state, and local levels, NAEP is an integral part of our nation’s evaluation of the condition and progress of education. Only information related to academic achievement and relevant variables is collected. The privacy of individual students and their families is protected, and the identities of participating schools are not released.
If you want to… Visit…Learn more about NAEP results The Nation’s Report Card at
http://nationsreportcard.gov
Learn about the NAEP long-term trend assessment The Nation’s Report Card at http://nationsreportcard.gov/ltt_2008/ltt0016.asp
View NAEP data for a particular state or contact your NAEP State Coordinator
The National Center for Education Statistics at http://nces.ed.gov/nationsreportcard/states
Access specific results for a grade level, subject, jurisdiction, and/or demographic groups
The NAEP Data Explorer at http://nces.ed.gov/nationsreportcard/naepdata
Find information regarding the types of questions used on NAEP assessments or view subject-specific questions
The NAEP Questions Tool at http://nces.ed.gov/nationsreportcard/itmrlsx
Download a Sample Questions booklet that contains sample test questions for the upcoming and previous assessments
The National Center for Education Statistics at http://nces.ed.gov/nationsreportcard/about/booklets.asp
Learn more about NAEP frameworks and how policy is drafted for each NAEP assessment
The National Center for Education Statistics at http://nces.ed.gov/nationsreportcard/frameworks.asp
Offer a comment or suggestion on NAEP The National Center for Education Statistics mailbox at http://nces.ed.gov/nationsreportcard/contactus.asp
3388
7.10
11.8
5405
4030
1 This publication was prepared for the National Assessment of EducationalProgressbyWestatunder contract (ED-07-CO-0083) to the National Center for Education Statistics, U.S. Depart ment of Education.