Embed Size (px)
DESCRIPTION
The International Food and Agribusiness Management Review is the Official Journal of the International Food and Agribusiness
Citation preview

International Food and Agribusiness Management Review
Official Journal of the International Food and Agribusiness Management Association
Volume 15: Issue 42012

© 2012 International Food and Agribusiness Management Association (IFAMA). All rights reserved.
International Food and Agribusiness Management Review
Supporters and Partners
FOOD AND AGRIBUSINESS MANAGEMENT
The IFAMR Open Access Project is supported in part through contributions from these institutions. Scholars,
practitioners, students, and policymakers may now read and download the most current and archival content from
the IFAMR website. The Board of Directors of the International Food and Agribusiness Management Association
feel that open and immediate access to IFAMR’s articles and case studies will dramatically elevate the quality of
scientific inquiry and instruction around the world in the field of agribusiness. If you would like to support this
effort please contact: Kathryn White, Email: [email protected].

International Food and Agribusiness Management Review
Editorial StaffExecutive Editor
Peter GoldsmithUniversity of Illinois, USA
Regional Managing EditorsAsia, Australia, and New Zealand
Murray McGregor, Curtin University of Technology, Australia Nicola M. Shadbolt, Massey University, New Zealand
EuropeJacques Trienekens, Wageningen University, The Netherlands
Vera Bitsch, Technical University of Munich, Germany Alessio Cavicchi, University of Macerata, Italy
North AmericaCorinne Alexander, Purdue University, USA.
Vincent R. Amanor-Boadu, Kansas State University, USAMark Hansen, Brigham Young University, USADavid Van Fleet, Arizona State University, USA
Ram Acharya, New Mexico State University, USADavid Sparling, The University of Western Ontario, Canada
South AmericaJoao Martines-Filho, Universidade de São Paulo, Brazil
Filippo Arfini, Universita’ di Parma, ItalyAjuruchukwu Obi, University of Fort Hare, South AfricaStefano Boccaletti, Universita’ Cattolica, ItalyMichael Boehlje, Purdue University, USAFabio Chaddad, University of Missouri, USADennis Conley, University of Nebraska - Lincoln, USAFrancis Declerck, ESSEC Business School, FranceHamish Gow, Massey University, New ZealandDavid Hughes, Imperial College - London, United KingdomJukka Kola, University of Helsinki, Finland
Jay Lillywhite, New Mexico State University, USAWoody Maijers, INHOLLAND University, The NetherlandsMarcos Fava Neves, FEA / USP / PENSA, BrazilOnno Omta, Wageningen University, The NetherlandsHernán Palau, Buenos Aires University, ArgentinaChristopher Peterson, Michigan State University, USAThomas Reardon, Michigan State University, USAMary Shelman, Harvard Business School, USAJohan van Rooyen, University of Stellenbosch, South Africa
The IFAMR (ISSN #: 1559-2448) is published quarterly and is available at http://www.ifama.orgFor copyright and publishing information, please contact: Kathryn White, Administrative Editor
IFAMA Business Office • P.O. Box 14145 • College Station, TX 77841-4145, USATel: 1-979-845-2118 • Fax: 1-979-862-1487 • E-mail: [email protected] • Web: http://www.ifama.org

© 2012 International Food and Agribusiness Management Association (IFAMA). All rights reserved.

2012 International Food and Agribusiness Management Association (IFAMA). All rights reserved. iii
International Food and Agribusiness Management Review
Volume 15, Issue 4, 2012
Table of Contents
RESEARCH
1. Food Store Density, Nutrition Education, Eating Habits and Obesity Alessandro Bonanno and Stephan J. Goetz....................................................................................
p. 1
2. Sustained Competitive Advantage in Agribusiness: Applying the Resource-
Based Theory to Human Resources Amin W.Mugera.....................................................
p. 27
3. Competitiveness, Efficiency and Environmental Impact of Protected Agriculture
in Zacatecas, Mexico Luz E. Padilla Bernal, Alfredo Lara-Herrera, Elivier Reyes-Rivas,
and Oscar Perez-Veyna...............................................................................................................
p. 49
4. The Relationship Between Information Exchange Benefits and Performance:
The Mediating Effect of Supply Chain Compliance in the Chinese Poultry Chain Guangqian Peng, Jacques H. Trienekens, S.W.F. (Onno) Omta, & Wensheng Wang................
p. 65
5. Segmenting Consumers to Inform Agrifood Value Chain Development in Nepal Rajendra Prasad Adhikari, Ray Collins & Ximing Sun...............................................................
p. 93
6. Are Organic Growers Satisfied with the Certification System? A Causal Analysis
of Farmers’ Perceptions in Chile Carlos Padilla Bravo, Achim Spiller, and
Pablo Villalobos..........................................................................................................................
p.115
7. Analyzing Consumers’ Preferences for Apple Attributes in Tirana, Albania Engjell Skreli and Drini Imami....................................................................................................
p.137
CASE STUDY
8. Driving a Fishery along the Bumpy Ride of Today’s Globalization: The Case of
the Australian Southern Rock Lobster Association Domenico Dentoni, Jianyong Lu, Francis English, Rebecca McBride.......................................
p.157
INDUSTRY SPEAKS
9. Towards a Branded Food Economy in China Damien McLoughlin, Steve Bourne,
Mary Shelman, Frank Bradley and Aidan Connolly...................................................................
p.177
10. The Agenda of Sustainable Development Gustavo Grobocopatel .................................... p. 185
11. Mapping and Quantification of the Cotton Chain in Brazil Marcos FavaNeves,
Mairun Junqueira Alves Pinto, José Carlos de Lima Júnior......................................................
p. 189

International Food and Agribusiness Management Review / Volume 15, Issue 4, 2012
2012 International Food and Agribusiness Management Association (IFAMA). All rights reserved. iv

© 2012 International Food and Agribusiness Management Association (IFAMA). All rights reserved. v
International Food and Agribusiness Management Review
Volume 15, Issue 4, 2012
EDITOR’S NOTE
Dear Readers,
As the leading international journal in agribusiness, this issue features articles representing five
continents including seven research manuscripts and a great teaching case study from Australia.
We have three wonderful industry commentaries from McLaughlin et al. and Alltech (Ireland),
Gustavo Grobocopatel of Los Grobo (Argentina), and Marcos Fava Neves from Markestat
(Brazil). Let me first draw attention to the Alltech commentary. The authors let us peer into the
thinking of a remarkable group called The Alltech Presidents Club, who recently met in
Shanghai for an open exchange and debate on leadership issues. The commentary reflects the
group’s thinking about the development of the Chinese branded food market.
In the second Industry Commentary, Gustavo Grobocopatel tackles the sustainability issue from
an interesting perspective. His thoughts provide a nice introduction to the IFAMR’s next special
issue, due out December 2012, focused on “Managing Wicked Problems in Agribusiness: The
Role of Multi-Stakeholder Engagement in Value Creation.” These are managerial challenges
that have to be addressed, and occupy large amounts of time and resources, but are not
necessarily solvable. How firms comply with stakeholder expectations about sustainability,
animal welfare, transgenic organisms, greenhouse gas emissions, and land use are examples of
wicked problems facing the modern agribusiness manager. Be on the lookout for the “Managing
Wicked Problems in Agribusiness,” edited by Domenico Dentoni, Brent Ross, and Otto Hospes.
Happy reading.
Peter Goldsmith, Executive Editor, IFAMR

International Food and Agribusiness Management Review / Volume 15, Issue 4, 2012
2012 International Food and Agribusiness Management Association (IFAMA). All rights reserved. vi

2012 International Food and Agribusiness Management Association (IFAMA). All rights reserved
1
International Food and Agribusiness Management Review
Volume 15, Issue 4, 2012
Food Store Density, Nutrition Education, Eating Habits and Obesity
Alessandro Bonannoa and Stephan J. Goetz
b
aAssistant Professor of Agricultural Economics, Department of Agricultural Economics, Sociology and Education,
The Pennsylvania State University, 207-D Armsby Building, University Park, Pennsylvania, 16802, USA
bDirector, The Northeast Regional Center for Rural Development, Professor of Agricultural and Regional
Economics, The Pennsylvania State University, 207-C Armsby Building, University Park, Pennsylvania, 16802 USA
Abstract
Food retailers and restaurants are under scrutiny for their alleged effects on diets and obesity,
although no clear evidence of a causal relationship exists. Furthermore, because no prior study
controls for nutrition education and the dynamic nature of the underlying phenomena, existing
estimates quantifying these relationships could be biased. Using state-level data for the
continental U.S. we evaluate how the density of different food stores and per-capita expenditures
on SNAP (nutrition) Education impact eating habits and (indirectly) adult obesity, controlling for
endogeneity of store locations and con-sumption dynamics. Our results caution against using
large-scale policies regulating the food environment and highlight the need to control for
nutrition education and process dynamics to obtain unbiased estimates. Implications for the
agribusiness sector are discussed.
Keywords: food store density, fruits and vegetables consumption, adult obesity, nutrition
education, endogeneity bias, omitted variables bias
Corresponding author: Tel: +1.814.863.8633
Email: [email protected]
+The IFAMR is a non-profit publication. The additional support provided from this issue advertiser, Novus
International helps us remain open access and dedicated to serving management, scholars, and policy makers
worldwide.

Bonanno and Goetz / International Food and Agribusiness Management Review / Volume 15, Issue 4, 2012
2012 International Food and Agribusiness Management Association (IFAMA). All rights reserved.
2
Introduction, Background, and Objectives
In 2007-2008, one third of the U.S. adult population was classified as obese (Flegal et al. 2010).1
Obesity results from consuming excess calories relative to need,2 and rising obesity rates are
associated with reduced physical labor due to technological change; increased agricultural
productivity and food availability; and lower food prices (Philipson and Posner 1999;
Lakdawalla and Philipson 2002). Technological progress in food processing has also reduced
assembly/preparation time for meals and increased the availability of calorie-dense foods (Cutler,
Glaeser, and Shapiro 2003). As a result of these trends, the agribusiness sector as a whole is
under scrutiny as it may be contributing to the worsening of consumer diets and the obesity
epidemic. Given the large scale of this problem, public policy makers are seeking to mitigate its
dimension (Kuchler, Tegene, and Harris 2005). The policy debate assessing what tools may be
most effective to curtail the “obesity epidemic” has considered, inter alia, taxing high-calorie
carbonated soft drinks (Todd and Zhen 2010), nutrition labeling (Arsenault 2010) and
regulating food access–i.e., the types of food outlets to which consumers are exposed.3
As higher consumption of particular food categories (such as fruit, as in Lin and Morrison, 2002)
is associated with lower body weight, the effect of food outlets on obesity is likely to be indirect,
through diets: for example, if certain kinds of food outlets facilitate the consumption of fruits and
vegetables, they may mitigate the growing obesity phenomenon. To date, however, research
findings in this area are mixed. Rose and Richards (2004) found ease of supermarket access to
be associated with increased daily consumption of fruits and vegetables among low-income
individuals (SNAP recipients), while Cummins et al. (2005) found no significant changes associ-
ated with the entry of a large-scale food retailer. Some studies have looked at the direct impact
of food outlets on obesity rates or related consequences. Morland, Diez Roux, and Wing (2006)
consider different outlets simultaneously, finding a negative relationship between the presence of
supermarkets, overweight and obesity, and the opposite for grocery and convenience stores.
Chen, Florax, and Snyder (2009), using geo-referenced micro data from the Indianapolis urban
area, found a negative relationship between the density of grocery stores and Body Mass Index
(BMI). Courtemanche and Carden (2011) found that the opening of one Wal-Mart Supercenter
(henceforth WMSC) per 100,000 residents leads to a 0.24 point increase in BMI and an increase
of 2.3% in the likelihood of being obese. This suggests that the real income-increasing effect of
lower prices may not translate into consumption of healthier foods.
Researchers have also examined the role of restaurants on diets, as meals consumed in these
establishments are usually less healthy than homemade meals (Lin and Frazão 1997; Chou,
Grossman, and Saffer 2004). In particular, fast food restaurants are associated with higher
consumption of fat, sodium and soft drinks (Bowman and Vinyard 2004) and lower
consumption of fruits and vegetables (Powell et al. 2007). Also, using different databases and
1 The BMI or Body Mass Index is the ratio of an individual’s weight in Kilograms and height squared, in meters. The U.S.
Center of Disease Control and Prevention (CDC) classifies the BMI of adults as: Underweight <18.5; Normal weight 18.5-
24.9; Overweight: 25–29.9; Obese: >30. In 2007-08, 33.8% of adults were obese. 2 For a discussion of the dynamics between energy stored, appetite, metabolism and the factors impacting these
relationships, see Egger and Swinburn (1997). 3 See White (2007) for a detailed review of the literature on food access and obesity.

Bonanno and Goetz / International Food and Agribusiness Management Review / Volume 15, Issue 4, 2012
2012 International Food and Agribusiness Management Association (IFAMA). All rights reserved.
3
empirical approaches, previous studies have established positive relationships between restaurant
density and adult BMI (Chou, Grossman, and Saffer 2004; Chen, Florax, and Snyder 2009) or
obesity among children (Currie et al. 2009). In response, policymakers have proposed zoning
laws in urban areas to limit fast-food access (the CDC has a “Zoning to encourage healthy
eating” program), mandatory caloric labels on restaurant menus and other strategies, all with
limited effectiveness.4
Given the strong advocacy in the public media (see the examples reported in Collins and Baker,
2009) for regulating food outlet locations (in particular fast food restaurants) one would expect
the existing empirical evidence to show a clear causal relationship between food store location,
diets and obesity, and to account for sources of potential bias in the estimated impacts. However,
several important aspects have been disregarded in prior research.
In the first place, most prior studies (Courtemanche and Carden 2011), being one of the
exceptions, have largely disregarded issues of causality, failing to account for confounding
factors (e.g., endogeneity of store location) which could bias the estimated effect of particular
food outlets on diets (fruits and vegetables consumption) and/or obesity rates/BMI. Such a bias
could be particularly marked in the case of fast-food restaurants, as they may locate in
neighborhoods where consumers are more likely to engage in unhealthy food choices and eating
behaviors.5 The existing evidence of causal effects from micro-level studies is mixed. Using
number of highway exits at the county level as instruments for fast-food restaurant density, Dunn
(2008) found that a 10% increase in fast-food restaurants increases BMI by 0.33 points. Using
interstate highways in rural areas as instruments for restaurant density, Anderson and Matsa
(2011) found no causal link between food consumption at fast-food and full service restaurants
and obesity, indicating that consumers who eat more often at restaurants may offset calories by
eating less on other occasions. Similar mixed findings emerge at the aggregate level: although a
positive correlation exists between the presence of fast food restaurants and adult obesity at the
state-level (Maddock 2004), serious doubt has been cast on whether the relationship is causal
(Collins and Baker 2009).
Second, consumers’ nutrition knowledge can influence the relationship between food stores and
eating habits or obesity. Evidence exists that nutrition education results in higher intakes of fruit
and vegetables (see, e.g., the results of nutrition interventions among older adults reported by
Sahyoun, Pratt, and Anderson 2004) and that nutrition knowledge spills over across family
members (in particular from mothers to preschool children, as shown by Variyam et al. 1999).
Effective nutrition education could discourage consumers from patronizing fast food restaurants
or increase patronage of fruit and vegetables stores as they seek healthier food products. The
effect of nutrition education on the dietary choices of consumers patronizing larger stores is less
clear; as these types of outlets offer access to a multitude of food items, some consumers may
4 In New York City, for example, Elbel et al. (2009) found that labels increase awareness of calories but do not alter food
choices. 5 Areas with less-privileged individuals are characterized by limited access to “high quality” food stores (see for example
Moore and Diez Roux, 2006; Powell et al. 2007), leading to poorer diets and higher obesity. Fast food outlets may locate
disproportionately in low-income areas; to the extent that such areas contain more obese individuals, higher obesity rates
may be a cause of fast food stores locating in a community, rather than a consequence.

Bonanno and Goetz / International Food and Agribusiness Management Review / Volume 15, Issue 4, 2012
2012 International Food and Agribusiness Management Association (IFAMA). All rights reserved.
4
still adopt unhealthy diets even in the presence of higher nutrition education expenditures, as
they will be exposed to both healthy and unhealthy choices in the same store. Nonetheless,
failure to control for the effect of nutrition knowledge or education on eating habits or obesity
may result in omitted variables bias.
Finding variables that capture nutrition education is a challenge, as objective measures are
needed in place of self-rated health knowledge measures which may be a weak determinant of
consumption of fruits and vegetables (see for example Schroeter, House, and Lorence, 2009).
Alternatively, one would need to capture a series of repeated controlled experiments or a
large-scale nutrition education campaign. The USDA’s Supplemental Nutritional Assistance
Program-Nutrition Education (SNAP-Ed) is an example of the latter.6 SNAP-Ed seeks to im-
prove diets of low-income individuals, it is implemented to varying degrees across states,7 and it
has grown from $6.61 mn in FY 1992 to over $380 mn in FY 2010, providing variation in the
implementation across time and space. At least one study (McGeary 2009) finds that increased
federal SNAP-Ed outlays may help to mitigate adult obesity.
Last, as most studies linking food stores’ presence, eating habits and obesity use cross sectional
data, they cannot account for the dynamic aspects of the process generating eating habits and
obesity. On average, consumers tend to prefer those foods they consume habitually (Mela 1999).
This indicates that there is some persistence in eating habits over time, and that greater
availability of certain foods may lead consumers to associate them with “the norm.” Also, as
energy-dense foods on average tend to be liked more than others (with taste rating higher than
health and variety), habits involving the repeated consumption of these products are more likely
to develop (Drewnowski and Specter 2004). Furthermore, as obesity can be an outcome of
sustained energy imbalance over time (Egger and Swinburn 1997), current obesity levels are a
function of present and past eating (and other) habits, as well as other features such as
consumers’ socio-demographic profiles and the food available to them. In sum, failure to
account for the dynamic aspects of these relationships may result in model misspecifications and
therefore in biased estimates.
The objective of this paper is to assess the existence of the biases discussed above and, more
specifically, to: 1) analyze whether an aggregate, causal effect of the density of different food
outlets on eating habits exists; 2) assess the indirect aggregate effect of food outlets on BMI via
their impact on eating habits and; 3) determine whether investing in nutrition education could
6 The Expanded Food and Nutrition Education Program (EFNEP) by the National Institute of Food and Agriculture is an-
other example of federally funded program aimed at improving diets and nutrition education levels of limited-resource
individuals. EFNEP activities target adults or youth audiences and aim to inform and train the recipients in different as-
pects of nutrition, diets, food preparation, food sourcing and health; program participants are selected through referral pro-
grams using several channels including SNAP and WIC offices, churches, local business, etc. Program delivery uses peer
educators and volunteers trained by county extension professional and a variety of delivery methods. Given the heteroge-
neity of implementation we opted for not using it as proxy for nutrition education. 7 The SNAP-Ed program is an optional program of nutrition education that State Agencies can deliver to SNAP recipients
as part of their program operations. State agencies submit an annual SNAP-Ed plan to the Food and Nutrition System of
the USDA (some States have multiyear plans), highlighting the budget and the proposed activities for the following year.
Federal funds cover 50% of the program costs. The goal of SNAP-Ed is to increase the consumption of fruits and
vegetables, whole grains, and fat-free or low-fat milk products, physical activity and to maintain a balanced caloric intake
(USDA 2010).

Bonanno and Goetz / International Food and Agribusiness Management Review / Volume 15, Issue 4, 2012
2012 International Food and Agribusiness Management Association (IFAMA). All rights reserved.
5
substitute for regulation of food outlet locations in improving eating habits and obesity rates. We
use state-level data for the Contiguous U.S. on the percent of adults eating at least five servings
of fruit and vegetables daily as a proxy (albeit incomplete)8 for eating habits, and the share of
adult population with BMI of 30 or above, as a measure of obesity rates. Food outlet density is
measured as per-capita grocery stores, fruit and vegetable stores, full and limited-service
restaurants, and WMSCs. Our proxy for public expenditure on nutrition education programs are
the inflation-adjusted per-capita SNAP-Ed expenditures.9 We use supply-side drivers of store
locations as instrumental variables and to account for possible endogenity of food store density.
Also, to further reduce bias in the estimates, we account for the dynamic nature of the process
generating eating habits and obesity.
Understanding the role of the food environment vs. nutrition education in expanding the share of
adult population engaging in healthy eating habits has clear policy implications and is relevant
for the agribusiness sector as a whole. Food retailers and food service companies, as well as
many food manufacturers, are under scrutiny for their potential roles in shaping diets and in con-
tributing to the obesity epidemic. This study seeks to provide additional evidence on whether
policies aimed at regulating the food environment (i.e., the location of food retailers and restau-
rants) are likely to achieve the intended goals. Furthermore, analyzing the effect of nutrition
education on fruit and vegetables consumption, vis-à-vis that of food outlets, could prove useful
to agribusiness firms (especially food retailers) by allowing them to propose alternative “policy
recipes” to direct regulation counteracting the obesity epidemic. Last, the quantification of the
impact of nutrition education expenditure on the share of adults eating fruits and vegetables five
or more times per day could prove useful to fruit and vegetables producers and processors as it
may illustrate whether nutrition education can be used to expand their consumer base.
Empirical Methods
The Model
We posit a linear relationship between consumption of fruits and vegetables, food access (i.e.,
food store density), and other exogenous control variables. Let FV5it be the share of the adult
population consuming fruit and vegetables at least five times a day in state i at time t (our proxy
for healthy eating), NEdit is a proxy measure of the average exposure to nutrition education of
individuals in state i at time t, and jitFA a proxy for the average consumer’s access to the j-th type
of food outlet in state i at time t. We consider:
8 Fruit and vegetables consumption is, at best, an incomplete proxy for the adoption of healthy diets, as it does not take
into account the consumption of other food groups (consumers who consume more servings of fruits and
vegetables may also consume more “unhealthy” foods containing, for example, high values of sodium and fat).
Furthermore, the concept of a “healthy” diet can differ among different subgroups of the population. Readers should keep
in mind these caveats, which also hold for the interpretation of the results. 9 All monetary variables are measured in real terms.

Bonanno and Goetz / International Food and Agribusiness Management Review / Volume 15, Issue 4, 2012
2012 International Food and Agribusiness Management Association (IFAMA). All rights reserved.
6
(1)
05it NEd it FAj jit OHh hit
j h
SDk kit Enm mit Rl li Tt t FVit
k m l t
FV NEd FA OH
SD En REG T
where OH are variables capturing other habits and behaviors, SD are socio-demographic
characteristics capturing heterogeneity in consumers’ tastes, En are variables capturing
environmental characteristics impacting eating habits, REG are regional fixed-effects capturing
the heterogeneity of diets across areas, and T are year indicators controlling for changes in diets
over time; the s are parameters to be estimated, and εFVit is an idiosyncratic error term.
Equation (1) ignores the dynamic aspects of the process generating eating habits, discussed
above. Maintaining the assumptions of linearity, by virtue of the mechanics of the geometric
distributed lag model10
we can rewrite equation (1) to include the effect of lagged eating habits
(FV5it-1) as:
(2)
0 5 1 15 5it FV t it NEd it FAj jit
j
OHh hit SDk kit Rl li Tt t Enm mit FVit
h k l t m
FV FV NEd FA
OH SD REG T En
so that one can calculate both short-sun and long-run effects of explanatory variables on FV5it.
Consider a variable Zj; while its short-run impact on FV5it is 5
SR
itZ
j
FV
Z
, following the logic
of the geometric distributed lag models (Greene, 2003), the long-run parameters (and implicitly
the long-run marginal effects) of Zj on FV5it-1 can be measured as 5 1
5
1
LR
it Z
j FV t
FV
Z
. It
should be noted that the long-run marginal effects refer to an indefinite future period in which
the market reaches long-run equilibrium.
Let ObIit represent the incidence of adult obesity in area i at time t and the relationship between
obesity rates and its determinants be:
(3) 0 5 5 Ob Ob
it FV it OHh hit SDk kit Rl li Tt t ObIit
h k l t
ObI FV OH SD REG T
where the groups of explanatory variables are described above, the s are parameters to be esti-
mated, and εObIit is an idiosyncratic error term. Equation (3) states that obesity is a function of
eating and other habits controlling also for socio-demographic characteristics: the subscript Ob
indicates that the subsets of OH and SD entering the obesity equation are specific for that equa-
tion.
10
See the Appendix for a brief illustration of this model. The interested reader will find a more detailed discussion of ge-
ometric lag models and other distributed lag models in Greene (2003).

Bonanno and Goetz / International Food and Agribusiness Management Review / Volume 15, Issue 4, 2012
2012 International Food and Agribusiness Management Association (IFAMA). All rights reserved.
7
One can combine the estimated coefficients of equations (1) and (3) to obtain the indirect mar-
ginal effects of food access and nutrition education on adult obesity incidence as:
5
5
5
it it itFV NEd
it it it
ObI ObI FV
NEd FV NEd
and
5
5
5
it it itFV FAj
jit it jit
ObI ObI FV
FA FV FA
,
respectively. The intuition behind these measures is the following: given the assumptions of our
model, a marginal change in nutrition education (access to outlet-type j) will lead to a marginal
change in the incidence of adults consuming fruits and vegetables equal to NEd (FAj ); since a
marginal change in FV5it leads to a change in the incidence of adult obesity, a marginal change
in NEdit (FAjit) will have an indirect impact on adult obesity equal to 5FV NEd (5FV FAj ).
Similarly, the marginal effects on ObI of those variables impacting both the incidences of adult
obesity and adults consuming fruit and vegetables at least five times a day, are illustrated below.
Using a socio-demographic variable common to both equations (such as income and education,
represented below as SDk) one has:
5
5
5
5it
it it it itSDk FV SDk
kit kit it kitFV
ObI ObI ObI FV
SD SD FV SD
.
where the first term in the mid-portion of the equation represents the direct effect of SDk on adult
obesity incidence, while the second captures the indirect effect through FV5, similar to the
indirect effects of nutrition education and food access illustrated above. That is, these marginal
effects will account for the fact that other habits (OH) and socio-demographic (SD) factors
impact both eating habits and body weight.
Again, using the assumptions of the geometric distributed lag model and maintaining a linear
functional form, an alternative specification of equation (3) that includes the effect of previous
obesity values (ObIit-1) on current values is:
(4)
0 1 1 5 5it Ob it FV it
OHh hit SDk kit Rl li Tt t ObIit
h k l t
ObI ObI FV
OH SD REG T
where ObIit-1represents the one-period lagged value of adult obesity in area i. Following the same
logic discussed above for the other marginal effects and the calculation of long-run parameters,
using the estimated coefficients of equations (2) and (4), the long-run marginal effects of the
variation in food access, nutrition education and demographics on adult obesity rates are:
5 5
1 5 1 1 5 1
; ;1 1 1 1
LR LR
FAjit FV it FV NEd
jit Ob FV t it Ob FV t
ObI ObI
FA NEd
5
1 1 5 11 1 1
LR
it SDk FV SDk
kit Ob Ob FV t
ObI
SD
.

Bonanno and Goetz / International Food and Agribusiness Management Review / Volume 15, Issue 4, 2012
2012 International Food and Agribusiness Management Association (IFAMA). All rights reserved.
8
Data and Variables Description
The main data used are state-level aggregates from the “Prevalence and Trends Data” from the
Centers for Disease Control and Prevention’s (CDC) Behavioral Risk Factor Surveillance
System (BRFSS) survey,11
available from the CDC website. “Adult obesity” is the state-level
percent of adult population whose BMI is 30 and above, while the percent of “Adults who have
consumed fruits and vegetables five or more times per day” (FV5 hereafter) is used as a proxy
for healthy eating habits. The first variable is obtained from the “Weight Classification by Body
Mass Index (BMI)” series, which presents the state-level share of adult population that is neither
overweight nor obese (BMI ≤ 24.9), Overweight (25.0 ≤ BMI < 29.9) and Obese (BMI ≥ 30.0).
The state-level aggregates are obtained based on individuals’ BMIs calculated from self-reported
values of height and weight (BMI>100 are discarded). Similarly FV5 is obtained via state
averages of the number of survey respondents who were found to consume more than five
servings of fruits and vegetables daily, with values imputed from individuals’ answers to a series
of six questions regarding frequency of consumption of fruit and vegetables.12
As noted, food store density is measured as the number of food store establishments divided by
population. Food store establishment data are from the County Business Pattern, U.S. Bureau of
Labor Statistics (BLS). The industries included are: NAICS 4451: Grocery Stores, NAICS
44523: Fruit and Vegetables Stores;13
NAICS 7222: Limited Service Restaurants (proxy for fast-
food) and NAICS 722: Food Services and Drinking Places. The difference between NAICS 722
and NAICS 7222 establishments represents full-service restaurants. State-level numbers of
WMSCs are from the company’s annual shareholder reports. State-level population is from the
Population Estimates Program (PEP).
Nutrition education is measured as real state-level per capita annual federal outlays on SNAP-
Nutrition Education program (SNAP-Ed). State-level federal outlays, in current dollars were
obtained from public use data from the Food and Nutrition Service of the United States
Department of Agriculture (FNS – USDA).14
These amounts represent 50% of the expenditure
in programs of nutrition education proposed by State Agencies in each state, i.e., the amount that
is federally funded and excluding the expenditure of each state. To account for inflation and
evaluate real expenditure, we divided the outlays by general Consumer Price Index (CPI) from
11
The BRFSS is an on-going telephone health survey system tracking health conditions and risk behaviors among the U.S.
population and collects data on 1) individuals’ habits, such as smoking, physical activity, alcohol consumption; 2) health
status and health prevention measures, e.g., whether the respondents had high blood pressure, high cholesterol levels,
access to healthcare, etc., and 3) respondents’ socio-demographic characteristics such a children in the household, age and
gender. All of these characteristics are self-reported. 12
Consumption of fruits and vegetables is recorded separately in the BRFSS through six questions, two on the frequency
(daily, weekly, monthly or annually) of consumption of fruits (fruit juices and fruit, excluding juices, respectively) and
four on the consumption of vegetables (green salad, potatoes - excluding chips and fries, carrots, and servings of other
vegetables). The reported values are converted into daily servings consumed by each group, and then used to create sum-
mary indexes of fruits and vegetables consumed per day and an indicator variable capturing whether an individual con-
sumed five or more servings of fruits and vegetables per day. 13
According to the official Census Definition (http://www.census.gov/eos/www/naics/) . The establishments included in
this industry are specialty food stores primarily engaged in retailing fresh fruits and vegetables, excluding roadside stands
and electronic, direct or mail sales. Farmers markets are not included in this classification. 14
We thank Alice Lockett, at the FNS-USDA for providing data on State-level Federal Outlays for the SNAP-Ed program.
Bonanno and Goetz / International Food and Agribusiness Management Review / Volume 15, Issue 4, 2012
2012 International Food and Agribusiness Management Association (IFAMA). All rights reserved.
9
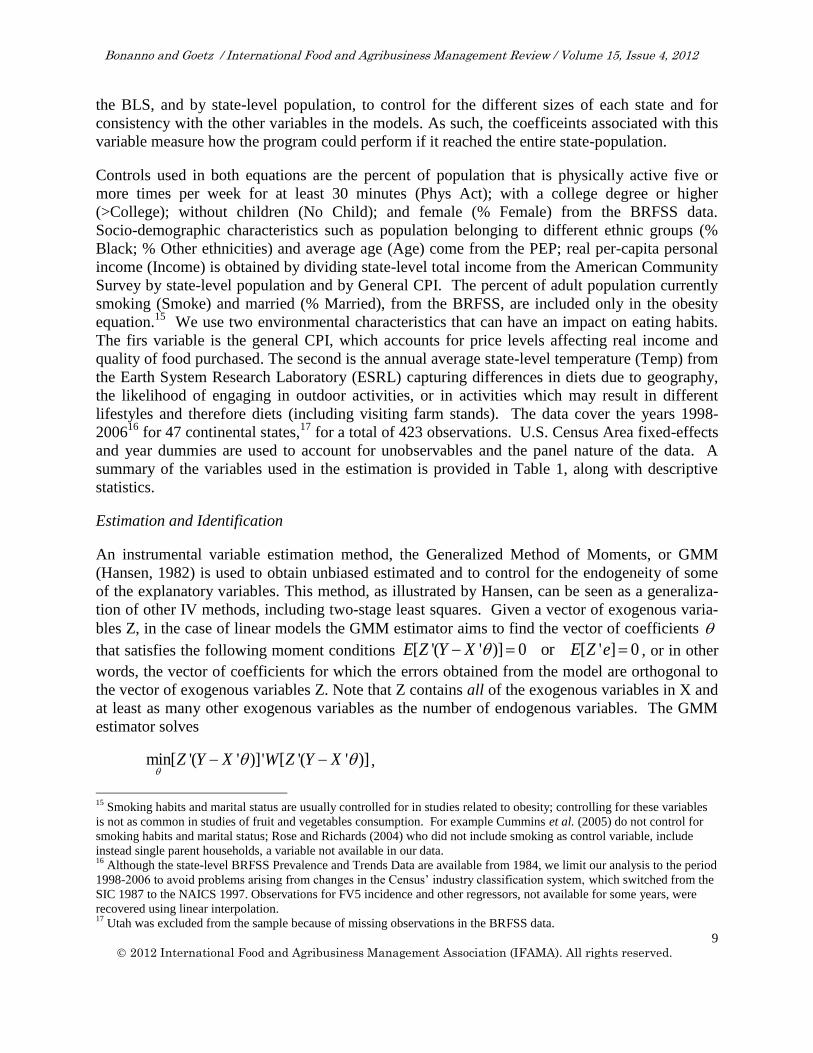
the BLS, and by state-level population, to control for the different sizes of each state and for
consistency with the other variables in the models. As such, the coefficeints associated with this
variable measure how the program could perform if it reached the entire state-population.
Controls used in both equations are the percent of population that is physically active five or
more times per week for at least 30 minutes (Phys Act); with a college degree or higher
(>College); without children (No Child); and female (% Female) from the BRFSS data.
Socio-demographic characteristics such as population belonging to different ethnic groups (%
Black; % Other ethnicities) and average age (Age) come from the PEP; real per-capita personal
income (Income) is obtained by dividing state-level total income from the American Community
Survey by state-level population and by General CPI. The percent of adult population currently
smoking (Smoke) and married (% Married), from the BRFSS, are included only in the obesity
equation.15
We use two environmental characteristics that can have an impact on eating habits.
The firs variable is the general CPI, which accounts for price levels affecting real income and
quality of food purchased. The second is the annual average state-level temperature (Temp) from
the Earth System Research Laboratory (ESRL) capturing differences in diets due to geography,
the likelihood of engaging in outdoor activities, or in activities which may result in different
lifestyles and therefore diets (including visiting farm stands). The data cover the years 1998-
200616
for 47 continental states,17
for a total of 423 observations. U.S. Census Area fixed-effects
and year dummies are used to account for unobservables and the panel nature of the data. A
summary of the variables used in the estimation is provided in Table 1, along with descriptive
statistics.
Estimation and Identification
An instrumental variable estimation method, the Generalized Method of Moments, or GMM
(Hansen, 1982) is used to obtain unbiased estimated and to control for the endogeneity of some
of the explanatory variables. This method, as illustrated by Hansen, can be seen as a generaliza-
tion of other IV methods, including two-stage least squares. Given a vector of exogenous varia-
bles Z, in the case of linear models the GMM estimator aims to find the vector of coefficients
that satisfies the following moment conditions [ '( ' )] 0 or [ ' ] 0E Z Y X E Z e , or in other
words, the vector of coefficients for which the errors obtained from the model are orthogonal to
the vector of exogenous variables Z. Note that Z contains all of the exogenous variables in X and
at least as many other exogenous variables as the number of endogenous variables. The GMM
estimator solves
min[ '( ' )]' [ '( ' )]Z Y X W Z Y X
,
15
Smoking habits and marital status are usually controlled for in studies related to obesity; controlling for these variables
is not as common in studies of fruit and vegetables consumption. For example Cummins et al. (2005) do not control for
smoking habits and marital status; Rose and Richards (2004) who did not include smoking as control variable, include
instead single parent households, a variable not available in our data. 16
Although the state-level BRFSS Prevalence and Trends Data are available from 1984, we limit our analysis to the period
1998-2006 to avoid problems arising from changes in the Census’ industry classification system, which switched from the
SIC 1987 to the NAICS 1997. Observations for FV5 incidence and other regressors, not available for some years, were
recovered using linear interpolation. 17
Utah was excluded from the sample because of missing observations in the BRFSS data.

Bonanno and Goetz / International Food and Agribusiness Management Review / Volume 15, Issue 4, 2012
2012 International Food and Agribusiness Management Association (IFAMA). All rights reserved.
10
where W is a weight matrix (usually 'Z Z ), which is solved by
1(( ' ) ( ' )) ( ' )GMM
X Z W Z X X Z Y 18
An illustration of the identification strategy follows. As the food store location decision is in part
driven by demand-side factors impacting consumers’ eating habits not captured by the other
control variables in the model, FA is likely to be correlated with the errors in the FV5 equation.19
Since food retailers and food service establishments locate preferentially where pre-existing
infrastructures provide ease of transportation and implementation of logistics structure, our
identification strategy uses historical information on infrastructure to capture exogenous (to
diets) variation in store-density. We use state-level miles of federal highways in 1950 (U.S.
Department of Transportation, Federal Highway Administration, 1950)20
, segmented by rural
and urban areas, as well as the percent of federal highways in each state in urban and rural
locations as instruments. The portion of rural and non-rural land in each state and the square
miles of land are from the Gazetteer of counties (U.S. Bureau of Census, 2001). Furthermore,
we control for market potential and proxies for land prices, e.g., state-level population density,
total land available and the percent of land in natural parks and preserves; also we use the
maximum state-level corporate income tax rate (from the U.S. tax foundation) to capture the
characteristics of the business environment across states. Our identification strategy for
WMSCs21
follows the notion that the company’s expansion into food retailing capitalizes on
converting its mass merchandize Discount Stores (DSs) into supercenters (see Bonanno, 2010);
therefore the current number of WMSCs is regressed on the lagged number of DSs (similar to
Basker and Noal (2009) who use historical values instead), the average distance from food dis-
tribution centers based on Holmes’ store location database (Holmes 2010) regional fixed-effects
and year dummies. The predicted number of stores is divided by total population (in hundreds of
thousands) and used in lieu of the actual ones in the estimation.22
Endogeneity bias may also affect the obesity equation estimates, since unobservables impacting
adult obesity rates could be correlated with fruit and vegetable consumption (e.g., consumption
of other food groups). To resolve this issue, the excluded variables from the FV5 equations are
used as instruments for FV5it in the obesity equation. In equation (2) such variables are CPI,
average temperatures, per-capita real SNAP-Ed expenditure and the instrument for WMSC; the
same variables are also used in equation (4), along with the appropriately instrumented lagged
FV5.23
18
For a more detailed illustration of the GMM estimator see Wooldridge (2002), Chapter 14. 19
If, for example, an area is characterized by a higher demand for unhealthy high-calorie food, limited service restaurants
will be more likely to find such areas to be profitable and locate there. 20
We use historical highway density measures instead of contemporary ones to mitigate issues of spurious correlation
which may arise if the objective of structural interventions to improve the capillarity of highway systems had, as a goal,
that of attracting more businesses in a given area. 21
Specifically, WMSCs locations may be correlated with particular socio-demographic profile, which may in turn be
correlated with poorer diets (e.g., high poverty rates, as in Goetz and Swaminathan, 2006; or share of population receiving
food stamps as in Bonanno, 2010). 22
As different instruments were used to control for the endogeneity of WMSCs, we opted to run a separate first-stage OLS
regression where both the lagged number of discount stores and the inverse distance from the company’s food distribution
centers showed positive and statistically significant coefficients, and the R-squared was 0.5996. 23
The identifying assumptions for the ObI equations is that the exclusion restrictions used (i.e. the variables from the FV5
equations) explain FV5 but not obesity incidence and they are uncorrelated with the errors. The second point can be tested

Bonanno and Goetz / International Food and Agribusiness Management Review / Volume 15, Issue 4, 2012
2012 International Food and Agribusiness Management Association (IFAMA). All rights reserved.
11
Table 1. Variables used in the estimation
Variable Description Source Mean St. dev.
Ob % of adult population with BMI > 30 BRFSS 21.82 3.50
FV5 % of adult population eating fruits and vegetables 5
or more times daily
BRFSS 23.44 3.75
Grocery
Establishments in NAICS 4451 / 1,000 people BLS / PEP 0.34 0.09
FV stores
Establishments in NAICS 44523 / 100,000 people BLS / PEP 0.95 0.66
Lim Serv. Res
(NAICS 722 – NAICS 7222)
Establishments / 1,000 people
BLS / PEP 0.80 0.09
Full Serv. Res
Establishments in NAICS 7222 / 1,000 people BLS / PEP 1.05 0.26
WMSCs Number of WM Supercenters / 100,000 people Wal-Mart
Inc / PEP
0.49 0.46
SNAP-Ed Per Capita Expenditure in SNAP-Ed / CPI
ERS / BLS 0.27 0.26
Phys Act % adults: 30 + minutes of physical activity five or
more days / week
BRFSS 74.50 5.13
Smoke % respondents: currently smoke BRFSS 22.57 2.93
No Child % respondents: no children in their household BRFSS 59.97 3.02
>College % respondents: highest grade or year of school
completed is “College or higher”
BRFSS 29.05 5.50
Income Real per capita income
(Total income / CPI / total population)
ACS / PEP 16.66 2.32
% Female % of respondents being female BRFSS 51.72 0.80
% Black African American population / total population (%) PEP 7.38 6.62
% Other ethnicities Population other than White Caucasian or Black /
total population (%)
PEP 28.66 2.97
% Married % of adult population being married BRFSS 60.34 3.24
Age Average age PEP 36.44 1.18
Temp Average state-level annual temperature ESRL 52.16 7.63
CPI General Consumer Price Index BLS 1.80 0.13
for (see footnote 24). Validating the first point is of particular importance given Courtemanche and Carden’s (2011) result
that Wal-Mart’s presence is associated with higher obesity and McGeary’s (2009) findings that SNAP-Ed is negatively
related to it. To that end, we included per capita real SNAP-Ed expenditure, CPI, average temperatures and the WMSC
instrument as explanatory variables in a specification of the ObI equation where FV5 was excluded from the explanatory
variables, and tested for their statistical significance. In the first place the coefficients of SNAP-Ed and temperatures were
not statistically significant and, in spite those of those of CPI and WMSC being (individually) significant, jointly they
were not. We re-estimated the ObI equation including FV5 in the model both via OLS and GMM (using temperature and
SNAP-Ed as instruments for FV5), leaving CPI and WMSC as explanatory variables: the coefficients for both variables
were not statistically significant. Repeating the same exercise including the instrumented lag of FV5 led to the same con-
clusions. This indicates that all these variables, including the WMSC instrument and SNAP-Ed, can be used as instruments
in the ObI equation.

Bonanno and Goetz / International Food and Agribusiness Management Review / Volume 15, Issue 4, 2012
2012 International Food and Agribusiness Management Association (IFAMA). All rights reserved.
12
Lastly,24
equations (2) and (4) contain lagged dependent variables on the RHS, which are
endogenous by construction. In each of the two equations, the lagged dependent variable is
regressed on lagged exogenous variables entering the respective equation, and the predicted
values used in place of the actual ones. All equations are estimated both via Ordinary Least
Squares (OLS) and (GMM).25
An illustration of the moment conditions necessary to hold for the
parameters of each equation to be identified is discussed in Appendix 2. Equation (1) was esti-
mated with and without the inclusion of per-capita SNAP-Ed. Once estimates of the parameters
are obtained, the impact of FA, SNAP-Ed and other relevant demographic variables on obesity
are calculated. Estimation was performed using STATA v. 11.
Empirical Results
Table 2 presents the empirical results of different specifications of equations (1) and (2). The
first two columns show OLS estimates without and with SNAP-Ed expenditure; respectively, the
third and fourth columns are the GMM estimates. The models show similar goodness of fit (be-
tween 0.5274, for the model without SNAP-Ed, estimated via GMM, to 0.5835, for the model
with SNAP-Ed, estimated via OLS).26
The magnitude and significance of the FA coefficients’ estimates change once SNAP-Ed
expenditure is controlled for, supporting the intuition that without controlling for nutrition
education, the estimated impact of the built environment on eating habits (or obesity) may be
biased. Also, the coefficients change considerably after accounting for FA endogeneity. The
estimated grocery store coefficients are positive in all models, but in none of the models are they
statistically significant suggesting that a positive correlation exists between access to grocery
stores and FV5 incidence; however, this relationship is weak and in all likelihood non-causal,
which may explain why previous more limited-scale studies show mixed findings (e.g., Rose and
Richards’ (2004) and Cummings et al. (2005) report conflicting findings).
24
The use of a linearized geometric distributed lag model requires that the errors of the estimated model not be serially
correlated. Tests for first order serial correlation, using Durbin’s h statistics, show that, in all cases the errors were free
from serial correlation. 25
The orthogonality of the over-identifying instruments to the errors of the second stage regressions is evaluated via
Hansen’s (1982) test. The J-statistic of this test is distributed as chi-squared with degrees of freedom equal to the number
of over-identifying instruments. A non-significant test statistic indicates that the instruments are valid. To evaluate
instead the power of the instruments, we use Staiger and Stock’s (1997) rule of thumb: if the F-statistic for the joint
significance of the instruments’ coefficients in the first stage equations exceeds 10 one can rule out weak instruments
problems. 26
The instruments used to correct for endogeneity of FA do not violate the orthogonality condition (the p-values of
Hansen’s (1982) J-tests are 0.2970 and 0.1649, respectively, in the model with and without SNAP-Ed).The larger p-value
obtained when accounting for SNAP-Ed, suggests that controlling for this variable leads to more reliable results.
Furthermore, the value of the F-statistics for the joint significance of the instruments’ coefficients in the first stage
equations exceed the “rule of thumb” value of 10, suggesting that the instruments used are not weak (Staiger and Stock,
1997). A more in-depth look at the first stage regression results shows the R-squared for the first-stage FA equations rang-
ing from circa 0.6 (limited-service restaurants) to 0.84 (fruits and vegetables stores) and that remarkable similarities appear
in the results. For example, maximum corporate tax rate has a negative and significant effect on the density of three out of
the four types of stores while a positive relationship exists with population density (the one exception being full service
restaurants). The proxy for land availability seems to impact primarily the store density measures with the exception of
limited service restaurants, which are, conversely, heavily impacted by highway density (percent of federal highways in
urban and rural areas), much more so than other outlets (for example grocery stores and fruits and vegetables stores are
only weakly impacted by these variables).

Bonanno and Goetz / International Food and Agribusiness Management Review / Volume 15, Issue 4, 2012
2012 International Food and Agribusiness Management Association (IFAMA). All rights reserved.
13
Table 2. Estimated coefficients – Equation 1: incidence of consuming five servings of fruits and
vegetables per day.
OLS
GMM
NO SNAP-Ed With SNAP-Ed NO SNAP-Ed With SNAP-Ed
Grocery 3.2273 2.7901 4.4157 3.0192
(2.3454) (2.3224)
(6.2735) (6.0118)
FVstores 0.8349** 1.1348***
0.6645* 0.8953**
(0.3268) (0.3364)
(0.4058) (0.4077)
LimRes -1.5921 -0.8313
-6.8123 -4.2693
(2.1214) (2.1104)
(4.4663) (4.5650)
FullRes -2.5394*** -2.8996***
3.0450* 1.6750
(0.9027) (0.8994)
(1.8373) (1.8789)
WMSCs -0.9640*** -1.0324***
-0.7796*** -0.8967***
(0.2217) (0.2201)
(0.2439) (0.2453)
SNAP-Ed
1.8211***
1.3709**
(0.5685)
(0.5830)
Phys Act 0.1124** 0.1039**
0.0899 0.0885
(0.0499) (0.0494)
(0.0752) (0.0730)
No Child 0.0582 0.0621
0.0572 0.0554
(0.0770) (0.0762)
(0.1031) (0.0996)
>College 0.2400*** 0.2686***
0.1721** 0.1972**
(0.0568) (0.0569)
(0.0878) (0.0858)
PC Income 0.2778** 0.2560**
0.5165*** 0.4553**
(0.1127) (0.1116)
(0.1892) (0.1872)
%Race -0.2465*** -0.2832***
-0.2793*** -0.2960***
(0.0746) (0.0747)
(0.0806) (0.0799)
% Black -0.08243** -0.09438**
-0.1248*** -0.1212***
(0.0407) (0.0404)
(0.0361) (0.0352)
% Fem -0.0625 -0.0537
0.6452 0.5308
(0.3890) (0.3845)
(0.4658) (0.4567)
Age -0.0160 -0.1030
-0.4510 -0.4221
(0.2459) (0.2445)
(0.3435) (0.3342)
Temp 0.0226 0.0415
0.0885 0.0846
(0.0361) (0.0362)
(0.0566) (0.0552)
CPI 11.348*** 10.003**
11.899*** 11.333***
(4.3538) (4.3242)
(4.4064) (4.1458)
Constant -10.2790 -5.8101
-36.2370 -30.0000
(22.7260) (22.5080)
(27.8550) (26.7270)
R-squared 0.5727 0.5835 0.5274 0.5542
Hansen’s J [χ2 (4)]
6.4976 4.9069
p-value J 0.1649 0.2970
Note. *, **, and *** represent 10, 5 and 1% significance levels, respectively. Standard errors in parenthesis.
Regional fixed-effects and time dummy coefficients excluded for brevity.

Bonanno and Goetz / International Food and Agribusiness Management Review / Volume 15, Issue 4, 2012
2012 International Food and Agribusiness Management Association (IFAMA). All rights reserved.
14
The estimated coefficients of F&V stores are positive and significant, across specifications and
estimation methods. After controlling for SNAP-Ed expenditure, the estimated coefficient for
F&V stores increases by approximately 30% (0.835 to 1.135 in the OLS results; 0.665 to 0.895
in the GMM). Since the sample average state-level density of FV stores is about one store per
100,000 people, the results indicate that doubling access to F&V stores raises the FV5 incidence
by 0.66 % to about 0.9%.
The OLS estimates of the full and limited service restaurants coefficients are negative; the
former (−2.539 and −2.899) are statistically significant, while the latter (−1.592 and –0.831) are
not, suggesting a negative correlation between restaurants and the incidence of fruits and
vegetables consumption among the adult population. The coefficients for limited service
restaurants become more negative after endogeneity is controlled for, although it is not
statistically significant, suggesting that the density of these establishments is negatively
correlated with our crude proxy for healthy eating and that, because fruits and vegetables
consumption is likely negatively related to obesity incidence, our results are consistent with pre-
vious studies (Chou, Grossman, and Saffer, 2004; Chen, Florax, and Snyder, 2009; Currie et al.
2009); however, this relationship is likely to be non-causal. Instead, once endogeneity is
controlled for the sign of the full service restaurant coefficient becomes positive, although
significant at the 10% level only in the model without SNAP-Ed.
This result seems to support Anderson and Matsa’s (2011) argument that excess calories from
meals at restaurants could be offset by reducing consumption on other occasions, or in this case,
by increasing the frequency of consumption of fruits and vegetables. However, not all
individuals may make such calorie-offsetting decisions: the fact that the coefficient loses
statistical significance when our proxy for nutrition education is controlled for, may indicate that
only a portion of the population (perhaps consumers who are more educated from a nutritional
stand point) would make better dietary choices in the presence of more restaurants, and that once
education is controlled for only a correlation persists.
The effect of WMSCs on FV5 incidence is negative and statistically significant across models
and estimation methods, with the GMM coefficients showing a lower magnitude than the OLS
coefficients, while the coefficients are eight to twelve percent larger when SNAP-Ed expenditure
is accounted for. This supports Courtemanche and Carden’s (2011) contention that the real
income-increasing effect of Wal-Mart’ lower prices does not translate into consumption of
healthier foods; as the negative relationship between the incidence of adults consuming fruits and
vegetables five or more times a day and the company’s presence becomes more marked
controlling for nutrition education, it may suggest that the less educated consumers are those
engaging the most in unhealthy eating practices once they are exposed to more varieties at lower
prices. Our results indicate that an increase of one WMSC per 100,000 individuals (a 200%
increase in store numbers, the sample average of which is 0.49) would reduce FV5 incidence by
0.78 to 0.9 percentage points.
The coefficients associated with SNAP-Ed expenditures are positive and significant using both
OLS and GMM (1.821 and 1.371, respectively), indicating that an increase in per-capita
expenditure in SNAP-Ed of $1/year would raise FV5 incidence by approximately 1.4 to 1.8
Bonanno and Goetz / International Food and Agribusiness Management Review / Volume 15, Issue 4, 2012
2012 International Food and Agribusiness Management Association (IFAMA). All rights reserved.
15
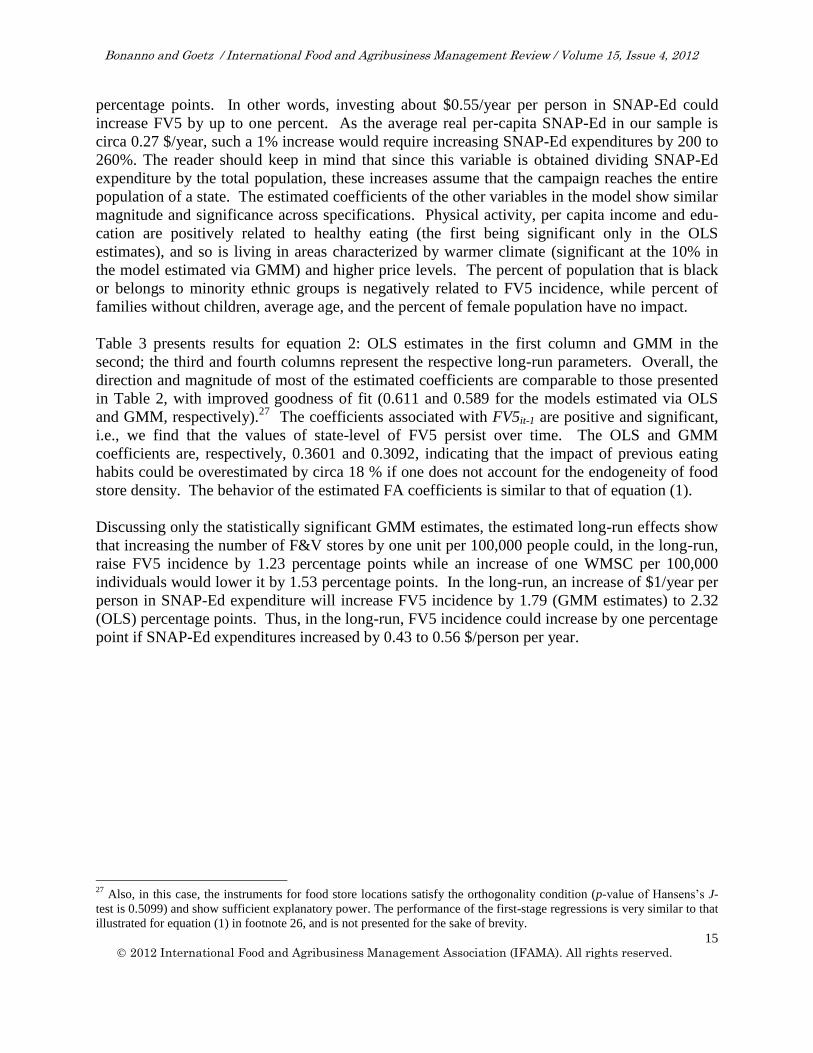
percentage points. In other words, investing about $0.55/year per person in SNAP-Ed could
increase FV5 by up to one percent. As the average real per-capita SNAP-Ed in our sample is
circa 0.27 $/year, such a 1% increase would require increasing SNAP-Ed expenditures by 200 to
260%. The reader should keep in mind that since this variable is obtained dividing SNAP-Ed
expenditure by the total population, these increases assume that the campaign reaches the entire
population of a state. The estimated coefficients of the other variables in the model show similar
magnitude and significance across specifications. Physical activity, per capita income and edu-
cation are positively related to healthy eating (the first being significant only in the OLS
estimates), and so is living in areas characterized by warmer climate (significant at the 10% in
the model estimated via GMM) and higher price levels. The percent of population that is black
or belongs to minority ethnic groups is negatively related to FV5 incidence, while percent of
families without children, average age, and the percent of female population have no impact.
Table 3 presents results for equation 2: OLS estimates in the first column and GMM in the
second; the third and fourth columns represent the respective long-run parameters. Overall, the
direction and magnitude of most of the estimated coefficients are comparable to those presented
in Table 2, with improved goodness of fit (0.611 and 0.589 for the models estimated via OLS
and GMM, respectively).27
The coefficients associated with FV5it-1 are positive and significant,
i.e., we find that the values of state-level of FV5 persist over time. The OLS and GMM
coefficients are, respectively, 0.3601 and 0.3092, indicating that the impact of previous eating
habits could be overestimated by circa 18 % if one does not account for the endogeneity of food
store density. The behavior of the estimated FA coefficients is similar to that of equation (1).
Discussing only the statistically significant GMM estimates, the estimated long-run effects show
that increasing the number of F&V stores by one unit per 100,000 people could, in the long-run,
raise FV5 incidence by 1.23 percentage points while an increase of one WMSC per 100,000
individuals would lower it by 1.53 percentage points. In the long-run, an increase of $1/year per
person in SNAP-Ed expenditure will increase FV5 incidence by 1.79 (GMM estimates) to 2.32
(OLS) percentage points. Thus, in the long-run, FV5 incidence could increase by one percentage
point if SNAP-Ed expenditures increased by 0.43 to 0.56 $/person per year.
27
Also, in this case, the instruments for food store locations satisfy the orthogonality condition (p-value of Hansens’s J-
test is 0.5099) and show sufficient explanatory power. The performance of the first-stage regressions is very similar to that
illustrated for equation (1) in footnote 26, and is not presented for the sake of brevity.

Bonanno and Goetz / International Food and Agribusiness Management Review / Volume 15, Issue 4, 2012
2012 International Food and Agribusiness Management Association (IFAMA). All rights reserved.
16
Table 3. Equation 2 – Estimated coefficients: incidence of consuming five servings of fruits and
vegetables per day and long-run parameters
Estimated Coefficients Long-run Parameters
OLS GMM OLS GMM
Lag FV5 0.3601** 0.3092*
(0.1629) (0.1837)
Grocery 4.4194** 0.3054 6.9067 * 0.4421
-1.9860 -5.5938 (3.6443)
(8.0404)
FV stores 0.8619*** 0.8503** 1.3469 ** 1.2310 *
(0.3232) (0.4026) (0.5703)
(0.7036)
Lim Serv. Res -1.3502 -3.4589 -2.1102
-5.0073
(2.1693) (4.0061) (3.3798)
(5.9355)
Full Serv. Res -2.5601*** 0.7393 -4.0010 ** 1.0702
(0.7157) (1.8877) (1.6657)
(2.6267)
WMSCs -1.0746*** -1.0590*** -1.6794 *** -1.5331 ***
(0.2104) (0.2272) (0.4911)
(0.5325)
SNAP-Ed 1.4848*** 1.2347** 2.3205 ** 1.7875 *
(0.4710) (0.5726) (0.9399)
(0.9653)
Phys Act 0.0031 0.0124 0.0049
0.0180
(0.0794) (0.0800) (0.1243)
(0.1167)
No Child 0.0612 0.0228 0.0956
0.0330
(0.0919) (0.0883) (0.1546)
(0.1311)
> College 0.1573* 0.1300 0.2458 ** 0.1881
(0.0920) (0.0950) (0.1088)
(0.1210)
Income 0.1942* 0.2772 0.3035 ** 0.4012 *
(0.1061) (0.2058) (0.1536)
(0.2505)
% Oth. Race -0.2740*** -0.2586*** -0.4282 *** -0.3744 ***
(0.0837) (0.0945) (0.1292)
(0.1148)
% Black -0.0624 -0.0671 -0.0975 * -0.0971 *
(0.0434) (0.0524) (0.0555)
(0.0579)
% Fem (0.1912) 0.1336 -0.2988
0.1935
(0.3596) (0.5558) (0.6026)
(0.7745)
Age -0.1759 -0.2388 -0.2748
-0.3457
(0.2450) (0.3137) (0.4021)
(0.4433)
Temp 0.0376 0.0511 11.5955
13.0750
(0.0320) (0.0527) (8.4214)
(8.4790)
CPI 7.4196 9.0318* 0.0588
0.0740
(4.5355) (4.7364) (0.0514)
(0.0699)
Constant 12.9670 -3.7785
(19.5750) (28.9290)
R-squared 0.6108 0.5893
Hansen’s J [χ2
(4)] 3.2693
p-value J 0.5099
Note. *, **, and *** represent 10, 5 and 1% significance levels, respectively. Standard errors in parenthesis.
Regional fixed-effects and time dummy coefficients excluded for brevity.

Bonanno and Goetz / International Food and Agribusiness Management Review / Volume 15, Issue 4, 2012
2012 International Food and Agribusiness Management Association (IFAMA). All rights reserved.
17
Table 4 presents the results of the obesity equations (3) and (4). The first two columns contain
OLS and GMM estimated parameters of equation (3) while the third and fourth columns report
the GMM estimates of equation (4) and the calculated long-run parameters. The goodness of fit
of the models is comparable (the R-squared are 0.8709 and 0.8423, for equation 3, OLS and
GMM respectively, and 0.8567 for equation 4, GMM). While no relationship seems to emerge
between FV5 and adult obesity incidence in the OLS estimates (the coefficient being positive,
small and not statistically significant), once endogeneity of eating habits is accounted for,28
the
results show that a one percentage point increase in FV5 incidence lowers adult obesity
incidence by approximately −0.24 % (in the short run), while a long-run marginal decrease can
reach -0.44%.
Most of the estimated coefficients for the other variables show similar magnitude, sign and
significance across specifications and behave as expected. The percent of population holding a
college degree or higher shows negative and significant coefficients as do having no children; the
signs associated with average age, smoking and belonging to minorities are negative but not
statistically significant. Also, the percent of population married and the percent of black popula-
tion do not show a statistically significant effect. The coefficients of two variables have signs
counter to expectation: physical activity and per capita income, both of them positive, although
the latter not statistically significant: as these results do not account for the indirect effect on
adult obesity incidence though their impact on healthy eating, the full effect should be
considered instead, which is discussed below.
Table 5 presents the cumulative impact of SNAP-Ed expenditure, selected FA and demographic
variables on adult obesity obtained combining the estimated parameters of equations 1 and 3,
with those of equations 2 and 4 (GMM results). As they are obtained from parameters of
separate equations, we are unable to provide standard errors associated with them, a caveat that
readers should keep in mind. Increasing SNAP-Ed expenditure by $1/year per individual (that is,
under the caveat that the policy would have to reach the entire population) could reduce the
incidence of adult obesity by at least 0.3 percentage points. Such an increase translates into a
long-run 0.8% decrease in the rate of adult obesity. An increase of one F&V store per 100,000
individuals reduces adult obesity incidence by approximately −0.2 percentage points in the short-
run and −0.54% in the long run. The sample average of F&V stores density being about 1, we
can conclude that 1) doubling the density of F&V stores reduces adult obesity incidence by half a
percentage point, or that 2) increasing the density of F&V by 180% would lower obesity by one
percent. The presence of WMSCs results in a short-run obesity-increasing effect ranging from
0.2 to 0.25, and a long-run marginal increase of 2/3 of a percentage point.
28
The excluded variables from the FV5 equations, used as instruments in the ObI equation, satisfy the orthogonality
condition (p-values of Hansen J are 0.6290 and 0.3092, for equation (3) and (4), respectively). The R-squared of the re-
gressions are 0.5556 and 0.5884; the coefficients of WMSC instrument and CPI were statistically significant in the first
stage regression (the second at the 10 % level in equation (4)), while the other variables showed less explanatory power,
although SNAP-Ed’s coefficient approaches the 10% significant levels in both first stage regressions. In spite of the dif-
ferent performances across models, the parameters of the over-identifying instruments are jointly significant at the 1%
level in both cases.

Bonanno and Goetz / International Food and Agribusiness Management Review / Volume 15, Issue 4, 2012
2012 International Food and Agribusiness Management Association (IFAMA). All rights reserved.
18
Table 4. Equations 3 and 4 – Estimated coefficients: adult obesity incidence and long-run
parameters.
Eq (3)
Eq (4) LR parameters
OLS GMM GMM Eq. 4 (GMM)
Lag ObI
0.4634***
(0.0856)
FV5 0.0055 -0.2338* -0.2371* -0.4419 *
(0.0255) (0.1394) (0.1267) (0.2309)
Phys Act 0.1006*** 0.1228*** 0.0619* 0.1154 *
(0.0241) (0.0376) (0.0346) (0.0684)
No Child -0.1615*** -0.1864*** -0.1316*** -0.2452 ***
(0.0386) (0.0510) (0.0494) (0.0950)
> College -0.3427*** -0.3227*** -0.1901*** -0.3542 ***
(0.0309) (0.0353) (0.0412) (0.0649)
% Smokers -0.0116 -0.1134 (0.0881) -0.1642
(0.0381) (0.0746) (0.0755) (0.1346)
Income 0.0104 0.0939 0.0474 0.0884
(0.0494) (0.0692) (0.0683) (0.1242)
% Oth. Race -0.0084 -0.0877 0.0713 0.1328
(0.0392) (0.0646) (0.0743) (0.1509)
% Black 0.07654*** 0.05276** -0.0116 -0.0217
(0.0217) (0.0259) (0.0268) (0.0513)
% Fem 0.5401*** 0.5185*** 0.6510*** 1.2131 ***
(0.1637) (0.1747) (0.1740) (0.3945)
Age -0.0272 0.0265 -0.1162 -0.2165
(0.1161) (0.1373) (0.1337) (0.2541)
% Married 0.0281 -0.0284 0.0149 0.0277
(0.0292) (0.0447) (0.0430) (0.0817)
Constant 8.5778 19.2020 -1.6358
(9.5569) (12.1710) (13.7270)
R-squared 0.8709 0.8423 0.8507
Hansen’s J χ2
(3)= 1.7357; p-val = 0.6290 χ2 (4)=4.7935; p-val = 0.3091
Note. *, **, and *** represent 10, 5 and 1% significance levels, respectively. Standard errors in parentheses. Re-
gional fixed-effects and time dummy coefficients excluded for brevity
The cumulative marginal effects of the socio-demographic variables show that increases in
income, education and the level of physical activity all have an effect on containing obesity,
which supports previous findings. However, the marginal effect of physical activity calculated
from the coefficients of equations not including the dependent variable lag, shows perverse
(positive) sign; this points to the importance of including dynamics in the model. The results
indicate that, as income increases, consumers will consume more overall, but proportionately
more fruit and vegetables. Looking at the results of the models accounting for system dynamics,
the marginal effect of an increase of $1,000 per individual results in a 0.15 (short-run) to 0.26

Bonanno and Goetz / International Food and Agribusiness Management Review / Volume 15, Issue 4, 2012
2012 International Food and Agribusiness Management Association (IFAMA). All rights reserved.
19
(long-run) points decrease in adult obesity. Comparing this effect to that of SNAP-Ed, an
increase of 0.33 $ per capita in SNAP-Ed among the entire population would (approximately)
have the same effect on obesity as that of increasing consumers’ income by $1,000. The cumula-
tive effect of an increase in regular physical activity within the population is to reduce the adult
obesity rate, suggesting that the effect of physical activity on obesity may not simply be due to
the burning of more calories but also to an improvement in eating habits, because of the adoption
of healthier life styles. Last, even if the percent of population holding at least a college degree
did not significantly affect healthy eating, its direct effect on adult obesity prevails, leading to a
short-run marginal effect of −0.14 and a long-run effect of −0.26.
Table 5. Calculated marginal impact of SNAP-Ed, selected FA and demographic variables on
adult obesity incidence (GMM results only).
Eq. 1 and 3 Eq. 2 and 4(SR) Eq. 2 and 4 (LR)
SNAP-Ed -0.3205 -0.2928 -0.7898
FV stores -0.2093 -0.2016 -0.5439
WMSCs 0.2096 0.2511 0.6774
Income -0.0125 -0.1534 -0.2585
Phys Act 0.1021 -0.1893 -0.3516
> College -0.3888 -0.1442 -0.2559
Discussion, Implications for the Agribusiness Sector, and Limitations
The results illustrated above have a series of policy implications. In the first place, at the
aggregate-level, we find no evidence of a negative causal relationship between the density of
food-service establishments and the state-level incidence of adult healthy eating (similar to
Collins and Baker, 2009, who find no “Granger causality” on obesity incidence using nationwide
data), suggesting that policies aiming to restrict access to these outlets may have little impact on
improving healthy diets. This result could be seen as an average (aggregate) outcome of con-
sumers’ eating habits, which is consistent with Anderson and Matsa’s (2011) findings, i.e., that
consumers who eat at restaurants more often could offset calories by reducing consumption on
other occasions. Another result which may have policy implications is the detrimental effect of
WMSCs on eating habits. Consistent with Courtemanche and Carden (2011) we find that the
price-decreasing effects of the company may induce consumers to increase consumption overall,
but not necessarily that of healthier foods. However, the company has announced (January
2011) a five-year plan to reduce the price of produce and the sodium, trans fat and added sugars
content in several food produces under their private brands, as well as pledging to push major
suppliers to follow their example (The New York Times, 2011). Policy makers should monitor
closely whether this initiative impacts eating habits which, in light of the magnitude of our find-
ings, could have a large impact on obesity rates.
Similarly, our results indicate that expenditures on nutrition education programs can improve
eating habits and, indirectly, curb the incidence of adult obesity. However, increases in nutrition
education efforts would have to be substantial. Using the combined long-run effects of SNAP-Ed

Bonanno and Goetz / International Food and Agribusiness Management Review / Volume 15, Issue 4, 2012
2012 International Food and Agribusiness Management Association (IFAMA). All rights reserved.
20
on obesity, our results indicate that quadrupling average expenditure on nutrition education (see
below for some additional caveats on the interpretation of this result) could reduce adult obesity
by 0.8%; the feasibility of such a large spending increase as a policy tool is unlikely. However,
as the presence of FV stores appears to be a catalyst of healthy eating, the use of local subsidies
or zoning laws that enhance the presence of these outlets may be combined with larger nutrition
education expenditures and have a synergic effect.
Our findings are relevant for the agribusiness industry on several fronts. In the first place, they
advise against large-scale policies to regulate the structure of the food environment; although the
results and the data used do not allow for evaluating the effectiveness of such interventions in
specific contexts, they indicate that, at the aggregate level, their validity can be questioned.
Second, an implication of our results is that agribusiness firms could considerably benefit from
investing in nutrition education campaigns (or support already existing ones), on two fronts: 1) in
general, they could benefit (indirectly) in terms of their public image as they will contribute to a
more widespread adoption of healthy eating habits; 2) more specifically, fruit and vegetables
producers and processors could directly benefit from an expanded consumer base which could
result from an effective nutrition education campaign.
Our study is, however, not without limitations. First, we use the incidence of adults who
consume more than five servings of fruits and vegetables daily as proxy for eating habits among
the adult population; that is, as mentioned above, a rough and incomplete proxy for “healthy
eating;” future research should consider using more refined measures of the overall quality of
individuals’ diets. Second, given the aggregate nature of the data used, we cannot rule out that
part of the population could be affected negatively by the presence of outlets such as fast-food
restaurants. While some consumers may show marked preference for healthier alternatives, they
may still opt for healthy diets regardless of the food environment, others, more susceptible to the
surrounding environment, may be affected negatively by the presence of fast foods. These two
effects may cancel each other out, resulting in a zero aggregate effect: as such, our results, which
depict average aggregate effects, cannot and should not be used to draw inferences on how an
individual’s fruit and vegetables consumption habits are affected by the presence of a particular
food outlet. Third, although our statistical evidence supports the validity of our identification
strategy, our findings are conditional on the choice of instruments for the food density measures.
Additional research should explore an alternative identification strategy to shed more light on
whether the relationship between the food environment and diet (and its outcomes, such as
obesity) is causal or not, and whether different identification strategies produce different results.
Fourth, as we estimate the two equations separately, we are unable to provide standard errors for
the indirect and combined marginal effects of some of the explanatory variables on adult obesity
incidence. Because of the small number of observations and the aggregate nature of the data used
in this analysis, the limited variation in the data did not allow us to use successfully simultaneous
equation modeling. Future research using more detailed databases and more sophisticated
empirical approach could overcome such limitation.
Lastly, two remarks on our use of the per capita real expenditure on SNAP-Ed are warranted.
First, it could be argued that because SNAP-Ed reaches only a small portion of the population,
i.e., SNAP participants, it may not be worthwhile to investigate the possibility of increasing

Bonanno and Goetz / International Food and Agribusiness Management Review / Volume 15, Issue 4, 2012
2012 International Food and Agribusiness Management Association (IFAMA). All rights reserved.
21
SNAP-Ed funding as a policy tool. The reader should however keep in mind that, because of the
population it reaches, SNAP-Ed actually targets individuals in greatest need of education from a
nutritional standpoint and those who may therefore derive the greatest benefit from it. As a
result, the FV5-increasing effect of SNAP-Ed may come largely from the fact that more
disadvantaged consumers engage in “healthy eating”; as such, an increase in SNAP-Ed
expenditure could be an effective policy tools to improve eating habits among low income
households. However, given the size of the increase in SNAP-Ed expenditures needed to
achieve a sizeable reduction in obesity, expanding the reach of the policy to target more
population may, in practice, be infeasible.29
The infeasibility of such approach is even more
evident if one considers that we normalized federal SNAP-Ed expenditure by population, i.e., all
of the estimated impacts of this variable refer to a hypothetical scenario where the funds were
spent to educate the entire state population and not only SNAP recipients.
Second, our results do depict causal effects if and only if the measure of nutrition education used,
per-capita SNAP-Ed, is in fact exogenous. To benefit from SNAP-Ed, states are required to
match federal funds; therefore states in which diets are worse are also those where there may be
more interest in investing in nutrition education. From an empirical standpoint, this means that
one should control for enough factors associated with both diets and policymakers’ decisions to
invest in nutrition education, to guarantee that the estimated parameters of equations (1) and (2)
are unbiased (McGeary, 2009). The risk of endogeneity bias is, however, limited as we control
for consumers’ heterogeneity through aggregate demographic indicators, and exogenous
determinants of diets (such as temperature).30
Concluding Remarks
This paper has examined the simultaneous impact of different food outlets’ density and
expenditures in nutrition education programs on the incidence of healthy eating among the U.S.
adult population and, indirectly, on adult obesity incidence, using a state-level panel data set and
controlling for different sources of biases in the estimates. We find that even after controlling
for omitted variable, endogeneity bias and the lagged fruit and vegetables consumption
incidence, the density of fruits and vegetable stores is associated with higher shares of adults
consuming fruits and vegetables regularly, and therefore lower obesity rates. The presence of
Wal-Mart Supercenters, in contrast, across specifications, is associated with lower percentages of
individuals consuming fruit and vegetables regularly and, as a consequence, with higher levels of
obesity. The effect of SNAP-Ed expenditures is consistently that of more healthy eating and,
consequently, reduced obesity.
Our results advise against large-scale policies to regulate the structure of the food environment as
they indicate instead that investing in nutrition education could be (at the aggregate level), a
more suitable tool to improve healthy eating incidence among the adult population. As a result,
29
Also, as an anonymous reviewer pointed out, SNAP-Ed may also capture different attitudes towards SNAP within the
states. Addressing this question is beyond the scope of our current study but worth exploring in future research. 30
McGeary (2009) also points out that both funding levels and diets could change in response to local economic
conditions. As we control for variables related to economic conditions, e.g., real income and CPI (related to inflationary
trends) such a bias should not be an issue here.
Bonanno and Goetz / International Food and Agribusiness Management Review / Volume 15, Issue 4, 2012
2012 International Food and Agribusiness Management Association (IFAMA). All rights reserved.
22
while all agribusiness firms could benefit from investing in nutrition education campaigns, as
they may gain in terms of image, fruit and vegetables producers and processors would benefit
directly from it as they may experience an expanded consumer base.
Future research could use more refined data and econometric analysis to separate the direct and
indirect impact of the food outlets on obesity, accounting for the trade-off between having access
to more food outlets vs. that of having access to healthier ones. Alternatively, different types of
food outlets (for example farmers’ markets) or more refined measures of healthy eating
(including for example whole grains, low fat dairy, etc.) could be examined.
References
Anderson, M., and D. A. Matsa. 2011. Are restaurants really supersizing America? American
Economic Journal: Applied Economics 3(1):152–88.
Arsenault, J. E. 2010. Can nutrition labeling affect obesity? Choices Magazine 25(3): 27-30.
Basker, E., and M. Noel. 2009. The evolving food chain: Competitive effects of Wal-Mart’s
entry into the supermarket industry.” Journal of Economics and Management Strategy
18(4): 977–1009.
Bonanno, A. 2010. An empirical investigation of Wal-Mart’s expansion into food retailing.
Agribusiness: An International Journal 26(2): 220–243.
Bowman, S. A., and B. T. Vinyard. 2004. Fast food consumption of U.S. adults: Impact on
energy and nutrient intakes and overweight status. Journal of the American College of
Nutrition 23(2):163-168.
Center for Disease Control and Prevention. 1996-2005. Behavioral Risk Factor Surveillance
System Survey Data. Atlanta, Georgia: U.S. Department of Health and Human Services,
Centers for Disease Control and Prevention.
Chen, S. E., R. J.G.M. Florax, and S. D. Snyder. 2009. Obesity, Fast Food, and Grocery Stores:
Evidence from Geo-referenced Micro Data. National Poverty Center. Available at
http://www.npc.umich.edu/news/event s/food-access/index.php
Chou, S., M. Grossmam, and H. Saffer. 2004. An economic analysis of adult obesity: results
from the Behavioral Risk Factor Surveillance System. Journal of Health Economics 23:
565–587.
Collins R., and G.A. Baker. 2009. Of junk food and junk science. International Food and Agri-
business Management Review 12(3) 111-126
Courtemanche, C., and A. Carden. 2011. Supersizing supercenters? The impact of Wal-Mart
supercenters on Body Mass Index and obesity. Journal of Urban Economics 69 (2):165-
181.

Bonanno and Goetz / International Food and Agribusiness Management Review / Volume 15, Issue 4, 2012
2012 International Food and Agribusiness Management Association (IFAMA). All rights reserved.
23
Cummins, S., M. Petticrew, C. Higgins, A. Findlay, and L. Sparks. Large scale food retailing as
an Intervention for diet and health: quasi-experimental evaluation of a natural Experi-
ment. Journal of Epidemiology Community and Health 59(12): 1035–1040.
Currie J., S. DellaVigna, E. Moretti, and V. Pathania. 2009. The effect of fast food restaurants on
obesity. NBER Working .Paper No. 14721 http://www.nber.org/papers/w14721 (accessed
September 12, 2011).
Cutler, D. M., E. L. Glaeser, and J. M. Shapiro. 2003. Why have Americans become more
obese? Journal of Economic Perspectives 17 (3):93-118.
Drewnowski, A., and S.E. Specter. 2004. Poverty and obesity: the role of energy density and en-
ergy costs. American Journal of Clinical Nutrition 79 (1): 6-16.
Dunn, R. A. 2008. Obesity and the availability of fast-Food: an instrumental variables approach.
Available at the SSRN eLibrary Paper No. 989363.
Earth System Research Laboratory. Average mean temperature index by month: 1971-2000
Available at: http://www.esrl.noaa.gov/psd/data/usclimate/tmp.state.112000.climo
Egger, G., and B. Swinburn. 1997. An "ecological" approach to the obesity pandemic. BMJ
1997, 315:477.
Elbel, B., R. Kersh, V. L. Brescoll, and B. L. Dixon. 2009. Calorie labeling and food choices: a
first look at the effects on low-income people in New York City. Health Affairs 28(6):
1110-21.
Flegal, K. M., M. D. Carroll, C. L. Ogden, and L. R. Curtin. 2010. Prevalence and trends in obe-
sity among US adults, 1999-2008 Journal of the American Medical Association 303(3):
235-241.
Goetz, S. J., and H. Swaminathan. 2006. Wal-Mart and family poverty in US counties. Social
Science Quarterly 83(2006): 211-225.
Greene W. H. 2003. Econometric Analysis. 4th
Edition. New Jersey, Prentice Hall.
Hansen, L. P. 1982. Large sample properties of Generalized Method of Moments estimators.
Econometrica 50(4): 1029-54.
Holmes, T. J. 2010. Opening dates of Wal-Mart stores and Supercenters, 1962-Jan 31, 2006.
http://www.econ.umn.edu/~holmes/data/WalMart/index.html (accessed June 4, 2011).
Kuchler, F., Tegene, A., and J.M. Harris. 2005. Taxing snacking foods: manipulating diet quality
or financing information programs? Review of Agricultural Economics 27(1): 4-20.

Bonanno and Goetz / International Food and Agribusiness Management Review / Volume 15, Issue 4, 2012
2012 International Food and Agribusiness Management Association (IFAMA). All rights reserved.
24
Lakdawalla, D. and T. Philipson. 2002. The growth of obesity and technological change: A
theoretical and empirical examination. NBER Working paper Series N. 8946.
http://www.nber.org/papers/w8946 (accessed August 3, 2011).
Lin, B.-H. and E. Frazão. 1997. Nutritional quality of foods at and away from home. Food
Review 20(1): 33-40.
Lin, B. and R. M. Morrison. 2002. Higher fruit consumption linked with lower Body Mass In-
dex. Food Review 25(1): 28–32.
Mc Geary, Kerry A. 2009. The impact of State-Level Nutrition-Education Program funding on
BMI: Evidence from the Behavioral Risk Factor Surveillance System, NBER working
Paper w15001. http://www.nber.org/papers/w15001 (accessed August 3, 2011).
Mela, D. J. 1999. Food choice and intake: the human factor. Proceedings of the Nutrition Society
58(3): 513-521.
Maddock, J. 2004. The relationship between obesity and the prevalence of fast food restaurants:
state-level analysis. American Journal of Health Promotion 19(2):137-143.
Moore, L. V., and A. V. Diez Roux. 2006. Associations of neighborhood characteristics with the
location and type of food stores. American Journal of Public Health 96(2): 325-31.
Morland, K., Diez Roux, A., and S. Wing. 2006. Supermarkets, other food stores, and obesity.
The Atherosclerosis Risk in Communities Study. American Journal of Preventive
Medicine 30(4): 333-339.
Philipson, T. J., and R. A. Posner. 1999. The long-run growth in obesity as a function of techno-
logical change. NBER Working Paper No. 7423.
Powell, L. M., Auld, C., Chaloupka, F. J., O’Malley, P. M. and L. D. Johnston. 2007.Access to
fast food and food prices: relationship with fruit and vegetable consumption and
overweight among adolescents. Advances in Health Economics and Health Services
Research 17(1): 23–48.
Rose, D., and R. Richards. 2004. Food store access and household fruit and vegetable use among
participants in the U.S. Food Stamp Program. Public Health Nutrition 7(8): 1081-1088.
Sahyoun, N. R., Pratt, C. A., and A. Anderson. 2004. Evaluation of nutrition education interven-
tions for older adults: a proposed framework. Journal of the American Dietetic Associa-
tion 104(1): 58-69.
Schroeter, C., L. House, and A. Lorence. 2007. Fruit and vegetable consumption among college
students in Arkansas and Florida: Food culture vs. health knowledge. International Food
and Agribusiness Management Review 10(3): 63-89

Bonanno and Goetz / International Food and Agribusiness Management Review / Volume 15, Issue 4, 2012
2012 International Food and Agribusiness Management Association (IFAMA). All rights reserved.
25
Staiger, D., and J. H. Stock. 1997. Instrumental variables regression with weak instruments.
Econometrica 65(3): 557-586.
Stolberg, S.G. 2011. Wal-Mart shifts strategy to promote healthy foods. The New York Times.
January 20.
Todd, J., and C. Zhen. 2010. Can taxes on calorically sweetened beverages reduce obesity?
Choices Magazine, 25(3): 31-37.
U.S. Bureau of Census. 1998–2006. County business patterns database.
http://www.census.gov/epcd/cbp/download/cbpdownload.html
U.S. Bureau of Census. 1998–2006. Population estimates program.
http://www.census.gov/popest/estimates.php
U.S. Bureau of Census. 2001. Gazetteer of counties: Year 2000.
http://www.census.gov/geo/www/gazetteer/places2k.html.
U. S. Department of Agriculture, Food and Nutrition Service. 1998-2006. Federal Outlays in
Supplemental Assistance Nutrition Program.
U. S. Department of Agriculture, Food and Nutrition Service. 2010. SNAP-Ed factsheet.
http://www.nal.usda.gov/snap/SNAP-EdFactsheet2010.pdf
U.S. Department of Transportation. Federal Highway Administration. 1952. Highway Statistics.
U.S. Tax Foundation. Corporate Income Tax Rates: 2000-2011.
http://www.taxfoundation.org/taxdata/show/230.html. (accessed 06/01/2011).
Variyam, J.N., Blaylock, J., Lin, B.-H., Ralston, K., and D. Smallwood. 1999. Mother’s
nutrition knowledge and children’s dietary intake. American Journal of Agricultural
Economics 81(5): 373-384.
Wal-Mart Inc. 1998-2006. Shareholders’ Annual Reports. www.walmartstores.com
White, Martin. 2007. Food access and obesity. Obesity Reviews 8(1): 99-107.
Wooldridge J.M. 2002. Econometric Analysis of Cross Section and Panel Data. Cambridge,
MA: MIT Press.

Bonanno and Goetz / International Food and Agribusiness Management Review / Volume 15, Issue 4, 2012
2012 International Food and Agribusiness Management Association (IFAMA). All rights reserved.
26
Appendix 1: A Brief Illustration of the Geometric Lag Model
The following illustration of the geometric lag model follows the discussion in Greene (2003),
chapter 19. Note that Greene discusses two versions of the geometric distributed lag model: the
model used here is similar to the “partial adjustment” model.
Let the covariates impacting eating habits be X, and j be their subscript. The process generating
eating habits in area i at time t (t = 1,…, T ) is 0 ( )
1 0
5 ; 0 1J
k
it j ji t k FVit
j k
FV X e
where k is a weight given to the past values of the explanatory variables, and eFVti contains an
autoregressive component or eFVit = λeFVit-1 + εFVit , while εFVit is a mean 0 normally distributed
disturbance. Subtracting λFV5it-1 from both sides of the equation and noting that
1 0 ( 1 ) 1
1 0
5J T
k
it j ji t k FVit
j k
FV X e
one has
15 5it itFV FV 0 0 1
1
J
j jit FVit FVit
j
X e e
. Defining '
0 0 0 gives
'
0 1
1
5 5J
it it j jit FVit
j
FV FV X
which resembles equation (2).
Appendix 2. Moment Conditions
Following the notation in the “Empirical Methods” section, let’s define vectors containing al the
exogenous variables in equation 1 and 3, respectively as
5 [ , , , , , , ]FVX NEd OH SD WMSC REG T En (where WMSC is the per-capita instrumented
number of Wal-Mart Supercenters) and [ , , , ]Ob Ob
OBIX OH SD REG T .
Let the exogenous variables used to capture supply-side variation in the determinant of food
stores location in equation 1 and 3 be ZFA. The moment condition to be satisfied in equation 1
and 3, respectively, are 5 5([ , ]' ) 0FV FA FVE X Z and 5 5([ 5, , ]' ) 0FV FA FVE LFV X Z , where
5LFV is the instrumented lag of FV5, while the moment condition that need to hold in equation
2 and 4, respectively, are
([ , , , ]' ) 0 and ([ , , 5, , , ]' ) 0ObI ObI ObI ObIE X NEd WMSC En E X LObI LFV NEd WMSC En

2012 International Food and Agribusiness Management Association (IFAMA). All rights reserved
27
International Food and Agribusiness Management Review
Volume 15, Issue 4, 2012
Sustained Competitive Advantage in Agribusiness:
Applying the Resource-Based Theory to Human Resources
Amin W. Mugera
Institute of Agriculture & School of Agriculture and Resource Economics, University of Western Australia,
35 Stirling Highway, Crawley, Western Australia 6009
Abstract
Employees are a strategic resource for agribusiness firms to achieve sustained competitive
advantage (SCA). The resource-based theory (RBT) has emerged as a useful framework to
analyze the significance of the human resource system in achieving SCA. However, few
empirical studies in agribusiness provide evidence of a relationship between human resource
system and SCA. This paper builds off our 2005 case study exploring human resource manage-
ment and sustained competitive advantage. It provides an in depth review of the RBT and
develops a framework by which agribusiness scholars might operationalize the RBT for both
applied research and guidance for managers.
Keywords: human resource management, resource-based view, agribusiness, sustained
competitive advantage
Corresponding author: Tel: +61.8.6488.3427
Email: [email protected]
+The IFAMR is a non-profit publication. The additional support provided from this issue advertiser, Novus
International helps us remain open access and dedicated to serving management, scholars, and policy makers
worldwide.
Click here to view
authors’ intro video

Mugera / International Food and Agribusiness Management Review / Volume 15, Issue 4, 2012
2012 International Food and Agribusiness Management Association (IFAMA). All rights reserved.
28
Introduction
The Resource-based theory (RBT) of the firm has been around for over two decades and has
emerged to be a dominant management theory in explaining firm performance differentials. The
theory holds that the internal resources that a firm controls have the potential to be a source of
sustained competitive advantage (SCA) if the resources are valuable, rare, inimitable, and
nonsubstitutable (VRIN). The theory serves as a major theoretical foundation in the management
scholarly literature and prominently features in most text books in strategic management.
Although the core message of the RBT is simple, and easy to grasp and teach, the application of
this message in agribusiness has been slow. With the exception of Mugera and Bistch (2005),
Gall and Shroeder (2006), Ng and Goldsmith (2010), there is little empirical application of the
theory in agribusiness scholarship.
Why has the theory not been widely used in agribusiness scholarship? What is the importance of
empirically testing the theory in the agribusiness environment? How can the test be done? What
is the implication of the theory for management practice and research? Those important
questions need to be addressed if the theory will find wide application in agribusiness.
The purpose of this paper is to review the literature on the RBT and its application to support
SCA, with a focus on agribusiness labor management. The paper proposes the RBT as a potential
theoretical framework to guide human resource management (HRM) practice and research in
agribusiness. Therefore, through the review of a case study, we illustrate how HRM practices fit
the RBT basic tenets and propose a conceptual framework to empirically test the RBT in the
agribusiness environment. Indeed, empirical studies in non-agricultural oriented industries
suggest that there is a close relationship between the employment of HRM instruments shaped
according to the RBT and HRM efficiency (Wright et al. 1999). A key question is how to
quantify whether the HRM practices shaped according to the RBT can contribute to SCA in
agribusiness.
This paper contributes to advancing the discipline of agribusiness management by suggesting a
managerial explanation for agribusiness firm behavior. As noted by Ng and Siebert (2009), the
problem facing the advancement of agribusiness management is how to develop its research
identity by placing greater attention to “strategic management” explanations of the firm rather
than economics.
The remainder of this paper is structured as follows: first, the fundamental tenets and recent
advances of the RBT are presented; second, a case study is used to illustrate the application of
the RBT to analyze HRM issues in agribusiness and, third, the evidence from the case study is
used to illustrate how the RBT framework can be extended and operationalized to guide future
research and management practice in agribusiness..
Sustained Competitive Advantage in Agribusiness
The agribusiness sector is facing competitive challenges mainly from innovations in technology
and information systems, and changes in demography, global economies and climate. Meeting
those challenges is the single most important factor for achieving sustained competitive
advantage (SCA). Agribusiness firms can respond to those challenges either through changes in
managerial capabilities using human resource (HR) programs or through technical capabilities

Mugera / International Food and Agribusiness Management Review / Volume 15, Issue 4, 2012
2012 International Food and Agribusiness Management Association (IFAMA). All rights reserved.
29
using technology (Chacko et al. 1997). However, as observed by Pfeffer (1994), there is an
economic trade-off between human and capital resources. It is the management of human
resources rather than the reliance of advanced technology or patents or strategic position that
help firms achieve SCA. Becker (2001) buttressed the strategic importance of human resources
to the economic success of agribusiness firms by noting that:
“In most industries, it is now possible to buy on the international marketplace machinery
and equipment that is comparable to that in place by the leading global firms. Access to
machinery and equipment is not the differentiating factor. Ability to use it effectively is. A
company that lost all its equipment but kept the skills and knowhow of its workforce could
be back in business relatively quickly. A company that lost its workforce, while keeping its
equipment, would never recover.” (Becker et al. 2001, 6)
Given recent trends in the global food and agribusiness sector, agribusiness competitiveness has
become a topic of much interest in both the popular press and academic literature. The economic
performances of agribusiness firms is projected to continue to increasingly dependent upon
management and returns to management rather than ownership of assets and the capital earnings
of these assets. This will mainly be through the adoption and use of new and innovative
programs and practices in the management of HR and technology.
The focus of this paper is on labor management in large and corporate farms, hereafter-human
resource management. Over the last two decades, labor use in the agriculture of North America
and Australia has been affected by changes in the composition of agricultural labor and increas-
ing shortage of skilled agricultural labor. The general trend have been a decline of number of
farms, an increase of average farm sizes, and a general shortage of sufficient and skilled work-
force (Productivity Commission 2005, DEST 2006, NASS 2002). This trend is attributable to a
number of factors that include increase in the productivity of rural labour, overall increase in the
volume of rural output, and compositional changes in rural output, with a growth in relatively
labour intensive industries (Garnett and Lewis 2002). The combination of declining farm num-
bers, increasing size of operations and less family members returning to farms has meant a de-
mand for employed labor with different skills.
As farms grow beyond the labor capacity of the immediate families, human resources
management (HRM) becomes an important management function and practices developed for
large non-agricultural corporations often may not fit the agricultural or agribusiness environment
(Bitsch 2009). Therefore, HRM as a managerial function plays an important role in agriculture,
particularly in the management of agribusiness organizations and large commercial farms.
Traditionally, the HRM function has been viewed as the process of attracting, keeping and
motivating employees.
The typical characteristic of most successful corporate organizations is a SCA that results from
the configuration of their strategic assets to outperform their competitors. Sustaining competitive
advantage is very crucial as competing firms will try to imitate, reach, and even outperform their
rivals by acquiring similar or better resources that they perceive to be enabling their rivals
outperform them.
Human resources are one of the crucial strategic assets in agribusiness and production
agriculture. Farm and ranch owners, their family members and cooperating neighbors provide

Mugera / International Food and Agribusiness Management Review / Volume 15, Issue 4, 2012
2012 International Food and Agribusiness Management Association (IFAMA). All rights reserved.
30
substantial labor to agricultural operations. However, hired employees provide most agricultural
labor especially in the labor-intensive tasks that are not easy to mechanize such as fruit picking
and pruning. Attracting, motivating, and retaining qualified employees are some of they key
challenges faced by agribusiness organizations. Equally, agribusiness managers face the
challenge of managing their employees in an effective and efficient manner to remain
competitive in the marketplace. This calls for an understanding of how to model the HRM
function to be a prime source of SCA and key driver of value creation. However, agribusiness
managers have little research-based information to rely on when developing HRM policies and
procedures. As noted by Bitsch (2009), this is partly because research on HRM practices in
agribusiness has not received significant attention in the agribusiness literature due limited
research funding, rare peer reviewed articles, and because many editors do not perceive HRM as
a priority.
The resource-based theory (RBT) has received considerable attention in the strategic manage-
ment literature as a useful framework to analyze the significance of human resources (HR) in
achieving SCA. The view posits that firms with a well-managed HR system have the potential to
create economic value through their employees, but the potential is only realized when the HRM
functions is aligned with the overall competitive strategy of a firm (Barney 2001). However, as
noted by Bitsch (2009), there are few labor management studies in agribusiness that have been
able to provide evidence of a substantial relationship between any particular HRM practice and
productivity or competitive advantage. Yet, it has been observed that technological management
programs are less influential in assisting firms to achieve their competitiveness goals than HRM
programs (Chacko et al. 1997).
Resource-Based Theory: Literature Review
Literature in strategic management presents two theoretical perspectives in explaining sources of
competitive advantage (CA): The Porter’s five forces perspective and the resources-based theory
(RBT) perspective (Kim and Oh 2003). The first perspective views CA as a position of superior
performance that a firm achieves through offering cost advantages or benefit advantages (Porter,
1980, 1981). This model attributes CA to the external environmental factors that a firm must
respond to such as erecting barriers of entry to competitors, product differentiation, capital
requirements, and buyer switching costs (Lado et al. 1992).
The second model of CA is the resource-based theory (RBT). The model assumes that the
desired outcome of managerial effort within the firm is SCA that allows the firm to earn returns
that are above industry average (Fahy and Smithee 1999). This model view SCA as emanating
from the distinctive resources of a firm that gives it an edge over its rivals. An organization is
viewed as a bundle of specialized resources that are deployed to create a privileged market
position (Barney 1986a, Ghemawat 1986, Day and Wensley 1988). Therefore, the RBT
emphasizes strategic choices where managers of a firm have the important task of identifying,
developing, and deploying key resources to maximize returns (Fahy and Smithee 1999). The
theory focuses on the link between strategy and the internal resources of a firm in achieving SCA
rather than the industry-environmental focus characteristic of the traditional strategic analysis
paradigms, for example, the Porter’s “five forces model” (Wright et al. 1994).
The RBT of the firm assumes that resources (factors that a firm are owns and controls) and
capabilities (firm’s capacity to deploy resources) are both heterogeneously distributed and

Mugera / International Food and Agribusiness Management Review / Volume 15, Issue 4, 2012
2012 International Food and Agribusiness Management Association (IFAMA). All rights reserved.
31
imperfectly immobile. These assumptions allow for the existence of differences in firm resource
endowment and those differences persist over time. The theory hypothesizes that if a firm
possess and exploits resources and capabilities that are both valuable and rare, it will attain a
competitive advantage. The firm will sustain this advantage only if these resources and capabili-
ties are also inimitable and non-substitutable. Barney (1991) defines a firm’s resources to include
all assets, capabilities, organizational processes, firm attributes, information, and knowledge that
it controls and that enable it to conceive and implement strategies that improve its efficiency and
effectiveness.
Resource heterogeneity refers to the distribution of different resources across firms. Peteraf
(1993) notes that heterogeneity implies that the productive factors used in firms have intrinsical-
ly differential levels of efficiency whereby some are superior to others. Therefore, firms
endowed with superior resources are economical in production and can effectively compete in
the market compared to those without superior resources. Resource immobility refers to the
inability of competing firms to obtain resources from other firms (Wright and McMahan 1992).
This could be due to several reasons: First, when the resources property rights are not well
defined (Dierickx and Cool 1989); second, when the resources have no use outside the firm
(Williamson 1975); third, when the resources are co-specialized, that is they are used in conjunc-
tion with another or have higher economic value when employed together (Teece 1986); and
forth when the resources have high transaction costs (Williamson 1975). Since the immobile
resources are non-tradable or are of less value to other users, they remain bound to the firm and
available for use over the long run. Hence, the resources are a source of competitive advantage
to the firm (Peteraf 1993).
The assumptions of heterogeneity and immobility of resources are necessary but not sufficient
conditions for a firm’s resources to hold potential for SCA. A resource must have four other
attributes to provide SCA: 1) the resources must add value to the firm; 2) the resources must be
rare among current or potential competitors; 3), the resources must be imperfectly imitable; and
4), the resources should not be strategically substitutable with another resource by competing
firms (Barney 1991, Wright and McMahan 1992).
A firm’s resources are valuable when they enable its management to conceive or implement
strategies that improve its efficiency and effectiveness. Valuable resources enable a firm to
capitalize on its strengths to exploit the opportunities in the external environment while
neutralizing existing threats (Barney 1991, 1999). A resource is rare when a large number of
firms do not possess it. Barney (1992) urges that if a large number of firms possess a particular
valuable resource, the resource becomes a source of competitive parity and not CA or SCA.
Resources that are valuable and rare may lead to the resources being imperfectly imitable, i.e.,
not easy to obtain or copy (Lippman and Rumelt 1982, Barney 1986a, 1986b). A firm may find
it difficult to obtain a valuable and rare resource because of the cost disadvantage it faces
compared to firms that possess that resource (Barney 1992). Derricks and Cool (1989) describe
three conditions under which resources can be imperfectly imitable. First, when the ability of the
firm to obtain resources is dependent on unique historical conditions; second, when the link
between the resources and the firm’s competitive advantage is causally ambiguous; and third,
when the resource generating a firm’s competitive advantage is socially complex.

Mugera / International Food and Agribusiness Management Review / Volume 15, Issue 4, 2012
2012 International Food and Agribusiness Management Association (IFAMA). All rights reserved.
32
The first condition states that the performance of a firm not only depends on the industry
structure within which it operates but also on the historical path it followed to arrive where it is,
i.e. path dependent (Barney 1991). For example, a firm that developed significant commitment
to a particular way of doing business may find it hard to adapt to minor changes in technology.
Causal ambiguity is defined as the situation where the link between the resources controlled by a
firm and its SCA is not understood or only understood imperfectly (Lippman and Rumelt 1982,
Reed and DeFillippi 1990, Barney 1991). In this case, the relationship between a resource and
other firm-specific resources and capabilities creates uncertainty regarding the causes of
efficiency differences among firms. This prevents would-be imitators from knowing exactly
what to imitate or how to imitate it (Lado et al. 1992, Peteraf 1993). Casual ambiguity arises out
of an informational problem where a competitor is unable to identify what are the reasons behind
a given firm’s success (Fahy and Smithee 1999).
Social complexity is a complex social situation arising from human interaction and constitutes a
competitive advantage. According to Wright et al. (1994), the term refers to the fact that many
social phenomena are complex to make it possible to manage and influence them systematically.
Examples of social complexity in a firm’s resources include (1) the interpersonal relationship
among managers (Hambrick 1987), (2) organizational culture (Barney 1986b), (3) reputation
among suppliers (Porter 1980), and (4) a firm’s relationship with customers (Klein and Leffler
1981). The final requirement for a resource to be a source of SCA is non-substitutability. This
demands that a firm’s resource must not have other strategically equivalent resources. As such,
other competing firms cannot implement the same strategy because of the absence of another
strategically equivalent resource to generate the SCA (Barney 1991). Figure 1 presents a
conceptual framework for understanding the assumptions and conditions relevant for attaining
SCA as postulated by the RBT.
NC = Necessary Conditions AC= Additional Conditions SCA = Sustained Competitive Advantage NC (1) & NC (2) = SCA
Figure 1. Conceptual framework for sustained competitive advantage as postulated by the
Resource-based Theory
NECESSARY CONDITIONS (1) FOR SCA Firm resources Heterogeneous Firm resources Immobility
ADDITIONAL CONDITIONS (2) FOR SCA (1) Is the resource Valuable?
(2) Is the resource Rare?
If (1) & (2) = Is the resource, is it Costly or Difficult to Copy?
Path Dependent
Causal Ambiguity
Social Complexity
Is the resource Non-substitutable?
Sustained Competitive Advantage (SCA)

Mugera / International Food and Agribusiness Management Review / Volume 15, Issue 4, 2012
2012 International Food and Agribusiness Management Association (IFAMA). All rights reserved.
33
The RBT has emerged to be the most prominent and powerful theory of understanding organiza-
tions in the last two decades. The theory appears to have reach maturity stage; research using the
resource-based framework is now precise and sophistication, closely resembling a theory than a
view1 (Barney, Ketchen Jr, and Wright 2011). The theory has given rise to prominent spin-offs
perspectives that are yet to be tested and operationalized in the agribusiness environment.
Such spin-off perspectives include the knowledge-based view (Grant 1996), the natural-resource-
based view (Hart 1995, Hart and Dowell 2011), the dynamic capabilities view (Teece, Pisano,
and Shuen 1997), the family capital theory (Hoffman, Hoelscher, and Sorenson 2004), and the
corporate diversification view (Wan et al 2011). Insights from the RBT are already integrated
with other perspectives such as the institutional theory and strategic HRM (Wright and Snell
1991, Oliver 1997, Wright et al. 2001) and organizational ecology (Ng and Goldsmith 2010).
Hoffman, Hoelscher, and Sorenson (2004) introduced the concept of family capital and proposed
that family capital has potential to impact on business performance. Drawing from the RBT, they
suggest that family businesses with high levels of family capital possibly do hold SCA over fam-
ily businesses with low levels of family capital or nonfamily businesses. Eddleston et al. (2008)
empirical study of family firms using the RBT confirm that family firms can benefit from em-
phasizing the positive aspects of kingship and that family relationships can be a source of CA.
Hart and Dowell (2011) examine the application of the natural-resource-based view (NRBV) to
help firms incorporate environment sustainability in their quest for competitive advantage. They
provide a model of SCA that includes the constraints and challenges that the natural environment
places on firms.
Kunc and Morecroft (2008) use the RBT to present a framework that connects managerial deci-
sion making to resource building and firm performance. The authors identify two decisions mak-
ing processes: the creative conceptualization of resource configurations intended to deliver CA,
and the painstaking development of resources required to implement strategy. They argue that
heterogeneity in the resources of rival firms arise from the interplay of those two processes. Sir-
mon et al. (2011) discusses the potential of an emerging research stream, termed as resource or-
chestration, to enlighten our understanding of the role of managers’ actions in resource manage-
ment within the RBT. Makadok (2011) notes that although the RBT attributes CA as the main
source of interfirm profit differentials, additional sources of profit differentials includes rival re-
straint, information asymmetry and commitment timing. The author propose for a unified ap-
proach of investigating the relative effects of each of those four mechanisms on interfirm profit
differentials rather than examining each in isolation.
Wan et al. (2011) outlines ways to enrich the RBT perspectives on corporate diversifications by
integration of ideas from organizational economics, new institutional economics, and industrial
organization economics. Wenerfelt (2011) examines the process through which a firm can
acquire resources and argues that firms should expand their resource portfolios by building on
their existing resources. Therefore, as different firms will acquire different new resources, small
initial heterogeneities will be amplified over time. Maritan and Peteraf (2011) discuss how to
create heterogeneous resource position by resource acquisition in strategic factor markets and
internal resource accumulation.
1 The resource-based theory is also referred to as the resource-based view in the extant literature.

Mugera / International Food and Agribusiness Management Review / Volume 15, Issue 4, 2012
2012 International Food and Agribusiness Management Association (IFAMA). All rights reserved.
34
Kraaijenbrink et al. (2010) review some of the main critiques of the RBT. They identify five
critiques that do not threaten the RBV’s status and three that offer serious challenges that need to
be dealt with if the RBV is to realize its potential to explain SCA. They recommend moving the
RBV’s agenda into the dynamic Austrian framework by incorporating time, space, and
uncertainty resolutions into the RBV’s axiomatic base.
Kraaijenbrink et al. (2010) highlight the need for analysis within firm boundaries of the internal
processes of managing resources and recognition that heterogeneous human capital is a critical
underling mechanism for capabilities. Coff and Kryscynski (2011) agree that human capital
provides a promising source of CA but call for stronger micro-foundations for understanding
human capital-based CA. They identify individual and firm level components that interact to
grant some firms unique capabilities in attracting and retaining, and motivating human capital.
Co-specialization of idiosyncratic individuals and organizational systems are identified as among
the most powerful isolating mechanisms that sustain human capital-based advantages.
Ng and Goldsmith (2010) use insights from the RBT and Organizational Ecology to explain a
firm’s entry into the ethanol market. The study demonstrates that a firm’s entry timing is
dependent on the specialization of their assets to which such specializations introduces a “com-
mitment-flexibility” trade-off that influences a firm’s entry into distinct stages of the product
market life cycle. The study provides a greater understanding of how specialized assets impact a
firm’s internal decision process. This study extends RBV explanations of entry timing by
attributing entry to both the specialized nature of a firm’s assets as well as to the uncertain and
population conditions of the market.
On methods and measurement issues within the RBT, Molloy et al. (2011) use content analysis
to identify how scholars have examined 186 intangibles in published tests of the RBT. To better
link RBT and measurement concerning intangibles, the authors present a theory driven
multidisciplinary assessment process that integrates complimentary perspectives of economics
and psychology and provides a context-specific theory of intangibles for empirical studies. All
those recent development on the RBT suggest that the potential application of the theory to the
agribusiness environment is unlimited and remain untapped.
Application of the RBT to HRM
Drawing from the RBT of the firm, literature in strategic HRM is increasingly concerned with
whether HR can be a source of CA (Reed and DeFillippi 1990, Wright and McMahan 1992,
Wright and Snell 1991, Wright et al. 1994, Kamoche 1998). Ulrich (1991), Wright et al. (1994),
Barney, and Wright (1998) used the BRT to describe how HRM practices can be used to develop
strategies that leads to CA.
Wright and McMahan (1992) and Wright et al. (1994) describe two conditions in the labor
market that make human resources a source of CA: 1) the heterogeneous demand for labor, and
2) the heterogeneous supply of labor. The authors argue that human resources add value to the
firm because of the existence of heterogeneous demand for and supply of labor. Heterogeneous
demand for labor exists because firms have jobs that require different skills. For example, the
skills needed to work on a dairy farm are different from those required to work in a greenhouse

Mugera / International Food and Agribusiness Management Review / Volume 15, Issue 4, 2012
2012 International Food and Agribusiness Management Association (IFAMA). All rights reserved.
35
operation. Heterogeneous supply of labor exists because individuals differ in their skills and
level of skills. Those two conditions ensure that human resources with high competencies
provide value to the firm. Wright et al. (1994) argues that there would be no variance in an
individual’s contribution to the firm if both the demand for and supply of labor was
homogeneous, i.e., all employees and potential employees have equal productive capacity. In
this case, there would be no need to create value through investment in employee training and
development. However, Barney and Wright (1998) note that the main goal of HR executives is
to create value through the HR function. The authors argue that a firm can create value by either
decreasing product and services costs or differentiating the product and services in a way that
allows it to charge a premium price. Richard (2000) observes that cultural diversity in human
capital can serve as a source of CA because it creates value that is both difficult to imitate and
rare.
Wright et al. (1994) used the difference in cognitive abilities of individuals to demonstrate that
human resources are rare. The authors argued that jobs require individuals to have different
skills that allow for variance in individuals contributions in organizations. Hence, since these
skills are normally distributed, human resources with high ability levels are rare. Therefore,
firms with employees of high average cognitive ability relative to their competitors will also
possess more valuable human capital resources. The ultimate goal of all selection programs is to
ensure that the organization is hiring only individuals with highest ability. Barney and Wright
(1998) use an example from a firm in a highly competitive retailing industry to demonstrate how
a firm can develop and exploit rare characteristics of its human resources to gain CA. The
retailing industry is characterized as having low skill requirements and high turnover for sales
clerks. Assuming the labor pool for sales clerk is homogenous, a firm can invest in attracting
and retaining young college-educated sales clerks who desire a career in retailing. The firm can
provide high incentive based compensation system that allows the sales persons to earn twice the
industry average in pay. In this example, the firm takes labor that is considered homogenous and
exploits its rare characteristic - those individuals who desire a career in retailing - to gain CA.
Wright et al. (1994) demonstrate how human resources meet the third criteria of a resource being
inimitable by using the concepts of unique historical conditions, causal ambiguity, and social
complexity. Human resources are inimitable when the firm has a unique history over the course
of which particular cultures and norms develop. The culture and norms may meld human
resources together to create a synergistic work culture where individuals cooperate in line with
organizational goals. Such an organizational culture rooted in its history may not be imitable.
Casual ambiguity leading to efficient production in one firm may be due to teamwork whereby it
is impossible for a rival firm to create a team with similar attributes. Social complexity may
arise out of transaction specific relationships whereby there is knowledge and trust between
employees and other business stakeholders that are hard to analyze and imitate. Barney and
Wright (1998) also point that social complex phenomenon such as an organization’s unique
history or culture that competitors cannot easily imitate. Richard (2000) agues that human
resources cannot be easily imitated because they are protected by knowledge barriers and are
socially complex because they involve a mix of talents that are elusive and hard to understand.
The fourth condition for a resource to be a source of SCA is not to have substitutes. Wright et al.
(1994) argues that human resources are one of the few firm’s resources that have the potential of

Mugera / International Food and Agribusiness Management Review / Volume 15, Issue 4, 2012
2012 International Food and Agribusiness Management Association (IFAMA). All rights reserved.
36
not becoming obsolete. Therefore, if one firm develops a technology that provides greater
productivity than what is generated by a rival firm that relies on human ability, once the latter
firm is able to purchase the new technology its human resources would again become a source of
CA. This is because technology can be purchased in the market place or become obsolete while
human resources with high cognitive ability and highly committed to the firm are valuable, rare
and cannot be imitated. Hence, human resources are non-substitutable.
Application of RBT Model to HRM in Agribusiness
Several scholars have used the RBT to conduct empirical research in strategic HRM in the
non-agricultural environment (King and Zeithaml 2001, Richard 2000, Wright et al. 1999, and
Koch and McGrath 1996, Wright et al. 1995). However, Mugera and Bitsch (2005) is the only
empirical application of the RBT to analyze HRM practices in agribusiness.
This study builds on and extends the work of Mugera and Bitsch (2005) who applied the RBT to
analyze HRM practices on six dairy farms in Michigan. Their case study employed in-depth in-
terviews with farm managers, supervisory, and non-supervisory employees in order to illustrate
an application of RBT in agribusiness.
The purpose of their 2005 study was to illuminate how the HRM practices of dairy farmers con-
tribute to making human resources and resulting HRM systems valuable, rare, imperfectly imita-
ble, and non-substitutable (Table 1 see Appendix). These are the attributes that contribute to
farm competitiveness as postulated by the RBT.
The fundamental purpose of the RBT is to explain how a firm can deploy its internal resources to
implement its business strategy. The mission statement defines the strategic intent of the firm
and the operational goals stipulate how the firm expects to achieve its mission. To achieve CA,
the mission statement and operational goals provide a road map to dairy farm managers on how
to deploy, develop, and manage their human resources. Two cases had written mission state-
ments. Three other cases did not have written mission statements but the respondents could ver-
bally define the future direction of their farm enterprises. The statements focused on three main
issues: increasing profitability, milk quality, employee job satisfaction. The long-term goals re-
vealed that the two main strategies for the dairy farm enterprises is either expansion by increas-
ing herd size and milk production or maintaining the farm at current size. Maintaining a sound
financial position by reducing operational costs was a common theme across the six cases. The
short-term goals of the farms focused on achieving efficiency in dairy management by keeping
the cows healthy, producing premium milk and improving reproduction. Employees identified
explicit goals that are measurable and specific as important yardsticks for value creation.
Managers of dairy farms can create value by either decreasing operational costs or increasing
revenue and employees play a major role in achieving these goals. Employees contributed to this
goal by taking measures to ensure a low somatic cell count. Employees also contributed to
creating value by striving to achieve other goals such as heat detection, successful insemination,
and a low calf mortality rate. Managers recognized the importance of employees in creating val-
ue by providing incentives to motivate them to achieve those goals. Rather than hire new em-
ployees formally, managers mostly relied on their current employees to recommend job seekers
and provide the scarce information about the individuals’ work ethics. Employees, therefore,

Mugera / International Food and Agribusiness Management Review / Volume 15, Issue 4, 2012
2012 International Food and Agribusiness Management Association (IFAMA). All rights reserved.
37
create value to the farms by providing important information that enables managers to overcome
the problem of adverse selection and hiring of low quality employees. This reduces the cost of
recruiting through advertisement or through farm labor contactors, hence reduction in operational
costs. In all six cases, newly hired employees were trained on how to perform different tasks
related to their jobs by working alongside incumbent experienced employees. Incumbent
employees, therefore, create value to their farms by training newly hired employees and passing
on their knowledge about the farm’s routines and culture.
The RBT posits that a resource must be rare to be a source of CA. Despite the large pool of job
seekers in the labor market, dairy farmers reported difficulties in recruiting employees with the
requisite skills and dairy husbandly knowledge. Farmers who had made the transition from hir-
ing local employees to immigrant employees skilled in dairy husbandly did not want to revert to
the local workforce. Managers in five cases practiced selective hiring to ensure that only indi-
viduals who are can work in teams and have the aptitude to learn and work on a dairy farm were
hired. Managers also reported variance in individual performance with some individuals consist-
ently outperforming others. Managers strive to retain such employees even when there were
good grounds for termination. This evidence supported the notion that skilled and knowledgeable
employees who like working on a dairy farm environment are a rare resource.
Resources are immobile when they cannot be transferred easily from one farm to another. Im-
mobility may arise out of social complexity, causal ambiguity, path dependency, or a combina-
tion of all those factors. Internal hiring deterred the transfer of specific skills and knowledge de-
veloped on one farm to another. For example, three farms trained their employees on specific
milking routines that are not practiced by other dairies. Routines practiced on a particular farm
are also path dependent. A farm that has been committed to particular standard operating proce-
dures may find it difficult to adapt to new ways of performing the same tasks. Routines result in
immobility of knowledge and skills because they are a result of cumulative experience and prac-
tice. Execution of a routine also depends on the given context, i.e., the physical equipment and
work environment that facilitates and nurtures collective action.
Well-trained and experienced employees had higher replacement costs because they supply ser-
vices that cannot be immediately provided by newly hired employees. Managers strived to retain
those employees by offering job security, higher compensation, and good interpersonal relation-
ships that minimized their mobility. Two herdsmen, for example, reported that they would not
take alternative employment offers because of close interpersonal working relationships with
their managers. The herdsmen were not sure whether they would have such working relation-
ships in alternative employment offers.
Path dependency, social complexity, and causal ambiguity contributed to farms developing dis-
tinct human resource systems that were not imitable. Managers selected and hired non-
supervisory employees based on their kinship and friendship ties with current employees because
they wanted to have employees who can effectively work together in teams. Employee turnover
and termination were reported to be low in five cases where selection was based on kinship and
friendship ties; turnover and termination was high in the case where the manager hired walk-ins
who had no ties with incumbent employees. In two cases, employees used peer pressure to
compel their coworkers who are not able to meet performance expectations or who did not fit
into their working culture to quit.

Mugera / International Food and Agribusiness Management Review / Volume 15, Issue 4, 2012
2012 International Food and Agribusiness Management Association (IFAMA). All rights reserved.
38
Causal ambiguity describes the inability of competitors to identify and imitate the sources of a
firm’s CA. For example, a large farm provided higher wages, more benefits and training
opportunities to employees compared to a smaller farm. Yet, employees on both farms reported
to be satisfied with their current employment. Therefore, employee satisfaction was a source of
causal ambiguity. The history of a farm influenced its ability to achieve CA through its human
resource system. For example, one manager mentioned that family values and beliefs deter-
mined the farm’s organizational culture. Family employees trusted each other and subsequently
trusted their hired employees. This evidence suggests that family capital can be a source of CA.
Milking is done in shifts and employees work in teams. When employees are able to achieve the
set operational goals like low somatic cell count or increased milk production, it is not possible
to determine or separate the contribution of each individual in the team. Therefore, high
productivity arising from teamwork production is a potential source of causal ambiguity because
it is not easy to relate superior performance to an individual’s effort. The manager cannot isolate
and reward the individual nor can the competitors hire out the individual responsible for the high
performance.
Employees on dairy farms are non-substitutable resources. All cases hired year-round fulltime
employees because dairy farming could not be fully automated. Even on highly mechanized
farms, human resources were needed, for example, to monitor the herd health, administer
treatment, and assist calving cows. Current technology and machinery will becomes obsolete
over time but human resources that are constantly educated and retrained retain their value.
Dairy farm automation may results in increasing the number of cows per employee but does not
entirely replace the need for human resources. For example, the organizational culture and
interpersonal work relationships that are based on kinship and friendship ties on each farm
cannot be easily substituted.
Across case comparisons of the labor management practices indicated that each case had a
distinct human resource system emanating from its organizational culture, kinship and friendship
ties, resource endowment, and HRM practices. Organizational outcomes, such as voluntary
turnover and termination rates, employee satisfaction, and manager satisfaction did not stem
from single or isolated HRM practices. Therefore, in each case, the manager had the potential to
develop his or her own unique human resource system as a source of SCA. Such a human
resource system is not something that can be purchased from the labor market. Overall, the man-
agers recognized the importance of hired labor to the success of their farm enterprises and three
managers considered losing their employees due to voluntary turnover as their worst-case
scenario in HRM.
The empirical results from the six case studies lend support to the claim that dairy farm managers
can manage their human resources effectively and efficiently to achieve CA. Human resources
and the emanating human resource systems on dairy farms have the potential of being valuable,
rare, inimitable, and non-substitutable if effectively managed2.
2 The leadership style of the farm manager is equally important in managing resources to achieve CA. The manager
who applies good leadership styles can enhance the potential of his HR system to be a source of competitive ad-
vantage. The philosophy and personality (“emotional intelligence”) of a manager can indirectly lead to CA by influ-
encing the leadership capability necessary for implementing effective strategic change.

Mugera / International Food and Agribusiness Management Review / Volume 15, Issue 4, 2012
2012 International Food and Agribusiness Management Association (IFAMA). All rights reserved.
39
Empirical Test of the RBT in the Agribusiness Environment
The RBT was a useful theoretical framework for understanding how human resources in the six
dairy cases can be a SCA, and the role of the HRM function in this process. To gain better
understating on how to achieve SCA through HR, there is need for future empirical research to
narrow the gap between the theoretical utility and the practical utility of the RBT by
operationalizing the theory in the agribusiness environment. Levitas and Chi (2002) and Rouse
and Daellenbach (2002) both state that RBT can be validated empirically without having to
operationalize all its key constructs.
The model depicted in Figure 2 provides a conceptual framework of how different HRM
practices from the case study relate to the four key assumptions of the RBT. The model also
draws from the work of several authors on the RBT (Barney 1991, Wright et al. 1994 and Wright
et al. 2001) to demonstrate that SCA does not emanate from isolated HRM practices, like
compensation and training. It emanates from the integration of HR practices, managerial
function, and employee behaviors into an HR system that is a strategic partner to the overall
competitive strategy of an organization.
Figure 2. A proposed conceptual framework for investigating the relationship between HR
systems and firm performance grounded on the RBT.
Note. Black boxes represent HRM practices, blue boxes represent the necessary and sufficient conditions for the
RBT to hold, and dashed boxes represent firm outcomes. Dotted arrows represent the relationship between HRM
practices and RBTconstructs, dashed arrows represent the relationships between HRM practices and outcomes, and
solid arrows indicate the linkage of the RBT constructs and firm outcomes.

Mugera / International Food and Agribusiness Management Review / Volume 15, Issue 4, 2012
2012 International Food and Agribusiness Management Association (IFAMA). All rights reserved.
40
The dotted arrows from the boxes with HRM practices indicate how the practice relates to the
four key assumptions of the RBT. For example, the arrow extending from compensation to add
positive value indicates that managers can use compensation to add value to the farm, say by
providing performance based incentives. The arrow extending from compensation to path
dependency indicates that the compensation system of a firm is path dependent. Solid arrows
that link path dependency, causal ambiguity, and social complexity indicate that those three
factors lead to a resource being imperfectly inimitable. Likewise, solid arrows linking to
immobility indicate the factors that contribute to a resource being immobile.
The dotted arrows linking add value and rare to heterogeneity indicate that the assumptions of a
resource being valuable and rare contribute to the resource being heterogeneous (Barney 1991,
Lado and Wilson 1994). The dotted arrow linking imperfect inimitability to immobile indicates
that meeting the conditions of not being easy to imitate also contributes to a resource not being
easy to transfer from one case to another. Therefore, to empirically test the relationship between
the HRM function and the performance of a farm based on the RBT, one needs only to test
whether human resources meets the four key assumptions of being valuable, rare, imperfectly
inimitable and having no strategic substitute.
The dashed arrows from compensation, training and development, recruitment, and selection
indicate that those four practices have an effect on termination and voluntary turnover.
Termination and turnover together with the direct effect of training and development eventually
affect the mobility or immobility of human resources. The solid lines indicate the conditions
postulated by the RBT for a resource to generate competitive advantage.
Before testing the theory one needs to operationalize the key criteria that human resources and
the HR system have to meet to fulfill the RBT assumptions of a resource being valuable, rare,
inimitable and non-substitutable. This can be achieved by designing a structured questionnaire
that focuses on the HRM practices and organizational culture. Those practices would include
recruitment and selection criteria, training and development, compensation, and termination. The
questionnaire would also include aspects of strategic planning like mission and goal setting.
Collected data could be analyzed using the principal component analysis (PCA) method to ex-
tract the main factors that relate to the RBT. Principal component analysis explains the variance
structure of a matrix of data through linear combinations of variables. Hence, the data can be re-
duced to a few principal components that generally describe 80 to 90% of the variance for each
construct. The extracted factors can be used as proxies for the four RBT constructs.
To explore the relationship between the four factors and firm performance, truncated and ordi-
nary least square regression models can be used. Sustained competitive advantage can be meas-
ured by benchmarking the performance of a farm relative to other farms in the same industry.
Return on assets, technical efficiency, and allocative efficiency can be used to measure the per-
formance of firms. Technical efficiency refers to the ability of a firm to obtain maximum output
from a given set of inputs with reference to a production function. Allocative efficiency
measures the ability of a firm to use inputs and outputs in optimal proportions, given prevailing
market prices. Those two measures can be combined to provide the measurement of total eco-
nomic efficiency. The efficiency scores can be computed from output and inputs data using the

Mugera / International Food and Agribusiness Management Review / Volume 15, Issue 4, 2012
2012 International Food and Agribusiness Management Association (IFAMA). All rights reserved.
41
econometric approach (i.e., stochastic frontiers) or mathematical programming approach (i.e.,
data envelopment analysis).
The dependent variables in the analysis would be measures of technical efficiency, allocative ef-
ficiency and return on assets. The extracted factors from PCA would be the explanatory variables
in the following regression equations:
(1) Technical efficiency = α + β1Value + β2Rareness + β3Inimitability + β4Non-substutable + ε
(2) Allocative efficiency = α + β1Value + β2Rareness + β3Inimitability + β4Non-substutable + ε
(3) Return on Assets = α + β1Value + β2Rareness + β3Inimitability + β4Non-substutable + ε
The suggested framework would answer the question of why the performance of agribusiness
firms differ by extending production economics to explain how HRM practices impacts on a
firm’s SCA. For instance, the computation of allocative efficiency is important in determining
the optimal mix of inputs and outputs given prevailing market prices. Although the proposed
framework can be implemented in a cross-sectional setting, use of a longitudinal setting would
be more appropriate as the dynamic relationship between the RBT key constructs and firms’’
performance can be observed over time. Dummy variables can be included in the three equations
to control for unobserved heterogeneity across firms, for example, farm size and recent history of
major change such as expansion. Equations 1 and 2 can be estimated using truncated regression
while equation 3 can be estimated using ordinary least square.
Conclusion
This paper has provided a comprehensive review of the Resource-based theory as a framework to
formulate HRM strategies to achieve SCA. Drawing from the fundamental tenets of the theory,
a review of empirical studies in strategic HRM served to illustrate how the concept can be
applied in agribusiness. A case study in agribusiness was used to illustrate how the different
HRM functions fit to the theory. Given that this type of study is still in the explorative stage, a
conceptual framework on how to empirically test the theory in agribusiness environment is
proposed. This is a good starting point for engaging both practitioners and academicians in
developing HR systems that are shaped according to the RBT tenets.
The paper demonstrated that the HRM system is a potential source of SCA for agribusiness
firms. Employees in agribusiness firms are enablers of change and can help the agribusiness
organizations to dynamically develop and achieve longer-term superior performance relative to
other firms in the same industry. However, the gap between the theoretical utility and the
practical utility of the RBT need first to be narrowed by operationalizing the theory in the
agribusiness environment.
The RBT has not been widely used in agribusiness scholarship, perhaps due to a lack of a
comprehensive review of the theory in agribusiness and challenges in operationalizing the
theory. Therefore, there is need to empirically test the theory in the agribusiness environment in
order to explain differences in the performance of agribusiness firms with the aim of identifying
factors that lead to superior performance over time such as management practices or resource

Mugera / International Food and Agribusiness Management Review / Volume 15, Issue 4, 2012
2012 International Food and Agribusiness Management Association (IFAMA). All rights reserved.
42
endowment. The necessary next step is to apply the proposed framework to a variety of
agricultural settings to evaluate its usefulness and make modifications as necessary.
The management implication of this study is that agribusiness managers can use the RBT
framework to configure how their HR system operates and identify ways in which it can be
customized to be a source of SCA. The focus should be making the HR system valuable, rare,
inimitable, and nonsubstitutable. Managers need to understand how to nurture firm
idiosyncrasies such as trust-based relationships and routines that can lead to SCA. This would
involve a shift of perspective from one that sees the HRM function as primarily administrative to
recognizing the HRM function as a key player in the overall competitive strategy of a firm.
Acknowledgements
The author would like to express sincere appreciation to the Executive and Managing Editors and
two anonymous reviewers for their suggestions to improve this article. The paper is much better
because of their suggestions.
References
Barney, J. B. 1986a. Organization Culture: Can it be a Source of Sustained Competitive
Advantage? Academy of Management Review 11: 656-665.
Barney, J. B. 1986b. Strategic Factor Market: Expectations, Luck, and Business Strategy.
Management Science 42: 1231-1241.
Barney, J. B. 1991. Firm Resources and Sustained Competitive Advantage. Journal of
Management 17: 99-120.
Barney, J. B. 1999. Looking inside for Competitive Advantage. In Strategic Human Resource
Management, edited by Jackson, S. E., and R. S. Schuler, 128-147. Oxford: Blackwell.
Barney, J. B. 2001. Is the Resource-Based "View" a Useful Perspective for Strategic
Management Research? Yes. The Academy of Management Review 26(1):41-56.
Barney, J. B. 2002. Gaining and Sustaining Competitive Advantage . 2nd ed., Prentice Hall:
Upper Saddle River, New Jersey.
Barney, J. B. and P. M. Wright. 1998. On Becoming a Strategic Partner: The Role of Human
Resource in Gaining Competitive Advantage. Human Resource Management 37(1): 31-
46.
Barney, J. B., D. J. Ketchen Jr, and M. Wright. 2011. The Future of Resource-Based Theory.
Journal of Management 37(5): 1299-1315.

Mugera / International Food and Agribusiness Management Review / Volume 15, Issue 4, 2012
2012 International Food and Agribusiness Management Association (IFAMA). All rights reserved.
43
Becker, B. E., M.A. Huselid, and D. Ulrich. 2001. The HR Scorecard: Linking People, Strategy,
and Performance. Harvard Business School Press, Boston: MA.
Bitsch, V. 2009. Personnel Management Research in Agribusiness. Paper presented at the 19th
Annual World Forum and Symposium of the International Food and Agribusiness Man-
agement Association, Budapest, Hungary, June 20-23.
Chacko, T.I., J.G.Wacker, and M.M. Asar. 1997. Technological and Human Resource Manage-
ment Practices in Addressing Perceived Competitiveness in Agribusiness Firms.
Agribusiness 13(1):93-105.
Coff, R. and D. Kryscynski. 2011. Invited Editorial: Drilling for Micro-Foundations of
Human Capital–Based Competitive Advantages. Journal of Management 37(5): 1429-
1443.
Day, R. H. and R. Wensley. 1988. Assessing Advantage: A Framework for Diagnosing
Competitive Advantage Superiority. Management Science, 51(1-20).
Department of Education, Science and Training (DEST). 2006. Industry Skill Report: Agri-Food
Industries. Australian Government.
Dierickx, I. and K. Cool. 1989. Asset Stock Accumulation and Sustainability of Competitive
Advantage. Management Science 35: 1504-1511.
Eddleston, K. A., F. W. Kellermanns, and R. Sarathy. 2008. Resource Configuration in Family
Firms: Linking Resources, Strategic Planning and Technological Opportunities to Per-
formance. Journal of Management Studies 45(1):26-50.
Fahy, S. and A. Smithee. 1999. Strategic Marketing and the Resource-based View of the Firm.
Academy of Marketing Science Review [Online] 10. (Accessed: 10/10/12).
http://www.amsreview.org/articles/fahy10-1999.pdf.
Gall, R. G. and B. Schroder. 2006. Agricultural Producer Cooperatives as Strategic Alliances.
International Food and Agribusiness Management Review 9(4):26-44.
Garnett, A. M. and P.E.T. Lewis. 2002. Estimating Farm Labour Trends in Australia. CLMR
Discussion Paper Series 02/4, Centre for Labour Market Research, The University of
Western Australia.
Ghemawat, P. 1986. Sustainable Advantage. Harvard Business Review 64(5): 53-58.
Grant, R. 1991. The Resource-based Theory of Competitive Advantage: Implications for Strate-
gy Formulation. California Management Review, (Spring): 114-135.
Grant, R. 1996. Toward a Knowledge-based Theory of the Firm. Strategic Management Journal
17:173-190.

Mugera / International Food and Agribusiness Management Review / Volume 15, Issue 4, 2012
2012 International Food and Agribusiness Management Association (IFAMA). All rights reserved.
44
Hambrick, D. 1987. Top Management Teams: Key to Strategic Success. California
Management Review 30: 88-108.
Hart, S. 1995. A Natural Resource-based View of the Firm. Academy of Management Review,
20:986-1014.
Hart, S. L. and G. Dowell. 2011. Invited Editorial: A Natural-Resource-Based View of the Firm.
Journal of Management 37(5): 1464-1479.
Hoffman, J., M. Hoelscher, and R. Sorenson. 2006. Achieving Sustainable Competitive
Advantage: A Family Capital Theory. Family Business Review 19(2):135-145.
Kamoche, K. 1998. A Critic and Proposed Reformulation of Strategic Human Resource Man-
agement. In Strategic Human Resource Management, edited by Mabey, C., G. Salaman
and J. Storey, 283-296. Thousands Oaks, CA: Sage.
Kim, B. Y., and H. Oh. 2003. An Integrated Approach to Strategic Management for the Lodging
Industry. International Journal of Hospitality and Tourism Administration 4(2): 1- 15.
King, A. W., and C. P. Zeithaml. 2001. Competencies and Firm Performance: Examining the
Causal Ambiguity Paradox. Strategic Management Journal, 22: 75-99.
Klein, B., and K. Leffler. 1981. The Role of Price in Guaranteeing Quality. Journal of Political
Economy 89: 615-641.
Koch, M. J. and R. G. McGrath. 1996. Improving Labor Productivity: Human Resource Man-
agement Policies. Strategic Management Journal 17: 335-354.
Kraaijenbrink, J., J. C. Spender, and A.J.Groen. 2010. The Resource-Based View: A Review and
Assessment of its Critiques. Journal of Management 36(1): 349-372.
Kunc, M. H., and J.D.W. Morecroft. 2010. Managerial Decisions Making and Firm Performance
under a Resource-based Paradigm. Strategic Management Journal 31:1164-1182.
Lado, A. A., N. G. Boyd, and P. Wright. 1992. A Competency Based Model of Sustainable
Competitive Advantage: Towards a Conceptual Integration. Journal of Management
18(1): 77-91.
Lado, A. A., and M. C.Wilson. 1994. Human Resource Systems and Sustained Competitive Ad-
vantage: A Competency-Based Perspective. Academy of Management Review.19(4):
699-727.
Levitas, E., and T. Chi. 2002. Rethinking Rouse and Dallenbach’s Rethinking: Isolating vs.
Testing for the Sources of Sustainable Competitive Advantage. Strategic Management
Journal 23(10): 957-962.

Mugera / International Food and Agribusiness Management Review / Volume 15, Issue 4, 2012
2012 International Food and Agribusiness Management Association (IFAMA). All rights reserved.
45
Lippman, S. and R. Rumelt. 1982. Uncertain Imitability: An Analysis of Interfirm Differences
in Efficiency under Competition. Bell Journal of Economics 13: 418-438.
Makadok, R. 2011. Invited Editorial: The Four Theories of Profit and Their Joint Effects.
Journal of Management 37(5): 1316-1334.
Maritan, C. A. and M. A. Peteraf. 2011. .Invited Editorial: Building a Bridge between Resource
Acquisition and Resource Accumulation. Journal of Management 37(5): 1374-1389.
Molloy, J., C. Chadwick, R. Ployhart, and S. Golden. 2011. .Making Intangibles .Tangible: A
Multidisciplinary Critique and Validation Framework. Journal of Management 37:1496-
1518.
Mugera, A. W., and V. Bitsch. 2005. Labor on Dairy Farms: A Resource-based Perspective with
Evidence from Case Studies. International Food and Agribusiness Management Review
8(3):79-98.
NASS (National Agricultural Statistics Service). 2002 Census of Agriculture, Washington DC,
http://www.agcensus.usda.gov/Publications/2002/index.php (accessed October 10, 2012).
Ng, D. and J.W. Siebert. 2009. Toward Better Defining the Field of Agribusiness Management.
International Food and Agribusiness Management Review 12(4):123-142.
Ng, D. and P. D. Goldsmith. 2010. Bio Energy Entry Timing from a Resource Based View and
Organizational Ecology Perspective. International Food and Agribusiness Management
Review 13(2):69-100.
Oliver, C. 1997. Sustainable Competitive Advantage: Combining Institutional and Resource-
based View. Strategic Management Journal 18(9): 697-713.
Peteraf, M. A. 1993. The Cornerstones of Competitive Advantage: A Resource-based View.
Strategic Management Journal 14: 179-191.
Porter, M. 1980. Competitive Strategy. Free Press: New York:
Porter, M. 1981. The Contribution of Industrial Organization to Strategic Management. Acade-
my of Management Review 6: 609-620.
Pfeffer, J. 1994. Competitive Advantage through People. Havard University Press, Boston, MA.
Productivity Commission 2005. Trends in Australian Agriculture, Research Paper, Canberra.
Reed, R. and R. DeFillipi. 1990. Causal Ambiguity, Barriers to Imitation, and Sustainable
Competitive Advantage. Academy of Management Review, 15: 88-102.

Mugera / International Food and Agribusiness Management Review / Volume 15, Issue 4, 2012
2012 International Food and Agribusiness Management Association (IFAMA). All rights reserved.
46
Richard, O. C. 2000. Racial Diversity, Business Strategy, and Firm Performance: A Resource-
based View. Academy of Management Journal 43(2): 164-177.
Rouse, M. J. and U. S. Daellenbach. 2002. More Thinking on Research Methods for the Re-
source-based Perspective. Strategic Management Journal 23(11): 963-967.
Teece, D. J. 1986. Firm Boundaries, Technological Innovation and Strategic Planning. In The
Economics of Strategic Planning, edited by Thomas, G. L, (Eds.). 187-199.
Massachusetts: Lexington Books.
Teece, D. J., G. Pisano, and A. Sheun. 1997. .Dynamic Capabilities and Strategic Management.
Strategic Management Journal 18:509-534.
Sirmon, D., M.A. Hitt, R.D. Ireland, and B. A. Gilbert. 2011. Resource Orchestration to Create
Competitive Advantages Breadth, Depth, and Life Cycle Effects. Journal of Management
37:1390-1412.
Ulrich, D. 1991. Using Human Resource for Competitive Advantage. In Making Organizations
Competitive. Kilman, R & Associates, I. K, (Eds.), 129-155. San Francisco, CA: Jossy-
Bass.
Wan, W. P., R.E. Hoskisson, J.C. Short and D.W.Yiu. 2011. Resource-Based Theory and Corpo-
rate Diversification. Journal of Management 37(5): 1335-1368.
Wernerfelt, B. 2011. The Use of Resources in Resource Acquisition. Journal of Management
37(5): 1369-1373.
Williamson, O. 1975. Markets and Hierarchies. New York: Free Press.
Wright, P. M. and G. C. McMahan. 1992. Theoretical Perspectives for Strategic Human
Resource Management. Journal of Management. 18(2): 295-320.
Wright, P. M., J. M. George, S. R. Farnsworth, and G. C. McMahan. 1993. Productivity and
Extra-Role Behavior: The Effects of Goals and Incentives on Spontaneous Helping.
Journal of Applied Psychology 78(3): 374-381.
Wright, P. M., D. L. Smart, and G. C. McMahan. 1995. Matches between Human Resources and
Strategy among NCAA Basketball Teams. Academy of Management Journal. 38(4):
1052-1074.
Wright, P. M., and S. A. Snell. 1991. Towards an Integrated View for Exploring Fit and Flexi-
bility in Strategic Human Resource Management. Human Resource Management Review
1(3): 203-225.
Wright, P. M., B. B. Dunford, and S. A. Snell. 2001. Human Resources and the Resource- based
View of the Firm. Journal of Management 27: 701-721.

Mugera / International Food and Agribusiness Management Review / Volume 15, Issue 4, 2012
2012 International Food and Agribusiness Management Association (IFAMA). All rights reserved.
47
Wright, P. M., M. C. Gary, and M. Abagail. 1994. Human Resources and Sustained Competitive
Advantage: A Resource-based Perspective. International Journal of Human Resource
Management 5(2): 301-326.
Wright, P. M., B. McCormick, W. S. Sherman, and G. C. McMahan. 1999. The Role of Human
Resource Practices in Petro-chemical Refinery Performance. International Journal of
Human Resource Management. 10(4): 551-571.

Mugera / International Food and Agribusiness Management Review / Volume 15, Issue 4, 2012
2012 International Food and Agribusiness Management Association (IFAMA). All rights reserved.
48
Ap
pen
dix
T
ab
le 1
. P
ote
nti
al S
ourc
es o
f C
om
pet
itiv
e A
dvan
tage
in t
he
Six
Cas
es

2012 International Food and Agribusiness Management Association (IFAMA). All rights reserved
49
International Food and Agribusiness Management Review
Volume 15, Issue 4, 2012
Competitiveness, Efficiency and Environmental Impact of
Protected Agriculture in Zacatecas, Mexico
Luz E. Padilla Bernal
a, Alfredo Lara-Herrera
b, Elivier Reyes-Rivas
c, and Oscar Perez-Veyna
d
a Researcher Professor, Unidad Académica de Contaduría y Administración, Universidad Autónoma de Zacatecas,
Comercio y Administración s/n, Col. Progreso, Zacatecas, Zac. C.P. 98066, Mexico
b Researcher Professor, Unidad Académica de Agronomía, Universidad Autónoma de Zacatecas, Carr. Zacatecas -
Guadalajara Km 15.5 Cieneguitas, Zac., México
c Researcher Professor, Unidad Académica de Contaduría y Administración, Universidad Autónoma de Zacatecas,
Comercio y Administración s/n, Col. Progreso, Zacatecas, Zac. C.P. 98066, Mexico
d
Researcher Professor, Unidad Académica en Estudios del Desarrollo, Universidad Autónoma de Zacatecas, Av.
Preparatoria s/n, Col. Hidráulica, Zacatecas, Zac. C.P. 98064, Mexico
Abstract
In Zacatecas, agriculture consumes 77% of the underground water; 44% of the aquifers are over
extracted. All protected agriculture production systems pump water from the aquifers for
irrigation, and 96% of the production units were constructed with government support. They also
receive support for inputs and domestic production factors. This paper analyzes the impact of
agricultural policy on protected tomato production in the state of Zacatecas, Mexico, by
examining competitive and efficient technologies and considering alternative sustainable
production practices. The Extended Policy Analysis Matrix was applied. The analysis included
four technologies under current conditions and two scenarios: a) adoption of sustainable
production practices and b) unsustainable practices, at economic and private prices. The
sustainable project paid for itself under both private and economic prices.
Keywords: greenhouses, agricultural production systems, comparative advantage Corresponding author: Tel: + 492.9223309
Email: [email protected] A. Lara-Herrera: [email protected] E. Reyes-Rivas: [email protected] O. Perez-Veyna: [email protected]
+The IFAMR is a non-profit publication. The additional support provided from this issue advertiser, Novus
International helps keep us open access and dedicated to serving management, scholars, and policy makers world-
wide.

E. Padilla Bernal et al. / International Food and Agribusiness Management Review / Volume 15, Issue 4, 2012
2012 International Food and Agribusiness Management Association (IFAMA). All rights reserved.
50
Introduction
In the state of Zacatecas, located in the north-central region of Mexico, the number of protected
agriculture production units (PU) has had accelerated growth in recent years. The mean rate of
annual growth of the cultivated area during the period 2000 to 2010 was 25% (Padilla-Bernal,
Lara-Herrera, Reyes-Rivas, and Pérez-Veyna 2011). In 2010, this area was estimated to be 277
ha, of which 90% was cultivated under tomato (SEDAGRO 2010). The area under protected ag-
riculture in Zacatecas accounts for nearly 10% of the total in Mexico (Cook 2007). Given the
growth rate of these PU, the area is now estimated to be larger.
The protected agriculture production systems, in the modality of intensive agriculture, aim to
obtain the highest yield possible, isolating the crop from natural conditions and applying artifi-
cial climate and cultural techniques to obtain maximum profitability (Castellanos and Borbón
2009, 1), implicating better use of the natural resources water and soil (Antón 2004). Technolog-
ically advanced production units require higher investment, but yields are higher and risk is low-
er (Padilla-Bernal, Rumayor, Pérez-Veyna and Reyes-Rivas 2007).
One of the main factors to which rapid expansion of protected agriculture is attributed is
government aid for construction. The authorities have considered this modality as an alternative
to contribute to regional development (GODEZAC 1999; 2005; 2011). Recently, around 96% of
the PU were granted support by the program Alianza para el Campo (SAGARPA 2006; Padilla-
Bernal et al. 2010). Furthermore, protected agriculture producers, like other farmers, have access
to other types of government aid: subsidy to diesel for agricultural use (SAGARPA 2009),
subsidy to electricity for pumping irrigation water, zero aggregated value tax (IVA) on fertiliz-
ers, pesticides and other agrochemicals, among others. Some of this support forms part of the
government Alianza para el Campo (Contigo) and Apoyos a la Comercialization (SAGARPA
2009). These programs appeared in the 1990s to help incorporate producers into the process of
trade aperture and to increase their competiveness in the face of the State’s withdrawal from
agricultural production and commercialization. The support that reduces relative prices of agro-
chemicals and diesel induces higher consumption than would be determined by an undistorted
market, resulting in false profitability. A lower relative price of agrochemicals, diesel or
irrigation water also discourages the adoption of new technologies (Ávila et al. 2005).
For irrigation, 100% of the protected agriculture production systems in Zacatecas extract under-
ground water; that is, they pump water from the aquifers. The main source of water for the
diverse activities of the region is 34 aquifers, of which 44% are over-extracted (CNA 2011).
Agriculture consumes 77% of the available underground water (CNA 2008; 2011), irrigating
more than 130 thousand hectares (INEGI 2010) with high water consumption caused by over-
irrigating and obsolete irrigation systems (OECD 2008, 7; Mojarro et al. 2010, 2-3). In Mexico,
whoever receives an underground water concession can use a given amount of water from the
aquifer free of charge, an implicit subsidy.
Over-extraction of the aquifers causes damage to the environment. Over-extraction means less
water in the future leading to greater salinization of the soil and reduction of crop yields, and
thus less sustainable production systems (OECD 2008, 7). A production system is not sustainable
if agricultural practices impose negative externalities or degrade the environment, creating a

E. Padilla Bernal et al. / International Food and Agribusiness Management Review / Volume 15, Issue 4, 2012
2012 International Food and Agribusiness Management Association (IFAMA). All rights reserved.
51
market failure. Agricultural production costs in unsustainable systems ignore negative
immediate impacts on other people or long-term degradation of this natural resource base. On the
other hand, eliminating environmental market failures contributes to the creation of sustainable
agricultural production systems. It would also contribute to sustainability if government policy
corrects negative externalities and degradation of resources (Pearson, Gotsch, and Bahri 2003,
67). Agricultural production costs in the sustainable production systems are fully accounted
because they include immediate negative external impacts on other people and expenses to offset
long-term degradation of the natural resource base.
In protected agriculture, besides the environmental problems that all agricultural practices
generate such as affecting soil quality, soil degradation and salinization, especially where water
is limited, there is the additional problem of generating residues (Stanghellini 2003; Ren 2003).
For this reason and given the accelerated increase in these production units, the government
authorities in Zacatecas are interested in having information that would lead to the creation of a
development strategy and the definition of policies oriented toward planning growth of protected
agriculture production units and creating norms that help to protect the environment.
The objective of this study was to examine the impact of agricultural policy on protected agricul-
ture tomato production systems in the state of Zacatecas, Mexico, by identifying competitive and
efficient technologies, considering alternative sustainable production practices (alternative
projects). The analysis is performed under two accounting perspectives. The first perspective
uses existing distorted private prices and the second perspective uses efficient economic prices
that recognize the true social benefit opportunity cost of using resources in protected agriculture.
Elements are provided to contribute to the formulation of policies for sustainable rural develop-
ment and strategies for increasing the value chain’s competitiveness. The following research
question is answered: What is the behavior of competitiveness and efficiency in the production
systems when they adopt sustainable production practices?
Agricultural Policy and Environmental Market Failures
Agricultural policies are government decisions that have the intention of influencing the level of
input and product price stability, public investment that affects agricultural production, costs and
incomes, and revenue allotment. Policies that impact the agricultural sector can fall into one of
the following three categories: agricultural price policies, macro-economic policies, or public
investment policies. One distorting policy is government intervention that forces market prices to
diverge from their efficient valuation. Taxes and subsidies, international trade restrictions, or
price regulations can lead to divergence from efficient valuation. Distorting policies are usually
established to promote non-efficiency objectives, such as equity or safety (Pearson, Gotsch, and
Bahri 2003).Another way to make efficient price valuations diverge is market failures. A market
failure is created when price mechanisms do not achieve competitive results or efficient prices.
The common types of market failures are monopolies, externalities, environmental degradation
and imperfections in the market of factors. Environment degradation refers to changes in
physical resources such as soil, water or air. In the case of environmental market failures in the
agricultural sector, most occur when farmers misuse use a physical resource since they do not
have to pay full costs, as is the case of irrigation water in Mexico. There are two types of
environmental market failures: environmental externalities and environmental degradation

E. Padilla Bernal et al. / International Food and Agribusiness Management Review / Volume 15, Issue 4, 2012
2012 International Food and Agribusiness Management Association (IFAMA). All rights reserved.
52
(Monke and Pearson 1989, 5; Kydd, Pearce, and Stockbridge 1997; Pearson, Gotsch, and Bahri
2003, 67). The existence of an environmental market failure provides a rationale for government
intervention to attempt to correct the divergence.
Negative environmental externalities in the agricultural sector are distinguished by involving the
use of soil and water; this is the case of water pollution from use of chemical pesticides. They
appear when the producer or consumer imposes immediate costs on other people for which they
cannot be charged. In contrast, positive externalities occur when producers or consumers
generate immediate benefits for others for which they cannot receive compensation. When
negative externalities occur, the market fails since they cannot include negative external costs for
producers that damage the environment (Baumol and Oates 1995).
Environmental degradation refers to overuse of physical resources (soil, water, air and forests)
by producers or consumers. This imposes future costs on all of the users of natural resources in-
cluding those individuals responsible for degradation of the resource base (Pearson, Gotsch and
Bahri 2003, 68). If the negative effects do not occur for many years, producers will have few in-
centives to invest in resource conservation actions for the future. When users understand the
probable impact on the future use of current resources, they may be motivated through policies
aimed to conserve resources.
Kydd, Pearce, and Stockbridge (1997, 337-338) assert that, to a certain degree, environmental
degradation associated with agricultural production can be reduced through application of con-
servation measures (Anaya 2010, 65) and improved agricultural practices. Costs associated with
these measures are borne directly by expenses incurred in the development of these practices or
indirectly through loss of productivity associated with different farming practices. In either case,
environmental costs are borne by the producer in absence of government subsidies. Kydd,
Pearce, and Stockbridge (1997) add that in most countries the cost of these market failures are
not internalized in the indicated way, but are borne by the society as a whole.
Materials and Methods
Extended Policy Analysis Matrix
The Extended Policy Analysis Matrix (EPAM) was used to examine the impact of agricultural
policy on protected agriculture production systems in Zacatecas under alternative sustainable
production practices (alternative projects). This is used to determine the impact of the policies on
competitiveness and efficiency, or comparative advantage, of the production systems in the
present and two hypothetical scenarios: a) with the adoption of resource conservation practices,
denominated sustainable, and b) with agricultural practices that generate negative externalities,
denominated unsustainable. It is also used to guide agricultural research policies and
technological change (Monke and Pearson1989; Pagiola 1991; Kydd, Pearce, and Stockbridge
1997; Pearson, Gotsch, and Bahri 2003).
It should be pointed out that internalizing costs of environmental degradation and taking into
account some benefit of alternative sustainable production practices is not an easy task. Although
the area to be studied has quite uniform climatic, topographical and physical production

E. Padilla Bernal et al. / International Food and Agribusiness Management Review / Volume 15, Issue 4, 2012
2012 International Food and Agribusiness Management Association (IFAMA). All rights reserved.
53
conditions, the quantity of required data is enormous. Where these conditions are diverse, as in
most cases, obtaining sufficient information with some degree of detail is practically and
financially impossible. Despite all this, a rough estimation that can serve to formulate policy for
some commodity can be arrived at (Kydd, Pearce, and Stockbridge 1997, 337; Pearson, Gotsch,
and Bahri 2003, 69).Thus, in the case of protected tomato production in the state of Zacatecas,
environmental impact of the production systems is incorporated through lower productivity
caused by environmental degradation attributed to overuse of underground water.
The main empirical task in the application of EPAM is determining the budgets of agricultural
production systems at private or market prices as well as economic efficiency prices. Economic
efficiency prices are those that reflect values of scarcity or that recognize the true social
opportunity cost. Moreover, prices denominated “sustainable” that are aimed to correct
environmentally related market failures were used.
The first row of EPAM is a budget that shows current revenues, costs, and profits at market
prices. The second row shows the budget of a scenario denominated “unsustainable”, also at
market prices. This registers the drop in productivity associated with environmental degradation.
The third row presents a scenario denominated “sustainable” at private prices, which considers
the costs and investment required for adoption of alternative sustainable production practices
(alternative project).
The fourth row of the matrix (Table 1) is a budget of the current situation valued at economic
efficiency prices. The fifth and sixth rows show the “unsustainable” and “sustainable” scenarios
also valuated at economic efficiency prices, considering environmental costs and their
internalization, respectively. The last three rows of the matrix, called divergences, are
determined by the difference between the first and fourth rows, between the second and fifth, and
between the third and sixth rows. These show the net impact of distorting policies and market
failures. The signs of divergences in revenues, costs and profits indicate whether the net effect of
the policy and market failures point to a subsidy or a tax, or alternatively, market failures. The
costs in EPAM are divided into two columns, one for tradable inputs and another for domestic
factors. Tradable inputs are traded or could be traded internationally. Domestic factors are the
primary factors of production: labor, capital, land, natural resources.
Applying EPAM, there is competitiveness when, under present market conditions, an individual
producer obtains profits in a production system. There is comparative advantage, or it is efficient
if, prevalent market distortions are eliminated, a production system is able to generate the highest
levels of output and income (Monke and Pearson 1989, 20).
Therefore, if πp is positive, the system generates profit under current market policies and
conditions, and it is said to be competitive. Likewise, if πe is positive, the system is capable of
generating profit valued in prices that reflect scarcity values or social opportunity costs, that is,
without subsidies or restrictions imposed by taxes, and therefore, the system is efficient. For
example, if a system receives a subsidy to inputs or pays labor at prices lower than those deter-
mined by an efficient labor market, the system can be competitive but is not efficient, or does not
have a comparative advantage. Also, λπpn and λπen registers profits or losses of the systems

E. Padilla Bernal et al. / International Food and Agribusiness Management Review / Volume 15, Issue 4, 2012
2012 International Food and Agribusiness Management Association (IFAMA). All rights reserved.
54
denominated unsustainable, while λπps and λπes does so for those with alternative projects, valued
at both market and economic efficiency prices.
Table 1. Extended Policy Analysis Matrix
Revenues
(R)
Costs
Net profit
(π) Tradable inputs
(TI)
Domestic
factors
(DF)
Private prices (current) Rp TIp DFp πp
Private prices (unsustainable) λRpu λTIpu λDFpu λπpu
Private prices (sustainable) λRps λTIps λDFps λπps
Economic prices (current) Re TIe DFe πe
Economic prices ( unsustainable) λReu λTIeu λDFeu λπeu
Economic prices (sustainable) λRes λTIes λDFes λπes
Divergences (current) Rdt TIdt DFdt πdt
Divergences (unsustainable) λRdtu λTIdtu λDFdtu λπdtu
Divergences (sustainable) λRdts λTIdts λDFdts λπdts
Source. Monke and Pearson 1989; Kydd, Pearce, and Stockbridge 1997; Pearson, Gotsch, and Bahri 2003.
To compare the production systems, which can be different in terms of the relative proportions of
inputs they use, with the data registered in EPAM, indicators of competitiveness or profitability
and efficiency or comparative advantage are obtained. The indicator of private profitability is the
private cost ratio (PCR), also called the competitiveness ratio. PCR measures the proportion of
the domestic factor cost relative to value added. Value added is the difference between the value
of output and the cost of tradable inputs.
Where DFp are domestic factors; Rp and TIp are output value and tradable inputs at private prices.
If the ratio is greater than one (PCR>1), the domestic factor cost is greater than the value added
or created wealth, and therefore, the system is not profitable: the crop is not profitable for the
producer in terms of the prices paid and prices received. If PCR<1, the system is profitable, and
earns extraordinary profits. Thus, the most profitable production systems are those with a PCR
closest to zero.
The domestic resource cost (DRC) ratio provides a measure of efficiency or level of comparative
advantage. This is a ratio similar to that of competitiveness but calculated at economic efficiency
prices, obtained with the following equation:

E. Padilla Bernal et al. / International Food and Agribusiness Management Review / Volume 15, Issue 4, 2012
2012 International Food and Agribusiness Management Association (IFAMA). All rights reserved.
55
Where Re, TIe and DFe are output value, tradable inputs and domestic factor costs at economic
efficiency prices. If DRC>1, the system does not have comparative advantage; if DRC<1, the
system has comparative advantage and is said to be economically efficient. Under the
assumption that subsidies or taxes and market distortions are eliminated, the empirical analysis
of comparative advantage determines whether, in a medium term, certain commodities produced
in different regions of the country will be competitive with equivalent products on the
international markets. The main limitation of EPAM is its inability to calculate how the
production systems expand or contract when prices change, although its structure allows
simulation of changes and evaluation of other scenarios.
Unsustainable and Sustainable (Alternative Project) Scenarios
The scenario denominated “unsustainable” considered environmental degradation from the
overuse of irrigation water, thereby impacting the productivity of production systems. This is
evaluated at both market prices and economic efficiency prices (Pearson, Gotsch, and Bahri
2003, 67-5). Multi-annual budgets were constructed assuming a 2% decrease in yields (Castella-
nos and Ojodeagua 2009, 187-04; Macías-Duarte et al. 2010, 11-9) with a 15-year time horizon.
Adjustments were made for use of day labor during harvest and packing, and an additional
investment of digging a well 14 meters deeper was considered (CNA- GODEZAC-UAZ,
2008).In contrast, the scenario denominated “sustainable” adopts sustainable production
practices (alternative project). In this scenario, constant production yields over time (15 years)
are assumed as well as less use of water by the plant, rainwater harvesting and storage in
cisterns, and use of moisture sensors are considered.
Within the EPAM structure, values in the unsustainable and sustainable scenarios are determined
by deducting revenues, costs (tradable costs and domestic factor costs) and profits represented by
λR, λTI, λDF and λπ at present value (PV), with both private and economic prices, where the sub-
indexes pn, ps, en and es, refer to valuation at private and economic prices in unsustainable and
sustainable production systems, respectively. The prefix λ means that the variable represents dis-
counted revenues, costs or profits at a given time period—for this case, 15 years. For example,
λRpu represents the present value (PV) of returns from tomato production in the unsustainable
system over 15 years. Therefore,
∑
Where r is the interest rate and n the number of years.
The divergences attributed to the adoption of alternative sustainable production practices are
calculated by the difference in profits: unsustainable system (with no project) minus sustainable
system (alternative project) (Pearson, Gotsch, and Bahri 2003, 58-4).
;
;
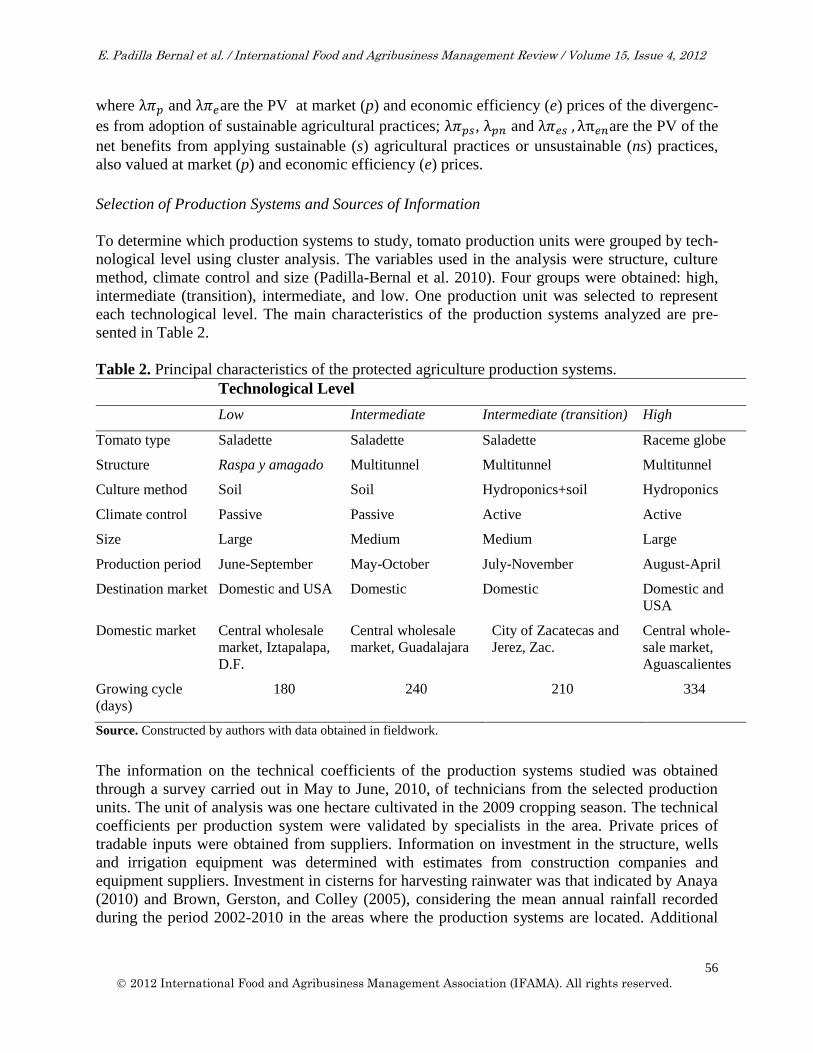
E. Padilla Bernal et al. / International Food and Agribusiness Management Review / Volume 15, Issue 4, 2012
2012 International Food and Agribusiness Management Association (IFAMA). All rights reserved.
56
where and are the PV at market (p) and economic efficiency (e) prices of the divergenc-
es from adoption of sustainable agricultural practices; , and are the PV of the
net benefits from applying sustainable (s) agricultural practices or unsustainable (ns) practices,
also valued at market (p) and economic efficiency (e) prices.
Selection of Production Systems and Sources of Information
To determine which production systems to study, tomato production units were grouped by tech-
nological level using cluster analysis. The variables used in the analysis were structure, culture
method, climate control and size (Padilla-Bernal et al. 2010). Four groups were obtained: high,
intermediate (transition), intermediate, and low. One production unit was selected to represent
each technological level. The main characteristics of the production systems analyzed are pre-
sented in Table 2.
Table 2. Principal characteristics of the protected agriculture production systems.
Technological Level
Low Intermediate Intermediate (transition) High
Tomato type Saladette Saladette Saladette Raceme globe
Structure Raspa y amagado Multitunnel Multitunnel Multitunnel
Culture method Soil Soil Hydroponics+soil Hydroponics
Climate control Passive Passive Active Active
Size Large Medium Medium Large
Production period June-September May-October July-November August-April
Destination market Domestic and USA Domestic Domestic Domestic and
USA
Domestic market Central wholesale
market, Iztapalapa,
D.F.
Central wholesale
market, Guadalajara
City of Zacatecas and
Jerez, Zac.
Central whole-
sale market,
Aguascalientes
Growing cycle
(days)
180 240 210 334
Source. Constructed by authors with data obtained in fieldwork.
The information on the technical coefficients of the production systems studied was obtained
through a survey carried out in May to June, 2010, of technicians from the selected production
units. The unit of analysis was one hectare cultivated in the 2009 cropping season. The technical
coefficients per production system were validated by specialists in the area. Private prices of
tradable inputs were obtained from suppliers. Information on investment in the structure, wells
and irrigation equipment was determined with estimates from construction companies and
equipment suppliers. Investment in cisterns for harvesting rainwater was that indicated by Anaya
(2010) and Brown, Gerston, and Colley (2005), considering the mean annual rainfall recorded
during the period 2002-2010 in the areas where the production systems are located. Additional

E. Padilla Bernal et al. / International Food and Agribusiness Management Review / Volume 15, Issue 4, 2012
2012 International Food and Agribusiness Management Association (IFAMA). All rights reserved.
57
information was collected during visits to the production units, for which an observation data
card was designed.
The private tomato price considered the market destination, domestic and/or international, and
was determined at the farm level taking into account the months the produce was traded.
Reference prices were obtained from the Sistema Nacional de Information e Integración de
Mercados (SNIIM - National System of Market Information and Integration) and the US
International Trade Commission (USITC), for domestic and international markets, respectively.
The economic efficiency price of tomato was determined as an export parity price and tradable
inputs as import parity price at the farm level. To calculate parity prices, an adjustment was made
for the overvaluation in the exchange rate of the Mexican peso relative to the US dollar. The
average annual rate of overvaluation in 2009 was 11.4% (CEFP 2010). The international refer-
ence for these inputs was the average price paid by US farmers in April of 2006, 2007 and 2008
(NASS-USDA 2009). In the case of labor, mechanized work, administrative salaries, farm
insurance, social security and land, it was assumed that the economic efficiency prices are the
same as market prices.
For short and long term credit, the economic opportunity cost of capital was considered with a
real interest rate of 10% and 12 %, respectively (Monke and Pearson, 1989), and a rate of
accumulated inflation of 3.5% (BANXICO 2010) for the year 2009. In this way, the interest rate
on nominal short term credit used in the analysis at market prices (13.91%) was adjusted to an
annual 13.92% in the economic analysis, while long term credit ascends from an annual 14.61%
to 15.99%. The nominal interest rates are those reported by the Fideicomisos Instituidos en
Relación con la Agricultura (FIRA 2009) in 2009, for short term (one year) and long term (10
years) credits to producers with yearly incomes above 1,000 times the minimum wage. The
subsidized 9 CU rate of Mex $0.42 kwh in 2009 (CFE 2007) was adjusted to its real cost, Mex
$1.50 kwh (Fernández 2009).
Results
Tables 3a, 3b and 3c summarize the revenues, costs and profits at both private and economic
efficiency prices, as well as the total divergences obtained in the current situation and the two
scenarios of the production systems studied. In all cases, profits are reported, although these are
higher at economic efficiency prices. This is attributed to the fact that the divergence obtained
between the economic price of tomato and the price on the domestic market is higher than the
divergence generated by the effect of the policy of overvaluation of the exchange rate in tradable
inputs plus the subsidies to the cost of electricity for pumping irrigation water and to the interest
rate. As expected, the highest profits occurred in the production system with advanced
technology, while the lowest occurred in those with low technology. It should be pointed out that
the latter has lower investment than the other systems and produces only during the spring-
summer growing season, and consequently, has lower annual yield.

E. Padilla Bernal et al. / International Food and Agribusiness Management Review / Volume 15, Issue 4, 2012
2012 International Food and Agribusiness Management Association (IFAMA). All rights reserved.
58
Table 3a. Extended Policy Analysis Matrix for protected tomato production systems. Current
situation (thousands of Mexican pesos/ ha).
Notes. Calculated at present value in a period of 15 years, with an interest rate of 14.61% at private prices and
15.99% at economic efficiency prices.
Table 3b. Extended Policy Analysis Matrix for protected tomato production systems. Scenario
with unsustainable practices (thousands of Mexican pesos/ha).
Notes. Calculated at present value in a period of 15 years, with an interest rate of 14.61% at private prices and
15.99% at economic efficiency prices.
Revenues
Costs Net profits
Tradable inputs Domestic factors
Low technology
Private prices 1,604 483 688 433
Economic prices 2,157 550 695 912
Divergences -554 -67 -7 -480
Intermediate technology
Private prices 2,235 648 893 694
Economic prices 3,038 737 902 1,399
Divergences -803 -89 -9 -705
Intermediate technology (in transition)
Private prices 2,437 934 960 542
Economic prices 3,999 1,113 981 1,905
Divergences -1,563 -178 -21 -1,363
Advanced technology
Private prices 7,774 2,948 2,065 2,762
Economic prices 9,203 3,507 2,104 3,592
Divergences -1,429 -560 -39 -830
Revenues
Costs Net profits
Tradable inputs Domestic factors Low technology
Private prices 8,646 2,878 4,087 1,682
Economic prices 10,966 3,069 3,864 4,033
Divergences -2,319 -191 222 -2,351
Intermediate technology
Private prices 12,058 3,866 5,305 2,887
Economic prices 15,442 4,114 5,018 6,310
Divergences -3,384 -248 287 -3,423
Intermediate technology (in transition)
Private prices 13,154 5,571 5,702 1,881
Economic prices 20,328 6,209 5,457 8,662
Divergences -7,174 -639 245 -6,781
Advanced technology
Private prices 42,063 17,573 12,280 12,210
Economic prices 46,919 19,570 11,717 15,632
Divergences -4,856 -1,997 563 -3,422

E. Padilla Bernal et al. / International Food and Agribusiness Management Review / Volume 15, Issue 4, 2012
2012 International Food and Agribusiness Management Association (IFAMA). All rights reserved.
59
Table 3c. Extended Policy Analysis Matrix for protected tomato production systems. Scenario
with sustainable production practices (thousands of Mexican pesos/ha).
Notes. Calculated at present value in a period of 15 years, with an interest rate of 14.61% at private prices and
15.99% at economic efficiency prices.
In the current situation, all the indicators of competitiveness (PCR) and efficiency or compara-
tive advantage (DRC) are below one (Table 4). These results show that with no government aid,
the production systems obtain extraordinary profits and could survive under a policy of eliminat-
ing subsidies to internal factors and distortions to the exchange rate. The lowest private cost ratio
(PCR) was found in the production system with advanced technology, which generates the high-
est return on domestic factors at private prices. In contrast, the lowest domestic resource cost
(DRC) ratio in the current situation is found in the system with intermediate technology in transi-
tion, followed by that with advanced technology.
Table 4. Indicators of competitiveness and efficiency of the protected tomato production systems
(current situation).
Source. Constructed by author with information collected during fieldwork.
The net benefit for investing in adoption of sustainable production practices determined as the
difference between the profits gained in the sustainable system (with project) and those gained in
the unsustainable system (without project)at both private and economic prices is shown in
Table 5. Despite the high investment required, in all cases NPV is positive and tends to increase
with advances in technology level.
Revenues
Costs Net profits
Tradable inputs Domestic factors Low technology
Private prices 9,557 2,832 4,100 2,624
Economic prices 12,033 3,021 3,864 5,148
Divergences -2,477 -188 236 -2,525
Intermediate technology
Private prices 13,320 3,806 5,320 4,195
Economic prices 16,946 4,050 5,015 7,880
Divergences -3,626 -245 305 -3,686
Intermediate technology (in transition)
Private prices 14,521 5,514 5,720 3,287
Economic prices 22,308 6,148 5,458 10,702
Divergences -7,786 -634 262 -7,415
Advanced technology
Private prices 46,331 17,480 12,299 16,552
Economic prices 51,337 19,470 11,707 20,160
Divergences -5,006 -1,990 592 -3,608
Technological level Competitiveness
(PCR) Economic efficiency
(DRC)
Low 0.61 0.43
Intermediate 0.56 0.39
Intermediate (transition) 0.64 0.34
High 0.43 0.37

E. Padilla Bernal et al. / International Food and Agribusiness Management Review / Volume 15, Issue 4, 2012
2012 International Food and Agribusiness Management Association (IFAMA). All rights reserved.
60
Table 5. Net present value for investing in sustainable production systems.
Technological level
Low1/
Intermediate1/
Intermediate
1/
(transition) Advanced
2/
Private prices
Investment in cistern (000/ Mex$) 170.10 210.64 210.64 3,113.19
Benefit NPV3/ (000/Mex$) 942.03 1,307.56 1,406.00 4,342.44
Economic efficiency prices
Investment in cistern (000/Mex$) 189.0 234.1 234.1 3,459.7
Benefit NPV3/ (000/Mex$) 1,115.6 1,570.1 2,039.9 4,528.8
Notes. 1. Geomembrane cistern. 2. Welded steel cistern. 3. Discounted rates used were 14.61% at private prices
and 15.99% at economic efficiency prices.
Source. Constructed by author with information collected in fieldwork and from Anaya (2010); Brown, Gerston,
and Colley (2005).
Table 6 presents the indicators of competitiveness (PCR) and economic efficiency (DRC) of the
unsustainable and sustainable scenarios. Both the private cost ratio (PCR) and the domestic
resource cost (DRC) ratio are lower in the scenario where conservation practices are used. In the
sustainable scenario, the indicators obtained are similar to those of the current situation, suggest-
ing that adopting conservation practices, besides reducing environmental degradation, helps to
maintain current competitiveness and efficiency. Given the results obtained in this study, it is
proposed that government support granted for construction of protected agriculture production
units be conditioned to adoption of sustainable production practices. Also, we suggest evaluating
other alternatives that help producers become aware of the probable impact of excessive use of
irrigation water on the future, and encouraging research in the development of agricultural
practices that conserve resources.
Table 6. Indicators of competitiveness and efficiency of the tomato production systems under
protected agriculture. Scenarios with unsustainable and sustainable production practices.
Technological level Unsustainable Sustainable Competitiveness
(PCR)
Efficiency
(DRC)
Competitiveness
(PCR)
Efficiency
(DRC)
Low 0.71 0.49 0.61 0.43
Intermediate 0.65 0.44 0.56 0.39
Intermediate (transition) 0.75 0.39 0.64 0.34
Advanced 0.50 0.43 0.43 0.37
Note. Calculated with the present value of revenue, cost and profit flows. Conclusions and Recommendations
This study was an analysis of competitiveness and economic efficiency of protected tomato
production systems in the state of Zacatecas, Mexico, considering the possibility of adopting
sustainable production practices (alternative projects). In the current situation, all the production
systems studied generated extraordinary profits for the producers. The systems are able to
compete at market prices, which include the effects of policies and market failures. Likewise, all
the technology used is economically efficient, that is, under a scheme of elimination of subsidies

E. Padilla Bernal et al. / International Food and Agribusiness Management Review / Volume 15, Issue 4, 2012
2012 International Food and Agribusiness Management Association (IFAMA). All rights reserved.
61
and taxes and market distortions; with all the tomato growing technology studied, the production
systems are able to compete at international prices.
Adopting production practices that make more efficient use of irrigation water in protected agri-
culture will help prevent environmental degradation, favor competitiveness of the producers and,
in the case of elimination of subsidies to tradable inputs and domestic factors, the production
systems will be able to remain in the market.
It is proposed that government aid for constructing protected agriculture production units be
conditioned to the use of conservation practices, under constant supervision, to prevent resources
from being diverted. Moreover, it is suggested that training be given to producers and technicians
of these systems; training should include topics that support sustainable agriculture and
contribute to create awareness of the impact over-extraction of aquifers has on the environment.
Moreover, it is recommended that research and technological processes be oriented toward
developing inputs and other products that minimize environmental deterioration.
References
Antón V., Ma. Assumpcio. 2004. Utilización del análisis del ciclo de vida en la evaluación del
impacto ambiental del cultivo bajo invernadero mediterráneo. Tesis de Doctorado. Programa
de Doctorat Enginieria Ambiental. Universitat Politécnica de Catalunya. 235 p.
Anaya-Garduño, Manuel. 2010. “Captación o cosecha de agua de lluvia diseño de sistemas de
captación del agua de lluvia.” In Instituto Nacional de Recursos Hidráulicos (INDRHI).
Aumento de la oferta hídrica. República Dominicana: INDRHI-Centro para la Gestión
Sostenible de los Recursos Hídricos en los Estados Insulares del Caribe (CEHICA).
Ávila, Sara, Carlos Muñoz, Luis Jaramillo, and Adán Martínez. 2005. Un análisis al subsidio de
la tarifa 09. Gaceta Ecológica 75: 65-76.
Banco de México. 2010. “Política monetaria e inflación”. México: Author. (accessed August
2010). http://www.banxico.org.mx/.
Brown, Chris, Jan Gerston, and Stephen Colley. 2005. The Texas manual on rainwater
harvesting, 3rd
ed. Texas Water Development Board. Austin, Texas: TWDB.
Baumol, William J. and Wallace E. Oates. 1995. The theory of environmental policy. United
States of America: Cambridge University Press.
Castellanos, Javier Z. and Carlos Borbón M. 2009. Panorama de la horticultura protegida en
México. In Castellanos, Javier Z. ed. Manual de producción de tomate en invernadero.
México: Intagri.
Castellanos, Javier Z. and J. Luis Ojodeagua. 2009. Manejo de la fertirrigación del tomate
en suelo. In Castellanos, Javier Z. ed. Manual de producción de tomate en invernadero.
México: Intagri.

E. Padilla Bernal et al. / International Food and Agribusiness Management Review / Volume 15, Issue 4, 2012
2012 International Food and Agribusiness Management Association (IFAMA). All rights reserved.
62
CEFP. 2010. México: sobre o subvaluación del peso 1980-2010. Centro de Estudios de las Fi-
nanzas Públicas. Cámara de Diputados. H. Congreso de la Unión. México: CEFP.
(accessed September 2011). http://www.cefp.gob.mx/intr/e-stadisticas/esta37.xls.
Comisión Federal de Electricidad. 2007. Ajuste a las tarifas para suministro y venta de energía
eléctrica 9-CU y 9-N. Acuerdos que autorizan o modifican tarifas. México: CFE. (acces-
sed August 2010). http://www.cfe.gob.mx/Paginas/Home.aspx.
Comisión Nacional del Agua. 2008. Estadísticas del agua en México2008. México: Secretaría de
Medio Ambiente y Recursos Naturales. México: CNA.
Comisión Nacional del Agua. GODEZAC 2004-2010. UAZ. 2008. Plan hídrico de los acuíferos
Aguanaval, Calera y Chupaderos en el estado de Zacatecas. México: CNA-GODEZAC-
UAZ.
Comisión Nacional del Agua. 2011. Disponibilidad del agua subterránea. Gobierno Federal.
SEMARNAT.CONAGUA. México: CNA. (accessed April 2011.
http://www.conagua.gob.mx/.
Cook, Roberta. 2007. El mercado dinámico de la producción de tomate fresco en el área del
TLCAN. Departamento de Agricultura y Recursos Económicos. Universidad de Califor-
nia, Davis. http://www.agecon.ucdavis.edu/aredepart/facultydocs/Cook/articles.php (ac-
cessed August 2007).
Fernández, Adrián B. 2009. Subsidios que dañan al ambiente ¿Cómo desacoplarlos? La susten-
tabilidad de las finanzas públicas en México. México: Instituto Nacional de Ecología.
(accessed August 2010).
http://www.cefp.gob.mx/foro/2009/sustentabilidad/presentaciones/ine.pdf.
Fideicomisos Instituidos en Relación con la Agricultura. 2009. Cotizaciones para cobertura de
tasa de interés para créditos refaccionarios moneda nacional. México: Banco de México-
FIRA. (accessed August 2010). http://www.fira.gob.mx/irj/portal/anonymous.
Gobierno del Estado de Zacatecas. 1999. Plan Estatal de Desarrollo 1999-2004. Zacatecas:
GODEZAC.
Gobierno del Estado de Zacatecas. 2005. Plan Estatal de Desarrollo 2005-2010.Zacatecas:
GODEZAC.
Gobierno del Estado de Zacatecas. 2011. Plan Estatal de Desarrollo 2005-2010. Zacatecas:
GODEZAC.
Instituto Nacional de Estadística Geografía e Informática. 2010. Sistema para la consulta del
anuario estadístico de Zacatecas 2010. México: INEGI. (accessed August 2010).
http://www.inegi.mx.

E. Padilla Bernal et al. / International Food and Agribusiness Management Review / Volume 15, Issue 4, 2012
2012 International Food and Agribusiness Management Association (IFAMA). All rights reserved.
63
Kydd, Jonathan, Richard Pearce, and Michael Stockbridge. 1997. The economic analysis of
commodity systems: extending the policy analysis matrix to account for environmental
effects and transaction costs. Agricultural Systems 55: 323-45.
Macías-Duarte, R., Raúl L. Grijalva-Contreras, and Fabian Robles-Contreras. 2010. Efecto de
tres volúmenes de agua en la productividad y calidad de tomate bola (Lycopersicon escu-
lentum Mill.) bajo condiciones de invernadero. BIOtecnia XII:11-9.
Monke, Eric A. and Scott R. Pearson. 1989. The Policy Analysis Matrix for Agricultural. Ithaca
and London: Cornell University Press.
Mojarro, Francisco, Carlos F. Bautista, Hector Santana, Aaron Medina, and José J. Martínez.
2010. Diagnóstico y políticas de manejo para la sostenibilidad de 6 acuíferos en el esta-
do. Informe de Investigación.Zacatecas: SAGARPA-SEDAGRO-UAZ.
NASS-USDA.Agricultural Statistics Board.2009. Agricultural prices 2008 Summary. National
Agricultural Statistics Service.United States Department of Agriculture.Pr 1-3 (09).
OECD. 2008. Desempeño Ambiental la Agricultura desde 1990. Reporte Principal, Paris,
Francia: OCDE.
Padilla-Bernal, L.E., Agustín F. Rumayor-Rodríguez, and Óscar Pérez-Veyna. 2007. La
competitividad de los invernaderos de tomate del estado de Zacatecas. In Lara-Herrera,
A. and RicardoValdez C. coords. Agricultura protegida. Zacatecas, México: Coordina-
ción de Investigación y Posgrado, UAZ.
Padilla-Bernal, L.E., Agustín F. Rumayor-Rodríguez, Oscar Pérez-Veyna, and Elivier Reyes-
Rivas. 2010. Competitiveness of Zacatecas (Mexico) protected agriculture: the fresh
tomato industry. International Food and Agribusiness Management Review 13:55-4.
Padilla-Bernal, L.E., Alfredo Lara-Herrera, Elivier Reyes-Rivas, and Oscar Pérez-Veyna. 2011.
Competitividad, eficiencia e impacto ambiental de la agricultura protegida en Zacatecas.
Informe Técnico. Zacatecas: UAZ.
Pearson, Scott, Carl Gotsch, and Sjaiful Bahri. 2003. Applications of the policy analysis matrix
in Indonesian agriculture. Indonesian Food policy Program. (accessed December 2010
http://www.stanford.edu/group/FRI/indonesia/index.html.
Pagiola, Stephano. 1991. Use of cost benefit analysis and the policy analysis matrix to examine
environmental and natural resource problems. Stanford University. Stanford, C.A.: Food
Research Institute.
Ren, X. 2003. Biodegradable plastics: a solution or a challenge? Journal of Cleaner
Production11:27-40.

E. Padilla Bernal et al. / International Food and Agribusiness Management Review / Volume 15, Issue 4, 2012
2012 International Food and Agribusiness Management Association (IFAMA). All rights reserved.
64
Secretaría de Agricultura Ganadería, Desarrollo Rural, Pesca y Alimentación. 2006. Evaluación
Alianza para el Campo 2005.Informe de Evaluación Nacional Programa de Fomento
Agrícola. México: SAGARPA.
Secretaría de Agricultura Ganadería, Desarrollo Rural, Pesca y Alimentación. 2009. Acuerdo por
el que se dan a conocer las Reglas de Operación de los Programas de la Secretaría de Ag-
ricultura, Ganadería, Desarrollo Rural, Pesca y Alimentación, que se indican. En Diario
Oficial de la Federación. México.
Secretaría de Desarrollo Agropecuario. 2010. Apoyo a construcción y equipamiento de inverna-
deros, con el Programa de Alianza para el Campo del 2000 al 2007. Subsecretaría de
Agricultura. Zacatecas: SEDAGRO.
Stanghellini, C., F.L.K. Kempkes, and P. Knies. 2003. Enhancing environmental quality in
agricultural systems. In Pardossi, A., G. Serra, and F. Tognoni. Proceedings of the
International Symposium on Managing Greenhouse Crops in Saline Environment. ISHS.
Acta Horticulturae. Pisa, Italy.

2012 International Food and Agribusiness Management Association (IFAMA). All rights reserved
65
++++
International Food and Agribusiness Management Review
Volume 15, Issue 4, 2012
The Relationship Between Information Exchange Benefits and
Performance: The Mediating Effect of Supply Chain Compliance
in the Chinese Poultry Chain
Guangqian Penga, Jacques H. Trienekens
b, S.W.F. (Onno) Omta
c, and Wensheng Wang
d
aAssistant Professor, Business Administration Department, Capital University of Economics and Business,
Flower-Town, Fengtai District, Beijing, 100070, China
bProfessor, Business Administration Department, Wageningen University,
Hollandseweg 1, Wageningen 6706 KN, The Netherlands
c Professor, Business Administration Department, Wageningen University,
Hollandseweg 1, Wageningen 6706 KN, The Netherlands
dProfessor, Agricultural Information Institute, Chinese Academy of Agricultural Sciences,
Zhongguangcun South Street 12, Beijing, 100081, China
Abstract
This paper aims to examine the relationships between information exchange benefits and
company performance, and the mediating effect of supply chain compliance on this relationship.
A sample of 165 buying companies and of 96 suppliers were analyzed by partial least square
(PLS) path modeling. Five company characteristics, including company size, company age,
company type, quality standard implemented, and administrative level of a location, were added
as control variables in the model. The paper extends our understanding on the relationships
between perceived communication benefits, supply chain compliance, performance and company
characteristics. Managerial implications are generalized for buyers and suppliers respectively.
Keywords: Inter-organizational information exchange, perceived communication benefits,
supply chain compliance, performance, company characteristics. Corresponding author: Tel: + 86.10.83952195
Email: [email protected] J.H.Trienekens: [email protected] S.W.F.Omta: [email protected] W. Wang: [email protected]
+The IFAMR is a non-profit publication. The additional support provided from this issue advertiser, Novus
International helps keep us open access and dedicated to serving management, scholars, and policy makers world-
wide.

Peng et al. / International Food and Agribusiness Management Review / Volume 15, Issue 4, 2012
2012 International Food and Agribusiness Management Association (IFAMA). All rights reserved.
66
Introduction
The theory of Supply Chain Management asserts that the way companies pursue their objectives
is to seek cooperation through supply chains (SC) ( Lee, Padmanabhan, and Whang 1997; Sahin
and Robinson 2002). Supply chain cooperation can bring with substantial benefits and
advantages for companies, and raise performance levels above those attainable in spot-market
operations (Lambert, Cooper, and Pagh 1998; Mentzer, Foggin, and Golicic 2000).
A basic enabler for tight supply chain collaboration is inter-organizational information exchange
(IOIE) (Fawcett et al. 2010). Moreover, information exchange is an essential determinant of the
successful strategic positioning of firm networks (Jarillo 1988). Information exchange is
fundamental to business as carbon is to physical life (Reinsch 2001). This stands true especially
for the food sector because of agri-product market globalization and given the specific character-
istics of perishable foods, such as shelf life constraints and food safety. However, only limited
research has been conducted on supply chain information systems in the food sector (Stock and
Boradus 2006; Storer 2006).
Although significant achievements have been made with the research on information exchange,
it is still difficult to find out from existing literature how information exchange leads to improved
performance (Storer 2005). In practice, although the competitive value of information is widely
heralded, few companies have fully harnessed information’s abilities to enhance their company
and SC performance (Fawcett et al. 2007). To narrow the gap, this study intends to re-examine
the relationship between information exchange and performance.
During literature study, we found that the literature often equated the value of information
exchange with improved company performance, thus, often examined the value of information
exchange by taking use of the constructs of performance. For example, Fawcett et al. (2007)
identified and analyzed two distinct dimensions of information sharing – connectivity and will-
ingness. And they examined the impact of both dimensions on operational performance and
competitive performance. Paulraj et al. (2008) found empirical support for the notion of inter-
organizational communication as a relational competency that enhances buyers’ and suppliers’
performance.
Differently, we assume company performance such as a firm’s profitability and competitive
performance might partly be an indirect result of information exchange. Comparatively, direct
results might be issues such as cost reductions, problem resolution, as well as delivery and
quality control. For example, it would be hard for a manager to answer a question such as “does
the communication with your main customer/supplier help to improve profitability and sale
growth rate of your company?” However, it would be less difficult for a manager to answer a
question such as “does the communication with your main customer/supplier help you to solve
problem and to control product quality?” Thus, we propose that the value of information
exchange should be operationalized in a way to measure the direct benefits that a company
obtains from information exchange. Therefore, we proposed a new construct “perceived
communication benefits” and distinguished between perceived communication benefits and
company performance.

Peng et al. / International Food and Agribusiness Management Review / Volume 15, Issue 4, 2012
2012 International Food and Agribusiness Management Association (IFAMA). All rights reserved.
67
Then, we ask what is the relationship between perceived communication benefits and
performance, and how perceived communication benefits impact on performance? As we can
imagine, there should be diverse ways that information exchange may lead to improved perfor-
mance. This study focuses on checking the mediating role of supply chain compliance on this
relationship.
Last but not the least, most prior studies focused on the perceptions of buying firms only or
suppliers only, and did not reflect the perceptions of both sides. However, as we know, buying
firms and suppliers have different functions and powers. There are questions concerning whether
both buyers and suppliers benefit from information sharing and collaboration (Nyaga, Whipple,
and Lynch 2010). And we further question whether the benefits obtained by a company from
information exchange with its suppliers and with its customers contribute to its performance
without difference. This paper is among the first attempt to reflect both sides of the ‘coin’ of
information exchange by collecting data on the focal companies’ relationships with their
suppliers and with their customers respectively.
Thus, this paper intends to empirically test the relationship between perceived communication
benefits and company performance, to explore the mediating role of supply chain compliance on
this relationship, and to unfold how communication benefits help to improve company
performance for food buyers and suppliers respectively.
The central research question is therefore: ‘what is the relationship between communication
benefits and company performance? how do communication benefits help to improve
performance?’ To answer this central research question and to achieve the desired research
objective, the following specific research questions are formulated:
RQ1. What is the relationship between perceived communication benefits and supply chain
compliance?
RQ2. What is the relationship between supply chain compliance and performance?
RQ3. With regarding to the answers to RQ1 and 2, what are the similarities or differences for
buying firms and suppliers?
As companies through a food supply chain from farm to fork often have diverse characteristics,
we have added five company characteristics as control variables in the structural model in order
to avoid potential bias and to examine the potential influence of company characteristics on the
interrelationships between perceived communication benefits, supply chain compliance and
performance. These company characteristics are: company size, company age, company type,
quality standard implemented, and administrative level of a location.
This paper focuses on the poultry supply chain in China. In the last 26 years from 1985, the share
of poultry has gradually increased in the total output of livestock products in China (Table 1).
Correspondingly, per capital possession of poultry has gradually increased also during the last
two decades (Table 2). Notably different from the highly integrated poultry chains in the West,
fragmentation and integration coexist in the Chinese poultry supply chain. Table 3 shows that

Peng et al. / International Food and Agribusiness Management Review / Volume 15, Issue 4, 2012
2012 International Food and Agribusiness Management Association (IFAMA). All rights reserved.
68
small-scale, medium-sized, and large-scale poultry farms coexist. Thus, the Chinese poultry
chain provides a new and meaningful context for the study and arouses our research interest.
Table 1. The output of poultry and other meat in selected years in China (10,000 tonnes). 1985 1995 2005 2008
Output % Output % Output % Output %
Poultry 160.2 8.3 724.3 17.8 1,344.2 19.4 1,533.7 21.1
Pork 1,654.7 85.9 2,853.5 71.0 4,555.3 65.6 4,620.5 63.5
Other meat 111.6 5.8 496.6 12.2 1,039.4 15.0 1,124.5 15.4
Total meat 1,926.5 100.0 4,074.4 1000.0 6,938.9 100.0 7,278.7 100.0 Source. China Statistical Yearbook of Animal Husbandry 2009 Table 2. Per capita possession of poultry and other meat in selected years in China (kilograms).
1990 1995 2000 2005 2008
Poultry 2.8 6.1 9.4 11.2 11.5
Pork 20.0 24.2 31.4 38.3 34.8
Total meat 25.1 34.5 47.8 59.2 54.8 Source. Chinese Yearbook of Meat 2008 Table 3. Poultry production scale for 2008 in China
Poultry production scale
(Number of poultry / year)
Number of poultry at the end
of the year (10,000 heads) Percentage of the total poultry
Below 2000 144,668.9 18.4
2000 ~ 49,999 440,699.0 55.9
50,000 ~ 499,999 132,208.7 16.8
500,000 ~ 999,999 21,804.3 2.8
More than 1,000,000 48,640.8 6.2
Total 788,022.6 100.0 Source. China Statistical Yearbook of Animal Husbandry 2009.
In the sections to follow, this paper presents our hypotheses and the research framework. Then,
based on empirical data analysis, a review of the findings is described. Afterwards, elaboration
on the conclusions and discussions follows in the penultimate section. Finally, this paper ends
with managerial and policy implications, research limitation, and future research.
Perceived Communication Benefits, Supply Chain Compliance and Performance
Perceived Communication Benefits and Supply Chain Compliance
A way companies pursue their objectives is to seek cooperation through supply chains (SC), and
a basic enabler for tight supply chain collaboration is inter-organizational information exchange
(IOIE). IOIE is looked as imperative glue that holds supply chain partners together (Mohr and
Nevin 1990, 36), is the heart (Lamming 1996), lifeblood (Stuart and McCutcheon 1996), nerve
center (Chopra and Meindl 2007), essential ingredient (Min et al. 2005), key requirement (Sheu,
Yen, and Chae 2006), and foundation (Lee and Whang 2001) of chain collaboration. It is a criti-
cal factor in promoting SC compliance among firms, and is also a generic cure for SC ailments
(Lee, Padmanabhan, and Whang 1997; Sahin and Robinson 2002). Effective and efficient

Peng et al. / International Food and Agribusiness Management Review / Volume 15, Issue 4, 2012
2012 International Food and Agribusiness Management Association (IFAMA). All rights reserved.
69
communication is vital to on-going channel relationships and successful inter-firm exchange
(Paulraj, Lado, and Chen 2008). Correspondingly, communication difficulties are a prime cause
of collaboration failures. Miscommunication could cause conflicts and misunderstanding among
SC partners (Paulraj, Lado, and Chen 2008; Cao et al. 2010). Thus, to examine the influence of
information exchange benefits on supply chain compliance, we herein propose the following
hypotheses:
H1: The level of perceived communication benefits is positively associated with the level of
supply chain compliance.
‘Perceived communication benefits’ here refers to the extent to which a company perceives
benefits directly from information exchange with its suppliers and customers. And ‘supply chain
compliance’ here refers to the extent to which a company complies with its customers’ require-
ments for logistics activities and quality control.
Supply Chain Compliance and Performance
Previous studies have revealed that customers and suppliers that comply with business partners’
requirements, for example, in the area of logistics and quality, are likely to perform better.
However, some of the findings are different or even conflicting in recent studies in the Chinese
context. Lu (2007) studied the Chinese vegetable chain, and found that vegetable companies’
compliance with buyers’ delivery requirements had positive effects on quality and price satisfac-
tion, on profitability, but not on efficiency, whereas companies’ compliance with quality
requirements had no significant effect on any of these aspects of performance. Adversely, Han
(2009) found that the association between integrated logistics management and performance was
not supported in the Chinese pork chain, but the relationship between quality management
practices and performance was supported.
We suppose these conflicting results might come from a sector effect. To scrutinize the relation-
ship between supply chain management and performance further, the present study examines the
Chinese poultry chain, and distinguishes not only different aspects of chain compliance including
logistics compliance and quality compliance, but also different aspects of performance including
customer satisfaction, external efficiency, and profitability and competitive edge. Thus, we
propose:
H2: The level of supply chain compliance of a company is positively associated with the level
of company performance.
Figure 1 presents the research conceptual framework:
Figure 1. The research conceptual framework.
Perceived Communication
Benefits
Supply Chain Compliance
Performance

Peng et al. / International Food and Agribusiness Management Review / Volume 15, Issue 4, 2012
2012 International Food and Agribusiness Management Association (IFAMA). All rights reserved.
70
Methodology
Data Collection and Study Population
The study domain is the poultry chain in the Mainland China. Given the vast geographic size of
China, this study focuses on three regions: Beijing (the capital) and Hebei province located in
Northern China; Shandong, an eastern coastal province; and Guizhou, a province located in
South-west China. Comparatively, Beijing, Hebei and Shandong represent the more developed
regions, whereas Guizhou is a less developed province.
First, to optimise the validity of the questionnaire items, valuable insights were obtained through
a series of pilot interviews, literature study and pre-test survey (Straub, Boudreau, and Gefen
2004; Churchill and Lacobucci 2010). These not only helped to construct the final structured
questionnaires, but also provided valuable information on the Chinese poultry sector and the
distribution status of poultry firms in the sampling areas.
The survey was conducted between October 2008 and June 2009. The respondent companies
were selected based on multistage cluster sampling. Although an overall list of the companies in
the poultry chains was not available, three main criteria were used to select candidate companies
in order to obtain a representative sample. These criteria include firm type (supermarket,
restaurant, trader, processor, intermediary and commercial farm), firm size (mini, small, middle,
large, and super and international), and administrative level of a location ((national and
provincial) capital city, other city, and county). Table 4 shows the locations, administrative
levels of locations and firm size of the respondent companies. Other principles employed to
select respondent companies are as follows:
1. For a supermarket or a restaurant with more than one store, the survey was conducted only
with its head store or one of its major stores. Most supermarkets have individual consumers
as their major customers, thus, we only asked them to fill in the part of the questionniare
concerning their most important suppliers. But for a few membership warehouses with
organiations as their main customers, the researcher also asked them for information about
their most important customers.
2. With regard to restuarants, though the whole population of restaurants is pretty huge, only
those restaurants providing poultry as their sole or main products were targeted in this
research. Meanwhile, the objective of this research is to examine inter-organizational
information exchange, thus, we looked for those restaurants purchasing poultry products
from organizations instead of those from individuals in wet markets.

Peng et al. / International Food and Agribusiness Management Review / Volume 15, Issue 4, 2012
2012 International Food and Agribusiness Management Association (IFAMA). All rights reserved.
71
Table 4. Locations, administrative level of a location, and firm size of the total sample:
frequency (and percentage).
Su
per
mar
ket
s
Res
taura
nts
Tra
der
s
Pro
cess
ors
Inte
rmed
iari
es
Far
ms
Oth
ersa
All
fir
ms
Location
Beijing & Hebei 9 28 15 14 11 12 2 91 (53%)
Shandong 5 2 2 4 3 3 - 19 (11%)
Guizhou 11 12 7 7 8 16 1 57 (33%)
Total 25 42 24 25 22 31 3 172 (100%)
Administrative level of the location
(Provincial)
capital city 6 35 21 11 10 11 3 97 (56%)
Other city 8 1 2 4 4 4 - 23 (13%)
County or town 11 6 1 10 8 16 - 52 (30%)
Total 25 42 24 25 22 31 3 172 (100%)
Firm sizeb
Mini 2 28 24 10 21 23 2 110 (64%)
Small 8 10 - 5 1 7 1 31 (18%)
Middle 8 2 - 5 - 1 - 17 (10%)
Large 3 2 - 2 - - - 7 (4%)
Super &
international 4 - - 3 - - - 7 (4%)
Total 25
(15%)
42
(24%)
24
(14%)
25
(15%)
22
(13%)
31
(18%)
3
(2%)
172
(100%) a‘Others’ refers to organizations of which the main activities include both scientific research and business
transaction. b
Firm size is partly based on the “National Criteria to Divide Big-, Middle-, and Small-sized Enterprises”
(National Committee of Trade and Economics of China [2003]143).
We did not try sending a post mail survey, because companies in China are not used to it. The
targeted firms were contacted mainly through informants in organizations such as Supermarket/
Restaurant Associations, Administration Offices for Industry and Commerce, and Centers for
Animal Disease Control and Prevention. These organizations provide administrative or support
services, so have close business contacts with the targeted companies. Most of the targeted
companies were willing to take part in the survey. This contributed to a response rate of
over 90%.
To minimize response bias, we have targeted top and key managers as the respondents within
each focal company. We asked each respondent to select their most important supplier and
customer, and answer the questions related to their most important supplier and customer. The
questionnaires, together with the instruction letters, were sent out by various measures according

Peng et al. / International Food and Agribusiness Management Review / Volume 15, Issue 4, 2012
2012 International Food and Agribusiness Management Association (IFAMA). All rights reserved.
72
to the preferences of the respondents. They were mostly sent out by e-mail to the supermarkets,
and by fax or e-mail to the processors, intermediaries and farms. As for most of the restaurants
and traders, printed questionnaires were taken to them by the researcher and research assistants.
Each returned questionnaire was checked timely and carefully. When a questionnaire was found
incomplete or confusing, the researcher called or visited the respondents to confirm their
answers, in this way to make sure that the respondents understood the questions correctly and
provided answers precisely.
Finally, 165 questionnaires were obtained for the company-supplier sample, with answers from
respondent firms on the relationships with their most important suppliers. Meanwhile, 96
questionnaires were obtained for the company-customer sample, with answers from the
respondent firms on the relationships with their most important customers.
Company Profile
The sample consists of 172 respondent companies, including 25 supermarkets, 42 restaurants, 24
traders, 25 processors, 22 intermediaries, 31 commercial farms and 3 other firms (Table 5). Two
(membership) supermarkets having organizations as their most important customers have
contributed not only to the customer sample but also the supplier sample. Other supermarkets
and restuarants have individual consumers as their major customer, thus have contributed only to
the customer sample.
Table 5. Firm type and numbers of the company-supplier (CS) and the company-customer (CC)
samples.
Super
mar
ket
s
Res
taura
nt
Tra
der
s
Pro
cess
ors
Inte
rmed
iari
es
Far
ms
Oth
ers
All
fir
ms
The CS
sample 25
(=2a+23)
42 23
(=21a+2)
24
(=20a+4)
22
(=20 a+2)
27
(=24a+3)
2
(=2a+0)
165
(=89a+74)
The CC
sample 2
(=2a+0)
- 22
(=21a+1)
21
(=20a+1)
20
(=20a+0)
28
(=24a+4)
3
(=2a+1)
96
(=89a+7)
Total 25 42 24 25 22 31 3 172
Note. a.The number of the respondent firms that contribute to both samples.
Table 6 displays the profile of the respondent companies. It is shown that the average firm age
was 8.8 years. The oldest organization, an institute with both breeding and selling chicken as
main activities, was set up 52 years ago. The youngest organizations, including two restaurants
and one farm, were set up just one year ago. The average ages of farms and restaurants are
significantly younger than those of processors and the ‘others’.

Peng et al. / International Food and Agribusiness Management Review / Volume 15, Issue 4, 2012
2012 International Food and Agribusiness Management Association (IFAMA). All rights reserved.
73
Table 6. Profile of the total sample on firm age, respondent position, and poultry types: number
(and percentage).
Su
per
mar
ket
s
Res
taura
nts
Tra
der
s
Pro
cess
ors
Inte
rmed
iari
es
Far
ms
Oth
ers
All
Fir
ms
Firm age in years: (mean and S.D.)
8.04
(5.02)
6.95
(5.29)
7.17
(4.43)
10.32
(6.47)
9.64
(5.43)
6.84
(5.21)
28.67
(20.60)
8.77
(7.52)
Respondent Position
- senior or key
employee 24 38 20 20 18 28 3 151(88%)
- others 1 4 4 5 4 3 - 21 (12%)
Poultry Type
- chicks only - 4 12 12 12 16 2 58 (34%)
- ducks only - - 1 5 1 4 1 12 (7%)
- other poultry only - 1 - - - 2 - 3 (2%)
- at least two
types of poultry 25 37 11 8 9 9 - 99 (58%)
Total 25
(15%)
42
(25%)
24
(14%)
25
(15%)
22
(13%)
31
(18%)
3
(2%)
172
(100%)
As for the profiles of the respondents, the results show that 87.8% of the respondents of the
survey were senior employees or key employees (there is often no specific senior employee in a
small company except the owner). This indicates a high quality of respondents, who should have
a clear understanding of what practices their organizations employ with regard to their most
important customers and suppliers.
With regard to poultry types, most respondent companies (57.6%) were involved in at least two
types of poultry, while the second largest group of firms (33.7%) were involved in chick
products only.
Measurements and Data Analysis Method
Grounded on previous studies, perceived communication benefits was operationalized with two
constructs, including ‘perceived communication benefits for buyers’ and ‘perceived communica-
tion benefits for suppliers’. Supply chain compliance was operationalized with ‘logistics compli-
ance’ and ‘quality compliance’. And company performance was operationalized with ‘custermer
satisfaction’, ‘external efficiency’, and ‘profit & competitive edge’. Appendix 1 presents a
summary of these constructs and measurement items.

Peng et al. / International Food and Agribusiness Management Review / Volume 15, Issue 4, 2012
2012 International Food and Agribusiness Management Association (IFAMA). All rights reserved.
74
To analyze the data and test the hypotheses, partial least squares (PLS) path modeling technique
was employed. Following Chin (1998b), we ran bootstrapping1 with 500 resampling.
PLS path modeling is a type of structural equation modeling (SEM) technique. Supply Chain
Management reserach very often involves an analysis of relationships among latent variables
(LV). The advent of SEM techniques allowed social scientists to perform path analytic modeling
with LV, and to stimultaneously examine theory and measures. This in turn has led some to
describe this aproach as an example of ‘a second generation of multivariate analysis’ (Fornell
1987, : 408). Nowadays, SEM techniques are the most applied and consolidated means of testing
relations and causality in the field of management information systems (e.g. Pavlou and Chai
2002; Dibbern et al. 2004), buyer-supplier relationships (e.g. Claro 2004), and marketing
resesarch (e.g. Steenkamp and Trijp 1991; Malhotra, Peterson, and Kleiser 1999).
There are two distinct families of SEM techniques: (1) the covariance-based SEM techniques, as
represented by LISREL and AMOS; and (2) the component-based SEM techniques, also known
as variance-based techniques, of which PLS modeling is the most prominent representative (Chin
1998b). Applying PLS modeling has some advantages over covariance-based SEM tools (Chin
1998b). The main characteristics of PLS path modeling, which have increased its popularity
within the research community and motivated our choice in this study, include (Henseler, Ringle,
and Sinkovics 2009):
1. PLS path modeling delivers LV scores, i.e. proxies of the constructs, which are measured by
one or several indicators, namely, manifest variables (MV).
2. PLS path modeling avoid small sample size problems and can therefore be applied in some
situations when other methods cannot (Chin and Newsted 1999).
3. PLS path modeling can estimate very complex models (i.e. models consisting of many LV
and MV) without leading to estimation problems (Wold 1985).
4. PLS path modeling makes less stringent assumptions about the distribution of variables and
error terms (Fornell 1982, 443; Bagozzi 1994); however, it does not make less stringent as-
sumptions about the representativeness of the sample.
5. PLS path modeling can handle both formative measurement models and reflective ones (Chin
1998a; Diamantopoulos and Winklhofer 2001). Although the inclusion of formative
measures in covariance-based SEM has been well documented (Jöreskog and Goldberger
1975; MacCallum and Browne 1993), analysts usually encounter identification problems.
6. PLS path modeling is methodologically advantageous to covariance-based SEM whenever
improper or non-convergent resutls are likely to occur (i.e. Heywood cases; see (Krijnen,
Dijkstra, and Gill 1998).
1 Bootstrap is nonparametric approach to estimate the precision of the PLS estimates (Chin 1998). The general
approach is to resample with replacement from the original data set. Parameter estimates are calculated for each
instance, and the variation in the estimates are analysed. For details about bootstrap, see Efron and Gong (1983).
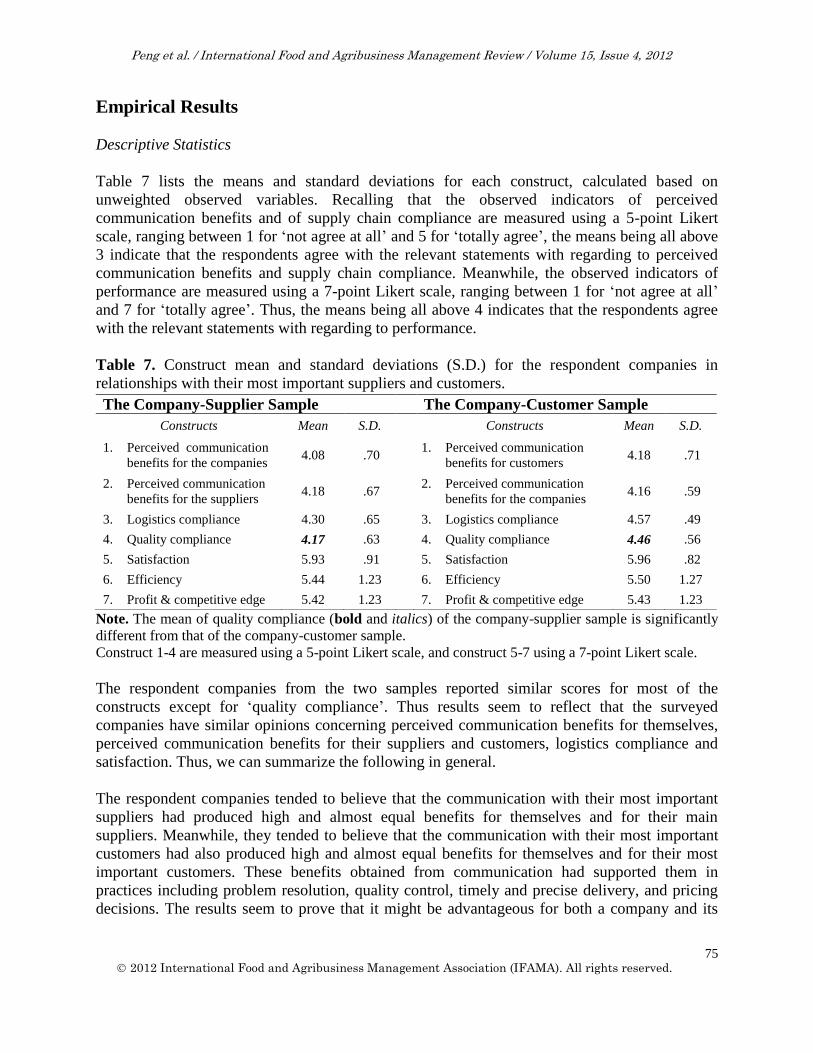
Peng et al. / International Food and Agribusiness Management Review / Volume 15, Issue 4, 2012
2012 International Food and Agribusiness Management Association (IFAMA). All rights reserved.
75
Empirical Results
Descriptive Statistics
Table 7 lists the means and standard deviations for each construct, calculated based on
unweighted observed variables. Recalling that the observed indicators of perceived
communication benefits and of supply chain compliance are measured using a 5-point Likert
scale, ranging between 1 for ‘not agree at all’ and 5 for ‘totally agree’, the means being all above
3 indicate that the respondents agree with the relevant statements with regarding to perceived
communication benefits and supply chain compliance. Meanwhile, the observed indicators of
performance are measured using a 7-point Likert scale, ranging between 1 for ‘not agree at all’
and 7 for ‘totally agree’. Thus, the means being all above 4 indicates that the respondents agree
with the relevant statements with regarding to performance.
Table 7. Construct mean and standard deviations (S.D.) for the respondent companies in
relationships with their most important suppliers and customers.
Note. The mean of quality compliance (bold and italics) of the company-supplier sample is significantly
different from that of the company-customer sample.
Construct 1-4 are measured using a 5-point Likert scale, and construct 5-7 using a 7-point Likert scale.
The respondent companies from the two samples reported similar scores for most of the
constructs except for ‘quality compliance’. Thus results seem to reflect that the surveyed
companies have similar opinions concerning perceived communication benefits for themselves,
perceived communication benefits for their suppliers and customers, logistics compliance and
satisfaction. Thus, we can summarize the following in general.
The respondent companies tended to believe that the communication with their most important
suppliers had produced high and almost equal benefits for themselves and for their main
suppliers. Meanwhile, they tended to believe that the communication with their most important
customers had also produced high and almost equal benefits for themselves and for their most
important customers. These benefits obtained from communication had supported them in
practices including problem resolution, quality control, timely and precise delivery, and pricing
decisions. The results seem to prove that it might be advantageous for both a company and its
The Company-Supplier Sample The Company-Customer Sample
Constructs Mean S.D. Constructs Mean S.D.
1. Perceived communication
benefits for the companies 4.08 .70
1. Perceived communication
benefits for customers 4.18 .71
2. Perceived communication
benefits for the suppliers 4.18 .67
2. Perceived communication
benefits for the companies 4.16 .59
3. Logistics compliance 4.30 .65 3. Logistics compliance 4.57 .49
4. Quality compliance 4.17 .63 4. Quality compliance 4.46 .56
5. Satisfaction 5.93 .91 5. Satisfaction 5.96 .82
6. Efficiency 5.44 1.23 6. Efficiency 5.50 1.27
7. Profit & competitive edge 5.42 1.23 7. Profit & competitive edge 5.43 1.23

Peng et al. / International Food and Agribusiness Management Review / Volume 15, Issue 4, 2012
2012 International Food and Agribusiness Management Association (IFAMA). All rights reserved.
76
main customers, and for both a company and its main suppliers, to invest heavily and more or
less equally in information exchange with each other.
The respondent companies were of the opinion that their main suppliers had complied well with
their logistics and quality requirements. Meanwhile, the respondent companies tended to believe
that they themselves had also complied well with their customers’ logistics and quality
requirements.
Companies in the chain were satisfied with their performance compared to their main
competitors in the last twelve years. Specifically, they were satisfied with the product quality of
and the prices paid to their suppliers. They had paid less money and had taken less time, thus
they had realized higher (external) efficiency in the transactions with their main suppliers and
customers. Further, they tended to believe that they had achieved better performance, compared
to their main competitors in the last twelve months in terms of profitability, sales growth rate,
and overall competitive edge.
Of particular interest is that the company-supplier sample has scored significantly lower than the
company-customer sample for suppliers’ compliance with customers’ quality requirements. This
might reflect that, although the companies have complied well with customers’ quality
requirements in general, they do not comply as well as that their customers think they should
have. This finding is a valuable warning for companies in the Chinese poultry chain to pay more
attention to improving their chain quality compliance, and to make sure that they do meet their
customers’ quality requirements and expectations.
Validity and Reliability of Measures and Constructs
We identified the constructs in the present study as reflective constructs, by following the four
primary decision rules stated in (Jarvis and MacKenzie 2003) and based on insights obtained
from the field research. Then, we examined content validity, discriminant validity, and
nomological validity. Meanwhile, we also checked item multicollinearity for all of the
constructs.
The content validity is based on the literature and further confirmed by experts, officers, and
practitioners during interviews and the pre-test (Straub, Boudreau, and Gefen 2004). All of the
correlation coefficients between the variables are well below the common cut-off of 0.8. This
proves the discriminant validity, thus we can employ all of these constructs in one model. The
nomological validity has been confirmed by estimating the structural equations in our theoretical
models (Churchill 1979; Steenkamp and Trijp 1991). A number of significant relationships have
been found between the constructs (see Figure 2) as they should be (Bollen and Lennox 1991).
To assess item multicollinearity, Pearson correlation has been applied to pairs of items of each
constructs. The only problem found was that the correlation coefficients between ‘market share’
and ‘overall competitive edge’ for both the company-supplier and the company-customer
samples are slightly higher than the threshold value of 0.80. Thus, the item of ‘market share’ has
been dropped. As for all other constructs, the correlation coefficients lie well below the threshold

Peng et al. / International Food and Agribusiness Management Review / Volume 15, Issue 4, 2012
2012 International Food and Agribusiness Management Association (IFAMA). All rights reserved.
77
of 0.8, which exhibit no problem of item multicollinearity (Malhortra, Peterson, and Kleiser
1999; Diamantopoulos and Winklhofer 2001).
Relationship between Perceived Communication Benefits and Company Performance:
The Mediating Effect of Supply Chain Compliance
The structural equation model on the influence of perceived communication benefits on company
performance was tested by PLS path modelling. Figure 2 and 3 presents the results of the
Communication-compliance-performance Model for companies in relationships with their most
important suppliers and with their most important customers respectively. The overall model
explains about 25.7% of the variance of the endogenous latent variables for the company-
supplier sample and about 20.9% for the company-customer sample. This indicates that a
satisfactory model fit is obtained for each sample. PLS provides standardised path coefficients,
so we can compare the direction and the magnitude of the impacts based on the path coefficients.
Figure 2. The Relationships in the Communication-Compliance-Performance Model for the
Company-Supplier (CS) sample (N=165).
Note. **being significant at p < 0.01 level; * being significant at p < 0.05 level.
Dotted lines show the tested relationships being not significant.
Figure 3. The Relationships in the Communication-Compliance-Performance Model for the
Company-Customer (CC) sample (N=96).
Note. **being significant at p < 0.01 level; * being significant at p < 0.05 level.
Dotted lines show the tested relationships being not significant.
Profitability & competitive
edge
External efficiency
Satisfaction
Logistics compliance
Quality compliance
Perceived communication benefits for the
companies
Perceived communication
benefits for suppliers
0.12
0.30*
0.44** 0.36**
0.47**
0.57**
0.11 0.09
0.08
0.14
R2 = 0.28
R2 = 0.14
R2 = 0.27
R2 = 0.12
R2 = 0.39
Profitability & competitive
edge
External efficiency
Satisfaction
Logistics compliance
Quality compliance
Perceived communication
benefits for customers
Perceived communication benefits for the
companies
0.28*
0.35**
0.35** 0.53**
0.39*
0.36**
0.09 0 .12
-0.06
-0.05
R2 = 0.32
R2 = 0.17
R2 = 0.21
R2 = 0.24
R2 = 0.20

Peng et al. / International Food and Agribusiness Management Review / Volume 15, Issue 4, 2012
2012 International Food and Agribusiness Management Association (IFAMA). All rights reserved.
78
When looking at the relationships between ‘perceived communication benefits’ and ‘supply
chain compliance’, it appears that ‘perceived communication benefits for buyers’ and ‘perceived
communication benefits for suppliers’ have different influences on ‘supply chain compliance’.
For a company in relationships with its most important suppliers, communication benefits
obtained by the company (as the buyer) were not significantly associated with its suppliers’
compliance with its requirements. But communication benefits obtained by its suppliers were
positively and significantly associated with the suppliers’ compliance with the company’
logistics and quality requirements. These results reflect that when a company communicates with
its main suppliers, the benefits obtained by its suppliers are likely to help these suppliers to
comply better with its logistics and quality requirements. Thus, it makes sense for a company to
help its main suppliers to really benefit from the information exchange, if the company intends to
improve its suppliers’ compliance with its requirements.
For a company in relationships with its most important customers, the communication benefits
obtained by its customers do not necessarily help the company to comply better with the
customers’ logistics requirements; however, they are likely to help the company to comply better
with the customers’ quality requirements. Meanwhile, the communication benefits obtained by
the company itself are likely to help it to comply better with the customers’ logistics and quality
requirements. Thus, it makes sense for a company to ensure not only itself, but also its main
customers to really benefit from the information exchange, if the company intends to improve its
compliance with its customers’ requirements.
Based on the above empirical proofs from the buyer and the supplier sides, we may draw an
important conclusion that it makes sense for a company to help not only itself, but also its
important suppliers and customers to really realize benefits from their mutual information
exchange. In this way, the company is likely to improve its suppliers’ compliance with its
requirements and its own compliance with its customers’ requirements.
When looking at the relationships between ‘supply chain compliance’ and company
‘performance’, we can see from Figure 2 that for a company in relationship with its main suppli-
ers, its suppliers’ logistics compliance does not necessarily influence its performance; however,
its suppliers’ quality compliance is likely to improve each aspect of its performance. Similarly,
we can see from Figure 2 that for a company in relationship with its main customers, its logistics
compliance does not necessarily influence its performance; however, its quality compliance is
likely to improve each aspect of its performance in term of customer satisfaction, external
efficiency, profitability, and overall competitive edge. Thus, another valuable finding is that it
appears that it is a company’s main suppliers’ compliance with its quality requirements, and its
own compliance with its customers’ quality requirements, rather than logistics compliance, that
make the company stand out from its main competitors.
Here logistics compliance does not yet show its potential value in improving company
performance. A likely explanation is that there is limited implementation of logistics
management in the Chinese poultry chain. Another possible reason is that logistics compliance
does not necessarily make a company stand out from its main competitors, though it might
Peng et al. / International Food and Agribusiness Management Review / Volume 15, Issue 4, 2012
2012 International Food and Agribusiness Management Association (IFAMA). All rights reserved.
79
contribute to the improvement of company performance to certain extent. This would be worth
examining further in future research.
When looking at the relationships between ‘perceived communication benefits’ and company
‘performance’, the results of total effects estimation show that for a company in relationships
with its main suppliers, the communication benefits obtained by the company itself (the buyer)
are not significantly associated with its company performance. However, the communication
benefits obtained by its main suppliers are likely to make it stand out from its main competitors
in satisfaction, external efficiency, profitability, and competitive edge. Similarly, the results of
total effects also show that for a company in relationship with its main customers, the
communication benefits obtained by its customers are not significantly associated with its
performance. However, the communication benefits obtained by the company (the supplier) are
likely to make it stand out from its main competitors in customers’ satisfaction.
Thus, we may draw a valuable conclusion as: communication benefits obtained by suppliers are
likely to make themselves and their main customers stand out from their main competitors.
Differently and notably, the communication benefits obtained by buyers do not necessarily make
themselves or their main suppliers stand out from their main competitors, though such benefits
might help to improve their own and their suppliers’ performance to certain extent.
Buyers are often with higher marketing and negotiation powers than their suppliers. They tend to
less actively comply with their suppliers’ requirements while their suppliers tend to more
actively comply with their requirements. However, the above results indicate that it is valuable
for a buyer to actively help its main suppliers to realize benefits from their information exchange.
Effect of Company Characteristics on the Relationships between Information Exchange Benefits
and Performance
To explore the effect of company characteristics on the relationships between information
exchange benefits and performance, five control variables were then added to each endogenous
construct in the Communication-compliance-performance Model. They are company size,
company age, company type2, quality standard implemented
3, and administrative level of a
location4. Other parts and paths of the model remained as the same. The overall model explains
about 31.1% of the variance of the endogenous latent variables for the company-supplier sample,
and 34.0% for the company-customer sample.
The results show a company’s characteristics are likely to influence in one way or the other how
well it is likely to comply with the requirements of its main customers, and how well its
comparative performance is likely to be achieved (Table 8). However, they do not necessarily
2 Company type is modelled as a dummy variable: with 1 for companies having trading activities as main functions,
being closer to end markets and with more market power; and 0 for companies having production activities as
main functions, being farther from end markets and with less market power. 3 Quality standard implemented is represented by the highest quality standard adopted by a company.
4 Administrative level of a location is an ordinal variable: with 1 for town or county, 2 for other cities, and 3 for
national or provincial capital cities.

Peng et al. / International Food and Agribusiness Management Review / Volume 15, Issue 4, 2012
2012 International Food and Agribusiness Management Association (IFAMA). All rights reserved.
80
change the significance of the relationships between the constructs in the model that is presented
in Figure 3. Thus, we conclude that the results of the relationhsips between perceived
communication benefits, supply chain compliance and performance found in this study are likely
to be tenable for different companies with different characteristics.
Table 8. The significant effect of company characteristics on supply chain compliance
and performance. The Company-Supplier Sample The Company-Customer Sample
size
age
typ
e
qu
alit
y
loca
tio
n
size
age
typ
e
qu
alit
y
loca
tio
n
Logistics compliance - +
Quality compliance - +
Satisfaction - † - -
†
Efficiency - † - -
†
Profit & competitive edge - † -
†
Notes. a. The company characteristics examined are: company size, company age, company type, quality standard
implied, and the administrative level of a location. Specifically, company type: 0 = production firms with lower
market power; 1 = trading firms with higher market power. Administrative level of a location: 1 = town or country,
2 = medium-sized city; 3 = national or provincial capital city.
b.†
The path coefficients being significant for both the company-supplier and the company-customer samples at
p<0.05 level.
In general, the size, business age, and type of a company do not necessarily affect how well its
suppliers are likely to comply with its logistics or quality requirements, but are likely to
influence how well it is likely to comply with the logistics or quality requirements of its main
customers. Meanwhile, the type, the highest quality standard employed, and the administrative
level of the location of a company are likely to influence the level of each aspect of its
performance compared to its main competitors.
For both the company-supplier and the company-customer samples, company type has
interestingly shown negative and significant effects on ‘profit & competitive edge’. A trader or a
retailer is likely to report a lower level, whilst a commercial farm or a processor is likely to
report a higher level of profitability and competitive edge, compared to its main competitors in
the last twelve months. The survey was conducted during the Financial Crisis (2008-2009). The
researcher noticed that retailers complained about their sheer reduced sales due to the Financial
Crisis, especially those in the eastern and coastal advanced regions in China. This result might
therefore reflect the fact that traders and retailers, who normally sell multiple types of products,
were confronted with higher challenges in sales than before, and thus tended to be pessimistic
and score lower on their performance. Conversely, commercial farms and processors of poultry
products, a type of basic consumption product, did not experienced much higher challenges in
sales than before, and thus tended to be optimistic and score higher on their performance
comparatively.

Peng et al. / International Food and Agribusiness Management Review / Volume 15, Issue 4, 2012
2012 International Food and Agribusiness Management Association (IFAMA). All rights reserved.
81
In constrast to our expectation, for both the company-supplier and the company-customer
samples, the administrative level of a location has shown negative effects on performance
including satisfaction and external efficiency. This might imply that a company located in a
smaller city is likely to be more satisfied with the product quality of and the price paid to their
main suppliers, and is likely to make its main customers feel more satisfied. Meanwhile, it is
likely to spend less money and less time, thus be more externally efficient in the transactions
with its main suppliers and customers. A likely explanation is that most production companies
are located in small towns or cities because of lower costs and the environment protection policy.
As mentioned above, they deal with poultry products, a type of basic consumption product.
Therefore, they did not experience higher challenges during the Financial Crisis than before, and
tend to make a positive assessment of their performance comparatively. However, most trading
companies are located in middle or large cities being important end markets. They normally deal
with multiple products including luxury goods. Therefore, they faced more challenges during the
Financial Crisis than before, and tend to make a pessimistic assessment of their performance.
However, there might have been unexpected effects of the Financial Crisis that were not
measured in this study. To explain these findings, further research will be necessary.
Of particular interest, when a company employs a higher level of quality standard, it tends to be
stricter and unsatisfied with its suppliers’ compliance with its quality requirements. Meanwhile,
possibly due to increased costs, higher prices and more negotiation, it is likely to suffer a lower
level of customer satisfaction and a lower level of external efficiency. These findings might
imply that companies and consumers in the Chinese poultry chain are more sensitive to product
price than product quality. These might also reflect and explain why there is so little motivation
for players in the Chinese food chain to improve food quality. This finding is a warning that new
or adjusted food policy is needed to stimulate the self-motivation of the companies to employ
higher levels of quality standards.
For companies in relationships with their customers, a larger firm is likely to comply better with
the quality requirements than a smaller firm, but does not necessarily comply better with the
logistics requirements of its main customers. A likely explanation is that a larger company is able
and willing to invest to comply better with the quality requirements, in order to safeguard its
long-term reputation and markets; Meanwhile, the logistics compliance has limited implementa-
tion and is still in its early stages, and this situation holds true for both small and large firms in
the Chinese poultry chain.
For companies in relationships with their customers, company age has shown to be negatively
associated with logistics compliance. A younger firm is likely to comply better with the logistics
requirements of its main customers. A likely explanation is that chain logistics management is a
relatively new practice in Chinese food chains. It might be harder for an old firm to change its
old operation habits.
Company type has shown to be positively associated with logistics compliance. This might
reflect that compared to a commercial farm or a processor, a trader or a retailer being closer to
end markets is likely to comply better with its customers’ logistics requirements. This finding is
a warning for farms and processors which also have to produce and transport products to
customers. They should particularly pay attention to improve their knowledge and practices in

Peng et al. / International Food and Agribusiness Management Review / Volume 15, Issue 4, 2012
2012 International Food and Agribusiness Management Association (IFAMA). All rights reserved.
82
logistics management, and in turn they might obtain particularly huge development space and
competitive advantage.
Conclusions
This paper intends to reveal the relationship between perceived communication benefits and
company performance, the mediating role of supply chain compliance on this relationship, and
the difference for buying companies and suppliers.
This paper has proposed a Communication-compliance-performance Model (see Figure 2 and 3),
which is composed of three man parts: perceived communication benefits, supply chain
compliance, and company performance. The model can be used to understand, examine, and
assess how communication benefits obtained by companies and by their suppliers/buyers help to
improve supply chain compliance, and further contribute to better performance for the company
and for its suppliers and buyers.
Another theoretical contribution of this paper is its extension of existing research on the value of
information exchange. This paper appears to be the first to propose and examine the benefits of
information exchange for buyers (i.e. perceived communication benefits for buyers) and for
suppliers (i.e. perceived communication benefits for suppliers) respectively, and further to
distinguish their different influence on different aspects of company performance. Previous
studies often equate the value of information exchange with company performance, or often
examined the relationships of information exchange with limited aspects of performance.
However, we assume company performance might not be a direct but rather partly an indirect
result of information exchange, and company performance itself is a broad concept covering
diverse aspects.
Thus, we hereby checked the relationship between the direct benefits of information exchange
(i.e. perceived communication benefits) and the indirect results of information exchange (i.e.
company performance). The results of this study support that perceived communication benefits
and company performance are two different constructs and could be checked in one model.
Therefore, we call future research to distinguish between the direct benefits of information
exchange and company performance.
Meanwhile, we examined the mediating effects of supply chain compliance on this relationship
by taking the insights of Supply Chain Management. The results support the significant and
positive mediating effect of quality compliance on the relationship between perceived
communication benefits and company performance. However, the expected mediating effect of
logistics compliance is not supported here. We call future research to check the potential
mediating effect of logistics compliance in other chains in China or in the West.
In general, the most important findings are: (1) Communication benefits obtained by a company
are likely to help the company and its main suppliers to improve compliance in a chain. (2)
Communication benefits obtained by a company and its improved compliance with its
customers’ quality requirements jointly lead to better performance for the company and for its
main customers. (3) A company’ compliance with its main customers’ quality requirement is a

Peng et al. / International Food and Agribusiness Management Review / Volume 15, Issue 4, 2012
2012 International Food and Agribusiness Management Association (IFAMA). All rights reserved.
83
key to improve the performance of the company and of its customers. (4) In contrast to our
expectation, a company’s compliance with its main customers’ logistics requirements here is not
significantly linked with company performance. This might reflect the fact that there is limited
implementation of logistics compliance and this holds true for both small and large companies in
the Chinese poultry chain.
This paper also contributes to the extension of our knowledge on the effects of company
haracteristics on the interrelationships between perceived communication benefits, supply chain
compliance, and performance. An important finding is that the five company characteristics are
likely to affect the levels (magnitude) of supply chain compliance and performance, but do not
necessarily change the interrelationships between perceived communication benefits, supply
chain compliance, and performance. Thus, the interrelationships between perceived
communication benefits, supply chain compliance and performance that were revealed in this
study (see Figure 2 and 3) are likely to be tenable for different companies with different
characteristics.
Managerial and Food Policy Implications
Based on the major findings of this study, we draw the following managerial implications. First,
in order to advance from realizing potential communication benefits to standing out from its
main competitors, a company should not only commit to realizing the potential communication
benefits for itself, but also commit to helping its main suppliers and customers realize the
potential benefits as well.
In practice, some companies are unwilling to share information or they only share under
ressures from business partners. Some companies doubt the value of information communication
compared to the financial, physical and human costs. Some are afraid that information provided
to their customers or suppliers may be abused and place their organizations at a competitive
disadvantage (Fawcett et al. 2007). However, what managers can learn from this study and
should always bear in mind that it is not only the communication benefits obtained by a company
itself, but also those by its main suppliers and customers that make it stand out from its main
competitors. When a company’s main suppliers obtain communication benefits, they can comply
better with the company’s logistics and quality requirements; and when the company’s main
customers obtain such benefits, they can help the company comply better with their quality
requirements, thus significantly contribute to the company’s performance ultimately.
Second, a company should pay great attention to quality management in its supply chain. It
should commit to ensuring that its main suppliers comply well with its own quality requirements,
and also ensuring that it complies well with its customers’ quality requirements. These will
jointly make it stand out in performance compared to its main competitors.
Third, for Chinese poultry managers aiming to achieve better performance than their main
competitor, learning to improve their own logistics compliance and that of their suppliers’
appears to be a great challenge but a huge potential opportunity for further performance
improvement.

Peng et al. / International Food and Agribusiness Management Review / Volume 15, Issue 4, 2012
2012 International Food and Agribusiness Management Association (IFAMA). All rights reserved.
84
Fourth, by examining the influence of company characteristics, we find that the level of supply
chain compliance and company performance should be evaluated on the basis of company
characteristics. By cross-checking with their main counterparts and competitors with similar
characteristics, a company could have a clearer understanding of how well it has performed in
the area of supply chain compliance and company performance.
For food policy makers, explicit attention should be paid to how to improve the self-motivation
of food companies to implement quality standards. The results of this study indicate that
companies adopting higher quality standards are likely to suffer from lower customer satisfaction
and lower external efficiency. This might imply that there is no much motivation in the Chinese
poultry chain to adopt higher levels of quality standards. And this lack of self-motivation might
be a main reason why food quality incidents happen more frequently in China than in the
developed countries.
Thus, an important means of solving the food quality problem might be to facilitate companies’
self-motivation to adopt quality standards by adjusting the trade-off that is brought by the quality
standards. Particularly, it might be valuable to carry out relevant food policy that encourages
retailers to adopt high quality standards. In the face of very powerful retailers, food production
companies and logistics companies are likely to comply with the retailers’ increased quality
requirements.
Limitations and Future Research
First, it is worth remarking that the main findings and conclusions of this study are based mainly
on the poultry chain in Mainland China. In general, they may be valuable for other non-highly
integrated meat chains. However, some of these conclusions should be carefully examined if
they are to be generalized to non-meat chains or highly integrated chains in the developed
countries. For instance, the expected positive association between logistics compliance and
performance was neither supported in the Chinese poultry chain in this study, nor in the Chinese
pork chain (Han, Trienekens, and Omta 2009), however, was found in the Chinese vegetable
chain (Lu et al. 2007). Therefore, we expect that the positive association between logistics
compliance and performance might not exist in other Chinese meat chains, but might exist in the
Chinese fruit chain which has similar logistics requirements to the vegetable chain, and might
exist in food chains in the West. Thus, we also assume that it would be valuable to conduct a
comparative study in the future between the non-highly integrated food chains in China and the
highly integrated food chains in the West.
Second, this study focused on the relationships between companies and their most important
suppliers, and their most important customers. However, we assume that the information and
compliance relationships between companies and their less important business partners might
take on a different picture. Based on the polarization of power and benefits, there might be more
bargaining than collaboration between companies and their less important business partners. And
managers have to think more carefully about the trade-off between benefits and costs of
communication and chain compliance, and adjust their communication and compliance strategy
based on the trade-off. Thus, we call for future research on the communication and compliance
of companies with their less important customers and suppliers, which is absent from the

Peng et al. / International Food and Agribusiness Management Review / Volume 15, Issue 4, 2012
2012 International Food and Agribusiness Management Association (IFAMA). All rights reserved.
85
literature. Third, this study has examined the mediating effect of supply chain compliance on the
relationships between perceived communication benefits and performance. However, the
mediating effect of logistics compliance was expected but not supported in this study. Addition-
ally, there should be diverse ways tha`t information exchange leads to performance. Therefore,
we call future research to study the mediating effects of logistics compliance and
other variables (such as governance structure) on the relationships between perceived
communication benefits and performance.
Fourth, the results of this study reveal that some differences exist between buying companies and
suppliers with regard to information exchange. This is reasonable considering that buying
companies and suppliers have different functions and often different market and negotiation
powers. Thus, we call for more dyadic study on supply chain information management in the
future.
Acknowledgements
The authors wish to thank the two anonymous reviewers, the managing editor, and the executive
editor of IFAMR for their valuable comments and encouragement. Our gratitude also goes to the
Chinese poultry chain actors who shared their insights with us. The first author sincerely appre-
ciates the research project fund from Wageningen University and Netherlands Organization for
International Cooperation in Higher Education (project nr. 2100842400, contract nr. CF4661).
References
Bagozzi, Richard P. ed. 1994. Principles of Marketing Research. Oxford: Blackwell.
Bollen, Kenneth, and Richard Lennox. 1991. Conventional wisdom on measurement: a structural
equation perspective. Psychological Bulletin 110 (2):305-314.
Cao, Mei, Mark A. Vonderembse, Qingyu Zhang, and T. S. Ragu-Nathan. 2010. Supply chain
collaboration: conceptualisation and instrument development. International Journal of
Production Research 48 (22):6613-6635.
Chin, Wynne W. 1998a. Issues and opinion on structural equation modeling. MIS Quarterly 22
(1):VII-XVI.
Chin, Wynne W. 1998b. The partial least squares approach to structural equation modeling. In
Modern Methods for Business Research, edited by G.A. Marcoulides, 295-358. Mahwah,
NJ: Lawrence Erlbaum Associates.
Chin, Wynne W., and Peter.R. Newsted. 1999. Structural equation modeling analysis with small
samples using partial least squares. In Statistical strategies for small sample research,
edited by R.H. Hoyle, 307-342. Thousand Oaks, CA: Sage.

Peng et al. / International Food and Agribusiness Management Review / Volume 15, Issue 4, 2012
2012 International Food and Agribusiness Management Association (IFAMA). All rights reserved.
86
Chopra, Von S., and Peter Meindl. ed. 2007. Supply chain management: strategy, planning and
operations. 3rd
ed. Upper Saddle River, NJ: Prentice Hall.
Churchill, Gilbert. A. 1979. Paradigm for developing better measures of marketing constructs.
Journal of Marketing Research 16 (1):64-73.
Churchill, Gilbert A. and Dawn Lacobucci ed. 2010. Marketing research: methodological
foundations, 10th
ed. Mason, USA: Cengage Learning.
Claro, Danny P. 2004. Managing business networks and buyer-supplier relationships,
Wageningen University, Wageningen, NL.
Diamantopoulos, Adamantios and Heidi M. Winklhofer. 2001. Index construction with formative
indicators: an alternative to scale development. Journal of Marketing Research 38
(2):269-277.
Dibbern, Jens, Tim Goles, Rudy A. Hirschheim, and Bandula Jayatilaka. 2004. Information
systems coutsourcing: a survey and analysis of the literature. The Data Base for Advances
in Information Systems 35 (4):6-102.
Efron, Bradley, and Gail Gong. 1983. A leisurely look at the bootstrap, then jackknife, and cross-
validation. The American Statistician 37 (1):36-48.
Fawcett, Stanley. E., Cynthia Wallin, Chad. Allred, Amydee. M. Fawcett, and Gregory M.
Magnan. 2010. Information technology as an enabler of supply chain collaboration: a
dynamic-capabilities perspective. Journal of Supply Chain Management 47 (1):38-59.
Fawcett, Stanley, E., Paul Osterhaus, Gregory M. Magnan, James C. Brau and Matthew W.
McCarter. 2007. Information sharing and supply chain performance: the role of
connectivity and willingness. Supply Chain Management: an International Journal 12
(5):358-368.
Fornell, Claes. 1982. A second generation of multivariate analysis: an overview. In A second
generation of multivariate analysis: measurement and evaluation, edited by C. Fornell, 1-
21. New York: Praeger.
———. 1987. A second generation of multivariate analysis: classification of methods and
implications for marketing research. In Review of Marketing, edited by M.J. Houston,
407-450. Chicago, IL: American Marketing Association.
Han, Jiqin, Jacques. H. Trienekens, and S. W. F. Omta. 2009. Integrated information and
logistics management, quality management and firm performance of pork processing
industry in China. British Food Journal 111 (1):9-25.

Peng et al. / International Food and Agribusiness Management Review / Volume 15, Issue 4, 2012
2012 International Food and Agribusiness Management Association (IFAMA). All rights reserved.
87
Henseler, Jörg, Christian M. Ringle, and Rudolf R. Sinkovics. 2009. The use of partial least
squares path modeling in international marketing. In Advances in International
Marketing, edited by R. R. Sinkovics and P. N. Ghauri, 277-319. Emerald Group
Publishing Limited.
Jöreskog, Karl G., and Arthur S. Goldberger. 1975. Estimation of a model with multiple
indicators and multiple causes of a single latent variable. Journal of the American
Statistical Association 70 (351):631-639.
Jarillo, José C. 1995. Strategic networks: creating the borderless organization. Oxford:
Butterworth-Heinemann.
Jarvis, Cheryl B., Scott B. MacKenzie, and Philip M. Podsakoff. 2003. A critical review of
construct indicators and measurement model misspecification in marketing and consumer
research. Journal of Consumer Research 30 (2):199-218.
Krijnen, Wim P., Theo K. Dijkstra, and Richard D. Gill. 1998. "Conditions for factor (in)
determinancy in factor analysis." Psychometrika 63 (4):359-367.
Lambert, Douglas. M., Martha C. Cooper, and Janus D. Pagh. 1998. Supply chain management:
implementation issues and research opportunities. The International Journal of Logistics
Management 9 (2):1-19.
Lamming, Richard. 1996. Squaring lean supply with supply chain management. International
Journal of Operations & Production Management 10 (2):183-196.
Lee, Hau L., V. Padmanabhan, and Seungjin Whang. 1997. Information distortion in a supply
chain: The bullwhip effect. Management Science 43 (4):546-558.
Lee, Hau L., and Seungjin Whang. 2001. E-Business and supply chain integration. In Stanford
Global Supply Chain Management Forum.
Lu, Hualiang, Jacques H. Trienekens, S. W. F. Omta, and Suyi. Feng. 2007. The role of guanxi
networks and contracts in Chinese vegetable supply chains. Journal on Chain and
Network Science 7 (2):121-131.
MacCallum, Robert C., and Michael W. Browne. 1993. The use of causal indicators in
covariance structure models: some practical issues. Psychological Bulletin 114 (3):533-
541.
Malhortra, Naresh K., Mark Peterson, and Susan B. Kleiser. 1999. Marketing research: a state-
of-the-art review and directions for the twenty-first century. Journal of the Academy of
Marketing Science 27 (2):160-183.
Mentzer, John T., J. Foggin, and Susan L. Golicic. 2000. Collaboration: the enablers,
impediments, and benefits. Supply Chain Management Review 5 (6):52-58

Peng et al. / International Food and Agribusiness Management Review / Volume 15, Issue 4, 2012
2012 International Food and Agribusiness Management Association (IFAMA). All rights reserved.
88
Min, Soonhong, Anthony S. Roath, Patricia J. Daugherty, Stefan E. Genchev, Haozhe Chen,
Aaron D. Arndt, and R. Glenn Richey. 2005. Supply chain collaboration: what's
happening? International Journal of Logistics Management 16 (2):237-256
Nyaga, Gilbert N., Judith M. Whipple, and Daniel F. Lynch. 2010. Examining supply chain
relationships: Do buyer and supplier perspectives on collaborative relationships differ?
Journal of Operations Management 28 (2):101-114.
Paulraj, Antony, Augustine A. Lado, and Injazz J. Chen. 2008. Inter-organizational
communication as a relational competency: Antecedents and performance outcomes in
collaborative buyer-supplier relationships. Journal of Operations Management 26 (1):45-
64.
Pavlou, Paul A., and Lin Chai. 2002. What drives electronic commerce across cultures? A cross
cultural empirical investigation of the theory of planned behaviour. Journal of Electonic
Commerce Research 3 (4):240-253.
Reinsch, N.L. 2001. Business performance: communication is a compound, not a mixture. Vital
Speeches of the Day 67 (6):172-174.
Sahin, Funda, and E Powell Robinson. 2002. Flow coordination and information sharing in
supply chains: Review, implications, and directions for future research. Decision
Sciences 33 (4):505-536.
Sheu, Chwen, HsiuJu R. Yen, and Bongsug Chae. 2006. Determinants of supplier-retailer
collaboration: evidence from an international study. International Journal of Operations
& Production Management 26 (1):24-49.
Steenkamp, Jan-Benedict E. M., and Hans C. M. van Trijp. 1991. The use of LISREL in
validating marketing constructs. International Journal of Research in Marketing 8 (283-
299).
Stock, James R., and C. Jared Boradus. 2006. Doctoral research in supply chain management
and/or logistics-related areas: 1999-2004. Journal of Business Logistics 27 (1):139-15.
Storer, Christine E. 2006. Information communication tools used to coordinate food chains.
Australsian agribusiness review 14:1-23.
Storer, Christine E. 2005. Inter-organizational information management systems and
relationships in agribusiness food chains of organizations, Graduate School of Business,
Curtin University of Technology.
Straub, Detmar, Marie-Claude Boudreau, and David Gefen. 2004. Validation guidelines for IS
positivist research. Communications of the Association for Information systems 13:380-
427.

Peng et al. / International Food and Agribusiness Management Review / Volume 15, Issue 4, 2012
2012 International Food and Agribusiness Management Association (IFAMA). All rights reserved.
89
Stuart, F. Lan, and David McCutcheon. 1996. Sustaining strategic supplier alliances.
International Journal of Operations & Production Management 16 (10):5-22.
Wold, Herman. 1985. Partial least squares. In Encyclopedia of Statistical Sciences, edited by S.
Kotz and N.L. Hohnson, 581-591. New York: Wiley.

Peng et al. / International Food and Agribusiness Management Review / Volume 15, Issue 4, 2012
2012 International Food and Agribusiness Management Association (IFAMA). All rights reserved.
90
Appendix. Measurements and Constructs Note: each company was asked to select its most important supplier and customer of poultry
product, and to answer the following questions related to the selected supplier and customer.
Perceived communication benefits
(5-point Likert scale, from ‘1 = totally disagree’ to ‘5 = totally agree’)
Perceived communication benefits for buyers (BenefitB)
We (our most important customers) get information from our most important
supplier (us), which supports us (it) directly in:
BenefitB 1: Problem resolution
BenefitB 2: Product quality control
BenefitB 3: Timely and precise delivery
BenefitB 4: Product price decision
Perceived communication benefits for suppliers (BenefitS).
We (our most important supplier) get information from our most important customers
(us), which supports us (it) directly in:
BenefitS1: Problem resolution
BenefitS 2: Product quality control
BenefitS 3: Timely and precise delivery
BenefitS 4: Product price
Supply Chain Compliance
(5-point Likert scale, from ‘1 = totally disagree’ to ‘5 = totally agree’)
Logistics compliance (LC)
LC1: Our most important supplier (We) delivers products timely and precisely to us
(to our most important customer).
LC2: Our most important supplier (We) packages products according to the
requirements of us (our most important customer).
Quality compliance (QC)
QC1: Our most important supplier (We) will help us (our most important customer)
if we (they) meet quality problems or troubles.

Peng et al. / International Food and Agribusiness Management Review / Volume 15, Issue 4, 2012
2012 International Food and Agribusiness Management Association (IFAMA). All rights reserved.
91
QC2: Our most important supplier (We) provides products which fit quality
requirements of us (our most important customer).
QC3: Our most important supplier (We) provide products with better quality than its
(our) major competitors.
Firm Performance
(7-point Likert scale, from ‘1 = totally disagree’ to ‘7 = totally agree’)
Satisfaction (Satis)
Satis1: We (Our most important customer) are satisfied with the product quality of
our most important supplier (us).
Satis2: We (Our most important customer) are happy with the price paid to our most
important supplier (us).
Efficiency (Effi)
Effi1: It costs us less money when we purchase (sell) poultry from our most
important supplier (to our most important customer).
Effi2: It costs us less time to finish an order with our most important supplier
(customer) than with others.
Profit & Competitive edge (P&C)
Comparing to our main competitors in the last 12 months, we achieved better
business of poultry products in term of:
P&C1: Profitability.
P&C2: Sale growth rate.
P&C3: Market share. (Dropped)
P&C4: Overall competitive edge

Peng et al. / International Food and Agribusiness Management Review / Volume 15, Issue 4, 2012
2012 International Food and Agribusiness Management Association (IFAMA). All rights reserved.
92

2012 International Food and Agribusiness Management Association (IFAMA). All rights reserved
93
International Food and Agribusiness Management Review
Volume 15, Issue 4, 2012
Segmenting Consumers to Inform
Agrifood Value Chain Development in Nepal
Rajendra Prasad Adhikaria, Ray Collins
b, and Ximing Sun
c
aPhD Student, School of Agriculture and Food Sciences, The University of Queensland, Gatton, 4343, Australia
bProfessor of Agribusiness, School of Agriculture and Food Sciences, The University of Queensland,
Gatton, 4343, Australia
cResearch Fellow, School of Agriculture and Food Sciences, The University of Queensland,
Gatton, 4343, Australia
Abstract
The Nepalese government is piloting agricultural projects that are described as taking a value
chain approach to development. Although consumer value lies at the core of value chain man-
agement principles, none of these projects adopts a consumer perspective. This is an example of
a more widespread gap in both the literature and practice as to how consumer perspectives can be
used in the development of agrifood value chains in developing countries. This paper addresses
this gap by surveying consumers of tomatoes in Nepal, segmenting them using cluster analysis
and demonstrating how consumer segmentation can provide strategic direction for value chain
development. The research identifies four distinct segments of tomato consumers in Kathmandu.
The high value consumer segment, which is also the largest segment, places most importance on
credence-based attributes that cannot be ensured unless a whole-chain effort is employed, indi-
cating that developing value chains would be necessary if this need is to be met, and that such
effort would pay off. An analysis of existing supply chains shows discrepancies between con-
sumer expectations and the delivery of value, suggesting improvement opportunities to develop
these chains.
Keywords: value chain, consumer segmentation, agrifood, developing countries, Nepal Corresponding author: Tel: +61.7.54601093
Email: [email protected]
R. Collins: [email protected]
X. Sun: [email protected]
+The IFAMR is a non-profit publication. The additional support provided from this issue advertiser, Novus
International helps keep us open access and dedicated to serving management, scholars, and policy makers
worldwide.
Click here to view
authors’ intro video

Adhikari, Collins and Sun / International Food and Agribusiness Management Review / Volume 15, Issue 4, 2012
2012 International Food and Agribusiness Management Association (IFAMA). All rights reserved.
94
Background
In Nepal, both the government and donors have put concerted efforts into developing fresh
vegetable value chains through a series of donor funded projects within the last five years (World
Bank 2009; Shrestha 2010). Tomato, the most widely used fresh vegetable in Nepal, is identified
in most of these projects as having high potential for value chain development (Full Bright
Consultancy 2008).
The value chain concept has been described as a shift in mindset from a conventional producer-
focused supply-push approach to a consumer-oriented demand-pull approach (Collins 2009;
Fearne 2009). Thus, in principle, value chain development should take into account consumer
perspectives and should be guided by value as defined by consumers themselves.
The lack of a consumer perspective in chain development could negatively impact both the
development objectives of government and donors, and the business objectives of commercial
actors in the chains. Past development efforts without a value-based perspective have resulted in
problems such as oversupply or lack of response to market needs. At the same time, when
consumerism has driven agribusiness actors to align their business strategies and structures to
ensure greater consumer value (Boehlje 1999, Moser, Raffaelli, and Thilmany-McFadden 2011),
agrifood value chains that are more responsive to consumers become more effective, and thereby
more competitive (Trienekens 2011; Soosay, Fearne, and Dent 2012).
In spite of this evidence in the literature, a review of the Nepalese projects referred to above
showed no evidence of the adoption of a consumer perspective in the development of value
chains. In 2008, the Commercial Agriculture Development Project carried out a ‘Product Chain
Study’ for ten different agricultural commodities (including tomato) to explore value chain
development opportunities (Full Bright Consultancy 2008). None of these included consumers in
the analysis. Similarly, no other consumer-based study with a value chain development
perspective can be found in Nepal.
Therefore, this paper uses tomato as a case study crop to demonstrate how knowledge from
consumer research can be used in the development of fresh tomato value chains. First, the paper
segments consumers of tomato to explore value preferences for different segments of consumers.
Second, the structures and processes of existing tomato chains are examined. Then, implications
of the value preferences of different consumer segments are used to identify development
opportunities for existing chains.
Objectives
The broad objective of this paper is to identify needs and opportunities of value chain
development in the agrifood industry of Nepal using tomato as a case study crop. The specific
objectives are to segment consumers of tomato according to their characteristics and value
preferences, and to explore improvement opportunities in existing tomato chains based on
knowledge about consumer value. To guide the research process, these specific objectives are
expressed in the form of the following three research questions:
1. What are the different segments of tomato consumers in Kathmandu and their
characteristics and value preferences?

Adhikari, Collins and Sun / International Food and Agribusiness Management Review / Volume 15, Issue 4, 2012
2012 International Food and Agribusiness Management Association (IFAMA). All rights reserved.
95
2. What are the structures and processes of existing tomato chains that cater for these
consumers?
3. What are the implications of these analyses for tomato value chain development in
Nepal?
Research Approach I: Consumer Segmentation
A two-pronged methodological approach was used in this research. First, a consumer survey was
conducted to identify segments of consumers and their preferences on the attributes of tomato.
Second, the structure and processes of existing chains that cater to the surveyed consumers were
examined to identify the improvement opportunities.
The following sections highlight the methods used to understand segmentation of consumers and
their preferences.
Questionnaire Design
A checklist of product and process-based attributes of agrifood products in general and tomatoes
in particular was drawn from literature (Johansson et al. 1999; Sun and Collins 2002, 2007;
Kennedy et al. 2008; Collins 2009). Two focus group discussions were conducted amongst
tomato consumers in Kathmandu, the nation’s capital city, to identify relevant attributes for use
in the research design. As a result, eighteen product and process-based attributes were included
in a questionnaire (see Appendix 1) whose purpose was to identify the relative importance that
consumers attach to these attributes in their tomato purchasing decisions. Attributes included 12
intrinsic and six extrinsic product attributes, or 10 search, three experience and five credence
attributes (Ford, Smith and Swasy 1988; Grunert et al. 2005; Moser, Raffaelli and Thilmany-
McFadden 2011) (Table 1). Consumers’ attitudes and perceptions towards these 18 variables
were measured using a 5 point rating scale where 4 = very important, 3 = important, 2 = less
important, 1 = unimportant and 0 = do not know. The questionnaire also included questions
about consumers’ socio-demographic characteristics.
Table 1. Taxonomy of Variables Used in the Analysis
Attribute Search Experience Credence
Intrinsic
Color Shelf-life Freshness
Size Cooking quality Pesticide residue
Ripeness Taste Production location
Presence of peduncle1 Organic production
Pest-free
Extrinsic
Price Traceability
Packaging
Pack size
Shopping location
Display in shop
1 The stalk that supports the tomato fruit

Adhikari, Collins and Sun / International Food and Agribusiness Management Review / Volume 15, Issue 4, 2012
2012 International Food and Agribusiness Management Association (IFAMA). All rights reserved.
96
Primary Data Collection
Data was generated by market intercept consumer surveys conducted in May and June 2010 in
Kathmandu. Using a replacement lottery method (Kalton 1983), samples were drawn from the
pool of 51 representative retail outlets until 423 individual shopper samples had been allocated to
the respective outlets. In each selected outlet, consumers were interviewed randomly by selecting
the first and subsequently available tomato buyers whom the enumerator met at the exit of the
store. Out of the total 423 random samples drawn, 394 questionnaires were completed (see
Appendix 2).
Method of Segmentation
There is little research on segmentation techniques to guide value chain development in any sec-
tor in developing countries, and especially little that relates to the agrifood sector (Cunningham
2001). By comparison, in developed countries, consumer segmentation approaches have been
frequently used in marketing to devise customized strategies (Smith 1956; Dickson and Ginter
1987; Bock and Uncles 2002; Flint, Woodruff and Gardial 2002; Palmer and Millier 2004;
Verbeke, Vermeir and Brunsø 2007; Zhang et al. 2008; Zhang et al. 2010). Segmentation was
used in this research to develop value chain strategies focused on meeting the differing needs of
discrete segments among tomato consumers. A cluster analysis (CA) approach was used, as it is
a well-established method of multivariate analysis for consumer segmentation (Kettenring 2006).
In a heterogeneous market, CA segments consumers into homogeneous sub-groups (Hair et al.
2010) based on the variables used to classify them. CA is used in this research for the
exploratory purpose of developing a taxonomy of fresh tomato consumers and profiling them in
terms of their value preferences and socio-demographic characteristics. Such an approach has
two implications. First, it establishes baseline consumer value profiles in the Kathmandu fresh
vegetable market for comparison against future segmentation studies. Second, it demonstrates
that consumer segmentation studies can contribute to customized value chain strategies, thereby
contributing to value chain development among the actors and stakeholders of the system.
Design Issues in Cluster Analysis
Research design issues relevant to CA have been identified as adequate sample size, detection of
outliers, selection of similarity measures, and standardization of the data (Hair et al. 2010).
Addressing these issues is important in increasing the robustness of the analysis. The sample size
of 394 was large enough to draw valid conclusions since a minimum of 100 observations is
sufficient to perform segmentation using CA (Hair et al. 2010). An agglomeration schedule,
which is an output of CA, was used to detect outliers and no sample was found to have any role
in destabilizing outputs. A squared Euclidean distance measure was used as the measure of
distance. Standardization of the data was not needed since the unit of measurement was the same
for all variables.
A bivariate Pearson’s correlation coefficient (r) analysis revealed that three pairs of attributes,
namely packaging and pack size, taste and cooking quality, and organic production and
production location, were correlated ( r>0.5) (Allen and Bennett 2010). To reduce the effect of

Adhikari, Collins and Sun / International Food and Agribusiness Management Review / Volume 15, Issue 4, 2012
2012 International Food and Agribusiness Management Association (IFAMA). All rights reserved.
97
multicollinearity, three attributes with low rating values in each set, i.e. pack size, cooking
quality and production location, were dropped in the final analysis.
Hierarchical cluster analysis was used initially to identify the appropriate cluster size (Everitt et
al. 2011). Because hierarchical cluster analysis can provide as many cluster solutions as the
number of cases, the agglomeration schedule and dendrogram were used to derive a potential
range of appropriate cluster sizes. The agglomeration schedule revealed that a four or five cluster
solution maximized between-cluster heterogeneity without a large decrease in intra-cluster
homogeneity. The shape of the dendrogram supported this result since a slight shift along one
axis reduced cluster numbers from nine to five, a further small shift reduced cluster numbers to
four, but a shift of almost twice that distance was required to reduce cluster numbers to three.
Thus both the agglomeration schedule and the shape of the dendrogram supported either a four
or five cluster solution.
In the next stage, non-hierarchical cluster analysis using the k-means technique, which is more
robust (Pena, Lozano and Larranaga 1999; Hair et al. 2010; Everitt et al. 2011), was used to
segment consumers based on four and five-cluster alternatives. K-means analysis minimizes the
variance within clusters by continuing to reassign cases to the cluster whose centroid lies closest
to the case (Punj and Stewart 1983). It also fine tunes existing cluster solutions derived from the
hierarchical algorithm (Hair et al. 2010) and segments observations relatively evenly. Table 2
summarizes the distribution of cases for four and five-cluster solutions.
Table 2. Cross-Tabulation between Clusters for Four and Five-Cluster Solutions
Cluster Number of Cases (Five-cluster solution)
Total 1 2 3 4 5
Cluster number of
cases
(Four-cluster solution)
1 1 3 67 0 86 157
2 49 0 0 0 1 50
3 0 1 10 111 0 122
4 0 52 13 0 0 65
Total 50 56 90 111 87 394
In this research the four-cluster solution was selected because from a management perspective, a
solution with fewer clusters would be preferred for ease of interpretability (Trocchia and Janda
2003) and parsimony in strategic implementation (Hair et al. 2010).
Results of Consumer Segmentation
Cluster Characteristics
Clusters are characterized by analyzing the pattern reflected in the mean and mean-centered
values for each cluster as shown in Table 3, Figure 1 and Figure 2.

Adhikari, Collins and Sun / International Food and Agribusiness Management Review / Volume 15, Issue 4, 2012
2012 International Food and Agribusiness Management Association (IFAMA). All rights reserved.
98
Cluster 1
Cluster 1 contains 40% of the observations and is distinguished by relatively high means for the
credence attributes of freshness, presence of pesticide residue, traceability, and organic produc-
tion. This cluster has above average ratings for all attributes except packaging. A distinguishing
feature of this cluster is the lowest mean value for price, indicating that this group values quality
over price. Members of this group appear to be discerning consumers who look for premium
products. Being the largest cluster and attaching such importance to credence attributes, this
cluster has strategic significance from a value chain development perspective.
Cluster 2
Cluster 2 contains 13% of the observations and is most distinguished by the lowest mean value
for the presence of pesticide residue. Consumers in this group are more concerned about extrin-
sic attributes, primarily the shopping location and the overall look of the product, and are less
concerned about credence and process-based attributes, such as traceability and organic produc-
tion. This group of consumers may be relatively unresponsive to health and food safety initia-
tives.
Cluster 3
Cluster 3 comprises 31% of total observations and is the second largest. Its most distinguishing
feature is that consumers in this cluster place the highest importance on price compared with
other clusters and have the highest mean values for physical product attributes such as color,
size, shelf-life and ripeness and the lowest means for credence attributes such as traceability and
organic production.
Cluster 4
Cluster 4 contains 16% of total observations. The distinguishing feature of this cluster is that it
has the lowest means for product external and physical attributes such as color, size, ripeness and
pest free status. Although consumers in this group gave below average ratings for most other at-
tributes, they are second to cluster 1 in their preferences for presence of the peduncle, traceability
and organic production, which are considered important features associated with health and food
safety. Thus the most notable feature of this cluster is that its consumers seem concerned about
features that add value to health and food safety, while being below average on preferences for
other attributes.
The underlying structures of these observations reveal that cluster 1 consists of consumers who
place importance on most of the product and process-based attributes and are less concerned
about price compared to other attributes. Cluster 2 comprises consumers who have the least con-
cern about pesticide residues and more concern about where they shop and the physical appear-
ance of the product. Consumers in cluster 3 are relatively sensitive to physical attributes, less
concerned about production related processes, and most concerned about price. Consumers in
cluster 4 are below average for most attributes but are highly concerned about product features
that are associated with food safety and health.

Adhikari, Collins and Sun / International Food and Agribusiness Management Review / Volume 15, Issue 4, 2012
2012 International Food and Agribusiness Management Association (IFAMA). All rights reserved.
99
Tab
le 3
. M
eans
Val
ues
and M
ean
-Cen
tere
d V
alues
fro
m K
-Mea
ns
Clu
ster
Anal
ysi
s

Adhikari, Collins and Sun / International Food and Agribusiness Management Review / Volume 15, Issue 4, 2012
2012 International Food and Agribusiness Management Association (IFAMA). All rights reserved.
100
Figure 1. Distribution of Mean Values of Clustering Variables in Four-Cluster Solution
Figure 2. Distribution of Mean-Centred Values of Clustering Variables in Four-Cluster Solution
Consumer Profiles
Having characterized the clusters on the basis of consumers’ responses to product and process-
based attributes, they can be characterized by the socio-demographic profile of their membership
to examine underlying relationships between the preferences to attributes and the socio-
demographic profiles of their consumer members.
Table 4 presents a result of Chi-square tests that compare clusters against gender, education,
family structure, preferred shopping location and income. Education, family structure, preferred
shopping location and income were statistically significant in explaining variations in the prefer-
ences of consumers, a result that supports the distinctiveness of the clusters.

Adhikari, Collins and Sun / International Food and Agribusiness Management Review / Volume 15, Issue 4, 2012
2012 International Food and Agribusiness Management Association (IFAMA). All rights reserved.
101
Table 4. Chi-Square Test of Consumer Segments against Socio-Demographic Variables
Value df Asymp. Sig. (2-sided)
Gender 5.942 3 .114
Shopping location 64.545 15 .000
Education 60.625 12 .000
Family Income 59.364 15 .000
Family composition 12.860 3 .005
Chi-square (X2) = p <.05
Further, a cross-classification of clusters based on the socio-demographic features by which the
clusters differ significantly (shopping location, education, family income, and family
composition) provides a profile of each consumer segment. Based on the cross-classification
analysis, the four resulting segments of consumers are labeled as high-value discerning consum-
ers, low-value institutional consumers, price-centric non-informed consumers and low-value
rational consumers.
High-Value Discerning Consumers
Consumers in this cluster are discerning individuals who value premium products over price.
Their main concerns are about process and credence attributes such as freshness, organic
production, traceability and pesticide residue. Approximately 85% of consumers in supermarkets
fall into this category, indicating that supermarket consumers have greater concerns about food
safety and health. About 50% of consumers who purchase tomatoes in corner shops are also in
this category. Since prices are usually more expensive in supermarkets and corner shops when
compared to other outlets, the expressed low concern of these consumers about price in favor of
other attributes is consistent with their actions. Almost 75% of these consumers come from high-
er income brackets and 90% of them are either high school or college graduates. At the house-
hold level, 47% of consumers whose family size is less than 4 are in this cluster. This cluster
therefore represents consumers who are educated, have higher incomes, prefer to shop in specific
permanent locations such as supermarkets and corner shops, and seek and are willing to pay for a
premium product. Thus they are labeled ‘high value discerning’ consumers.
Low-Value Institutional Consumers
The most striking feature of the consumers in the second cluster is their lowest rating for concern
about pesticide residues and highest rating for product display in the shop. Combined with their
major concern for low price and ripeness, it is possible that the importance they attach to display
in the shop is associated with being able to buy ripe fruit for a low price. Based on observations
during the survey period, consumers in this cluster are institutional buyers who were purchasing
over-ripe tomatoes towards the end of each day at low prices. The local vegetable market is the
preferred buying location for 46% of these consumers, and none of them shop at supermarkets.
Educationally, around half of them are high school graduates and only 8% have a university
degree. More than 80% of them are in the middle income bracket. Interestingly, no respondent

Adhikari, Collins and Sun / International Food and Agribusiness Management Review / Volume 15, Issue 4, 2012
2012 International Food and Agribusiness Management Association (IFAMA). All rights reserved.
102
who earns less than NRs5,000 (USD59.442) per month (the low income bracket) is in this cluster.
This group also has the largest family size of any cluster.
Data reveals that many consumers in this cluster are consumers who operate institutions such as
low-standard hotels and catering services. They buy over-ripened tomatoes at low prices but their
preferred shopping locations do not include street vendors and pedestrian markets, which are low
value markets in the Nepalese context. They want regular suppliers who can consistently supply
very ripe tomatoes, so they choose wholesale and local vegetable markets because of the high
volumes transacted and the associated high levels of over-ripeness and waste. Thus they are la-
beled in this analysis as ‘low-value institutional’ consumers.
Price-Centric Non-Informed Consumers
Consumers grouped in cluster 3 are very price-sensitive and most concerned about the product’s
external physical attributes. While they express some concern about pesticide residues, they
show low levels of concern for health and food safety related credence attributes. Given that in-
formed consumers tend to place high importance on credence attributes (Verbeke, Vermeir and
Brunsø 2007), consumers in this group appear to have little knowledge of, or concern for, the
attributes about which today’s more informed consumers are most sensitive. In terms of educa-
tion, this cluster contains diverse membership. Among consumers with no formal education,
45% are in this cluster, yet half the cluster’s members are university graduates. A little more than
half (52%) of the consumers in this cluster are in the income bracket of NRs10,000-20,000
(USD118.88-237.76) per month, which is below the poverty line in Nepal for a family of four
members or more. Most of them (57%) prefer shopping in local vegetable markets, where they
get a wide range of choices on price. In this cluster, 58% have a relatively large family size of
more than 4 members. This group of consumers is labeled as ‘price-centric non-informed’ con-
sumers.
Low-Value Rational Consumers
Consumers in cluster 4 express below average ratings for all variables except presence of the
peduncle, shopping location, traceability and organic production. Their ratings for intrinsic
attributes of the product, such as color, freshness, size, shelf-life, ripeness, and taste, and
extrinsic attributes such as packaging, are the lowest among all clusters. However, their rating
for traceability and organic production is higher, and for price is lower, than ‘low value institu-
tional’ consumers and ‘price-centric non-informed’ consumers. Their higher rating for health and
safety related attributes, traceability and organic production, and low rating for price demon-
strates a level of rationality at a time when consumers are becoming very sensitive to these is-
sues.
A distinguishing socio-demographic characteristic of this group is that around 80% of them are
low income earners. In spite of this, they do not believe that price is the most important attribute
in buying tomatoes and they place greater importance on products’ credence attributes than
physical attributes. With a low ability to pay high prices, yet high value attached to credence
attributes, these consumers are labeled as ‘low-value rational’ consumers.
2 Dollar equivalence is based on an NR100:USD1.18 exchange rate of as at 17 January 2012 (Source:
www.oanda.com)

Adhikari, Collins and Sun / International Food and Agribusiness Management Review / Volume 15, Issue 4, 2012
2012 International Food and Agribusiness Management Association (IFAMA). All rights reserved.
103
Implication for Value Chain Development
The segmentation analysis shows that the largest segment of consumers place value on credence
attributes such as freshness, pesticide residue, traceability and organic production. These are
attributes that can only be delivered and guaranteed by a whole of chain approach. Individual
firms must play a role, but no firm in isolation can guarantee freshness, food safety, traceability,
freedom from residues, and so on. Zero tolerance for pesticide residues, mandatory systems for
food safety and product traceability and increasing interest in organic production are becoming
common features of food retailing (e.g. Gil, Gracia and Sanchez 2000; Porter, Baker and
Agrawal 2011). As similar concerns among consumers become evident in the analysis, the need
to adopt value chain approaches becomes more obvious. Delivering these attributes requires
more aligned processes, more reliable information and greater collaboration among chain mem-
bers – the building blocks of value chain management. Further, this analysis demonstrates that
value chains that are responsive to consumers can generate more income. The ‘high value dis-
cerning consumer’ segment places less emphasis on price and more on the product’s credence
attributes, suggesting that these consumers would pay a premium price for credence attributes.
These findings, therefore, could be useful in stimulating value chain development among actors
wishing to target higher value consumers, the largest segment of the consumer population in this
study and the segment which places greatest importance on credence-based attributes. The next
section examines the structures and processes of tomato chains which catered for the population
of consumers from which the survey samples were drawn.
Research Approach II: Examining Tomato Supply Chains
The following sections examine the structures and processes of existing tomato chains which
serve consumers in Kathmandu. Results are based on interviews with 27 actors in existing
tomato chains and observations of the chains’ operations. Fieldwork was carried out between
April and September 2010. These case study chains originated from Kavre and ended in retail
outlets in Kathmandu. Kavre is one of the major tomato growing districts, and Kathmandu is the
most populated city in Nepal. Checklist-based observations during value chain walks, in-field
observations and semi-structured interviews with the actors of the chains, and additional memos
generated during data collection and analysis, constitute the sources of data.
Structures
The purpose of the analysis was to identify improvement opportunities within existing chains
through the lens of consumer value. Chains that are guided by a knowledge of consumers
become more responsive, effective and competitive (Bonney et al. 2007; Collins 2009; Soosay,
Fearne and Dent 2012), with the potential to become value chains. A value chain is a relation-
ship-based governance structure, focused on value creating activities (Boehlje 1999) which bring
a product or service from its origin to its end use (Kaplinsky and Morris 2001) in such a way that
the process efficiently and effectively delivers value as defined by the consumers (Collins 2009).
The tomato chains in this study comprised of actors in five different roles: farmers, commission
agents, wholesalers, wholesaler cum supplier, and retailers. Chain processes start from farmers
who have been producing tomatoes commercially for more than two decades. They supply the
product to wholesalers either directly or through commission agents who collect and assemble
the product from farmers and deliver to wholesalers. Wholesalers are individual traders operating

Adhikari, Collins and Sun / International Food and Agribusiness Management Review / Volume 15, Issue 4, 2012
2012 International Food and Agribusiness Management Association (IFAMA). All rights reserved.
104
at the country’s largest fresh produce wet market. They link chain activities between the
upstream and downstream actors, supplying products to the retailers.
Consumers buy tomatoes mainly from retailers, and occasionally from wholesalers. There are
five different categories of retail outlets: supermarkets, vegetable corner shops, local vegetable
markets, pedestrian markets, and street vendors. Supermarkets and vegetable corner shops are
characteristically similar and are considered as high end retail market for fresh vegetables, gen-
erally targeted by convenience and quality seeking consumers. Local vegetable markets are wet
markets where a number of retailers operate side by side. This is the preferred shopping location
for bargain seeking consumers with no time constraints. Pedestrian markets and street vendors
are considered low end retail markets. Pedestrian markets are roadside markets with a less hy-
gienic market environment. Street vendors purchase low quality or low priced product from wet
markets and offer door to door services to consumers.
Depending on the types of retail outlets involved, the product reaches consumers through three
different types of chain: one that serves retailers in the local vegetable markets, one that serves
supermarkets/vegetable corner shops and another that serves pedestrian markets or street ven-
dors. Except for the chain that involves supermarkets in which a wholesaler-cum-supplier links
between the wholesalers and the supermarket, the structures are similar across these chains. Alt-
hough the majority of actors in these chains are engaged in continuous transactional relation-
ships, there is no evidence of collaboration at any stage of the chain. Each actor is structurally
and functionally independent.
With respect to the volumes of product and future growth prospects, chains that lead to local
vegetable markets and supermarkets are significant. The majority of tomato production flows
through local vegetable markets. Although the supermarket share of total volume was negligible
at the time of data collection, it was growing rapidly. There was only one supermarket which had
fresh vegetables as a product line in 2010. This supermarket had two retail outlets with a daily
volume of transaction around 100 kg from each outlet. The number of outlets increased to five
within the two years between 2010 and 2012. With a growing middle income population in the
country, the potential for supermarket growth seems high. Therefore, these two chains are in-
cluded in the further analysis.
Processes
The matrix presented in Table 5 summarizes the main processes of the tomato supply chains
related to product flow (column 1), major activities within each process and their relative
importance (column 2), and improvement activities (column 3). Based on their impact on
creating or adding value to the final product, activities in column 2 are further sub-divided into
value-adding activities, necessary but not value-adding activities and waste activities (Bonney et
al. 2007). An activity that adds value to the final product is defined by the consumer as value-
adding. This activity relates to final product attributes that consumers value. Necessary but not
value-adding activity is activity that does not directly add value to the product but which cannot
be removed under the prevailing state of technology. Waste is activity that either reduces product
value or is unnecessary, and which can be removed without compromising the value of the final
product. Improvement activity is that activity which, if incorporated in the existing process, can
improve the efficiency or effectiveness of the chain.

Adhikari, Collins and Sun / International Food and Agribusiness Management Review / Volume 15, Issue 4, 2012
2012 International Food and Agribusiness Management Association (IFAMA). All rights reserved.
105
So
urc
e.
Fie
ld S
urv
ey 2
01
0
Pro
cess
es
Rel
ati
ve
imp
ort
an
ce
of
pre
vail
ing
act
ivit
ies
Imp
rovem
en
t op
port
un
itie
s
Valu
e-a
dd
ing
act
ivit
ies
Nec
essa
ry b
ut
not
valu
e-a
dd
ing
Wast
e
Incorp
orati
ng
valu
e-a
dd
ing
act
ivit
y
Red
uci
ng
wast
e
Inpu
t
man
agem
ent
Man
agin
g s
eed
M
anag
ing f
erti
lize
r,
irri
gat
ion
and
pes
tici
de
M
anag
ing p
ost
-pro
du
ctio
n
acti
vit
ies
Pro
du
ctio
n
Sel
ecti
ng
var
iety
an
d
pro
du
cin
g
tom
ato
, S
takin
g
du
rin
g
pro
du
ctio
n
Nu
rser
y,
tran
spla
nti
ng
seed
lin
g,
mu
lch
ing,
fert
iliz
ing,
irri
gat
ing,
har
ves
tin
g
Usi
ng e
xce
ssiv
e am
ou
nt
of
pes
tici
des
S
ort
ing a
nd
gra
din
g,
apply
ing
pro
per
har
ves
tin
g t
imin
g a
nd
tech
niq
ue
such
as
pic
kin
g i
n
tim
e an
d w
ith
sta
lk
Red
uci
ng u
nn
eces
sary
use
of
pes
tici
des
Lo
gis
tics
T
ran
spo
rtin
g
pro
du
ct i
n t
ime
Man
agin
g c
rate
s,
coll
ecti
ng p
rodu
ct
fro
m f
ield
, lo
adin
g i
n
veh
icle
, an
d u
nlo
adin
g
Tra
nsf
erri
ng i
nto
cra
tes,
over
fil
lin
g
into
cra
tes,
pu
ttin
g o
ther
veg
etab
les
on
to
p o
f lo
aded
cra
tes
wh
ile
tran
spo
rtin
g
Usi
ng s
pec
iali
zed
veh
icle
s su
ch
as r
efri
ger
ated
van
an
d
imp
rovis
ing v
ehic
les
to
tran
spo
rt p
last
ic c
rate
s
All
ow
ing s
top
-fre
e
mo
vem
ents
of
veh
icle
s
wit
h f
resh
veg
etab
les
by
go
ver
nm
ent
Wh
ole
sale
Sel
lin
g p
rodu
ct e
arly
in m
orn
ing
Ass
emb
lin
g t
om
ato
es f
rom
dif
fere
nt
sou
rces
, tr
ansf
erri
ng f
rom
cra
te t
o
crat
e th
ereb
y i
ncr
easi
ng h
and
lin
g a
nd
red
uci
ng q
ual
ity,
con
sum
ing m
ore
lab
or
and
tim
e
Est
abli
shin
g t
race
abil
ity
mec
han
ism
s to
ass
ure
cre
den
ce
attr
ibu
tes
Ass
emb
lin
g p
rodu
cts
acco
rdin
g t
o q
ual
ity,
esta
bli
shin
g c
han
nel
to
red
irec
t q
ual
ity p
rod
uct
dir
ectl
y t
o r
etai
lers
Su
pp
ly t
o
Su
per
mar
ket
C
oll
ecti
ng r
equir
ed
qu
anti
ty o
n s
earc
h
qu
alit
y,
sort
ing,
del
iver
ing t
o
sup
erm
arket
B
uyin
g p
rod
uct
dir
ectl
y f
rom
farm
ers
hav
ing c
apab
ilit
y t
o
sup
ply
qu
alit
y p
rod
uct
s
Ret
ail:
lo
cal
veg
etab
le m
ark
et
D
isp
layin
g a
nd
tran
sact
ing
G
rad
ing a
nd
lab
elin
g w
ith
cred
ence
att
rib
ute
s
Ch
ann
elin
g t
o r
igh
t
con
sum
er s
egm
ents
Ret
ail:
sup
erm
arket
G
rad
ing,
pac
kag
ing,
dis
pla
yin
g i
n c
lean
envir
on
men
t,
del
iver
ing q
ual
ity
bas
ed o
n s
earc
h
attr
ibu
tes
P
rom
oti
ng c
red
ence
att
ribu
tes,
lab
elin
g p
rodu
cts
wit
h c
red
ence
attr
ibu
tes,
su
pp
lyin
g f
resh
pro
du
ct
Tab
le 5
. P
roduct
Flo
w P
roce
sses
: Im
port
ant
Act
ivit
ies
and I
mpro
vem
ent
Opport
unit
ies

Adhikari, Collins and Sun / International Food and Agribusiness Management Review / Volume 15, Issue 4, 2012
2012 International Food and Agribusiness Management Association (IFAMA). All rights reserved.
106
The matrix shows that the chains’ processes are not aligned so as to assure consumers that the
products are fresh, pesticide free, traceable and organic, leading to a mismatch between the
expectations of the highest value consumer segment and the delivery of product attributes by
existing supply chains. This could be a reason for tomato being a low value commodity across
the chains. These chains’ processes, however, are delivering the majority of the value for other
segments of consumers. The chains measure the quality of the products based on search
attributes of product such as size, color and pest damage. Segmentation analysis reveals that the
other segments of consumers generally value these search attributes in tomatoes.
Support Functions
Government and development partners have long been important stakeholders of agricultural
development in Nepal (Mellor 1995; NPC 2007; Shrestha and Adhikari 2010). Generally they
support farmers on technology transfer and social mobilization, and traders on market infrastruc-
ture development and management support. Farmers in these chains have not yet received any
direct support from government. Indirectly, one government policy has helped these farmers to
buy some fertilizer from a semi-government institution. Similarly, the market where these
wholesalers operate was developed by the government with support from the United Nation’s
Capital Development Fund. Established by a government regulation, a market development
board manages the wholesale market’s operations. Except for these examples of indirect support,
no actors in these chains have received any support from government or development partners
that would help them to develop value chains.
Indirect support from government also does nothing to add specific value to the product as
defined by high value discerning consumers. Rather, some of the government regulations have
created wastage. Vehicles carrying fresh vegetables are allowed to enter the wholesale market
only between 6 p.m. and 7 a.m. Despite carrying perishable products, they are not exempt from
non-stop movement on the highway. If a vehicle cannot enter the market before 7 a.m. due to
stoppage at a checkpoint or an incident on the highway, the lead time for vegetables to reach
consumers increases, leading to waste creation in the chain.
Results from the Analysis of Chains
The research suggests that existing chains are responsive to the value attributes of all consumer
segments other than the largest segment, which contains high value discerning consumers. These
chains are incapable of meeting the expectation of the most valued consumers for the following
reasons.
First, the chains are lengthy. A longer chain increases the lead time of product flow to the
consumer. This also increases the frequency of handling of the product, and thus increases the
chances of product damage. In this case, the longer the chain the lower its efficiency. Further, it
becomes more difficult to establish the product’s credence attributes in a longer chain.
Second, stages in the chain after production are not adding significant value to the product,
though they capture a large proportion of the product’s retail value. Since there is little value
addition after production, tomato is traded as a commodity throughout all retail outlets. Having
identified different segments of consumers with different value preferences and multiple uses of

Adhikari, Collins and Sun / International Food and Agribusiness Management Review / Volume 15, Issue 4, 2012
2012 International Food and Agribusiness Management Association (IFAMA). All rights reserved.
107
the product, the analysis shows that tomato has untapped potential for product differentiation.
Not even the supermarket, a high end retail outlet, has added value to the product according to
the preferences of its consumers. For example, it is sourcing tomatoes from wet markets where
traceability disappears.
Third, government and development partners are providing indirect support at the production and
marketing stages, but there is no direct support and no chain-wide support. The product flow
matrix shows that government policy can add to, or therefore reduce, wasteful activities. The
analysis offers the following managerial and policy implications with respect to improvement in
existing chains so as to cater for the needs of high value consumer segments.
Managerial Implications for Actors in the Chains
The findings offer prospects for improvement both in chains that are significant from a growth
perspective (supermarkets) and a volume perspective (wet markets). Chains involving
supermarkets can target high value consumers and there is some prospect of shortening these
chains. Few actors are involved in creating or adding consumer value, most of which is deter-
mined in the production stage. Findings provide a rationale for chain members to engage in
shorter but more collaborative value chains to deliver attributes that high value consumers will
pay for. Shortening the length of chains also reduces lead time, improving freshness, and
improves the assurability of credence attributes.
The brand image of supermarkets requires vigilance in offering products that are safe and
healthy. Supermarkets can quickly lose market share if there is food safety incident, thus they
stand to benefit by engaging with their supply chains. Likewise, upstream actors aspire to devel-
op value chains with supermarket to gain access to high end retail outlets and their high value
consumers. Unfortunately, developing chain relationships with supermarkets is challenging, and
actors must demonstrate their ability to reliably deliver a quality product. Greater collaboration
with government and development partners may help upstream actors develop these abilities.
Since these stakeholders are committed to developing fresh vegetable value chains through fund-
ed programs, commercial actors have an opportunity to develop the necessary attitudes, skills
and resources to re-orient themselves to value chain ways of doing business. Therein lies shared
value for all. By delivering higher value to consumers and by reducing costs, the value chain
development objectives of government and development partners can be achieved. At the same
time, actors would become more competitive and consumers would receive greater value.
Chains that involve wet market retailers can improve their chain performance by reducing the
waste at each stage. These chains are already delivering the majority of the attributes identified
by other segments of consumers, but could do so more efficiently. Lowering costs improves
competitiveness.
Policy Implications for Stakeholders of the Chains
Although the government is offering competitive grants to develop fresh vegetable value chains,
the actors in chains have not benefited from these opportunities. Findings from consumer seg-
mentation suggest that the greatest payoff from value chain development will come from efforts
to target high value discerning consumers. Since these consumers will pay for value that is

Adhikari, Collins and Sun / International Food and Agribusiness Management Review / Volume 15, Issue 4, 2012
2012 International Food and Agribusiness Management Association (IFAMA). All rights reserved.
108
largely created at the production stage but must be delivered and guaranteed at modern retail out-
lets, future support from the government and donors may be targeted at building examples of
such chains.
Relatively small interventions from the government can also address wastage and inefficiency
(Adhikari 2008) such as injudicious use of pesticides, actors’ dependence on input-suppliers for
technical knowledge, losses during transport due to use of inappropriate transport materials, and
increased transport times.
Furthermore, segmentation analysis reveals that ‘low value institutional consumers’ are acting
with a level of ignorance. Having knowledge that such a segment does exist, government can
devise policies that minimize such moral hazards, in partnership with development partners who
can implement awareness programs targeting these consumers. During data collection, it was
observed that consumers were buying tomatoes with visible traces of pesticides and later
confirmed that they lacked knowledge about the dangers of pesticide residues. Thus consumer
awareness of credence attributes could become a strategic objective for public stakeholders in
fresh produce value chain development.
Conclusion
In earlier sections, findings from consumer segmentation established a need for value chain
development in the context of this study. The results show that tomato consumers in Kathmandu
clearly differ in their preferences and characteristics. Perhaps surprisingly, high value consumers
represent the largest segment, which provides an incentive for chain actors to change their
practices. As these consumers seek attributes that can only be delivered through whole of chain
efforts, a value chain approach applied to this segment might serve as a demonstration of the
benefits of such an approach more widely in the agrifood sector of Nepal.
Findings from the segmentation analysis, along with the analysis of existing chains, reveal gaps
between the expectations of consumers and the ability of actors to deliver desired product
attributes. This gap is most prominent in the high value consumer segment and in chains servic-
ing high value retail outlets. Consumer segmentation analysis identifies value expectations of
consumers, while chain analysis guides where and how value attributes can be created.
With growing knowledge among consumers, more awareness by stakeholders and actors in agri-
food chains, a growing middle income population, and more supermarkets in developing coun-
tries, the numbers of consumers who attach value to credence attributes are expected to increase
in the future. At the same time, even in a least-developed country such as Nepal, more strict food
safety and quality regulations are expected to be enacted in response to incidences of food borne
diseases in Nepal and elsewhere. Greater knowledge from consumer segmentation, as shown in
this study, when combined with these forces driving food safety and quality, will enhance oppor-
tunities for value chain development in Nepal. This is an approach that government and
development partners are promoting in the country as a means of achieving commercialization in
agriculture, but limitations in existing programs where consumer value is not taken into account,
must be addressed, as shown in this study.

Adhikari, Collins and Sun / International Food and Agribusiness Management Review / Volume 15, Issue 4, 2012
2012 International Food and Agribusiness Management Association (IFAMA). All rights reserved.
109
Limitations, Future Research and Contributions
Limitations and Future Research
Yankelovich and Meer (2006) argue that the three constraints that limit the benefits of
segmentation are distraction from production features to consumers’ identity, little emphasis on
actual consumer behavior, and undue emphasis on technical features of segmentation rather than
on practical implication. This study addresses the first and third constraints by using product and
process-based attributes for segmentation, and applying simple and frequently used methods of
segmentation. Taking Yankelovich and Meer’s (2006) perspective, this study does not account
for consumers’ actual purchase behavior directly, but by conducting surveys in actual market
settings immediately after consumers’ purchase actions, it was expected that their survey
responses were a close reflection of their actual behavior. A design that could have included both
perceptions and actual behaviors may have further strengthened the study’s validity.
This study has used variables related to consumers’ preferences for product benefits as the basis
for segmentation because the objective of the study was to identify different consumer value
profiles. Choice barriers, which refer to consumers’ inability to maximize their utility due to lack
of knowledge (Bock and Uncles 2002), were not used as a basis for segmentation in this study.
Verbeke et al. (2007) argue that consumers who are involved with product quality and have
greater confidence to evaluate that quality, tend to place higher value on credence-based
attributes than search attributes. This implies that ratings for credence-based attributes such as
traceability, food safety and responsible production systems, would be higher for more informed
consumers. The lower importance attached to some of these attributes in this study by a majority
of consumers suggests a possible choice barrier among Nepalese tomato consumers. Future
research may include choice barriers as a basis for segmentation to further refine the analysis.
Also, the roles of different stakeholders such as government and development partners in
reducing choice barriers could be explored.
Further research might also explore similarities and differences among the actors and stakehold-
ers in agrifood chains in terms of their understandings of consumer value preferences and the
impacts these differences have on partner selection and collaboration in value chain
development.
Contribution
This study contributes to the segmentation literature by including both product and process-based
attributes specific to tomato consumers in Nepal, a developing country. The study also demon-
strates how consumer research can be useful in developing or improving value chains for a fresh
agricultural product. The approach adopted in this study would provide a basis for developing
value chain management strategies in similar country and industry contexts. Most importantly,
this study is among the first to link consumer segmentation to value chain development in a
developing country.

Adhikari, Collins and Sun / International Food and Agribusiness Management Review / Volume 15, Issue 4, 2012
2012 International Food and Agribusiness Management Association (IFAMA). All rights reserved.
110
References
Adhikari, R.P. 2008. Linking farmers to markets: a supply chain approach. Agriculture
Development Journal 5 (5):146-158.
Allen, P.J., and K. Bennett. 2010. PASW statistics by SPSS : a practical guide : version 18.0.
South Melbourne, Victoria: Cengage Learning.
Bock, T., and M. Uncles. 2002. A taxonomy of differences between consumers for market
segmentation. International Journal of Research in Marketing 19 (3):215-224.
Boehlje, M. 1999. Structural changes in the agricultural industries: how do we measure, analyze
and understand them? American Journal of Agricultural Economics 81 (5):1028.
Bonney, L., R. Clark, R. Collins and A. Fearne. 2007. From serendipity to sustainable
competitive advantage: insights from Houston's farm and their journey of co-innovation.
Supply Chain Management: An International Journal 12 (6):395 - 399.
Collins, R. 2009. Value chain management and postharvest handling: partners in
competitiveness. In Postharvest Handling: A Systems Approach, edited by W.J.
Florkowski, R.L. Shewfelt, B. Brueckner and S.E. Prussia: Elsevier.
Cunningham, D.C. 2001. The distribution and extent of agrifood chain management research in
the public domain. Supply Chain Management: An International Journal 6 (5):212-215.
Dickson, P.R., and J.L. Ginter. 1987. Market segmentation, product differentiation, and
marketing strategy. The Journal of Marketing 51 (2):1-10.
Everitt, B.S., S. Landau, M. Leese, and D. Stahl. 2011. Cluster analysis. Hoboken: Wiley.
http://onlinelibrary.wiley.com.ezproxy.library.uq.edu.au/book/10.1002/9780470977811
(accessed November 10, 2011).
Fearne, A. 2009. Sustainable food and wine value chains. Government of South Australia.
Flint, D.J., R.B. Woodruff, and S.F. Gardial. 2002. Exploring the phenomenon of customers'
desired value change in a business-to-business context. Journal of Marketing 66 (4):102-
117.
Ford, G.T., D.B. Smith, and J.L. Swasy. 1988. An empirical test of the search, experience and
credence attributes framework. Advances in Consumer Research 15 (1):239-243.
Full Bright Consultancy. 2008. Product chain study tomato. Biratnagar, Nepal: Commercial
Agriculture Development Project.
Gil, J.M., A. Gracia, and M. Sanchez. 2000. Market segmentation and willingness to pay for
organic products in Spain. International Food and Agribusiness Management Review 3
(2):207-226.

Adhikari, Collins and Sun / International Food and Agribusiness Management Review / Volume 15, Issue 4, 2012
2012 International Food and Agribusiness Management Association (IFAMA). All rights reserved.
111
Grunert, K.G., L.F. Jeppesen, K.R. Jespersen, A. Sonne, K. Hansen, T.Trondsen, and J.A.
Young. 2005. Market orientation of value chains: a conceptual framework based on four
case studies from the food industry. European Journal of Marketing 39 (5/6):428-455.
Hair, J.F., W.C. Black, B.J. Babin, and R.E. Anderson. 2010. Multivariate data analysis. Upper
Saddle River, N.J.: Pearson Prentice Hall.
Johansson, L., A. Haglund, L. Berglund, P. Lea, and E. Risvik. 1999. Preference for tomatoes,
affected by sensory attributes and information about growth conditions. Food Quality and
Preference 10 (4-5):289-298.
Kalton, G. 1983. Introduction to survey sampling. Newbury Park, Calif. ; London: SAGE.
Kaplinsky, R., and M. Morris. 2001. A handbook for value chain research. Report prepared for
IDRC.
Kennedy, Jean, M. Worosz, E.C. Todd, and M.K. Lapinski. 2008. Segmentation of US
consumers based on food safety attitudes. British Food Journal 110 (7):691-705.
Kettenring, J.R. 2006. The practice of cluster analysis. Journal of Classification 23:3-30.
Mellor, J. 1995. Nepal: Agriculture Perspective Plan. Agriculture Project Support Centre and
John Mellor Associates. Kathmandu: Government of Nepal.
Moser, R., R. Raffaelli, and D. Thilmany-McFadden. 2011. Consumer preferences for fruit and
vegetables with credence-based attributes: a review. International Food and Agribusiness
Management Review 14 (2):121-142.
NPC. 2007. Three year interim plan. Kathmandu: National Planning Commission.
Palmer, R.A., and P. Millier. 2004. Segmentation: identification, intuition, and implementation.
Industrial Marketing Management 33 (8):779-785.
Pena, J.M., J.A. Lozano and P. Larranaga. 1999. An empirical comparison of four initialization
methods for the k-means algorithm. Pattern Recognition Letters 20 (10):1027-1040.
Porter, J.K., G.A. Baker, and N. Agrawal. 2011. The US produce traceability initiative: analysis,
evaluation, and recommendations. International Food and Agribusiness Management
Review 14 (3):45-66.
Punj, G., and D.W. Stewart. 1983. Cluster analysis in marketing research: review and
suggestions for application. Journal of Marketing Research 20 (2):134-148.
Shrestha, R.K., and R.P. Adhikari. 2010. Implementation of value chain approach within the
framework of Ministry of Agriculture and Cooperatives: a case study of Commercial
Agriculture Development Project. Agriculture Development Journal 7 (7):71-79.

Adhikari, Collins and Sun / International Food and Agribusiness Management Review / Volume 15, Issue 4, 2012
2012 International Food and Agribusiness Management Association (IFAMA). All rights reserved.
112
Shrestha, S. 2010. Special evaluation study on support to agriculture value chains development
for inclusive growth. Asian Development Bank, Manila.
Smith, W.R. 1956. Product differentiation and market segmentation as alternative marketing
strategies. The Journal of Marketing 21 (1):3-8.
Soosay, C., A. Fearne, and B. Dent. 2012. Sustainable value chain analysis – a case study of
Oxford Landing from “vine to dine”. Supply Chain Management: An International
Journal 17 (1):68-77.
Sun, X. and R. Collins. 2002. Attitudes and consumption values of consumers of imported fruit
in Guangzhou, China. International Journal of Consumer Studies 26 (1):34-43.
———. 2007. The application of fuzzy logic in measuring consumption values: Using data of
Chinese consumers buying imported fruit. Food Quality and Preference 18 (3):576-584.
Trienekens, J. 2011. Agricultural value chains in developing countries a framework for analysis.
International Food and Agribusiness Management Review 14 (2):51-82.
Trocchia, P.J., and S. Janda. 2003. How do consumers evaluate internet retail service quality?
Journal of Services Marketing 17 (3):243-253.
Verbeke, W., I. Vermeir, and K. Brunsø. 2007. Consumer evaluation of fish quality as basis for
fish market segmentation. Food Quality and Preference 18 (4):651-661.
World Bank. 2009. Project for Agriculture Commercialization and Trade (PACT): project
implementation document appraisal stage. World Bank.
Yankelovich, D. and D. Meer. 2006. Rediscovering market segmentation. Harvard Business
Review 84 (2):122-131.
Zhang, X., H. Dagevos, Y. He, I. v. d. Lans, and F. Zhai. 2008. Consumption and corpulence in
China: A consumer segmentation study based on the food perspective. Food Policy 33
(1):37-47.
Zhang, X., J. Huang, H. Qiu, and Z. Huang. 2010. A consumer segmentation study with regards
to genetically modified food in urban China. Food Policy 35 (5):456-462.

Adhikari, Collins and Sun / International Food and Agribusiness Management Review / Volume 15, Issue 4, 2012
2012 International Food and Agribusiness Management Association (IFAMA). All rights reserved.
113
Appendix 1
Consumer Survey Questionnaire
Location of Survey (Market center):
Date of Survey: Respondent's Gender: Male Female
Starting Time: Finishing Time:
Enumerator: Respondent’s name (optional):
1. How important are the following characteristics to you to buy and to consume tomatoes?
Characteristic Very
Important Important
Less
Important
Not
Important
Don’t
Know
Color
Freshness
Size
Shelf life
Ripeness
Presence of peduncle
Price
Packing
Pack size
Free of disease and insect dam-
age
Free of pesticide residue
Cooking Quality
Taste
Others (specify)
2. How important are the following process factors/information for you while buying and consuming tomatoes?
Characteristic Very
Important Important
Less
Important
Not
Important
Don’t
Know
Production location
Shopping location
Traceability
Display in the shop
Organic production
others (specify)
General information about yourself
Your educational background?
a) Self-studied b) Primary level
c) Secondary level d) University level
e) No formal education
In which income group does your family's average monthly income fall?
a) Less than NRs5000 per month b) NRs5000 – 10,000 per month
c) NRs10, 001 – 20,000 per month d) NRs 20,000-50,000 per month
e) NRs50, 000 -1, 00,000 per month f) More than NRs1, 00,000 per month
Your family composition?
Number of adults in the family b) Number of children
Thank you for your cooperation.

Adhikari, Collins and Sun / International Food and Agribusiness Management Review / Volume 15, Issue 4, 2012
2012 International Food and Agribusiness Management Association (IFAMA). All rights reserved.
114
Appendix 2
Distribution of Samples According to Market Outlets Market Outlets No. of Samples % of Samples
Supermarket 13 3
Local vegetable corner shop 84 21
Vegetable wholesale market 33 8
Local vegetable market 182 46
Pedestrian market 53 13
Street vendor 29 7
Total 394 100

2012 International Food and Agribusiness Management Association (IFAMA). All rights reserved
115
International Food and Agribusiness Management Review
Volume 15, Issue 4, 2012
Are Organic Growers Satisfied with the Certification System?
A Causal Analysis of Farmers’ Perceptions in Chile
Carlos Padilla Bravoa, Achim Spiller
b, and Pablo Villalobos
c
a PhD Student, Department of Agricultural Economics and Rural Development, Georg-August-Universität
Göttingen, Platz der Göttinger Sieben 5, 37073 Göttingen, Germany
bProfessor, Department of Agricultural Economics and Rural Development, Georg-August-Universität
Göttingen, Platz der Göttinger Sieben 5, 37073 Göttingen, Germany
cAssistant Professor, Department of Agricultural Economics, University of Talca, 2 Norte 685, Casilla 747,
Talca, Chile
Abstract
This study addresses farmer satisfaction with organic certification and its determinants. The find-
ings show that the majority of the interviewees are satisfied with the certification system.
Furthermore, the perceived benefit in terms of farm income is the most important factor determin-
ing satisfaction, suggesting a need to improve communication of other potential benefits such as
market access. The perceived bureaucracy associated with organic certification negatively affects
farmers’ expectations, indicating that the simplification of the certification process and
harmonisation of organic standards should be considered in the political debate. Surprisingly, the
perceived reliability of organic certification has no significant effect on satisfaction. This study
discusses market and policy implications.
Keywords: certification, satisfaction, organic standard, reliability, Chile
Corresponding author: Tel: +49.0.551.394825
Email: [email protected]
A. Spiller: [email protected]
P. Villalobos: [email protected]
+The IFAMR is a non-profit publication. The additional support provided from this issue advertiser, Novus
International helps us remain open access and dedicated to serving management, scholars, and policy makers world-
wide.

Padilla Bravo et al. / International Food and Agribusiness Management Review / Volume 15, Issue 4, 2012
2012 International Food and Agribusiness Management Association (IFAMA). All rights reserved
116
Introduction
Organic production is classified as a process-oriented attribute that cannot be detected in the end
product (Giannakas 2002; Jahn, Schramm, and Spiller 2004a; Jahn, Schramm, and Spiller 2005).
This means that information about the nature of these products is asymmetric, allowing
opportunistic behaviour through e.g. mislabelling. While producers know whether the product is
organic or not, consumers and even retailers do not (Giannakas 2002). To reduce market failure
in the food market and to ensure that the end product meets the appropriate process and product
standards, third-party certification1 (TPC) has arisen as an institutional framework for monitoring
and enforcing compliance with food quality and safety regulations (Lohr 1998; Giannakas 2002;
Hatanaka, Bain, and Busch 2005; Jahn, Schramm, and Spiller 2005; Anders, Souza-Monteiro,
and Rouviere 2007, Hatanaka and Busch 2008). In the organic market, third party certifiers
monitor farmer compliance through criteria set by certification standards. In the case of a positive
appraisal, a certificate indicating compliance with the standard is issued.
Given that certification as an institutional mechanism is relatively young in the food industry,
there have been some attempts to evaluate the performance of various certification standards and
quality assurance systems in the agribusiness sector from different perspectives (e.g. Jahn,
Schramm, and Spiller 2004a, 2004b; Jahn, Schramm, and Spiller 2005; Gawron and Theuvsen
2006; Enneking, Obersojer, and Kratzmair 2007; Jahn and Spilller 2007a, 2007b; Schulze et al.
2008; Albersmeier, Schulze, and Spiller 2009; Albersmeier et al. 2009; Karipidis et al. 2009;
Herzfeld, Drescher, and Grebitus 2011). However, few studies have investigated certification in
the organic food sector. These include an assessment by Schulze and Spiller (2010) of farmers’
acceptance of organic certification in the German market. Albersmeier, Schulze and Spiller
(2009) analyse farmers’ perceptions of the reliability of the organic scheme in Brazil and Costa
Rica. Barrett et al. (2002) and Garcia Martinez and Bañados (2004) focus on the impact of
organic standards on exports in developing countries. To the best of our knowledge, no study has
analysed farmers’ perceptions of organic certification in Chile. Specifically, this is the first
attempt to analyse farmer satisfaction with the organic certification process in less developed
organic markets.
Chile has a long tradition as a producer and exporter of agricultural products, supplying the most
important food markets worldwide. According to official statistics, exports of agricultural
products2 accounted for US$ 8,897.4 million in 2011, which represents 11% of the Chile’s total
exports (Banco Central de Chile, 2012). Organic farming is now becoming an attractive
alternative production method for Chilean growers. Advantages such as geographical location
and phytosanitary status place Chile in a privileged position to promote and expand organic
farming. In addition, the political debate on organic farming in recent years has resulted in the
implementation of an official law3 that currently regulates organic farming and certification
1 Certification is defined as “the (voluntary) assessment and approval by an (accredited) party on an (accredited)
standard” (Meuwissen et al. 2003). Similarly, according to Giannakas (2002) certification is “a process through
which unobservable product characteristics (such as the process through which they have been produced) are
guaranteed to consumers through a label. To avoid conflicts of interest, the guarantee is usually issued by an inde-
pendent third (private or public) party whose ability to verify producer claims is greater than that of an individual”. 2 Official statistics do not currently distinguish between conventional and organic products.
3 On 24th December 2007, the Chilean organic Law N° 20.089 came into force, together with its regulations and
technical standards. This law establishes a national certification system for agricultural organic products. According

Padilla Bravo et al. / International Food and Agribusiness Management Review / Volume 15, Issue 4, 2012
2012 International Food and Agribusiness Management Association (IFAMA). All rights reserved
117
activities in Chile. As a result, the current organic standard provides a legal regulatory framework
to encourage conventional farmers to convert to the organic sector. Despite Chile’s potential for
organic farming and the establishment of an official regulation, organic production still represents
a small proportion of Chilean agriculture. According to official statistics, there are around
151,000 ha under organic cultivation in Chile (ODEPA 2011a). This represents 0.5% of the area
covered by livestock and agricultural production4. As the market for domestic consumption is still
undeveloped, Chile’s organic production is export-oriented (ODEPA 2011b). This means that
organic growers must comply not only with the local organic regulation, but also with organic
standards and certification processes imposed by foreign customers.
In particular, farmers may perceive both advantages and disadvantages from the use of
certification (Gawron and Theuvsen 2006; Getz and Shreck 2006; Lazo, Jahn, and Spiller 2007;
Dorr and Grote 2009; Hammoudi, Hoffman, and Surry 2009; Karipidis et al. 2009).
Disadvantages may be especially relevant for farmers in developing countries, where legislation
and institutions governing organic food production are usually weaker and farm resources more
limited than in industrialized economies. Perceived costs associated with the use of organic
certification and an unreliable inspection system may damage farmers’ expectations of the
performance of the control scheme, with detrimental consequences for farmer satisfaction.
Dissatisfaction with the organic certification system may encourage farmers to change their
certification agency or shift back to conventional agricultural practices, with the latter having
negative implications for the private and public sector. In addition, dissatisfied farmers could also
deter other potential customers through negative communication by word of mouth. In this
context, it is useful to critically assess farmer satisfaction with the certification system and the
factors driving it. Therefore, this research develops and analyses a structural equation model
using data collected in Chile. In particular, this investigation tests the causal relationships in the
proposed model using partial least squares (PLS) analysis. The following sections of this article
provide information about determinants of satisfaction with quality assurance systems and
describe the research hypotheses of the study, followed by the data collection procedure and
statistical approach. The article then reports the results and discusses market and policy
implications. Finally, this study draws conclusions for the organic sector in Chile.
Satisfaction with Certification Schemes and Reported Determinants
The core variable in this study corresponds to farmer satisfaction with organic certification.
Satisfaction in this study is conceptualised as the affective reactions of individuals toward the use
of organic certification. Satisfaction is defined as the fulfilment of certain prior expectations
related to a product or service (Raboca 2006). Kotler and Keller (2006) similarly refer to
satisfaction as “a person’s feeling of pleasure or disappointment resulting from comparing a
product’s perceived performance (or outcome) in relation to his or her expectation”. In other
words, satisfaction reflects the degree to which a person believes that the position and/or use of a
system evoke positive feelings (Rust and Oliver 1994).
to this regulation “the objective of this system is to ensure and certify that organic products are those elaborated,
packed and handled in accordance with standards set by this Law and its Regulations”. 4 The agricultural census carried out in Chile in 2007 indicates that the area being utilized for livestock and agricul-
ture activities is 29,781,690.81 ha (INE 2011).

Padilla Bravo et al. / International Food and Agribusiness Management Review / Volume 15, Issue 4, 2012
2012 International Food and Agribusiness Management Association (IFAMA). All rights reserved
118
Although customer satisfaction studies are restricted in many cases by monetary and time
constraints, they are relatively common in the agrifood sector (e.g. Juhl, Kristensen, and
Østergaard 2002; Gilbert et al. 2004; Mai and Ness 2006; Spiller, Bolten, and Kennerknecht
2006; Lülfs-Baden et al. 2008). However, there are few studies that address issues of farmer
satisfaction with certification schemes in the food industry. Enneking, Obersojer and Kratzmair
(2007) addressed the study of farmer satisfaction, and its determinants, with three different
quality assurance systems in Germany. They reported that improvements in image, sales and
production efficiency are key factors influencing famer satisfaction. Using regression analysis to
assess organic farmers’ acceptance of organic certification in Germany, Schulze, Jahn and Spiller
(2007) found that the perceived bureaucratic costs, effectiveness and usefulness of organic
certification are major factors determining farmer satisfaction. In addition, Schulze et al. (2008)
reported that the cost/benefit ratio, the evaluation of the catalogue of requirements, the perceived
communication of the standard owner, the perceived expertise of the auditor and the perceived
costs of the certification significantly affect the overall evaluation of the International Food
Standard. In this case, managers and quality assurance staff from European agrifood companies
participated in the study. Using causal analysis to evaluate farmer satisfaction with organic
certification in Germany, Schulze and Spiller (2010) also indicate that the perceived bureaucratic
costs, effectiveness and usefulness of the system are key determinants of farmer satisfaction.
In the following, we present a model and a set of hypotheses that, from our perspective, can
hypothetically describe the effects of several factors on farmer satisfaction with organic
certification schemes. Unlike the study carried out by Schulze and Spiller (2010), this research
further focuses on the analysis of the perceived reliability of organic certification and its potential
drivers, as well as addressing farmers’ perceptions in a less mature organic market, i.e. Chile.
Factors Influencing Farmer Satisfaction with Organic Certification
Perceived Reliability of Organic Certification
Despite the usefulness of TPC in reducing information asymmetry within the organic market, it is
susceptible to opportunistic behaviour (e.g. the mislabelling of conventional foods as organic)
(Giannakas 2002). Cases of mislabelling in the organic food sector have been reported by several
authors (Giannakas 2002; Jahn, Schramm, and Spiller 2005). Given that the success of any
certification system mainly depends on ‘trust relationships’ (Jahn Schramm, and Spiller 2005),
opportunistic behaviour negatively affects consumer perception of the scheme and, therefore, has
detrimental consequences for the market acceptance of organic food products (Giannakas 2002).
In addition, occurrences of opportunistic behaviour can affect farmers’ perception of the
reliability of the control procedure. We define perceived reliability in this study as the respond-
ent’s judgement that the monitoring system is capable of detecting non-compliance with the or-
ganic standard. Perceived low reliability of organic certification may create conflicts and distrust
amongst the different actors within the organic food supply chain on the one hand, and affect
farmer loyaty and the adoption of the organic standard due to the scheme’s low acceptance on the
other hand. Therefore, we hypothesize that:
H1: The greater the perceived reliability of the organic certification scheme, the greater the
satisfaction with the organic certification process.

Padilla Bravo et al. / International Food and Agribusiness Management Review / Volume 15, Issue 4, 2012
2012 International Food and Agribusiness Management Association (IFAMA). All rights reserved
119
Perceived Benefits of Using Organic Certification
As mentioned above, customers of certification services may perceive benefits and costs of using
certification standards. Benefits can be divided into internal (e.g. improvements in firm
management, increasing income) and external benefits (market access and improved client
relationships) (Karipidis et al. 2009). Unlike previous empirical studies (Schulze, Jahn, and
Spiller 2007; Albersmeier, Schulze, and Spiller 2009; Schulze and Spiller 2010), we decompose
the perceived benefit or usefulness of the certification system into three main constructs and
evaluate their effects on satisfaction separately. Thus, we hypothesise that:
H2: The better the perceived farm management, the greater the satisfaction with the organic
certification process.
H3: The better the perceived relationship with buyers and access to market, the greater the
satisfaction with the organic certification process.
H4: The higher the perceived farm income, the greater the satisfaction with the organic
certification process.
Perceived Costs of Using Organic Certification
Certification incurs economic and bureaucratic costs. While bureaucratic costs are commonly
related to the use of quality assurance schemes (Theuvsen 2004), economic costs also arise from
the implementation of the standard (e.g. new infrastructure, personal training) and the fee
customers must pay for the inspection service (Dorr and Grote 2009, Karipidis 2011). Schulze
and Spiller (2010) found that bureaucratic costs negatively affect organic farmers’ satisfaction in
Germany. Similar results have also been reported in the German dairy system (Jahn and Spiller
2007b). The cost of the inspection fee is of special interest in developing countries because in
most cases farmers must use internationally accredited inspection bodies, which increases the cost
of certification (Barret et al. 2002; Vogl, Klicher, and Schmidt 2005). Considering this, we
postulate that:
H5: The higher the perceived economic costs, the lower the satisfaction with the organic
certification process.
H6: The higher the perceived bureaucratic costs, the lower the satisfaction with the organic
certification process.
Experience in the Organic Sector
Empirical studies have reported that the number of years’ experience in the organic sector
significantly affect farmer satisfaction with organic certification in some Latin American
countries (Albersmeier et al. 2009a). According to Ferguson, Wenssen and Storey (2005), less
experienced organic growers in Canada are less satisfied with third-party organic certification.
Based on this, we hypothesise that:

Padilla Bravo et al. / International Food and Agribusiness Management Review / Volume 15, Issue 4, 2012
2012 International Food and Agribusiness Management Association (IFAMA). All rights reserved
120
H7: The more experience farmers in the organic sector have, the greater the satisfaction with
the organic certification process.
Factors Influencing the Perceived Reliability of Organic Certification
Perceived Reputation of Inspectors and Certification Bodies
According to Jahn, Schramm and Spiller (2005) and Anders, Souza Monteriro and Rouviere
(2007), the objectivity, experience and independence of the executive certification body (CB) are
crucial determinants of the reliability of TPC. This is also valid for auditors or inspectors in
charge of carrying out inspections at the producer’s property. In developing countries supplying
organic food products to high-value markets, reliable certification is critical (Anders, Souza-
Monteiro, and Rouviere 2007). Nevertheless, the outbreak of food-borne diseases and continuous
scandals affecting the food industry demonstrate that CBs and audit processes are sometimes
susceptible to failure. Poor inspection quality may not only undermine the reputation of a
particular CB or auditor but also negatively affect the reliability of the whole system because the
probability of mislabelling is higher. In other words, the reliability of the certification process
depends on the way auditing is carried out (Jahn, Schramm, and Spiller 2004b). However, the
thoroughness of the audit process often varies considerably amongst different third-party
certifiers (Jahn, Schramm, and Spiller 2005). Empirical evidence shows that there are significant
differences between the auditing judgments issued by different certification bodies in the organic
(Zorn, Lippert, and Dabbert 2010) and conventional food industries (Albersmeier et al. 2009).
Considering this information, we hypothesise that:
H8: The better the CB’s reputation, the higher the perceived reliability of the organic
certification scheme.
H9: The better the auditor’s reputation, the higher the perceived reliability of the organic
certification scheme.
Perceived Risk of Fraud in the Organic Sector
Mislabelling and cheating in the organic sector can increase potential negative market effects
(e.g. decrease in consumer demand). If farmers perceive that fraudulent practices by other
growers are frequent in the organic sector, i.e. an increase in farmers’ risk perception of fraud,
they may negatively evaluate the reliability of the certification system. Therefore, we postulate
that:
H10: The higher the perceived risk of fraud in the organic sector, the lower the perceived
reliability of the organic certification scheme.
Perceived External and Internal Sources of Pressure
Finally, some sources of internal and external pressure enforcing compliance with the organic
standard may positively affect farmers’ perception of the reliability of the certification process.
In terms of organic certification, the government is the standard-setting institution (Garcia

Padilla Bravo et al. / International Food and Agribusiness Management Review / Volume 15, Issue 4, 2012
2012 International Food and Agribusiness Management Association (IFAMA). All rights reserved
121
Martinez and Bañados 2004). Therefore, we can expect that governmental institutions play a key
role in monitoring compliance with the rules. Getz and Shreck (2006) highlight the importance of
farm associations and farmers in enforcing compliance with organic standards. Furthermore,
suppliers of organic products are under constant pressure because of the great number of different
demands from customers (buyers) (Jahn, Schramm, and Spiller 2004b). Similar to farmer associa-
tions, the families of organic growers have a special interest in the correct functioning of the
certification system since they may also suffer from economic losses in the event of fraud
(Albersmeier, Schulze, and Spiller 2009). Considering this background, we hypothesise that:
H11: The greater the perceived buyer pressure, the higher the perceived reliability of the
organic certification scheme.
H12: The greater the perceived government pressure, the higher the perceived reliability of the
organic certification scheme.
H13: The greater the perceived farmers pressure, the higher the perceived reliability of the
organic certification scheme.
H14: The greater the perceived family pressure, the higher the perceived reliability of the
organic certification scheme.
Figure 1 summarises the proposed research model.
Figure 1. Research Model
Methodology
Data Collection
Between August and October 2008, face to face interviews were conducted in the Ñuble and
Curicó provinces of Chile. A total of 60 subjects were consulted about their perceptions of
Satisfaction
Farm
management
Reliability
CB‘s
reputation
Auditor‘s
reputation
Relationship with
buyers/
Market access
Farm
income
Economic
costs
Bureaucratic
costsExperience
Family
pressure
Farmers
pressure Government
pressure
Buyer
pressure
Risk
perception
H2+H13+H14+
H1+
H3+
H4+
H5-
H6- H7+H8+
H9+
H10-
H11+
H12+

Padilla Bravo et al. / International Food and Agribusiness Management Review / Volume 15, Issue 4, 2012
2012 International Food and Agribusiness Management Association (IFAMA). All rights reserved
122
organic certification. In addition, the whole sample was composed of certified organic farms.
With regard to the sampling procedure, respondents in this study were not randomly selected.
Instead, a convenience sample was used. Therefore, the results reported in the following sections
must be interpreted from an exploratory research perspective.
In order to test our hypotheses, a structured questionnaire with multiple scale items was designed.
Personal and farm structure aspects were also recorded for each respondent. The questionnaire
was designed in English. It was subsequently translated into Spanish and special attention was
paid to ensure it contained wording typically used in Chile. Before administering the
questionnaire, a pilot test was performed in order to check for inconsistencies.
Sample Description
The survey provided information from organic famers working with different types of berries
(raspberry, blackberry, blueberry, etc.), vegetables and some major crops. In addition, most of
the farms (87%) are affiliated to one of the most important certification bodies operating in the
country (BCS ÖKO-GARANTIE GMBH). It was mainly farm owners (73.3%) that took part in
the survey. Respondents who went to primary or secondary school accounted for 68.3%, while
subjects holding a bachelor degree or who went to technical schools accounted for 30% and 1.7%
respectively. On average, the subjects surveyed were 49.1 years old and had practiced organic
farming for 7 years. The farms covered an area of 21.7 ha on average and the number of workers
was on average 9.5. The high standard deviations for the number of ha and workers indicate that
the sample includes both small and medium/large organic operations (Table 1). In terms of sales,
almost half of the sample achieved less than $15 million Chilean pesos5, while around 18%
reached over $75 million. The rest of the respondents (30%) declared sales between $15 and $75
million. The majority of the respondents are organised as independent bodies (80%). The main
marketing channels are the agroindustry (45%) and export companies (50%).
Table 1. Sample Characteristics.
Experience with Number of
Age Gender organic farming Size of farm workers/employees
(years) (female/male) (years) (ha) (#)
49.1 8/52 7.0 21.7 9.5
12.3a 13.3%/86.7% 5.2 37.7 16.6
a Standard deviation in italics.
Measures
Items used to capture the latent variables of the structural model (see Table 4 in Appendix) were
adopted from measurement scales that have been tested in previous studies dealing with famers’
acceptance and their assessment of different quality assurance systems (e.g. Jahn and Spiller
2007a, 2007b; Schulze, Jahn, and Spiller 2007). The selected statements or items were assessed
by respondents on a seven-point Likert scale (-3 ‘totally disagree’, -2 ‘disagree’, -1 ‘partially
disagree’, 0 ‘neither agree nor disagree’, +1 ‘partially agree’, +2 ‘agree’, +3 ‘totally agree’). All
were examined beforehand using exploratory factor analysis (principal component analysis, 5 USD$ 1 = Chilean pesos $ 518.66. Central Bank of Chile (www.bcentral.cl) (accessed on 21st December 2011).

Padilla Bravo et al. / International Food and Agribusiness Management Review / Volume 15, Issue 4, 2012
2012 International Food and Agribusiness Management Association (IFAMA). All rights reserved
123
VARIMAX rotation). Items with double loading and those loading on improper factors were
excluded from further analysis.
Statistical Approach
Structural equation modelling (SEM) is a general analytic framework that allows the
identification of causal relationships through the combination of multiple regression, path
analysis, and confirmatory factor analysis (Tomarken and Waller 2005). Estimation of causal
models with latent constructs can be performed either by covariance-based or variance-based
SEM techniques (Gefen, Straub, and Boudreau 2000; Reinartz, Haenlein, and Henseler 2009). In
this study, partial least squares (PLS), a variance-based method, was used because it is
appropriate for exploratory studies with small sample sizes and relaxes the distributional
assumptions required by covariance-based approaches (Gefen, Straub, and Boudreau 2000;
Henseler, Ringle, and Sinkovics 2009; Reinartz, Haenlein, and Henseler 2009; Hair, Ringle, and
Sarstedt 2011). The analysis and interpretation of PLS models comprises two steps: i) the
assessment of the reliability and validity of the measurement model (outer model); and ii) the
assessment of the goodness of fit of the structural model (inner model) (Hulland 1999; Henseler,
Ringle, and Sinkovics 2009; Hair, Ringle, and Sarstedt 2011). The statistical software SmartPLS
version 2.0 M3 (Ringle, Wende, and Will 2005) was used to analyse the data.
Results
Satisfaction with Organic Certification
The majority of respondents seem to be satisfied with the organic certification process. While
23.3% and 36.7% partially agree or agree, 30% totally agree with the statement “I am satisfied
with the organic certification scheme”.
Reliability and Validity of the Measurement Model
The reliability of the measures takes into account the factor loadings of each measurement item
on their respective latent construct (see Table 4 in Appendix). The majority of measure loadings
are consistent with the recommended value of 0.7 (Chin 1998a; Hulland 1999; Henseler, Ringle,
and Sinkovics 2009; Hair, Ringle, and Sarstedt 2011).
The evaluation of construct reliability considers Cronbach’s alpha and composite reliability
(Table 2). However, Cronbach’s alpha usually exaggerates the unreliability of measurements and
thus composite reliability provides a better judgement of construct reliability (Baumgartner and
Homburg 1996; Henseler, Ringle, and Sinkovics 2009; Hair, Ringle, and Sarstedt 2011). No
matter which reliability coefficient is used, the recommended threshold for sufficient
construct reliability in early stages of research is 0.7 or above (Nunnally and Bernstein 1994).
Convergent validity considers the evaluation of average variance extracted (Fornell and Larcker
1981). This research reports satisfactory values (greater than 0.5) for average variance extracted
for all the assessed constructs. In other words, the latent variables are able to explain more than
half of their indicators’ variance on average.

Padilla Bravo et al. / International Food and Agribusiness Management Review / Volume 15, Issue 4, 2012
2012 International Food and Agribusiness Management Association (IFAMA). All rights reserved
124
Table 2. Assessment of the measurement model.
CRAa
CRb
AVEc
Variables N° items (>= 0.7) (>= 0.7) (>=0.5)
Auditor’s reputation 3 0.53 0.76 0.52
Bureaucratic costs 3 0.58 0.77 0.53
Buyers pressure 2 0.63 0.84 0.73
Relationship with buyers/Market access 4 0.80 0.86 0.61
CB’s reputation 2 0.40 0.75 0.61
Economic costs 2 0.62 0.82 0.70
Experience 1 1.00 1.00 1.00
Family pressure 1 1.00 1.00 1.00
Farm income 2 0.56 0.81 0.69
Farm management 3 0.57 0.76 0.53
Farmer pressure 3 0.61 0.79 0.56
Government pressure 1 1.00 1.00 1.00
Reliability 3 0.62 0.79 0.57
Risk perception 3 0.59 0.77 0.52
Satisfaction 1 1.00 1.00 1.00 a Cronbach’s alpha.
b Composite reliability.
c Average variance extracted.
Discriminant validity considers the performance of the Fornell-Larcker criterion (Fornell and
Larcker 1981) and the evaluation of cross loadings. The Fornell-Larcker criterion postulates that
a latent construct should share more variance with its assigned indicators than with another latent
variable in the structural model (Hair, Ringle, and Sarstedt 2011). We found no evidence of
correlation between any two latent constructs larger than the square root of the average variance
extracted from these two constructs (see Table 5 in Appendix). A second criterion requires that an
indicator’s loading with its associated construct should be higher than its loadings with all the
remaining constructs (Hair, Ringle, and Sarstedt 2011). Data analysis shows that there is no
evidence of cross loadings (data not shown). Therefore, discriminant validity is supported, which
means that all constructs in the research model are indeed measuring different concepts.
Goodness of Fit of the Structural Model and Determinants of Satisfaction
The assessment of goodness of fit for the model focuses on R² scores and the algebraic sign, size
and significance of the path coefficients (Baumgartner and Homburg 1996; Henseler, Ringle, and
Sinkovics 2009; Hair, Ringle, and Sarstedt 2011). There is good structural fit for the model when
i) there is high explanatory power (R²) and ii) there are statistically significant t-values associated
with the path coefficient estimates.
The structural model explained 51% of the variance in the perceived reliability of the organic cer-
tification process and 47% of the variance in satisfaction. In PLS models, R² scores of 19, 33 and
67% are considered weak, moderate and substantial respectively (Chin 1998b). Recently, Hair,
Ringle and Sarstedt (2011) provided more restrictive criterion for assessing R2 values (25, 50, and

Padilla Bravo et al. / International Food and Agribusiness Management Review / Volume 15, Issue 4, 2012
2012 International Food and Agribusiness Management Association (IFAMA). All rights reserved
125
75%). Given the explorative character of this study and the small sample size, reported R² values
in this study are acceptable.
The significance of path estimates (Table 3) was determined by using the SmartPLS
bootstrapping routine with 5,000 sub-samples and 60 cases (Henseler, Ringle, and Sinkovics
2009; Hair, Ringle, and Sarstedt 2011).
Table 3. Structural path estimates. Endogenous Parameter Standard
Variables constructs estimate error t-statistic
Perceived reliability
H1 Reliability Satisfaction 0.06 0.17 0.34ns
Perceived benefits
H2 Farm management Satisfaction 0.18 0.14 1.28ns
H3 Relationship with buyers/Market access Satisfaction 0.20 0.15 1.32ns
H4 Farm income Satisfaction 0.38 0.12 3.11**
Perceived costs
H5 Economic costs Satisfaction -0.05 0.10 0.48ns
H6 Bureaucratic costs Satisfaction -0.22 0.10 2.13*
Experience in the organic sector
H7 Experience Satisfaction -0.03 0.09 0.36ns
Perceived reputation
H8 CB’s reputation Reliability 0.18 0.17 1.08ns
H9 Auditor’s reputation Reliability 0.19 0.18 1.04ns
Perceived risk of fraud in organic sector
H10 Risk perception Reliability -0.30 0.12 2.53*
Perceived external and internal pressure
H11 Buyers pressure Reliability 0.32 0.15 2.15*
H12 Government pressure Reliability 0.14 0.14 1.00ns
H13 Farmer pressure Reliability 0.30 0.11 2.78**
H14 Family pressure Reliability -0.12 0.13 0.95ns
* Parameter is significant at p < 0.05; **parameter is significant at p < 0.01; *** parameter is significant at
p < 0.001; ns = parameter is not significant.
The results reveal that among the perceived benefits, the perceived improvement in farm income
due to the use of organic certification shows a significant influence on farmers’ satisfaction. In
addition, this variable has the highest impact on satisfaction in the model. Although other
perceived benefits show the expected sign, they are not significant. As postulated, the costs
associated with the certification process, i.e. economic and bureaucratic costs, negatively affect
farmer satisfaction. Nevertheless, only bureaucratic costs significantly affect this endogenous
variable. Surprisingly, the perceived reliability of the certification process is not a significant
determinant of satisfaction. The perceived risk of fraud in the organic sector and external as well
as internal sources of monitoring arise as significant determinants of the perceived reliability. To
an even greater extent, the perceived monitoring by buyers is the most important factor affecting
reliability. Neither the perceived reputation of the auditor nor the perceived reputation of the CB

Padilla Bravo et al. / International Food and Agribusiness Management Review / Volume 15, Issue 4, 2012
2012 International Food and Agribusiness Management Association (IFAMA). All rights reserved
126
significantly influences the perceived reliability of the organic scheme, although they show the
expected sign.
Discussion with a Focus on Market and Policy Implications
The findings of this study must be analysed with caution. The explorative character of this re-
search limits the interpretation of the results to the sample we analysed in the Chilean case. Nev-
ertheless, important lessons can be taken from this study.
Satisfaction with Organic Certification
The results show a high level of farmer satisfaction with organic certification. In other words, the
performance of the certification scheme meets farmers’ expectations. This is supported by the
fact that the majority of the subjects surveyed (71.7%) have never changed their CB (data not
shown). Previous empirical evidence indicates that farmers’ acceptance of the organic
certification scheme is higher and less controversial in Latin American countries than in more
developed organic food markets (Albersmeier, Schulze, and Spiller 2009). This is a good signal
for the CBs operating in the region because the long term competiveness and success of firms de-
pends to some extent on customer loyalty to the product or service, which is in turn shaped by
customer satisfaction (Bayol et al. 2000; Spiller, Bolten, and Kennerknecht 2006; Lülfs-Baden et
al. 2008 Anderson and Swaminathan 2011). However, as mentioned previously, 87% of the farms
surveyed are affiliated to the same single CB. This fact prevents the development of a clear
picture of the assessment of the organic certification process by organic farmers affiliated to other
CBs. Empirical evidence shows that there are differences between the auditing judgments of
different CBs in the organic food industry (Zorn, Lippert, and Dabbert 2010). In addition,
Ferguson, Wenssen and Storey (2005) point out that there are large differences in farmers’
satisfaction across different CBs in the Canadian organic market. Therefore, future studies
analysing farmer satisfaction with organic certification should consider the use of a more
heterogeneous sample in terms of CBs. Another limitation in relation to this sample is the fact
that it did not consider farmers who reverted back to conventional agriculture. Additionally, given
that satisfaction is a complex multidimensional construct (Raboca 2006), further investigations
should include more statements to assess farmer satisfaction. This could provide a more accurate
evaluation.
Determinants of Satisfaction
Surprisingly, the perceived reliability of organic certification is not a significant predictor of
farmer satisfaction in this study. Maybe the perceived good reputation of CBs (or at least BCS
ÖKO-GARANTIE GMBH) and auditors (see Table 4 in Appendix), as well as the absence of
major public scandals in the local organic industry, may be focusing the attention of local farmers
on other factors (e.g. perceived benefit in terms of farm income) when assessing their
expectations regarding the use of organic certification.
The findings also indicate that the perceived benefits are more important than the perceived costs.
Previous studies have reported similar results in the conventional food industry (e.g. Enneking,
Obersojer, and Kratzmair 2007). However, the picture seems to be different for small farmers
(Karipidis et al. 2009). As previously mentioned, the perceived benefit in terms of farm income is

Padilla Bravo et al. / International Food and Agribusiness Management Review / Volume 15, Issue 4, 2012
2012 International Food and Agribusiness Management Association (IFAMA). All rights reserved
127
the most important factor affecting satisfaction. This is not unusual because Chile’s organic
production is export-oriented and therefore deals with high-value markets (Garcia Martinez and
Bañados 2004). Moreover, there is evidence from Latin America indicating that farmers who
have adopted certification schemes have a higher net income compared with non-certified farm-
ers (Dorr and Grote 2009). The findings also reveal that other potential benefits such as a good
relationship with buyers, market access and improvement in farm management may not have
been well communicated to organic farmers so far. Access to information and good
communication promotes the adoption of certification standards (Dorr and Grote 2009). If local
policy makers aim to encourage the adoption and increase acceptance of the organic control
scheme in Chile then they should properly communicate the benefits associated with the use of it.
This matter is particularly critical when considering small farmers, who normally have more
difficulty accessing information.
As expected, farmers perceive the certification process as a bureaucratic burden negatively
influencing farmer satisfaction. Although this finding is in line with previous studies carried out
in developed food markets (e.g. Theuvsen 2004; Jahn and Spiller 2007b; Schulze and Spiller
2010), there is also contradictory empirical evidence reported in developing countries (Lazo,
Jahn, and Spiller 2007). The use of farmer associations might be a way to reduce bureaucracy
(Getz and Shreck 2006) because it allows economies of scale and reduces transaction costs.
Reaching equivalence6 between Chile’s organic law and the standards ruling the most important
organic markets might also mitigate the bureaucratic process. According to Barret et al. (2002),
being recognized as a ‘Third Country’ by EU organic legislation facilitates the export process by
reducing bureaucracy. However, the process of harmonization for organic regulations should
consider differences in regional farming techniques and integrate the knowledge of local farmer
groups to ensure effective environmental and health protection goals (Vogl, Klicher, and Schmidt
2005). In addition, the integration of regional or local aspects during the process of harmonization
would help to guarantee the participation of small farmers in the international organic market and
promote sustainable development in organic farming. Another way to reduce bureaucratic costs
and, consequently, increase satisfaction with the organic control scheme is the encouragement of
direct marketing through the establishment of local farmer markets. In terms of direct local
marketing, no equivalence of national organic rules with European, etc., regulations is needed
(Vogl, Klicher, and Schmidt 2005). Nevertheless, the establishment of direct marketing channels
in less developed organic markets needs to be accompanied by a promotional strategy for organic
food in order to capture local consumer attention and ensure a minimum level of consumer
demand.
Although the perceived economic costs have a negative influence on farmer satisfaction, they do
not exert a significant effect. The use of only one construct dimension (certification fee) may
have affected the performance of this variable in this study. Thus, future studies should
incorporate more variables associated with economic costs (e.g. costs related to new
infrastructure, personal training) into the analysis. This could provide a clearer picture of the
impact of economic costs on satisfaction.
6 Equivalence means that the norms regulating the production, processing, documentation, inspection and certifica-
tions systems in import markets are equally as effective as those in export markets, but not necessarily that they have
to be identical (Garcia Martinez and Bañados 2004).

Padilla Bravo et al. / International Food and Agribusiness Management Review / Volume 15, Issue 4, 2012
2012 International Food and Agribusiness Management Association (IFAMA). All rights reserved
128
Determinants of Perceived Reliability
As the findings show, the reliability of the certification scheme depends on several factors. The
perceived external control carried out by buyers and the perceived internal control undertaken by
farmers or farmer associations both play a critical role in determining reliability. This is
consistent with the findings of Albersmeier, Schulze and Spiller (2009), who point out that these
types of organisations can perform a social monitoring function. In addition, they are more
effective in this aspect than public authorities in Latin American countries. This indicates that the
responsibility for monitoring is moving from the public sector to non-state actors. As Hatanaka
and Busch (2008) argue, “the state is withdrawing from direct oversight and monitoring, and
increasingly regulating food and agriculture indirectly”. Also, the lack of harmonization between
the local organic legislation and those standards demanded by export markets (e.g. EU and USA),
the existence of weak institutional regulatory structures and the undeveloped character of
domestic organic markets in several Latin American countries may help to explain the perceived
poor performance of the public sector as a monitoring body.
The risk perceived by farmers regarding fraud practices in the organic sector is also a determinant
of the perceived reliability. This is not unusual since opportunistic behaviour and cheating in the
organic food business, including third-party inspection activities, are still an important area of
discussion in the international arena (Giannakas 2002; Jahn, Schramm, and Spiller 2005;
Hatanaka and Busch 2008).
Unlike the suggestions from previous studies (e.g. Jahn, Schramm, and Spiller 2004b; Jahn,
Schramm, and Spiller 2005; Anders, Souza-Monteiro, and Rouviere 2007; Albersmeier, Schulze,
and Spiller 2009), neither the perceived reputation of the inspector nor the perceived reputation of
the CB determine the perceived reliability of the organic control scheme in the research model.
However, the results partially agree with those reported by Schulze and Spiller (2010) in
Germany, who concluded that neither the perceived thoroughness of the CB nor the perceived
expertise of the auditor significantly affect the effectiveness of the organic control system.
Although the items used to evaluate CB and auditor reputation in this study were adapted mainly
from earlier empirical research, the number of latent constructs describing these factors differs
from those used in other studies. Therefore, differences in model specification may partially
explain the variation in results. Another explanation is the fact that the majority of farms
surveyed in this study are affiliated to the same CB, which apparently seems to enjoy a good
reputation. Either way, the effect of reputation issues on farmer satisfaction deserves more
empirical research at a local market level.
Conclusions
According to the findings of this study, organic farmers in Chile are satisfied with organic certifi-
cation. However, extending this result to the whole domestic organic industry requires an analysis
of a more heterogeneous sample.
Perceived benefits are more important determinants of farmer satisfaction than perceived costs, as
the perceived improvement in farm income is the most important variable driving satisfaction and
the perceived bureaucratic cost is the central barrier to increasing the acceptance of the organic
control scheme. In this context, public authorities and other stakeholders may play a central role

Padilla Bravo et al. / International Food and Agribusiness Management Review / Volume 15, Issue 4, 2012
2012 International Food and Agribusiness Management Association (IFAMA). All rights reserved
129
in reducing bureaucracy by e.g. negotiating equivalence of the local legislation. In this way,
farmer satisfaction with and acceptance of the monitoring system may increase. Adequate
communication of other potential benefits (e.g. market access) may also help to increase farmer
satisfaction.
Surprisingly, the perceived reliability of organic certification does not play an important role in
determining farmer satisfaction. However, this may be an unusual case in the organic food
industry, due to the apparently good reputation of the main CB in this study and the absence of
major public scandals in Chile’s organic industry, which may focus the attention of farmers on
other factors.
The findings also reveal that the perceived performance of the state as a monitor is poor. In
contrast, customer (buyer) demands and the internal control carried out by farmers or farmer
associations both suggest that the industry is able to self-regulate its monitoring activities.
Contrary to the evidence reported in the literature, neither the perceived reputation of the
inspector nor the perceived reputation of the CB determines the perceived reliability of the
organic control scheme. However, more evaluations at a local market level should provide
support to validate this argument.
References
Albersmeier, F., H. Schulze, and A. Spiller 2009. Evaluation and reliability of the organic
certification system: Perceptions by farmers in Latin America. Sustainable Development 17
(5):311-324.
Albersmeier, F., H. Schulze, G. Jahn, and A. Spiller. 2009. The reliability of third-party
certification in the food chain: From checklists to risk-oriented auditing. Food Control 20
(10):927-935.
Anders, S., D. Souza-Monteiro, and E. Rouviere. 2007. Objectiveness in the market for third-
party certification: What can we learn from market structure? Paper presented at EAAE’s
105th
Seminar, Bologna, Italy, March.
Anderson, R.E., and S. Swaminathan. 2011. Customer satisfaction and loyalty in e-markets:
A PLS path modeling approach. Journal of Marketing Theory and Practice 19 (2):221-234.
Banco Central de Chile. 2012. Indicadores de comercio exterior. Cuarto trimestre 2011. Santiago,
Chile. http://www.bcentral.cl/publicaciones/estadisticas/sector-externo/pdf/ice042011.pdf
(accessed on 16th October 2012).
Barrett, H.R., A.W. Browne, P.J.C. Harris, and K. Cadoret. 2002. Organic certification and the
UK market: Organic imports from developing countries. Food Policy 27 (4):301-318.
Baumgartner, H., and C. Homburg. 1996. Applications of structural equation modeling in market-
ing and consumer research: A review. International Journal of Research in Marketing 13
(2):139-161.

Padilla Bravo et al. / International Food and Agribusiness Management Review / Volume 15, Issue 4, 2012
2012 International Food and Agribusiness Management Association (IFAMA). All rights reserved
130
Bayol, M., A. de la Foye, C. Tellier, and M. Tenenhaus. 2000. Use of PLS path modelling to
estimate the European Consumer Satisfaction Index (ECSI) model. Statistica Applicata 12
(3):361-375.
Chin, W.W. 1998a. Issues and opinion on structural equation modeling. MIS Quarterly
22 (1):7-16.
Chin, W.W. 1998b. The partial least squares approach for structural equation modeling. In
Modern methods for business research, methodology for business and management, edited
by G.A. Marcoulides, Lawrence Erlbaum Associates Inc., New Jersey, pp. 295-336.
Dorr, A.C., and U. Grote. 2009. The role of certification in the Brazilian fruit sector. Revista de
Economia Contemporânea 13 (3):539-571.
Enneking, U., T. Obersojer, and M. Kratzmair. 2007. Faktoren für die Zufriedenheit mit
Qualitätssystemen aus Sicht der Primärerzeuger. Agrarwirtschaft 56 (2):112-124.
Ferguson, S., S. Wessen, and G. Storey. 2005. Organic producer perceptions of the role of
certification bodies. Project on Organic Agriculture, Marketing Study, Paper Number 5.
Department of Agricultural Economics, University of Saskatchewan, Saskatchewan,
Canada.
Fornell, C., and D.F. Larcker. 1981. Evaluating structural equation models with unobservable
variables and measurement error. Journal of. Marketing Research 18 (1):39-50.
Garcia Martinez, M., and F. Bañados. 2004. Impact of EU organic product certification legisla-
tion on Chile organic exports. Food Policy 29 (1):1-14.
Gawron, J., and L. Theuvsen. 2006. The international food standard: Bureaucratic burden or help-
ful management instrument in global markets? Empirical results from the German food
industry. Paper presented at EAAE’s 98th
Seminar, Chania, Crete, Greece, June-July.
Gefen, D., D. Straub, and M. Boudreau. 2000. Structural equation modeling and regression:
guidelines for research practice. Communications of the Association for Information
Systems 4:1-78.
Getz, C., and A. Shreck. 2006. What organic and fair trade labels do not tell us: Towards a place-
based understanding of certification. International Journal of Consumer Studies 30 (5):490-
501.
Giannakas, K. 2002. Information asymmetry and consumption decisions in organic food product
markets. Canadian Journal of Agricultural Economics 50 (1):35-50.
Gilbert, G.R., C. Veloutsou, M.M.H. Goode, and L. Moutinho. 2004. Measuring customer satis-
faction in the fast food industry: A cross-national approach. Journal of Services Marketing
18 (5):371-383.

Padilla Bravo et al. / International Food and Agribusiness Management Review / Volume 15, Issue 4, 2012
2012 International Food and Agribusiness Management Association (IFAMA). All rights reserved
131
Hair, J.F., C.M. Ringle, and M. Sarstedt. 2011. PLS-SEM: Indeed a silver bullet. Journal of
Marketing Theory and Practice 19 (2) 139-151.
Hammoudi, A., R. Hoffman, and Y. Surry. 2009. Food safety standards and agri-food supply
chains: An introductory overview. European Review of Agricultural Economics 36 (4):469-
478.
Hatanaka, M., C. Bain, and L. Busch. 2005. Third-party certification in the global agrifood
system. Food Policy 30 (3):354-369.
Hatanaka, M., and L. Busch. 2008. Third-party certification in the global agrifood system: An
objective or socially mediated governance mechanism? Sociologia Ruralis 48 (1):73-91.
Henseler, J., C.M. Ringle, and R.R Sinkovics. 2009. The use of partial least squares path
modeling in international marketing. Advances in International Marketing 20 (:277–319.
Herzfeld, T., L. Drescher, and C. Grebitus. 2011. Cross-national adoption of private food quality
standards. Food Policy 36 (3):401-411.
Hulland, J. 1999. Use of partial least squares (PLS) in strategic management research: A review
of four recent studies. Strategic Management Journal 20 (2):195-204.
INE, 2011. VII censo nacional agropecuario y forestal. http://www.censoagropecuario.cl
(accessed on 15th December 2011).
Jahn, G., M. Schramm, and A. Spiller. 2004a. Differentiation of certification standards: The
trade-off between generality and effectiveness in certification systems. Paper presented at
IAMA’s 14th
World Forum and Symposium, Montreux, Switzerland, June.
Jahn, G., M. Schramm, and A. Spiller. 2004b. Trust in certification procedures: An institutional
economics approach investigating the quality of auditings within food chains. Paper
presented at IAMA’s 14th
World Forum and Symposium, Montreux, Switzerland, June.
Jahn, G., M. Schramm, and A. Spiller. 2005. The reliability of certification: Quality labels as a
consumer policy tool. Journal of Consumer Policy 28 (1):53-73.
Jahn, G., and A. Spiller. 2007a. Controversial positions about the QS system in agriculture: An
empirical study. In Quality management in food chains, edited by L. Theuvsen, A. Spiller,
M. Peupert, and G. Jahn, Wageningen Academic Publishers, Wageningen, pp. 355-367.
Jahn, G., and A. Spiller. 2007b. Dairy farmer’s acceptance of a processor driven quality man-
agement system: A structural equation model. In Quality management in food chains, edited
by L. Theuvsen, A. Spiller, M. Peupert, and G. Jahn, Wageningen Academic Publishers,
Wageningen, pp. 385-396.
Juhl, H.J., K. Kristensen, and P. Østergaard. 2002. Customer satisfaction in European food
retailing. Journal of Retailing and Consumer Services (6):327-334.

Padilla Bravo et al. / International Food and Agribusiness Management Review / Volume 15, Issue 4, 2012
2012 International Food and Agribusiness Management Association (IFAMA). All rights reserved
132
Karipidis, P., K. Athanassiadis, S. Aggelopoulos, and E. Giompliakis. 2009. Factors affecting the
adoption of quality assurance systems in small food enterprises. Food Control 20 (2):93-98.
Kotler, P., and K. L. Keller. 2006. Marketing Management, Prentice-Hall, New Jersey.
Lazo, A., G. Jahn, and A. Spiller. 2007. Growers’ perceptions about EurepGAP in developing
countries: results of a survey carried out in Peru. In Quality management in food chains, ed-
ited by L. Theuvsen, A. Spiller, M. Peupert, and G. Jahn, Wageningen Academic Publish-
ers, Wageningen, pp. 369-384.
Lohr, L. 1998. Implications of organic certification for market structure and trade. American
Journal of Agricultural Economics 80 (5):1125-1129.
Lülfs-Baden, F., A. Spiller, A. Zühlsdorf, and M. Mellin. 2008. Customer satisfaction in farmer-
to-consumer direct marketing. International Food and Agribusiness Management Review 11
(2):49-72.
Mai, L., and M.R. Ness. 2006. A structural equation model of customer satisfaction and future
purchase of mail-order specialty food. International Journal of Business Science and Ap-
plied Management 1 (1):1-13.
Meuwissen, M.P.M., A.G.J. Velthuis, H. Hogeveen, and R.B.M. Huirne. 2003. Traceability and
certification in meat supply chains. Journal of Agribusiness 21 (2):167-181.
Nunnally, J., and I. Bernstein. 1994. Psychometric theory, MacGraw-Hill, New York.
ODEPA. 2011a. ¿Qué, cuánto y dónde se produce orgánicamente en Chile? Oficina de Estudios y
Políticas Agrarias (ODEPA), Ministerio de Agricultura, Santiago, Chile.
http://www.odepa.gob.cl/odepaweb/publicaciones/doc/2638.pdf (accessed December 03,
2011).
ODEPA. 2011b. Propuesta de plan estratégico para la agricultura orgánica chilena 2010-2020.
Oficina de Estudios y Políticas Agrarias (ODEPA), Ministerio de Agricultura, Santiago,
Chile. http://www.odepa.gob.cl/odepaweb/servicios-informacion/Comisiones/Plan_
Estrategico_Agricultura_Organica2010-2020.pdf (accessed October 16, 2012).
Raboca, H. 2006. Determinants of customer satisfaction and service quality: The case of Romani-
an public services. Transylvanian Review of Administrative Sciences 16:124-135.
Reinartz, W., M. Haenlein, and J. Henseler. 2009. An empirical comparison of the efficacy of co-
variance-based and variance-based SEM. International Journal of Research in Marketing 26
(4):332-244.
Ringle, C.M., S. Wende, and A. Will. 2005. SmartPLS 2.0 M3. http://www.smartpls.de.

Padilla Bravo et al. / International Food and Agribusiness Management Review / Volume 15, Issue 4, 2012
2012 International Food and Agribusiness Management Association (IFAMA). All rights reserved
133
Rust, R.T., and R.L. Oliver. 1994. Service quality: Insights and managerial implications from the
frontier. In Service Quality: New Directions in Theory and Practice, edited by R.T. Rust,
and R.L. Oliver, Sage, London, pp. 1-19.
Schulze, H., G. Jahn, and A. Spiller. 2007. Institutional change and acceptance of quality assur-
ance: The case of organic farming in Germany. Paper presented at 1st International Europe-
an Forum on Innovation and System Dynamics in Food Networks, Innsbruck-Igls, Austria,
February.
Schulze, H., F. Albersmeier, J. Gawron, A. Spiller, and L. Theuvsen. 2008. Heterogeneity in the
evaluation of quality assurance systems: The international food standard (IFS) in European
agribusiness. International Food and Agribusiness Management Review 11 (3):99-138.
Schulze, H., and A. Spiller. 2010. Farmers’ acceptance of the organic certification system in
Germany: A partial least squares model. Journal of International Food & Agribusiness
Marketing 22 (1-2):7-36.
Spiller, A., J. Bolten, and R. Kennerknecht. 2006. Customer satisfaction and loyalty as success
factors in organic food retailing. Paper presented at IAMA’s 16th
World Forum and Sympo-
sium, Buenos Aires, Argentina, June.
Theuvsen, L. 2004. On good and bad bureaucracies: designing effective quality management sys-
tems in the agrofood sector. Paper presented at EAAE’s 84th
Seminar, Zeist, The Nether-
lands, February.
Tomarken, A.J., and N.G. Waller. 2005. Structural equation modeling: Strengths, limitations, and
misconceptions. Annual Review of Clinical Psychology 1:31-65.
Vogl, C.R., L. Klicher, and H. Schmidt. 2005. Are standards and regulations of organic farming
moving away from small farmers’ knowledge? Journal for Sustainable Agriculture 26
(1):5-26.
Zorn, A., C. Lippert, and S. Dabbert. 2010. Analyse der Kontroll und Sanktionshäufigkeiten
grosser Ökokontrollstellen in Deutschland. In Agrar- und Ernährungsmärkte nach dem
Boom, edited by J-P. Loy, and R. Müller, Landwirtschaftsverlag GmbH, Münster, pp. 271-
282.

Padilla Bravo et al. / International Food and Agribusiness Management Review / Volume 15, Issue 4, 2012
2012 International Food and Agribusiness Management Association (IFAMA). All rights reserved
134
Appendix 1
Table 4. Measurement items for the variables in the research model
Standard Factor
Variables and measurement itemsa Mean deviation loading
b
Satisfaction with organic certification
I am satisfied with the organic certification scheme. 1.68 1.41 1.00
Perceived reliability of organic certification
The certification process is reliable. 1.58 1.36 0.86
Cheaters are discovered during the inspections. 0.78 1.65 0.77
Inspectors are able to notice if other farmers sometimes do not follow the guide-
lines. 1.27 1.38 0.60
Perceived benefits
Farm management
Organic certification standards enhance the effectiveness of my organic practices. 1.57 1.43 0.87
The auditor gives me good ideas to improve the management of my farm. 1.05 1.90 0.69
The organic certification standard improves my productivity. 0.67 1.82 0.59
Relationship with buyers/Market access
The direction our business is going in became clearer through the certification pro-
cess. 2.03 1.15 0.84
I have a better relationship with my buyers since I got organic certification. 1.90 1.35 0.83
Since I farm organically, my business relations have increased. 1.80 1.56 0.81
I need organic certification to be able to sell my products. 2.20 1.26 0.63
Farm income
My income has increased since I got organic certification. 0.78 1.74 0.90
I had more gains with conventional agriculture than with organic agriculture.c 0.92 1.81 0.75
Perceived costs
Economic costs
The fee for the certification process is not so high.c 1.48 2.02 0.96
The cost for the organic certification scheme is too high. 2.48 0.85 0.69
Bureaucratic costs
The time expenditure for the certification process is too high. 0.38 2.09 0.82
The organic certification control system is very bureaucratic. 1.62 1.49 0.78
The required documentation for the organic certification scheme is too much. 0.42 2.04 0.56
Experience in the organic sector
Experienced
For how many years have you been practicing organic agriculture? 7.0 5.2 1.00
Perceived reputation
CB’s reputation
I chose this CB because it has a good reputation. 1.20 1.25 0.92
In comparison to other CBs ours is more thorough. 0.45 1.13 0.61
Auditor’s reputation
The performance of the auditor during the inspection is very correct. 1.80 1.12 0.88
Our auditor tries to find the weak points in my farm. 1.95 0.95 0.65
The auditor is an expert in organic production. 1.07 1.76 0.61
(Continued)

Padilla Bravo et al. / International Food and Agribusiness Management Review / Volume 15, Issue 4, 2012
2012 International Food and Agribusiness Management Association (IFAMA). All rights reserved
135
Table 4. (Continued)
Standard Factor
Variables and measurement itemsa Mean deviation Loading
b
Perceived risk in the organic sector
Risk perception
Nowadays there are more farmers who do not follow the organic guidelines. -0.30 1.28 0.76
Not every organic farmer has the same level of reliability. 1.72 1.22 0.72
I do not believe that all organic producers are trustworthy. 1.63 1.18 0.70
Perceived external and internal sources of pressure
Buyers pressure
My buyer warns me frequently about the consequences of cheating. 1.37 1.86 0.88
My buyer makes sure that I keep close to the guidelines. 1.68 1.75 0.82
Government pressure
The government does not monitor if farmers comply with organic certification. 0.90 1.69 1.00
Farmers pressure
If my neighbours discover that I am doing something wrong they would report me. 1.27 1.73 0.84
My organic certified neighbours monitor that I comply with the requirements of the
certification. 0.00 1.77 0.69
Producers are aware that if any of them cheat then it could be detrimental to the
name of the association. 2.18 1.10 0.71
Family pressure
My family cares that I fulfil the requirements of organic farming. 1.85 1.39 1.00 a Respondents assessed each item using a seven-point Likert scale with totally disagree (-3) and totally agree (+3) as
anchors. b Results of the PLS confirmatory factor analysis.
c A negative statement, the scale items were reverse coded.
d Years.

2012 International Food and Agribusiness Management Association (IFAMA). All rights reserved
136
Appendix 2
Va
ria
ble
s 1
2
3
4
5
6
7
8
9
1
0
11
1
2
13
1
4
15
1.
Au
dit
or’
s re
puta
tio
n
0.7
2a
2.
Bu
reau
crat
ic c
ost
s -0
.01
0
.73
3.
Bu
yer
s p
ress
ure
0
.20
0.0
3
0.8
5
4.
Rel
atio
nsh
ip/M
arket
a.
0.3
6
-0.2
7
0.3
1
0.7
8
5.
CB
’s r
eputa
tio
n
0.5
2
0.0
0
0.3
1
0.3
6
0.7
8
6.
Eco
no
mic
cost
s -0
.10
0
.01
-0.0
1
-0.1
5
-0.0
9
0.8
4
7.
Ex
per
ience
0
.09
0.0
4
-0.0
8
0.1
1
0.2
6
-0.0
8
1.0
0
8.
Fam
ily p
ress
ure
0
.45
-0.0
3
0.3
2
0.4
4
0.4
8
-0.1
3
0.1
1
1.0
0
9.
Far
m i
nco
me
0.4
3
0.0
2
0.3
0
0.4
3
0.2
4
-0.1
0
0.2
5
0.3
1
0.8
3
10
. F
arm
man
agem
ent
0.3
8
-0.0
9
0.3
9
0.3
5
0.4
5
-0.1
3
0.0
1
0.4
3
0.2
7
0.7
3
11
. F
arm
er p
ress
ure
-0
.01
0
.04
0.3
2
0.1
1
0.0
0
-0.0
4
-0.3
3
0.2
2
-0.0
8
0.3
0
0.7
5
12
. G
over
nm
ent
pre
ssure
-0
.22
-0
.03
-0
.17
-0
.05
-0
.18
0
.13
-0.1
1
-0.0
7
-0.3
6
-0.2
9
-0.0
8
1.0
0
13
. R
elia
bil
ity
0.3
3
-0.2
2
0.4
9
0.4
8
0.3
2
-0.2
4
-0.0
1
0.2
8
0.2
4
0.4
3
0.4
6
-0.0
5
0.7
5
14
. R
isk p
erce
pti
on
-0.2
4
0.1
6
-0.1
5
-0.3
0
-0.0
7
0.1
7
-0.0
1
-0.2
2
-0.3
2
-0.2
9
-0.3
4
0.1
4
-0.4
6
0.7
2
15
. S
atis
fact
ion
0.3
6
-0.3
0
0.2
1
0.5
2
0.3
5
-0.1
6
0.0
8
0.6
2
0.5
2
0.4
1
0.1
5
-0.2
1
0.3
8
-0.3
3
1.0
0
a Dia
go
nal
val
ues
in b
old
are
the
squar
e ro
ots
of
the
aver
age
var
iance
extr
acte
d.
CB
: C
erti
fica
tio
n b
od
y.
Tab
le 5
. D
iscr
imin
ant
val
idit
y a
nal
ysi
s bas
ed o
n t
he
Forn
ell
Lar
cker
cri
teri
on.

2012 International Food and Agribusiness Management Association (IFAMA). All rights reserved
137
International Food and Agribusiness Management Review
Volume 15, Issue 4, 2012
Analyzing Consumers’ Preferences
for Apple Attributes in Tirana, Albania
Engjell Skrelia and Drini Imami
b
a Associate Professor, Department of Agricultural Economics and Policy, Faculty of Economics and Agribusiness,
Agriculture University of Tirana, Koder-Kamez, Tirana
b PhD, Lecturer, Department of Agricultural Economics and Policy, Faculty of Economics and Agribusiness,
Agriculture University of Tirana, Koder-Kamez, Tirana, Albania
Abstract
This paper reports the findings of a study conducted on consumer preferences for apple fruits in
Tirana, Albania. Consumer preferences where analyzed using a Conjoint Choice Experiment and
Latent Class Analysis. For each identified consumer class, preferences for the chosen attributes
and their willingness to pay for such attributes were estimated. Marketing and policy
recommendations are provided for the sector stakeholders, with particular focus on producers
and policy-makers.
Keywords: apples, Conjoint Choice Experiment, consumer preferences Albania
Corresponding author: Tel: + 355686014986
Email: [email protected]
D. Imami: [email protected]
+The IFAMR is a non-profit publication. The additional support provided from this issue advertiser, Novus
International helps us remain open access and dedicated to serving management, scholars, and policy makers
worldwide.

Skreli and Imami / International Food and Agribusiness Management Review / Volume 15, Issue 4, 2012
2012 International Food and Agribusiness Management Association (IFAMA). All rights reserved.
138
Introduction
Apple production is an important economic activity for the Albanian agricultural sector; apples
are the most commonly cultivated fruit tree in Albania which falls under the category of labor
intensive activities. With a rather high labor to land ratio, as in case of Albanian agriculture, la-
bor intensive industries are an economically justified alternative. On the demand side, Albanian
consumers’ expenditures on apples are ranked as the second highest for all fruits and vegetables
combined, following tomatoes (USAID’s AAC 2008).
The Albanian Ministry of Agriculture, Food and Consumer Protection (MAFCP) is currently
supporting the fruit sector through an investment support scheme, by providing subsidies for new
fruit (apple) plantations. From a policy perspective, fruit production, including apple production,
is one of the four priority sectors of the new Programme for Rural Development in Albania 2012
– 2013 (MAFCP 2011a). This sector has also received attention from key donor projects
operating in the agriculture and rural sector in Albania, such as USAID’s AAC (Albanian
Agriculture Competitiveness) Program, SNV (Netherlands Development Organisation), and
MADA (Mountain Areas Development Agency).
Farmers are exploiting the economic opportunity presented by apple production. Domestic
production of apples in Albania has rapidly increased in recent years (more than quadrupling
between 2000 and 2010), as shown in Table 1. Production is expected to further increase in the
coming years, due to new plantations, stimulated by the investment support scheme, and
motivation from high domestic consumers demand. The per capita consumption of apples in
Albania increased 1.5 times between 2000 and 2007, estimated currently at 18 kg per capita
(FAOSTAT 2012).
Table 1. Dynamics of apple production and supply in Albania.
Category Unit/
Year 2000 2005 2006 2007 2008 2009 2010
Production Mt 12,000 16,000 27,566 36,000 45,000 47,202 54,604*
Import Mt 28,163 38,417 33,723 22,516 15,641 12,928 17,702
Export Mt 0 0 0 147 34 109 1,097
Supply1 Mt 40,163 54,417 61,289 58,369 60,607 60,022 71,209
Export/import % 0.0% 0.0% 0.0% 0.7% 0.2% 0.8% 6.2%
Production/supply % 29.9% 29.4% 45.0% 61.5% 59.1% 78.6% 76.7%
Import/supply % 70.1% 70.6% 55.0% 38.6% 41.0% 21.5% 24.9% Source. FAOSTAT (production), UNSTAT (import – export), *MAFCP (2011b)
Apple domestic production currently covers more than three-fourths (76.7%) of the domestic
supply; its share has increased substantially as compared to the year 2000, when domestic supply
was dominated by imports while domestic production covered only less than one-third of the
domestic supply (Table 1). Though the share of imports to domestic supply has dramatically fall-
en from 70.1 percent in the year 2000 to 24.9 percent in the year 2010, it is still high based on the
potential to increase production. The still high presence of imports can be partially explained by
1 Supply = Production – Export + Import

Skreli and Imami / International Food and Agribusiness Management Review / Volume 15, Issue 4, 2012
2012 International Food and Agribusiness Management Association (IFAMA). All rights reserved.
139
the seasonality of domestic supply, and partially by preferences of (certain) consumers (classes)
for specific apple varieties sourced by imports.
While several studies have been conducted on the apple value chain by a number of
organizations (DSA (Development Solutions Associates), SNV, USAID’s AAC), there is
currently a need for an in depth consumer analysis to identify consumer preferences for apple
attributes.
Understanding consumer preferences and behavior is important in the decision-making process
of key stakeholders, including apple producers and traders, MAFCP, as well as donor agencies
that operate in the sector. It is particularly important in a context where import substitution is
considered more feasible than export promotion, based on the development stage of private
actors and public competitiveness enhancing institutions (MAFCP 2007). Furthermore, so far,
MAFPC subsidy schemes have disregarded the importance of varieties (eg. supporting apple or
fruits plantation in general and not specific types of apple varieties which are mostly demanded
by the market). Therefore providing information on varieties of apples which are mostly
demanded by various market segments (including their size and willingness to pay) might be
useful to prepare more specific and efficient support schemes.
Objectives
The goal of this study is to assess consumer preferences for apple fruits in Tirana, Albania.
Specifically, the research objectives are:
1. Group consumers according to their preferences for the main apple attributes.
2. Assess consumer preferences of each identified class and their willingness to pay for such
attributes.
3. Provide marketing and policy recommendations for the sector’s stakeholders, with
particular focus on producers and policy-makers. Consequently, apple producers may
base their production and marketing decisions guided by consumer preferences, taking in-
to consideration the respective market segment size and willingness to pay for the given
attributes.
Methods and Procedures
The proposed method for this research is Conjoint Analysis (CA) which originated theoretically
from Lancaster (1966) who posited that the consumer utility is based on the bundle of attributes a
product represents. Later, CA has been widely used to assess consumer preferences beginning
with Green and Rao (1971) and Johnson (1974). The advantage of CA, compared to other
methods, stands in the fact that CA is based on different product attributes. For each attribute
there are several levels which enable assessment of consumer preferences for the products
through partial contribution of product features (Hauser and Rao 2003). Louviere and
Woodworth (1983) improved conjoint analysis introducing choice based experiments or conjoint
choice experiment (CCE). The main advantage of CCE over conventional CA is that in CCE
Skreli and Imami / International Food and Agribusiness Management Review / Volume 15, Issue 4, 2012
2012 International Food and Agribusiness Management Association (IFAMA). All rights reserved.
140
respondents have to choose the most preferred option out of several choice sets and thereby the
trade-off can be measured in line with the respondents’ weight in choosing one attribute over
another (Haaijer 1999).
This approach enables us to obtain consumer classes—each class including information on the
preferred product attributes and based on which willingness to pay can also be derived. As result,
various producers and traders can identify the most suitable market niche/segment to target,
given consumer preferences by classes. From a practical standpoint, if a producer cannot produce
a particularly preferred product due to already planted traditional cultivars then the information
from the study enables them to judge the value of trade-off between currently planted cultivars
and new cultivars that could replace them, to meet consumer demand.
CCE has been used before for fruits (Barber et al. 2008, Evans 2008) and for apple specifically
in other countries (Wirth et al. 2011; Novotorova and Mazzocco 2008; Sun and Wang 2002;
Jerko and Kovačić 2008; Manalo 1990). CCE has also been used extensively in Albania on other
food products, such as olive oil (Chan-Halbrendt et al. 2010), lamb meat (Imami et al. 2011),
table olives (Zhllima et al. 2011) and wine (Zhllima et al. 2012). These studies have grouped
consumers by their preferences for various product attributes and have assessed willingness to
pay, thus providing important indications and recommendations to agrifood marketing
enterprises and to policy-makers. Therefore we have chosen CCE with Latent Class Analysis
(LCA) for studying consumer preferences for apple in Albania.
There are four stages in the designing of conjoint choice experiments resulting in a survey. Once
the survey is administered to the respondents, the data are analyzed using latent class analysis to
determine Tirana consumer preferences for apples.
Conjoint Choice Design
First and Second Conjoint Choice Design Stage: Selecting Product Attributes and their Levels
Product attributes and their levels have been selected based on literature review, expert assess-
ment and focus group discussions. Two focus groups discussions were organized; one focus
group with consumers and another one with agrifood marketing experts. As a result, the most
important apple attributes and their respective levels were identified. The attributes identified
were: color (variety), origin, price, and fruit size.
Color (variety). Color has consistently been an important attribute in previous fruit and vegetable
analyses. The relative importance for color of apples was 20 percent in Manalo’s study (1990)
and 17.98 percent in Jerko and Kovačić study (2008). In our study we have chosen to make a
linkage between color and apple variety. According to the focus group findings, most consumers
in Albania do not recognize apple by variety name, but by color. Therefore we use color as an
attribute instead of variety – the later is observed indirectly through color.
Origin. Origin is quite an important attribute for agrifood products. Jerko and Kovačić (2008)
found that relative importance of origin for apple was 20.94 percent. Dentoni et al. (2009) found
that consumers prefer local grown apple over imported ones in USA. Consumer surveys in

Skreli and Imami / International Food and Agribusiness Management Review / Volume 15, Issue 4, 2012
2012 International Food and Agribusiness Management Association (IFAMA). All rights reserved.
141
Albania on other agrifood products such as olive oil (Chan-Halbrendt et al. 2010), and lamb meat
(Imami et al. 2011) show a preference and significant willingness to pay for locally grown
products.
Price. Although price is not technically a product attribute, it is commonly included as an attrib-
ute in conjoint analyses because it is a major factor in product buying choice. Price is also
necessary to compute willingness to pay.
Size. Expert opinions and focus groups identified size as an important attribute for apple. Large
fruits may be preferred to small ones because larger sizes may imply a higher quality. On the
other hand, large fruit size may also be perceived as being produced using hormones. It may be
possible that small fruits are preferred to larger ones because they may be considered as
organically produced or because of convenience in consumption, according to the focus group
findings. Apple fruit size is considered as an important attribute in several studies conducted on
apple consumer preferences (Manalo 1990; Richard and Smith 2004).
Other studies have included the method of production and environmental practices as product
attributes. Novotorova and Mazzocco (2008) as well as Sun and Wang (2002) found that con-
sumers in USA rank method of production as highly important – there is an overall preference
for organically produced versus conventionally produced apples. Also Jerko and Kovačić (2008)
conclude with similar finding for Croatia. In Albania, consumers largely perceive domestic
agrifood products as organically produced while genetically modified (GM) apples are
practically nonexistent – therefore the method of production was not included in the survey.
Other important attributes like freshness, safety and quality were judged to be difficult to assign
precise attribute levels. Moreover, for practical reasons, the number of attributes could not be
extended beyond the four already selected, as adding more attributes makes survey
implementation more complicated.
The attributes included in the study are represented by categorical variables which imply a
decision to be made about the number of attribute levels. Four colors (red, yellow, green and red
yellow stripped) corresponding to the four most common varieties currently in Albania
(Red-chief, Golden Delicious, Grany Smith and Fuji) represent the four levels of attribute
“color” Table 2). Domestic and imported are the two levels for the attribute “Origin”. Including
also the main regions of apple origin within Albania as attribute levels was declined in order to
avoid respondents’ fatigue. Two levels of fruit size – 5 and 8 cm – were selected based on con-
sumers perception of “small” and “large” fruits” in Albania. The decision on fruit size
attribute levels is based on focused group discussions and by consulting fruit wholesalers and
retailers. The levels of apple price were decided by the research team given the price interval and
its distribution team based on Agriculture Market Information System.

Skreli and Imami / International Food and Agribusiness Management Review / Volume 15, Issue 4, 2012
2012 International Food and Agribusiness Management Association (IFAMA). All rights reserved.
142
Table 2. Apple attributes and levels.
Attributes
Color (Variety) Price (ALL2/Kg) Origin Fruit size
Atr
ibu
te
level
Red (Starking) 50 Imported Large (8 cm)
Yellow (golden) 80 Local Small (5 cm)
Green (Granny Smith) 110
Red yellow striped (Fuji) 150
Third and Fourth Conjoint Choice Design Stage: Choice of Experimental Design and
Construction of Choice Sets
In this study, a Conjoint Choice Experiment (CCE) was used to design the survey and Latent
Class Analysis (LCA) was used to analyze the data. Sawtooth Software SSI Web v 6.6 was used
to design the survey and to prepare the data for processing, while Sawtooth Software Latent
Class for CBC v 4.0.8 was used for data processing. Table 3 gives a brief description of the
design stages of a CCE.
Table 3. Design stages for a CCE
Stage Description
Selection of
attributes
Selection of apple attributes has been done based on the literature review,
expert interview and focus group discussions.
Assignments of
attributes level
The range of attributes is also based on literature review, expert interview
and market conditions. The attribute levels have been assigned such as to
be reasonable and realistic.
Choice of
experimental
design
Fractional factorial design is used to reduce the possible combinations
which combine the levels of the attributes that reduce respondents fatigue
and also provide efficiency in model estimation.
Construction of
choice sets
The concepts identified by the experimental design are then paired and
classed into choice sets to be presented to respondents.
Source. Chan-Halbrendt et al. 2010
The idea that all goods can be described by their characteristics, also known as attributes, is the
basis of CCE. For CCE, the most important attributes and their levels have to be determined
when designing the study.
Using the CCE method in designing the survey with LCA to analyze the data collected, is an im-
provement on the traditional (i.e. one class) aggregated model analysis. The standard aggregated
model has to deal with the independence of irrelevant alternatives problem, which affects the
predictions of market niches. Latent classes take into consideration different segments with dif-
ferent utility preferences within a certain group or class (Magidson and Vermunt 2003). In LCA,
2 Note. ALL stands for the Albanian Currency. Approximately 100 ALL = 1 USD during the time when the survey
was carried out.

Skreli and Imami / International Food and Agribusiness Management Review / Volume 15, Issue 4, 2012
2012 International Food and Agribusiness Management Association (IFAMA). All rights reserved.
143
respondents are grouped, according to their choices in the CCE. The choices that respondents
made are considered mainly based on their attribute preferences and their socio-demographics. In
our study, we have not included socio-demographic variables affecting consumer choice because
of software limitations.
Questionnaire Design, Sampling and Data Collection
Questionnaire Design
The questionnaire has been designed based on literature review, expert knowledge consultation,
focus groups and brainstorming within the research team. The core part of the questionnaire con-
sists of choice sets. After apple attributes have been selected and attribute levels assigned, the
later have been combined into choice sets of triple concepts or profiles, as seen in Figure 1:
Apple Type
Yellow (Golden) Green (Granny Smith) Red yellow striped (Fuji) Domestic Imported Imported
Big (larger than 8 cm) Small (less than 8 cm) Small (less than 8 cm) ALL 80 per kg ALL 50 per kg ALL 110 per kg
I would choose
Figure 1. Example of choice sets used in the survey.
Twelve choice sets (profiles) of triple concepts were included in each questionnaire, and each
respondent was asked to choose 12 concepts, one for each triple choice sets. The minimum
number of choice sets or profiles depend on the number of attributes and attributes levels
(Novotorova and Mazzocco 2008) which determine the number of parameters. The number of
parameters is equal to the total number of attribute levels minus the total number of attributes
plus one. In our case with 12 attribute levels (2x4+2x2) and 4 attributes, the number parameters
is 9 and the number of choice sets should be 13.5.
Sampling
A sample size of 250 questionnaires was deemed as an appropriate sample size to provide relia-
ble estimates. Green and Srinavasan (1978) suggest a minimum sample of 100 respondents for
conjoint analysis types of studies. Xu and Yuan (2001) suggest using the ratio of the number of
respondents to the number of parameters when identifying the sample size; a ratio between 5 and
10 is a recommended ratio. In our study, the number of parameters is 9, and therefore a sample
size to result in reliable results is between 45 and 90. Our sample of 250 is considered large
enough to produce reliable results; similar sample size has been used in other similar surveys in
Albania (Chan-Halbrendt et al. 2010; Zhllima et al. 2012).

Skreli and Imami / International Food and Agribusiness Management Review / Volume 15, Issue 4, 2012
2012 International Food and Agribusiness Management Association (IFAMA). All rights reserved.
144
Interviews were conducted in Tirana. We chose Tirana for three reasons: (i) purchasing power is
concentrated mainly in Tirana, the country’s capital; (ii) Tirana has a reasonably good demo-
graphic representation of the country as a whole (during the last twenty years, Tirana has grown
from 200,000 to around 700,000 inhabitants as people from all over Albania have migrated to
Tirana); and, (iii) interviews in Tirana reduce travel costs substantially. The interviews were car-
ried out at various sites within Tirana as suggested by the focus groups. Interviews took place
close to green markets and supermarkets – people were approached randomly in a face-to-face
interview and after completing the interview, interviewers would approach the next closest
person who walked by.
Table 4 (below) shows the gender and age structure of Tirana survey respondents. The study’s
population showed that older people are a bit over-represented in the survey when compared to
the real population. Younger people and females are slightly under-represented in this study, as
in Albania it is more common for men to do the food shopping, particularly for older genera-
tions. Such sample is in line with previous research on consumer behavior carried out in Albania
(Imami et al. 2011; Zhllima et al. 2012).
Table 4. Socio- demographic comparison of survey respondents with Tirana’s population. Survey Respondents Tirana Population
(%) (%) Gender Female 46.1 50.14
Male 53.9 49.86
Age 18-24 1.9 12.89
25-30 3.2 7.66
31-35 4.6 10.74
36-40 5.1 11.40
41-45 7.4 11.75
46-50 14.8 10.48
51-55 18.1 8.59
56-60 17.1 6.67
61-64 10.6 6.54
65 and up 17.1 13.34 Source. INSTAT (for the Tirana population’s figures)
Data Collection
Data have been collected by well trained and motivated interviewers and the process was closely
monitored by the research staff. The questionnaire was properly coded in order to better manage
data entering and data processing. A data entry file was prepared and entered in a SPSS data-
base.

Skreli and Imami / International Food and Agribusiness Management Review / Volume 15, Issue 4, 2012
2012 International Food and Agribusiness Management Association (IFAMA). All rights reserved.
145
Data Analysis: Conjoint Choice Model Using LCA Approach
This is the final stage of the research design. As discussed in the literature review, conjoint
choice method using LCA is an improvement on the traditional aggregated or one class model. In
latent class analysis, the different segments that have different utility preferences are accounted
for and hence better market predictions can be made.
The Latent Class Model is a random utility model. Building on the seminal work of McFadden
(1973), consumer utility can be represented as follows:
ijtijtijt XU (1)
where the subscript i refers to individual i, j refers to concept j and t refers to choice set t. The
utility level Uijt is a linear function of observable vector of attributes xijt and its coefficient to be
estimated, β. εijt is a random error term, which captures all unobservable attributes and factors
that influence the choice process.
McFadden (1974) showed that the probability that concept j in choice set t is chosen by individu-
al i is given as:
J
k
ikt
ijt
ijt
X
XP
1
)exp(
)exp(
(2)
The numerator is the exponent of the observable utility of concept j in choice set t, and the de-
nominator is simply a collection of observable utility from all available concepts.
In our study, only product attributes (color/variety, origin, size and price) have been considered,
therefore an individual’s probability of choosing concept j was considered as a function of apple
attributes. The socio-demographic variables have not been considered, due to software limita-
tions, as abovementioned.
Results and Discussions
Selection of the Model with Optimal Number of Distinct Classes
Consistent Akaike Info Criterion (CAIC) was used to determine the best model. Based on
CAIC, the four class model was chosen over the three class and five class models. CAIC
decreases substantially when passing from three class model to four class model, showing that
four class model matches better the data, as shown in Table 5. CAIC is also smaller in the five
class model compared to the four class model, but the rate of decrease is less significant.
Additionally, the five class model contains two quite small classes of consumers, as shown in
Annex 2. These criteria suggest that the four class model is the best model.
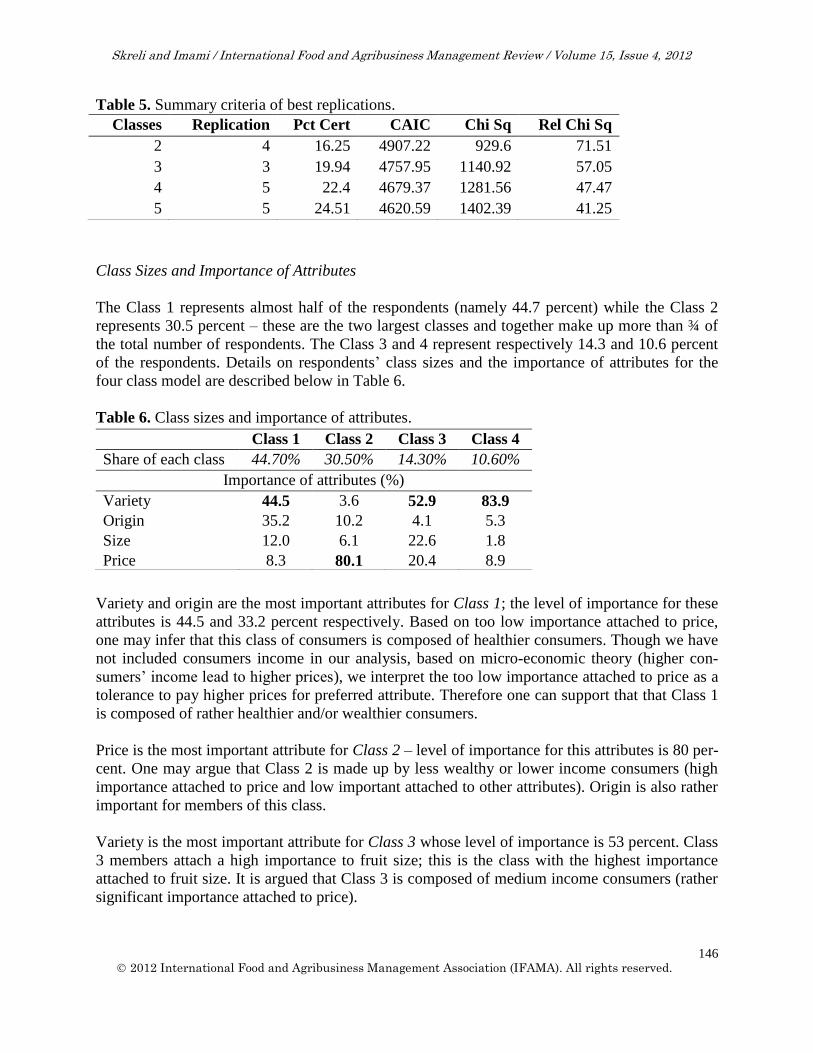
Skreli and Imami / International Food and Agribusiness Management Review / Volume 15, Issue 4, 2012
2012 International Food and Agribusiness Management Association (IFAMA). All rights reserved.
146
Table 5. Summary criteria of best replications.
Class Sizes and Importance of Attributes
The Class 1 represents almost half of the respondents (namely 44.7 percent) while the Class 2
represents 30.5 percent – these are the two largest classes and together make up more than ¾ of
the total number of respondents. The Class 3 and 4 represent respectively 14.3 and 10.6 percent
of the respondents. Details on respondents’ class sizes and the importance of attributes for the
four class model are described below in Table 6.
Table 6. Class sizes and importance of attributes.
Variety and origin are the most important attributes for Class 1; the level of importance for these
attributes is 44.5 and 33.2 percent respectively. Based on too low importance attached to price,
one may infer that this class of consumers is composed of healthier consumers. Though we have
not included consumers income in our analysis, based on micro-economic theory (higher con-
sumers’ income lead to higher prices), we interpret the too low importance attached to price as a
tolerance to pay higher prices for preferred attribute. Therefore one can support that that Class 1
is composed of rather healthier and/or wealthier consumers.
Price is the most important attribute for Class 2 – level of importance for this attributes is 80 per-
cent. One may argue that Class 2 is made up by less wealthy or lower income consumers (high
importance attached to price and low important attached to other attributes). Origin is also rather
important for members of this class.
Variety is the most important attribute for Class 3 whose level of importance is 53 percent. Class
3 members attach a high importance to fruit size; this is the class with the highest importance
attached to fruit size. It is argued that Class 3 is composed of medium income consumers (rather
significant importance attached to price).
Classes Replication Pct Cert CAIC Chi Sq Rel Chi Sq
2 4 16.25 4907.22 929.6 71.51
3 3 19.94 4757.95 1140.92 57.05
4 5 22.4 4679.37 1281.56 47.47
5 5 24.51 4620.59 1402.39 41.25
Class 1 Class 2 Class 3 Class 4
Share of each class 44.70% 30.50% 14.30% 10.60%
Importance of attributes (%)
Variety 44.5 3.6 52.9 83.9
Origin 35.2 10.2 4.1 5.3
Size 12.0 6.1 22.6 1.8
Price 8.3 80.1 20.4 8.9

Skreli and Imami / International Food and Agribusiness Management Review / Volume 15, Issue 4, 2012
2012 International Food and Agribusiness Management Association (IFAMA). All rights reserved.
147
Variety is by far the most important attribute for Class 4 – level of importance for this attributes
is 84 percent. As in case of Class 1, this class is composed of healthier consumers (less im-
portance attached to price).
Origin is very important for the two largest classes (Class 1 and Class 2) which actually make up
¾ of consumers. There is currently an overall preference for Albanian products. Recent studies
confirm the overall preference of Albanian consumers for domestic products such as lamb, olive
oil, table olives, and wine (Imami et al. 2011; Chan-Halbrendt et al. 2010; Zhllima et al. 2011,
Zhllima et al. 2012).
Consumer Preferences
Members of Class 1 prefer green apple (Granny Smith variety) to yellow (Golden) and red yel-
low striped apples (Fuji variety). Additionally, they prefer domestic apples to imported ones, and
bigger size apples to smaller ones (Table 7). We name this class as “Local green”.
Table 7. Parameter estimates Class 1 Class 2 Class 3 Class 4
Variety Utility(β) t Utility(β) t Utility(β) t Utility(β) t
Red (Starking) -0.01 -0.12 -0.08 -0.78 -0.01 -0.13 2.09** 12.61
Yellow (Golden) -0.30** -4.88 -0.11 -1.11 1.37** 11.90 0.05 0.35
Green (Granny
Smith) 0.57** 10.89 0.09 0.83 -0.76** -5.61 -1.22** -6.03
Red Yellow Striped -0.27 -4.48** 0.10 0.97 -0.60** -4.69 -0.92** -5.08
Origin
Domestic 0.34 10.22** 0.30** 4.67 0.08 1.20 -0.11 -1.11
Imported -0.34 -10.22** -0.30** -4.67 -0.08 -1.20 0.11 1.11
Size
Big (8 cm) 0.12 3.58** 0.18** 3.18 -0.46** -6.51 0.04 0.39
Small (5 cm) -0.12 -3.58** -0.18** -3.18 0.46** 6.51 -0.04 -0.39
Price
Price -0.05 -1.83 -1.58** -20.47 -0.27** -4.28 0.12 1.37
** Significance at 0.01 levels
Members of Class 1 are not price sensitive and prefer less sugar content apples. It can be can in-
ferred that Class 1 is composed of healthier consumers (not price sensitive) whose choice is af-
fected by their health concerns (they prefer less sugar content apples). The recent data from Al-
banian Ministry of Health (MoH) support that 3 in four deaths are caused by cardio-vascular and
tumor diseases and three in five deaths are caused by cardio-vascular diseases alone (MoH
2012); both kinds of diseases are also associated with eating habits.
Price is the most important attribute for Class 2, a reason for us to name it as “Price sensitive”
class. Price has significant negative value. Consumers in this class are oriented primarily towards
lower price (cheaper) apple. This class is composed most probably of less healthy consumers.

Skreli and Imami / International Food and Agribusiness Management Review / Volume 15, Issue 4, 2012
2012 International Food and Agribusiness Management Association (IFAMA). All rights reserved.
148
Similar to Class 1, domestic apples are preferred to imported ones, and bigger size apples to
smaller ones.
Variety is the most important attribute for Class 3. Members of Class 3 prefer yellow to green
and red-yellow apples (we name it “Yellow Class”). Additionally, they prefer small size to large
size apples, while show no significant preference to the attribute of origin.
Variety is by far the most important attribute also for Class 4. Consumers in Class 4 prefer red
apple (we name it “Red Class”) to green and red-yellow apple in comparison to other varieties.
Consumers in this class show no significant preference for the attributes of the origin and size.
Utilities and Consumers’ Willingness to Pay
Table 7 summarizes part worth utilities (parameters) and their significance. Based on these esti-
mates, one may compute consumers’ willingness to pay for each attribute level and calculate
premium for choosing one attribute level over another.
As discussed by Lusk and Schroder (2004) and Colombo (2008), willingness to pay (WTP) is
derived by the price difference necessary to invoke indifference between two alternatives. Total
WTP for attribute on (in case of origin attribute, n takes the values of 1 for domestic and 2 for
imported) versus “none” option is simply calculated as the ratio of the attribute specific constant
(part worth utilities) to the price coefficient: βon/α. Marginal WTP for attribute level 1 versus
attribute level 2 can be calculated as a ratio of the difference between total WTP for attribute
level 1 and total WTP for attribute level 2 and the price coefficient, or as the ratio of the
difference between alternative specific constant (part worth utilities) of attribute level 1 and 2
and the price coefficient: (βo1-βo2)/α; as explained, o stands for product origin.
The consumers in the first class are willing to pay ALL 13.6 more for each kg of domestic apple
as compared to imported apple ((0.34-(-0.34))/(-0.05). Additionally, they are willing to pay ALL
17.4 per green apple versus yellow apples and 4.8 ALL per kg of big apples versus small apples.
The third class of consumers is quite the opposite of the first class; consumers in this class are
willing to pay ALL 7.9 more for yellow apples versus green apples, and 3.4 ALL for small ap-
ples versus big apples. The consumers of the fourth class show a strong preference for red ap-
ples, since they are ready to pay ALL 27.6 more per kg of red apples versus green apple.
Conclusions
This study aims to identify consumer classes and their preferences for main apple attributes, such
as variety, origin, size and price in order to provide marketing and policy recommendations.
Findings on consumer preferences are essential for private actors throughout the apple value
chain and policy-makers. Information on market segmentation and segments’ sizes, benefits pri-
vate actors in terms of learning about apple attributes (varieties, fruit sizes) preferred by consum-
ers; it benefits also policy-makers, particularly MAFCP, in terms of better orienting its current
investment support scheme toward varieties that have higher demand.

Skreli and Imami / International Food and Agribusiness Management Review / Volume 15, Issue 4, 2012
2012 International Food and Agribusiness Management Association (IFAMA). All rights reserved.
149
Study results reveal that origin, variety, and size are quite important attributes. Variety/color is
so important that the first class can be named “green class”, the third class can be named “yellow
class” and the forth class is named “red class”. Class 1 (which is also the largest) is willing to
pay more than 17 ALL per kg of green apple versus yellow apple. Apple color is found to be im-
portant by Jerko and Kovačić (2008).
There is a clear preference for domestic versus imported apples in three out of four classes. For
the first (largest) class of consumers, there is a clear preference for domestic versus imported ap-
ple, and willingness to pay a premium of ALL 13.6 for each kg of domestic apple as compared to
imported apple. The preference for domestic apples is supported by other studies conducted in
Albania (USAID’AAC 2010). Jerko and Kovačić (2008) as well as Novotorova and Mazzocco
(2008) have also found that consumers rank origin among the most important attributes, prefer-
ring locally produced apples, respectively in Croatia and USA.
The distinction between domestic and imported apples does not seem to be very objective how-
ever. While more than 1/3 of consumers (35.5 percent) believe to be able to distinguish domestic
from imported apple by themselves, and 41.5 percent make the decision on origin by asking the
trader, a related in-depth survey (USAID’AAC 2010) has found that there is a preference for
domestic apples before testing and lack of recognition for imported and domestic apples after
testing.
Our study finds that fruit size comes out to be important in three out of four classes. It is im-
portant to emphasize that the preference for large size apples (the first and second class of con-
sumers) and for small size apples (third class of consumers) implies consumers’ willingness to
pay for that attribute. Manalo (1990), using a CCE and Richard and Smith (2004) using a hedon-
ic pricing model found willingness to pay for large apples. Apple size is associated with either
apple quality or production method. According to the focus groups, larger size, when preferred,
implies better quality phrased as “better appearance” or “better taste”, and smaller size, when
preferred, implies a “more naturally” grown fruit or more convenience in consumption.
Thus, our study findings are in line with previous apple consumer studies conducted elsewhere.
On the other hand, our study adds new knowledge on apple consumer preferences compared to
existing studies (Wirth et al. 2011; Jerko and Kovačić 2008; Manalo 1990), and goes one step
further by analyzing consumer preferences for each of the identified consumer classes. This
study provides detailed information for preferred product attributes to agrifood value-chain
stakeholders. Additionally, the WTP was calculated for each of the main attributes, which was
not done in the abovementioned studies, provides useful information to the apple sector decision-
makers.
The implications should be considered from both marketing and policy viewpoints. Apple varie-
ty and fruit size are quite important attributes in marketing. It is important that actors throughout
the apple value chain (farmers, collectors/traders) think not in terms of producing and selling
simply “apples”, but producing and selling “green apples”, “yellow apples” and “red” apples.
This is important for targeting different consumer segments. We discussed that consumers be-
longing to Classes 1 and 4 are healthier consumers, and Class 3 consumers are medium income
consumers. Study results show that the members of these classes are willing to pay a premium

Skreli and Imami / International Food and Agribusiness Management Review / Volume 15, Issue 4, 2012
2012 International Food and Agribusiness Management Association (IFAMA). All rights reserved.
150
for preferred apple attributes. The importance attached by consumers to fruit size should have an
adequate response by both private actors in terms of grading policy.
In terms of policy, this study suggests that government should pay due attention to supporting
domestic apple promotion and design awareness raising campaigns stressing the importance of
apple consumption for healthy diet. Three-forths of the consumers represented in Classes 1 and 2
(Table 6), consider production origin a valued attribute. Regarding origin, a highly important
recommendation should be considered: there is a difference between subjective preference for
domestic apples and a lack of objective differentiation between domestic and imported apples.
Therefore, designing a certification program for “domestically produced apples” is likely to bet-
ter channel customer preferences to domestically produced apples. Regional branding coupled
with producers identification information is already instituted as the most important producing
apple area in Albania. The preference of consumers to less sugar content apples suggests that
health concerns are important. The government may therefore need to consider designing and
implementing a consumer education policy, including school curriculum improvement.
Related literature and expert opinions – as discussed in this paper – support the hypothesis that
other apple attributes such as freshness, safety, quality, method of production and regional origin
within Albania are also important. Additionally, socio-economic determinants of consumer
choices were not fully addressed in this study. Further studies may address them. Finally, being
limited only to the Tirana market— despite arguments that Tirana market is rather representative
– may have somewhat biased the study results, and therefore some precaution is advised when
generalizing the results at a country level.
Acknowledgment
This research work was supported by World Learning, AHEED and HED financed by USAID.
Special thanks to Dr. Catherine Chan-Halbrendt, coordinator of the AHEED program for assist-
ing us throughout the research project, and to Mr. Besart Likmeta for editing. We are thankful to
Dr. Domenico Dentoni for his valued comments and to unknown reviewers for their useful
analysis.
References
Barber, S. G., C. Chan-Halbrendt, J. Krishnakumar, T. Radovich, and K. Love. 2008. Hawaii
Avocado Industry Analysis: Part 2: Buyer Preference Focus. University of Hawaii, Coop-
erative Extension Service, Economic Issues.
Chan-Halbrendt, C., E. Zhllima, G. Sisior, D. Imami, and L. Leonetti. 2010. Consumer Prefer-
ence for Olive Oil: The Case of Tirana. International Food and Agribusiness Manage-
ment Review 13 (3): 55 – 74.
Colombo, S., N. Hanley, and J. Louviere. 2008. Modeling Preference Heterogeneity in Stated
Choice Data: an Analysis for Public Goods Generated by Agriculture. Stirling Economics
Discussion Papers 2008/28. University of Stirling.

Skreli and Imami / International Food and Agribusiness Management Review / Volume 15, Issue 4, 2012
2012 International Food and Agribusiness Management Association (IFAMA). All rights reserved.
151
Dentoni, D., G. Tonsor, R. Calantone, and C. Peterson. 2009. The Direct and Indirect Effect of
Locally-Grown Attributes on Consumers’ Attitudes towards a Product. Agricultural and
Resource Economics Review 38 (3): 384–396.
Evans C. B. 2008. Consumer preferences for watermelons: a conjoint analysis, PhD thesis, Au-
burn University Graduate School, Alabama, USA.
FAOSTAT, Statistical Database of FAO (Food and Agriculture Organization), Available at:
faostat.fao.org (accessed August 30th
, 2012).
UNSTAT Commercial Trade Database, Available at http://comtrade.un.org/ (accessed August
30th
, 2012).
Green, P.E. and V. R. Rao. 1971. Conjoint Measurement for Quantifying Judgmental Data.
Journal of Marketing Research 8: 355-63.
Green, P.E., and V. Srinivasan. 1978. Conjoint Analysis in Consumer Research: Issues and Out-
look. The Journal of Consumer Research 5: 103-123
Haaijer, M., 1999. Modeling conjoint choice experiments with the probit model. PhD Thesis,
University of Groningen, Labyrint Publications, The Netherlands.
Hauser, R.J. and V. Rao. 2003. Conjoint Analysis, Related Modeling and Applications. In
Market Research and Modeling: Progress and Prospects:A Tribute to Paul E. Green,
edited by Yoram Wind, Paul E. Green,141-168. Springer.
Johnson, R. M. 1974. Trade-off Analysis of Consumer Values, Journal of Marketing Research
11: 121-7.
Imami D., C. Chan-Halbrendt, Q. Zhang, and E. Zhllima. 2011. Conjoint Analysis of Consumer
Preferences for Lamb Meat in Central and Southwest Urban Albania, International Food
and Agribusiness Management Review 14(3): 111-126.
INSTAT (Albanian Institution of Statistics), 2012 (Source of socio-demographic figures of Tira-
na Population) Available at: http://www.instat.gov.al/
Jerko, M., and D. Kovačić. 2008. The Importance of Apple attributes: a Comparison of Self-
explicated and Conjoint Analysis Results. Paper prepared for presentation at the 12th
EAAE Congress: “People, Food and Environments: Global Trends and European Strate-
gies”, Gent (Belgium), 26-29 August 2008.
Lancaster, K. 1966. A New Approach to Consumer Theory. Journal of Political Economy 74:
132—157.

Skreli and Imami / International Food and Agribusiness Management Review / Volume 15, Issue 4, 2012
2012 International Food and Agribusiness Management Association (IFAMA). All rights reserved.
152
Louviere, J. J. and G. G. Woodworth. 1983. Design and analysis of simulated consumer choice
or allocation experiments: An approach based on aggregated data. Journal of Marketing
Research 20:350-367.
Lusk, J. L., and T. C. Schroeder. 2004. Are Choice Experiments Incentive Compatible? A Test
with Quality. American Journal of Agricultural Economics 86 (2):467-482.
Magidson, J. and J. Vermunt. 2003. Latent Class Models. http://www.statisticalinnovations.com/
articles/sage11.pdf (accessed November 2010).
McFadden, D. 1973. Conditional logit analysis of qualitative choice behavior. Frontiers in
Econometrics, edited by P. Zarembka, Academic Press
McFadden, D. 1974. Conditional Logit Analysis of Qualitative Choice Behavior. Frontiers in
Econometrics. Edited by I. Zarembka. New York: Academic Press
MAFCP. 2007. Sector Strategy of Agriculture and Food 2007-2013.
MAFCP. 2011a. Rural Development Programme 2011-2013 Under the Instrument for Pre-
Accession Assistance.
MAFCP. 2011b. Statistical Yearbook. Published by ALBDESIGN.
Manalo, A. 1990. Assessing the Importance of Apple Attributes: An Agricultural Application of
Conjoint Analysis. Northeastern Journal of Agricultural and Resource Economics 19(2).
MoH. 2012. Publications/Statistics. Causes of Death fro 100,000 people in 2009.
http://www.moh.gov.al/index.php?module=2&item=87 (accessed August 25th
, 2012).
Novotorova, N. K. and M. A. Mazzocco. 2008. Consumer Preferences and Trade-Offs for Local-
ly Grown and Gentically Modified Apples: A Conjoint Analysis Approach. International
Food and Agribusiness Management Review 11 (4): 31 – 53.
Richard C. R. and E. Smith. 2004. The value of apple characteristics to wholesalers in western
Canada: A hedonic approach. Canadian Journal of Plant Science 84(3): 829-835,
10.4141/P03-164.
Sun, J. and Q. Wang. 2002. A conjoint analysis of consumer demand for organic apples in Ver-
mont. Agricultural and Resource Economics Review 31 (2): 263.
USAID’AAC. 2008. The Albanian Apple Value Chain. Technical report.
USAID’AAC. 2010. Consumer Survey: Domestic or Imported Apple? Technical Report.
Zhllima, E., A. Vercuni, C. Chan-Halbrendt, I. Qinami, E. Merkaj, D. Imami. 2011. Consumer
preferences for table olives in Tirana. IFAMA Conference Proceedings, Frankfurt,
Germany.
Skreli and Imami / International Food and Agribusiness Management Review / Volume 15, Issue 4, 2012
2012 International Food and Agribusiness Management Association (IFAMA). All rights reserved.
153
Zhllima, E., C. Chan-Halbrendt, Q. Zhang, , D. Imami, , R. Long, , L. Leonetti, M. Canavari.
2012. Latent Class Analysis of Consumer Preferences for Wine in Tirana, Albania.
Journal of International Food & Agribusiness Marketing 24 (4):1–18.
Wirth, F. F., J. L. Stanton, and J.B. Wiley. 2011. The Relative Importance of Search versus
Credence Product Attributes: Organic and Locally Grown. Agricultural and Resource
Economics Review 40 (1) : 48 – 62.
Xu, G., and Y. Yuan. 2001. Conjoint Analysis in Pharmaceutical Marketing Research. Quirk’s
Marketing Research Review June: 1-10.

Skreli and Imami / International Food and Agribusiness Management Review / Volume 15, Issue 4, 2012
2012 International Food and Agribusiness Management Association (IFAMA). All rights reserved.
154
Appendix 1. Summary of Results Summary of Best Replications
Classes Replication Pct Cert CAIC Chi Sq Rel Chi Sq
2 4 16.25 4,907.22 929.60 71.51
3 3 19.94 4,757.95 1,140.92 57.05
4 5 22.40 4,679.37 1,281.56 47.47
5 5 24.51 4,620.59 1,402.39 41.25
Solution for 4 Classes (Replication 5)
Percent Certainty 22.40
Consistent Akaike Info Criterion 4,679.37
Chi Square 1,281.56
Relative Chi Square 47.47
Segment Size 0.14 0.11 0.45 0.31
Part Worth Utilities
Red (Starking) -0.01 2.09 -0.01 -0.08
Yellow (Golden) 1.37 0.05 -0.30 -0.11
Green (Granny Smith) -0.76 -1.22 0.57 0.09
Red Yell Strip (Fuji -0.60 -0.92 -0.27 0.10
Local 0.08 -0.11 0.34 0.30
Imported -0.08 0.11 -0.34 -0.30
Big (8 cm) -0.46 0.04 0.12 0.18
Small (5 cm) 0.46 -0.04 -0.12 -0.18
Price -0.27 0.12 -0.05 -1.58
t Ratios
Red (Starking) -0.13 12.61 -0.12 -0.78
Yellow (Golden) 11.90 0.35 -4.88 -1.11
Green (Granny Smith) -5.61 -6.03 10.89 0.83
Red Yell Strip (Fuji) -4.69 -5.08 -4.48 0.97
Local 1.20 -1.11 10.22 4.67
Imported -1.20 -1.11 10.22 -4.67
Big (8 cm) -6.51 0.39 3.58 3.18
Small (5 cm) 6.51 -0.39 -3.58 -3.18
Price -4.28 1.37 -1.83 -20.47
Attribute Importance
Variety 52.89 83.90 44.55 3.62
Origin 4.05 5.33 35.19 10.18
Size 22.64 1.84 11.99 6.14
Price 20.41 8.93 8.27 80.06

Skreli and Imami / International Food and Agribusiness Management Review / Volume 15, Issue 4, 2012
2012 International Food and Agribusiness Management Association (IFAMA). All rights reserved.
155
Appendix 2. Summary of Best Replications, Graphical Representation
70 67 66 65
147
102 96 75
48 31
18
24
21
38
Two group solution Three groupsolution
Four group solution Five group solution
Disstribution of cases by group solution
4000
4200
4400
4600
4800
5000
2 3 4 5
AIC
Number of groups
Consistent Akaike Informaion Criterion

Skreli and Imami / International Food and Agribusiness Management Review / Volume 15, Issue 4, 2012
2012 International Food and Agribusiness Management Association (IFAMA). All rights reserved.
156

2012 International Food and Agribusiness Management Association (IFAMA). All rights reserved
157
International Food and Agribusiness Management Review
Volume 15, Issue 4, 2012
Driving a Fishery along the Bumpy Ride of Today’s Globalization:
The Case of the Australian Southern Rock Lobster Association
Domenico Dentonia, Jianyong Lu
b, Francis English
c, Rebecca McBride
d
a Assistant Professor, Management Studies Group, Wageningen University and Research Centre, Hollandsweg 1,
KN6707, Wageningen, The Netherlands
b,c,d
Researcher, School of Agriculture, Food and Wine, The University of Adelaide
North Terrace, 5000 Adelaide, South Australia
Abstract
The case of the Australian Southern Rock Lobster Association describes real issues faced by the
Market Development Manager of a collective agri-food organization (SRL) representing all the
southern rock lobster fishermen in Victoria, South Australia and Tasmania. The case deals with
recent globalization issues faced by the Australian rock lobster industry: the rise of China as a
vital and risky market of high-end food products; the financial crisis that affected the US starting
from 2006 and the rise of sustainability issues that constrained the rock lobster supply. This case
is designed for advanced BSc and MSc in agribusiness and international business. It is relevant
for both for strategic management and supply chain management courses. In this case, managers,
policy-makers and academics find challenging questions that are still open and can be similarly
posed to other agribusiness industries worldwide attempting to compete collectively in
international markets.
Keywords: lobsters; seafood; Seafood CRC; China; Australia; US market. Corresponding author: Tel: +31.3174.82180
Email: [email protected]
IFAMA Agribusiness Case 15.4
This case was prepared for class discussion rather than to illustrate either effective or ineffective handling of an agribusiness
management situation. The author(s) may have disguised names and other identifying information presented in the case in order
to protect confidentiality. IFAMA prohibits any form of reproduction, storage or transmittal without its written permission. To
order copies or to request permission to reproduce, contact the IFAMA Business Office. Interested instructors at educational
institutions may request the teaching note by contacting the Business Office of IFAMA.
+The IFAMR is a non-profit publication. The additional support provided from this issue advertiser, Novus
International helps us remain open access and dedicated to serving management, scholars, and policy makers
worldwide.

Dentoni et al. / International Food and Agribusiness Management Review / Volume 15, Issue 4, 2012
2012 International Food and Agribusiness Management Association (IFAMA). All rights reserved.
158
“I am young and intend to be in this business for long time. I think about where this industry is going in the fture—
not only next year—but more importantly, where we will stand thirty years from now.”
Matthew Muggleton, Market Development Manager, Southern Rock Lobster Limited
Introduction
Matthew Muggleton, is the Market Development Manager of Southern Rock Lobster (SRL)
Limited, an organization representing the fishermen’s associations in the states of Victoria,
Tasmania and South Australia. Matthew is a charismatic self-starter who has been working with
SSL Members since 2003 to raise awareness on the following key points:
1. Selling the most precious product category (lobsters weighing 2 kg or less <2kg) to one
single channel (importers in Hong Kong) and to one single market (China) was too risky.
Therefore, diversifying into new markets with complementary products through other
channels was necessary.
2. Helping members see how they are better off working together rather than competing to
develop a collective brand on Australian Southern rock lobsters in a highly differentiated
market designed to move the fishermen from commodity suppliers to marketers.
3. Linking Australian fishermen and the lobster supply chain to new markets must be
adapted to fit the collective brand strategy. Moreover, changing market conditions may
require further adaptive changes in the supply chain.
Supported by the financial backing of SRL members and the public Research & Development
(R&D) agencies at the state and national level, Matthew connected their product (lobsters larger
than 2 kg, >2kg) with the market channel: the Super-Premium Fine Dining (SPFD) sector in the
US in 2006. He spearheaded the logistics, brand-marketing process and established the market
channels into the US between 2006 and 2009.
Yet, things did not go exactly as Matthew expected. Until 2009, the revenues yielded from the
US SPFD sector did not cover the costs of transporting and distributing live lobsters to the West
Coast restaurants. At the same time, increasing the quantity supplied in order to lower the aver-
age costs was not an option for the following reasons:
1. A progressive reduction in the harvesting quota to prevent depletion of the existing
lobster population was self-imposed by SRL members since 2008 (see detail on SRL
harvesting quotas in Section 2 below) and;
2. All the lobsters below 2kg were already sold to Chinese importers in Hong Kong, which
was guaranteeing enough profit margins to fishermen. So there were not enough lobsters
available to be sold in the US market. When in 2009 he founded his own distribution
company in the US acting as market platform for SRL and selling a basket of seafood
products to a broader range of customers, the number of Matthew’s detractors increased,
accusing him of pursuing his own interests rather than the interest of SRL.

Dentoni et al. / International Food and Agribusiness Management Review / Volume 15, Issue 4, 2012
2012 International Food and Agribusiness Management Association (IFAMA). All rights reserved.
159
Responding to these pressures and complaints, Matthew responds adamantly, “Opening up an
alternative market channel to China was crucial for our lobster industry, and we did it. So far we
made little money, but we secured an alternative market channel for our lobster supply.” And
looking towards the future: “We need to keep the channel open. If we have no lobsters, we keep
selling other selected products from our basket. The important thing is to maintain the relation-
ships built with customers. Shutting the channel down would be a real waste of money.”
Although most of the Australian lobsters are currently bought by the Chinese market, Matthew
believes that an alternative channel in the US needs to be ready to absorb the Australian lobster
supply should future shocks occur in the Chinese market, (see detail on historical trends of
Chinese demand for Australian lobsters in Section 2).
According to Matthew, a further investment in relationship-building and brand communication is
needed with continuous support by the public R&D institutions and by the SRL members to keep
this second US SPFD channel open. Today, Matthew is willing to consider alternative opportuni-
ties of market diversification along with the US SPFD sector. He knows that he could have made
better and decisions in the past and is willing to learn from past mistakes. He must now make
strategic decisions for his future and that of the Australian lobster industry.
The case study is organized as follows: the next section provides background information on the
southern rock lobster, the Australian Fishermen Association and its status in the early 2000s.
Details are provided on the SRL between 2003-present and final section discusses the problems
currently faced by Matthew, SRL and their stakeholders.
Southern Rock Losters and the Australian Industry
The southern rock lobster (Jasus edwardsii)—also called red rock lobster or spiny rock lobster,
is a species of spiny lobster found throughout the coastal waters of southern Australia and New
Zealand. Rock lobsters resemble common lobsters (Homarus Americanus and Gammarus), but
lack the large characteristic pincers on the first pair of walking legs (Figure 1). Mature Southern
rock lobster can weigh from 800grams up to 10 kg, although the most valuable are considered
the ones below 2 kg. Chinese restaurants value lobsters below 2 kg more since they are easier to
stock and serve in plates. Also, Australian consumers can freeze smaller lobsters in their houses
especially for use at Christmas dinner or similar events.
(a) (b)
Figure 1. a. The American Lobster (Homarus Americanus). b. The Southern Rock Lobster
(Jasus edwardsii)
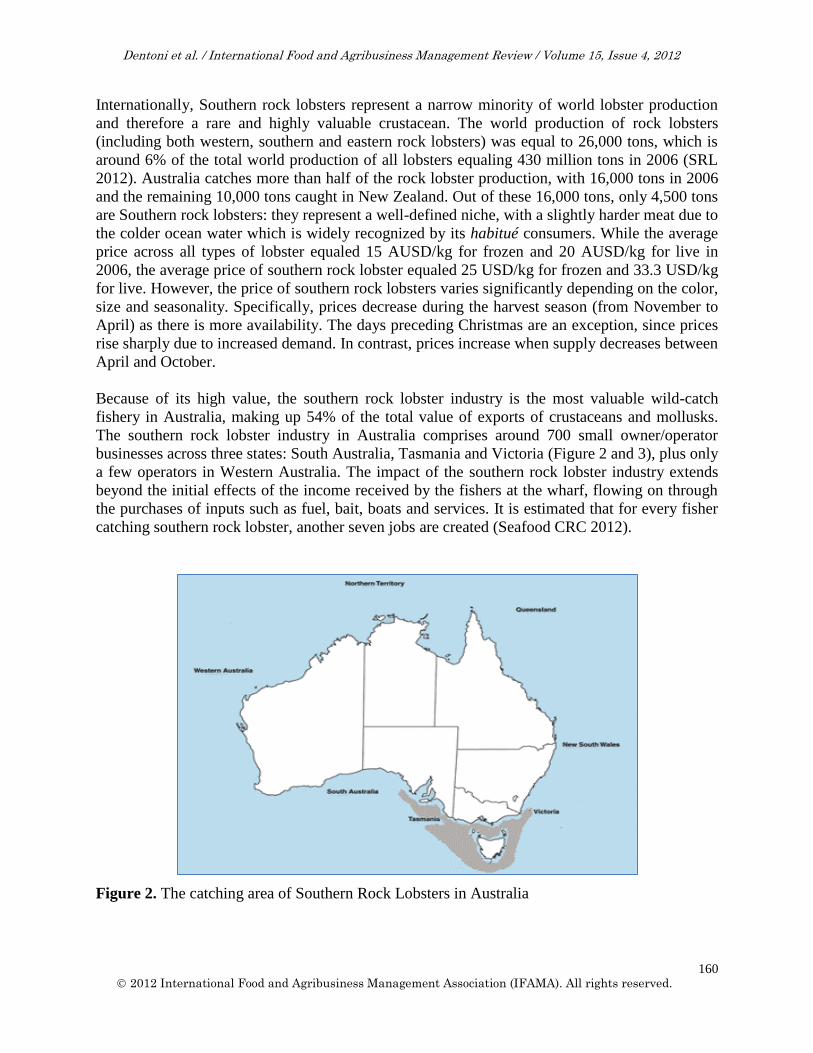
Dentoni et al. / International Food and Agribusiness Management Review / Volume 15, Issue 4, 2012
2012 International Food and Agribusiness Management Association (IFAMA). All rights reserved.
160
Internationally, Southern rock lobsters represent a narrow minority of world lobster production
and therefore a rare and highly valuable crustacean. The world production of rock lobsters
(including both western, southern and eastern rock lobsters) was equal to 26,000 tons, which is
around 6% of the total world production of all lobsters equaling 430 million tons in 2006 (SRL
2012). Australia catches more than half of the rock lobster production, with 16,000 tons in 2006
and the remaining 10,000 tons caught in New Zealand. Out of these 16,000 tons, only 4,500 tons
are Southern rock lobsters: they represent a well-defined niche, with a slightly harder meat due to
the colder ocean water which is widely recognized by its habitué consumers. While the average
price across all types of lobster equaled 15 AUSD/kg for frozen and 20 AUSD/kg for live in
2006, the average price of southern rock lobster equaled 25 USD/kg for frozen and 33.3 USD/kg
for live. However, the price of southern rock lobsters varies significantly depending on the color,
size and seasonality. Specifically, prices decrease during the harvest season (from November to
April) as there is more availability. The days preceding Christmas are an exception, since prices
rise sharply due to increased demand. In contrast, prices increase when supply decreases between
April and October.
Because of its high value, the southern rock lobster industry is the most valuable wild-catch
fishery in Australia, making up 54% of the total value of exports of crustaceans and mollusks.
The southern rock lobster industry in Australia comprises around 700 small owner/operator
businesses across three states: South Australia, Tasmania and Victoria (Figure 2 and 3), plus only
a few operators in Western Australia. The impact of the southern rock lobster industry extends
beyond the initial effects of the income received by the fishers at the wharf, flowing on through
the purchases of inputs such as fuel, bait, boats and services. It is estimated that for every fisher
catching southern rock lobster, another seven jobs are created (Seafood CRC 2012).
Figure 2. The catching area of Southern Rock Lobsters in Australia

Dentoni et al. / International Food and Agribusiness Management Review / Volume 15, Issue 4, 2012
2012 International Food and Agribusiness Management Association (IFAMA). All rights reserved.
161
Figure 3.The structure of the Southern Rock Lobster (SRL) Association in Australia
Despite its high value and importance for Australian economy, both the quantities produced and
the price of southern rock lobster have been strongly fluctuating in the latest ten years, creating
problems for the sector and for the entire upstream chain (see Appendix, Exhibit 1). Production
volumes of rock lobsters were highest in 1999/2000 at 20,000T. They reached a low of 14,000 T
in 2001/02, came back to almost 20,000 T in 2003/04 but have dropped back to under 14,000 T
in 2007/08.
Southern rock lobster prices have also been fluctuating strongly since the late 1990s. Nearly 30%
of these were southern rock lobsters. The value of southern rock lobsters was highest at the start
of the 2000s with 633 AUSD million in 1999/2000. Then the value dropped to its lowest point of
516 AUSD million in 2003/04. It stabilized to reach 560 AUSD million in 2005/06 but dropped
down to 512 AUSD million again in 2007/08. Consequently, the lives of fishermen and their
employees become difficult and uncertain when the production value of southern rock lobsters
and the related profit shrinks.
Starting from 1993 and 1995, the South Australia, Tasmania and Victoria introduced a
harvesting quota on southern rock lobsters, which is commonly referred to as Total Allowable
Commercial Catch (TACC). TACC was part of a fishery management system including a
combination of input and output controls to avoid the depletion of marine biomass. Along with
the TACC, these controls include limited licenses, restricted seasonal harvests (depending on the
year, around 100 days sometimes between November and April), equipment gear restrictions and
requirements, a minimum size limit of 0.8 kg (but no maximum size limit) and a monitoring
system requiring documentation and real time reports to license holders. Year-by-year, the state
governments in consultation with the industry agree on TACC increases or reductions. Based on
the recommendations of the local university, Tasmania voluntarily reduced TACC in recent
years, from 1,524 tons in 2008/2009 to 1,103 in 2011/2012 (Gardner et al. 2011). This was
mainly a decision taken to reduce the increasing harvesting costs (measured in terms of catch per
unit of effort, CPUE), which increase as the number of lobsters in the ocean is decreasing

Dentoni et al. / International Food and Agribusiness Management Review / Volume 15, Issue 4, 2012
2012 International Food and Agribusiness Management Association (IFAMA). All rights reserved.
162
(Appendix, Exhibit 2). On the other hand, South Australia maintained the TACC at 1,900
tons/year throughout the 2000s.
There appeared to be a slightly negative correlation between the quantity of catch and the price
of southern rock lobsters, although, catch volumes were not the only factor determining price
fluctuations. China represented around 90% of the total market of Australian southern rock
lobsters and 99% of exports. Importantly, China imported the most expensive and demanded
they be: live, of intense red color and only smaller than 2kg. As a result, price and revenues from
Australian southern rock lobsters strongly depend on factors affecting China. For example, SRL
managers and industry experts are convinced that the SARS outbreak in China in 2002 was the
major cause of a 50% collapse in the price of live lobsters in China. According to SRL managers,
the decreased consumer spending and the fear of food contamination led to the collapse of the
restaurant trade in Hong Kong and China which in turn impacted the industry. Such a market
shock in China provoked a drop in the international price for live lobsters from 38 AUSD/kg to
25 AUSD/kg, with an estimated fall in the value of export revenues to 50 AUSD Million, in
2003/ 2004. After the market shock, in 2004 SRL members asked that something be done at the
national level to stabilize their lobster price in the years to come. In particular, a market for the
lobsters larger than 2kg which were not demanded by the Chinese market—could be a product
receiving better prices than in the domestic Australian market.
In light of these events, Matthew decided to take the lead in driving a change process in the
marketing of the Australian lobster industry. In a strategic meeting with SRL in late 2003, he
presented his challenge to the members: “We need to make a choice,” said Matthew. “Do we
want to remain disorganized victims of food-industry globalization at the mercy of price setters
who control the market by offer buyers a cheaper generic product?”
He was referring to the status quo, where one hundred competing small exporters were
individually selling all their lobsters to China with no incentive or need to develop markets. And
then he suggested his vision: “Or we can become organized and develop markets and new value-
added products thereby creating upward price pressure and further growth for our industry.”
In his view, industry development was contingent upon coordinated investment at the whole of
industry level to enter an alternative market channel with a currently undervalued product
(lobsters >2kg).
The route identified by Matthew, although still vague, found a broad consensus among the SRL
members and its Executive Director. The Executive Director said, “Over 90% of SRL product is
exported live into the Asian region, with the majority sent to Hong Kong and China, however we
recognize that we have the potential to secure ourselves as a super-premium fine-dining product
in other countries.”
The SRL association was funded for research projects by the Fishery Research and Development
Corporation (FRDC) and the Department of Agriculture, Forestry and Fisheries (DAFF), a
national public R&D body and the Ministry—to explore opportunities for alternative export
markets (Appendix, Exhibit 3). The goal of the project was to identify a viable strategy to
diversify the portfolio of SRL markets and so to reduce the risk of dependency on the Chinese
customers.

Dentoni et al. / International Food and Agribusiness Management Review / Volume 15, Issue 4, 2012
2012 International Food and Agribusiness Management Association (IFAMA). All rights reserved.
163
Juggling Lobsters in the Global Market
Exploring and Entering the US Super-Premium Fine Dining Sector (2004-2007)
With the support of the Market Development Program research funded by FRDC in 2004 and
conducted by one university and one consulting company, SRL selected the US SPDS as its
target to market southern rock lobsters >2kg. “It is hoped that the success of the trial will lead to
a ‘trickle down’ effect amongst the Australian southern rock lobster industry, and increasing
utilization of the system will benefit the whole chain,” said an authoritative SRL member, in
2004.
The US market was chosen because: 1) data showed evidence that high-end US consumers
would highly value Australian southern rock lobsters relative to local varieties in super-premium
restaurant settings. In particular, the research concluded that the high-end segment of US
consumers would give value to lobsters having a brand identity based on place-of-origin,
sustainability, traceability, guaranteed top quality, freshness and a perception of direct links with
the fishermen. 2) the super-premium fine dining sector would probably not be affected by the
possible negative trends in the US economy; 3) the US market, especially the West Coast, is
relatively closer to Australia both geographically and culturally. The US market was assessed as
culturally closer than China and South and South-East Asia.
The results of this market research led to the implementation of a second R&D project, which
was funded by Seafood Cooperative Research Center (CRC) between 2006 and 2009. The
project aimed at developing the concept of an SRL commodity brand in the US market and to
test the feasibility of establishing an efficient distribution platform to serve restaurants, casinos
and deli stores on the West Coast. Based on the opportunity sought and assessed by SRL, the
Executive Director of the Seafood CRC funding the project claimed, “The Seafood CRC project
is expected to contribute AUSD 45-50m per annum towards the AUSD 90 Million target. “Not
bad for an investment of AUSD 1.78 Million over the next three years.”
To reach their goal, the SRL directors and Matthew first designed a product which was expected
to match the demand of the US market. First, SRL coined and registered the label Clean Green
Australian Southern Rock Lobster (Appendix, Exhibit 4). To strengthen US consumers’
perceptions of sustainability, SRL also applied and obtained the Marine Stewardship Council
(MSC) certification. MSC is a global non-governmental organization (NGO) which has
developed standards for sustainable fishing and seafood traceability. Both standards are based on
independent third-party assessments by accredited certifiers. The MSC's fishery certification
program and seafood labels aim at recognizing and rewarding organizations adopting sustainable
fishing practices.
Roger synthesized for the SRL members, “The MSC label provides an immediate branding
solution and product awareness in numerous international markets,” said Roger. “Our
organization is investigating various means to increasing demand for our lobster and spread mar-
ket risk. Certification of our fishery by the MSC is a potential tool for achieving this.”

Dentoni et al. / International Food and Agribusiness Management Review / Volume 15, Issue 4, 2012
2012 International Food and Agribusiness Management Association (IFAMA). All rights reserved.
164
Moreover, Matthew and his SRL partners developed a traceability system. “Field trials have
confirmed the practicality of the horn tag as part of the project when used in conjunction with a
prototype mechanical tag applicator,” said Matthew. “The chefs have reinforced that traceability
is an essential element for such a high value product,” he added. Through such a traceability
system, consumers in restaurants and deli stores would be able to know exactly where their
lobster was fished, and by whom. This would create a consumer perception of a fresh, authentic
product which is directly transferred “from the pot to the plate” (the pot is the tool used to fish
lobsters). Working jointly with such a traceability system, Matthew established a method of
guaranteed quality with for their potential US customers: only the best lobsters were actually
sold, while damaged ones were excluded from the deal (Appendix, Exhibit 5).
Finally, Matthew and the R&D project team organized workshops and meetings with chefs and
restaurant owners in San Francisco and the Napa Valley, Los Angeles and Las Vegas. These
meetings allowed them to test whether the designed product would work. In commercial jargon
used among chefs and restaurants in the US, Matthew and Roger defined the >2kg lobsters that
were going to the US as live, porcelain Southern Rocklobster jumbos. “SRL is committed to
achieving its goals through an extensive education and development program designed to
facilitate relationships with US chefs and reinforce the premium product quality message,”
claimed Roger, in late 2006 (Appendix, Exhibit 6).
However, by the end of 2007, although much relationship-building with US customers was
realized, only 18 restaurants started regularly procuring an average amount of 10kg of live
lobsters per week. To some extent, this is not surprising as Matthew commented, “These R&D
projects could only fund the pilot launch of the commercialization project, not the full scale
rollout phase; and this is what we did. Now, we need to move on and reach our distribution target
in this market.”
However, he also recognized that dealing with celebrity chefs and customers in the SPFD sectors
was more challenging than he expected. “The market goggled,” said Mathew. “I have been
requested to provide samples, samples and samples, but not often has this turned into a signed
contract.”
Part of the difficulty of closing contracts depended on the fluctuating exchange rate conditions
(from 0.68 in mid-2004 to 0.95 in mid-2008), which made Australian products sold in the US
significantly more expensive (see historical trend of AUSD/USD exchange rate in Exhibit 7).
Australian Lobsters to US: Transformations in the Supply Chain (2006-2010)
In order to sustain such a commodity brand strategy for market diversification, Matthew and the
SRL leaders had to drive a number of changes in the supply chain between 2006 and 2009. These
changes took place after the market research in the US was conducted starting from the
negotiation process with targeted US customers (2006-2007). Based on the market trials, further
changes in the US lobster distribution platform were made (2008-2009).
First, Matthew led the implementation process of the Fisher direct program: SRL license holders
maintained product ownership and therefore commitment through to the customer. Along with
SRL leaders, the Executive Director of the Seafood CRC believed that this would generate real

Dentoni et al. / International Food and Agribusiness Management Review / Volume 15, Issue 4, 2012
2012 International Food and Agribusiness Management Association (IFAMA). All rights reserved.
165
industry impact: “What makes this project innovative is that fishers will retain ownership of the
product through to its final sale,” said, Matthew. “Consequently bringing higher wholesale
returns back to Australia for the fishers and processors to share,” he claimed in late 2006.
SRL leaders were aware that this was a “high risk and high reward” game for their members. It
utilized a different model than the chain into the Chinese market (taking 99% of exports), where
importers become owners and bear the risks on the product. Live lobsters were distributed by
SRL industry-managed distributors contracted by Matthew instead of large importer gatekeepers
as in China. In such a way, Matthew could monitor the transport process and the quality of the
live lobsters arriving from Australia into the West Coast ports.
Yet, in the first months after operations to the US started, it turned out to be difficult to assure
that no damages would occur to live lobsters transported and distributed to the US. This
generated controversies between the SRL fishermen and the distributing companies. To solve the
controversy, Matthew established an SRL trade facilitation division (including tanks to conserve
the live lobsters and issued the necessary insurance contracts) in California to guarantee the
promised quality by facilitating transport until the product arrived at the US customers’ door.
Moreover, SRL issued insurance against the risk of damages to live lobsters during transport.
A second change in the supply chain was attempting to redirect the available volume of live
lobsters to the US market. Supplying lobsters >2kg in the US market was a voluntary initiative
left to the license holders. In any case, fishermen were encouraged to support the strategy in the
US market. Therefore, once the US SPFD channel became a marketing option for the fishermen,
each SRL member had to choose whether to continue harvesting and selling only <2kg lobsters
to China or to attempt harvesting and selling >2kg lobsters to US. On one hand, <2kg lobsters to
China could guarantee an established high price for a smaller per unit quantity sold. On the other
hand, supplying >2kg lobsters to US offered a possible (although still uncertain, since the market
was under development) higher price for a larger per unit quantity sold (since the lobsters are
bigger, so more kg are sold). So the US market offered an appealing alternative to the SRL
license holders: with a fixed licensing quota limiting the number of harvested lobsters, they
could sell more kg of lobsters in the US by simply selling larger animals. Plus, to make the US
SPFD channel run and expand, the SRL marketing manager really needed a sufficient quantity of
lobsters to be redirected from China to US.
“Success will depend on industry commitment to supply,” said Roger in early 2007. “Adopting
such market approach represents a major and fundamental change for the industry from a
catching mentality to that of a niche marketer,” he added. Another SRL member said in 2007: “I
am now convinced that commercial market alternatives are available to the industry, but to
develop and secure them will require long term industry commitment to guarantee supply.
Indeed the international market development program success depends on industry commitment
to supply new markets, in spite of large fluctuations in beach price as we have once again
experienced this season.” This was indeed an issue for SRL lobsters.
Many fishermen perceived the incentive to sell lobsters to the US as too uncertain weighed
against the risk of having their lobsters damaged in the transport to US. Therefore, a number of
SRL members preferred to fish and continue selling their lobsters <2kg to China and direct the

Dentoni et al. / International Food and Agribusiness Management Review / Volume 15, Issue 4, 2012
2012 International Food and Agribusiness Management Association (IFAMA). All rights reserved.
166
lobsters >2kg to the domestic market or to keep them under water to minimize risks. This was a
point of lively debate among the SRL members. In favor of keeping the US channel option open.
“If the potential is to supply, say, 10% or 500 tons of live large porcelain lobster into the USA,
how do we guarantee the chefs we will meet the supply when they want it?,” Roger asked. “Is it
the usual volunteers committing part of their catch (…) or is it partitioning part of the quota?”
Roger concluded, “Whatever the answer, innovation is needed immediately and my challenge
and request to you is to put forward ideas on how individually and as a whole industry, up to
10% of the catch can be secured for developing new markets and then maintaining them long
term.”
By the end of 2007, Matthew and SRL leaders realized that the quantity of live lobsters sold was
not sufficient to make per-unit costs of transport and distribution low enough. An independent
review of the SRL market development program commissioned by Seafood CRC computed that
- given the current per-unit costs the SRL must source at least 500 active restaurant customers in
the USA to achieve the breakeven international sales volume in the following three years (from
2008 to 2011). This conclusion was based on the assumption, estimated with Matthew, that each
active restaurant customer would buy an average of 500kg of Southern Rock Lobster per annum,
or approximately 10kg per week (that is 250,000kg/annum = 250 tons). An average export value
of approximately 72AUSD/kg so far was achieved and a beach price paid to fishers of
35AUSD/kg had also been achieved. Quite challenging, considering that the forecast total
quantity sold by mid-2008 was around 14,000kg/annum.
According to an independent reviewer in order to reach such a scale the market development
team of SRL would have been required to add an average increase of 3-4 restaurant customers
per week, every week—for the next three years. The reviewers concluded that the
commercialization of the market research will require a significant investment in market
development over the next three years, and certainly a greater resourcing than has currently been
committed to date is needed to achieve commercial success. The reviewers also commented that
with the current business model and the current issues with the demand, reaching such full scale
within three years was unlikely. Proposing an alternative business model was outside the scope
of the review, but ultimately some radical changes were recommended to effectively enter the
US market.
In light of the current challenges affecting both the demand and supply of live lobsters, Matthew,
with the consensus of the SRL board, decided to undertake a swift change in the business model.
Matthew’s decision was also influenced by the impact of the financial crisis on the US food
service sector: he estimated that the sector would decline 30-40% within the two following years
(2009-2010). At the same time, the beach price of live lobsters reached its peak due to increasing
demand from the Chinese market. Considering the unfavorable market conditions for the live
lobster business in the US, he felt it would be difficult to increase the number of customers
consistently in the next three years.
By early 2009 Matthew was ready to change the business model again. He needed to find a way
to make the market channel in the US financially sustainable, as the financial support by public
R&D agencies was coming to an end. As the live lobsters were not profitable enough under the

Dentoni et al. / International Food and Agribusiness Management Review / Volume 15, Issue 4, 2012
2012 International Food and Agribusiness Management Association (IFAMA). All rights reserved.
167
current market conditions, he switched to exporting processed lobsters. In agreement with the
SRL leaders, Matthew decided to expand the product range: along with live lobsters, SRL started
exporting lobster ravioli, bisque, frozen steaks and portions. To create enough scale, he also
diversified the basket of seafood products, including processed Australian kingfish, mulloway
and tuna and New Zealand shellfish.
Product diversification created the need for further changes in the supply chain. Matthew started
exploring alternative channels to the SFPD sector, including deli stores, local retailers and the
traditional Chinese food service sector in the US. He created SRL Marketing USA, a
distribution company owned by himself in which SRL Australia held a purchase option of 50%.
He acted as both the SRL marketing manager and an independent distributor of Australian sea-
food products in the US market. According to Matthew, this allowed SRL to capture the com-
mercial benefits and provided a mechanism to provide a self-funding model to undertake market
development and promotion beyond the life of the CRC. While the other seafood products were
only distributed rather than processed, SRL contracted with an Australian company to process
lobsters into ravioli, bisque and portions.
However, selling processed lobsters as part of the product line was not a significant source of
profits for SRL members. Only 3.2 kg of lobsters were sold in the US by mid-2009. At the same
time, 3,576 kg of other seafood products were sold. One year later, the business expanded to sell
7,300 kg but lobsters represented still around 40% of the quantity sold. From Matthew’s
perspective, this could be considered a first success. Within three years, he was close to
establishing a self-financed distribution system of Australian live and processed lobsters in the
US (Exhibit 8 and 9).
At the same time, in front of a large public and private investment made since 2006 without
return to the lobster industry, some SRL members and public R&D agencies started criticizing
Matthew’s strategy. Some SRL members commented that SRL Marketing in the USA became
nothing more than another export-import private company dealing with the US. Others expressed
concerns regarding Matthew’s ownership of the US distribution company and the benefits gained
by himself rather than by the industry. In general, given the rapid changes which had occurred
along the chain within a few months, some SRL members lamented a scarce flow of information
about the most recent US activities. Matthew’s detractors demanded to stop any public and
private investment for lobsters in brand marketing and relationship-building activities in the US
and to shut down the channel. Given that the quantity of southern rock lobsters sold in the US
market— both live or processed – was never substantial, public R&D agencies considered the
US market development program a major failure. Matthew’s detractors demanded they stop any
public and private investment for lobsters in brand marketing and relationship-building activities
in the US and channels be shut down.
To these pressures and complaints, Matthew responds firmly,“Opening up an alternative market
channel was crucial for our lobster industry, and we did it. So far we made little money, but this
is just the start. At the moment, we have secured an alternative market channel for our lobster
supply and started managing our market risks.” And toward the next future, “We need to keep
the channel open. If we have no lobsters, we keep selling other selected products from our
basket. The important thing is to maintain the relationships built with customers. Shutting the

Dentoni et al. / International Food and Agribusiness Management Review / Volume 15, Issue 4, 2012
2012 International Food and Agribusiness Management Association (IFAMA). All rights reserved.
168
channel down would be the real waste of money.” By the end of 2010, he was busy again
discussing the options to expand the US channel with the SRL members and the R&D agencies.
Australian Lobsters to China: A Need for Change?
The US market experience that Matthew Muggleton and SRL leaders experienced between 2004
and 2010 caused members to rethink the importance of the Chinese market. China and Hong
Kong not only account for almost 80% of Australia’s annual exports of rock lobster and 97% of
Australian southern rock lobsters, finding alternative markets and new channels such as in the
US may be an expensive, long-term, and uncertain.
Many SRL members that lamented Matthew’s strategy in the US argue whether developing new
markets provide a true advantage over the current Chinese export market. Is it worth trying to
develop new markets for the Australian southern rock lobster industry? A number of SRL
members exporting directly to China are convinced that other markets aren’t willing to pay more
for lobster than the Chinese because lobster is used as a celebration food for weddings, birthdays
and the Chinese New Year. Furthermore, market trends show a booming growth in the food
service sector in urban China which analysts forecast will eventually make the Chinese exchange
rate for Australian products more competitive than in the US and Europe (see the historical trend
of AUSD/Chinese Yuan exchange rate in Exhibit 10).
These questions remain open as the status quo in China is continuously challenged. At the end of
2010, China banned the entire import of rock lobsters from Australia, including the Hong Kong
ports. The import ban was intended to stop illegal trading of Australian lobsters from Hong Kong
to China. According to current Chinese regulations, Australian lobsters shipped directly to main-
land China are subject to an import tariff of 10% plus a value added tax (VAT) of 13%. Instead,
Australian lobsters shipped to Hong Kong are subject to no tariff and no VAT. Moreover, since
2003, (when the Closer Economic Partnership Arrangement was signed) Hong Kong can sell
goods produced exclusively in its territory to mainland China with no import duties. This implies
that Australian lobsters sold to mainland China through Hong Kong ports could avoid the import
tariff and VAT only through illegal trading. The unexpected ban could not have come at a worse
time, during the start of the harvesting season (November) and close to Christmas, when Chinese
demand sharply increases. Although the ban was subjected to further discussion between
Chinese and Australian governments and then partially amended in mid-2011, the event
re-confirmed the risks associated with the current export market through Hong Kong—although
profitable in the short run.
The recent export ban of rock lobsters in China has encouraged SRL and its members to think
about how to develop alternative and transparent market systems with customers in the food
service industry of urban China. Is there an opportunity to brand the fish inside China? In the
current export system through Hong Kong, Australian fishermen can only be price-takers as no
brand is attached to the product and no relationships are built with the downstream chain. If
import duties are not paid on the product, the origin of lobsters cannot be traced and certified
downstream.
Perhaps the Australian abalone industry provides an example of how to brand a high-value
Australian seafood product in China. The Australian abalone industry has also traditionally
exported the majority of its live product through Hong Kong to avoid import duties. To diversify

Dentoni et al. / International Food and Agribusiness Management Review / Volume 15, Issue 4, 2012
2012 International Food and Agribusiness Management Association (IFAMA). All rights reserved.
169
risk, the Abalone Council of Australia with the support of a Chinese-based marketing company,
started a 1.8 million AUSD initiative funded by the Seafood CRC to develop a direct, long-term,
sustainable, origin-certified abalone trade route between Australia and China meeting the
Chinese import tariff of 10% plus 13% VAT. Similar to the southern rock lobster case in the US,
the Australian abalone industry is in the process of building relationships with customers and
market/sale partners in China. The process takes time and is the subject of controversy.
Although, employing a similar strategy could also be a plausible direction for the southern rock
lobster industry to follow.
Conclusions
It took Matthew more than three hours to present the entire story of how the SRL is building a
collective brand in the US, transforming the chain, and looking for alternatives to the status quo
both in the US and Chinese markets. In the past eight years, he played a major role in changing
the Australian rock lobster industry culture and strenuously attempted to build consensus around
the next actions to take.
Today, Matthew’s execution plan remains the subject of controversy among SRL members and
public R&D officers. On one hand, making fast action-oriented decisions and adapting to rapid
change is the essence of entrepreneurship and innovation. Yet, when designing a strategy for an
entire industry and building a collective brand, building consensus, timely and transparent
communication is vital to achieving the goals the organizational goals. Matthew invested his
energy and enthusiasm into making a difference for his association and their product. Yet,
looking back, he realizes he could have done things differently. Several decisions would have
had better outcomes if evaluated more carefully.
In the strategies Matthew pursued, could he have done something differently? He was accused of
making swift changes putting his personality and energy in front of the doubts and critiques of a
minority of SRL members and R&D officers, but isn’t this the role of an entrepreneur? At what
point should an entrepreneur facing a turbulent international market take the time to discuss the
issues with stakeholders before making necessary changes? Which situations could have
involved more experts, informed stakeholders and dialogue before taking decisions? “I am glad
to discuss the details of what we have done so far,” said Matthew. “The more I discuss this with
people involved in this business, the more I learn from this story. It will help us do our business
better tomorrow.”
Looking back, some SRL members and R&D officers think that attempting to open a direct and
transparent channel of southern rock lobsters with Chinese customers was the direction that
should have been taken in 2004. But who could have forecasted the changing conditions in the
US and the turbulent times of the last seven years back in 2004? Was the market research and
the collective brand development strategy implemented in the US wrong? Where were the
mistakes made in the supply chain transformation to adapt to such a changing context? Which
decisions should have been taken in order to have a higher and less expensive penetration in the
US market?

Dentoni et al. / International Food and Agribusiness Management Review / Volume 15, Issue 4, 2012
2012 International Food and Agribusiness Management Association (IFAMA). All rights reserved.
170
These are not rhetorical questions for Matthew. He is looking at his own story in order to make
better decisions to design tomorrow’s strategy for SRL and for his SRL Marketing Company in
the US. Would it make sense, as some of his detractors suggest, to shut down the US channel
now that investments are made, relationships with customers are built, and contracts with proces-
sors and clients are signed? Apart from his personal interest in it, shouldn’t the US channel
indeed be considered a risk management tool that diversifies from uncertain Chinese exports?
With a duplicable prototype, Matthew can imagine opening other channels for SRL internation-
ally. If a direct and transparent Chinese market alternative to the current sales through Hong
Kong is the preferred option to follow, what are the next steps that Matthew should take? What
should he do similarly to or differently from the US experience in terms of market research,
collective branding and transformation of the supply chain?
Matthew is interested in hearing these questions discussed. The answers would be opinions and
suggestions from international experts that have no vested interests in the southern rock lobster
business.
Acknowledgements
This research has been funded by the Seafood Cooperative Research Centre (CRC) as part of the
Project 2010/749. The authors would like to thank Seafood CRC managers as well as their
industry and research partners for fruitful discussions during data collection and analysis.
Note
The content provided in this case is based on authors’ interpretation of primary and secondary
data collected during interviews with the major stakeholders involved in this case. The
interpretation reflects solely the opinion of the authors, who take full responsibility for the
information and interpretation provided in this case.
References
Gardner, C., K. Hartmann, and D. Hobday. 2011. Tasmanian Rock Lobster Fishery 2009/10.
Fishery Assessment Report. Hobart, Tasmania: Tasmanian Aquaculture and Fisheries
Institute, University of Tasmania.
EconSearch 2011. Economic Indicators for the South Australian Southern Zone Rock Lobster
Fishery (2008/2009). A Report prepared for Primary Industries and Resources South
Australia (PIRSA). Marryatville, SA: EconSearch Pty Ltd.
SRL 2012. Information on Sourthern Rock Lobster association strategic plans. Website:
http://www.southernrocklobster.com/ (accessed on July 29, 2012).
Seafood CRC 2012. SRL 2012. Information on Seafood Cooperative Research Centre R&D
programs and projects. Website: http://www.southernrocklobster.com/ (access July 29,
2012).

Dentoni et al. / International Food and Agribusiness Management Review / Volume 15, Issue 4, 2012
2012 International Food and Agribusiness Management Association (IFAMA). All rights reserved.
171
Appendix
Exhibit 1. Gross Value of Production (GVP), price and catch indices for the southern zone of
Southern Australia Rock Lobster fishery (1990/91=100) (EconSearch 2011, 6)
Exhibit 2. Historical trend of Total Allowable Commercial Catch (TACC) and Catch per Unit of
Effort (CPUE) in Tasmania between 1970 and 2010 (Gardner et al. 2011, 9).

Dentoni et al. / International Food and Agribusiness Management Review / Volume 15, Issue 4, 2012
2012 International Food and Agribusiness Management Association (IFAMA). All rights reserved.
172
Exhibit 3. The list and outcome of projects funded by Australian public stakeholders to support
SRL market diversification strategy (based on discussions with Matthew). Date Item Outcome
1999 South Australia industry project: Planning for
Future Competitiveness (Reld and Spawton,
Univeristy of South Australia)
Set broad direction for development (“whole of
species” and value chain analysis)
2001 Improved management of Southern Rocklobster
R&D (FRDC Project 2001/072) Morgan
Recommended: National approached to industry
R&D investment
2002-03 Southern roc lobster R&D plan and subprogram
development (FRDC 2002/313) Coldhoun
Southern Rocklobster Strategic Development Plan
Priority Investments:
Establish industry R&D entity
Market Development
2004 Southern Rocklobster Limited (SRL) Formed Raised AUSD 240,000/annum for 5 years with
25% funded through levies from SRL license
holders for new R&D investment
2005 FRDC Memorandum of Understanding (MoU) 5-year R&D planning and management agreement
and extension program budget of AUSD
180,000/annum
2005 FRDC Project No.: 2004/251. Identification of new
market opportunities for Southern Rocklobster.
2006 Implement and establish the USA market develop-
ment platform to enable trade of Certified Clear
Green
Platform and Certified Clear Green delivered to
industry
2007 Seafood CRC Project 2007/704: “Assessment of
new market opportunities and development of ef-
fective market penetration strategies for Australian
Southern Rocklobster in the USA, Middle East and
Europe.”
To be detemined
Exhibit 4. The Clean Green Australian Southern Rock Lobster label introduced in the US
market since 2006 (from SRL Newsletter).

Dentoni et al. / International Food and Agribusiness Management Review / Volume 15, Issue 4, 2012
2012 International Food and Agribusiness Management Association (IFAMA). All rights reserved.
173
Exhibit 5. Specifications of the Guaranteed Quality Program in the US (from SRL Newsletter).
Exhibit 6. An example of education and communication workshop on live porcelain jumbo
lobsters taking place in California in late 2006 (from SRL Newsletter).
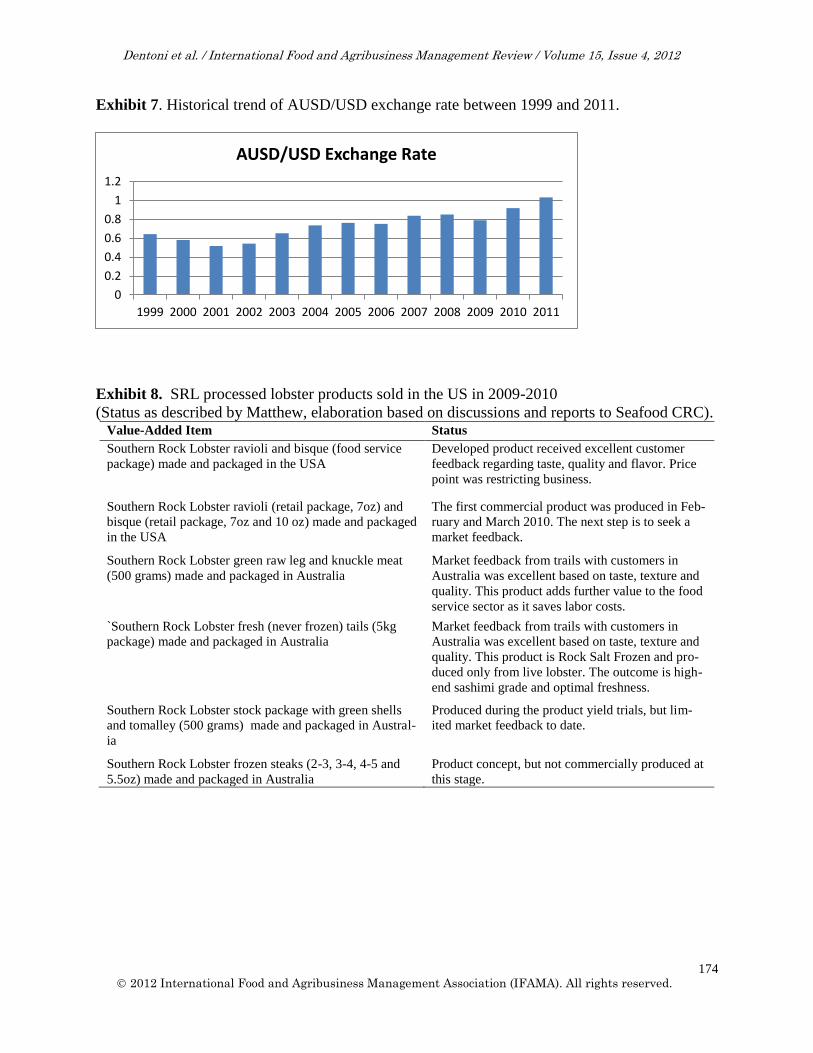
Dentoni et al. / International Food and Agribusiness Management Review / Volume 15, Issue 4, 2012
2012 International Food and Agribusiness Management Association (IFAMA). All rights reserved.
174
Exhibit 7. Historical trend of AUSD/USD exchange rate between 1999 and 2011.
Exhibit 8. SRL processed lobster products sold in the US in 2009-2010
(Status as described by Matthew, elaboration based on discussions and reports to Seafood CRC). Value-Added Item Status
Southern Rock Lobster ravioli and bisque (food service
package) made and packaged in the USA
Developed product received excellent customer
feedback regarding taste, quality and flavor. Price
point was restricting business.
Southern Rock Lobster ravioli (retail package, 7oz) and
bisque (retail package, 7oz and 10 oz) made and packaged
in the USA
The first commercial product was produced in Feb-
ruary and March 2010. The next step is to seek a
market feedback.
Southern Rock Lobster green raw leg and knuckle meat
(500 grams) made and packaged in Australia
Market feedback from trails with customers in
Australia was excellent based on taste, texture and
quality. This product adds further value to the food
service sector as it saves labor costs.
`Southern Rock Lobster fresh (never frozen) tails (5kg
package) made and packaged in Australia
Market feedback from trails with customers in
Australia was excellent based on taste, texture and
quality. This product is Rock Salt Frozen and pro-
duced only from live lobster. The outcome is high-
end sashimi grade and optimal freshness.
Southern Rock Lobster stock package with green shells
and tomalley (500 grams) made and packaged in Austral-
ia
Produced during the product yield trials, but lim-
ited market feedback to date.
Southern Rock Lobster frozen steaks (2-3, 3-4, 4-5 and
5.5oz) made and packaged in Australia
Product concept, but not commercially produced at
this stage.
0
0.2
0.4
0.6
0.8
1
1.2
1999 2000 2001 2002 2003 2004 2005 2006 2007 2008 2009 2010 2011
AUSD/USD Exchange Rate

Dentoni et al. / International Food and Agribusiness Management Review / Volume 15, Issue 4, 2012
2012 International Food and Agribusiness Management Association (IFAMA). All rights reserved.
175
Exhibit 9. SRL financial and commercial results in US and Australia between 2007 and 2010
(status as described by Matthew, elaboration based on discussions and reports to Seafood CRC). 2007/2008 2008/2009 2009/2010
SRL facilitated commercial sales AUSD 749,475 AUSD 566,416 AUSD 1,334,942
Margin available to pay platform resources AUSD 54,649,000 AUSD 76,836,000 AUSD 140,000
Margin percentage of total sales value 7% 14% 10%
Southern Rock Lobster volume traded (kg) inUS 4506 3191 7,300
Southern Rock Lobster volume traded (kg) in
Australia
6007 1204 300
Other seafood volumes traded (kg) in USA 0 3575 37,000
Seafood CRC Project 704/2007 expenditure AUSD 661,517 AUSD 674,772 AUSD 485,000
Exhibit 10. Historical trend of AUSD/Chinese Yuan exchange rate between 1999 and 2011.
0
1
2
3
4
5
6
7
1999 2000 2001 2002 2003 2004 2005 2006 2007 2008 2009 2010 2011
AUSD/Chinese Yuan (CNY)

Dentoni et al. / International Food and Agribusiness Management Review / Volume 15, Issue 4, 2012
2012 International Food and Agribusiness Management Association (IFAMA). All rights reserved.
176

2012 International Food and Agribusiness Management Association (IFAMA). All rights reserved
177
International Food and Agribusiness Management Review
Volume 15, Issue 4, 2012
Towards a Branded Food Economy in China
Industry Speaks
Damien McLoughlin a, Steve Bourne
b, Mary Shelman
c, Frank Bradley
d and Aidan Connollye
a Professor of Marketing, UCD Michael Smurfit Graduate Business School,
University College Dublin, Blackrock, Co Dublin, Ireland
bVice-President, Asia Pacific, Alltech, 3031 Catnip Hill Pike, Nicholasville,
Lexington, Kentucky, 40356, USA
c Director, Agribusiness Program and President of IFAMA, Harvard Business School,
Morgan T74, Boston, Massachusetts, 02163, USA
d Emeritus Professor, Michael Smurfit Graduate Business School,
University College Dublin, Blackrock, Co Dublin, Ireland
e Vice President Corporate Accounts, Alltech, Summerhill Road, Sarney,
Dunboyne, Meath, Ireland
Abstract
The Chinese economy has achieved extraordinary levels of economic growth and prosperity over
the past 30 years. This has evolved into a desire for greater quantities, quality and variety of food
products both from its newly enriched citizens and political leaders. These changes have affected
the rest of the world, most notably in the demand for the commodity products needed to feed an
expanding agricultural industry and its citizens. This paper discusses the six forces which are
currently shaping the food industry: an expanding middle class; concerns for food security, safe-
ty and quality; the integration and consolidation of industry supply chains; the simultaneous
complexity and simplicity of Chinese culture. These forces will shape food production and con-
sumption; the emergence of a Chinese consumer market, the emergence of food retailing and a
we conclude a branded food economy.
Keywords: branded food, china, demographics, food safety, supply chains
Corresponding author: Email: [email protected]
+The IFAMR is a non-profit publication. The additional support provided from this issue advertiser, Novus
International helps us remain open access and dedicated to serving management, scholars, and policy makers
worldwide.

Connolly et al. / International Food and Agribusiness Management Review / Volume 15, Issue 4, 2012
2012 International Food and Agribusiness Management Association (IFAMA). All rights reserved.
178
Introduction
China is currently in the throes of a breathtaking economic growth phase that is transforming
China and the world. China has a population of 1.3 billion but has only 7% of the world’s arable
farmland. Harsh climate, rough terrain and a growing water shortage (China only has 25% of the
world’s average per capita water supply) each present limiting factors, although China is the
world’s largest agricultural producer. In 2009/10 it was the global leader in many categories such
as cotton, rice, pork, apples and dairy/dry whole milk powder.
Through an export oriented economic growth strategy China has seen significant growth in its
economic prosperity over the past 30 years. In 1980, per capita GDP (on a purchasing power
parity basis) was US$250, this rose to US$7,500 in 2010 and is expected to rise to US$17,400 by
2025.
This growth in income has already led to an increase in food consumption and a switch from
grains to protein in particular. Meat consumption in China has doubled over the past 20 years,
with per capita consumption of 26kg in 1990, 55kg in 2011 and estimated growth of up to 85kg
per person in 2030.
Pork is the favorite meat and over half of the world’s pork is produced and consumed in China.
Poultry consumption is also rising, particularly as pork prices have risen by more than 50% over
the past year. China produces 4.7bn broilers annually and firms are moving towards integrated
production. While Chinese diets traditionally do not include dairy products, dairy consumption is
also growing–especially for infant formula and other products for children. Chinese consumers
are also dining on Western style fast food (KFC is opening a new restaurant every 13 hours) and
buying convenience products.
Agriculture is a top priority for government as it contributes 10.9% of GDP in China and em-
ploys 39.5% of the labor force, although this is gradually leaking to other parts of the economy.
There has been a consistent migration of population from rural areas to cities over the past
decades, with 15-20 million people moving each year. In 2011, China had 160 cities with
population in excess of 1m people, Europe had only 25. By 2025, 65 new cities will have popula-
tions of more than 1m and 24 new megacities will be home to more than 5 million people. This
movement is re-shaping China’s demand for food and presenting new challenges for the location
of farms and the availability of farm workers with the absence of a cold chain becoming an
increasing problem.
China faces serious issues as it strives to keep feeding its ever-hungrier population. Farms are
small–less than 1 acre on average – which requires food processors to deal with a myriad of sup-
pliers of varying capabilities. Meat and milk production is also fragmented: about 60% of
Chinese hog operations have fewer than 50 pigs and many dairy farmers milk only four or five
cows. This leads to problems with productivity, disease (especially when animals are raised in
close proximity to cities), and food safety–sometimes leading to very serious consequences.
By 2020, China will be the world’s largest economy. While today it is largely self-sufficient in
food, China is an important and growing importer of several commodities. It buys over 50% of

Connolly et al. / International Food and Agribusiness Management Review / Volume 15, Issue 4, 2012
2012 International Food and Agribusiness Management Association (IFAMA). All rights reserved.
179
all globally traded soybean and in 2010 passed Russia to become the world’s largest importer of
dairy products. During 2011, China surprised the global market by importing increasing
quantities of corn and pork. However, even with strong government efforts to keep prices in
check, food inflation is running at over 11%.
The potential for agriculture and the food industry in China is great. The Chinese governments,
as well as the indigenous and global food industries, have recognized this, as have partners
outside the industry such as international banks, who have begun to provide loans to farmers for
investment.1i
Each of these parties sees the challenges, but above all the opportunities, in the
modernization of the Chinese agricultural production. China must make important choices about
the future of its food industry. These choices will shape the development of the industry. The
question is how will this industry evolve?
The authors suggest the next significant development in the Chinese food industry will be the
emergence of a branded food economy.
Six forces are identified that individually, but particularly when combined, help to understand
why the future of food in China will be branded. Ambition for a branded future was confirmed
by a number of speakers at the Alltech Presidents Club, including senior leaders of COFCO,
Bright Foods and Liuhe. This end point will be important for the momentum that it will intro-
duce into the food supply chain. This was highlighted by one speaker at the Alltech Presidents
Club who noted that the emergence of a branded food economy in China would impact upon
every business as its effects rippled through supply chains, improving margins at the front end
and tightening them in the middle.
The remainder of this paper is divided into two parts; the first highlights the six forces, each in-
dividually important, but which, as they converge, will drive the emergence of a branded food
industry. The second is a reflection on the forces of uncertainty in the Chinese food economy
that might impact on the imagined future.
Forces Leading the Chinese Food Industry Towards Brands
The presentations and discussions of the Alltech Presidents Club revealed six forces driving the
Chinese food industry towards a branded model:
Expanding middle class
Food security, safety and quality
Integration and consolidation of industry supply chains
Simultaneous complexity and simplicity
Emergence of a Chinese consumer market
Emergence of a retail economy
Each of these forces is detailed below.
1 ‘HSBC Sows Seeds in Chinese Countryside’, The Financial Times, 5
th September 2011.

Connolly et al. / International Food and Agribusiness Management Review / Volume 15, Issue 4, 2012
2012 International Food and Agribusiness Management Association (IFAMA). All rights reserved.
180
Expanding Middle Class
The principle driver of a branded economy in food will be the emergence of a middle class, those
with an income sufficiently large that they have discretion over what they spend their income on.
The McKinsey Global Institute estimates that by 2025 up to 75% of the Chinese population will
be middle class2. This will include groups of lower and upper middle class consumers with in-
comes of up to 25,000 RMB and 100,000 RMB respectively. These new groups will be younger
than other global middle class cohorts and will see their income as sufficient to save for both old
age and ill-health and consume new types of higher quality food. Much of this growth will be
located in 400 mid-size cities in China and other parts of the South and East of the world. By
2025, more of the world's middle class will be in the developing world than in the developed
world. This will be a huge new growth market that is not currently on the radar of many organi-
zations.
A speaker at the Alltech Presidents Club identified three groups in the Chinese population: sur-
vivors, builders and boomers. The ‘survivors’ are the fast growing 60+ age group who lived
through hard times of famine and austerity in China’s past. However, their economic power and
good health make this group an important target for food companies. Their children are the
‘builders’, the brand conscious, tough negotiating investors in the modern Chinese economy. The
next population cohorts are the ‘boomers’ who will be the first generation to offer a private alter-
native to public investment as a driver of economic growth. This group is important as they are
in the midst of a love affair with brands in many other categories. For example, many of the
world’s luxury goods such as Burberry and Prada are thriving on the basis of Asian and particu-
larly Chinese demand. This cohort is educated on the value of brands as a symbol of status and a
guarantee of quality. It is imperative to monitor, understand and participate in the emergence of
this middle class.
Food Security, Safety and Quality
China faces the challenge of balancing food security with the need for food safety. The latter has
become a particular challenge following the rapid expansion of domestic food consumption.
While China is able to feed itself, it relies heavily on imported food inputs; it imported, for ex-
ample, 78% of its soybean requirements in 2010. An important challenge in coming years will be
the need to balance its raw materials imports, particularly for animal feed, against the price for
food in China. A further challenge to food security is access to suitable land in the face of rapid
urbanization, the availability of water and the competition for labor with better-paid industrial
work.
China’s opportunity is to improve the safety and quality of the food that it produces. Attempts to
develop national systems of food standards have been described as ‘sluggish’ due to the absence
of a food safety culture. One speaker spoke of food safety being the number one issue for the
Chinese government. Another explained that safe food was not a luxury for the Chinese people,
but a necessity. However, there is a demonstrated willingness on the part of the Chinese
government and firms to engage in meaningful learning with international partners, with the Jilin
2 The Value of China’s emerging middle class
https://www.mckinseyquarterly.com/The_value_of_Chinas_emerging_middle_class_1798

Connolly et al. / International Food and Agribusiness Management Review / Volume 15, Issue 4, 2012
2012 International Food and Agribusiness Management Association (IFAMA). All rights reserved.
181
Food Zone an excellent example of this. A cooperation between the governments of Singapore
and China, along with the city government of Jilin and Singapore’s SATS, aims to share China’s
access to natural resources and Singapore’s expertise in safe food production to improve the
quality and safety of food in China.
The Integration and Consolidation of Industry Supply Chains
The integration of industry supply chains will be an important dynamic in the future as they will
contribute to the safety and productivity needed to support a branded food economy. The desire
to produce safe food is driving the integration of industry supply chains. For example, leading
Chinese feed firm Wellhope and its European joint venture partners De Heus, have been active in
creating an integrated chain with the objective of resolving the issues of safety and quality
through creating a farm to fork integrated chain in which control and authority, and thus respon-
sibility, for safety can be readily observed3.
The opportunity of integration is not just open to Chinese firms. Nestlé is one Western firm that
has been making such investments in the dairy industry in China4. Recognizing the need to
improve the efficiency and profitability of farming in China they have worked to provide advice
on feed and build relationships directly with feed suppliers for those wishing to supply them with
milk. They also provide banks loans, agronomic advice and advice on sourcing the right
equipment.
Chinese food firms are also under pressure to invest in improving the productivity of the industry
in order to maximize the country’s ability to meet food security goals, reduce input price volatili-
ty and produce safer food.
In ten years, it is likely that there will be 1,000 significant food firms operating in China, down
from 20,000 ten years ago and 12,000 today. This consolidation of the Chinese industry and the
resulting drive for efficiencies will leave the largest of these firms looking for new ways to create
and capture value, with branded goods and the lure of higher margins an easy choice. This
approach was signaled by Liuhe as an important future growth strategy. The best way to get a
return for these investments is to brand their products, incorporating the safety message as part of
their promise to consumers, and secure a premium from consumers.
Simultaneous Simplicity and Complexity
China will continue to offer simultaneous simplicity and complexity. The apparent simplicity
arises around the strength of Chinese culture and its apparent uniformity. For example, during
the Alltech Presidents Club, the role of culture was highlighted in the case of Wellhope and
Liuhe. In the former, the success of the firm was founded on the five Confucian principles of
benevolence, justice, courtesy, wisdom and honesty. The Liuhe case highlighted the importance
of their values of kindness, hard work, study and harmony in how they dealt with internal and
external stakeholders. The complexity begins to arise when an attempt is made to try and under-
3 ‘Wellhope – A Feed Fairytale in Northern China’, Pig Progress, Vol. 27, No. 6, 2011.
4 ‘A Market for Local Sourcing’, The Financial Times, 4th April 2011.

Connolly et al. / International Food and Agribusiness Management Review / Volume 15, Issue 4, 2012
2012 International Food and Agribusiness Management Association (IFAMA). All rights reserved.
182
stand in a specific, rather than an anecdotal, way the role that culture plays in decision-making
and action. This is a particular challenge for companies and managers from outside China.
One of the consequences of the apparent uniformity of Chinese culture is the assumption that all
Chinese people are the same. However, simple demographics such as income, geography and
education lead to the presence of significant market segments. For example, large segments exist
in food for children, as a gift for rural dwellers and food as a gift or conspicuous consumption.
While health is a major concern for Chinese people, there is also a traditional view in China that
they eat for taste first and life second.
A number of forces will drive the further splintering of the consumer market in China. One is
population mobility as the move from the countryside to cities continues as improved rail, road
and air infrastructure allows for easier movement between cities and regions. Second is the very
strong role that TV and movies play in diffusing culture in China. A third force is the role of
conspicuous consumption and gift giving amongst the Chinese population. The opportunity is to
target one of these segments and participate in its development over the medium term.
Emergence of a Chinese Consumer Market
The current size of the consumer market in China is great and its economic potential greater. For
example, the soft drinks market is expected to double in size to $86bn by 20155. This makes the
market attractive for both Chinese and international firms. Chinese firms have made good use of
their local knowledge to develop products that Chinese customers want (for example, peanut
flavored milk drinks), but international firms cannot let a historic opportunity of this size pass by
and are responding with their own locally adapted products.
However, the Chinese consumer has a strong commitment to domestic brands, such that no con-
sumer goods category is led by a Western brand although there are many such competitors in the
market. The innovation and competitive battle between Chinese and international firms for this
market will be intense but will also yield products which are unique and valuable to Chinese and
international consumers.
A key trend for Chinese consumers is the need for novelty, with the average life cycle for a
consumer product in China being about three years6. For suppliers to these companies there will
be a constant need for proactive engagement with consumer focused innovation. Such innovation
may have global resonance and be in areas such as health and sustainability but will have to be
tailored to the needs of the Chinese consumer. The experience of firms beyond China, and their
supply chains, in meeting the needs of demanding customers in areas such as health and sustain-
ability leave them well placed to actively participate in this growth.
5 ‘China Sets Pace in Brand Innovation’, The Financial Times, 2011
6 ‘China Sets Pace in Brand Innovation’, The Financial Times, 2011.

Connolly et al. / International Food and Agribusiness Management Review / Volume 15, Issue 4, 2012
2012 International Food and Agribusiness Management Association (IFAMA). All rights reserved.
183
Influence of Retailers
Consumers face the challenge that many products sold as brands in China are not authentic. As a
result, Chinese consumers often trust retailers above brands as a reliable retailer guarantees the
authenticity of a brand. As a consumer brand culture develops in China this will reverse,
although this will likely take a generation. Retailers can be expected to take advantage of power
and leverage the emergence of brands that meet consumer needs for variety, safety and quality,
but also provide the best margins for retailers. In short, an international retail model looks likely
to prevail. While no national channel currently exists, one speaker did identify the likelihood of
government support for one or two national, or supra regional, retail champions as a likely option
in the near future. Such a development would assist in a national brand roll out and encourage
food producers to engage in branding.
Many international retailers, such as Walmart, are already present and growing fast in China7.
The presence of such retailers provides branding expertise to Chinese food producers either di-
rectly through the desire of retailers to stock local brands, or indirectly through demonstrating
‘how it is done’ via driving brand development in other categories and stocking international
brands. The latter are likely to be partners of retailers in other countries and will take advantage
of retailer presence in China to enter the market, helping further to create a branded food
economy.
The Future
There were three uncertainties raised during the Alltech Presidents Club that will interact with
the previous six forces to ultimately decide the future of the Chinese food industry.
How will China access and use the resources it needs to develop the next stage of its food
industry?
Most brands in China are relatively small and have a regional focus. While the firms which own
them can be large in sales terms, they lack expertise in technology of food safety, agricultural
productivity and branding. There are a variety of ways in which this expertise could be secured
such as international partnerships, internal development or acquisition. The latter appears to be
gaining currency in the Chinese food industry. One good example of this is provided by Bright
Foods, who recently acquired 75% of the Australian company Manassen Foods in one of the
largest ever acquisitions by a Chinese food company. The company had previously attempted to
acquire the French yogurt maker Yoplait, US vitamin retailer GNC, and the UK snack
manufacturer, United Biscuits. The common theme across the successful and unsuccessful
acquisition targets is the access they would provide for Bright to international distribution
channels, production technology and strong brands in developed markets. While there is no
problem in securing capital for such acquisitions, there is a challenge in integrating knowledge
acquired, a challenge faced by every firm post acquisition.
7 ‘Walmart in US Sales Struggle’, The Financial Times, 18
th May 2011.

Connolly et al. / International Food and Agribusiness Management Review / Volume 15, Issue 4, 2012
2012 International Food and Agribusiness Management Association (IFAMA). All rights reserved.
184
Will China allow its food industry to develop to international models or will it seek another way?
With industry integration and consolidation under way, the Chinese food industry looks to be
heading in the same direction as the international food industry with larger farms and concentrat-
ed processing. However, the commitment of the government to social harmony and the existing
desire of the Chinese people to eat fresh rather than processed food may mean that another path
is chosen.
How will western influence shape food consumption in China?
As the Chinese food industry develops, it will not do so with a blank slate, rather it will progress
in interaction with international participants operating in the industry. It is a source of uncertain-
ty to consider how these Western influences will be allowed to shape and direct the development
of the industry in China and whether the mistakes made elsewhere will be repeated or repaired in
China.
Conclusion
This paper reviewed discussions which occurred during the 4th
Annual Alltech Presidents Club
conference. Six prevailing forces were identified which we conclude will accelerate the
development of strong local branded food products. While three scenarios also emerged which
may make the path less certain, the end point is clear. The implications for the food and feed
industries are that the provision of technologies, products and processes that facilitate the ability
of Chinese national and international companies to develop these brands, must be the goal of any
supplier to these businesses. In addition to offering cutting edge technology, traceability, cost-
effectiveness and consistency, such companies should also consider offering softer, knowledge
based, services such as the transfer of branding building skills. Our conclusion is that while the
Chinese industry might be ten years behind Western companies in building a branded food in-
dustry, it is unlikely to take ten years to catch up.
About the Alltech President’s Club
The Alltech Presidents Club is an annual meeting of food and agribusiness industry leaders
hosted by the founder and President of Alltech, Dr. Pearse Lyons. This invitation only event is
intended to be a club of presidents and a forum for open exchange and debate on leadership
issues. It expressly focuses on identifying opportunities for business growth. The 4th
Alltech
Presidents Club in 2011 took place in Beijing and Shanghai, China, and was attended by 105
Presidents.

2012 International Food and Agribusiness Management Association (IFAMA). All rights reserved
185
International Food and Agribusiness Management Review
Volume 15, Issue 4, 2012
The Agenda of Sustainable Development1
Industry Speaks
Gustavo Grobocopatel
President, Grupo Los Grobo, Ruta No. 5 Km 308 C.C. 188
Figueroa Alcorta 3535 . 12th Floor, Carlos Casares, BA 6530, Argentina
Abstract
A new generation of industries will gradually replace those inherited from the Industrial
Revolution; that process will be a sort of “rural industrialization”, with new, copious and cheaper
products of higher quality and less impact on the environment.
Within this new paradigm, sustainable development challenges will not only include the impacts
on the environment or social issues, construed as those included within the “goals of the
millennium”, but governing such transformations. How will decisions be made in a more
integrated and interdepending world so that this process is inclusive? Who will have the ability
or responsibility to make these processes possible?
Keywords: sustainable development, environmental impact, consumption habits
Corresponding author: Email: [email protected]
1 This article was originally appeared in © La Nacion on May 2, 2012.
+The IFAMR is a non-profit publication. The additional support provided from this issue advertiser, Novus
International helps us remain open access and dedicated to serving management, scholars, and policy makers
worldwide.

Grobocopatel et al. / International Food and Agribusiness Management Review / Volume 15, Issue 3, 2012
2012 International Food and Agribusiness Management Association (IFAMA). All rights reserved.
186
Introduction Sustainable development (SD) may be understood as a way of inclusive progress of society.
“Progress for Everybody” was the motto of the recent Summit of the Americas. Thus, I take for
granted that SD includes a better quality of life, higher happiness indexes, a greater ability to
meet needs, improved education and health levels, and more opportunities for those willing to
have them - an aspect that requires a greater ability to understand the world, its dynamics, oppor-
tunities, and challenges.
It is sustainable because I believe that time does not degrade this process; on the contrary, it
enhances and envisages it to a higher extent. On the one hand, I could presume that SD means a
growing and extensive well-being with no limits for each and all human beings. On the other
hand, I believe that SD may have various meanings depending on cultures, the phase of society
or its prevailing paradigm.
Within this framework, I think we have developed a notion of well-being and, therefore, of SD,
with standards derived from industrial society, with a pattern of consumption and particular
habits, with ownership of property as the core of satisfaction. Each human being requires a
house, a refrigerator, a car that uses fossil fuel, prefers to eat proteins or use oil instead of cereals
or vegetables. At this pace, if a significant portion of the world population continues to adopt
these consumption habits, many planets will be required to satisfy our needs. All lands available
would not be enough to produce more food; minerals, oil and other sources of energy will also be
insufficient. Just to mention an example: an average American consumer use twice as much
energy as a typical European consumer and four times more than an average Latin American
consumer. The discussion on SD should include deep thought about these issues since there is no
solution to the problem that such an increase in the consumption of goods would cause.
Sustainable Development (SD) may be understood as a way of inclusive progress of society.
However, moving from an industrial society to a society of knowledge brings about good news
to some of these issues. We are walking towards a society where the tendency is to share goods,
where satisfaction is less frequently based on using material objects and focuses more on
experiences as well as on the consumption of services instead of products. That is to say, a
society that focuses on flow control more than on the ownership of stocks.
Owning a PC with Internet access already seems to be more important than having a car in
certain geographies and segments of society. Should this tendency – seen in more advanced
societies – increase, we will probably face a change in consumption habits.
With regard to agribusiness-related issues, we will witness a fascinating change given the fact
that plants are used more and more as bioreactors, and they not only produce food (proteins,
carbohydrates, or fibers) but also varied ways of energy, industrial enzymes, plastics, or
medicines. Consequently, we are looking at small “industrial plants” or a “green industry” that
uses clean and renewable energies, such as solar energy, where leaves are some kind of efficient
“panels”. These “factories” have original designs that come in a chip, which is the seed, and

Grobocopatel et al. / International Food and Agribusiness Management Review / Volume 15, Issue 3, 2012
2012 International Food and Agribusiness Management Association (IFAMA). All rights reserved.
187
which determines their features; instead of having smokestacks and issuing gases, they consume
the atmosphere’s carbon dioxide.
We are walking towards a society where the tendency is to share goods.
I believe a new generation of industries will gradually replace those inherited from the Industrial
Revolution; that process will be a sort of “rural industrialization”, with new, copious and cheaper
products of higher quality and less impact on the environment.
Within this new paradigm, SD’s challenges will not only include the impacts on the environment
or social issues, construed as those included within the “goals of the millennium”, but governing
such transformations. How will decisions be taken in a more integrated and interdepending world
so that this process is inclusive? Who will have the ability or responsibility to make these
processes possible?
Undoubtedly, these trends place the State and its ability to adapt to this new paradigm in the
center of the scene. The extent to which this process will produce an extensive well-being with
no frontiers will depend on such State’s quality and intelligence.
During the recent Summit, several Heads of State of the Americas clearly introduced this issue
into the agenda; governance is required based on consensus, institutional character, predictabil-
ity, and a safe framework. They also discussed about pragmatism in the Government’s actions
and a State that adapts to changes; they stated that they consider a “good government” one that is
efficient (I personally think there are various ways of efficiency), effective, transparent, and
accountable to society.
The responsibility of such State transformation goes beyond governments or political groups and
includes civil society as a whole and, of course, businesspeople, who will be responsible for
undertaking risks, investment capacity, and creativity in view of this new age’s challenges. The
process must create public goods and build social capital. Public-private associations may be a
good platform to drive these actions.
Meanwhile, the social agenda knocks at our doors every day: structural poverty, economic unre-
liability with consequences on the pension plan, inequality, and violence together with organized
crime, income differences between the rich and the poor, the youngsters that do not study or
work, the problem of access to housing, the need of high-quality education, how to create
employment and, especially, employability. The environmental agenda requires joint actions at a
local and global level so as to find solutions to climate change, deforestation, the problem of
access to water, and sea control.
The discussion of these issues should speed up and intensify. There are solutions available, and
this is why sustainable development should go beyond an ethical discussion and should be
included within the authorities’ agenda.
The agenda of sustainable development must include the pressing problems of the social and
environmental agenda, reviewing consumption habits, the State’s quality, the development of

Grobocopatel et al. / International Food and Agribusiness Management Review / Volume 15, Issue 3, 2012
2012 International Food and Agribusiness Management Association (IFAMA). All rights reserved.
188
new ways of global government, and the productive paradigm’s transformation with the emer-
gence of “green industries".

2012 International Food and Agribusiness Management Association (IFAMA). All rights reserved
189
International Food and Agribusiness Management Review
Volume 15, Issue 4, 2012
Mapping and Quantification of the Cotton Chain in Brazil
Industry Speaks
Marcos Fava Nevesa, Mairun Junqueira Alves Pinto
b, José Carlos de Lima Júnior
c
a Professor, School of Economics and Business (FEARP) University of São Paulo,
Av dos Bandeirantes 3900, Ribeirão Preto (SP), 14.040-900, Brazil
b Researcher, Markestrat Project and Research Center, Rua Maestro Ignácio Stabile, 520, 14025-640,
Ribeirão Preto, SP, Brazil
c PhD Candidate, University of São Paulo, FEA - School of Economics, Business and Accounting,
Markestrat Project and Research Center, Rua Maestro Ignácio Stabile, 520, 14025-640
Ribeirão Preto, SP, Brazil
Abstract
The CHAINPlan method developed by Neves (2007) is a practical tool which can be used to
construct strategic plans for production chains. A preliminary step in this process includes
mapping and quantifying the production chain. We present the results of applying the method to
one of the most important agribusiness chains in Brazil—the cotton sector. The Gross Domestic
Product for the cotton sector in the 2010-2011 crop year was estimated at nearly $19.2 billion.
We show the interconnections between the links in the chain and its ability to generate
revenues, taxes and jobs.
Keywords: cotton, economic impact, value chain.
Corresponding author: Tel: +55 16 3602-3903 Email: [email protected]
M. J. Alves Pinto: [email protected]
J.C. de Lima Júnior: [email protected]
+The IFAMR is a non-profit publication. The additional support provided from this issue advertiser, Novus
International helps us remain open access and dedicated to serving management, scholars, and policy makers
worldwide.

Fava Neves et al. / International Food and Agribusiness Management Review / Volume 15, Issue 4, 2012
2012 International Food and Agribusiness Management Association (IFAMA). All rights reserved.
190
The Cotton Chain
The mapping and quantification of agribusiness chains in Brazil has been the subject of several
studies. Readers will better understand the magnitude of economic and social development of the
production chain through addressing the following questions:
How significant is the sum of sales of the various links in the supply chain and its GDP?
How much tax revenue is generated by the production chain?
How many jobs are generated in Brazil?
How significant is the sum of wages paid to workers during a season?
The Gross Domestic Product (GDP) of the cotton sector for the 2010-2011 crop year reached an
estimated value of US$ 19.19 billion (Table 1). Overall financial transactions, which consist of
the sum of the revenues of each link in the productive chain sum to US $37.94 billion.
Table 1. GDP estimate for Brazilian cotton production chain based on final goods
Product Internal Market External Market GDP (IM + EM)
US$ (millions) US$ (millions) US$ (millions)
Cotton lint Not applicable 745.938 745.938
Cotton linters 113.712 14.004 127.716
Cotton motes 26.512 Not applicable 26.512
Cotton yarns Not applicable 10.981 10.981
Cotton textiles 11,785.909 164.333 11,950.242
Cotton knits 5,519.544 11.768 5,531.312
Cotton seeds 244.339a Not applicable 244.339
Cottonseed cake and meal 271.003 Not applicable 271.003
Crude cottonseed oil 228.844b Not applicable 228.844
Cottonseed-based biodiesel 56.076 Not applicable 56.076
Total 17,772.756 947.024 19,192.963 Source. Elaborated by the authors
a - Sales made by cotton gins considering the total production of cotton seed minus the amount allocated to crushers
for the manufacture of cottonseed oil, cake and meal.
b - Sales by crushers, considering the total production of crude cottonseed oil minus the amount destined for the
manufacture of biodiesel.
The cotton value chain is divided into three stages: (1) before farm, (2) on the farm, and (3) after
the farm.
Before Farms
The link of supplies and inputs includes the resources necessary for agricultural production.
Agricultural supply industries accounted for US$1.93 billion in sales to cotton farmers.
Pesticides, fertilizers and fuel and lubricants account for 82% of the sector’s expenditure on farm
inputs. The high use of pesticides is due to the high incidence of hard-to-control pests and
diseases that, if left untreated, can cause major economic losses to growers. The high use of ferti-
lizers is justified mainly by the fact that production is concentrated in the areas of the cerrado

Fava Neves et al. / International Food and Agribusiness Management Review / Volume 15, Issue 4, 2012
2012 International Food and Agribusiness Management Association (IFAMA). All rights reserved.
191
(savannah-like vegetation zones) where the soil conditions require fertilization. The expenditure
on fuel and lubricants accounts for the strong use of machinery in all stages of production: plant-
ing, treatment, harvest and internal transportation–and by the large number of field applications
per harvest year.
On the Farms
In the cotton chain it is common to find an integrated model where growers gin their own cotton.
The ginning process therefore is included in on-farm activities. Often, there is a rendering of
services among the producers themselves, and in most reported cases, payment is made through
the “barter” system, in agricultural enterprises where no ginning occurs on farm. Producers trade
a portion of the processed product, mainly cotton seed and lint, for ginning services. Only in the
state of Minas Gerais did the interviewees indicate that producers paid cash per kilo ginned.
Bartering comprised $636.41 million of the $7,059.15 million in revenue earned by cotton
farmers. The other $ 6,423.15 came from the sale of cotton lint.
Beyond the Farm
The next stage in the chain includes the textile industry (spinning and weaving/knitting), which
purchases lint from producers. Textiles in 2010 accounted for $26.38 billion in sales of cotton
products (IEMI, 2011; Secex, 2011). Another source of revenue is generated from crushers who
process the farm-produced cotton seeds into vegetable oil, meal, and linters. Vegetable oil is
marketed primarily to the food and biodiesel industries, while the meal is used for animal feed.
The linters, which are short cotton fibers that cover the seeds are also sold by the crushers. The
combined sale of oil; cake and meal; linters; and biodiesel resulted in $737.46 million in
revenue.
Value Chain Services
The cotton service sector had sales totaling $412.12 million. Services include cotton fiber
classification laboratories ($11.10 million); brokerage firms ($80.96 million); maintenance of gin
plants ($ 21.48); and credit lines for cotton cultivation ($298.58). Other important service
providers such as agricultural consultants and crop application are not accounted for due to the
lack of data.
Taxes, Employment and Wages
The cotton sector pays nearly $8 billion in sales taxes and employs over 150,000 people: 79,477
people working exclusively with cotton and cotton fibers; 14,241 in the cultivation of cotton;
27,481 in the preparation and spinning of cotton fibers; and 37,755 in the weaving of cotton
yarn/thread. The total wage bill for the cotton sector in 2010 was $ 786.79 million.
Product sales estimated in US dollars for the 2010-2011 harvest year can be seen in Figure 1.

Fava Neves et al. / International Food and Agribusiness Management Review / Volume 15, Issue 4, 2012
2012 International Food and Agribusiness Management Association (IFAMA). All rights reserved.
192
Fig
ure
1. T
he
map
pin
g a
nd q
uan
tifi
cati
on o
f th
e B
razi
lian
Cott
on C
hai
n
So
urc
e.
Ela
bo
rate
d b
y t
he
auth
ors
.

Fava Neves et al. / International Food and Agribusiness Management Review / Volume 15, Issue 4, 2012
2012 International Food and Agribusiness Management Association (IFAMA). All rights reserved.
193
Conclusion
The cotton chain is very specific, due to the fact that the most important part of the chain doesn’t
go to the food consumer, but to the textile industry. Consequently, the cotton chain faces
competition from the industrial and alternative fiber sectors. The cotton chain is not experiencing
the same consumption growth as seen in grains like soybean, corn, wheat, peanuts and others.
The implications of this study provide measurements detailing all aspects of the chain and profit
sectors, and the major difficulties the chain currently faces. The findings show the Brazilian
cotton sector offers growth opportunities not only in the primary production of lint, but mainly in
other production systems, such as food products, pharmaceuticals and textiles, especially when
one takes a closer look at the various byproducts generated from raw cotton. Among these prod-
ucts, a recent increase in the value of vegetable oil in the biofuels sector should be highlighted,
concomitantly being a natural source of clean energy for the biodiesel industry as well as an im-
portant protein concentrate for animal feed, providing 32% crude protein, which directly impacts
the development of other production chains, such as cattle breeding.
After examining the numbers and impacts, these type of projects can gain acceptance within
Government, private companies and organizations within the cotton chain, and move forward
into an implementation phase.
References
IEMI, 2011. Instituto de Estudos e Marketing Industrial. Relatório Setorial da Indústria Têxtil
Brasileira. Instituto de Estudos e Marketing Industrial.
Neves, M.F., 2007. A Method for Demand Driven Strategic Planning and Management for Food
Chains (The ChainPlan Method). In: 17th Annual World Forum and Symposium - Food
Culture: Tradition, Innovation and Trust - A Positive Force for Modern Agribusiness,
2007, Parma, Italy: June.
SECEX/MDIC, 2011. Ministry of Development, Industry and Foreign Trade of Brazil. Availa-
ble at < http://mdic.gov.br> Accessed 14 October 2011.

IFAMA Business Office • P.O. Box 14145 • College Station, TX 77841-4145, USA
Tel: 1-979-845-2118 • Fax: 1-979-862-1487 • E-mail: [email protected] • Web: http://www.ifama.org
The IFAMR (ISSN #: 1559-2448)