Embed Size (px)
Citation preview


Volume 15 • APA I • 2003
Journal of the Urban and Regional Information Systems Association
CONTENTS
REFEREED 5 Introduction to the Special Issues on Access and Participatory Approaches in
Using Geographic InformationHarlan J. Onsrud and Max Craglia, Co-Editors
9 Toward a Framework for Research on Geographic Information-Supported Participatory Decision-Making
Piotr Jankowski and Timothy Nyerges
19 In Search of Rigorous Models for Policy-oriented Research: A Behavioral Approach to Spatial Data Sharing
Uta Wehn de Montalvo
29 Cultural and Institutional Conditions for Using Geographic Information; Access and Participation
W.H. Erik de Man
35 A New Era of Accessibility? Sarah Niles and Susan Hanson
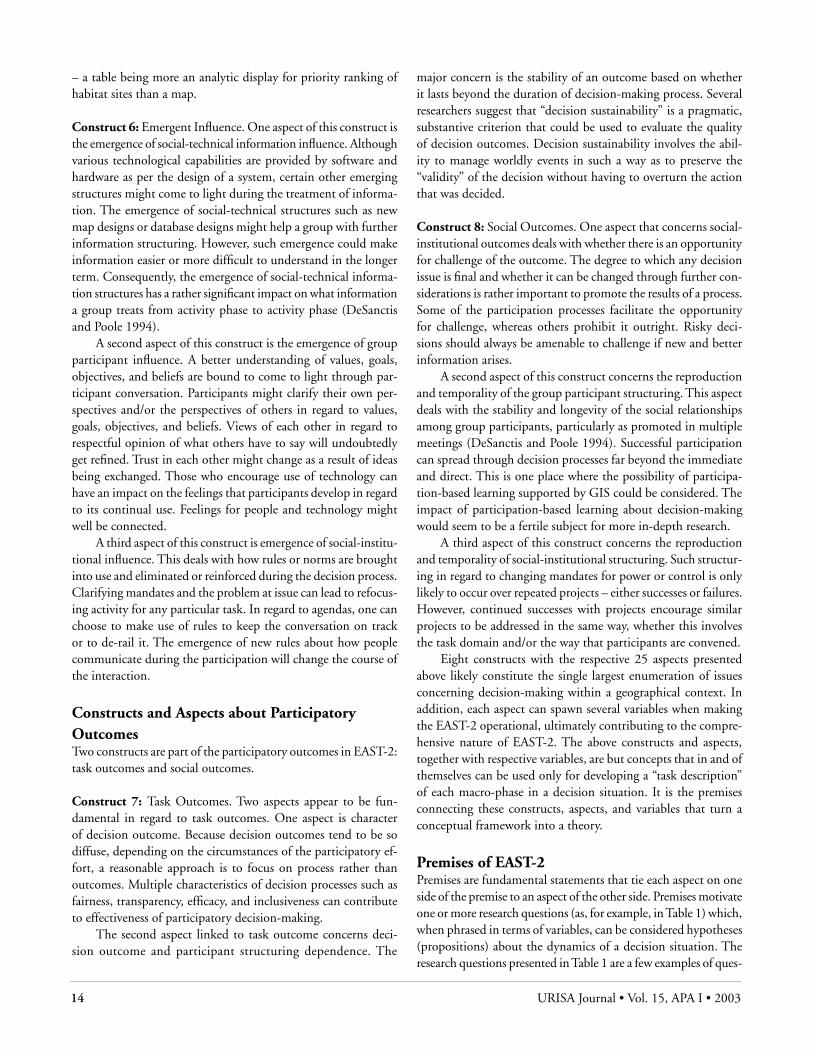
43 World Status of National Spatial Data Clearinghouses Joep Crompvoets and Arnold Bregt
51 Access to Geographic Information: A European Perspective Max Craglia and Ian Masser
61 The Future of Participatory Approaches Using Geographic Information: developing a research agenda for the 21st Century
Steve Carver
73 Transparency – Considerations for PPGIS Research and Development Christina H. Drew

2 URISA Journal • Vol. 15, APA I • 2003 URISA Journal • Vol. 15, APA I • 2003 3
Journal
EDITORIAL OFFICE: Urban and Regional Information Systems Association, 1460 Renaissance Drive, Suite 305, Park Ridge, Illinois 60068-1348; Voice (847) 824-6300; Fax (847) 824-6363; E-mail [email protected].
SUBMISSIONS: This publication accepts from authors an exclusive right of first publication to their article plus an accompanying grant of non-exclusive full rights. The publisher requires that full credit for first publication in the URISA Journal is provided in any subsequent electronic or print publications. For more information, the “Manuscript Submission Guidelines for Refereed Articles” is available on our website, www.urisa.org, or by calling (847) 824-6300.
SUBSCRIPTION AND ADVERTISING: All correspondence about advertising, subscriptions, and URISA memberships should be directed to: Urban and Regional Information Systems Association, 1460 Renaissance Dr., Suite 305, Park Ridge, Illinois, 60068-1348; Voice (847) 824-6300; Fax (847) 824-6363; E-mail [email protected].
URISA Journal is published four times a year by the Urban and Regional Information Systems Association.
© 2003 by the Urban and Regional Information Systems Association. Authorization to photocopy items for internal or personal use, or the internal or personal use of specific clients, is granted by permission of the Urban and Regional Information Systems Association.
Educational programs planned and presented by URISA provide attendees with relevant and rewarding continuing education experience. How-ever, neither the content (whether written or oral) of any course, seminar, or other presentation, nor the use of a specific product in conjunction therewith, nor the exhibition of any materials by any party coincident with the educational event, should be construed as indicating endorsement or approval of the views presented, the products used, or the materials exhibited by URISA, or by its committees, Special Interest Groups, Chapters, or other commissions.
SUBSCRIPTION RATE: One year: $295 business, libraries, government agencies, and public institutions. Individuals interested in subscriptions should contact URISA for membership information.
US ISSN 1045-8077
Publisher: Urban and Regional Information Systems Association
Editor-in-Chief: Stephen J. Ventura
Journal Coordinator: Scott A. Grams
Electronic Journal: http://www.urisa.org/journal.htm

2 URISA Journal • Vol. 15, APA I • 2003 URISA Journal • Vol. 15, APA I • 2003 3
URISA Journal Editor
Editor-in-ChiefStephen J. Ventura, Department of Environmental Studies and Soil Science, University of Wisconsin-Madison
Thematic Editors
Editor-Urban and Regional Information Science
Lewis Hopkins, Department of Planning, University of Illinois-Champaign/Urbana
Editor-Applications ResearchLyna Wiggins, Department of Planning, Rutgers University
Editor-Social, Organizational, Legal, and Economic Sciences
Ian Masser, Department of Urban Planning and Management, ITC (Netherlands)
Editor-Geographic Information ScienceMark Harrower, Department of Geography, University of Wisconsin Madison
Editor-Information and Media SciencesMichael Shiffer, Department of Planning, Massachusetts Institute of Technology
Editor-Spatial Data Acquisition and Integration
Gary Hunter, Department of Geomatics, University of Melbourne (Australia)
Editor-Geography, Cartography, and Cognitive Science
David Mark, Department of Geography, SUNY-Buffalo
Editor-EducationKaren Kemp, Department of Geography, University of California-Berkeley
Section Editors
Software Review Editor Jay Lee, Department of Geography, Kent State University
Book Review EditorRebecca Somers, Somers-St. Clair
Literature Review EditorZorica Nedovic, Department of Urban and Regional Planning,University of Illinois-Champaign/Urbana
Article Review Board
Peggy Agouris, Department of Spatial Information Science and Engineering, University of Maine
Michael Batty, Centre for Advanced Spatial Analysis, University College London (United Kingdom)
Kate Beard, Department of Spatial Information Science and Engineering, University of Maine
Yvan Bédard, Centre for Research in Geomatics, Laval University (Canada)
Barbara P. Buttenfield, Department of Geography, University of Colorado
Keith C. Clarke, Department of Geography, University of California-Santa Barbara
David Coleman, Department of Geodesy and Geomatics Engineering, University of New Brunswick (Canada)
David J. Cowen, Department of Geography, University of South Carolina
Massimo Craglia, Department of Town & Regional Planning, University of Sheffield (United Kingdom)
William J. Craig, Center for Urban and Regional Affairs, University of Minnesota
Robert G. Cromley, Department of Geography, University of Connecticut
Kenneth J. Dueker, Urban Studies and Planning, Portland State University
Geoffrey Dutton, Spatial Effects
Max J. Egenhofer, Department of Spatial Information Science and Engineering, University of Maine
Manfred Ehlers, Geoinformatics and Institute for Environmental Sciences, University of Vechta (Germany)
Manfred M. Fischer, Economics, Geography & Geoinformatics, Vienna University of Economics and Business Administration (Austria)
Myke Gluck, Department of Math and Computer Science, Virginia Military Institute
Michael Goodchild, Department of Geography, University of California-Santa Barbara
Michael Gould, Department of Science, Experimentales Universitat (Spain)
Daniel A. Griffith, Department of Geography, Syracuse University
Francis J. Harvey, Department of Geography, University of Minnesota
Kingsley E. Haynes, Public Policy and Geography, George Mason University
Eric J. Heikkila, School of Policy, Planning, and Development, University of Southern California
Stephen C. Hirtle, Department of Information Science and Telecommunications, University of Pittsburgh
Dr. Gary Jeffress, Department of Geographic
Information Science, Texas A&M University-Corpus Christi
Richard E. Klosterman, Department of Geography and Planning, University of Akron
Robert Laurini, Claude Bernard University of Lyon (France)
Thomas M. Lillesand, Environmental Remote Sensing Center, University of Wisconsin-Madison
Paul Longley, Centre for Advanced Spatial Analysis, University College, London (United Kingdom)
Xavier R. Lopez, Oracle Corporation
David Maguire, Environmental Systems Research Institute
John McLaughlin, Research and International Cooperation, University of New Brunswick (Canada)
Harvey J. Miller, Department of Geography, University of Utah
Joel L. Morrison, Center for Mapping, Ohio State University
Atsuyuki Okabe, Department of Urban Engineering, University of Tokyo (Japan)
Jeffrey K. Pinto, School of Business, Penn State Erie
Gerard Rushton, Department of Geography, University of Iowa
Jie Shan, School of Civil Engineering, Purdue University
Bruce D. Spear, Federal Highway Administration
Jonathan Sperling, Policy Development & Research, U.S. Department of Housing and Urban Development
David J. Unwin, School of Geography, Birkbeck College, London (United Kingdom)
Stephen J. Ventura, Environmental Studies and Soil Science, University of Wisconsin-Madison
Nancy von Meyer, Fairview Industries
Barry Wellar, Department of Geography, University of Ottawa (Canada)
Michael F. Worboys, Department of Computer Science, Keele University (United Kingdom)
Benjamin Zhan, Department of Geography, Southwest Texas State University
EDITORS AND REVIEW BOARD

URISA Journal • Vol. 15, APA I • 2003 5

URISA Journal • Vol. 15, APA I • 2003 5
Access issues and participatory approaches in using geographic information have been persistent and growing areas of research focus across the globe over the past decade. The proliferation of spatial technologies, growth of geographic databases, pervasive use of the web, and expanding use of mobile communication networks are providing exciting opportunities for increasing personal access to virtual and physical resources and enabling broader participation in decision making. Yet these same changes are exacerbating existing social inequities and giving rise to new access problems.
There are at least two major research themes in address-ing issues of “access” within the geographic information science (GIS) research community. The first involves spatial concepts and theories that relate to access to goods and services generally. The second involves the notion of access to geographic information as a source of wealth and power.
Over time, geographers have developed theories about the way individuals and aggregates of individuals respond to the con-straints of time, cost, and effort in order to gain access to work, shopping, recreation, and other spatially distributed activity op-portunities. Many of the models developed from these theories have been very useful. However, the nature of accessibility is changing as many goods and services may be accessed without recourse to physical movement. Information, in combination with the infrastructure that carries it, is a new and expanding resource that often replaces labor, capital, and physical resources. Access to physical space can be replaced or complemented by access to virtual space in which traditional notions of distance, nearness, and spatial interaction lose meaning or, at the very least, must be reassessed. In virtual environments the activities appear to be more people-based than place-based. Where you physically are may become less and less an indicator of what you may be doing. Thus, the traditional assumption of a strong correlation between place and activity upon which many geographic models have been based often may be unwarranted in virtual space.
Introduction to the Special Issues onAccess and Participatory Approaches in Using
Geographic Information
Harlan J. Onsrud and Max Craglia, Co-Editors
The second primary research theme focuses on access as a basis of wealth and power in society and addresses societal issues such as equity, ownership, and control. Those active in this re-search domain argue that the foundations of legal rights of citizens and scientists to access information are being undermined as we move into networked digital data environments. Thus, research-ers focused in this arena believe it is important to identify the processes by which losses in access are occurring, publicize that the losses are occurring, explore alternatives for halting or reversing the losses, and investigate models for expanding access or providing more equitable access. There is also a need to observe society in action through assessment of the impact of evolving policy and legal trends on access to scientific and technical data generally and geographic data specifically.
Closely affiliated with concepts of access is the concept of participation. Geographic information technologies are seen alternatively as tools that empower communities versus tools that invasively advantage some people and organizations while marginalizing others. Public Participation GIS research efforts largely adhere to the first and more positive view and seek to develop approaches, mechanisms, technologies, and institutions that aid self-determination by various forms of self-defining communities with full awareness of the second view that choices made may have negative as well as positive power ramifications. Although consistency in definition has yet to emerge, some of the characteristics envisioned for participatory geographic infor-mation technologies have included: 1) emphasis on the role of participants in creation and evaluation of data; 2) accommodation of equitable representation of diverse views, preserving contradic-tion, inconsistencies, and disputes against premature resolution; 3) system outputs redefined to reflect the standards and goals of the participants; 4) capabilities for managing and integrating all data components and participant contributions from one interface – technologically sophisticated but easy to use; 5) preservation and representation of the history of its own development and be

6 URISA Journal • Vol. 15, APA I • 2003 URISA Journal • Vol. 15, APA I • 2003 7
more capable of handling time components than existing GIS, and 6) embedment of the condition that “Public Participation GIS” is not primarily enabling technology focused but is primar-ily an ongoing “process” of self-determination by self-defining communities.
In the Fall of 2001, a workshop with participation by United States and European researchers was held in Spoleto, Italy to assess the current state of research on access to geographic informa-tion and on geographic access theory, to evaluate the impact of evolving policy and legal trends in the U.S. and Europe on access to scientific and technical data generally and geographic data specifically, to assess the current state of research on participa-tory approaches surrounding the use of geographic information, to explore commonalities and differences in U.S. and European directions of research within these arenas, and to develop a joint U.S./European research agenda on geographic information access and participatory issues.
The idea for a “Workshop on Access and Participatory Ap-proaches in Using Geographic Information” arose from research discussions among university members of the University Con-sortium for Geographic Information Science (UCGIS) and the Association of Geographic Information Laboratories in Europe (AGILE). The articles in this first and a second special issue of the URISA Journal arose from papers presented at the Spoleto Workshop as well as from a subsequent call for papers on the topics of the Workshop. The Workshop was jointly funded by the National Science Foundation and the European Science Founda-tion, and the final report from the Workshop is contained in the second special issue.
Special Issue I We begin the issue with three articles focused on methodological and research framework issues. Next we present an article that explores a framework for considering accessibility in the context of evolving technology and social structures. This is followed by two articles that pursue a survey approach in exploring access is-sues. Finally, we present two articles that focus on participatory experiences in geographic information technology settings.
To establish a context for research on geographic informa-tion-supported participatory decision-making, Piotr Jankowski and Timothy Nyerges explore the multiple constructs of par-ticipatory situations and highlight how models of participatory situations can help organize our understanding of participatory settings in the use of GIS. The authors present a framework for comparing participatory GIS models. Eighteen empirical research strategies are compared to each other, and the authors suggest circumstances under which each strategy might contribute to empirical investigations of participatory GIS use activities. They urge systematic comparisons by the research community in order to gain an overall sense of how and under what circumstances a participation model might be more beneficial than others in terms of efficiency, effectiveness, and equity, and to gain an understand-
ing of how the costs of different models structure participant interaction. The power of their framework is in linking premises with research questions and testable hypotheses and the empiri-cal testing of the hypotheses. This may lead to verification of the theoretical framework and therefore a logical basis upon which to base guidelines for designing and using geographic information technologies in participatory decision making.
The development of spatial data-sharing cultures is important to the successful implementation of geographic information tech-nologies among and within user groups and to the advancement of GIS generally. After reviewing several theoretical models of decision-making, Uta Wehn de Montalvo demonstrates in her article that the theory of planned behavior drawn from the field of social psychology can be fruitful as an organizing principle for research into spatial data sharing. That is, the theory has been used successfully in identifying in a systematic fashion the incentives and disincentives that determine the intention of key individuals within an organization to share spatial data. Results of her em-pirical work are presented. The author suggests that the strength of the approach is in identifying context-specific incentives and disincentives to spatial data sharing which in turn may provide a basis for policy makers in achieving desired sharing behaviors.
The third article by W.H. Eric de Man is yet another that draws on theories from other scholarly domains to explore access and participatory processes in geographic information settings. Approaches are needed to describe and analyze the predominant cultural conditions affecting access to and participation in the use of geographic information. This article introduces two existing models used to describe and compare different cultures, namely the approaches of Geert Hofstede and Mary Douglas. Because access to and use of geographic information are embedded within the culture and institutional arrangements of a host society, the author argues that cultural and institutional values and factors must often be accounted for in order to more completely explain and identify resistance or non-resistance to particular approaches to sharing or using spatial data.
Many of the accessibility models developed over time by scholars have been very useful for understanding how people are related spatially to their economic and social activities. This understanding has improved the quality of life of communities by enabling better planning and design of land development activities, transportation systems, and preservation projects. However, the previous models and inputs to those models need to be reassessed in the light of different ways that people now communicate, learn, work, and conduct commerce brought about by the Internet. Sarah Niles and Susan Hanson illustrate numerous ways that grounded geographies mark cyberspace and examine the intersection of people’s use of information technol-ogy and grounded socio-spatial relations. They argue and present evidence that physical access to the Internet closely resembles pre-Internet spatial patterns of access to goods and services. Their examples illustrate how the social context in which online mate-rial is produced and consumed can greatly affect the accessibility of that information.

6 URISA Journal • Vol. 15, APA I • 2003 URISA Journal • Vol. 15, APA I • 2003 7
Although insufficient by itself, access to spatial data is a neces-sary precondition to be able to engage meaningfully in decision making that depends on or could be affected by such data. Across the globe, various actors have been engaged in making spatial data available to others through the establishment of a system of clearinghouse nodes. Sometimes, the nodes provide access to metadata so that others may know that specific spatial data exist while other nodes provide online access to actual spatial data. Joep Crompvoets and Arnold Bregt accomplished a survey of the status of such nodes in December of 2001. Their survey shows that nodes had been established in 59 countries as of that point in time. Their article also highlights differences in the use, content, and management of various nodes across the globe.
An article by Max Craglia and Ian Masser next addresses is-sues of access to spatial data from a European perspective. They review recent policy and legislative developments in Europe and identify three main strands of research on access to geographic information that they believe deserve concerted effort by the re-search community in Europe. In brief, the strands include a focus on the role of governments in developing frameworks for sharing spatial information, a focus on the organizational level, and a focus on regulatory frameworks in national and trans-national contexts such as those that seek to protect intellectual property rights while promoting wider access and use of geographic information.
The article by Steve Carver focuses on participatory ap-proaches using geographic information. It pays initial attention to general theories of participation and empowerment before examining the role of geographic information in providing a framework for active public participation. The author reviews
the current use of geographic information to facilitate involvement in decision making and then explores factors working against or for use of geographic information and technologies in communal decision-making. A research agenda is outlined for building on strengths, addressing weaknesses, exploring opportunities, and neutralizing threats in the use of geographic information tech-nologies in participatory processes.
Specific groups are often tasked through legislation or other authority to make decisions affecting large segments of the popula-tion. Transparency in the data and processes used in such decision making is very important when the uncertainties of following particular courses of action may be high or the potential nega-tive effects of decisions may be severe or widespread. Geographic information and Internet technologies may be used as positive tools in increasing the transparency of decisions. In an article by Christina Drew, an example is detailed of how increased transpar-ency was facilitated through the use of a geographic information system and the Internet. The example illustrates the complexity and challenges of measuring decision transparency and highlights the need for research and methodological development focused on such measures.
Articles in this special issue are based partially upon work sup-ported by the National Science Foundation under Grant No. 0098389 and the European Science Foundation. Any opinions, findings, and conclusions or recommendations expressed in this material are those of the authors and do not necessarily reflect the views of the National Science Foundation or the European Science Foundation.

URISA Journal • Jankowski, Nyerges 9

URISA Journal • Jankowski, Nyerges 9
IntroductionAt a workshop on Access and Participatory Approaches in Us-ing Geographic Information organized by the U.S. National Science Foundation and the European Science Foundation in Spoleto, Italy, in December 2001, the development of place-based methodologies and methods for more inclusive community participation in spatial decision-making was recognized as one of six core research areas in the context of geographic information system (GIS) and society (Weiner et al. 2001). The plea for the development of methodologies implies some shortcomings in the current state of knowledge on participatory decision-making and begs the question: “What are the main obstacles to successful implementations of participatory decision-making supported by geographic information technology?”
Many examples of community development projects in-volving public participation from around the world suggest that cultural and political context rather than hardware and software are the main obstacles to successful public participation in deci-sion-making (Craig et al. 2002). This may be true for participatory decision-making situations employing relatively simple informa-tion tools. Yet there are many other spatial decision situations where the success of a participatory approach requires both a good understanding of cultural and political context and more efficient, effective, and equitable information and communication tools. In these types of situations, there is a lack of operational knowledge to guide the selection of information tools appropriate for the task at hand. Insufficient knowledge also extends to the influence of culture and political systems on shaping feasible forms of participation. One example of the importance of knowing how different cultural and political contexts influence what works and what does not work in adopting a participatory approach to a decision-making process is work by Renn et al. (1995), which is based on ideas articulated in a National Research Council report entitled Understanding Risk (1996). In that study, Renn presented the results of evaluating one specific model of public participation
Toward a Framework for Research on Geographic Information-Supported Participatory Decision-Making
Piotr Jankowski and Timothy Nyerges
Abstract: This article offers a framework for evaluating geographic information technology applied in the context of participa-tory problem solving and decision-making. The framework consists of constructs and detailed aspects describing significant issues of participatory decision-making. Constructs reflect the structure, while aspects address the content of participatory decision-making. Aspects are tied through premises, which present fundamental statements about the nature of convening, process, and outcome phases of decision-making. The power of the framework lies in linking premises with research questions and testable hypotheses, which can be formulated on the bases of research questions. Empirically based testing of hypotheses leads in turn to verification of theoretical framework and to design guidelines for future uses of geographic information technology in participa-tory decision-making.
in environmental decision-making called the “analytic-deliberative process.” The model involves three consecutive steps:1) identification and selection of concerns and evaluation
criteria;2) identification and measurement of impacts and consequences
related to different policy options; and3) conducting a discourse with randomly selected citizens as
jurors and representation of interest groups as witnesses.
This model was applied with different results in Germany, Switzerland, and the United States. While participants in Ger-many and Switzerland were grateful for the invitation to par-ticipate, U.S. participants distrusted prefabricated participation models and suspected hidden agendas with such an approach. This underscores the cultural differences that come into play in participatory decision-making. Renn concluded that the success of public involvement in the U.S. would depend on securing approval of the process by the affected communities before that process is put into play. Based on multiple empirical studies in Europe and North America, Renn also concluded that discursive/participatory processes needed a structure that assures the integra-tion of technical expertise, regulatory requirements, and public values. Other authors (for example, Pickles 1995) postulated that participatory decision-making should become a tool of politi-cal discourse challenging the instrumental logic of the existing practice of decision-making. This, according to Pickles, may require using a different logic than a normative approach to the decision-making process. Shiffer (1995) saw the promise of Inter-net-based participatory decision-making, but at same time admits potential difficulties arising from involving computer-technology challenged people and differential understanding of information presented through virtual images and map-based representations. Weiner et al. (2001:13) expressed belief in potential contributions of public participation geographic information systems (PPGISs) stating that “Future PPGIS academic research can thus contribute

10 URISA Journal • Vol. 15, APA I • 2003 URISA Journal • Jankowski, Nyerges 11
significantly to geography and to the social sciences in general.” This statement is somewhat tempered by their earlier concern “…that academics engaged with PPGIS will tire and fall back to their familiar role as researchers. In such cases, PPGIS has the potential to become another form of community exploitation” (Weiner et al. 2001:9). This seeming inconsistency underscores the tension resulting from the interdisciplinary character of in-quiries about the access to and the participatory use of geographic information. Applications and research about participatory deci-sion-making are rooted both in social-behavioral sciences and in broadly defined information science and technology. This is a reflection of what geographic information-supported participa-tory decision-making is about – open and transparent access to spatially enabled data and information handling tools for people interested in place-based problem solving and decision-making in a specific socio-political context. This ad hoc definition dem-onstrate the complexity of the subject.
The Need for a Framework Characterizing Participatory GIS Use Any successful implementation of participatory decision-making requires the knowledge of people who are involved in the deci-sion-making process, plus their values and expectations. Imple-mentation requires data and information about the problem at hand – both scientific and non-scientific – representing individual experiences and the collective wisdom of participants. It requires an understanding of socio-political influence on power and con-trol. Last, but not least, implementation requires data processing and communication tools.
The range of tools that may be appropriate in a given decision problem context ranges potentially from push-pin maps to such high-tech structures as virtual reality visualization environments. But how is one to know whether a given problem situation is a
Figure 1. EAST-2 framework consisting
of convening, process, and outcome constructs (including example aspects) plus
the respective premises provides a conceptual
map for understanding a participatory decision
process.

10 URISA Journal • Vol. 15, APA I • 2003 URISA Journal • Jankowski, Nyerges 11
good candidate for a participatory approach and, if so, which information and communication tools are appropriate for the task at hand? There is a clear need for a knowledge base about when, in what context, and how one should apply participatory approaches to spatial decision problems and which information and communication technologies should be employed in support of such participatory approaches.
Developing such a knowledge base requires a systematic approach to empirical studies of participatory approaches to place-based decision-making. Empirical studies are potentially the main source of knowledge guiding further development and applications of participatory decision-making. In order to develop the knowledge base, it is necessary to understand the social-behav-ioral implications of information and communication technolo-gies applied in a spatial problem-solving context. Unfortunately, anecdotal evidence about the implementations of participatory decision-making supported by geographic information technol-ogy, although good for sharing experiences and telling stories, is not sufficient to understand the complexity of information technology intertwined with human perceptions and understand-ings of spatially represented information in various social-political contexts. Without a systematic knowledge of participatory use of GIS and other information and communication tools based on social-behavioral research, poor designs of geographic information technology-supported public participation are likely to be repro-duced again and again and to have (sometimes unintended) social implications for efficiency, effectiveness, and equity. If anything, an approach based on anecdotal evidence rather then on system-atic research framework may lead to community exploitation.
Without a systematic approach to researching participatory decision-making, stories and experiences are difficult to integrate; hence we are less likely to accrue “knowledge about use.” Nyerges et al. (2002) proposed one such approach that may be helpful in developing empirical evidence about the use of participatory GIS (PGIS). The approach is based on social-behavioral research on the uses of PGIS consisting of three stages: planning, implementa-tion, and corroboration. Each stage involves a balance among three research domains: substance, theory, and methods. From this ap-proach, a rigorous methodological framework consisting of problem articulation, treatment mode selection, data gathering strategy, data analysis strategy, and reporting strategy can be derived for empiri-cal studies about substantive problems. A theoretical foundation to back up that methodological approach is Enhanced Adaptive Structuration Theory (EAST). The theory provides constructs and premises that help to interpret how people make use of PGIS in a given problem context and elucidates the elements involved in structuring human–computer-human interaction.
Enhanced Adaptive Structuration Theory (EAST) The most recent version of the framework, called EAST-2, con-sists of a set of eight constructs detailed in terms of 25 aspects (the elements of the conceptual domain) that describe significant
issues for characterizing group decision-making (Jankowski and Nyerges 2001a). The seven premises of EAST-2 describe the rela-tions among the eight constructs (Figure 1; the seven premises are numbered from P1 through P7 and the eight constructs are depicted in the respective eight boxes). The structuration process of what/who influences what/who is the embedding context for EAST-2. Neither technological nor social character of an organi-zation predominates in change – they work together to structure and, hence, reconstruct each other – the fundamental idea un-derlying “adaptive structuration.”
The organization of constructs in EAST-2 reflects an organi-zation of participatory decision-making process. The constructs are grouped into convening, process, and outcome categories.
Constructs about Convening a Participatory SituationThree constructs consisting of 11 aspects characterize the con-vening influence about a decision situation when information technology is involved.
Construct 1: Social-Institutional Influence. Social-institutional influence is usually based in law, mandate, policy, social norm, or natural events (i.e., influences commonly outside the control of any single individual). One aspect of social-institutional influ-ence is power and control, which refer to the entitlements that are granted by formal or informal mandate (e.g., laws and regulations or special interest group awareness). Whether specific participant groups intend to exercise their power is a concern to all participant groups (Susskind and Field 1996).
A second aspect of social-institutional influence is subject domain. Sharing an interest in subject domain is what principally brings people together into participatory decision processes. Many decision problems from the domain of environmental and land management contain intangibles that cannot be easily quantified, and their structure is only partially known or is burdened by uncertainties. These problems require the participation of people representing diverse areas of competence, political agendas, and social values. Environmental and land management problems are characteristic of at least three kinds of uncertainty, which adds to the complexity. One type of uncertainty relates to knowledge about the natural environment (i.e., what we don’t know about natural processes and the influences that humans might have in such processes). A second type of uncertainty is about the inten-tions in related fields of choice from a technical perspective (i.e., is one solution technically better than another). A third type of uncertainty is about values (i.e., which valued concerns in society are those that should be pursued), often at full awareness that we cannot pursue all values of concern. Beck (1992) observed that major social conflict in western societies has become centered on the distribution and tolerability of risks for social groups, regions, and future generations, leading to the label of “risk society.” With such interests running high, environmental problems thus lead to a democratic dilemma for at least two reasons. First, allocat-

12 URISA Journal • Vol. 15, APA I • 2003 URISA Journal • Jankowski, Nyerges 13
ing resources to address such problems require that we consider possible redistributions of such resources. Second, there are multi loci of relevant knowledge with which to make such decisions (Coenenet al. 1998).
A third aspect of social-institutional influence involves the persons, groups, and/or organizations as convener of participants. The convener can potentially exert fundamental influence in set-ting a topic and direction for discussion, and might also be the party that acts as the facilitator for the participatory decision process. The influence of the convener can be amplified or di-minished, depending on the organizational and technological arrangements of decision process.
A fourth aspect of social-institutional influence is choosing the number, type, and diversity of participants that are brought together to address a problem. Access to the discourse in terms of giving voice to all groups who are impacted by a complex problem situation sets up an ironic dilemma. The larger the group with different interests being convened, the more opportunity for conflict. Thus, it is perceived that more interests means longer solution times. However, when all interests are not convened at the beginning of a process, there is more opportunity for challenge at completion of the process (perhaps in the form of a law suit). Thus, even though convening more groups in the short-run might appear to extend a process, not convening the appropriate groups sets up the risk of having the deliberation fail through continual challenges (Susskind and Field 1996).
A fifth aspect of social-institutional influence (not reflected in Figure 1) comes from a collection of rules and norms as social structures among participants. Such structuring influences the modes of participation in a public decision process. The modes of participation are in turn adopted as a matter of expectations for communication, cooperation, and collaboration.
Construct 2: Group Participant Influence. One aspect of group participant influence deals with participants’ expectations-based values. Values set the stage for participant perspectives about ex-pected benefits and outcomes. Different perspectives on values lead to differentiating between the facts that get stored in GIS and the social values used to interpret the facts. In participatory decision processes, values get often exemplified as concerns. Par-ticipants’ interpretations of the effectiveness in decision-making depend on how their concerns are addressed during the decision-making process.
A second aspect of participant influence, participants’ views/knowledge of the subject domain and each other, mainly involves how participants approach the importance of the topic and how they approach each other in terms of “friendship” or “enemy” feelings. Stakeholder views develop as a result of experience and educational background with topics; people build for themselves a frame of reference for particular issues and they sometimes share them. Frames of reference are anchored by “reference points” (i.e., familiar information elements that are used as a basis for interpreting material and each other’s backgrounds). Often, it is because of the similarities and differences in world views and
values, experience and trust, and knowledge and expertise that people align themselves into stakeholder groups; world views and values are more important to the alignment, experience and trust are next, and knowledge and expertise are less important. The difference in stakeholder perspective leads to different values, objectives, and criteria being articulated as the basis of solutions of group-influenced problems.
A third aspect concerns participants’ trust in the process. Because in many cases the public is disillusioned with the politi-cal process, participation in collaborative decision efforts is on the rise. A fourth aspect of participant influence comes from participants’ beliefs and feelings about technology. The emotive issues for GIS technology are often under studied, but in some cases may be as important as the technology itself. Feelings and beliefs are likely an important aspect of reinforcing a person’s experience with technology. Such experiences encourage and/or hinder expressing ones interest in considering new ways of ac-complishing tasks.
Construct 3: Participatory GIS Influence. One aspect of social-technical information structuring deals with the combination of place, time, and channel of communications. Whereas rules and norms for social structuring are social-institutional aspects of participation, different types of meetings structured in terms of place, time, and communication channels also have an impact on who says what and when during participation in a decision situation. The physical (or virtual) setting of a place has a signifi-cant impact on whether people attend a discussion. Being able to attend a meeting due to scheduling (distance and timing) con-straints is a fundamental concern in participation. More local and more frequent meetings do not always enhance the opportunity to participate, since more time away from some other activity (perhaps work) is not always as convenient. It is for that reason that technology-supported meetings have been on the increase to open channels of communication.
A second aspect of social-technical information influence involves the availability of social-technical structures as informa-tion aids. These structures provide information aids to support the participatory effort. Three types of information aids are of-ten integrated into a spatial decision support system. These are cartographic visualization tools, spatial and attribute data query tools, and analytical models. Computer-mapping techniques implement cartographic visualization tools. Spatially referenced database management systems implement spatial and attribute data query tools. Spatial analysis techniques support analytical model development, and decision analysis techniques make use of the results of spatial analysis to introduce evaluation of multiple alternatives for decision-making. A spatial decision support system integrates those techniques in a computerized, analytical environ-ment that supports participants in their search for solutions.
12 URISA Journal • Vol. 15, APA I • 2003 URISA Journal • Jankowski, Nyerges 13
Constructs and Aspects of the Participatory ProcessThe central box in Figure 1 represents an expanded view of a participatory decision process flowing from appropriation (con-struct 4), decision process (task) management (construct 5), and emerging information (construct 6), and back to appropriation and so forth around.
Construct 4: Appropriation. Appropriation is the act of invoking a structure, whether the act is one time or continual (DeSanctis and Poole 1994). Continual appropriation of the same structure can be called “use” but does not include the act of continual use once invoked. Various appropriation acts structure the character of the information use. One aspect of appropriation involves social-institutional influences (i.e., appropriating at any time any one or more of the five aspects of social-institutional influences).
A second aspect of appropriation concerns appropriation of participant influence. When participants are recognized by others in the participation process, then they provide voice to certain concerns. These might be concerns important to interested and affected parties, concerns of clarification from technical special-ists, and/or concerns of allocating a redistribution of resources by managers or decision makers. Participants as the “agents of change” in conversation introduce information about concerns based on their trust with the process of getting a “fair voice.” Sometimes that information is introduced through the use of GIS technology based on their belief that such technology treats information in a way that suits their need for information.
A third aspect of appropriation deals with appropriation of participatory GIS influence. We know little about place, time, and communication channel influences on information use in geographic problem solving and decision-making. Most people recommend anytime, anywhere access, as this covers all situations. However, the advantages and disadvantages to the various forms of place and time meetings when map information is being dis-cussed are not known. In addition to physical settings, we know little about how information technology can be put to best use under different types of participatory process methods. There is an inherent tradeoff between sophistication (representational and analytical power) and ease of use of decision support tools. More sophisticated tools are often more challenging to use, despite the enormous effort put into making tools “user friendly.” This tradeoff becomes even more significant when the users of deci-sion support tools are people of various educational and cultural backgrounds. A non-specialist approaching GIS software often naively expects to work with a set of virtual maps that portray an “objective, shared understanding” about the world. However, GIS has roots in many disciplines and its effective use requires a considerable knowledge, suggesting that there are “multiple realities” to be portrayed.
Construct 5: Group Process. One aspect of group process con-cerns idea exchange as social interaction. Renn et al. (1995) used
Habermas concept of communicative competence to characterize the ability of participation strategies to support different types of discourse, providing participants with an ability to exchange ideas. Four types of discourse were characterized: explicative, theoretical, practical, and therapeutic. Explicative discourse involves terms, definitions, grammar, and the everyday use of language; the par-ticipatory process should allow conversations that make reference to worldly events in everyday language. Theoretical discourse involves references to scientific studies as in an objectified world; the participatory process should also allow reference to the detail of the nuances of complex problems described in terms of techni-cal (discipline-based) language. Practical discourse involves social needs and the appropriate forms (norms) of social interaction; the participatory process must support social interaction that develops out of conventions people know from their everyday experience. Therapeutic discourse makes reference to the subjectivity of a speaker in terms of sincerity and authenticity of claims. Conflict is undoubtedly going to arise in complex situations where values differ. Coping with those conflicts can be handled by permit-ting therapeutic discourse. How geospatial information tools can support these different styles of communication in order to encourage certain types of participatory process for certain types of problem tasks, effecting certain types of outcomes, is still a matter of empirical research.
A second aspect of group process focuses on participatory task flow management, which concerns the structuring into stages, steps, or phases, either from a pre-determined agenda, an open agenda, or a mixture of both. Renn et al. (1995) characterized the fairness of participation strategies in terms of three criteria: agenda and rule making, moderation and rule enforcement, and discussion. Agenda and rule making deal with who participates in setting the agenda and the rules by which the group will in-teract. Moderation and rule enforcement deal with whether the group process is facilitated and whether a facilitator enforces the rules that have been established. Discussion involves the degree to which all who are impacted by the decision have a voice in the process. A group process that is fair is a basic tenant in a direct democracy. Few complex public-private problems are addressed through direct democracy; more of them are addressed through a representative democratic process. However, one of the major issues seems to be that representative democracy is not function-ing as it once did. Thus, participatory decision situations appear to be on the rise.
A third aspect of group process is the behavior of participants toward each other. This concerns the working relationships that develop as ideas are exchanged and the decision process proceeds. Stakeholder behavior involving conflict has been studied, and idea differentiation and integration are both important (Susskind and Cruikshank 1987, DeSanctis and Poole 1994). Obermeyer and Pinto (1994) see the introduction of GIS as encouraging more conflict between groups rather than less conflict. Jankowski and Nyerges (2001b) investigated group conflict in decision support for habitat redevelopment site selection and found that maps are less likely to be associated with discussion conflict than tables
14 URISA Journal • Vol. 15, APA I • 2003 URISA Journal • Jankowski, Nyerges 15
– a table being more an analytic display for priority ranking of habitat sites than a map.
Construct 6: Emergent Influence. One aspect of this construct is the emergence of social-technical information influence. Although various technological capabilities are provided by software and hardware as per the design of a system, certain other emerging structures might come to light during the treatment of informa-tion. The emergence of social-technical structures such as new map designs or database designs might help a group with further information structuring. However, such emergence could make information easier or more difficult to understand in the longer term. Consequently, the emergence of social-technical informa-tion structures has a rather significant impact on what information a group treats from activity phase to activity phase (DeSanctis and Poole 1994).
A second aspect of this construct is the emergence of group participant influence. A better understanding of values, goals, objectives, and beliefs are bound to come to light through par-ticipant conversation. Participants might clarify their own per-spectives and/or the perspectives of others in regard to values, goals, objectives, and beliefs. Views of each other in regard to respectful opinion of what others have to say will undoubtedly get refined. Trust in each other might change as a result of ideas being exchanged. Those who encourage use of technology can have an impact on the feelings that participants develop in regard to its continual use. Feelings for people and technology might well be connected.
A third aspect of this construct is emergence of social-institu-tional influence. This deals with how rules or norms are brought into use and eliminated or reinforced during the decision process. Clarifying mandates and the problem at issue can lead to refocus-ing activity for any particular task. In regard to agendas, one can choose to make use of rules to keep the conversation on track or to de-rail it. The emergence of new rules about how people communicate during the participation will change the course of the interaction.
Constructs and Aspects about Participatory OutcomesTwo constructs are part of the participatory outcomes in EAST-2: task outcomes and social outcomes.
Construct 7: Task Outcomes. Two aspects appear to be fun-damental in regard to task outcomes. One aspect is character of decision outcome. Because decision outcomes tend to be so diffuse, depending on the circumstances of the participatory ef-fort, a reasonable approach is to focus on process rather than outcomes. Multiple characteristics of decision processes such as fairness, transparency, efficacy, and inclusiveness can contribute to effectiveness of participatory decision-making.
The second aspect linked to task outcome concerns deci-sion outcome and participant structuring dependence. The
major concern is the stability of an outcome based on whether it lasts beyond the duration of decision-making process. Several researchers suggest that “decision sustainability” is a pragmatic, substantive criterion that could be used to evaluate the quality of decision outcomes. Decision sustainability involves the abil-ity to manage worldly events in such a way as to preserve the “validity” of the decision without having to overturn the action that was decided.
Construct 8: Social Outcomes. One aspect that concerns social-institutional outcomes deals with whether there is an opportunity for challenge of the outcome. The degree to which any decision issue is final and whether it can be changed through further con-siderations is rather important to promote the results of a process. Some of the participation processes facilitate the opportunity for challenge, whereas others prohibit it outright. Risky deci-sions should always be amenable to challenge if new and better information arises.
A second aspect of this construct concerns the reproduction and temporality of the group participant structuring. This aspect deals with the stability and longevity of the social relationships among group participants, particularly as promoted in multiple meetings (DeSanctis and Poole 1994). Successful participation can spread through decision processes far beyond the immediate and direct. This is one place where the possibility of participa-tion-based learning supported by GIS could be considered. The impact of participation-based learning about decision-making would seem to be a fertile subject for more in-depth research.
A third aspect of this construct concerns the reproduction and temporality of social-institutional structuring. Such structur-ing in regard to changing mandates for power or control is only likely to occur over repeated projects – either successes or failures. However, continued successes with projects encourage similar projects to be addressed in the same way, whether this involves the task domain and/or the way that participants are convened.
Eight constructs with the respective 25 aspects presented above likely constitute the single largest enumeration of issues concerning decision-making within a geographical context. In addition, each aspect can spawn several variables when making the EAST-2 operational, ultimately contributing to the compre-hensive nature of EAST-2. The above constructs and aspects, together with respective variables, are but concepts that in and of themselves can be used only for developing a “task description” of each macro-phase in a decision situation. It is the premises connecting these constructs, aspects, and variables that turn a conceptual framework into a theory.
Premises of EAST-2Premises are fundamental statements that tie each aspect on one side of the premise to an aspect of the other side. Premises motivate one or more research questions (as, for example, in Table 1) which, when phrased in terms of variables, can be considered hypotheses (propositions) about the dynamics of a decision situation. The research questions presented in Table 1 are a few examples of ques-

14 URISA Journal • Vol. 15, APA I • 2003 URISA Journal • Jankowski, Nyerges 15
Premises Research Question Motivated by Respective Premise Convening Premises Premise 1. Social-institutional influences affect the appropriation of group participant influences and/or social-technical influences.
- In what way does the purpose of a decision task influence the types of geographic information structures (e.g., maps, tables, diagrams) appropriated by the participants?- In what way does the organization that convened the decision situation in combination with the diversity of participants influence the type of group participant structuring?
Premise 2. Group participant influences affect the appropriation of social-institutional influences and/or social-technical influences.
- How do the different perspectives such as those oriented to policy/decision maker, technical/scientific specialist, and interested and affected party influence the types of geographic information structures appropriated?- What types of social-technical information structures appear to be linked to differences in participant structuring?
Premise 3. Participatory GIS influences affect the appropriation of social-institutional influences and/or group participant influences.
- How does each of four meeting venues influence the generation of information structures (e.g., maps, animations, tables, and text narration) useful for understanding spatial criteria that can be processed with a GIS?- How do the social-technical capabilities of software get appropriated across meetings in relation to participants’ trust in the group agenda which represents a plan for the process?
Process PremisesPremise 4. Appropriation of influences affect the dynamics of social interaction described in terms of group processes.
- What types of geographic information structures are appropriated during the different intensities of participation that seem to facilitate an analytic-deliberative process and which information structures seem to hinder the process?- Appropriation of what types of group participant structures has what type of influence on group process?
Premise 5. Group processes have an affect on the types of influences that emerge during those processes, and emergent influences affect the appropriation of influences.
- What kinds of geographic information structures emerge during the different levels of participation in an analytic-deliberative process?- What emergent structures influence the type of appropriation that is undertaken?
Outcome Premises Premise 6. Given particular influences being appropriated, if successful appropriation occurs and group processes fit the task, then desired outcomes result.
- Given that a group appropriates a particular type of information structure that has been found to be useful in the past, and if the information structure is appropriated during “specific conditions,” can we expect the outcome from the process to be satisfactory to all participants?- What structure appropriation under what conditions of group process appear to affect the dependence of the decision outcome on group participant structuring?
Premise 7. Given particular influences being appropriated, if successful appropriation occurs and group processes fit the task, then reproduction of social-institutional influences result.
- In what way are various social-institutional structures together with group participant structures linked to the opportunity to challenge the task outcome?- How do inter-organizational protocols and the social interaction during group process promote or discourage further group work?
Table 1. Example Research Questions Motivated by Premises in Enhanced Adaptive Structuration Theory
tions that could be posed. Each premise is a general statement, and each premise statement consists of a subject construct related to an object construct. Hence, each research question asks something about how a subject aspect relates to an object aspect, thus many different questions could be posed. In the context of empirical, social-behavioral research on participatory decision-making, we could say: “how does one variable relate to another variable?”
The seven premises in EAST-2 presented in Table 1, together with the respective example questions, indicate that a wide va-riety of interesting, empirical research opportunities exist with regard to the use of GIS in participatory settings. Articulating social-behavioral explanations by way of the premises and the research questions they motivate is intended to lead to a “deeper
understanding” about the impact of software designs on GIS support of participatory decision-making. Addressing any one or more questions among such a wide variety of questions is a considerable challenge.
The challenge “begs” for a systematic approach to empirical social-behavioral research so that we can better understand of how empirical results relate to each other in our attempts to build knowledge about the implications of PGIS use. Such a systematic approach is particularly important when trying to understand the nuances of “participation models” (e.g., the three-phase participa-tion model set forth by Renn et al. (1995) as described above). Jankowski and Nyerges (2001a) outline 18 research strategies that could be used to unpack the “process relationships” in such

16 URISA Journal • Vol. 15, APA I • 2003 URISA Journal • Jankowski, Nyerges 17
a model. Choosing among research settings (field, lab, or field-lab), among treatment modes, among data collection instruments, and among data analysis approaches are all important, and thus impact the nature of the empirical evidence derived.
ConclusionParticipation models can help us organize the way we think people interact during work in participatory settings. Empirical studies of participation models that help organize our understanding of the use of participatory GIS are an activity that can contribute to “participatory geographic information science.”
Although participation models abound in the literature, we have little understanding about the efficiency, effectiveness, and equitable benefits and costs of how different models structure par-ticipant interaction. When placed in the context of participatory GIS use, we have even less knowledge of such issues. An organizing framework for arraying the multiple constructs (and correspond-ing detailed aspects) of a participatory situation is beneficial in helping to organize the kinds of research questions that can be examined. The Enhanced Adaptive Structuration Theory as an organizing framework suggests that people structure situations; in turn, situations structure people’s interaction. Technology enables, but it also constrains – thus the need for a systematic approach to empirical studies of such situations.
A wide array of empirical research strategies exists. The 18 strategies outlined in Jankowski and Nyerges (2001a) are compared to each other to provide a sense of what each strategy might contribute to such empirical investigations. Having an understanding of how one strategy differs from another, and hence why we might use one research design rather than another to examine a single participation model or to compare participa-tion models would help us build knowledge in a systematic way. Only through systematically comparing evidence from a variety of research approaches will we gain an overall sense of how and why one participation model in comparison to another provides us with efficiency, effectiveness, and equity advantages and dis-advantages. As there is little empirical evidence at this time to point to these advantages and disadvantages, there is considerable opportunity for empirical research to help develop a geographic information science of PGIS use.
About the Authors
Piotr Jankowski is Professor of Geography at the Department of Geography, University of Idaho. He is also a Professor of Geo-informatics at the Institute for Geoinformatics, University of Muenster. His teaching and research areas include models and methods for spatial problem solving and collaborative decision-making.
Corresponding Address:Department of Geography,University of IdahoPiotr JankowskiMoscow, ID 83844-3021, [email protected]
Timothy Nyerges is Professor of Geography at the Department of Geography, University of Washington. His teaching and research areas include GIS design and social-behavioral stud-ies of collaborative, geospatial decision problem solving.
Corresponding Address:Department of GeographyUniversity of WashingtonTimothy NyergesBox 353550Seattle, WA, 98195, USA, [email protected]
References
Beck, U., 1992, From Industrial Society to the Risk Society: Ques-tions of Survival, Social Structure and Ecological Enlighten-ment. Theory, Culture and Society, 9(1):97-123.
Coenen, F.H.J.M, D. Huitema, and L.J. O’Toole, 1998, Participa-tion and Environment. In Coenen, F.H.J.M, D. Huitema, and L.J. O’Toole (Eds.) Participation and the Quality of Environmental Decision-Making (Dordrecht: Kluwer Pub-lishers), 1-20.
Craig, W.J., T.M. Harris, and D. Weiner (Eds.), 2002, Com-munity Participation and Geographic Information Systems. (London: Taylor & Francis).
DeSanctis, G. and M.S. Poole, 1994, Capturing the Complexity in Advanced Technology Use: Adaptive Structuration Theory. Organization Science, 5(2):121-147.
Jankowski, P. and T. Nyerges, 2001a, GIS for Group Decision-Making (London: Taylor & Francis).
Jankowski, P. and T. Nyerges, 2001b, GIS-Supported Collabora-tive Decision-Making: Results of an Experiment. Annals of the Association of American Geographers, 91(1):48-70.
National Research Council, 1996, Understanding Risk: Inform-ing Decisions in a Democratic Society (Washington, D.C.: National Academy Press).

16 URISA Journal • Vol. 15, APA I • 2003 URISA Journal • Jankowski, Nyerges 17
Nyerges, T., P. Jankowski, and C. Drew, 2002, Data Gathering Strategies for Social-Behaviour Research about Participatory Geographic Information System Use. International Journal of Geographical Information Science, 16(1):1-22.
Obermeyer, N. and J. Pinto, 1994, Managing Geographic Infor-mation Systems (New York: Guilford).
Pickles, J. (Ed.), 1995, Ground Truth: The Social Implications of Geographic Information Systems (New York: Guilford).
Renn, O., T. Webler, and P. Wiedemann, 1995, Fairness and Competence in Citizen Participation: Evaluating Models for Environmental Discourse (Dordrecht: Kluwer Academic Publishers).
Schiffer, M., 1995, Issues of Collaborative Spatial Decision-Support in City Planning Context. In Densham, P.J., M.P. Armstrong, and K. Kemp (Eds.) Report from the Specialist Meeting on Collaborative Spatial Decision-Making, Initia-tive 17. Santa Barbara, CA: National Center for Geographic Information and Analysis.
Susskind, L. and J. Cruikshank, 1987, Breaking the Impasse: Consensual Approaches to Resolving Public Disputes (New York: Basic Books).
Susskind, L. and P. Field, 1996, Dealing with an Angry Public (New York: The Free Press).
Weiner, D., T.M. Harris, and W.J. Craig, 2001, Community Participation and GIS. Workshop on Access and Partici-patory Approaches in Using Geographic Information in Spoleto, Italy. http://www.spatial.maine.edu/~onsrud/Spoleto/Keynotes.htm

URISA Journal • Wehn de Montalvo 19

URISA Journal • Wehn de Montalvo 19
Introduction1
With the increasing use of the geographic information system (GIS) in industrialized and developing countries, the availability of spatial data has become an issue that affects many organizations. Spatial data initiatives are reliant on the willingness of different organizations to engage in spatial data sharing in order to be effective in overcoming bottlenecks in the availability of spatial data. An important role of spatial data initiatives involves more than the coordination and development of metadata, clearing-houses, and standards components. The important aspect that can be expected to vary considerably for each national initiative is the existence or the fostering of a data sharing culture (Clarke et al. 1998) that encourages participation in spatial data sharing. The purpose of this article is to demonstrate that the Theory of Planned Behavior can be applied as an organizing framework for policy-oriented research to identify the motivations and obstacles of different groups of actors to engage in spatial data sharing.
This article is organized into three parts. In search of rigor-ous models to better understand spatial data sharing, the first section reviews research on spatial data sharing and examines the relevance of decision-making research, and of the Theory of Planned Behavior in particular, for the issue of access to geo-graphic information and spatial data sharing. The second section discusses the components of this theory, notes the contribution that its application can make to research on spatial data sharing, and considers the appropriate unit of analysis. The third section demonstrates the results that can be generated using the Theory of Planned Behavior as an organizing framework for research on spatial data sharing. Thus it is possible to identify–empirically–the fundamental factors underlying a disposition to engage in spatial data sharing within a specific community of actors (i.e., national or regional). For policy makers, these insights can provide a ba-sis for the formulation of appropriate mechanisms to encourage spatial data sharing behavior.
Behavioral Models and Research on Spatial Data SharingThe growing importance of spatial data availability and data ac-cess for the effective use of GIS has begun to generate a branch of research that focuses directly on the issue of spatial data sharing. Several contributions have been made to gain an understanding why organizations may or may not wish to engage in spatial data sharing. The factors that have been considered are mostly con-ceptualized in terms of facilitators and constraints (Stage 1995, Tosta 1995), costs and benefits (Alfelor 1995, Dangermond 1995, Dueker and Vrana 1995), or antecedents and consequences (Obermeyer and Pinto 1994, Pinto and Onsrud 1995) of spatial data sharing. Several models have been advanced in this field of research, and this section considers their strengths from a meth-odological perspective.
The conceptual framework for spatial data sharing across organizational boundaries proposed by Obermeyer and Pinto (1994) combines a number of variables as facilitators and inhibi-tors, and as outcomes. These variables consist of the antecedents that may improve the likelihood of creating positive, collaborative relationships between organizations and of the consequences of spatial data sharing. Although Obermeyer and Pinto claim that the variables in the model have been drawn from organization theory, intergroup dynamics, exchange theory, and political-economy, a major limitation of this framework is the lack of a justification for the inclusion of these factors in the model and for the exclu-sion of other factors.
Kevany (1995) proposed a structure for observing spatial data sharing by exploring the factors and conditions that may create a conducive environment for sharing. These factors consist of: a) sharing classes; b) project environment; c) the need for shared data; d) the opportunity to share data; e) the willingness to share data; f ) the incentive to share data; g) the impediments to sharing; h) the technical capability to share; and i) resources for sharing. A number of measures for each of the factors are proposed in order
In Search of Rigorous Models for Policy-oriented Research: A Behavioral Approach to Spatial Data Sharing
Uta Wehn de Montalvo
Abstract: This article introduces a theory from social psychology as an organizing framework for policy-oriented research on spatial data sharing. The article demonstrates how, using this approach, the incentives and disincentives that determine the intention of key individuals within organizations to share spatial data can be identified in a systematic fashion. With a view to methodologi-cal considerations, the article reviews research on spatial data sharing and examines the relevance of decision-making research for this field. It considers the contribution of the Theory of Planned Behavior to research on spatial data sharing and identifies the appropriate unit of analysis. Actual results that have been generated using the Theory of Planned Behavior for research on spatial data sharing are presented. These findings can form a profile of perceptions that provides a basis for addressing the issue of spatial data sharing more effectively at the policy-making level. Conclusions are drawn on the relevance of this behavioral approach to research on spatial data sharing.

20 URISA Journal • Vol. 15, APA I • 2003 URISA Journal • Wehn de Montalvo 21
to determine the probability of successful sharing. Although very comprehensive, Kevany’s method of analyzing the environments for spatial data sharing has several limitations. There is no explicit basis for the inclusion of the factors, nor is there a basis for con-ceptualizing the likely relationships between these factors. The factors are derived on the basis of the author’s personal insights and experiences with GIS design, implementation, and operation projects. Hence, there is no organized framework in which to analyze the relevance of these factors. Moreover, the framework proposed by Kevany has not been verified empirically.
Azad and Wiggins (1995) proposed a research framework that focuses on inter-organizational dynamics. The central tenet of their framework is autonomy. Azad and Wiggins assume that sharing results in a loss of autonomy and increased interdepen-dence of organizations, and they argue that these consequences are at odds with the organizational goals. These are the principle obstacles to spatial data sharing that have to be addressed. Their framework consists of a typology of inter-organizational spatial data sharing and the reasons for the development of inter-orga-nizational relationships. In addition, Azad and Wiggins argue that the likelihood of establishing inter-organizational relations is related to the intensity of the relationship and the loss of orga-nizational autonomy required by the relationship. Finally, they propose a process model to manage the development of inter-organizational relations for spatial data sharing.
The starting point for the Azad and Wiggins framework is open to question. The assumptions that, firstly, spatial data sharing necessarily leads to a loss of autonomy and increasing interdependence among organizations and that, secondly, these consequences are inherently negative from an organization’s point of view have not been subject to empirical confirmation. Similar assumptions about the nature of the power of, and control over, spatial data are embedded in much of the literature as indicated by the following:
Because geographic information has potential value to those with effective access to it, this realization gives rise to the desire to exercise ownership rights over the information. Thus, the power that information provides is antipathetic to sharing. (Onsrud 1995:293)
If we agree that the possession of [spatial] information serves as a source of control for individuals and organizations, then we are faced with questions about the ways in which organizations can be induced to relinquish this control. (Obermeyer and Pinto 1994:107)
In contrast, in this article it is argued that it is not possible to presume the obstacles to sharing a priori. Instead, they should be the subject of empirical verification. As Pinto and Onsrud (1995:48) suggested; “... little is known, for instance, about the reasons why governmental agencies and other GIS-using organizations will or will not share GIS-related information.”
The point of departure for research into whether and why individuals within organizations may be willing to engage in spa-tial data sharing should be located one step back owing to: “... the potentially differing perceptions of the benefits from [spatial] data sharing” (Sperling 1995:391).
Perceptions may also vary with respect to the costs of, or obstacles to, sharing spatial data. The nature of these perceptions should not be generalized across organizations without recourse to an empirical investigation that permits validation of some of these assumptions and that provides a basis for generalization. Rhind (1998) provided a summary of the views of different players and stakeholders in spatial data and their agendas, which suggests that the perceptions of various actors from the public and the private sector may differ substantially in terms of finance and the dissemination of information, both in the short and in the long term.
Under “Research Initiative 9: Institutions Sharing Geographic Information” of the National Center for Geographic Information and Analysis (NCGIA) in the United States, a focus group con-sidered the organizational aspects of sharing (Batty 1992, Onsrud and Rushton 1992, 1996). The outcome is a two-dimensional matrix of organizational issues and organizational forms to mea-sure the degree and impact of spatial data sharing (Onsrud and Rushton 1992). Research in this case is directed to investigating the complexities of dynamic interactions at work in sharing ac-tivities. Similarly, Nedovic-Budic and Pinto (1999) proposed a conceptual framework, based on Kevany (1995) and a literature review, consisting of four general theoretical constructs, namely context, motivation, coordination mechanisms, and outcomes. In their subsequent research, they used case study and survey methods. In particular, the empirical research on the nature of interorganizational sharing arrangements (Nedovic-Budic et al. 2001) focused on sharing “clusters” of organisations. However, in both the Research Initiative 9 and the Nedovic-Budic and Pinto framework, the focus on actual incidents of sharing (albeit successful and unsuccessful sharing activities) limits the scope of the research to an investigation of the views of the “sharers.” “Non-sharers” are excluded and, hence, important insights into why individuals within organizations may not be willing to share cannot be captured.
In summary, the above discussion has raised two essential concerns about research on spatial data sharing. First, the deter-minants of whether and why organizations may be willing to engage in spatial data sharing with other organizations should be established empirically, they should not be assumed a priori. Second, the scope of empirical research should encompass the whole community of potential sharers involved in GIS and not just the actual “sharers.” If the fundamental factors underlying a disposition to engage in spatial data sharing can be identified, this can provide a basis for the formulation of appropriate mechanisms to encourage spatial data sharing behavior. In this article, it is argued that the Theory of Planned Behavior represents a robust and rigorous model from social psychology that can be employed to make the incentives for, and obstacles to, spatial data sharing the subject of empirical verification and that it will yield useful insights for policy. Furthermore, the empirical investigation based on the Theory of Planned Behavior can be designed to incorporate all potential “sharers.”

20 URISA Journal • Vol. 15, APA I • 2003 URISA Journal • Wehn de Montalvo 21
Theory-Driven Models in Decision-Making ResearchResearch into factors that influence human judgment and deci-sion-making provides a basis for exploring the issue of spatial data sharing from a perspective that focuses on the various positions that individuals in different organizations take toward spatial data sharing and on why they take these positions. The field of human judgment and decision making is interdisciplinary, drawing on contributions from economics, political science, organization and management studies, and social psychology. The starting point for much decision-making research is rational choice theory (Abelson and Levi 1985, Medin and Bazerman 1999), and much of the research has focused on the comparison of actual decision making with principles of rationality in decision making (Dawes 1998). Rational choice theory assumes that preferences and constraints affect behavior and that individuals optimize in some way (Opp 1999). The narrow assumptions about a fully informed, rational decision-maker have given way to the realization that cognitive as well as noncognitive factors influence the decision-making process (Keren 1996, Mellers et al. 1998) and that decision-makers are not necessarily fully informed. That perceived, subjective and not merely objective tangible constraints may be relevant. Constraints and preferences taken together, rather than individual constraints on their own, may explain behavior (Opp).
Distinguishing between the many different approaches to decision making are structural and process models (Abelson and Levi 1985)2. Structural models are concerned with what deci-sion-makers choose, while process models analyze the intervening steps in cognitive processes. A further distinction, although less clear, can be drawn between normative and descriptive models (Stevenson et al. 1990, Keren 1996). The former model considers how decision-makers should make decisions and the latter model how they actually do make decisions. In light of the overall goal to examine the nature of the conditions under which the different actors involved with spatial data are willing to engage in spatial data sharing, a structural, descriptive model is most appropri-ate. This enables an investigation of what decisions individuals within organizations actually do take with respect to spatial data sharing.
Fitting this requirement are prospect theory and expected value (EV) models. The prospect theory developed by Kahneman and Tversky (1979) takes into account contextual factors, but it assumes the existence of an idealized individual (Abelson and Levi 1985) and suffers from ambiguity (Yates 1990). Expectancy value models make no assumptions about rationality and instead rely on the internal consistency between the constructs included in the models (Ajzen 1996). Expectancy value models are not restricted to cognitive elements and allow for the inclusion of noncognitive factors such as emotions and desires (Ajzen).
Much behavioral decision research relies on revealed, ob-served preferences where probabilities and values have to be in-ferred from people’s judgments (Medin and Bazerman 1999). The contribution of social psychology to this field is the development
of direct measurements of perceived preferences and constraints (Jones 1985, Ajzen 1996, Opp 1999) which have been developed since the 1930s (Hogg and Vaughan 1995)3. The expectancy value models of attitudes used by social psychologists are employed here in order to provide a basis for analyzing the considerations that may underlie real-life decisions to share spatial data.
Attitude-Behavior ModelsResearch within the discipline of social psychology deals with decision making in the general context of predicting and explain-ing behavior, and research on attitudes is a central consideration within this body of work. Beliefs are understood as providing the subjective basis for individual’s decisions. The source of beliefs may be logical processes as well as emotions or desires (Ajzen 1996). Attitudes are assumed to reflect the beliefs that the deci-sion-maker holds (Eagly and Chaiken 1998), and the relationship between attitude and actual behavior is taken to be mediated by the intention to act (Fishbein and Ajzen 1975).
Several models of the attitude-behavior relationship have been developed that examine the beliefs that influence attitude formation. The framework for examining this relationship (which has received widespread attention in the literature) is that which has given use to expectancy value models that characterize the relationship between beliefs and attitudes. Expected values are said to be made up of subjective probabilities of outcomes and subjec-tive evaluations (positive or negative) of outcomes of a behavior. The most salient, the Theory of Reasoned Action proposed by Fishbein and Ajzen (1975), is most appropriate when behavior is subject to volitional control and, apart from attitudes, it contains a social norm component to capture situational constraints that may influence decisions. Ajzen (1991) extended the Theory of Reasoned Action to account for planned, more complex behaviors to formulate the Theory of Planned Behavior. Neither, the Theory of Reasoned Action nor the Theory of Planned Behavior assume that decision-makers necessarily engage in elaborate cognitive processes prior to taking action (Ajzen and Fishbein 1980, Ajzen 1991); instead, an individual has formed an attitude by thinking about the consequences of a given behavior and those attitudes or intentions can be retrieved and acted upon at a later time. The Theory of Reasoned Action and the Theory of Planned Behavior are not restricted to explaining the determinants of behavior in a specific behavioral domain; they can be used in a wide range of practical situations.4 Among the contending theories, the Theory of Planned Behavior framework is the most widely applied and tested with considerable proven explanatory and predictive value for many behaviors.
The Theory of Planned Behavior as an Organising Framework for Spatial Data Sharing ResearchThe Theory of Planned Behavior represents a sound theoretical framework to map out the belief structures underlying inten-tional behavior.5 Owing to the predictive power of the intention

22 URISA Journal • Vol. 15, APA I • 2003 URISA Journal • Wehn de Montalvo 23
construct, understanding the antecedents of intentions implies understanding the behavior. This section introduces the prin-ciples of the Theory of Planned Behavior. As stated above, the Theory of Planned Behavior (Ajzen 1985, 1988, 1991, 1996) is an extension of the Theory of Reasoned Action (Fishbein and Ajzen 1975, Ajzen and Fishbein 1980) and is most appropriate for the investigation of behaviors that are not assumed to be under volitional control (i.e., performance of the behavior is not only reliant on the intention to carry out the behavior but also on opportunities and resources (Ajzen 1988)). Spatial data shar-ing among different organizations cannot be assumed a priori to be under volitional control because certain skills, resources, or opportunities may play a role in determining whether they can engage in spatial data sharing.
Basic Principles of the Theory of Planned BehaviorThe basic model of the Theory of Planned Behavior consists of five distinct components: a particular behavior under consid-eration, the intention to act, and three determinants of inten-tion. A distinction is made between the decision to engage in a particular behavior, conceptualized as Behavioral intention, and actual performed behavior.
It has been argued:
Intentions are assumed to capture the motivational factors that have an impact on a behavior; they are indications of how hard people are willing to try, of how much of an effort they are planning to exert, in order to perform the behavior. These intentions remain behavioral dispositions until, at the appropriate time and opportunity, an attempt is made to translate the intention into action. (Ajzen 1988:113)
Because of the distinction between intention to act and actual behavior, the intention construct provides the basis for investigat-ing the disposition of organizations toward spatial data sharing. Hence, it is possible to measure the intention, or the willingness, to engage in spatial data sharing which is, conceptually, expected to be closely linked to actual sharing behavior.
The first determinant of intention (i.e., the attitude toward the behavior) is a person’s positive or negative evaluation of performing the behavior. The second (i.e., the subjective norm) captures the individual’s perception of social pressure to engage or not to engage in the behavior. Finally, perceived behavioral control consists of the perceived availability of required opportunities and resources to perform the behavior.
These components have been tested empirically to predict intentions and behavior (e.g., Ajzen 1985, 1988, 1991, Ajzen and Madden 1986, Ajzen and Driver 1992). The relative weight of the attitudinal, normative, and control factors is expected to vary according to the behavior under investigation. As the Theory of Planned Behavior aims to explain, rather than merely predict, a behavior, it can be used to trace the determining antecedents of attitude, social norm, and perceived behavioral control. The underlying foundation of beliefs about the behavior is considered
to provide the basis for perception. “It is at the level of beliefs that we can learn about the unique factors that induce one person to engage in the behavior of interest and to prompt another to follow a different course of action” (Ajzen 1991:206-207).
The Theory of Planned Behavior, like the underlying Theory of Reasoned Action, focuses on subjective perceptions of individu-als rather than on objective observations to explain behavior.
Basic to this approach is the view that people use the information available to them in a reasonable manner to arrive at their decisions. This is not to say that their behavior will always be reasonable or appropriate from an objective point of view. People’s information is often incomplete and at times also incorrect. But we would argue that a person’s behavior follows quite logically and systematically from whatever information he happens to have available. (Ajzen and Fishbein 1980:44)
Although people are assumed to hold a great number of be-liefs about a particular behavior, only a small number, the so-called “salient” beliefs, are expected to be the predominant determinants of intention and action. According to the expectancy value prin-ciple, it is necessary for each belief and its strength (likelihood) to be rated and then combined.
Three types of beliefs can be distinguished: behavioral beliefs (influencing attitude), normative beliefs (determining so-cial norm), and control beliefs (underlying perceived behavioral control). Behavioral beliefs consist of the evaluation of specific consequences and outcomes that may result from performing the behavior in question. Normative beliefs constitute beliefs about the important referents (individuals or groups) and their likely approval or disapproval with regard to engaging in the behavior. Control beliefs capture the perceived presence or absence of req-uisite resources and opportunities (such as skills and capabilities) and the cooperation of other people deemed necessary to perform the behavior.
A behavior is said to be explained once the determinants of intention and behavior have been traced to the underlying beliefs. Detailed descriptions developed at the belief level of analysis provide a systematic basis for inferring why individuals embedded within organizations may be willing, or resistant, to share spatial data.
The Appropriate Unit of Analysis: Macro and Micro Considerations Pfeffer (1985) suggested that when trying to understand orga-nizational behavior and decisions, a focus on the individual as the unit of analysis often leads to a neglect of normative contexts and technological aspects. Yet Jones (1985:53) stressed that: “The individual must be seen as the intersection point of a variety of pressures: immediate situational demands, conflicting social expectations, and internalized beliefs and values.”
Using the Theory of Planned Behavior as an organizing framework, the influence of these aspects may be explicitly ad-dressed by the inclusion of social norm and control components within the model. Moreover, the suitability of psychological theo-

22 URISA Journal • Vol. 15, APA I • 2003 URISA Journal • Wehn de Montalvo 23
ries to understanding organizational behavior has been discussed by Staw (1991) and more specifically for the Theory of Planned Behavior, by Elliott et al. (1995). Staw (1991:812) suggested that psychological theories that typically examine behavior at the micro level can also be used to understand action at the macro level (i.e., organizational behavior) “...because it is possible to identify key actors in important organizational decisions, psychological research can be applied to these individuals in order to explain organizational actions.”
According to Staw, the most fruitful approach is not to ex-amine in detail all individual behavior within an organization, but rather to study the key organizational decision-makers. Bacharach et al. (1995) argued that because actors making decisions are ac-countable for their decision, they seek decision criteria that can be used to justify those decisions. These key decision-makers may be assumed to have an accurate understanding of their organization’s position toward spatial data sharing and their perceptions may be the best indicator of their organization’s behavior (Elliott et al. 1995). In this way, the focal situation can be expanded to a larger arena (Markus and Robey 1988).
This position with respect to the representation of individuals as indicators of likely organizational behavior provides the basis
for the research strategy advocated here. Rather than limiting the scope of the research to an in-depth study of a few organiza-tions,6 a range of individuals and organizations can be included, with the goal being to examine their dispositions toward spatial data sharing.
Application of The Theory of Planned Behavior to Spatial Data SharingAs argued above, the Theory of Planned Behavior provides a systematic way of combining qualitative and quantitative empiri-cal research methods to arrive at a model of the propensity to engage in spatial data sharing across organizational boundaries. This framework was employed to integrate qualitative empirical evidence, with insights drawn from several bodies of literature in a systematic fashion to arrive at a model of the willingness of organizations to engage in spatial data sharing (Wehn de Mon-talvo 2001). This entailed two stages of empirical research. The qualitative stage involved semi-structured interviews, the results of which were analyzed and complemented by insights drawn from the appropriate theoretical and empirical literatures to build a
Figure 1: Model of the willingness to share spatial data across organizational boundaries (South Africa)

24 URISA Journal • Vol. 15, APA I • 2003 URISA Journal • Wehn de Montalvo 25
conceptual model of the willingness of individuals within organi-zations to share spatial data (see Figure 1). The resultant model was operationalised using a questionnaire, and the second, quantitative stage of research entailed the application of the questionnaire instrument using a face-to-face interview method. The survey included local, provincial, and national government, para-statal organizations, the private sector, academia, and nongovernmental organizations in South Africa.7
Owing to the complexity of the behavior–spatial data shar-ing–interviews alone would not have been sufficient to provide the necessary information about the full range of beliefs or a basis for translating them into questionnaire items. Therefore, based on the analysis of the qualitative interviews in stage one, the development of the model of spatial data sharing also employed theoretical insights drawn from several related fields of enquiry such as resource dependence theory and knowledge creation. The construction of the model and its components, as well as detailed aspects of the research methodology of the empirical research and of the analysis, are beyond the scope of this article and are considered elsewhere (Wehn de Montalvo 2001).
In this model, the intention construct refers to the willingness to engage in spatial data sharing activities across organizational boundaries; “attitude” refers to the attitude toward spatial data sharing; “subjective norm” is referred to as the social pressure to engage, or not to engage, in spatial data sharing; and “perceived behavioral control” is referred to as the perceived control over spatial data sharing activities that key individuals within orga-nizations perceive.
The verification of the model of the willingness to share spatial data against empirical data demonstrated that, in terms of the reliability of the measures, the items in the questionnaire had highly satisfactory levels of internal reliability. With respect to conceptual validity, the analysis of the empirical data con-firmed that the items in the questionnaire instrument tapped the concepts suggested by the model. Finally, concerning construct validity, the relationships between the variables derived from the Theory of Planned Behavior were all in the expected direction and confirmed the explanatory power of the model.
These results offer strong statistical support for the model. The attainment of the validity of the model constitutes a crucial step in the approach which proposes to systematize the determi-nants of organizations’ spatial data sharing behavior. Only after a model has been demonstrated to be valid, can it be relied upon to further the understanding of the incentives and disincentives for key individuals within organizations to engage in spatial data sharing.
Research Results–Determinants of Spatial Data SharingEmpirical data were used to assess the factors likely to influence the willingness of key individuals embedded in organizations to engage in spatial data sharing across organizational boundaries. The specific findings are summarized below.
Regarding the intention of key individuals within organiza-tions to share spatial data, the results suggest that willingness in South Africa cannot be taken for granted; this is contrary to the underlying assumption in the design of, and in many discus-sions on, spatial data infrastructures. It was found that the actual motivation of organizations in the sample was not in favor of participating in spatial data sharing. Overall, the willingness of the representatives of organizations in the sample to share spatial data across organizational boundaries was low, with only a slight increase expected in the near future. The majority of the respondents reported that their organization was undecided about whether to engage in spatial data sharing, and a small share indicated that their organizations were unwilling to share spatial data across organizational boundaries.
The results of the analysis further indicate that the intention of organizations, as expressed by the respondents in the sample, to engage in spatial data sharing did not vary significantly for the different sectors in the GIS community.8 There were also no significant differences in the willingness to share according to the perceived extent of self-sufficiency or dependence of organizations on spatial data. Contrary to what was expected, the willingness to share did not differ with respect to the organizations’ spatial data position (i.e., whether organizations were predominantly giving spatial data to, or receiving spatial data from, other or-ganizations).
The results of the statistical analysis show that the inten-tion of key individuals within organizations to engage in spatial data sharing can be predicted from corresponding measures of “attitude” toward spatial data sharing and “social norm” from important referents to engage in spatial data sharing. Somewhat greater emphasis was placed on the “social norm” component. It was found that the technical aspects of sharing in terms of the skills and resources considered under the “perceived control” compo-nent could not be confirmed as an important factor in influencing the willingness of individuals in organizations to engage in spatial data sharing. This finding suggests that, while the technical aspects that are currently the focus of attention in the context of spatial data sharing initiatives (such as the interoperability of different GIS applications and spatial data sets, the establishment of stan-dards, and the implementation of clearinghouses) are necessary, it cannot be expected that their resolution will be sufficient to overcome the obstacles to spatial data sharing.
An additional finding was that the National Spatial Infor-mation Framework (NSIF) directorate did not emerge as an important referent for organizations with respect to their en-gagement in spatial data sharing. The aim of the NSIF is to build a spatial data infrastructure in South Africa in pursuit of social and economic goals by promoting spatial data sharing among different organizations. In the context of diffusion of innovations research, the intended role of the NSIF can be conceptualized as that of a change agent.9 Change agents are seen as opinion lead-ers who can influence the attitudes and behavior of individuals with respect to a particular innovation (Rogers 1995). Since the analysis could not directly confirm the NSIF as an important

24 URISA Journal • Vol. 15, APA I • 2003 URISA Journal • Wehn de Montalvo 25
referent for organizations regarding their engagement in spatial data sharing, this finding suggests that the capacity of the NSIF to influence the decisions of key individuals within organizations to engage in spatial data sharing is still limited and that it could to be strengthened. The additional results of the analysis revealed ways in which the effectiveness of the NSIF to encourage greater spatial data sharing could be improved.
A more detailed and substantive explanation of spatial data sharing across organizational boundaries was obtained by distin-guishing between three distinct groups of respondents–those who perceived their organizations to be willing to engage in spatial data sharing, those undecided, and those unwilling. This revealed areas important to take into account for the current spatial data sharing initiative in South Africa in order to foster a spatial data sharing “culture.” The six points are:1. As a key referent inside the organization for spatial data
sharing activities, the management of GIS-using organizations (rather than mainly the technical GIS personnel, as is currently the case) could be targeted by the spatial data infrastructure initiative in order to increase their awareness and understanding of spatial data sharing activities for the effectiveness of their organizations’ GIS and so that they may provide support and encouragement for such activities.
2. Although they are key referents outside the organization for spatial data sharing activities, the different sectors of the GIS community do not yet seem to be providing clear and encouraging stimuli for spatial data sharing. The results of the analysis also suggest that, according the perception of the respondents, the NSIF is conceptually linked to the GIS national government departments, thereby indirectly including the NSIF in the referents from the GIS community. Yet the role of the NSIF as an important referent for organizations regarding their engagement in spatial data sharing could not be directly confirmed. In combination with the assessment of actual sharing behavior, which found that the extent of sharing was still very limited, these results suggest that a spatial data sharing “culture” has not yet developed. This adds further weight to the remaining findings of the research that can be used to guide the fostering of such a sharing culture.
3. While it is important to specify particular benefits of engaging in spatial data sharing, the results show that the disincentives for spatial data sharing also need to be addressed. In particular, the importance of reducing the fears associated with losing control over spatial data has been highlighted. While much of the promotion of the NSIF stresses the benefits of spatial data sharing across organizational boundaries, it would be helpful to reduce the fears associated with the negative consequences of such activities rather than solely emphasizing positive outcomes. The threats to an organization’s strategic position would need to be addressed by specifying how unregulated access to an organization’s spatial data by other organizations can be limited and how the use of an organization’s spatial data can be restricted to the particular organizations that are
considered sharing partners. It would also be important to clarify the mechanisms that might be put in place to ensure that rules regarding the ownership of, access to, and the use of the organization’s spatial data can be enforced. With respect to the benefits of spatial data sharing, reference should be made to the potential benefits of spatial data sharing for an organization’s particular activities.
4. Generally, promotion of the National Spatial Information Framework in South Africa makes reference to the benefits of establishing the NSIF and of spatial data sharing. However, the results of this study indicate that it would be beneficial to articulate explicitly how organizations that engage in spatial data sharing are able to benefit, by focusing on their core activity, to increase the usefulness of their GIS and to improve the quality of their decision making. Furthermore, it would be important to mention the specific benefits of spatial data sharing in terms of the savings in administrative efforts that would otherwise be needed for data capture.
5. Furthermore, aside from the cost-benefit approach usually adopted in the promotion of spatial data sharing initiatives, the results showed that more intangible consequences of spatial data sharing, such as the opportunity to gain new insight, can act as incentives for spatial data sharing. They should be referred to in detail by providing information about how organizations can benefit from spatial data sharing in terms of these intangible outcomes with salient examples. Specific reference could be made to these by detailing how organizations can benefit from spatial data sharing because it may: 1) trigger dialogue and collective reflection across organizational boundaries (such as joint problem solving) and involve articulating and comparing spatial data-related concepts; 2) allow access to ideas that are codified in spatial data, enabling their translation, combination, and application in different organizations; 3) provide the means to observe spatial data skills through personal interaction and to create shared mental models and experiences across organizational boundaries; and 4) enable the combination of new and existing spatial data sets from different organizations to create new knowledge.
6. Finally, the results revealed that the South African government initiative ‘Integrated Development Planning’ has emerged as another incentive for spatial data sharing. Since this has not previously been linked to the promotion of spatial data sharing, specific reference to the benefits of spatial data sharing in terms of integrated development planning should be made in the context of the spatial data infrastructure initiative in South Africa.
ConclusionsThe theory-based, behavioral approach to spatial data sharing presented in this article takes advantage of a robust model devel-oped in another field of enquiry within the social sciences (i.e., in the existing body of knowledge about human behavior and

26 URISA Journal • Vol. 15, APA I • 2003 URISA Journal • Wehn de Montalvo 27
decision making). Based on the validation and the analysis of resultant model of the willingness to engage in spatial data shar-ing, it can be argued that: 1) the Theory of Planned Behavior has been applied successfully as an organizing framework for research on spatial data sharing; and 2) this model, as implemented us-ing the questionnaire instrument, could also be used in other national contexts to elicit the dispositions of actors in a specific GIS community.
From a policy perspective, the findings of the analysis re-ported here show that by using the Theory of Planned Behavior, it is possible to generate specific insight for policy formulation by revealing–in a systematic fashion–the incentives and disincentives for decision-makers within organizations to share spatial data. The results can provide a basis for specific guidance as to how policy makers may influence the actual behavior of spatial data sharing more effectively. The strength of this approach is not to produce generalisable truths but to identify context-specific incentives and disincentives to spatial data sharing.
About the Author
Uta Wehn de Montalvo is researcher and advisor at the Insti-tute for Strategy, Technology and Policy at the Netherlands Organisation for Applied Scientific Research. She previously worked as a programmer for IBM UK Ltd. and as a research officer in SPRU–Science and Technology Policy Research. She holds a B.Sc. in Computer Science, and a M.Sc. and a Ph.D. in Science and Technology Policy. Her research focuses on access to geographic information and spatial data sharing, the social aspects of implementing spatial data infrastructures, and the role of information and communica-tion technologies for development. She currently chairs the Data Policy Working Group of the Association of Geographic Information Laboratories for Europe (AGILE).
Corresponding Address:Dr. Uta Wehn de MontalvoTNO - The Netherlands Organisation for Applied Scientific ResearchInstitute for Strategy, Technology and PolicySchoemakerstraat 97P.O. Box 60302600JA Delft, NLemail: [email protected]
References
Abelson, R.P. and A. Levi, 1985, Decision Making and Decision Theory. In Lindzey, G. and E. Aronson (Eds.) The Handbook of Social Psychology, 3rd ed (New York: Random House), 1, 231-309.
Ajzen, I., 1985, From Intentions to Actions: A Theory of Planned Behavior. In Kuhl, J. and J. Beckmann (Eds.) Action Con-trol–From Cognition to Behavior (Berlin: Springer-Verlag) 11-39.
Ajzen, I., 1988, Attitudes, Personality, and Behavior (Milton Keynes, UK: Open University Press), 110.
Ajzen, I., 1991, The Theory of Planned Behavior. Organizational Behavior and Human Decision Processes, 50, 179-211.
Ajzen, I., 1996, The Social Psychology of Decision Making. In Higgins, E.T. and A.W. Kruglanski (Eds.) Social Psychol-ogy–Handbook of Basic Principles (New York and London: The Guildford Press), 297-325.
Ajzen, I. and B.L. Driver, 1992, Application of the Theory of Planned Behavior to Leisure Choice. Journal of Leisure Research, 24(3), 207-224.
Ajzen, I. and M. Fishbein, 1980, Understanding Attitudes and Predicting Social Behavior (Englewood Cliffs, N.J.: Pren-tice-Hall).
Ajzen, I. and T.J. Madden, 1986, Prediction of Goal-Directed Behavior: Attitudes, Intentions, and Perceived Behavioral Control. Journal of Experimental Social Psychology, 22, 453-474.
Alfelor, R.M., 1995, GIS and the Integrated Highway Informa-tion System. In Onsrud, H.J. and G. Rushton (Eds.) Sharing Geographic Information (New Brunswick, NJ: Center for Urban Policy Research), 397-412.
Azad, B. and L.L. Wiggins, 1995, A Proposed Structure for Observing Data Sharing. In Onsrud, H.J. and G. Rushton (Eds.) Sharing Geographic Information (New Brunswick, NJ: Center for Urban Policy Research), 22-43.
Bacharach, S., P. Bamberger, and B. Mundell, 1995, Strategic and Tactical Logics of Decision Justification: Power and Decision Criteria in Organizations. Human Relations, 48(5), 467-488.
Batty, M. (1992), Sharing Information in Third World Planning Agencies, National Center for Geographic Information and Analysis, Buffalo, Technical Report No.92-8, February.
Callon, M., 1991, Techno-Economic Networks and Irrevers-ibility. In Law, J. (Ed.) A Sociology of Monsters: Essays on Power, Technology and Domination (London and New York: Routledge), 132-164.
Clarke, D., E. Gavin, W. Honu, T. Krieg, M. Muller, H.J. Smith, T. Smith, and S. Vorster, 1998, Proceedings of the National Spatial Information Framework Workshop, Sinodale Sen-trum, Pretoria, February 11, 1998.

26 URISA Journal • Vol. 15, APA I • 2003 URISA Journal • Wehn de Montalvo 27
Dangermond, J., 1995, Public Data Access: Another Side of GIS Data Sharing. In Onsrud, H.J. and G. Rushton (Eds.) Shar-ing Geographic Information (New Brunswick, NJ: Center for Urban Policy Research), 331-339.
Dawes, R.M., 1998, Behavioral Decision Making and Judge-ment. In Gilbert, D.T., S.T. Fiske, and G. Lindzey (Eds.) The Handbook of Social Psychology, 4th ed (New York: McGraw-Hill), 1, 497-548.
Dueker, K.J. and R. Vrana, 1995, Systems Integration: A Reans and a Means for Data Sharing. In Onsrud, H.J. and G. Rush-ton (Eds.) Sharing Geographic Information (New Brunswick, NJ: Center for Urban Policy Research), 149-171.
Eagly, A. and S. Chaiken, 1993, The Psychology of Attitudes (Fort Worth: Harcourt Brace College Publishers).
Eagly, A.H. and S. Chaiken, 1998, Attitude Structure and Func-tion. In Gilbert, D.T., S.T. Fiske, and G. Lindzey (Eds.) The Handbook of Social Psychology, 4th ed (New York: McGraw-Hill), 1, 269-322.
Elliott, R., D. Jobber, and J. Sharp, 1995, Using the Theory of Reasoned Action to Understand Organisational Behaviour: The Role of Belief Salience. British Journal of Social Psychol-ogy, 34, 161-172.
Fishbein, M. and I. Ajzen, 1975, Belief, Attitude, Intention, and Behavior: An Introduction to Theory and Research (Reading, MA: Addison-Wesley).
Hogg, M. and G. Vaughan, 1995, Social Psychology–An Intro-duction (London: Prentice Hall).
Jones, E.E., 1985, Major Developments in Social Psychology During the Past Five Decades. In G. Lindzey and E. Aronson (Eds.) The Handbook of Social Psychology, 3rd ed (New York: Random House), 1, 47-107.
Kahneman, D. and A. Tversky, 1979, Prospect Theory: An Analysis of Decision Making under Risk. Econometrica, 47, 263-291.
Keren, G., 1996, Perspectives of Behavioral Decision Making: Some Critical Notes. Organizational Behavior and Human Decision Processes, 65(3), 169-178.
Kevany, M.J., 1995, A Proposed Structure for Observing Data Sharing. In H. J. Onsrud and G. Rushton (Eds.) Sharing Geographic Information (New Brunswick, NJ: Center for Urban Policy Research), 76-100.
Latour, B., 1987, Science in Action (Cambridge, MA: Harvard University Press).
Law, J. and J. Hassard (Eds.), 1999, Actor Network Theory and After (Oxford: Blackwell Publishers)
Masser, I. and H.J. Onsrud (Eds.), 1993, Diffusion and Use of Geographic Information Technologies (London: Kluwer Academic Publishers).
Markus, M.L. and D. Robey, 1988, Information Technology and Organizational Change: Causal Structure in Theory and Research. Management Science, 34(5), 583-598.
Medin, D.L. and M.H. Bazerman, 1999, Broadening Behavioral Decision Research: Multiple Levels of Cognitive Processing. Psychonomic Bulletin and Review, 6(4), 533-546.
Mellers, B.A., A. Schwartz, and D.J. Cooke, 1998, Judgement and Decision Making. Annual Review of Psychology, 49, 447-477.
Mohr, L.B., 1982, Explaining Organizational Behavior (San Francisco: Jossey-Bass Publishers).
Nedovic-Budic, Z. and J. Pinto, 1999, Understanding Interorga-nizational GIS Activities: A Conceptual Framework, Journal of the Urban and Regional Information System Association (URISA), 11(1), 53-64.
Nedovic-Budic, Z., L. Warnecke, and J. Pinto, GIS Database Development and Exchange: Interaction Mechanisms and Motivations. Submitted to Journal of the Urban and Regional Information System Association (URISA), Version 09/24/01, www.urisa.org/journal/
Obermeyer, N. and J. Pinto, 1994, Managing Geographic In-formation Systems (New York and London: The Guildford Press).
Onsrud, H.J., 1995, The Role of Law in Impeding and Facili-tating the Sharing of Geographic Information. In Onsrud, H.J. and G. Rushton (Eds.) Sharing Geographic Information (New Brunswick, NJ: Center for Urban Policy Research), 292-306.
Onsrud, H.J. and J.K. Pinto, 1991, Diffusion of Geographic In-formation Innovations. International Journal of Geographi-cal Information Systems, 5(4), 447-467.
Onsrud, H.J. and G. Rushton, 1992, NCGIA Research Initiative 9: Institutions Sharing Geographic Information, National Center for Geographic Information and Analysis, Report of the Specialist Meeting, Technical Report 92-5, June 1992.
Onsrud, H.J. and G. Rushton (Eds.), 1995, Sharing Geographic Information (New Brunswick, NJ: Center for Urban Policy Research).
Onsrud, H.J. and G. Rushton, 1996, Institutions Sharing Geographic Information, National Center for Geographic Information and Analysis, Closing Report, Research Initia-tive 9, March 1996.
Opp, K.-D., 1999, Contending Conceptions of the Theory of Rational Action. Journal of Theoretical Politics, 11(2), 171-202.
Pfeffer, J., 1985, Organizations and Organization Theory. In Lindzey, G. and E. Aronson (Eds.) The Handbook of Social Psychology, 3rd ed (New York: Random House), 1, 379-440.
Pinto, J.K. and H.J. Onsrud, 1995, Sharing Geographic In-formation Across Organizational Boundaries: A Research Framework. In Onsrud, H.J. and G. Rushton (Eds.) Sharing Geographic Information (New Brunswick, NJ: Center for Urban Policy Research), 44-64.
Rhind, D. (1998) ‘Public/private sector relationships in the creation, management and exploitation of geospatial data’ in Conference Proceedings, XXI International Congress Developing the Profession in a Developing World - Com-mission 3: Land Information Systems, vol.3, Brighton: The International Federation of Surveyors, pp.201-215.

28 URISA Journal • Vol. 15, APA I • 2003 URISA Journal • de Man 29
Rogers, E.M. (1995) Diffusion of Innovations, 4th ed, New York: The Free Press.
Sabini, J., 1995, Social Psychology, 2nd ed (New York: W.W. Norton and Company).
Sperling, J., 1995, Development and Maintenance of the TIGER Database: Experiences in Spatial Data Sharing at the U.S. Bureau of the Census. In Onsrud, H.J. and G. Rushton (Eds.) Sharing Geographic Information (New Brunswick, NJ: Center for Urban Policy Research), 377-396.
Stage, D., 1995, A Multi-Agency Management Structure to Facilitate the Sharing of Geographic Data. In Florida. In Onsrud, H.J. and G. Rushton (Eds.) Sharing Geographic Information (New Brunswick, NJ: Center for Urban Policy Research), 426-447.
Staw, B.M., 1991, Dressing Up Like an Organization: When Psychological Theories Can Explain Organizational Action. Journal of Management, 17(4), 805-819.
Stevenson, M.K., J.R. Busemeyer, and J.C. Naylor, 1990, Judge-ment and Decision-Making Theory. In Dunette, M.D. and L.M. Hough (Eds.) Handbook of Industrial and Organi-zational Psychology, 2nd ed (Palo Alto, CA: Consulting Psychologists Press), 1, 283-367.
Tosta, N., 1995, The Evolution of Geographic Information Sys-tems and Spatial Data-Sharing Activities in California State Government. In Onsrud, H.J. and G. Rushton (Eds.) Shar-ing Geographic Information (New Brunswick, NJ: Center for Urban Policy Research), 193-206.
Wehn de Montalvo, U., 2001. Crossing Organisational Boundar-ies: Prerequisites for Spatial Data Sharing in South Africa, D.Phil. Thesis, SPRU–Science and Technology Policy Re-search, University of Sussex, Brighton.
Yates, J.F., 1990, Judgement and Decision Making (Englewood Cliffs, NJ: Prentice Hall).
Notes 1 The author is grateful for comments from the participants
of the ESF-NSF Workshop on Access to Geographic In-formation and Participatory Approaches Using Geographic Information, Spoleto, Italy, 6-8 December 2001, where an earlier version of this article was presented.
2 This parallels the distinction between variance and process models in more general literature on organisational behavior (for example, Mohr 1982).
3 For a discussion of different measurement techniques, see Hogg and Vaughan (1995).
4 The current list of empirical research papers applying the Theory of Planned Behavior exceeds 240 articles (http://www-unix.oit.umass.edu/~aizen).
5 Modifications to the Theory of Planned Behavior have been discussed, such as the inclusion of personal norm and perceived moral obligation, self-identity, and past behavior variables, to improve the predictions of intention and be-havior (Sabini 1995, Eagly and Chaiken 1993). It is argued that these additions may be drawn upon and included in the TPB model depending on the specific behavior under investigation (Eagly and Chaiken 1998).
6 This would be the case, for example, for research based on the concepts developed within actor-network theory (see, for example, Latour (1987), Callon (1991) and Law and Has-sard (1999)) focusing on the negotiations and interactions among, and the motivations of, a small set of actors.
7 The sample includes just over 110 key individuals from some 70 different organisations.
8 The South African GIS community is made up of the fol-lowing groups: local authorities, provincial government, national government, para-statal organisations, academic research institutions, GIS industry, private sector, and non-governmental organisations.
9 For a conceptualisation of the diffusion of geographic in-formation technologies, see Onsrud and Pinto (1991) and Masser and Onsrud (1993).

28 URISA Journal • Vol. 15, APA I • 2003 URISA Journal • de Man 29
IntroductionTaken together, the Workshop by the European Science Founda-tion-U.S. National Science Foundation on Access to Geographic Information and Participatory Approaches in Using Geographic Information, held in Spoleto, Italy, from December 6-8, 2001, raised the question whether increased access to geographic infor-mation also increases public participation; if not: reinvigorates democracy, and benefits society at large? The obvious answer to that question is: it depends. Of course, the ultimate reason for being concerned with the issue of participatory use of geo-graphic information – or of any information for that matter – is its potential support for some kind of “participatory develop-ment.” However, there is evidence of both empowerment and marginalization of people and communities due to differential access to information and to participation. (For a discussion of these contradictory aspects related to geographic information, see articles by Obermeyer and Pinto (1994:169-181) and Harris and Weiner (1998).)
What do we mean by access to and participatory use of geo-graphic information? I suggest we view information as a resource that can be tapped but needs to be nurtured and maintained as well. It follows that participants can both make use of the stock of information and add (local) knowledge, facts, interpretations, analysis, and the like to it. Participatory use of information is an act of sharing, dialogue, and collaboration among individuals. Access to information would then enable these two-way flows. Geographic information and its participatory use are particularly significant when social groups (such as communities or societies at large) collectively deal with development problems most of which having important spatial or locational dimensions.
The relationship between access to and participatory use of geographic information (GI) is not a linear process. Certainly, making use of information necessitates some form of access to it. But access itself may also be a drive into participatory use of information and this, in turn, may be a condition for popular
Cultural and Institutional Conditions for Using Geographic Information; Access and Participation
W.H. Erik de Man
Abstract: Access to geographic information is a necessary and enabling but not a sufficient condition for participation in its use. Access and participation are both essentially behavioral in nature and therefore depend on social conditions, in particular, on culture and institutions. This article explores two existing models to describe different cultures (viz. well-known models proposed by Geert Hofstede and Mary Douglas, respectively) and the potentials of these models in analyzing cultural conditions for access to geographic information and participation in its use. Finally, the article proposes inclusion of cultural and institutional condi-tions in the emerging research agenda on access to and participatory approaches in using geographic information and suggests some steps to this end.
participation in general. What are critical conditions in this re-spect? How will the information be integrated with folk percep-tions about the world, which are generally in terms of narratives (stories) and images? In this article, I will argue that access to and participation in use of geographic information depend on social context, specifically on local culture and institutions. Participa-tory approaches in using geographic information – or any kind of information for that matter – are likely to have limited effects in societies that are not supportive to (popular) participation in general. The dependency on context does not ignore, however, the positive – although limited – role that availability of and access to (geographic) information can play in increasing public participation.
Access and Participation Depend on Social ContextAccess to (geographic) information and its usability are relevant concerns whenever people seek information. This will generally be the case when they meet or anticipate problems. Many of these problems have a strong spatial dimension as in spatial analysis, spatial planning, and decision-making, implementation of these plans, and environmental monitoring and management. Access to and use of geographic information are schematically situated between geographic information and its providing technology on the one hand and spatial problems on the other. Access to geographic information is important because the information may be used because of solving spatial problems.
Access to and participatory use of (geographic) information are essentially behavioral in nature. Access to information is both to be sought and seized by some, and to be enabled or facilitated by others. The same is the case for participation.
Although individuals exercise concrete problem-solving actions, these individual actions generally do take place within groups or societies. And so do access to and the use of geographic information. Consequently, both are subject to social conditions.

30 URISA Journal • Vol. 15, APA I • 2003 URISA Journal • de Man 31
But both may contribute in shaping social conditions as well; be it to a limited extent. Because of these social interactions, I view geographic information as being socially constructed. Con-sequently, I view participatory approaches in using information as essentially social processes in the construction of information. (The traditions that I follow in the article include “symbolic actionism” (Blumer 1969) and “social construction of technol-ogy” (Bijker and Law 1992, Bijker 1995) (see also, for instance, Harvey 2000).
Culture and InstitutionsWhich social conditions in particular influence access to and use of geographic information? Because culture and institutions guide individual actions and behavior, I would argue that both access to and use of geographic information are embedded in the culture and the institutional arrangements of the host society. But they are not fully determined by cultural and institutional conditions only. The situation, for example, that laws in the United States allow greater access to government information and use of that information than is generally allowed in the nations of Europe cannot be explained by differences in cultural conditions alone. Laws are only to a limited extent expressions of the dominant culture of the host society. But “the rule of law” as such might be culturally embedded.
CultureCulture is a major condition for access to and use of geographic information because both rely ultimately on behavior. In social sciences, the term “culture” refers to the shared ways and think-ing that grow out of group experience and are passed from one generation to the next (Broom et al. 1981). Specifically, it refers to the deeper level of basic assumptions and beliefs that define in a basic taken-for-granted fashion a group’s view of itself and its environment. These assumptions and beliefs are learned responses to the group’s problems of survival in its external environment and its problems of internal integration (Schein 1985).
Culture is of particular relevance for the use of information in problem solving. First, culture shapes what people think ought to be. Second, what solutions and remedies are acceptable in a given problem-situation depends to a considerable extent on cultural values. In both ways, culture determines information needs. Finally, the very processes of collecting and interpreting data are also influenced by culture.
InstitutionalizationThe sociological notion “institution” is relevant as well. It refers to a recurrent social mechanism that is established and valued by a group, community, or society. Specifically, an institution has a normative impact on the behavior of individuals and may develop within groups or within society at large (see, for example, Broom et al. 1981 and Robertson 1982). In this sociological view, institutions are embedded within the host culture.
Access to and use of geographic information interact with institutions. In this respect, one could argue that the provision
of geographic information must be “rooted” within society in order to be of real value. It is in this sense that one could view the provision of specific sets of geographic information itself as being institutionalized within a group or society (see, for instance, De Man 2000).
Access and Participation are Culturally and Institutionally EmbeddedWe now can summarize the assumptions and speculations made so far (Figure 1). First, access to and use of geographic information are “between” spatial problems and geographic information tech-nologies. Second, participatory approaches in using geographic information deal both with access to and use of geographic infor-mation. Third, participation in the use of geographic information is embedded in the culture and institutional arrangements of the host society.
Cultural DifferencesCulture differs from one society to another. How do we dif-ferentiate between them? A classic distinction is between active and passive societies. Active societies seek opportunities in their environment for improving their conditions and display a desire for attainment and to be in charge. Passive societies, on the con-trary, seek to maintain their status quo and display a tendency to be under the control of natural processes, of social waves and developments, or of active others (Etzioni 1968). In other words, societies differ in they way they deal with uncertainties: do they perceive them as opportunities or as threats? It is self-evident that seeking new opportunities requires fundamentally different sets of information than the maintenance of a status quo.
Notwithstanding its merits, the active-versus-passive dimen-sion will not be sufficient to describe and explain the interaction between culture and the application of (geographic) information technology. For example, it does not explain how different bureau-cratic ways of management deal with information. To this end,
Figure 1. Access, use, and participation are culturally and institutionally embedded

30 URISA Journal • Vol. 15, APA I • 2003 URISA Journal • de Man 31
the manner in which a society deals with differences in power and hierarchy and with uncertainty and risk has to be accounted for as well. A more elaborate view on “culture” will be necessary.
Geert Hofstede’s well-known four-dimensional model to describe different cultures seems attractive and promising to this end. However, an alternative model to deal with different cultural “biases” proposed by Mary Douglas and others is worth to mentioning as well. In this section, both models are briefly sketched.
Four Dimensions of Culture (Geert Hofstede)Hofstede’s study on cultural values of people in over 50 coun-tries revealed common problems, but with solutions differing from country to country (Hofstede 1980 and 1997). From Hofstede’s analysis of 116,000 questionnaires and more than 20,000 interviews with employees of the multinational IBM in over 50 countries, he found that (national) cultures differed by: 1) social inequality (including the relationship with authority); 2) the relationship between the individual and the group; 3) concepts of masculinity and femininity; and 4) ways of dealing with uncertainty. These terms seem to reflect reasonably well the basic (cultural) problems each society faces. Together, these dimensions form a four-dimensional model explaining, as Hof-stede claims, around two-thirds of the value differences among national cultures. These cultural dimensions are crucial to issues as accessibility and sharing of information as well, and these are, in turn, most relevant to any information and communication technology (ICT). The latter is reflected in numerous applica-tions of Hofstede’s work in research investigations within the field of ICT (see, for example, Grover et al. 1994 and Shore and Venkatachalam 1996).
The four dimensions of national culture in Hofstede’s model can be briefly described as follows:
Power Distance. Culture’s way to accommodate human inequality. Large power distance cultures are hierarchical, authoritarian, and elitist in the sense of accumulation of the good things in life at the higher levels in the hierarchy and of the bad things in life at the lower levels. Small power distance cultures demonstrate flat organisations and value participation (e.g., spread in the distribution of the good and the bad things in life).
Individualism versus Collectivism. Culture’s way to accommodate the individual and the ‘group.” Individualist cultures are composed of calculating citizens. In collectivist cultures, group values are dominant. In such cultures, one’s sense of life is derived from one’s contribution to the common good (e.g., closely-knit crowds).
Masculinity versus Femininity. Culture’s way to accommodate masculine and feminine “values.” Masculine cultures focus on achievements and success. They are aggressive and have the visibility of success. Feminine cultures are caring cultures emphasizing quality of life, networking, and relationships as social values (e.g., egalitarian and compassion).
Uncertainty Avoidance. Culture’s way to accommodate uncertainty. Strong uncertainty avoiding cultures are characterized by little risk taking, minimal innovation, extensive institutions to bring security and stability, conservative, and thorough planning. Weak uncertainty avoidance cultures are innovative and creative, and tolerant of differences in views and behavior. Risk and excitement are greater values for such cultures than security and stability (e.g., play as it comes, incremental planning, and few contingency scenarios).
Cultures can be described in terms of various combina-tions of these dimensions. Hofstede found that countries with a generally large power distance are also likely to be more col-
Aspects of Participatory Use of Geographic Information
Power Distance
Uncertainty Avoidance Masculinity versus Femininity
Large Small Strong Weak Masculine Feminine
Access to geographic information
L – Top managers assume they know best with no need for further visibility
H – Accountability and transparency are valued
H – Emphasis on control, contingency, and (“hard”) sciences
L – GI may be interesting but not really needed (“who cares”)
L/H – GI is needed only in so far required to shine success(Masculinity is defensive and aggressive at the same time.)
H – The possible contribution of GI in adjusting various interests and in protecting the underprivileged is valued
Participation in using geographic information
L – Top managers assume they know best with no need to seek knowledge and experiences from others
H – Relatively “flat” social groups and organizations, and involvement of a wider circle of actors
L/H – GI needed only if it provides assistance to perceived security and stability
L – GI may be useful in involving others but little need for full-fledged (expensive) outputs
L – Communication is not valued
H – Networking, establishing relationships, and caring are valued
Table 1 Possible connotation of cultural dimensions vis-à-vis access to and participatory use of geographic information (Adapted from Van den Toorn and E. De Man 2000)

32 URISA Journal • Vol. 15, APA I • 2003 URISA Journal • de Man 33
lectivist, and countries with small power distance appear to be more individualist. Hence, the dimensions of power, distance, and individualism-versus-collectivism are correlated. This leads to three “independent” dimensions: power distance, uncertainty avoidance, and masculinity vs. femininity. Armored with Hof-stede’s multidimensional model, we return to culture’s possible impact on access to geographic information and its participatory use. However, this can only be done speculatively at this stage (Table 1).
L, H = low (L) and high (H) support for access to and par-ticipation in using GI from the respective cultural dimensions
Cultural Biases as a Different Way of Life (Mary Douglas)Notwithstanding its merits, Hofstede’s model has some weak-nesses. For example, data for the model were restricted to those countries with IBM establishments. Moreover, within national cultures, different sub-cultures can be identified (see, for in-stance, Riggs 1962 and 1964). The application of the model at the level of these sub-cultures is embryonic at best. In addition, Van Dongen (1997) argues that Hofstede is not analyzing culture but producing it by assuming homogeneity as a basis for his fac-tor analysis, given that the assumption of heterogeneity would inhibit this analysis.
An alternative model is suggested by Thompson et al. (1990) and describes different cultures as different ways of life. They build upon the grid-group typology proposed by Mary Douglas (1978). Douglas argues that two dimensions of sociality can ad-equately capture the variability of an individual’s involvement in social life: group and grid. Group refers to the extent to which an individual is incorporated into bounded units. The greater the incorporation, the more individual choice is subject to group determination. Grid denotes the degree to which an individual’s life is circumscribed by externally imposed prescriptions. The more binding and extensive the scope of the prescriptions, the less of life that is open to individual negotiation.
These two dimensions (group and grid) together produce four different “ways of life” (summarized by Carver 2001):Individualism (low group–low grid). Decisions present
opportunity, except for those that threaten freedom of choice action (“the market” will provide control, so there is no need for other kinds of control).
Hierarchy (high group–high grid). Technological and environmental decisions should be left to experts).
Fatalism (low group–high grid). Fatalists feel that they have very little control over decisions that affect them and accept whatever decisions are made on their behalf ).
Egalitarianism (high group–low grid). Egalitarians fear risk to the environment, the collective good, and future generations, and believe that power and influence should be spread more evenly within society.
Thompson et al. (1990) emphasize the dynamic character of these ways of life. Cultures are neither permanent nor singular.
When conditions change, ways of life may change as well. Within one social group, different ways of life can be recognized and are in permanent dynamic imbalance; forming alliances though remaining competitors.
As compared with Hofstede’s model, this “way of life” model lacks a quantifiable foundation (operationalization).
Unanswered QuestionsAt first sight, both models show some similarity. However, more elaborate analysis is required before any sound conclusion can be drawn. For example, how does Hofstede’s observation that in his study “individualism” and “power distance” are inversely correlated across the full set of countries relate to “individualism” and “hierarchy” as two distinct bur possible concurrent ways of life in the other model.
Both models reflect the understanding of “culture” as the group’s learned responses to problems of survival in its external environment and its problems of internal integration (Schein 1985). But how these models deal with spatial problems is not clear. For instance, is the “NIMBY syndrome” (Not In My Back Yard) a cultural response to a distinct category of spatial problems or is it a problem of internal integration itself?
Culture’s Possible Contribution to a Research AgendaBoth (theoretical) literature and practice suggest that cultural and institutional conditions are important for answering ques-tions regarding access to and use of geographic information, and participatory approaches in this respect. However, to deal with this in concrete and operational terms lies still ahead and more research will be needed. Here only a few steps – partly overlapping – to this end can be proposed.
Operational framework for analyzing culture’s influence. Integrating different existing models (like the models proposed by Hofstede and Douglas) and/or developing specific models for analyzing cultural conditions for access and participatory use of geographic information. Preferably, this will be part of a larger framework emerging from the ESF-NSF Spoleto-meeting in December 2001.
Cultural connotation of spatial problems. For example, how does culture influence the definition and perception of spa-tial problems? How does culture influence coping with spatial problems?
Cultural connotation of institutional arrangements. To which extent are differential institutional arrangements governing access to and use of geographic information culturally determined?
Real-life case studies. Learning-by-doing involving real-life case studies. What is the impact of participatory approaches in using geographic information? What are the cultural conditions in these real-life case studies?

32 URISA Journal • Vol. 15, APA I • 2003 URISA Journal • de Man 33
ConclusionCentral to the article is the question whether increased access to geographic information also increases public participation; if not: reinvigorates democracy and benefits society at large. The obvious answer to this question that it depends still remains. Therefore, the article has concentrated on some major conditions in this respect.
Access to and participation in use of geographic information are important conditions when communities (or societies at large) address common problems in their living environments. Access to (geographic) information is both a necessary and possibly an enabling condition for participation in its use; but not a suffi-cient condition. Because of their essentially behavioral character both access to and participatory use in (geographic) information depend on social conditions; specifically on local culture and institutions. Hence, approaches are needed for describing and analyzing the predominant cultural conditions in concrete and operational terms. Literature and practice suggest that such ap-proaches can be found and developed.
Finally, the article proposes to include cultural and institu-tional conditions in the emerging research agenda on access to geographic information and participatory approaches in its use.
About the Author
W. H. Erik de Man is Senior Lecturer in Geographic Informa-tion Management and Institutional Development at the International Institute for Geo-Information Science and Earth Observation (ITC), Enschede, The Netherlands. He studied land surveying and – later – public administration. His current research interests are cultural and institutional conditions for GIS, GIS and organizations, institutionaliza-tion of GIS, GIS and governance.
Corresponding Address:Social Sciences DivisionW. H. Erik de ManInternational Institute for Geo-Information Science and Earth Observation (ITC)Enschede, The [email protected]
References
Bijker, W.E., 1995, Of Bicycles, Bakelites, and Bulbs: Towards a Theory of Sociotechnical Change (Cambridge MA: The MIT Press).
Bijker, W.E. and J. Law (Eds.), 1992, Shaping Technology/Building Society: Studies in Sociotechnical Change (Cam-bridge MA: The MIT Press).
Blumer, H., 1969, Symbolic Interactionism: Perspectives and Method (Englewood Cliffs, N.J.: Prentice-Hall).
Broom, L., P. Selznick, and D. Broom-Darroch, 1981, Sociology (New York: Harper and Row).
Carver, S., 2001, Participation and Geographical Informa-tion: A Position Paper ESF-NSF Workshop on Access to Geographic Information and Participatory Approaches in Using Geographic Information, held in Spoleto (Italy), 6-8 December, 2001. http://www.shef.ac.uk/~scgisa/spoleto/workshop.htm
De Man, W.H.E., 2000, Institutionalization of Geographic Infor-mation Technologies: Unifying Concept? Cartography and Geographic Information Science, 27(2), 139-151.
Douglas, M., 1978, Cultural Bias (Occasional Paper No. 35. Royal Anthropological Institute of Great Britain and Ireland).
Etzioni, A., 1968, The Active Society (New York: The Free Press).
Grover, V., A.H. Segars, and D. Durand, 1994, Organisational Practice, Information Resource Deployment and System Success: A Cross Cultural Survey. Journal of Strategic In-formation Systems, 3(2), 85-106.
Harris, T., and D. Weiner, 1998, Empowerment, Marginaliza-tion, and “Community-Integrated” GIS. Cartography and Geographic Information Systems, 25(2), 67-76.
Harvey, F., 2000, The Social Construction of Geographic Infor-mation Systems (Editorial Introduction). International Jour-nal of Geographical Information Science, 14(8), 711-713.
Hofstede, G., 1980, Culture’s Consequences: International Dif-ferences in Work-related Values (Beverly Hills, CA: Sage Publications).
Hofstede, G.H., 1997, Cultures and Organizations: Software of the Mind (New York: McGraw-Hill).
Obermeyer, N.J. and J.K. Pinto, 1994, Managing Geographic Information Systems (New York: Guilford Press).
Riggs, F.W., 1962, The “Sala” Model: An Ecological Approach to the Study of Comparative Administration. Philippine Journal of Public Administration, 6, 3-16.
Riggs, F.W., 1964, Administration in Developing Countries; The Theory of Prismatic Society (Boston: Houghton Mifflin).
Robertson, I., 1982, Sociology (New York: Worth).Schein, E.H., 1985, Organizational Culture and Leadership: A
Dynamic View (San Francisco: Jossey-Bass).Shore, B., and A.R. Venkatachalam, 1996, Role of National
Culture in the Transfer of Information Technology. Journal of Strategic Information Systems, 5(1) 19-35.
Thompson, M., R. Ellis, and A. Wildavsky, 1990, Cultural Theory (Boulder, CO: Westview Press).
Van den Toorn, W. and E. De Man, 2000, Anticipating Cultural Factors of GDI, In Groot, R. and J. McLaughlin (Eds.), Geospatial Data Infrastructure; Concepts, Cases and Good Practice (Oxford: Oxford University Press), 97-111.
Van Dongen, A.M., 1997, Culture as Method; Homogenizing or Heterogenizing Strategies of Change; The Case of the International NGO Forum on Indonesian Development (INFID) (Delft: Eburon Publishers).

URISA Journal • Niles, Hanson 35

URISA Journal • Niles, Hanson 35
IntroductionA recent front-page story in the Wall Street Journal asks whether the city—as a high-density, highly centralized settlement pat-tern—has a future (Wessel 2001). Citing many contemporary examples of the demise of centralized institutions and the concom-itant success of dispersed, networked ones, the author wonders if the downtown can survive in the face of terrorist threats, which encourage dispersal, and information technologies, which enable it. Wessel concedes, however, that the kinds of accessibility and the face-to-face interaction that cities foster are unlikely to be replaced or are replaceable to such a degree in the foreseeable future that the existence of cities will be undermined: “In short, the very forces that are breaking up the old centralized institutions of the 20th century—the ones that make possible the dissemination of information through decentralized networks and threaten rigid military-style hierarchies—are often the result of old-fashioned human interaction in crowded places.”1 By highlighting the de-pendence of the very creation of space-transcending information technologies (ITs) on face-to-face social interactions, this news article nicely pointed to the enduring imprint of grounded social relations2 on accessibility in an information age.
In this article, we explore the concept of accessibility at the intersection of cyberspace and physical (or grounded) space. Early prophecies hailing the ability of cyberspace to offer complete ac-cess to everyone portrayed cyberspace as a sci-fi version of an iso-tropic plain, where even the friction of distance would no longer hold sway. In fact, cyber-accessibility has proved to be remarkably dependent on good, old-fashioned geography and grounded social relations. Our focus here is on why physical places and grounded geographies remain salient to travel in cyberspace.
Accessibility has always been important to retailers, politi-cians, and geographers, inter alia. Individual access refers to one’s ability to reach or obtain something (usually something desirable such as a paying job, medical care, or entertainment), and in the non-virtual world achieving access—often even access to infor-
A New Era of Accessibility?
Sarah Niles and Susan Hanson
Abstract: The authors explore some of the many ways that grounded social relations remain salient to the online world of the Internet. Because of the ability to distribute via the Internet information at a very low cost anywhere that is connected to a telephone line, many advocate the Internet as being a democratizing force in the modern world. Such claims, however, often overlook the constraints on this medium created by uneven social relations, which shape how we use technology and how we are able to use technology. This article explores examples of Internet use from recent research on the topic, examples that show how the social context in which online information is produced and consumed greatly affects the accessibility of that information.
mation—requires physical mobility. In both physical and virtual access, one must know of the existence of a destination that will meet one’s needs, be aware of how such a destination might be found, and be able to reach the destination. If connecting to the information superhighway from anywhere gives a person access to everywhere, the physical locations of the origin and destination of that connection do not matter. What is germane to a person’s ability to access online information is their knowledge of what information is available online and how to navigate to the place where that information resides.
In this article, we review research that considers accessibility via the Internet in light of grounded social relations. We draw on research from a wide range of disciplines to illustrate that physical access to infrastructure does not equate to accessibility and that social and geographic context remain important to how and by whom information is produced and consumed. Specifically, we provide examples showing that the use of both technology and online information are context-specific; appreciating this specific-ity is important in understanding the accessibility or final utility of the Internet in everyday life. Throughout our discussion, we relate questions of accessibility in an information age to changing urban spatial structure and inequality. The 1999 Participatory GIS Conference held in Spoleto, Italy sought to discuss the liberaliza-tion of geographic information (GI) data and what that means for empowering people to participate in public decision-making. This review foregrounds the need to understand the various conditions under which people gain access to online information, including GI, and the possible impediments to the general dissemination of this information.

36 URISA Journal • Vol. 15, APA I • 2003 URISA Journal • Niles, Hanson 37
Accessibility to Information in Physical and Virtual Space
Measuring Access to Online Information: Technology Penetration Access to the Internet in the United States has mostly focused on access to the hardware necessary to connect to the Internet. Set up as an issue of uneven technology penetration, most surveys aimed at measuring a population’s access to the Internet examine geographi-cal and socio-economic disparities among those who have or don’t have a computer and modem in the home and consider those who lack these hardware items to fall on the wrong side of the “digital divide” (National Telecommunications and Information Adminis-tration 2000). These important and influential studies equate access to the Internet with the physical presence of a home computer equipped with a modem, the lack of which is considered the only barrier to the unlimited benefits that the Internet has to offer.
The results of these national studies of the digital divide are widely disseminated and have raised alarm that the U.S. is becoming a nation of information haves (those with computers in their homes) and have-nots (those without computers in their homes). Although the overall penetration rates are rapidly increas-ing across the U.S., the disparities persist and are even growing in some instances (National Telecommunications and Information Administration 2000). Rural populations, the inner-city poor, minorities, young households, and female-headed households remain disproportionately disadvantaged (McConnaughey and Lader 1998). Similar studies examining penetration rates of computers and modems have shown that the digital divide is even more severe on a global scale; illiteracy and lack of physical access to computer hardware explain why 88% of Internet us-ers come from countries that represent only 15% of the world’s population (Charp 2001).
Although access to appropriate hardware is a necessary condi-tion for online activity, conceptualizing access to online informa-tion as a function of uneven penetration of physical infrastructure encourages one to see physical space and physical access as the primary constraints on access in cyberspace; in this view, if you lack proximity to a telephone network, electricity, etc., you are offline. Yet, this sort of analysis denies the possibility that one’s on-the-ground social relations also shape opportunities for and constraints on virtual accessibility. Nor does framing the problem around physical access address whether closing the digital divide will erode inequalities in the access to information and improve the general welfare of Americans. By this measure, accessibility would be ubiquitous if universal service could be assured for every citizen. Universal service in turn, would guarantee equal access to welfare-improving information.
Place Matters: Internet Infrastructure and Information FlowsIn studying the Internet, geographers have looked at the extent to which Internet infrastructure is place-dependent and have sought
to understand the spatial patterns of flows of information. Ex-amining the distribution of physical infrastructure and patterns of digital information flows reveals that online communications are distributed to favor large cities in the U.S. Focusing on ag-gregate flows of information between places, geographers, and others have determined that physical locations shape the form that the Internet takes—the information available on it as well as patterns of traffic and connectivity. A number of researchers focus on measures such as communication flows (Castells 1996) and information transfer capacities (Moss and Townsend 2000) between places. By examining information transfer capacities (i.e., the capacity of the physical infrastructure), Moss and Townsend found that seven cities in the U.S. have the greatest capacity for information transfer and, although these cities are also connected to the regions within which they exist, there is more capacity be-tween and among the seven large centers than between the centers and their surrounding regions. Castells claimed that instead of decentralization or the even distribution of information with the Internet, a global urban network is being created where nodes (major information producing and consuming cities) dominate information production and dissemination. The ascendance of cities to node status is usually explained through place-based inertia and first-mover advantages that favor historically domi-nant economic and political centers (Sui 2000). This inertia, in which the spatial patterns of the IT economy mirror those of the pre-IT world, has been demonstrated for everything from the spatial distribution of information workers to the building of the physical infrastructure of the Internet atop existing rights-of-way that privilege cities (The Economist 2001c). The irony here is, of course, that the very places that have long benefited from excel-lent physical access are now also benefiting from superb IT access, so that instead of mitigating spatial inequalities, the Internet is exacerbating them.
Place Matters: The Production and Regulation of Internet ContentThe production and regulation of Internet content also increasing-ly reflects the importance of geographic context. The production of Internet content is biased in the U.S. toward large established cities, and the production of specialized Internet content often oc-curs in places where there was a previous specialization in activities associated with that content (e.g., entertainment in Los Angeles) (Kellerman 2000). According to Kellerman, New York City, Los Angeles, and the Silicon Valley are the largest Internet content producers, with concentrations of production within those places (e.g., Manhattan in New York City, Hollywood in Los Angeles). Kellerman points to the accumulation of expertise and other so-cial and physical infrastructure in these places as reasons for their dominance in the production of Internet content.
As technological advances have increasingly made it possible to identity the location of Internet users, Internet content pro-viders have used geography both to shape the content produced on the Internet and to appeal to the place-based context within which online information will be received. Firms can now target

36 URISA Journal • Vol. 15, APA I • 2003 URISA Journal • Niles, Hanson 37
Internet users by identifying the geographic location from which they are connecting to the Internet and can then differentiate users geographically based on socio-demographic data (The Economist 2001c). A new service offered by the company Quova can determine the geographic location of Internet users down to the zip code, thus allowing for online marketing and the local-ization of Web sites (Singer 2001). Such technologies will allow the same geomarketing3—or differentiation of consumers across space—that is a key component of non-Internet marketing.
Content can also be differentiated by jurisdiction, for ex-ample to offer state specials or to reflect local regulations. In The Economist (2001d), it was predicted that the mobile Internet (or mobile data services) will permit network operators to fine-tune location-specific content to let users know, for example, of up-to-date special offers or sales at stores within, say, 500 meters of a user’s current location.
Nations have used this same technology to control the types of information that can be disseminated within national space on the Internet. France has cited the ability to locate Internet users in a court case that decided to regulate Yahoo! to prevent that company from marketing Nazi paraphernalia to French citizens (The Economist 2001b). In Saudi Arabia and Singapore, the national governments enforce morality regulations by the selective screening of Internet content to prevent “immoral content” from being downloaded in those countries (The Economist 2001b).
Geography therefore remains important in a number of ways that conspire to deny the placelessness of cyberspace. From the physical capacity of infrastructure, to the flow of information, to the production of Internet content, to what information can be viewed, grounded geographic contexts and the grounded social relations that are unevenly distributed across those contexts govern access to GI. As pointed out in The Economist (2001c:20):
It is undoubtedly true that the Internet means that the distance between two points on the network is no longer terribly important. But where those points are [emphasis added] still matters very much. Distance is dying; but geography, it seems, is still alive and kicking.
Context Matters: Adoption and Use of ITHow people create and make use of online information and ser-vices are also particular to the socio-spatial context within which such services are received. For example, the e-commerce-only online grocer GroceryWorks was unprofitable as an online-only retailer with dedicated warehouse space. When Tesco, the United Kingdom-based grocery chain giant, bought it and re-organized it to integrate online sales with its own bricks-and-mortar op-erations, the company was able to successfully capitalize on its network of existing stores, store design (easy picking), reputation, and existing supply chains (The Economist 2001a). The nature of e-commerce in Japan similarly shows the importance of the social context in which ITs are embedded. In Japan, a tradition of inexperience with catalogue shopping, a population with few credit card users, and low penetration rates for home computers make for a distinctive social and physical context for e-commerce
(Aoyama 2001). To overcome these barriers, e-commerce retail-ers have joined forces with neighborhood convenience stores to provide a set of dispersed, easily accessible physical locations for ordering, paying for, and sending e-commerce goods, proving that “interaction between real space and cyberspace need not take a single form” (Aoyama 2001:133). As these examples illustrate, retailers can enhance their accessibility via IT (i.e., by becoming e-tailers as well as—not instead of—retailers) by capitalizing on their pre-existing geographies.
The uneven, context-specific adoption and use of Internet technologies is highlighted in one study of four different scientific disciplines. Walsh (1997) surveyed scientists in physics, biology, chemistry, and mathematics about their use of Internet technolo-gies. He found that modes of Internet use differed in important ways depending on the social practices and technical limitations of each discipline. For example, Walsh found that physics re-searchers, who are often involved in large interdependent and capital-intensive projects requiring large amounts of information sharing and communication, use the Internet largely to coordinate their activities. On the other hand, chemists, whose research is often commodifiable, are less likely to share their early findings online for fear they will disseminate proprietary information. For chemists, then, Internet use focuses on accessing databases of published research abstracts. Walsh’s study makes it clear that the social context from which people seek information affects how they use the Internet and the context from which people disseminate (or not) information shapes the way these technolo-gies can be used.
Another illustration of the importance of grounded socio-spatial context in Internet use comes from a pilot study that we undertook in Worcester, MA in 1999 to explore some of the ways in which employers use online recruiting to find workers (Niles and Hanson 2003). We had hypothesized that employers would use the Internet to broaden their search for employees, both socially and spatially; that is, we thought employers would see the Internet as a way to gain access to a more varied pool of talent than was available locally through traditional methods of recruitment such as word of mouth and news-article advertise-ments. The results of our small case study suggested, however, that employers were often not seeking to broaden their applicant pool socially or (especially) geographically. Instead they were advertis-ing jobs on Internet job boards like Monster.com in the hope of capturing the attention of a type of employee they had already identified—via their traditional recruiting methods—as desirable. Perhaps most important, in terms of demonstrating the power of geography, the employers voiced a strong preference for hiring employees who already lived nearby.
These examples show how on-the-ground social organiza-tion affects the ways that Internet and other technologies are adopted and the uses to which they are put. The social context of technology and, in particular, the ways in which information and services that are available over the Internet are produced and consumed have an uneven geography that depends in part on pre-IT geographies. As the example of e-commerce in Japan

38 URISA Journal • Vol. 15, APA I • 2003 URISA Journal • Niles, Hanson 39
shows, this geographically uneven social context precludes singu-lar measures of accessibility. Measuring Internet access via home computer penetration rates in the U.S. flattens the variety of ways in which online services may be accessed and thus ignores the uneven social contexts of production and use.
Place Matters: Understanding and Applying InformationContext and place affect not only what information is made avail-able online and what technological means are used to receive it; they also affect what online information is sought and how that information can and will be applied. Virtual accessibility requires that people be able to find, make sense of, and apply informa-tion on the Internet: considering access to information as good in its own right overlooks the importance of the context within which that information is received and the reason for which it is sought. An individual’s social and spatial location places her/him in a context through which s/he learns how to use technologies and interpret information. The production of information in one context with little or no knowledge of how it will be found and interpreted by people in other contexts compromises the notion of accessibility.
The lack of appropriate skills required to find online informa-tion, as well as the lack of an appropriate context for understand-ing how to interpret and prioritize information according to one’s needs, can prevent many people from accessing the information they require. Research has shown that frustration with informa-tion overload and irrelevant downloads is a major stumbling block to accessing desired information online (Hoftsetter 1998, Dodge 2000, Kibirige 2001). Another study of new Internet users found that although initially many people had positive attitudes toward the Internet, often these people had only vague ideas of what purpose the Internet could serve (Kiesler et al. 1997).
Problems such as information overload and the difficulty of locating relevant information are likely due to incompat-ibilities between the context in which information is produced and those within which it is consumed. Three points need to be considered:
First, information available online is a product of a person, group, or firm/agency that is embedded in a social organization and/or set of social relationships. Information is posted online for a variety of reasons—from profit to public service to entertain-ment—that may involve motives not appreciated by the Internet surfer. The link between people and the online information that they seek is usually through search engines (as evidenced by the fact that search engines are the most popular ways of finding and accessing information on the Internet) (Kellerman 2000, Kibirige 2001). However, studies of Internet users show that popular search engines bias the information returned in an Internet search (be-cause these search engines specialize in different areas and never index more than one-third of the web on average) (Fornesca and King 2000, Kibirige 2001). Furthermore, because for the most part search engines are driven by a profit motive, or at least must
cover costs of production and operation, network operators have an incentive to please sponsors. Many search engines have adopted a system of “pay-for-placement” where “a rising number of [search engines] let companies pay to pop up prominently when people enter particular search terms” (Businesss Week 2001). Such a system may create little incentive for search engines to search out and index alternative, small-scale, highly specialized or local pages. In turn, the willingness to please sponsors might translate into less effort to find relevant information to fit the searcher’s particular needs. Sui (2000) argues also that information available online is not always the best or the most accurate information available; one could add that it is not always appropriate to suit the context from which it is sought. If content is produced disproportionately in the U.S., and within the U.S. disproportionately in its historically dominant political and economic centers, there is a question of whether the information produced in these places is really accessible, relevant, or interesting to a person in for example the Southern Sudan. Having information structured in one place so that it suits a particular set of social relations does not mean it will necessarily make sense to those who do not share that social understanding.
Second, the skills needed to harness the Internet in this way are usually acquired through social processes that mostly occur in places. Most people learn how to use the Internet from other people. In much the same way as having a car does not predict one’s ability to drive, simply putting a personal computer in ev-ery home does not ensure that everyone will be flying down the information highway.
An important study called “HomeNet” conducted in Pitts-burgh provided a large number of households with a computer, modem, and Internet software and measured how, how often, and for what purpose these were used. One of the most inter-esting findings of the HomeNet study was that individuals in households with at least one heavy Internet user were less likely to have the otherwise frequent experience of having trouble get-ting started on the Internet owing to a lack of understanding of overall concepts and difficulty diagnosing problems (Kraut et al. 1996). Another telephone poll in two U.S. states similarly finds that individuals in multi-person households, and especially in households with children, are more likely to be frequent Internet users (Bucy 2000), presumably because of increased motivation and skills. These studies show how on-the-ground social relations in the home provided a social form of access via motivation and technical help.
Third, obtaining and learning how to use the requisite tech-nology may be the first step in accessing information, but also necessary is the ability to translate information acquired online so that one can use it for productive purposes. Seely-Brown and Duguid (2000) argue that information is useful only when inter-preted with a set of knowledge; social contexts provide knowledge that imbues information with meaning. Knowledge, they claim, is a result of learning to be a practitioner, and practice shapes the assimilation of how information can be dealt with, which is knowledge: “Both examples, the classroom and the workplace, indicate how the resources for learning lie not simply in informa-

38 URISA Journal • Vol. 15, APA I • 2003 URISA Journal • Niles, Hanson 39
tion, but in the practice that allows people to make sense of and use that information” (Seely-Brown and Duguid 2000:133). In this vein, Kibirige and DePalo’s (2000) research examining the online searching strategies of undergraduates, graduates, and faculty found that those with more specialized and/or advanced training had an easier time finding information online.
The HomeNet study in Pittsburgh found that “local Pitts-burgh and neighborhood information and communication ser-vices have special appeal to participants” (Kraut et al. 1996:60). Kraut et al. attribute the appeal of local sites to: 1) searching for information that is only useful at the local level (e.g., bus sched-ules, information about social services), and 2) the idea that local sites appeal to “people’s social identities, [Where] [p]eople want to participate in and be part of groups, and geography provides one basis for group formation” (p. 60). People visit local sites because local information is embedded in a familiar context that enables people to understand and make productive use of information. In addition, people might visit local sites frequently because they are more heavily advertised in local areas and/or are more frequently recommended by friends and/or family living locally.
Together, these results imply that the more aware people are—before going online—of the information available online and how it is useful in their own context, the more efficient the search and the more accessible the information retrieved.
Information that appears online is first filtered and inter-preted through the socio-spatial context of the producers of Internet content, and then that information is filtered through the socio-spatial context of the individual accessing the informa-tion. These filters may hamper the ability of information seekers to apply Internet content to the specific need for which they sought that information. Research in the medical health field has found that, despite the widespread dissemination of medical information on the Internet, individuals do not see the Web as the easiest way to access health information; they trust advice from doctors and/or nurses far more than the information they receive online (Pennbridge et al. 1999). The unspecific, decon-textualized medical advice available online is unlikely to replace the advice of a trained doctor who knows the specifics of a case. For these reasons too, Wimmer et al. (2000) predict that while services and information on the Web may curtail the demand for many market intermediaries (middle men), new intermediaries will be needed. The Internet creates a demand for new kinds of specialists, experts, and purveyors of quality information to disseminate and translate online information so that people can use it to make competent decisions on the transactions that the Internet now allows them to make themselves.
Information online, as elsewhere, is filtered through both the socio-spatial context of the producers and the consumers of that information. Information available on the Internet is unique as it often comes without any traditional ways to identify the purposes and biases with which it is produced or the audience for whom it is intended. As researchers of virtual accessibility, we may be overlooking social context as an important new frontier on the digital divide: the potential for fundamental incompatibilities
between the socio-spatial context for information production and the context of its consumption. The degree to which people are able to interpret and filter Internet information to suit their specific contexts will greatly affect how accessible that informa-tion really is.
The Ascendance of E-Mail: The Importance of Information Tailored to the IndividualIn light of the importance of social and spatial context, it is not surprising that the most popular online activity—the one that keeps people logging on—is e-mail. U.S. studies cited by Bikson and Panis (1997) show that e-mail is the Internet activity most often used by the largest proportion of people. The HomeNet project in Pittsburgh similarly found that e-mail, and especially the desire to check if a new message had arrived, was the main service that kept people logging on (Kiesler et al. 1997). Once online to check e-mail, people may then go elsewhere on the Internet; in the words of the researchers, “For our sample, in-terpersonal communication via E-mail was both more popular and more sustaining than information acquisition via the Web” (Kiesler et al. 1997:3).
E-mail is a unique online activity in that e-mail messages are almost entirely specific to an individual; people receive informa-tion over e-mail that is related directly to them. E-mail messages have a context, people know why they are receiving an e-mail message, they know the origin of information, and therefore they are usually aware of the context in which the information is being sent. In short, e-mails assume the knowledge and context that will be used in receiving the information in them; they are embedded in a set of social relations that give people the con-text with which to process information. As the HomeNet study found “Compared to the Web, electronic mail is personalized, spontaneous, and interactive; the content of a particular message is usually tailored to the recipient and often takes into account their prior interactions” (Kiesler et al. 1997:3). The HomeNet study in Pittsburgh found that “e-mail sustains ongoing dialogues and relationships” (www.homenet.andrew.cmu.edu/progress/), and similarly Wellman et al. (2001) found that the Internet is especially used to maintain friends met in more traditional, on-the-ground ways. A survey by Wellman et al. of 39,211 visitors to the National Geographic Society’s Website found that not only is e-mail used especially to maintain active social ties to existing friends, but people use e-mail to contact friends who live physi-cally close more frequently (by three times) than they do friends who live at a distance. This study also found that the frequent use of e-mail is often associated with frequent face-to-face and telephone interactions, leading Wellman et al. to conclude that e-mail supplements but does not substitute for face-to-face and telephone communication.
The success of e-mail as the most popular online activity pro-vides an important clue about the importance of embedded social relations and social context in making information accessible or useful to the individual seeking or receiving online information.

40 URISA Journal • Vol. 15, APA I • 2003 URISA Journal • Niles, Hanson 41
Because information available on the Web is embedded in social or knowledge structures that are not always transparent to the person trying to access the information, it may be difficult for that person to understand how to comprehend and apply that information. Especially given the difficulty mapping and priori-tizing information available online, it is likely that some special knowledge is needed to make sense of the information that can be identified. A person might acquire the special knowledge with which to make sense of online information via general knowledge gained through socio-spatial context, via an explicit statement accompanying the online information which makes obvious its application, or via someone in the person’s social network refer-ring her or him to online information and by doing so providing a way to apply the information to the person’s needs.
Conclusion We have outlined some of the many ways that grounded geog-raphies mark cyberspace. Because pre-Internet geographies to a large extent shape Internet geographies, understanding patterns of individuals’ access to information on the Internet requires a close examination of the intersection of people’s use of IT and grounded socio-spatial relations.
Grounded geographies shape the Internet by guiding the placement of IT infrastructure such that—at regional and even intra-urban scales—physical access to the Internet closely resembles pre-Internet patterns of spatial access to goods and services. But physical access to Internet infrastructure alone does not equate to access. Pre-Internet geographies shape constraints on individuals’ accessibility to usable information and knowledge on the Internet in other ways as well. As suggested in the Wall Street Journal article mentioned at the outset of this article, the production of Internet content takes place (quite literally) in selected urban locations, and the content itself often reflects its specific geographic origins. A great deal of information on the Internet is also targeted to users in particular locations, and some nation-states have begun to regulate the Internet content that citizens within their boundaries can access. The ways in which people and institutions adopt and use the Internet also reflect pre-Internet geographies, such that one’s ability to obtain grocer-ies, for example, via the Internet differs by geographic location. Finally, we note the importance of geographic context in people’s ability to understand and usefully apply information accessed via the Internet. We cite the example of e-mail as testimony to the importance of context in Internet access.
By describing the key ways in which Internet access inter-sects with grounded social relations, we have pointed to some of the key constraints on Internet access that need to be addressed if the initial promise of the Internet to provide equal access to information is to be realized.
About the Authors
Sarah Niles is a Ph.D. Candidate in the Graduate School of Geography at Clark University. She has a Master’s Degree in Planning from the University of Toronto and her current research addresses the role of grounded social relations in the function of labor markets for temporary workers.
Corresponding Address:School of GeographyClark UniversitySarah NilesWorcester, Massachusetts [email protected]
Susan Hanson is the Jan and Larry Landry Professor and Chair of the School of Geography at Clark University. Dr. Hanson received her Ph.D. in Geography from Northwestern Uni-versity and her current research examines the difference that grounded, gendered social relations make to entrepreneurship activities in place.
Corresponding Address:School of GeographyClark UniversitySusan HansonWorcester, Massachusetts [email protected]
Acknowledgements
The authors thank Harlan Onsrud for the invitation to prepare this piece as a keynote address at the Spoleto conference and we thank the Spoleto participants for their reactions to our article. The authors are also grateful to the National Science Foundation for supporting this research through a Varenius seed grant.
This article was written while Susan Hanson was a Fellow at the Center for Advanced Study at Stanford; she gratefully acknowl-edges the fellowship support of the William and Flora Hewlett Foundation (Grant # 2000-5633).
Notes
1 The last report of the Office of Technology Assessment before the U.S. Congress abolished it in 1995 reached the same conclusion (Office of Technology Assessment 1995).
2 The term “grounded social relations” is used throughout to refer to interactions in physical, not virtual, space.
3 For a discussion of pre-Internet geomarketing, see Goss (1995).

40 URISA Journal • Vol. 15, APA I • 2003 URISA Journal • Niles, Hanson 41
References
Aoyama, Y., 2001, Structural Foundations for E-Commerce Adoption: A Comparative Organization of Retail Trade Between Japan and the United States. Urban Geography, 22(2), 130-153.
Bikson, T.K. and C.W. Panis, 1997, Computers and Connectivity: Current Trends. In S. Kiesler (Ed.), Culture of the Internet (Mahwah, NJ: Lawrence Erlbaum Associates), 407-430.
Bucy, E.P., 2000, Social Access to the Internet. Harvard Interna-tional Journal of Press/Politics, 5(1), 50-61.
Business Week, 2001, Search Engines: Leading Us Astray?, i3744, 8.
Castells, M., 1996, The Rise of the Network Society (Oxford: Blackwell).
Charp, S., 2001, Bridging the Digital Divide, T H E Journal (Technological Horizons in Education), 28(10), 10.
Dodge, M., 2000, Accessibility to Information with the Internet: How Can it be Measured and Mapped? In Janelle, D.G. and D.C. Hodge (Eds.), Information, Place, and Cyberspace (Berlin/Heidelberg/New York: Springer-Verlag), 187-199.
The Economist, 2001a, Surfing USA. June 30, 2001, 58-59.The Economist, 2001b, The Internet’s New Borders. August 11,
2001, 9-10.The Economist, 2001c, Special Report: Geography and the Net.
August 11, 2001, 18-20.The Economist, 2001d, Special Report: The Internet Untethered.
October 13, 2001, 12.Fornesca, T. and M. King, 2000, Incorporating the Internet
into Traditional Library Instruction. Computers in Librar-ies, 20(2), 38-44.
Goss, J., 1995, We Know Who You Are and Where You Live: The Instrumental Rationality of Geodemographic Systems. Economic Geography, 71(2), 171-198.
Hofstetter, F.T., 1998, Internet Literacy (Boston: Irwin/McGraw-Hill).
Kellerman, A., 2000, Phases in the Rise of the Information So-ciety. Info, 2(6), 537-541.
Kibirige, H.M. and L. DePalo, 2000, The Internet as a Source of Academic Research Information: Findings of Two Pilot Stud-ies. Information Technology and Libraries, 19(1), 11-17.
Kibirige, H.M., 2001, Internet Access in Public Libraries: Results of an End User Targeted Pilot Study, 1997-2000. Informa-tion Technology and Libraries, 20(2), 113-115.
Kiesler, S., R. Kraut, T. Mukhopadhyay, and W. Scherlis, 1997, HomeNet Overview: Recent Results from a Field Trial of Residential Internet Use. Carnegie Mellon University, The HomeNet Project, August 1997. http://homenet.hcii.cs.cmu.edu/progress/ovrview8697.html.
Kraut, R., W. Scherlis, T. Mukhopadhyay, and J. Manning, 1996, The HomeNet Field Trial of Residential Internet Services. Communications of the ACM, 39(12), 55-64.
McConnaughey, J.W. and W. Lader, 1998, Falling Through the Net II: New Data on the Digital Divide (Washington, D.C.: National Telecommunications and Information Ad-ministration).
Moss, M.L. and A.M. Townsend, 2000, The Role of the Real City in Cyberspace: Understanding Regional Variations in Inter-net Accessibility. In Janelle, D.G. and D.C. Hodge (Eds.), Information, Place, and Cyberspace (Berlin/Heidelberg/New York: Springer-Verlag), 171-186.
National Telecommunications and Information Administration, 2000, Falling Through the Net: Towards Digital Inclusion (Washington, D.C.: National Telecommunications and Information Administration).
Niles, S. and S. Hanson, 2003, The Geographics of Online Job Search Preliminary findings from Worcester, MA Environ-ment and Planning A, in press
Office of Technology Assessment, 1995, The Technological Re-shaping of Metropolitan America (Washington, D.C.: U.S. Government Printing Office), September 1995.
Pennbridge, J., R. Moya, and L. Rodrigues, 1999, Questionnaire Survey of California Consumers’ Use and Rating of Sources of Health Care Information Including the INTERNET. The Western Journal of Medicine, 171(5), 302-305.
Seely Brown, J. and P. Duguid, 2000, The Social Life of Informa-tion (Boston, MA: Harvard Business School Press).
Singer, M., 2001, Quova Acquires Realmapping, Gains More Internet Geolocation Technology. (http://siliconvalley.internet.com/news/article.php/3531_733021).
Sui, D.Z., 2000, The E-Merging Geography of the Information Society: From Accessibility to Adaptability. In Janelle D.G. and D.C. Hodge (Eds.), Information, Place, and Cyberspace (Berlin/Heidelberg/New York: Springer-Verlag), 107-130.
Walsh, J.P., 1997, Computer Networks and Scientific Work. In S. Kiesler (Ed.), Culture of the Internet (Mahwah, NJ: Lawrence Erlbaum Associates), 385-406.
Wellman, B., A. Quan-Haase, J. Witte, and K. Hampton, 2001, Does the Internet Increase, Decrease or Supplement Social Capital? Social Networks, Participation and Community Commitment. American Behavioral Scientist, 45(3), 436-455.
Wessel, 2001, Decentralization and Downtowns. Wall Street Journal, October 21, 2001, 1.
Wimmer, B.S., A.M. Townsend, and B. Chezum, 2000, Infor-mation Technologies and the Middleman: The Changing Role of Information Intermediaries in an Information-Rich Economy. Journal of Labor Research, 21(3), 407-419.

URISA Journal • Crompvoets, Bregt 43

URISA Journal • Crompvoets, Bregt 43
IntroductionAt present, of the 192 countries in the world, 120 are working on their national spatial data infrastructure (NSDI) in order to create an efficient environment for the access of spatial data. One of the main components of an NSDI is a national clearinghouse (McLaughlin 1991, Clinton 1994, Federal Geographic Data Committee 1997, Onsrud 1998). A spatial data clearinghouse can be defined as an electronic facility for searching, viewing, transferring, ordering, advertising, and disseminating spatial data from numerous sources via the Internet. Such a clearinghouse usually consists of a number of servers that contain information (metadata) about available digital data. A national clearinghouse aims to become a kind of shopping mall for all national avail-able spatial data as acquired by governmental agencies and/or industrial bodies.
The first national clearinghouse was established in 1994 in the United States. From that moment, there has been fast develop-ment of other clearinghouses throughout the world. Few studies exist with information about the worldwide status of national clearinghouses. Onsrud (1998) and Lance and Hyman (2001) presented a list of the existing national clearinghouses; however, no detailed description was included. To the best of our knowledge, no systematic periodical research has taken place with regard to the status of national clearinghouses. In order to fill this gap, in 1999 we started a survey of the World Wide Web, which was repeated every 6 months. The Web survey’s main objectives are to assess the worldwide progress, the spatial distribution, and the similarities and differences between national clearinghouses. Additionally, this Web survey can be considered as a starting point to gather information necessary for the analysis of the legal, economical, cultural, technical, and institutional impacts on the development of clearinghouses. Moreover, since clearinghouses are a key component of spatial data infrastructures, the evaluation of the findings of this Web survey might improve the planning and investing of spatial data infrastructures in a more strategic
World Status of National Spatial Data Clearinghouses
Joep Crompvoets and Arnold Bregt
Abstract: In December 2001, a survey of the World Wide Web was carried out to assess systematically the state-of-the-art of national spatial data clearinghouses around the world. The aim of this Web survey was to evaluate the status and the spatial distribution of the clearinghouse implementations and to find out the similarities and differences between them. Each clear-inghouse was characterized by the following criteria: the year of first implementation; the number of data suppliers; the type of data accessibility; the metadata-standard; the number of datasets; the most recently produced dataset; the number of Web refer-ences; the number of monthly visitors; the frequency of Web updates; the language used; and the use of maps for searching and registration-only access. For 59 countries, a national clearinghouse has already been established. The results of this Web survey show a large variety in history, use, content, and management.
way. This article presents only the results of data collected the month of December 2001.
Web Survey Methodology In order to assess national clearinghouse developments around the world, a Web survey was undertaken. The main intention of this survey was to examine the condition (status) of national clear-inghouses. Added to this survey is the word “Web” to emphasize that the needed information was mainly collected on the Web. Because of the easy access to the clearinghouse sites, the Web is an excellent means by which to gather the needed information quickly and objectively on a regular temporal basis. In this case, a traditional research survey, which would collect information by asking a set of pre-formulated questions in a predetermined sequence in a structured questionnaire to individuals (Hutton 1990), would not be a suitable approach to collect the needed information quickly, objectively, and easily.
The Web survey began in December 1999 and was conducted in a systematic and periodical manner. The procedure consisted of the following two steps: 1) making an inventory of all existing national clearinghouses on the Internet; and 2) measuring several characteristics to describe each clearinghouse.
The inventory (step 1) was compiled by extensive browsing of the Internet, reading related literature, and contacting experts and several Webmasters. Clearinghouses were characterized (step 2) based on the following criteria: ease of measurement, objective character, and clear presentation of history, content, and use and management of the clearinghouse. The following 12 character-istics were measured: 1) the year of first implementation; 2) the number of data suppliers; 3) the type of data accessibility; 4) the metadata-standard used; 5) the number of datasets; 6) the most recently produced dataset; 7) the number of Web references (Al-taVista and Google); 8) the number of monthly visitors; 9) the frequency of Web updates; 10) the languages used; 11) the use of
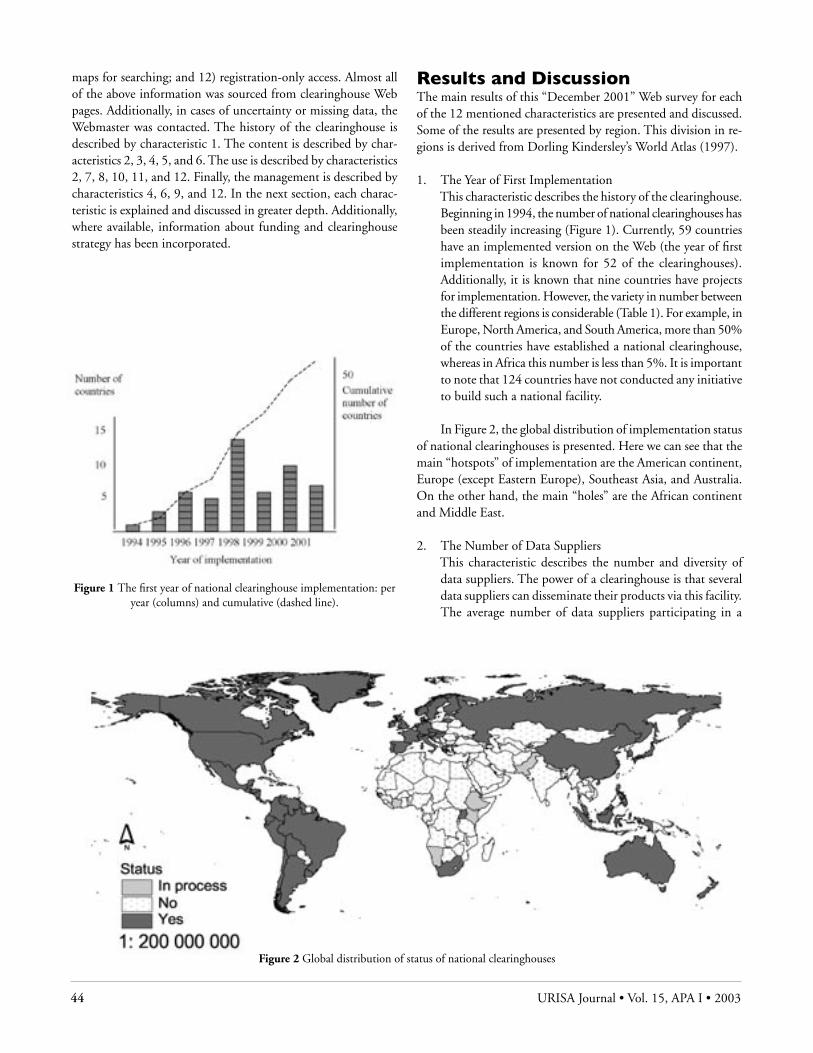
44 URISA Journal • Vol. 15, APA I • 2003 URISA Journal • Crompvoets, Bregt 45
maps for searching; and 12) registration-only access. Almost all of the above information was sourced from clearinghouse Web pages. Additionally, in cases of uncertainty or missing data, the Webmaster was contacted. The history of the clearinghouse is described by characteristic 1. The content is described by char-acteristics 2, 3, 4, 5, and 6. The use is described by characteristics 2, 7, 8, 10, 11, and 12. Finally, the management is described by characteristics 4, 6, 9, and 12. In the next section, each charac-teristic is explained and discussed in greater depth. Additionally, where available, information about funding and clearinghouse strategy has been incorporated.
Results and DiscussionThe main results of this “December 2001” Web survey for each of the 12 mentioned characteristics are presented and discussed. Some of the results are presented by region. This division in re-gions is derived from Dorling Kindersley’s World Atlas (1997).
1. The Year of First Implementation This characteristic describes the history of the clearinghouse.
Beginning in 1994, the number of national clearinghouses has been steadily increasing (Figure 1). Currently, 59 countries have an implemented version on the Web (the year of first implementation is known for 52 of the clearinghouses). Additionally, it is known that nine countries have projects for implementation. However, the variety in number between the different regions is considerable (Table 1). For example, in Europe, North America, and South America, more than 50% of the countries have established a national clearinghouse, whereas in Africa this number is less than 5%. It is important to note that 124 countries have not conducted any initiative to build such a national facility.
In Figure 2, the global distribution of implementation status of national clearinghouses is presented. Here we can see that the main “hotspots” of implementation are the American continent, Europe (except Eastern Europe), Southeast Asia, and Australia. On the other hand, the main “holes” are the African continent and Middle East.
2. The Number of Data Suppliers This characteristic describes the number and diversity of
data suppliers. The power of a clearinghouse is that several data suppliers can disseminate their products via this facility. The average number of data suppliers participating in a
Figure 1 The first year of national clearinghouse implementation: per year (columns) and cumulative (dashed line).
Figure 2 Global distribution of status of national clearinghouses

44 URISA Journal • Vol. 15, APA I • 2003 URISA Journal • Crompvoets, Bregt 45
First Year of Implementa-
tion
Total No. of
Countries
No. of African
Countries
No. of Asian Countries
No. of Australian Countries
No. of European Countries
No. of North AmericanCountries
No. of South American Countries
1994 1 1
1995 3 3
1996 6 1 3 1 1
1997 5 2 2 1
1998 14 1 3 1 6 2 1
1999 6 3 1 2
2000 10 1 3 4 2
2001 7 3 1 3
Date unknown 7 3 3 1
1994 – 2001 59 2 9 2 24 12 10
Building phase 9 4 2 0 1 2 0
No implementation 124 45 38 12 18 9 2
Table 1 The first year of national clearinghouse implementation (distributed per region).
Region Average StandardDeviation
Median Maximum number
Africa (2) 11 11 10 19
Asia (9) 7 6 5 16
Australasia & Oceania (2) 14 17 14 26
Europe (24) 33 49 12 133
North America (12) 204 551 6 1758
South America (10) 4 3 2 8
World (59) 54 239 6 1758
Region Abstract Metadata Data (+ metadata)
Africa (2) 1 1 0
Asia (9) 1 6 2
Australasia & Oceania (2) 0 1 1
Europe (24) 6 16 2
North America (12) 0 9 3
South America (10) 2 8 0
WORLD (59) 10 41 8
Table 2 The number of data suppliers of national clearinghouse per region. The number in parentheses is the number of clearinghouses analyzed per region.
Table 3 The type of data accessibility of national clearinghouse per region. The number in parentheses is the number of clearinghouses analyzed per region.

46 URISA Journal • Vol. 15, APA I • 2003 URISA Journal • Crompvoets, Bregt 47
clearinghouse is high; however, there is great variety between the clearinghouses (Table 2). For Austria, the Czech Republic, Slovenia, and the U.S., the number of data suppliers exceeds 100. In Canada, there are 1758 data suppliers. This contrasts with the 35 clearinghouses that have fewer than 10 suppliers (notably in South America and Asia with their powerful national mapping agencies).
3. The Type of Data Accessibility This characteristic describes the presentation of the content.
Not all existing clearinghouses give access to data or metadata. For example, in some cases the clearinghouse presents only a simple (not standardized) description of the datasets. For this reason, three classes of accessibility are distinguished: 1) abstract (simple/short description about the databases without using any formal meta-data description); 2) metadata; and 3) data (+metadata). In most clearinghouses, the user has access to metadata (Table 3). However, in eight countries (Australia, Canada, Dominica, Finland, Malaysia, Portugal, Singapore, and the U.S.), an option exists to access the data itself.
4. The Metadata-Standard Used This characteristic describes the metadata-standard used. With
the diverse sources from which spatial databases are built, it is extremely important to maintain information about the content, quality, source, and lineage of the data. A number of standard organizations have developed (or are in the process of developing) standards for storing and maintaining metadata. The most mature of these have been developed by the Federal Geographic Data Committee (FGDC) (1995) and the European Committee for Standardization (CEN/287 1996). These metadata-standards form the backbone of national clearinghouses. The FGDC metadata-standard is the most applied and distributed standard around the world (Table 4). The CEN standard is only applied in Europe. Recently, the International Organization of Standardization has created the ISO19115 standard (ISO/TC-211 2001). Currently, 10 countries have started a project to apply this last-mentioned standard for their national clearinghouse
5. The Number of Spatial Datasets A means to quantify the content of a clearinghouse is
the number of datasets. However, it does not represent the importance of the accessible datasets to the economic and social development of the country. The variety in the number of datasets is enormous (Table 5). For example, the U.S. federal clearinghouse can give access to almost 100,000 datasets (December 6, 2001), while the average of the 24 European clearinghouses is 440. The difference in the total number of accessible datasets between the U.S. and Europe is easily noticed (100,000 vs. 10,000). In total, the clearinghouses describe 170,000 spatial datasets together. 10 clearinghouses have more than 1000 datasets described (Australia, Austria, Canada, the Czech Republic, Japan, Mexico, South Africa, Switzerland, Uruguay, and the U.S.).
6. The Most Recently Produced Dataset This characteristic describes the up-to-date nature of content
and the management of content in the clearinghouse. It is
Region CEN FGDC Na-tional
Others
Africa (1) 1
Asia (8) 3 2 3
Australasia & Oceania (2) 1 1
Europe (18) 7 4 7
North America (12) 11 1
South America (8) 8
WORLD (49) 7 23 8 11
Table 4 Metadata-standards as used by national clearinghouses per region. The number in parentheses is the number of clearinghouses
analyzed per region.
Region Average number
Standad deviation
Total number of data sets
Median Minimum Maximum
Africa (2) 1561 2198 3122 1561 6 3115
Asia (6) 676 857 4056 260 9 1782
Australasia & Oceania (2) 15,031 21,249 30,062 15,031 5 30,056
Europe (22) 440 867 9768 118 8 3011
North America (10) 11,802 31,089 118,020 211 8 99,649
South America (8) 721 1646 5768 38 7 4735
WORLD (50) 3616 14,618 170,796 111 5 99,649
Table 5 The number of datasets described within national clearinghouses per region. The number in parentheses is the number of clearinghouses analyzed per region.

46 URISA Journal • Vol. 15, APA I • 2003 URISA Journal • Crompvoets, Bregt 47
Region Average Duration (months)
Standard Deviation
Median (months)
Mini-mum Maxi-mum
Africa (2) 31 41 31 2 60
Asia (6) 47 19 55 23 66
Australasia & Oceania (2) 2 1 2 1 2
Europe (22) 21 31 9 1 126
North America (10) 15 12 17 1 29
South America (8) 73 106 43 1 257
WORLD (50) 28 44 15 1 257
Table 6 The duration in months between date of the Web survey (December 2001) and the date of the most recently produced dataset. The number in parentheses is the number of clearinghouses analyzed per region.
Number of Web References“AltaVista”
Number of Web References “Google”
Region Ave-rage STD Median Maxi-mum Ave-rage STD Median Maxi-mum
Africa (2) 50 56 50 89 41 43 41 71
Asia (9) 151 148 105 477 59 112 52 175
Australasia and Oceania (2) 3084 2851 3084 5100 1315 913 1315 1960
Europe (24) 320 792 42 3642 123 129 67 502
North America (12) 96 168 40 480 146 351 55 1080
South America (10) 112 140 48 428 76 78 53 213
WORLD (59) 312 857 50 5100 145 309 54 1960
Table 7 The number of Web references by AltaVista and Google search engines per region (STD = STANDARD deviation). The number in parentheses is the number of clearinghouses analyzed per region.
the difference in months between the date of Web survey and the date of the most recently produced dataset described in the national clearinghouse. On average, the time of the production of the most recent dataset is more than 2 years (Table 6). However, 22 national clearinghouses describe spatial datasets produced within 1 year of the Web survey. However, for 12 national clearinghouses, this duration is longer than 3 years (mainly countries located in South America or Asia).
7. The Number of Web References This number can be interpreted as a means to measure
the popularity (use) of the clearinghouse site within the Internet network. The “Free Link Popularity Service” http://www.linkpopularity.com (The PC Edge, Inc.) is used, which measures the number of links to the home page of the national clearinghouse that can be checked by the following search engines: “AltaVista” and “Google.” A well-linked popularity can dramatically increase traffic to the specific
Web site. The link popularity of national clearinghouse is high, which means that they are an excellent source of consistent and targeted Web traffic. However, the variety is enormous (Table 7). The “Number of Web references” does not differ that much between the regions and so the popularity of a national clearinghouse can be considered as universal. The following national clearinghouses have high link popularity: Australia, Canada, Colombia, Finland, New Zealand, Norway, the U.S., and Venezuela.
8. The Number of Monthly Visitors This characteristic describes the use of national clearinghouses
for accessing spatial datasets. This amount is related to the number of visitors who have visited the homepage of the clearinghouse. The average number of visits of this page exceeds the 5000 visitors. It is worth noting that the variety between the implementations is high due to some particularly popular clearinghouses (Table 8). The following national clearinghouses are visited the most: Canada, Finland,

48 URISA Journal • Vol. 15, APA I • 2003 URISA Journal • Crompvoets, Bregt 49
and Korean script). 29 clearinghouses use only their home language. These language problems reduce the accessibility to data (for English-speaking people).
11. The Use of Maps for Searching The use of this facility can improve the accessibility to data.
In 18 clearinghouses, maps can be used as an option to search for (meta)data. This relatively advanced alternative for searching is popular in Europe and Asia.
12. Registration-Only Access This characteristic describes the management and possible
limitations of use. Before accessing the data, users must register themselves by entering personal details. This characteristic could have a negative impact on accessibility. For eight national clearinghouses, the user is required to register to access metadata or data (Canada, El Salvador, Finland, Hungary, Malaysia, Singapore, Spain, Canada, and Uruguay).
Region AverageDuration
(days)
Standard Deviation
Median (days) Clearinghouses Updated Within
1 Day
Clearinghouses Updated more than 100 Days
Ago
Africa (2) 902 1270 902 0 1
Asia (9) 482 723 7 4 3
Australasia & Oceania (2) 12 13 12 0 0
Europe (22) 195 312 27 6 7
North America (9) 3 3 2 4 0
South America (10) 37 42 26 3 1
WORLD (54) 201 440 15 17 12
Table 9 The frequency of Web updates per region (days). The number in parentheses is the number of clearinghouses analyzed per region.
Region Average Standard Deviation
Median Minimum Maximum
Africa (1) 423 423
Asia (5) 1 055 382 1 120 618 1576
Australasia & Oceania (1) 4 378 4 378
Europe (10) 10 521 18 571 1 743 410 60 000
North America (6) 5 384 7 492 1 973 328 18 700
South America (3) 1 684 944 1 517 835 2 700
WORLD (26) 5 871 12 337 1334 328 60 000
Table 8 The monthly number of visitors per region. The number in parentheses is the number of clearinghouses analyzed per region. (note: the number of clearinghouses is much lower as illustrated in the other tables due to the fact that not all clearinghouse sites are able to count the
number of visitors).
Portugal, Slovenia, and the U.S.; Portugal’s clearinghouse has approximately 60,000 visits per month.
9. The Frequency of Web Updates This characteristic describes the management of the
content in the clearinghouse. One possible indication of a well-managed clearinghouse can be seen by the frequency of updated information. The average number of days of last update is high for the whole population of clearinghouses due to instances of poor management (with some updates exceeding 100 days) in Europe and Asia (Table 9). The variety between clearinghouses is high as, alongside the poorer managed clearinghouse, numerous excellently managed facilities operate (update within 1 day).
10. The Languages Used This characteristic describes the number and diversity of
users able to access data because of their familiarity and knowledge of the given language. 30 clearinghouses do not have a search mechanism written in English (in addition, five of these are written in Arabic, Chinese, Greek, Japanese,
48 URISA Journal • Vol. 15, APA I • 2003 URISA Journal • Crompvoets, Bregt 49
ConclusionsSince 1994, the number of national clearinghouses has steadily increased to a total of 59. Looking at the trend of implementation, countries can expect to see additional national clearinghouses established. In fact, building clearinghouses is a global activity (with the exception of Africa and the Middle East (as well as Australasia and Oceania)). Most existing clearinghouses are estab-lished in Europe, Southeast Asia, and North and South America. The main initiatives for establishment come from Anglo-Saxon countries, such as the U.S., South Africa, and Australia. The U.S., in particular, which is supported by the FGDC, has stimulated many (American continent) countries to build a clearinghouse. However, 124 countries have still not shown any initiative to build one. There are several reasons for this. For example, a country may not have appropriate network architecture or there may be institutional bottlenecks for implementation. The differences in content, use, and management between the clearinghouses are broad. An example of such broad difference in content is the total number of accessible datasets described in a clearinghouse. In the U.S. clearinghouse, this number is 10 times as high as the total number of all 24 European clearinghouses. The reason for such difference is due to each country’s unique historical, institutional, economic, legal, technical, and cultural setting. Especially in Eu-rope, there are great contrasts in the number of datasets, suppliers, visitors, Web references, and frequency of Web updates, probably as a result of the high institutional, economic, legal, technological, and cultural diversity within this region. However, similarities between clearinghouses do exist (for example, the type of data accessibility and the metadata-standard used).
The most applied metadata-standard is the FGDC. However, looking to the numerous projects to apply the ISO standard, it is likely that ISO19115 will be the most applied standard in the future. This international consensus standard reflects FGDC, CEN, and other inputs. It provides detail that goes beyond FGDC and CEN metadata, including special coverage of raster and imagery information. Currently, there are several initiatives to create implementable subsets and extensions of ISO19115 so that conversion of FGDC-support tools and implementations to meet ISO conformance requirements is facilitated (Federal Geographic Data Committee Metadata Staff Coordinator 2001). Looking to the average number of data suppliers, Web references, and visitors, we can conclude that national clearinghouses are a popular facility to distribute and access spatial data.
Finally, in the future, it is highly probable that many national clearinghouses will give access to spatial data itself and provide complementary services such as online mapping. However, a con-cern could be the low frequency of Web updates of several clear-inghouses due to poor management. Therefore, special attention has to be given to keep clearinghouse managers motivated for hav-ing a well-managed clearinghouse. Based on the 12 characteristics used, we can conclude that Australia, Canada, Portugal, and the U.S. have the best existing national clearinghouses. Additionally, this Web survey shows that not only the richest countries have good clearinghouses. Examples of relatively poorer countries with
suitable national clearinghouse are El Salvador, Nicaragua, and Uruguay. Based on the above research, for all countries, it seems that one of the keys for successful clearinghouse implementation is high political support and interest by means of funding and long-term strategy.
About the Authors
Joep Crompvoets is Assistant Professor of Geo-Information Science at the Wageningen University in The Netherlands. From 1999, he has been monitoring the development of national clearinghouses and spatial data infrastructures around the world.
Corresponding Address:Wageningen UniversityArnold BregtCentre for Geo-InformationP.O. Box 47, 6700 AA, WageningenThe [email protected]
Arnold Bregt is Professor of Geo-Information Science at Wa-geningen University. Following more than 15 years of experi-ence in the field of geographic information systems research and applications, his current areas of interest are spatial data quality, dynamic modeling of land use change, and spatial data infrastructures. From 1996 to 1998, he was one of the project leaders to develop a national clearinghouse for spatial data in The Netherlands.
Corresponding Address:Wageningen UniversityArnold BregtCentre for Geo-InformationP.O. Box 47, 6700 AA, WageningenThe Netherlands [email protected]
Acknowledgements
The authors would like to thank Dr. Gert Jan Hofstede and Dr. Monica Wachowicz of Wageningen UR for their critical com-ments and suggestions on earlier versions of this article. Addition-ally, the authors appreciate very much the numerous reactions of the Webmasters to all their questions.

50 URISA Journal • Vol. 15, APA I • 2003 URISA Journal • Craglia, Masser 51
References
CEN/TC 287, 1996, Geographic Information-Data Description-Metadata, Technical Report, prEN12657 (Brussels: CEN).
Clinton, W., 1994, Coordinating Geographic Data Acquisition and Access to the National Spatial Data Infrastructure. Executive Order 12096, Federal Register 59, 17671-4, (Washington, D.C.).
Dorling Kindersley, 1997, World Atlas (London: Dorling Kinder-sley Limited), 402 pp.
Federal Geographic Data Committee, 1995, Content Standards for Digital Geospatial Metadata Workbook (Washington, D.C.).
Federal Geographic Data Committee, 1997, Metadata to Clearinghouse Hands-On Tutorial. http://www.fgdc.gov/clearinghouse
Federal Geographic Data Committee (Metadata Staff Co-ordinator), 2001, Proposal for a National Spatial Data Infrastructure Standards Project, June 2001. http://www.fgdc.gov/standards/status/iso_metadata.doc
Hutton, 1990, Survey Research for Managers: How to Use Surveys in Management Decision-Making, 2nd edition (Basingstoke: Macmillan)
ISO/TC-211, 2001, Geographic Information: Metadata, Inter-national Standard 19115.
Lance, K. and G. Hyman, 2001, Adoption and Implementation of National Spatial Data Infrastructure in Latin America and the Caribbean. 5th Global Spatial Data Infrastructure Conference, Cartagena de Indias, Colombia, May 2001. http://codazzi4.igac.gov.co/gsdi5/m_sesion7.htm
McLaughlin, J., 1991, Towards National Spatial Data Infrastruc-ture. Proceedings of the 1991 Canadian Conference on GIS, Ottawa, Canada, Canadian Institute of Geomatics, Ottawa, Canada, March 1991, 1-5.
Onsrud, H.J., 1998, Compiled Responses by Question for Select-ed Questions. Survey of National and Regional Spatial Data Infrastructure Activities Around the Globe. Global Spatial Data Infrastructure survey. http://www.spatial.maine.edu/~onsrud/gsdi/Selected.html

50 URISA Journal • Vol. 15, APA I • 2003 URISA Journal • Craglia, Masser 51
IntroductionThe purpose of this article is to identify key issues that need to be researched further to support policies aimed at maximising access to geographic information (GI). To do so, it sets access to GI into the wider policy developments in Europe which today strongly focus on promoting the re-use of public sector information through more transparent conditions on access and exploitation. These developments are also starting to affect those parts of public sector information, such as geographic and meteo-rological data, that have traditionally been seen as commercially more valuable and therefore exempt from open-access policies. We are thus starting to move away from the polarization between the United States (federal) position in favor of open access and a European position in favor of cost recovery (Weiss 2002) toward greater convergence on both sides. With these considerations in mind, the following sections will consider recent developments at the European level, then focus on national developments, and then explore recent policy changes through a case study of Great Britain. On the basis of this analysis, the article identifies key research areas that deserve a concerted effort.
European Developments
BackgroundRecent policy developments on access to GI in Europe cannot be separated from the much broader issues relating to access to public sector information and the development of an Informa-tion Society. Before summarizing such developments, however, it is useful to consider some of the key facts and challenges that characterize the decision-making process at the European Union (EU) level.
The EU currently comprises 15 sovereign Member states, with a total population of almost 400 million, representing three
Access to Geographic Information: A European Perspective
Max Craglia and Ian Masser
Abstract: This article is offered to stimulate the formulation of a cross-Atlantic research agenda on access to geographic informa-tion. The article is organized in four sections. The first sets the context for the article. The second reviews at some length recent developments in Europe in relation to access to public sector information and the development of the Information Society. The geographic information dimension of these developments and the emergence of a strong environmental policy framework are also discussed. The third section focuses on developments in data policy at the national level using the United Kingdom as an example, as this country has often been depicted as being, in policy terms, at the antithesis of the United States federal policy. The fourth section concludes the article and identifies three main strands of research on access to geographic information that deserve a concerted effort by the research community in Europe.
quarters of the total European population (Russia excluded). Ne-gotiations are almost complete for the enlargement of the Union to another 10 countries in 2004, with a further three countries to follow once they have met the relevant criteria. By the end of the decade, the EU may have up to 28 member countries and a popu-lation of some 550 million inhabitants. The challenges entailed by such massive enlargement are far from trivial and consume a significant amount of political energy within the EU.
The decision-making process in the EU is complex. The key institutions are the European Council, which includes the Prime Ministers and Heads of State of the member countries, and the European Parliament, which is elected by universal suf-frage and has co-decision powers on some issues. Sectoral policies are decided by the Council of Ministers (i.e., a collection of the competent ministers of the Member states) in co-decision with Parliament. The European Commission (EC) is the other key institution. The responsibilities of the EC are threefold: it initi-ates Community action; it ensures that the Treaties are correctly implemented; and it is the executive body for Community rules and programmes. In other words, the Council and Parliament must wait for a Commission proposal before they can legislate, and it generally falls to the Commission to apply or enforce the decisions taken and Community law. Therefore, the EC is not like a fully fledged national or federal government. Although powerful, it is essentially a relatively small administrative body, with a staff of 15,000, 20% of which are devoted to translate key documents in the 11 languages of the EU, managing a budget of € 97 billion (1999), which is just over 1% of the combined gross domestic product (GDP) of the Member states (www.europa.int).
The main policy areas of the EU in financial terms are agri-culture policy (€ 43 bn. per annum) and regional policy (€ 31 bn.), representing 45% and 33%, respectively, of the EU budget. Given that some 4% goes to administration, all other internal policy areas, external actions, and aid to the accession countries combined absorb only 18% of the budget. Given the relatively

52 URISA Journal • Vol. 15, APA I • 2003 URISA Journal • Craglia, Masser 53
small size of the EU budget compared to national budgets, its key role is one of coordination and support in leveraging public and private sector investments in the Member States. The competences devolved from Member States to the Union are set in Treaties that are signed by the European Council and are subject to ratifica-tion through the national Parliaments or national referenda. For the purpose of this article, one of the key developments is the 1993 Maastricht Treaty, which gave the Union responsibility in matters of trans-European networks in the transport, energy, and telecommunications sectors, thus providing the legal basis for the development of the Information Society.
Toward the Development of the Information SocietyThe Commission’s White Paper on Growth, Competitiveness, and Employment published in December 1993 (Commission of the European Communities 1993) stressed the urgent need for a pan-European infrastructure to help boost economic growth and competitiveness at a time in which Europe was facing significant problems of industrial restructuring and long-term unemploy-ment. The development of a society strongly based on the creation and use of information-related knowledge, products, and services was seen as the key to the creation of new job opportunities in Europe in the medium and long run. The term “Information Society” has since come to encompass the set of policies, initia-tives, and investments needed to achieve this goal.
Acting on proposals made in the White Paper, the Brussels European Council of December 1993 asked a group of high-level experts and industrialists under the chairmanship of Commis-sioner Martin Bangemann to draft a report on the Information Society suggesting practical ways in which its objectives could be achieved. The Bangemann Report (Commission of the European Communities 1994a) stressed the need to speed up the process of liberalization of the telecomm sector in Europe, hitherto largely in the hands of state monopolies, and reinforce universal service. It proposed a list of 10 initiatives to demonstrate the utility of new Telematics applications, including: distance learning and tele-working, traffic management, health care, trans-European public administrations networks, and city information highways. It is worth noting that the report stressed that financing the informa-tion infrastructure should come from the private sector, while the role of the EC would be to help target long-term investment in the exploitation of available technology. These proposals were incorporated into an Action Plan entitled Europe’s Way to the Information Society (Commission of the European Communities 1994b) and were also supported by a number of funding streams in the Fourth Research and Development Framework Programme 1994-98, with € 3.6 billion allocated to the Information Society Technologies programmes.
The European approach to the development of the Information Society hinged on the twin track of liberaliza-tion of the telecomm sector to achieve physical access and the “liberalization” of public sector information to achieve social access and economic objectives. Consequently, a key
milestone was the publication in early 1999 of the Green Paper entitled Public Sector Information (Commission of the European Communities 1998). This consultation article has played a major role in raising the debate across Europe on the opportunities created by the increased availability of public sector information (PSI) in digital format for its reuse be-yond the purposes for which it was originally collected. The article recognized existing barriers to accessing PSI, including different legal frameworks and pricing regimes, and posed pertinent questions on the extent to which such frameworks should be harmonized across Europe differentiating between administrative and non-administrative data, and “essential” versus value-added data.
After extensive consultation, this Green Paper was fol-lowed-up by a Communication (Commission of the European Communities 2001a) and a draft Directive (Commission of the European Communities 2002a), which make the case for ac-tion at the European level to remove the identified barriers and create a minimum level of harmonization on the commercial and noncommercial re-use of PSI. The draft Directive does not address issues of access to data, arguing that these are best dealt with at national, regional, and local levels. Instead, it focuses on ensuring a level playing field, transparency, and nondiscrimina-tory practices in the conditions for the re-use and exploitation of accessible data.
The increased emphasis on access to PSI has also ben-efited from the privatization of state-owned telecomms across Europe and the success of the European standard for mobile telephony (GSM), which was promoted by the EC in 1994, and has resulted in a multi-billion euros industry. This is a notable European success and its implications for future access to the Internet and through this to a wide range of public and private sector information may well be significant. In particular, the high penetration of mobile phones across all segments of society in Europe, coupled with the development of third-gen-eration phones providing high-speed Internet connections may give Europeans a different way of accessing information than Americans. This is shown in Figure 1, which clearly demon-strates not only the high level of use of mobile phones compared to personal computers (PCs) in Europe, but also that the U.S. and Canada stand out for being the only countries of this group where PC use outstrips mobile phone use. The survey by The
Figu
re 1
Sou
rce:
Eco
nom
ist,
13th
Oct
ober
200
1

52 URISA Journal • Vol. 15, APA I • 2003 URISA Journal • Craglia, Masser 53
Economist (2001) on the developments leading to a mobile Internet explains these differences as follows.
America’s enthusiasm for PCs, and lack of enthusiasm for mobile phones, is due to a combination of factors, but mainly to the relative prices of fixed and mobile calls. In Japan, expensive access to the fixed Internet drove users to mobiles; in America it was mobiles that priced themselves out of the market. Local calls are free, and PCs are cheap. Mobile phones, on the other hand, suffer the huge drawback that users are charged to receive calls, so Americans tend to leave their mobile phones switched off to avoid having to pay for unwanted incoming calls. Mobile network coverage is patchy and rates until recently were high. So teenagers who want to keep in touch with their friends are given their own phone line, a PC and a dial-up account with AOL, the world’s largest Internet-access provider. Soon they are happily sending and receiving instant messages through their PCs.
Their counterparts elsewhere in the world, in contrast, are brandishing mobile phones and sending text messages. Mobile phones have become even more appealing to teenagers in Europe since the advent of “pre-paid” phones, which can be replenished with vouchers on sale at newsagents and corner shops. Pre-pay-ment, which originated in Italy to exploit a tax loophole, means that even people without bank accounts (such as children) can have mobile phones. It also enables users to control their spend-ing. (The Economist, October 13, 2001:11)
It is against this backdrop that there continues to be a significant political momentum behind the development of the Information Society in Europe. This was clearly shown by the adoption of a new “eEurope” political initiative by the European Council in 1999 (Commission of the European Communities 1999a) whose key objectives are to bring all citizens, business, and administrations online, promote education, the availability of venture capital, and ensure that the whole process is socially inclusive.
The eEurope initiative has been followed by Action Plans for 2002 (Commission of the European Communities 2001b) and for 2005 (Commission of the European Communities 2002b) focusing on cheaper Internet access, education and skills, and key application areas including e-commerce, health, and the delivery of government services and information. Of particular relevance for this discussion is the increased emphasis on e-government, with binding agreements among Member States to reach set targets for the delivery of public services on line by 2005, and as a corollary, much increased access to public sector information by all citizens. The Action Plans are largely funded by national governments, with some core EU funding.
The developments reviewed above indicate the concerted effort made in Europe for the development of the Information Society, key planks of which have been the privatization of the state-owned telecomm monopolies, the steps toward a common legal framework including issues of Intellectual Property Rights (IPR) and data protection, and the agreement of common tech-nical standards such as GSM that have fostered a multi-billion euro industry that is creating millions of new jobs. It is against
this backdrop that the developments relating specifically to GI need to be understood.
The GI DimensionRecent European policy developments relating to GI have been reviewed by Craglia and Masser (1997), Masser (2001), and Longhorn (2001), among others. These centre on the initiative taken by the European Commission in 1995-97 to develop a policy framework for GI in Europe (GI2000), which was intended to take the form of a Communication to the European Council and Parliament on the importance of developing core reference data, metadata standards, and catalogues, and a mechanism for co-ordination through a High-Level Working Party.
These three main elements echo the main features of the national spatial data infrastructure (NSDI) in the U.S., although the relatively small budget of the European Commission and the lack of European agencies with a mandate to collect pan-European data make it difficult to take a strong lead. Hence, the develop-ment of a Strategic Defense Initiative (SDI) in Europe has to be supported essentially by the Member States in partnership with the private sector, while the role of the EC is one of political coordination.
The discussions of the GI2000 drafts held with the various stakeholders in government agencies, industry, research, and user communities were helpful in finding common ground and raising awareness of the issues involved. Although the intended Com-munication did not materialize due to a perceived lack of support from industry and the low political visibility of this initiative, there have been several projects funded or co-funded by the EC to sup-port key elements of a future infrastructure. With respect to the development of policies for access and dissemination, the focus shifted for a few years away from GI per se toward the broader context of public sector information, in which GI is singled out as one of the major, and potentially more valuable, components (Pira International et al. 2000). Very recently, however, we have started to see a renewed recognition that GI is crucial to informed policy-making, particularly in the context of environmental policy as reviewed below.
The Environmental DimensionDuring the last 20 years, there has been an increased awareness across Europe of environmental issues. This is due to global developments such as the Bruntland Report on sustainable development, the 1992 Rio Earth Summit, and the 1997 Kyoto Protocol on Climate Change, local developments including the increasing profile of environmental activists and pressure groups, and European developments with the accession in 1995 of Swe-den, Finland, and Austria, which have traditionally held the local environment in high regard. In recognition of these pressures, environmental policy was identified as a competence of the EU in the 1993 Maastrich Treaty, and “sustainable development” was added to the core objectives of the EU in the Amsterdam Treaty of 1996.

54 URISA Journal • Vol. 15, APA I • 2003 URISA Journal • Craglia, Masser 55
As a result, there has been a noticeable shift in emphasis in European policy from a sectoral, vertical approach to a more integrated horizontal one that pays much more attention to the cumulative environmental impacts of policies such as agriculture, transport, and regional development. Therefore, spatial planning at the regional scale has emerged as a powerful framework for analysis, co-ordination of intervention, and evaluation of impacts. The formulation of the European Spatial Development Perspec-tive (Commission of the European Communities 1999b) is the most clear embodiment of this approach, but its principles are also present in the other areas of policy. These include, for example, the shift in agricultural policy from direct support to farmers toward integrated rural development and the new requirements for integrated plans for coastal zone management.
The regional approach to planning, the increasing recogni-tion of the importance of local issues and local stakeholders, and a tightening of the requirements for monitoring and evaluation have also increased the importance of more focused interven-tions, and hence the importance of geographic information to assess needs, target intervention, and monitor effectiveness. The increasing requirement to adopt GIS for policy monitoring and evaluation in fields such as agriculture and water management are examples of this increasing importance.
As the need for better monitoring and evaluation in complex environments is recognized, so are the current deficiencies in harmonized, consistent datasets and indicators at the appropriate geographic scale and time series. To address these data limita-tions, we are starting to see a major shift in emphasis toward a more decentralized approach to data management, leaving the data at the level at which it can be more easily collected and updated, with an attempt to integrate information flows from local to global and vice versa more cohesively. Assuring access to such geographic and environmental data becomes an absolute pre-requisite in this scheme. Hence the initiative announced by the Directorate General for the Environment toward the devel-opment of an Infrastructure for Spatial Information in Europe (INSPIRE) to be embedded in Community legislation (www.ec-gis.org/inspire).
The legal basis for the development of INSPIRE is in the Water Framework Directive 2000/60/EC of the 23rd October 2000 which established a framework for community action in the field of water policy. This Directive has a strong spatial impact, as it defines river basins as the most appropriate spatial framework for a comprehensive approach to water protection. All Member States have to define such basins by 2003 and prepare manage-ment plans within the following 6 years. Such plans require the collection, integration, and analysis of a large body of data which the Directive specifies need to be in GIS format, including the physical, environmental, and socio-economic state of the basin.
Given the legal backing of this Directive, which is manda-tory on all Member States, and the extent of spatial information it requires in GIS format, it is clear that a coordinated framework is needed to avoid duplication and ensure compatibility of layers. Moreover, the data collected are seen as a foundation for other
thematic policies such as agriculture, transport, and regional policy. In this way, a process has been launched to develop a new legislative framework addressing “common base data collection, definition and use of standards, establishment of co-ordination bodies, information gaps, harmonizing community geographic information reporting requirements, metadata, and access con-ditions” (Perera 2001). These are, in essence, all the elements envisaged by the GI2000 proposals but this time there is strong political support and a legal basis from which to operate.
Summary“Europe works in mysterious ways” could be the title of this section, as it is often baffling to Europeans, let alone external commentators. What is clear from the above review is that Member States remain the focal point for decision-making in Europe, even in those areas where competence is granted to the EU through international treaties. This is all the more clearly demonstrated when considering that EU funding is just over 1% of the combined GDP of the EU 15, compared, for example, to 18% of the GDP spent by the federal government in the U.S. (http://www.whitehouse.gov/omb/budget/fy2002/balances.pdf). EU funding is therefore used for direction and coordination and to leverage funding from the public and private sector in the Member States.
With respect to access to information, the review has shown that a key priority has been given to increasing physical and eco-nomic access through the privatization of the telecomm industry and the development of common standards. More recently at-tention has turned to public sector information, with a focus on services to the citizen and government-to-consumer relationships. Although geographic information is part of this, it is not the primary focus at the European level, although changes may occur with the new emphasis on environmental information.
The European success in relation to the use of mobile cell phones may have major implications for future access to the Internet by the majority of the population. Thus, many of the research questions that are dominant in the U.S. (see, for example, Sheppard et al. 1999) may need revisiting from a European per-spective based on the widespread access through mobile phones rather than through PCs.
When it comes to access to data, it is also clear that parallels with the U.S. context need to be viewed with great caution as there is no such thing as European data in terms of ownership, given that there are no European-wide agencies collecting data. All data come from the Member States and, although EU agen-cies may do a significant amount of work in harmonizing such data, the resulting IPR is at best mixed, and conditions of access are often unclear, given the variations in national policies. This may also change in the future with an increasing convergence of national policies as discussed in the following section.

54 URISA Journal • Vol. 15, APA I • 2003 URISA Journal • Craglia, Masser 55
National Policies On Data Access: A Case Study of Great Britain
OverviewIn recognition of the rapidly evolving picture with respect to poli-cies for access to public sector information and GI in particular in Europe, the European Commission and European Umbrella Organisation for Geographic Information (EUROGI) organized workshops in 1999 and 2000 to identify similarities and dif-ferences in policy in the EU Member States and the accession countries, respectively.
The first meeting looked at 10 of the 15 countries in the EU [Austria, Belgium (Walloon Region), Finland, France, Germany, Ireland, Italy, the Netherlands, Portugal, and the United King-dom] plus Hungary and Norway. The key findings (Craglia et al. 2000) are summarized below: 1. There are many national initiatives across Europe concerned
with the development of data policies in general and GI policy in particular. In some cases (for example, in Portugal and the Netherlands), the GI dimension is very strong. In other countries, such as France, GI is recognized as an important element of public sector information, which highlights the potential conflicts between economic and social objectives.
2. Whilst in most countries the emphasis is on the national level, it is important to recognize that in other countries the regional/local dimension is particularly important, as in Germany, Italy, and Belgium.
3. Whilst some countries display a higher level of awareness than others, there is a sense to which the very rapid developments brought about by technology and the Internet are forcing governments to come to terms with the opportunities and challenges that these developments create. At the present time, most countries seem to have adopted policies in respect to access to public sector information. These may in some cases take the form of Freedom of Information legislation. There is, however, a quite different set of policies that needs developing in respect to a pro-active dissemination of public sector information. The Mandelkern (1999) report in France is a good example of the difference between access and dissemination. Disseminating information has major implications in respect to the organisation of work in the public administration, intellectual property, metadata (i.e., the first step in active dissemination is to declare what is available), relationships with the private sector, and pricing.
4. In respect to pricing, there are significant variations among the countries analysed. In some cases, a distinction has been drawn between essential data that is free of charge (i.e., paid for through general taxation) and value-added data for which there is a fee. In other cases, a policy has yet to emerge, and individual organisations act independently. Where a policy exists, a general principle that seems to emerge is that,
whatever the pricing policy, price should not deter use of data but on the contrary should encourage it.
What we are witnessing therefore is significant variation in a number of areas, the importance attributed to GI-related initia-tives, the conditions of access, pricing, overall awareness, but a distinct sense that no government can afford to do nothing, and that this realization is sinking in even among those countries that are less advanced.
The second meeting focused on 12 accession countries. The findings (Craglia et al. 2001, Craglia and Masser 2002) show the tremendous effort that all 12 countries are making in moving from the command economy that characterized the last 50 years of their history to an open market economy benefiting the whole of society and not just small parts of it. It is a huge challenge that involves not only the adoption of new legislation, but also a major reorganization of administration with decentralization at regional and local levels, and the development of new skills, procedures, and ways of working to be able to benefit fully from integration in the Union, administer wisely the funding opportunities that arise from this process, and guide the whole of society through this transition process.
With respect to the development of NSDI strategies, it is important to note that the vast majority of the countries analyzed have taken a very strategic view of GI infrastructures by formulat-ing and adopting national strategies either on their own or as part of a National Information Strategy and/or an Information Society Strategy. These are very significant initiatives because they are not related to the level of economic development of the countries involved, but show a genuine awareness of the strategic role of government in enabling the development of an Information So-ciety, and the key role of geographic information for both public policy and service provision. The degree of vision and political commitment displayed by most of the countries analyzed is ad-mirable and significantly higher than that of many governments of the existing EU Member States (Craglia et al. 2000).
Whilst these overviews give a snapshot of the situation in different countries at the turn of the millennium, it is also worth looking very briefly at the direction of change in policy by focusing on one country, Great Britain, which has often been portrayed as the other extreme to the U.S. approach to freedom of information.
Policy Shifts in Data Access in Great BritainThe situation in the Great Britain in the mid-1990s was described and evaluated by Masser (1998). The position at that time was still very much coloured by the 1986 Tradable Information Initiative, which was taking a robust commercial line asking all government departments to evaluate their information holdings and to charge market price where there was already an established market and where a market was yet to be developed to charge only for the costs incurred over and above those associated with handling the information for their own purposes. The other key policy initia-tive, the Next Steps Programme in 1988 (Chancellor of the Duchy

56 URISA Journal • Vol. 15, APA I • 2003 URISA Journal • Craglia, Masser 57
of Lancaster 1996) was to increase the efficiency of the public sector by turning many government departments into Executive Agencies with defined efficiency, financial, and customer service targets. These agencies include the Ordnance Survey (OS), HM Land Registry, and the Central Statistical Office, which were given cost recovery targets varying between 40% for the Meteorological Office to 100% for the Land Registry, the OS being somewhere in between at 80% (Masser 1998). Whilst the OS had made no-table successes in completing the national topographic database in 1995, its licencing system was cumbersome and geared to satisfy few large corporate users such as the utilities and local government rather than the mass market. This evaluation indicated many op-portunities but also significant variations in the policy framework for access to government data, with tensions between the desire to promote the use of information and to raise capital at the same time. With respect to the development of an NSDI-equivalent framework in the U.K., Masser argued that, whilst the core data were already largely in place, the metadata was rather limited and the coordinating mechanism rather weak. The development of a National Geospatial Data Framework promoted by the OS appeared promising, but had yet to deliver at that time.
The Labour government that came into power in 1997 started putting in place a number of major initiatives and re-views that have significantly changed the approach to government information. The key ones are itemized below:
Freedom of Information Act (Home Office 2000). The Act was passed in November 2000 after 3 years of consultation and debate. While the first draft of the Act in 1997 was welcomed for its liberal approach, successive drafts have significantly restricted the scope of the Act, creating a long list of exemptions which caused public outcry (see, for example, The Economist 1999). The final version passed by Parliament took on board some of the comments, but by most European and U.S. standards is still a rather restrictive legislation. For example, Sections 36-2c and 36-4 exempt government-held information, including statistical information, from disclosure if it “would otherwise prejudice, or would be likely otherwise to prejudice, the effective conduct of public affairs.” This clause is potentially much more restrictive than the simple harm test proposed in the 1997 original proposal. Moreover, the Act will not be implemented in full until 2005.
More progress has been made within the framework of the Modernising Government initiative (Cabinet Office 1999), which set out to increase collaboration across all government departments to deliver better and more efficient services, and set the target for all government services, including those by local government, to be available online by 2005. This was followed by Modernising e-Government in 2000 (Cabinet Office 2000), which laid down the four basic principles of public services in the information age: Building services around the citizens’ choices; Making government and services more accessible; Social inclusion; and Using information better.
An Office of the e-Envoy was created as part of the Prime Minister’s Cabinet Office to coordinate the achievement of the objectives set above (http://www.e-envoy.gov.uk/). Central to its strategy is the one-stop government portal UKOnline (http://www.ukonline.gov.uk/). Underpinning this portal is the re-quirement to all government organisations to document their information resources using an agreed-upon metadata standard and register them on the Information Asset Register. A search engine, Inforoute, then enables trawling through these assets (http://www.inforoute.hmso.gov.uk/). A separate Government Gateway portal is used for secure transactions between citizens and government (http://www.gateway.gov.uk/).
Government pricing policy and licencing systems have also been greatly simplified as a result of the review of Crown Copy-right (HMSO 2001) and the Cross-Cutting Review of the Knowl-edge Economy by the Treasury in 2000 (HM Treasury 2000). A Green Paper on the Crown Copyright (1998) set out a series of options including abolishing Crown Copyright, retaining it but with waivers in particular conditions, or waiving copyright as a general rule except for specified categories of information (http://www.hmso.gov.uk/copy.htm). The outcome of the consultation was a new regime whereby copyright is retained as a statement of the authoritative nature of the information. For “essential” information such as legislation, forms, and so on, copyright is waived and access is free. For basic or “raw” information, a sim-plified user licence easily available on the web is needed and the information is charged at marginal cost with no restrictions on reuse. For value-added information, and information from the Trading Funds, individual licences are needed and prices are set by the individual organisations.
The move toward a marginal cost charge for all “raw” infor-mation (unless otherwise specified by Government) was recom-mended by the Cross-Cutting Review of the Knowledge Economy (HM Treasury 2000). This recognized that “The current policy of average cost pricing creates a significant barrier to the re-use of information because it requires parts of government, where this is not core business, to make assessments and attributions of relevant costs and negotiate individual contracts in an area in which many departments and agencies are ill-placed to operate. Marginal cost pricing would remove this burden from both the department concerned and the private sector” (ibid. para 1.15). Additional reforms adopted by the Government as a result of this review include: Freedom for all government bodies to produce value-added
services charged at market prices provided that this can be achieved in a transparent manner and with a level playing field with the private sector.
Reposition the HMSO as a regulatory body for government content to ensure fair competition, including the overseeing of trading funds.
Request all public sector copyright owners other than the Crown Copyright, such as local authorities, to review their charging, licencing, and access practices and align

56 URISA Journal • Vol. 15, APA I • 2003 URISA Journal • Craglia, Masser 57
them with the new reforms (http://www.hmso.gov.uk/keyreforms.htm).
These changes have had two positive results. First, they provide a much clearer framework for all government agencies at central and local levels, and more importantly for users on ac-cess, charges, and licencing. Second, they enable a much increased provision of government information in electronic form free of charge or at affordable costs than was hitherto the case and, equally important, a mechanism through which this information can be easily found and accessed.
Whilst Trading Funds were exempted from the rule of mar-ginal cost recovery and are allowed to charge market prices for their value-added products, there has been a significant move to-ward developing a light-touch regulatory framework that ensures transparency of procedures and pricing, promotes fair trading and a level playing field, and reassures the market that dominant play-ers do not exploit their position to the detriment of others (Tullo 2002). The “Fair Trading Scheme” promoted by the HMSO in its new position as regulator requires the Chief Executives of the Trading Funds to publicly agree to these principles and publish their pricing policy. This is backed-up by an independent audit-ing mechanism to ensure adherence to these principles (http://www.hmso.gov.uk/regulation-outcome-anxb.htm).
Compared to the situation described by Masser in 1996, there is now a much more proactive engagement and leadership by central government in respect to access to public sector informa-tion. While in the past, government information was primarily seen as a commodity, there is a real sense to which the concept of custodianship is gaining ground, particularly given the extent to which access to information underpins key government policies for improving services delivery and departmental cooperation. This process, however, is not without some setbacks and some resistance as shown in the case of the Freedom of Information Act. On the whole, however, the policy changes described bring the U.K. much more in line with the developments in other parts of Europe, and we can see clear convergence with the policies formulated in e-Europe (Commission of the European Communi-ties 1999a) and with other national governments in respect to a distinction between essential, core, and value-added information (Craglia et al. 2000).
Accessibility to GI has also increased, not only through the OS, but through other government departments such as the Office for National Statistics (see, for example, http://www.statistics.gov.uk/neighbourhood/home.asp) and through the repackaging of government information by the private sector (see, for example, www.upmystreet.com). These developments have largely been driven by the market, technology, and broader government policy, rather than through the development of a specific NSDI. In fact, the closest policy that the U.K. had in this respect, the National Geospatial Data Framework, has now been abandoned, while its metadata service is now managed by the AGI, the Association for Geographic Information (www.agi.org.uk).
Summary and ConclusionsTosta and Domaratz (1997) made the point that the success of the NSDI was not so much due to a splendid enlightenment of American decision-makers on the value of GI, but to the NSDI fitting the political agenda of the Clinton administration to “re-invent” the federal government (Gore 1993) and was thus included in a packet of recommendations “focused on establishing accountability and control at the lower levels of Federal agencies, as well as at state and local government agencies” (Tosta and Domaratz 1997:21).
In the two main sections of this article, we have indicated that, in Europe, access to GI is part of a much broader picture on access to public sector information and the development of the Information Society. This was launched in the early 1990s as a policy that was aimed at job creation in the face of massive structural changes in the European economy. Over time, the achievement of social and environmental objectives has also strengthened the momentum behind this policy, thus providing a virtuous alliance of interest.
The policy environment is very dynamic and moving toward a much increased provision of public sector information, often through paths that could not be envisaged even a few years ago as the case-study of Great Britain demonstrated. Moreover, the enlargement of the Union and the very proactive policies being pursued by the accession countries in respect to the Information Society and the development of spatial data infrastructures (see the Overview in the section entitled “National Policies on Data Access: A Case-Study of Great Britain”) suggests a number of important research strands that ought to be developed at the present time, which fall under three main strands: institutional, organisation, and economic/legal.
The first strand should focus on the role of governments in developing appropriate frameworks for sharing information horizontally across government departments and between public and private sector organisations and vertically from central to local government and individual citizens. As this article indicates, the great variety of approaches at national and regional levels across Europe and the U.S. create an excellent laboratory on which to study such processes. The focus on governments is particularly appropriate, given that they are at the same time the major pro-ducers, consumers, and regulators of public sector information in general and geographic information in particular.
The second strand should focus at the organisational level because this is the level at which major challenges exist to engen-der a culture of information documentation, sharing, and re-use. Over and over again, we witness that the best-intentioned policies flounder in their implementation not due to technical difficul-ties but organisational ones. At the same time, some of the rapid progress made in many central European countries appear to be related to the greater ability to change organisational behaviour and cultures during a time of rapid societal transition and change (Pauknerowa and Corbin 2002). Therefore, the relationship be-tween organisational cultures and access to GI, in both private and public sectors should be studied in greater depth relation to
58 URISA Journal • Vol. 15, APA I • 2003 URISA Journal • Craglia, Masser 59
the ability to adapt and change, and the incentives or disincentives for data sharing. Rigorous models exist to undertake cross national comparative studies in this area that should be built upon (e.g., Hofstede 1997 and Wehn de Montalvo 2003), as well as existing work in the field of information management.
Finally, the emergence and impact of regulatory frameworks, such as the one in Great Britain (see the section “Policy Shifts in Data Access in Great Britain”) which seek to protect the intel-lectual property rights of data providers while promoting wider access and the use of GI, trust among stakeholders, and a level playing field need to be closely monitored and carefully evaluated in both national and trans-national contexts. This is important because such frameworks are emerging throughout Europe, and are heavily promoted by European Commission policies such as those on the environment (INSPIRE) and the exploitation of Public Sector Information (Commission of the European Com-munities 2002a). Therefore, an evaluation of their impacts is absolutely necessary.
In promoting these key areas of research, there are op-portunities to be exploited in the forthcoming 6th Framework for Research, Technology and Development of the European Union, which promotes the development of European-wide networks of excellence to help coordinate research effort and achieve critical mass. Therefore, it is important to consider how existing geographic information research networks established by organisations such as the European Science Foundation and the Association of Geographic Information Laboratories in Europe can be utilised to create a European network of excellence in the geographic information policy field and join forces with our American counterparts to build a programme of international comparative research.
About the Authors
Massimo Craglia is a Senior Lecturer at the University of Shef-field, Sheffield, United Kingdom, and an adviser to the Eu-ropean Commission on data policy issues. He founded and chaired the Data Policy Working Group of the Association of Geographic Information Laboratories in Europe (AGILE) 1999-2002.
Corresponding Address:Max CragliaDept. of Town and Regional PlanningUniversity of SheffieldSheffield S10 2TN, [email protected]
Ian Masser is Professor of Urban and Regional Planning at the ITC in the Netherlands and Head of their Urban Planning and Management Division. He was the Founder Chairman of the Association of Geographic Information Laboratories in Europe from 1998 to 1999 and was elected President of the European Umbrella Organisation for Geographic Infor-mation in March 1999.
Corresponding Address:Ian MasserDivision of Urban Planning and ManagementInternational Institute for Aerospace Survey and the Earth Sciences (ITC)P.O. Box 67500AA Enschede, The Netherlands
References
Cabinet Office, 1999, Modernising e-Government (London: HMSO). http://www.official-documents.co.uk/document/cm43/4310/4310.htm
Cabinet Office, 2000, e-Gov: Electronic Government Ser-vices for the 21st Century (London: HMSO). http://www.cabinet-office.gov.uk/innovation/2000/delivery/foreward/frames.htm
Chancellor of the Duchy of Lancaster, 1996, Next Steps Agen-cies in Government Review 1995. Cm 3164 (London: HMSO).
Commission of the European Communities, 1993, Growth, Competitiveness and Employment: The Challenges and Ways Forward into the 21st Century (Brussels: Commis-sion of the European Communities).
Commission of the European Communities, 1994a, Europe and the Global Information Society: Recommendations to the European Council (Brussels: Commission of the European Communities).
Commission of the European Communities, 1994b, Europe’s Way to the Information Society: An Action Plan, COM(94) 347 Final (Brussels: Commission of the European Com-munities).
Commission of the European Communities, 1998, Public Sector Information: A Key Resource for Europe COM(98) 585 Final (Brussels: Commission of the European Communi-ties).
Commission of the European Communities, 1999a, eEurope: An Information Society for All. COM(1999)687 (Brus-sels: Commission of the European Communities). http://europa.eu.int/information_society/eeurope/news_library/documents/index_en.htm

58 URISA Journal • Vol. 15, APA I • 2003 URISA Journal • Craglia, Masser 59
Commission of the European Communities, 1999b, The European Spatial Development Perspective (Brussels: Commission of the European Communities). http://www.inforegio.cec.eu.int/wbdoc/docoffic/official/space_en.htm
Commission of the European Communities, 2001a, eEurope 2002: Creating a EU Framework for the Exploitation of Public Sector Information COM(2001) 607 Final. (Brus-sels: Commission of the European Communities). http://www.cordis.lu/econtent/psi/
Commission of the European Communities, 2001b, eEurope 2002: Impact and Priorities. COM(2001)140 Final (Brus-sels: Commission of the European Communities). http://europa.eu.int/information_society/eeurope/news_library/documents/index_en.htm
Commission of the European Communities, 2002a, Proposal for a European Parliament and Council Directive on the Re-Use and Commercial Exploitation of Public Sector Documents. COM(2002) 207 Provisional (Brussels: Commission of the European Communities).
Commission of the European Communities, 2002b, eEurope 2005: An Information Society For All. COM(2002)263 Final (Brussels: Commission of the European Communities).
Craglia, M., A. Annoni, and I. Masser, 2000, Geographic Infor-mation Policies in Europe: National and Regional Perspec-tives (Ispra: European Commission). EUR19552en http://www.ec-gis.org
Craglia, M., and J.-F. Dallemand, 2001, Geographic Information and the Enlargement of the European Union (Ispra: Euro-pean Commission). EUR19824en http://www.ec-gis.org
Craglia, M., and I. Masser, 1997, A European Policy Framework for Geographic Information. Computers Environment and Urban Systems, 21(6), 393-406.
Craglia, M., and I. Masser, 2002, Geographic Information and the Enlargement of the European Union: Four National Case Studies. URISA Journal, 14(2), 39-47.
The Economist, 1999, Secret Society. May 27, 1999. http://www.economist.com
The Economist, 2001, The Internet Untethered: A Survey of the Mobile Internet. October 13, 2001. www.economist.com
Gore, A., 1993, From Red Tape to Results: Creating a Gov-ernment that Works Better and Costs Less. Report of the National Performance Review (Washington, D.C.: U.S. Government Printing Office).
Her Majesty’s Stationary Office (HMSO), 1998. Crown Copy-right in the Information Age.
HMSO, London, http://www.hmso.gov.uk/copyhome.htm
Hofstede, G., 1997, Cultures and Organizations: Software of the Mind (London: McGraw-Hill).
HMSO, 2001, Licencing of Crown Copyright: HMSO Regulato-ry Framework (London: HMSO). http://www.hmso.gov.uk/regulation-framework.htm
HM Treasury, 2000, Cross-Cutting Review of the Knowl-edge Economy (London: HMSO). http://www.hm-treasury.gov.uk/sr2000/associated/knowledge/index.html
Home Office, 2000, Freedom of Information Act (London: HMSO). http://www.legislation.hmso.gov.uk/acts/acts2000/20000036.htm
Longhorn, R., 2001, The Impact of Data Access Policies on Re-gional Spatial Data Infrastructure. Proceedings of the 7th EC-GIS Conference, Potsdam, June 10-13, 2001 (Ispra: JRC). http://www.ec-gis.org
Mandelkern, D., 1999, Diffusion des Données Publiques et Révolution Numérique (Paris: Commissatiat General du Plan). http://www.ladocfrancaise.gouv.fr/
Masser, I., 1998, Governments and Geographic Information (London: Taylor & Francis).
Masser, I., 2001, Regional SDI’s: The European Perspective. Ar-ticle presented at the International Symposium on Spatial Data Infrastructure, Melbourne, November 19-20, 2001.
Pauknerowa, E. and C. Corbin, 2002, GI Capacity Building in the Accession Countries: Country Report. http://www.ec-gis.org/ginie/documents
Perera, P., 2001, EESDI Presentation at the First Eurogeograph-ics General Assembly, Dublin, September 3-5, 2001. http://www.eurogeographics.org/NewsAndEvents/PastEvents/GA2001/Docs/ec_environ.ppt
Pira International, Ltd., University of East Anglia, and Knowl-edge, Ltd., 2000, Commercial Exploitation of Europe’s Pub-lic Sector Information (Luxembourg: EC DG INFSO).
Sheppard, E., H. Couclelis, S. Graham, J.W. Harrington, and H. Onsrud, 1999, Geographies of the Information Society. International Journal of GIS, 13(8), 797-823.
Tosta, N. and M. Domaratz, 1997, The U.S. National Spatial Data Infrastructure. In Craglia M. and Couclelis H. (Eds.), Geographic Information Research: Bridging the Atlantic. (London: Taylor & Francis), 19-27.
Tullo, C., 2002, UK Government Information Initiatives: En-couraging Global Access and Re-Use. Proceedings of GSDI 6 Conference, Budapest, September, 16-19, 2002. AutoDesk (Hungary: Budapest).
Weiss, P., 2002, Borders in Cyberspace: Conflicting Public Sec-tor Information Policies and their Economic Impacts. http://205.156.54.206/sp/Borders_report.pdf
Wehn de Montalvo, U., 2003, In Search of Rigorous Models for Policy-Oriented Research: A Behavioral Approach to Spatial Data Sharing. URISA Journal. Volume 15, Number 2.

URISA Journal • Carver 61

URISA Journal • Carver 61
IntroductionThe current heightened research interest in participatory ap-proaches to decision making may well be a waste of time or, at best, misplaced confidence. The effort expended is done so on the possibly false surmise that the general public want to be more closely involved in decision-making, and perhaps more importantly, that those in positions of decision-making power actually value and therefore encourage public input. A pessimistic assessment, maybe, but it needs careful consideration if we are to progress further with research and development in this field.
I have chosen to start the discussion from this point be-cause over ten years experience of developing participatory GIS has taught me that we, as academics, tend to credit the public with more knowledge, greater rationality and enthusiasm for participation in decision making than we perhaps ought. It is surprising how little even well educated people know about a broad range of basic topics, often holding quite erroneous beliefs and irrational ideas that appear to be based largely on here-say, sensationalist media reporting and poor understanding of basic facts. The willingness to become actively involved is also lacking across the population as a whole and is symptomatic of a wider malaise in the democratic process; witness the poor turnouts in many elections and the mistrust and contempt in which we hold many politicians. The techno-optimists among us maintain that the revolution in ICTs (Information and Communication Technologies) brought about by the Internet and wireless com-munications will redress the balance. I must admit to sharing some of this optimism, but would however countenance caution in that technological approaches need to be carefully grounded in a good understanding of the issues involved and an application
The Future of Participatory Approaches Using Geographic Information: developing a research agenda
for the 21st Century
Steve Carver
Position paper prepared for ESF-NSF Meeting on Access and Participatory Approaches in Using Geographic Information, Spoleto Italy, December 5–9, 2001
Abstract Geographical space is an important factor across a wide range of decision-making problems, not only because many hu-man and environmental processes vary markedly from one place to another, but also because space determines people’s perception of the world and ultimately determines what we call ‘local’ and ‘global’. The ability of individuals and social groups to map out, in a true geographic sense, their vision for the future is a key prerequisite for informed and sustainable planning. Obtaining sufficient input from a representative sample of the broad population is often made more difficult by the lack of ‘connectivity’ (in both the technical and conceptual sense) between the different stakeholders involved. Technological approaches to improving participation, including the use of GIS and ICTs, are reviewed. The effects of space, place and locality are identified as key factors determining public interest in decision problems. Recommendations are made for further research directions in the field.
of the technology within a framework of more traditional means of outreach and participation.
This position paper reviews the current situation in respect to public participation and the use of geographical information to both encourage and facilitate wider involvement in the deci-sion-making process. In doing so it is first necessary to give some attention to general theories of participation and empowerment within the democratic process before examining the role of GI, and space itself, in providing a framework for active public par-ticipation. The factors that work for and against this are analysed in some detail, before drawing up a list of recommendations for further research effort in this field.
Democracy and ParticipationDemocracy, the government by the population through elected representatives, is perhaps the single most defining characteristic of western civilization. Public participation involves ordinary citizens in decisions about, and the implications of, social and economic change. Participation in democratic society has for most people until recently been limited to choosing elected representatives through the voting process and then lobbying them over issues of concern. However, as people have become ever more informed about a variety of issues through mainstream media they have become noticeably more critical of decisions made on their behalf. Over the last decade ICTs have massively increased the amount of information available and the speed at which it is transmit-ted. Yet, despite technological advances, there are still relatively few opportunities for the general public to actively participate in decision making. Current modes of participation, including vot-

62 URISA Journal • Vol. 15, APA I • 2003 URISA Journal • Carver 63
ing in elections, protest activities, lobbying and public meetings, appear over-stretched and may not fully meet the democratic ideals and requirements of the 21st Century (Bryan et al., 1998; Friedmann, 1995).
The participation ladderA useful analogy when considering levels of public participation is that of a ladder; the base of which represents zero opportu-nity to participate with successively higher rungs representing increased levels of participation and greater public empowerment in the decision making process. The top of the ladder represents full public control and responsibility for the final decision. The participation ladder is shown in figure 1. This public participa-tion ladder is used by Arnstein (1969) to describe the transferral of political power from traditional power-holders having power over citizens, to citizens having the power to achieve their own requirements. Wiedemann and Femers (1993) adapt this theory to their consideration of environmental decisions about hazard-ous waste management.
EmpowermentEmpowerment is the process by which stakeholders identify and shape their lives and the society in which they live through ac-cess to knowledge, political processes and financial, social and natural resources (Arnstein, 1969). Participation alone cannot, however, guarantee socially just development since the process of empowerment through participation can be undermined by the motives of the traditional power holder, power relations, and
inequalities of access to information and participatory mecha-nisms (Slocum and Thomas-Slayter, 1995). For example, common practice in traditional methods of public participation involves the public, or at least those with a particular interest, in attend-ing planning meetings. These often take place in an atmosphere of confrontation that can discourage participation by an often less vocal majority resulting in such meetings being dominated by vocal individuals whose views may not necessarily represent the wider opinions of local people. Planning meetings are often held during the evening at specific times, limiting the numbers of people who can attend. Access to relevant information is also limited, meaning that fully informed decision makers are clearly at an advantage when compared to a partially informed public. Such inequalities of access, both to information and the meet-ings themselves, severely limit the level of empowerment gained through participation in such meetings.
New methods of participationUnder traditional forms of participation, public involvement in decision making is only a few rungs up the public participation ladder and extends little beyond the “right to object”, though the level of placation varies from country to country. Several methods for encouraging more active participation have been developed. These include the use of opinion surveys, referendum, focus groups, deliberative polls, citizens’ panels and citizens’ juries (Fishkin and Luskin, 1999; Finney, 2000; Petts, 2001; Thompson and Hoggett, 2001).
An interesting example of geographically based public partici-pation is “Planning For Real” (PFR). This is an idea developed and patented by the Neighbourhood Initiatives Foundation (NIF), as a means of involving local people more closely in local environ-mental planning problems and decision-making (Gibson, 1996). NIF is a charity whose main aim is to maximise the participation of local people in decisions that affect their neighbourhoods and quality of life. The founding director, Dr Tony Gibson, devised PFR in the 1970s as a technique of active participation based around interaction with large-scale maps or physical models of the area of interest. NIF has continued to develop and adapt this pri-mary tool to meet both local and strategic consultation needs and as an essential process in community development programmes. The PFR approach has been adopted as method of improving participation in developing countries. For example, Integrated Approaches to Participatory Development (IAPAD) has devel-oped similar tools for use in integrating the views of local people into conservation and development projects. Three-dimensional topographic models are used as a focal point in merging people’s local knowledge with traditional spatial information (Rambaldi and Callosa-Tarr, 2001).
In contrast to more traditional or non-digital methods, new forms of participation based around ICTs are beginning to evolve. These include online discussion, web surveys and online decision support systems. Together these form what might be termed the e-participation ladder as shown in Figure 2.
Figure 1. The public participation ladder(After Arnstein, 1969; Wiedemann and Femers, 1993)

62 URISA Journal • Vol. 15, APA I • 2003 URISA Journal • Carver 63
The bottom rung of this participation ladder represents on-line delivery of public services such as payment of rates and taxes, applications for licences and access to government information. Local government web sites and those of various national govern-ment departments are good examples. Selected examples from the UK include Brent and Wandsworth. Here the flow of information is essentially one-way; from server to client, and does not take full advantage of the possibilities for two-way communication. Fur-ther up the e-participation ladder, the communication becomes bi-directional making participation more interactive through the sharing of information, ideas and feedback. One of the earliest attempts at online dialogue was by MN-Politics email forum set up in 1995 in Minnesota. An example of a long-running web site dedicated to online discussion of ideas surrounding digital democracy is UKCOD (UK Citizen’s Online Democracy) that provides access to a range of web services relating to electronic democracy and runs its own forums to discuss political issues affecting the United Kingdom as well as access to research, best practice and training in electronic democracy. The use of the web as a delivery mechanism for opinion surveys is also growing (Tsagarousiano et al., 1998). Bulmer and Coleman (2001) go so far as making the case for a “Civic Commons in Cyberspace” to create “an open-ended institutionally backed extension of people’s opportunities to make contributions to public policy on those matters that specially concern them” (p.5).
Online participation promises a number of improvements. Firstly, participation is not restricted by geographical location. Access to the relevant information and ideas of other stakehold-ers is available from any location that has Internet access. This information is also available at any time of the day thus avoiding the problems associated with holding meetings in the evenings. The concept of “24/7” access (i.e. 24 hours a day, 7 days a week) opens up opportunities for more people to participate in public consultations. When compared with the traditional method of making a point verbally in front of a group of relative strangers, an Internet-based system also allows people to make comments and express their views in a relatively anonymous and (usually) non-confrontational manner. Thus ICTs are seen as breaking down key barriers to participation, principally those concerning accessibility and socio-psychological factors. While addressing the physical barriers to participation by online access is important, un-derstanding the social aspects of participation is perhaps more so; particularly how people perceive decision problems and respond to them as individuals and as members of social groups.
Some thoughts on individual and group decision-making behaviourIn recent years researchers have recognised that to understand how the public respond to and participate in a decision problem it is necessary to focus on the social and cultural factors that govern this process. Public perceptions and attitudes are shaped by the “world views” shared by the groups to which individuals belong, such as work, social and cultural groupings (Dake, 1991). This recognises
that society is composed of different groups each with different world-views (Slovic and Peters, 1998). For instance, research on nuclear power shows that pro-nuclear respondents see economic aspects as most salient, while the anti group see accidents and consequences for the environment as most salient. Thus differ-ent stakeholders may hold different world-views leading to focus on different aspects of the available information. This leads to different perceptions and attitudes to the decision problem and clearly affects the ways in which different people participate in the decision-making process. Cultural theory suggests there are four stakeholder groups, each having a distinctive attitude (Douglas, 1992). These biases reflect the individual’s favoured institutional arrangements, and predispose people as to their attitude to risk, the fairness of decisions made on behalf of society, and who to blame when things go wrong. Though used by Douglas (1992) to describe attitudes to risk, the four types are adapted here for decision making in general: Individualist/Entrepreneurs - decisions present opportunity,
save those that threaten freedom of choice and action; ‘the market’ will provide control, so there is no need for other kinds of control;
Hierarchists - believe technological and environmental decisions should be left to experts;
Fatalists - feel that they have very little control over decisions that affect them, and accept whatever decisions are made on their behalf; and
Egalitarians - fear risks to the environment, the collective good and future generations, and believe that power and influence should be spread more evenly within society.
Recently a further type has been added that perhaps better describes those of us seeking to employ ICTs and GI to further our egalitarian objectives, that of:
Technological Enthusiast - who show a commitment to the development of a high-technology society.
Figure 2. The e-participation ladder(After Smyth, 2001)

64 URISA Journal • Vol. 15, APA I • 2003 URISA Journal • Carver 65
Groups holding these different views will often come into conflict. For instance, we might normally expect to find individu-alists and egalitarians in conflict about nuclear issues.
Although cultural theory provides a plausible typology, the research evaluating these ideas is more ambiguous. It has been shown individuals may not perceive and act consistently within one type in all decision-making domains. Rather, it is likely that they may show characteristics of one type in one situation and another type in a different situation (Dake, 1991). Groups, on the other hand, may be formed specifically to reflect a particular view. The group norms that determine group perceptions and actions may therefore be more stable and more reliably categorised.
From the standpoint of this theory, the search for a single, universal metric for decision-making behaviour may be futile, since the perception of the decision problem and responses to it varies across groups and between individuals as a function of social and cultural factors. Nonetheless, a better understanding of indi-vidual and group decision behaviour is clearly needed, especially when complicated by the addition of geographical space.
The role of spaceOf the scientific issues involved, the role geographical space in focusing interest and shaping our response to decision problems is central to this discussion paper. The effects of space, place and locality are important in determining who is interested in a decision problem and why. People local to a particular problem or issue will, by the very virtue of their geographical position, be (in the main) interested enough to get involved or at least express a considered point of view if polled. As scale increases, a smaller proportion of the population affected will be interested enough to seek involvement, such that at national scales the proportion of the interested population is pitifully small, even though the absolute numbers may be quite large (Kingston et al., 2000). This is true even for those issues that at first glance it would seem everyone ought to hold a vested interest, like where to dispose of nuclear waste for example. Only when locational decisions are made about national issues does the problem then become “local” and so the politics of scale kick in again to create an explosion of local inter-est. NIMBY (Not In My Back Yard) is a much-maligned public reaction to “invasive” siting decisions - a kind of geographical version of personal space - but it does demonstrate the parochial nature of public interest in decision-making very well, particularly when concerned with controversial facilities such as those for nuclear waste (Sjöberg and DrottzSjöberg, 2001).
The role of participatory GIS is to help minimise conflict and arrive at decisions that are acceptable to the majority of stakehold-ers through consensus building approaches based on awareness of the spatial implications of a decision problem. Participatory GIS is well placed as a technology to explore phenomena such as NIMBY-ism and perhaps offer up some solutions.
GIS as facilitatorAlthough it is not uncommon for new technologies such as GIS to play an important part in the decision making process, these tools are, in the main, beyond the reach of ordinary citizens with an interest in a particular decision problem. This is true in both in a material and a cognitive sense, since GIS and spatial data are expensive and require high levels of training for competent use. In its traditional mode of employment, behind closed doors and operated by trained decision makers using ‘restricted’ datasets, GIS actually works against participation and empowerment. On these grounds GIS has often been criticised as being an elitist tech-nology and one that merely enhances existing power structures (Pickles, 1995). Making GIS and appropriate datasets available to the public over the Internet, however, provides at least the potential to redress this situation by placing all stakeholders on an equal footing. This may ultimately help move public participa-tion further up the participation ladder past the rung of restricted participation (Figure 1).
Access to GIS alone does not, however, provide the public user with a satisfactory means of active participation in the decision process. GIS is far too complex a technology to allow effective use by the non-specialist with little or no previous train-ing or experience in this field. The following quote from Mark Monmonier’s essay on “Ridicule as a weapon against GIS-based siting studies” highlights the problem very effectively:
“…in the same way that ridicule can undermine an incomplete or otherwise flawed siting study, project opponents armed with a GIS but lacking the savvy to use the system appropriately become vulnerable to sarcastic attacks from site advocates and sceptical journalists.”(Monmonier, 1996)
Putting GIS on the Internet therefore does not in its own right, constitute an effective participatory decision support solu-tion, if only because it is such a complex beast and the data difficult to interpret. Intelligent interfaces to specific problem areas perhaps needed to allow effective interaction between individuals and the computer. Such interfaces would need to be intelligent enough to recognise the socio-cultural and educational background of the user and adapt themselves to their requirements accordingly. In addition, GIS-based decision tools need to be exploratory rather than definitive. People need the space and freedom to ‘explore’ the decision problem and create personal constructs (digital, spatial or otherwise) that represent their own outlook (vision) or opinion on a decision problem. GIS-based decision tools should provide the means by which stakeholders can explore a decision problem using existing information, experiment with possible solutions, view other people’s ideas, formulate their own views, and share these with the wider community.
Developments in participatory GISThere has been a blossoming of interest in public use of GIS in recent years. A recent rash of papers and research initiatives are indicative of something of a paradigm shift in the application of

64 URISA Journal • Vol. 15, APA I • 2003 URISA Journal • Carver 65
GIS technology, yet the ethical and epistemological arguments have been aired in public for some time. The long running volley of articles and editorials between Stan Openshaw, Peter Taylor and others are an excellent and entertaining example of this de-bate between the two camps of techno-positivist GIS-ers on the one hand and GIS-hating social theorists on the other (Taylor, 1990; Taylor and Overton; 1991; Openshaw, 1991; 1992; Pickles, 1995; Openshaw, 1996; 1997). Despite this rocky start, social science and GIS are nevertheless coming together to collaborate on participatory approaches and the societal implications in and on GIS.
The US National Center for Geographic Information and Analysis (NCGIA) has run two related initiatives; Collaborative Spatial Decision Making (I-17) and The Social Implications of How People, Space & Environment are Represented in GIS (I-19); known simply as “GIS and Society”. The latter focused research efforts in two key areas concerning the inter-relationship between GIS and society: how the spread of this technology is affecting the political, economic, legal, and institutional structures of society; and how societal process affect the form taken by the technology itself (NCGIA, 1993). The emphasis on PPGIS itself comes about from a merging of the re-evaluation of the social implications of GIS by the GIS community and its critics, and existing lines of research into public participation and decision-making, principally from the planning field. The recent Varenius initiative on “Empowerment, Marginalisation and Public Partici-pation GIS” clearly focuses the issues discussed here and identifies a broad range of issues of relevance to community representations and PPGIS. These include: The implications of map-based models for community
representations; Possible distortion of grass-root perspectives by GIS; Methods of representing the “community knowledge base”
within GIS; Impacts of inequalities of access to GIS technology and
data; Information needs of community groups and role of GIS in
meeting these; and Empowerment in the decision making process through the
use of PPGIS.
Up until the formation of AGILE in 1998 research on these topics in Europe seems to have lacked a central focus although a number of early projects within the various units of the Regional Research Laboratories have addressed pertinent issues (e.g. Carver et al., 1992) and many individual papers have appeared in the literature (e.g. Doyle et al., 1998). AGILE has now identified GI policy and society as one of five research challenges including is-sues of access to information and organisational change. Despite these initiatives in both North America and Europe and the work of many individuals, there does still seem to be a significant gap between the experimental and the practical application of par-ticipatory GIS. Sure, the number of mapping-based web sites has exploded in recent years helped along by web mapping add-ons
to proprietary GIS packages, but there are still comparatively few instances of real-life usage of this technology within public participation exercises though a few notable exceptions do exist (e.g. Shiffer, 1995; Jordan, 1999; Kingston et al., 2000). The reasons for this can only be guessed at, but it is clear that they are likely to include political ‘difficulties’, lack of resources and expertise, and the fact that the public at large are, perhaps, just not ready for it yet.
Participation and GI – a SWOT analysisIt is clear from the above discussion and the amount of research effort being expended around the world on participation, GIS and related topics that there is considerable enthusiasm about the potential for participatory GIS of one form or another. It may be useful at this juncture to analyse its wider potential in the hope that this may provide a framework for identifying key areas for further research. A SWOT analysis is given as a means of organising some of the issues and factors promoting or acting against participatory approaches.
StrengthsPeople, on the whole, want to be better informed about issues that affect them. If those issues have a strong spatial component, then GIS or its derivatives would seem natural contenders for conveying that information.
From an institutional perspective, GIS has matured as a technology and is now universally accepted as the best method of handling and analysing spatial data. This level of technological acceptance is not however universal, a fact that is picked up later in considering issues of trust and understanding. Nonetheless, most decision-making organisations have adopted GIS and so ought to be in a good position to extend their operations through participatory approaches using GI as a focus for and facilitator of discussions between stakeholder groups.
Huge volumes traditional spatial data are available world-wide at a variety of scales and resolutions and covering a range of themes. These form the ‘back drop’ of most participatory GIS, but lack local knowledge and community perspectives. In this context, one of the strengths of participatory approaches has to be their aim (successful or otherwise) of incorporating local com-munity level perspectives on a particular decision problem that may lead to different solutions than might otherwise have been reached using purely traditional forms of data. The community itself needs to be regarded as a form of database, unconventional in the IT sense, but wholly understandable from a social science perspective. Local people usually know their local area better than anyone else and so can reasonably be expected to provide detailed insights into local phenomena that are not normally available via ordinary GI datasets. Incorporation of local knowledge is clearly a major strength of participatory approaches and may go some way towards the Geographical Knowledge Systems (GKS) proposed by Taylor (1990).

66 URISA Journal • Vol. 15, APA I • 2003 URISA Journal • Carver 67
From the outset it is clear that many decision problems, particularly those concerning the environment and the way we occupy it and utilise it, have a strong spatial component. Includ-ing space as a central element or framework in addressing such decisions is highly beneficial in organising both our view of the problem and our engagement with it. Despite its limitations, the map is the best way of organising spatial information and is the best available tool for interacting with it. One of the main strengths of PPGIS therefore lies in its ability to handle spatial information and communicate this to interested stakeholders, and in turn, accept, organise and reflect inputs (spatial or otherwise) that users provide during the participation process.
Finally, anything that increases public access to information and active participation in the decision making process should be seen as an improvement over existing public/decision maker power relationships. In this instance current experiments in participatory GIS are steps in the right direction; that of citizen empowerment through greater involvement and openness and accountability on behalf of decision makers. This process has recently received a fillip from the United Nations in the form of the Aarhus Convention, adopted in June 1998 and entering into force in October 2001. This international law on access to information, public participation in decision making and access to justice in environmental matters seeks to strengthen the role of members of the public and environmental organisations in pro-tecting and improving the environment for the benefit of future generations. Through its recognition of citizen’s environmental rights to information, participation and justice, it aims to promote greater accountability and transparency in environmental matters (UNECE, 2001). While the convention has been ratified mainly by eastern countries, it is expected that western nations will ratify the convention in due course.
WeaknessesEase of access to relevant information and the tools with which to use it are oft quoted strengths of ICT-based public participa-tion. Equality of access creates a level playing field from which all stakeholders can operate and debate the issues on equal terms. This may be somewhat of a utopian dream. Recent initiatives in many countries have centred on ensuring equal access to information via the Internet. The reasoning behind this is the clear, if rather simplistic notion, that if everyone has access, then everyone has the opportunity to be equally well informed. Better access to the Internet will help, but it is maintained here that there will always be a significant proportion of the population who do not have the appropriate training or intelligence with which to use it effectively. It is these people - the ‘Information underclass’ - who always have, and maybe always will be, excluded from the decision loop by the so called ‘Digital Divide’ (Carver et al., 2000; Oden and Lentz, 2001). Although participatory approaches are firmly rooted in an ethos of social inclusion, it is clear that the knife cuts both ways; the majority may well be better empowered, but a small yet significant minority will become increasingly marginalized by comparison although their position in absolute terms may not
actually have changed (Althaus and Tewkesbury, 2000; Bulmer and Coleman, 2001).
This discussion leads on to issues surrounding the public understanding of science and specific decision problems. Those in positions of decision-making power have often argued that because they have access to all the relevant information, have been extensively trained in the art of decision making, and have a detailed understanding of the decision problem in question, then they are best placed to make the decisions. The public on the other hand may well have limited knowledge of the decision problem, partial access to the facts and little or no training. The profession-als could be right in their assertion that they are the best people to make the final decision, but that does not necessarily mean that the public view should hold less weight or even be ignored. Nevertheless, there are significant problems in incorporating public opinion into the decision making process. For example, the public at large often conceptualise a decision problem in very different ways, using simplistic thinking routines for judging risk and uncertainty, that in turn lead to predictable errors and bias in their judgement (Bazerman, 1997; Kahneman et al., 1982). A useful illustration of this is how people consistently overestimate dramatic causes of death such as floods and homicide, while more mundane ones such as diabetes are underestimated (Lichtenstein et al., 1982).
Despite the inclusion of the spatial dimension being advanta-geous for our investigation of decision problems, the role of geog-raphy in participatory decision-making is not clearly understood. The NIMBY syndrome demonstrates that space and locality are important for controversial siting decisions such as for nuclear waste disposal. This is further complicated by the “sense of place” often associated with particular localities. GIS data models may be able to cope with the quantitative and deterministic aspects of space, spatial scale and distance, but may not be best suited to representing the more qualitative and perceptual effects of place since this is more of a personal construct. Traditional GIS data models and representations of space may therefore distort local and individual/group world-views. Forcing community level data into Cartesian coordinates and vector/raster data models may also not be appropriate because of corresponding distortions of space and distance in an individual’s mental map of their locality (Aitken and Michel, 1995).
OpportunitiesThe medium and long-term opportunities for participatory ap-proaches and GI are significant. PPGIS should not be viewed as a replacement for more traditional forms of participation in the democratic process rather its role is seen more as augmenting and supporting stakeholder dialogue and public involvement in deci-sion making. As such PPGIS is a form of Computer Supported Real Life (CSRL). This should be viewed as an opportunity for increasing involvement and accountability.
Greater accountability in decisions made is seen as an important opportunity for participatory GIS. At present many decisions are still made behind closed doors, using restricted in-

66 URISA Journal • Vol. 15, APA I • 2003 URISA Journal • Carver 67
formation and with only minimal public input. As the kind of participatory decision making procedures described here become more common place, then the decision makers themselves will become more accountable for their actions on the basis that the decision making process is more transparent and based on freer dialogue between stakeholders. Perhaps the real opportunity lies in making the public itself more accountable for decisions made by giving over greater decision-making responsibility to individual stakeholders and stakeholder groups.
Greater participation implies greater levels of social inclusion. Reasons for why this might not always be the case have already been given under the discussion of potential weaknesses, and these apply just as much here. If we subscribe to the position of ‘technological enthusiasm’ then developments in the information society such as Internet access for all, digital television, mobile wireless communications, etc. will mean greater accessibility of information for all, implying greater opportunity and higher levels of social inclusion.
From a technological standpoint, and assuming access prob-lems are solved, the greatest opportunities for PPGIS perhaps lie in the development of better interfaces and data models. Some of the main criticisms of GIS are levelled at impenetrable interfaces and data models that are unsuited to public access and handling qualitative interpretations of space and personal ideas of place and locality (Aitken and Michel, 1995). It may be that from a strict GIS perspective such data models are not possible, but hybrids or pseudo-models might feasibly be developed to bridge the gap be-tween Cartesian coordinate space and mental/personal space. This recognises that there are many different types of space - from the physical to the metaphysical – and as many personal interpreta-tions of these as there are people. GIS cannot possibly incorporate representations of all of these within its necessarily reductionist view of the world, but opportunities present themselves for GIS to at least provide something of a framework (or interface) by which we can express ourselves and our opinions/feelings about particular issues and decision problems. This gives rise to the idea of “territory as interface” where the map (and derivatives of it) is central to stakeholder interaction and dialogue – an environment that be explored, an ethereal space in which ideas can be tested and decisions formulated.
ThreatsIf we were blindly optimistic about participatory GIS we would probably deny the existence of any serious threats to its develop-ment and further adoption. It may well be that PPGIS or similar approaches might actually do much to help foster a new era of greater trust through more open and accountable decision mak-ing structures. However, some quite significant and pernicious threats do exist and we ignore these at our peril.
The current political climate and the power relations that have built up around it have bred a certain cynicism and mis-trust among the general electorate in the democratic process. Politics is often seen as corrupt and obsessed with power and money rather than as a democratic institution with the aims of
service, trust and the public good at its heart. Trust is essential to any participatory process. Why would anyone take the effort to get involved if they believed that their input would simply be ignored or, worse, misused and distorted? The same principle applies to the data being used, much of which is collected by or on behalf of the state, and therefore to some people an object of some suspicion (Curry, 1995). The potential for misinformation within participatory systems is quite high, and people need to be able trust the data and tools they are given if they are to trust the whole participation process.
The issue of (mis)trust in the wider democratic process is beyond the scope of this paper, but it remains an important issue. The relative positions of power in respect to different stakeholder groups within the decision making process is also an issue that threatens the potential of PPGIS. Issues surrounding relative equity within the decision-making process need to be addressed. It is perhaps unrealistic to imagine that the views of a single individual could ever hold as much power as that of a govern-ment minister or elected representative, but taken together the collective views of individuals and community groups need to be taken seriously.
We might not always be able to trust the responses gained through the employment of participatory systems either. There are significant and, to date, unresolved problems concerning the representative nature of the data generated and the validation of individual responses. Internet-based systems are especially vul-nerable to being hijacked by determined individuals or groups intent on pushing a particular view. It is also difficult to distin-guish between genuine responses and those submitted by whim or fancy.
Antipathy in the very people it aims to empower may well turn out to be the greatest threat facing participatory GIS. The general public may well be interested in a particular decision problem but when faced with the opportunity to take part, often adopt a antipathetic position. “Why should I bother? I can’t make a difference.” This fits the “fatalistic” or “hierarchical” category of decision-maker described above. It may sound trite, but “while you can lead a horse to water, you can’t always make it drink”. Regardless of the amount of hype and incentive, people might just not be interested enough or have the time and energy to participate (Davies, 2001). This is especially true in times of economic recession such as facing the world today, since people tend to be more concerned with day-to-day economic necessities in times of hardship than with the luxuries of playing politics and long-term planning.
The Way forward?The industry standard strategic response to any SWOT analysis is simply to build on your strengths, address your weaknesses, exploit the opportunities and neutralise any threats. The same can be said of participatory GIS. We can perhaps use the SWOT analysis as a frame of reference in drawing up a research agenda that supplements those arising from the I-19 and the Varenius Projects.

68 URISA Journal • Vol. 15, APA I • 2003 URISA Journal • Carver 69
A new research agendaSeveral research directions can be identified that are to some extent ‘generic’ or non-location specific in the sense that they applicable as much in Europe and they are in the US. A draft ‘generic’ research agenda based on the above SWOT analysis might be as follows:1. Building on existing strengths:
a. Raising awareness among decision makers about the potential of GI-based participation;
b. Further research into methods of incorporating local knowledge into GIS databases;
c. Further research into methods of communicating GI (and associated issues) to the lay public; and
d. More practical real-world applications of participatory GIS to increase experience.
2. Addressing weaknesses:a. Increasing access to wide range of GI for use in
public participation exercises (e.g. through copyright agreements for ‘local’ use);
b. Further research on public perceptions of space and understanding of the spatial aspects of decision problems;
c. Further research on public approaches to decision making when there is a strong spatial component; and
d. Research on how more qualitative perceptions of space, place and locality may be incorporated in to GIS databases and/or models.
3. Exploiting opportunities:a. Investigate how participatory GIS approaches may
augment traditional means of participation;b. Develop mechanisms for demonstrating accountability
of decision made using public input via participatory GIS;
c. Investigate possibilities of porting participatory approaches to various new media such as digital television and wireless communications; and
d. Research and develop adaptive user interfaces to enable content and methods of interaction to be customised to the user.
4. Neutralising threats:a. Investigate methods of increasing the transparency of
GI and communicating limitations to the user; andb. Develop methods of verification and validation that can
be applied to responses gained through participatory GIS.
A research item that cuts across all four of these headings is the multiplicity of issues, factors and concerns that characterise the whole topic of transforming GIS into a tool for the masses. So far this paper has attempted to draw the reader’s attention to a range of issues from the social science of decision-making behaviour to the technicalities of serving GIS on the Internet. What is clear from this brief undertaking is the multi-faceted nature of the subject matter. When developing participatory
GIS we inevitably end up working with a range of multiples: multiple stakeholders, multiple criteria, multiple objectives and multiple scales, together with differential levels of access, training and finance to differentials in spatial cognition, education and cultural background. In short, we need to consider “multiplicity” as a universal research agenda item.
Perhaps the main route by which the GI research commu-nity can take this agenda forward is through the development of example real-world applications of participatory GIS approaches. In other words, real people using real systems to address real prob-lems. To do so would necessarily involve answering many of the other research objectives in the above list. To date there has been a great deal of theorising and conceptualising and deconstruction about the possible role of GIS in society. Perhaps now is the time to start doing and learn by our actions. May be then, and only then, will we start to find answers to support the theory and discover just how far GI can help in promoting the ideals and facilitating the mechanics of the new deliberative democracy.
Geographical addendumMuch of the above discussion, whilst recognising that space, place and locality are of tremendous importance to participatory ap-proaches in spatial decision-making, does not fully distinguish between the local ‘truths’ that exist between different communities and the parts of the world they occupy. For instance, planning law differs from one country to another, while the sense of place that shapes the way one group of people feel about a particular loca-tion also shapes the way in which they may approach a problem and the decision-making process itself.
Basic cultural differences, based on social and environmental stimuli, often mean that there are fundamental differences in the way the global ‘we’ may approach the same type of decision problem. Different cultures possess differing notions of hierarchy, patriarchy, honour and dependency. For example, in Asian coun-tries there is a much stronger sense of hierarchy than is generally found in North American and European countries. This manifests itself in a greater deference to decision-making structures that are based on respect for the views of ‘elders’, leaders and learned ‘experts’. In other instances, local people may see the interven-tion of other countries in giving aid or advice as meddling or to accept such help as dishonourable. The short history of GIS and ICT applications in international aid and development is littered with projects that have failed because outside organisations have not understood the basics of the local situation or heeded local opinion (Mather, 1997).
The cultural dimension further complicates our understand-ing of group and individual decision-making dynamics in a way that makes cross-cultural and international decisions particularly awkward - a fact made only too obvious by recent world events. While politics and religion, disputed resources and the blinkered tribalism of the ‘other’ may fuel these there is often a common theme of geography behind many conflicts. Armed conflict is often the inevitable result in the presence of two ‘nation states’ confined within one geographical area, contemporary examples

68 URISA Journal • Vol. 15, APA I • 2003 URISA Journal • Carver 69
being Northern Ireland and Israel/Palestine. GIS is beginning to be used as a tool of analysis and mediation in cases of interna-tional conflict (Wood, 2000a). Two well-publicised examples are the use of GIS to redraw the boundaries of ethnic enclaves in the Balkans (Bouchardy, 2000; Wood, 2000b) and map Palestinian and Israeli territories in the West Bank and Gaza Strip (Aronson, 2000; Starr, 2000). Although this may seem at first glance to be an area ripe for participatory GIS, feelings of the potential participants are likely to be too entrenched to yield acceptable compromise solutions. Alternatively, the anonymity of Internet-based approaches to participation and GIS communication of geographical ‘realities’ may help break the deadlock by allowing peoples’ true feelings to surface without fear of recrimination among neighbours and ‘allies’.
Returning to Europe and North America, basic differences between respective constitutions create the need to investigate a range of participatory approaches; each tailored to the needs of individual countries. What works well in Europe, might not necessarily work well in North America, and visa versa. There are also likely to be regional differences due to differences in local government, such as size, resources and politics, and differences in the geodemographics of the target population. This is especially true in Europe where history has created a mosaic of very different political and social systems. For example, unitary authorities in the UK are considerably larger than their counterparts in France, Italy and Germany, while the systems of national and local government are similarly diverse. Citizen involvement in local government decisions is therefore more developed in some EU countries than in others, perhaps reflecting these geographical differences and the political and social opportunities presented. This gives rise to a number of questions that we, as GI and ICT researchers, may wish to address. For example: Do national and local governments in small and densely
populated countries associate more with participatory approaches?
Is there a north-south gradient in levels of participation with greater opportunities for participation in northern countries?
How has the history of the EU and North America affected opportunities for participation?
Does participation vary between central and marginal states, and between old and new members?
How does this historical legacy of shifting borders in Europe affect the social and cultural dimension of participatory approaches?
These differences (if they do in fact exist) make the possibil-ity of developing generic approaches to participatory GIS within the European scene seem rather remote. Indeed, we may identify similar differences between US/Canadian States, for example be-tween California and, say, Tennessee or between native-Americans and European immigrants.
Whatever the answers to these and other questions on the opportunities for and potential uptake of participatory approaches
it ought to be apparent that there is some common ground within the participation and GI/ICT research agenda. It is also clear that the geographical differences mentioned above will be responsible for fundamental differences in the way we apply the results of this research at a regional and local level. The key to this is perhaps through developing a broad and detailed understanding of the social aspects of decision making and being able to apply this sensibly within the rapidly changing technological arena.
Human nature has been thousands of years in the making and cultural identities have developed over hundreds of years. Our geographical sense of ‘belonging’ can change over generations or an individual lifetime, and yet the technology of GIS and ICTs is developing and changing so quickly that the social and political dimensions are having difficulty in keeping pace. It is perhaps for reason that some geographers and social scientists feel threatened by GIS and ICTs. Rather than stalking each other from either side of the epistemological fence we need to work together to realise the potential benefits of GI and ICTs, but temper any trend toward ‘blind’ technological positivism with a social real-ism that understands the physical and metaphysical boundaries of essential human nature.
About the Author
Steve Carver
Corresponding Address:School of Geography, University of Leeds, LS2 9JT, UKEmail: [email protected]
References
Aitken, S.C. and Michel, S. (1995) Who Contrives the ‘Real’ in GIS?: Geographic Information, Planning and Critical Theory. Cartography and Geographic Information Systems. 22(1), 17-29.
Althaus, S.L. and Tewkesbury, D. (2000) Patterns of Internet and traditional news media use in a networked community. Political Communication. 17(1), 21-45.
Arnstein, S.R. (1969) A ladder of citizen participation. American Institute of Planners Journal, 35, 216-224.
Aronson, G. (2000) Land for peace: mapping the future of Pal-estine. GeoEurope October 2000, 28-31.
Bazerman, M. (1998) Managerial Decision Making. Wiley. 4th Edition.
Bouchardy, J-Y. (2000) Winning the peace in Kosovo. GeoEurope July 2000, 36-41.
Bryan, C., Tsagarousianou, R. & Tambini, D. (1998) Electronic democracy and the civic networking movement in context. R.Tsagarousianou, D.Tambini & C.Bryan (Eds.) Cyberde-mocracy: technology, cities and civic networks. Routledge, London, 1-17.

70 URISA Journal • Vol. 15, APA I • 2003 URISA Journal • Carver 71
Bulmer, J.G. and Coleman, S. (2001) Realising Democracy Online: a Civic Commons in Cyberspace. IPPR/Citizens Online Research Publication No.2, March 2001.
Carver, S., Myers, A. and Newson, M. (1992) The role of public perception in the response planning for major incidents: a proposal for a GIS-based strategy. NorthEast Regional Re-search Laboratory Report No.92/1. University of Newcastle upon Tyne.
Carver, S., Evans, A., Kingston, R. and Turton, I. (2000) Ac-cessing Geographical Information Systems over the World Wide Web: Improving public participation in environmental decision-making. Information, Infrastructure and Policy, 6, 157-170.
Curry, M.R. (1995) GIS and the Inevitability of Ethical Incon-sistency. J.Pickles (Ed.) Ground Truth: The Social Implica-tions of Geographic Information Systems. New York: The Guilford Press, 68-87.
Dake, K. (1991) Orienting Dispositions in the Perception of Risk: An analysis of contemporary World views and Cultural Biases. Journal of Cross-Cultural Psychology, 22, 61 - 82.
Davies, A.R. (2001) Hidden or hiding? Public perceptions of participation in the planning system. Town Planning Review. 72(2), 193-216.
Douglas, M. (1992) Risk and Blame. Routledge, London.Doyle, S. Dodge, M. and Smith, A. (1998) The potential of Web-
based mapping and virtual reality technologies for modelling urban environments. Computers, Environment and Urban Systems, 22(2), 137-155.
Finney, C. (2000) Implementing a citizen-based deliberative pro-cess on the Internet: the Buckinghamshire Health Authority electronic citizen’s jury in the UK. Science and Public Policy 27(1), 45-64.
Fishkin, J.S. and Luskin, R.C. (1999) Bring deliberation to the democratic dialogue. M.McCombs and A.Reynolds (Eds.) The Poll with a Human Face. Lawrence Erlbaum, Hillsdale, NJ.
Friedmann, J. (1995) Empowerment. Blackwell, London.Gibson, T. (1996) The Power in our Hands: Neighbourhood-
based world-shaking. Jon Carpenter Publishing, Charlbury, Oxfordshire.
Jordan, G. (1999) A Public Participation GIS for Community Forestry User Groups in Nepal: Putting People Before the Technology. NCGIA Specialist Meeting on “Empower-ment, Marginalization, and Public Participation GIS” http://www.ncgia.ucsb.edu/varenius/ppgis/papers/jordan.pdf
Kahneman, D. Slovic, P. & Tverski, A (1982) Judgement under uncertainty: Heuristics and biases. New York, Cambridge University Press.
Kingston, R., Carver, S., Evans, A. and Turton, I. (2000) Web-Based Public Participation Geographical Information Systems: An Aid To Local Environmental Decision-Mak-ing. Computers, Environment and Urban Systems, 24(2), 109-125.
Lichtenstein, S., Fischhoff, B. and Phillips, L. (1982) Calibration of probabilities: The state of the art to 1980. D.Kahneman, P.Slovic, and A.Tverski (Eds.) Judgement under uncertainty: Heuristics and biases. New York, Cambridge University Press.
Mather, C. (1997) Geographic Information Systems, mapping and development practice. Science, technology and Develop-ment 15(2-3), 291-302.
Monmonier, M. (1996) Ridicule as a weapon against GIS-based siting studies. Position paper I-19 GIS and Society meeting, NCGIA. http://www.geo.wvu.edu/i19/papers/monmonier.html
National Centre For Geographical Information and Analy-sis (1996) GIS and Society: Initiative 19 NCGIA http://www.geo.wvu.edu/i19/
Oden, M.D. and Lentz, R.G. (2001) Digital divide or digital opportunity in the Mississippi Delta region of the US. Telecommunications Policy 25(5), 291-313.
Openshaw, S. (1991) A View on the GIS Crisis in Geography, or, Using GIS to Put Humpty-Dumpty Back Together Again, Environment and Planning A, 23, 621-628.
Openshaw, S. (1992) Further Thoughts on Geography and GIS: A Reply, Environment and Planning A, 24, pp.463-466.
Openshaw, S. (1996) GIS and Society: a lot of fuss about very little that matters and not enough about that which does. Position paper I-19 GIS and Society meeting, NCGIA. http://www.geo.wvu.edu/i19/papers/openshaw.html
Openshaw, S. (1997) The truth about Ground Truth. Transac-tions in GIS, 2(1), 7-24.
Petts, J. (2001) Evaluating the effectiveness of deliberative pro-cesses: waste management case studies. Journal of Environ-mental Planning and Management, 44(2), 207-226.
Pickles, J. (Ed.) (1995) Ground Truth. The Social Implications of Geographic Information Systems. Guilford Press, New York.
Rambaldi, G. and Callosa-Tarr, J. (2001) Participatory 3-D Modeling: Bridging the Gap between Communities and GIS Technology. Paper presented at the International Workshop “Participatory Technology Development and Local Knowl-edge for Sustainable Land Use in Southeast Asia”, 6-7 June 2001, Chiang Mai, Thailand.
Shiffer, M. (1995) Interactive Multimedia Planning Support: Moving from Stand Alone Systems to the Web. Environment and Planning B: Planning and Design, 22, 649-664.
Sjöberg, L. and DrottzSjöberg, B.M. (2001) Fairness, risk and tolerance in the siting of a nuclear waste repository. Journal of Risk Research. 4(1), 75-102.
Slocum, R. and Thomas-Slayter, B. (1995) Participation, empow-erment and sustainable development. R.Slocum, L.Wichart, D.Rocheleau, and B.Thomas-Slayter (Eds.) Power, Process and Participation: tools for change. Intermediate Technology Publications, London. 3-9.

70 URISA Journal • Vol. 15, APA I • 2003 URISA Journal • Carver 71
Slovic, P. and Peters, E. (1998). The Importance of World Views in Risk Perception. Risk, Decision & Policy, 3, 165 - 170.
Smyth, E. (2001) Would the Internet widen public participation? Unpublished MRes Thesis, University of Leeds.
Starr, H. (2000) Using Geographic Information Systems to re-vist enduring rivalries: the case of Israel. Geopolitics 5(1), 37-56.
Taylor, P.J. (1990) GKS, Political Geography Quarterly, 9(3), 211-212.
Taylor P.J, and Overton M. (1991) Further Thoughts on Geog-raphy and GIS, Environment and Planning A, 23, 1087-1094.
Thompson, S. and Hoggett, P. (2001) The emotional dynamics of deliberative democracy. Policy and Politics 29(3), 351-364.
Tsagarousianou, R. Tambini, D. and Bryan, C. (Eds.) (1998) Cyberdemocracy: technology, cities and civic networks. Routledge, London.
United Nations Economic Commission for Europe (2001) The Aarhus Convention: Access to Information, Public Participation and Justice in Environmental Matters. http://www.unece.org/env/pp/
Weidemann, I. and Femers, S. (1993) Public participation in waste management decision-making: analysis and management of conflicts. Journal of Hazardous Materials 33, 355-368.
Wood, W.B. (2000a) GIS as a tool for territorial negotiations. Boundary and Security Bulletin 8(3), 72-79.
Wood, W.B. (2000b) Complex emergency response planning and coordination: potential GIS applications. Geopolitics 5(1), 19-36.

URISA Journal • Drew 73

URISA Journal • Drew 73
Introduction Increasingly, the notion of “transparency” has appeared in aca-demic and popular literature – indeed, three of the four keynote papers for the “Workshop on Access and Participatory Approaches in Using Geographic Information” (Spoleto, Italy, December 2001) mentioned “transparency” in some context. Transparency is often touted as essential for democratic decision-making and public involvement. In the literature, transparency seems to mean that something can be “readily understood,” but a formalized definition for transparency and ways to measure if something is transparent are only just beginning to emerge (Florini 1999, Drew 2002, Drew and Nyerges 2004). In this article, I argue that conceptions of transparency – what it means, how to measure it, and how these may be time and/or space dependent – should be included in the Public Participation Geographic Information Science (PPGIS) research agenda.
The project discussed here is focused specifically on the trans-parency of complex environmental decisions. If people are meant to participate in a decision process, they must first understand several things, such as how decisions get made, what the technical issues are, and how to get information necessary for a decision. These needs are even more important when decisions are complex, when stakes are high (e.g., potential health risks and costs), and when uncertainties are large (e.g., technical difficulty). Such is the case at Hanford – a former plutonium production facility in the State of Washington – and the setting for my research.
This article contains four major sections. First, the Hanford cleanup context is briefly described. Second, the concept of trans-parency is explored and the beginnings of a framework by which it might be measured are presented. Third, we describe the tool that we developed called the “Decision Mapping System,” which uses Geographic Information Science (GIS) and the Internet to promote two-way information exchange among the Hanford decision-makers, active stockholders, and the general public about the Hanford cleanup. Finally, a few key lessons from the
Transparency – Considerations for PPGIS Research and Development
Christina H. Drew
Abstract: Notions of transparency – what it means, how to measure it, and how these may be space and/or time dependent – should be included in the Public Participation Geographic Information Science research agenda. Transparency of decisions is particularly important when the stakes are high and uncertainties are large – as is the case in complex environmental decisions. In this article, I suggest that decision transparency is a complex topic requiring multiple measures to capture its full breadth and depth. The “Decision Mapping System,” which was created for Hanford, a former plutonium production facility owned and operated by the United States Department of Energy, is described. The Decision Mapping System is an example of how to facilitate decision transparency using geographic information and Internet technology.
research that should be applied to the PPGIS research agenda are highlighted.
The Hanford Cleanup ContextThe Hanford site (580 square miles) is located in the southeastern region of Washington State (Figure 1). The site includes nine retired plutonium production reactors, three inactive chemical separations facilities, 177 aging underground storage tanks filled with high level radioactive waste, and many other contaminated facilities. As a result of site operations, intentional “releases,” unplanned spills, and chronic leakages, there is widespread ra-dioactive and chemical contamination of soil, groundwater, and the nearby Columbia River ecosystem. Hanford’s mission is now entirely related to managing nuclear waste and cleaning up the environment. The U.S. Department of Energy (DOE) manages the Hanford cleanup; however, despite spending over a billion dollars per year for the past 10 years on the cleanup, progress has been slow. Some of the contaminants involved are not only very
Figure 1

74 URISA Journal • Vol. 15, APA I • 2003 URISA Journal • Drew 75
dangerous to humans, but they persist in the environment for long periods of time (sometimes tens of thousands of years). Plus, there is no “easy solution” when it comes to radionuclide contamina-tion – in many cases, we simply do not have the technology to dispose of the materials “safely.” And of course, the very question of “how safe is safe” is contested on many levels.
Many people are interested in learning about Hanford and getting involved in its cleanup decision processes, but it is difficult to understand what is happening there and why. For example, complex federal and state regulations have resulted in a vast but poorly organized collection of documents that are difficult to find, obtain, and read. Moreover, decisions are geographically and tech-nically complex, but they are often defined very narrowly, making it a challenge to see how the pieces fit together across space and time. These difficulties boil down to a lack of transparency.
The Importance of Transparency In Complex DecisionsI first became interested in transparency while working with a group called the Hanford Openness Workshops (HOW) (Kern 1998, 1999). This group of diverse stakeholders provided ad-vice to the DOE about the task of sorting through and making “public” the millions of pages of information that were de-clas-sified in the 1990s. The HOW participants frequently paired and interchanged the concepts of transparency and openness. The importance of transparency for this group led my colleagues and me into a review of the environmental and decision-making literature (Drew 2002, Drew and Nyerges 2004).
We found that in many cases, organizations and the literature declare transparency to be essential for public decision-making in democratic societies. Specifically, transparency is praised for lead-ing to more informed choices, permitting evaluation, strengthen-ing institutional credibility, and promoting efficiencies in terms of long-term cost savings, efficient resource allocations, and less duplication (Drew 2002, Drew and Nyerges 2004). Despite the prominence of the term, prior to our analysis, no one had pro-posed any performance measures or other criteria for its evalua-tion. In general, the literature suggested that a transparent decision was one that “allows people who are interested in a decision to understand what is being decided, why, and where.”
In addition, seven key concepts stood out in the literature as having a particularly close association with transparency. The concepts include: clarity, accessibility, integration with other deci-sions, logic and rationale, accountability, truth and accuracy, and openness (Figure 2).
These components of transparency, which can also be thought of as goals, are further described in Table 1. The bullets initiate a robust measurement framework for evaluating transpar-ency – each can be used to devise a specific question to help in an evaluation. For example, parts of this framework were used to evaluate the transparency of a document (Drew and Nyerges 2004) and a Web site (Drew 2002). From this diverse list of po-tential transparency criteria, we conclude that transparency itself is a complex topic and multiple measures are needed to express its full breadth and depth. Major sources influencing our framework include Lodge 1994, the U.S. DOE 1994, the IMF Working Group 1998, Buiter 1999, the Council of the European Union 1999, Florini 1999, the IMF 1999, Issing 1999, Kern 1999, Stiglitz 1999, and Katz 1999. Fuller accounts of this literature and how the framework was developed are available elsewhere (Drew 2002, Drew and Nyerges 2004).
THE DECISION MAPPING SYSTEM AS A TOOL TO PROMOTE TRANSPARENCYBefore we explore the concept of transparency, we thought about how several information structures (some geographic, some not) could be used to support decision processes. Much of the com-plexity of Hanford cleanup information relates to risks – what are they, where are they, and what can/should we do about them? A key question for me has been: how can risk information be structured in a way that makes it easier for people to participate in a decision process?
Figure 2 Figure 3

74 URISA Journal • Vol. 15, APA I • 2003 URISA Journal • Drew 75
Clear• Comprehensible/Intelligible• Unambiguous • Easily detected • Easily seen/heard • Visible (no hidden meanings) • Precise and simple • Contains minimal jargon
Integrated• Comprehensive (process fully laid out/full
disclosure) • Takes a “big picture” view - shows decision in
context to related decisions• Consolidated – described in a single document• Provides logical referencing system pointing
users to additional information and source documentation
• Contains detailed table of contents and indices
Accessible• Allows citizens to have access to important
meetings of government officials • Allows citizens to request and receive government
documents • Makes of detailed documentation and databases
available• Promotes two-way access to information
(stakeholders have access to government legislation, and government has access to stakeholder values)
Truthful and Accurate• Truthful and accurate, free from deceit• Messages undiluted (information delivered
effectively without altering content)
Logical and Rational• Follows a rational defensible plan, clear to a broad
array of stakeholders• Committed to scientific credibility (sound,
dependable, leading edge) • Processes are consistent, standardized, formalized,
flexible, expandable• Identifies clear decision points (and opportunities
for involvement) • Able to track decisions and policies over time • Electronic information includes descriptive
information (metadata) so can be interpreted by all • Uses available technologies to improve access to
declassified or formerly classified information
Accountable• Analyses subjected to independent assurances of
credibility (i.e., peer review)• Shows that activities meet goals of policies • Shows linkages between decisions and
implementation; i.e. records milestones (activities), follows cost and schedule changes, provides rationale for changes, etc.
• Provides rationale behind decisions• Reassures the public• Responds to stakeholders in timely fashion • Provides adequate time for stakeholders to be
involved
Open/Involve stakeholders• Allows concerned citizens to see openly into
government activities• Allows citizens to have input into government
decisions and rule making • Undertakes budget preparation, execution, and
reporting openly• Allows stakeholders consistent opportunities to
make suggestions during decision process and to appeal decisions
• Provides early notification of opportunities • Seeks wide ranging early advice on key proposals • Provides clear and coherent messages • Describes impact of public/stakeholder input • Provides user friendly interfaces • Promotes inter-institutional cooperation
and coordination with the Hanford Tri-Party Agreement, internal organizations, and stakeholders
Table 1: Measuring Transparency
Working closely with stakeholders, we developed a prototype for a geographically based Internet information tool that we call the Decision Mapping System (DMS) (Figure 3). The purpose of the DMS is to allow a better understanding of cleanup activities occurring at Hanford and thus to make it easier for people to participate in Hanford decision processes. The DMS is designed to present cleanup decision information to stakeholders and solicit their comments and feedback.
The DMS has been created specifically for describing deci-sions in the Hanford “100 Area,” but the concepts could be adapted to the entire site, to other weapons production sites man-aged by the DOE, and to other types of environmental cleanup decisions. The DMS includes six related information structures intended to unpack the spatial, temporal, and socio-cultural dimensions of a decision:

76 URISA Journal • Vol. 15, APA I • 2003 URISA Journal • Drew 77
Decision Maps consist of several interactive Web pages that connect decision information to geographic features on a map (spatial dimension). Decision maps are integrated with background information for geographic areas and decisions.
Background Information provides contextual information, allowing users to learn more about Hanford history and how the Department of Energy makes decisions (socio-cultural dimension).
Decision Paths describe decision process information (decision steps) on a timeline (temporal dimension) and provide direct links to online documentation. Each decision has one decision path (Drew et al. 2002).
The Geographic Library connects decision documents to geographic features on a map (spatial dimension). Geographic libraries can be developed for different spatial scales.
Value Trees provide rationale for the decision; ideally, broad values and goals as well as specific objectives and criteria are provided for both procedural and outcome aspects of a decision (socio-cultural dimension). A particular value tree could be associated with many decisions, and each decision could be connected to a number of value trees.
Commenting Features allow users to make remarks about the decision or the DMS (socio-cultural dimension) and view remarks from others.
The DMS is intended to provide a transparent alternative to the current “public record” that documents decision infor-mation. A robust public record is important for the Hanford context because some radioactive contaminants may persist in the environment for tens of thousands of years and because the volume of relevant information is so vast. We believe that GIS and Internet technology could be powerful tools to better man-age both documents and data important for the public record, but they are currently underutilized at Hanford. Geographic
Information Systems have long been used as a tool to integrate data but we now propose that, when combined with other information structures (such as those in the DMS), GIS can be used to integrate information. This integration can allow participants to synthesize knowledge in new ways and more easily than in the past. Similarly, Internet publication will foster greater physical accessibility to information – mainly because of the number of cross-links that are envisioned for the system. Where possible, we have simply linked to existing information, but have also organized it in several ways – spatially, temporally, and conceptually. We hope that this multi-pronged approach will make the decision information easier to understand (i.e., so that it is more conceptually accessible). Internet
publication should also allow a broader audience to access the information, but we recognize that Internet publication is not a panacea and it cannot replace the “grounded social relations” (Niles and Hanson 2001) essential to any decision process.
An important contribution of this research is to study how people want complex environmental decision information to be structured so that they have both physical and conceptual ac-cess to it. Our research design has been strongly influenced by a conceptual framework called Enhanced Adaptive Structuration Theory-2 (EAST-2) (Jankowski and Nyerges 2001), which pro-vides a broad outline for exploring how geographic and other in-formation technology is used in a group decision-making process (see also Nyerges et al. 2002). The research design includes an Internet survey that evaluates the ability of the DMS to provide information transparently. Concepts identified in the transpar-ency literature review form the basis for the survey questions, resulting in an innovative protocol to evaluate the transparency of decisions (Drew 2002).
Conclusions The issues introduced in this article are only a beginning. While the DMS is perhaps better characterized as “public records” GIS (Weiner et al. 2001) than PPGIS per se, we are excited by working hands-on with stakeholders to address the problem of organizing complex spatial information for broad consumption. Ideally, we will be able to continue with a planned “build out” of the DMS into a robust database driven PPGIS. (Currently, the only images and graphics available in the system are static image maps – there is no capability in the system to generate images, charts, or tables on demand.) Nevertheless, I believe that the deeper understand-ing about the meaning of transparency we expect to bring will be highly applicable to PPGIS research agenda. With this in mind, I’d like to make three summary points:
First, the participatory design model has been a key to our success. Hanford has been designated as a national repository for nuclear waste, giving it high priority as a local, regional, and national issue. The DMS was developed using a participatory
Figure 4

76 URISA Journal • Vol. 15, APA I • 2003 URISA Journal • Drew 77
approach that incorporated several active local and regional Hanford stakeholders – including representatives from the U.S. Department of Energy, Washington Ecology, the U.S. Environ-mental Protection Agency, several activist groups, and university researchers. National, regional, and local stakeholders will also be involved in the evaluation of the Decision Mapping System. Preliminary reactions to the DMS have been overwhelmingly positive (Drew 2001). I believe that this response directly reflects the participatory approach used to develop the system.
Second, physical access is only a first step. Access is a major component of our working definition of transparency because it is a major concern of Hanford stakeholders. The participants of the Hanford Openness Workshops, for example, looked closely at the notion of “access” and concluded that physical access to documentation is only a first step. Tools to comprehend technical information contained in the documents, tools to see how docu-ments and decisions fit together, tools that allow stakeholders to provide feedback on the documents and decisions, and tools that allow stakeholders to see how their contributions have influenced decisions are needed. These concerns have been a driving force be-hind the DMS and transparency research – particularly in regard to the system features that foster commenting and information integration. However, much more work is needed to make these goals attainable.
Third, place matters. The Hanford setting is extraordinarily complex and our findings will certainly be colored by this context. Some argue that Hanford is an excellent testing area because it often represents the worst problems – if you can make something work there, you can make it work anywhere. Others suggest that the Hanford context is so complex that results are simply not transferable elsewhere. Either way, our findings will only provide a partial “truth” which must be evaluated in other contexts.
These three lessons suggest that a dialogue about what trans-parency means, how it should be measured in different contexts, and its relative importance compared to other needs (e.g., equity or efficiency) should be a core component of any research agenda involving “communities” or the “public.”
About the Author
Christie Drew is a Research Scientist with the Institute for Risk Analysis and Risk Communication at the University of Washington in Seattle. The Decision Mapping System was the subject of her Ph.D. thesis in Geography. Drew has worked with the Consortium for Risk Evaluation with Stakeholder Participation (CRESP) on U.S. Department of Energy cleanup issues since 1995.
Corresponding Address:Christina H. Drew, Ph.D.University of Washington, Institute for Risk Analysis and Risk Communication4225 Roosevelt Way, NE Suite 100, Seattle, WA 98195Tel: 206-616-7413; Email: [email protected]
Acknowledgements
This research is supported by the Consortium for Risk Evalu-ation with Stakeholder Participation (CRESP) through a grant with the U.S. Department of Energy (Award No. DE-FG26-00NT40938). Any opinions, findings, conclusions, or recom-mendations expressed herein do not necessarily reflect the views of the Department of Energy. I thank the many Hanford stake-holders who donated time and energy to the project and to Tim Nyerges and the anonymous reviewers for comments on earlier drafts of this article.
References
Buiter, W.H., 1999, Alice in Euroland. Journal of Common Market Studies, 37(2), 181-209.
Council of the European Union, 1999, Basic Texts on Trans-parency Concerning the Activities of the Council of the European Union/Council of the European Union, General Secretariat, DG F, Information Policy, Transparency, Public Relations (Luxembourg: The European Council).
Drew, C.H., 2001, Decision Mapping System and Transparency Project Preliminary Design Report: Combined Summary of Stakeholder Interviews (Seattle: Consortium for Risk Evalu-ation with Stakeholder Participation).
Drew, C.H., 2002, The Decision Mapping System: Promoting Transparency of Long-Term Environmental Decisions at Hanford. Ph.D. Dissertation, University of Washington, Department of Geography, Seattle, June 2002. http://nalu.geog.washington.edu/dms
Drew, C.H. and T.L. Nyerges, 2004, Decision Transparency for Long-Term Stewardship: A Case Study of Soil Cleanup at the Hanford 100 Area. Journal of Risk Research (in press).
Drew, C.H., T.L. Nyerges, K. McCarthy, and J.A. Moore, 2002, Using Decision Paths to Explore Three Environmental Cleanup Decisions: A Cross-Case Analysis. International Journal of Environment and Pollution, 17(3), 171-201.
Florini, A.M., 1999, Does the Invisible Hand Need a Transparent Glove? The Politics of Transparency. Annual World Bank Conference on Development Economics, Washington, DC. http://www.worldbank.org/research/abcde/washington_11/pdfs/florini.pdf
International Monetary Fund, 1999, Code of Good Practices on Fiscal Transparency – Declaration of Principles. International Monetary Fund, March 2001. http://www.imf.org/external/np/fad/trans/code.htm
International Monetary Fund Working Group, 1998, Report of the Working Group on Transparency and Accountability (Washington, DC: International Monetary Fund).
Issing O (1999). The Eurosystem: Transparent and Accountable or ‘Willem in
Euroland”. Journal of Common Market Studies 37(3): 503-519.

78 URISA Journal • Vol. 15, APA I • 2003
Jankowski, P. and T.L. Nyerges, 2001, Geographic Information Systems for Group Decision Making: Towards a Participa-tory, Geographic Information Science (London: Taylor and Francis).
Katz, E.M., 1999, Transparency in Government – How American Citizens Influence Public Policy. U.S. Department of State, International Information Programs. Washington, DC. http://usinfo.state.gov/products/pubs/transgov/
Kern, M. (Ed.), 1998, Hanford Openness Workshops October 1997 – May 1998: Final Report (Seattle: Hanford Openness Workshops). http://www.hanford.gov/boards/openness/trac-0818/index.html
Kern, M. (Ed.), 1999, Is Openness Working? A Progress Report (Seattle: Hanford Openness Workshops). http://www.hanford.gov/boards/openness/trac-0828/index.html
Lodge, J., 1994, Transparency and Democratic Legitimacy. Jour-nal of Common Market Studies, 32(3), 343-368.
Niles, S. and S. Hanson, 2001, A New Era of Accessibility: Or Is It? Workshop on Access to Geographic Information and Partici-patory Approaches Using Geographic Information, Spoleto, Italy, December 6-8, 2001. http://www.spatial.maine.edu/~onsrud/Spoleto/NilesHanson.pdf
Nyerges, T., P. Jankowski, and C. Drew, 2002, Data Gathering Strategies for Social-Behavioural Research about Participa-tory Geographic Information System Use. International Journal of Geographic Information Science, 16(1), 1-22.
Stiglitz, J.E., 1999, On Liberty, The Right to Know, and Public Discourse: The Role of Transparency in Public Life. Oxford Amnesty Lecture, The World Bank, January 27, 1999. http://www.worldbank.org/html/extdr/extme/jssp012799.htm
U.S. Department of Energy, 1994, DOE Public Participa-tion Policy. U.S. Department of Energy, Policy: DOE P 1210.1. Washington, DC. http://www.em.doe.gov/public/doepub.html
Weiner, D., T.M. Harris, and W.J. Craig, 2001, Community Participation and Geographic Information Systems. Work-shop on Access to Geographic Information and Participa-tory Approaches Using Geographic Information, Spoleto, Italy, December 6-8, 2001. http://www.spatial.maine.edu/~onsrud/Spoleto/WeinerEtAl.pdf