Embed Size (px)
Citation preview

Volume 13 / Issue 3NOVEMBER 2020
www.fe.um.si/en/jet.html

2 JET

JET 3

4 JET
VOLUME 13 / Issue 3
Revija Journal of Energy Technology (JET) je indeksirana v bazah INSPEC© in Proquest’s Technology Research Database.
The Journal of Energy Technology (JET) is indexed and abstracted in database INSPEC© and Pro-quest’s Technology Research Database.

JET 5
JOURNAL OF ENERGY TECHNOLOGY
Ustanovitelj / FOUNDER Fakulteta za energetiko, UNIVERZA V MARIBORU / FACULTY OF ENERGY TECHNOLOGY, UNIVERSITY OF MARIBOR
Izdajatelj / PUBLISHERFakulteta za energetiko, UNIVERZA V MARIBORU / FACULTY OF ENERGY TECHNOLOGY, UNIVERSITY OF MARIBOR
Glavni in odgovorni urednik / EDITOR-IN-CHIEFJurij AVSEC
Souredniki / CO-EDITORSBruno CVIKLMiralem HADŽISELIMOVIĆGorazd HRENZdravko PRAUNSEISSebastijan SEMEBojan ŠTUMBERGERJanez USENIKPeter VIRTIČIvan ŽAGAR
Uredniški odbor / EDITORIAL BOARDDr. Anton BERGANT, Litostroj Power d.d., Slovenia
Izr. prof. dr. Marinko BARUKČIĆ, Josip Juraj Strossmayer University of Osijek, Croatia
Prof. dr. Goga CVETKOVSKI, Ss. Cyril and Methodius University in Skopje, Macedonia
Prof. dr. Nenad CVETKOVIĆ, University of Nis, Serbia
Prof. ddr. Denis ĐONLAGIĆ, University of Maribor, Slovenia
Doc. dr. Brigita FERČEC, University of Maribor, Slovenia

6 JET
Prof. dr. Željko HEDERIĆ, Josip Juraj Strossmayer University of Osijek, Croatia
Prof. dr. Marko JESENIK, University of Maribor, Slovenia
Izr. prof. dr. Ivan Aleksander KODELI, Jožef Stefan Institute, Slovenia
Izr. prof. dr. Rebeka KOVAČIČ LUKMAN, University of Maribor, Slovenia
Prof. dr. Milan MARČIČ, University of Maribor, Slovenia
Prof. dr. Igor MEDVED, Slovak University of Technology in Bratislava, Slovakia
Izr. prof. dr. Matej MENCINGER, University of Maribor, Slovenia
Prof. dr. Greg NATERER, Memorial University of Newfoundland, Canada
Prof. dr. Enrico NOBILE, University of Trieste, Italia
Prof. dr. Urška LAVRENČIČ ŠTANGAR, University of Ljubljana, Slovenia
Izr. prof. dr. Luka SNOJ, Jožef Stefan Institute, Slovenia
Izr. prof. dr. Simon ŠPACAPAN, University of Maribor, Slovenia
Prof. dr. Gorazd ŠTUMBERGER, University of Maribor, Slovenia
Prof. dr. Anton TRNIK, Constantine the Philosopher University in Nitra, Slovakia
Prof. dr. Zdravko VIRAG, University of Zagreb, Croatia
Prof. dr. Mykhailo ZAGIRNYAK, Kremenchuk Mykhailo Ostrohradskyi National University, Ukraine
Prof. dr. Marija ŽIVIĆ, University of Slavonski Brod, Croatia

JET 7
Tehnični urednik / TECHNICAL EDITORSonja Novak
Tehnična podpora / TECHNICAL SUPPORTTamara BREČKO BOGOVČIČ
Izhajanje revije / PUBLISHINGRevija izhaja štirikrat letno v nakladi 100 izvodov. Članki so dostopni na spletni strani revije - www.fe.um.si/si/jet.html / The journal is published four times a year. Articles are available at the journal’s home page - www.fe.um.si/en/jet.html.Cena posameznega izvoda revije (brez DDV) / Price per issue (VAT not included in price): 50,00 EURInformacije o naročninah / Subscription information: http://www.fe.um.si/en/jet/subscriptions.html
Lektoriranje / LANGUAGE EDITINGTerry T. JACKSON
Oblikovanje in tisk / DESIGN AND PRINTFotografika, Boštjan Colarič s.p.
Naslovna fotografija / COVER PHOTOGRAPH Jurij AVSEC
Oblikovanje znaka revije / JOURNAL AND LOGO DESIGNAndrej PREDIN
Ustanovni urednik / FOUNDING EDITORAndrej PREDIN

8 JET
Spoštovani bralci revije Journal of energy technology (JET)
Nekoč je gozd prekrival večji del celin. Danes se zaradi poseljevanja in industrializacije gozdovi po svetu močno krčijo. Še posebej je zaskrbljujoče krčenje amazonskega pragozda, t. i. pljuč sveta. Po podatkih približno 7-10 % vseh potreb po energiji v svetu zadostimo z lesno biomaso. Podobno je tudi v Evropi, kjer energija lesa še vedno predstavlja najpomembnejši energetski obnovljivi vir. Pod lesno biomaso razumemo predvsem les iz gozda, lesne odpadke, rastlinske ostanke ... Veči-no energije, pridobljene z biomaso, porabimo v svetu za ogrevanje in kuhanje. Več kot polovico Slovenije prekriva gozd; tako smo ena redkih držav v Evropi, ki se lahko ponaša s toliko zelenimi površinami. Uporaba biomase je enako zanimiva v klasičnih sistemih za ogrevanje in kuhanje kot tudi za sopro-izvodnjo toplotne in električne energije. V ta namen so razviti različni sistemi s Stirlingovim motor-jem, ORC procesom, z motorji z notranjim zgorevanjem, plinsko turbino, parno turbino… Uporaba sistemov s soproizvodnjo toplote in električne energije daje mnogo boljše termodinamične in ek-sergijske izkoristke v primerjavi s klasičnimi biomasnimi sistemi. Tudi v Sloveniji imamo kar precej takšnih enot, saj iz biomasne proizvodnje pridobimo nekaj več kot 2 % vse električne energije. Na-slednja možnost izrabe biomase je tudi pretvorba lesne biomase v biogoriva, kot so na primer lesni plin, metan ali biovodik.
Jurij AVSECodgovorni urednik revije JET

JET 9
Dear Readers of the Journal of Energy Technology (JET)
Once upon a time, the forest covered most of the continents. Due to settlement and industrializa-tion, forests around the world are shrinking. Of particular concern is the shrinking of the Amazon rainforest, the lungs of the world. According to data, about 7–10% of all energy needs in the world are met by wood biomass, which includes Europe, where wood energy is still the most important energy renewable energy source. By “wood biomass”, we mean mainly wood from the forest, wood waste, plant residues, and similar. Most of the biomass energy in the world is used for heating and cooking. More than half of Slovenia is covered forest; we are among the greenest countries in Eu-rope, in this regards. Given the amount of wood, it is logical that Slovenia would also have a large wood-processing industry. Apart from the use of biomass in conventional heating and cooking systems, the cogeneration of heat and electricity is always interesting. For this purpose, various systems with Stirling engines, ORC processes, internal combustion engines, gas turbine, steam turbine have been developed. The use of systems with cogeneration of heat and electricity gives much better thermodynamic and exergy efficiency than conventional biomass systems do. Slovenia also has quite a few such units, as we obtain a little more than 2% of all electricity from biomass cogeneration. Another possibility of using biomass is the conversion of wood biomass into biofuels, such as wood gas, methane or biohydrogen.
Jurij AVSECEditor-in-chief of JET

10 JET
Table of Contents /Kazalo
Innovative gasification technology for the circular economy
Inovativna tehnologija uplinjanja za krožno gospodarstvo
Teos Perne, Marko Šetinc, Tine Seljak . . . . . . . . . . . . . . . . . . . . . . . . . . . . . . . . . . . . .11
Design influenced by the effect of filter selection on the appraiser variation of the measuring results of a 3D optical measuring system
Zasnova, ki vpliva na izbiro filtra za oceno merilnih rezultatov 3D optičnega merilnega sistema
Josip Groš, Tihomir Mihalić, Srđan Medić, Nikola Šimunić . . . . . . . . . . . . . . . . . . . . . . . . .27
Fuzzy model for estimating the risk of infection by Covid-19
Mehki model napovedi ogroženosti z boleznijo Covid-19
Janez Usenik . . . . . . . . . . . . . . . . . . . . . . . . . . . . . . . . . . . . . . . . . . . . . . . . . . . .43
A regenerator used in the installation of magnetic refrigeration devices
Uporaba regeneratorja za magnetno hlajenje
Botoc Dorin, Jurij Avsec, Adrian Plesca. . . . . . . . . . . . . . . . . . . . . . . . . . . . . . . . . . . . .57
Instructions for authors . . . . . . . . . . . . . . . . . . . . . . . . . . . . . . . . . . . . . . . . . . . . .67

JET 11
JET Volume 13 (2020) p.p. 11-26Issue 3, November 2020
Type of article 1.01www.fe.um.si/en/jet.html
INNOVATIVE GASIFICATION TECHNOLOGY FOR THE CIRCULAR ECONOMY
INOVATIVNA TEHNOLOGIJA UPLINJANJA ZA KROŽNO GOSPODARSTVO
Teos Perne1,R, Marko Šetinc Ph.D.2, Tine Seljak Ph.D.3
Keywords: Gasification, carbonaceous, waste, tars, syngas, catalyst, circular economy, carbon, methanol
AbstractThis article presents a novel gasification technology process in the context of achieving carbon neu-trality by establishing a sustainable circulation of carbonaceous materials with a focus on the produc-tion of virgin materials from various kinds of waste. The technology can alleviate the key limitations of existing gasification systems, which are the production and management of residue tars. The innova-tive technology process re-utilizes tars within the reaction itself, enabling an endless cycle of carbon. It also ensures high flexibility for efficiently handling heterogenic waste materials.
PovzetekČlanek predstavlja nov tehnološki postopek uplinjanja v okviru doseganja ogljikove nevtralnosti z vzpostavitvijo trajnostnega kroženja ogljikovih materialov s fokusom na proizvodnji izvornih surovin iz različnih vrst odpadkov. Tehnologija lahko reši ključne omejitve obstoječih sistemov uplinjanja, to je proizvodnja in upravljanje ostankov katrana. Inovativni tehnološki postopek uporabi katrane v sami reakciji, kar omogoča neskončno kroženje ogljika. Zagotavlja tudi visoko prilagodljivost za učinkovito ravnanje s heterogenimi odpadnimi materiali.
R Corresponding author: Teos Perne, Tel.: +386 64 231 881, Mailing address: Ul. Jakoba Aljaža 18, 4281 Mojstrana, Slovenia, E-mail address: [email protected]
1 PLASMA NOVA, Project development, Tehnološki park 20, 1000 Ljubljana, Slovenia;
2 GEOPOLIS, Teslova 30, 1000 Ljubljana, Slovenia
3 University of Ljubljana, Faculty of mechanical engineering, Aškerčeva 6, SI-1000 Ljubljana, Slovenia.

12 JET
Teos Perne, Marko Šetinc, Tine Seljak JET Vol. 13 (2020)Issue 3
2 Teos Perne, Marko Šetinc, Tine Seljak JET Vol. 13 (2020) Issue 3
‐‐‐‐‐‐‐‐‐‐
1 INTRODUCTION
Talking about global warming is talking about carbon management, which should be simple: the release of carbon into the atmosphere should be reduced as much as possible. For example:
avoiding the use of C for energy production;
avoiding biodegradation (which is also a cause of GHG emissions);
the use of biomass, as optimal and efficient circulation of GHG is possible only via biomass;
all C from carbonaceous wastes and residues should be prioritized for the production of new virgin raw hydrocarbons;
With the existing technological solutions, a circular economy cannot be established. The transformation of carbon from residues to new virgin materials should be the basis of any programme. Existing methods for recycling carbonaceous materials can assure only limited cycles, after which the recycled products end up as waste in incineration plants, or, as is the case for the EU, in the landfills of southern continents, as well as (of course) in the oceans:
Figure 1: The 5 Gyres
The term “recycling” should mean an endless circulation of materials, as is the case with metals. The treatment of hydrocarbons as we know it today is in reality only extending the life cycle of products, which contributes to the reduction of fossil hydrocarbon consumption; however, the material flow balance is inexorable in the end: all inputs will sooner or later become outputs. This fact calls for an appropriate and better technological solution with the possibility of processing heterogeneous carbonaceous waste and residue materials into new virgin materials. Chemical recycling based on the gasification process is one of them.
Solving the major problem of the gasification process through an innovative approach, a technological solution of producing new virgin materials from any kind of waste or residues is now available. According to Directive 2010/75/EU on industrial emissions (IED), the gasification technology presented in this paper may be treated as “End of Waste” technology, as the prescribed technical conditions are met. According to the R3 process (recycling), syngas is considered a new raw material. Besides the application of such syngas as a technical gas or energy source, its major importance is in acting as the first process phase in the synthesis
JET 13
Innovative gasification technology for the circular economy
Innovative gasification technology for the circular economy
‐‐‐‐‐‐‐‐‐‐‐‐‐
3
industry when producing virgin hydrocarbons. New gasification technology enables a true and endless carbon cycle.
2 GASIFICATION PROCESS
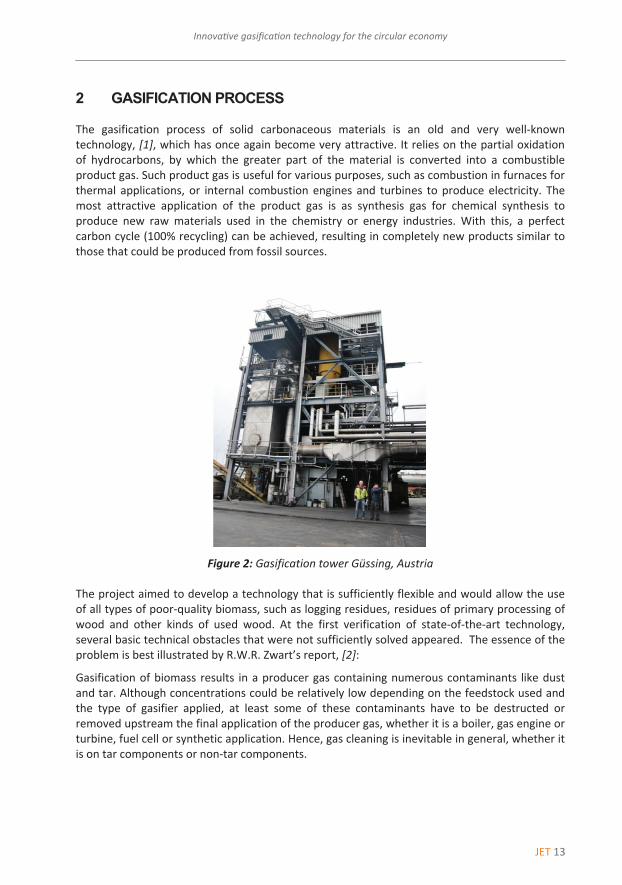
The gasification process of solid carbonaceous materials is an old and very well‐known technology, [1], which has once again become very attractive. It relies on the partial oxidation of hydrocarbons, by which the greater part of the material is converted into a combustible product gas. Such product gas is useful for various purposes, such as combustion in furnaces for thermal applications, or internal combustion engines and turbines to produce electricity. The most attractive application of the product gas is as synthesis gas for chemical synthesis to produce new raw materials used in the chemistry or energy industries. With this, a perfect carbon cycle (100% recycling) can be achieved, resulting in completely new products similar to those that could be produced from fossil sources.
Figure 2: Gasification tower Güssing, Austria
The project aimed to develop a technology that is sufficiently flexible and would allow the use of all types of poor‐quality biomass, such as logging residues, residues of primary processing of wood and other kinds of used wood. At the first verification of state‐of‐the‐art technology, several basic technical obstacles that were not sufficiently solved appeared. The essence of the problem is best illustrated by R.W.R. Zwart’s report, [2]:
Gasification of biomass results in a producer gas containing numerous contaminants like dust and tar. Although concentrations could be relatively low depending on the feedstock used and the type of gasifier applied, at least some of these contaminants have to be destructed or removed upstream the final application of the producer gas, whether it is a boiler, gas engine or turbine, fuel cell or synthetic application. Hence, gas cleaning is inevitable in general, whether it is on tar components or non‐tar components.
14 JET
Teos Perne, Marko Šetinc, Tine Seljak JET Vol. 13 (2020)Issue 3
4 Teos Perne, Marko Šetinc, Tine Seljak JET Vol. 13 (2020) Issue 3
‐‐‐‐‐‐‐‐‐‐
Still not many gasifiers are operating commercially on biomass feedstock, in particular when not taking into account those gasification systems (co‐)firing the product straight into boilers. The need for gas cleaning, and in particular tar removal technology, for CHP or synthesis purposes is still the Achilles heel of biomass gasification and gas cleaning. Standard technology has proven to be insufficient for tar destruction or removal and has led to years of (still ongoing) R&D on thermal and catalytic tar cracking as well as (advanced) scrubbing technologies. For the moment, the latter ones seem to have made the biggest progress, with operating biomass‐based CHP plants at e.g. among others Harboøre and Güssing, and water as well as organic liquid (RME, oil) based technologies being commercially available.
Figure 3: The computer scheme of Güssing gasifier in operation, Austria
A step by step approach could be considered in which technology is scaled up gradually. There has been a tendency to construct large (demonstration) facilities hoping that these are operated successfully and due to scale are commercially attractive as well. The risks are high though, as solving unexpected issues will require enormous budgets. The risk that such a plant becomes mothballed instead of a commercial success has been proven to be relevant. Examples of this are the 180 ton per day Battelle gasification plant in Burlington, USA, and the 8 MWel ARBRE combined‐cycle plant in Eggborough, UK.
Tars are still considered to be the major bottleneck or even stumbling blocks in the application of biomass gasification. This holds for fluidized as well as updraft fixed bed‐based gasification performed at temperatures well below 1000°C, as tar contents in the raw gas can be up to several tens of g/Nm³. A description of tars and the main associated issues are included in the appendices. The cleaning from these organic species down to values that are acceptable for different downstream processes is of crucial importance for successful implementation of biomass gasification technology. Tar reduction measures can be classified in three main categories, being:
i. tar cracking and reforming (thermal or catalyst), ii. mechanical tar removal and iii. physical tar removal (emphasis added).
Many sophisticated technical solutions have been developed to solve the tar problem. However, most (if not all) solutions go at the expense of process flexibility, which should be the most important advantage of gasification technology. The purpose of gasification should be the
JET 15
Innovative gasification technology for the circular economy
Innovative gasification technology for the circular economy ‐‐‐‐‐‐‐‐‐‐‐‐‐
5
ability to process all challenging materials, such as worthless biomass (wet or contaminated with dust), or any kind of municipal and industrial waste. The use of high quality dry and dustless wood chips or even pellets for gasification is not in line with sustainability criteria and waste hierarchy. Losing upstream flexibility does not aid in avoiding losing downstream flexibility. An example of this is the Güssing CHP plant: the use of dustless wood chips for gasification did not prevent the need for a sophisticated filtering system, which led to high operational costs. The plant was not profitable without subsidies; hence production was halted in 2016, [3].
3 A NEW APPROACH
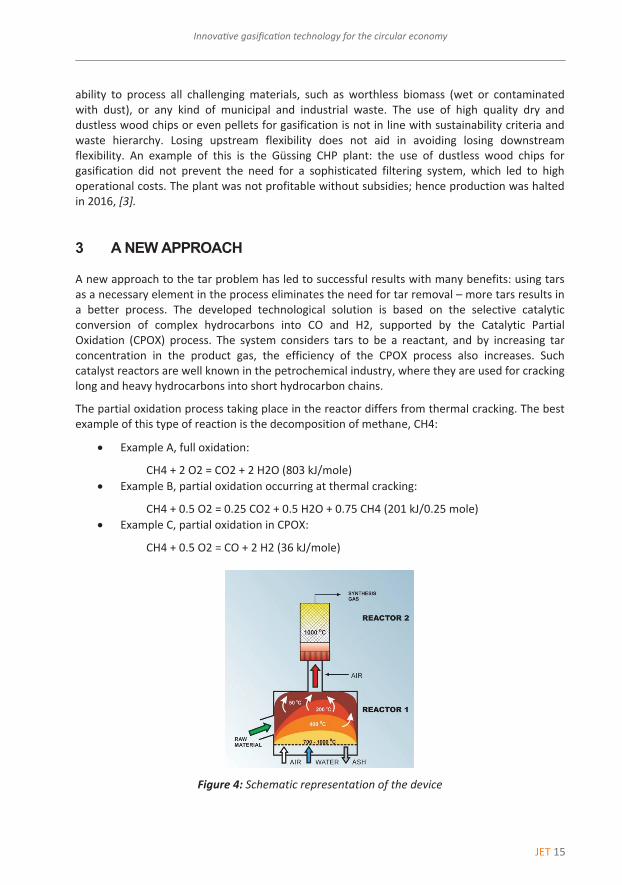
A new approach to the tar problem has led to successful results with many benefits: using tars as a necessary element in the process eliminates the need for tar removal – more tars results in a better process. The developed technological solution is based on the selective catalytic conversion of complex hydrocarbons into CO and H2, supported by the Catalytic Partial Oxidation (CPOX) process. The system considers tars to be a reactant, and by increasing tar concentration in the product gas, the efficiency of the CPOX process also increases. Such catalyst reactors are well known in the petrochemical industry, where they are used for cracking long and heavy hydrocarbons into short hydrocarbon chains.
The partial oxidation process taking place in the reactor differs from thermal cracking. The best example of this type of reaction is the decomposition of methane, CH4:
Example A, full oxidation:
CH4 + 2 O2 = CO2 + 2 H2O (803 kJ/mole) (1.1) Example B, partial oxidation occurring at thermal cracking:
CH4 + 0.5 O2 = 0.25 CO2 + 0.5 H2O + 0.75 CH4 (201 kJ/0.25 mole) (1.2) Example C, partial oxidation in CPOX:
CH4 + 0.5 O2 = CO + 2 H2 (36 kJ/mole) (1.3)
Figure 4: Schematic representation of the device
16 JET
Teos Perne, Marko Šetinc, Tine Seljak JET Vol. 13 (2020)Issue 3
6 Teos Perne, Marko Šetinc, Tine Seljak JET Vol. 13 (2020) Issue 3
‐‐‐‐‐‐‐‐‐‐
In CPOX, the exothermic reaction is taking place inside the reactor. Partial oxidation releases significantly less heat than full oxidation, but still enough to get the catalyst up to working temperature. Another advantage of the CPOX is its compactness, as the residence time ranges from 0.14 to 0.08 sec, while the residence time in full oxidation systems can reach up to 10 s.
In order to reach higher tar concentrations in the product gas, heterogeneous and poor‐quality gasification materials may be used, with less drying and sieving (to remove dust). The quality of the material used depends on the type of gasifier. For basic CPOX testing, a specially designed multi‐fuel updraft gasifier was used, which can accept all kinds of heterogeneous carbonaceous materials, except for very fine dust or explosives. It can operate on sawdust, all kinds of waste, sludge, coal, charcoal, plastic, wood chips and agricultural residues. The gasifier produces product gas with up to 20% tar content, which is optimal for the CPOX catalyst system.
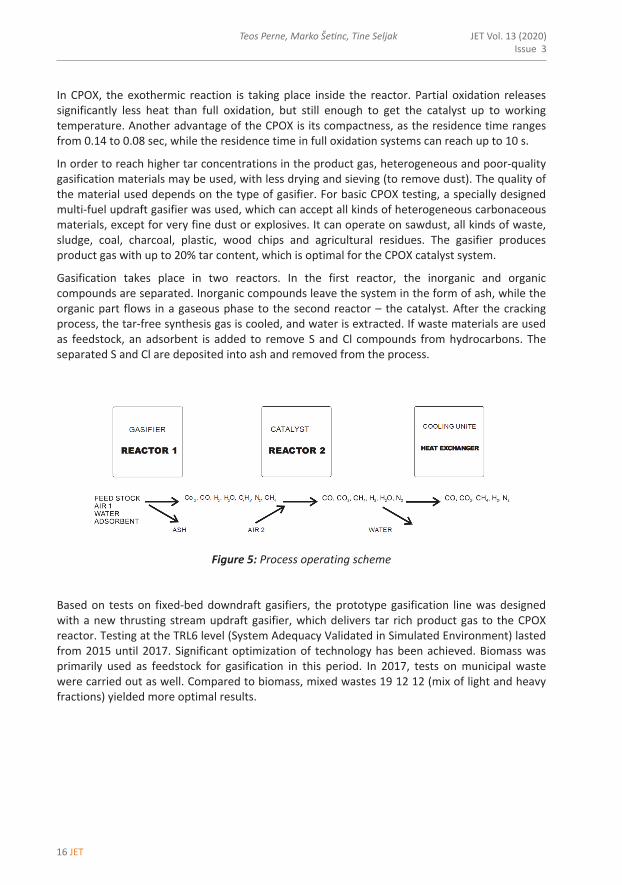
Gasification takes place in two reactors. In the first reactor, the inorganic and organic compounds are separated. Inorganic compounds leave the system in the form of ash, while the organic part flows in a gaseous phase to the second reactor – the catalyst. After the cracking process, the tar‐free synthesis gas is cooled, and water is extracted. If waste materials are used as feedstock, an adsorbent is added to remove S and Cl compounds from hydrocarbons. The separated S and Cl are deposited into ash and removed from the process.
Figure 5: Process operating scheme
Based on tests on fixed‐bed downdraft gasifiers, the prototype gasification line was designed with a new thrusting stream updraft gasifier, which delivers tar rich product gas to the CPOX reactor. Testing at the TRL6 level (System Adequacy Validated in Simulated Environment) lasted from 2015 until 2017. Significant optimization of technology has been achieved. Biomass was primarily used as feedstock for gasification in this period. In 2017, tests on municipal waste were carried out as well. Compared to biomass, mixed wastes 19 12 12 (mix of light and heavy fractions) yielded more optimal results.
JET 17
Innovative gasification technology for the circular economy
Innovative gasification technology for the circular economy ‐‐‐‐‐‐‐‐‐‐‐‐‐
7
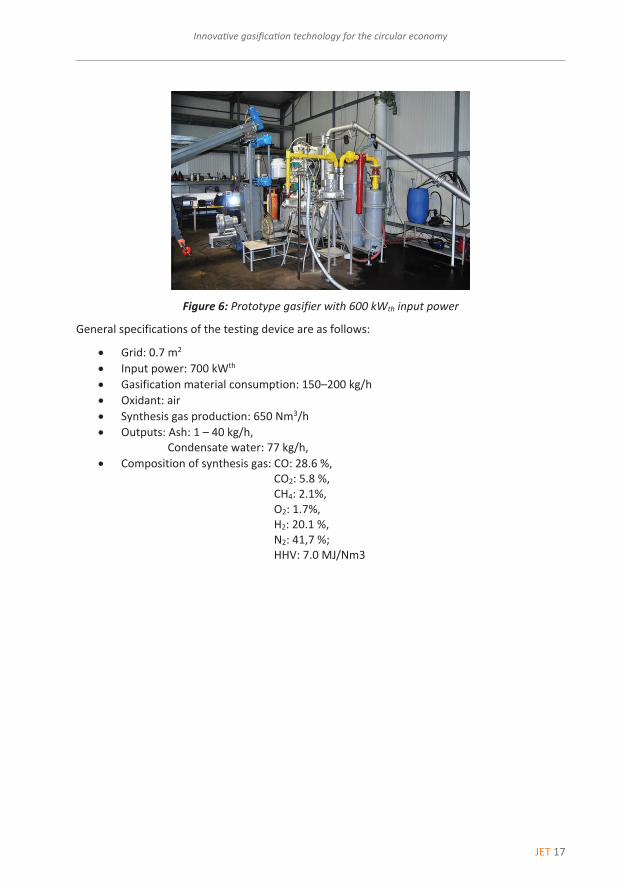
Figure 6: Prototype gasifier with 600 kWth input power
General specifications of the testing device are as follows:
Grid: 0.7 m2 Input power: 700 kWth Gasification material consumption: 150–200 kg/h Oxidant: air Synthesis gas production: 650 Nm3/h Outputs: Ash: 1 – 40 kg/h,
Condensate water: 77 kg/h, Composition of synthesis gas: CO: 28.6 %,
CO2: 5.8 %, CH4: 2.1%, O2: 1.7%, H2: 20.1 %, N2: 41,7 %; HHV: 7.0 MJ/Nm3
18 JET
Teos Perne, Marko Šetinc, Tine Seljak JET Vol. 13 (2020)Issue 3
8 Teos Perne, Marko Šetinc, Tine Seljak JET Vol. 13 (2020) Issue 3
‐‐‐‐‐‐‐‐‐‐
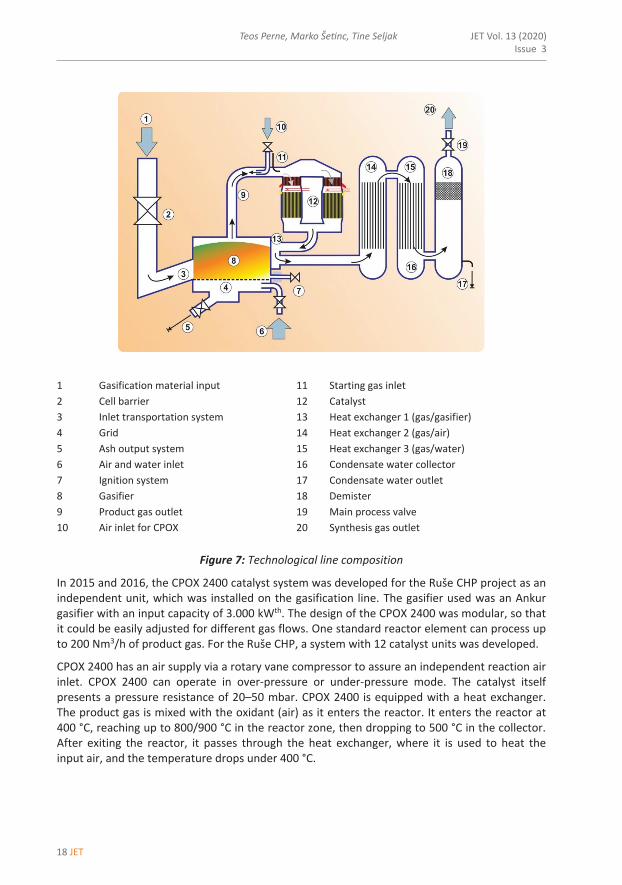
Figure 7: Technological line composition
In 2015 and 2016, the CPOX 2400 catalyst system was developed for the Ruše CHP project as an independent unit, which was installed on the gasification line. The gasifier used was an Ankur gasifier with an input capacity of 3.000 kWth. The design of the CPOX 2400 was modular, so that it could be easily adjusted for different gas flows. One standard reactor element can process up to 200 Nm3/h of product gas. For the Ruše CHP, a system with 12 catalyst units was developed.
CPOX 2400 has an air supply via a rotary vane compressor to assure an independent reaction air inlet. CPOX 2400 can operate in over‐pressure or under‐pressure mode. The catalyst itself presents a pressure resistance of 20–50 mbar. CPOX 2400 is equipped with a heat exchanger. The product gas is mixed with the oxidant (air) as it enters the reactor. It enters the reactor at 400 °C, reaching up to 800/900 °C in the reactor zone, then dropping to 500 °C in the collector. After exiting the reactor, it passes through the heat exchanger, where it is used to heat the input air, and the temperature drops under 400 °C.
1 Gasification material input 11 Starting gas inlet 2 Cell barrier 12 Catalyst 3 Inlet transportation system 13 Heat exchanger 1 (gas/gasifier) 4 Grid 14 Heat exchanger 2 (gas/air) 5 Ash output system 15 Heat exchanger 3 (gas/water) 6 Air and water inlet 16 Condensate water collector 7 Ignition system 17 Condensate water outlet 8 Gasifier 18 Demister 9 Product gas outlet 19 Main process valve 10 Air inlet for CPOX 20 Synthesis gas outlet

JET 19
Innovative gasification technology for the circular economy
Innovative gasification technology for the circular economy ‐‐‐‐‐‐‐‐‐‐‐‐‐
9
Figure 8: CPOX 2400 catalyst device
4 WASTE CARBONACEOUS MATERIALS AS FEEDSTOCK FOR GASIFICATION
Gasification is a slow thermochemical process in which materials are heated to 600 °C, which is the temperature at which the majority of hydrocarbons break down. The process is generally determined by the amount of C and H (as well as other contaminants) added to the process, while the structure of the molecules in which the elements are arranged is not of importance. In the case of using waste as the feedstock, the fraction of Cl and S should also be determined. Limitations are presented only by clean materials in the shape of dust, or rapidly combustible materials which must be diluted. Liquid hydrocarbons must be mixed with a solid carrier, such as sawdust or a heavy fraction of waste.
Technical conditions for gasification materials preparation:
‐ material should be heterogeneous;
‐ material should be wet;
‐ density must be 200 kg/m3 (mix of light + heavy fraction);
‐ material should be crushed to G50 – G70;
‐ metals and minerals must be removed as much as possible;
‐ dust or moisture removal not needed;
‐ removal of materials with S and Cl elements not needed (according to S and Cl content, the appropriate amount of adsorbent is added);
‐ separation of fractions by waste type not needed.

20 JET
Teos Perne, Marko Šetinc, Tine Seljak JET Vol. 13 (2020)Issue 3
10 Teos Perne, Marko Šetinc, Tine Seljak JET Vol. 13 (2020) Issue 3
‐‐‐‐‐‐‐‐‐‐
Main parameters of the innovative gasification technology:
‐ gasification efficiency: 80% of energy from input materials is converted into chemical energy of syngas;
‐ outputs consist of inert ash without organic carbon and condensate water;
‐ no tars, water or particles are present in the syngas;
‐ according to technical standards from Directive 2010/75/EU, syngas has the same or better purity as natural gas and is classified as a new raw material, even if waste is used as feedstock;
‐ syngas may be used as technical gas, as energy source or as a feedstock for chemical synthesis of new virgin products (such are synthetic methane, methanol, or FT products);
According to article 42/1 of the Directive 2010/75/EU on industrial emissions (IED), the conditions for a classification as “End of Waste” technology is assured. The implementation procedure of the above statutory provision is determined by the non‐paper document prepared by the EU Commission [4]. According to the aforementioned document, the following list of combustible wastes will be tested in the gasification process:
• Non‐hazardous combustible wastes: 02 01 02, 02 01 03, 02 01 04, 02 01 07, 02 01 09, 02 02 02, 02 02 03, 02 03 01, 02 03 03, 02 03 04, 02 03 05, 02 05 01, 02 05 02, 02 06 01, 02 07 02, 02 07 03, 02 07 04, 03 01 01, 03 01 05, 03 01 99, 03 02 99, 03 03 01, 03 03 02, 03 03 05, 03 03 07, 03 03 08, 03 03 10, 04 01 08, 04 01 09, 04 02 09, 04 02 10, 04 02 21, 04 02 22, 05 01 10, 05 01 13, 05 01 17, 07 01 12, 07 02 12, 07 02 13, 07 02 15, 07 02 17, 07 03 12, 08 01 12, 08 01 14, 08 04 10, 08 04 12, 09 01 07, 09 01 08, 10 01 25, 12 01 05, 15 01 01, 15 01 02, 15 01 03, 15 01 05, 15 01 06, 15 01 09, 15 02 03, 16 01 03, 16 01 19, 16 03 06, 17 02 01, 17 02 03, 17 03 02, 18 01 04, 18 01 07, 18 01 09, 18 02 03, 18 02 06, 18 02 08, 19 02 03, 19 02 06, 19 02 10, 19 03 05, 19 03 07, 19 05 01, 19 05 02, 19 06 04, 19 06 06, 19 08 01, 19 08 05, 19 08 09, 19 08 12, 19 08 14, 19 09 04, 19 09 05, 19 11 06, 19 12 01, 19 12 04, 19 12 07, 19 12 08, 19 12 10, 19 12 12, 20 01 01, 20 01 08, 20 01 10, 20 01 11, 20 01 25, 20 01 28, 20 01 30, 20 01 32, 20 01 38, 20 01 39, 20 01 40, 20 01 41, 20 03 01, 20 03 02 and 20 03 07; • Hazardous combustible wastes: 02 01 08*, 03 01 04*, 04 02 14*, 05 01 09*, 07 01 11*, 07 02 11*, 07 02 14*, 07 02 16*, 07 03 11*, 08 01 11*, 08 01 13*, 08 04 09*, 08 04 11*, 15 01 10*, 15 02 02*, 16 03 05*, 17 02 04*, 17 03 01*, 17 09 02*, 17 09 03*, 18 01 03*, 18 01 06*, 18 01 08*, 18 02 02*, 18 02 05*, 18 02 07*, 19 02 05*, 19 02 08*, 19 02 09*, 19 03 04*, 19 03 06*, 19 08 10*, 19 08 11*, 19 08 13*, 19 11 05*, 19 12 06*, 19 12 11*, 20 01 26*, 20 01 27*, 20 01 29*, 20 01 31* and 20 01 37*;
The need for the heterogeneousness of gasification materials leads to a much simpler waste preparation process, compared to today’s separation methods into fractions or even separate waste types. A new and simpler system of waste treatment could be implemented, employing cheaper methods, leading to a much more effective transformation of carbonaceous materials into new virgin materials. Landfilling of useless wastes and GHG emissions will decrease significantly, and a large part of fossil carbon can be replaced with carbon circulation in a true recycling cycle.
JET 21
Innovative gasification technology for the circular economy
Innovative gasification technology for the circular economy ‐‐‐‐‐‐‐‐‐‐‐‐‐
11
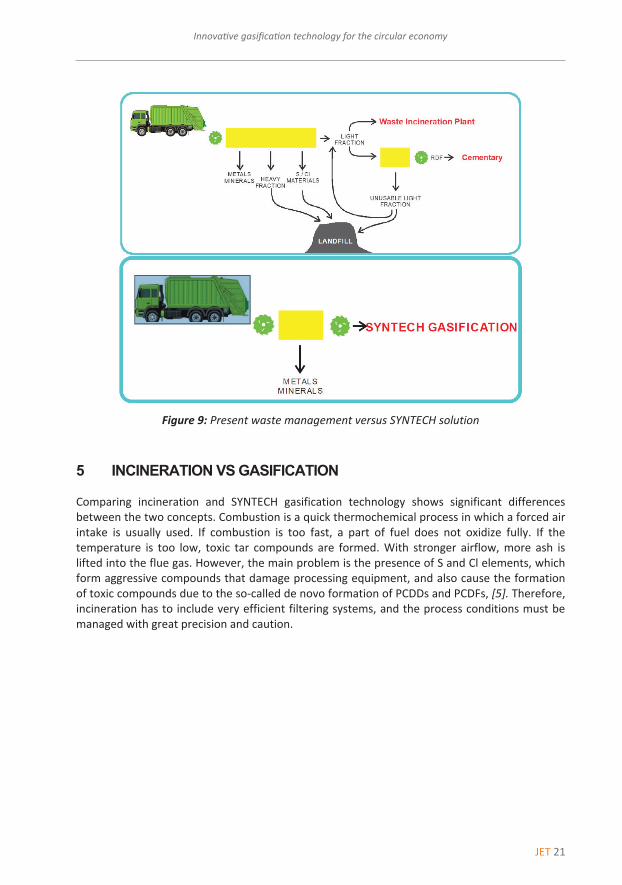
Figure 9: Present waste management versus SYNTECH solution
5 INCINERATION VS GASIFICATION
Comparing incineration and SYNTECH gasification technology shows significant differences between the two concepts. Combustion is a quick thermochemical process in which a forced air intake is usually used. If combustion is too fast, a part of fuel does not oxidize fully. If the temperature is too low, toxic tar compounds are formed. With stronger airflow, more ash is lifted into the flue gas. However, the main problem is the presence of S and Cl elements, which form aggressive compounds that damage processing equipment, and also cause the formation of toxic compounds due to the so‐called de novo formation of PCDDs and PCDFs, [5]. Therefore, incineration has to include very efficient filtering systems, and the process conditions must be managed with great precision and caution.
22 JET
Teos Perne, Marko Šetinc, Tine Seljak JET Vol. 13 (2020)Issue 3
12 Teos Perne, Marko Šetinc, Tine Seljak JET Vol. 13 (2020) Issue 3
‐‐‐‐‐‐‐‐‐‐
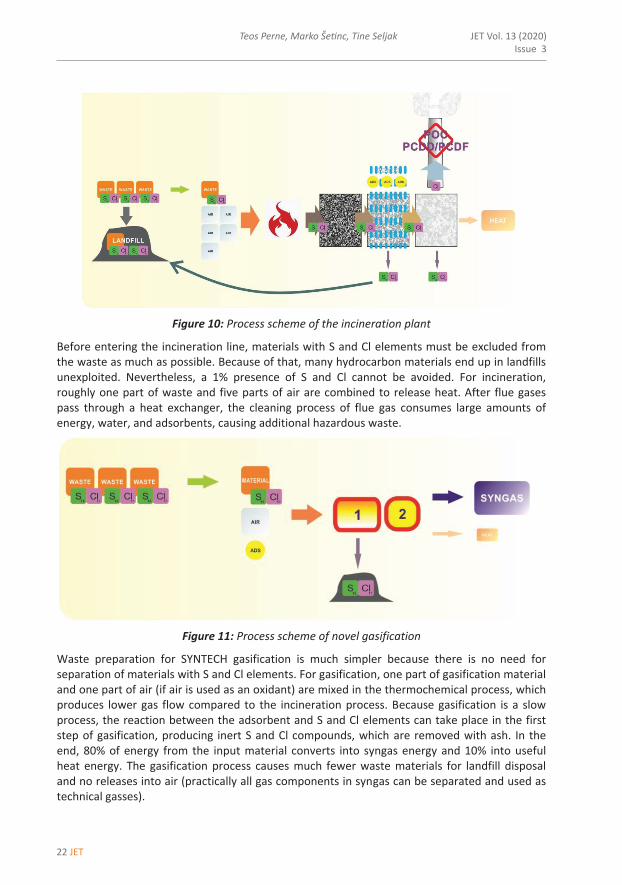
Figure 10: Process scheme of the incineration plant
Before entering the incineration line, materials with S and Cl elements must be excluded from the waste as much as possible. Because of that, many hydrocarbon materials end up in landfills unexploited. Nevertheless, a 1% presence of S and Cl cannot be avoided. For incineration, roughly one part of waste and five parts of air are combined to release heat. After flue gases pass through a heat exchanger, the cleaning process of flue gas consumes large amounts of energy, water, and adsorbents, causing additional hazardous waste.
Figure 11: Process scheme of novel gasification
Waste preparation for SYNTECH gasification is much simpler because there is no need for separation of materials with S and Cl elements. For gasification, one part of gasification material and one part of air (if air is used as an oxidant) are mixed in the thermochemical process, which produces lower gas flow compared to the incineration process. Because gasification is a slow process, the reaction between the adsorbent and S and Cl elements can take place in the first step of gasification, producing inert S and Cl compounds, which are removed with ash. In the end, 80% of energy from the input material converts into syngas energy and 10% into useful heat energy. The gasification process causes much fewer waste materials for landfill disposal and no releases into air (practically all gas components in syngas can be separated and used as technical gasses).
JET 23
Innovative gasification technology for the circular economy
Innovative gasification technology for the circular economy ‐‐‐‐‐‐‐‐‐‐‐‐‐
13
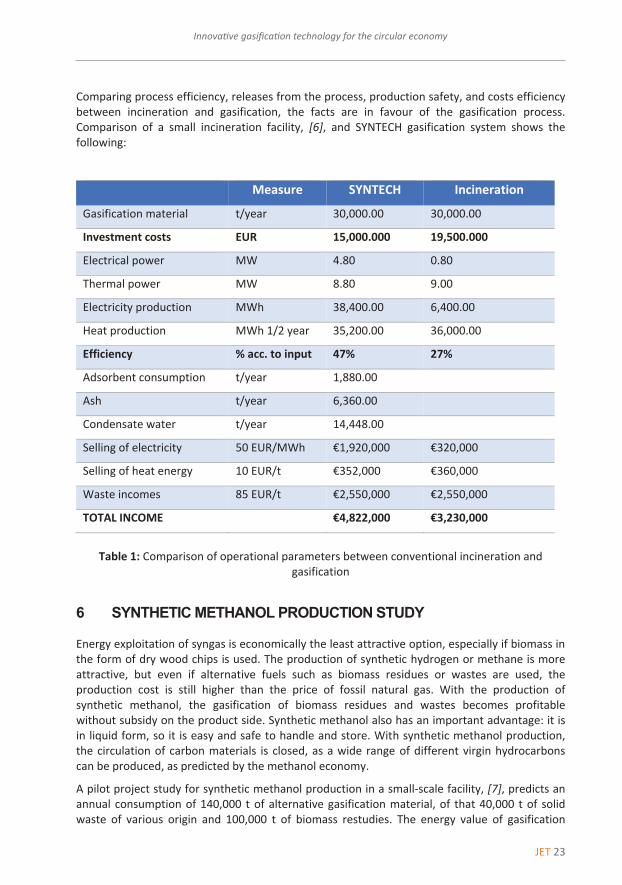
Comparing process efficiency, releases from the process, production safety, and costs efficiency between incineration and gasification, the facts are in favour of the gasification process. Comparison of a small incineration facility, [6], and SYNTECH gasification system shows the following:
Measure SYNTECH Incineration Gasification material t/year 30,000.00 30,000.00
Investment costs EUR 15,000.000 19,500.000
Electrical power MW 4.80 0.80
Thermal power MW 8.80 9.00
Electricity production MWh 38,400.00 6,400.00
Heat production MWh 1/2 year 35,200.00 36,000.00
Efficiency % acc. to input 47% 27%
Adsorbent consumption t/year 1,880.00
Ash t/year 6,360.00
Condensate water t/year 14,448.00
Selling of electricity 50 EUR/MWh €1,920,000 €320,000
Selling of heat energy 10 EUR/t €352,000 €360,000
Waste incomes 85 EUR/t €2,550,000 €2,550,000
TOTAL INCOME €4,822,000 €3,230,000
Table 1: Comparison of operational parameters between conventional incineration and
gasification
6 SYNTHETIC METHANOL PRODUCTION STUDY
Energy exploitation of syngas is economically the least attractive option, especially if biomass in the form of dry wood chips is used. The production of synthetic hydrogen or methane is more attractive, but even if alternative fuels such as biomass residues or wastes are used, the production cost is still higher than the price of fossil natural gas. With the production of synthetic methanol, the gasification of biomass residues and wastes becomes profitable without subsidy on the product side. Synthetic methanol also has an important advantage: it is in liquid form, so it is easy and safe to handle and store. With synthetic methanol production, the circulation of carbon materials is closed, as a wide range of different virgin hydrocarbons can be produced, as predicted by the methanol economy.
A pilot project study for synthetic methanol production in a small‐scale facility, [7], predicts an annual consumption of 140,000 t of alternative gasification material, of that 40,000 t of solid waste of various origin and 100,000 t of biomass restudies. The energy value of gasification
24 JET
Teos Perne, Marko Šetinc, Tine Seljak JET Vol. 13 (2020)Issue 3
14 Teos Perne, Marko Šetinc, Tine Seljak JET Vol. 13 (2020) Issue 3
‐‐‐‐‐‐‐‐‐‐
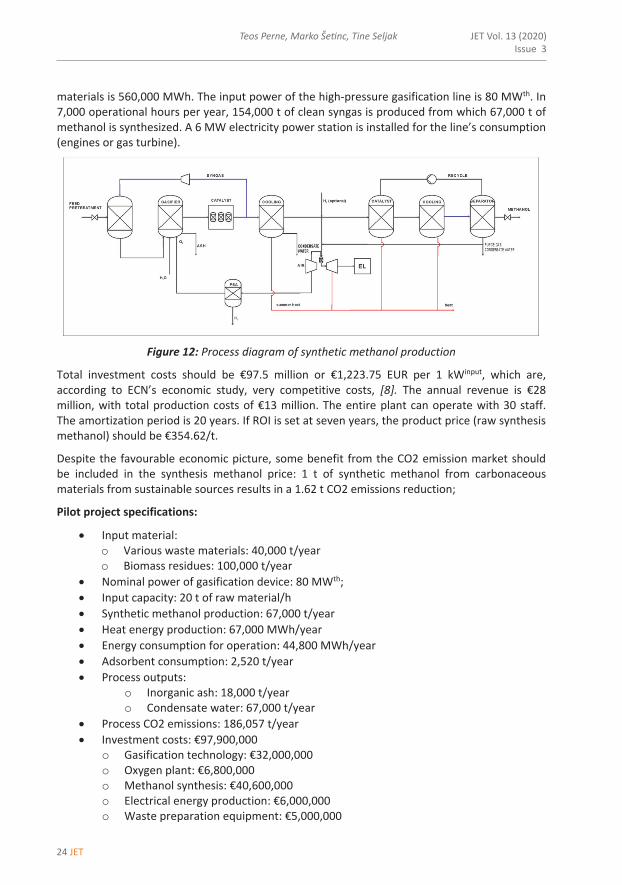
materials is 560,000 MWh. The input power of the high‐pressure gasification line is 80 MWth. In 7,000 operational hours per year, 154,000 t of clean syngas is produced from which 67,000 t of methanol is synthesized. A 6 MW electricity power station is installed for the line’s consumption (engines or gas turbine).
Figure 12: Process diagram of synthetic methanol production
Total investment costs should be €97.5 million or €1,223.75 EUR per 1 kWinput, which are, according to ECN’s economic study, very competitive costs, [8]. The annual revenue is €28 million, with total production costs of €13 million. The entire plant can operate with 30 staff. The amortization period is 20 years. If ROI is set at seven years, the product price (raw synthesis methanol) should be €354.62/t.
Despite the favourable economic picture, some benefit from the CO2 emission market should be included in the synthesis methanol price: 1 t of synthetic methanol from carbonaceous materials from sustainable sources results in a 1.62 t CO2 emissions reduction;
Pilot project specifications:
Input material: o Various waste materials: 40,000 t/year o Biomass residues: 100,000 t/year
Nominal power of gasification device: 80 MWth; Input capacity: 20 t of raw material/h Synthetic methanol production: 67,000 t/year Heat energy production: 67,000 MWh/year Energy consumption for operation: 44,800 MWh/year Adsorbent consumption: 2,520 t/year Process outputs:
o Inorganic ash: 18,000 t/year o Condensate water: 67,000 t/year
Process CO2 emissions: 186,057 t/year Investment costs: €97,900,000
o Gasification technology: €32,000,000 o Oxygen plant: €6,800,000 o Methanol synthesis: €40,600,000 o Electrical energy production: €6,000,000 o Waste preparation equipment: €5,000,000
JET 25
Innovative gasification technology for the circular economy
Innovative gasification technology for the circular economy ‐‐‐‐‐‐‐‐‐‐‐‐‐
15
o Location and buildings: €3,000,000 o Engineering and documentation: €4,500,000
Price for acquiring waste: €85.00/t Biomass price: €74.55/t Planned synthetic methanol price: €350/Sm3 Heat price: €10 /MWh Number of job positions: 30 Duration of the project: 20 years Average annual revenue: €27,000,000 Average annual expenses: €13,500,000 Amortization: €4,800,000
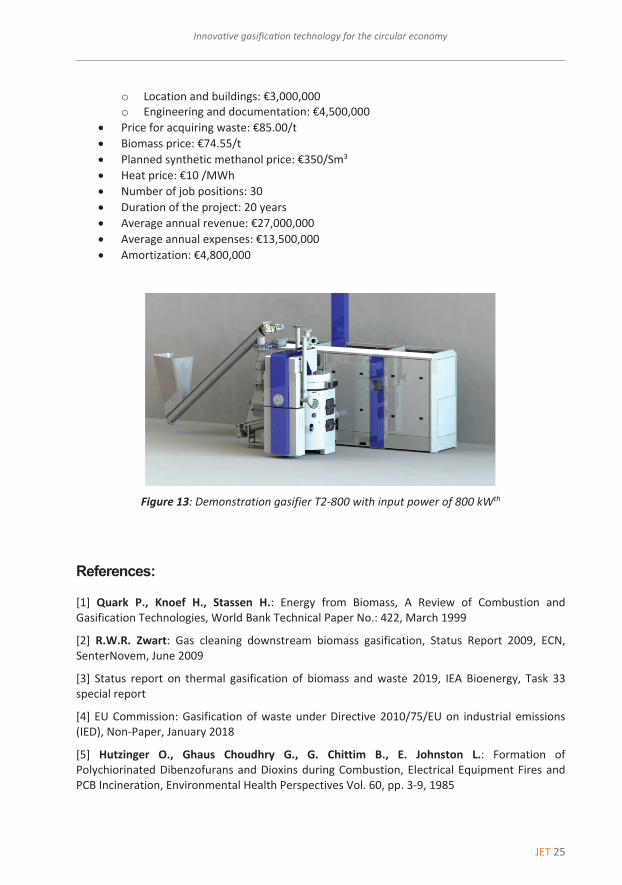
Figure 13: Demonstration gasifier T2‐800 with input power of 800 kWth
References:
[1] Quark P., Knoef H., Stassen H.: Energy from Biomass, A Review of Combustion and Gasification Technologies, World Bank Technical Paper No.: 422, March 1999
[2] R.W.R. Zwart: Gas cleaning downstream biomass gasification, Status Report 2009, ECN, SenterNovem, June 2009
[3] Status report on thermal gasification of biomass and waste 2019, IEA Bioenergy, Task 33 special report
[4] EU Commission: Gasification of waste under Directive 2010/75/EU on industrial emissions (IED), Non‐Paper, January 2018
[5] Hutzinger O., Ghaus Choudhry G., G. Chittim B., E. Johnston L.: Formation of Polychiorinated Dibenzofurans and Dioxins during Combustion, Electrical Equipment Fires and PCB Incineration, Environmental Health Perspectives Vol. 60, pp. 3‐9, 1985

26 JET
Teos Perne, Marko Šetinc, Tine Seljak JET Vol. 13 (2020)Issue 3
16 Teos Perne, Marko Šetinc, Tine Seljak JET Vol. 13 (2020) Issue 3
‐‐‐‐‐‐‐‐‐‐
[6] Zidanšek M., Rcero Celje s toplarno Celje – primer dobre prakse, Ureditev področja ravnanja z odpadki: od urgentne do sistemske ureditve, DS RS, Zbornik referatov in razprav št. 1/2019
[7] E. Lücking L., Methanol Production from Syngas, Technische Universitet Delft, december 2017
[8] Aranda G., van der Drift A., Smit R.: The Economy of Large‐Scale Biomass to Subtitute Natural Gas (bioSNG) plants, ECN, January 2014

JET 27
JET Volume 13 (2020) p.p. 27-41Issue 3, November 2020
Type of article 1.01www.fe.um.si/en/jet.html
DESIGN INFLUENCED BY THE EFFECT OF FILTER SELECTION ON THE APPRAISER
VARIATION OF THE MEASURING RESULTS OF A 3D OPTICAL MEASURING SYSTEM
ZASNOVA, KI VPLIVA NA IZBIRO FILTRA ZA OCENO MERILNIH REZULTATOV 3D
OPTIČNEGA MERILNEGA SISTEMAJosip Groš2, Tihomir MihalićR, Srđan Medić3, Nikola Šimunić4
Keywords: 3D optical measuring systems, Gaussian best fit, Chebyshev best-fit, Minimum circum-scribed element and Maximum inscribed element
AbstractDuring the previous decade, 3D optical measuring systems have had an increasing application re-garding quality control in different industrial branches where they are commonly used to monitor parts made from sheets, polymers, and castings. The biggest disadvantage of 3D measuring devices is the lack of ISO standards for the calibration of such devices, making it difficult to estimate the quality of the measuring results. The introductory part of the present paper elaborates the working principle of the 3D optical measuring system. In this paper, the free software package GOM inspect is used. When marking the geometric features of the measured metering object, GOM inspects dif-ferent filters for the selection of the aforementioned features. The experimental part of the paper elaborates the influence of usage of different filters (Gaussian best fit, Chebyshev best-fit, Mini-mum circumscribed element and Maximum inscribed element) on the measuring results. Refer-ence results are measurements performed on a device with a higher level of accuracy (coordinate measuring device). Afterwards, a comparison of the reference results and measures performed with 3D optical measuring systems using different filters was made.
1 Corresponding author: Tihomir Mihalić, PhD., University of Applied Sciences, Karlovac, Tel.: +385 98 686 072, Mailing ad-dress: I.Meštrovića 10, Karlovac, Croatia E-mail address: [email protected]
28 JET
JET Vol. 13 (2020)Issue 3
Josip Groš, Tihomir Mihalić, Srđan Medić, Nikola Šimunić
2 Josip Groš, Tihomir Mihalić, Srđan Medić, Nikola Šimunić JET Vol. 13 (2020) Issue 3
‐‐‐‐‐‐‐‐‐‐
Povzetek V zadnjem desetletju imajo 3D optični merilni sistemi vse večji pomen pri nadzoru kakovosti v različnih industrijskih panogah, kjer se pogosto uporabljajo za nadzor delov iz pločevine, polimerov in ulitkov. Največja pomanjkljivost 3D merilnih naprav je pomanjkanje ISO standardov za kalibracijo 3D optičnih merilnih naprav, kar otežuje oceno kakovosti merilnih rezultatov. V uvodnem delu prispevka je predstavljeno načelo dela 3D optičnega merilnega sistema. V tem prispevku je za analizo uporabljen brezplačni programski paket GOM inspect. Med označevanjem geometrijskih značilnosti merjenega merilnega predmeta GOM pregled ponuja različne filtre za izbiro zgoraj omenjenih lastnosti. Eksperimentalni del prispevka pojasnjuje vpliv uporabe različnih filtrov na rezultate meritev. Referenčni rezultati so meritve, opravljene na napravi z višjo stopnjo natančnosti (koordinatna merilna naprava). V članku je bila narejena tudi primerjava referenčnih rezultatov in meritev, izvedenih s 3D optičnimi merilnimi sistemi z uporabo različnih filtrov.
1 INTRODUCTION
The 3D optical measuring method is a non‐contact metering method. Its field of application is very wide and includes everything from quality control to archaeology, the auto industry, aeronautics, and even medicine.
Metering systems that use optical measuring methods to display an object are called “3D optical measuring systems”. Originally, they were used only for reverse engineering, but nowadays they are widely used in measuring and product quality control.
In production engineering, there is a growing need for fast and precise measuring of geometric characteristics, resulting from increasing demands for quality, thanks to the ever‐growing competition and production automatization.
The development of new products increased their complexity regarding their geometric characteristics. They are becoming increasingly elaborate in order to decrease the total number of parts in production while requirements for their functionality simultaneously increase. Previous production methods were relatively restrictive regarding the complexity of the design resulting in the simplicity of lines and shapes of the final product. Such products had relatively simple demands regarding quality control.
However, nowadays, in addition to the precision of manufacturing, great attention is given to the speed of product development, resulting in an increasing need for new approaches regarding measuring and controlling the geometry of the shape. That is why quality control is now present as early as manufacturing certain parts of the final product or immediately after that, opposed to previous quality control of the finished product at the end of the production process.
Due to the constant progress of the industry, the production boundaries change more rapidly, as more elaborate and complex items are being made, resulting in increasing demands
JET 29
Design influenced by the effect of filter selection on the appraiser variation of the measuring results of a 3D optical measuring system
Design influenced by the effect of filter selection on the appraiser variation of the measuring results of a 3D optical measuring system 3
‐‐‐‐‐‐‐‐‐‐
regarding the accuracy of production as well as allowed tolerances. Therefore, the measuring devices need to adopt imposing trends regarding high speed and accuracy of measurement.
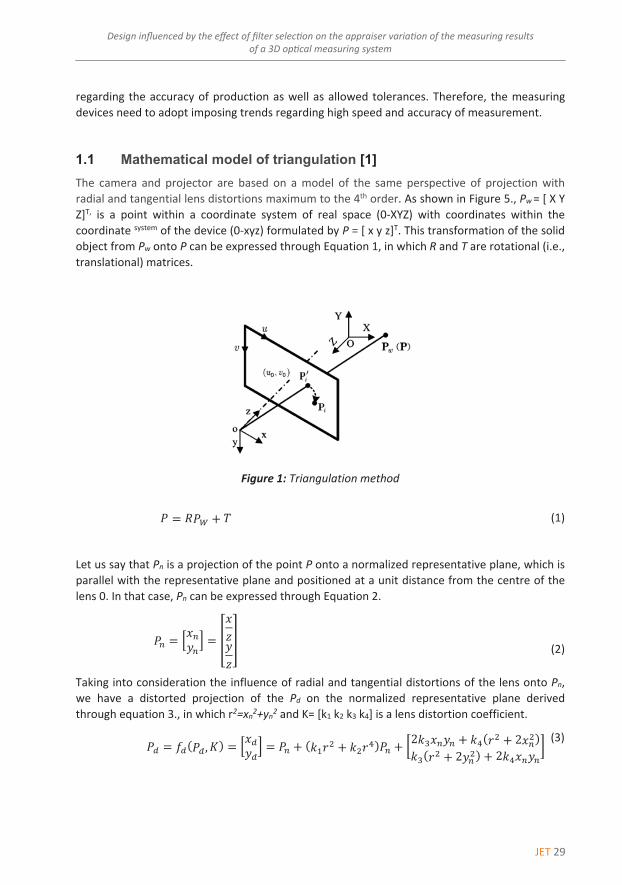
1.1 Mathematical model of triangulation [1] The camera and projector are based on a model of the same perspective of projection with radial and tangential lens distortions maximum to the 4th order. As shown in Figure 5., Pw = [ X Y Z]T, is a point within a coordinate system of real space (0‐XYZ) with coordinates within the coordinate system of the device (0‐xyz) formulated by P = [ x y z]T. This transformation of the solid object from Pw onto P can be expressed through Equation 1, in which R and T are rotational (i.e., translational) matrices.
Figure 1: Triangulation method
𝑃𝑃 � 𝑅𝑅𝑃𝑃� � 𝑇𝑇 (1)
Let us say that Pn is a projection of the point P onto a normalized representative plane, which is parallel with the representative plane and positioned at a unit distance from the centre of the lens 0. In that case, Pn can be expressed through Equation 2.
𝑃𝑃� � �𝑥𝑥�𝑦𝑦�� � �𝑥𝑥𝑧𝑧𝑦𝑦𝑧𝑧�
(2)
Taking into consideration the influence of radial and tangential distortions of the lens onto Pn, we have a distorted projection of the Pd on the normalized representative plane derived through equation 3., in which r2=xn2+yn2 and K= [k1 k2 k3 k4] is a lens distortion coefficient.
𝑃𝑃� � ���𝑃𝑃�, 𝐾𝐾� � �𝑥𝑥�𝑦𝑦�� � 𝑃𝑃� � �𝑘𝑘�𝑟𝑟� � 𝑘𝑘�𝑟𝑟��𝑃𝑃� � �2𝑘𝑘�𝑥𝑥�𝑦𝑦� � 𝑘𝑘��𝑟𝑟� � 2𝑥𝑥���𝑘𝑘��𝑟𝑟� � 2𝑦𝑦��� � 2𝑘𝑘�𝑥𝑥�𝑦𝑦�
� (3)

30 JET
JET Vol. 13 (2020)Issue 3
Josip Groš, Tihomir Mihalić, Srđan Medić, Nikola Šimunić
4 Josip Groš, Tihomir Mihalić, Srđan Medić, Nikola Šimunić JET Vol. 13 (2020) Issue 3
‐‐‐‐‐‐‐‐‐‐
The last two elements of Equation 3 represent the radial and tangential distortions of the lens. In that case, the projection on the representative plane Pi can be expressed as shown in Equation 4, in which fu and fv represent the horizontal and vertical focal lengths, while u0 and v0 present the coordinates of the principal point.
𝑃𝑃� � �𝑢𝑢𝑣𝑣� � �𝑓𝑓�𝑥𝑥� � 𝑢𝑢�𝑓𝑓�𝑦𝑦� � 𝑣𝑣��
(4)
In summary, the camera and the projector model can be described according to Equation 5., in which function g describes the imaging from the actual coordinate system onto a representative plane, while Θ = [ R T fv fh u0 v0 K] represents the model parameter.
𝑃𝑃� � 𝑔𝑔�𝑃𝑃�, Θ � (5)
2 FILTERS FOR THE SELECTION OF THE CONTROL ELEMENTS
Depending on the desired object of construction, four methods can be used. Each of them has its advantages and disadvantages, and each is used depending on the object of the measurement. The Gauss filter uses normal distribution and eliminates the furthest points during the calculation. The number of points used for the calculation can be determined by changing the sigma value. The Chebyshev filter is used for GD&T (tolerance of the position and shape). The norm prescribes that the element must be defined through that method in case of verifying tolerance of the position and the shape of the element.
It might be easiest to explain the usage of the remaining two filters through their practical application. The maximum inscribed element filter should be used in cases of, for example, defining the maximum axle diameter, while the minimum circumscribed element filter would be used for defining the minimum diameter of the hole.
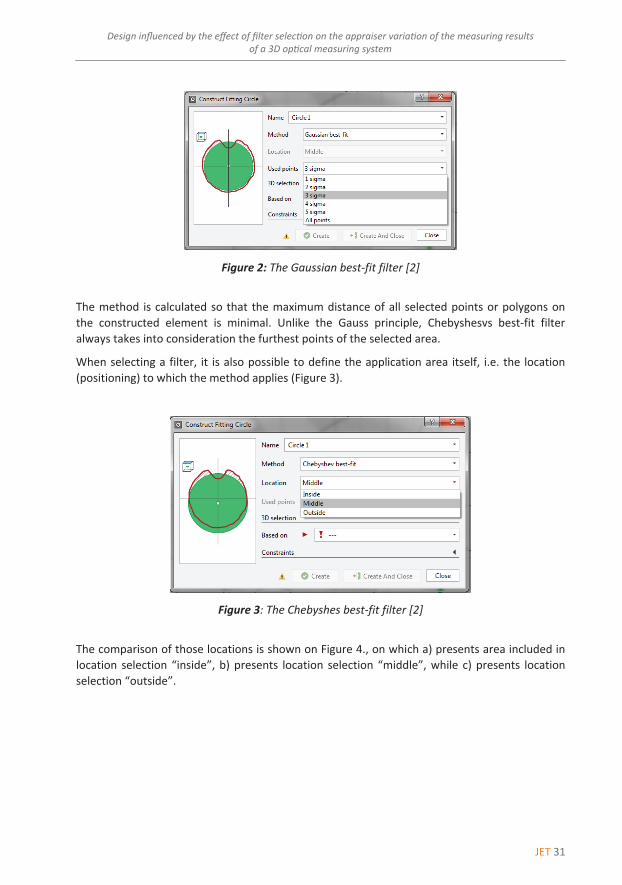
2.1 The Gaussian best-fit filter The filter is based on the calculation in which the total square deviations from the given points are smallest. Figure 2. shows the possibility of selecting the so‐called “Used Points”. That function is active only in the limits of this method. Using statistical methods, it is possible to eliminate points that are located outside the model but are included in the selected area.
JET 31
Design influenced by the effect of filter selection on the appraiser variation of the measuring results of a 3D optical measuring system
Design influenced by the effect of filter selection on the appraiser variation of the measuring results of a 3D optical measuring system 5
‐‐‐‐‐‐‐‐‐‐
Figure 2: The Gaussian best‐fit filter [2]
The method is calculated so that the maximum distance of all selected points or polygons on the constructed element is minimal. Unlike the Gauss principle, Chebyshesvs best‐fit filter always takes into consideration the furthest points of the selected area.
When selecting a filter, it is also possible to define the application area itself, i.e. the location (positioning) to which the method applies (Figure 3).
Figure 3: The Chebyshes best‐fit filter [2]
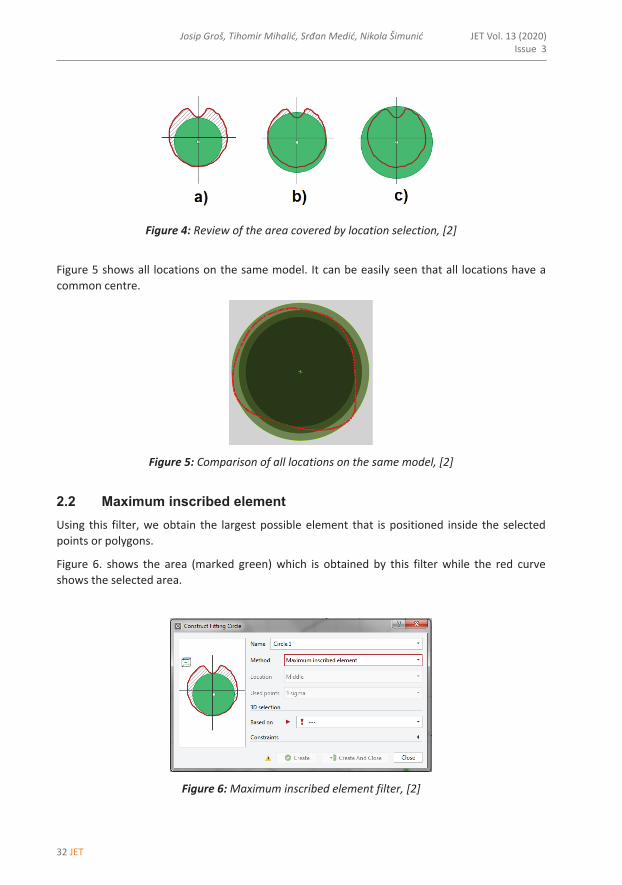
The comparison of those locations is shown on Figure 4., on which a) presents area included in location selection “inside”, b) presents location selection “middle”, while c) presents location selection “outside”.
32 JET
JET Vol. 13 (2020)Issue 3
Josip Groš, Tihomir Mihalić, Srđan Medić, Nikola Šimunić
6 Josip Groš, Tihomir Mihalić, Srđan Medić, Nikola Šimunić JET Vol. 13 (2020) Issue 3
‐‐‐‐‐‐‐‐‐‐
Figure 4: Review of the area covered by location selection, [2]
Figure 5 shows all locations on the same model. It can be easily seen that all locations have a common centre.
Figure 5: Comparison of all locations on the same model, [2] 2.2 Maximum inscribed element Using this filter, we obtain the largest possible element that is positioned inside the selected points or polygons.
Figure 6. shows the area (marked green) which is obtained by this filter while the red curve shows the selected area.
Figure 6: Maximum inscribed element filter, [2]

JET 33
Design influenced by the effect of filter selection on the appraiser variation of the measuring results of a 3D optical measuring system
Design influenced by the effect of filter selection on the appraiser variation of the measuring results of a 3D optical measuring system 7
‐‐‐‐‐‐‐‐‐‐
2.3 Minimum circumscribed element Using this filter, we obtain the smallest possible element that includes selected points or polygons.
Figure 7. shows the area which is obtained by this filter (marked green) in relation to selected points (red curve).
Figure 7: Minimum circumscribed element filter [2]
3 EXPERIMENTAL PART OF THE MEASUREMENT OF THE HOLE ON THE FLANGE
In the experimental part of the paper regarding reproducibility of the measuring results obtained by a 3D optical measuring devices, the measuring system provided by the company Steinbichler COMET 1.4, which includes an automated turntable, is used.
The measuring device uses a structured light by which it decreases the influence of the external light on the measuring result, [3][4]. The flange was measured with the use of an automated turntable and without referent points. 3D optical measuring systems have certain limitations regarding the measurement of the geometric and dimensional features of reflective and transparent surfaces, [5][6][7]. Due to the reflective surfaces, white powder spray was used during the measurement process. Not using such a spray causes mistakes in the measurement process [2].
34 JET
JET Vol. 13 (2020)Issue 3
Josip Groš, Tihomir Mihalić, Srđan Medić, Nikola Šimunić
8 Josip Groš, Tihomir Mihalić, Srđan Medić, Nikola Šimunić JET Vol. 13 (2020) Issue 3
‐‐‐‐‐‐‐‐‐‐
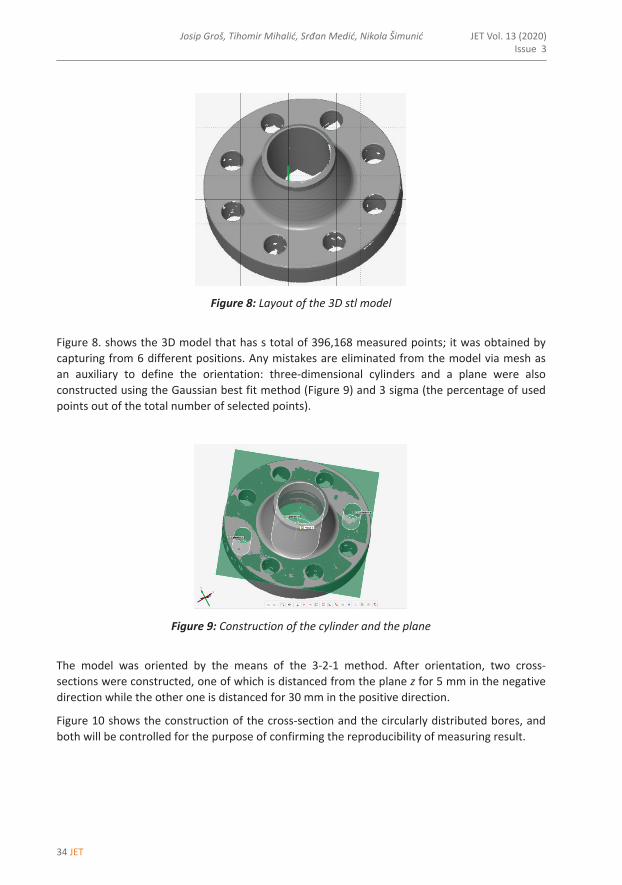
Figure 8: Layout of the 3D stl model
Figure 8. shows the 3D model that has s total of 396,168 measured points; it was obtained by capturing from 6 different positions. Any mistakes are eliminated from the model via mesh as an auxiliary to define the orientation: three‐dimensional cylinders and a plane were also constructed using the Gaussian best fit method (Figure 9) and 3 sigma (the percentage of used points out of the total number of selected points).
Figure 9: Construction of the cylinder and the plane
The model was oriented by the means of the 3‐2‐1 method. After orientation, two cross‐sections were constructed, one of which is distanced from the plane z for 5 mm in the negative direction while the other one is distanced for 30 mm in the positive direction.
Figure 10 shows the construction of the cross‐section and the circularly distributed bores, and both will be controlled for the purpose of confirming the reproducibility of measuring result.

JET 35
Design influenced by the effect of filter selection on the appraiser variation of the measuring results of a 3D optical measuring system
Design influenced by the effect of filter selection on the appraiser variation of the measuring results of a 3D optical measuring system 9
‐‐‐‐‐‐‐‐‐‐
Figure 10: Construction of the cross‐section
The next step is the construction of the circulars, followed by the measurement of the same. Using the model, a total of 11 measurements was made, and all filters have been used. All 11 diameters were measured, and a standard deviation was calculated as described in the following chapter.
3.1. Calculation of the standard deviation Standard deviation presents the numerical evaluation of the accuracy of the measuring procedure. When it is smaller, the precision of the measurement is greater. Precision or imprecision is not the same as “inaccuracy”, which shows the correlation between the result of the measurement and the true value of the measuring size, [8].
With the help of the standard deviation, it is simple to apply a 3 s test, which is used on a set of data that behaves according to normal distribution. It is a statistical test on which we base the criteria for determining a gross error. A gross error of a measurer arises from different reasons, such as measurer negligence, application of inadequate measuring equipment or inadequate measuring instrument, reading the results on the wrong scale or reading the wrong value, omitting the digit when reading the scale, etc., [9].
Equation 7 was used to calculate the standard deviation follows:
𝑠𝑠 � �∑ ��������������
(6)
𝑥𝑥 � �������� � ∑ ����
� (7)
𝑥𝑥�...measuring results
𝑥𝑥...arithmetic average of measuring results
s... approximate standard deviation

36 JET
JET Vol. 13 (2020)Issue 3
Josip Groš, Tihomir Mihalić, Srđan Medić, Nikola Šimunić
10 Josip Groš, Tihomir Mihalić, Srđan Medić, Nikola Šimunić JET Vol. 13 (2020) Issue 3
‐‐‐‐‐‐‐‐‐‐
3.2. Results of measuring the 11 holes The results of measuring the 11 holes in 6 different positions can be seen in Table 1. With different filters, the measuring results of the hole vary significantly. The results of the measuring are compared to the results of the measuring obtained by a coordinate measuring device (marked as reference measures in Table 1).
Table 1: Results of measuring the 11 holes in 6 different positions
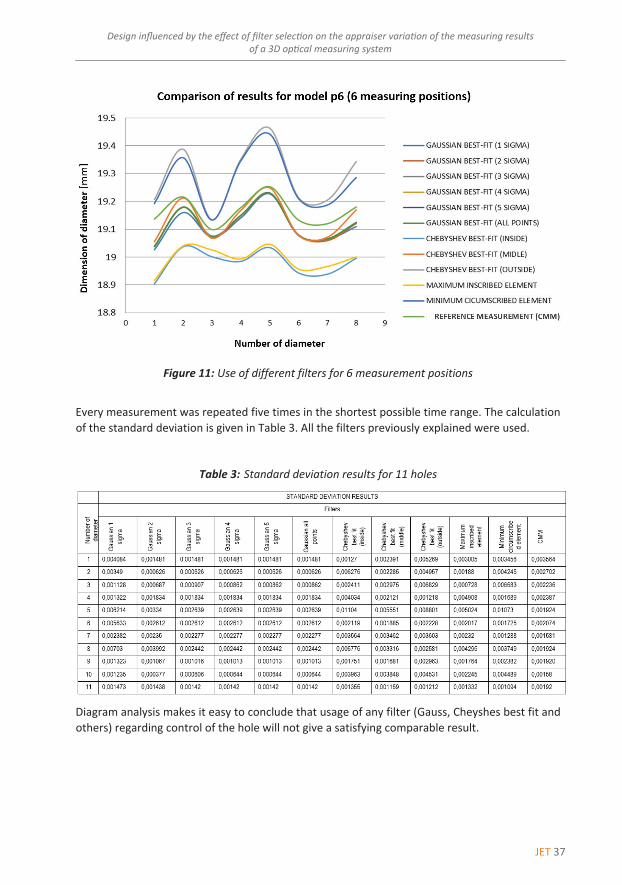
Figure 11 shows the usage of the filters on 11 holes. Each method is marked with a colour, and the diagram shows not only methods but also the curve of the referent measurement. The curves are distributed into three groups, which can provide insight to which of the methods used are more similar, resulting in similar final results, i.e., which methods calculate the data similarly.
Two curves that stand out with the highest values are the one obtained by using a Chebyshe’s best‐fit (outside) and Minimum circumscribed element methods. Two curves that have the lowest values are obtained by using a Chebyshe’s best‐fit (inside) and Maximum inscribed element methods.
At the middle of the diagram, we observe the curves which refer to that Gaussian method and its combinations as well as the curves obtained by Chebyshe’s best‐fit (middle) method and the curve of referent measurement.
If we examine that set of curves, it is seen that the curves obtained with the Gaussian method almost all overlap, while those obtained with 1 sigma and 2 sigma stand out from the set and the ones obtained by 3 and more sigma, including the one that contains all selected points, also overlap. The reason for such a result is that starting from 3 sigma the method uses a 99.7% of the total number of the selected points.
Chebyshe’s best‐fit (middle) curve, and, consequently, the results used to create the curve are the middle value of the Chebyshes best‐fit (inside) and Chebyshes best‐fit (outside) method. The results obtained by this method, and consequently the layout of the curve, show that in several places they overlap with the results obtained with the referent measurement while sometimes they overlap with the results obtained with Gaussian best‐fit methods.
JET 37
Design influenced by the effect of filter selection on the appraiser variation of the measuring results of a 3D optical measuring system
Design influenced by the effect of filter selection on the appraiser variation of the measuring results of a 3D optical measuring system 11
‐‐‐‐‐‐‐‐‐‐
Figure 11: Use of different filters for 6 measurement positions
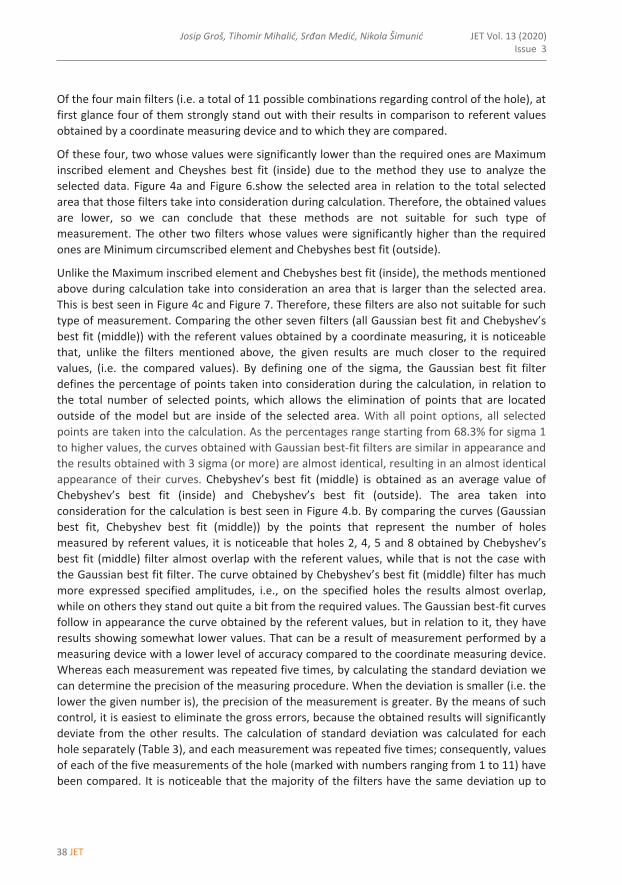
Every measurement was repeated five times in the shortest possible time range. The calculation of the standard deviation is given in Table 3. All the filters previously explained were used.
Table 3: Standard deviation results for 11 holes
Diagram analysis makes it easy to conclude that usage of any filter (Gauss, Cheyshes best fit and others) regarding control of the hole will not give a satisfying comparable result.
38 JET
JET Vol. 13 (2020)Issue 3
Josip Groš, Tihomir Mihalić, Srđan Medić, Nikola Šimunić
12 Josip Groš, Tihomir Mihalić, Srđan Medić, Nikola Šimunić JET Vol. 13 (2020) Issue 3
‐‐‐‐‐‐‐‐‐‐
Of the four main filters (i.e. a total of 11 possible combinations regarding control of the hole), at first glance four of them strongly stand out with their results in comparison to referent values obtained by a coordinate measuring device and to which they are compared.
Of these four, two whose values were significantly lower than the required ones are Maximum inscribed element and Cheyshes best fit (inside) due to the method they use to analyze the selected data. Figure 4a and Figure 6.show the selected area in relation to the total selected area that those filters take into consideration during calculation. Therefore, the obtained values are lower, so we can conclude that these methods are not suitable for such type of measurement. The other two filters whose values were significantly higher than the required ones are Minimum circumscribed element and Chebyshes best fit (outside).
Unlike the Maximum inscribed element and Chebyshes best fit (inside), the methods mentioned above during calculation take into consideration an area that is larger than the selected area. This is best seen in Figure 4c and Figure 7. Therefore, these filters are also not suitable for such type of measurement. Comparing the other seven filters (all Gaussian best fit and Chebyshev’s best fit (middle)) with the referent values obtained by a coordinate measuring, it is noticeable that, unlike the filters mentioned above, the given results are much closer to the required values, (i.e. the compared values). By defining one of the sigma, the Gaussian best fit filter defines the percentage of points taken into consideration during the calculation, in relation to the total number of selected points, which allows the elimination of points that are located outside of the model but are inside of the selected area. With all point options, all selected points are taken into the calculation. As the percentages range starting from 68.3% for sigma 1 to higher values, the curves obtained with Gaussian best‐fit filters are similar in appearance and the results obtained with 3 sigma (or more) are almost identical, resulting in an almost identical appearance of their curves. Chebyshev’s best fit (middle) is obtained as an average value of Chebyshev’s best fit (inside) and Chebyshev’s best fit (outside). The area taken into consideration for the calculation is best seen in Figure 4.b. By comparing the curves (Gaussian best fit, Chebyshev best fit (middle)) by the points that represent the number of holes measured by referent values, it is noticeable that holes 2, 4, 5 and 8 obtained by Chebyshev’s best fit (middle) filter almost overlap with the referent values, while that is not the case with the Gaussian best fit filter. The curve obtained by Chebyshev’s best fit (middle) filter has much more expressed specified amplitudes, i.e., on the specified holes the results almost overlap, while on others they stand out quite a bit from the required values. The Gaussian best‐fit curves follow in appearance the curve obtained by the referent values, but in relation to it, they have results showing somewhat lower values. That can be a result of measurement performed by a measuring device with a lower level of accuracy compared to the coordinate measuring device. Whereas each measurement was repeated five times, by calculating the standard deviation we can determine the precision of the measuring procedure. When the deviation is smaller (i.e. the lower the given number is), the precision of the measurement is greater. By the means of such control, it is easiest to eliminate the gross errors, because the obtained results will significantly deviate from the other results. The calculation of standard deviation was calculated for each hole separately (Table 3), and each measurement was repeated five times; consequently, values of each of the five measurements of the hole (marked with numbers ranging from 1 to 11) have been compared. It is noticeable that the majority of the filters have the same deviation up to
JET 39
Design influenced by the effect of filter selection on the appraiser variation of the measuring results of a 3D optical measuring system
Design influenced by the effect of filter selection on the appraiser variation of the measuring results of a 3D optical measuring system 13
‐‐‐‐‐‐‐‐‐‐
the third decimal place, compared to calculated standard deviation of the results obtained with a coordinate measuring device.
4 SUMMARY
From day to day, technology is progressing more and more, new possibilities of production of more complicated and more complex products with high demands regarding quality, functionality and mere aesthetics are being offered. 3D optical measuring systems are increasingly being implemented in manufacturing processes even though they lack ISO calibration standards. Currently, there are VDI / VDE 2634 recommendations, but a relationship with the national metering standard has not established.
The purpose of this paper is to stimulate thinking regarding the necessity of setting standards for calibration of 3D optical metering systems, not only in the scientific community but also regarding all those who use 3D optical measuring systems.
This paper showed a great lack of uniformity regarding the results since the measurement results can easily be changed using a filter, which produces a non‐uniform result.
For a long time, authors have used 3D optical measuring systems for measuring machine parts for the purpose of quality control. The stl files obtained after measuring show great disadvantages regarding their usage, for instance, the original measuring result can be easily changed and refined (mesh: smooth, thin, refine and repair).
Improvements are possible in the development of a new stl file that could not be changed (i.e., measuring stl file). With each result using a particular filter, a note should be added to allow the ordering client to be sure which filter was used. That would ensure a more credible measuring report.
This is one of the presuppositions for the development of ISO norms for the calibration of the 3D optical measuring systems. According to the research, the class of accuracy of the 3d optical measurement systems is 0.1 mm.
References
[1] Croatian Standards Institute: HRN EN ISO/IEC 17025:2007
[2] Zeiss group: User manual GOM Inspect Direct Help, V7 SR2
[3] C. Bernal, B. de Agustina, M.M. Marín, A.M. Camacho: Performance evaluation of optical scanner based on blue LED Structured light, Procedia Engineering, Vol. 63, 591–598, 2013
[4] K. Xue, V. Kurella, A. Spence: Multi‐sensor blue LED and touch probe inspection system, Computer‐Aided Design and Applications, 2016,

40 JET
JET Vol. 13 (2020)Issue 3
Josip Groš, Tihomir Mihalić, Srđan Medić, Nikola Šimunić
14 Josip Groš, Tihomir Mihalić, Srđan Medić, Nikola Šimunić JET Vol. 13 (2020) Issue 3
‐‐‐‐‐‐‐‐‐‐
[5] M.A.B. Ebrahim: 3D Laser Scanners’ Techniques Overview, International Journal of Science and Research, Volume 4, Issue 10, 2015
[6] S. Gerbino, D.M.D. Giudice, G. Staiano, A. Lanzotti, M. Martorelli: On the influence of scanning factors on the laser scanner‐based 3D inspection process, Int J Adv Manuf Technol ,2016, 84, 1787
[7] B. Boeckmans, M. Zhang, F. Welkenhuyzen, J. P. Kruth: Determination of Aspect Ratio Limitations, Accuracy and Repeatability of a Laser Line Scanning CMM Probe, International Journal of Automation and Control Technology Vol.9 No.5, 2015
[8] http://racunala.ttf.unizg.hr/files/Statistika.pdf
[9] B. Runje: Predavanja iz kolegija teorija i tehnika mjerenja, FSB Zagreb, 2014

JET 41
JET Volume 13 (2020) p.p. 43-56Issue 3, November 2020
Type of article 1.01www.fe.um.si/en/jet.html
FUZZY MODEL FOR ESTIMATING THE RISK OF INFECTION BY COVID-19
MEHKI MODEL NAPOVEDI OGROŽENOSTI Z BOLEZNIJO COVID-19
Janez UsenikR
Keywords: Covid-19, fuzzy variable, fuzzy inference, risk of infections
Abstract
The present paper presents a fuzzy model for predicting the risk of a community (country) to being infected by the coronavirus Covid-19. The research is not the medical field, where favourable news about vaccines against this disease is just emerging from the research community. Instead, it presents a relatively simple mathematical model based on the use of fuzzy logic. The model is created as a fuzzy system, in which the basic postulates of fuzzy logic and fuzzy inference are used. The presented model is, of course, only one possibility for describing and predicting the threat to the population due to the Covid-19 disease.
PovzetekV članku je predstavljen mehki model napovedi ogroženosti prebivalcev neke skupnosti (države) z boleznijo Covid-19. Raziskava se ne spušča na medicinski področje, kjer se v svetovni raziskovalni skupnosti ravnokar pojavljajo ugodne vesti o cepivu proti tej bolezni. Raziskava predstavlja relativno preprost matematični model, ki temelji na uporabi mehke logike. Model je kreiran kot mehki sistem, kjer uporabljamo osnovne postulate mehkega sklepanja. Predstavljeni model je seveda le ena od mo-žnosti opisovanja in predvidevanja ogroženosti prebivalcev zaradi bolezni Covid-19.
R Corresponding author: Prof. Janez Usenik, PhD, University of Maribor, Faculty of Energy Technology, Hočevarjev trg 1, SI 8270 Krško, tel. +386 40 647 689. E-mail address: [email protected]

42 JET
JET Vol. 13 (2020)Issue 3
Janez Usenik2 Janez Usenik JET Vol. 13 (2020) Issue 3
‐‐‐‐‐‐‐‐‐‐
1 INTRODUCTION
The end of the first and the beginning of the second quarter of 2020 was marked by a global outbreak of the Covid‐19 disease, which results from infection with a new and hitherto unknown virus. The threat of infection and death was declared worldwide, and the World Health Organization (WHO) declared a pandemic in the first half of March 2020. Individual countries took the same or at least similar rigorous measures to curb the epidemic, because the situation was serious. As of June 8, 2020, WHO data were as follows, [5]: 6,881,352 infected, 399,895 dead in 216 countries. All affected countries have taken (more or less) drastic measures to curb the pandemic. Countries reacted differently to the pandemic, from extremely strict measures (e.g., Italy, Spain, also Slovenia) to extremely lenient ones (e.g., Sweden, Belarus). The results were different, but no variant was explicitly confirmed to be correct and thus successful. Health services cannot confirm or deny any possibility.
A huge number of tests have been performed worldwide; as a rule, these tests are not completely credible, but they are certainly a significant indicator of the spread of the virus.
After the end of the epidemic, countries greatly relaxed their measures, social life and the economy were revived, and restrictions on tourism were greatly relaxed. Slovenia was quite successful in this first wave, declaring the coronavirus epidemic over, as of June 1 2020, thus relieving a series of preventive measures taken at the beginning of the outbreak. Many other countries have done the same. The main reason for this was, of course, of an economic nature, as during the quarantine period prescribed by the states to contain the disease, many economic activities around the world declined markedly, or ceased entirely. The global pandemic was thus (at least theoretically) over, the economic recovery was beginning, which is a condition sine qua non mainly for the functioning of the labour market, which has experienced a marked decline in all countries.
In Slovenia, a national survey, [4], was conducted in the first wave, which was supposed to answer the question about the infection of the population with coronavirus. The projected random sample of 3,000 respondents is certainly large, significant, and robust. Unfortunately, these characteristics were lost due to the unresponsiveness of the respondents, as the response was less than half. Thus, the results of the research are questionable, [8]. These possibly correct results show that the population of Slovenia is slightly infected, which is not exactly an encouraging result.
States have revoked strict measures at the time of the worst outbreak. In the summer months, tourism also revived to a large extent, having experienced the worst shock of all economic activities. Unfortunately, the abolition of the strict measures turned out to be premature, as too much relaxation led to a second wave of infections, which was significantly more severe than the first. Thus, on February 19 2020, the following data can be found, [6]: 55,927,327 confirmed cases and 1,344,003 dead. In less than 24 weeks, the number of infections increased by more than eight times (813%), and the increase in the number of deaths was fortunately much smaller (336%). The number of deaths is less rapid than the number of infected, which is probably due to better knowledge of the disease in hospitals and thus more effective treatment. The World Health Organization conducts a comprehensive overview of the spread of the disease to all its members. On the same website, [6], we also find data for Europe on 19.11.2020: 15,999,670 confirmed cases and 459,195 deaths.
Up‐to‐date data for Slovenia are available on the website of the government, [4].

JET 43
Fuzzy model for estimating the risk of infection by Covid-19 Fuzzy model for estimate the risk of infection by Covid‐19 3
‐‐‐‐‐‐‐‐‐‐
The purpose of our research, the result of which is a fuzzy model for assessing the risk of Covid‐19 disease, is to sketch a fuzzy system with which, based on fuzzy reasoning, we can roughly predict the risk of coronavirus infection in the population of each country or the threat in general.
The results are interesting, but not necessarily correct, as any disease cannot be predicted with certainty.
2 FUZZY SYSTEM
The virus’s behaviour has not yet been fully elucidated, in medicine or in other sciences. In the final phase of testing, several different vaccines would successfully curb COVID‐19 and thus end the global socially unnatural behaviour humanity has been forced to undergo. However, this current failure gives various mathematical models that attempt to explain the dynamic behaviour of the virus, the status of vagueness, and roughly speaking, perhaps even speculation. Several mathematical models have emerged on the virus’s prevalence and behaviour and the (un)successful handling of the virus, but so far no prediction has been sufficiently stable/robust and thus entirely credible. Several studies and articles have appeared online (e.g. [2], [7], [9]) that attempt to explain and predict the course and threat of population infection with coronavirus using classical mathematical methods, such as statistics, probability calculus, and differential equations. All these models, which are dynamic, are only more or less successful guesses about the disease, and the results are more or less successful approximations of actual events.
In contrast to these principles of straightforward approaches, we have developed a fuzzy mathematical model based on a relatively simple and sensible perception of the aggressiveness of the virus and thus the threat to the inhabitants of an individual community (country). This model (or its results) is only a guess at the actual situation and threat of the coronavirus. The preference for a model is (at least) not possible so far, but above all, it is not sensible and thus rational. For this reason, we can not claim that the model presented below is worse or better than other assumptions.
The fuzzy model is presented in the form of a fuzzy system. In this manner, we proceeded from some rudimentary and meaningful assumptions. The basic idea of the model is that we cannot predict the level of infection or even mortality (this is the work of medical science), but we can (more or less successfully) predict the level of risk of infection of the population in a community (country).
If we want to create a fuzzy system, we need to know the rules and operation of fuzzy logic. We will not list these basics in this article, but we can refer readers to sources [10]–[14], where the idea of fuzzy logic, fuzzy reasoning, and the creation of a fuzzy system with all theoretical postulates and applied approach is described in detail.
The construction of a fuzzy system generally takes several steps: the selection of decision variables and their fuzzification, establishing the goal and construction of algorithm (base of rules of fuzzy reasoning), inference and defuzzification of results of fuzzy inference. A presentation of a fuzzy system is given in Figure 1.
44 JET
JET Vol. 13 (2020)Issue 3
Janez Usenik4 Janez Usenik JET Vol. 13 (2020) Issue 3
‐‐‐‐‐‐‐‐‐‐
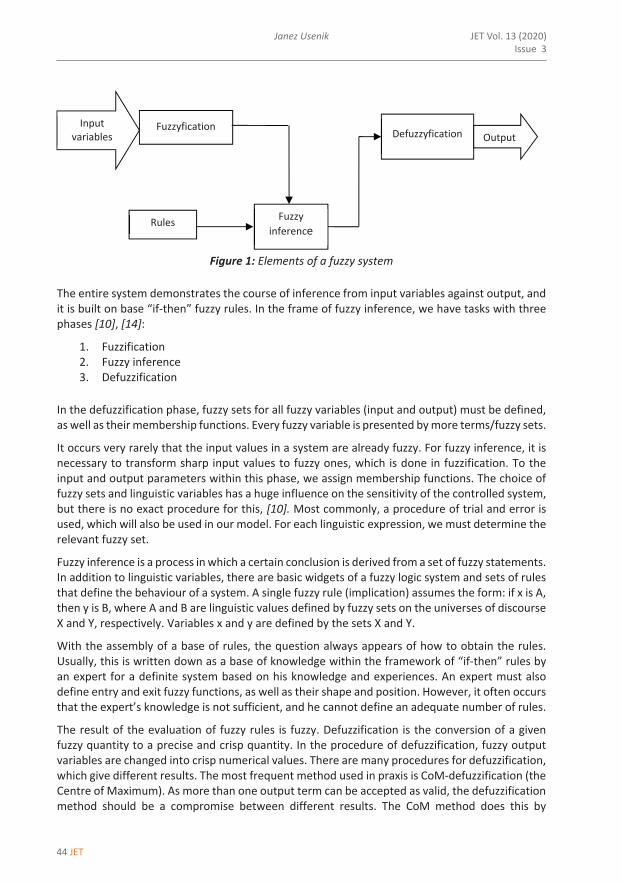
Figure 1: Elements of a fuzzy system The entire system demonstrates the course of inference from input variables against output, and it is built on base “if‐then” fuzzy rules. In the frame of fuzzy inference, we have tasks with three phases [10], [14]:
1. Fuzzification 2. Fuzzy inference 3. Defuzzification
In the defuzzification phase, fuzzy sets for all fuzzy variables (input and output) must be defined, as well as their membership functions. Every fuzzy variable is presented by more terms/fuzzy sets.
It occurs very rarely that the input values in a system are already fuzzy. For fuzzy inference, it is necessary to transform sharp input values to fuzzy ones, which is done in fuzzification. To the input and output parameters within this phase, we assign membership functions. The choice of fuzzy sets and linguistic variables has a huge influence on the sensitivity of the controlled system, but there is no exact procedure for this, [10]. Most commonly, a procedure of trial and error is used, which will also be used in our model. For each linguistic expression, we must determine the relevant fuzzy set.
Fuzzy inference is a process in which a certain conclusion is derived from a set of fuzzy statements. In addition to linguistic variables, there are basic widgets of a fuzzy logic system and sets of rules that define the behaviour of a system. A single fuzzy rule (implication) assumes the form: if x is A, then y is B, where A and B are linguistic values defined by fuzzy sets on the universes of discourse X and Y, respectively. Variables x and y are defined by the sets X and Y.
With the assembly of a base of rules, the question always appears of how to obtain the rules. Usually, this is written down as a base of knowledge within the framework of “if‐then” rules by an expert for a definite system based on his knowledge and experiences. An expert must also define entry and exit fuzzy functions, as well as their shape and position. However, it often occurs that the expert’s knowledge is not sufficient, and he cannot define an adequate number of rules.
The result of the evaluation of fuzzy rules is fuzzy. Defuzzification is the conversion of a given fuzzy quantity to a precise and crisp quantity. In the procedure of defuzzification, fuzzy output variables are changed into crisp numerical values. There are many procedures for defuzzification, which give different results. The most frequent method used in praxis is CoM‐defuzzification (the Centre of Maximum). As more than one output term can be accepted as valid, the defuzzification method should be a compromise between different results. The CoM method does this by
Input variables
Fuzzyfication
Fuzzy inference
Defuzzyfication Output
Rules
JET 45
Fuzzy model for estimating the risk of infection by Covid-19 Fuzzy model for estimate the risk of infection by Covid‐19 5
‐‐‐‐‐‐‐‐‐‐
computing the crisp output as a weighted average of the term membership maxima, weighted by the inference results, [10]. In our example, our model is created using FuzzyTech 5.55i software, and we use the Centre of Maximum (CoM) defuzzification method.
2.1 Creating a COVID-19 fuzzy model
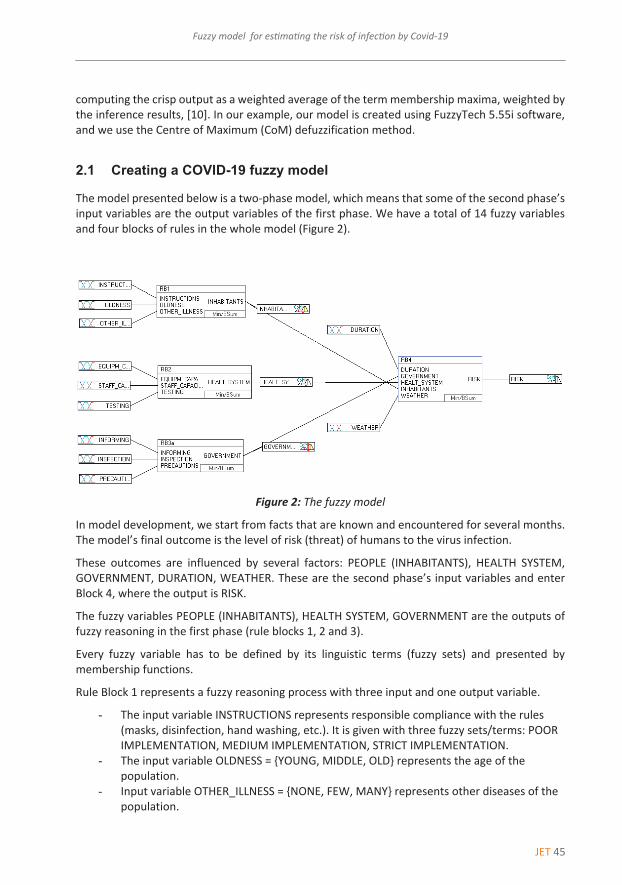
The model presented below is a two‐phase model, which means that some of the second phase’s input variables are the output variables of the first phase. We have a total of 14 fuzzy variables and four blocks of rules in the whole model (Figure 2).
Figure 2: The fuzzy model
In model development, we start from facts that are known and encountered for several months. The model’s final outcome is the level of risk (threat) of humans to the virus infection.
These outcomes are influenced by several factors: PEOPLE (INHABITANTS), HEALTH SYSTEM, GOVERNMENT, DURATION, WEATHER. These are the second phase’s input variables and enter Block 4, where the output is RISK.
The fuzzy variables PEOPLE (INHABITANTS), HEALTH SYSTEM, GOVERNMENT are the outputs of fuzzy reasoning in the first phase (rule blocks 1, 2 and 3).
Every fuzzy variable has to be defined by its linguistic terms (fuzzy sets) and presented by membership functions.
Rule Block 1 represents a fuzzy reasoning process with three input and one output variable.
- The input variable INSTRUCTIONS represents responsible compliance with the rules (masks, disinfection, hand washing, etc.). It is given with three fuzzy sets/terms: POOR IMPLEMENTATION, MEDIUM IMPLEMENTATION, STRICT IMPLEMENTATION.
- The input variable OLDNESS = {YOUNG, MIDDLE, OLD} represents the age of the population.
- Input variable OTHER_ILLNESS = {NONE, FEW, MANY} represents other diseases of the population.

46 JET
JET Vol. 13 (2020)Issue 3
Janez Usenik6 Janez Usenik JET Vol. 13 (2020) Issue 3
‐‐‐‐‐‐‐‐‐‐
- The output variable INHABITANTS = {LOW_RESPONSIVE, MEDIUM_RESPONSIVE, VERY_RESPONSIVE} indicates the susceptibility of the population to the coronavirus.
Rule Block 2 means a fuzzy reasoning process with three input and one output variable.
- The input variable STAFF_CAPACITY = {FEW, MEDIUM, ENOUGH} represents the medical staff's capacity.
- Input variable EQUIPMENT_CAPACITY = {BAD, MEDIUM. ENOUGH} represents the capacity of hospital equipment.
- The input variable TESTING = {NOT_ENOUGH, MEDIUM, MANY} represents the number of population tests.
- The output variable HEALTH_SYSTEM = {DEFICIENT, GOOD, VERY_GOOD} means the robustness and sustainability of the health system.
Rule Block 3 means a fuzzy reasoning process with three input and one output variable.
- The input variable INFORMING = {BAD, MEDIUM, GOOD} represents the level of success of information on the course and state of the disease, on the measures taken, on the vaccine, and similar.
- The input variable PRECAUTIONS = {BAD_TOO_LATE, MEDIUM, GOOD} represents the level of security measures taken by the government, such as mandatory wearing of masks, self‐isolation, quarantine, purchase of equipment and timely preparation of hospitals, curfew, and similar.
- The input variable INSPECTION = {DEFICIENT, MEDIUM, GOOD} represents the activity of government departments in checking compliance with the measures taken.
- The output variable GOVERNMENT = {UNSUCCESSFUL, SUCCESSFUL, VERY_SUCCESSFUL} indicates the government’s performance in fighting the virus.
Rule Block 4 represents the second phase of the fuzzy model and represents a process of fuzzy reasoning with five inputs and one output.
- We already know the input variables INHABITANTS, HEALTH_SYSTEM, GOVERNMENT, as these are the outputs of the first phase of our model.
- The input variable DURATION = {SHORT, LONG} represents the time component of the epidemic.
- The input variable WEATHER = {BAD, GOOD} represents the effect of weather on the intensity of the virus’s spread.
- The output variable RISK = {VERY_LOW, LOW, MEDIUM, HIGH, DRAMATIC} is also the final output of the fuzzy system and indicates the level of susceptibility of the population and thus the possibility of infection.
All fuzzy variables are given in the range of 0 to 100 and show the incidence rate. All fuzzy sets are described and represented by membership functions. For the fuzzy variables INHABITANTS, HEALT_SYSTEM, GOVERNMENT and RISK, the membership functions are shown in Figures 3 ‐ 6.
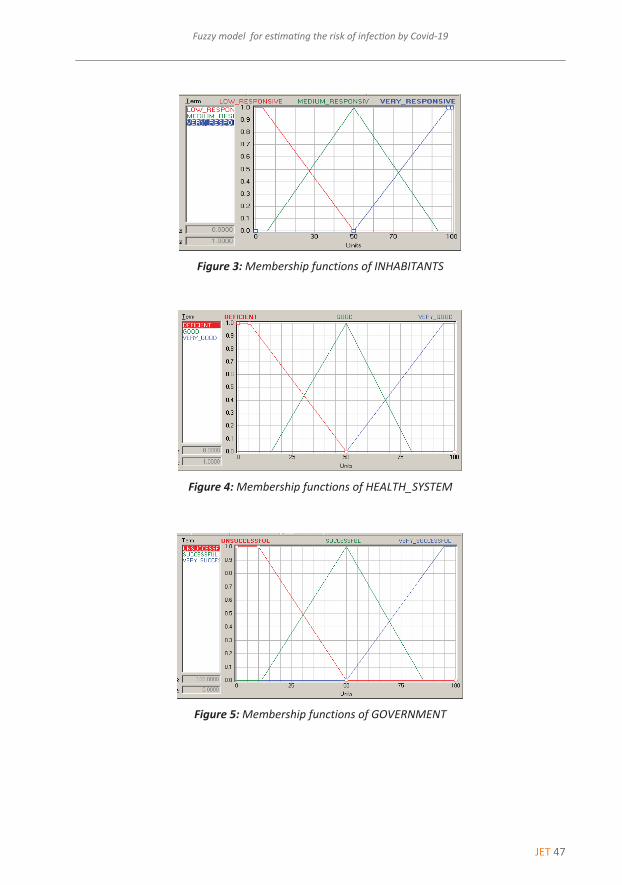
JET 47
Fuzzy model for estimating the risk of infection by Covid-19 Fuzzy model for estimate the risk of infection by Covid‐19 7
‐‐‐‐‐‐‐‐‐‐
Figure 3: Membership functions of INHABITANTS
Figure 4: Membership functions of HEALTH_SYSTEM
Figure 5: Membership functions of GOVERNMENT
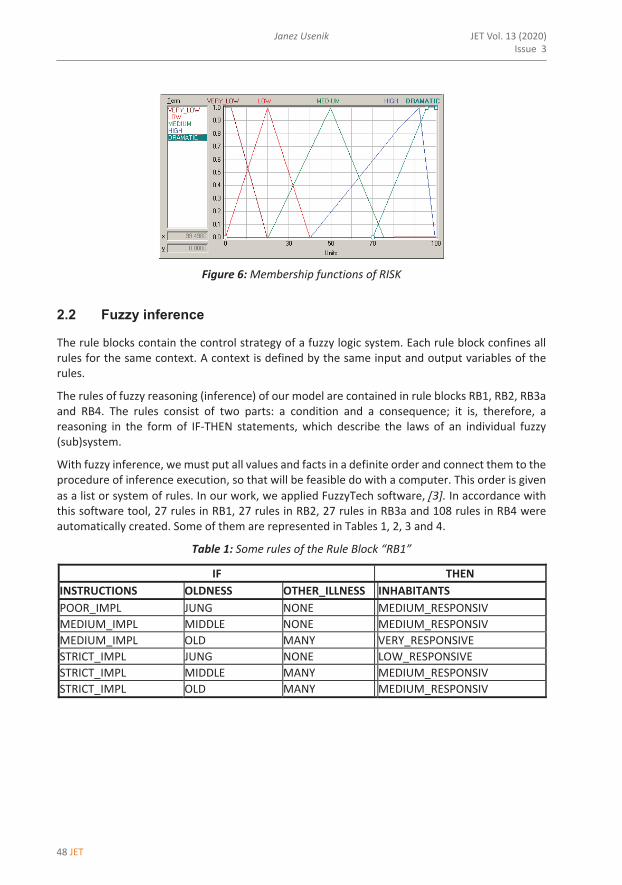
48 JET
JET Vol. 13 (2020)Issue 3
Janez Usenik8 Janez Usenik JET Vol. 13 (2020) Issue 3
‐‐‐‐‐‐‐‐‐‐
Figure 6: Membership functions of RISK
2.2 Fuzzy inference
The rule blocks contain the control strategy of a fuzzy logic system. Each rule block confines all rules for the same context. A context is defined by the same input and output variables of the rules.
The rules of fuzzy reasoning (inference) of our model are contained in rule blocks RB1, RB2, RB3a and RB4. The rules consist of two parts: a condition and a consequence; it is, therefore, a reasoning in the form of IF‐THEN statements, which describe the laws of an individual fuzzy (sub)system.
With fuzzy inference, we must put all values and facts in a definite order and connect them to the procedure of inference execution, so that will be feasible do with a computer. This order is given as a list or system of rules. In our work, we applied FuzzyTech software, 3]. In accordance with this software tool, 27 rules in RB1, 27 rules in RB2, 27 rules in RB3a and 108 rules in RB4 were automatically created. Some of them are represented in Tables 1, 2, 3 and 4.
Table 1: Some rules of the Rule Block “RB1”
IF THEN INSTRUCTIONS OLDNESS OTHER_ILLNESS INHABITANTSPOOR_IMPL JUNG NONE MEDIUM_RESPONSIV MEDIUM_IMPL MIDDLE NONE MEDIUM_RESPONSIV MEDIUM_IMPL OLD MANY VERY_RESPONSIVE STRICT_IMPL JUNG NONE LOW_RESPONSIVE STRICT_IMPL MIDDLE MANY MEDIUM_RESPONSIV STRICT_IMPL OLD MANY MEDIUM_RESPONSIV
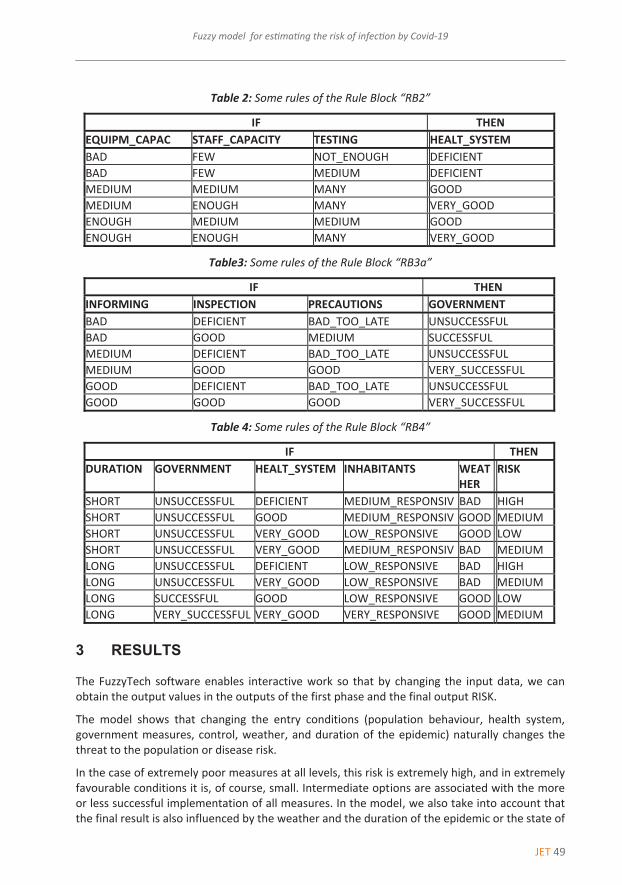
JET 49
Fuzzy model for estimating the risk of infection by Covid-19 Fuzzy model for estimate the risk of infection by Covid‐19 9
‐‐‐‐‐‐‐‐‐‐
Table 2: Some rules of the Rule Block “RB2”
IF THEN EQUIPM_CAPAC STAFF_CAPACITY TESTING HEALT_SYSTEM BAD FEW NOT_ENOUGH DEFICIENT BAD FEW MEDIUM DEFICIENT MEDIUM MEDIUM MANY GOODMEDIUM ENOUGH MANY VERY_GOOD ENOUGH MEDIUM MEDIUM GOODENOUGH ENOUGH MANY VERY_GOOD
Table3: Some rules of the Rule Block “RB3a”
IF THEN INFORMING INSPECTION PRECAUTIONS GOVERNMENT BAD DEFICIENT BAD_TOO_LATE UNSUCCESSFUL BAD GOOD MEDIUM SUCCESSFUL MEDIUM DEFICIENT BAD_TOO_LATE UNSUCCESSFUL MEDIUM GOOD GOOD VERY_SUCCESSFUL GOOD DEFICIENT BAD_TOO_LATE UNSUCCESSFUL GOOD GOOD GOOD VERY_SUCCESSFUL
Table 4: Some rules of the Rule Block “RB4”
IF THEN DURATION GOVERNMENT HEALT_SYSTEM INHABITANTS WEAT
HER RISK
SHORT UNSUCCESSFUL DEFICIENT MEDIUM_RESPONSIV BAD HIGH SHORT UNSUCCESSFUL GOOD MEDIUM_RESPONSIV GOOD MEDIUM SHORT UNSUCCESSFUL VERY_GOOD LOW_RESPONSIVE GOOD LOW SHORT UNSUCCESSFUL VERY_GOOD MEDIUM_RESPONSIV BAD MEDIUM LONG UNSUCCESSFUL DEFICIENT LOW_RESPONSIVE BAD HIGH LONG UNSUCCESSFUL VERY_GOOD LOW_RESPONSIVE BAD MEDIUM LONG SUCCESSFUL GOOD LOW_RESPONSIVE GOOD LOW LONG VERY_SUCCESSFUL VERY_GOOD VERY_RESPONSIVE GOOD MEDIUM
3 RESULTS
The FuzzyTech software enables interactive work so that by changing the input data, we can obtain the output values in the outputs of the first phase and the final output RISK.
The model shows that changing the entry conditions (population behaviour, health system, government measures, control, weather, and duration of the epidemic) naturally changes the threat to the population or disease risk.
In the case of extremely poor measures at all levels, this risk is extremely high, and in extremely favourable conditions it is, of course, small. Intermediate options are associated with the more or less successful implementation of all measures. In the model, we also take into account that the final result is also influenced by the weather and the duration of the epidemic or the state of
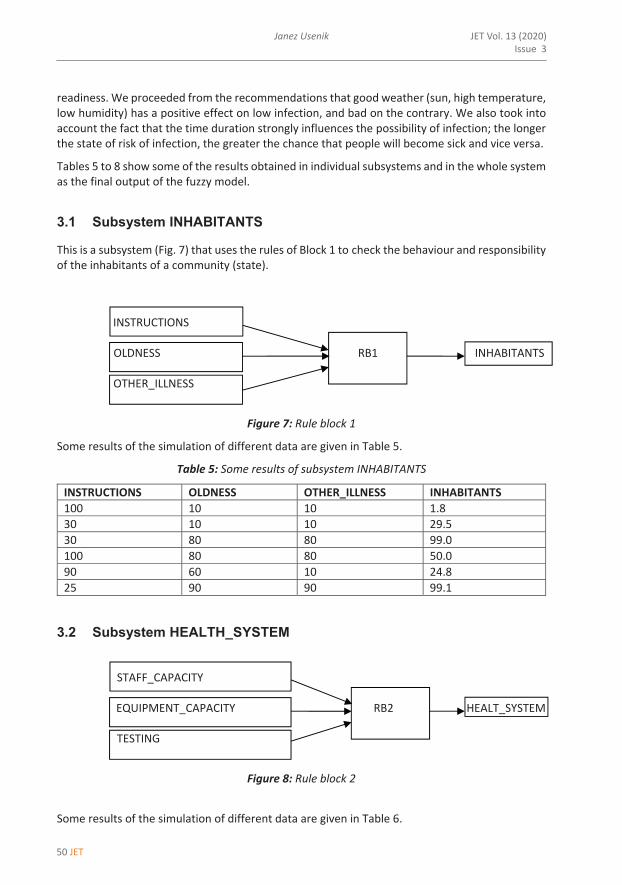
50 JET
JET Vol. 13 (2020)Issue 3
Janez Usenik10 Janez Usenik JET Vol. 13 (2020) Issue 3
‐‐‐‐‐‐‐‐‐‐
readiness. We proceeded from the recommendations that good weather (sun, high temperature, low humidity) has a positive effect on low infection, and bad on the contrary. We also took into account the fact that the time duration strongly influences the possibility of infection; the longer the state of risk of infection, the greater the chance that people will become sick and vice versa.
Tables 5 to 8 show some of the results obtained in individual subsystems and in the whole system as the final output of the fuzzy model.
3.1 Subsystem INHABITANTS
This is a subsystem (Fig. 7) that uses the rules of Block 1 to check the behaviour and responsibility of the inhabitants of a community (state).
INSTRUCTIONS OLDNESS RB1 INHABITANTS OTHER_ILLNESS
Figure 7: Rule block 1
Some results of the simulation of different data are given in Table 5.
Table 5: Some results of subsystem INHABITANTS
INSTRUCTIONS OLDNESS OTHER_ILLNESS INHABITANTS 100 10 10 1.830 10 10 29.530 80 80 99.0100 80 80 50.090 60 10 24.825 90 90 99.1
3.2 Subsystem HEALTH_SYSTEM
STAFF_CAPACITY EQUIPMENT_CAPACITY RB2 HEALT_SYSTEM TESTING
Figure 8: Rule block 2
Some results of the simulation of different data are given in Table 6.
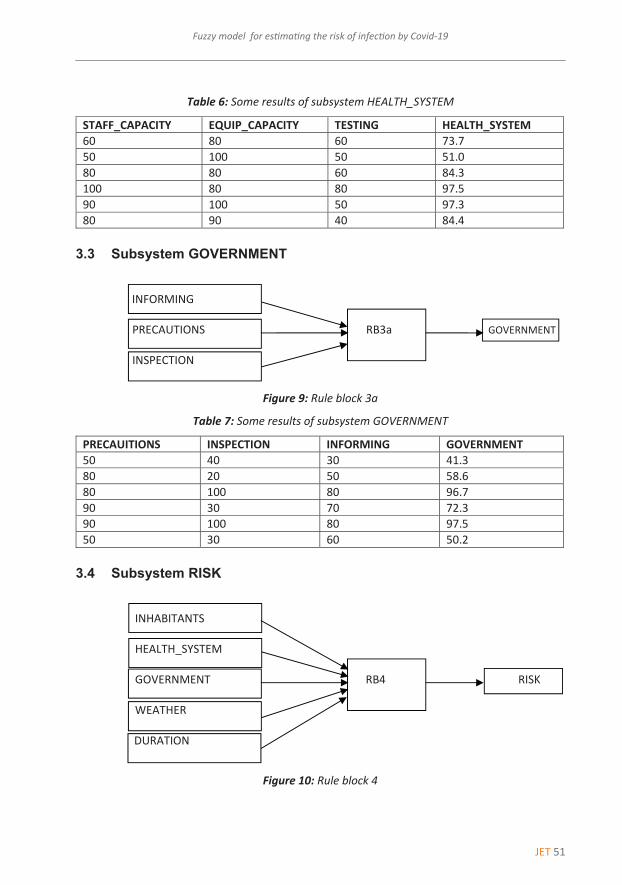
JET 51
Fuzzy model for estimating the risk of infection by Covid-19 Fuzzy model for estimate the risk of infection by Covid‐19 11
‐‐‐‐‐‐‐‐‐‐
Table 6: Some results of subsystem HEALTH_SYSTEM
STAFF_CAPACITY EQUIP_CAPACITY TESTING HEALTH_SYSTEM 60 80 60 73.750 100 50 51.080 80 60 84.3100 80 80 97.590 100 50 97.380 90 40 84.4
3.3 Subsystem GOVERNMENT
INFORMING PRECAUTIONS RB3a GOVERNMENT INSPECTION
Figure 9: Rule block 3a
Table 7: Some results of subsystem GOVERNMENT
PRECAUITIONS INSPECTION INFORMING GOVERNMENT 50 40 30 41.380 20 50 58.680 100 80 96.790 30 70 72.390 100 80 97.550 30 60 50.2
3.4 Subsystem RISK
INHABITANTS HEALTH_SYSTEM GOVERNMENT RB4 RISK WEATHER DURATION
Figure 10: Rule block 4
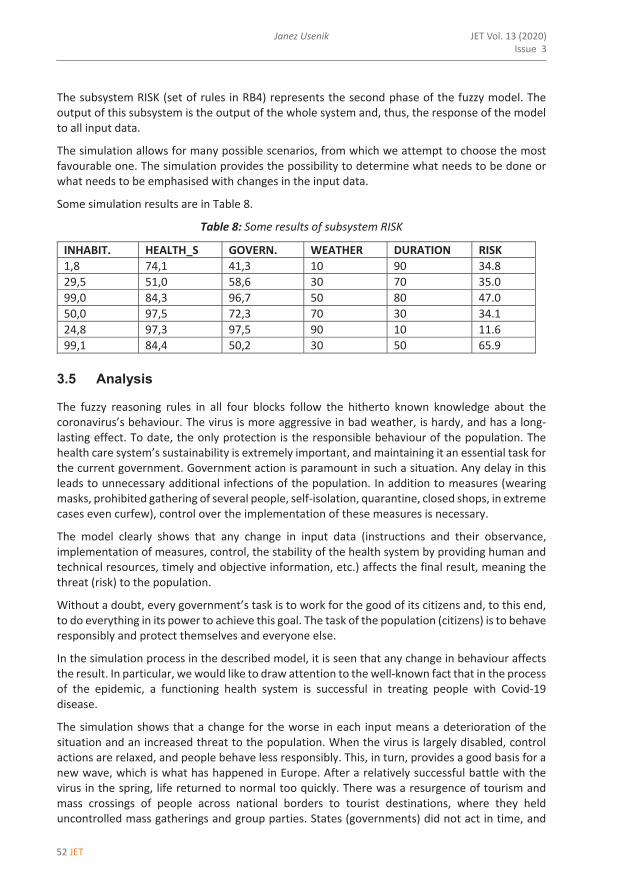
52 JET
JET Vol. 13 (2020)Issue 3
Janez Usenik12 Janez Usenik JET Vol. 13 (2020) Issue 3
‐‐‐‐‐‐‐‐‐‐
The subsystem RISK (set of rules in RB4) represents the second phase of the fuzzy model. The output of this subsystem is the output of the whole system and, thus, the response of the model to all input data.
The simulation allows for many possible scenarios, from which we attempt to choose the most favourable one. The simulation provides the possibility to determine what needs to be done or what needs to be emphasised with changes in the input data.
Some simulation results are in Table 8.
Table 8: Some results of subsystem RISK
INHABIT. HEALTH_S GOVERN. WEATHER DURATION RISK 1,8 74,1 41,3 10 90 34.8 29,5 51,0 58,6 30 70 35.0 99,0 84,3 96,7 50 80 47.0 50,0 97,5 72,3 70 30 34.1 24,8 97,3 97,5 90 10 11.6 99,1 84,4 50,2 30 50 65.9
3.5 Analysis
The fuzzy reasoning rules in all four blocks follow the hitherto known knowledge about the coronavirus’s behaviour. The virus is more aggressive in bad weather, is hardy, and has a long‐lasting effect. To date, the only protection is the responsible behaviour of the population. The health care system’s sustainability is extremely important, and maintaining it an essential task for the current government. Government action is paramount in such a situation. Any delay in this leads to unnecessary additional infections of the population. In addition to measures (wearing masks, prohibited gathering of several people, self‐isolation, quarantine, closed shops, in extreme cases even curfew), control over the implementation of these measures is necessary.
The model clearly shows that any change in input data (instructions and their observance, implementation of measures, control, the stability of the health system by providing human and technical resources, timely and objective information, etc.) affects the final result, meaning the threat (risk) to the population.
Without a doubt, every government’s task is to work for the good of its citizens and, to this end, to do everything in its power to achieve this goal. The task of the population (citizens) is to behave responsibly and protect themselves and everyone else.
In the simulation process in the described model, it is seen that any change in behaviour affects the result. In particular, we would like to draw attention to the well‐known fact that in the process of the epidemic, a functioning health system is successful in treating people with Covid‐19 disease.
The simulation shows that a change for the worse in each input means a deterioration of the situation and an increased threat to the population. When the virus is largely disabled, control actions are relaxed, and people behave less responsibly. This, in turn, provides a good basis for a new wave, which is what has happened in Europe. After a relatively successful battle with the virus in the spring, life returned to normal too quickly. There was a resurgence of tourism and mass crossings of people across national borders to tourist destinations, where they held uncontrolled mass gatherings and group parties. States (governments) did not act in time, and
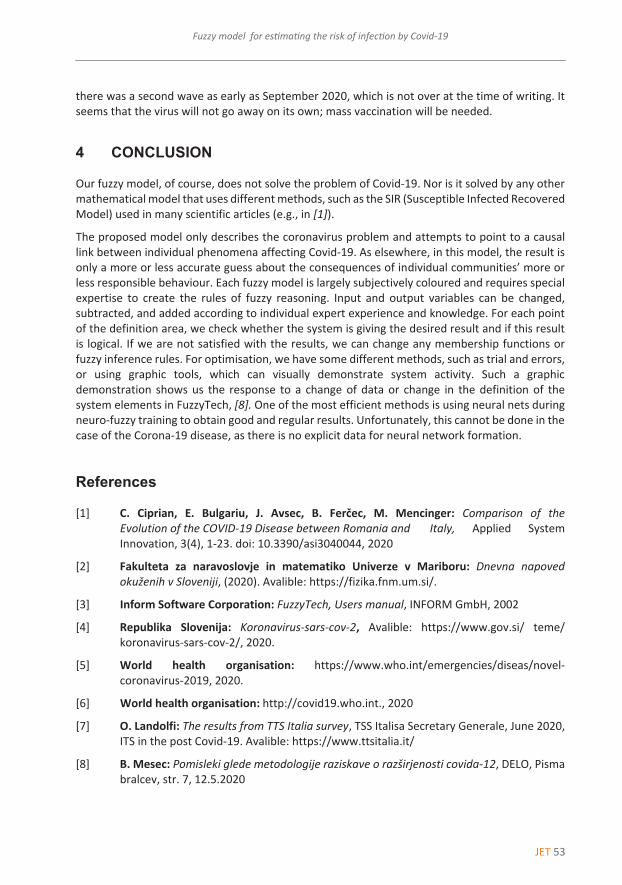
JET 53
Fuzzy model for estimating the risk of infection by Covid-19 Fuzzy model for estimate the risk of infection by Covid‐19 13
‐‐‐‐‐‐‐‐‐‐
there was a second wave as early as September 2020, which is not over at the time of writing. It seems that the virus will not go away on its own; mass vaccination will be needed.
4 CONCLUSION
Our fuzzy model, of course, does not solve the problem of Covid‐19. Nor is it solved by any other mathematical model that uses different methods, such as the SIR (Susceptible Infected Recovered Model) used in many scientific articles (e.g., in [1]).
The proposed model only describes the coronavirus problem and attempts to point to a causal link between individual phenomena affecting Covid‐19. As elsewhere, in this model, the result is only a more or less accurate guess about the consequences of individual communities’ more or less responsible behaviour. Each fuzzy model is largely subjectively coloured and requires special expertise to create the rules of fuzzy reasoning. Input and output variables can be changed, subtracted, and added according to individual expert experience and knowledge. For each point of the definition area, we check whether the system is giving the desired result and if this result is logical. If we are not satisfied with the results, we can change any membership functions or fuzzy inference rules. For optimisation, we have some different methods, such as trial and errors, or using graphic tools, which can visually demonstrate system activity. Such a graphic demonstration shows us the response to a change of data or change in the definition of the system elements in FuzzyTech, [8]. One of the most efficient methods is using neural nets during neuro‐fuzzy training to obtain good and regular results. Unfortunately, this cannot be done in the case of the Corona‐19 disease, as there is no explicit data for neural network formation.
References
[1] C. Ciprian, E. Bulgariu, J. Avsec, B. Ferčec, M. Mencinger: Comparison of the Evolution of the COVID‐19 Disease between Romania and Italy, Applied System Innovation, 3(4), 1‐23. doi: 10.3390/asi3040044, 2020
[2] Fakulteta za naravoslovje in matematiko Univerze v Mariboru: Dnevna napoved okuženih v Sloveniji, (2020). Avalible: https://fizika.fnm.um.si/.
[3] Inform Software Corporation: FuzzyTech, Users manual, INFORM GmbH, 2002
[4] Republika Slovenija: Koronavirus‐sars‐cov‐2, Avalible: https://www.gov.si/ teme/ koronavirus‐sars‐cov‐2/, 2020.
[5] World health organisation: https://www.who.int/emergencies/diseas/novel‐coronavirus‐2019, 2020.
[6] World health organisation: http://covid19.who.int., 2020
[7] O. Landolfi: The results from TTS Italia survey, TSS Italisa Secretary Generale, June 2020, ITS in the post Covid‐19. Avalible: https://www.ttsitalia.it/
[8] B. Mesec: Pomisleki glede metodologije raziskave o razširjenosti covida‐12, DELO, Pisma bralcev, str. 7, 12.5.2020

54 JET
JET Vol. 13 (2020)Issue 3
Janez Usenik
14 Janez Usenik JET Vol. 13 (2020) Issue 3
‐‐‐‐‐‐‐‐‐‐
[9] R. O. H. Stutt and all: A modelling framework to assess the likely effectiveness of facemasks in combination with »lock‐down« in managing the COVID‐19 Pandemic, Proceedings of the Royal Society A, Matematical, Physical and Engineering Sciencies, The Royal Society Publishing, Avalible: https://doi.org/10.1098/rspa.2020.0376, 10.6.2020
[10] T. J. Ross: Fuzzy logic with engineering applications. John Wiley & Sons. Second Edition, John Wiley & Sons Ltd., The Atrium, Southern Gate, Chichester, West Sussex, England, 2007
[11] J. Usenik, M. Bogataj: Fuzzy approach for a location‐inventory model, Mathematical economics, operational research and logistics, serial no. 3, Ljubljana: Faculty of Economics, 2004
[12] J. Usenik: System control in conditions of fuzzy dynamic processes, Upravljanje sistema v pogojih mehkih dinamičnih procesov, Journal of energy technology, Fakulteta za Energetiko Univerze v Mariboru, 2015, Avalible: http://www. fe.um.si/images/jet/JET _november_2015‐splet.pdf
[13] M. Vidiček, J. Usenik: Fuzzy approach to determining the sustainability index of energy using biomass, Journal of landscape governance, 2017. Avalible: JLGhttps://docs.google.com/a/vsgrm.unm.si/viewer?a=v&pid=sites&srcid=dW5tLnNpfH ZzZ3JtdW5tfGd4OjE1YTUxODc4ZjdiY2RlMA
[14] H. J. Zimmermann: Fuzzy set theory and its applications, fourth edition, Kluwer Academic Publishers, Massachusetts, 2001

JET 55
JET Volume 13 (2020) p.p. 57-66Issue 3, November 2020
Type of article 1.04www.fe.um.si/en/jet.html
A REGENERATOR USED IN THE INSTALLATION OF MAGNETIC
REFRIGERATION DEVICES
UPORABA REGENERATORJA ZA MAGNETNO HLAJENJE
Botoc DorinR, Jurij Avsec1, Adrian Plesca2
Keywords: Energy efficiency, gadolinium material, magnetocaloric effect, alternative technology, AMR
Abstract
In this article, the mechanism and functioning of a refrigeration system based on the magnetic system and the magnetocaloric effect are examined. Magnetic refrigeration plants operate based on a state--of-the-art technology that does not contain any toxic refrigerant that is harmful to the environment and the ozone layer. The magnetocaloric effect is created by a rare earth metal called gadolinium. We have studied the benefits of using this type of mechanism for both domestic and industrial needs. High efficiency, net energy consumption lower than the classic, silent systems, and a lack of typical refrigerant characterize this type of installation. The following layout describes the initial prototype for AMR in magnetocaloric refrigeration.
PovzetekV tem članku je proučen mehanizem in delovanje hladilnega sistema, ki temelji na magnetnem siste-mu in magnetokaloričnem učinku. Magnetne hladilne naprave delujejo po najsodobnejši tehnologiji,
R Corresponding author: Botoc Dorin, E-mail address: [email protected]
1 University of Maribor, Faculty of Energy Technology, Laboratory for Thermomechanics, Applied Thermal Energy Technolo-gies and Nanotechnologies, Hočevarjev trg 1, SI-8270 Krško, Slovenia
2 Faculty of Electrical Engineering, Energetics and Applied Informatics, Gheorghe Asachi Technical University of Iasi, Depart-ment of Power Engineering, Romania
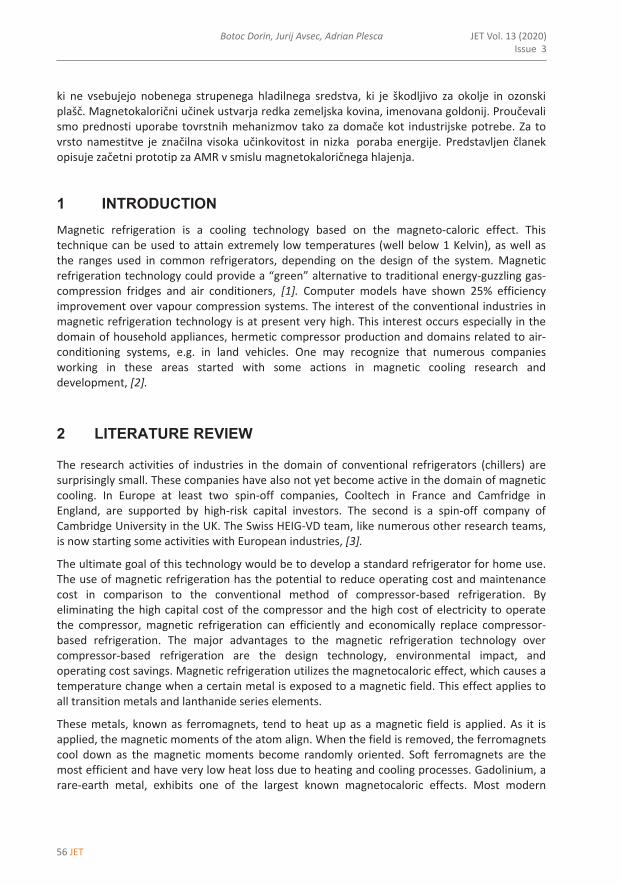
56 JET
JET Vol. 13 (2020)Issue 3
Botoc Dorin, Jurij Avsec, Adrian Plesca
Botoc Dorin, Jurij Avsec, Adrian Plesca 2
ki ne vsebujejo nobenega strupenega hladilnega sredstva, ki je škodljivo za okolje in ozonski plašč. Magnetokalorični učinek ustvarja redka zemeljska kovina, imenovana goldonij. Proučevali smo prednosti uporabe tovrstnih mehanizmov tako za domače kot industrijske potrebe. Za to vrsto namestitve je značilna visoka učinkovitost in nizka poraba energije. Predstavljen članek opisuje začetni prototip za AMR v smislu magnetokaloričnega hlajenja.
1 INTRODUCTION Magnetic refrigeration is a cooling technology based on the magneto‐caloric effect. This technique can be used to attain extremely low temperatures (well below 1 Kelvin), as well as the ranges used in common refrigerators, depending on the design of the system. Magnetic refrigeration technology could provide a “green” alternative to traditional energy‐guzzling gas‐compression fridges and air conditioners, [1]. Computer models have shown 25% efficiency improvement over vapour compression systems. The interest of the conventional industries in magnetic refrigeration technology is at present very high. This interest occurs especially in the domain of household appliances, hermetic compressor production and domains related to air‐conditioning systems, e.g. in land vehicles. One may recognize that numerous companies working in these areas started with some actions in magnetic cooling research and development, [2].
2 LITERATURE REVIEW
The research activities of industries in the domain of conventional refrigerators (chillers) are surprisingly small. These companies have also not yet become active in the domain of magnetic cooling. In Europe at least two spin‐off companies, Cooltech in France and Camfridge in England, are supported by high‐risk capital investors. The second is a spin‐off company of Cambridge University in the UK. The Swiss HEIG‐VD team, like numerous other research teams, is now starting some activities with European industries, [3].
The ultimate goal of this technology would be to develop a standard refrigerator for home use. The use of magnetic refrigeration has the potential to reduce operating cost and maintenance cost in comparison to the conventional method of compressor‐based refrigeration. By eliminating the high capital cost of the compressor and the high cost of electricity to operate the compressor, magnetic refrigeration can efficiently and economically replace compressor‐based refrigeration. The major advantages to the magnetic refrigeration technology over compressor‐based refrigeration are the design technology, environmental impact, and operating cost savings. Magnetic refrigeration utilizes the magnetocaloric effect, which causes a temperature change when a certain metal is exposed to a magnetic field. This effect applies to all transition metals and lanthanide series elements.
These metals, known as ferromagnets, tend to heat up as a magnetic field is applied. As it is applied, the magnetic moments of the atom align. When the field is removed, the ferromagnets cool down as the magnetic moments become randomly oriented. Soft ferromagnets are the most efficient and have very low heat loss due to heating and cooling processes. Gadolinium, a rare‐earth metal, exhibits one of the largest known magnetocaloric effects. Most modern

JET 57
A regenerator used in the installation of magnetic refrigeration devices
Botoc Dorin, Jurij Avsec, Adrian Plesca 3
magnetic refrigeration designs employ arc‐melted alloys of gadolinium, silicon, and germanium, which provide greater temperature ranges at room temperatures, [4].
Magnetic refrigeration is a timely topic of research. The discovery of magnetic materials that exhibit a remarkable change in their temperature when they are adiabatically magnetized close to room temperature has produced a surge in the number of publications on the magnetocaloric effect in the previous two decades.
Simultaneously, as these materials enable the possibility of designing magnetic refrigerators with operation temperatures close to room temperature, there has been a noticeable increase in the development of magnetic refrigerator prototypes, [5].
3 MAGNETIC REFRIGERATION SYSTEM
Currently, there is a great deal of interest in utilizing the MCE as an alternative technology for refrigeration both in the ambient temperature and in cryogenic temperatures. Magnetic refrigeration is an environmentally friendly cooling technology. Most modern refrigeration systems and air conditioners still use ozone‐depleting or global‐warming volatile liquid refrigerants. Magnetic refrigerators use a solid refrigerant (usually in the form of spheres or thin sheets) and common heat transfer fluids (e.g., water, water‐alcohol solution, air, or helium gas) with no ozone‐depleting and/or global warming effects, [6].
Figure 1: Thermodynamic processes in magnetic refrigeration
The manipulation of the magnetic field distribution and the period of the fluid flow gives significant possibilities to form different magnetic refrigeration cycles. The basic goal when introducing new thermodynamic cycles is to reduce the potential magnetic work input and therefore increase the efficiency.
When the magneto‐caloric material is subjected to the magnetic field, the magnetic moments of soft ferromagnetic materials become aligned, making the material more ordered. Hence, the material liberates more heat resulting in the decrease of their magnetic entropy. However, when the magnetic material subjected to the magnetic field is reduced isothermally, the

58 JET
JET Vol. 13 (2020)Issue 3
Botoc Dorin, Jurij Avsec, Adrian Plesca
Botoc Dorin, Jurij Avsec, Adrian Plesca 4
magnetic moments become disoriented, due to which the material absorbs heat and, consequently, their magnetic entropy increases, [7].
One of the most notable examples of the magnetocaloric effect is in the chemical element gadolinium and some of its alloys. Gadolinium’s temperature is observed to increase when it enters certain magnetic fields. When it leaves the magnetic field, the temperature drops back to normal. The effect is considerably stronger for the gadolinium alloy Gd5(𝑆𝑆𝑆𝑆2Ge2). Praseodymium alloyed with nickel (Pr𝑁𝑁𝑆𝑆2) has such a strong magnetocaloric effect that it has allowed scientists to approach within one‐thousandth of a degree of absolute zero. Magnetic Refrigeration is also called as Adiabatic Magnetization.
The basic thermodynamic cycle of the magnetic refrigerator is the Brayton Cycle, which operates between two adiabatic and two isomagnetic field lines.
As already discussed, Pure gadolinium may be regarded as being the ideal substance for magnetic refrigeration, just like the ideal gas is for conventional refrigeration. However, just as conventional systems practically cannot be operated with ideal gases, magnetic refrigerators using pure gadolinium are also not possible; they perform better with specially designed alloys. Below is the list of the promising categories of magneto‐caloric materials for application in magnetic refrigerators, [8].
1. Gadolinium‐ Silicon‐ Germanium Compounds 2. Binary and ternary intermetallic compounds 3. Manganites 4. Lanthanum iron‐based compounds.
Gadolinium, a rare earth metal exhibits one of the largest known magnetocaloric effects. It was used as the refrigerant in many of the early magnetic refrigeration systems.
In general, at the present stage of the development of magnetic refrigerators with permanent magnets, hardly any freezing applications are feasible, because large temperature spans occur between the heat source and the heat sink. Some current examples are in cooling plants in the food industry or in large marine freezing applications. Some of the future applications are:
1. Magnetic household refrigeration appliances 2. Magnetic cooling and air conditioning in buildings and houses 3. Central cooling system 4. Refrigeration in medicine 5. Cooling in the food industry and storage 6. Cooling in transportation 7. Cooling of electronic
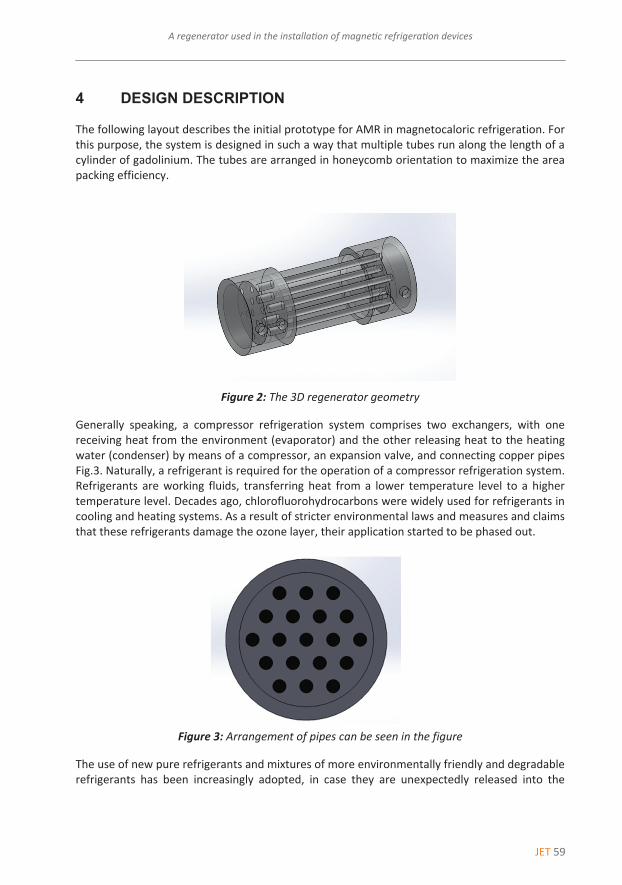
JET 59
A regenerator used in the installation of magnetic refrigeration devices
Botoc Dorin, Jurij Avsec, Adrian Plesca 5
4 DESIGN DESCRIPTION
The following layout describes the initial prototype for AMR in magnetocaloric refrigeration. For this purpose, the system is designed in such a way that multiple tubes run along the length of a cylinder of gadolinium. The tubes are arranged in honeycomb orientation to maximize the area packing efficiency.
Figure 2: The 3D regenerator geometry
Generally speaking, a compressor refrigeration system comprises two exchangers, with one receiving heat from the environment (evaporator) and the other releasing heat to the heating water (condenser) by means of a compressor, an expansion valve, and connecting copper pipes Fig.3. Naturally, a refrigerant is required for the operation of a compressor refrigeration system. Refrigerants are working fluids, transferring heat from a lower temperature level to a higher temperature level. Decades ago, chlorofluorohydrocarbons were widely used for refrigerants in cooling and heating systems. As a result of stricter environmental laws and measures and claims that these refrigerants damage the ozone layer, their application started to be phased out.
Figure 3: Arrangement of pipes can be seen in the figure
The use of new pure refrigerants and mixtures of more environmentally friendly and degradable refrigerants has been increasingly adopted, in case they are unexpectedly released into the
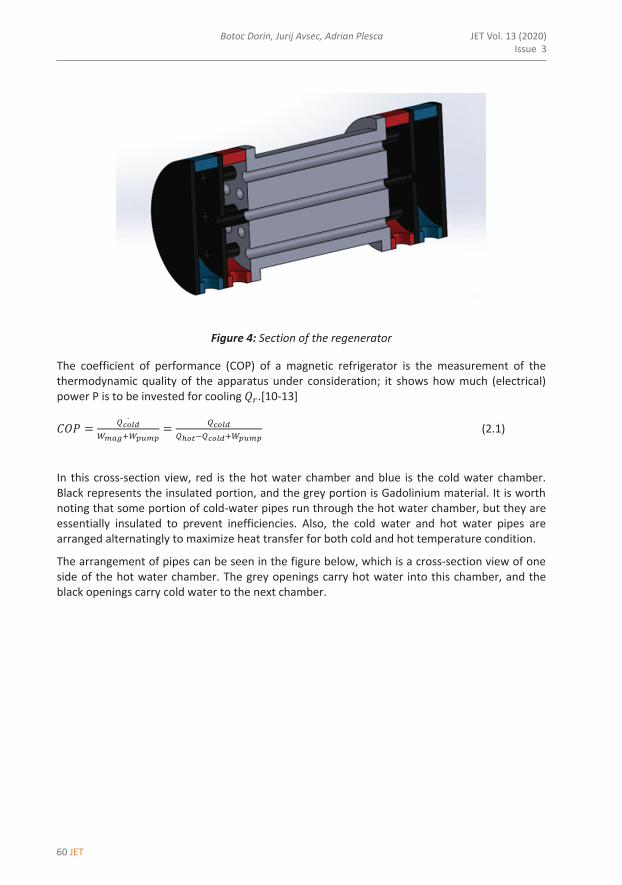
60 JET
JET Vol. 13 (2020)Issue 3
Botoc Dorin, Jurij Avsec, Adrian Plesca
Botoc Dorin, Jurij Avsec, Adrian Plesca 6
environment. At both ends, two separate chambers are attached for both hot and cold water flux, as shown in the following figure.
Figure 4: Section of the regenerator
The coefficient of performance (COP) of a magnetic refrigerator is the measurement of the thermodynamic quality of the apparatus under consideration; it shows how much (electrical) power P is to be invested for cooling 𝑄𝑄�.[10‐13]
��� � ����������������
� ���������������������
(2.1)
In this cross‐section view, red is the hot water chamber and blue is the cold water chamber. Black represents the insulated portion, and the grey portion is Gadolinium material. It is worth noting that some portion of cold‐water pipes run through the hot water chamber, but they are essentially insulated to prevent inefficiencies. Also, the cold water and hot water pipes are arranged alternatingly to maximize heat transfer for both cold and hot temperature condition.
The arrangement of pipes can be seen in the figure below, which is a cross‐section view of one side of the hot water chamber. The grey openings carry hot water into this chamber, and the black openings carry cold water to the next chamber.
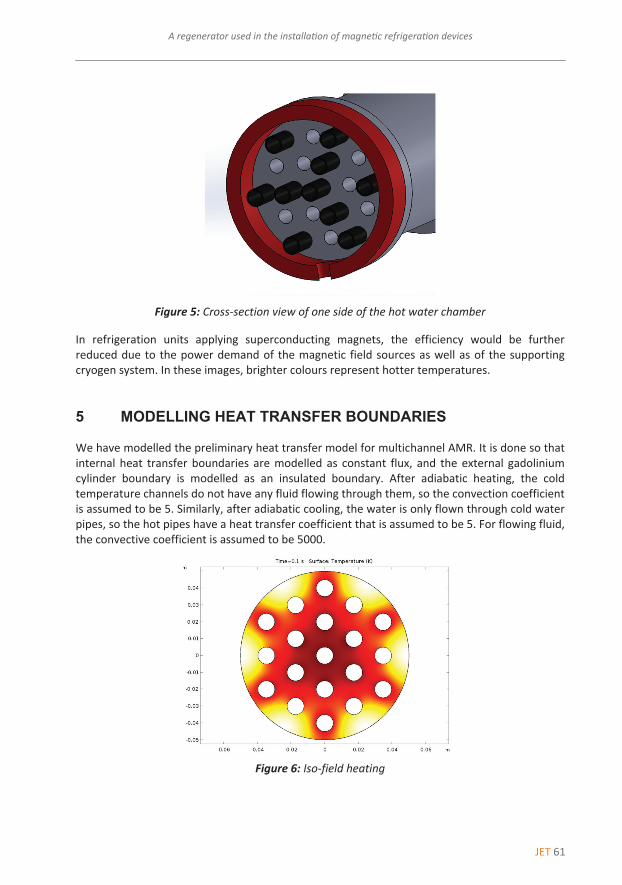
JET 61
A regenerator used in the installation of magnetic refrigeration devices
Botoc Dorin, Jurij Avsec, Adrian Plesca 7
Figure 5: Cross‐section view of one side of the hot water chamber
In refrigeration units applying superconducting magnets, the efficiency would be further reduced due to the power demand of the magnetic field sources as well as of the supporting cryogen system. In these images, brighter colours represent hotter temperatures.
5 MODELLING HEAT TRANSFER BOUNDARIES
We have modelled the preliminary heat transfer model for multichannel AMR. It is done so that internal heat transfer boundaries are modelled as constant flux, and the external gadolinium cylinder boundary is modelled as an insulated boundary. After adiabatic heating, the cold temperature channels do not have any fluid flowing through them, so the convection coefficient is assumed to be 5. Similarly, after adiabatic cooling, the water is only flown through cold water pipes, so the hot pipes have a heat transfer coefficient that is assumed to be 5. For flowing fluid, the convective coefficient is assumed to be 5000.
Figure 6: Iso‐field heating

62 JET
JET Vol. 13 (2020)Issue 3
Botoc Dorin, Jurij Avsec, Adrian Plesca
Botoc Dorin, Jurij Avsec, Adrian Plesca 8
Figure 7: Iso‐field cooling
The thermal model is based on the finite difference method and solved by the implicit method. It also calculates the thermal capacity and conductivity of the material as functions of H and T and deduces the new temperatures (in fluid and material) with good precision.
6 THE ADVANTAGES AND DISADVANTAGES OF THE MAGNETIC REFRIGERATION SYSTEM
6.1 Advantages
The environmentally friendly refrigerant used is solid and non‐volatile and thus has no greenhouse effect. Conventional refrigerators use refrigerants that contain CFC or HCFC, which have been linked to ozone depletion and global warming. Some refrigerants, such as ammonia, are toxic and flammable.
Low running and operating cost ‐ There is no compressor, which is the most inefficient and costly part, in magnetic refrigerators. This leads to less energy consumption resulting in low running costs.
Higher efficiency ‐ Because it eliminates the need to expand and compress the liquid, a magnetic refrigerator consumes less energy and can operate at 60% efficiency.
Reliability ‐ High energy density and more compact device, fewer moving parts in comparison to traditional systems and thus more reliable.
Quiet operation ‐ This refrigerator unit is substantially quieter than traditional refrigeration systems.
Compactness: ‐ It is possible to achieve a high energy density compact device, because in the case of magnetic refrigeration the working substance is a solid material (e.g., gadolinium) and not a gas, as in the case of vapour compression cycles
JET 63
A regenerator used in the installation of magnetic refrigeration devices
Botoc Dorin, Jurij Avsec, Adrian Plesca 9
6.2 Disadvantages
The initial investment is very high in comparison to conventional refrigeration.
The magnetocaloric materials are rare earth materials; thus their availability also becomes a disadvantage. These materials need to be developed to allow larger frequencies of rectilinear and rotary magnetic refrigerators.
Electronic components must be shielded from magnetic fields. However, it must be noted that the fields are static, of short‐range and may be shielded.
Permanent magnets have limited field strength, while electromagnets and superconducting magnets are very expensive.
Temperature changes are limited. Multi‐stage machines lose efficiency through the heat transfer between the stages.
Moving machines need high precision to avoid magnetic field reduction due to gaps between the magnets and the magnetocaloric material, [11‐12].
7 CONCLUSION
In this article, the mechanism and functioning of the refrigeration system based on the magnetic system and the magnetocaloric effect has been examined, and the initial prototype for AMR in magnetocaloric refrigeration has been described. This is an interesting subject with important applications both in domestic and industrial fields. The industrial applicated will have a significant impact on energy consumption as well as a minimal impact on the environment. The layout in this paper describes the initial prototype for heat exchanger in magnetocaloric refrigeration. For this purpose, the system is designed in such a way that multiple tubes run along the length of a cylinder of gadolinium. The material which was chosen for the study was widely used in the research of magnetocaloric materials. Other alloys are members of the lanthanide period.
References
[1] Prakash Chawla, Ankit Mathur., ”Development of Magnetic Refrigerator at Room Temperatur” Vol. 3. pp 127‐140
[2] Zimm C.B., et.al. “Design and initial performance of a magnetic refrigerator with a rotating permanent magnet”, Proc. 2nd International Conference on Magnetic Refrigeration at Room Temperature Portorož, Slovenia, p. 341‐347, 2007
[3] Kitanovski A., Egolf P.W., “The Thermodynamics of Magnetic Refrigeration”, Review Article of the Int. J. Refr. 29, pp. 3‐21, 2006
[4] Engin K. et.al.” Magnetic Refrigeration Technology applications on near room temperature” 5th International Advanced Technologies Symposium (IATS’09)

64 JET
JET Vol. 13 (2020)Issue 3
Botoc Dorin, Jurij Avsec, Adrian Plesca
Botoc Dorin, Jurij Avsec, Adrian Plesca 10
[5] R. Bjørk, “Designing a magnet for magnetic refrigeration”, PhD Thesis, 2010
[6] J.A. Lonzano, et.al.“Performance analysis of a rotary active magnetic refrigerator”, J. Applied Energy, 111: pp. 669‐680, 2010
[7] R. Bjørk, et.al. “Comparison of adjustable permanent magnetic field sources”, J. Magnetism and Magnetic Materials,322 (22): pp. 3664‐3671, 2010
[8] Barclay J.A., “Wheel‐type magnetic refrigerator”, U.S. Patent 1983, No. 4.408.463
[9] Tušek J., Zupan S., Šarlah A., Prebil I., Poredoš A., “Development of a rotary magnetic refrigerator”, Int. J. Refr. 33 (2): 294‐300, 2010
[10] Rowe A., “Configuration and performance analysis of magnetic refrigerators”, Int. J. Refr. 34(1): pp.168‐177
[11] Hall J.L., Reid C.E., Spearing I.G., J.A. Barclay, “Thermodynamic consideration for the design of active magnetic regenerative refrigerators”, Adv. Cryog. Eng. 41: 1653‐165,1996
[12] Botoc Dorin, Jurij Avsec, Adrian Plesca, “The efficiency of magnetic refrigeration and a comparison with compressor refrigeration systems''JET, Vol.11, 2018
[13] Sergiu Lionte, Carmen Vasile, Monica Siroux, “Numerical analysis of a reciprocating active magnetic regenerator” Applied Thermal Engineering, 2014
Nomenclature
t time
density
Q heat released

JET 65
Author instructions
www.fe.um.si/en/jet.html
MAIN TITLE OF THE PAPERSLOVENIAN TITLEAuthor1, Author 2, Corresponding authorR
Keywords: (Up to 10 keywords)
AbstractAbstract should be up to 500 words long, with no pictures, photos, equations, tables, only text.
Povzetek(Abstract in Slovenian language)
Submission of Manuscripts: All manuscripts must be submitted in English by e-mail to the editorial office at [email protected] to ensure fast processing. Instructions for authors are also available online at http://www.fe.um.si/en/jet/author-instructions.html.
Preparation of manuscripts: Manuscripts must be typed in English in prescribed journal form (MS Word editor). A MS Word template is available at the Journal Home page.
A title page consists of the main title in the English and Slovenian language; the author(s) name(s) as well as the address, affiliation, E-mail address, telephone and fax numbers of author(s). Corre-sponding author must be indicated.
Main title: should be centred and written with capital letters (ARIAL bold 18 pt), in first paragraph in English language, in second paragraph in Slovenian language.
Key words: A list of 3 up to 6 key words is essential for indexing purposes. (CALIBRI 10pt)
Abstract: Abstract should be up to 500 words long, with no pictures, photos, equations, tables, - text only.
Povzetek: - Abstract in Slovenian language.
Main text should be structured logically in chapters, sections and sub-sections. Type of letters is Calibri, 10pt, full justified.
R Corresponding author: Title, Name and Surname, Organisation, Department, Address, Tel.: +XXX x xxx xxx, E-mail address: [email protected] Organisation, Department, Address2 Organisation, Department, Address

66 JET
JET Vol. 13 (2020)Issue 3
Authors names and surnames
Units and abbreviations: Required are SI units. Abbreviations must be given in text when first men-tioned.
Proofreading: The proof will be send by e-mail to the corresponding author in MS Word’s Track changes function. Corresponding author is required to make their proof corrections with accepting or rejecting the tracked changes in document and answer all open comments of proof reader. The corresponding author is responsible to introduce corrections of data in the paper. The Editors are not responsible for damage or loss of submitted text. Contributors are advised to keep copies of their texts, illustrations and all other materials.
The statements, opinions and data contained in this publication are solely those of the individual authors and not of the publisher and the Editors. Neither the publisher nor the Editors can accept any legal responsibility for errors that could appear during the process.
Copyright: Submissions of a publication article implies transfer of the copyright from the author(s) to the publisher upon acceptance of the paper. Accepted papers become the permanent property of “Journal of Energy Technology”. All articles published in this journal are protected by copyright, which covers the exclusive rights to reproduce and distribute the article as well as all translation rights. No material can be published without written permission of the publisher.
Chapter examples:
1 MAIN CHAPTER
(Arial bold, 12pt, after paragraph 6pt space)
1.1 Section (Arial bold, 11pt, after paragraph 6pt space)
1.1.1 Sub-section
(Arial bold, 10pt, after paragraph 6pt space)
Example of Equation (lined 2 cm from left margin, equation number in normal brackets (section.equation number), lined right margin, paragraph space 6pt before in after line):
Equation (1.1)
Tables should have a legend that includes the title of the table at the top of the table. Each table should be cited in the text.
Table legend example:
Table 1: Name of the table (centred, on top of the table)

JET 67
Paper title
Figures and images should be labelled sequentially numbered (Arabic numbers) and cited in the text – Fig.1 or Figure 1. The legend should be below the image, picture, photo or drawing.
Figure legend example:
Figure 1: Name of the figure (centred, on bottom of figure, photo, or drawing)
References[1] N. Surname: Title, Journal Title, Vol., Iss., p.p., Year of Publication
[2] N. Surname: Title, Publisher, Year of Publication
[3] N. Surname: Title [online], Publisher or Journal Title, Vol., Iss., p.p., Year of Publication. Available: website (date accessed)
Examples:
[1] J. Usenik: Mathematical model of the power supply system control, Journal of Energy Technology, Vol. 2, Iss. 3, p.p. 29 – 46, 2009
[2] J. J. DiStefano, A.R. Stubberud, I. J. Williams: Theory and Problems of Feedback and Con-trol Systems, McGraw-Hill Book Company, 1987
[3] T. Žagar, L. Kegel: Preparation of National programme for SF and RW management taking into account the possible future evolution of ERDO [online], Journal of Energy Technol-ogy, Vol. 9, Iss. 1, p.p. 39 – 50, 2016. Available: http://www.fe.um.si/images/jet /Volume 9_Issue1/03-JET_marec_2016-PREPARATION_OF_NATIONAL.pdf (7. 10. 2016)
Example of reference-1 citation: In text [1], text continue.
Nomenclature
(Symbols) (Symbol meaning)
t time

JET I Journal of Energy Technology I Vol. 13, Issue 3, N
ovember 2020 I U
niversity of Maribor, Faculty of Energy Technology
9 771855 574008
ISSN 1855-5748