Embed Size (px)
Citation preview

Volume 10 Number 1 September 2020
ABOUT JCPMI
The Journal of Construction Project Management and Innovation is published bi-annually
(twice per year) through the Sustainable Human Settlement and Construction Research Centre (SHSCRC) of the University of Johannesburg by the University of Johannesburg.
The Journal of Construction Project Management and Innovation is an open access journal that publishes all sorts of research on Construction project management; Project management; Design and construction management processes; Housing and infrastructure development; Stakeholder management; Project planning and project impact assessments; Design and implementation of labour-intensive projects; Procurement management; Management of construction companies; Industry development; Knowledge management in construction;
Empowerment of women; Innovation; Project financing; Current and emerging infrastructure issues in developing countries as well as other issues. The goal of JCPMI is to broaden the knowledge of construction professionals and academicians by promoting free access and providing valuable insight to construction-related information, research and ideas. JCPMI is a bi-annual publication and all articles are peer-reviewed.
Submission of Manuscripts
Manuscript submission can be done using the link https://journals.uj.ac.za/index.php/JCPMI/login
For all other correspondence that cannot be sent by email, please contact the editorial office ([email protected], [email protected], [email protected]).
The Journal of Construction Project Management and Innovation will only accept manuscripts submitted online. Please read the Instructions for Authors before submitting your manuscript.
Editors-in-Chief
Prof. Wellington Didibhuku Thwala Professor of Construction Management Department of Construction Management and Quantity Surveying Faculty of Engineering and the Built Environment University of Johannesburg South Africa
Prof. Clinton Ohis Aigbavboa Professor of Sustainable Human Settlement Department of Construction Management and Quantity Surveying Faculty of Engineering and the Built
Environment University of Johannesburg South Africa
Deputy Editors
Dr Zakari Mustapha Cape Coast Technical University, Cape Coast, Ghana
Dr Ayodeji Oke Federal University of Technology, Akure, Ondo State, Nigeria
Dr Titus Kwofie Kwame Nkrumah University of Science and Technology
Dr Douglas Aghimien University of Johannesburg, Johannesburg, South Africa
Editorial Board Prof. Peter Love Curtin University, Australia
Prof. Albert P.C. Chan The Hong Kong Polytechnic University, Hong Kong
Prof. Charles Egbu University of Salford, United Kingdom
Prof. Nicholas Chileshe University of South Australia, Australia
Prof. David Carmichael University of New South Wales, Australia
Prof. Scott Fee Minnesota State University, USA
Prof. A.C. Ogbonna Federal University of Technology, Akure, Nigeria
Dr E. Adinyira Kwame Nkrumah University of Science and Technology, Kumasi, Ghana
Dr David Daw North West University, South Africa
Prof. Joshua Ayarkwa Kwame Nkrumah University of Science and Technology, Kumasi, Ghana
Dr Geraldine Kikwasi Ardhi University, Tanzania
Dr De-Graft Owusu-Manu Kwame Nkrumah University of Science and Technology, Ghana
Prof. Frank Fugar Kwame Nkrumah University of Science and Technology, Kumasi, Ghana
Dr Lindile Ndabeni Tshwane University of Technology, South Africa
Prof. Alfred Talukhaba Tshwane University of Technology Pretoria, South Africa Dr Jian Zuo University of South Australia, Australia
Prof. Hamimah Adnan University Teknologi Mara, Malaysia
Prof. Jun Ying Liu Tianjin University, China
Prof. Low Sui Pheng National University of Singapore, Singapore
Dr Monty Sutrisna University of Salford, United Kingdom
Prof. John Smallwood Nelson Mandela Metropolitan University Port Elizabeth, South Africa
Prof. Christopher Harty University of Reading United Kingdom
Prof. Miklos Hajdu Szent István University Hungary

Editorial Policy and Submission Guidelines
Overview
As part of the process of ensuring quality, the Journal of Construction Project Management and Innovation (JCMPI) Editors subscribe to the open-access publishing code of the Academy of Science of South Africa (ASSAf).
Only papers with a clear focus on construction project management and innovations with relevance to the built environment are and will be published in the journal.
The JCPMI is an open-access journal that publishes research scholarly work on construction project management; project management; design and construction management processes; housing and infrastructure development; stakeholder management; project planning and project impact assessments; design and implementation of labour-intensive projects; procurement management; management of construction companies; industry development; knowledge management in construction; empowerment of women; innovation; project financing; current and emerging infrastructure issues in developing countries as well as other issues. The goal of the JCPMI is to broaden the knowledge of construction professionals and academicians by promoting free access and providing valuable insight to construction-related information, research and ideas.
The journal strives to ensure diversity in its publication by ensuring papers from different countries are represented in each issue and volume published.
Authors are encouraged to submit scholarly articles, review articles, practical library work, short communications, book reviews or letters to the editor.
Items that have been published elsewhere should be submitted only with permission of the original publisher, and this should be clearly indicated and the improvement to such publication annotated for ease of reference.
Editing Procedure (Peer Review Policy)
All submitted manuscripts are reviewed by an editor and members of the Editorial Board or at least two qualified outside reviewers. Authors cannot nominate reviewers. Only reviewers selected from the journal’s database with specialization in the subject area will be contacted to evaluate the manuscripts.
The review process will be double-blind review.
The feedback from reviewers is checked and reviewed by the journal editor assigned to the manuscript to ensure quality and relevance of the review comments, while all final review communications are sent to the authors by the Editor-in-Chief.
In submitting a revised manuscript, authors are mandated to submit a report detailing how they have responded to the reviewers’ comments. The journal editor checks to ensure that all recommended changes for
improvement of the article have been substantively attended to before initiating a follow-up blind reviewer process. After the peer reviewers have read and evaluated the manuscript, one of the following three recommendations for publication is made:
• Accept the manuscript for publication with minor revisions.
• Accept the manuscript for publication with major revisions.
• Reject the manuscript for publication.
After the editor receives the peer reviewers’ recommendations, they are forwarded to the author, who will then perform the necessary revisions and submit a new draft within a time frame determined by the editor. The editor then reviews the final draft to determine whether the manuscript is ready for publication, or if it requires further peer review. Once a manuscript is ready for publication, it is forwarded to the copy editor who will review the manuscript to correct spelling, punctuation, and grammatical errors, and to ensure that the text adheres to JCPMI’s formatting and style guidelines. Once the copy editor’s work is done, the managing editor performs a final review of the manuscript and publishes it.
It is the goal of the JCPMI to publish manuscripts within the shortest possible time after submission.
By submitting a manuscript to JCPMI, authors agree that journal editors have the right to check their manuscript via iThenticate. However, it is the responsibility of authors to check their papers for any plagiarism issue before submitting to the journal. But all submitted papers are by default checked for plagiarism using iThenticate on the OJS platform. Should the editors detect potential plagiarism issues, the paper will be temporarily suspended and send back to the authors.
Conflict of Interest Statement
The Editors-in-Chief are allowed to publish papers occasionally in the journal. Such publication must be relevant to the built environment, and the full review process should be followed and managed by one of the deputy editors. Similarly, the Deputy Editors are allowed to publish papers occasionally in the journal. Such publication must be relevant to the built environment and the full review process should be followed and managed by one of the Editors-in-Chief.
Copyright Policy
Authors who publish in the Journal of Construction Project
Management and Innovation agree to the following terms:
Authors retain copyright and grant the journal right of first publication with the work and allows others to share the work with an acknowledgement of the work’s authorship and initial publication in this journal.
Submission of a manuscript to JCPMI implies that the work described has not been published before (except in the form of an abstract or as part of a published lecture, or thesis); that it is not under consideration for publication elsewhere; that if and when the manuscript is accepted for publication, the author(s) still hold the copyright and retain publishing rights without restrictions. Authors or others are allowed to multiply the article as long as it is not for commercial purposes. Any use and or copies of this journal in whole or in part must include the customary bibliographic citation, including author attribution, date and article title.
Errata
All articles published in JCPMI are subject to an editorial review process. On acceptance, electronic proofs will be sent (email attachment) to the corresponding author as a PDF file. Page proofs are considered to be the final version of the manuscript. With the exception of typographical or minor clerical errors, no changes will be made in the manuscript at the proof stage. After publication, authors who notice any error must contact the Journal Manager who will determine the impact of the change and decide the necessary line of action to be taken.
Submission Guidelines
See guidelines:
https://journals.uj.ac.za/index.php/JCPMI/about/s
ubmissions
Institutional Affiliation
JCPMI is an institutional journal, and editors are accountable to the University of Johannesburg.
JCPMI is published bi-annually (twice per year) through the Sustainable Human Settlement and Construction Research Centre (SHSCRC) of the University of Johannesburg by the University of Johannesburg
JCPMI is an open-access journal, and pdf versions of all papers are available on the journal website https://journals.uj.ac.za/index.php/JCPMI/login
JCPMI is accredited by the South African Department of Higher Education and Training, and the journal editors will continue to seek and maintain the quality standards necessary for ongoing accreditation.
Instructions for Authors
Electronic submission of manuscripts is strongly encouraged, provided that the text, tables, and figures are included in a single Microsoft Word file (preferably in Arial font).
The cover letter should include the corresponding
author's full address and telephone/fax numbers and should be in an email message sent to the Editor, with the file, the name of which should begin with the first author's surname, as an attachment.
Article Types
Three types of manuscripts may be submitted:
Regular Articles
All portions of the manuscript must be typed 1.5 spacing, and all pages numbered starting from the title page. The font size must be 12.
Regular Articles
These should describe new and carefully confirmed findings, and experimental procedures should be given in sufficient detail for others to verify the work. The length of a full paper should be the minimum required to describe and interpret the work clearly. The length of a full paper should be between 4000 – 7000 words.
Review Process
Short Communications
A short communication is suitable for recording the results of complete small investigations or giving details of new models or hypotheses, innovative methods, techniques or apparatus. The style of main sections need not conform to that of full-length papers. Short communications are 2 to 4 printed pages (about 6 to 12 manuscript pages) in length.
Reviews
Submissions of reviews and perspectives covering topics of current interest are welcome and encouraged. Reviews should be concise and no longer than 4-6 printed pages (about 12 to 18 manuscript pages). Reviews are also peer-reviewed.
Review Process
All manuscripts are reviewed by an editor and members of the Editorial Board or qualified outside reviewers. Authors cannot nominate reviewers. Only reviewers randomly selected from our database with specialization in the subject area will be contacted to evaluate the manuscripts. The process will be blind review. Decisions will be made as rapidly as possible, and the journal strives to return reviewers’ comments to authors as quickly as possible. The editorial board will re-review manuscripts that are accepted pending revision. It is the goal of the JCPMI to publish manuscripts within the shortest possible time after submission.
Regular Articles
All portions of the manuscript must be typed in double spacing and all pages numbered, starting from the title page.
The Title should be a brief phrase describing the contents of the paper. The Title Page should include the authors' full names and affiliations, the name of the corresponding author along with phone, fax and email information. Present addresses of authors should appear as a footnote.
The Abstract should be informative and completely self-explanatory, briefly presenting the topic, stating the scope of the experiments, indicating significant data, and pointing out major findings and conclusions. The Abstract should be 100 to 300 words in length. Complete sentences, active verbs, and the third person should be used, and the abstract should be written in the past tense. Standard nomenclature should be used and abbreviations should be avoided. No literature should be cited. Following the abstract, about 3 to 10 key words that will provide indexing references should be listed.
A list of non-standard Abbreviations should be added.
In general, non-standard abbreviations should be used only when the full term is very long and used often. Each abbreviation should be spelled out and introduced in parentheses the first time it is used in the text.
The Introduction should provide a clear statement of the problem, the relevant literature on the subject, and the proposed approach or solution. It should be understandable to colleagues from a broad range of scientific disciplines.
Materials and methods should be complete enough to
allow experiments to be reproduced. However, only truly new procedures should be described in detail; previously published procedures should be cited, and important modifications of published procedures should be mentioned briefly. Capitalize trade names and include the manufacturer's name and address. Subheadings should be used. Methods in general use need not be described in detail.
Results should be presented with clarity and precision.
The results should be written in the past tense when describing findings in the authors’ experiments. Previously published findings should be written in the present tense. Results should be explained, but largely without referring to the literature. Discussion, speculation and detailed interpretation of data should not be included in the Results but should be put into the Discussion section.
The Discussion should interpret the findings in view of
the results obtained in this and in past studies on this topic. State the conclusions in a few sentences at the end of the paper. The Results and Discussion sections can include sub-headings, and when appropriate, both sections can be combined.

The Acknowledgments of people, grants, funds, etc. should be brief.
Tables should be kept to a minimum and be designed to be as simple as possible. Tables are to be typed in double-spacing throughout, including headings and footnotes. Each table should be on a separate page, numbered consecutively in Arabic numerals and supplied with a heading and a legend. Tables should be self-explanatory without reference to the text. The details of the methods used in the experiments should preferably be described in the legend instead of in the text. The same data should not be presented in both table and graph form or repeated in the text.
Figure legends should be typed in numerical order on a separate sheet. Graphics should be prepared using applications capable of generating high resolution GIF, TIFF, JPEG or PowerPoint before pasting in the Microsoft Word manuscript file. Tables should be prepared in Microsoft Word. Use Arabic numerals to designate figures and upper-case letters for their parts (Figure 1). Begin each legend with a title and include sufficient description so that the figure is understandable without reading the text of the manuscript. Information given in legends should not be repeated in the text.
References: In the text, a reference identified by means of an author‘s name should be followed by the date of the reference in parentheses. When there are more than two authors, only the first author‘s name should be mentioned, followed by ’et al ‘. In the event that an author cited has had two or more works published during the same year, the reference, both in the text and in the reference list, should be identified by a lower case letter like ’a‘ and ’b‘ after the date to distinguish the works.
Examples:
Aigbavboa (2012), Aigbavboa et al. (2012), (Thwala, 2000), (Aigbavboa and Thwala, 2012), (Aigbavboa, 2008; Lesito, 2007a, b; Aigbavboa, 2010, 2011), (Thwala et al., 2001)
References should be listed at the end of the paper in alphabetical order. Articles in preparation or articles submitted for publication, unpublished observations, and personal communications should not be included in the reference list but should only be mentioned in the article text (e.g., A. Kingori, University of Nairobi, Kenya, personal communication). Journal names are abbreviated according to Chemical Abstracts. Authors are fully responsible for the accuracy of the references.
Examples:
Aigbavboa CO (2010). Residential satisfaction in low-income housing: a South Africa perspective. Journal of Construction Project Management and Innovation. 1(2): 14 – 20.
Aigbavboa CO, Lesito K (2012). ICT benefit in South Africa Construction Journal of Construction Project Management and Innovation. 2(2): 75 – 81.
Short Communications
Short Communications are limited to a maximum of two figures and one table. They should present a complete study that is more limited in scope than is found in full-length papers. The items of manuscript preparation listed above apply to Short Communications with the following differences: (1) Abstracts are limited to 300 words; (2) instead of a separate Materials and Methods section, experimental procedures may be incorporated into Figure Legends and Table footnotes; (3) Results and Discussion should be combined into a single section.
Proofs and Reprints: Electronic proofs will be sent (email attachment) to the corresponding author as a PDF file. Page proofs are considered to be the final version of the manuscript. With the exception of typographical or minor clerical errors, no changes will be made in the manuscript at the proof stage.
Fees and Charges
No fee is paid for the publication of article(s) in
JCPMI. Authors’ submissions are only required
to meet the peer review process.
Copyright: © 2018, Sustainable Human Settlement and Construction Research Centre and the Department of Construction Management and
Quantity Surveying, University of Johannesburg.
All rights reserved. In accessing this Journal, you agree that you will access the contents for your own personal use but not for any commercial use. Any use and or copies of this Journal in whole or in part must include the customary bibliographic citation, including author attribution, date and article title.
Submission of a manuscript implies: that the work described has not been published before (except in the form of an abstract or as part of a published lecture, or thesis); that it is not under consideration for publication elsewhere; that if and when the manuscript is accepted for publication, the authors agree to automatic transfer of the copyright to the publisher.
Disclaimer of Warranties
In no event shall the management of the Journal of Construction Project Management and Innovation be liable for any special, incidental, indirect, or consequential damages of any kind arising out of or in connection with the use of the articles or other material derived from the JCPMI, whether or not advised of the possibility of damage, and on any
theory of liability.
This publication is provided “as is” without warranty of any kind, either expressed or implied, including, but not limited to, the implied warranties of merchantability, fitness for a particular purpose, or non-infringement. Descriptions of, or references to, products or publications does not imply endorsement of that product or publication. While every effort is made by JCPMI management to see that no inaccurate or misleading data, opinion or statements appear in this publication, they wish to make it clear that the data and opinions appearing in the articles and advertisements herein are the responsibility of the contributor or advertiser concerned. JCPMI management makes no warranty of any kind, either express or implied, regarding the quality, accuracy, availability, or validity of the data or information in this publication or of any other
publication to which it may be linked.
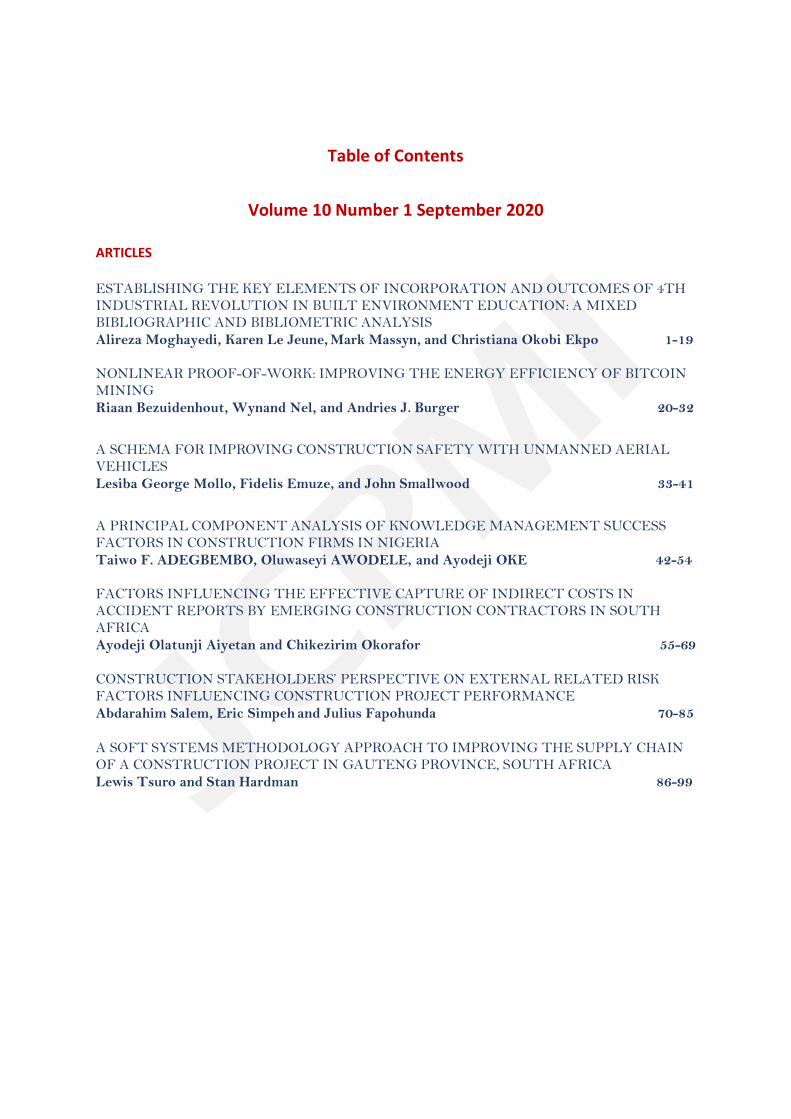
Table of Contents
Volume 10 Number 1 September 2020
ARTICLES
ESTABLISHING THE KEY ELEMENTS OF INCORPORATION AND OUTCOMES OF 4TH INDUSTRIAL REVOLUTION IN BUILT ENVIRONMENT EDUCATION: A MIXED BIBLIOGRAPHIC AND BIBLIOMETRIC ANALYSIS
Alireza Moghayedi, Karen Le Jeune, Mark Massyn, and Christiana Okobi Ekpo 1-19
NONLINEAR PROOF-OF-WORK: IMPROVING THE ENERGY EFFICIENCY OF BITCOIN MINING
Riaan Bezuidenhout, Wynand Nel, and Andries J. Burger 20-32
A SCHEMA FOR IMPROVING CONSTRUCTION SAFETY WITH UNMANNED AERIAL VEHICLES
Lesiba George Mollo, Fidelis Emuze, and John Smallwood 33-41
A PRINCIPAL COMPONENT ANALYSIS OF KNOWLEDGE MANAGEMENT SUCCESS FACTORS IN CONSTRUCTION FIRMS IN NIGERIA
Taiwo F. ADEGBEMBO, Oluwaseyi AWODELE, and Ayodeji OKE 42-54 FACTORS INFLUENCING THE EFFECTIVE CAPTURE OF INDIRECT COSTS IN ACCIDENT REPORTS BY EMERGING CONSTRUCTION CONTRACTORS IN SOUTH AFRICA
Ayodeji Olatunji Aiyetan and Chikezirim Okorafor 55-69
CONSTRUCTION STAKEHOLDERS’ PERSPECTIVE ON EXTERNAL RELATED RISK FACTORS INFLUENCING CONSTRUCTION PROJECT PERFORMANCE
Abdarahim Salem, Eric Simpeh and Julius Fapohunda 70-85
A SOFT SYSTEMS METHODOLOGY APPROACH TO IMPROVING THE SUPPLY CHAIN OF A CONSTRUCTION PROJECT IN GAUTENG PROVINCE, SOUTH AFRICA
Lewis Tsuro and Stan Hardman 86-99
Journal of Construction Project Management and Innovation, 10 (1): 1-19, 2020
ISSN 2223-7852 © Sustainable Human Settlement and Construction Research Centre DOI: https://doi.org/10.36615/jcpmi.v10i1.350
1
ESTABLISHING THE KEY ELEMENTS OF INCORPORATION AND OUTCOMES OF 4TH
INDUSTRIAL REVOLUTION IN BUILT ENVIRONMENT EDUCATION: A MIXED
BIBLIOGRAPHIC AND BIBLIOMETRIC ANALYSIS
Alireza MOGHAYEDI1, Karen LE JEUNE2, Mark MASSYN2 and Christiana Okobi EKPO4
1,2,3&4Department of Construction Economics and Management, University of Cape Town,
Cape Town, South Africa, 7700
Email: [email protected]; [email protected]; [email protected];
ABSTRACT The rapid, exponential fusion of technologies which profoundly disrupts all industries and processes is commonly described as the Fourth Industrial Revolution (4th IR). The Built Environment (BE) sector has long been overdue for radical transformation that is symphonious with global trends. Consequently, how to incorporate 4th IR in BE education remains challenging. This research aims to establish what educational methods, context, tools, and technological pedagogy are required and should be adopted, as well as what the effects and outcomes can be expected from the incorporation of the 4th IR concepts in BE education. The rationale for this research stems from the aspiration to meet the United Nation Sustainable Development Goals, which advocate that young people need to be "future-ready" and this includes digital fluency and ICT literacy. The study utilised a verifiable and reproducible systematic literature review of digital education; with analysis and scrutiny of 582 academic articles for the co-occurrence of keywords, using a mixed bibliographic and bibliometric method. Through clustering analysis based on the bibliometric method, the key elements, outcomes, and their interconnections of incorporating 4th IR in BE education were outlined. The paper revealed that, in adopting 4th IR, Higher education, Design, Innovation and Privacy appear to be the predominant context. Distance education, Collaborative learning and Digital learning are the foremost education methods. Digital technologies, Virtual reality and cloud computing are the most significant education tools and technology elements. Sustainable education, Ethical learning and Student engagement are the resultant primary outcomes of incorporating 4th IR in built environment education. In addition, the results of the interconnections of indicators analysis revealed Higher education, Distance education and Sustainable education are significantly intertwined with Digital technologies. Based on the taxonomy of key elements and outcomes and the analysis of their interconnections, a conceptual framework for adopting 4th IR in built environment education was developed. Keywords: 4th Industrial revolution, Built Environment, Education, Key elements, Outcomes
1. INTRODUCTION The Built Environment (BE) collectively describes products and processes of human creation (Mazumdar et al., 2018), and the environments with which people interact most directly, are often the products of human-initiated processes (Haig & Amaratunga, 2010). There has been
Moghayedi et al. JCPMI, 10(1): 1-19
2
a rapid evolution in new technologies and project delivery methods in recent years, to address the inefficiencies that exist in the BE and the 4th Industrial Revolution (IR) and digitalised innovative technology have contributed significantly (Solnosky & Parfitt 2015). The implementation of 4th IR in the BE industry is meant to advance mechanized automation technological interconnectedness with operation and communication that encourages less humans’ involvement and further improves efficiency, saves time, and improves product quality (Alaloul et al, 2020). Walden, (2017) agrees that the advent of technology has increased in the rate of changes in the BE and plays an essential role in deciding the way forward for the industry. Unfortunately, even when technology progressively acts as a catalyst for change, the global BE industry is responding to it very slowly and is known for its poor track record in driving change (Whyte 2017). The BE industry has over time been on the slower end of adopting these new technologies (Whyte 2017). The BE industry shows hesitation in implementing these 4th IR concepts despite the numerous benefits it proffers in other industries (Alaloul et al, 2020). In order for the present and future generation to create and maintain pertinent labour forces there needs to be some modifications and convergence, then new techniques, awareness and expertise are required (Zabidin et al., 2019) to be able to compete in industry transformation, and the global industrial revolutionary vision. There is, therefore, a need for an education framework and a research base that supports the industry in digital technological transformation for both immediate and future learning for the integration of digital and innovation strategies (Whyte 2017).
Unlike other industries, no breakthrough on rudimental productivity has been achieved as most BE projects today operate almost identically as several decades ago (Foroughi Sabzevar et al., 2020). This is confirmed in results from many studies where the findings have shown similar challenges of systems inefficiencies, delays in construction, cost and time overruns that generally affect productivity. However, a profound shift is being observed in the role that automation and skills acquisition play in promoting improved productivity and economic progress, leading to the application of the term “industrial revolution” which is seen as the occurrence when changes in social, economic and technological industrial systems are driven by progressively advanced intelligent-scientific solutions (Dombrowski & Wagner, 2014). Parn and Edwards (2019) describes digital knowledge as both the engine and product of economic growth which the engineering and built environment industry apparently contributes to. Kozma, (2003) believes that the creation, distribution and application of new information and skills can contribute significantly to increased productivity and create very lucrative job opportunities as well. Bates (2016) also acknowledges that contemporary society appear to be technologically engrossed in the 4th IR concepts and consumed by the hype in a way that shows no sign of declining judging by the ready acceptance of the rapid rate of change and the fact that most knowledge-based activities depend heavily on their usage by society at large. However, Bates (2016) argues that educational institutions are largely not predisposed towards the current digital era even though uptake in technology is leading to massive changes in economies, communication, relationships and learning processes.
The more technological development increases and these trends progressively gain more momentum, practitioners and academia have realised that education on these topics is essential and in order to adopt these concepts, proper and well-tested courses and curriculum restructuring are required (Solnosky & Parfitt 2015). For this trend to particularly change in most parts of the world, Jacobs (2015) opines that higher education, as the bedrock for achieving most knowledge and skills, should be given corresponding attention to ensure that the sustainable digitalised technologies’ principles and concepts that meant to enhance knowledge, are embedded within the knowledge domain to further foster industrial transformation and enhance efficiency and productivity.
No concrete framework has been adopted to fill this gap in the literature. Therefore, this study, aims to identify the key elements of the 4th IR in BE education and develop a
Moghayedi et al. JCPMI, 10(1): 1-19
3
framework to assess the incorporation and impact of digitalised innovative technology in Engineering and built environment education. In an attempt to facilitate better integration of 4th IR and digitalised innovative technology into the built environment education, this study explores the current applications of 4th IR in education of the Built Environment through a mixed bibliographic and bibliometric analysis. The objective of this study is firstly to identify the current status of 4th IR and education adaptation through critical literature review. Secondly, this study further examines the application of 4th IR and outcomes as obtained from reviewed literature. Finally, the study develops a conceptual framework for adopting 4th IR to the built environment education by identified the key elements of incorporating 4th IR in built environment education and its outcomes.
2. LITERATURE REVIEW Higher educational institutions have been acknowledged for the significant role they play in providing the BE industry with innovatively well-equipped graduates (Jin et al., 2015). However, insufficiency still exists in most institutional education resources, and this poses a huge challenge to train the built environment students in order to meet industry needs in most parts of the world, where the industrial demand for professionals proficient at understanding innovative concepts is growing (Jin, et al. 2018; Jacobs, 2015). Consequently, developing the kinds of graduates from existing courses and programs that fit into the increasingly complex, ambiguous, volatile and uncertain future are required in the direction that can enable them to compete favourably in the BE market (Bates 2016).
Tertiary institutions are therefore obliged to respond to digitalised technology demands to equip students with 4th IR skills and competencies for the labour markets, thus requiring changes in the BE education (Bai et al., 2020; Philips 2017; Bates, 2016; Jacobs 2015). Inefficiencies that manifests in delays in planning, building and construction processes that cause cost and schedule overruns and further impact on efficiency and productivity in the BE industry are gradually being addressed, and the 4th IR education is being propagated as a partial way out. The 4th IR tools promise to reshape construction around the world and redefine projects’ lifecycle, drive productivity and efficiency for better outputs (Philips 2017; Foroughi Sabzevar et al., 2020). Bates (2016) suggests that the overall level of knowledge in 4th IR concepts are not adequate, that significant knowledge gaps exist and that there is a lack of relevant training to bridge the divide in digital innovative technological education.
2.1 Effects of 4th IR on Education The current trends in 4th IR are gaining more traction in education partly due to the way in which these trends impact education. Newman, (2017) argued that educators in most of the developed world have realised that lecture rooms are now made to simulate the workplace, and to encourage and create collaborative-friendly spaces that facilitate student learning. In comparison, a typical classroom across most parts of the developing world still comprises rows of desks, all pointing toward the front of the classroom or studio. The evolution from chalkboards to 21st-century smart boards in lecture rooms and smart desks in pod formation rather than individual seating ameliorates the transformation in educational technology (Newman, 2017). Han (2020) agrees that students are embarking on virtual field trips rather than merely just studying from books and are actively involved in creating educational media rather than just being ordinary spectators. The redesigned learning spaces are designed with integrated technology, which means students are not just using these facilities, but are engaging with the facilities and understanding how to apply and use the armamentarium in order to achieve targeted goals set primarily for the workplace.
Smith and Hu (2013) argue that the important skills needed for 4th IR such as systems thinking, computational literacy, creativity, empathy, and abstract reasoning, are difficult to
Moghayedi et al. JCPMI, 10(1): 1-19
4
teach, and therefore digitalised teaching tools such as Virtual reality (VR), which is an immersive, hands-on tool for learning among other tools, can play a unique role in addressing such BE educational challenges. Other tools such as Artificial Intelligence (AI) and Machine Learning, Computer-aided design (CAD), Computer-aided manufacture (CAM), Building Information Modelling (BIM), 3D-printing, Cloud-based computing and mobile applications are useful in the way these tools are not only improving teaching and learning pedagogy but the BE workforce too. The adoption of BIM, for instance, aids the incorporation of processes throughout the whole lifecycle of a construction project. BIM focuses on consistently creating and reusing digital information from all stakeholders in a project's lifecycle. It is useful in urban development planning and design as well as for enhancing safety, code checking, general construction, and many other benefits (Kamaruzaman et al., 2019). The BE industry is going through 4th IR paradigm shift in order to firstly improve; efficiency, productivity, quality, sustainability, and infrastructure value, and secondly reduce; lead times and lifecycle costs, via effective communication and collaboration of stakeholders in built environment projects (Bates, 2016).
A virtual world, for instance, offers the opportunity to create a virtual reality, which is typically a multi-user, computer-based environment in which users interact with one another through pre-programmed avatars or digital representations of the user (Philips 2017). It allows educators to have virtual excursions; take students to otherwise infeasible sites (Dunleavy & Dede, 2014). Science, medicine and maths departments in most institutions have particularly incorporated virtual environments but the adoption of VR is uncommon to the BE as yet. The successful application of VR in simulating medical procedures is adequately documented, because it permits errors and mistakes to be made with no adverse consequences to real-life patients. VR can be applied in the BE industry to avert construction disasters too. Through 4th IR education, engineering and BE disciplines are able to engage with real-life issues through virtual reality, for instance real estate students who can learn how to apply Geographical Information Systems (GIS) when identifying sales trends and prices in various geographical localities (Windapo & Moghayedi, 2019); Surveyors can use drones to access the topography and features on a site without necessarily being on-site; Architecture students can view the interior of their designs in the virtual world and make amendments to spaces and building components which appear not to be functional thus averting potential fatalities; mechanical engineers are be able to use robots to unblock blocked pipes and engineers can generally employ the use of digital technologies to simulate the construction and functioning of structures to understand how effective and applicable their ideas are in real-life (Moghayedi, 2019).
Historically, infrastructure projects have relied on 2D design and CAD work, and a large percentage of projects are still represented with 2D digital drawings. More recently, however, technology is being designed and utilised specifically for educational contexts, and it is changing the way students learn and understand things (Shvets & Nedviga, 2019). Cloud computing advancement in combination with mobile and social media are giving rise to cost-effective, concomitant and actual information being available; the application thereof in the property industry implies that some online leasing activities are taking place too. The latest technology to launch into the educational landscape is Augmented Reality (AR) which allows for digitised information to be overlaid on actual-world objects through mobile device camera like tablet or smartphone. In converse to virtual reality, where the real world is obscured, and the user is immersed in a fully digital yet life-like experience (Philips, 2017). In some educational uses of AR, the three-dimensional images, text, video or audio are induced to appear by a printed image.
Phillips’ (2017) research has shown that although innovative digital technology enhanced self-directed learning, there are still technological and pedagogical challenges such as slow response times, incompatible software and conflicting environmental settings that need to be overcome. An industrial revolution is known to shape work circumstances, life

Moghayedi et al. JCPMI, 10(1): 1-19
5
conditions and economic wealth. Skills development is a major area that is impacted and influenced, and thus is regarded as the most important key factor for the successful adoption and implementation of 4th IR (Periera & Romero, 2017). Khan and Khan (2018) assert that technology permeates the societal fibre of modern life and forms the basis for automatic data processing, telecommunications, photography and navigation, as well as manufacturing and finance. Innovation on the other hand “is an idea, practice or object that is perceived as new by an individual or the unit adopting it” (Khan & Khan, 2018). Philip (2017) espouses that a societal shift has occurred caused by digital automations in the BE industry, which embodies a set of tools that utilise and control digital data to enhance, deliver and operate the construction and built environment. In considering AR, VR and Mixed Reality (MR), for instance, Newman, (2017) argues that these are exemplary examples of transformative technology that can help to improve teacher instruction while concurrently creating enticing lessons that engage students as it makes learning exciting, collaborative, interactive and fun.
VR, for instance, has been able to connect the outside world with the classroom and vice versa and has the capability to enhance technological and visual literacy as well as hold the attention of the audience for longer, which when all three are achieved, results in beneficial learning (Schrock, 2014; Newman, 2017). The digital technology devices used in 4th IR education have undoubtedly improved collaboration and knowledge transferral within the educational domain as well as the building team and stakeholders in the BE industry (Desjardins & Bullock, 2019). Research is also beginning to provide propitious illustrations of how, when and where the 4th IR technologies may conform to the pedagogical collection of educators (Newman, 2017). Therefore, not only are students more motivated, but collaboration is improved, and knowledge construction is promoted through enhanced classroom study practices which engage with all these devices (Dunleavy & Dede, 2014).
2.2 Challenges of 4th IR Incorporation in Built Environment Education Educators in most parts of the world face major challenges as a result of the paradigm shift to 4th IR era (Wadhera, 2016). They are challenged with the mammoth task of finding contemporary approaches that enhance learning experiences and academic performance of current and future students. Experiential teaching and learning that involve multisensory activities require educators to embrace and leverage better teaching delivery methods that allow for the most effective learning experiences (Hernandez-de-Menendez & Morales-Menendez, 2019). Digital technological teaching devices and methods offer wide application of learning possibilities for improved education. This has caused an increasing interest among the BE authorities and educators to integrate 4th IR innovative technologies and concepts into degree programmes (Abdirad & Dossick 2016). Much is known about the current strategies that degree programmes aspire to and the instructors implement in their curricula, as well as the challenges they faced, and the educational outcomes envisaged by BE disciplines. However, so far, no study has critically combined existing knowledge and findings with the implications of 4th IR in BE education (ibid). In response to the 4th IR disruption, the BE industry and academia around the world should realise that embedding 4th IR knowledge and skills, principles and concepts through innovative education pedagogies in university curricula is an important requirement to satisfy educational demands of the contemporary BE industry. This is because many challenging constraints exist that hinder resources acquisition thus promoting systems’ inefficiencies and unproductivity in the BE industry thus increasing the need for effective and sustainable architecture, construction and project management solutions amidst urban pressures (Clevenger et al., 2017). The increasing inadequacy in knowledge and skill acquisition of 4th IR and innovative digitalised concepts among most lecturers and students alike directly reflects in the inefficient, imprudent execution and implementation of projects – by modern standards - in the BE industry (Jacobs 2015). These inadequacies are attributed to a lack in corresponding, relevant education that is needed to unlock the potential in BE professionals
Moghayedi et al. JCPMI, 10(1): 1-19
6
via education, and seen as a major barrier to progress (Bai et al., 2020; Bates, 2016; Jacobs; 2015; Shafii, Ali & Othman, 2006). Designers, Construction engineers and property developers often make decisions that impact on the environment and society (Clevenger et al., 2017) and ability to make well-informed, holistically viable contributions depends on the type of acquired knowledge that informs them. Hwang (2019) expresses concern about ignoramuses seeking ways to proffer sustainable solutions on how to adopt technologies that strive for efficiency and optimisation that can improve, low levels of productivity, efficient and cost-effective work methods.
Schilling and Shankar (2019) argue that technologies, which were initially reserved only for very expensive industries like the oil and gas and aerospace sectors, are presently becoming more accessible and affordable to a much broader range of professionals as the technology prices decrease. The BE education sector needs to take advantage of this. It is, however, noted that BE education, unfortunately, is one of the last industries to make an extensive change, holding on to the classical methods and practices (Philips, 2017). Nevertheless, the 4th IR and digital transformation are helping to change the tide through technology education, and educators have begun making drastic changes to their pedagogy, assessments methods, even the physical architecture of their classrooms (ibid).
2.3 Key Elements 4th IR Conceptual Framework In very broad terms, 'digital' refers to data or signals that are expressed by the digits 0 and 1. Digital technology describes networks, structures, tools and operations and processes that utilise digital data or signals to attain a specific user-defined results. Digital technology unveils economic and social opportunities revealed in the paradigm shift experienced in labour structures, business models and production technology due to the 4th IR. (Windapo & Moghayedi, 2020). The 4th IR or Industry 4.0, according to Periera and Romero, (2017) is an automated system that effectuates the latest developments that align with future smart technology. It connects the physical and digital worlds through the Cyber-Physical Systems (CPS) technology, sparking future industrial advancements that create improved efficiency and productivity among companies that are oriented towards the paradigm change (Schmidt et al., 2015). What then is 4th IR education all about and what are the key elements that need to be incorporated in BE education and what will be the outcomes – these are the questions that this study seeks to answer.
Bates (2016), reveals that knowledge includes two cogently fused but different constituents, namely “content” and “skills”. Content involves principles, facts, evidence, ideas, and descriptions of processes or procedures, and skills, on the other hand, involves efficiency, experience, abilities, prowess, and ingenuity in what one is doing. How much of these do university education offer? Bates (2016) agrees that most University instructors are correctly equipped with knowledge and well-grounded in content and have a deep comprehension of the subject areas they teach. Neither is the problem the educators’ ability to help students develop skills and talents, but rather, the concern lies with contemporaneity of their intellectual expertise to match the needs of knowledge-based workers, and whether enough emphasis is paid to skills development within BE education (Bates 2016). Thus, educators and instructors are faced with a massive but vital challenge to incorporate the ideals of the 4th IR and digital technologies in BE educational systems in most parts of the world in order to enhance knowledge and transform the construction and BE.
Educational institutions have to consider the transformation of the approaches in the way they work and teach in order to fit in with 4th IR (Newman, 2017). OECD 2018’s report on ‘Future of Education and Skills 2030: Conceptual Learning Framework ’ concludes that; digital literacy is now a fundamental learning objective, which includes information handling skills, and the capacity to judge its relevance and reliability, and the switch to open, skills-based, student-centred approaches in the education system supported by ICT will ensure the

Moghayedi et al. JCPMI, 10(1): 1-19
7
4th IR is inculcated in schooling, teaching and learning across the board (Taguma et al., 2018).
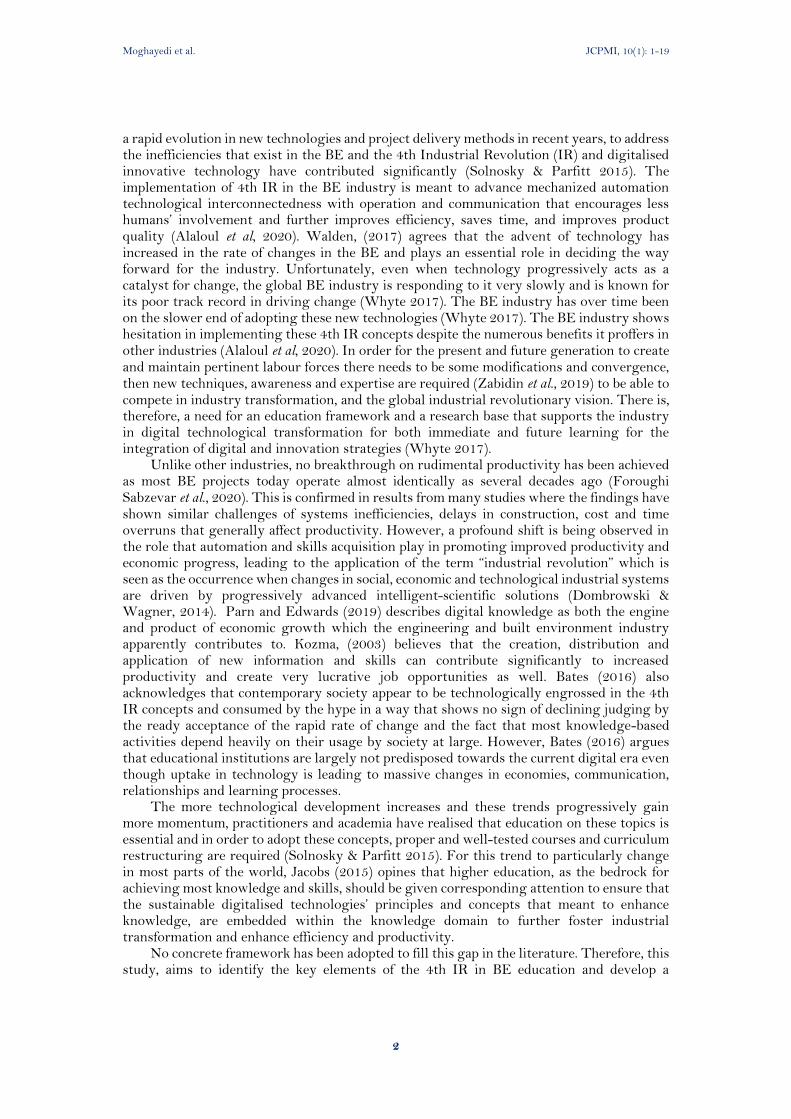
3. RESEARCH METHODOLOGY 3.1 3.1 Keywords, Databases, and Inclusion Criteria This section aims to elucidate the methodological approach that forms the basis of this study. It is fundamental to have an indication of the main characteristics that define this research, prior to defining and applying any research method, to which end, Figure 1 illustrates the adopted methodological framework applied to this bibliometric research. The main goal of the study is to identify the key elements of 4th IR that need to be incorporated in BE education and what the expected outcomes should be. By developing a comprehensive bibliographical control structure, it has been understood that the potential results achieved through this method has the capacity to address all the concerns raised in this study. The bibliometric research approach of this research comprises four phases, and embodies; the establishment of a keyword database, ascertainment of the bibliographic database to include in the study, conducting the document search and finally, analysing the resultant literature sample. The desktop data collection was conducted during the month of June 2020.
Figure 1. Adopted methodological framework
3.2 Keyword Database Establishment and Bibliographic Database Selection The initial step in the bibliometric analysis was the establish a keyword database which would be applied in the bibliographic databases. This enabled the researchers to find publications potentially related to the themes under study. Reflecting on this, the authors determined that the following keywords would be used, namely, Digital Technology/Technologies, Education, and Built Environment. The study considered document titles, abstracts and author keywords. Two major bibliographic databases, namely Scopus and Web of Science, were used to search for pertinent documents, thus ensuring that the majority of all relevant publications would be included in the keyword search. Together, the keyword database establishment phase and the bibliographic database selection phase of the research, demarcate the boundaries of the study, considering that the resultant portfolio
Methodological
Framework
Research Goal Research logic Research Process Research ResultsResearch
ProceduresInstruments
Goal NatureArticles
Nature
Exploratory
Descriptive
Explanatory
Theoretical Practical
Conceptual
Illustrative
Applied
Conceptual
Case Study
Survey
Experimental
Deductive
Inductive
Data
Gathering
Primary
Data
Secondary
Data
Both
Problematics
Approach
Qualitative
Quantitative
Mixed
Applied
Basic
Bibliographic
Research
Documental
Research
Experimental
Research
Survey
Case Study
Action
Research
Participatory
research
MS Excel
Matlab
Gephi
Moghayedi et al. JCPMI, 10(1): 1-19
8
of publications compiled after the document search is conducted, could be viewed as the definitive reference list for the topics under study.
3.3 Document Search bibliometric study further considered specific parameters, namely subject topic and document types. The results were limited to the Computer Science, Education science, Social Science, Environmental and Engineering subjects, and although the documents in the research results were limited to the Final peer-review conference processing and journal articles published in English only, there was no restriction on the date of publication of the documents. As the next step, it was feasible to combine the results from the two databases (Scopus 301 documents and Web of Science 427 documents). After re-evaluating the alignment of the titles and keywords of the resultant 728 documents to the research theme, 146 articles were excluded, leaving the authors with a portfolio of 582 relevant articles.
4. DATA ANALYSIS The following criteria were used to analyse the publications’ portfolio:
• Trend of publications over time • Publication “Country of Origin” analysis • Keyword analysis • Keyword clustering analysis • Interconnection analysis
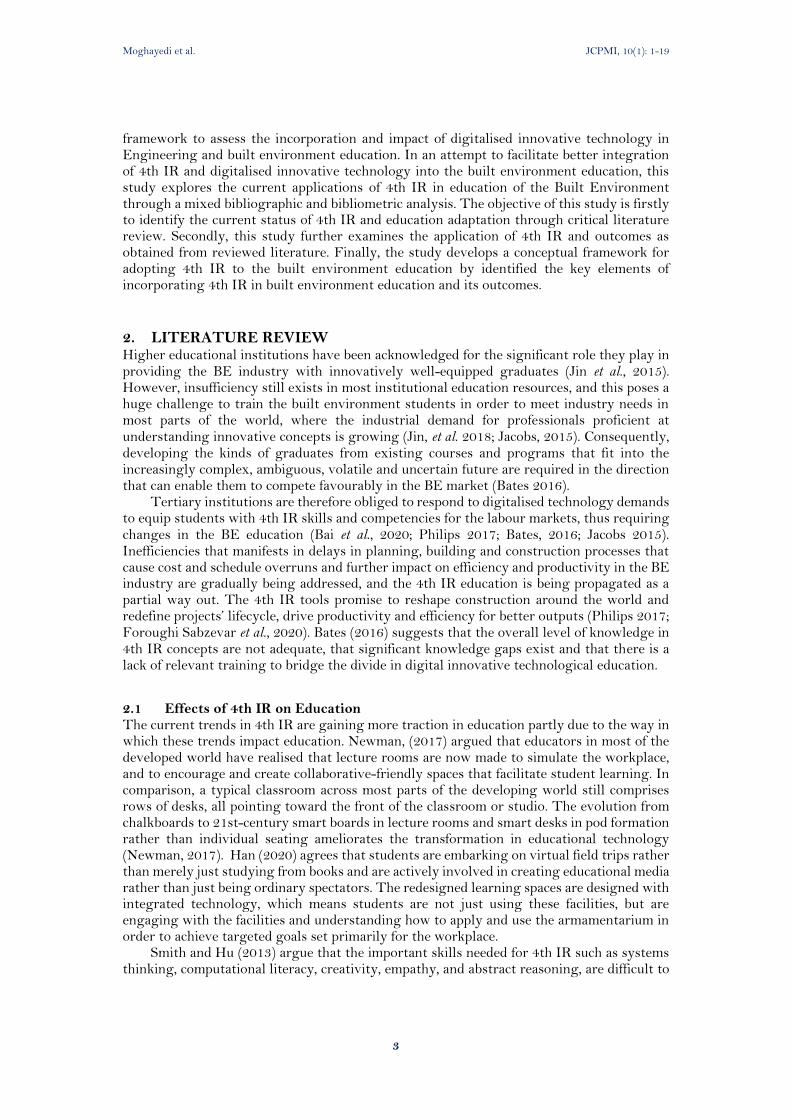
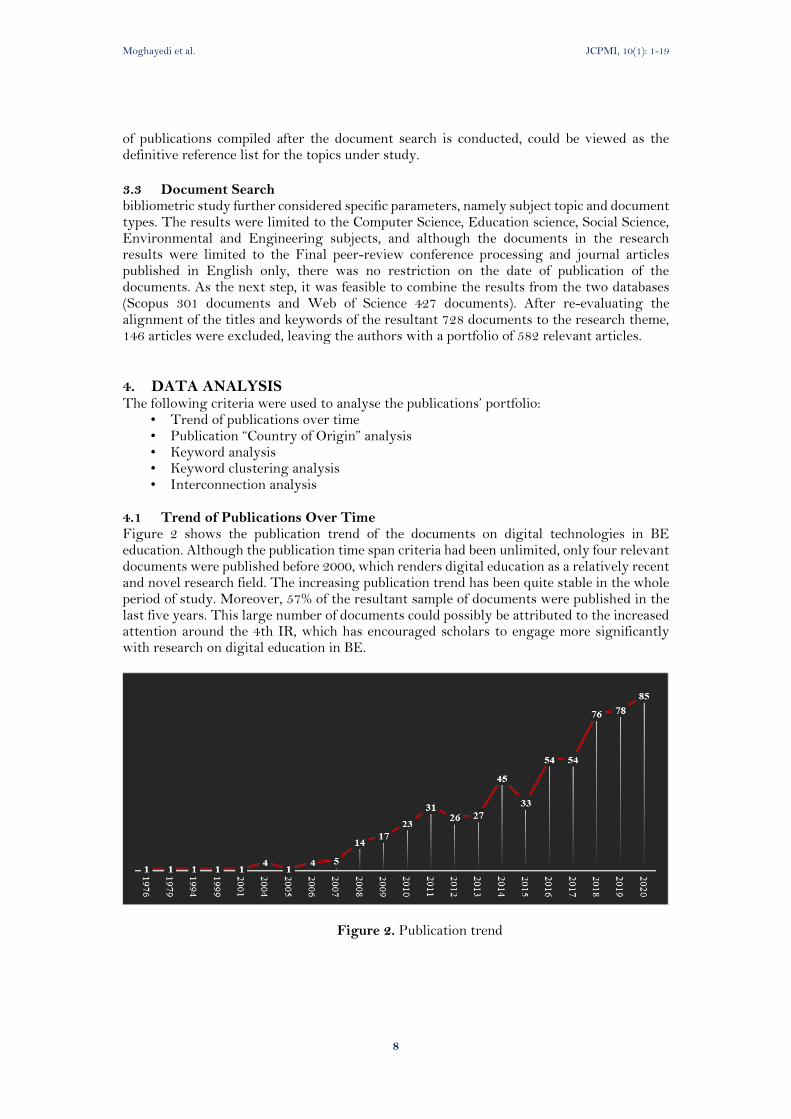
4.1 Trend of Publications Over Time Figure 2 shows the publication trend of the documents on digital technologies in BE education. Although the publication time span criteria had been unlimited, only four relevant documents were published before 2000, which renders digital education as a relatively recent and novel research field. The increasing publication trend has been quite stable in the whole period of study. Moreover, 57% of the resultant sample of documents were published in the last five years. This large number of documents could possibly be attributed to the increased attention around the 4th IR, which has encouraged scholars to engage more significantly with research on digital education in BE.
Figure 2. Publication trend
Moghayedi et al. JCPMI, 10(1): 1-19
9
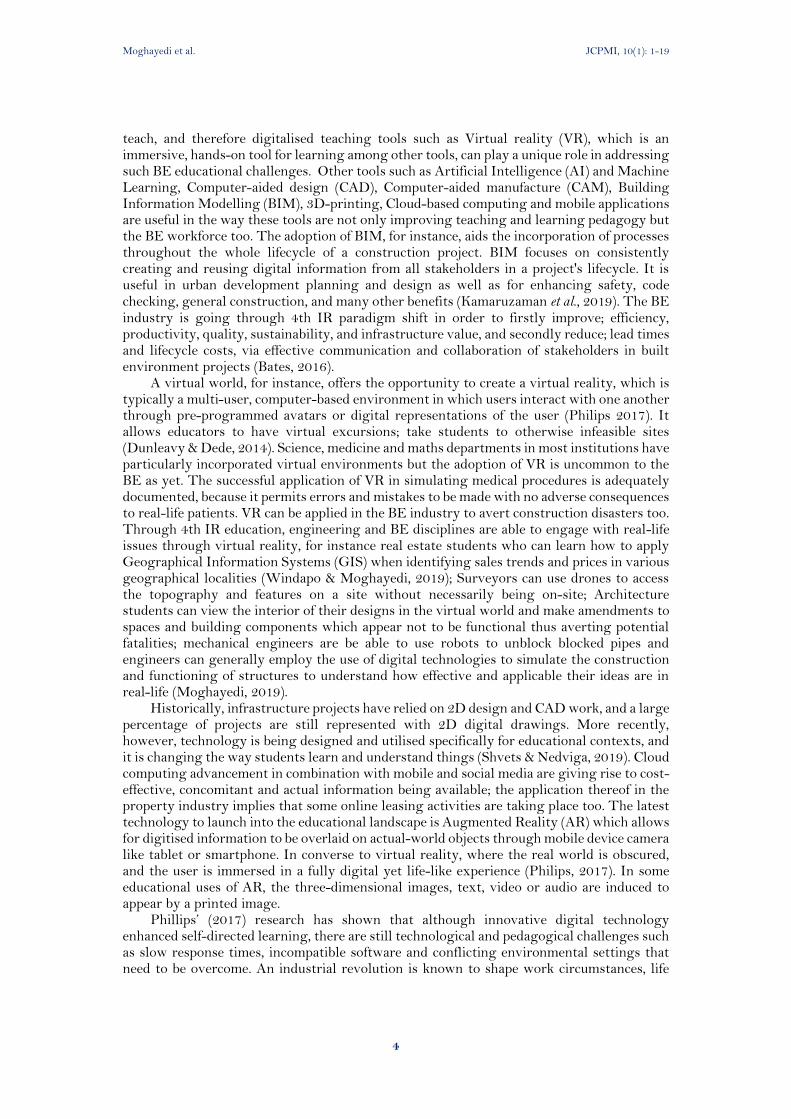
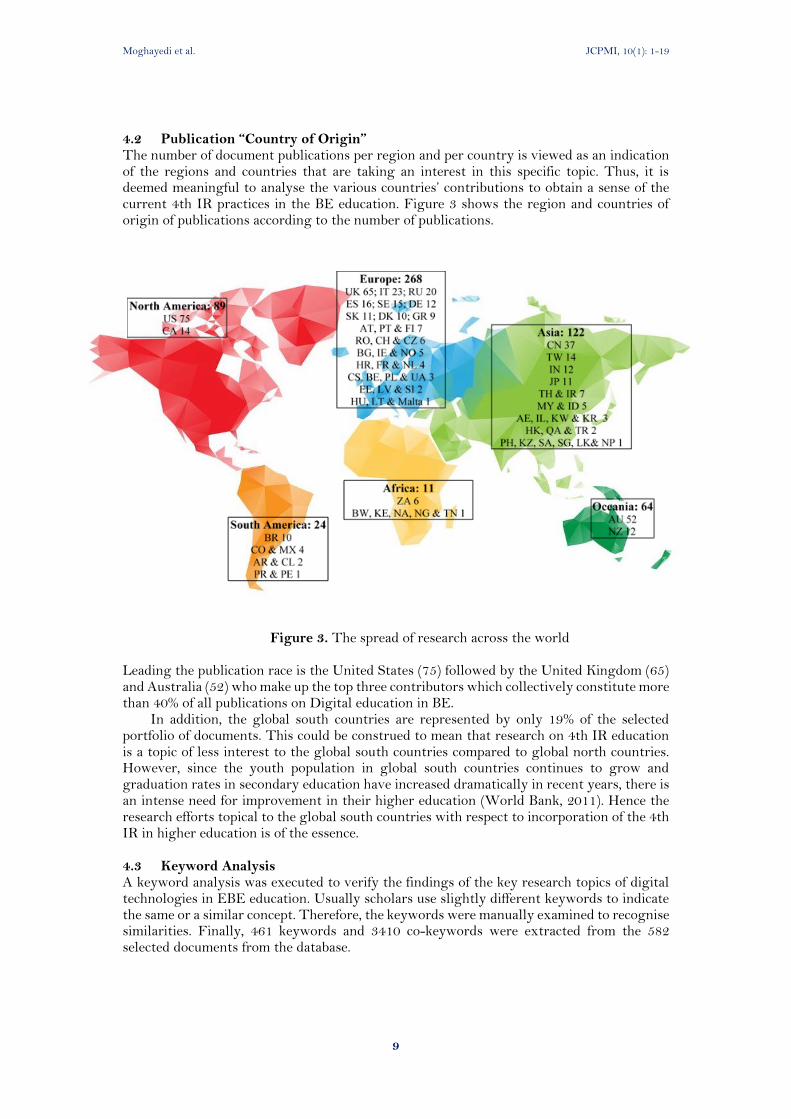
4.2 Publication “Country of Origin” The number of document publications per region and per country is viewed as an indication of the regions and countries that are taking an interest in this specific topic. Thus, it is deemed meaningful to analyse the various countries’ contributions to obtain a sense of the current 4th IR practices in the BE education. Figure 3 shows the region and countries of origin of publications according to the number of publications.
Figure 3. The spread of research across the world Leading the publication race is the United States (75) followed by the United Kingdom (65) and Australia (52) who make up the top three contributors which collectively constitute more than 40% of all publications on Digital education in BE.
In addition, the global south countries are represented by only 19% of the selected portfolio of documents. This could be construed to mean that research on 4th IR education is a topic of less interest to the global south countries compared to global north countries. However, since the youth population in global south countries continues to grow and graduation rates in secondary education have increased dramatically in recent years, there is an intense need for improvement in their higher education (World Bank, 2011). Hence the research efforts topical to the global south countries with respect to incorporation of the 4th IR in higher education is of the essence.
4.3 Keyword Analysis A keyword analysis was executed to verify the findings of the key research topics of digital technologies in EBE education. Usually scholars use slightly different keywords to indicate the same or a similar concept. Therefore, the keywords were manually examined to recognise similarities. Finally, 461 keywords and 3410 co-keywords were extracted from the 582 selected documents from the database.
Moghayedi et al. JCPMI, 10(1): 1-19
10
In the next step, the occurrence of a selected keyword was calculated, and the keywords according to their occurrence were ranked according to following steps:
• Step 1: MS Excel was used to develop a node table that quantified the recurring keywords in selected documents and an edge matrix was developed to quantify the occurrence of co-keywords appearing in one article.
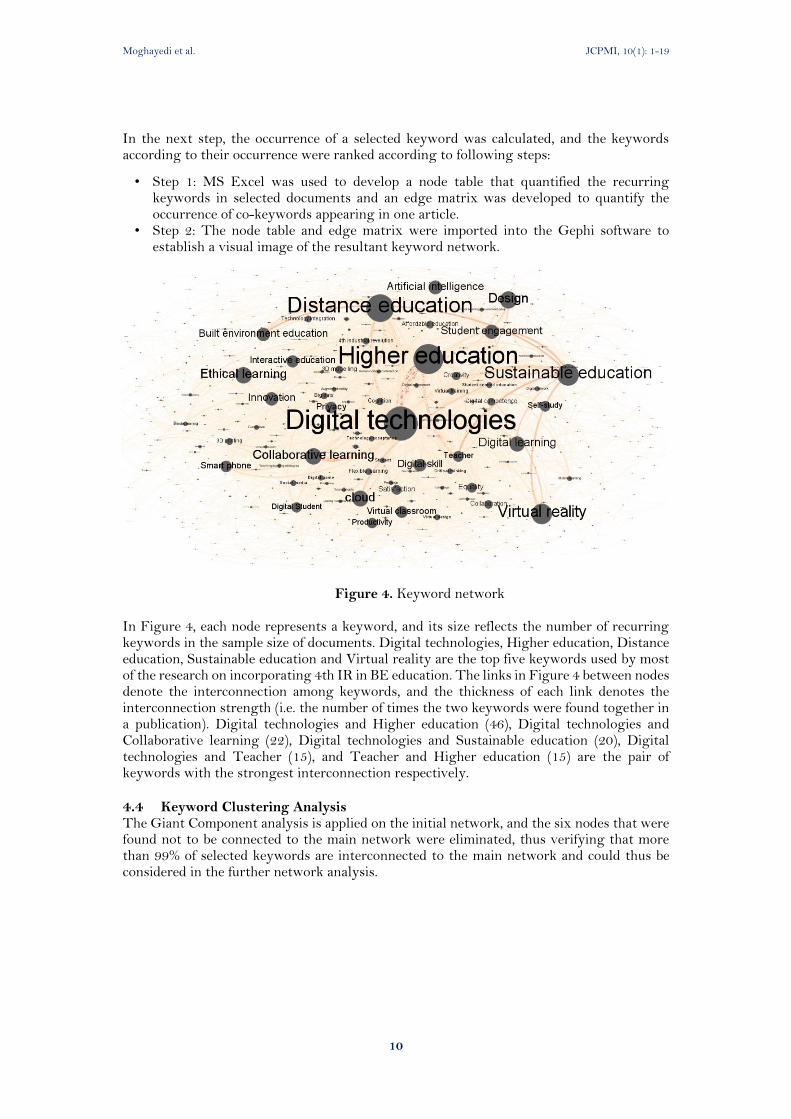
• Step 2: The node table and edge matrix were imported into the Gephi software to establish a visual image of the resultant keyword network.
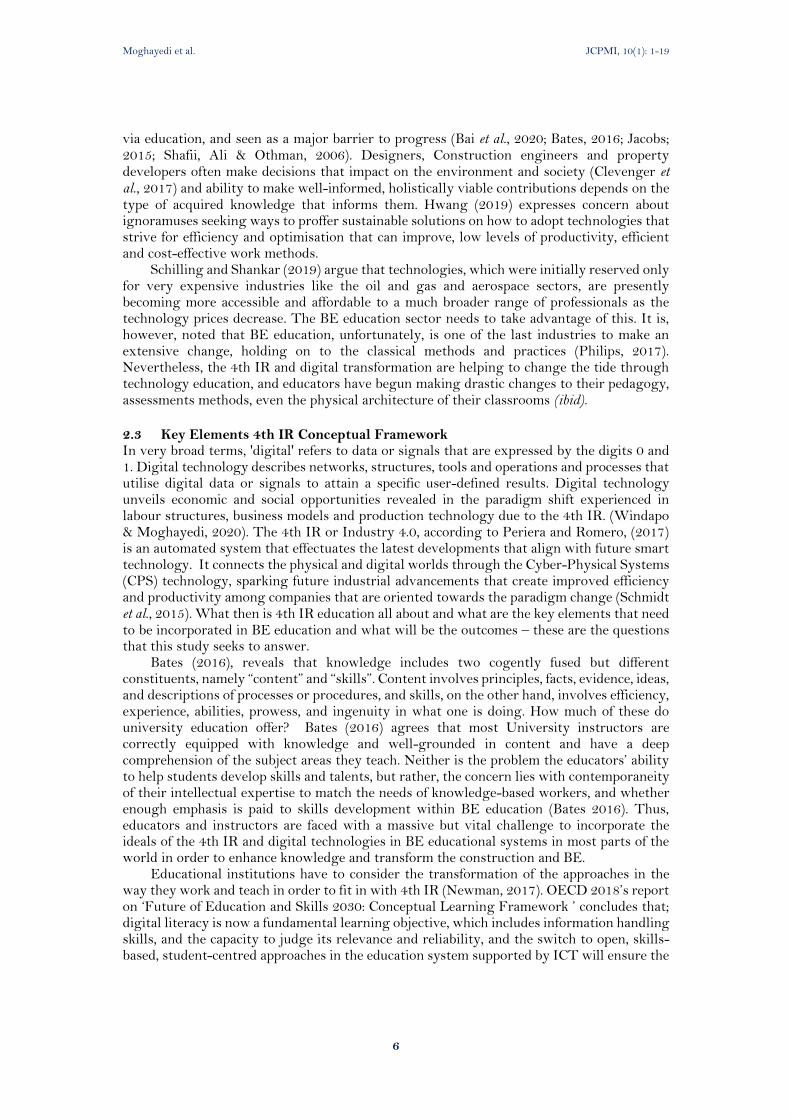
Figure 4. Keyword network
In Figure 4, each node represents a keyword, and its size reflects the number of recurring keywords in the sample size of documents. Digital technologies, Higher education, Distance education, Sustainable education and Virtual reality are the top five keywords used by most of the research on incorporating 4th IR in BE education. The links in Figure 4 between nodes denote the interconnection among keywords, and the thickness of each link denotes the interconnection strength (i.e. the number of times the two keywords were found together in a publication). Digital technologies and Higher education (46), Digital technologies and Collaborative learning (22), Digital technologies and Sustainable education (20), Digital technologies and Teacher (15), and Teacher and Higher education (15) are the pair of keywords with the strongest interconnection respectively.
4.4 Keyword Clustering Analysis The Giant Component analysis is applied on the initial network, and the six nodes that were found not to be connected to the main network were eliminated, thus verifying that more than 99% of selected keywords are interconnected to the main network and could thus be considered in the further network analysis.
Moghayedi et al. JCPMI, 10(1): 1-19
11
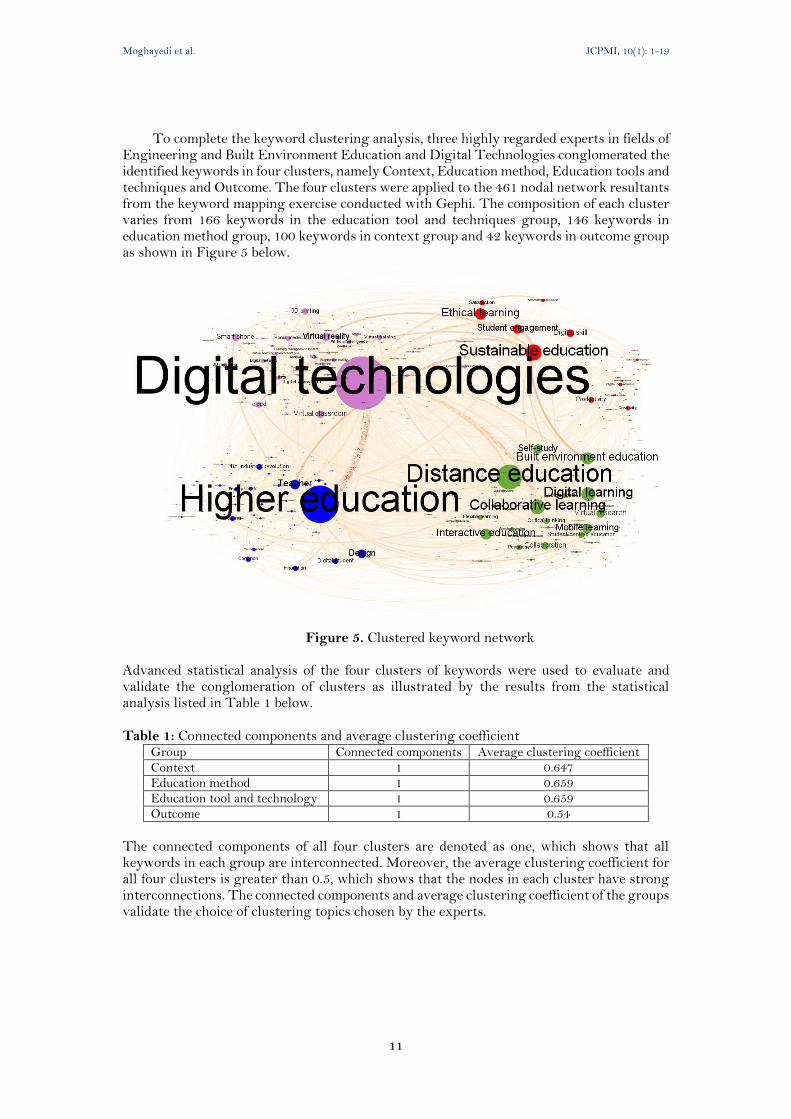
To complete the keyword clustering analysis, three highly regarded experts in fields of Engineering and Built Environment Education and Digital Technologies conglomerated the identified keywords in four clusters, namely Context, Education method, Education tools and techniques and Outcome. The four clusters were applied to the 461 nodal network resultants from the keyword mapping exercise conducted with Gephi. The composition of each cluster varies from 166 keywords in the education tool and techniques group, 146 keywords in education method group, 100 keywords in context group and 42 keywords in outcome group as shown in Figure 5 below.
Figure 5. Clustered keyword network
Advanced statistical analysis of the four clusters of keywords were used to evaluate and validate the conglomeration of clusters as illustrated by the results from the statistical analysis listed in Table 1 below. Table 1: Connected components and average clustering coefficient
Group Connected components Average clustering coefficient Context 1 0.647 Education method 1 0.659 Education tool and technology 1 0.659 Outcome 1 0.54
The connected components of all four clusters are denoted as one, which shows that all keywords in each group are interconnected. Moreover, the average clustering coefficient for all four clusters is greater than 0.5, which shows that the nodes in each cluster have strong interconnections. The connected components and average clustering coefficient of the groups validate the choice of clustering topics chosen by the experts.
Moghayedi et al. JCPMI, 10(1): 1-19
12
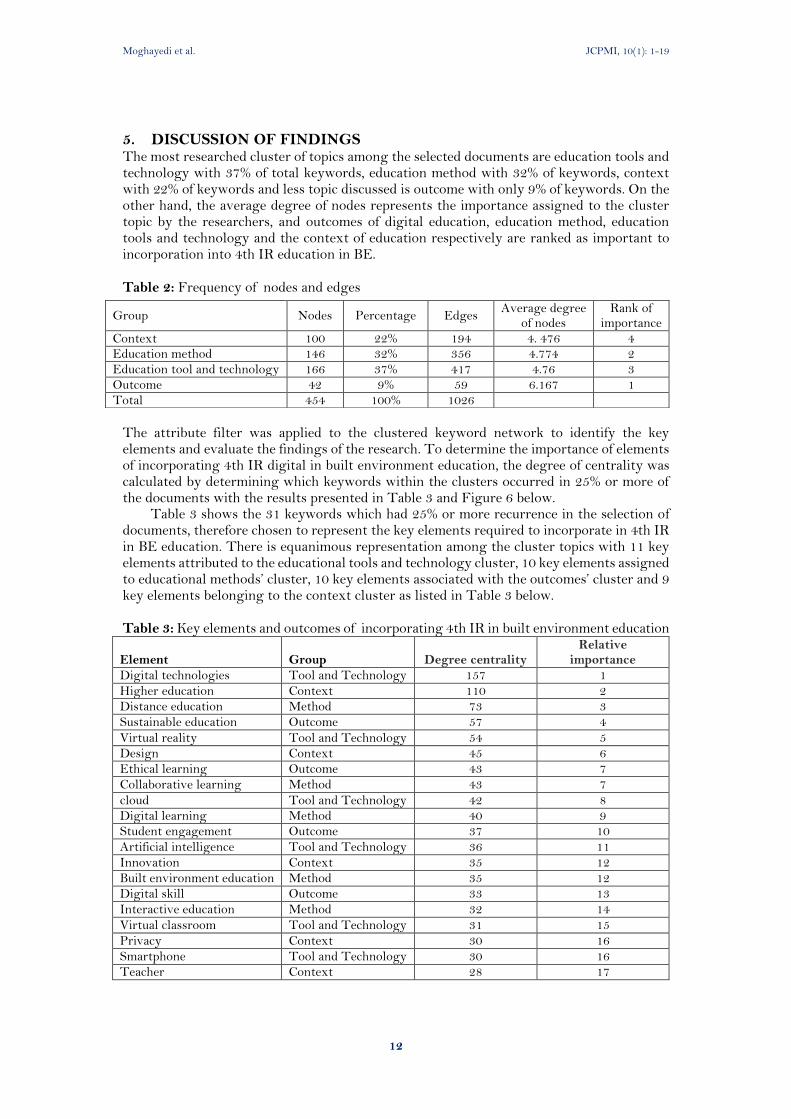
5. DISCUSSION OF FINDINGS The most researched cluster of topics among the selected documents are education tools and technology with 37% of total keywords, education method with 32% of keywords, context with 22% of keywords and less topic discussed is outcome with only 9% of keywords. On the other hand, the average degree of nodes represents the importance assigned to the cluster topic by the researchers, and outcomes of digital education, education method, education tools and technology and the context of education respectively are ranked as important to incorporation into 4th IR education in BE. Table 2: Frequency of nodes and edges
The attribute filter was applied to the clustered keyword network to identify the key elements and evaluate the findings of the research. To determine the importance of elements of incorporating 4th IR digital in built environment education, the degree of centrality was calculated by determining which keywords within the clusters occurred in 25% or more of the documents with the results presented in Table 3 and Figure 6 below.
Table 3 shows the 31 keywords which had 25% or more recurrence in the selection of documents, therefore chosen to represent the key elements required to incorporate in 4th IR in BE education. There is equanimous representation among the cluster topics with 11 key elements attributed to the educational tools and technology cluster, 10 key elements assigned to educational methods’ cluster, 10 key elements associated with the outcomes’ cluster and 9 key elements belonging to the context cluster as listed in Table 3 below.
Table 3: Key elements and outcomes of incorporating 4th IR in built environment education
Element Group Degree centrality Relative
importance
Digital technologies Tool and Technology 157 1
Higher education Context 110 2 Distance education Method 73 3
Sustainable education Outcome 57 4
Virtual reality Tool and Technology 54 5
Design Context 45 6 Ethical learning Outcome 43 7
Collaborative learning Method 43 7
cloud Tool and Technology 42 8 Digital learning Method 40 9 Student engagement Outcome 37 10
Artificial intelligence Tool and Technology 36 11
Innovation Context 35 12
Built environment education Method 35 12 Digital skill Outcome 33 13
Interactive education Method 32 14
Virtual classroom Tool and Technology 31 15
Privacy Context 30 16
Smartphone Tool and Technology 30 16
Teacher Context 28 17
Group Nodes Percentage Edges Average degree
of nodes Rank of
importance Context 100 22% 194 4. 476 4 Education method 146 32% 356 4.774 2 Education tool and technology 166 37% 417 4.76 3 Outcome 42 9% 59 6.167 1 Total 454 100% 1026
Moghayedi et al. JCPMI, 10(1): 1-19
13
Self-study Method 27 18 Productivity Outcome 27 18 Digital Student Context 26 19 Equality Context 25 20 Satisfaction Outcome 25 20 Creativity Outcome 22 21 Collaboration Method 22 21 Affordable education Outcome 20 22
3D modelling Tool and Technology 20 22
Digital competence Outcome 20 22
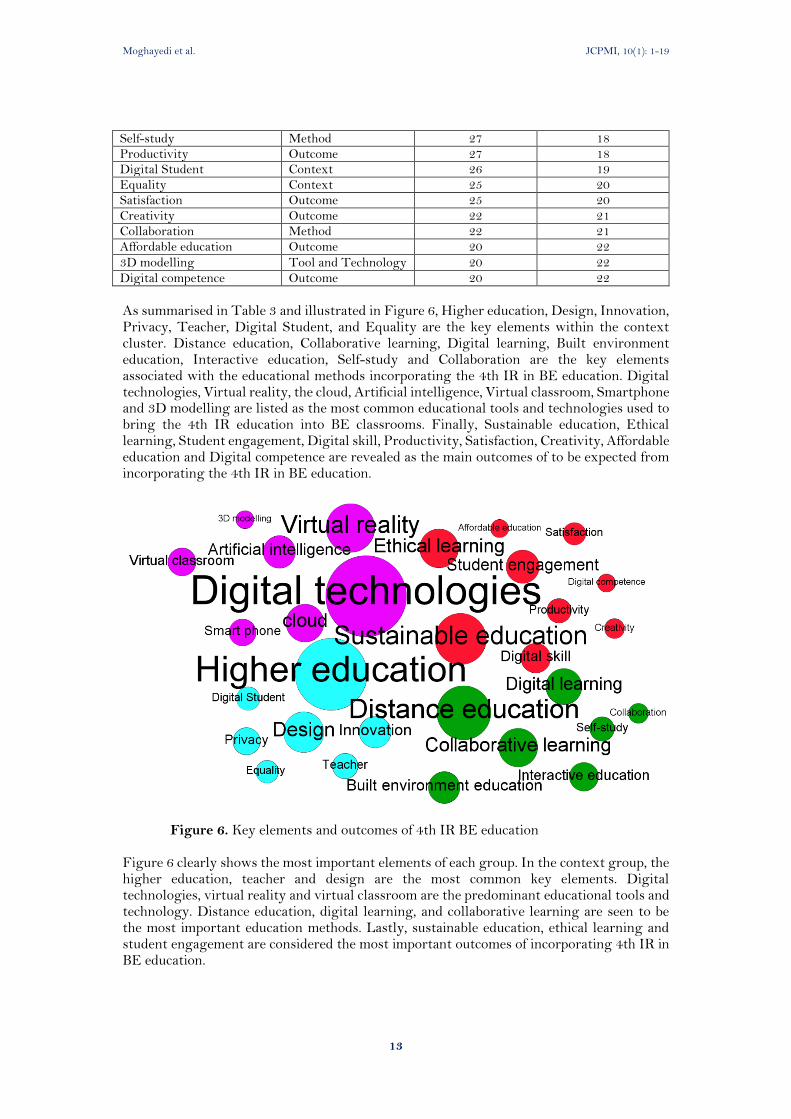
As summarised in Table 3 and illustrated in Figure 6, Higher education, Design, Innovation, Privacy, Teacher, Digital Student, and Equality are the key elements within the context cluster. Distance education, Collaborative learning, Digital learning, Built environment education, Interactive education, Self-study and Collaboration are the key elements associated with the educational methods incorporating the 4th IR in BE education. Digital technologies, Virtual reality, the cloud, Artificial intelligence, Virtual classroom, Smartphone and 3D modelling are listed as the most common educational tools and technologies used to bring the 4th IR education into BE classrooms. Finally, Sustainable education, Ethical learning, Student engagement, Digital skill, Productivity, Satisfaction, Creativity, Affordable education and Digital competence are revealed as the main outcomes of to be expected from incorporating the 4th IR in BE education.
Figure 6. Key elements and outcomes of 4th IR BE education
Figure 6 clearly shows the most important elements of each group. In the context group, the higher education, teacher and design are the most common key elements. Digital technologies, virtual reality and virtual classroom are the predominant educational tools and technology. Distance education, digital learning, and collaborative learning are seen to be the most important education methods. Lastly, sustainable education, ethical learning and student engagement are considered the most important outcomes of incorporating 4th IR in BE education.

Moghayedi et al. JCPMI, 10(1): 1-19
14
To evaluate the interconnection between the identified key elements and outcomes, the edge filter was applied to demonstrate the links of the key element keyword network. Only the strongest interconnection between the all the key elements and the key elements associated with the outcomes’ cluster were filtered and is presented in Figure 7.
Figure 7 shows a significant connection between digital technologies and higher education, which indicates the core aspects of 4th IR education. Also, the interconnection network shows the direct and indirect interconnections between the identified key elements and key elements attributed to the outcomes’ cluster. Digital technologies, as the most important identified key element with the highest degree centrality and largest number of interconnections, has a direct interconnection to all key elements. Moreover, Digital technologies has a robust direct interconnection to sustainable education, ethical learning, student engagement, Digital skill, affordable education and other outcomes of 4th IR built environment education.
Figure 8 illustrates the conceptual framework that summarises the identified key elements of incorporating 4th IR in BE education and its’ perceived outcomes. The proposed conceptual framework offers the opportunity for further exploration to aid the adoption of 4th IR into BE education. The 4th IR education in BE framework elucidates the process of incorporating 4th IR educational methods, tools and technologies to BE education and the outcomes of digital transformation in BE education.
Figure 7. Interconnection network between the key elements and outcomes of 4th IR BE education

Moghayedi et al. JCPMI, 10(1): 1-19
15
Figure 8. 4th Industrial Revolution (IR) in Built Environment (BE) education framework
6. CONCLUSION The 4th Industrial Revolution is transforming the BE industry and helping to make projects safer, more efficient, and more collaborative. As a result, more significant innovation in engineering, building and construction is evident, with new materials and modern processes being deployed, and previously “impossible” projects becoming possible through innovative design and construction. Moreover, the BE industry uses a wide range of inputs from many other industries to produce its goods and services, and as a result of the BE industry also contributes indirectly to the jobs that are created across a number of sectors. As the 4th IR gathers momentum, the BE education fraternity requires to provide immediate and comprehensive knowledge and skills to meet the challenges that this transformation of the sector will require of them. This implies that BE education in developing world should advance swiftly in their digital technology knowledge and learn how to apply the basic
Higher education
Design
Innovation
Privacy
Teacher
Digital Student
Equality
Context
Distance education
Collaborative learning
Digital learning
Built environment
education
Interactive education
Self-study
Collaboration
Method
Digital technologies
Virtual reality
Cloud
Artificial intelligence
Virtual classroom
Smart phone
3D modelling
Tool and Technology
Sustainable education
Ethical learning
Student engagement
Digital skill
Productivity
Satisfaction
Creativity
Affordable education
Digital competence
4th Industrial Revolution Education in Built Environment
Moghayedi et al. JCPMI, 10(1): 1-19
16
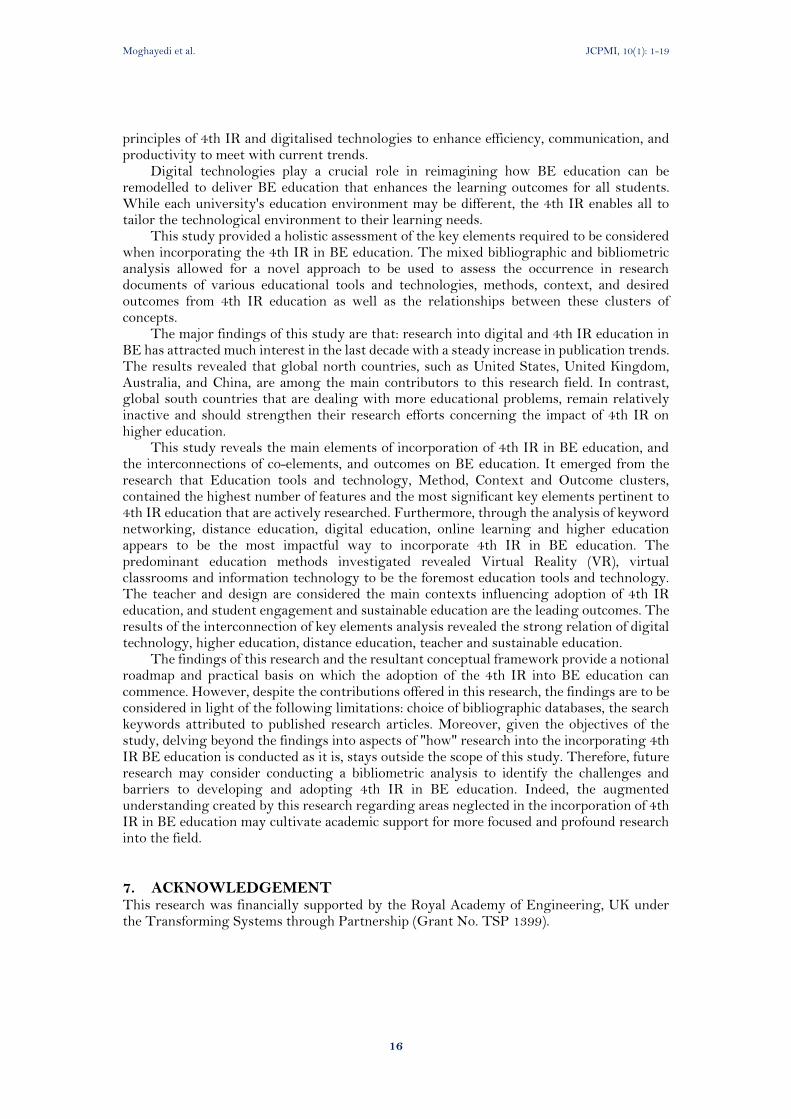
principles of 4th IR and digitalised technologies to enhance efficiency, communication, and productivity to meet with current trends.
Digital technologies play a crucial role in reimagining how BE education can be remodelled to deliver BE education that enhances the learning outcomes for all students. While each university's education environment may be different, the 4th IR enables all to tailor the technological environment to their learning needs.
This study provided a holistic assessment of the key elements required to be considered when incorporating the 4th IR in BE education. The mixed bibliographic and bibliometric analysis allowed for a novel approach to be used to assess the occurrence in research documents of various educational tools and technologies, methods, context, and desired outcomes from 4th IR education as well as the relationships between these clusters of concepts.
The major findings of this study are that: research into digital and 4th IR education in BE has attracted much interest in the last decade with a steady increase in publication trends. The results revealed that global north countries, such as United States, United Kingdom, Australia, and China, are among the main contributors to this research field. In contrast, global south countries that are dealing with more educational problems, remain relatively inactive and should strengthen their research efforts concerning the impact of 4th IR on higher education.
This study reveals the main elements of incorporation of 4th IR in BE education, and the interconnections of co-elements, and outcomes on BE education. It emerged from the research that Education tools and technology, Method, Context and Outcome clusters, contained the highest number of features and the most significant key elements pertinent to 4th IR education that are actively researched. Furthermore, through the analysis of keyword networking, distance education, digital education, online learning and higher education appears to be the most impactful way to incorporate 4th IR in BE education. The predominant education methods investigated revealed Virtual Reality (VR), virtual classrooms and information technology to be the foremost education tools and technology. The teacher and design are considered the main contexts influencing adoption of 4th IR education, and student engagement and sustainable education are the leading outcomes. The results of the interconnection of key elements analysis revealed the strong relation of digital technology, higher education, distance education, teacher and sustainable education.
The findings of this research and the resultant conceptual framework provide a notional roadmap and practical basis on which the adoption of the 4th IR into BE education can commence. However, despite the contributions offered in this research, the findings are to be considered in light of the following limitations: choice of bibliographic databases, the search keywords attributed to published research articles. Moreover, given the objectives of the study, delving beyond the findings into aspects of "how" research into the incorporating 4th IR BE education is conducted as it is, stays outside the scope of this study. Therefore, future research may consider conducting a bibliometric analysis to identify the challenges and barriers to developing and adopting 4th IR in BE education. Indeed, the augmented understanding created by this research regarding areas neglected in the incorporation of 4th IR in BE education may cultivate academic support for more focused and profound research into the field.
7. ACKNOWLEDGEMENT This research was financially supported by the Royal Academy of Engineering, UK under the Transforming Systems through Partnership (Grant No. TSP 1399).
Moghayedi et al. JCPMI, 10(1): 1-19
17
8. REFERENCES Abdirad, H. & Dossick, C.S. (2016). BIM curriculum design in architecture, engineering, and
construction education: a systematic review. Journal of Information Technology in Construction (ITcon), Vol. 21, pg. 250-271, http://www.itcon.org/2016/17
Bai, X., He, Y., & Kohlbacher, F. (2020). Older people’s adoption of e-learning services: a qualitative study of facilitators and barriers. Gerontology & geriatrics education, 41(3), 291-307.
Bates T. (2016) Teaching in a Digital Age. Retrieved from http://opentextbc.ca/teachinginadigitalage/wpcontent/uploads/sites/29/2015/04/Scenario-A.mp3, Accessed: 20/06/2019
Carvalho, N., Chaim, O., Cazarini, E. & Gerolama, M. (2018). Manufacturing in the Fourth Industrial Revolution: A Positive Prospect in Sustainable Manufacturing. Procedia Manufacturing. 21(2018), 671-678
Clevenger, C., Abdallah, M., & Beauregard, M. (2017). Advancing construction students’ sustainability competencies using online tools. In Proc., ICSC17: The Canadian Society for Civil Engineering 5th Int./12th Construction Specialty Conf. Vancouver, Canada: Univ. of British Columbia.
Costley, K. C. (2014). The Positive Effects of Technology on Teaching and Student Learning. Online Submission.
Crossan, M. M., & Apaydin, M. (2010). A multi‐dimensional framework of organisational innovation: A systematic review of the literature. Journal of management studies, 47(6), 1154-1191.
Desjardins, F., & Bullock, S. (2019). Professional Development Learning Environments (PDLEs) embedded in a Collaborative Online Learning Environment (COLE): Moving towards a new conception of online professional learning. Education and Information Technologies, 24(2), 1863-1900.
Dombrowski, U., & Wagner, T. (2014). Mental strain as field of action in the 4th industrial revolution. Procedia Cirp, 17(1), 100-105.
Dunleavy M. & Dede C. (2014). Augmented Reality Teaching and Learning. In: Spector J., Merrill M., Elen J., Bishop M. (eds) Handbook of Research on Educational Communications and Technology. Springer, New York, NY
Foroughi Sabzevar, M., Gheisari, M., & Lo, L. J. (2020). Improving Access to Design Information of Paper-Based Floor Plans Using Augmented Reality. International Journal of Construction Education and Research, 1-21.
Haigh, R. and Amaratunga, D. (2010), "An integrative review of the built environment discipline's role in the development of society's resilience to disasters", International Journal of Disaster Resilience in the Built Environment, Vol. 1 No. 1, pp. 11-24.
Han, I. (2020). Immersive virtual field trips in education: A mixed‐methods study on elementary students' presence and perceived learning. British Journal of Educational Technology, 51(2), 420-435.
Mazumdar, S., Learnihan, V., Cochrane, T., & Davey, R. (2018). The built environment and social capital: A systematic review. Environment and Behavior, 50(2), 119-158.
Hernandez-de-Menendez, M & Morales-Menendez, R. (2019). Technological innovations and practices in engineering education: a review. International Journal on Interactive Design and Manufacturing (IJIDeM) Vol 13(2) 713–728
Hourani, H., & Abdallah, M. (2018). Cloud Computing: Legal and Security Issues. In 2018 8th International Conference on Computer Science and Information Technology (CSIT) (pp. 13-16). IEEE.
Hwang, G. (2019). Challenges for innovative HRD in era of the 4th industrial revolution. Asian Journal of Innovation and Policy, 8(2), 288-301.
Jacobs, E. (2015). The status quo of green-building education in South Africa. Acta Structilia: Journal for the Physical and Development Sciences 22(2): 110-133.
Moghayedi et al. JCPMI, 10(1): 1-19
18
Jin, R., Yang, T., Piroozfar, P., Kang, B. G., Wanatowski, D., Hancock, C. M., & Tang, L. (2018). Project-based pedagogy in interdisciplinary building design adopting BIM. Engineering, Construction and Architectural Management.
Kamaruzaman, M. F., Hamid, R., Mutalib, A. A., & Rasul, M. S. (2019). Comparison of Engineering Skills with IR 4.0 Skills. International Journal of Online and Biomedical Engineering (iJOE), 15(10), 15-28.
Khan, M. T., & Khan, N. A. (2018). ATTRIBUTES OF'DIFFUSION OF INNOVATIONS'OF BUSINESS PRODUCTS. International Journal of Information, Business and Management, 10(3), 1-14.
Kozma, R.B. (2003) Technology, Innovation and Educational Change: A Global Perspective. International Society for Technology in Education.
Mihindu, S., & Arayici, Y. (2008, July). Digital construction through BIM systems will drive the re-engineering of construction business practices. In 2008 international conference visualisation (pp. 29-34). IEEE.
Moghayedi, A. (2019). Modelling uncertainty of cost and time in infrastructure projects (Doctoral dissertation, Engineering and the Built Environment).
Newman, D. (2017). Top 6 Digital Transformation Trends in Education. Retreived from: https://www.forbes.com/sites/danielnewman/2017/07/18/top-6-digital-transformation-trends-in-education/#5aeb2edb2a9a. Assessed: 23/06/2019
Parn, E. A., & Edwards, D. (2019). Cyber threats confronting the digital built environment. Engineering, Construction and Architectural Management.
Periera, A.C. & Romero, F. (2017). A Review of the Meanings and the Implications of the Industry 4.0 Concept. Procedia Manufacturing. 13 (2017), 1206–1214
Phillips, M. (2017). How virtual reality technology is changing the way students learn. Retreived from: http://theconversation.com/how-virtual-reality-technology-is-changing-the-way-students-learn-63271. Assessed:23/06/2019
Rojas, E.M., and Mukherjee, A. (2005). General-Purpose Situational Simulation Environment for Construction Education.” Journal of Construction Engineering and Management, ASCE, Vol. 131(3), pp 319-329.
Schilling, M. A., & Shankar, R. (2019). Strategic management of technological innovation. McGraw-Hill Education.
Schmidt, R., Möhring, M., Härting, R. C., Reichstein, C., Neumaier, P., & Jozinović, P. (2015). Industry 4.0-potentials for creating smart products: empirical research results. In International Conference on Business Information Systems (pp. 16-27). Springer, Cham. Schrock, K. (2014). Kathy Schrock's guide to everything. Retrieved from http://www.schrockguide.net/samr.html Accessed: 20/06/2019
Shafii, F., Ali, Z.A. & Othman, M.Z. (2006). Achieving sustainable construction in the developing countries of Southeast Asia. In: Proceedings of the 6th Asia-Pacific Structural Engineering and Construction Conference (APSEC 2006), 5-6 September 2006, Kuala Lumpur, Malaysia. Skudai: Universiti Teknologi Malaysia, pp. C29-44.
Shvets, G. A., & Nedviga, E. S. (2019). Computer-aided design software for education in Building Engineering. AlfaBuild, (4), 34-53.
Smith, J. and Hu, R. (2013) ‘Rethinking teacher education: synchronizing eastern and western views of teaching and learning to promote 21st century skills and global perspectives’, Education Research and Perspectives (Online), Vol. 40, pp.86–108, Retrieved from http.//ezproxy.cul.columbia.edu/login?url=http.//search.proquest.com.ezproxy.cul.columbia.ed u/docview/1462385468?accountid=10226
Solnosky, R., Parfitt, M. K., & Holland, R. (2015). Delivery methods for a multi-disciplinary architectural engineering capstone design course. Architectural Engineering and Design Management, 11(4), 305-324.

Moghayedi et al. JCPMI, 10(1): 1-19
19
Taguma, M., Feron, E., & Meow Hwee, L. I. M. (2018). Future of Education and Skills 2030: Conceptual Learning Framework.
Wadhera, M. (2016) ‘The information age is over; welcome to the experience age’, Tech Crunch, May, Vol. 9, Retrieved from https.//techcrunch.com/2016/05/09/the-information-age-is-overwelcome-to-the-experience-age/
Walden, N. (2017). Four key areas for digital transformation in procurement. https://www.supplychaindigital.com/procurement/four-key-areas-digital-transformation-procurement. Assessed: 14/06/20219
Windapo, A., & Moghayedi, A. (2019). The Use of Geographic Information Systems (GIS) in Understanding Building Material Price Dispersion in South Africa. Innovative Production and Construction: Transforming Construction Through Emerging Technologies, 225.
Windapo, A. O., & Moghayedi, A. (2020). Adoption of smart technologies and circular economy performance of buildings. Built Environment Project and Asset Management.
World Bank. (2011). Learning for all: Investing in people’s knowledge and skills to promote development. World Bank Group Education Strategy 2020.
Whyte, J. (2017). The Importance of Continuous Research. Institution of Civil Engineers (ICE) Imperial College London.
Journal of Construction Project Management and Innovation, 10 (1): 20-32, 2020
ISSN 2223-7852 © Sustainable Human Settlement and Construction Research Centre DOI: https://doi.org/10.36615/jcpmi.v10i1.351
20
NONLINEAR PROOF-OF-WORK: IMPROVING THE ENERGY EFFICIENCY OF BITCOIN MINING
Riaan BEZUIDENHOUT1, Wynand NEL2, and Andries J. BURGER3
1,2,3Computer Science and Informatics, University of the Free State, 205 Nelson Mandela
Drive, Bloemfontein, South Africa
Email: [email protected]; [email protected]; [email protected]
ABSTRACT Bitcoin is probably the most well-known blockchain system in existence. It employs the proof-of-work (PoW) consensus algorithm to add transactions to the blockchain. This process is better known as Bitcoin mining. PoW requires miners to compete in solving a cryptographic puzzle before being allowed to add a block of transactions to the blockchain. This mining process is energy-intensive and results in high energy wastage. The underlying cause of this energy inefficiency is the result of the current implementation of the PoW algorithm. PoW assigns the same cryptographic puzzle to all miners, creating a linear probability of success between the miner’s computational power as a proportion of the total computational power of the network. To address this energy inefficiency of the PoW mining process, the researchers investigated whether a nonlinear probability of success, between the miner’s computation power and its probability of success, will result in better energy usage. A nonlinear proof-of-work (nlPoW) algorithm was constructed by using a design science approach to derive the requirements for and structure of the algorithm. The Bitcoin mining process was tested through statistical simulation, comparing the performance of nlPoW with PoW. Preliminary results, simulating a network of 1000 miners with identical computational power, indicate that nlPoW reduce the number of hash computations, and therefore the energy consumption, required by Bitcoin mining. The findings are significant because nlPoW does not reduce the degree of decentralised consensus, or trade energy usage for some other resource as is the case with many other attempts to address the energy consumption problem in PoW. Keywords: Bitcoin, bitcoin mining, consensus algorithm, nonlinear proof-of-work, proof-of-work
1. INTRODUCTION Blockchain systems such as Bitcoin is a public, indelible, transactional data structure shared on a distributed computer network without a central authority (Mulár, 2018). The nodes of the distributed, decentralised computer network follow a pre-determined set of rules (consensus algorithm) to add transactions and reach consensus on the single correct version of the transaction history in the blockchain. This entire process is called Bitcoin mining (Nakamoto, 2008).
In order for blockchain systems to work as distributed systems, they require consensus algorithms to function under the assumption that a limited number of the components may be faulty. It is critical that distributed systems are able to agree on a piece of data (the transaction record in this case) even if part of the system is unreliable (Fischer, 1983). Section 3.4 deals with different consensus algorithms, and Section 5 places these into context with the algorithm that is proposed in this research.
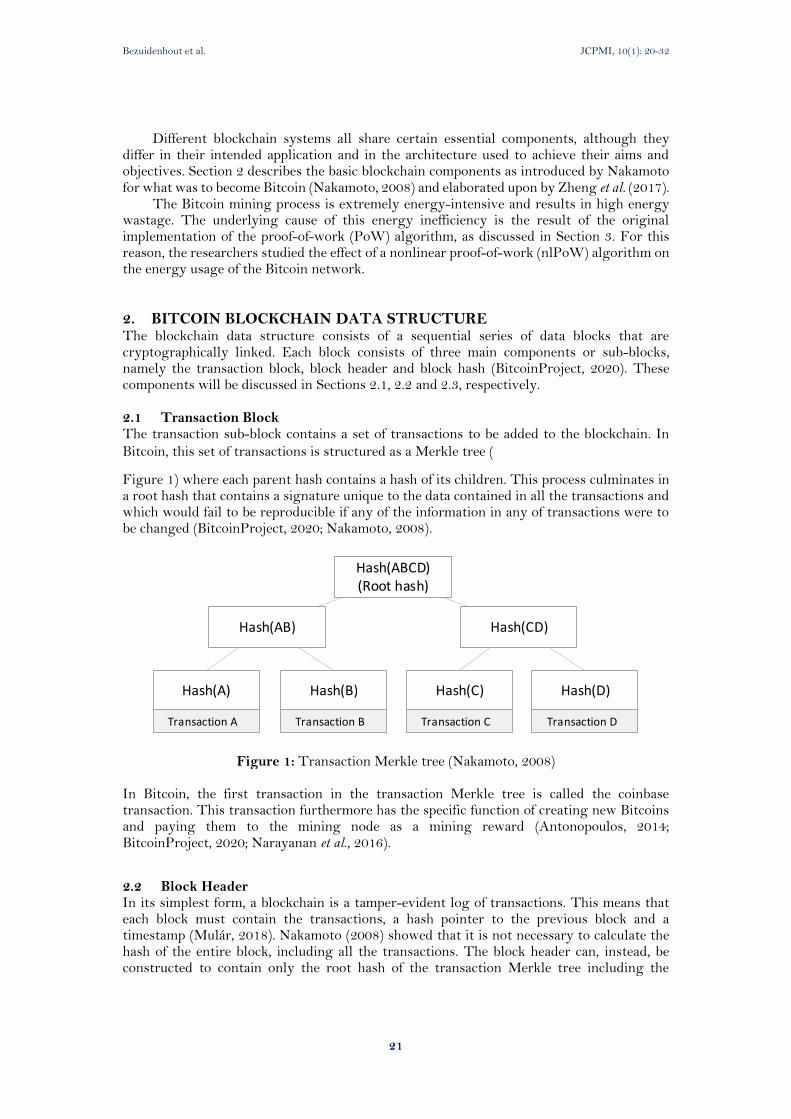
Bezuidenhout et al. JCPMI, 10(1): 20-32
21
Different blockchain systems all share certain essential components, although they differ in their intended application and in the architecture used to achieve their aims and objectives. Section 2 describes the basic blockchain components as introduced by Nakamoto for what was to become Bitcoin (Nakamoto, 2008) and elaborated upon by Zheng et al. (2017).
The Bitcoin mining process is extremely energy-intensive and results in high energy wastage. The underlying cause of this energy inefficiency is the result of the original implementation of the proof-of-work (PoW) algorithm, as discussed in Section 3. For this reason, the researchers studied the effect of a nonlinear proof-of-work (nlPoW) algorithm on the energy usage of the Bitcoin network.
2. BITCOIN BLOCKCHAIN DATA STRUCTURE The blockchain data structure consists of a sequential series of data blocks that are cryptographically linked. Each block consists of three main components or sub-blocks, namely the transaction block, block header and block hash (BitcoinProject, 2020). These components will be discussed in Sections 2.1, 2.2 and 2.3, respectively. 2.1 Transaction Block The transaction sub-block contains a set of transactions to be added to the blockchain. In
Bitcoin, this set of transactions is structured as a Merkle tree (
Figure 1) where each parent hash contains a hash of its children. This process culminates in a root hash that contains a signature unique to the data contained in all the transactions and which would fail to be reproducible if any of the information in any of transactions were to be changed (BitcoinProject, 2020; Nakamoto, 2008).
Figure 1: Transaction Merkle tree (Nakamoto, 2008) In Bitcoin, the first transaction in the transaction Merkle tree is called the coinbase transaction. This transaction furthermore has the specific function of creating new Bitcoins and paying them to the mining node as a mining reward (Antonopoulos, 2014; BitcoinProject, 2020; Narayanan et al., 2016).
2.2 Block Header In its simplest form, a blockchain is a tamper-evident log of transactions. This means that each block must contain the transactions, a hash pointer to the previous block and a timestamp (Mulár, 2018). Nakamoto (2008) showed that it is not necessary to calculate the hash of the entire block, including all the transactions. The block header can, instead, be constructed to contain only the root hash of the transaction Merkle tree including the
Hash(A) Hash(B) Hash(C) Hash(D)
Transaction A Transaction B Transaction C Transaction D
Hash(AB) Hash(CD)
Hash(ABCD)(Root hash)
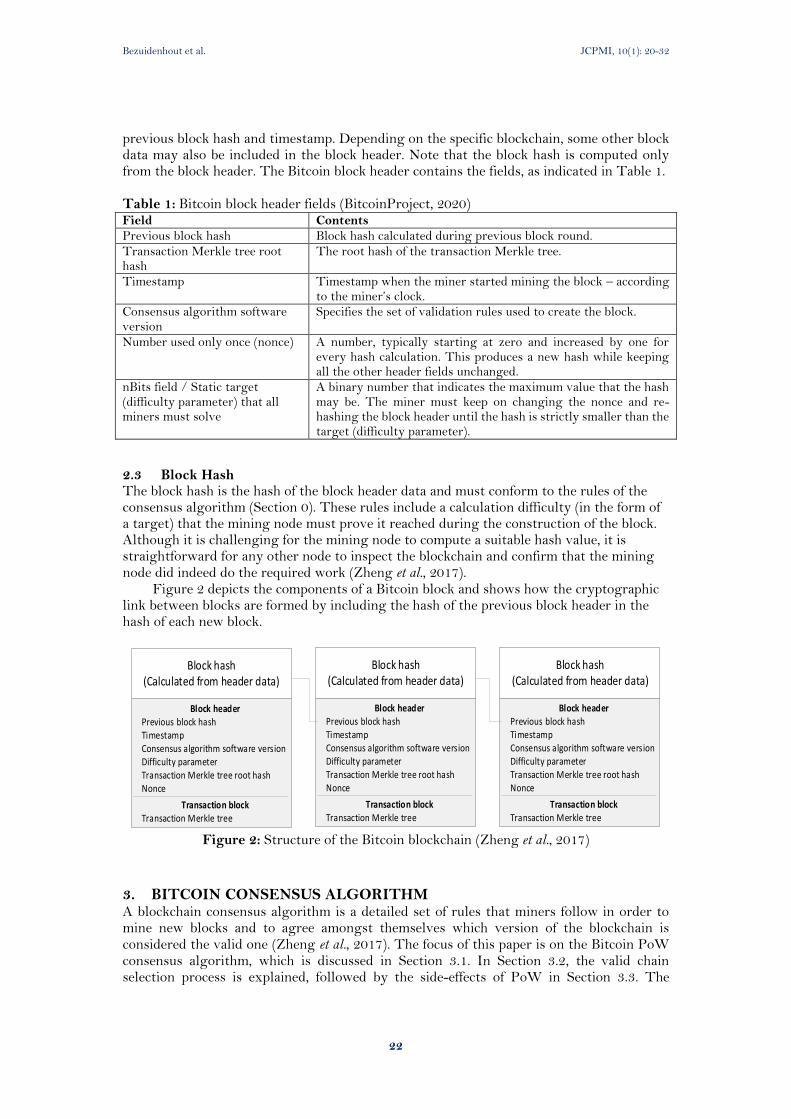
Bezuidenhout et al. JCPMI, 10(1): 20-32
22
previous block hash and timestamp. Depending on the specific blockchain, some other block data may also be included in the block header. Note that the block hash is computed only from the block header. The Bitcoin block header contains the fields, as indicated in Table 1. Table 1: Bitcoin block header fields (BitcoinProject, 2020) Field Contents
Previous block hash Block hash calculated during previous block round. Transaction Merkle tree root hash
The root hash of the transaction Merkle tree.
Timestamp Timestamp when the miner started mining the block – according to the miner’s clock.
Consensus algorithm software version
Specifies the set of validation rules used to create the block.
Number used only once (nonce) A number, typically starting at zero and increased by one for every hash calculation. This produces a new hash while keeping all the other header fields unchanged.
nBits field / Static target (difficulty parameter) that all miners must solve
A binary number that indicates the maximum value that the hash may be. The miner must keep on changing the nonce and re-hashing the block header until the hash is strictly smaller than the target (difficulty parameter).
2.3 Block Hash The block hash is the hash of the block header data and must conform to the rules of the consensus algorithm (Section 0). These rules include a calculation difficulty (in the form of a target) that the mining node must prove it reached during the construction of the block. Although it is challenging for the mining node to compute a suitable hash value, it is straightforward for any other node to inspect the blockchain and confirm that the mining node did indeed do the required work (Zheng et al., 2017).
Figure 2 depicts the components of a Bitcoin block and shows how the cryptographic link between blocks are formed by including the hash of the previous block header in the hash of each new block.
Figure 2: Structure of the Bitcoin blockchain (Zheng et al., 2017)
3. BITCOIN CONSENSUS ALGORITHM A blockchain consensus algorithm is a detailed set of rules that miners follow in order to mine new blocks and to agree amongst themselves which version of the blockchain is considered the valid one (Zheng et al., 2017). The focus of this paper is on the Bitcoin PoW consensus algorithm, which is discussed in Section 3.1. In Section 3.2, the valid chain selection process is explained, followed by the side-effects of PoW in Section 3.3. The
Block hash(Calculated from header data)
Block hash(Calculated from header data)
Block hash(Calculated from header data)
Transaction Merkle tree
Previous block hashTimestampConsensus algorithm software version
Transaction block
Block header
Transaction Merkle tree root hashNonce
Difficulty parameter
Transaction Merkle tree
Previous block hashTimestampConsensus algorithm software version
Transaction block
Block header
Transaction Merkle tree root hashNonce
Difficulty parameter
Transaction Merkle tree
Previous block hashTimestampConsensus algorithm software version
Transaction block
Block header
Transaction Merkle tree root hashNonce
Difficulty parameter

Bezuidenhout et al. JCPMI, 10(1): 20-32
23
enormous energy wastage of the Bitcoin network, which is also the problem that is investigated in this paper, is discussed in Section 3.3.1. 3.1 Proof-of-Work PoW is an algorithm for determining which miners managed to create valid new blocks. This entails the calculation of a hash value of sufficient difficulty from the block header data, including the transaction Merkle tree root hash, which serves as a “cryptographic summary” of all the transactions in the block. The target is selected so that it requires each miner to calculate an enormous number of hashes, each time using a new nonce to render a different hash, before finding a suitable block hash (Antonopoulos, 2014; Nakamoto, 2008; Narayanan et al., 2016).
One of the built-in rules of Bitcoin’s PoW is that the network recalculates the target every 2016 blocks so that it takes on average 600 seconds (10 minutes) to mine a block. The calculation adjusts the target by the factor that the average block addition time is less than or more than 10 minutes and has the effect that the difficulty changes as the computational power of the network changes. Both the 10-minute average block addition time and the 2016 block target recalculation interval (at 10-minute intervals the mining of 2016 blocks equates to two weeks) are arbitrary values that were introduced by Nakamoto in the original Bitcoin software (Nakamoto, 2008). Any other values could substitute these values. Historically, the Bitcoin block addition times mostly started at 10 minutes and decreased over the span of 2016 blocks (which then also took less time to complete than the theoretical two weeks), as new computational power was continuously added to the network. This decrease in block addition times continued until such time that the target was recalculated (Antonopoulos, 2014; Narayanan et al., 2016).
One of the core innovations of Bitcoin is that any miner is allowed to add a block to the blockchain with the simple rule that the first valid block announced, is the correct one. In practice it does happen, due to the latency of data propagation, that more than one valid block is found by the network, bringing multiple branches of the blockchain into existence. This is called a fork in the blockchain and has the result that different partitions of the network may mine onto different branches (Eyal et al., 2016).
As one of the forks eventually becomes longer than the other, it will eventually replace all other versions of the blockchain on the network (Bonneau et al., 2015). It can be inferred that transactions that were contained in the shorter fork will then be included in future blocks on the longer chain. 3.2 Valid Chain Selection and Transaction Security A critical requirement of any blockchain system is that the network of miners eventually reaches an agreement on only one valid version of the blockchain, discarding all other forks. In Bitcoin, this is done through the longest chain rule. The fork that is mined by the largest network partition (by computing power) will eventually grow longer (will contain more blocks) than forks that are mined by smaller partitions (by computing power) (Nakamoto, 2008). Nakamoto (2008) referred to this principle in the context of the proportion of honest to dishonest miners, but it applies to network partitions in general.
When a miner receives a version of the blockchain that is longer than the one it is currently mining, it will discard its current blockchain and replace it with the longer one. This process ensures that only the longest blockchain survives and becomes the only valid blockchain accepted by all miners (Zheng et al., 2017). As a block becomes buried under more blocks in the blockchain, it becomes increasingly unlikely that an adversary will be able to apply enough resources to change a transaction in that block, improving the confidence of a payee that a received payment is secure (Bentov et al., 2016).
Bezuidenhout et al. JCPMI, 10(1): 20-32
24
3.3 The Side-effects of Proof-of-Work Ma et al. (2018) note that finding a suitable hash requires no strategy by a miner, but relies on a form of brute force guessing (making a large number of guesses, each time with another nonce in the header, until a suitable hash is discovered) to solve a computational puzzle. The more computational power commanded by a miner, the more likely it is to solve the puzzle first and claim the prize, although the process remains probabilistic and does not guarantee that the most powerful miner will prevail.
Dimitri (2017) presents a framework whereby each round of the Bitcoin mining process can be viewed as an all-pay contest. An all-pay contest is a competition where the award or prize is known in advance and require everyone to make an investment to participate. Having miners play this type of game has two important desirable effects on the blockchain ecosystem, whereby firstly, it results in very few (preferably one) suggested new blocks to be found during each round and secondly, reducing the ability for bad actors to take back already spent Bitcoins. This is important as there is no prohibition on anyone to participate as a Bitcoin miner (Ma et al., 2018). On the other hand, brute force guessing and unprohibited participation have led to one of the main undesirable side effects of Bitcoin mining, namely energy wastage.
3.3.1 Energy Wastage by Bitcoin Mining The incentive structure of Bitcoin’s PoW consensus scheme requires that all the miners in the network calculate an enormous amount of hashes in the race to be the first to produce one suitable block hash (Ma et al. 2018). This translates into an unsustainable level of energy usage. As the computing power of the network increases, resulting in a higher hash rate by the network in general, the target of the block hash is automatically adjusted downward (difficulty is increased) by the consensus algorithm. This is done to keep the average block creation time constant, but in turn, results in mining entities adding ever more computing power to remain competitive (Tschorsch & Scheuermann, 2016). Ma et al. (2018) point out that as the value of Bitcoin has risen over the years (2009 to 2018 were the years covered by their research), the reward from mining has become more substantial, resulting in drawing more participants and consequently, increasing energy usage.
According to the Digiconomist (2020), the Bitcoin network consumed an estimated 66 terawatt-hour (TWh) of electricity per year in August 2020. This is comparable with the energy consumption of The Czech Republic, a country with 10.7 million inhabitants (July 2020 estimate) (Central Intelligence Agency, 2020).
Only a single block, mined by a single miner eventually survives to permanently become part of the blockchain and all the energy expended by unsuccessful miners, which is the vast majority, goes to waste (Zheng et al., 2017). Tschorsch and Scheuermann (2016) state that, given the same block hash target for each miner and given that all miners aim to come up with a solution, the chance of solving the block hash is proportional to the miner’s fraction of the total computing power. In other words, the probability of successfully mining a block is linear to the computational power, as explained by (Dimitri, 2017):
Assume a network where each miner is denoted as 𝑖 and: 𝑖 = 1, 2, . . , 𝑛
The hash power of each miner is denoted as: ℎ𝑖
Thus, the hash power of the entire network is denoted as: ℎ𝑛 Then, the probability that a miner is the first to solve the block hash is:
P(ℎ𝑖) = ℎ𝑖
ℎ𝑛 (1)
Since the total computing power of the network can be considered to be a constant, C, during the 600-second interval of each block round (Section 3.1), equation 1 becomes a linear equation:
P(ℎ𝑖) = ℎ𝑖
𝐶 (2)
Bezuidenhout et al. JCPMI, 10(1): 20-32
25
and the probability for any miner i, becomes linear to its proportion of computing power (hi) in the network.
3.4 Related work Many alternative types of consensus schemes have been proposed for blockchain systems, which can broadly be categorised into proof-based and voting-based algorithms (Nguyen & Kim, 2018). Not all of these focus on addressing the shortcoming of PoW. Voting-based algorithms forego decentralised consensus in favour of improved trust assumptions about the network, afforded by a controlled pool of participants. These types of algorithms fall outside the scope of this research as the primary motivation for PoW is to maintain a completely decentralised consensus.
Some proof-based algorithms have made attempts to lower resource usage during mining, most notably, proof-of-stake, proof-of-importance (Bentov et al., 2016; NEM, 2018; Zheng et al., 2017) and delegated proof-of-stake (BitShares Blockchain Foundation, n.d.; Hasib, 2018). There have also been attempts to exchange energy for other resources during the mining process, these types of solutions include PoW with a cuckoo hash function (relies on memory rather than computational power) (Tromp, 2014), proof-of-human-work (requires inputs that are easy for humans to provide, but difficult for computers) (Blocki & Zhou, 2016), proof-of-burn (uses blockchain tokens) (Jenks, 2018; P4Titan, 2014), proof-of-space (relies on data storage capacity) (Dziembowski et al., 2015), proof-of-entanglement (depends on the quantum properties of light) (Bennet & Daryanoosh, 2019), proof-of-elapsed time and proof-of-luck (uses centralised random number generation) (Nguyen & Kim, 2018) and proof-of-responsibility (relies on trusted nodes) (Coinspace.com, 2019).
Consensus algorithm development is an ongoing process, as new ideas are constantly being added and tested (Zheng et al., 2017). In the discussion section, the solution proposed in this paper will be placed in context with these existing alternatives.
4. PROPOSED SOLUTION In Section 0.3.1, the high energy wastage of PoW was identified as a major concern for the long-term sustainability of the Bitcoin network. The energy consumption is related to the amount of computation required and is measured in hashes per second per watt (H/s/W) (Narayanan et al., 2016). This energy wastage was linked to the fact that each miner’s probability of success is linear to the proportion of its computational power. If this probability of success could be changed to be nonlinear to the computational power of each miner, it is reasonable to argue whether it would have an effect on the energy consumption of the network as a whole. In other words, if every miner received a random target during each block round, will it reduce the energy consumption of the mining network?
The researchers propose a nonlinear proof-of-work (nlPoW) algorithm for assigning a dynamic target (random target) to each miner during each block round (Section 4.1). Furthermore, the researchers want to provide initial indications of the viability of the solution through the simulation of the mining process under nlPoW (Section 4.2). The rationale for this approach is two-fold, firstly it is expected that miners that receive a large target (small difficulty) in comparison to other miners may be able to solve the block relatively quickly with fewer computations, thereby saving the amount of energy expended by the network (as soon as a new block is announced, the rest of the network stops mining their current blocks and starts the process of mining new blocks that follow on the newly announced one). Secondly, there may arise circumstances where miners who receive a relatively small target (large difficulty) are discouraged from taking part in a block round altogether.
Bezuidenhout et al. JCPMI, 10(1): 20-32
26
The implication of the first rationale, should it hold, is based on the fact that the average block addition time as set by the original algorithm (Section 3.1), may decrease. As stated before, the 10-minute average block addition time in the original Bitcoin algorithm is an arbitrary value, but it does form the basis of the periodic target adjustment to account for changes in the computing power of the Bitcoin network. The nlPoW algorithm must retain the ability to account for changes in network computing power (Section 4.3.1).
It is very difficult to envisage the implications of the second rationale as it is impossible to predict the circumstances and motivations that drive the decision-making process of individual miners. For the purposes of this study, a simple assumption will be made that a miner will participate as long as its dynamic target is greater than, or equal to the static target (difficulty parameter) during any given target adjustment interval (Section 4.1). If the dynamic target is less than the static target, the miner will not participate.
4.1 Assigning a Random Target Assigning a dynamic target to each miner entails generating a uniformly distributed random
number in the range 0 𝑡𝑜 2256 (the possible outcomes of the SHA256 hash algorithm). Stark and Ottoboni (2018) propose that cryptographic hash functions may be useful as pseudo-random number generators. The unpredictability and collision-resistant properties of hash functions make them suitable for pseudo-random number generators.
For the purposes of this research, the cryptographic hash function provides an elegant solution to generating a pseudo-random number, but it will require a seed (input value) with specific characteristics. It is important that the seed is determined during the design of the algorithm and that it conforms to a number of guidelines that the algorithm must adhere to when selecting the seed.
Firstly, the seed must be unique to each miner so that the target calculated for each miner is different. Secondly, the information for selecting the seed must be encoded on the blockchain to allow other miners to confirm the target calculated by the successful miner and by implication, the validity of the block hash produced. Thirdly, the seed must change every time a new block is constructed so as not to provide a permanent advantage or disadvantage to any individual miner. Finally, since each miner is free to choose any strategy to its advantage, it must not be possible for the miner to manipulate the seed (generate many seeds) until it produces an easy target for itself.
One solution to this problem is to construct the seed from the miner’s coinbase address and the previous block hash with the proviso that the coinbase address must contain a previous transaction on the blockchain (the coinbase address may not be created at the same time as the block containing it). 4.2 Simulation of Dynamic Target Assignment In order to investigate the proposed solution that assigning a dynamic target from a uniform distribution to each miner, during each block round, will reduce the number of computations performed by the network to mine a new block, the mining process was simulated. During the simulation, a random target was awarded to each miner by calculating the SHA256 hash of the miner’s address in conjunction with a fictional previous block hash. The address for each miner was unique, and the previous block hash was identical for all miners.
By dividing the result of the SHA256 hash function above by 10000 and taking the remainder, a uniformly distributed random number ranging from zero to 9999 is produced. This number can be standardised to produce a uniformly distributed random number (to four decimals) in the range (0,1] (zero excluded and 1 included) by adding one and dividing by 10000.
This paper details the simulation results from two methods of using a uniformly distributed, standardised number to generate a random target for each miner, namely unidirectional random target assignment (Section 4.3) and the bidirectional random target
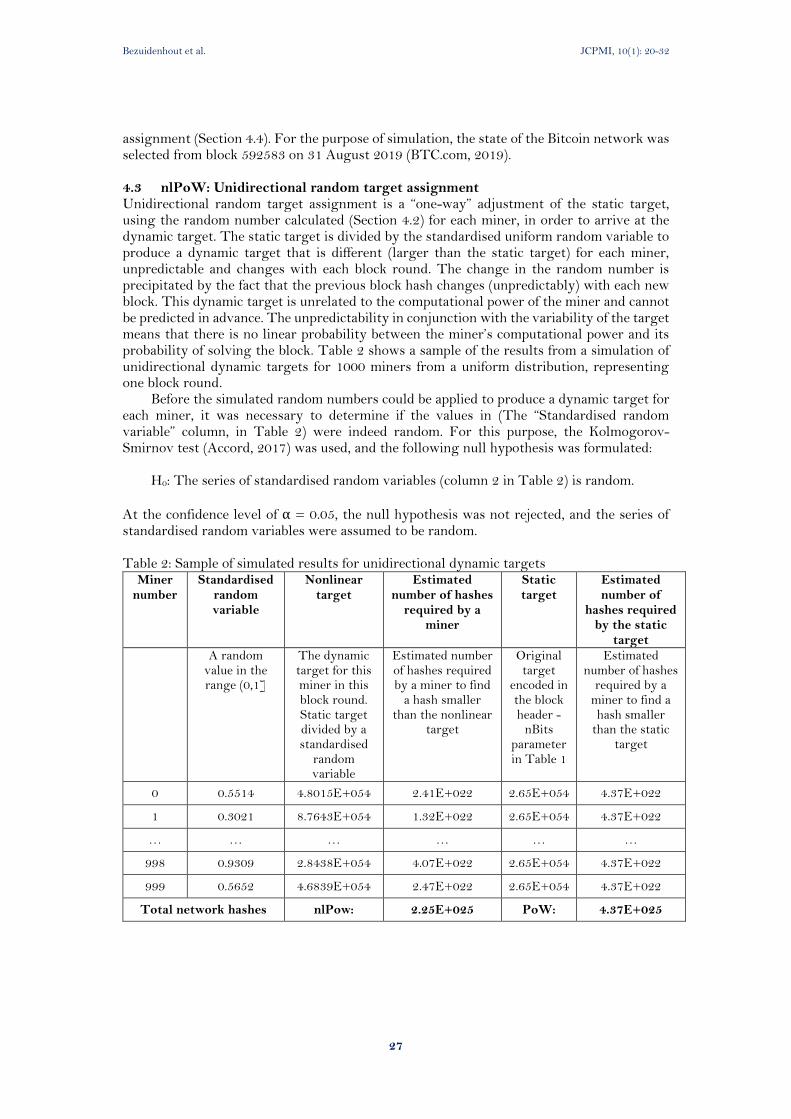
Bezuidenhout et al. JCPMI, 10(1): 20-32
27
assignment (Section 4.4). For the purpose of simulation, the state of the Bitcoin network was selected from block 592583 on 31 August 2019 (BTC.com, 2019). 4.3 nlPoW: Unidirectional random target assignment Unidirectional random target assignment is a “one-way” adjustment of the static target, using the random number calculated (Section 4.2) for each miner, in order to arrive at the dynamic target. The static target is divided by the standardised uniform random variable to produce a dynamic target that is different (larger than the static target) for each miner, unpredictable and changes with each block round. The change in the random number is precipitated by the fact that the previous block hash changes (unpredictably) with each new block. This dynamic target is unrelated to the computational power of the miner and cannot be predicted in advance. The unpredictability in conjunction with the variability of the target means that there is no linear probability between the miner’s computational power and its probability of solving the block. Table 2 shows a sample of the results from a simulation of unidirectional dynamic targets for 1000 miners from a uniform distribution, representing one block round.
Before the simulated random numbers could be applied to produce a dynamic target for each miner, it was necessary to determine if the values in (The “Standardised random variable” column, in Table 2) were indeed random. For this purpose, the Kolmogorov-Smirnov test (Accord, 2017) was used, and the following null hypothesis was formulated:
H0: The series of standardised random variables (column 2 in Table 2) is random.
At the confidence level of α = 0.05, the null hypothesis was not rejected, and the series of standardised random variables were assumed to be random. Table 2: Sample of simulated results for unidirectional dynamic targets
Miner number
Standardised random variable
Nonlinear target
Estimated number of hashes
required by a miner
Static target
Estimated number of
hashes required by the static
target A random
value in the range (0,1]
The dynamic target for this miner in this block round. Static target divided by a standardised
random variable
Estimated number of hashes required by a miner to find
a hash smaller than the nonlinear
target
Original target
encoded in the block header -
nBits parameter in Table 1
Estimated number of hashes
required by a miner to find a hash smaller
than the static target
0 0.5514 4.8015E+054 2.41E+022 2.65E+054 4.37E+022
1 0.3021 8.7643E+054 1.32E+022 2.65E+054 4.37E+022
… … … … … …
998 0.9309 2.8438E+054 4.07E+022 2.65E+054 4.37E+022
999 0.5652 4.6839E+054 2.47E+022 2.65E+054 4.37E+022
Total network hashes nlPow: 2.25E+025 PoW: 4.37E+025

Bezuidenhout et al. JCPMI, 10(1): 20-32
28
The next step determined the total number of hashes that would be calculated under existing PoW. The total estimated number of hashes that was calculated by the entire network under the existing PoW algorithm with a static target was
4.3738 ∗ 1025 ℎ𝑎𝑠ℎ𝑒𝑠 In contrast, the total estimated number of hashes that was calculated by the entire network under the nlPoW algorithm was
2.2486 ∗ 1025 ℎ𝑎𝑠ℎ𝑒𝑠 This nlPoW algorithm produces a saving of
2.215 ∗ 1025 ℎ𝑎𝑠ℎ𝑒𝑠 𝑂𝑅 48.59% The above results depict a single block round. In order to see what the results will look like over time, the simulation was extended to produce results for 2016 block rounds to represent one target readjustment interval (Table 3). Table 3: Simulated results for unidirectional dynamic target over one block adjustment interval
Rounds 2 016 Miners 1 000 Static target this interval (from block 592583 on 31 August 2019) 2.6474E+054
Average dynamic target for this interval 5.2978E+054 Expected static target time (seconds) 1 209 600 Expected adjusted interval time (seconds) 604 448 Actual simulated time (seconds) 616 784 Adjustment ratio 0.9800 Static target next interval 2.7014E+054 Expected static PoW hashes 8.8177E+028 Expected nlPoW hashes 4.4063E+028 Estimation of saving in the number of hashes (%) 50.03 Discouraged miners (%) 0.00
As a starting point, the simulated computational power of the network is derived from the selected static target and then randomly adjusted upward or downward during each block round by between 0% and 5%. These mimic the fluctuations in computational power as miners add resources to or withdraw resources from the network. At the end of the interval, an adjustment must be made to account for the net change of computational power over 2016 blocks. The mechanism employed by nlPoW to achieve this is explained in Section 4.3.1.
The estimated saving in the number of hashes executed over the interval is 50.03% which compares well with the expectation that the mean of the standardised random number for all miners during each block round should be 0.5. Since the dynamic target is larger than the static target, no miners are discouraged from mining under the assumption stated in Section 4.Since discouraging some proportion of miners is desirable, this shortcoming is addressed in Section 4.4 where the second method of using a uniformly distributed standardised number, to generate a random target for each miner, is discussed. 4.3.1 Adjusting the Static Target Section 3.1 referred to the process whereby the static target (nBits parameter in the block header) is adjusted after every 2016 blocks to account for changes in the computational power
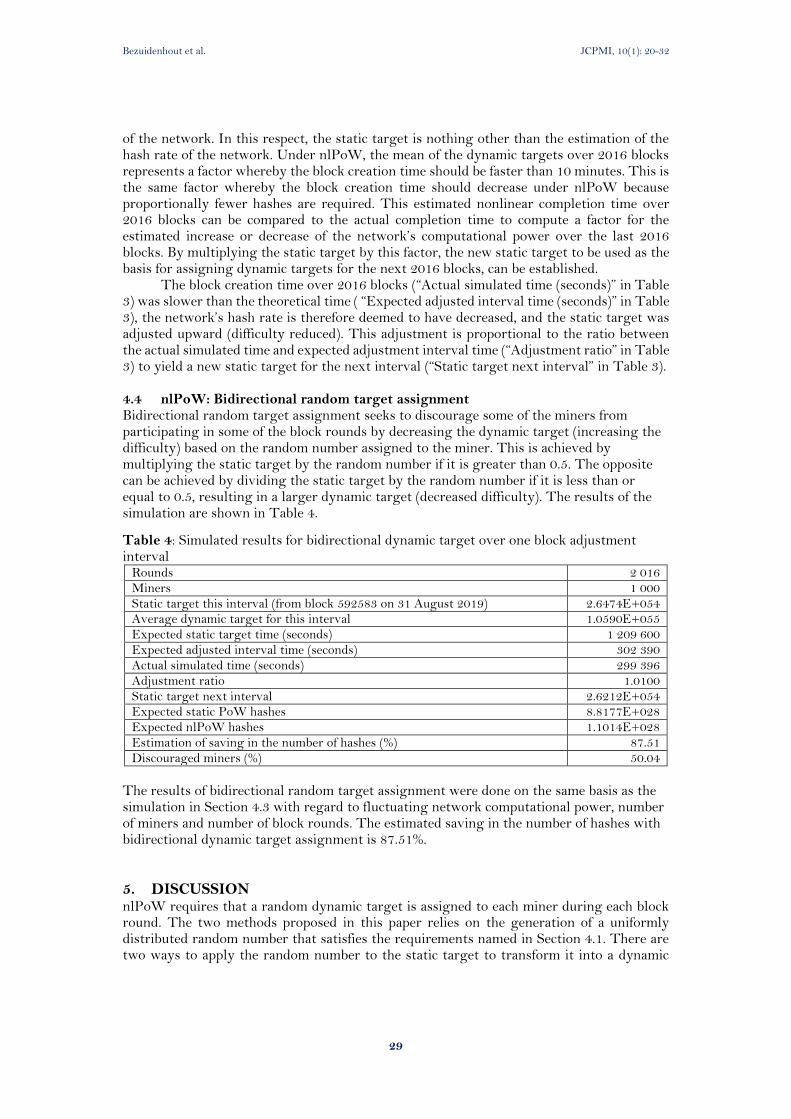
Bezuidenhout et al. JCPMI, 10(1): 20-32
29
of the network. In this respect, the static target is nothing other than the estimation of the hash rate of the network. Under nlPoW, the mean of the dynamic targets over 2016 blocks represents a factor whereby the block creation time should be faster than 10 minutes. This is the same factor whereby the block creation time should decrease under nlPoW because proportionally fewer hashes are required. This estimated nonlinear completion time over 2016 blocks can be compared to the actual completion time to compute a factor for the estimated increase or decrease of the network’s computational power over the last 2016 blocks. By multiplying the static target by this factor, the new static target to be used as the basis for assigning dynamic targets for the next 2016 blocks, can be established.
The block creation time over 2016 blocks (“Actual simulated time (seconds)” in Table 3) was slower than the theoretical time ( “Expected adjusted interval time (seconds)” in Table 3), the network’s hash rate is therefore deemed to have decreased, and the static target was adjusted upward (difficulty reduced). This adjustment is proportional to the ratio between the actual simulated time and expected adjustment interval time (“Adjustment ratio” in Table 3) to yield a new static target for the next interval (“Static target next interval” in Table 3). 4.4 nlPoW: Bidirectional random target assignment Bidirectional random target assignment seeks to discourage some of the miners from participating in some of the block rounds by decreasing the dynamic target (increasing the difficulty) based on the random number assigned to the miner. This is achieved by multiplying the static target by the random number if it is greater than 0.5. The opposite can be achieved by dividing the static target by the random number if it is less than or equal to 0.5, resulting in a larger dynamic target (decreased difficulty). The results of the simulation are shown in Table 4.
Table 4: Simulated results for bidirectional dynamic target over one block adjustment interval
Rounds 2 016 Miners 1 000 Static target this interval (from block 592583 on 31 August 2019) 2.6474E+054 Average dynamic target for this interval 1.0590E+055 Expected static target time (seconds) 1 209 600 Expected adjusted interval time (seconds) 302 390 Actual simulated time (seconds) 299 396 Adjustment ratio 1.0100 Static target next interval 2.6212E+054 Expected static PoW hashes 8.8177E+028 Expected nlPoW hashes 1.1014E+028 Estimation of saving in the number of hashes (%) 87.51
Discouraged miners (%) 50.04
The results of bidirectional random target assignment were done on the same basis as the simulation in Section 4.3 with regard to fluctuating network computational power, number of miners and number of block rounds. The estimated saving in the number of hashes with bidirectional dynamic target assignment is 87.51%.
5. DISCUSSION nlPoW requires that a random dynamic target is assigned to each miner during each block round. The two methods proposed in this paper relies on the generation of a uniformly distributed random number that satisfies the requirements named in Section 4.1. There are two ways to apply the random number to the static target to transform it into a dynamic
Bezuidenhout et al. JCPMI, 10(1): 20-32
30
target, namely unidirectional target assignment (Section 4.3) and bidirectional target assignment (Section 4.4).
Simulation shows that both methods will reduce the number of hashes required by the network and therefore, its energy consumption. Since unidirectional target assignment does not discourage mining by a proportion of the network, it is less effective than bidirectional target assignment. nlPoW provides a technique for adjusting the static target in response to changes in the computational power of the network by comparing the actual mean of the block solution times with the estimated mean solution times of the algorithm over a block target interval.
Section 3.4 referred to the myriad of other types of consensus algorithms that are available for blockchain systems. For the purposes of this study, where the preservation of decentralised consensus is of concern, algorithms that rely directly on some form of centralised control over the network of participating nodes do not apply. These include all the voting-based algorithms and some proof-based algorithms like proof-of-entanglement (Bennet & Daryanoosh, 2019), proof-of-elapsed time (Nguyen & Kim, 2018), proof-of-luck (Nguyen & Kim, 2018) and proof-of-responsibility (Coinspace.com, 2019).
Of the remaining types of proof-based algorithms, some exchange computing power (and therefore energy) with another resource such as memory, storage or human input (Blocki & Zhou, 2016; Dziembowski et al., 2015; Tromp, 2014). The authors argue that it is foreseeable that the same type of resource arms race, described in Section 3.3.1 would occur in a decentralised environment as it did with PoW in Bitcoin if they were implemented on a large scale. This may simply trade one type of problem for another.
The most promising competitors for PoW seems to be the stake-based algorithms (proof-of-stake, proof-of-importance and delegated proof-of-stake) (Bentov et al., 2016; Hasib, 2018; NEM, 2018; Zheng et al., 2017). These algorithms seek to limit the number of participating miners during each block round, which is in line with the aim of nlPoW, by ownership of blockchain tokens. Although the rules between these three algorithms vary slightly, they operate by allowing owners with larger proportions of the blockchain token, to mine a greater proportion of the transaction blocks. This may lead to hoarding strategies by miners and my in the long term reduce the randomness of the mining process and therefore its decentralised nature.
nlPoW does not compromise on the decentralised nature of the consensus process. It still relies on computational power but seeks to discourage a computational arms race, by introducing significant uncertainty for any party that aims to invest in additional computing power simply for the sake of blockchain mining. nlPoW does not require the use of any other resource as named above and does not encourage the hoarding of blockchain tokens as a strategy to increase mining success.
6. CONCLUSION The approach described in this paper establishes a new direction of research, whereby the energy wastage of PoW type consensus algorithms in blockchain systems can be addressed. It proposes the critical requirements for nlPoW that randomly distributes the targets (difficulty) of mining blocks on the Bitcoin blockchain between the population of miners. This approach aims to lower the number of hash calculations required by the network to create new blocks on the blockchain. Since the amount of energy required for Bitcoin mining is proportional to the number of hash calculations (Narayanan et al., 2016), the saving in energy usage is also directly proportional to the saving in hash calculations.
Bezuidenhout et al. JCPMI, 10(1): 20-32
31
7. FUTURE RESEARCH Although early results from simulations of Bitcoin mining under nlPoW shows promising results, further research is needed to establish the optimal distribution of dynamic targets between the population of miners. The results, as presented in this paper, distributes dynamic targets uniformly between miners, which serves the purpose of casting light on the viability of the concept. The researchers are currently investigating other types of distributions to investigate if it may yield more optimal results.
In this study, it was assumed that all miners possess equal computational power. In practice it is known that it has become infeasible for individual miners to mine Bitcoin with success (Eyal & Sirer, 2014), leading to alternative strategies like pooled mining (Tschorsch & Scheuermann, 2016). As a better understanding of nlPoW emerges, it will be necessary to investigate what effect pooled mining will have on the results.
A simplistic approach was followed with regard to the establishment of the participation threshold for each miner. In practice, the decision-making process of every miner may be different and much more complex than assumed here. This needs specific attention in future studies.
8. REFERENCES
Accord. (2017). Accord.NET Framework. Retrieved November 12, 2019, from http://accord-framework.net/docs/html/T_Accord_Statistics_Testing_KolmogorovSmirnovTest.htm
Antonopoulos, A. M. (2014). Mastering Bitcoin. O’Reilly Media. Retrieved from https://www.oreilly.com/library/view/mastering-bitcoin/9781491902639/ch05.html
Bennet, A., & Daryanoosh, S. (2019). Energy-Efficient Mining on a Quantum-Enabled Blockchain Using Light. Ledger, 4. https://doi.org/10.5195/ledger.2019.143
Bentov, I., Gabizon, A., & Mizrahi, A. (2016). Cryptocurrencies without Proof of Work. In 2016 Financial Cryptography and Data Security Conference.
BitcoinProject. (2020). Bitcoin Developer Reference. Retrieved January 12, 2020, from https://bitcoin.org/en/developer-reference
BitShares Blockchain Foundation. (n.d.). Delegated Proof-of-Stake Consensus. Retrieved August 11, 2019, from https://bitshares.org/technology/delegated-proof-of-stake-consensus/
Blocki, J., & Zhou, H.-S. (2016). Designing Proof of Human-Work Puzzles for Cryptocurrency and Beyond. In Theory of Cryptography (pp. 517–546). Springer. Retrieved from https://eprint.iacr.org/2016/145.pdf
Bonneau, J., Miller, A., Clark, J., Narayanan, A., Kroll, J. A., & Felten, E. W. (2015). SoK: Research Perspectives and Challenges for Bitcoin and Cryptocurrencies. In 2015 IEEE Symposium on Security and Privacy. Retrieved from https://ieeexplore.ieee.org/abstract/document/7163021
BTC.com. (2019). Pool Distribution. Retrieved October 11, 2019, from https://btc.com/stats/pool Central Intelligence Agency. (2020). Czech Republic. Retrieved July 22, 2019, from
https://www.cia.gov/library/publications/resources/the-world-factbook/ Coinspace.com. (2019). Electroneum’s Revolutionary Proof of Responsibility Blockchain is Now Live.
Retrieved from https://coinspace.com/news/altcoin-news/electroneums-revolutionary-proof-responsibility-blockchain-now-live
Digiconomist. (2020). Bitcoin Energy Consumption Index. Retrieved April 7, 2019, from https://digiconomist.net/bitcoin-energy-consumption
Dimitri, N. (2017). Bitcoin Mining as a Contest. Ledger, 96. Dziembowski, S., Faust, S., Kolmogorov, V., & Pietrzak, K. (2015). Proofs of space. In CRYPTO:
International Cryptology Conference. https://doi.org/10.1007/978-3-662-48000-7_29 Eyal, I., Gencer, A. E., Sirer, E. G., & Van Renesse, R. (2016). Bitcoin-NG: A Scalable Blockchain
Protocol. In 13th USENIX Symposium on Networked Systems Design and Implementation. Santa Clara.
Eyal, I., & Sirer, E. G. (2014). Majority is not Enough: Bitcoin Mining is Vulnerable. In 18th International Conference on Financial Cryptography and Data Security.
Fischer, M. J. (1983). The Consensus Problem in Unreliable Distributed Systems. In International Conference on Foundations of Computation Theory.
Bezuidenhout et al. JCPMI, 10(1): 20-32
32
Hasib, A. (2018). 101 Blockchains. Retrieved from https://101blockchains.com/consensus-algorithms-blockchain/#6
Jenks, T. (2018). Pros and Cons of Different Blockchain Consensus Protocols. Retrieved from https://www.verypossible.com/blog/pros-and-cons-of-different-blockchain-consensus-protocols
Ma, J., Gans, J. S., & Tourky, R. (2018). Market Structure in Bitcoin Mining (No. 24242). Cambridge, MA.
Mulár, B. O. (Masaryk U. (2018). Blockchain technology in the enterprise environment. Nakamoto, S. (2008). Bitcoin: A Peer-to-Peer Electronic Cash System. Narayanan, A., Bonneau, J., Felten, E., Miller, A., & Goldfeder, S. (2016). Bitcoin and Cryptocurrency
Technologies. Princeton: Princeton University Press. NEM. (2018). Proof-of-importance. Retrieved from https://nemplatform.com/wp-
content/uploads/2020/05/NEM_techRef.pdf Nguyen, G.-T., & Kim, K. (2018). A Survey about Consensus Algorithms Used in Blockchain. Journal
of Information Processing Systems, 14(1). P4Titan. (2014). Slimcoin: A Peer-to-Peer Crypto-Currency with Proof-of-Burn. Retrieved from
https://www.doc.ic.ac.uk/~ids/realdotdot/crypto_papers_etc_worth_reading/proof_of_burn/slimcoin_whitepaper.pdf
Stark, P. B., & Ottoboni, K. (2018). Random Sampling: Practice Makes Imperfect. ArXiv.Org. Retrieved from https://arxiv.org/pdf/1810.10985.pdf
Tromp, J. (2014). Cuckoo Cycle: a memory bound graph-theoretic proof-of-work. Retrieved from https://eprint.iacr.org/2014/059.pdf
Tschorsch, F., & Scheuermann, B. (2016). Bitcoin and Beyond: A Technical Survey on Decentralized Digital Currencies. IEEE Communications Surveys & Tutorials, 2084–2123.
Zheng, Z., Xi, S., Dai, H., Chen, X., & Wang, H. (2017). An Overview of Blockchain Technology: Architecture, Consensus, and Future Trends. In 2017 IEEE 6th International Congress on Big Data.
Journal of Construction Project Management and Innovation, 10 (1): 33-41, 2020
ISSN 2223-7852 © Sustainable Human Settlement and Construction Research Centre DOI: https://doi.org/10.36615/jcpmi.v10i1.352
33
A SCHEMA FOR IMPROVING CONSTRUCTION SAFETY WITH UNMANNED AERIAL VEHICLES
Lesiba George MOLLO1, Fidelis EMUZE2, John SMALLWOOD3
1&2Department of Built Environment, Central University of Technology, Free State,
South Africa 3Department of construction management, Nelson Mandela University, Port Elizabeth,
South Africa
Email: [email protected]; [email protected]; [email protected]
ABSTRACT This article aims to outline how to deploy unmanned aerial vehicles (UAVs) for on sites use in South African construction. The use of UAVs is gaining traction in the construction industry, where cyber-physical systems are promoting digital-to physical transformation. Among others, UAVs help assures the safety of people in construction. For instance, they are controlled remotely while moving faster than humans into inaccessible, hard-to-reach, and unsafe areas of job sites. They can be equipped with various types of sensors to transfer valuable data to safety managers and assist with onsite safety monitoring. Based on realised gains and the need to motivate its use, this article uses presents a schema that could help managers deploy UAVs on construction sites for safety performance purposes. The literature-based report utilised the keywords unmanned aerial vehicles and safety in construction to search the relevant database. The findings reveal that the critical hazards on construction sites can be identified using UAVs to allow proactive execution of accident prevention methods. Given that the captured visual images and video clips provide site management with a bird's eye view of a site, corrective measures can be implemented through 'walkabout' and instant instructions. The virtual images and video clips also help to identify hazards and risks that may cause accidents on construction sites. There is significant scope for using UAVs to improve construction safety when appropriate guidelines are implemented. Keywords: Construction, Project, Safety, Virtualisation, UAVs
1. INTRODUCTION The industry is regarded as one of the most high-risk industries where workers are exposed to numerous forms of harm that result in accidents (Shafique and Rafiq, 2019). Most accidents result from human actions that are derived from an inadequate safety management system (SMS). Thus, there is a need to reduce risks and hazards in construction and this need encouraged researchers and practitioners to search for innovative methods, technics, and technologies. Despite innovative methods of construction or the adoption of technologies, safety at work is a complex phenomenon, and often the adopted process of construction works exposes the workers to hazards that might result with accidents causing either injury or fatality (Yanar et al., 2018). To solve this reported problem, most of the construction organisations have opted to design safe work procedures that have the primary purpose of managing safety on sites (Rae and Provan, 2019). In addition, safety at work is concerned with the workers, and most of the workers have an informal and oral culture of risks, in which safety is rarely openly expressed in the workplace (Kines et al., 2010).
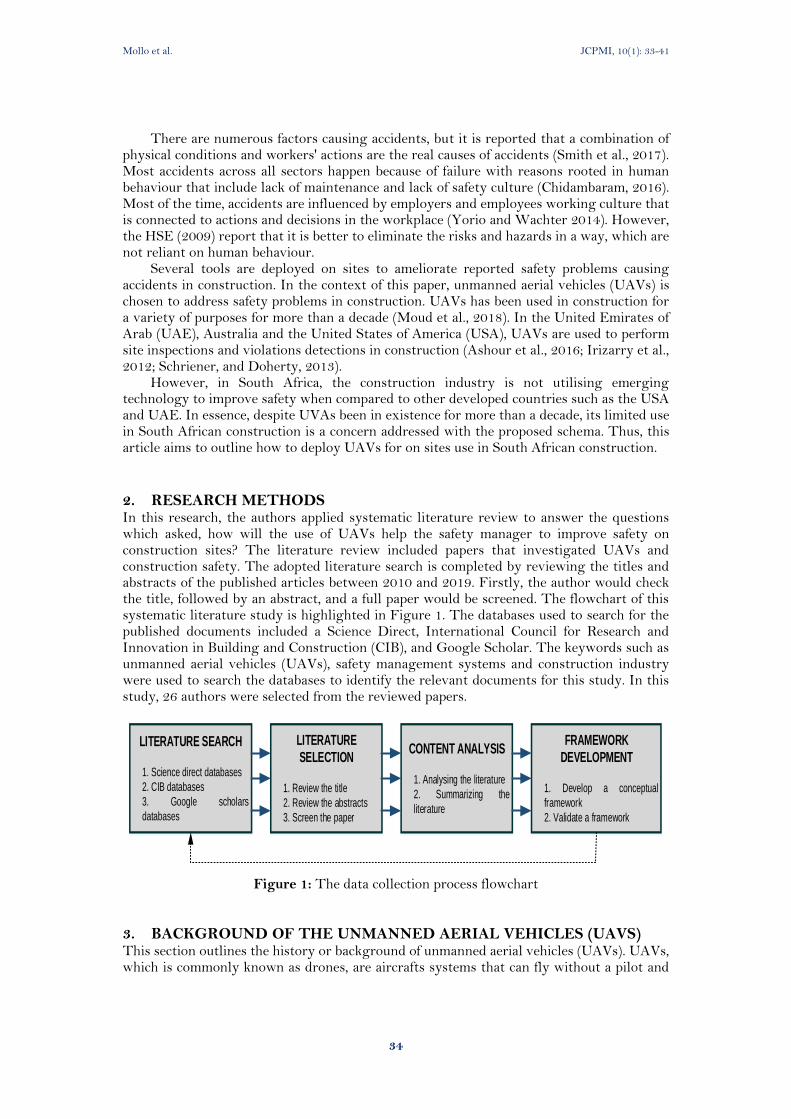
Mollo et al. JCPMI, 10(1): 33-41
34
There are numerous factors causing accidents, but it is reported that a combination of physical conditions and workers' actions are the real causes of accidents (Smith et al., 2017). Most accidents across all sectors happen because of failure with reasons rooted in human behaviour that include lack of maintenance and lack of safety culture (Chidambaram, 2016). Most of the time, accidents are influenced by employers and employees working culture that is connected to actions and decisions in the workplace (Yorio and Wachter 2014). However, the HSE (2009) report that it is better to eliminate the risks and hazards in a way, which are not reliant on human behaviour.
Several tools are deployed on sites to ameliorate reported safety problems causing accidents in construction. In the context of this paper, unmanned aerial vehicles (UAVs) is chosen to address safety problems in construction. UAVs has been used in construction for a variety of purposes for more than a decade (Moud et al., 2018). In the United Emirates of Arab (UAE), Australia and the United States of America (USA), UAVs are used to perform site inspections and violations detections in construction (Ashour et al., 2016; Irizarry et al., 2012; Schriener, and Doherty, 2013).
However, in South Africa, the construction industry is not utilising emerging technology to improve safety when compared to other developed countries such as the USA and UAE. In essence, despite UVAs been in existence for more than a decade, its limited use in South African construction is a concern addressed with the proposed schema. Thus, this article aims to outline how to deploy UAVs for on sites use in South African construction.
2. RESEARCH METHODS In this research, the authors applied systematic literature review to answer the questions which asked, how will the use of UAVs help the safety manager to improve safety on construction sites? The literature review included papers that investigated UAVs and construction safety. The adopted literature search is completed by reviewing the titles and abstracts of the published articles between 2010 and 2019. Firstly, the author would check the title, followed by an abstract, and a full paper would be screened. The flowchart of this systematic literature study is highlighted in Figure 1. The databases used to search for the published documents included a Science Direct, International Council for Research and Innovation in Building and Construction (CIB), and Google Scholar. The keywords such as unmanned aerial vehicles (UAVs), safety management systems and construction industry were used to search the databases to identify the relevant documents for this study. In this study, 26 authors were selected from the reviewed papers.
LITERATURE SEARCH
1. Science direct databases
2. CIB databases
3. Google scholars
databases
LITERATURE
SELECTION
1. Review the title
2. Review the abstracts
3. Screen the paper
CONTENT ANALYSIS
1. Analysing the literature
2. Summarizing the
literature
FRAMEWORK
DEVELOPMENT
1. Develop a conceptual
framework
2. Validate a framework
Figure 1: The data collection process flowchart
3. BACKGROUND OF THE UNMANNED AERIAL VEHICLES (UAVS) This section outlines the history or background of unmanned aerial vehicles (UAVs). UAVs, which is commonly known as drones, are aircrafts systems that can fly without a pilot and
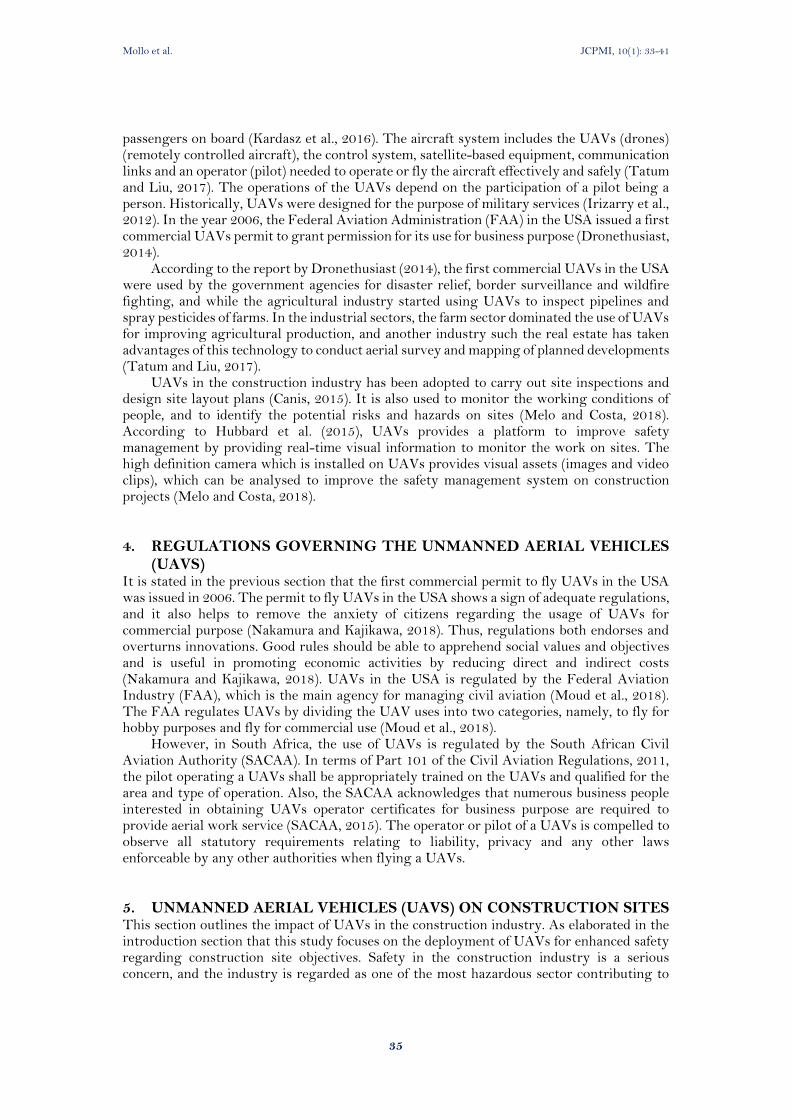
Mollo et al. JCPMI, 10(1): 33-41
35
passengers on board (Kardasz et al., 2016). The aircraft system includes the UAVs (drones) (remotely controlled aircraft), the control system, satellite-based equipment, communication links and an operator (pilot) needed to operate or fly the aircraft effectively and safely (Tatum and Liu, 2017). The operations of the UAVs depend on the participation of a pilot being a person. Historically, UAVs were designed for the purpose of military services (Irizarry et al., 2012). In the year 2006, the Federal Aviation Administration (FAA) in the USA issued a first commercial UAVs permit to grant permission for its use for business purpose (Dronethusiast, 2014).
According to the report by Dronethusiast (2014), the first commercial UAVs in the USA were used by the government agencies for disaster relief, border surveillance and wildfire fighting, and while the agricultural industry started using UAVs to inspect pipelines and spray pesticides of farms. In the industrial sectors, the farm sector dominated the use of UAVs for improving agricultural production, and another industry such the real estate has taken advantages of this technology to conduct aerial survey and mapping of planned developments (Tatum and Liu, 2017).
UAVs in the construction industry has been adopted to carry out site inspections and design site layout plans (Canis, 2015). It is also used to monitor the working conditions of people, and to identify the potential risks and hazards on sites (Melo and Costa, 2018). According to Hubbard et al. (2015), UAVs provides a platform to improve safety management by providing real-time visual information to monitor the work on sites. The high definition camera which is installed on UAVs provides visual assets (images and video clips), which can be analysed to improve the safety management system on construction projects (Melo and Costa, 2018).
4. REGULATIONS GOVERNING THE UNMANNED AERIAL VEHICLES (UAVS)
It is stated in the previous section that the first commercial permit to fly UAVs in the USA was issued in 2006. The permit to fly UAVs in the USA shows a sign of adequate regulations, and it also helps to remove the anxiety of citizens regarding the usage of UAVs for commercial purpose (Nakamura and Kajikawa, 2018). Thus, regulations both endorses and overturns innovations. Good rules should be able to apprehend social values and objectives and is useful in promoting economic activities by reducing direct and indirect costs (Nakamura and Kajikawa, 2018). UAVs in the USA is regulated by the Federal Aviation Industry (FAA), which is the main agency for managing civil aviation (Moud et al., 2018). The FAA regulates UAVs by dividing the UAV uses into two categories, namely, to fly for hobby purposes and fly for commercial use (Moud et al., 2018).
However, in South Africa, the use of UAVs is regulated by the South African Civil Aviation Authority (SACAA). In terms of Part 101 of the Civil Aviation Regulations, 2011, the pilot operating a UAVs shall be appropriately trained on the UAVs and qualified for the area and type of operation. Also, the SACAA acknowledges that numerous business people interested in obtaining UAVs operator certificates for business purpose are required to provide aerial work service (SACAA, 2015). The operator or pilot of a UAVs is compelled to observe all statutory requirements relating to liability, privacy and any other laws enforceable by any other authorities when flying a UAVs.
5. UNMANNED AERIAL VEHICLES (UAVS) ON CONSTRUCTION SITES This section outlines the impact of UAVs in the construction industry. As elaborated in the introduction section that this study focuses on the deployment of UAVs for enhanced safety regarding construction site objectives. Safety in the construction industry is a serious concern, and the industry is regarded as one of the most hazardous sector contributing to
Mollo et al. JCPMI, 10(1): 33-41
36
serious accidents rate worldwide (Li et al., 2015; Yanar et al., 2018; Kines et al., 2010). The causes of accidents in the construction industry are rooted in the working conditions of people. Notably, construction sites could be overcrowded with workers who are exposed to high risks duties such as operating at height and outdoors and with heavy machinery and equipment (Cheng et al., 2012). Numerous factors are contributing to the worker's safety through the interactions among the workers and the work environment (Zhang et al., 2019). Thus, it is essential to monitor the working environment of the workers to improve safety in the construction industry. The use of modern technologies on construction sites is one of the most recent interventions used to monitor and improve safety on construction sites.
As explained by Tatum and Liu (2017, cited in Melo and Costa, 2018), UAVs are used to improve the working conditions on construction sites. For example, UAVs could be used to investigate the worker's safety-related behaviours through site inspections. However, it is critical for a UAVs operator to explore the site project which UAVs would be deployed to and to determine the area which would be suitable to capture the images and videos of a site project (Melo et al., 2017). It should be acknowledged that safety inspections are the responsibility of a safety manager on a site project (Irizarry et al., 2012). The safety inspection process is carried out by regularly walking and taking direct observations of the site activities or tasks by a safety manager.
The competency of a safety manager on construction sites can be increased significantly with the use of UAVs (Tatum and Liu, 2017). The use of UAVs in the construction industry is continually changing the safety managers task of direct observation onsite works and interacts with the workers (Hubbard et al., 2015). UAVs improves site inspection by providing real-time inspection and surveillance from the site project in the form of a high-definition (HD) images and videos (Figure 2 and 3) (Schriener, and Doherty, 2013). For instance, Figure 2 shows the application on how a safety manager use UAVs to monitor specific locations that were determined in the design phase to be hazardous and to detect other dangerous situations and their places in the Jobsite (Alizadehsalehi et al. 2018).
Figure 2: 3D simulation of monitoring in the construction phase (Source: Alizadehsalehi, et al. 2018)
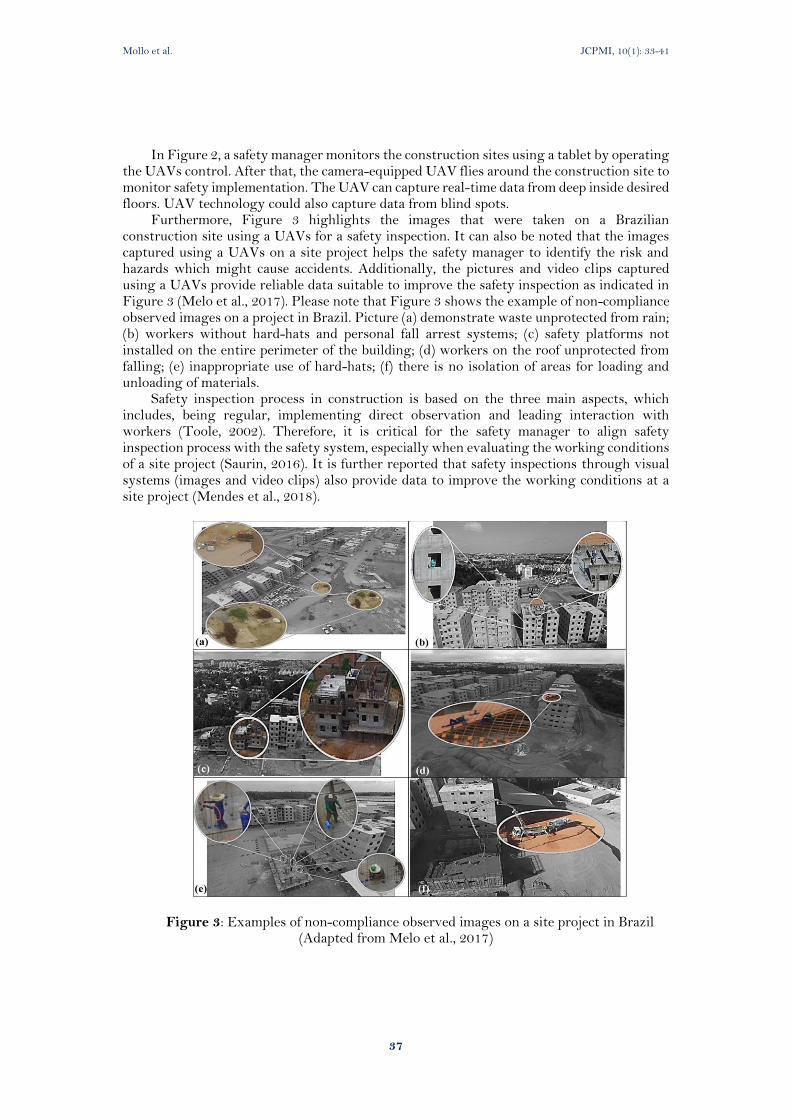
Mollo et al. JCPMI, 10(1): 33-41
37
In Figure 2, a safety manager monitors the construction sites using a tablet by operating
the UAVs control. After that, the camera-equipped UAV flies around the construction site to monitor safety implementation. The UAV can capture real-time data from deep inside desired floors. UAV technology could also capture data from blind spots.
Furthermore, Figure 3 highlights the images that were taken on a Brazilian construction site using a UAVs for a safety inspection. It can also be noted that the images captured using a UAVs on a site project helps the safety manager to identify the risk and hazards which might cause accidents. Additionally, the pictures and video clips captured using a UAVs provide reliable data suitable to improve the safety inspection as indicated in Figure 3 (Melo et al., 2017). Please note that Figure 3 shows the example of non-compliance observed images on a project in Brazil. Picture (a) demonstrate waste unprotected from rain; (b) workers without hard-hats and personal fall arrest systems; (c) safety platforms not installed on the entire perimeter of the building; (d) workers on the roof unprotected from falling; (e) inappropriate use of hard-hats; (f) there is no isolation of areas for loading and unloading of materials.
Safety inspection process in construction is based on the three main aspects, which includes, being regular, implementing direct observation and leading interaction with workers (Toole, 2002). Therefore, it is critical for the safety manager to align safety inspection process with the safety system, especially when evaluating the working conditions of a site project (Saurin, 2016). It is further reported that safety inspections through visual systems (images and video clips) also provide data to improve the working conditions at a site project (Mendes et al., 2018).
Figure 3: Examples of non-compliance observed images on a site project in Brazil (Adapted from Melo et al., 2017)
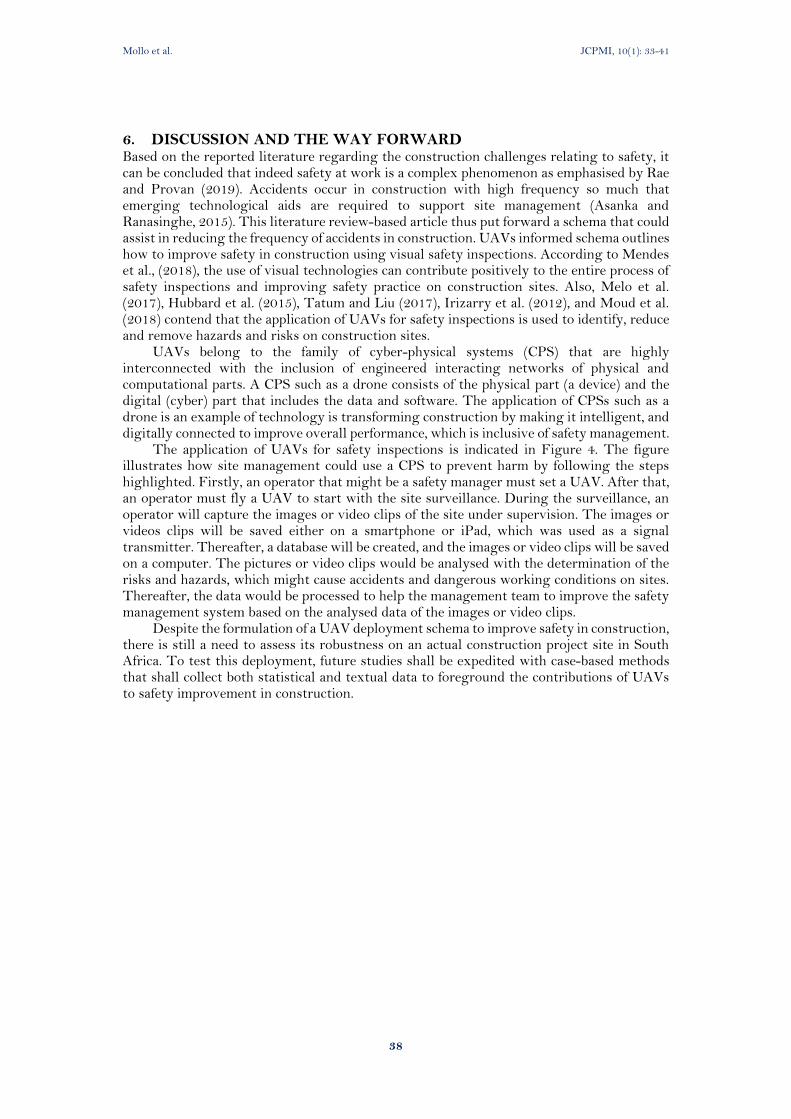
Mollo et al. JCPMI, 10(1): 33-41
38
6. DISCUSSION AND THE WAY FORWARD Based on the reported literature regarding the construction challenges relating to safety, it can be concluded that indeed safety at work is a complex phenomenon as emphasised by Rae and Provan (2019). Accidents occur in construction with high frequency so much that emerging technological aids are required to support site management (Asanka and Ranasinghe, 2015). This literature review-based article thus put forward a schema that could assist in reducing the frequency of accidents in construction. UAVs informed schema outlines how to improve safety in construction using visual safety inspections. According to Mendes et al., (2018), the use of visual technologies can contribute positively to the entire process of safety inspections and improving safety practice on construction sites. Also, Melo et al. (2017), Hubbard et al. (2015), Tatum and Liu (2017), Irizarry et al. (2012), and Moud et al. (2018) contend that the application of UAVs for safety inspections is used to identify, reduce and remove hazards and risks on construction sites.
UAVs belong to the family of cyber-physical systems (CPS) that are highly interconnected with the inclusion of engineered interacting networks of physical and computational parts. A CPS such as a drone consists of the physical part (a device) and the digital (cyber) part that includes the data and software. The application of CPSs such as a drone is an example of technology is transforming construction by making it intelligent, and digitally connected to improve overall performance, which is inclusive of safety management.
The application of UAVs for safety inspections is indicated in Figure 4. The figure illustrates how site management could use a CPS to prevent harm by following the steps highlighted. Firstly, an operator that might be a safety manager must set a UAV. After that, an operator must fly a UAV to start with the site surveillance. During the surveillance, an operator will capture the images or video clips of the site under supervision. The images or videos clips will be saved either on a smartphone or iPad, which was used as a signal transmitter. Thereafter, a database will be created, and the images or video clips will be saved on a computer. The pictures or video clips would be analysed with the determination of the risks and hazards, which might cause accidents and dangerous working conditions on sites. Thereafter, the data would be processed to help the management team to improve the safety management system based on the analysed data of the images or video clips.
Despite the formulation of a UAV deployment schema to improve safety in construction, there is still a need to assess its robustness on an actual construction project site in South Africa. To test this deployment, future studies shall be expedited with case-based methods that shall collect both statistical and textual data to foreground the contributions of UAVs to safety improvement in construction.
Mollo et al. JCPMI, 10(1): 33-41
39
Unmanned aerial vehicle
(UAV)
Safety inspections or
surveillance
Visualization
Images and video clips
Set a UAV
Fly UAV to a site project
Take images or video clips using high definition
(HD) camera installed on a UAV
Data storage
Data analysis
Saving images or video clips taken by a UAV on
a computer (creating a database)
Data processing
Identifying the risks and hazards from the site
images or videos
Improving the safety management systems
Figure 4. A schema for improving construction safety through UAVs
7. REFERENCES Alizadehsalehi, S., Yitmen, I., Celik, T. and Arditi, D. (2018). The effectiveness of an
integrated BIM/UAV model in managing safety on construction sites. International Journal of Occupational Safety and Ergonomics 1-18.
Asanka, W.A. and Ranasinghe, M. (2015). Study on the impact of accidents on construction projects. 6th international conference on structural engineering and construction management. Kandy, Sri Lanka: CSECM. 58-67.
Ashour, R., Taha, T., Mohamed, F., Hableel, E. and Abu Kheil, Y. (2016). Site Inspection Drone: A Solution for Inspecting and." IEEE 59th International Midwest Symposium on Circuits and Systems. Abu Dhabi, UAE.
Baird, R. (2018). Systematic reviews and meta-analytic techniques. Seminars in Pediatric Surgery 27, 338-344.
Canis, B. (2015). Unmanned Aircraft Systems (UAS): Commercial Outlook for a New Industry. Washington DC: Congressional Research Service (CRS).
Cheng, E.W.L., Ryan, N. and Kelly, S. (2012). Exploring the perceived influence of safety management practices on project performance in the construction industry. Safety Science 50, 363-369.
Chidambaram, P. (2016). Perspectives on human factors in a shifting operational environment. Journal of Loss Prevention in the Process Industries 44, 112-118.
Choudhry, R.M. (2014). Behavior-based safety on construction sites: A case study. Accident Analysis and Prevention 70, 14-23.
Dronethusiast (2014). The History Of Drones (Drone History Timeline From 1849 To 2019). Accessed March 11, 2019. https://www.dronethusiast.com/history-of-drones/.
Mollo et al. JCPMI, 10(1): 33-41
40
Health and Safety Executive (HSE) (2009). Reducing error and influencing behaviour. London: Health and Safety Executive.
Hubbard, B., Wang, H., Leasure, M., Ropp, T., Lofton, T., Hubbard, S. and Lin, S. (2015). Feasibility Study of UAV use for RFID Material Tracking on Construction Sites. Associated Schools of Construction Proceedings of the 51st Annual International Conference. Texas: ASC.
Irizarry, J., Gheisari, M. and Walker, B.N. (2012). Usability assessment of drone technology as safety inspection tools. Journal of Information Technology in Construction 17, 194-212.
Kardasz, P., Doskocz, J., Hejduk, M., Wiejkut, P. and Zarzycki, H. (2016). Drones and Possibilities of Their Using. Journal of Civil & Environmental Engineering 6 (3), 1-7.
Kines, P., Andersen, L.P.S., Spangenberg, S., Mikkelsen, K.L. and Dyreborg, J. (2010). Improving construction site safety through leader-based verbal safety communication. Journal of Safety Research 41, 399-406.
Li, H., Lu, M., Hsu, S., Gray, M. and Huang, T. (2015). Proactive behavior-based safety management for construction safety improvement. Safety Science 75, 107-117.
Melo, R.R. and Costa, D.B. (2018). Contributions of resilence engineering and visual technology to safety planning and control process. Edited by T.A., Costa, D.B., Behm, M., and Emuze, F Saurin. Joint CIB W099 and TG59 International Safety, Health, and People in Construction Conference. Salvador, Brazil. 13-22.
Melo, R.R., Costa, D.B., Álvares, J.S. and Irizarry, J. (2017). Applicability of unmanned aerial system (UAS) for safety inspection on construction sites. Safety Science 98, 174-185.
Mendes, C.M., Silveira, B.F., Costa, D.B. and Melo, R.S. (2018). Evaluating USA-image pattern recognition system application for safety guardrails inspection. Proceedings of the Joint CIB W099 and TG59 Conference Coping with the Complexity of Safety, Health, and Wellbeing in Construction. Salvador, Brazil. 23-32.
Moud, H.I., Shojaei, A., Flood, I., Zhang, X. and Hatami, M. (2018). Qualitative and Quantitative Risk Analysis of Unmanned Aerial Vehicle Flights over Construction Job Sites. Eighth International Conference on Advanced Communications and Computation, INFOCOMP. Barcelona, Spain.
Nakamura, H. and Kajikawa, Y. (2018). Regulation and innovation: How should small unmanned aerial vehicles be regulated? Technological Forecasting & Social Change 128, 262-274.
Rae, A. and Provan, D. (2019). Safety work versus the safety of work. Safety Science 111, 119-127.
Saurin, T.A. (2016). Safety inspections in construction sites: A systems thinking perspective. Accident Analysis and Prevention 93, 240-250.
Schriener, J. and Doherty, P. (2013). Drones Show Potential to Aid Jobsite Safety and Efficiency. July 25. Accessed March 15, 2019. http://constructionexec.com/article/drones-show-potential-to-aid-jobsite-safety-and-efficiency.
Shafique, M. and Rafiq, M. (2019). An Overview of Construction Occupational Accidents in Hong Kong: A Recent Trend and Future Perspectives. Applied Science 9 (2069), 1-16.
Shen, Y., Tuuli, M.M., Xia, B., Koh, T.Y. and Rowlinson, S. (2015). Toward a model for forming psychological safety climate in construction project management. International Journal of Project Management 33, 223–235.
Smith, S.D, Sherratt, F. and Oswald, D.C. (2017). The antecedents and development of unsafety. Proceedings of the Institute of Civil Engineers - Management, Procurement and Law 170 (MP2), 59-67.
South African Civil Aviation Authority (SACAA) (2015). Remote pilot licence: training, examination and application for RPL requirements. Johannesburg: SACAA.
Mollo et al. JCPMI, 10(1): 33-41
41
Tatum, M.C. and Liu, J. (2017). Unmanned Aircraft System Applications In Construction." Procedia Engineering 196, 167-175.
Toole, T.M. (2002). Construction site safety roles. Journal of Construction Engineering and Management 128(3), 203-210.
Wang, D., Wang, X. and Xia, N. (2018). How safety-related stress affects workers’ safety behavior: The moderating role of psychological capital." Safety Science 103: 247-259.
Yanar, B., Lay, M., and Smith, P.M. (2018). The Interplay Between Supervisor Safety Support and Occupational Health and Safety Vulnerability on Work Injury. Safety and Health at Work 10(2), 172-179.
Yorio, P. and Wachter, J.K. (2014). The impact of human performance focused safety and health management practices on injury and illness rates: Do size and industry matter?" Safety Science 62, 157-167.
Zhang, P., Li, N., Jiang, Z., Fang, D. and Anumbad, C.J. (2019). An agent-based modeling approach for understanding the effect of worker management interactions on construction workers' safety-related behaviors. Automation in Construction 97, 29-43.
Journal of Construction Project Management and Innovation, 10 (1): 42-54, 2020
ISSN 2223-7852 © Sustainable Human Settlement and Construction Research Centre DOI: https://doi.org/10.36615/jcpmi.v10i1.346
42
A PRINCIPAL COMPONENT ANALYSIS OF KNOWLEDGE MANAGEMENT SUCCESS FACTORS
IN CONSTRUCTION FIRMS IN NIGERIA
Taiwo F. ADEGBEMBO1, Oluwaseyi AWODELE2, and Ayodeji OKE3
1Department of Quantity Surveying, Federal University of Technology, Akure, Ondo State, Nigeria
Email: [email protected]; [email protected]; [email protected]
ABSTRACT Construction firms are knowledge-intensive organisations as employees use knowledge in their day to day activities; however, managing this knowledge is essential for improved service delivery. Knowledge Management (KM) has been affirmed to be of great benefit and improve the performance of organisations and particularly quantity surveying firms in Nigeria so, therefore, the need to assess the factors critical to the implementation of KM. Quantitative data was collected through the use of questionnaire from eighty-six quantity surveyors from quantity surveying firms in the southwestern geopolitical zone of Nigeria which comprises of six states using census sampling. Descriptive and inferential statistics were used to analyse the data collected, and the result discussed. Mean Item Score was used to rank the factors while data reduction technique was used to ascertain the factors critical to the implementation of KM. The Kaiser-Meyer-Olkin measure of sampling adequacy and Bartlett’s test of sphericity were conducted before the data were subjected to principal component analysis and the results indicated that the data set is suitable for factor analysis. Five constructs of CSF, namely; Organisation and Leadership, Resources, Management involvement, Information technology and culture were developed from the Principal Component Analysis (PCA) with a significant value ranging from 0.524 - 0.776. The reliability of each construct was tested using Cronbach Alpha coefficient, and the values arrived at are; 0.87, 0.885, 0.882, 0.903 and 0.749 respectively. The study revealed that the significance of KM critical success factors is well acknowledged by quantity surveyors in quantity surveying firms and the findings contributed to knowledge by introducing five factors critical to the success of KM. The study recommends that these factors should be given adequate attention for successful KM implementation in quantity surveying firms in Nigeria. Keywords: Critical success factors, Knowledge management, Principal component analysis, Nigeria
1. INTRODUCTION The construction industry, according to Hsu (2008), is a knowledge-intensive industry, because the industry uses the skills, knowledge and experience of individuals in its day to day activities. The construction industry has become more and more complex with challenges as a result of globalisation, internalisation of markets, liberalisation of trades, deregulation and knowledge economy (Hari, Egbu & Kumar, 2005). This knowledge-based economy requires that good practices are available in organisations to improve the effectiveness of the organisation (Omotayo, 2015). In facing these challenges, construction companies need to have appropriate strategies to stay relevant in the industry, and KM has been identified as one of such strategies. Organisations are, therefore, dependent on applying

Adegbembo et al. JCPMI, 10(1): 42-54
43
KM along with natural resources and tangible assets to achieve high performance (Lee & Sukoco, 2007).
According to Omotayo (2015), organisations have stopped to compete entirely on capital and financial strength but now compete based on the knowledge possessed by the organisation as knowledge has become the new competitive advantage in business (Okunoye, 2003). As such, knowledge ought to be protected, nurtured and shared among the people who work together within the organisation. Knowledge is considered the most valuable and precious asset of organisations (Sharif, Yaqub, Khan & Javed, 2014; Idris & Kolawole, 2016) and its benefits in quantity surveying firms in Nigeria has been affirmed (Awodele et al., 2015). The growing role of knowledge has made organisations move from other management practices to KM (Okunoye, 2003; Cho & Korte, 2014). This has lead Durst and Edvardsson (2012) to recommend that small organisations such as quantity surveying firms have to include KM to their daily activities so that they can stay stronger and perform better.
Studies have established that KM has been embraced in the Nigerian construction industry (Oke, Ogunsemi & Adeeko, 2013, Zuofa, et al., 2015; Idris & Kolawole, 2016; Idris, Bhadmus & Kadri, 2017) as well as in quantity surveying firms (Adegbembo, et al., 2015; Awodele, Adegbembo & Ajayi, 2015). Previous research on KM within Nigeria mainly addressed KM awareness, perception of benefits, challenges (Oke et al., 2013; Adegbembo et al., 2015; Awodele et al., 2015; Zuofa et al., 2015; Idris et al., 2017). Idris and Kolawole (2016), on the other hand, assessed the influence of KM success factors on organisational performance of construction firms with the focus on project managers in the construction industry. However, KM is still a new and evolving practice for the construction industries in developing countries like Nigeria (Idris, Ali & Aliagha, 2015).
While a considerable number of studies have identified success factors critical to the success of KM implementation, no known study has been conducted among quantity surveyors in the southwestern region of Nigeria using the principal component method. Due to the nature and scope of quantity surveying firms and using Principal Component Analysis (PCA), this study seeks to reveal the key success factors of KM with the focus on quantity surveying firms in Nigeria.
2. CRITICAL SUCCESS FACTORS OF KOWNLEDG MANAGEMENT According to Idris and Kolawole (2016), Critical Success Factors (CSF) are the processes, activities and techniques that need to be considered for the successful implementation of KM in an organisation. These processes and techniques need to be developed in an organisation for KM to work successfully. Implementing KM is crucial so organisations need to be aware of the factors which will influence the success of KM initiative. The ignorance or oversight of these factors may hinder an organisation’s effort in achieving the full benefit of KM (Wong, 2005). KM success factors can be seen as facilitating factors for a KM initiative and measurement of KM can be used as one of the means of providing an understanding of how it should be developed and implemented (Jennex & Olfman, 2004).
A series of researches on the CSF’s inherent in KM has been carried out (Skyrme & Amidon, 1997; Egbu et al., 2010; Abdelrahman & Papmichail, 2016). Anantatmula and Kanungo (2007), established fourteen factors important in determining the success of a KM project. These factors are leadership, top management support, culture, strategic focus, budgetary support, communication, formalisation, collaboration, content quality, KM processes, top management involvement, technology infrastructure and measurement of
results. Dalotă and Grigore (2010), on the other hand, had a deep look at the critical factors that play major roles in implementing a KM system in a small to medium-sized enterprise. These factors include leadership and support, processes and activities, motivational aids, resources, culture, information technology, strategy and purpose, measurement, organisational infrastructure, training and education, and human resource management. The

Adegbembo et al. JCPMI, 10(1): 42-54
44
top three factors from the findings of the research are senior management support and leadership, a knowledge friendly culture, and a clear strategy for managing knowledge while developing technological infrastructure, giving incentives to encourage KM practices and measuring the effectiveness of KM was the least.
Concurrently, Yu, Kim and Kim (2004), identified three main factor dimensions and nine factors. These are Organisational characteristics which consist of learning orientation, communication, knowledge sharing, flexibility; IT comprising of KM system quality, KM system functionality and thirdly managerial support consisting of top management support, KM reward and KM team activity. Wong (2005) outlined eleven critical factors that affect KM initiatives, which are top management support, organisational culture, information technology, organisational strategy in relation to resource and capabilities utilisation, organisational infrastructure, KM processes and activities, financial support, employee training and education, employee motivation, practices of human resource management. It was further stated that these practices would either need to be nurtured if they already existed or be developed if they were not yet in place. Akhavan, Hosnavi and Sanjaghi (2009), identified five critical factors of KM, which are KM architecture and readiness, human resource management, benchmarking, and chief knowledge officer. Heisig (2009), examined 119 studies on CSF and harmonised the different CSF identified from these studies. The identified CSFs were classified into four main factors which are Human factor which is composed of culture, people and leadership; Organisation which is mainly structures and processes; Information technology and management processes which comprise of strategy and control.
Sedighi and Zand (2012), however in their research described KM critical components in a broader context. They identified these critical components from two categories. These are; the external factors which are also known as environmental factors which play an important role in implementing KM while and internal factors, also called organisational factors, were identified as crucial in developing KM systems. They developed a conceptual classification model of KM CSF. Yong and Mustaffa (2013) similarly noted that CSFs of KM should include both factors organisations have control over and those factors beyond the control of organisations. In more recent studies on construction infrastructure, Wang et al. (2014) described 11 factors important to the success of KM as culture, leadership and support, human resource management, training and education, organisational infrastructure, KM processes, motivational aids, resources, strategy, information technology and measurement. Similarly, in the Nigerian construction industry, Idris and Kolawole (2016) identified leadership, strategy, organisational infrastructure, culture, information technology, processes and activities, education and training and KM resources.
According to Heisig (2009), for successful and sustainable KM, the influence of the following key areas is important; organisation and roles, culture, Strategy and leadership, controlling and measuring, skill and motivation and information technology. Table 1 below shows a summary of CSF’s identified by various authors.

Adegbembo et al. JCPMI, 10(1): 42-54
45
Table 1: Summary of Success Factors of KM
S/N Success Factors Sky
rmr
& A
mid
on
(19
97
)
Dav
enp
ort
et
al. (
199
8)
Hal
sapp
le&
Josh
i(2
000
)
Gold
et
al (
200
1)
McD
emott
& O
'Del
l (2
00
1)
Ok
un
oy
e &
Kar
sten
(20
02
)
Jen
nex
& O
lfam
(200
4)
Ch
on
g &
Ch
oi
(20
05
)
Won
g (
20
05
)
Won
g &
Asp
inw
all
(2005
)
Koh
et
al. (
20
05
)
Har
ihar
an (
200
5)
Ak
hav
an a
nd
Jaf
ari
(200
6)
Ak
hav
an e
t al
. (2
006
)
Ch
on
g (
20
06
)
Lie
bow
itz
(20
06
)
An
anta
tmu
la &
Kan
un
go
(2007
)
Gao
et
al. (2
00
8)
Ak
hav
an e
t al
. (2
009
)
Val
moh
amm
adi
(201
0b
)
Dal
ota
& G
rig
ore
(2
010
)
Olu
ikp
e (2
012
)
Sei
dig
hi
& Z
and
(2
012
)
Wan
g e
t al
. (20
14
)
Idri
s &
Kola
wole
(20
16
)
Ku
nth
i et
al.
(20
17
)
1 Organisational Strategy √ √ - - - - - - √ √ - - - - - √ - √ - √ √ √ √ √ √ -
2 Leadership √ - √ - - √ √ - - √ √ - - - - - √ - - √ √ - √ √ √ - 3 Top management support √ √ - - - - - - √ √ √ √ - √ - √ √ - - √ √ - - - - √ 4 Organisational Culture √ √ - √ √ √ - - √ √ - √ - √ - √ √ - - √ √ - √ √ - √ 5 Budgetary support - - - - - - - - - - √ - - - - - √ - - - - - - - - -
6 Communication - - - - - - - - - - - - - - - - √ - - - - - - - - - 7 Formalization - - - - - - - - - - - - - - - - √ - - - - - - - - - 8 Collaboration - - - - - - - - - - - - - - - - √ - - - - - - - - -
9 KM processes/Activities √ √ √ - - - - - √ √ - √ - √ - - √ - - √ √ - √ √ √ -
10 Technology infrastructure/ Ontology - √ - √ √ √ √ - √ √ √ √ - - - √ √ - - √ - - √ - - -
11 Measurement of Result √ - √ - - √ - - √ √ √ √ - - - - √ - - √ √ - - √ √ -
12 Motivational aid - - - - - - - - √ - - - - - - - - - - - √ - - √ - - 13 Resources - - √ - - - - - - √ - - - - - - - - - √ √ - - √ - - 14 Training & Education - - - - - - - - √ √ - - - √ - - - - - √ √ - - √ √ -
15 Organisational Infrastructure - √ - √ √ - - - √ - - - - - - √ - - - √ √ - - √ √
- -
16 Human Resource - - - - - - - - √ √ - - - - - - - - √ √ √ - √ √ √ √ 17 knowledge officers - - - - - - - - - - - - - - - √ - - √ - - - - - - - 18 Information Technology √ - - - - - - - √ √ - - - - - - - - √ - - - - √ √ √
19 Reward/Incentive - √ - - - - - - √ √ - - - - - √ - - - - - - - - - - 20 Organisational Structure - - - √ √ - - - - - - - - √ - - - - - - - - √ - - √ 21 Transparency - - - - - - - - - - - - - √ - - - - - - - - - - - - 22 Trust - - - - - - - - - - - - - √ - - - - - - - - - - - -
23 Pilot - - - - - - - - - - - - - √ - - - - - - - - - - - - 24 Benchmarking - - - - - - - - - - - - - - - - - - √ √ - - - - - -
25 KM architecture & readiness - - - - - - - - - - - - - √ - - - - √ - - - - - - -
26 Financial Resources/support - - - - - - - - - √ - - - - - - - - - - - - √ - - -
27 KM Strategic focus - - - - - √ - - - - √ √ - - - - √ - - - - - - - - - 28 Content quality - - - - - - - - - - - √ - - - - √ - - - - - - - - -
29 Top management involvement - - - - - - - - - - √ √ - - √ - √ - - - - - - - - -
30 Employee involvement - - - - - - - √ - - - - - - √ - - - - - - - - - - - 31 Teamwork - - - - - - - √ - - - - - - √ - - - - - - - - - - -
32 Employee empowerment - - - - - - - √ - - - - - - √ - - - - - - - - - - -
33 Information System Infrastructure - - - - - - - √ - - - - - - √ - - - - - - - - - - -
34 Knowledge Structure - - - - - - - √ - - - - - - √ - - - - - - - - - - -
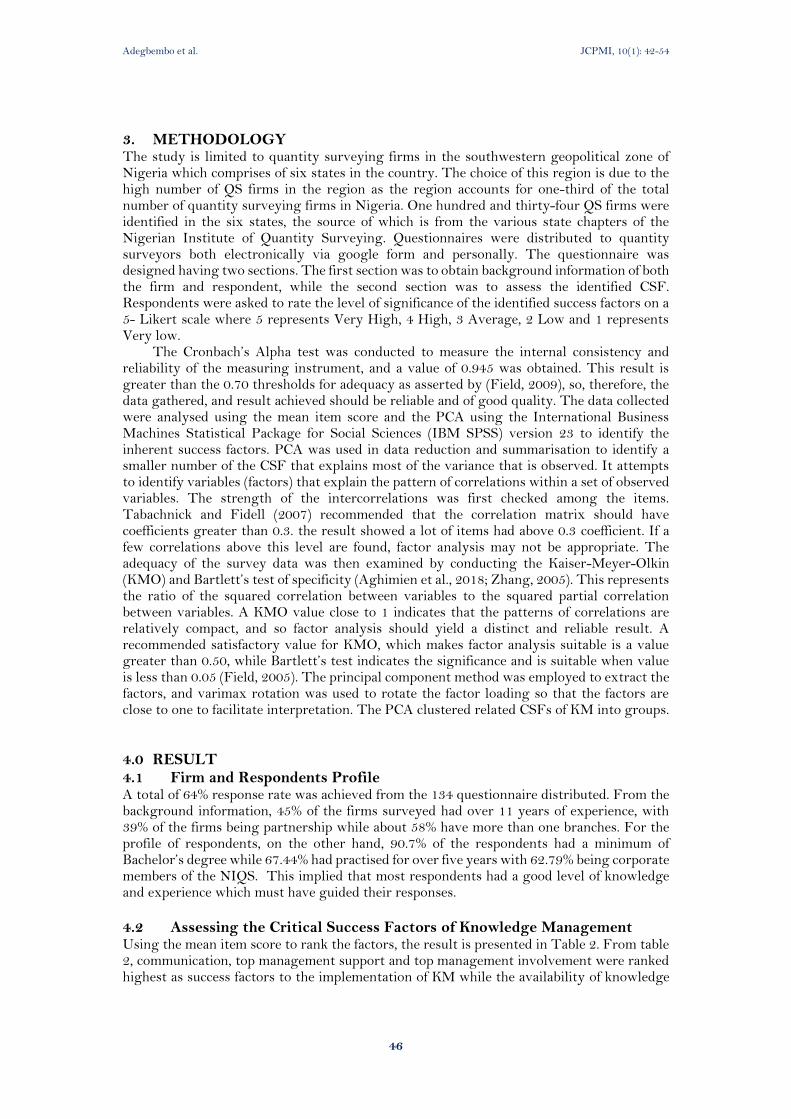
Adegbembo et al. JCPMI, 10(1): 42-54
46
3. METHODOLOGY The study is limited to quantity surveying firms in the southwestern geopolitical zone of Nigeria which comprises of six states in the country. The choice of this region is due to the high number of QS firms in the region as the region accounts for one-third of the total number of quantity surveying firms in Nigeria. One hundred and thirty-four QS firms were identified in the six states, the source of which is from the various state chapters of the Nigerian Institute of Quantity Surveying. Questionnaires were distributed to quantity surveyors both electronically via google form and personally. The questionnaire was designed having two sections. The first section was to obtain background information of both the firm and respondent, while the second section was to assess the identified CSF. Respondents were asked to rate the level of significance of the identified success factors on a 5- Likert scale where 5 represents Very High, 4 High, 3 Average, 2 Low and 1 represents Very low.
The Cronbach’s Alpha test was conducted to measure the internal consistency and reliability of the measuring instrument, and a value of 0.945 was obtained. This result is greater than the 0.70 thresholds for adequacy as asserted by (Field, 2009), so, therefore, the data gathered, and result achieved should be reliable and of good quality. The data collected were analysed using the mean item score and the PCA using the International Business Machines Statistical Package for Social Sciences (IBM SPSS) version 23 to identify the inherent success factors. PCA was used in data reduction and summarisation to identify a smaller number of the CSF that explains most of the variance that is observed. It attempts to identify variables (factors) that explain the pattern of correlations within a set of observed variables. The strength of the intercorrelations was first checked among the items. Tabachnick and Fidell (2007) recommended that the correlation matrix should have coefficients greater than 0.3. the result showed a lot of items had above 0.3 coefficient. If a few correlations above this level are found, factor analysis may not be appropriate. The adequacy of the survey data was then examined by conducting the Kaiser-Meyer-Olkin (KMO) and Bartlett’s test of specificity (Aghimien et al., 2018; Zhang, 2005). This represents the ratio of the squared correlation between variables to the squared partial correlation between variables. A KMO value close to 1 indicates that the patterns of correlations are relatively compact, and so factor analysis should yield a distinct and reliable result. A recommended satisfactory value for KMO, which makes factor analysis suitable is a value greater than 0.50, while Bartlett’s test indicates the significance and is suitable when value is less than 0.05 (Field, 2005). The principal component method was employed to extract the factors, and varimax rotation was used to rotate the factor loading so that the factors are close to one to facilitate interpretation. The PCA clustered related CSFs of KM into groups.
4.0 RESULT 4.1 Firm and Respondents Profile A total of 64% response rate was achieved from the 134 questionnaire distributed. From the background information, 45% of the firms surveyed had over 11 years of experience, with 39% of the firms being partnership while about 58% have more than one branches. For the profile of respondents, on the other hand, 90.7% of the respondents had a minimum of Bachelor’s degree while 67.44% had practised for over five years with 62.79% being corporate members of the NIQS. This implied that most respondents had a good level of knowledge and experience which must have guided their responses.
4.2 Assessing the Critical Success Factors of Knowledge Management Using the mean item score to rank the factors, the result is presented in Table 2. From table 2, communication, top management support and top management involvement were ranked highest as success factors to the implementation of KM while the availability of knowledge
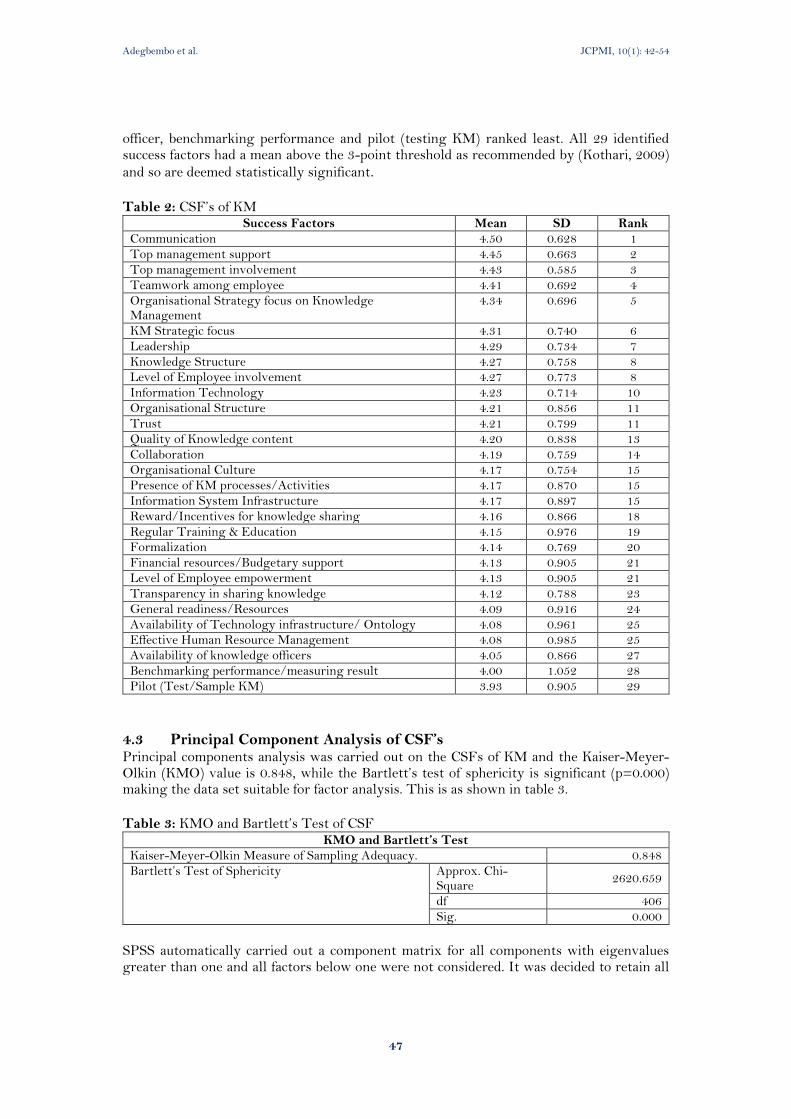
Adegbembo et al. JCPMI, 10(1): 42-54
47
officer, benchmarking performance and pilot (testing KM) ranked least. All 29 identified success factors had a mean above the 3-point threshold as recommended by (Kothari, 2009)
and so are deemed statistically significant. Table 2: CSF’s of KM
Success Factors Mean SD Rank
Communication 4.50 0.628 1 Top management support 4.45 0.663 2 Top management involvement 4.43 0.585 3 Teamwork among employee 4.41 0.692 4 Organisational Strategy focus on Knowledge Management
4.34 0.696 5
KM Strategic focus 4.31 0.740 6 Leadership 4.29 0.734 7 Knowledge Structure 4.27 0.758 8 Level of Employee involvement 4.27 0.773 8 Information Technology 4.23 0.714 10 Organisational Structure 4.21 0.856 11 Trust 4.21 0.799 11 Quality of Knowledge content 4.20 0.838 13 Collaboration 4.19 0.759 14 Organisational Culture 4.17 0.754 15 Presence of KM processes/Activities 4.17 0.870 15 Information System Infrastructure 4.17 0.897 15 Reward/Incentives for knowledge sharing 4.16 0.866 18
Regular Training & Education 4.15 0.976 19 Formalization 4.14 0.769 20 Financial resources/Budgetary support 4.13 0.905 21 Level of Employee empowerment 4.13 0.905 21 Transparency in sharing knowledge 4.12 0.788 23 General readiness/Resources 4.09 0.916 24 Availability of Technology infrastructure/ Ontology 4.08 0.961 25 Effective Human Resource Management 4.08 0.985 25 Availability of knowledge officers 4.05 0.866 27 Benchmarking performance/measuring result 4.00 1.052 28 Pilot (Test/Sample KM) 3.93 0.905 29
4.3 Principal Component Analysis of CSF’s Principal components analysis was carried out on the CSFs of KM and the Kaiser-Meyer-Olkin (KMO) value is 0.848, while the Bartlett’s test of sphericity is significant (p=0.000) making the data set suitable for factor analysis. This is as shown in table 3.
Table 3: KMO and Bartlett’s Test of CSF
KMO and Bartlett’s Test
Kaiser-Meyer-Olkin Measure of Sampling Adequacy. 0.848 Bartlett’s Test of Sphericity Approx. Chi-
Square 2620.659
df 406 Sig. 0.000
SPSS automatically carried out a component matrix for all components with eigenvalues greater than one and all factors below one were not considered. It was decided to retain all
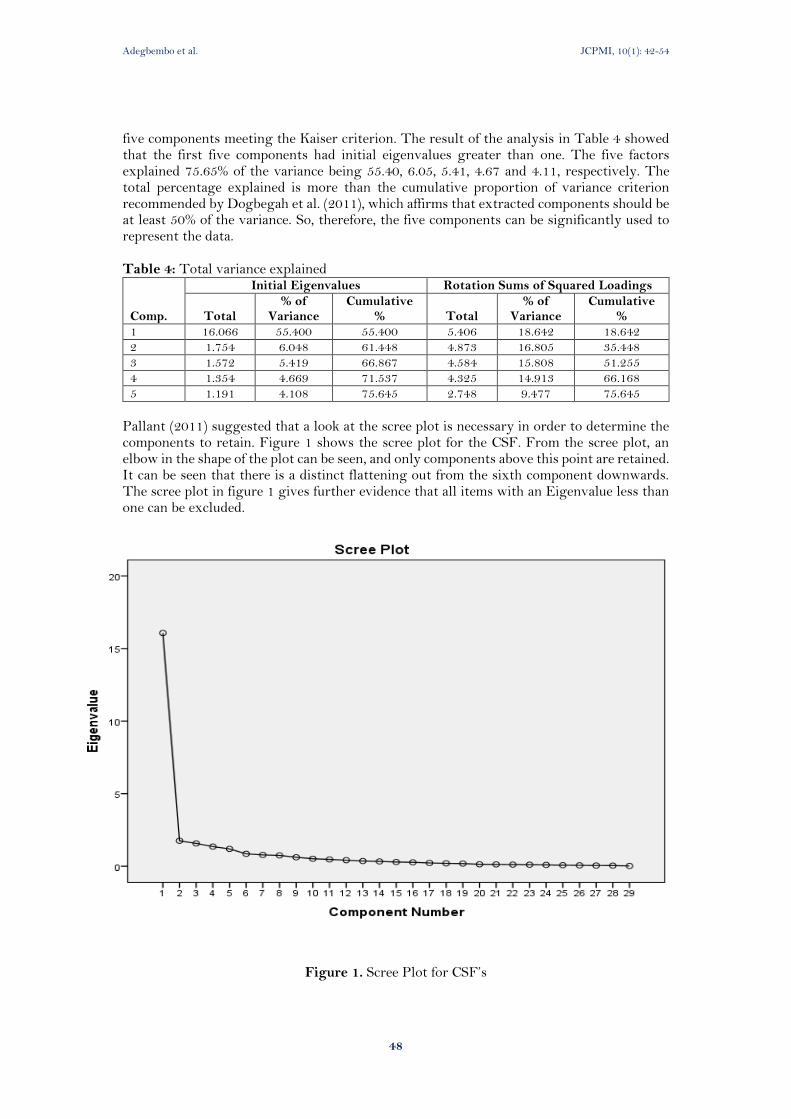
Adegbembo et al. JCPMI, 10(1): 42-54
48
five components meeting the Kaiser criterion. The result of the analysis in Table 4 showed that the first five components had initial eigenvalues greater than one. The five factors explained 75.65% of the variance being 55.40, 6.05, 5.41, 4.67 and 4.11, respectively. The total percentage explained is more than the cumulative proportion of variance criterion recommended by Dogbegah et al. (2011), which affirms that extracted components should be at least 50% of the variance. So, therefore, the five components can be significantly used to represent the data. Table 4: Total variance explained
Comp.
Initial Eigenvalues Rotation Sums of Squared Loadings
Total % of
Variance Cumulative
% Total % of
Variance Cumulative
%
1 16.066 55.400 55.400 5.406 18.642 18.642 2 1.754 6.048 61.448 4.873 16.805 35.448 3 1.572 5.419 66.867 4.584 15.808 51.255 4 1.354 4.669 71.537 4.325 14.913 66.168 5 1.191 4.108 75.645 2.748 9.477 75.645
Pallant (2011) suggested that a look at the scree plot is necessary in order to determine the components to retain. Figure 1 shows the scree plot for the CSF. From the scree plot, an elbow in the shape of the plot can be seen, and only components above this point are retained. It can be seen that there is a distinct flattening out from the sixth component downwards. The scree plot in figure 1 gives further evidence that all items with an Eigenvalue less than one can be excluded.
Figure 1. Scree Plot for CSF’s
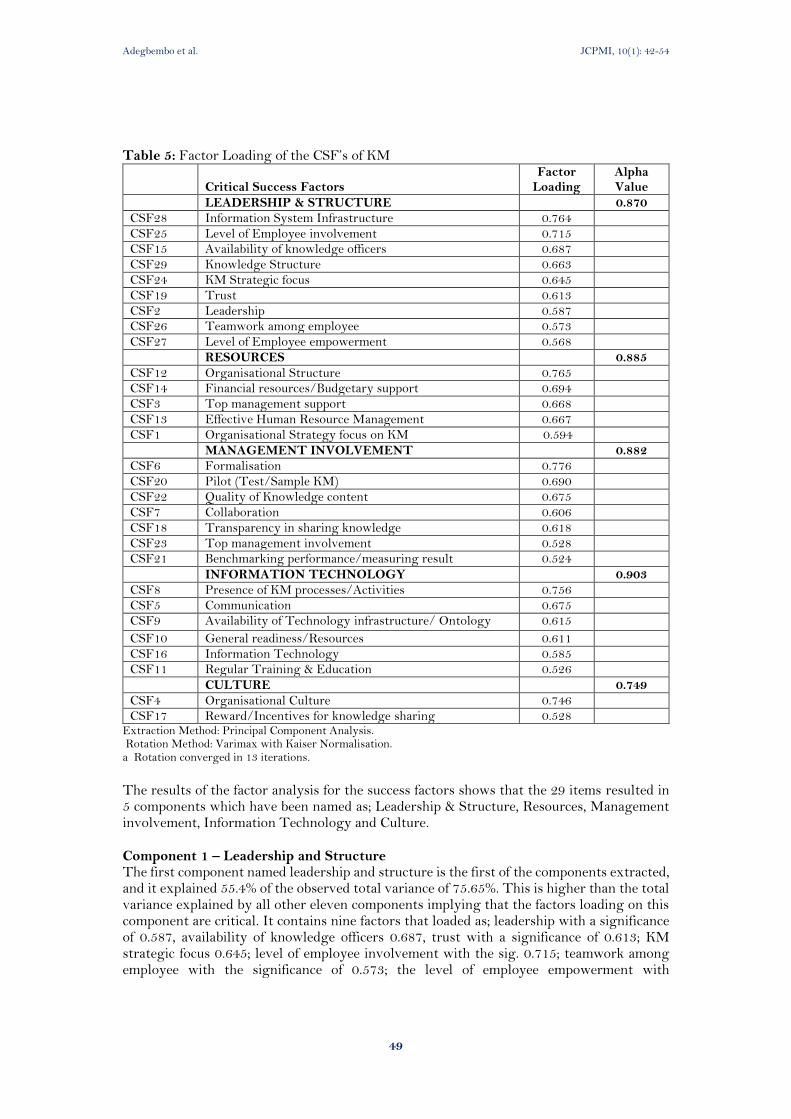
Adegbembo et al. JCPMI, 10(1): 42-54
49
Table 5: Factor Loading of the CSF’s of KM
Critical Success Factors Factor
Loading Alpha Value
LEADERSHIP & STRUCTURE 0.870
CSF28 Information System Infrastructure 0.764
CSF25 Level of Employee involvement 0.715
CSF15 Availability of knowledge officers 0.687
CSF29 Knowledge Structure 0.663
CSF24 KM Strategic focus 0.645
CSF19 Trust 0.613 CSF2 Leadership 0.587 CSF26 Teamwork among employee 0.573
CSF27 Level of Employee empowerment 0.568
RESOURCES 0.885
CSF12 Organisational Structure 0.765 CSF14 Financial resources/Budgetary support 0.694 CSF3 Top management support 0.668 CSF13 Effective Human Resource Management 0.667 CSF1 Organisational Strategy focus on KM 0.594
MANAGEMENT INVOLVEMENT 0.882
CSF6 Formalisation 0.776
CSF20 Pilot (Test/Sample KM) 0.690
CSF22 Quality of Knowledge content 0.675
CSF7 Collaboration 0.606
CSF18 Transparency in sharing knowledge 0.618
CSF23 Top management involvement 0.528
CSF21 Benchmarking performance/measuring result 0.524
INFORMATION TECHNOLOGY 0.903
CSF8 Presence of KM processes/Activities 0.756
CSF5 Communication 0.675
CSF9 Availability of Technology infrastructure/ Ontology 0.615
CSF10 General readiness/Resources 0.611
CSF16 Information Technology 0.585
CSF11 Regular Training & Education 0.526
CULTURE 0.749
CSF4 Organisational Culture 0.746
CSF17 Reward/Incentives for knowledge sharing 0.528 Extraction Method: Principal Component Analysis. Rotation Method: Varimax with Kaiser Normalisation. a Rotation converged in 13 iterations.
The results of the factor analysis for the success factors shows that the 29 items resulted in 5 components which have been named as; Leadership & Structure, Resources, Management involvement, Information Technology and Culture. Component 1 – Leadership and Structure The first component named leadership and structure is the first of the components extracted, and it explained 55.4% of the observed total variance of 75.65%. This is higher than the total variance explained by all other eleven components implying that the factors loading on this component are critical. It contains nine factors that loaded as; leadership with a significance of 0.587, availability of knowledge officers 0.687, trust with a significance of 0.613; KM strategic focus 0.645; level of employee involvement with the sig. 0.715; teamwork among employee with the significance of 0.573; the level of employee empowerment with
Adegbembo et al. JCPMI, 10(1): 42-54
50
significance of 0.568; information system infrastructure 0.764 and knowledge structure with the sig. 0.663, as shown in Table 5. All the nine items in the component had a loading above 0.5 significance value. Component 2 – Structure and Resources The second component is named structure and resources with 6.05% total variance explained and comprised of five variables. These items with their factor loadings are organisational strategy focus on KM (0.594), management support (0.668), organisational structure (0.765), effective human resource management (0.667) and financial/budgetary support (0.694). The component had a Cronbach alpha value of 0.885. Component 3 - Management Involvement The third component accounted for 5.42% of the variance explained and given the name Management involvement. A total of seven variables were grouped under this component and are highly correlated as; Formalization (0.776), Collaboration (0.606), Transparency of sharing knowledge (0.618), Pilot (0.690), Benchmarking/measuring KM result (0.524), quality of knowledge content (0.675) and Top management involvement (0.528). These components had a reliability value of 0.882. Component 4 - Information Technology Information technology is named as the fourth component with six variables explaining 4.66% of the variance and a corresponding reliability score of 0.903. These variables are highly correlated, and they include communication (0.675), presence of KM processes/activities (0.756), availability of technology (0.615), general readiness (0.611), regular training and education (0.526) and information technology (0.585). Component 5 – Culture The last component loaded only two factors, namely organisational culture (0.746) and reward/incentive for knowledge sharing (0.528), and accounts for 4.108% of the total variance with the reliability of 0.746. These factors were subsequently named culture.
5. DISCUSSION The CSF’s for the implementation of KM in quantity surveying firms was assessed, and communication, top management support and top management involvement were ranked highest as success factors to the implementation of KM while the availability of knowledge officer, benchmarking performance and pilot (testing KM) ranked least. All identified success factors had a mean above the 3-point threshold as recommended by (Kothari, 2009) and so are all deemed statistically significant. The result of the findings is in tandem with Ekung and Okonkwo (2015), who asserted that communication and leadership are the suggested knowledge areas where the future of the quantity surveying profession can be built on. Similarly, Chhim, Somers and Chinnam (2017) concluded in their study that without top-level leadership support, the necessary practices to develop, implement and continually support KM and especially repositories would not be well established. Drew (1997) asserted from his findings that benchmarking was one of the best tools for promoting organisational performance is in disagreement with this study as quantity surveyor rated it as the least. However, it was concluded that benchmarking may not be equally desirable or effective for all types of firms.
From the factor reduction carried out, five factors emerged and are discussed. The first component being leadership and structure had the highest variance explained by all factors, having explained 55.4% of the total variance of 75.65%. This implies that all factors in the component are critical to the successful implementation of KM. Factors in this component are; Leadership, availability of knowledge officers, trust, KM strategic focus, level of employee involvement, teamwork among employee, level of employee empowerment, information system infrastructure and knowledge structure. This is in line with Pasha and Pasha (2012) assertion that leadership is critical in creating organisational mission, vision
Adegbembo et al. JCPMI, 10(1): 42-54
51
and objectives as well as its KM strategies. Availability of knowledge officers which has been found to be important to the success of KM in this study is in agreement with Jassen (2011), noted in its study that it is necessary to define different roles and positions in organisations to help better KM in organisations and this can be better done by having knowledge officers who handle all KM related matters within the organisation. This is also the position of Akhavan et al. (2009); however, Adegbembo et al. (2015) found that quantity surveying firms in Nigeria do not have specific unit nor specific staff responsible for KM and its needs.
The second component of the factor analysis, named Resources produced five factors grouped together. These factors are; organisational strategy focus on KM, top management support, organisational structure, effective human resource management and financial resources. Organisational strategy focus on KM as described by Jennex (2017), deals majorly with aligning KM initiative with organisations competitive strategy as well as identifying knowledge users, knowledge needed, KM metrics and incentives that are needed to ensure the use of knowledge. Aligning with Kunthi et al. (2017), Abbaszadeh (2010), top management support is one of the most influential factors in determining the success of KM. Adegbembo (2014), however, found that the support of top management is essential in overcoming the challenges of KM in QSF in Nigeria.
Management involvement factors which grouped together are formalisation, collaboration, pilot testing KM, benchmarking performance, quality of knowledge content and top management involvement. Management can act as mentors to its employees by demonstrating and practising KM activities within the organisation (Pasha & Pasha, 2012). Involvement implies that management practice what they preach, and since it is leadership by example, the employee tends to do as they are mentored to do and by what they see the top management does.
The six extracted factors for Information Technology component are communication, presence of KM processes, availability of technology infrastructure, general readiness, training and education and information technology. Information technology aids communication, KM activities as well as training and education within organisations. The information technology system is noted to have a positive impact on knowledge sharing, knowledge application (Choi et al., 2010) and knowledge creation (Lee et al., 2012). The use of IT, according to Khan & Vorley (2017), has greatly changed KM practice and raised its quality. Culture as a component comprises of organisational culture and reward/incentive for knowledge sharing. Culture according to Davenport et al. (1998); Lee and Choi (2003) is probably the most influential factor for the successful practice of KM also Egbu (2004) noted that cultural change is required to aid the total effect of KM. These are in agreement with the study, but from Awodele et al. (2015), QSFs in Nigeria do not acknowledge that the culture of an organisation may be a challenge to successful KM practices
6. CONCLUSION AND RECOMMENDATIONS Quantity surveyors have acknowledged the significance of all identified CSF’s for the implementation of KM in quantity surveying firms, but communication and top management support and involvement were the most significant to quantity surveyors. A good leadership and structure, management involvement, availability of resources, information technology and culture are the most critical factors in the implementation of KM. From the findings and conclusions emanated from this study, it is recommended that quantity surveying firms should continue to recognise the importance of good leadership and structure, making resources available, the involvement of management, information technology and culture in developing successful KM practices.
Adegbembo et al. JCPMI, 10(1): 42-54
52
7. REFERENCES Abbaszadeh, M. A. (2010). Causal model of critical success factors for knowledge
management implementation, International Conference on Education and Management Technology.
Abdelrahman, M. & Papamichail, K. (2016). The Role of Organisational Culture on Knowledge Sharing by Using Knowledge Management Systems in MNCs. In 22nd American Conferenceon Information Systems in San Diego 11-14 August
Adegbembo, T. F., Awodele, O. A. & Ogunsemi, D. R. (2015). Assessment of knowledge management Practices in Quantity Surveying Firms in Lagos and Abuja, Nigeria. Journal of Information and Knowledge Management, 5(11), 11-19
Adegbembo, T. F. (2014). Appraising knowledge management practices in Quantity Surveying Firms in Lagos and Abuja, Nigeria. Thesis submitted to the Department of Quantity Surveying, Federal University of Technology, Akure.
Aghimien, D. O., Adegbemo, T. F., Aghimien, I. E., and Awodele, A. O., (2018). Challenges of Sustainable Construction: A Study of Educational Buildings in Nigeria. International Journal of Built Environment and Sustainability, 5(1), 33-46
Akhavan, P. & Jafari M. (2006). Critical Success Factors of Knowledge Management Implementation at A National Level. VINE Journal of Information and Knowledge Management Systems, 36, 52-66.
Akhavan, P., Hosnavi, R. & Sanjaghi M. (2009). Identification of Knowledge Management Critical Success Factors in Iranian Academic Research Centers. Education, Business and Society. Contemporary Middle Eastern Issues, 2(4), 276-288.
Akhavan, P., Jafari M. & Fathian, M. (2006). Critical Success Factors of Knowledge Management Systems: A Multi-Case Analysis. European Business Review, 18(2), 97-113
Anantatmula, V. S. & Kanungo, S. (2007). Modelling Enablers for Successful Knowledge Management Implementation, Proceedings of the 40th Hawaii International Conference on System Sciences
Awodele O. A, Adegbembo T. F & Ajayi M. O. (2015) Benefits and Challenges of Knowledge Management Practices in Quantity Surveying Firms in Nigeria: Quantity Surveyors Perspective. Lagos Journal of Environmental Science, 7(3), 53-63.
Chhim, P. P, Somers, T. M. & Chinnam, R. (2017). Knowledge reuse through electronic knowledge repositories: a multi theoretical study, Journal of Knowledge Management, https://doi.org/10.1108/JKM-03-2016-0126
Choi, S. Y., Lee, H., & Yoo, Y. (2010). The Impact of Information Technology and Transactive Memory Systems on Knowledge Sharing, Application, and Team Performance: A Field Study. MIS Quarterly, 34(4), 855-870.
Chong, S. C. & Choi, Y. S. (2005). Critical factors of knowledge management implementation success, Journal of Knowledge Management Practice, available at: www.tlainc.com/articl90.htm. Retrieved 11th August, 2017
Chong, S.C. (2006). Knowledge Management Critical Success Factors: A Comparison of Perceived Importance Versus Implementation in Malaysian ICT companies, The Learning Organisation: An International Journal, 13(3), 230-256.
Dalota, M. & Grigore, S. (2010). Successful implementation of knowledge management in small and medium enterprises, Managerial Challenges of contemporary society, 6(1), 46-49.
Davenport, T. H., De Long, D. W. & Beers, M. C. (1998). Successful Knowledge Management Project. Solan Management Review, 39(2), 43- 57
Dogbegah, R., Owusu-Manu, D. & Omoteso, K. (2011) ‘A principal component analysis of project management competencies for the Ghanaian construction industry’, Australasian Journal of Construction Economics and Building, 11(1), 26–40.

Adegbembo et al. JCPMI, 10(1): 42-54
53
Egbu, C. (2004). Managing knowledge and intellectual capital for improved organisational innovations in the construction industry: An examination of critical success factors, Engineering, Construction and Architectural Management, 11, 301-315.
Egbu, J U, Wood, G. & Egbu, C. (2010). Critical success factors associated with effective knowledge sharing in the provision of floating support services in sheltered housing for the elderly. In: Egbu, C. (Ed) Proceedings at the 26th Annual ARCOM Conference, 6-8 September 2010, Leeds, UK, Association of Researchers in Construction Management, 849-857.
Ekung, S. & Okonkwo, E. (2015). Trend in Influences on Career Choice in Quantity Surveying and its Implications, International Journal of Education, 3(1), 1-9
Field, A. (2005) Discovering Statistics Using SPSS, 2nd ed., Sage,London. Field, A. (2009) Discovering Statistics Using SPSS for Windows, 3rd ed., Sage Publications,
London. Gao, F, Li, M. & Clarke, S. (2008). Knowledge, Management, and Knowledge Management
in Business Operations, Journal of Knowledge Management, 12, 3-17. Gold, A. H., Malhotra, A. & Segars, A. H. (2001). Knowledge Management: An
Organisational Capabilities Perspective. Journal of Management Information System.18(1), 185-215.
Hari, S., Egbu, C. & Kumar, B. (2005). A knowledge capture awareness tool, Engineering, Construction and Architectural Management, 12 (6), 533 – 567
Heisig, P. (2009). Harmonisation of Knowledge Management – Comparing 160 Frameworks around the Globe. Journal of Knowledge Management, 13(4), 4-31
Holsapple, C. W. & Joshi, K.D. (2000). An Investigation of Factors that Influence the Management of Knowledge in Organisations. Journal of Strategic Information Systems, 9, 235-261.
Hsu, I. C. (2008). Knowledge sharing practices as a facilitating factor for improving organisational performance through human capital: A preliminary test. Expert Systems with Applications. 35(3), 1316-1326
Idris, K. M. & Kolawole, A. R. (2016). Influence of Knowledge Management Critical Success Factors on Organisational Performance in Nigerian Construction Industry, Ethiopian Journal of Environmental studies and Management, 9(3), 315-325
Idris, K., Ali, K. & Aliagha, G. (2015). Knowledge Management Model and Instrument for Implementation and Adoption; Perspective of Developing Country. Journal of Management Research. 7(2), 548-560.
Idris, K. M, Bhadmus, R. T. & Kabir, B. (2017). Knowledge Management Practice in Nigerian Construction Industry. Proceedings at the Nigerian Institute of Quantity Surveyors 3rd Research Conference (NIQSRecon3) 25th – 27th September
Jennex, M. E. & Olfman, L. (2004). Assessing Knowledge Management Success/Effectiveness Models. Proceedings of the 37th Hawaii International Conference on System Sciences.HICSS37, IEEE Computer Societys
Jennex, M. E. (2017). Re-Examining the Jennex Olfman Knowledge Management Success Model, Proceedings of the 50th Hawaii International Conference on System Sciences. 4375-4384 URI: http://hdl.handle.net/10125/41691
Khan, Z. & Vorley, T. (2017). Big data text analytics: An enabler of knowledge management, Journal of Knowledge Management, 21 (1), 18-34.
Kothari, C. R. (2009). Quantitative Techniques. (3rd ed.). New Delhi: Vikas Publishing House Pvt Limited
Kunthi, R., Sensuse, D. I. & Tobing, R. P. (2017). Critical Success Factors of the Implementation of Knowledge Management at PT XYZ. Advances in Economics, Business and Management Research (AEBMR), 55, 29-38
Adegbembo et al. JCPMI, 10(1): 42-54
54
Lee, H. & Choi, B. (2003.) Knowledge Management Enablers, Processes, and Organisational Performance: An Integrative View and Empirical Examination, Journal of Management Information Systems, 20(1),179-228
Oke A. E., Ogunsemi D. R., Adeeko O. C. (2013). Assessment of Knowledge Management Practices among Construction Professionals in Nigeria, International Journal of Construction Engineering and Management, 2(3), 85-92. doi: 10.5923/j.ijcem.20130203.06.
Okunoye, A. (2003). Context-Aware Framework of Knowledge Management: Cultural and Infrastructural Considerations. University of Turku and TUCS, Finland
Okunoye, A. & Karsten, H. (2002). Where the global needs the local: Variation in enablers in the Knowledge management process. Journal of Global Information Technology Management, 5(3), 12-31
Oluikpe, P. (2012). Developing a corporate knowledge management strategy. Journal of Knowledge management, 16(6), 862- 878
Omotayo, F. O. (2015). Knowledge management as an important tool in organisational management: A review of literature. Library Philosophy and Practice (e-journal) 1238, 1–23
Pallant, J. (2011). SPSS Survival Manual: A Step by Step Guide to Data Analysis using SPSS (4th ed.). China: Everbest Printing Company
Pasha, M. A. & Pasha, S. (2012). A Pragmatic Approach for Implementing Knowledge Management in Pakistani Organisations using Open Source Technologies. International Journal of Computer Applications, 49(7), 10-18
Sedighi, M. & Zand, F. (2012). Knowledge Management: Review of the critical success factors and development of a conceptual classification model. Proceedings of the 10th International Conference of ICT and Knowledge Engineering, IEEE Explore pp. 1-9.
Wang, J., Li, Z. & Tam, V. W. (2014). Critical Factors in Effective Construction Waste Minimisation at the Designs Stage: A Shenzhen Case Study, China, Resources, Conservation and Recycling, 82, 1-7
Wong, K. & Aspinwall, E. (2006). An Empirical Study of the Important Factors for Knowledge-Management Adoption in The SME Sector. Journal of Knowledge management, 9(3), 64-82.
Wong, K. (2005). Critical Success Factors for Implementing Knowledge Management in Small and Medium Enterprises. Industrial Management & Data Systems, 105(3), 261-279.
Yong, Y. C. & Mustaffa, N. E. (2013). Critical Success Factors for Malaysian Construction Projects: An Empirical Assessment, Construction Management and Economics, 31(9), 959-978
Yu S, Kim Y. & Kim M. (2004). Linking Organisational Knowledge Management Drivers to Knowledge Management Performance: An Exploratory Study. HICSS37, IEEE Computer Society
Zhang, T., Wang, W. Y. C. & Pauleen, D. J. (2017). Big data investments in knowledge and non knowledge intensive firms: What the market tells us, Journal of Knowledge Management, 21 (3), 623-639
Zuofa, T. Ochieng, E. & Burns, A. (2015). Appraising Knowledge Management Perception among Construction Practitioners. Proceedings of the Institution of Civil Engineers Management, Procurement and Law, 168 (2), 89-98
Journal of Construction Project Management and Innovation, 10 (1): 55-69, 2020
ISSN 2223-7852 © Sustainable Human Settlement and Construction Research Centre DOI: https://doi.org/10.36615/jcpmi.v10i1.279
55
FACTORS INFLUENCING THE EFFECTIVE CAPTURE OF INDIRECT COSTS IN ACCIDENT
REPORTS BY EMERGING CONSTRUCTION CONTRACTORS IN SOUTH AFRICA
Ayodeji Olatunji AIYETAN1 and Chikezirim OKORAFOR2
1&2Department of Construction Management and Quantity Surveying, Durban University
of Technology, Durban 4001
Email: [email protected]
ABSTRACT There has been limited research into the indirect cost of accidents in the South African construction industry, despite its consequences on productivity and performance measurement and management. Extant studies have attempted to explore the impact of direct and indirect costs from a macro-economic (industry-wide) perspective. Whilst a few have focused on the micro-economic impacts, with specific emphasis on the organizational level, most of these studies have concentrated on the construction client perspective without recourse to the experiences for construction contractors. This is the gap which this study seeks to fulfil within the South Africa. To achieve this objective, a document analysis of selected construction accident reports was conducted using a pre-set theme identified from the literature in extracting information from the emerging contractors ‘accident reports. It was revealed that none of the reports were compliant as per the pre-set theme used. The reasons behind the non-compliance were sought for, through another round of data collection deploying semi-structured interview and questionnaire surveys. A population of contractors within CIDB grades 5-7 were interviewed and surveyed. Survey results revealed that difficulties in extracting the information top the list, followed by organisational will. Also, areas for improvement in capturing the accident report were highlighted such as; making it as a policy for any accident report to capture indirect cost and assigning timeliness on when the data must be captured in any accidents is paramount. This finding has implications on the emerging contractors as it provides information on factors that negate and impact on sustainability of the emerging contractors as it relates to OHS performance and competitiveness. Keywords: Accident; Construction; Contractor; Cost; Health and Safety; South Africa
1. INTRODUCTION The construction industry has been known to make significant contribution to economic development. Globally, the sector accounts for about 10% of gross domestic product (GDP), 7 – 10% of the GDP of developed countries and 3 – 6% in the case of under-developed countries (Murie, 2007; Giang and Pheng, 2011; Osei, 2013). In South Africa, the construction industry contributes about 4% to the GDP (Statistics South Africa, 2018a) and employs approximately 8% percent of the total labour force (Statistics South Africa, 2018b). Despite the salient contributions to economic and national development as highlighted previously, the high incidence of accidents within the industry makes it a dangerous industry (Kheni, Dainty, and Gibb, 2008; Sánchez, Peláez, and Alís, 2017). This industry has gained notoriety due to the excessive accident rates recorded on construction project sites (Brace and Gibb, 2005). Costs are associated with these accidents. Such costs which are categorised
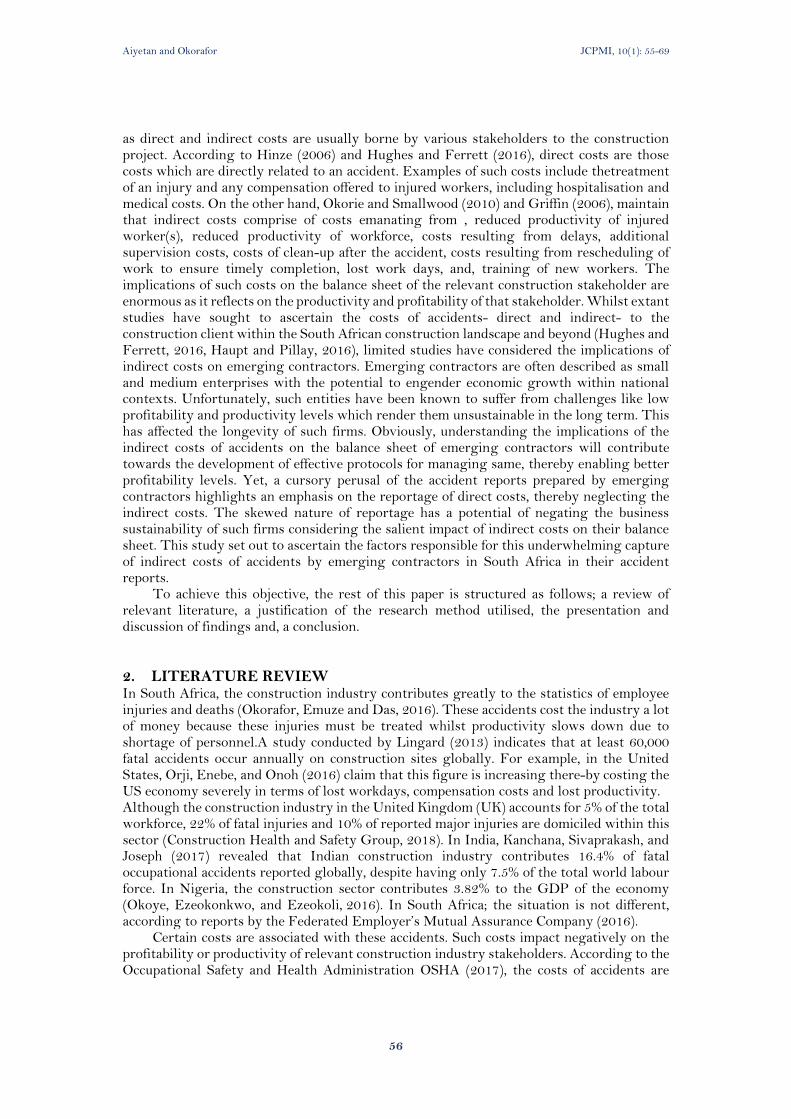
Aiyetan and Okorafor JCPMI, 10(1): 55-69
56
as direct and indirect costs are usually borne by various stakeholders to the construction project. According to Hinze (2006) and Hughes and Ferrett (2016), direct costs are those costs which are directly related to an accident. Examples of such costs include thetreatment of an injury and any compensation offered to injured workers, including hospitalisation and medical costs. On the other hand, Okorie and Smallwood (2010) and Griffin (2006), maintain that indirect costs comprise of costs emanating from , reduced productivity of injured worker(s), reduced productivity of workforce, costs resulting from delays, additional supervision costs, costs of clean-up after the accident, costs resulting from rescheduling of work to ensure timely completion, lost work days, and, training of new workers. The implications of such costs on the balance sheet of the relevant construction stakeholder are enormous as it reflects on the productivity and profitability of that stakeholder. Whilst extant studies have sought to ascertain the costs of accidents- direct and indirect- to the construction client within the South African construction landscape and beyond (Hughes and Ferrett, 2016, Haupt and Pillay, 2016), limited studies have considered the implications of indirect costs on emerging contractors. Emerging contractors are often described as small and medium enterprises with the potential to engender economic growth within national contexts. Unfortunately, such entities have been known to suffer from challenges like low profitability and productivity levels which render them unsustainable in the long term. This has affected the longevity of such firms. Obviously, understanding the implications of the indirect costs of accidents on the balance sheet of emerging contractors will contribute towards the development of effective protocols for managing same, thereby enabling better profitability levels. Yet, a cursory perusal of the accident reports prepared by emerging contractors highlights an emphasis on the reportage of direct costs, thereby neglecting the indirect costs. The skewed nature of reportage has a potential of negating the business sustainability of such firms considering the salient impact of indirect costs on their balance sheet. This study set out to ascertain the factors responsible for this underwhelming capture of indirect costs of accidents by emerging contractors in South Africa in their accident reports.
To achieve this objective, the rest of this paper is structured as follows; a review of relevant literature, a justification of the research method utilised, the presentation and discussion of findings and, a conclusion.
2. LITERATURE REVIEW In South Africa, the construction industry contributes greatly to the statistics of employee injuries and deaths (Okorafor, Emuze and Das, 2016). These accidents cost the industry a lot of money because these injuries must be treated whilst productivity slows down due to shortage of personnel.A study conducted by Lingard (2013) indicates that at least 60,000 fatal accidents occur annually on construction sites globally. For example, in the United States, Orji, Enebe, and Onoh (2016) claim that this figure is increasing there-by costing the US economy severely in terms of lost workdays, compensation costs and lost productivity. Although the construction industry in the United Kingdom (UK) accounts for 5% of the total workforce, 22% of fatal injuries and 10% of reported major injuries are domiciled within this sector (Construction Health and Safety Group, 2018). In India, Kanchana, Sivaprakash, and Joseph (2017) revealed that Indian construction industry contributes 16.4% of fatal occupational accidents reported globally, despite having only 7.5% of the total world labour force. In Nigeria, the construction sector contributes 3.82% to the GDP of the economy (Okoye, Ezeokonkwo, and Ezeokoli, 2016). In South Africa; the situation is not different, according to reports by the Federated Employer’s Mutual Assurance Company (2016).
Certain costs are associated with these accidents. Such costs impact negatively on the profitability or productivity of relevant construction industry stakeholders. According to the Occupational Safety and Health Administration OSHA (2017), the costs of accidents are
Aiyetan and Okorafor JCPMI, 10(1): 55-69
57
divided into two categories: direct cost and indirect cost. Direct costs of accidents are usually considered those costs covered by workers compensation insurance and other minor medical costs for the accident while indirect costs are all the "uninsured" additional costs associated with an accident which are greater than direct cost (Us OSHA, 2017).The direct costs tend to be those associated with the treatment of the injury and any unique compensation offered to workers as a consequence of being injured (Hinze, 2006), and while indirect costs are those costs that are borne by contractors through: reduced productivity of both returned worker(s); legal fees for defense against claims; replacement costs for reworks; training costs for replacement of injured worker(s); costs of transportation to hospital, and wages paid while the injured is idle (Brauer, 2006).
Manuele (2011) posits that the disparity in the ratio of direct cost to indirect cost is worrisome. This disparity has considerable implications for construction industry productivity. According toChoi (2006), indirect costs are measured as being four times the direct costs whereas Heinrich, (1959) indicates that the indirect costs of injuries may range from two to 20 times the sum of direct costs. In corroboration to these assertions, the Western National Insurance (2010) estimates that the indirect costs are 3 to 10 times the direct costs of an accident. Similarly, the International Safety Equipment Association (ISEA, 2012), maintains that indirect costs are up to 30 times the direct costs. Brauer (2006) and Hinze (2006) identify costs of accident as having negative impacts on the productivity of the industry. However, in the study of Hinze (2006) and Manuel (2011) their findings suggest that indirect cost of accident are neglected which Haupt and Pillay (2016) espoused the reason behind it such as; organisational will, technical-know and difficulty in extracting such information. In extracting information on indirect cost of accident, Levit and Samelson (1987) and Griffin (2006), identified the following theme inter alia; cost of overtime work to make up for the resultant delays, administrative cost in terms of paperwork related to claims and reports, cost relating to orientation of the replacement workers, cost resulting from delays, additional supervision costs, transportation of injured workers, wages paid while injured worker/s was/were idle, reduction in productivity, cost of clean-up after the accident, cost of replacing material, plant and equipment, stand-by costs of idle plant and equipment (Levitt and Samelson, 1987; Okorie and Smallwood, 2010; Griffin, 2006).
The cost implications of these accidents are frequently cited as a major motivation for addressing construction H&S (Hinze, 2006). Furthermore, Hinze (2006) describes construction accidents as a cancer afflicting the construction industry. According to the WHO (2010), over 1.25 trillion US dollars is spent annually on costs such as lost working time, workers’ compensation, and medical expenses resulting in unsafe and unhealthy working conditions. This amount has negative economic implications on contractors. The economic burden of site accidents is a serious concern to all stakeholders and governments alike. From the business standpoint, site accidents and incidents affect the profitability of contractors. The WHO (2010) maintains that site accidents have forced many contractors particularly the emerging contractors into liquidation due to high compensation paid to the family of a deceased worker(s) or through a protracted legal litigation occasioned by site accidents. The motive of every organisation is to make profit, but when an accident occurs on site, it has both direct and indirect economic implications on the organisation.
The indirect cost affects their profit margins, which, in turn impacts on the national economy. The overall economic implications of construction site accidents and ill health to contractors are very significant and unacceptable. On the national scale, the estimated indirect costs of construction accidents can be as high as 7-10% of a country's gross national product (ILO, 2011). Yet, little attention has been paid to tackling this phenomenon. Rather efforts have been dissipated on resolving the incidence of accidents on construction sites. For instance, in India, Kanchana, et al (2017) investigated the causes of accidents on construction sites while Okoye, Okolie, and Ngwu (2017) focused on the effectiveness of safety intervention and implementation strategies in Nigeria construction industry. Chileshe and

Aiyetan and Okorafor JCPMI, 10(1): 55-69
58
Dzisi (2012) focused on the benefits of H&S management in design organisations in the United Kingdom (UK). Alkilani, Jupp, and Sawhney (2013) identified factors hindering H&S practice and improvement measures in the Jordanian construction industry. Okoraforet al (2016) looked at H&S performance evaluation factors while Smallwood and Emuze (2016) looked at fatality, injuries, and diseases in the South African construction industry.
In the study context, an “emerging contractor” can be defined as a “person or enterprise which is owned, managed and controlled by previously disadvantaged persons and which is overcoming business impediments arising from the legacy of apartheid” (CIDB 2011). These enterprises are also termed “small construction enterprises” and “small-scale contractors”. Emerging contractors are generally characterised by limited capital resources, plant and equipment, and managerial support, all of which affect their ability to acquire skilled labour and employ professionals (Eyiah 2001). This study, therefore, defines “emerging contractors” as: Small to medium contracting enterprises that are owned by individuals previously disadvantaged by the apartheid system of the pre-1994 South Africa and are registered with the CIDB grading of 1-7. The emerging contractor companies contribute significantly to economic growth and job creation in South Africa (Van Eeden et al 2003). The sector contributes approximately 67% of employment opportunities in South Africa construction industry (Department of Trade and Industry, 2004). According to Pretorius (2009), 50–90% of South African small businesses fail, 32% of which fail in the first seven years of operation (Nemaenzhe, 2010). Small business failure can result in financial losses (Shepherd et al 2009), loss of resources (Peacock 2000) and job losses (Argenti 1976; Van Witteloostujin 1998; Temtime and Pansiri, 2004). The high failure rate of emerging contractors in South Africa is of great concern (Muzondo and Mc-Cutcheon, 2018) and their slim profit margin which stands threatened by the non-consideration of many factors which includes indirect costs of accidents but not limited to. Yet several studies investigating emerging contractor financial sustainability and longevity have failed to take cognizance of this gap. Arguably, little attention has been given to indirect costs by these entities hence this study.
3. RESEARCH METHOD The study utilised a pragmatic approach and the choice of pragmatism is premised on three main reasons, namely the nature of the research problem, the data and the methods of collecting this data, and the purpose of the research (Gray, 2014; Creswell, 2013). Based on the adoption of the pragmatist philosophical, the use of a simple mixed-method methodological choice was deemed most suitable for the study. The data collection was done in three phases: document analysis: to see if indirect costs were captured; Interviews: to ascertain the reasons behind the inability of Contractors to capture indirect costs and how to improve on it and; the questionnaire survey to evaluate the factors behind the poor capturing of indirect costs and the avenues for improving the present state of capture.
In the first phase, a comprehensive examination of construction accident reports prepared by emerging contractors in South Africa was undertaken to elicit information with a pre-determined set of criteria using thematic analysis. Sixteen accident reports from emerging contractors (CIDB grade 5-7) in South Africa were examined. This was premised on the availability and willingness of the contractor organizations to participate in the exercise. This indicates the use of convenience sampling in the selection of participating contracting organizations for the first phase of the study. For clarity sake, the themes utilized for extracting information from the report include; cost of overtime work to make up for the resultant delays, administrative cost in terms of paperwork related to claims and reports, cost relating to orientation of the replacement workers, cost resulting from delays, additional supervision costs, transportation of injured workers, wages paid while injured worker/s was/were idle, reduction in productivity, cost of clean-up after the accident, cost of replacing

Aiyetan and Okorafor JCPMI, 10(1): 55-69
59
material, plant and equipment, stand-by costs of idle plant and equipment (Levitt and Samelson, 1987; Okorie and Smallwood, 2010; Griffin, 2006).
In the second phase, semi-structured interviews were conducted using a telephonic device to seek the reasons behind the findings emanating from the review of accident reports. The data obtained from the interview sessions formed the basis for phase 3 of the data collection exercise.
In phase 3, a questionnaire survey was administered to collect relevant data for establishing the most important factors militating against the capturing of indirect costs in construction accident report by South African emerging contractors. The questionnaire also sought to decipher the factors with the potential to contribute towards improving the capturing of indirect costs in construction accident report by emerging contractor organizations. A total of 1338 active contractors were listed as emerging contractors under CIDB grade 5-7 for General Building and Civil Engineering category (CIDB, 2015). Based on the target population as discussed above, the researchers used Slovin’s formula with a margin of error of 5% to determine adequate number of sample: n = N 1 + N (e²)
Where n = sample size, N = number of target population, e² = margin of error. Based on the above formula, therefore the population is: n = 1 338 1 + 1 338(0.05²) n = 307.9
Three hundred and seven (307) questionnaires were distributed and two hundred (200) questionnaires were received from the emerging contractors across South Africa. Upon cleaning the data, 119 responses were found adequate and were used for the analysis. The data collected were analysed using descriptive statistics, particularly the Mean item score (MIS).
A five-point Likert scale was used to determine the factors militating the capturing of indirect cost in construction accident report. The adopted scale is as follows; 1= Most not important, 2= Not important, 3= Neutral, 4= Important and 5= Most important. The five-point scale was transformed to mean item score (MIS) for each of the factors of causes as assessed by the respondents. The indices were then used to determine the rank of each item. The ranking made it possible to cross compare the relative importance of the items as perceived by the respondents. The MIS was based on the previous studies conducted by (Sukamolson 2005) and Ayodele and Alabi (2011). This method was also used to analyse the data collected from the questionnaire survey. The computation of the relative mean item score (MIS) was calculated from the total of all weighted responses and then relating it to the total responses on an aspect. This was based on the principle that respondents’ scores on all the selected criteria, considered together, are the empirically determined indices of relative importance. The index of MIS of a particular factor is the sum of the respondents’ actual scores (on the 5-point scale) given by all the respondents’ as a proportion of the sum of all maximum possible scores on the 5-point scale that all the respondents could give to that criterion. Weighting were assigned to each response ranging from one to five for the responses of ‘Most not important ‘to ‘most important’. This is expressed mathematically below. The mean item score (MIS) was calculated for each item as follows, after Lim and Alum (2015). MIS= 1 n1 + 2 n2 + 3 n3+4 n4 +5 n5 -------------------------------------------equation 1 ∑ (N) Where, n1 = number of respondents for not important; n2 = number of respondents for not important; n3 = number of respondents for neutral;
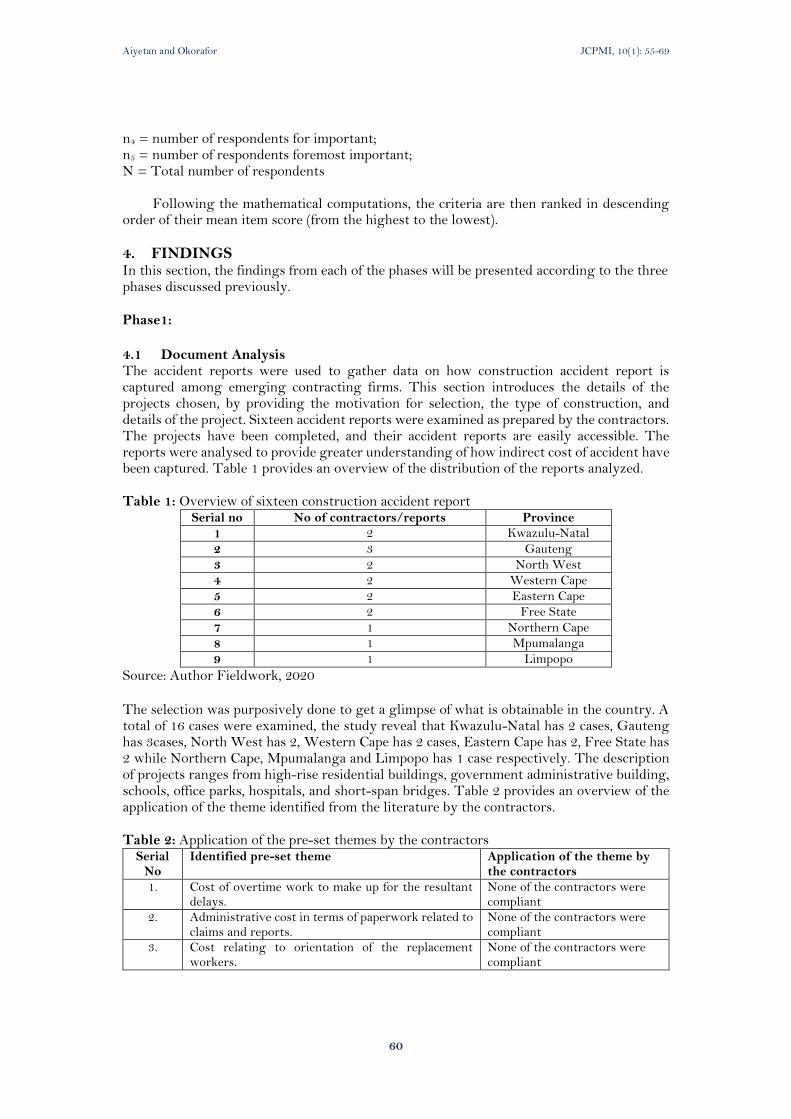
Aiyetan and Okorafor JCPMI, 10(1): 55-69
60
n4 = number of respondents for important; n5 = number of respondents foremost important; N = Total number of respondents
Following the mathematical computations, the criteria are then ranked in descending order of their mean item score (from the highest to the lowest).
4. FINDINGS In this section, the findings from each of the phases will be presented according to the three phases discussed previously. Phase1:
4.1 Document Analysis The accident reports were used to gather data on how construction accident report is captured among emerging contracting firms. This section introduces the details of the projects chosen, by providing the motivation for selection, the type of construction, and details of the project. Sixteen accident reports were examined as prepared by the contractors. The projects have been completed, and their accident reports are easily accessible. The reports were analysed to provide greater understanding of how indirect cost of accident have been captured. Table 1 provides an overview of the distribution of the reports analyzed. Table 1: Overview of sixteen construction accident report
Serial no No of contractors/reports Province
1 2 Kwazulu-Natal
2 3 Gauteng
3 2 North West
4 2 Western Cape
5 2 Eastern Cape
6 2 Free State
7 1 Northern Cape
8 1 Mpumalanga
9 1 Limpopo
Source: Author Fieldwork, 2020
The selection was purposively done to get a glimpse of what is obtainable in the country. A total of 16 cases were examined, the study reveal that Kwazulu-Natal has 2 cases, Gauteng has 3cases, North West has 2, Western Cape has 2 cases, Eastern Cape has 2, Free State has 2 while Northern Cape, Mpumalanga and Limpopo has 1 case respectively. The description of projects ranges from high-rise residential buildings, government administrative building, schools, office parks, hospitals, and short-span bridges. Table 2 provides an overview of the application of the theme identified from the literature by the contractors. Table 2: Application of the pre-set themes by the contractors
Serial No
Identified pre-set theme Application of the theme by the contractors
1. Cost of overtime work to make up for the resultant delays.
None of the contractors were compliant
2. Administrative cost in terms of paperwork related to claims and reports.
None of the contractors were compliant
3. Cost relating to orientation of the replacement workers.
None of the contractors were compliant
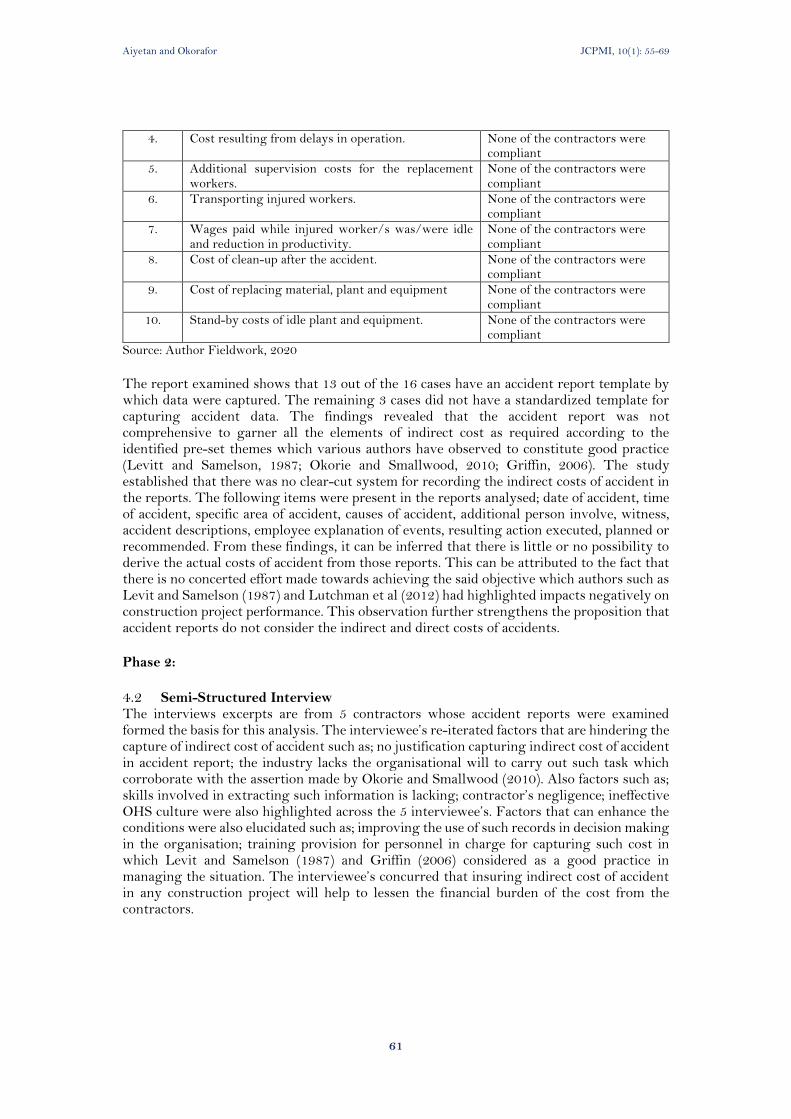
Aiyetan and Okorafor JCPMI, 10(1): 55-69
61
4. Cost resulting from delays in operation. None of the contractors were compliant
5. Additional supervision costs for the replacement workers.
None of the contractors were compliant
6. Transporting injured workers.
None of the contractors were compliant
7. Wages paid while injured worker/s was/were idle and reduction in productivity.
None of the contractors were compliant
8. Cost of clean-up after the accident.
None of the contractors were compliant
9. Cost of replacing material, plant and equipment None of the contractors were compliant
10. Stand-by costs of idle plant and equipment.
None of the contractors were compliant
Source: Author Fieldwork, 2020
The report examined shows that 13 out of the 16 cases have an accident report template by which data were captured. The remaining 3 cases did not have a standardized template for capturing accident data. The findings revealed that the accident report was not comprehensive to garner all the elements of indirect cost as required according to the identified pre-set themes which various authors have observed to constitute good practice (Levitt and Samelson, 1987; Okorie and Smallwood, 2010; Griffin, 2006). The study established that there was no clear-cut system for recording the indirect costs of accident in the reports. The following items were present in the reports analysed; date of accident, time of accident, specific area of accident, causes of accident, additional person involve, witness, accident descriptions, employee explanation of events, resulting action executed, planned or recommended. From these findings, it can be inferred that there is little or no possibility to derive the actual costs of accident from those reports. This can be attributed to the fact that there is no concerted effort made towards achieving the said objective which authors such as Levit and Samelson (1987) and Lutchman et al (2012) had highlighted impacts negatively on construction project performance. This observation further strengthens the proposition that accident reports do not consider the indirect and direct costs of accidents. Phase 2:
4.2 Semi-Structured Interview The interviews excerpts are from 5 contractors whose accident reports were examined formed the basis for this analysis. The interviewee’s re-iterated factors that are hindering the capture of indirect cost of accident such as; no justification capturing indirect cost of accident in accident report; the industry lacks the organisational will to carry out such task which corroborate with the assertion made by Okorie and Smallwood (2010). Also factors such as; skills involved in extracting such information is lacking; contractor’s negligence; ineffective OHS culture were also highlighted across the 5 interviewee’s. Factors that can enhance the conditions were also elucidated such as; improving the use of such records in decision making in the organisation; training provision for personnel in charge for capturing such cost in which Levit and Samelson (1987) and Griffin (2006) considered as a good practice in managing the situation. The interviewee’s concurred that insuring indirect cost of accident in any construction project will help to lessen the financial burden of the cost from the contractors.
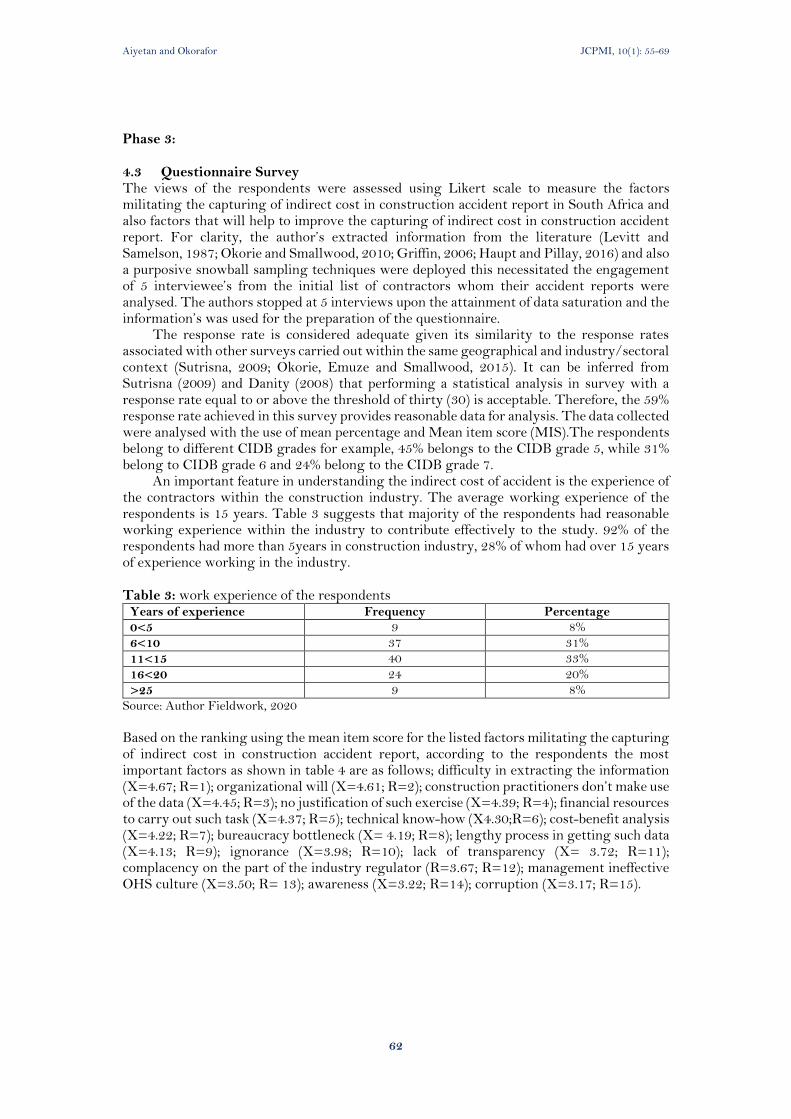
Aiyetan and Okorafor JCPMI, 10(1): 55-69
62
Phase 3: 4.3 Questionnaire Survey The views of the respondents were assessed using Likert scale to measure the factors militating the capturing of indirect cost in construction accident report in South Africa and also factors that will help to improve the capturing of indirect cost in construction accident report. For clarity, the author’s extracted information from the literature (Levitt and Samelson, 1987; Okorie and Smallwood, 2010; Griffin, 2006; Haupt and Pillay, 2016) and also a purposive snowball sampling techniques were deployed this necessitated the engagement of 5 interviewee’s from the initial list of contractors whom their accident reports were analysed. The authors stopped at 5 interviews upon the attainment of data saturation and the information’s was used for the preparation of the questionnaire.
The response rate is considered adequate given its similarity to the response rates associated with other surveys carried out within the same geographical and industry/sectoral context (Sutrisna, 2009; Okorie, Emuze and Smallwood, 2015). It can be inferred from Sutrisna (2009) and Danity (2008) that performing a statistical analysis in survey with a response rate equal to or above the threshold of thirty (30) is acceptable. Therefore, the 59% response rate achieved in this survey provides reasonable data for analysis. The data collected were analysed with the use of mean percentage and Mean item score (MIS).The respondents belong to different CIDB grades for example, 45% belongs to the CIDB grade 5, while 31% belong to CIDB grade 6 and 24% belong to the CIDB grade 7.
An important feature in understanding the indirect cost of accident is the experience of the contractors within the construction industry. The average working experience of the respondents is 15 years. Table 3 suggests that majority of the respondents had reasonable working experience within the industry to contribute effectively to the study. 92% of the respondents had more than 5years in construction industry, 28% of whom had over 15 years of experience working in the industry. Table 3: work experience of the respondents
Years of experience Frequency Percentage
0<5 9 8%
6<10 37 31%
11<15 40 33%
16<20 24 20%
>25 9 8%
Source: Author Fieldwork, 2020
Based on the ranking using the mean item score for the listed factors militating the capturing of indirect cost in construction accident report, according to the respondents the most important factors as shown in table 4 are as follows; difficulty in extracting the information (X=4.67; R=1); organizational will (X=4.61; R=2); construction practitioners don’t make use of the data (X=4.45; R=3); no justification of such exercise (X=4.39; R=4); financial resources to carry out such task (X=4.37; R=5); technical know-how (X4.30;R=6); cost-benefit analysis (X=4.22; R=7); bureaucracy bottleneck (X= 4.19; R=8); lengthy process in getting such data (X=4.13; R=9); ignorance (X=3.98; R=10); lack of transparency (X= 3.72; R=11); complacency on the part of the industry regulator (R=3.67; R=12); management ineffective OHS culture (X=3.50; R= 13); awareness (X=3.22; R=14); corruption (X=3.17; R=15).
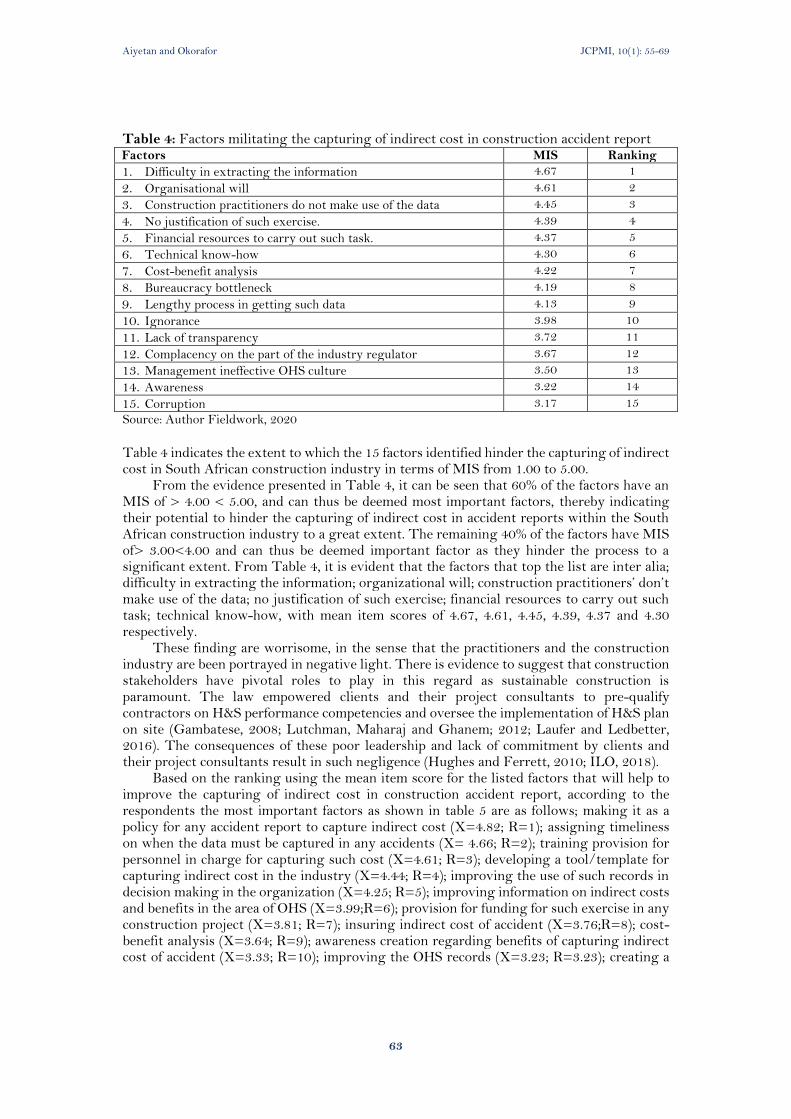
Aiyetan and Okorafor JCPMI, 10(1): 55-69
63
Table 4: Factors militating the capturing of indirect cost in construction accident report Factors MIS Ranking
1. Difficulty in extracting the information 4.67 1
2. Organisational will 4.61 2
3. Construction practitioners do not make use of the data 4.45 3
4. No justification of such exercise. 4.39 4
5. Financial resources to carry out such task. 4.37 5
6. Technical know-how 4.30 6
7. Cost-benefit analysis 4.22 7
8. Bureaucracy bottleneck 4.19 8
9. Lengthy process in getting such data 4.13 9
10. Ignorance 3.98 10
11. Lack of transparency 3.72 11
12. Complacency on the part of the industry regulator 3.67 12
13. Management ineffective OHS culture 3.50 13
14. Awareness 3.22 14
15. Corruption 3.17 15
Source: Author Fieldwork, 2020
Table 4 indicates the extent to which the 15 factors identified hinder the capturing of indirect cost in South African construction industry in terms of MIS from 1.00 to 5.00.
From the evidence presented in Table 4, it can be seen that 60% of the factors have an MIS of > 4.00 < 5.00, and can thus be deemed most important factors, thereby indicating their potential to hinder the capturing of indirect cost in accident reports within the South African construction industry to a great extent. The remaining 40% of the factors have MIS of> 3.00<4.00 and can thus be deemed important factor as they hinder the process to a significant extent. From Table 4, it is evident that the factors that top the list are inter alia; difficulty in extracting the information; organizational will; construction practitioners’ don’t make use of the data; no justification of such exercise; financial resources to carry out such task; technical know-how, with mean item scores of 4.67, 4.61, 4.45, 4.39, 4.37 and 4.30 respectively.
These finding are worrisome, in the sense that the practitioners and the construction industry are been portrayed in negative light. There is evidence to suggest that construction stakeholders have pivotal roles to play in this regard as sustainable construction is paramount. The law empowered clients and their project consultants to pre-qualify contractors on H&S performance competencies and oversee the implementation of H&S plan on site (Gambatese, 2008; Lutchman, Maharaj and Ghanem; 2012; Laufer and Ledbetter, 2016). The consequences of these poor leadership and lack of commitment by clients and their project consultants result in such negligence (Hughes and Ferrett, 2010; ILO, 2018).
Based on the ranking using the mean item score for the listed factors that will help to improve the capturing of indirect cost in construction accident report, according to the respondents the most important factors as shown in table 5 are as follows; making it as a policy for any accident report to capture indirect cost (X=4.82; R=1); assigning timeliness on when the data must be captured in any accidents (X= 4.66; R=2); training provision for personnel in charge for capturing such cost (X=4.61; R=3); developing a tool/template for capturing indirect cost in the industry (X=4.44; R=4); improving the use of such records in decision making in the organization (X=4.25; R=5); improving information on indirect costs and benefits in the area of OHS (X=3.99;R=6); provision for funding for such exercise in any construction project (X=3.81; R=7); insuring indirect cost of accident (X=3.76;R=8); cost-benefit analysis (X=3.64; R=9); awareness creation regarding benefits of capturing indirect cost of accident (X=3.33; R=10); improving the OHS records (X=3.23; R=3.23); creating a

Aiyetan and Okorafor JCPMI, 10(1): 55-69
64
common database on indirect cost on occupational exposure to accidents and disease (X=3.03; R=12).
Table 5: Factors that will help to improve the capturing of indirect cost in construction accident report
Factors MIS Ranking
1. Making it as a policy for any accident report to capture indirect cost 4.82 1
2. Assigning timeliness on when the data must be captured in any accidents. 4.66 2
3. Training provision for personnel in charge for capturing such cost. 4.61 3
4. Developing a tool/template for capturing indirect cost in the industry 4.44 4
5. Improving the use of such records in decision making in the organisation. 4.25 5
6. Improving information on indirect costs and benefits in the area of OHS 4.09 6
7. Provision for funding for such exercise in any construction project. 3.81 7
8. Insuring indirect cost of accident 3.76 8
9. Cost-benefit analysis 3.64 9
10. Awareness creation (benefits of capturing indirect cost of accident). 3.33 10
11. Improving the OHS records 3.23 11
12. Creating a common database on indirect cost on occupational exposure to accidents and disease
3.03 12
Source: Author Fieldwork, 2020
Table 5 indicates the extent to which the 12 factors identified can improve the capturing of indirect cost in South African construction industry in terms of MIS from 1.00 to 5.00.
It is deduced that 50% of the factors have MIS of > 4.00 < 5.00, and can thus be deemed most important factors, which indicates in general that they can improve the capturing of indirect cost in South African construction industry to a great extent. The remaining 50% of the factors have MIS of> 3.00 <4.00 and can thus be deemed important factor as they can improve the process to a significant extent. From Table 5 it is evident that the factors that top the list are inter alia; making it as a policy for any accident report to capture indirect cost; assigning timeliness on when the data must be captured in any accident report; training provision for personnel in charge for capturing such cost; developing a tool/template for capturing indirect cost in the industry; improving the use of such records in decision making in the organization; improving information on indirect costs and benefits in the area of OHS with mean item scores of 4.82, 4.66, 4.61, 4.44, 4.25 and 4.09 respectively. The study reveal that factors such as; making it as a policy for any accident report to capture indirect cost; assigning timeliness on when the data must be captured in any accident report; developing a tool/template for capturing indirect cost of accident in the industry and improving the use of such records in decision making in the organisation will engender sustainable practice and
also improve construction project performance (Raftery, 2003; Siemiatycki, 2009).
5. DISCUSSION OF FINDINGS This section comprises of the findings emanating from the two phases of data collection and analysis described in the preceding section. However, the presentation of the data and subsequent discussion will be aligned to main categories namely: (1) extraction of information from the document analysis and (2) the respondent views on the questionnaire. This presentation format is expected to enable coherence and streamlining of the data emerging from diverse data sources.
The examinations of the report indicate that the indirect costs of accident are not captured as per with the pre-set theme. This was clearly shown from the reports examined. Evidence suggests that there is no coordinated effort from the management of the organisations to do so. The practical implication of this is that the contractors will be short-
Aiyetan and Okorafor JCPMI, 10(1): 55-69
65
changed in knowing the exact loss they incur and at the same time will not know how to curb the effect which will adversely affect the sustainability of the firm. The reason behind it can be attributed to the findings from the study (see table 4) as it relate to difficulty in extracting the information, organizational will, construction practitioners don’t make use of the data and no justification of such exercise which Haupt and Pillay (2016) concurred as dominating factor responsible of such negligence. In resolving this issue of capturing indirect cost authors such as Levitt and Samelson, (1987); Okorie and Smallwood (2010) and Griffin (2006) propounded that within the study pre-set theme that the value of each cost item is derived as follows: overtime cost should be derived from the records of the personnel management and the payroll records using the actual scales of income for each worker involved for number of days actually lost; cost involved in administrating paperwork for incident investigation and reports should be derived from corporate health and safety department in the particular organisation or any unit saddled with such responsibility; cost of orientating the new workers should be derived from the records of either temporary employment services or technical related and the same rates as employees of organisation were used; cost resulting from delays should be captured from the records of personnel department; additional supervision cost should be derived from personnel department; cost of all the medical supports should be established from medical records kept by the various organisations; cost of productivity should be gathered from the personnel department and the payroll records of each workers; cost of cleaning up accident should be obtain from the medical records kept by the various organisations; cost associates with replacing material, plant and equipment should be derived from hire fees or replacement costs, depending on type of equipment and plant, since these costs are captured by each site (Levitt and Samelson, 1987; Okorie and Smallwood, 2010; Griffin, 2006). Also, the wider implication of this finding and as well as assertion made by the authors is that the capturing of indirect cost clearly deserves attention and can be captured amongst the stakeholders because such practice adds value to construction contractor business sustainability.
In probing the reason behind the findings, the study revealed many factors such as;difficulty in extracting the information; organizational will; construction practitioners don’t make use of the data; no justification of such exercise; financial resources to carry out such task and technical know-how played a major role amongst the emerging contractors. Importantly, this factor indicates the severity of their influence on the capturing of the indirect cost of accident. These findings corroborate with the study of ILO (2011); Alkilani et al (2013) and Haupt and Pillay (2016) as it relates to the finding. This has an implication as the negligence hampers on the contractor’s accountability and profitability. The provision for capturing indirect cost should be a pre-requisite for overall construction sustainability (Choi, 2006; Western National Insurance, 2010). Determination of indirect cost of accident as per each project will assist in identifying control measures that can be put in place to prevent further re-occurrences (Chileshe and Dzisi, 2012). Also it is a good-practice to document the outcome of any incident investigation to the rest of the employees, as that way they are all made aware of the potential risks (direct cost and indirect cost) and of changes the business has made to a process or procedure, including the reasons behind those changes (Choi, 2006; Watson 2017). In addition, Watson (2017) concurred that timely and efficient reporting of accident is needful to assess the financial risk and identify appropriate corrective actions that can be taken in engendering construction project accountability.In enhancing the condition, the study highlighted the factors such as; making it as a policy for any accident report to capture indirect cost; assigning timeliness on when the data must be captured in any accidents; training provision for personnel in charge for capturing such cost and improving the use of such records in decision making in the organisation.
Aiyetan and Okorafor JCPMI, 10(1): 55-69
66
6. IMPLICATION OF FINDINGS OF THE STUDY The study’s findings will serve as a theoretical platform for the development of a framework for enabling effective capturing of indirect costs by the contractors in their accident reports. Also, the findings will assist stakeholders to have a comprehensive view of the factors that are hindering the capture of indirect cost of accident and factors that can enhance the conditions. It offers a knowledge base for industry stakeholders and especially the emerging contractors regarding the indirect cost of accident as it affects contractor’s competitiveness.
7. CONCLUSION Based on the study, it is paramount that the emerging contractors should understand the need to capture indirect cost of accident in their accident report. The need is necessary at this era as the industry is geared towards sustainable development. It is evident in the examined report that the economic impact of indirect cost cannot be established and as such will affect the accountability of the project performance. In the study, the authors highlight the need for a comprehensive analysis of the indirect cost of any construction-related accident. Such examination will deepen the debate surrounding indirect cost of accident which is neglected as the study deduced.
In furtherance to the study, there is a need for; establishment of indirect cost of accident in any report; a verifiable data; improvement of H&S records; identifying an appropriate methodology to collect data on indirect cost of accident. The examination of these variables will add up to overall project performance in enhancing improved allocation of resources in construction accident abatement. It is expected that this study would provide the much-needed debate surrounding the factors that hinder the capturing of indirect cost of accident and its improvement. This will bring about enthronement of best practices across board which leads to the establishment of robust OHS culture and sustainability of construction industry as a whole. The limitation of the study is relatively due to smaller sample adopted and therefore, the study is recommending a wider sample that will cut across all contractors. Thisstudy has practical implications on the emerging contractors as it provides information on factors that negate and impact on sustainability of the emerging contractors as it relates to OHS performance and competitiveness.
8. REFERENCES Agumba, J. N and Haupt, T. C (2018). The influence of health and safety practices on health
and safety performance outcomes in small and medium enterprise projects in the South African construction industry. J. S. Afr. Inst. Civ. Eng., Midrand, 60 (3), 61-72, Sept. 2018. Available from <http://www.scielo.org.za/scielo.php?script=sci_arttextand pid=S1021-20192018000300006and lng=enandnrm=iso>. [Accessed on 21 February 2020].
Alkilani, S. Z., Jupp, J and Sawhney, A. (2013). Issues of construction health and safety in developing countries: A case of Jordan. Australasian Journal of Construction Economics and Building 13(3),141-156
Argenti, J. (1976). Corporate planning and corporate collapse. Long Range Planning, 9(6): 12–17
Ayodele, E.O. and Alabi, O.M. (2011). Abandonment of Construction Projects in Nigeria causes and Effects. Journal of Emerging Trends in Economics and Management Science, 2(2), 142-145
Brace C.L. and Gibb, A.G.F. (2005). A health management process for the construction industry. In Haupt, T. and Smallwood, J. (Eds.) Rethinking and revitalising construction safety, health and quality. Port Elizabeth, South Africa.
Brauer, L.R. (2006). Safety and health for engineers, 2nd ed. New Jersey: Wiley-Inter science,

Aiyetan and Okorafor JCPMI, 10(1): 55-69
67
Chileshe, N., and Dzisi, E. (2012). Benefits and barriers of construction health and safety management (HSM). Journal of Engineering, Design and Technology, 10 (2), 276–298.
Choi, S.D. (2006). A survey of the safety roles and costs of injuries in the roofing contracting industry. Journal of SH&E Research, 3(1), 1-20.
Construction Health and Safety Group. (2018). Health and safety in the UK construction industry. Available from www.chsg.co.uk/news/health-and-safety[Accesed on 22/1/2020].
Construction Industry Development Board (2015). Framework: National Contractor Development Programme. Pretoria: CIDB.
Dainty, A.R.J. (2008). Methodological pluralism in construction management research, In: Knight, A. and Roddock, L. (Eds). Advanced research methods in the built environment, oxford: willey-Blackwell, pp.1-3
Department of Trade and Industry. (2004). Annual Review of Small Business in South Africa 2003. Pretoria: Department of Trade and Industry, Enterprise Development Unit.
Eyiah, A. K (2001). An integrated approach to financing small contractors in developing countries: A conceptual model. Construction Management and Economics, 19(5): 511–518.
Federated Employer’s Mutual Assurance Company. (2016). Injury and accident statistics. Available from http://www.fem.co.za/Layer_SL/FEM_HomeAccident_Stats/FEM_AccidentStats.htm[Accesed on 22/2/2020].
Flin, R. (2003). Danger-men at Work: Management influence on Safety, Human Factors and Ergonomics in Manufacturing, Engineering Construction and management, 12 (2), 104 – 131
Gambatese, J.A. (2008). Research issues in Prevention through Design. Journal of Safety Research, 39 (2), 153-156
Giang, D. T. H. and Pheng, L. S. (2011). Role of construction in economic development: Review of key concepts in the past 40 years. Habitat International, 35(1),118-125.
Griffin, J. (2006). The true cost of accidents – Underground construction. In Proceedings of the 49th ASC Annual International Conference, Charles Berryman, 2013.
Haupt, T. C and Pillay, K. (2016). Investigating the true cost of Construction Accident. Journal of Engineering, Design and Technology, 14(2), 373-419
Heinrich, H.W (1959). Industrial accident prevention: A scientific approach. New York: McGraw-Hill Book Co.
Hinze, J. (2006). Construction safety (2nd ed.). Upper Saddle River, NJ: Prentice-Hall Book. Hinze, J. W. (2007). Construction safety, New Jersey: Prentice-Hall. Hughes, P. and Ferrett, E. D. (2010). Introduction to Health and Safety in Construction,
Butterworth Heinemann, Elsevier Linacre House, Jordan Hill Oxford 0X2 8DP, UK. Hughes, P., and Ferrett, E. (2016). Introduction to health and safety at work (6th ed.). New
York, NY: Routledge International Labour organisation. (2018). Standard on occupational safety and health
promoting safe and healthy working environment: Geneva, ILO. International Labour organisation (2011). ILO standard on occupational safety and health
promoting safe and healthy working environment: Geneva, ILO International Safety Equipment Association (ISEA). (2012). Personal protective equipment:
An investment in your workers’ and company’s future. Arlington, VA: Author. Kanchana, S., Sivaprakash, P., and Joseph, S. (2017). Studies on labour safety in construction
sites. The Scientific World Journal, 2015, 1–6. Kheni, N., Dainty, A. G. F., and Gibb, A. R. J. (2008). Health and safety management in
developing countries: A study of construction SMEs in Ghana. Construction Management and Economics, 26 (11), 1159–1169.
Aiyetan and Okorafor JCPMI, 10(1): 55-69
68
Laufer, A. and Ledbetter, W.B. (2016). Assessment of safety performance measures at construction sites. Journal of Construction Engineering, 112(4), 530–542.
Levit, R.E., and Samelson, N. M. (1987). Construction Safety Management, McGraw-Hill Book Company.
Lim, E.C. and J. Alum., Construction productivity: issues encountered by contractors in Singapore. International Journal of Project Management vol 13(1), 51-8, 2015.
Lingard, H. (2013). Occupational health and safety in the construction industry. Construction Management and Economics, 31 (6), 505–514.
Lutchman, C., Maharaj, R. and Ghanem, W. (2012). Safety management: A comprehensive approach to developing a sustainable system, 1st Edition, Boca Raton: CRC Press.
Manuele, F. (2011). Accident Costs: Rethinking ratios of indirect to direct costs. Available at https://aeasseincludes.assp.org/professionalsafety/pastissues/056/01/039_047_F2Manuele_0111Z.pdf[Accesed on 4/6/2020].
Murie, F. (2007). Building safety: An international perspective. International Journal of Occupational and Environmental Health, 13, 5-11.
Muzondo, F.T and Mc-Cutcheon, R.T. (2018). The relationship between project performance of emerging contractors in government infrastructure projects and their experience and technical qualifications. Journal of the South African Institution of Civil Engineering, 60(4), 25–33.
Nemaenzhe, P. P. (2010). Retrospective analysis of failure causes in South African small businesses. PhD Thesis, Pretoria: University of Pretoria.
Okorafor, C, Emuze, F.A and Das, D. K. (2016). Relative importance of health and safety performance evaluation factors in organisation level within Gauteng construction industry. In: Proceedings of the International Conference on Infrastructural Development in Africa Johannesburg.
Okorie, N. V., and Smallwood, J. J. (2010, July 18–20). Impact of health and safety culture on construction site performance in South-Africa. In Proceedings 5th Built Environment Conference (pp. 497–508). Durban
Okoye, P. U., Ezeokonkwo, J. U., and Ezeokoli, F. O. (2016). Building construction workers’ health and safety knowledge and compliance on site. Journal of Safety Engineering, 5 (1), 17–26.
Okoye, P. U., Okolie, K. C., and Ngwu, C. (2017). Multilevel safety intervention implementation strategies for Nigeria construction industry. Journal of Construction Engineering, 2017, 1–14.
Orji, S. E., Enebe, E. C., and Onoh, F. E. (2016). Accidents in building construction sites in Nigeria: A case of Enugu State. International Journal of Innovative Research and Development, 5 (4), 244–248
Osei, V. (2013). The construction industry and its linkages to the Ghanaian economy – Policies to improve the sector’s performance. International Journal of Development and Economic Sustainability, 1(1), 56-72.
Peacock, R. (2000). Failure and assistance of small firms. Small Enterprise Series, 1: 1–56. Pretorius, M. (2009). Defining business decline, failure and turnaround: A content analysis.
South African Journal of Entrepreneurship and Small Business Management, 2(1), 1–16.
Raftery, J. (2003). Risk analysis in project management. S.l: Routledge. Sanchez, F. A. S., Peláez, C. G. I., and Alís, J. C. (2017). Occupational safety and health in
construction: A review of applications and trends. Industrial Health. National Institute of Occupational. Safety and Health, 55 (3), 210–218.
Shepherd, D. A., Wiklund, J and Haynie, J. M. (2009). Moving forward: Balancing the financial and emotional costs of business failure. Journal of Business Venturing, 24(2), 134–148.
Aiyetan and Okorafor JCPMI, 10(1): 55-69
69
Siemiatycki, M. (2009). Academics and Auditors Comparing Perspectives on Transportation Project Cost Overruns. Journal of Planning Education and Research, 29(2), 142-156.
Smallwood J and Haupt T. (2005). The need for construction health and safety (Hand S) and the Construction Regulations: engineer’s perceptions. Journal of the South African Institution of Civil Engineering, 47 (2), 2-8.
Smallwood, J and Emuze, F. (2016). Towards Zero Fatalities, Injuries, and Disease in Construction. Procedia Engineering, 164, 453-460
Statistics South Africa. (2018a). Gross domestic product: Second quarter. Statistical Release P0441. Pretoria: Statistics South Africa.
Statistics South Africa. (2018b). Quarterly labour force survey: Quarter 4. Statistical release P0211. Pretoria: Statistics South Africa.
Sukamolson, S. (2005). Fundamentals of Quantitative Research. Chulalongkorn University, Thailand.
Sutrisna, M. (2009). Research methodology in doctoral research: Understanding the meaning of conducting qualitative research, Working Paper presented in ARCOM Doctoral Workshop, Liverpool, John Moores University.
Temtime, Z.T and Pansiri, J (2004). Small business critical success/failure factors in developing economies: SME evidence from Botswana. American Journal of Applied Sciences, 1(1), 18–25.
United States OSHA. (2017). Safety and health management systems eTool: Costs of accidents. Washington, DC: U.S.
Van Eeden, S, Viviers, S and Venter, D. (2003). A comparative study of selected problems encountered by small businesses in the Nelson Mandela, Cape Town and Egoli metropoles. Management Dynamics, 12(3), 13–23.
Van Witteloostujin, A. (1998). Bridging behavioural and economic theories of decline: Organizational inertia, strategic competition, and chronic failure. Management Science, 44(4), 501–519.
Watterson A. (2017). Global construction health and safety – what works, what does not, and why? International Journal of Occupational Environment and Health. 2017. 13,1-4.
Western National Insurance (2010). The total costs of accidents and how they affect your profits. Available at www.wnins.com/resources/commer cial/Spotlight/Total%20cost%20of%20accidents.pdf [Accessed on 4/6/2020].
World Health Organisation. (2010). World Health Report 2010, Geneva: London.
Journal of Construction Project Management and Innovation, 10 (1): 70-85, 2020
ISSN 2223-7852 © Sustainable Human Settlement and Construction Research Centre DOI: https://doi.org/10.36615/jcpmi.v10i1.192
70
CONSTRUCTION STAKEHOLDERS’ PERSPECTIVE ON EXTERNAL RELATED RISK FACTORS
INFLUENCING CONSTRUCTION PROJECT PERFORMANCE
Abdarahim SALEM1, Eric SIMPEH2 and Julius FAPOHUNDA3
1,2and3Department of Construction Management, Cape Peninsula University of Technology PO Box 1906. Bellville. 7535.Cape Town, South Africa
Email: [email protected]; [email protected]; [email protected]
ABSTRACT The construction industry is extremely complex, with dynamic project environments creating an atmosphere of high uncertainty and risk. For that reason, risks in construction project have become an inevitable feature and the industry is susceptible to numerous business, socio-political and technical risks that negatively influence project delivery. This study therefore investigates the causes of external risks factors in construction project delivery and the effect on project and organisational performance so that efficient control measures can be designed to minimise its occurrence. A quantitative research design was adopted, and the sample comprised of randomly selected construction professionals in the Western Cape Province. The data was statistically analysed using descriptive and inferential analyses. The salient findings revealed that socio-political-related risk factors were the major causes of risks during construction project delivery, these factors include labour strikes and disputes due to union issues, excessive influence by government on court proceedings regarding construction project disputes, and constraints on the availability and employment of expatriate staff. In addition, the study revealed the impact of external related risks on projects and organisational performance, and it was found that cost overrun was ranked the most significant on project performance and disputes between parties to the contract was ranked the most significant on organisational performance. In the context of the South African construction industry, previous studies tended to focus more on internal risks as opposed to external risks. Therefore, this study makes a contribution to the body of knowledge on the subject within a previously unexplored context. The study provides insights with regard to the sources of external related risks associated with construction project within the context of the South African construction industry. Keywords: Construction project; construction stakeholders; external related risk; project performance; socio-political risk
1. INTRODUCTION The construction industry is susceptible to risks, particularly external related factors because of the unusual characteristic of construction processes, such as long time periods, challenging environment, complex procedures, monetary force and different organisational structures (Zou, Zhang and Wang, 2006). Kuang (2011) opined that construction projects have a number of features, including specific goals, limited time periods, financial constraints and economic demands, particular organisational and legal contractual terms, complication and systematic characteristics. According to Tah, Thorpe and McCaffer (1993), external risks are those factors that are predominant in the external environment of projects, including risk related to inflation, fluctuations in currency exchange rate, change in technology, client-

Salem et al. JCPMI, 10(1): 70-85
71
related changes, politics, inclement weather conditions and major accidents or natural disasters. Furthermore, external risk is relatively uncontrollable and there is the need to continually examine and predict its occurrence in the context of a company’s strategy (Zavadskas, Turskis and Tamošaitiene, 2010; Tah et al.1993). Any investment project is a complicated system, but this is even more so for construction projects, as there are several external risk aspects and complex relations, which will impact the project. Therefore, if external risk factors are not considered, the factors will cause damage because of the inevitable decision-making errors (Kuang, 2011). Construction in South Africa faces many external risks. According to Chihuri and Pretorius (2010), some of the major external risks associated with construction projects in South Africa are: lack of power (electricity crisis), skills shortages, and escalating costs in construction materials. In a similar vein, Shunmugam and Rwelamila (2014) attributed the lack of progress in the South African construction industry to the rapid upsurge in fuel prices, poor performance of the local currency (Rands) compared to other major currencies, including the British pound and the US dollar, combined with a high level of inflation. Shunmugam and Rwelamila (2014) add that one of the worst blows to the industry surfaced in 2011, where some of the biggest construction firms were charged with anti-competitive behaviour. Gitau (2015) stated that programming and design may entail risks such as over-design, poor constructability, poor estimating and scope creep. On the other hand, the construction phase is susceptible to external risks relating to inflation, escalating costs in building materials and delays in obtaining permits. It is evident from the above discussion that construction projects are faced with many external risks which often impact on project delivery adversely in terms of cost, time, quality, safety and environment. In addition, the magnitude of these effects as well as the frequency of occurrence have not been adequately assessed. Therefore, the study aims to investigate the most significant factors that contribute to the major causes of external risk during construction and its impact on construction project performance. The purpose of the study is pursued by analysing quantitative data obtained from randomly selected construction professionals based in Cape Town, South Africa. The structure of this paper presents brief discussions with regard to the extant literature pertaining to sources of external risks and its impact of project performance. The methodological approach for collecting and analysing the data is outlined in the subsequent section. Thereafter, the findings from the survey are presented and discussed. The final section presents the conclusions of the study.
2. LITERATURE REVIEW 2.1 Taxonomy of external risk factors influencing construction project performance An extensive amount of literature has been published with respect to external related risk factors influencing construction project performance (Al-Shibly, Louzi and Hiassat, 2013; El-Sayegh, 2008; Qammaz, 2007; Van Thuyet, Ogunlana and Dey, 2007). According to Qammaz (2007), external risks may originate from outside the project and in most cases, are out of the control of contractors. Rezakhani (2012) for instance, categorised the external risk factors into two groups namely unpredictable/uncontrollable and predictable/controllable. Al-Shibly et al. (2013) also identified eight primary external risk factors including: economic and globalisation dynamics; environmental constraints; government; unanticipated circumstances; statutory requirements; political controls; health and safety issues outside the control of the project team, and socio-cultural issues. Qammaz (2007) opined that the sources of external risk include adverse physical conditions, design, managerial complexities, client’s financial resources, techniques and technology, extent of subcontractor availability, and availability of resources. Furthermore, Banaitiene and Banaitis (2012) stated that external risks may be categorised into three main groups such as lack of knowledge regarding social conditions, as well as lack of knowledge regarding the local economy and political situations. The authors further indicated that unfamiliar and new procedural formalities, regulatory
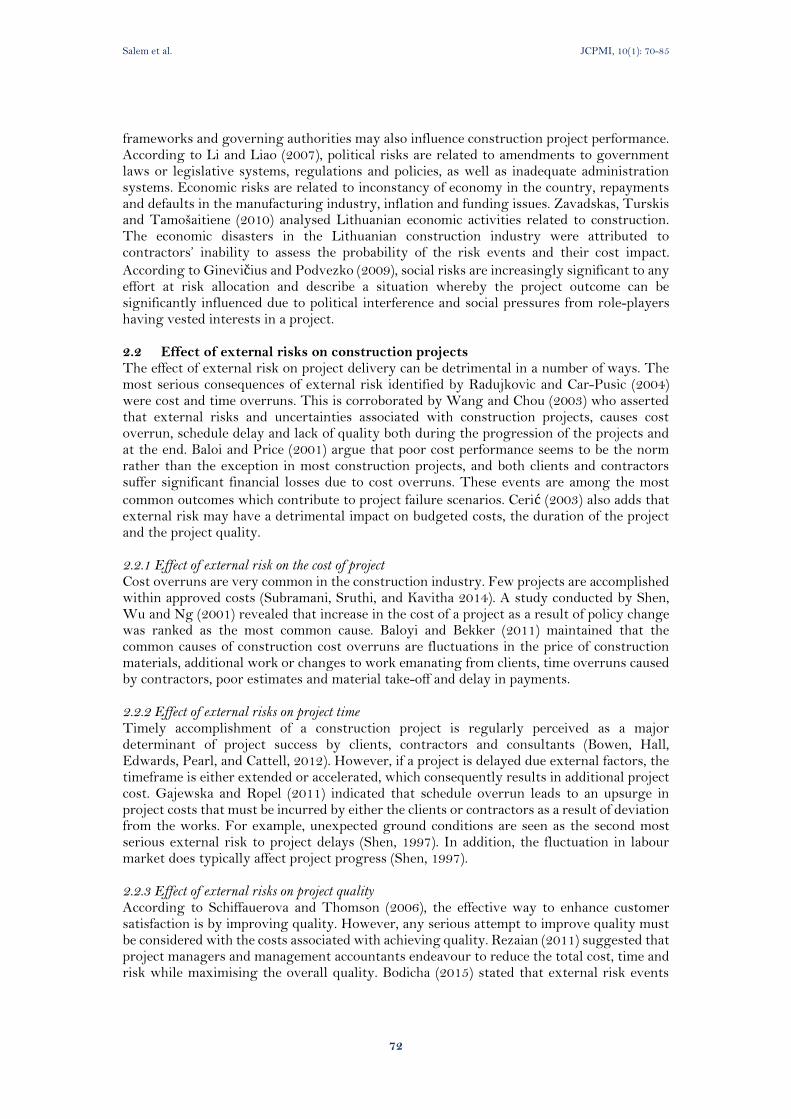
Salem et al. JCPMI, 10(1): 70-85
72
frameworks and governing authorities may also influence construction project performance. According to Li and Liao (2007), political risks are related to amendments to government laws or legislative systems, regulations and policies, as well as inadequate administration systems. Economic risks are related to inconstancy of economy in the country, repayments and defaults in the manufacturing industry, inflation and funding issues. Zavadskas, Turskis and Tamošaitiene (2010) analysed Lithuanian economic activities related to construction. The economic disasters in the Lithuanian construction industry were attributed to contractors’ inability to assess the probability of the risk events and their cost impact.
According to Ginevičius and Podvezko (2009), social risks are increasingly significant to any effort at risk allocation and describe a situation whereby the project outcome can be significantly influenced due to political interference and social pressures from role-players having vested interests in a project. 2.2 Effect of external risks on construction projects The effect of external risk on project delivery can be detrimental in a number of ways. The most serious consequences of external risk identified by Radujkovic and Car-Pusic (2004) were cost and time overruns. This is corroborated by Wang and Chou (2003) who asserted that external risks and uncertainties associated with construction projects, causes cost overrun, schedule delay and lack of quality both during the progression of the projects and at the end. Baloi and Price (2001) argue that poor cost performance seems to be the norm rather than the exception in most construction projects, and both clients and contractors suffer significant financial losses due to cost overruns. These events are among the most
common outcomes which contribute to project failure scenarios. Cerić (2003) also adds that external risk may have a detrimental impact on budgeted costs, the duration of the project and the project quality. 2.2.1 Effect of external risk on the cost of project Cost overruns are very common in the construction industry. Few projects are accomplished within approved costs (Subramani, Sruthi, and Kavitha 2014). A study conducted by Shen, Wu and Ng (2001) revealed that increase in the cost of a project as a result of policy change was ranked as the most common cause. Baloyi and Bekker (2011) maintained that the common causes of construction cost overruns are fluctuations in the price of construction materials, additional work or changes to work emanating from clients, time overruns caused by contractors, poor estimates and material take-off and delay in payments. 2.2.2 Effect of external risks on project time Timely accomplishment of a construction project is regularly perceived as a major determinant of project success by clients, contractors and consultants (Bowen, Hall, Edwards, Pearl, and Cattell, 2012). However, if a project is delayed due external factors, the timeframe is either extended or accelerated, which consequently results in additional project cost. Gajewska and Ropel (2011) indicated that schedule overrun leads to an upsurge in project costs that must be incurred by either the clients or contractors as a result of deviation from the works. For example, unexpected ground conditions are seen as the second most serious external risk to project delays (Shen, 1997). In addition, the fluctuation in labour market does typically affect project progress (Shen, 1997). 2.2.3 Effect of external risks on project quality According to Schiffauerova and Thomson (2006), the effective way to enhance customer satisfaction is by improving quality. However, any serious attempt to improve quality must be considered with the costs associated with achieving quality. Rezaian (2011) suggested that project managers and management accountants endeavour to reduce the total cost, time and risk while maximising the overall quality. Bodicha (2015) stated that external risk events
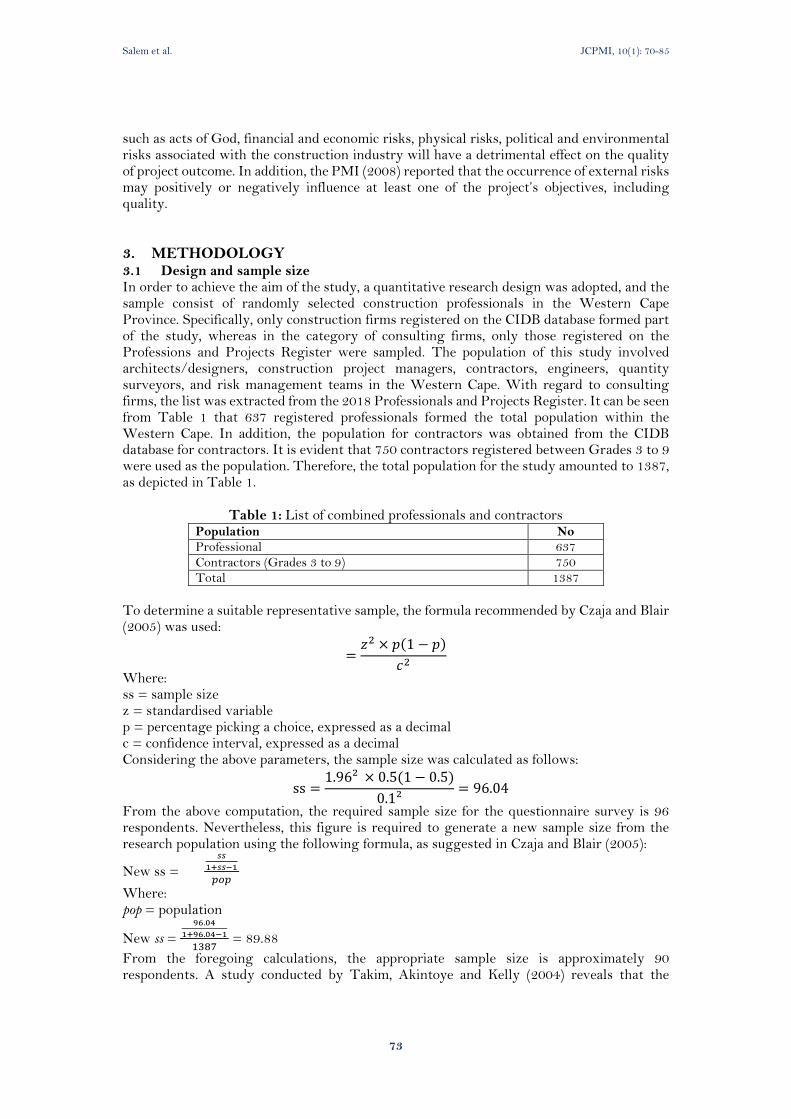
Salem et al. JCPMI, 10(1): 70-85
73
such as acts of God, financial and economic risks, physical risks, political and environmental risks associated with the construction industry will have a detrimental effect on the quality of project outcome. In addition, the PMI (2008) reported that the occurrence of external risks may positively or negatively influence at least one of the project’s objectives, including quality.
3. METHODOLOGY 3.1 Design and sample size In order to achieve the aim of the study, a quantitative research design was adopted, and the sample consist of randomly selected construction professionals in the Western Cape Province. Specifically, only construction firms registered on the CIDB database formed part of the study, whereas in the category of consulting firms, only those registered on the Professions and Projects Register were sampled. The population of this study involved architects/designers, construction project managers, contractors, engineers, quantity surveyors, and risk management teams in the Western Cape. With regard to consulting firms, the list was extracted from the 2018 Professionals and Projects Register. It can be seen from Table 1 that 637 registered professionals formed the total population within the Western Cape. In addition, the population for contractors was obtained from the CIDB database for contractors. It is evident that 750 contractors registered between Grades 3 to 9 were used as the population. Therefore, the total population for the study amounted to 1387, as depicted in Table 1.
Table 1: List of combined professionals and contractors Population No
Professional 637 Contractors (Grades 3 to 9) 750 Total 1387
To determine a suitable representative sample, the formula recommended by Czaja and Blair (2005) was used:
=𝑧2 × 𝑝(1 − 𝑝)
𝑐2
Where: ss = sample size z = standardised variable p = percentage picking a choice, expressed as a decimal c = confidence interval, expressed as a decimal Considering the above parameters, the sample size was calculated as follows:
ss =1.96² × 0.5(1 − 0.5)
0.1²= 96.04
From the above computation, the required sample size for the questionnaire survey is 96 respondents. Nevertheless, this figure is required to generate a new sample size from the research population using the following formula, as suggested in Czaja and Blair (2005):
New ss = 𝑠𝑠
1+𝑠𝑠−1
𝑝𝑜𝑝
Where: pop = population
New ss =
96.04
1+96.04−1
1387 = 89.88
From the foregoing calculations, the appropriate sample size is approximately 90 respondents. A study conducted by Takim, Akintoye and Kelly (2004) reveals that the
Salem et al. JCPMI, 10(1): 70-85
74
response rate in a survey could range between 20 – 30%. Thus, in order to make provision for non-response, the sample size was adjusted accordingly. With this in mind, a suitable assumption of 30% in relation to the response rate was considered, and the appropriate sample size was derived as follows:
𝑆𝑢𝑟𝑣𝑒𝑦 𝑠𝑠 =𝑛𝑒𝑤 𝑠𝑠
𝑟𝑒𝑠𝑝𝑜𝑛𝑠𝑒 𝑟𝑎𝑡𝑒
𝑆𝑢𝑟𝑣𝑒𝑦 𝑠𝑠 =90
0.3= 300 𝑟𝑒𝑠𝑝𝑜𝑛𝑑𝑒𝑛𝑡𝑠
Based on the preceding calculation, it is worth noting that the survey sample size is approximately 300 construction professionals. A random sampling method was adopted to select 300 professionals from the population.
3.2 Survey Administration and data analysis A questionnaire survey was designed for the study, where closed and open-ended questions were developed to solicit respondents’ opinions concerning the major causes of external risks during construction projects and the detrimental effect on project parameters. The research instrument for the survey was divided into different sections, with each section aimed at achieving a particular objective of the study. Section A, the background information, was the first section of the questionnaire. The information collected includes the gender, age, qualification, experience, organisation’s role and the respondents’ current position in the industry. The second section (section B) collected data with respect to the major causes of external risks during construction projects. A Likert scale question where 1 = Not critical at all, 2 = Slightly critical, 3 = Somewhat critical, 4 = Critical, and 5 = Very critical was used to collect information regarding major causes of external risks. Section C, the third section of the questionnaire, requested information concerning the effect of construction risks on project performance. A Likert scale where 1 = Minor extent, 2 = Near minor extent, 3 = Some extent, 4 = Near major extent, and 5 = Major extent was used to collect information regarding the effect of construction risks on project performance. It is worth noting that 60 respondents, representing 20% of the sample size, willingly participated in the survey. The data was statistically analysed using descriptive and inferential analyses. Descriptive statistics used in this study consist of frequency distribution and measurement of central tendency, such as mean and standard deviation. For the purpose of the research study, the internal reliability was tested on scales questions using Cronbach’s coefficient alpha. Inferential statistics was used to validate the data collected through the analysis of variance (ANOVA). The ANOVA was used for establishing whether or not there was a significant difference in agreement of respondents concerning the respective factors.
4. FINDING 4.1 Research Participation In the first section of the questionnaire, the respondents’ general information was collected. The information related to gender, age group, years of experience and level of education from the completed questionnaires was analysed.
Table 2 presents the background information of the respondents. With regard to gender of the respondents of the survey. It is shown that the sample was made up of 11.7% females and 88.3% males. The higher percentage of male respondents indicates the norm of higher participation ratio of males in the construction industry. Concerning the age groups of the respondents. It is evident that 3.3% of the respondents were below the age of twenty-five. The age group between twenty-five to thirty years made up 21.7% of the study participants.

Salem et al. JCPMI, 10(1): 70-85
75
The highest percentage of respondents fell between the ages of thirty-one and forty, representing 28.3% of the total respondents. The age group between forty-one to fifty made up 23.3% of the study participants. The age group between fifty-one to sixty years made up 10% of the study participants. The table indicates that 86.7% of the survey respondents were not older than sixty years of age, while 13.3% of the respondents were above sixty years of age, suggesting that most of the respondents were middle-aged. Regarding academic
qualifications, 33.3% of the respondents held a bachelor’s degree as their highest educational qualification, 31.7% held a diploma certificate, 20% held a master’s degree, 6.7% held a honours degree, 5% held a postgraduate diploma, 1.7% held a Matric certificate, and 1.7% held other qualifications. With respect to work experience of the survey participants in the construction sector. The descriptive analysis revealed that respondents with less than 5 years’ work experience in the construction industry represented 25% of the total respondents. Respondents having five to ten years’ construction work experience represented 16.7% of the total, while 58.3% of the respondents had been working in the construction sector for more than ten years. The years of experience of respondents were sufficient to achieve the purpose of the study, as a significant 58.3% of the study respondents had more than ten years of work experience in the construction industry. This is not to suggest that the input and work experiences of the respondents working only between 1-5 years is not significant this research.
Table 2: Background information of the respondents
Gender Frequency Percentage
Female 7 11.7
Male 53 88.3
Total 60 100.0
Age of respondents Frequency Percentage
Under 25 2 3.3
25 - 30 years 13 21.7
31 - 40 years 17 28.3
41 - 50 years 14 23.3
51 - 60 years 6 10.0
Over 60 years 8 13.3
Total 60 100.0
Type of qualifications Frequency Percentage
Matric certificate 1 1.7
Diploma 19 31.7
Bachelor’s degree 20 33.3
Honours degree 4 6.7
Postgraduate diploma 3 5.0
Master's degree 12 20.0
Other 1 1.7
Total 60 100.0
Years of working experience Frequency Percentage
Less than 5 years 15 25.0
5 – 10 10 16.7
Over 10 years 35 58.3
Total 60 100.0
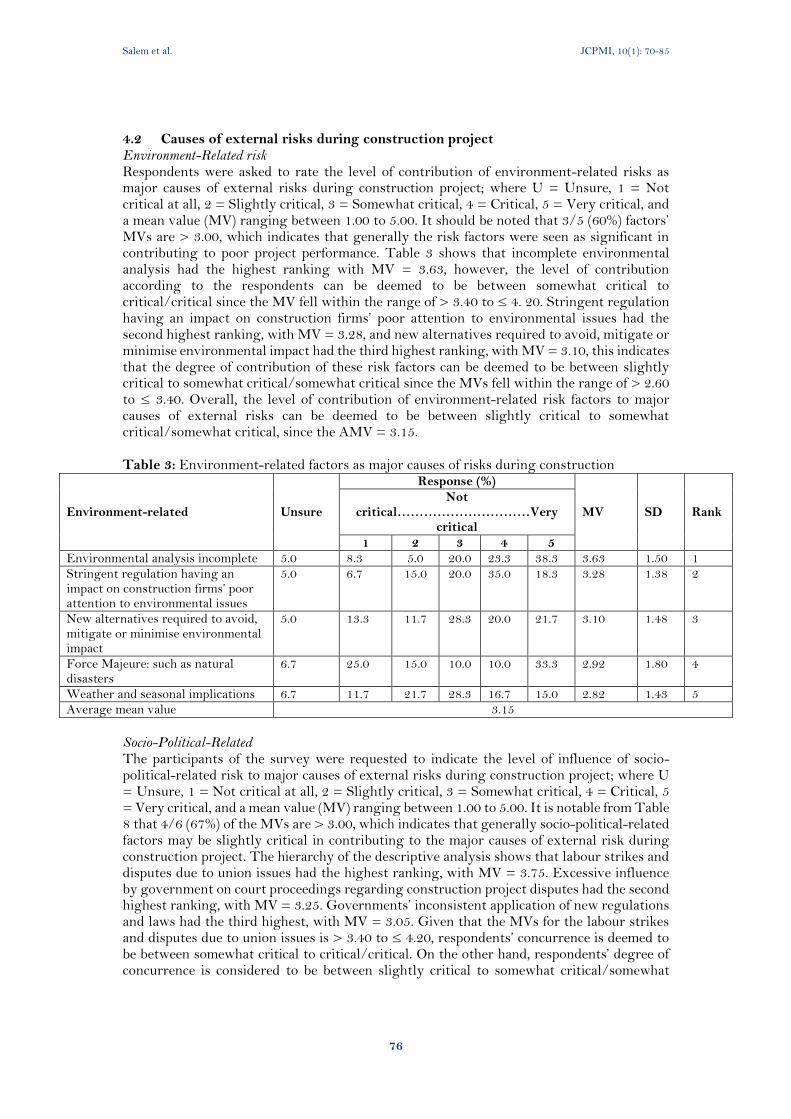
Salem et al. JCPMI, 10(1): 70-85
76
4.2 Causes of external risks during construction project Environment-Related risk Respondents were asked to rate the level of contribution of environment-related risks as major causes of external risks during construction project; where U = Unsure, 1 = Not critical at all, 2 = Slightly critical, 3 = Somewhat critical, 4 = Critical, 5 = Very critical, and a mean value (MV) ranging between 1.00 to 5.00. It should be noted that 3/5 (60%) factors’ MVs are > 3.00, which indicates that generally the risk factors were seen as significant in contributing to poor project performance. Table 3 shows that incomplete environmental analysis had the highest ranking with MV = 3.63, however, the level of contribution according to the respondents can be deemed to be between somewhat critical to critical/critical since the MV fell within the range of > 3.40 to ≤ 4. 20. Stringent regulation having an impact on construction firms’ poor attention to environmental issues had the second highest ranking, with MV = 3.28, and new alternatives required to avoid, mitigate or minimise environmental impact had the third highest ranking, with MV = 3.10, this indicates that the degree of contribution of these risk factors can be deemed to be between slightly critical to somewhat critical/somewhat critical since the MVs fell within the range of > 2.60 to ≤ 3.40. Overall, the level of contribution of environment-related risk factors to major causes of external risks can be deemed to be between slightly critical to somewhat critical/somewhat critical, since the AMV = 3.15. Table 3: Environment-related factors as major causes of risks during construction
Environment-related Unsure
Response (%)
MV SD Rank Not
critical…………………………Very critical
1 2 3 4 5
Environmental analysis incomplete 5.0 8.3 5.0 20.0 23.3 38.3 3.63 1.50 1 Stringent regulation having an impact on construction firms’ poor attention to environmental issues
5.0 6.7 15.0 20.0 35.0 18.3 3.28 1.38 2
New alternatives required to avoid, mitigate or minimise environmental impact
5.0 13.3 11.7 28.3 20.0 21.7 3.10 1.48 3
Force Majeure: such as natural disasters
6.7 25.0 15.0 10.0 10.0 33.3 2.92 1.80 4
Weather and seasonal implications 6.7 11.7 21.7 28.3 16.7 15.0 2.82 1.43 5 Average mean value 3.15
Socio-Political-Related The participants of the survey were requested to indicate the level of influence of socio-political-related risk to major causes of external risks during construction project; where U = Unsure, 1 = Not critical at all, 2 = Slightly critical, 3 = Somewhat critical, 4 = Critical, 5 = Very critical, and a mean value (MV) ranging between 1.00 to 5.00. It is notable from Table 8 that 4/6 (67%) of the MVs are > 3.00, which indicates that generally socio-political-related factors may be slightly critical in contributing to the major causes of external risk during construction project. The hierarchy of the descriptive analysis shows that labour strikes and disputes due to union issues had the highest ranking, with MV = 3.75. Excessive influence by government on court proceedings regarding construction project disputes had the second highest ranking, with MV = 3.25. Governments’ inconsistent application of new regulations and laws had the third highest, with MV = 3.05. Given that the MVs for the labour strikes and disputes due to union issues is > 3.40 to ≤ 4.20, respondents’ concurrence is deemed to be between somewhat critical to critical/critical. On the other hand, respondents’ degree of concurrence is considered to be between slightly critical to somewhat critical/somewhat
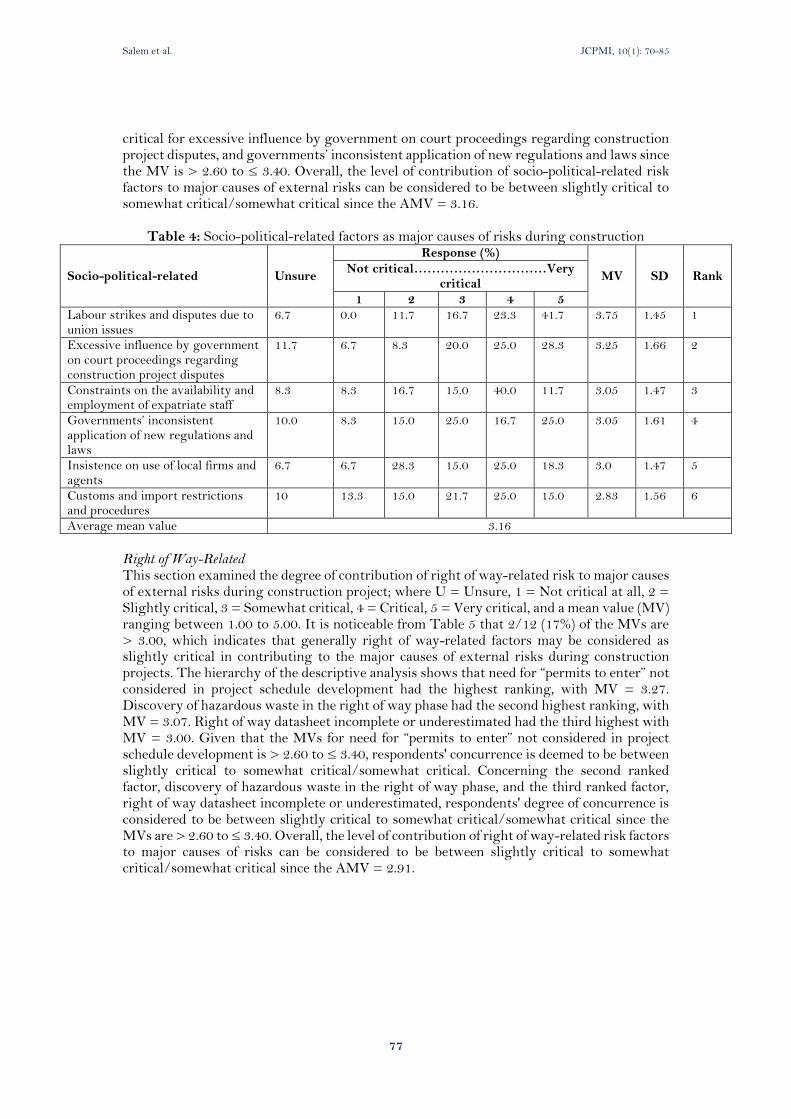
Salem et al. JCPMI, 10(1): 70-85
77
critical for excessive influence by government on court proceedings regarding construction project disputes, and governments’ inconsistent application of new regulations and laws since the MV is > 2.60 to ≤ 3.40. Overall, the level of contribution of socio-political-related risk factors to major causes of external risks can be considered to be between slightly critical to somewhat critical/somewhat critical since the AMV = 3.16.
Table 4: Socio-political-related factors as major causes of risks during construction
Socio-political-related Unsure
Response (%)
MV SD Rank Not critical…………………………Very
critical
1 2 3 4 5
Labour strikes and disputes due to union issues
6.7 0.0 11.7 16.7 23.3 41.7 3.75 1.45 1
Excessive influence by government on court proceedings regarding construction project disputes
11.7 6.7 8.3 20.0 25.0 28.3 3.25 1.66 2
Constraints on the availability and employment of expatriate staff
8.3 8.3 16.7 15.0 40.0 11.7 3.05 1.47 3
Governments’ inconsistent application of new regulations and laws
10.0 8.3 15.0 25.0 16.7 25.0 3.05 1.61 4
Insistence on use of local firms and agents
6.7 6.7 28.3 15.0 25.0 18.3 3.0 1.47 5
Customs and import restrictions and procedures
10 13.3 15.0 21.7 25.0 15.0 2.83 1.56 6
Average mean value 3.16
Right of Way-Related This section examined the degree of contribution of right of way-related risk to major causes of external risks during construction project; where U = Unsure, 1 = Not critical at all, 2 = Slightly critical, 3 = Somewhat critical, 4 = Critical, 5 = Very critical, and a mean value (MV) ranging between 1.00 to 5.00. It is noticeable from Table 5 that 2/12 (17%) of the MVs are > 3.00, which indicates that generally right of way-related factors may be considered as slightly critical in contributing to the major causes of external risks during construction projects. The hierarchy of the descriptive analysis shows that need for “permits to enter” not considered in project schedule development had the highest ranking, with MV = 3.27. Discovery of hazardous waste in the right of way phase had the second highest ranking, with MV = 3.07. Right of way datasheet incomplete or underestimated had the third highest with MV = 3.00. Given that the MVs for need for “permits to enter” not considered in project schedule development is > 2.60 to ≤ 3.40, respondents' concurrence is deemed to be between slightly critical to somewhat critical/somewhat critical. Concerning the second ranked factor, discovery of hazardous waste in the right of way phase, and the third ranked factor, right of way datasheet incomplete or underestimated, respondents' degree of concurrence is considered to be between slightly critical to somewhat critical/somewhat critical since the MVs are > 2.60 to ≤ 3.40. Overall, the level of contribution of right of way-related risk factors to major causes of risks can be considered to be between slightly critical to somewhat critical/somewhat critical since the AMV = 2.91.
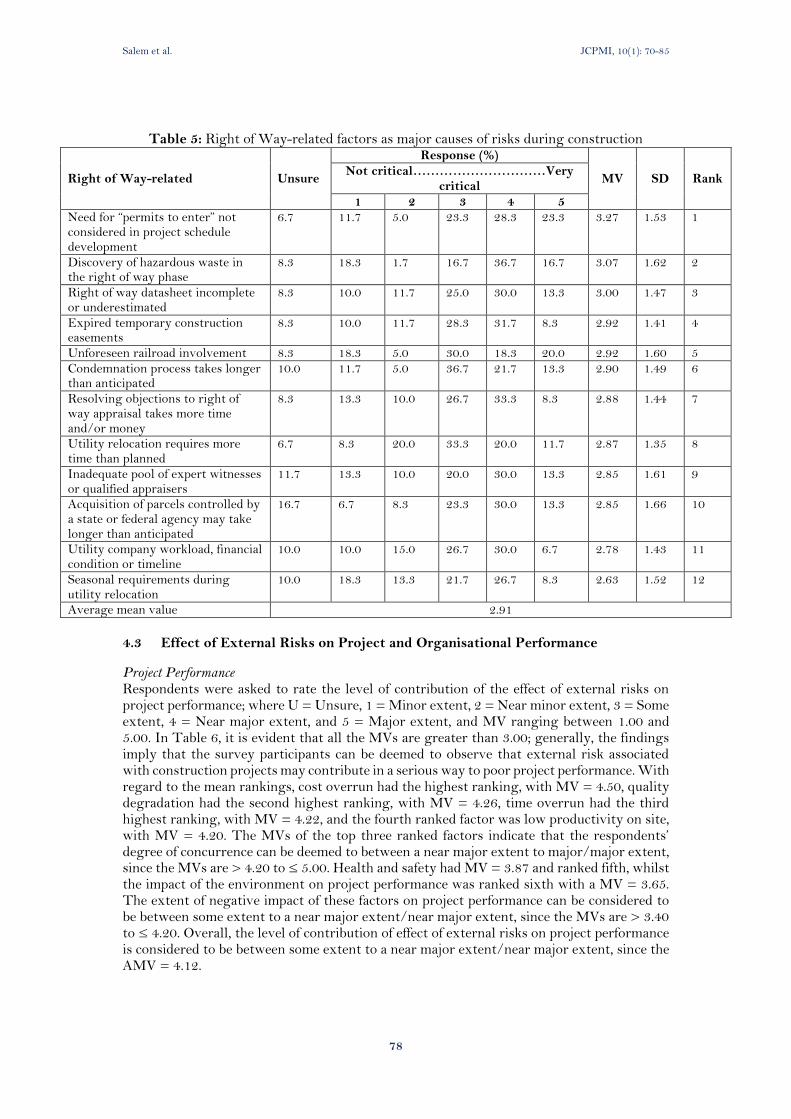
Salem et al. JCPMI, 10(1): 70-85
78
Table 5: Right of Way-related factors as major causes of risks during construction
Right of Way-related Unsure
Response (%)
MV SD Rank Not critical…………………………Very
critical
1 2 3 4 5
Need for “permits to enter” not considered in project schedule development
6.7 11.7 5.0 23.3 28.3 23.3 3.27 1.53 1
Discovery of hazardous waste in the right of way phase
8.3 18.3 1.7 16.7 36.7 16.7 3.07 1.62 2
Right of way datasheet incomplete or underestimated
8.3 10.0 11.7 25.0 30.0 13.3 3.00 1.47 3
Expired temporary construction easements
8.3 10.0 11.7 28.3 31.7 8.3 2.92 1.41 4
Unforeseen railroad involvement 8.3 18.3 5.0 30.0 18.3 20.0 2.92 1.60 5 Condemnation process takes longer than anticipated
10.0 11.7 5.0 36.7 21.7 13.3 2.90 1.49 6
Resolving objections to right of way appraisal takes more time and/or money
8.3 13.3 10.0 26.7 33.3 8.3 2.88 1.44 7
Utility relocation requires more time than planned
6.7 8.3 20.0 33.3 20.0 11.7 2.87 1.35 8
Inadequate pool of expert witnesses or qualified appraisers
11.7 13.3 10.0 20.0 30.0 13.3 2.85 1.61 9
Acquisition of parcels controlled by a state or federal agency may take longer than anticipated
16.7 6.7 8.3 23.3 30.0 13.3 2.85 1.66 10
Utility company workload, financial condition or timeline
10.0 10.0 15.0 26.7 30.0 6.7 2.78 1.43 11
Seasonal requirements during utility relocation
10.0 18.3 13.3 21.7 26.7 8.3 2.63 1.52 12
Average mean value 2.91
4.3 Effect of External Risks on Project and Organisational Performance
Project Performance Respondents were asked to rate the level of contribution of the effect of external risks on project performance; where U = Unsure, 1 = Minor extent, 2 = Near minor extent, 3 = Some extent, 4 = Near major extent, and 5 = Major extent, and MV ranging between 1.00 and 5.00. In Table 6, it is evident that all the MVs are greater than 3.00; generally, the findings imply that the survey participants can be deemed to observe that external risk associated with construction projects may contribute in a serious way to poor project performance. With regard to the mean rankings, cost overrun had the highest ranking, with MV = 4.50, quality degradation had the second highest ranking, with MV = 4.26, time overrun had the third highest ranking, with MV = 4.22, and the fourth ranked factor was low productivity on site, with MV = 4.20. The MVs of the top three ranked factors indicate that the respondents’ degree of concurrence can be deemed to between a near major extent to major/major extent, since the MVs are > 4.20 to ≤ 5.00. Health and safety had MV = 3.87 and ranked fifth, whilst the impact of the environment on project performance was ranked sixth with a MV = 3.65. The extent of negative impact of these factors on project performance can be considered to be between some extent to a near major extent/near major extent, since the MVs are > 3.40 to ≤ 4.20. Overall, the level of contribution of effect of external risks on project performance is considered to be between some extent to a near major extent/near major extent, since the AMV = 4.12.
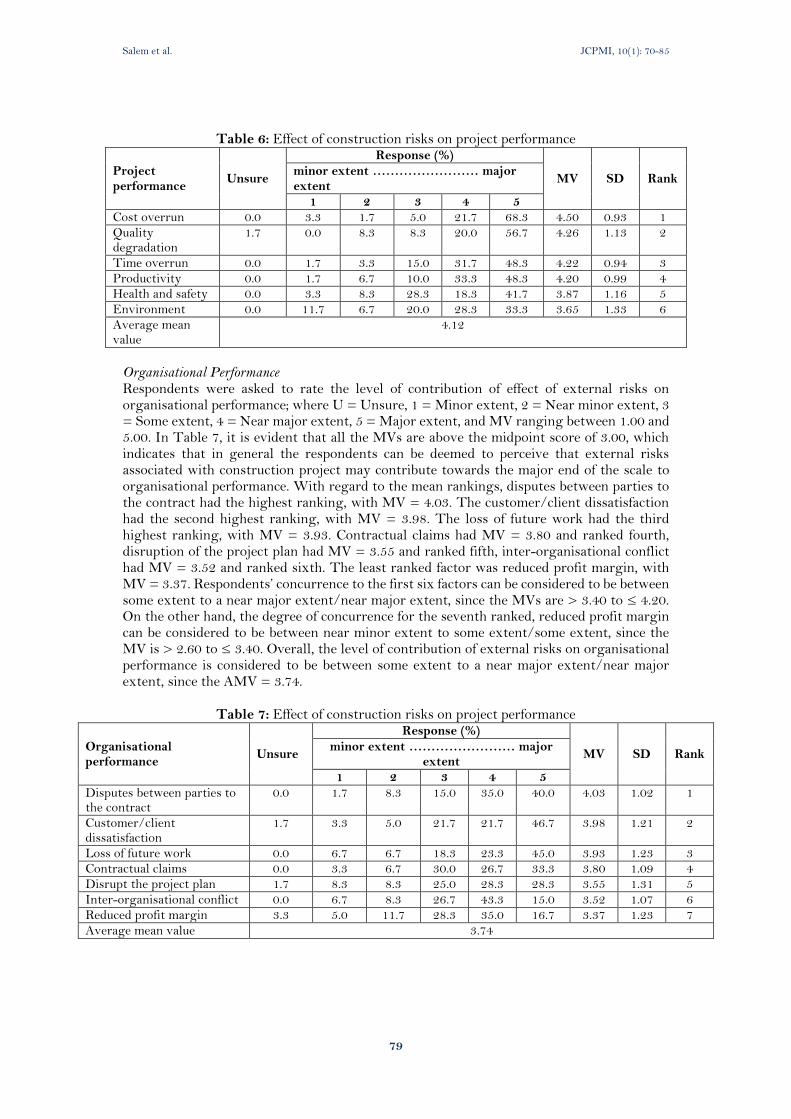
Salem et al. JCPMI, 10(1): 70-85
79
Table 6: Effect of construction risks on project performance
Project performance
Unsure
Response (%)
MV SD Rank minor extent …………………… major extent
1 2 3 4 5
Cost overrun 0.0 3.3 1.7 5.0 21.7 68.3 4.50 0.93 1 Quality degradation
1.7 0.0 8.3 8.3 20.0 56.7 4.26 1.13 2
Time overrun 0.0 1.7 3.3 15.0 31.7 48.3 4.22 0.94 3 Productivity 0.0 1.7 6.7 10.0 33.3 48.3 4.20 0.99 4 Health and safety 0.0 3.3 8.3 28.3 18.3 41.7 3.87 1.16 5 Environment 0.0 11.7 6.7 20.0 28.3 33.3 3.65 1.33 6
Average mean value
4.12
Organisational Performance Respondents were asked to rate the level of contribution of effect of external risks on organisational performance; where U = Unsure, 1 = Minor extent, 2 = Near minor extent, 3 = Some extent, 4 = Near major extent, 5 = Major extent, and MV ranging between 1.00 and 5.00. In Table 7, it is evident that all the MVs are above the midpoint score of 3.00, which indicates that in general the respondents can be deemed to perceive that external risks associated with construction project may contribute towards the major end of the scale to organisational performance. With regard to the mean rankings, disputes between parties to the contract had the highest ranking, with MV = 4.03. The customer/client dissatisfaction had the second highest ranking, with MV = 3.98. The loss of future work had the third highest ranking, with MV = 3.93. Contractual claims had MV = 3.80 and ranked fourth, disruption of the project plan had MV = 3.55 and ranked fifth, inter-organisational conflict had MV = 3.52 and ranked sixth. The least ranked factor was reduced profit margin, with MV = 3.37. Respondents’ concurrence to the first six factors can be considered to be between some extent to a near major extent/near major extent, since the MVs are > 3.40 to ≤ 4.20. On the other hand, the degree of concurrence for the seventh ranked, reduced profit margin can be considered to be between near minor extent to some extent/some extent, since the MV is > 2.60 to ≤ 3.40. Overall, the level of contribution of external risks on organisational performance is considered to be between some extent to a near major extent/near major extent, since the AMV = 3.74.
Table 7: Effect of construction risks on project performance
Organisational performance
Unsure
Response (%)
MV SD Rank minor extent …………………… major
extent
1 2 3 4 5
Disputes between parties to the contract
0.0 1.7 8.3 15.0 35.0 40.0 4.03 1.02 1
Customer/client dissatisfaction
1.7 3.3 5.0 21.7 21.7 46.7 3.98 1.21 2
Loss of future work 0.0 6.7 6.7 18.3 23.3 45.0 3.93 1.23 3 Contractual claims 0.0 3.3 6.7 30.0 26.7 33.3 3.80 1.09 4 Disrupt the project plan 1.7 8.3 8.3 25.0 28.3 28.3 3.55 1.31 5 Inter-organisational conflict 0.0 6.7 8.3 26.7 43.3 15.0 3.52 1.07 6 Reduced profit margin 3.3 5.0 11.7 28.3 35.0 16.7 3.37 1.23 7 Average mean value 3.74
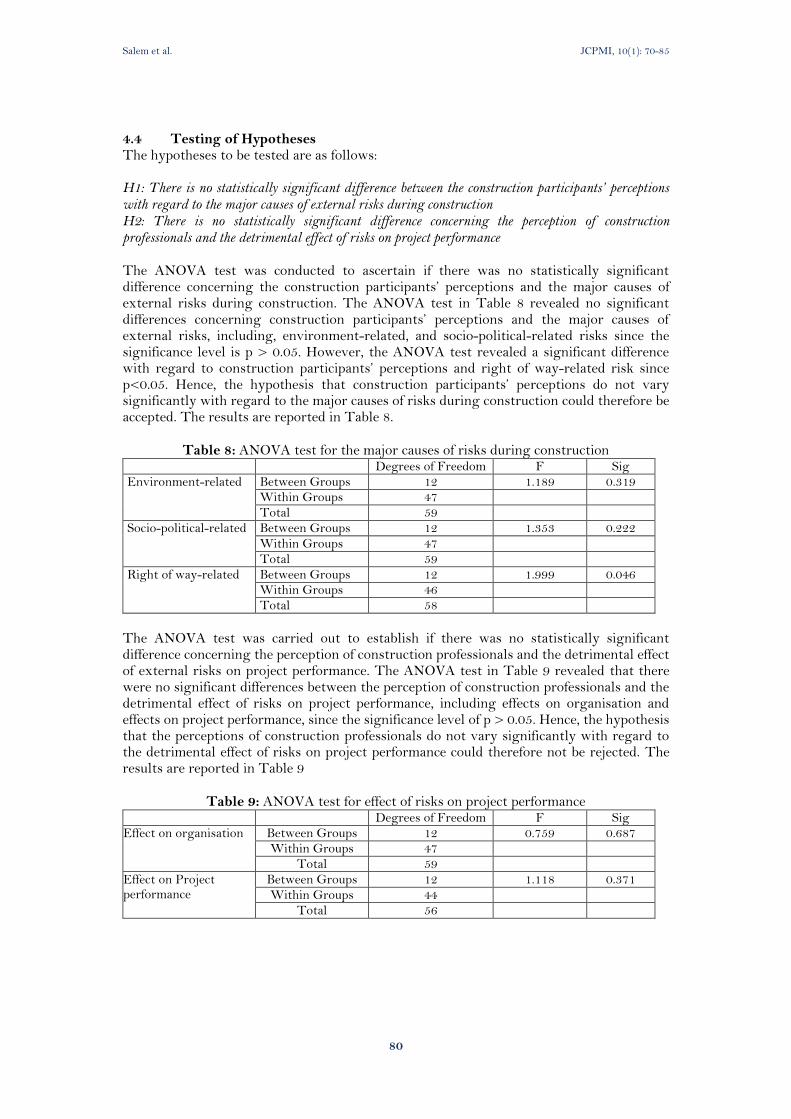
Salem et al. JCPMI, 10(1): 70-85
80
4.4 Testing of Hypotheses The hypotheses to be tested are as follows: H1: There is no statistically significant difference between the construction participants’ perceptions with regard to the major causes of external risks during construction H2: There is no statistically significant difference concerning the perception of construction professionals and the detrimental effect of risks on project performance The ANOVA test was conducted to ascertain if there was no statistically significant difference concerning the construction participants’ perceptions and the major causes of external risks during construction. The ANOVA test in Table 8 revealed no significant differences concerning construction participants’ perceptions and the major causes of external risks, including, environment-related, and socio-political-related risks since the significance level is p > 0.05. However, the ANOVA test revealed a significant difference with regard to construction participants’ perceptions and right of way-related risk since p<0.05. Hence, the hypothesis that construction participants’ perceptions do not vary significantly with regard to the major causes of risks during construction could therefore be accepted. The results are reported in Table 8.
Table 8: ANOVA test for the major causes of risks during construction Degrees of Freedom F Sig Environment-related Between Groups 12 1.189 0.319
Within Groups 47 Total 59
Socio-political-related Between Groups 12 1.353 0.222
Within Groups 47 Total 59
Right of way-related Between Groups 12 1.999 0.046 Within Groups 46 Total 58
The ANOVA test was carried out to establish if there was no statistically significant difference concerning the perception of construction professionals and the detrimental effect of external risks on project performance. The ANOVA test in Table 9 revealed that there were no significant differences between the perception of construction professionals and the detrimental effect of risks on project performance, including effects on organisation and effects on project performance, since the significance level of p > 0.05. Hence, the hypothesis that the perceptions of construction professionals do not vary significantly with regard to the detrimental effect of risks on project performance could therefore not be rejected. The results are reported in Table 9
Table 9: ANOVA test for effect of risks on project performance Degrees of Freedom F Sig
Effect on organisation Between Groups 12 0.759 0.687 Within Groups 47
Total 59 Effect on Project performance
Between Groups 12 1.118 0.371 Within Groups 44
Total 56

Salem et al. JCPMI, 10(1): 70-85
81
5. DISCUSSION OF FINDINGS The quantitative findings reveal that factors that contribute to the major causes of external risk during construction projects are widespread within the South African construction industry, and these factors subsequently impact negatively on project and organisational performance.
Overall, socio-political-related factors were ranked 1st with an AMV = 3.16. The survey participants rated some of the key factors relating to socio-political-related risk as follows: labour strikes and disputes due to union issues with MV = 3.75; excessive influence by government on court proceedings regarding construction project disputes with a MV= 3.25, and constraints on the availability and employment of expatriate staff with MV = 3.05. These findings are supported by Calzadilla, Awinda and Parkin (2012) and Zou, Zhang and Wang (2007). For example, Calzadilla et al. (2012) reveal that political situations such as national workers; strikes, nationalisation of basic industries and labour unions may lead to poor productivity on site, which subsequently affects project performance. Zou et al. (2007) also stated that the role of government with respect to mitigating political risks in order to create an enabling environment for project development cannot be overemphasised. Nonetheless, overly-prescriptive requirements and bureaucratic approval procedures on the part of government departments may impact on project delivery. Furthermore, Singh, Deep and Banerjee (2017) identify several political risks and among them are limitations regarding the availability and employment of expatriate staff.
Additionally, environment-related factors underlying the major causes of external risks in construction project are ranked second, with AMV = 3.15. Some of the key factors relating to environment-related risk include: environmental analysis incomplete (MV = 3.63); stringent regulation having an impact on construction firm’s poor attention to environmental issues (MV = 3.28), and new alternatives required to avoid, mitigate or minimise environmental impact (MV = 3.10).
Furthermore, right of way-related factors influencing the major causes of external risks in construction project are ranked third, with AMV = 2.91. Some of the key factors relating to right of way-related risk include: need for “permits to enter” not considered in project schedule development with a MV= 3.27; discovery of hazardous waste in the right of way phase with a MV= 3.07, and right of way datasheet incomplete or underestimated with a MV = 3.00. This finding aligns with Caltran’s (2007) assertion that: lack of provision for entry permits during project schedule development, uncovering of harmful waste in the right of way and right of way datasheet incomplete or underestimated results in poor project performance.
With regard to the negatively impact of risks on project and organisational performance, the hierarchical ranking of the average means for the effect of risks on construction projects indicates that the effect on project performance is ranked first, since the AMV = 4.12. The survey participants rated some of the key factors relating to project performance as follows: cost overrun, with MV 4.50; quality degradation, with MV 4.26, and time overrun, with MV 4.22. These findings are supported by Ali and Kamaruzzaman (2010), Bodicha (2015), and Vaardini (2015). For example, Ali and Kamaruzzaman (2010) state that the major factor contributing to cost escalations in construction projects was ascribed to either poor or imprecise cost estimates. Therefore, the most significant mechanism to adopt in order to control construction project costs would be accurate project costing and financing. Bodicha (2015) also reveals that external risk factors such as incidents as a result of force majeure, economic and financial risks, environment-related and political risks can definitely impact on the project outcome in terms of cost and quality. Furthermore, Vaardini (2015) reveals that time overruns have serious repercussions on project performance and suggests that the factors influencing time overrun during construction projects can be categorised into 12 major groups, consisting of 70 sub-factors.
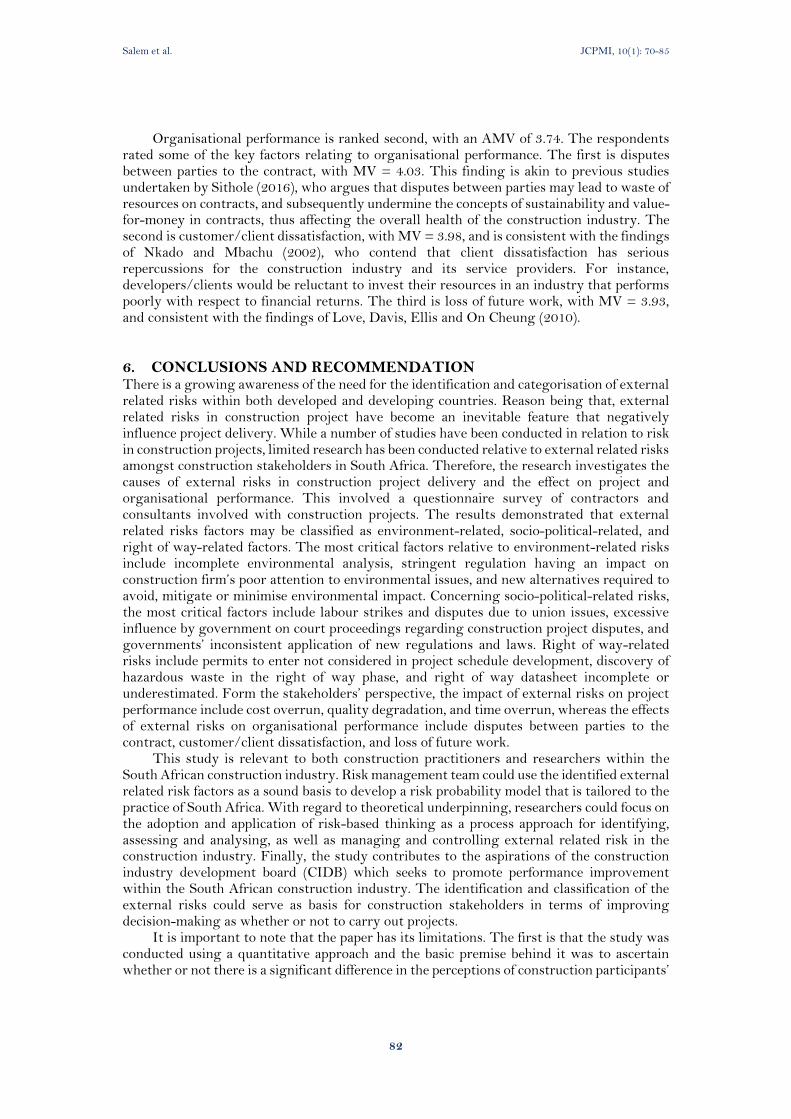
Salem et al. JCPMI, 10(1): 70-85
82
Organisational performance is ranked second, with an AMV of 3.74. The respondents rated some of the key factors relating to organisational performance. The first is disputes between parties to the contract, with MV = 4.03. This finding is akin to previous studies undertaken by Sithole (2016), who argues that disputes between parties may lead to waste of resources on contracts, and subsequently undermine the concepts of sustainability and value-for-money in contracts, thus affecting the overall health of the construction industry. The second is customer/client dissatisfaction, with MV = 3.98, and is consistent with the findings of Nkado and Mbachu (2002), who contend that client dissatisfaction has serious repercussions for the construction industry and its service providers. For instance, developers/clients would be reluctant to invest their resources in an industry that performs poorly with respect to financial returns. The third is loss of future work, with MV = 3.93, and consistent with the findings of Love, Davis, Ellis and On Cheung (2010).
6. CONCLUSIONS AND RECOMMENDATION There is a growing awareness of the need for the identification and categorisation of external related risks within both developed and developing countries. Reason being that, external related risks in construction project have become an inevitable feature that negatively influence project delivery. While a number of studies have been conducted in relation to risk in construction projects, limited research has been conducted relative to external related risks amongst construction stakeholders in South Africa. Therefore, the research investigates the causes of external risks in construction project delivery and the effect on project and organisational performance. This involved a questionnaire survey of contractors and consultants involved with construction projects. The results demonstrated that external related risks factors may be classified as environment-related, socio-political-related, and right of way-related factors. The most critical factors relative to environment-related risks include incomplete environmental analysis, stringent regulation having an impact on construction firm’s poor attention to environmental issues, and new alternatives required to avoid, mitigate or minimise environmental impact. Concerning socio-political-related risks, the most critical factors include labour strikes and disputes due to union issues, excessive influence by government on court proceedings regarding construction project disputes, and governments’ inconsistent application of new regulations and laws. Right of way-related risks include permits to enter not considered in project schedule development, discovery of hazardous waste in the right of way phase, and right of way datasheet incomplete or underestimated. Form the stakeholders’ perspective, the impact of external risks on project performance include cost overrun, quality degradation, and time overrun, whereas the effects of external risks on organisational performance include disputes between parties to the contract, customer/client dissatisfaction, and loss of future work.
This study is relevant to both construction practitioners and researchers within the South African construction industry. Risk management team could use the identified external related risk factors as a sound basis to develop a risk probability model that is tailored to the practice of South Africa. With regard to theoretical underpinning, researchers could focus on the adoption and application of risk-based thinking as a process approach for identifying, assessing and analysing, as well as managing and controlling external related risk in the construction industry. Finally, the study contributes to the aspirations of the construction industry development board (CIDB) which seeks to promote performance improvement within the South African construction industry. The identification and classification of the external risks could serve as basis for construction stakeholders in terms of improving decision-making as whether or not to carry out projects.
It is important to note that the paper has its limitations. The first is that the study was conducted using a quantitative approach and the basic premise behind it was to ascertain whether or not there is a significant difference in the perceptions of construction participants’
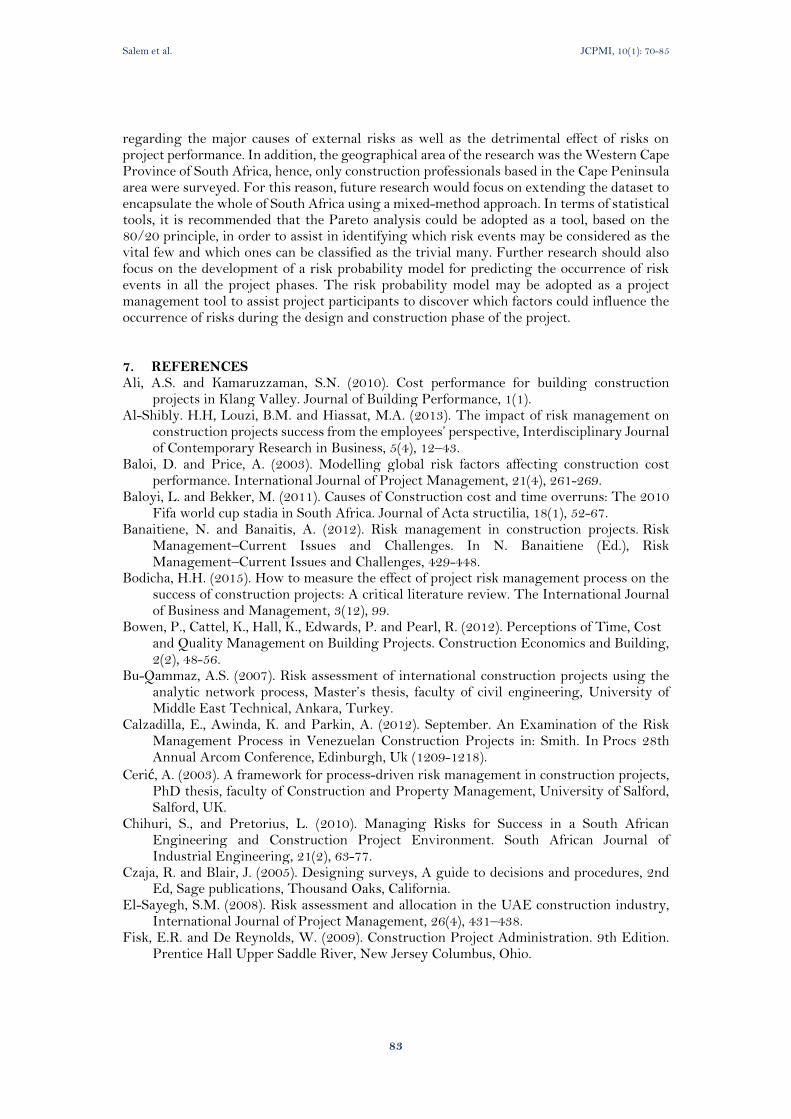
Salem et al. JCPMI, 10(1): 70-85
83
regarding the major causes of external risks as well as the detrimental effect of risks on project performance. In addition, the geographical area of the research was the Western Cape Province of South Africa, hence, only construction professionals based in the Cape Peninsula area were surveyed. For this reason, future research would focus on extending the dataset to encapsulate the whole of South Africa using a mixed-method approach. In terms of statistical tools, it is recommended that the Pareto analysis could be adopted as a tool, based on the 80/20 principle, in order to assist in identifying which risk events may be considered as the vital few and which ones can be classified as the trivial many. Further research should also focus on the development of a risk probability model for predicting the occurrence of risk events in all the project phases. The risk probability model may be adopted as a project management tool to assist project participants to discover which factors could influence the occurrence of risks during the design and construction phase of the project.
7. REFERENCES Ali, A.S. and Kamaruzzaman, S.N. (2010). Cost performance for building construction
projects in Klang Valley. Journal of Building Performance, 1(1). Al-Shibly. H.H, Louzi, B.M. and Hiassat, M.A. (2013). The impact of risk management on
construction projects success from the employees’ perspective, Interdisciplinary Journal of Contemporary Research in Business, 5(4), 12–43.
Baloi, D. and Price, A. (2003). Modelling global risk factors affecting construction cost performance. International Journal of Project Management, 21(4), 261-269.
Baloyi, L. and Bekker, M. (2011). Causes of Construction cost and time overruns: The 2010 Fifa world cup stadia in South Africa. Journal of Acta structilia, 18(1), 52-67.
Banaitiene, N. and Banaitis, A. (2012). Risk management in construction projects. Risk Management–Current Issues and Challenges. In N. Banaitiene (Ed.), Risk Management–Current Issues and Challenges, 429-448.
Bodicha, H.H. (2015). How to measure the effect of project risk management process on the success of construction projects: A critical literature review. The International Journal of Business and Management, 3(12), 99.
Bowen, P., Cattel, K., Hall, K., Edwards, P. and Pearl, R. (2012). Perceptions of Time, Cost and Quality Management on Building Projects. Construction Economics and Building, 2(2), 48-56.
Bu-Qammaz, A.S. (2007). Risk assessment of international construction projects using the analytic network process, Master’s thesis, faculty of civil engineering, University of Middle East Technical, Ankara, Turkey.
Calzadilla, E., Awinda, K. and Parkin, A. (2012). September. An Examination of the Risk Management Process in Venezuelan Construction Projects in: Smith. In Procs 28th Annual Arcom Conference, Edinburgh, Uk (1209-1218).
Cerić, A. (2003). A framework for process-driven risk management in construction projects, PhD thesis, faculty of Construction and Property Management, University of Salford, Salford, UK.
Chihuri, S., and Pretorius, L. (2010). Managing Risks for Success in a South African Engineering and Construction Project Environment. South African Journal of Industrial Engineering, 21(2), 63-77.
Czaja, R. and Blair, J. (2005). Designing surveys, A guide to decisions and procedures, 2nd Ed, Sage publications, Thousand Oaks, California.
El-Sayegh, S.M. (2008). Risk assessment and allocation in the UAE construction industry, International Journal of Project Management, 26(4), 431–438.
Fisk, E.R. and De Reynolds, W. (2009). Construction Project Administration. 9th Edition. Prentice Hall Upper Saddle River, New Jersey Columbus, Ohio.
Salem et al. JCPMI, 10(1): 70-85
84
Gajewska, E. and Ropel, M. (2011). Risk Management Practices in a Construction Project – a case study, Master’s thesis, faculty of civil and environmental engineering, Chalmers University of Technology, Göteborg, Sweden.
Ginevičius, R. and Podvezko, V. (2009). Evaluating the changes in economic and social development of Lithuanian counties by multiple criteria methods, Technological and Economic Development of Economy 15(3), 418–436.
Gitau, L.M.B. (2015). The effects of risk management at project planning phase on performance of construction projects in Rwanda, Master’s thesis, department of Entrepreneurship, Technology, Leadership and Management in the school of Entrepreneurship, Procurement and Management, University of Agriculture and Technology, Kenya.
Kuang, S. (2011). Risk Management in Construction Projects Application of Risk Management in Construction Period, Bachelor of Architectural Technology and Construction Management.
Li, Y., and Liao, X. (2007). Decision support for risk analysis on dynamic alliance,’ Decision Support Systems 42(4), 2043–2059.
Love, P., Davis, P., Ellis, J. and On Cheung, S. (2010). Dispute causation: identification of pathogenic influences in construction. Engineering, Construction and Architectural Management, 17(4), 404-423.
Nkado, R.N. and Mbachu, J.I.C. (2002). Causes of, and solutions to client dissatisfaction in the South African building industry: The clients perspectives. In 1st CIB W107 International Conference, Stellenbosch, South Africa (11-13).
Project Management Institute (2008). A guide to the project management body of knowledge (PMBOK® Guide)—Fourth edition. Newtown Square, PA: Author.
Renuka, S.M., Umarani, C. and Kamal, S. (2014). A review on critical risk factors in the life cycle of construction projects. Journal of Civil Engineering Research, 4(2A), 31-36.
Rezaian, A. (2011). Time-Cost-Quality-Risk of Construction and Development Projects or Investment, Middle-East Journal of Scientific Research 10(2), 218-223.
Rezakhani, P. (2012). Classifying key risk factors in construction projects. Buletinul Institutului Politehnic din lasi. Sectia Constructii, Arhitectura, 58(2), 27-38.
Schiffauerova, A. and Thomson, V. (2006). A review of research on cost of quality models and best practices. International Journal of Quality and Reliability Management, 23(6), 647-669.
Shen, L.Y. (1997). Project Risk Management in Hong Kong, International Journal of Project Management, 15(2), 101-105.
Shen, L.Y., Wu, G.W.C. and Ng, C.S.K. (2001). Risk Assessment for Construction Joint Ventures in China, Journal of Construction Engineering and Management, 127(1), 76-81.
Shunmugam, S. and Rwelamila, P.P. (2014). An evaluation of the status of risk management in South African construction projects, proceedings of the Project Management South Africa (PMSA) conference 2014, 29-30 September and 01 October.
Singh, M.K., Deep, S. and Banerjee, R. (2017). Risk management in construction projects as per Indian scenario. International Journal of Civil Engineering and Technology, 8(3), 127-136.
Sithole, B.M. (2016). Sources of disputes in South African construction contracts and the resolution techniques employed between clients and contractors (Doctoral dissertation).
Subramani, T., Sruthi, P.S. and Kavitha, M. (2014). Causes of cost overrun in construction. IOSR Journal of Engineering (IOSRJEN), 4(6), 2278- 8719.
Tah, J.H., Thorpe, A. and McCaffer, R. (1993). Contractor project risks contingency allocation using linguistic approximation. Computing Systems in Engineering, 4(2-3), 281-293.

Salem et al. JCPMI, 10(1): 70-85
85
Tvaronavičienė, M. and Grybaitė, V. (2007). Impact of FDI on Lithuanian economy: insight into development of main economic activities, Journal of Business Economics and Management 8(4), 285–290.
Vaardini, U.S. (2015). Identification of causes and impacts of time overrun in construction projects. International Journal of Applied Engineering Research, 10(19), 14253-14261.
Van Thuyet, N., Ogunlana, S.O. and Dey, P.K. (2007). Risk management in oil and gas construction projects in Vietnam. International Journal of Energy Sector Management, 1(2), 175-194.
Wang, M.T. and Chou, H.Y. (2003). Risk allocation and risk handling of highway projects in Taiwan. Journal of management in Engineering, 19(2), 60-68.
Wang, S.Q., Dulaimi, M.F. and Aguria, M.Y. (2004). Risk management framework for construction projects in developing countries. Construction Management and Economics, 22(3), 237 252.
Zavadskas, E.K., Turskis, Z. and Tamošaitiene, J. (2010). Risk assessment of construction projects. Journal of Civil Engineering and Management, 16(1), 33-46.
Zou, P., Zhang, G. and Wang, J. (2007). Understanding the key risks in construction projects in China. International Journal of Project Management, 25(6), 601-614.
Zou, P.X., Zhang, G. and Wang, J.Y. (2006). January. Identifying key risks in construction projects: life cycle and stakeholder perspectives. In Pacific Rim Real Estate Society Conference.
Journal of Construction Project Management and Innovation, 10 (1): 86-99, 2020
ISSN 2223-7852 © Sustainable Human Settlement and Construction Research Centre DOI: https://doi.org/10.36615/jcpmi.v10i1.342
86
A SOFT SYSTEMS METHODOLOGY APPROACH TO IMPROVING THE SUPPLY CHAIN OF A
CONSTRUCTION PROJECT IN GAUTENG PROVINCE, SOUTH AFRICA
Lewis TSURO1 and Stan HARDMAN2
1Blackfriars Dominican Community, 46 Derby Avenue Springs Extension, 1559, Springs,
South Africa 2Leadership Dialogue, P.O.Box 404, La Lucia 4159
Email: [email protected]
ABSTRACT The Soft Systems Methodology (SSM) was developed as a set of tools for identifying and making incremental steps to improve situations with poorly defined causes or solutions. The supply chain forms a key process of any construction project; however, on any given construction site, supply chain inefficiencies could arise from many different avenues. Opinions vary, though, on which of these avenues is more important for increasing supply chain efficiencies; whether any problem even exist across the different aspects of the supply chain; as well as what steps should be taken to resolve them. It was therefore studied, here, whether SSM could be employed as a useful tool to systematically apply in the supply chains of a construction project in South Africa, for understanding and targeting the problematic situations that arise. Following thorough cyclical open-ended interviews with 17 workers, supervisors, foremen, site clerks, senior managers, and the CEO of the principal contractor at a new office park construction project in Rosebank, Johannesburg, and a thematic analysis of the data, SSM was performed to understand the existing challenges, and develop a suitable model for improvement. The study found that SSM was a good tool for understanding the ‘messy’ circumstances surrounding the chosen construction project supply chain, as well as actions that could be taken to improve the supply chain’s efficiency on site. The findings add weight to the argument that SSM could be a good tool for project managers to systematically introduce into their project planning regimens. Keywords: Soft Systems Methodology (SSM); supply chain; construction projects; project management.
1. INTRODUCTION Large numbers of people are employed at any given time on construction projects (Ball, 2014), and many peculiarities affect the complexities and life spans of these projects. The influence of project managers, when leading projects, relies on their capacities to drive and direct the various sections of their projects, through their leadership acumen (Lloyd-Walker and Walker, 2011). Being a leader in a complicated world is frequently observed from the view of systems thinking, where the literature argues that an integral relationship exists
between leadership performance and systems thinking (Palaima and Skaržauskienė, 2010). Systems thinking is embodied in the notion that sequences of related events can be
devised to target smaller entities, which together, combine to form a larger entity (Wilson and Van Haperen, 2015). A process of systems thinking that has been introduced and developed for solving management problems, in the past four decades, is the Soft Systems
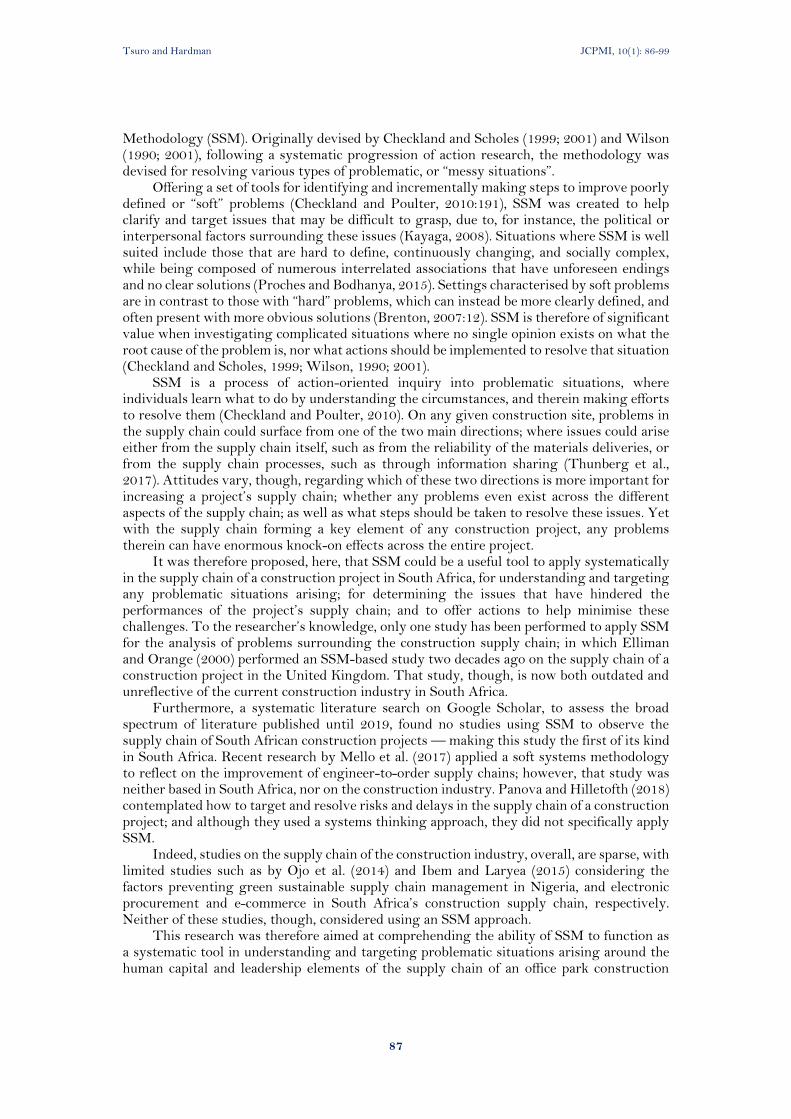
Tsuro and Hardman JCPMI, 10(1): 86-99
87
Methodology (SSM). Originally devised by Checkland and Scholes (1999; 2001) and Wilson (1990; 2001), following a systematic progression of action research, the methodology was devised for resolving various types of problematic, or “messy situations”.
Offering a set of tools for identifying and incrementally making steps to improve poorly defined or “soft” problems (Checkland and Poulter, 2010:191), SSM was created to help clarify and target issues that may be difficult to grasp, due to, for instance, the political or interpersonal factors surrounding these issues (Kayaga, 2008). Situations where SSM is well suited include those that are hard to define, continuously changing, and socially complex, while being composed of numerous interrelated associations that have unforeseen endings and no clear solutions (Proches and Bodhanya, 2015). Settings characterised by soft problems are in contrast to those with “hard” problems, which can instead be more clearly defined, and often present with more obvious solutions (Brenton, 2007:12). SSM is therefore of significant value when investigating complicated situations where no single opinion exists on what the root cause of the problem is, nor what actions should be implemented to resolve that situation (Checkland and Scholes, 1999; Wilson, 1990; 2001).
SSM is a process of action-oriented inquiry into problematic situations, where individuals learn what to do by understanding the circumstances, and therein making efforts to resolve them (Checkland and Poulter, 2010). On any given construction site, problems in the supply chain could surface from one of the two main directions; where issues could arise either from the supply chain itself, such as from the reliability of the materials deliveries, or from the supply chain processes, such as through information sharing (Thunberg et al., 2017). Attitudes vary, though, regarding which of these two directions is more important for increasing a project’s supply chain; whether any problems even exist across the different aspects of the supply chain; as well as what steps should be taken to resolve these issues. Yet with the supply chain forming a key element of any construction project, any problems therein can have enormous knock-on effects across the entire project.
It was therefore proposed, here, that SSM could be a useful tool to apply systematically in the supply chain of a construction project in South Africa, for understanding and targeting any problematic situations arising; for determining the issues that have hindered the performances of the project’s supply chain; and to offer actions to help minimise these challenges. To the researcher’s knowledge, only one study has been performed to apply SSM for the analysis of problems surrounding the construction supply chain; in which Elliman and Orange (2000) performed an SSM-based study two decades ago on the supply chain of a construction project in the United Kingdom. That study, though, is now both outdated and unreflective of the current construction industry in South Africa.
Furthermore, a systematic literature search on Google Scholar, to assess the broad spectrum of literature published until 2019, found no studies using SSM to observe the supply chain of South African construction projects — making this study the first of its kind in South Africa. Recent research by Mello et al. (2017) applied a soft systems methodology to reflect on the improvement of engineer-to-order supply chains; however, that study was neither based in South Africa, nor on the construction industry. Panova and Hilletofth (2018) contemplated how to target and resolve risks and delays in the supply chain of a construction project; and although they used a systems thinking approach, they did not specifically apply SSM.
Indeed, studies on the supply chain of the construction industry, overall, are sparse, with limited studies such as by Ojo et al. (2014) and Ibem and Laryea (2015) considering the factors preventing green sustainable supply chain management in Nigeria, and electronic procurement and e-commerce in South Africa’s construction supply chain, respectively. Neither of these studies, though, considered using an SSM approach.
This research was therefore aimed at comprehending the ability of SSM to function as a systematic tool in understanding and targeting problematic situations arising around the human capital and leadership elements of the supply chain of an office park construction
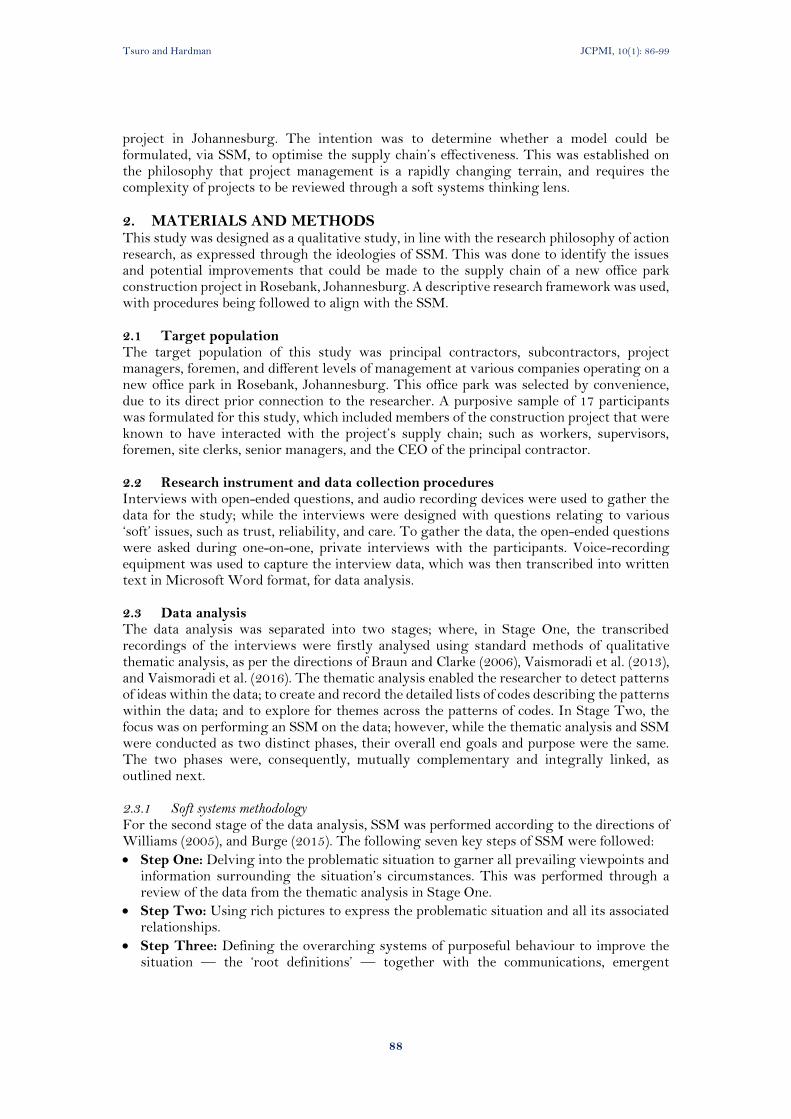
Tsuro and Hardman JCPMI, 10(1): 86-99
88
project in Johannesburg. The intention was to determine whether a model could be formulated, via SSM, to optimise the supply chain’s effectiveness. This was established on the philosophy that project management is a rapidly changing terrain, and requires the complexity of projects to be reviewed through a soft systems thinking lens.
2. MATERIALS AND METHODS This study was designed as a qualitative study, in line with the research philosophy of action research, as expressed through the ideologies of SSM. This was done to identify the issues and potential improvements that could be made to the supply chain of a new office park construction project in Rosebank, Johannesburg. A descriptive research framework was used, with procedures being followed to align with the SSM. 2.1 Target population The target population of this study was principal contractors, subcontractors, project managers, foremen, and different levels of management at various companies operating on a new office park in Rosebank, Johannesburg. This office park was selected by convenience, due to its direct prior connection to the researcher. A purposive sample of 17 participants was formulated for this study, which included members of the construction project that were known to have interacted with the project’s supply chain; such as workers, supervisors, foremen, site clerks, senior managers, and the CEO of the principal contractor. 2.2 Research instrument and data collection procedures Interviews with open-ended questions, and audio recording devices were used to gather the data for the study; while the interviews were designed with questions relating to various ‘soft’ issues, such as trust, reliability, and care. To gather the data, the open-ended questions were asked during one-on-one, private interviews with the participants. Voice-recording equipment was used to capture the interview data, which was then transcribed into written text in Microsoft Word format, for data analysis. 2.3 Data analysis The data analysis was separated into two stages; where, in Stage One, the transcribed recordings of the interviews were firstly analysed using standard methods of qualitative thematic analysis, as per the directions of Braun and Clarke (2006), Vaismoradi et al. (2013), and Vaismoradi et al. (2016). The thematic analysis enabled the researcher to detect patterns of ideas within the data; to create and record the detailed lists of codes describing the patterns within the data; and to explore for themes across the patterns of codes. In Stage Two, the focus was on performing an SSM on the data; however, while the thematic analysis and SSM were conducted as two distinct phases, their overall end goals and purpose were the same. The two phases were, consequently, mutually complementary and integrally linked, as outlined next. 2.3.1 Soft systems methodology For the second stage of the data analysis, SSM was performed according to the directions of Williams (2005), and Burge (2015). The following seven key steps of SSM were followed:
• Step One: Delving into the problematic situation to garner all prevailing viewpoints and information surrounding the situation’s circumstances. This was performed through a review of the data from the thematic analysis in Stage One.
• Step Two: Using rich pictures to express the problematic situation and all its associated relationships.
• Step Three: Defining the overarching systems of purposeful behaviour to improve the situation — the ‘root definitions’ — together with the communications, emergent
Tsuro and Hardman JCPMI, 10(1): 86-99
89
properties, hierarchies and controls necessary to target the problematic situation. The root definitions should define how the real world is, currently, and what transformation processes could be introduced to achieve a good (“unproblematic”) situation (Brenton, 2007:13). A technique referred to as ‘CATWOE’ is often proposed, to define the customers, actors, transformation processes, worldviews, owners, and environmental constraints (Checkland and Poulter, 2006); and this study used a CATWOE technique to express root definitions for system ‘X’, to accomplish ‘Y’, for stakeholder ‘Z”.
• Step Four: Constructing conceptual models for each root definition. Conceptual models are graphical, visual roadmaps comprising between five and nine feasible activities, in flow charts of interconnected tasks, which can be performed to achieve the root definitions. Tasks were selected, here, to satisfy a ‘three-E’s’ guideline of being the most efficient tasks, with the highest efficacy, and the potential for being the most effective.
• Step Five: Measuring the conceptual models in relation to real world situations; so that the different action-based models are compared and assessed for their practical feasibilities. This step was built into the interviews, where a discussion was initiated to allow the respondents to express which changes they thought would be accepted; and if not, what internal or external factors were limiting them from being implemented.
• Step Six: Identifying potential and practicable changes that could be made, through an iterative, cyclical process of brainstorming and free thinking, which considers what changes could be made to the tasks in the conceptual model, so that they are more likely to be successfully implemented. In the interviews, this step was performed by iteratively considering the difficulties that would limit the ideal changes from being made, and what could otherwise be done to avoid or bypass these difficulties. To do so, the tasks of the conceptual model were placed on an ease-benefit matrix, so that the ease of the tasks was measured relative to the potential benefit they would have in improving the problematic situation (Burge, 2015).
• Step Seven: Taking action to implement the plan for improvement. This is more of an iterative process of trial-and-error, and cyclical improvement through a reciprocal repetition of the SSM steps three-to-six. This step was not ultimately performed for the purposes of this study, though, since the purpose of the study was to identify the existing challenges of the supply chain of the selected construction project and develop a suitable
model for change, as opposed to actually implementing these changes.
2.4 Important considerations of the methodology It is important to emphasise that the seven steps of the SSM were merged into the study’s methodology by structuring the interview questions appropriately, and processing and analysing the data in a manner that the above SSM steps were accomplished. In addition, contrary to the more stringent approaches of hard systems methodologies, SSM is a more flexible tool that allows the investigator to customise the research framework to suit the situation in question (Hildbrand and Bodhanya, 2014). In the research setting of the construction project, here, a structured interview process with individual participants was also deemed to be far more feasible than attempting to gather all the participants together for group debates, iterative analyses and follow-up discussions. This is because there was a large variety of companies and job titles on the site, which were to be assessed. In addition, the dynamic nature of the project meant that multiple follow-up interviews and focus groups with gatherings of the same participants would have been very difficult to achieve, while potentially obstructing the workflow of the project. 2.4.1 Reliability, validity and the elimination of bias Internal consistency and interrater reliability were enhanced while codifying the interview data, and professional data analysts were contracted to maximise the consistency of the
Tsuro and Hardman JCPMI, 10(1): 86-99
90
outcomes, while minimising researcher biases. The construct and content validity were enhanced during the design of the study, by incorporating and allowing a complete spectrum of soft issues to be interrogated; while criterion validity was ensured when triangulating the results of this study with the literature. Interviews were held anonymously and in private to overcome inconsistency, poor information sharing, and unreliability; while encouraging truthfulness and openness among the participants.
3. RESULTS The results of this study are outlined according to the findings of each step of the SSM methodology. 3.1 Step One: Delving into the problematic situation The problematic situation was considered and observed during the interviews and subsequent thematic analysis, where the issues that were operating poorly, and the systems that were functioning well, were both determined and considered. Aspects of the supply chain that were claimed to have been functioning well on the project, as observed by a consensus among different respondents, was with the scheduling of the equipment and the materials on site. The safety on site, together with the supply delivery matters, and materials and equipment handling were noted recurrently on three occasions, each, by the respondents; and storing and procurement were noted by two participants, each, to have been working well. It is worth clarifying that although this study was qualitative, and therefore inherently devoid of numerical counting, multiple occurrences of a theme or topic in the interviews was reasoned to indicate an element of consensus, without necessarily confirming a greater degree of importance.
Delving deeper into the supply chain management’s soft elements, respondents argued that the trust, emotional intelligence, risk-taking and vision of the project management had enhanced the working environment, worker skills, project efficiency, and teamwork on the project; together with improvements that were specific to each manager in question. In addition, the motivation of the project managers to the workers and subcontractors, and their communication, supportiveness, and self-awareness had resulted in a good information flow; supplying the necessary information; explaining challenges and tasks well; holding daily and weekly meetings; having multiple discussions on site; promoting work reminders; and improving subcontractor-manager meetings. 3.2 Step Two: Expressing the situation of the problem The situation of the problem, as deciphered from the thematic analysis of the interview transcripts, was presented in the form of a rich picture, where the core problematic issues were listed in the centre cloud of the picture. As shown in Figure 1 there were 73 subthemes of issues highlighted across the project’s supply chain. These could be categorised into 11 overarching problematic areas of the project’s supply chain, which pertained to the site’s management, site operation and efficiency, safety, space, the site’s location, materials supply, security, client and time-related issues, site information, communication, and worker-related issues. In the case of ‘security problems’, for instance, the respondents had noted six themes of issues during the interviews, where problems were said to have occurred due to site break-ins, materials theft, equipment theft, tool theft, and tool forging.
While some of the topics in the rich picture, were populated with more extensive lists of issues, such as site-management problems, and worker-related problems, where 15 and 11 issues were observed, respectively, some overarching themes were only noted to have been plagued by three, or even fewer issues. The problem of site information, for instance, was said to have had issues with the wrong information being given, inconvenient design changes, and plans being given late; while in the case of site location problems, issues with
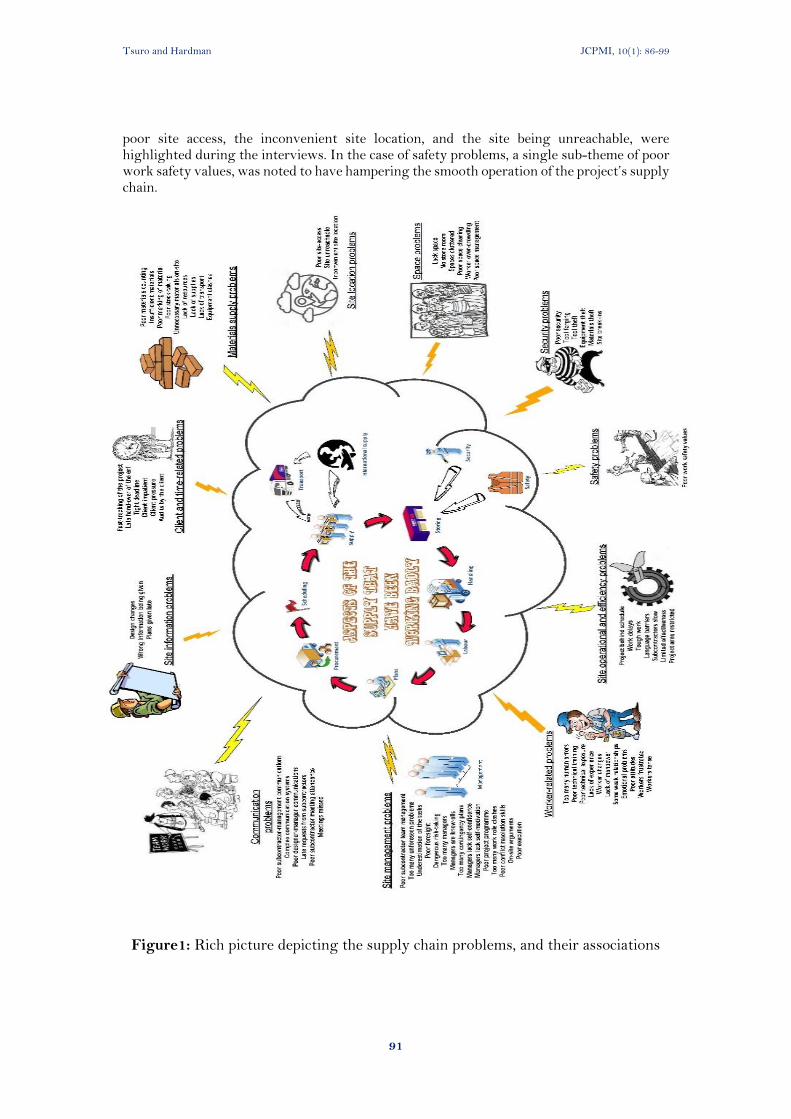
Tsuro and Hardman JCPMI, 10(1): 86-99
91
poor site access, the inconvenient site location, and the site being unreachable, were highlighted during the interviews. In the case of safety problems, a single sub-theme of poor work safety values, was noted to have hampering the smooth operation of the project’s supply chain.
Figure1: Rich picture depicting the supply chain problems, and their associations
Tsuro and Hardman JCPMI, 10(1): 86-99
92
Since the entire focus of SSM is not specifically on the issues, though, but on the steps for improvement, each of the 11 overarching categories of problematic issues will not be re-listed from the rich picture, here. Instead, it is worth emphasizing that the rich picture formed the basis upon which to formulate the root definitions, as presented next. 3.3 Step Three: Formulating root definitions While 11 overarching categories of problem areas were deciphered and listed in the rich picture, the third step of SSM, and particularly its CATWOE analysis, defined only five root definitions, or systems of purposeful behaviour to target the problematic situations. This is because certain of the actions for improvement could be clustered together to resolve the issues of several problematic areas at once. The five root definitions that were formulated, in X-Y-Z format (see Checkland and Scholes, 2001), were:
• To apply some adjustments to the operational, efficiency and space systems on site (X) by workers, subcontractors and project managers (Y), to target the operational, efficiency and space-related problems experienced (Z).
• To introduce numerous new systems of site information and communication (X) by the workers, subcontractors, designers and project managers (Y), to target the site information and communication issues that were being experienced (Z).
• To make changes to some of the time, client, and site management-related systems on the site (X) by the team leaders, foremen and project managers (Y), to target the time, client, and site management-related problems experienced (Z).
• To apply some adjustments to the materials’ supply and project planning mechanisms of the site (X) by the project’s managers (Y), to target the materials’ supply and project planning problems experienced (Z).
• To make adjustments to the training, skills, security and safety systems on the site (X) by the workers, subcontractors and project managers (Y), to target the training, skills, security and safety problems experienced (Z).
3.4 Step Four: Constructing conceptual models Upon analysis of the interview transcript data, the answers of the respondents regarding potential solutions to the aforementioned problems, allowed conceptual models to be created. These conceptual models were flow charts of between five and nine interconnected, feasible actions to perform, to achieve the five root definitions from Step Three. The conceptual model of steps for targeting the first root definition, for instance, and attempting to resolve the operational, efficiency and space-related problems, is presented in Figure 2.
A plan of four separate lines of sequentially executed tasks was proposed to target the operational, efficiency and space-related problems, where it was proposed that more workers should be employed on site; and that bonuses should be paid to incentivise the workers to improve work performance. A concurrent set of proposed tasks was for the workers to be supplied with improved worker transport, which was argued to improve the workers’ cooperation. Concurrently, it was proposed that payments to the subcontractors should be withheld until they had completed their work, which would improve the operational efficiency of the subcontractors. To address the space-related issues on site, it was proposed that space from the adjoining properties should be rented for use on this project; and for the workers to be provided with alternative eating areas. In addition, it was recommended that the project’s management should procure additional equipment to improve the operational efficiency of the site.
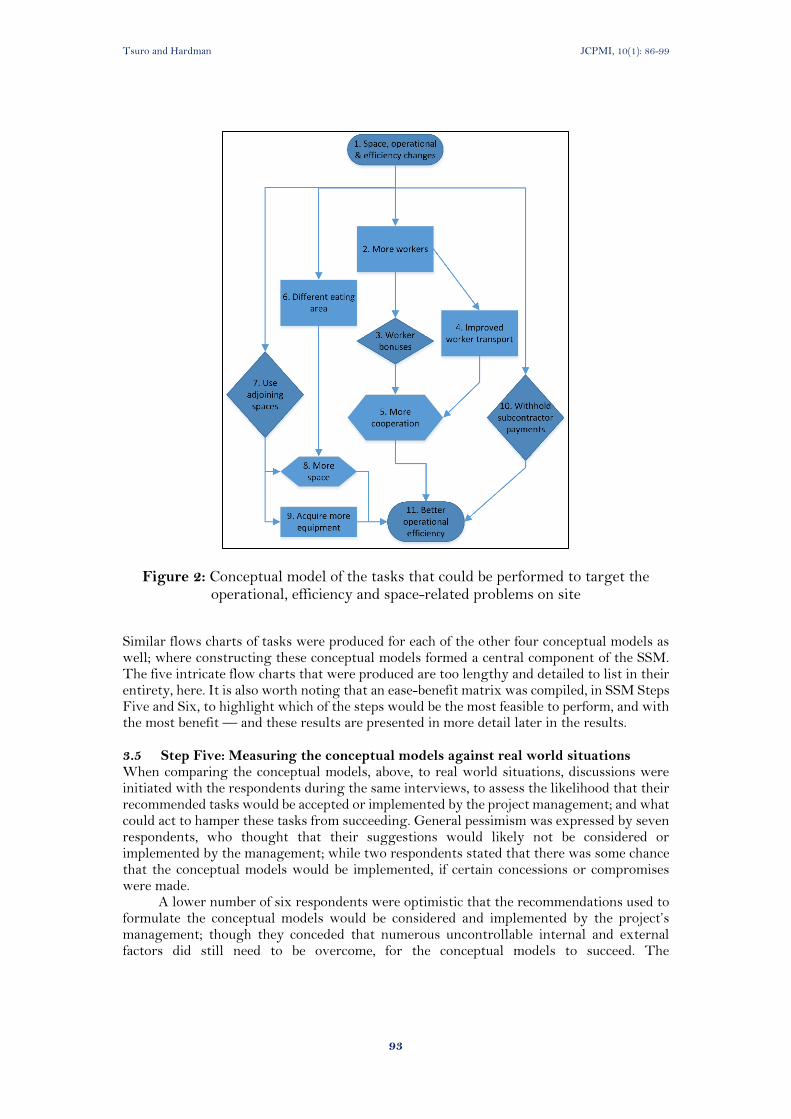
Tsuro and Hardman JCPMI, 10(1): 86-99
93
Figure 2: Conceptual model of the tasks that could be performed to target the operational, efficiency and space-related problems on site
Similar flows charts of tasks were produced for each of the other four conceptual models as well; where constructing these conceptual models formed a central component of the SSM. The five intricate flow charts that were produced are too lengthy and detailed to list in their entirety, here. It is also worth noting that an ease-benefit matrix was compiled, in SSM Steps Five and Six, to highlight which of the steps would be the most feasible to perform, and with the most benefit — and these results are presented in more detail later in the results. 3.5 Step Five: Measuring the conceptual models against real world situations When comparing the conceptual models, above, to real world situations, discussions were initiated with the respondents during the same interviews, to assess the likelihood that their recommended tasks would be accepted or implemented by the project management; and what could act to hamper these tasks from succeeding. General pessimism was expressed by seven respondents, who thought that their suggestions would likely not be considered or implemented by the management; while two respondents stated that there was some chance that the conceptual models would be implemented, if certain concessions or compromises were made.
A lower number of six respondents were optimistic that the recommendations used to formulate the conceptual models would be considered and implemented by the project’s management; though they conceded that numerous uncontrollable internal and external factors did still need to be overcome, for the conceptual models to succeed. The
Tsuro and Hardman JCPMI, 10(1): 86-99
94
uncontrollable factors that were said to be hampering the successful implementation of the conceptual models could be categorised into five broad themes, as follows:
• Traffic limitations: Poor road conditions; high traffic; site on a public road; and deliveries made in opposing traffic.
• Financial limitations: Lack of capital/funds.
• Community limitations: Intimidation by the community; community complaints; and grumpy neighbours.
• Time limitations: A shortage of time; and an immovable project deadline.
• Natural limitations: Rain delays.
3.6 Step Six: Identifying possible and feasible changes In line with the iterative, cyclical nature of SSM, questions were asked to determine what feasible and possible changes could be made to help overcome the uncontrollable factors noted previously. Only seven respondents were forthcoming with any additional ripostes in the interviews, with the following five themes of new changes being proposed:
• Communication changes: Increasing the frequency of mutual discussions; and increasing communications on site.
• Client and time-related changes: Having workers working over-time to finish in time; negotiating a later project hand-over date.
• Site operations and efficiency changes: Increasing equipment efficiency.
• Site management changes: Reducing the project’s management autonomy.
• Space changes: Recycling space on site.
3.7 Step Seven: Taking action to resolve the problematic issues While the final step of SSM is typically to take action to resolve the problematic issues, this was not done for this study. This is because the purpose was only to observe the efficacy of SSM in defining and developing a model to target the existing challenges of the project’s supply chain. Instead, a model for change was developed by placing all of the recommendations from the SSM Steps Four – to – Six into an ease-benefit matrix, as shown in Figure 3.
Actions listed in the upper-right hand quadrant of the matrix were those that were considered to have the greatest potential benefit to the project, while requiring the least effort. Conversely, actions listed in the lower-left hand quadrant of the matrix were considered to have the least potential benefit to the project, while requiring the most effort. Changes that were recommended by the respondents, but which were deemed by the researcher to be more difficult to implement, and/or had lower potential benefits to the project, were placed in the other quadrants of the matrix.
Actions noted in red were those that were specifically listed by the respondents in Step Six, above. These were also placed in the upper right-hand quadrant of the matrix. Another five recommendations from Steps Four and Five of the SSM were also deemed to be worthy, by the researcher, of being included in the upper-right quadrant of the matrix, as noted in black. These were for the project managers to ensure work understanding on site; to provide earlier communications on delivery; to perform more forward planning; to ensure work adherence; and to check work quality.
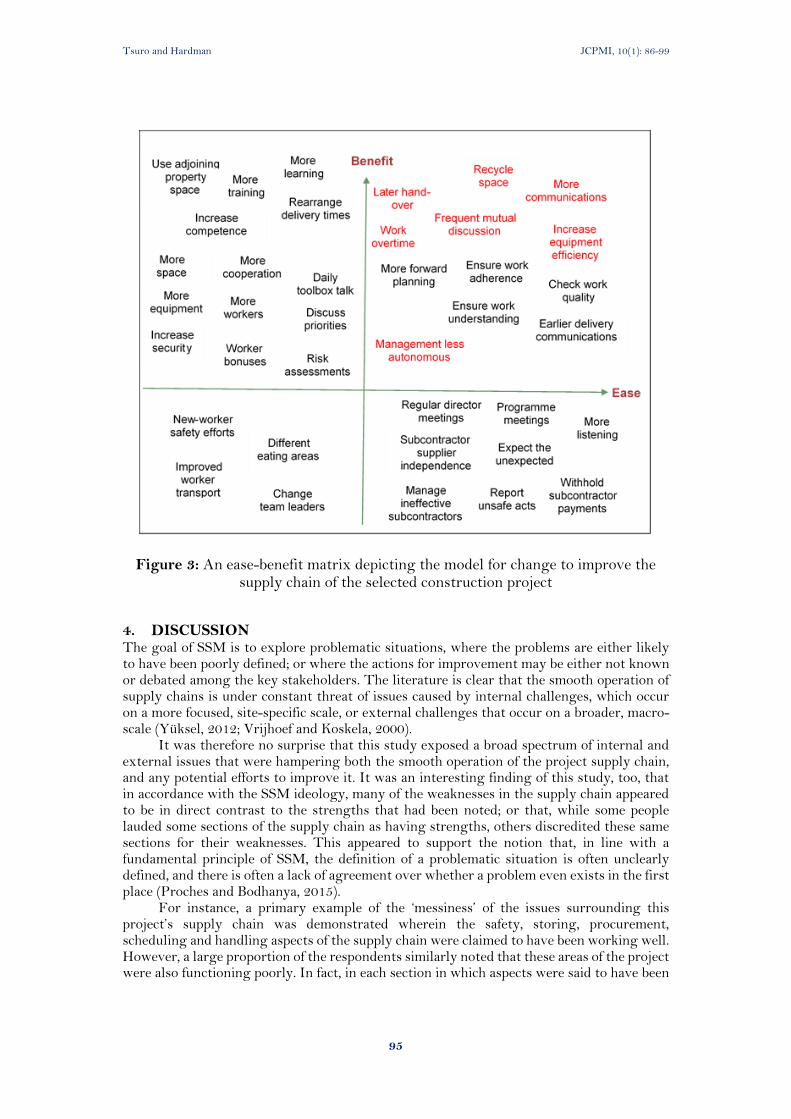
Tsuro and Hardman JCPMI, 10(1): 86-99
95
Figure 3: An ease-benefit matrix depicting the model for change to improve the supply chain of the selected construction project
4. DISCUSSION The goal of SSM is to explore problematic situations, where the problems are either likely to have been poorly defined; or where the actions for improvement may be either not known or debated among the key stakeholders. The literature is clear that the smooth operation of supply chains is under constant threat of issues caused by internal challenges, which occur on a more focused, site-specific scale, or external challenges that occur on a broader, macro-scale (Yüksel, 2012; Vrijhoef and Koskela, 2000).
It was therefore no surprise that this study exposed a broad spectrum of internal and external issues that were hampering both the smooth operation of the project supply chain, and any potential efforts to improve it. It was an interesting finding of this study, too, that in accordance with the SSM ideology, many of the weaknesses in the supply chain appeared to be in direct contrast to the strengths that had been noted; or that, while some people lauded some sections of the supply chain as having strengths, others discredited these same sections for their weaknesses. This appeared to support the notion that, in line with a fundamental principle of SSM, the definition of a problematic situation is often unclearly defined, and there is often a lack of agreement over whether a problem even exists in the first place (Proches and Bodhanya, 2015).
For instance, a primary example of the ‘messiness’ of the issues surrounding this project’s supply chain was demonstrated wherein the safety, storing, procurement, scheduling and handling aspects of the supply chain were claimed to have been working well. However, a large proportion of the respondents similarly noted that these areas of the project were also functioning poorly. In fact, in each section in which aspects were said to have been
Tsuro and Hardman JCPMI, 10(1): 86-99
96
working well, other respondents made claims that they were working poorly. While it is not unreasonable to consider that even within the same departments or sections, certain aspects may have been working well, while others may not, and that the codification during the thematic analysis may have made the issues appear contradictory, it did emphasise the need for each step of the SSM to be completed thoroughly. This was done to delineate the issues clearly and unambiguously, during the remaining steps of SSM.
Next, it is valuable to note that the setbacks experienced in this project’s supply chain were not specific or unique to this project, and various claims of what was occurring on this construction site, appeared to have been echoed in the literature as well. Problems in many projects, for instance, are known to arise when attempting to reach tight, or unrealistic schedules; as a result of non- or delayed payment by financiers; from poor planning and lack of experience and/or skills; and due to insufficient manpower on the workforce (Islam Mohammad Saiful, 2015). Poor scheduling and planning are known to cause issues, for instance, due to the poor involvement of the different stakeholders, from a project’s onset (Bankvall et al., 2010). Poor planning is a significant cause for increased penalties and costs (Subramani et al., 2014), while it also drives projects to deteriorate over time, as subcontractors and primary contractors scramble for resources to complete their works (Kerzner and Kerzner, 2017). Issues such as this were echoed on this project as well.
It is similarly important to note that numerous potential issues listed in the literature were not specifically noted to have caused any problems in this study. The literature describes, for instance, that problems can be caused on construction sites due to nepotism and corruption (Aigbavboa et al., 2016; Le et al., 2014), and/or collusion (Bowen et al., 2007); though none of these issues were mentioned in this study. SSM therefore appeared to be valuable for evaluating the unique circumstances of this particular project’s supply chain.
At the culmination of the seven steps of SSM, then, a model for improvement was devised, where changes were proposed that were deemed to potentially generate the most benefit, while requiring the least amount of resources, time, and effort. The steps to be taken were for space to be recycled, for equipment efficiency to be increased, to have the workers working over-time, and for a later hand-over time for the project to be negotiated. It was also recommended by the respondents, at the end of the cyclical questioning, for the management to be given less autonomy. It is worth noting, though, that removing the management’s autonomy would likely cause numerous other, unforeseen problems, without presenting a clear benefit to the project. It was therefore placed lower down, in the centre of the ease-benefit matrix, instead of securely in its top right-hand corner.
In addition, various other recommended tasks were placed in the upper right-hand quadrant of the ease-benefit matrix, which had been noted during the first five steps of SSM, and which the researcher judged to be proportionally higher on the ease-benefit spectrum than the other recommended actions. These actions were for the project managers to check the work quality more, and to ensure that there was suitable work understanding on site; to provide earlier communications on deliveries; to perform more forward planning; and for the managers to ensure that there was suitable work adherence.
It is worth emphasizing that there was no clear guideline as to which actions would have greater or lesser benefit to the project, or which would be easier or more difficult to implement. These recommended actions were only placed on the ease-benefit matrix according to the researcher’s initiative and intuition. This initiative was taken by pondering the overall benefit that the actions would likely have had on the project’s supply chain, relative to the amount of time, resources and effort required. In fact, the final step of SSM is supposed to be undertaken to test the model of proposed actions, and to iteratively review their successes and/or failures, before generating new proposed actions to further improve the problematic situation. Due to the nature of this study, though, this could not be performed, and a simple model for improvement could only be proposed following an iterative, single-interview process.
Tsuro and Hardman JCPMI, 10(1): 86-99
97
In light of the amount of success that SSM appeared to have, though, in understanding the current situation, and in finding actions for improving the issues within the project’s supply chain, it could be determined that the root definition and conceptual model that would most-likely succeed, upon initial trials, was for actions to be taken by the team leaders, foremen and project managers, to target the time, client, and site management-related problems experienced on site. This is because almost all of the actions on the flow-chart devised for this root definition could be placed highly on the ease-benefit matrix.
Furthermore, the root definition and conceptual model that would most likely produce the largest benefits for the project, was for proposed actions to be taken by the workers, subcontractors and project managers to target operational, efficiency and space systems problems on site. While these actions, according to the ease-benefit matrix, would have been more-challenging to achieve — being on the ‘less-easy’ end of the ease scale — by executing these actions, it could be logically reasoned that the project would see considerable tangible benefits. Furthermore, while executing the other three conceptual models would also render benefits to the project, in light of the relative positions of the majority of their actions on the ease-benefit matrix, they would likely have realised only a lower benefit to the supply chain, with proportionally higher effort than the above-mentioned two conceptual models.
5. CONCLUSION The researcher can confidently conclude that SSM was a good tool for understanding the ‘messy’ circumstances surrounding the chosen construction project supply chain. SSM was useful for revealing some of the complexity within the project, how it was affecting the supply chain, and what actions could be taken to improve the supply chain’s efficiency on site. These findings add weight to the argument that SSM could be a good tool for project managers to systematically introduce into their project planning regimens, so that the issues and challenges that are experienced on site can be targeted in a manner that is customised to the circumstances of the projects.
6. REFERENCES Aigbavboa, C., Oke, A. and Tyali, S. (2016). Unethical practices in the South African
construction industry. Johannesburg: University of Johannesburg Department of Quantity Surveying and Construction Management.
Ball, M. (2014). Rebuilding construction (Routledge revivals): Economic change in the British construction industry. New York: Routledge.
Bankvall, L., Bygballe, L. E., Dubois, A. and Jahre, M. (2010). Interdependence in supply chains and projects in construction. Supply Chain Management: An International Journal, 15(5), 385-393.
Bowen, P., Akintoye, A., Pearl, R. and Edwards, P. J. (2007). Ethical behaviour in the South African construction industry. Construction Management and Economics, 25(6), 631-648.
Braun, V. and Clarke, V. (2006). Using thematic analysis in psychology. Qualitative Research in Psychology, 3(2), 77-101.
Brenton, K. (2007). Using Soft Systems Methodology to examine communication difficulties. Mental Health Practice, 10(5), 12-17.
Burge, S. (2015). System Thinking: Approaches and Methodologies. An Overview of the Soft Systems Methodology. Burge Hughes Walsh. Available at: https: //www.burgehugheswalsh.co.uk/Uploaded/1/Documents/Soft-Systems-Methodology.pdf.
Tsuro and Hardman JCPMI, 10(1): 86-99
98
Checkland, P. and Poulter, J. (2006). Learning for action: a short definitive account of soft systems methodology and its use, for practitioners, teachers and students. New York: John Wiley and Sons Ltd.
Checkland, P. and Poulter, J. (2010). Soft Systems Methodology. In: Systems approaches to managing change: A practical guide. New York: Springer. pp. 191-242.
Checkland, P. and Scholes, J. (1999). Soft Systems Methodology: a 30-year retrospective. Chichester: John Wiley. pp. 1-330.
Checkland, P. B. and Scholes, J. (2001). Soft Systems Methodology in Action. In: J. Rosenhead and J. Mingers (eds), Rational Analysis for a Problematic World Revisited. Chichester: Wiley. pp. 91-113.
Elliman, T. and Orange, G. (2000). Electronic commerce to support construction design and supply-chain management: a research note. International Journal of Physical Distribution & Logistics Management, 30(3/4), 345-360.
Hildbrand, S. and Bodhanya, S. (2014). Application of the viable system model in a complex sugarcane supply chain. British Food Journal, 116(12), 2048-2068.
Ibem, E. O. and Laryea, S. (2015). E-procurement use in the South African construction industry. Journal of Information Technology in Construction, (20), 364-384.
Islam Mohammad Saiful, B. T. S. A. (2015). Causes of Delay in Construction Projects in Bangladesh. In: The 6th International Conference on Construction Engineering and Project Management (ICCEPM 2015), Busan, Korea.
Kayaga, S. (2008). Soft Systems Methodology for performance measurement in the Uganda water sector. Water Policy, 10(3), 273-284.
Kerzner, H. and Kerzner, H. R. (2017). Project management: a systems approach to planning, scheduling, and controlling. New York: John Wiley and Sons Ltd.
Le, Y., Shan, M., Chan, A. P. and Hu, Y. (2014). Overview of corruption research in construction. Journal of Management in Engineering, 30(4), 02514001.
Lloyd-Walker, B. and Walker, D. (2011). Authentic leadership for 21st century project delivery. International Journal of Project Management, 29(4), 383-395.
Mello, M. H., Gosling, J., Naim, M. M., Strandhagen, J. O. and Brett, P. O. (2017). Improving coordination in an engineer-to-order supply chain using a soft systems approach. Production Planning & Control, 28(2), 89-107.
Ojo, E., Mbowa, C. and Akinlabi, E. T. (2014). Barriers in implementing green supply chain management in construction industry. In: Proceedings of the 2014 International Conference on Industrial Engineering and Operations Management, 7–9 January, Bali, Indonesia, pp. 1974–1981.
Palaima, T. and Skaržauskienė, A. (2010). Systems thinking as a platform for leadership performance in a complex world. Baltic Journal of Management, 5(3), 330-355.
Panova, Y. and Hilletofth, P. (2018). Managing supply chain risks and delays in construction project. Industrial Management & Data Systems, 118(7), 1413-1431.
Proches, C. N. G. and Bodhanya, S. (2015). An application of Soft Systems Methodology in the sugar industry. International Journal of Qualitative Methods, 14(1), 1-15.
Subramani, T., Sruthi, P. S. and Kavitha, M. (2014). Causes of cost overrun in construction. IOSR Journal of Engineering, 4(6), 1-7.
Thunberg, M., Rudberg, M. and Karrbom Gustavsson, T. (2017). Categorising on-site problems: A supply chain management perspective on construction projects. Construction Innovation, 17(1), 90-111.
Vaismoradi, M., Jones, J., Turunen, H. and Snelgrove, S. (2016). Theme development in qualitative content analysis and thematic analysis. Journal of Nursing Education and Practice, 6(5), 100.
Vaismoradi, M., Turunen, H. and Bondas, T. (2013). Content analysis and thematic analysis: Implications for conducting a qualitative descriptive study. Nursing & Health Sciences, 15(3), 398-405.

Tsuro and Hardman JCPMI, 10(1): 86-99
99
Vrijhoef, R. and Koskela, L. (2000). The four roles of supply chain management in construction. European Journal of Purchasing & Supply Management, 6(3-4), 169-178.
Williams, B. (2005). Soft Systems Methodology. The Kellogg Foundation. Available at: http: //users.actrix.co.nz/bobwill.
Wilson, B. (1990). Systems: concepts, methodologies, and applications. New York: John Wiley & Sons.
Wilson, B. (2001). Soft Systems Methodology. Conceptual model building and its contribution, New York: John Wiley & Sons Ltd. p. 35.
Wilson, B. and Van Haperen, K. (2015). Soft systems thinking, methodology and the management of change. Basingstoke: Palgrave Macmillan.
Yüksel, İ. (2012). Developing a multi-criteria decision making model for PESTEL analysis. International Journal of Business and Management, 7(24), 52-66.