Embed Size (px)
Citation preview

V O L U M E 1 0
© 1999 . O M E G A R E S E A R C H , I N C . M I A M I , F L O R I D A .

Information in this document is subject to change without notice.
THE TRADING SYSTEMS IN THIS BOOK ARE EXAMPLES ONLY, AND HAVE BEEN INCLUDED SOLELY FOREDUCATIONAL PURPOSES. OMEGA RESEARCH DOES NOT RECOMMEND THAT YOU USE ANY SUCH TRADING
SYSTEM, AS THE USE OF ANY SUCH TRADING SYSTEM DOES NOT GUARANTEE THAT YOU WILL MAKEPROFITS, INCREASE PROFITS, OR MINIMIZE LOSSES. THE SOLE INTENDED USES OF THE TRADING SYSTEMSINCLUDED IN THIS BOOK ARE TO DEMONSTRATE THE WAYS IN WHICH EASYLANGUAGE CAN BE USED TO
DESIGN PERSONAL TRADING SYSTEMS AND TO SHOW SOME EXAMPLES OF HOW CERTAIN POPULAR, WELL-KNOWN TRADING STRATEGIES MAY BE INCORPORATED INTO PERSONAL TRADING SYSTEMS. OMEGA
RESEARCH, INC. IS NOT ENGAGED IN RENDERING ANY INVESTMENT OR OTHER PROFESSIONAL ADVICE.IF INVESTMENT OR OTHER PROFESSIONAL ADVICE IS REQUIRED, THE SERVICES OF A COMPETENT
PROFESSIONAL SHOULD BE SOUGHT.
Copyright © 1999 Omega Research Inc. All rights reserved. No part of this publication may be reproduced, stored in aretrieval system, or transmitted in any form or by any means, electronic, mechanical, photocopying, recording, or otherwise,without prior written permission of Omega Research, Inc. Printed in the United States of America.
TradeStation® and SuperCharts® are registered trademarks of Omega Research, Inc. EasyLanguage, Portfolio Maximizer,PaintBar, ShowMe and SystemBuilder are trademarks of Omega Research, Inc. Microsoft is a registered trademark ofMicrosoft Corporation and MS-DOS, Windows, and Excel are trademarks of Microsoft Corporation. DBC Signal and BMIare trademarks of Data Broadcasting Corp. Price data supplied courtesy of Global Market Information, Inc.
Contents
INTRODUCTION Welcome to STAD 10..........................................................................................................5
Chapter 1: JK Monday We Trade........................................................................................................11
Chapter 2 The Serendipity Entry Trigger, by Chuck LeBeau ...........................................................19
Chapter 3 Serendipity System............................................................................................................21
Chapter 4 Eight Ball...........................................................................................................................31
Chapter 5 Measuring & Comparing Performance .............................................................................49
Chapter 6 Going In Style ...................................................................................................................55
Chapter 7 Who’s Minding The Store ................................................................................................69
Chapter 8 Gemini ...............................................................................................................................81
Chapter 9 The Reference Deviation System, By William Brower, CTA ..........................................95
Chapter 10 Superman ........................................................................................................................103
Appendix A: Common Exits .................................................................................................................115
Appendix B Volume in Review ...........................................................................................................123
Index...................................................................................................................................124


I N T R O D U C T I O N
Welcome to Volume 10
Welcome to Volume 10 of the Omega Research System Trading & DevelopmentClub. We're very glad to know that you're taking advantage of this uniquelearning tool to improve your understanding of trading systems and to increase
the bottom-line results of your trading.
We believe that STAD Club Volume 10 contains something for everyone, from the beginner tothe advanced systems trader. The systems in this issue incorporate popular and importantconcepts such as using both setup conditions and entry techniques to find and then confirmtrading opportunities, and managing positions with several exit strategies — each one performingits own crucial function.
Here's a quick rundown of what you'll see in this volume: Monday We Trade isolates the one dayeach week that is best for trading the stock indices (guess which day), the Serendipity EntryTrigger improves a widely used entry technique by changing just one word in the EasyLanguagecode, and the Serendipity System turns that entry technique into a complete system by adding theRSI, two stops and a profit target.
Our Eight-Ball system uses two exponential moving averages to identify the long and short-termtrends, a volatility trigger to confirm the setup, and a series of stops to manage the trade. Goingin Style adds a volatility expansion condition and the Parabolic stop to enhance a price channelbreakout system. Who's Minding the Store integrates a classic chart pattern and the Stochasticoscillator to find winning trades.
The Gemini system relies on two data series from different time periods: one for the setup, theother for timing the entry, while our Superman system evaluates both the strength and the speedof a market to find reliable trading opportunities. A system from TradeStation guru Bill Brower-the RefDev2 System-builds on a smoothed momentum function to produce a solid-performingtrendfollowing system. Finally, a new RadarScreen indicator will let you know instantly andautomatically which stocks have made the greatest % change and which have lagged behind.
We think STAD 10 is one of our best volumes so far. How much you learn and how much youactually apply to your own trading are, of course, up to you. As always, we wish you good luckand good trading.
IMPORTANT NOTICE: The trading systems in this book are examples only, and they havebeen included solely for educational purposes. Omega Research does not recommend thatyou use any such trading system, as the use of any such trading system does not guaranteethat you will make profits, increase profits, or minimize losses. The sole intended use of thetrading systems included in this book are to demonstrate the ways in which EasyLanguagecan be used to design personal trading systems and to show some examples of how certainpopular, well-known trading strategies may be incorporated into personal trading systems.
Omega Research System Trading and Development Club - Volume 106 Contents at a Glance
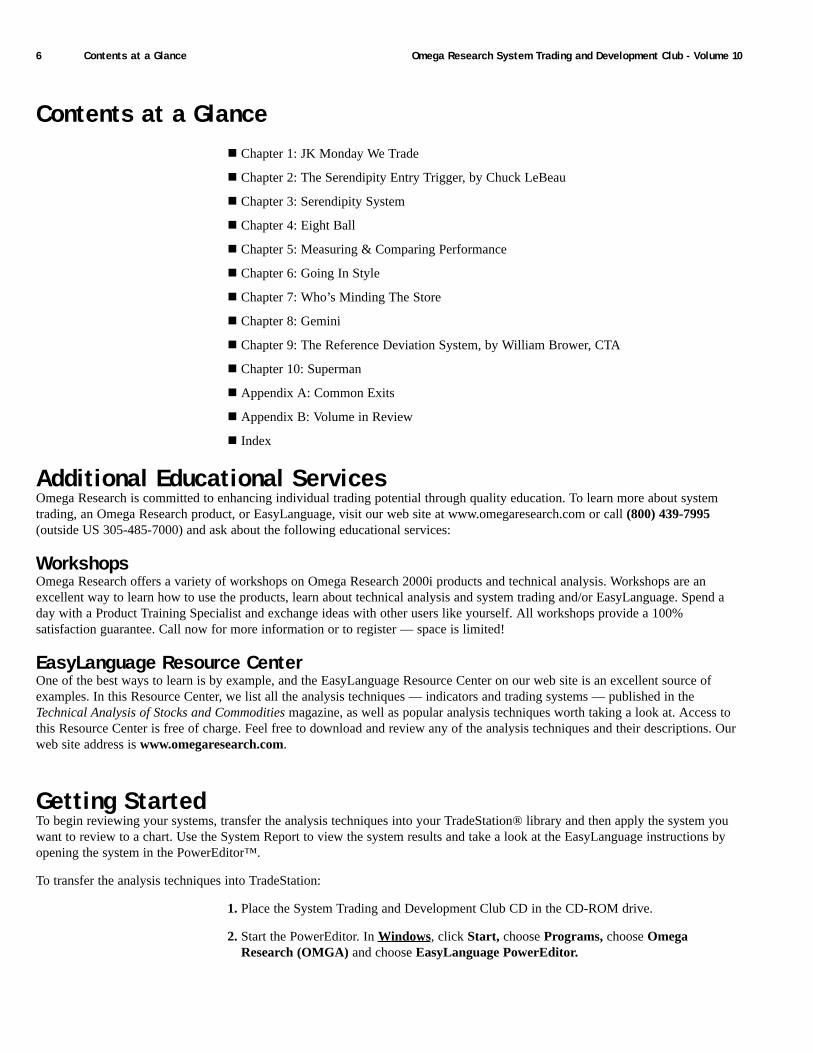
Contents at a Glance! Chapter 1: JK Monday We Trade
! Chapter 2: The Serendipity Entry Trigger, by Chuck LeBeau
! Chapter 3: Serendipity System
! Chapter 4: Eight Ball
! Chapter 5: Measuring & Comparing Performance
! Chapter 6: Going In Style
! Chapter 7: Who’s Minding The Store
! Chapter 8: Gemini
! Chapter 9: The Reference Deviation System, by William Brower, CTA
! Chapter 10: Superman
! Appendix A: Common Exits
! Appendix B: Volume in Review
! Index
Additional Educational ServicesOmega Research is committed to enhancing individual trading potential through quality education. To learn more about systemtrading, an Omega Research product, or EasyLanguage, visit our web site at www.omegaresearch.com or call (800) 439-7995(outside US 305-485-7000) and ask about the following educational services:
WorkshopsOmega Research offers a variety of workshops on Omega Research 2000i products and technical analysis. Workshops are anexcellent way to learn how to use the products, learn about technical analysis and system trading and/or EasyLanguage. Spend aday with a Product Training Specialist and exchange ideas with other users like yourself. All workshops provide a 100%satisfaction guarantee. Call now for more information or to register — space is limited!
EasyLanguage Resource CenterOne of the best ways to learn is by example, and the EasyLanguage Resource Center on our web site is an excellent source ofexamples. In this Resource Center, we list all the analysis techniques — indicators and trading systems — published in theTechnical Analysis of Stocks and Commodities magazine, as well as popular analysis techniques worth taking a look at. Access tothis Resource Center is free of charge. Feel free to download and review any of the analysis techniques and their descriptions. Ourweb site address is www.omegaresearch.com.
Getting StartedTo begin reviewing your systems, transfer the analysis techniques into your TradeStation® library and then apply the system youwant to review to a chart. Use the System Report to view the system results and take a look at the EasyLanguage instructions byopening the system in the PowerEditor™.
To transfer the analysis techniques into TradeStation:
1. Place the System Trading and Development Club CD in the CD-ROM drive.
2. Start the PowerEditor. In Windows, click Start, choose Programs, choose OmegaResearch (OMGA) and choose EasyLanguage PowerEditor.
Obtaining Technical Support 7Introduction
3. In the PowerEditor, use the File - Import and Export menu sequence.
4. Select the Import EasyLanguage Archive File (ELA and ELS) option and click NEXT.
5. Click Scan.
6. In the Enter drive letter to scan edit box, enter the drive letter for your CD-ROM drive(normally D), and click OK.
7. Choose STAD10.ELS from the list and click NEXT.
8. Below the Analysis Types box choose the Select All button and click NEXT.
9. Below the Available Analysis Techniques box choose the Select All button and clickFINISH.
10. Once the files are transferred and verified, a dialog box appears informing you that thetransfer was performed successfully. Click OK.
For your convenience, the names of the systems in this volume all begin with STAD10 (although the signals will not have this prefix).You can now open the systems in the PowerEditor and view the EasyLanguage instructions and/or apply them to a chart in TradeStation.You can remove your CD from the CD-ROM drive and store it in a safe place. As you apply the systems and work with them, refer tothis book for detailed explanations of the systems and the EasyLanguage used to create them. For instructions on applying systems andviewing the System Report, please refer to your TradeStation User's Manual.
Note to SuperCharts® Users: To transfer the systems into SuperCharts, use the Tools - QuickEditor menu sequence and select Transfer.Keep in mind, however, that although you can apply the systems in SuperCharts, you will not be able to view the EasyLanguageinstructions in the QuickEditor. This is because the systems were designed in the PowerEditor. Also, if you are using SuperCharts Endof Day, some of the systems will not apply as they are designed for intraday trading. Since the purpose of the Club is to provide youwith a learning tool, and viewing the EasyLanguage instructions is an essential part of this learning process, the use of this club forSuperCharts users is limited.
Note to TradeStation or SuperCharts 3.x Users: The systems for the Club were designed using TradeStation 2000i. As such, some ofthe features used, such as automatic drawing of trendlines and/or text, are not available in previous versions of TradeStation (orSuperCharts). An effort is made to provide a variety of systems that incorporate both long standing and new features; however, keep inmind that as new features are developed, we will naturally want to showcase and educate users on these features; therefore, users of themost recent version of our software will be able to make the most use of the Club.
Obtaining Technical SupportDepending on your question, there are two resources at your disposal: the EasyLanguage Support Department and the STAD ClubE-Mail Address.
EasyLanguage Support DepartmentThe EasyLanguage Support Department provides EasyLanguage support via fax and is designed to help you troubleshoot ananalysis technique or trading system you are currently working on. For example, if you are incorporating a trading system from theClub into your own and have a question about the implementation, the EasyLanguage Support Department can answer it.
Please keep in mind that while this department can answer any EasyLanguage question, it cannot answer questions about the STADClub specifically, such as the theory behind a system in the Club, why a system was developed a certain way, or why the system is notperforming as you expect it to, etc.
Fax Number: (305) 485-7598
E-Mail Address: [email protected]
Omega Research System Trading and Development Club - Volume 108 Benefits of System trading
Be sure to include the following information in your fax or e-mail:
! Name
! Security Block or Customer ID Number
! Telephone Number
! Fax Number
! Product you own
! EasyLanguage instructions you are working on
! Detailed description of your problem
Please allow 48 hours for a response.
STAD Club E-Mail AddressAnother resource at your disposal is the STAD Club e-mail address.
Please realize that when you send a message to this e-mail address, you will not receive a response directly; your message will bereviewed and the answer incorporated into the next volume of the STAD Club, when applicable. Therefore, if you need technicalsupport on EasyLanguage, please use the above fax number or e-mail address.
Please send any comment, suggestion, or question regarding the systems in the Club to the STAD Club e-mail address, and in eachsubsequent volume we will publish the most common suggestions and questions.
Benefits of System TradingThere are at least five major benefits of trading in a systematic manner as opposed to trading in a discretionary manner:
1. You’ll have a system that is compatible with your own personality and trading style — a system that you are comfortable with andthat you can follow.
2. You will eliminate overly emotional trading and reduce the stress of constantly making subjective, spur-of-the-moment tradingdecisions.
3. You will have objective entry and exit criteria that have been validated by historical testing of quantifiable data.
4. You will know the maximum peak-to-valley drawdown that your system has experienced in the past, and you can make sure that youare adequately capitalized (both financially and psychologically) to withstand another worst-case drawdown.
5. You will gain confidence in both your system and yourself, thus strengthening your ability to follow your system and to trade in ahighly disciplined manner.
As you continue to become more proficient as a systems trader, you will almost certainly discover even more benefits of a systematicapproach.
Getting Ideas For SystemsWe can easily think of at least five great ways to get ideas for trading systems. You’ll probably come up with at least a few more. Here’sour quick list:
1. SuperCharts and TradeStation’s built-in indicators, ShowMeTM studies, PaintBarsTM, and systems
2. Trading As A Business by Charlie Wright (available from Omega Research)
3. Jack Schwager’s Complete Guide to Designing and Testing Trading Systems (12 videos, CD, manual; available from OmegaResearch)

Getting Ideas for Systems 9Introduction
4. OmegaWorld (June, 2000, New York City)
5. And, of course, Omega System Trading & Development Club (ten new trading ideas with manual and CD, published six times peryear. Club members also receive a password for Omega’s STAD Club online forum.)
Once we’re convinced that systems trading is more likely to generate consistent profits than discretionary trading, and once we have anidea for a trading system, how do we progress from an idea to a complete system?
Building a Trading System
We hope the following ten-step plan will prove useful:
1. Write your trading idea as a ShowMe study. Scroll through several years of data to develop a sense of how your idea performs.
2. Write a very simple system based on your idea. For example, you could write a system that enters a position based on your idea andexits the position automatically after n-days. Alternatively, you could write a stop-and-reverse system that uses your idea to enter,exit, and reverse positions.
3. Design a setup for your system. A setup alerts you that a trading opportunity has developed. Setups don’t get you into a trade, butthey do tell you that market conditions have become favorable for a trade. An example of a buy setup is a market posting twoconsecutive closes above a moving average. An example of a sell setup is the Relative Strength Index (RSI) crossing from above 70to below 70.
4. Design an entry for your system. An entry is the criterion that must be met after a setup for a trade to be initiated. An example of abuy entry is a market rallying one average daily range above yesterday’s close. An example of a sell entry is a market’s declinebelow the previous week’s low.
5. Design an exit for your system. An exit is the criterion by which a trade is closed out. Trailing stops, profit targets, and exitconditions will account for most of your system’s exits.
A trailing stop is set below the current price for a long position and above the current price for a short position. When you are in a longposition, you raise the trailing stop as the market trades higher to lock in profits; while short, you lower the trailing stop as the markettrades lower, locking in profits.
An alternative to exiting on a trailing stop is exiting at a profit target. A profit target closes out a trade when the price reaches aspecified objective. One example of a profit-target exit is to close out a position on the second close above the high of the entry day.Another example is to automatically close out a trade when open profits equal three times the initial risk on the trade.
An exit condition gets you out of a trade when a market no longer justifies an open position. Good traders do not always rely on stopsto exit their trades. If the technical condition that got you into a trade (e.g. a rising moving average) is no longer in effect, you shouldexit the trade immediately rather than waiting for your stop to be hit.
6. Select the data on which you will test your system. For example, you might choose to test your system on continuous, back-adjusteddata on U.S. Treasury Bonds from January, 1978 through December, 1997.
7. Divide the test data into five equal parts. Since you are going to test your system on 20 years of data, each part consists of four years.The first four years (01/02/78 - 12/31/81) are reserved for the backward test, and the last four years (01/02/94 - 12/31/97) arereserved for the forward test. The middle 12 years (01/02/82 - 12/31/93) are the data on which you will test and optimize yoursystem.
8. Test and optimize your system on the large, middle section of data. To evaluate the results of testing and optimizing, you shouldconsider several factors including equity curve, net profit, percent profitable, profit factor (dollars won per dollar lost), average trade,and maximum drawdown.
9. Backward and forward test your system on the out-of-sample data you reserved. The test results will probably not be as good as theresults on the data for which your system was optimized. However, for your system to be tradable, the backward and forward testsshould yield favorable results. Your system is unlikely to perform better in the future than it did on the out-of-sample data. Checkyour system’s performance on the same key factors that you evaluated during your test of the sample data (equity curve, net profit,percent profitable, profit factor, average trade, and maximum drawdown).
10. Trade your system with consistency, confidence, and courage.

C H A P T E R 1 :
JK Monday We Trade
Joe Krutsinger, a long-time friend of Omega Research, contributed the Monday We Trade(MWT) system to STAD Club. MWT is a fine example of how a simple system-based on asound idea-can generate extraordinary profits.
MWT trades the stock indices. Joe tested it on the NASDAQ 100, and we tested it on the S&P500. Out of curiosity, we also tested it on an individual stock — IBM. (Test results can be foundbelow.) Here's the entire system: if it's Friday and the close is above a two-day simple movingaverage, buy at the open on Monday, set a money-management stop, and exit on the close; if it'sFriday and the close is below a two-day simple moving average, sell short at the open onMonday, set a money-management stop, and exit on the close. (If the market's not open onMonday, take the trade on Tuesday.)
Omega Research System Trading and Development Club - Volume 1012 Defining Our Trading Rules
Defining Our Trading RulesFor MWT, we defined long and short entries, a money-management stop, and an exit strategy. Theentries, stop, and exits are described next.
Long and Short Entries
a) Buy at the open on Monday if Friday's close was above a two-day simple moving average.
b) Sell short at the open on Monday if Friday's close was below a two-day simple moving average.
Long and Short Stops
Place a money-management protective stop, limiting the potential loss on the trade to a specifieddollar amount (not counting possible slippage if the stop is hit).
Long and Short Exits
If not stopped out during the day, exit on the close.
Designing & FormattingThis section presents the EasyLanguage instructions and formatting for the system, with theEasyLanguage instructions broken down and explained line by line.
EasyLanguage System Components: Monday Trade (STAD10: Monday Trade)
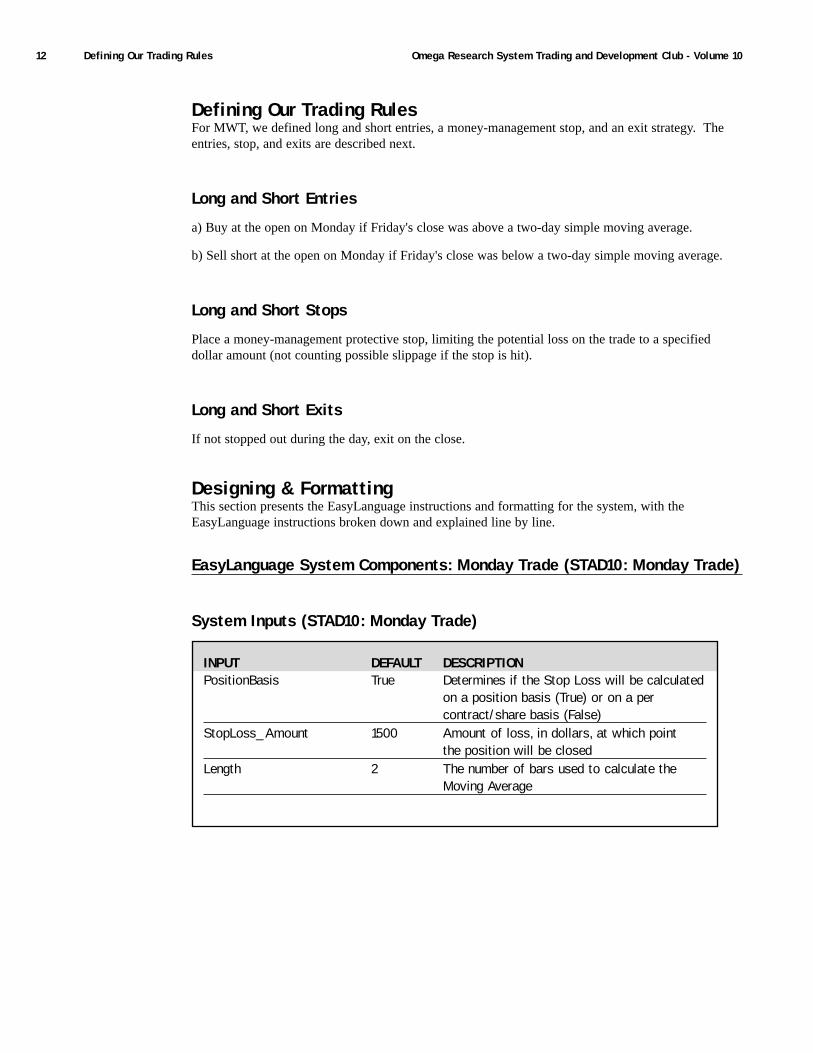
System Inputs (STAD10: Monday Trade)
INPUT DEFAULT DESCRIPTIONPositionBasis True Determines if the Stop Loss will be calculated
on a position basis (True) or on a percontract/share basis (False)
StopLoss_Amount 1500 Amount of loss, in dollars, at which pointthe position will be closed
Length 2 The number of bars used to calculate theMoving Average

Designing & Formatting 13Chapter 1 JK Monday We Trade
Signal Components:
1. JK Monday We Trade!
2. Stop Loss
3. Close at end of day
EasyLanguage Signal: JK Monday We Trade!:
Input: Length(5);
If DayOfWeek(Date) = Friday AND Close > Average(Close, Length) Then Buy Next Bar at Market;
If DayOfWeek(Date) = Friday AND Close <= Average(Close, Length) ThenSell Next Bar at Market;
Signal Inputs (JK Monday We Trade!)
Long Entry
If the current day of the week is Friday, and the Close is greater than the 2 bar Average of the Close, aBuy order is placed on the open of the next bar (Market), Monday.
If DayOfWeek(Date) = Friday AND Close > Average(Close, Length) Then Buy Next Bar at Market;
Short Entry
If the current day of the week is Friday, and the Close is less than the 2 bar Average of the close, aSell order is placed on the Open of the next bar (Market), Monday.
If DayOfWeek(Date) = Friday AND Close <= Average(Close, Length) ThenSell Next Bar at Market;
EasyLanguage Signal: Close at end of day
This Signal simply uses an EasyLanguage keyword called SetExitOnClose to trigger an Exit, eitherLong or Short, at the end of the trading day.
SetExitOnClose;
INPUT DEFAULT DESCRIPTIONLength 2 The number of bars used to calculate the
Moving Average
Omega Research System Trading and Development Club - Volume 1014 Designing & Formatting
EasyLanguage Signal: StopLoss
** See Common Stops Appendix
Testing & ImprovingJoe Krutsinger tested Monday We Trade on daily data for the NASDAQ 100 Index from 4/96 to 8/99.No deductions were made for slippage or commission. The total net profit was $107,035 on 167trades. 59% of the trades were profitable. The largest winning trade earned $15,000, while thelargest losing trade lost only $1,300. The average win was 1.68 times the size of the average loss, at$1,827 and -$1,087 respectively. The Profit Factor of 2.45 indicates that MWT gained $2.45 for each$1.00 it lost. Surprisingly (since stocks have been in an historic bull market for several years), thesystem made more money on the short side than on the long side: $45,955 long and $61,080 short.The average long trade earned $468 compared to an average short trade of $885.
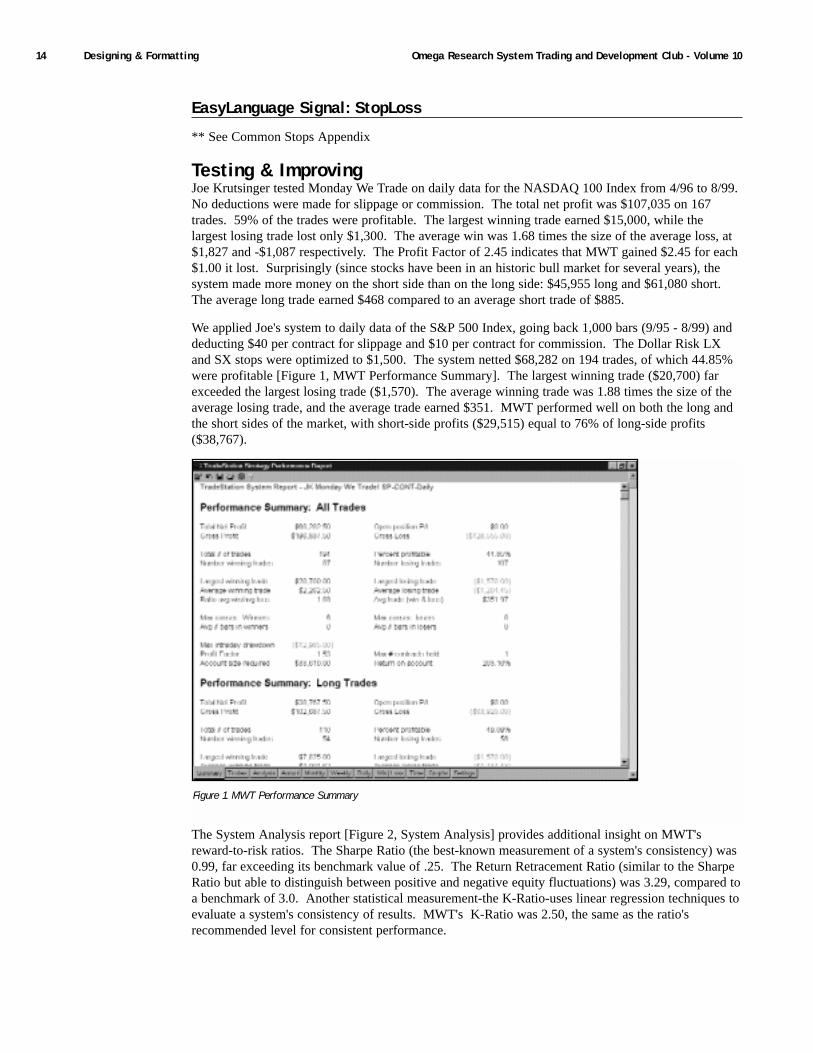
We applied Joe's system to daily data of the S&P 500 Index, going back 1,000 bars (9/95 - 8/99) anddeducting $40 per contract for slippage and $10 per contract for commission. The Dollar Risk LXand SX stops were optimized to $1,500. The system netted $68,282 on 194 trades, of which 44.85%were profitable [Figure 1, MWT Performance Summary]. The largest winning trade ($20,700) farexceeded the largest losing trade ($1,570). The average winning trade was 1.88 times the size of theaverage losing trade, and the average trade earned $351. MWT performed well on both the long andthe short sides of the market, with short-side profits ($29,515) equal to 76% of long-side profits($38,767).
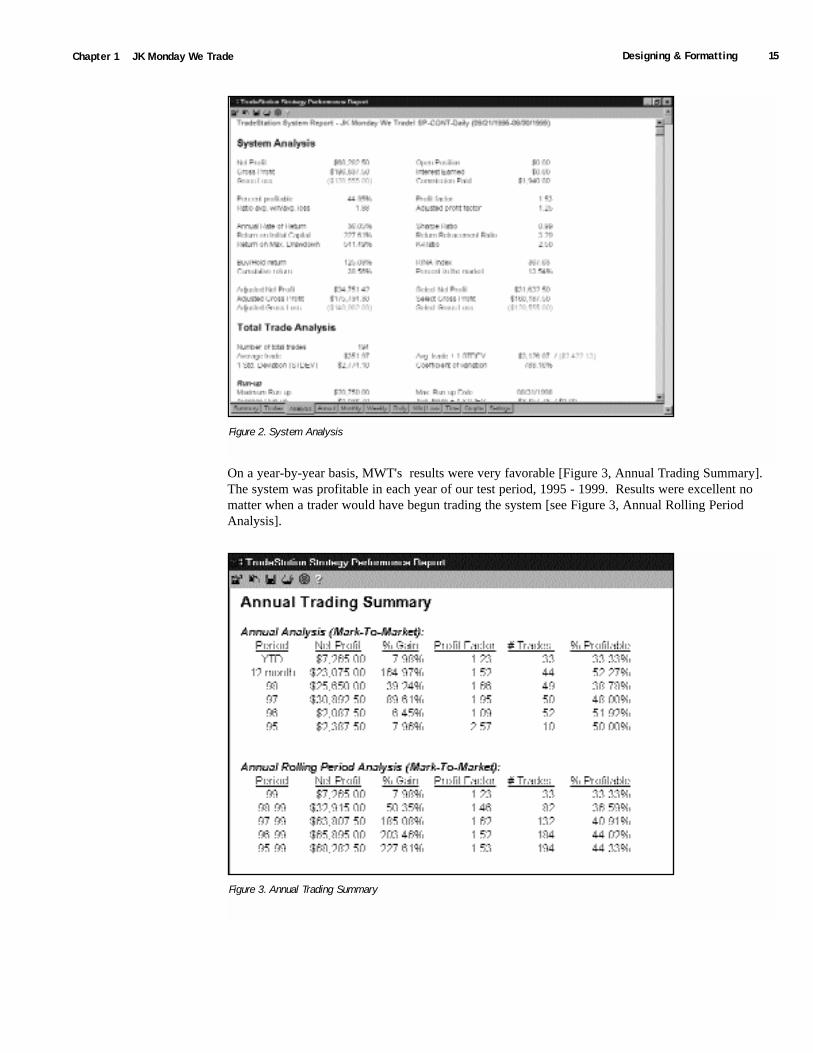
The System Analysis report [Figure 2, System Analysis] provides additional insight on MWT'sreward-to-risk ratios. The Sharpe Ratio (the best-known measurement of a system's consistency) was0.99, far exceeding its benchmark value of .25. The Return Retracement Ratio (similar to the SharpeRatio but able to distinguish between positive and negative equity fluctuations) was 3.29, compared toa benchmark of 3.0. Another statistical measurement-the K-Ratio-uses linear regression techniques toevaluate a system's consistency of results. MWT's K-Ratio was 2.50, the same as the ratio'srecommended level for consistent performance.
Figure 1. MWT Performance Summary
Designing & Formatting 15Chapter 1 JK Monday We Trade
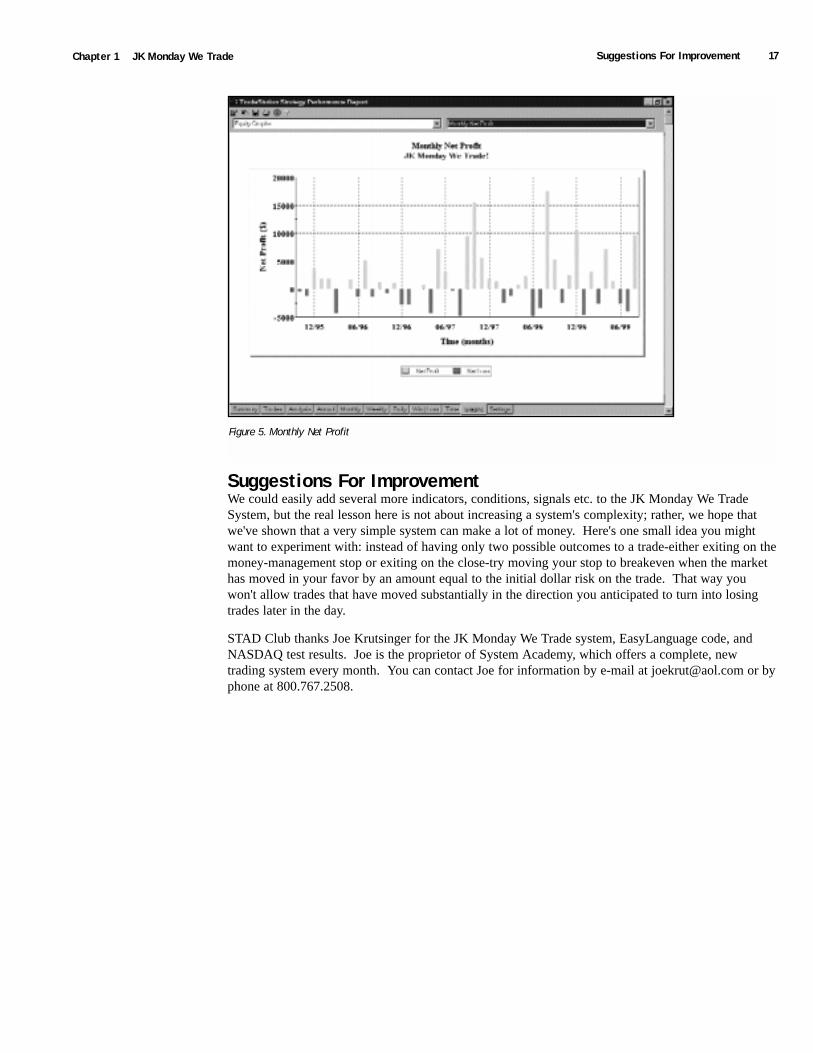
On a year-by-year basis, MWT's results were very favorable [Figure 3, Annual Trading Summary].The system was profitable in each year of our test period, 1995 - 1999. Results were excellent nomatter when a trader would have begun trading the system [see Figure 3, Annual Rolling PeriodAnalysis].
Figure 2. System Analysis
Figure 3. Annual Trading Summary

Omega Research System Trading and Development Club - Volume 1016 Designing & Formatting
The Underwater Equity Curve is a deliberately pessimistic display of a system's performance [Figure4, Underwater Equity Curve]. The vertical axis indicates the percent drawdown the systemexperienced, while the horizontal axis indicates the time in months. The short vertical bars risingabove the 0 line represent new equity highs; obviously, they are not drawn to scale. The mostprominent features of the Underwater Equity Curve are the equity declines between new monthlyequity highs. Unlike the bars that represent the new equity highs, these equity dips are drawn toscale, giving the graph a very negative appearance. The MWT system did have one drawdown ofabout 24%, but its other drawdowns were all less than 14 percent.
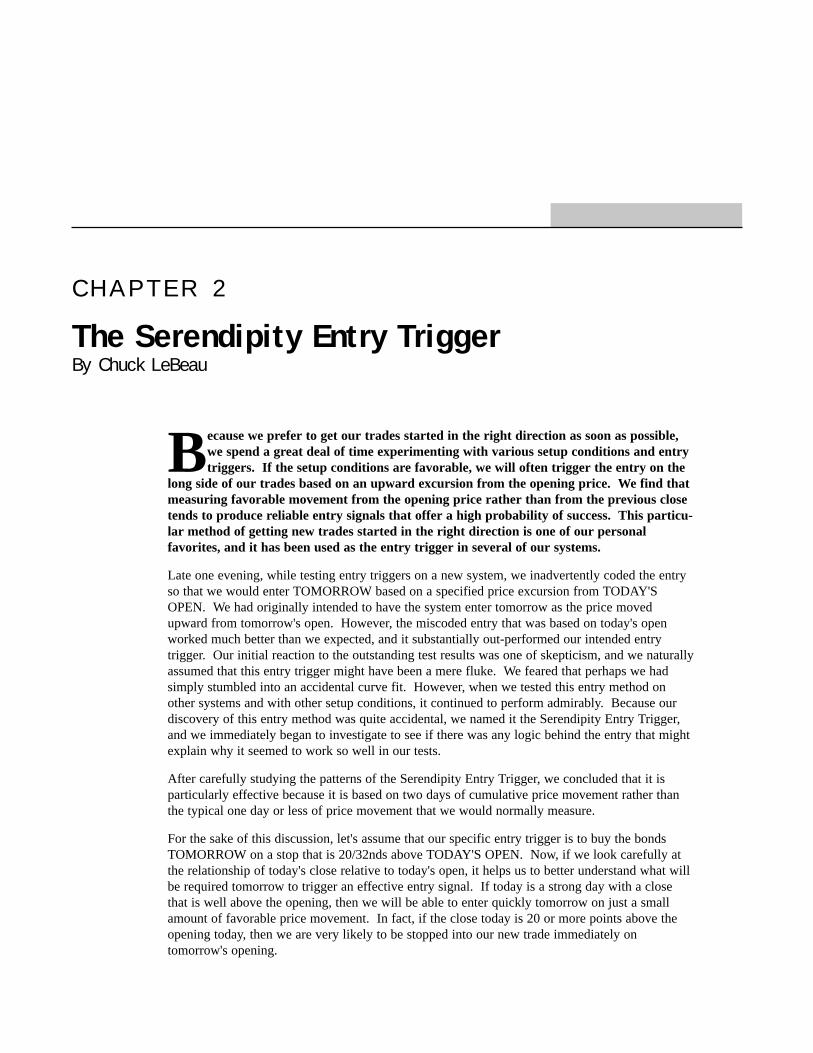
Monthly Net Profit is depicted in Figure 5 [Figure 5, Monthly Net Profit]. Note that there are severalmore winning months than losing months, and that several winning months are larger than any of thelosing months.
Although MWT was designed to trade stock indices, we also tested it on IBM. We tested the longside only on daily data from 1995 to 1999, deducting $.10 per share for slippage and $.05 per sharefor commission. Our optimization returned a money-management stop of $300 (per 100 contractstraded) and an eight-day simple moving average. Here are the test results for each day of the week: ifthe system bought on Tuesdays and exited on the close, it lost $259 over the approximately five-yeartest period; buying on Wednesdays earned $553; buying on Thursdays earned $1,037; buying onFridays earned $1,609; buying on Mondays earned $2,822.
Figure 4. Underwater Equity Curve
Suggestions For Improvement 17Chapter 1 JK Monday We Trade
Suggestions For ImprovementWe could easily add several more indicators, conditions, signals etc. to the JK Monday We TradeSystem, but the real lesson here is not about increasing a system's complexity; rather, we hope thatwe've shown that a very simple system can make a lot of money. Here's one small idea you mightwant to experiment with: instead of having only two possible outcomes to a trade-either exiting on themoney-management stop or exiting on the close-try moving your stop to breakeven when the markethas moved in your favor by an amount equal to the initial dollar risk on the trade. That way youwon't allow trades that have moved substantially in the direction you anticipated to turn into losingtrades later in the day.
STAD Club thanks Joe Krutsinger for the JK Monday We Trade system, EasyLanguage code, andNASDAQ test results. Joe is the proprietor of System Academy, which offers a complete, newtrading system every month. You can contact Joe for information by e-mail at [email protected] or byphone at 800.767.2508.
Figure 5. Monthly Net Profit

Omega Research System Trading and Development Club - Volume 1018
C H A P T E R 2
The Serendipity Entry TriggerBy Chuck LeBeau
Because we prefer to get our trades started in the right direction as soon as possible,we spend a great deal of time experimenting with various setup conditions and entrytriggers. If the setup conditions are favorable, we will often trigger the entry on the
long side of our trades based on an upward excursion from the opening price. We find thatmeasuring favorable movement from the opening price rather than from the previous closetends to produce reliable entry signals that offer a high probability of success. This particu-lar method of getting new trades started in the right direction is one of our personalfavorites, and it has been used as the entry trigger in several of our systems.
Late one evening, while testing entry triggers on a new system, we inadvertently coded the entryso that we would enter TOMORROW based on a specified price excursion from TODAY'SOPEN. We had originally intended to have the system enter tomorrow as the price movedupward from tomorrow's open. However, the miscoded entry that was based on today's openworked much better than we expected, and it substantially out-performed our intended entrytrigger. Our initial reaction to the outstanding test results was one of skepticism, and we naturallyassumed that this entry trigger might have been a mere fluke. We feared that perhaps we hadsimply stumbled into an accidental curve fit. However, when we tested this entry method onother systems and with other setup conditions, it continued to perform admirably. Because ourdiscovery of this entry method was quite accidental, we named it the Serendipity Entry Trigger,and we immediately began to investigate to see if there was any logic behind the entry that mightexplain why it seemed to work so well in our tests.
After carefully studying the patterns of the Serendipity Entry Trigger, we concluded that it isparticularly effective because it is based on two days of cumulative price movement rather thanthe typical one day or less of price movement that we would normally measure.
For the sake of this discussion, let's assume that our specific entry trigger is to buy the bondsTOMORROW on a stop that is 20/32nds above TODAY'S OPEN. Now, if we look carefully atthe relationship of today's close relative to today's open, it helps us to better understand what willbe required tomorrow to trigger an effective entry signal. If today is a strong day with a closethat is well above the opening, then we will be able to enter quickly tomorrow on just a smallamount of favorable price movement. In fact, if the close today is 20 or more points above theopening today, then we are very likely to be stopped into our new trade immediately ontomorrow's opening.
20 The Serendipity Entry Trigger Omega Research System Trading and Development Club - Volume 10
In our opinion, the Serendipity Entry Trigger works so well because it is almost like adding anelement of hindsight into the entry process. The precise sequence of price action on the setup daybecomes an important part of the final trigger mechanism.
We could, of course, simply require that the setup day be a strong day as a pre-entry condition.However, the Serendipity Trigger is more adaptive and robust than a setup condition because it isflexible enough to occasionally permit an entry even though the setup day is weak. A weak setup daycan occasionally be followed by an abnormally strong entry day, and the Serendipity Trigger wouldstill allow us to enter on this strength. If we were to use a more conventional entry trigger and makea strong setup day a pre-entry condition, there would be no entry signal on the following day even ifthe market showed remarkable strength.
The Serendipity Trigger offers an important operational advantage as well as contributing to improvedtiming. When using the conventional trigger that is based on tomorrow's opening price, our exactentry point cannot be calculated until after the opening trade has been posted. However, one of thebenefits of the Serendipity Trigger is that the exact entry order is available the day prior to the entry,and our stop order can be placed prior to the opening.
Conventional Entry Code
Buy("Long Entry") Open Tomorrow + 20 points stop;
Sell("Short Entry") Open Tomorrow - 20 points stop;
Serendipity Entry Code
Buy("Long Entry") Open + 20 points stop;
Sell("Short Entry") Open - 20 points stop;
Chuck LeBeau is the co-author of the highly regarded book, Computer Analysis of the FuturesMarket. He is also the proprietor of Chuck LeBeau's System Traders Club. The club's website addressis www.traderclub.com. You can contact Chuck by e-mail at [email protected].

C H A P T E R 3
Serendipity System
Our Serendipity System begins with Chuck LeBeau's Serendipity entry trigger thenadds a momentum indicator, a protective stop, a breakeven stop, and a profit targetto complete the system.
Although the Relative Strength Index (RSI) is usually used to identify overbought and oversoldconditions, we use it as our trend indicator in Serendipity. When RSI climbs to 70 or higher, themarket is strong, and we get ready to buy; when RSI falls to 30 or lower, the market is weak, andwe get ready to sell short.
With a bullish RSI setup in place, we go long at the open plus n points. When a bearish RSIsetup is in effect, we sell short at the open minus n points. The unusual aspect of this system isthat we are referring to the open of the day before the entry bar, not the open of the entry bar (seethe Serendipity entry trigger, Chapter 2 in this volume).
Upon entering a new long position, we place a protective stop at our entry price minus a multipleof the Average True Range (ATR). When the market moves in our favor by n ATRs, we raise ourstop to breakeven and place an order to take profits at a target that is also calculated as a multipleof the ATR. For a new short position, we set our protective stop at the entry price plus a multipleof the ATR. When the market moves in our favor by n ATRs, we lower our stop to breakevenand place an order to take profits at a target n ATRs below our entry price.
22 Defining Our Trading Rules Omega Research System Trading and Development Club - Volume 10
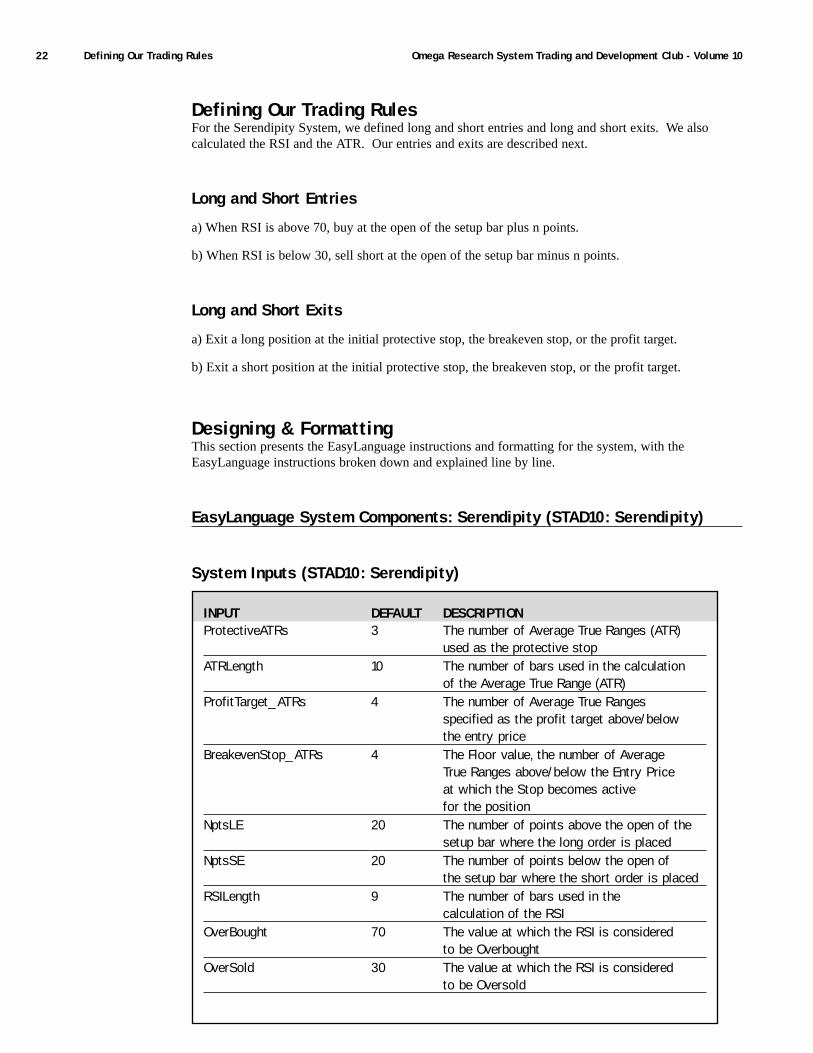
Defining Our Trading RulesFor the Serendipity System, we defined long and short entries and long and short exits. We alsocalculated the RSI and the ATR. Our entries and exits are described next.
Long and Short Entries
a) When RSI is above 70, buy at the open of the setup bar plus n points.
b) When RSI is below 30, sell short at the open of the setup bar minus n points.
Long and Short Exits
a) Exit a long position at the initial protective stop, the breakeven stop, or the profit target.
b) Exit a short position at the initial protective stop, the breakeven stop, or the profit target.
Designing & FormattingThis section presents the EasyLanguage instructions and formatting for the system, with theEasyLanguage instructions broken down and explained line by line.
EasyLanguage System Components: Serendipity (STAD10: Serendipity)
System Inputs (STAD10: Serendipity)
INPUT DEFAULT DESCRIPTIONProtectiveATRs 3 The number of Average True Ranges (ATR)
used as the protective stopATRLength 10 The number of bars used in the calculation
of the Average True Range (ATR)ProfitTarget_ATRs 4 The number of Average True Ranges
specified as the profit target above/belowthe entry price
BreakevenStop_ATRs 4 The Floor value, the number of AverageTrue Ranges above/below the Entry Priceat which the Stop becomes activefor the position
NptsLE 20 The number of points above the open of the setup bar where the long order is placed
NptsSE 20 The number of points below the open ofthe setup bar where the short order is placed
RSILength 9 The number of bars used in thecalculation of the RSI
OverBought 70 The value at which the RSI is consideredto be Overbought
OverSold 30 The value at which the RSI is consideredto be Oversold
Designing & Formatting 23Chapter 3 Serendipity System
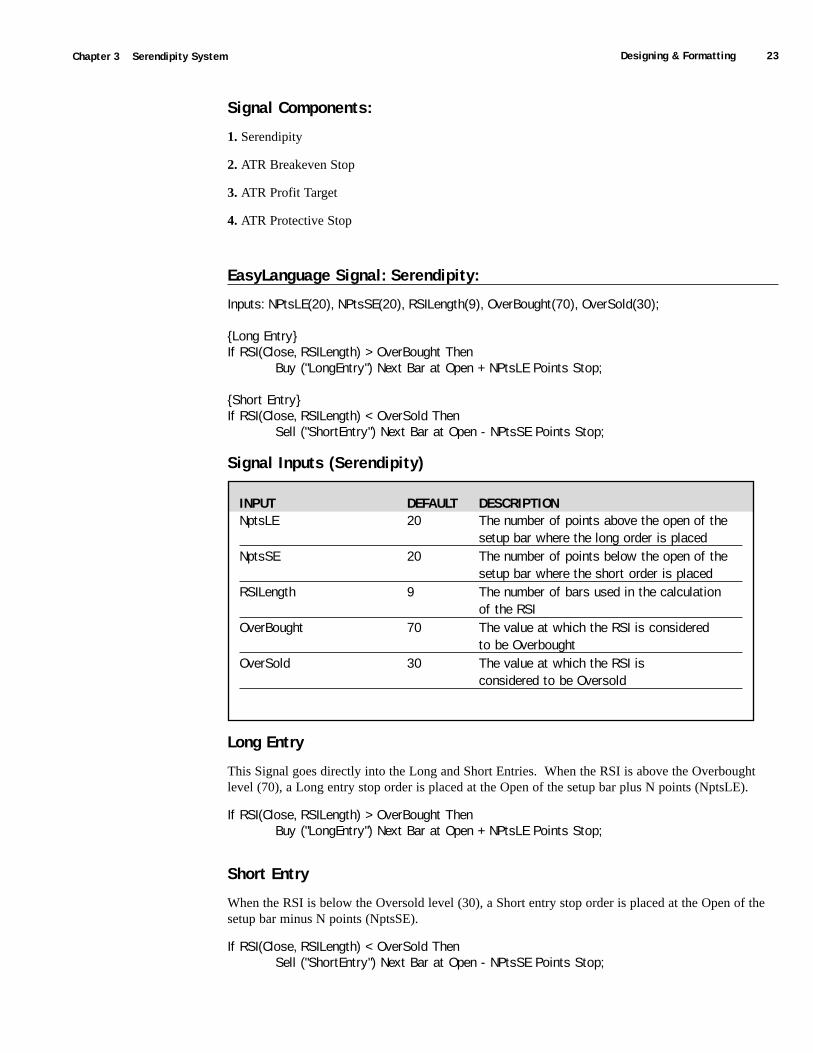
Signal Components:
1. Serendipity
2. ATR Breakeven Stop
3. ATR Profit Target
4. ATR Protective Stop
EasyLanguage Signal: Serendipity:
Inputs: NPtsLE(20), NPtsSE(20), RSILength(9), OverBought(70), OverSold(30);
{Long Entry}If RSI(Close, RSILength) > OverBought Then
Buy ("LongEntry") Next Bar at Open + NPtsLE Points Stop;
{Short Entry}If RSI(Close, RSILength) < OverSold Then
Sell ("ShortEntry") Next Bar at Open - NPtsSE Points Stop;
Signal Inputs (Serendipity)
Long Entry
This Signal goes directly into the Long and Short Entries. When the RSI is above the Overboughtlevel (70), a Long entry stop order is placed at the Open of the setup bar plus N points (NptsLE).
If RSI(Close, RSILength) > OverBought ThenBuy ("LongEntry") Next Bar at Open + NPtsLE Points Stop;
Short Entry
When the RSI is below the Oversold level (30), a Short entry stop order is placed at the Open of thesetup bar minus N points (NptsSE).
If RSI(Close, RSILength) < OverSold ThenSell ("ShortEntry") Next Bar at Open - NPtsSE Points Stop;
INPUT DEFAULT DESCRIPTIONNptsLE 20 The number of points above the open of the
setup bar where the long order is placedNptsSE 20 The number of points below the open of the
setup bar where the short order is placedRSILength 9 The number of bars used in the calculation
of the RSIOverBought 70 The value at which the RSI is considered
to be OverboughtOverSold 30 The value at which the RSI is
considered to be Oversold
24 Designing & Formatting Omega Research System Trading and Development Club - Volume 10
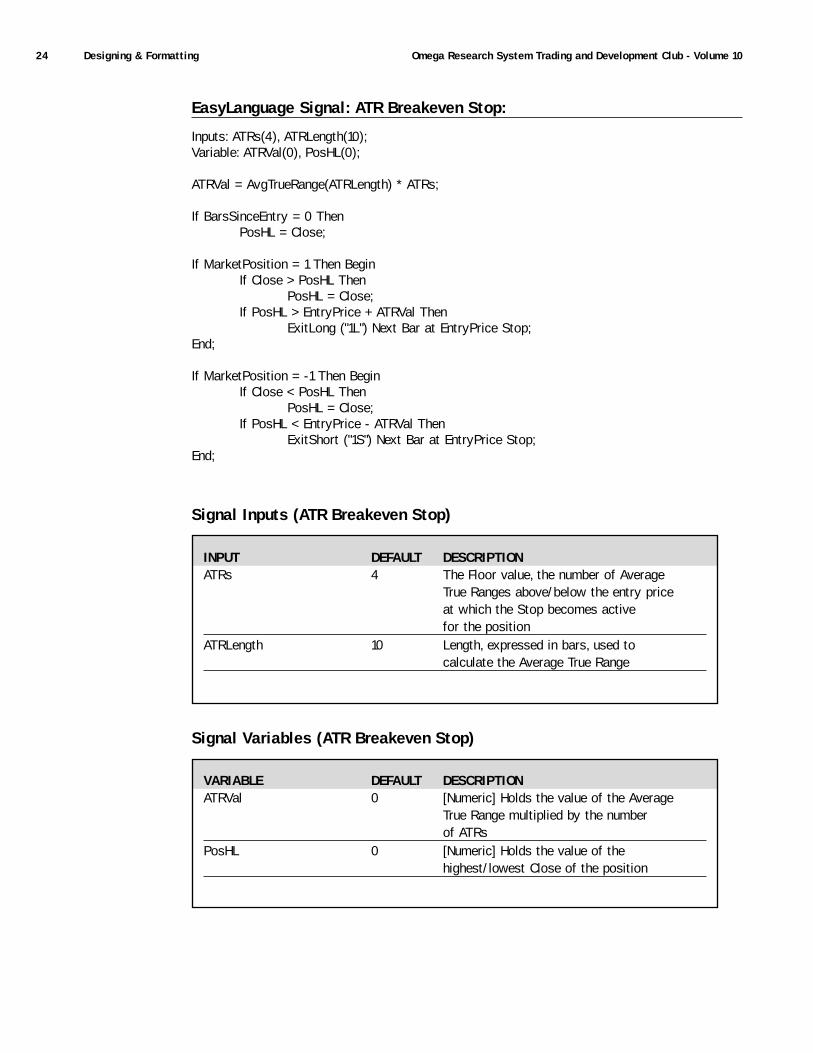
EasyLanguage Signal: ATR Breakeven Stop:
Inputs: ATRs(4), ATRLength(10);Variable: ATRVal(0), PosHL(0);
ATRVal = AvgTrueRange(ATRLength) * ATRs;
If BarsSinceEntry = 0 ThenPosHL = Close;
If MarketPosition = 1 Then BeginIf Close > PosHL Then
PosHL = Close;If PosHL > EntryPrice + ATRVal Then
ExitLong ("1L") Next Bar at EntryPrice Stop;End;
If MarketPosition = -1 Then BeginIf Close < PosHL Then
PosHL = Close;If PosHL < EntryPrice - ATRVal Then
ExitShort ("1S") Next Bar at EntryPrice Stop;End;
Signal Inputs (ATR Breakeven Stop)
Signal Variables (ATR Breakeven Stop)
INPUT DEFAULT DESCRIPTIONATRs 4 The Floor value, the number of Average
True Ranges above/below the entry priceat which the Stop becomes activefor the position
ATRLength 10 Length, expressed in bars, used tocalculate the Average True Range
VARIABLE DEFAULT DESCRIPTIONATRVal 0 [Numeric] Holds the value of the Average
True Range multiplied by the numberof ATRs
PosHL 0 [Numeric] Holds the value of thehighest/lowest Close of the position
Designing & Formatting 25Chapter 3 Serendipity System
Setup
In the Setup portion of the Signal, the Average True Range is calculated and multiplied by the numberof 'ATRs' specified in the Inputs.
ATRVal = AvgTrueRange(ATRLength) * ATRs;
On the first bar of the position, when the 'BarsSinceEntry' is equal to 0, the 'PosHL' variable isassigned the Close value. This resets the tracking of the highest/lowest Close of the position.The tracking is based on the direction of the position.
If BarsSinceEntry = 0 ThenPosHL = Close;
Long Exit
Once a Long position is taken, we must evaluate the highest closing price of the position and theFloor value established by the Average True Range. First, a comparison between the Close and the'PosHL' Variable is made. During a Long position the 'PosHL' variable represents the highest Closeof the position. Thus, if the Close is greater than the 'PosHL' value, the Close value is assigned to the'PosHL' variable as the new highest Close. Next, If the highest Close of the position (PosHL) exceedsthe sum of the 'EntryPrice' and the specified Average True Range (the Floor value), a Long Exit Stoporder is placed at the entry price (breakeven price).
If MarketPosition = 1 Then BeginIf Close > PosHL Then
PosHL = Close;If PosHL > EntryPrice + ATRVal Then
ExitLong ("1L") Next Bar at EntryPrice Stop;End;
Short Exit
Once a Short position is taken, we must evaluate the lowest closing price of the position and the Floorvalue established by the Average True Range. First, a comparison between the Close and the 'PosHL'Variable is made. During a Short position the 'PosHL' variable represents the lowest Close of theposition. Thus, if the Close is less than the 'PosHL' value, the Close value is assigned to the 'PosHL'variable as the new lowest Close. Next, If the lowest Close of the position (PosHL) falls below thedifference between the 'EntryPrice' and the specified Average True Range (the Floor value), a ShortExit Stop order is placed at the entry price (breakeven price).
If MarketPosition = -1 Then BeginIf Close < PosHL Then
PosHL = Close;If PosHL < EntryPrice - ATRVal Then
ExitShort ("1S") Next Bar at EntryPrice Stop;End;

26 Designing & Formatting Omega Research System Trading and Development Club - Volume 10
EasyLanguage Signal: ATR Profit Target:
Inputs: ATRs(4), ATRLength(10);Variable: ATRVal(0), EntryATR(0);
ATRVal = AvgTrueRange(ATRLength) * ATRs;
If BarsSinceEntry = 0 ThenEntryATR = ATRVal;
If MarketPosition = 1 ThenExitLong ("2L") Next Bar at EntryPrice + EntryATR Limit;
If MarketPosition = -1 ThenExitShort ("2S") Next Bar at EntryPrice - EntryATR Limit;
If LastBarOnChart Then Beginvalue1 = ShowLongStop(EntryPrice + EntryATR);value1 = ShowShortStop(EntryPrice - EntryATR);
End;
Signal Inputs (ATR Profit Target)
Signal Variables (ATR Profit Target)
INPUT DEFAULT DESCRIPTIONATRs 4 The number of Average True Ranges
specified as the profit target above/belowthe entry price
ATRLength 10 Length, expressed in bars, used tocalculate the Average True Range
VARIABLE DEFAULT DESCRIPTIONATRVal 0 [Numeric] Holds the value of the Average
True Range multiplied by the numberof ATRs
EntryATR 0 [Numeric] Holds the value of the AverageTrue Range on the first bar of the position
Designing & Formatting 27Chapter 3 Serendipity System
Setup
In the Setup portion of the signal, the Average True Range is calculated and multiplied by the numberof 'ATRs' specified for the profit target.
ATRVal = AvgTrueRange(ATRLength) * ATRs;
On the bar of entry for the position, profit target or 'ATRVal' is assigned to the Variable 'EntryATR'.This variable will be used to establish a constant profit target value, based on the entry price, for thatposition.
If BarsSinceEntry = 0 ThenEntryATR = ATRVal;
Long Exit
When the market position is Long, a Long Exit Limit order is placed at the profit target value — thesum of the entry price and the Average True Range calculation on the bar of entry. Notice that sincethis is a profit target exit, we are using a Limit order. The Limit order will place an order that may befilled at a specified price or higher.
If MarketPosition = 1 ThenExitLong ("2L") Next Bar at EntryPrice + EntryATR Limit;
Short Exit
When the market position is Short, a Short Exit Limit order is placed at the profit target value — thedifference between the entry price and the Average True Range calculation on the bar of entry. Noticethat since this is a profit target exit, we are using a Limit order. The Limit order will place an orderthat may be filled at a specified price or lower.
If MarketPosition = -1 ThenExitShort ("2S") Next Bar at EntryPrice - EntryATR Limit;
Additional Parameters
This next section of EasyLanguage utilizes the Functions 'ShowLongStop' and 'ShowShortStop' toplace text on the chart, which indicates where the profit target Exit price is located. The parameter isbasically the same calculation used for the Limit orders.
If LastBarOnChart Then Beginvalue1 = ShowLongStop(EntryPrice + EntryATR);value1 = ShowShortStop(EntryPrice - EntryATR);
End;
EasyLanguage Signal: ATR Protective Stop
** See Common Stops Appendix
28 Testing & Improving Omega Research System Trading and Development Club - Volume 10
Testing & Improving
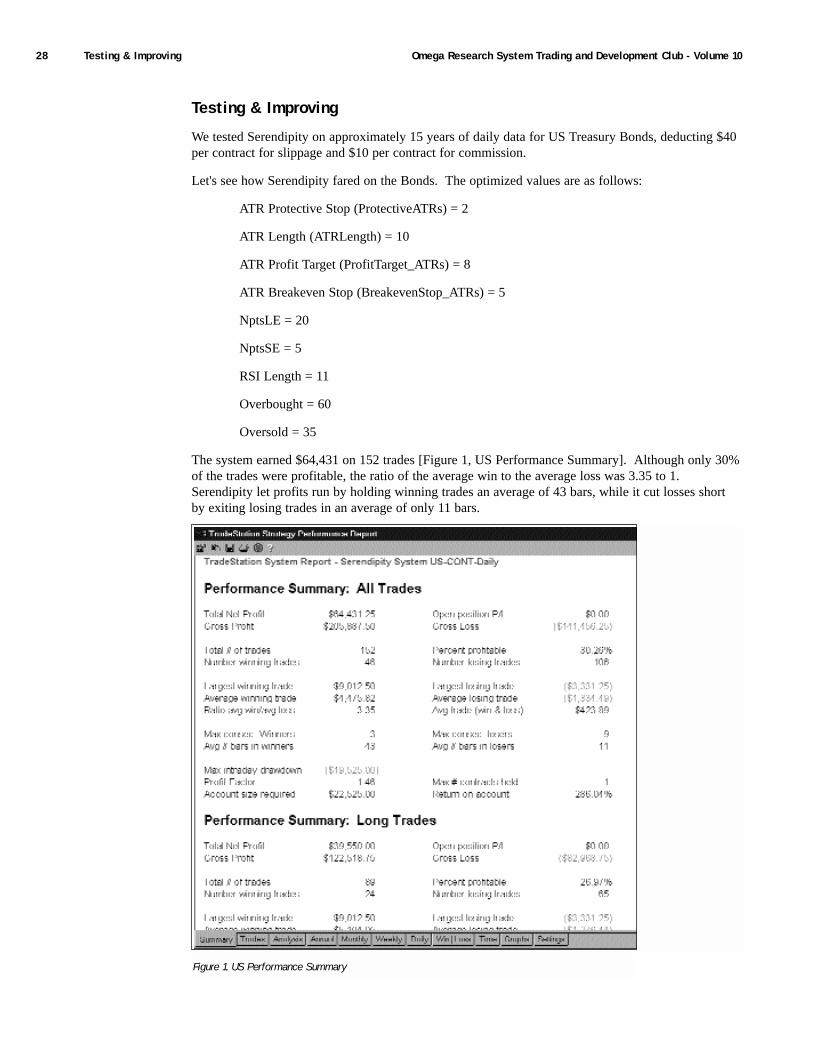
We tested Serendipity on approximately 15 years of daily data for US Treasury Bonds, deducting $40per contract for slippage and $10 per contract for commission.
Let's see how Serendipity fared on the Bonds. The optimized values are as follows:
ATR Protective Stop (ProtectiveATRs) = 2
ATR Length (ATRLength) = 10
ATR Profit Target (ProfitTarget_ATRs) = 8
ATR Breakeven Stop (BreakevenStop_ATRs) = 5
NptsLE = 20
NptsSE = 5
RSI Length = 11
Overbought = 60
Oversold = 35
The system earned $64,431 on 152 trades [Figure 1, US Performance Summary]. Although only 30%of the trades were profitable, the ratio of the average win to the average loss was 3.35 to 1.Serendipity let profits run by holding winning trades an average of 43 bars, while it cut losses shortby exiting losing trades in an average of only 11 bars.
Figure 1. US Performance Summary
Testing & Improving 29Chapter 3 Serendipity System
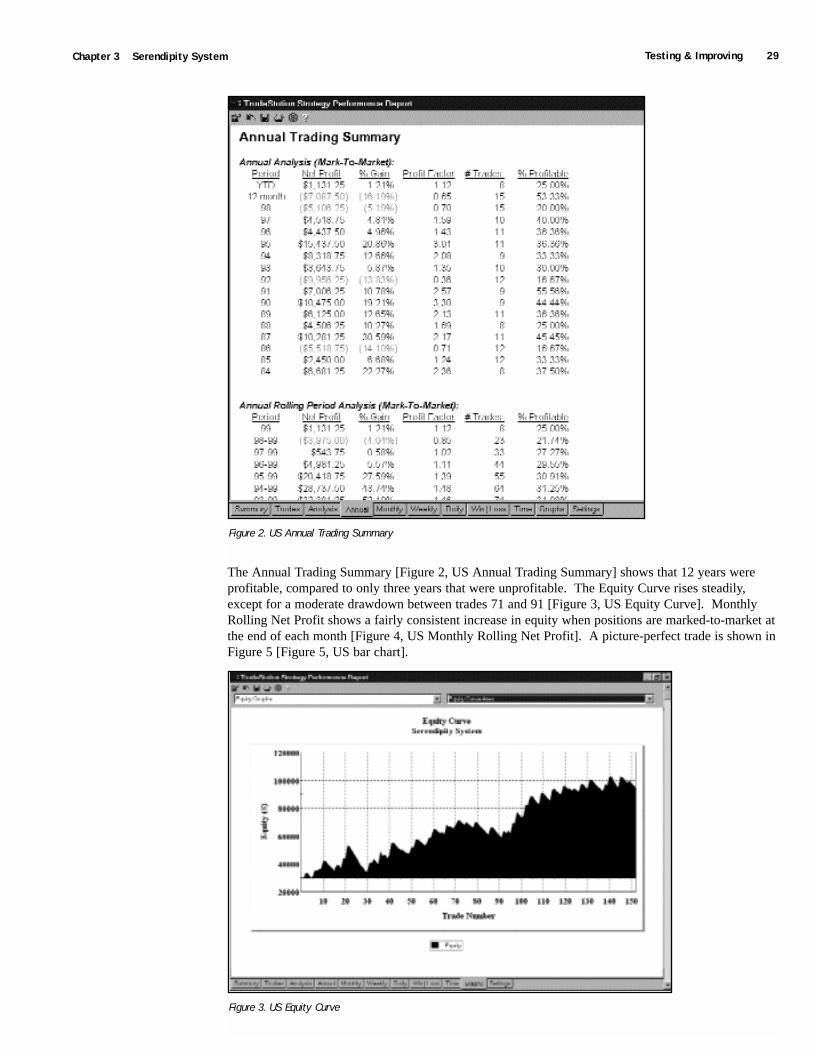
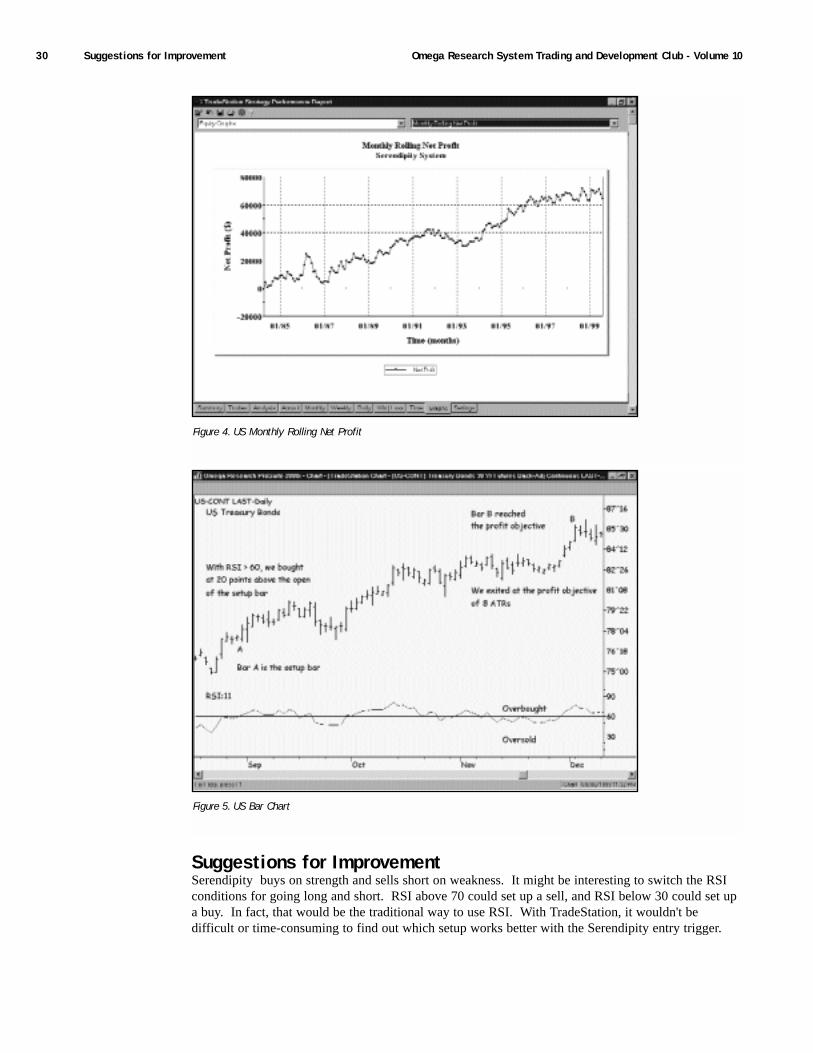
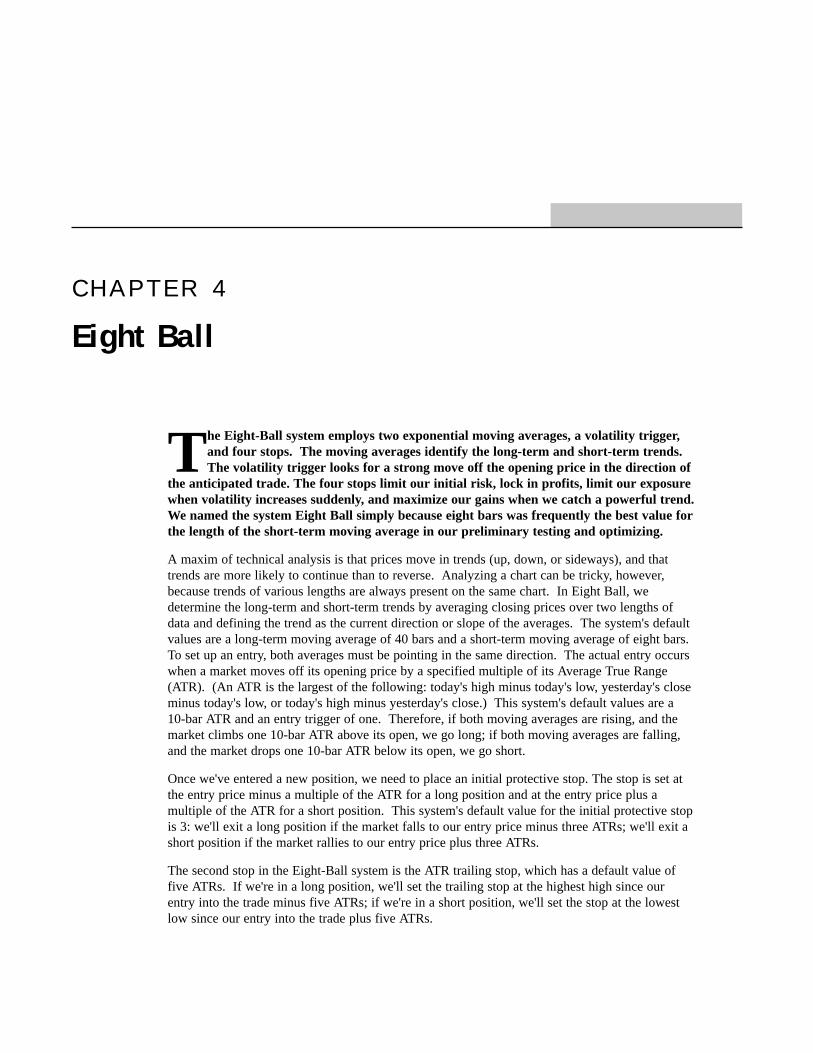
The Annual Trading Summary [Figure 2, US Annual Trading Summary] shows that 12 years wereprofitable, compared to only three years that were unprofitable. The Equity Curve rises steadily,except for a moderate drawdown between trades 71 and 91 [Figure 3, US Equity Curve]. MonthlyRolling Net Profit shows a fairly consistent increase in equity when positions are marked-to-market atthe end of each month [Figure 4, US Monthly Rolling Net Profit]. A picture-perfect trade is shown inFigure 5 [Figure 5, US bar chart].
Figure 2. US Annual Trading Summary
Figure 3. US Equity Curve
30 Suggestions for Improvement Omega Research System Trading and Development Club - Volume 10
Suggestions for ImprovementSerendipity buys on strength and sells short on weakness. It might be interesting to switch the RSIconditions for going long and short. RSI above 70 could set up a sell, and RSI below 30 could set upa buy. In fact, that would be the traditional way to use RSI. With TradeStation, it wouldn't bedifficult or time-consuming to find out which setup works better with the Serendipity entry trigger.
Figure 4. US Monthly Rolling Net Profit
Figure 5. US Bar Chart
C H A P T E R 4
Eight Ball
The Eight-Ball system employs two exponential moving averages, a volatility trigger,and four stops. The moving averages identify the long-term and short-term trends.The volatility trigger looks for a strong move off the opening price in the direction of
the anticipated trade. The four stops limit our initial risk, lock in profits, limit our exposurewhen volatility increases suddenly, and maximize our gains when we catch a powerful trend.We named the system Eight Ball simply because eight bars was frequently the best value forthe length of the short-term moving average in our preliminary testing and optimizing.
A maxim of technical analysis is that prices move in trends (up, down, or sideways), and thattrends are more likely to continue than to reverse. Analyzing a chart can be tricky, however,because trends of various lengths are always present on the same chart. In Eight Ball, wedetermine the long-term and short-term trends by averaging closing prices over two lengths ofdata and defining the trend as the current direction or slope of the averages. The system's defaultvalues are a long-term moving average of 40 bars and a short-term moving average of eight bars.To set up an entry, both averages must be pointing in the same direction. The actual entry occurswhen a market moves off its opening price by a specified multiple of its Average True Range(ATR). (An ATR is the largest of the following: today's high minus today's low, yesterday's closeminus today's low, or today's high minus yesterday's close.) This system's default values are a10-bar ATR and an entry trigger of one. Therefore, if both moving averages are rising, and themarket climbs one 10-bar ATR above its open, we go long; if both moving averages are falling,and the market drops one 10-bar ATR below its open, we go short.
Once we've entered a new position, we need to place an initial protective stop. The stop is set atthe entry price minus a multiple of the ATR for a long position and at the entry price plus amultiple of the ATR for a short position. This system's default value for the initial protective stopis 3: we'll exit a long position if the market falls to our entry price minus three ATRs; we'll exit ashort position if the market rallies to our entry price plus three ATRs.
The second stop in the Eight-Ball system is the ATR trailing stop, which has a default value offive ATRs. If we're in a long position, we'll set the trailing stop at the highest high since ourentry into the trade minus five ATRs; if we're in a short position, we'll set the stop at the lowestlow since our entry into the trade plus five ATRs.
32 Defining Our Trading Rules Omega Research System Trading and Development Club - Volume 10
The Eight-Ball system's third stop is a volatility stop with a default value of three. Our volatility stopis set at the previous day's closing price minus three ATRs for a long position and plus three ATRs fora short position. It's generally wise to exit a position when a market is moving against us withexpanding volatility. In this system, we define expanding volatility as a move three ATRs below theprevious day's close if we're long and three ATRs above the previous day's close if we're short.
The fourth stop in the Eight-Ball system is the "big profit" stop. When our open profits in a trade aregreater than or equal to a specified number of ATRs, we'll tighten our stop to make sure that we keepa larger than usual portion of the profits. The "big profit" default value in this system is 10 ATRs: ifwe're long, and the close is greater than or equal to our entry price plus 10 ATRs, we'll raise our stopto the four-bar low; if we're short, and the close is less than or equal to our entry price minus 10ATRs, we'll lower our stop to the four-bar high.
Defining Our Trading RulesFor the Eight-Ball system, we defined long and short entries and exits. We also calculated twoexponential moving averages and the Average True Range. The entries and exits are described next.
Long and Short Entries
a) If the long-term and short-term moving averages are both greater than on the previous bar, buy attomorrow's open plus the entry trigger.
b) If the long-term and short-term moving averages are both less than on the previous bar, sell short attomorrow's open minus the entry trigger.
Long and Short Exits
a) Exit a long position at the initial protective stop, the trailing stop, the volatility stop, or the big-profit stop.
b) Exit a short position at the initial protective stop, the trailing stop, the volatility stop, or the big-profit stop.
Designing & FormattingThis section presents the EasyLanguage instructions and formatting for the system, with theEasyLanguage instructions broken down and explained line by line.

Designing & Formatting 33Chapter 4 Eight Ball
EasyLanguage System Components: Eight Ball (STAD10: Eight Ball)
System Inputs (STAD10: Eight Ball)
Signal Components:
1. Eight Ball
2. ATR Big Profit Stop
3. ATR Protective Stop
4. ATR Trailing Stop
5. ATR Volatility Stop
EasyLanguage Signal: Eight Ball:
Inputs: Length1(40), Length2(8), Trigger(1); Variables: ATR(0), Avg1(0), Avg2(0);
ATR = AvgTrueRange(10);SlowAvg = XAverage(Close, Length1);FastAvg = XAverage(Close, Length2);
INPUT DEFAULT DESCRIPTIONVolatilityATRs 2 The number of Average True Ranges (ATR)
used in the Volatility StopATRLength 10 The number of bars used to calculate the
Average True Range (ATR)TrailingATRs 4 The number of Average True Ranges (ATR)
used as the Trailing StopProtectiveATRs 3 The number of Average True Ranges (ATR)
used as the protective stopBigProfitATRs 7 The number of Average True Ranges (ATR)
that indicate a "Big Profit"BigProfit_ExitBarLen 3 The number of bars used in the calculation of
the highest and lowest for the BigProfit exitSlowLen 40 The number of bars used to calculate the
Slow Exponential Moving AverageFastLen 8 The number of bars used to calculate the Fast
Exponential Moving AverageTrigger 1 The number of Average True Ranges
above/below the open of the next bar at which the order will be placed

34 Designing & Formatting Omega Research System Trading and Development Club - Volume 10
Condition1 = SlowAvg > SlowAvg[1] AND FastAvg < FastAvg[1];Condition2 = SlowAvg < SlowAvg[1] AND FastAvg > FastAvg[1];
{Long Entry}If Condition1 Then
Buy ("Long Entry") Next Bar at Open Tomorrow + Trigger * ATR Stop;{Short Entry}If Condition2 Then
Sell ("Short Entry") Next Bar at Open Tomorrow - Trigger * ATR Stop;
Signal Inputs (Eight Ball)
Signal Variables (Eight Ball)
Setup
In the first part of the setup, the most commonly used values are assigned to variables. These valuesinclude the Average True Range (ATR), as well as the Slow and Fast Moving Averages (Avg1 &Avg2).
ATR = AvgTrueRange(10);SlowAvg = XAverage(Close, Length1);FastAvg = XAverage(Close, Length2);
INPUT DEFAULT DESCRIPTIONSlowLen 40 The number of bars used to calculate the
Slow Exponential Moving AverageFastLen 8 The number of bars used to calculate the
Fast Exponential Moving AverageTrigger 1 The number of Average True Ranges
above/below the Open of the next bar at which th order will be placed
VARIABLE DEFAULT DESCRIPTIONATR 0 [Numeric] The calculation of the Average
True RangeSlowAvg 0 [Numeric] The value of the Slow
Moving AverageFastAvg 0 [True/False] The value of the
Fast Moving Average
Designing & Formatting 35Chapter 4 Eight Ball
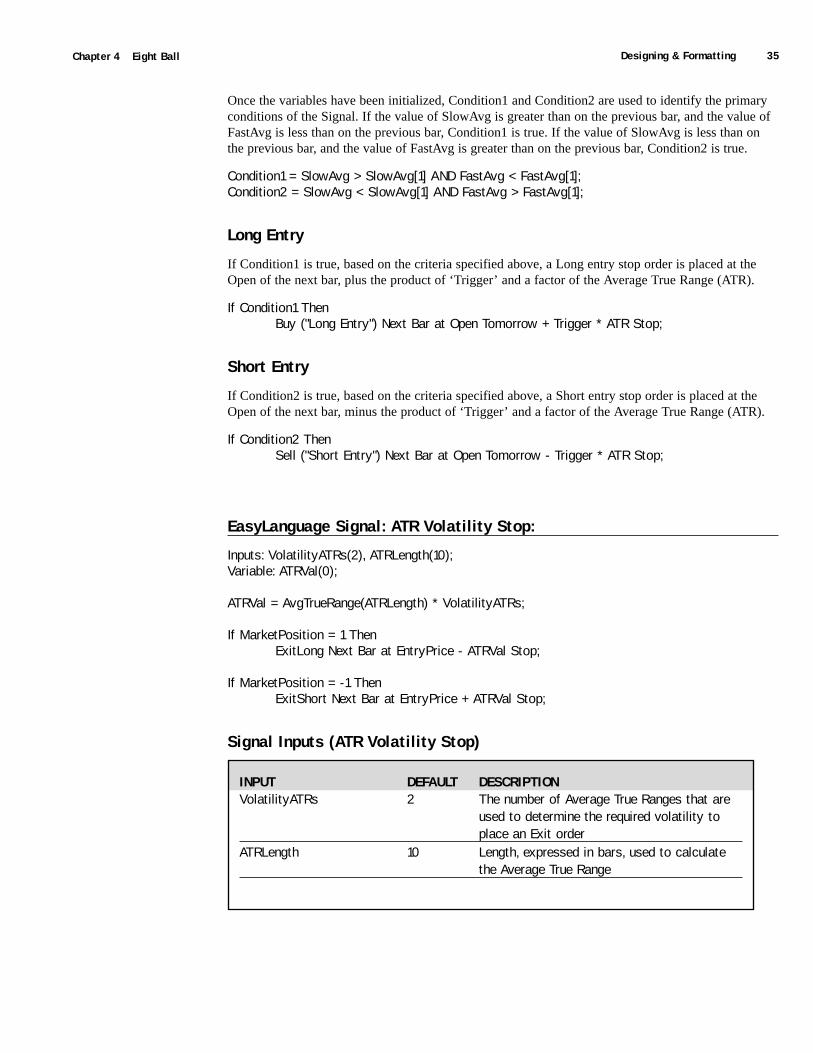
Once the variables have been initialized, Condition1 and Condition2 are used to identify the primaryconditions of the Signal. If the value of SlowAvg is greater than on the previous bar, and the value ofFastAvg is less than on the previous bar, Condition1 is true. If the value of SlowAvg is less than onthe previous bar, and the value of FastAvg is greater than on the previous bar, Condition2 is true.
Condition1 = SlowAvg > SlowAvg[1] AND FastAvg < FastAvg[1];Condition2 = SlowAvg < SlowAvg[1] AND FastAvg > FastAvg[1];
Long Entry
If Condition1 is true, based on the criteria specified above, a Long entry stop order is placed at theOpen of the next bar, plus the product of ‘Trigger’ and a factor of the Average True Range (ATR).
If Condition1 ThenBuy ("Long Entry") Next Bar at Open Tomorrow + Trigger * ATR Stop;
Short Entry
If Condition2 is true, based on the criteria specified above, a Short entry stop order is placed at theOpen of the next bar, minus the product of ‘Trigger’ and a factor of the Average True Range (ATR).
If Condition2 ThenSell ("Short Entry") Next Bar at Open Tomorrow - Trigger * ATR Stop;
EasyLanguage Signal: ATR Volatility Stop:
Inputs: VolatilityATRs(2), ATRLength(10);Variable: ATRVal(0);
ATRVal = AvgTrueRange(ATRLength) * VolatilityATRs;
If MarketPosition = 1 ThenExitLong Next Bar at EntryPrice - ATRVal Stop;
If MarketPosition = -1 ThenExitShort Next Bar at EntryPrice + ATRVal Stop;
Signal Inputs (ATR Volatility Stop)
INPUT DEFAULT DESCRIPTIONVolatilityATRs 2 The number of Average True Ranges that are
used to determine the required volatility to place an Exit order
ATRLength 10 Length, expressed in bars, used to calculate the Average True Range
36 Designing & Formatting Omega Research System Trading and Development Club - Volume 10
Signal Variables (ATR Volatility Stop)
Setup
In the setup portion of this signal, the Average True Range is calculated and multiplied by the numberof VolatilityATRs specified in the Inputs.
ATRVal = AvgTrueRange(ATRLength) * VolatilityATRs;
Long Exit
When the market position is Long, a Long Exit is placed at the entry price minus the VolatilityAverage True Range calculation (ATRVal)
If MarketPosition = 1 ThenExitLong Next Bar at EntryPrice - ATRVal Stop;
Short Exit
When the market position is Short, a Short Exit is placed at the entry price plus the Volatility AverageTrue Range calculation (ATRVal).
If MarketPosition = -1 ThenExitShort Next Bar at EntryPrice + ATRVal Stop;
EasyLanguage Signal: ATR Big Profit Stop
** See Common Stops Appendix
EasyLanguage Signal: ATR Trailing Stop
** See Common Stops Appendix
EasyLanguage Signal: ATR Protective Stop
** See Common Stops Appendix
VARIABLE DEFAULT DESCRIPTIONATRVal 0 [Numeric] Holds the value of the Average True
Range multiplied by the number ofVolatility ATRs
Testing & Improving 37Chapter 4 Eight Ball
Testing & ImprovingWe tested the Eight-Ball system on approximately 15 years of daily data for IBM, Bonds, and theSwiss Franc. On IBM, we tested the long side only and deducted $.10 per share for slippage and $.05per share for commission. On Bonds and the Swiss Franc, we tested both the long and short sides,deducting $40 per contract for slippage and $10 per contract for commission.
Here are the optimized values for IBM:
Volatility Stop (VolatilityATRs) = 2
ATR Length (ATRLength) = 10
ATR Trailing Stop (TrailingATRs) = 4
Initial Protective Stop (ProtectiveATRs) = 2
Big Profit Stop (BigProfitATRs) = 10
N bar Stop (BigProfit_ExitBarLen) = 3
Moving Average Slow (SlowLen) = 30
Moving Average Fast (FastLen) = 10
Volatility Trigger (Trigger) = 1.5
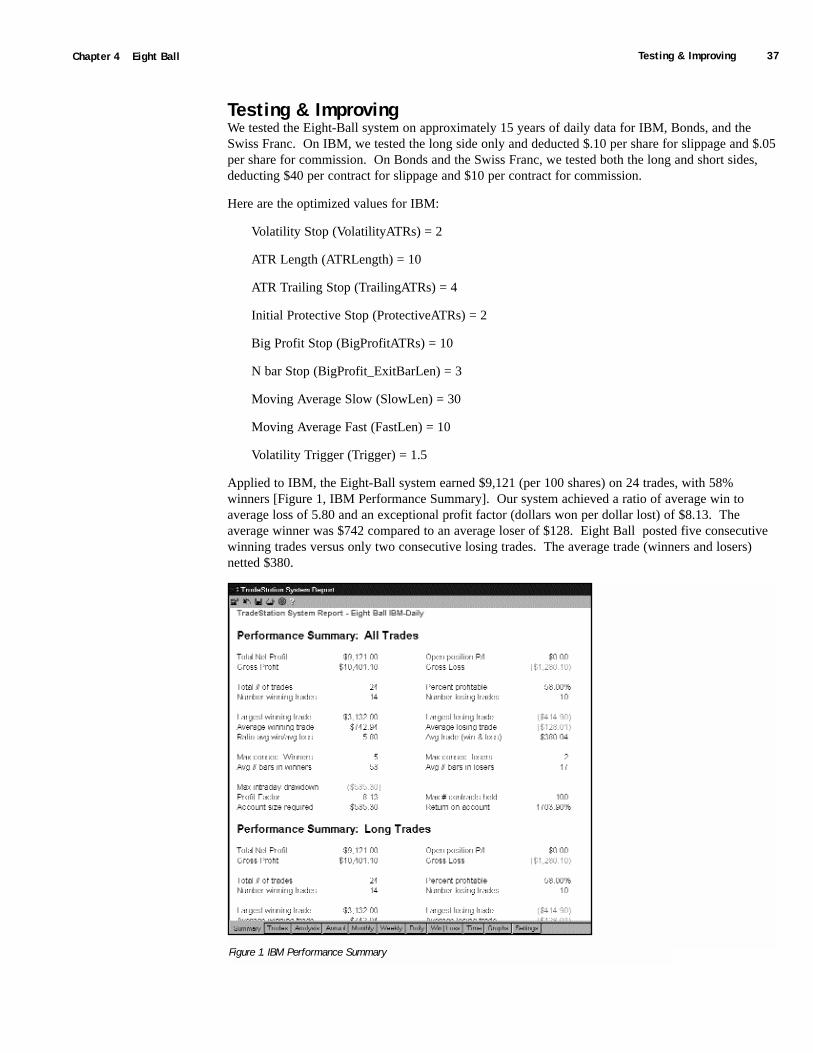
Applied to IBM, the Eight-Ball system earned $9,121 (per 100 shares) on 24 trades, with 58%winners [Figure 1, IBM Performance Summary]. Our system achieved a ratio of average win toaverage loss of 5.80 and an exceptional profit factor (dollars won per dollar lost) of $8.13. Theaverage winner was $742 compared to an average loser of $128. Eight Ball posted five consecutivewinning trades versus only two consecutive losing trades. The average trade (winners and losers)netted $380.
Figure 1. IBM Performance Summary
38 Testing & Improving Omega Research System Trading and Development Club - Volume 10
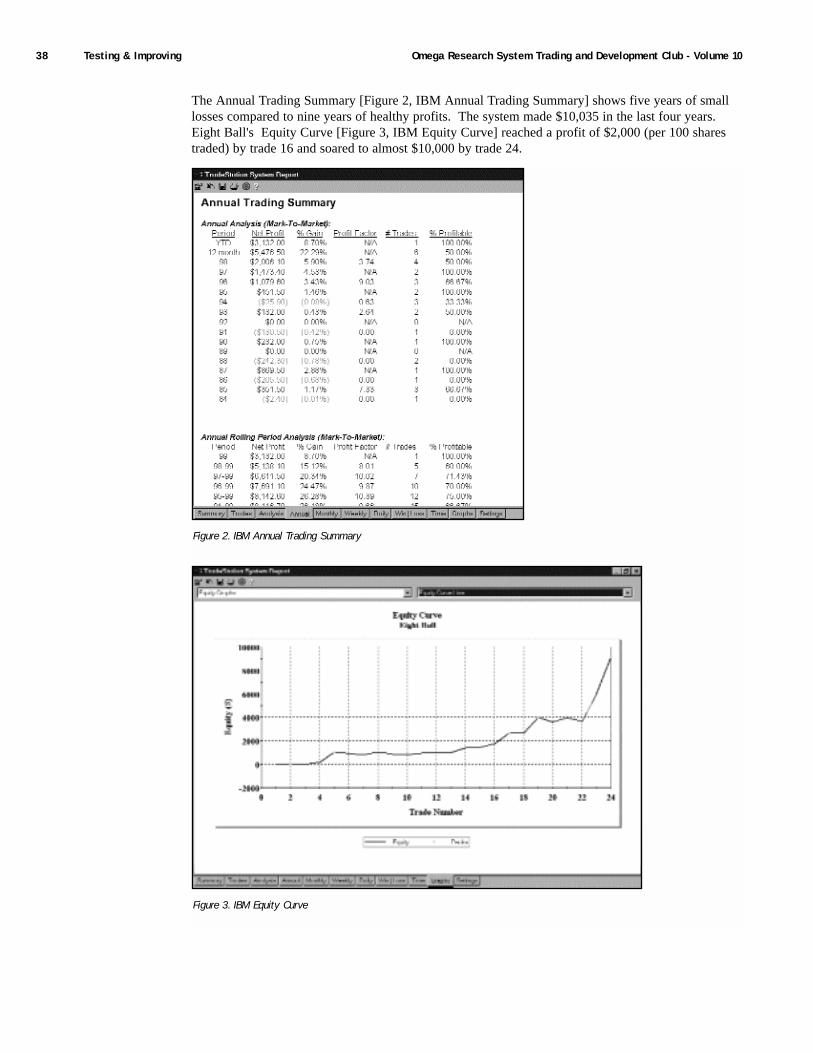
The Annual Trading Summary [Figure 2, IBM Annual Trading Summary] shows five years of smalllosses compared to nine years of healthy profits. The system made $10,035 in the last four years.Eight Ball's Equity Curve [Figure 3, IBM Equity Curve] reached a profit of $2,000 (per 100 sharestraded) by trade 16 and soared to almost $10,000 by trade 24.
Figure 2. IBM Annual Trading Summary
Figure 3. IBM Equity Curve
Testing & Improving 39Chapter 4 Eight Ball
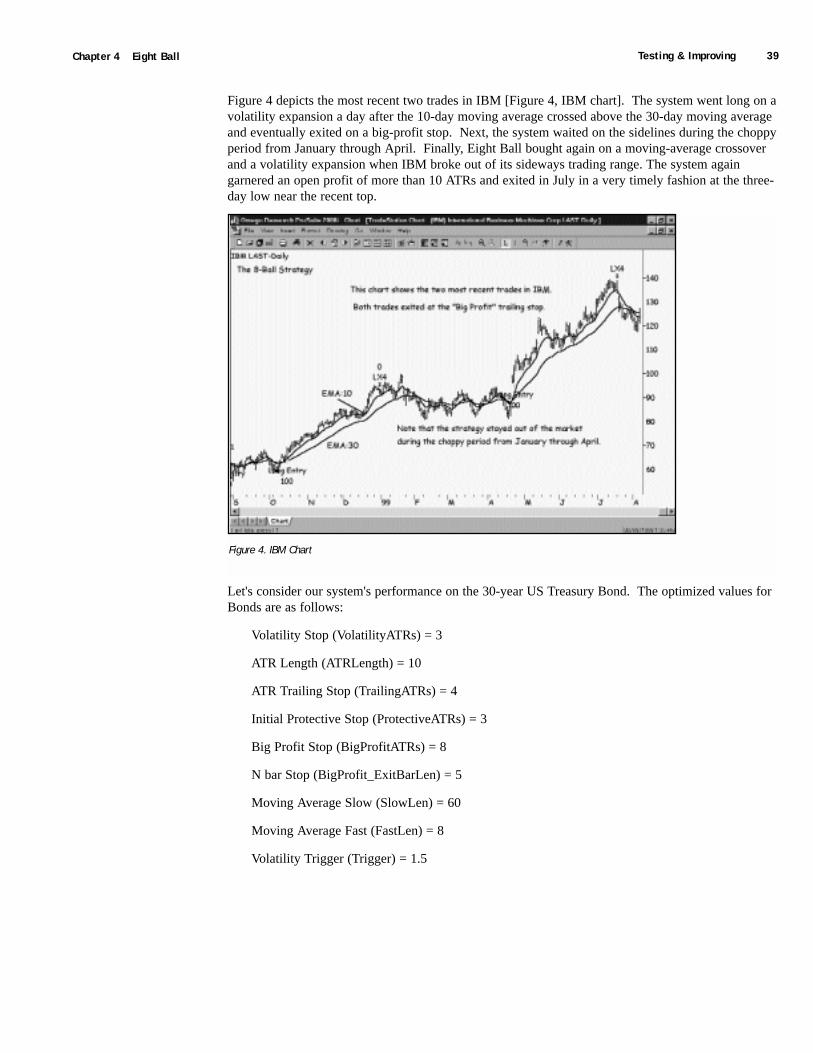
Figure 4 depicts the most recent two trades in IBM [Figure 4, IBM chart]. The system went long on avolatility expansion a day after the 10-day moving average crossed above the 30-day moving averageand eventually exited on a big-profit stop. Next, the system waited on the sidelines during the choppyperiod from January through April. Finally, Eight Ball bought again on a moving-average crossoverand a volatility expansion when IBM broke out of its sideways trading range. The system againgarnered an open profit of more than 10 ATRs and exited in July in a very timely fashion at the three-day low near the recent top.
Let's consider our system's performance on the 30-year US Treasury Bond. The optimized values forBonds are as follows:
Volatility Stop (VolatilityATRs) = 3
ATR Length (ATRLength) = 10
ATR Trailing Stop (TrailingATRs) = 4
Initial Protective Stop (ProtectiveATRs) = 3
Big Profit Stop (BigProfitATRs) = 8
N bar Stop (BigProfit_ExitBarLen) = 5
Moving Average Slow (SlowLen) = 60
Moving Average Fast (FastLen) = 8
Volatility Trigger (Trigger) = 1.5
Figure 4. IBM Chart
40 Testing & Improving Omega Research System Trading and Development Club - Volume 10
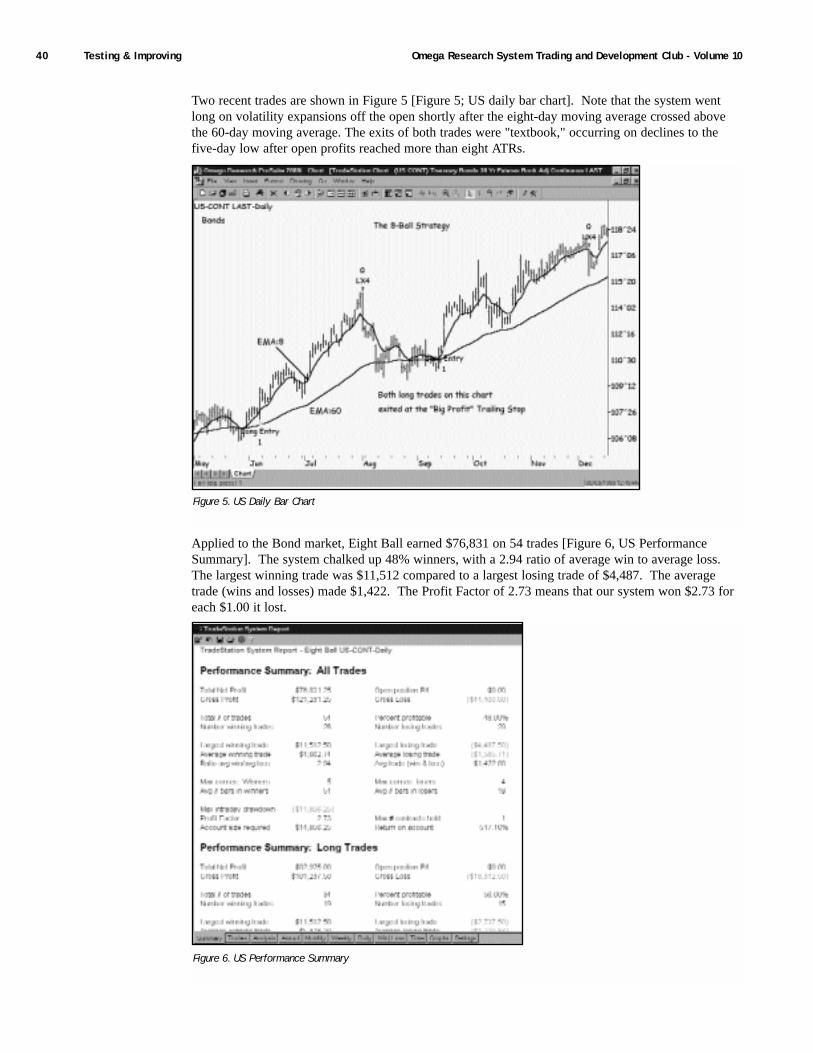
Two recent trades are shown in Figure 5 [Figure 5; US daily bar chart]. Note that the system wentlong on volatility expansions off the open shortly after the eight-day moving average crossed abovethe 60-day moving average. The exits of both trades were "textbook," occurring on declines to thefive-day low after open profits reached more than eight ATRs.
Applied to the Bond market, Eight Ball earned $76,831 on 54 trades [Figure 6, US PerformanceSummary]. The system chalked up 48% winners, with a 2.94 ratio of average win to average loss.The largest winning trade was $11,512 compared to a largest losing trade of $4,487. The averagetrade (wins and losses) made $1,422. The Profit Factor of 2.73 means that our system won $2.73 foreach $1.00 it lost.
Figure 5. US Daily Bar Chart
Figure 6. US Performance Summary

Testing & Improving 41Chapter 4 Eight Ball
The TradeStation System Report [Figure 7, System Report] presents several items of interest. EightBall's Sharpe Ratio, a standard measure of consistency of monthly returns compared to risk, was .24-very close to the desired rating of .25. The K- Ratio (which is similar to the Sharpe Ratio, but whichuses linear regression to evaluate a system's consistency of returns over time) came in at 3.68, muchbetter than the recommended reference point of 2.50. Two widely used reward-to-risk ratios alsoposted excellent results when Eight Ball was applied to the Bond market: Net Profit / Largest Losswas 17.12, and Net Profit / Maximum Drawdown was 17.31. The reference points for goodperformance in these ratios are 7 and 5, respectively.
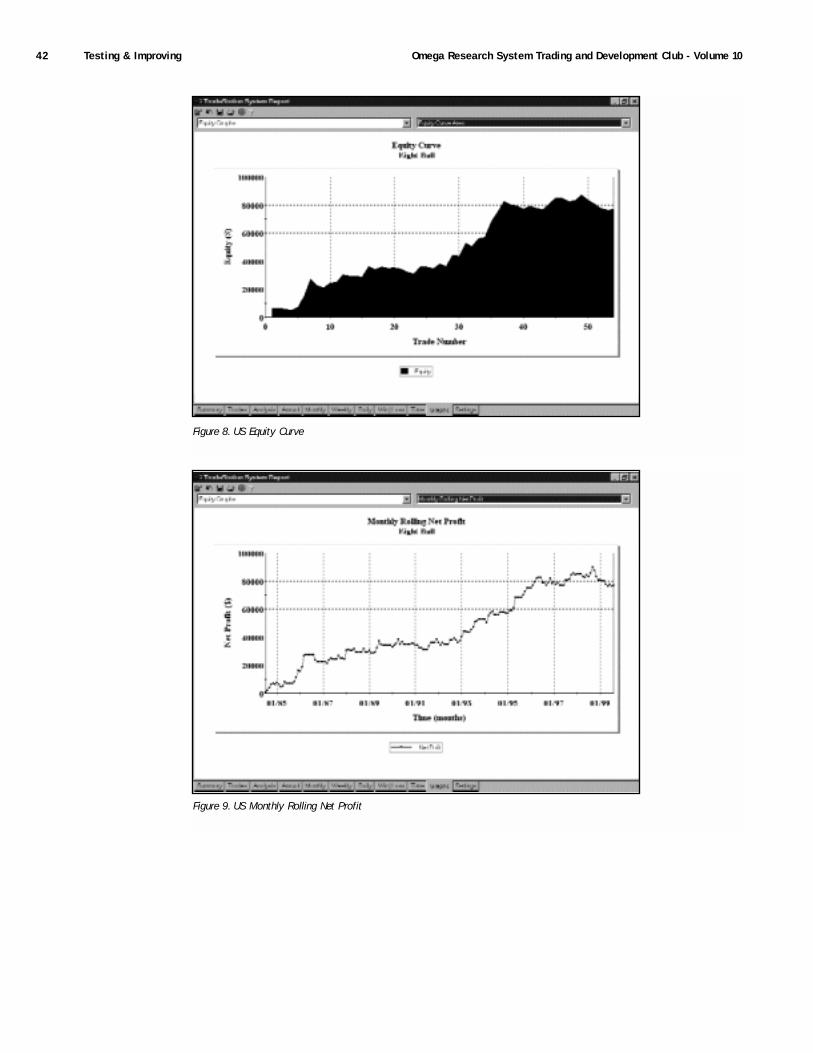
The system's Equity Curve represents fairly steady growth through trade 38 and a period of levelingoff since then to trade 54 [Figure 8, US Equity Curve]. The graph of Monthly Rolling Net Profitshows how the equity curve would look if trades were closed out at the end of each month [Figure 9,US Monthly Rolling Net Profit], and a snapshot was taken of the trading account. In other words, theaccount is "marked-to-market" on the last trading day of each month, and the end-of-month equity isposted to the graph.
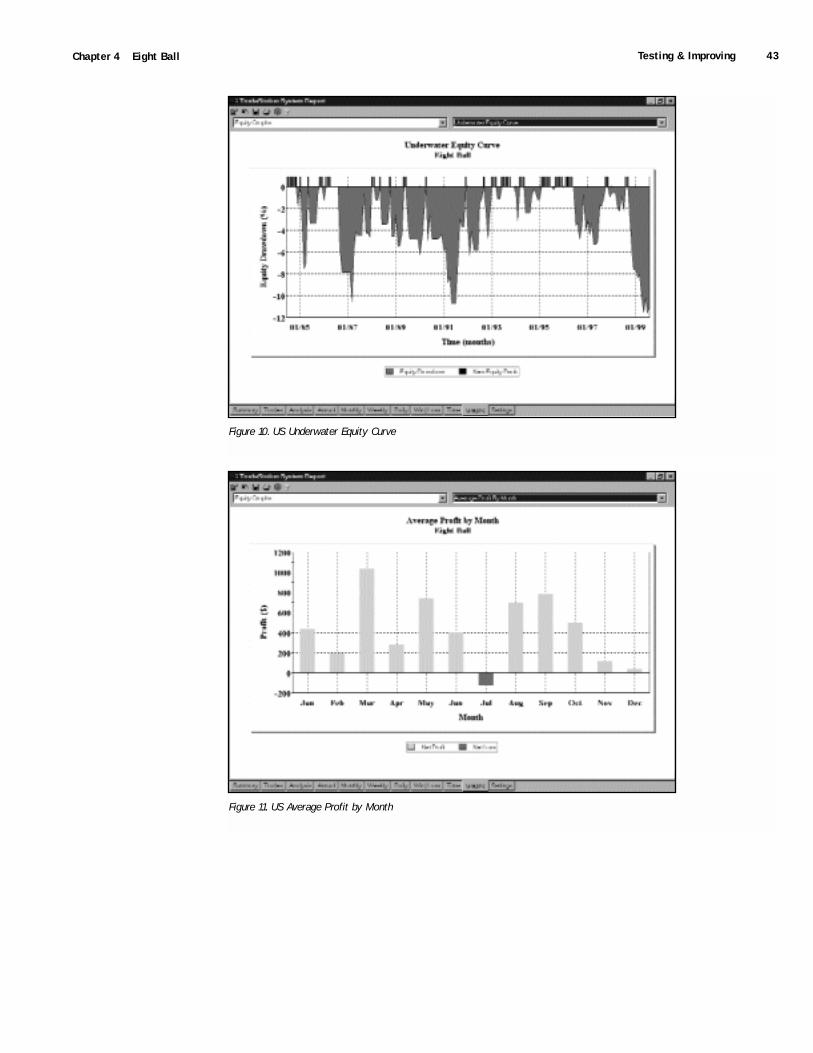
The Underwater Equity Curve [Figure 10, US Underwater Equity Curve] actually looks fairly goodwhen you consider that it was designed to paint a very negative picture of performance. The newequity highs (the short, vertical bars rising above the 0 line) obviously are not drawn to scale, but theareas of drawdown between the equity peaks are drawn very large. In reality, there were only threedrawdowns greater than 10 percent in the 15-year test period, with a largest drawdown of only 11 3/4percent.
The Average Profit by Month graph for the Eight-Ball system applied to Bonds is just about as goodas can be, with 11 winning months and only one small losing month when monthly returns areaveraged over the test period [Figure 11, US Average Profit by Month].
Figure 7. System Report
42 Testing & Improving Omega Research System Trading and Development Club - Volume 10
Figure 8. US Equity Curve
Figure 9. US Monthly Rolling Net Profit
Testing & Improving 43Chapter 4 Eight Ball
Figure 10. US Underwater Equity Curve
Figure 11. US Average Profit by Month
44 Testing & Improving Omega Research System Trading and Development Club - Volume 10
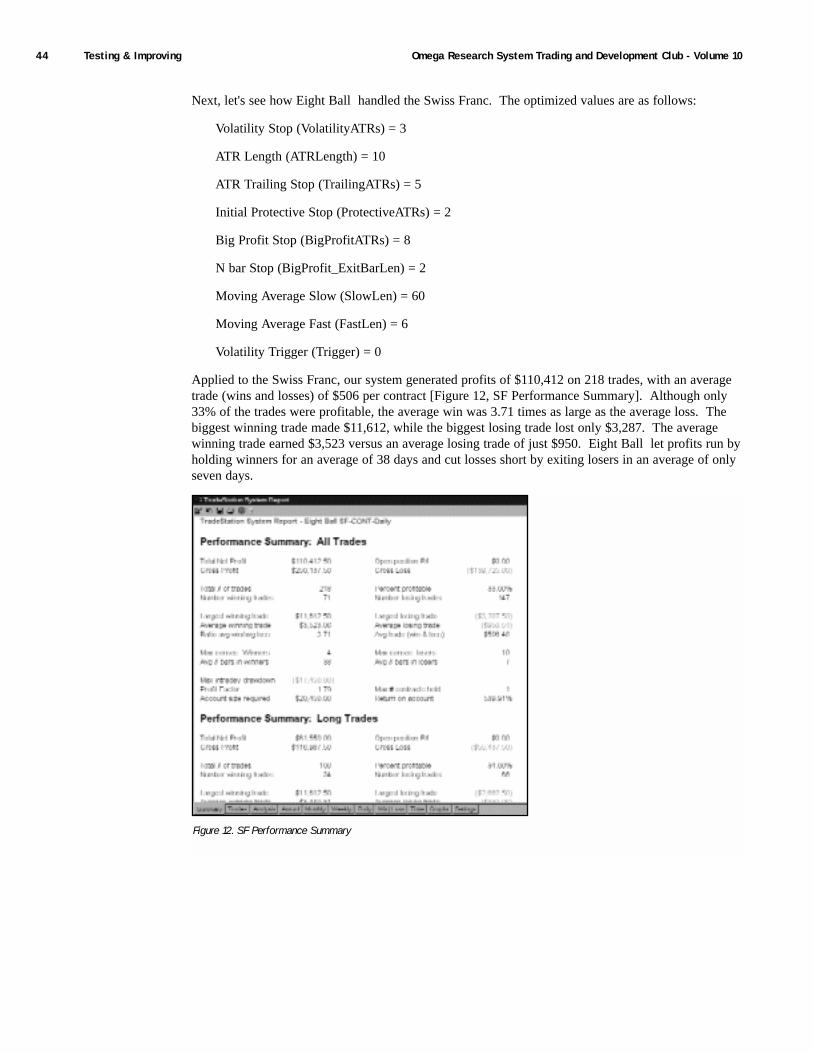
Next, let's see how Eight Ball handled the Swiss Franc. The optimized values are as follows:
Volatility Stop (VolatilityATRs) = 3
ATR Length (ATRLength) = 10
ATR Trailing Stop (TrailingATRs) = 5
Initial Protective Stop (ProtectiveATRs) = 2
Big Profit Stop (BigProfitATRs) = 8
N bar Stop (BigProfit_ExitBarLen) = 2
Moving Average Slow (SlowLen) = 60
Moving Average Fast (FastLen) = 6
Volatility Trigger (Trigger) = 0
Applied to the Swiss Franc, our system generated profits of $110,412 on 218 trades, with an averagetrade (wins and losses) of $506 per contract [Figure 12, SF Performance Summary]. Although only33% of the trades were profitable, the average win was 3.71 times as large as the average loss. Thebiggest winning trade made $11,612, while the biggest losing trade lost only $3,287. The averagewinning trade earned $3,523 versus an average losing trade of just $950. Eight Ball let profits run byholding winners for an average of 38 days and cut losses short by exiting losers in an average of onlyseven days.
Figure 12. SF Performance Summary
Testing & Improving 45Chapter 4 Eight Ball
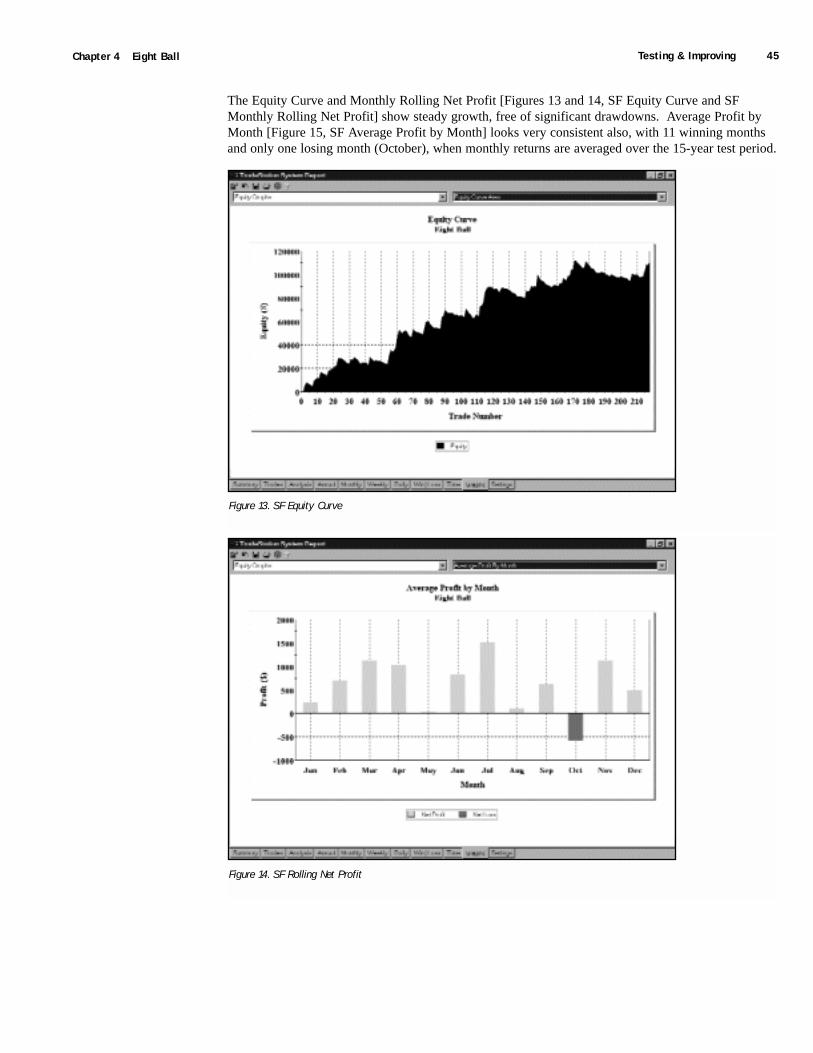
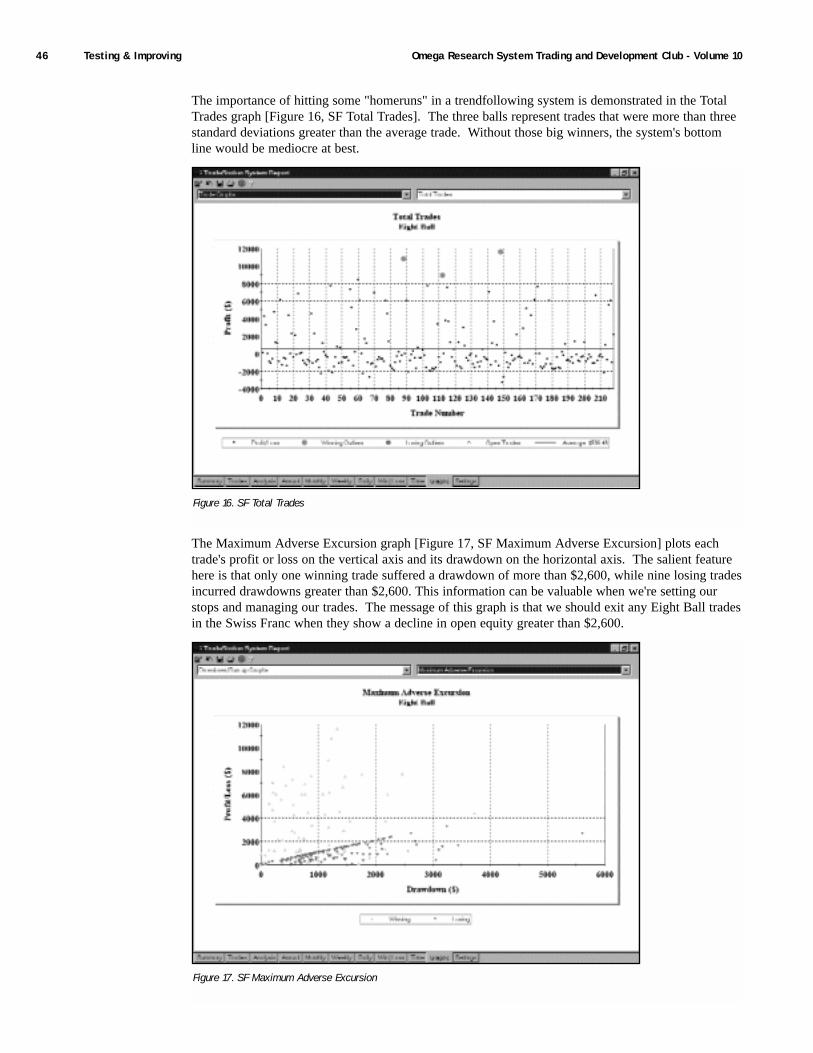
The Equity Curve and Monthly Rolling Net Profit [Figures 13 and 14, SF Equity Curve and SFMonthly Rolling Net Profit] show steady growth, free of significant drawdowns. Average Profit byMonth [Figure 15, SF Average Profit by Month] looks very consistent also, with 11 winning monthsand only one losing month (October), when monthly returns are averaged over the 15-year test period.
Figure 13. SF Equity Curve
Figure 14. SF Rolling Net Profit
46 Testing & Improving Omega Research System Trading and Development Club - Volume 10
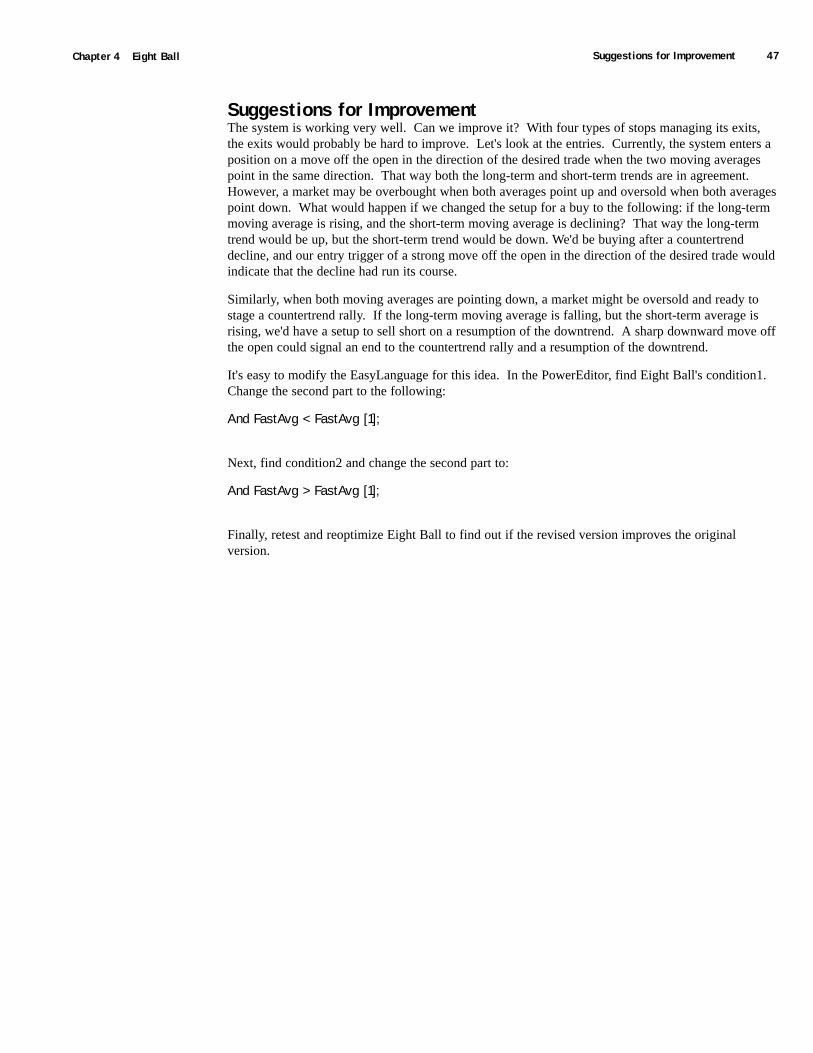
The importance of hitting some "homeruns" in a trendfollowing system is demonstrated in the TotalTrades graph [Figure 16, SF Total Trades]. The three balls represent trades that were more than threestandard deviations greater than the average trade. Without those big winners, the system's bottomline would be mediocre at best.
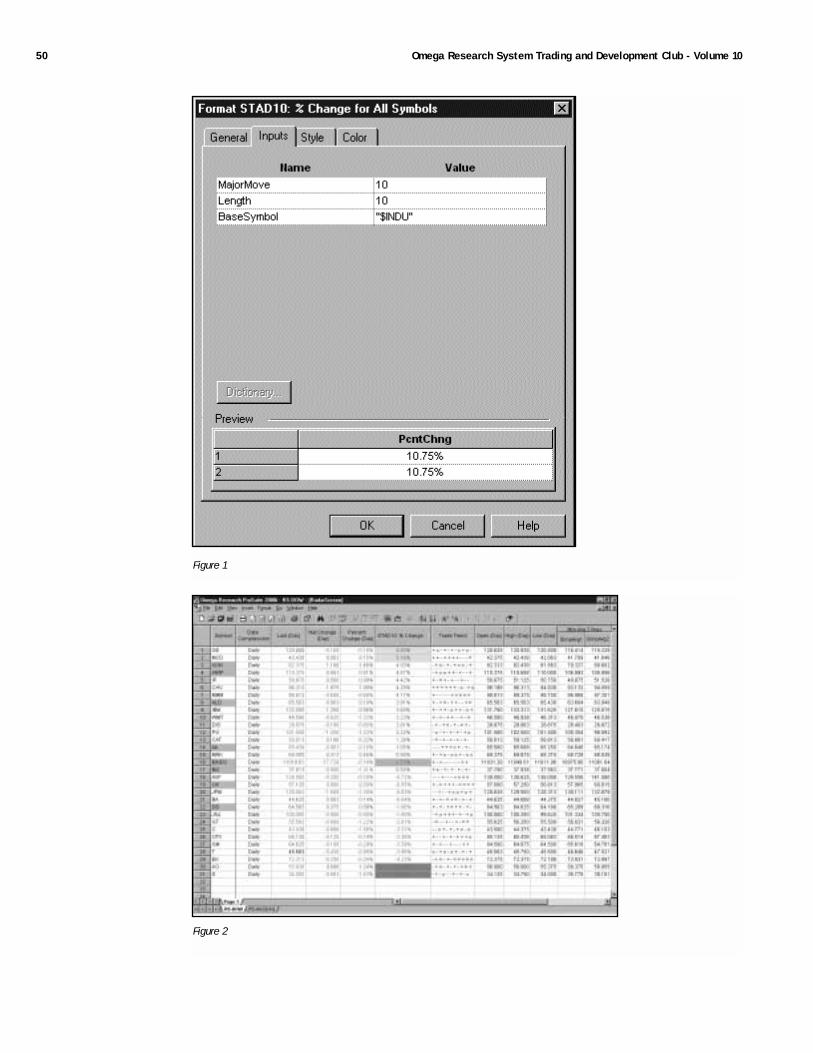
The Maximum Adverse Excursion graph [Figure 17, SF Maximum Adverse Excursion] plots eachtrade's profit or loss on the vertical axis and its drawdown on the horizontal axis. The salient featurehere is that only one winning trade suffered a drawdown of more than $2,600, while nine losing tradesincurred drawdowns greater than $2,600. This information can be valuable when we're setting ourstops and managing our trades. The message of this graph is that we should exit any Eight Ball tradesin the Swiss Franc when they show a decline in open equity greater than $2,600.
Figure 16. SF Total Trades
Figure 17. SF Maximum Adverse Excursion
Suggestions for Improvement 47Chapter 4 Eight Ball
Suggestions for ImprovementThe system is working very well. Can we improve it? With four types of stops managing its exits,the exits would probably be hard to improve. Let's look at the entries. Currently, the system enters aposition on a move off the open in the direction of the desired trade when the two moving averagespoint in the same direction. That way both the long-term and short-term trends are in agreement.However, a market may be overbought when both averages point up and oversold when both averagespoint down. What would happen if we changed the setup for a buy to the following: if the long-termmoving average is rising, and the short-term moving average is declining? That way the long-termtrend would be up, but the short-term trend would be down. We'd be buying after a countertrenddecline, and our entry trigger of a strong move off the open in the direction of the desired trade wouldindicate that the decline had run its course.
Similarly, when both moving averages are pointing down, a market might be oversold and ready tostage a countertrend rally. If the long-term moving average is falling, but the short-term average isrising, we'd have a setup to sell short on a resumption of the downtrend. A sharp downward move offthe open could signal an end to the countertrend rally and a resumption of the downtrend.
It's easy to modify the EasyLanguage for this idea. In the PowerEditor, find Eight Ball's condition1.Change the second part to the following:
And FastAvg < FastAvg [1];
Next, find condition2 and change the second part to:
And FastAvg > FastAvg [1];
Finally, retest and reoptimize Eight Ball to find out if the revised version improves the originalversion.

48 Omega Research System Trading and Development Club - Volume 10

C H A P T E R 5
Measuring & Comparing Performance inRadarScreen 2000iBy Gaston Sanchez
RadarScreen was designed to answer the question "What to Buy and Sell?" Thereare many ways, using many Indicators, that this question can be answered. In thischapter, I will be showing you a unique approach to setting up and sorting your
RadarScreen window to show you those stocks that are out-performing, as well as under-performing, a particular market index.
In this chapter I have taken advantage of RadarScreen's unique ability to create and sort based oncustom analysis techniques developed an excellent tool for benchmarking the performance of alist of stocks to a market index. Very simply put, the Indicator just calculates the Percent Changebased on a user-defined length. Even though the idea is simple, strength of this technique is reallybrought out by RadarScreen. Using the sorting capabilities in RadarScreen, my entire list ofstocks is sorted in such a way so as to show me those stocks that are over/under performing theselected market index. In addition, it also displays for me which are over/under performing themarket by a specific amount. This allows me to easily recognize which are the strongest stocks inmy window, relative to the selected market index. Basically a very valuable tool for determiningwhat I might want to Buy or Sell. This tool has shown such promise that it is likely that you maysee it added to the default work area at some point in the future.
We begin with a very simple example, say using the Dow 30 stocks. All 30 stocks can be easilyloaded into our RadarScreen window using the built-in symbol list. We will also load the DowJones Industrial Average ($INDU - the symbology may vary between feeds). The DJIA is whatwe will call the 'BaseSymbol'. The 'BaseSymbol' is a symbol that will serve as a benchmark forall the other symbols in our list. The next step is to apply the STAD10: % Change Indicator toyour RadarScreen window. When applying the Indicator, it is very important that you enter theappropriate symbol for the DJIA in quotes for the 'BaseSymbol' Input [Figure 1]. Once you haveapplied the Indicator to your chart, you can then double-click the column heading to sort the list.Once the list is sorted, you will notice that the DJIA or the 'BaseSymbol' is highlighted in yellow.Those stocks that are outperforming the DJIA for the period specified will appear above the cellhighlighted in yellow, and those that are under-performing the DJIA for the period specified willappear below the cell highlighted in yellow cell in the column. Any symbols that have aparticularly strong percent change, either positive or negative (as indicated by the MajorMoveInput) will be highlighted with a different color [Figure 2].
50 Omega Research System Trading and Development Club - Volume 10
Figure 1
Figure 2
EasyLanguage Indicator 51Chapter 5 Measuring & Comparing Performance in RadarScreen 2000i
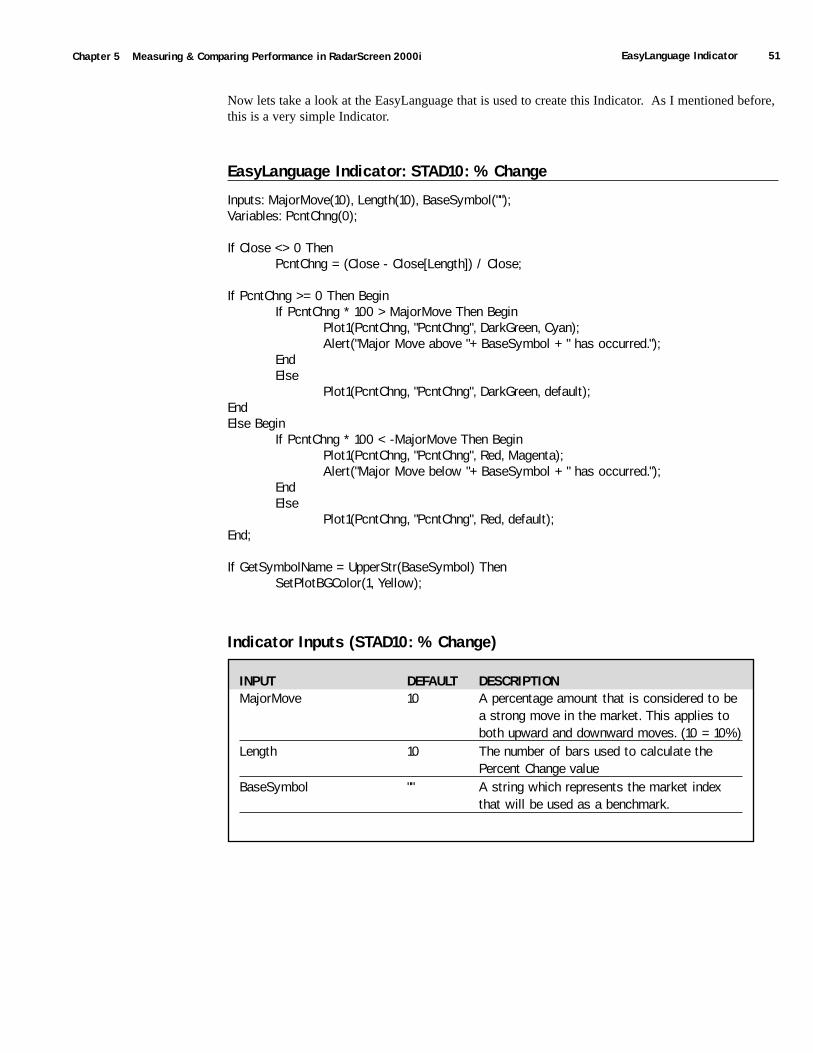
Now lets take a look at the EasyLanguage that is used to create this Indicator. As I mentioned before,this is a very simple Indicator.
EasyLanguage Indicator: STAD10: % Change
Inputs: MajorMove(10), Length(10), BaseSymbol("");Variables: PcntChng(0);
If Close <> 0 ThenPcntChng = (Close - Close[Length]) / Close;
If PcntChng >= 0 Then BeginIf PcntChng * 100 > MajorMove Then Begin
Plot1(PcntChng, "PcntChng", DarkGreen, Cyan);Alert("Major Move above "+ BaseSymbol + " has occurred.");
EndElse
Plot1(PcntChng, "PcntChng", DarkGreen, default);EndElse Begin
If PcntChng * 100 < -MajorMove Then BeginPlot1(PcntChng, "PcntChng", Red, Magenta);Alert("Major Move below "+ BaseSymbol + " has occurred.");
EndElse
Plot1(PcntChng, "PcntChng", Red, default);End;
If GetSymbolName = UpperStr(BaseSymbol) ThenSetPlotBGColor(1, Yellow);
Indicator Inputs (STAD10: % Change)
INPUT DEFAULT DESCRIPTIONMajorMove 10 A percentage amount that is considered to be
a strong move in the market. This applies to both upward and downward moves. (10 = 10%)
Length 10 The number of bars used to calculate the Percent Change value
BaseSymbol "" A string which represents the market index that will be used as a benchmark.
52 EasyLanguage Indicator Omega Research System Trading and Development Club - Volume 10
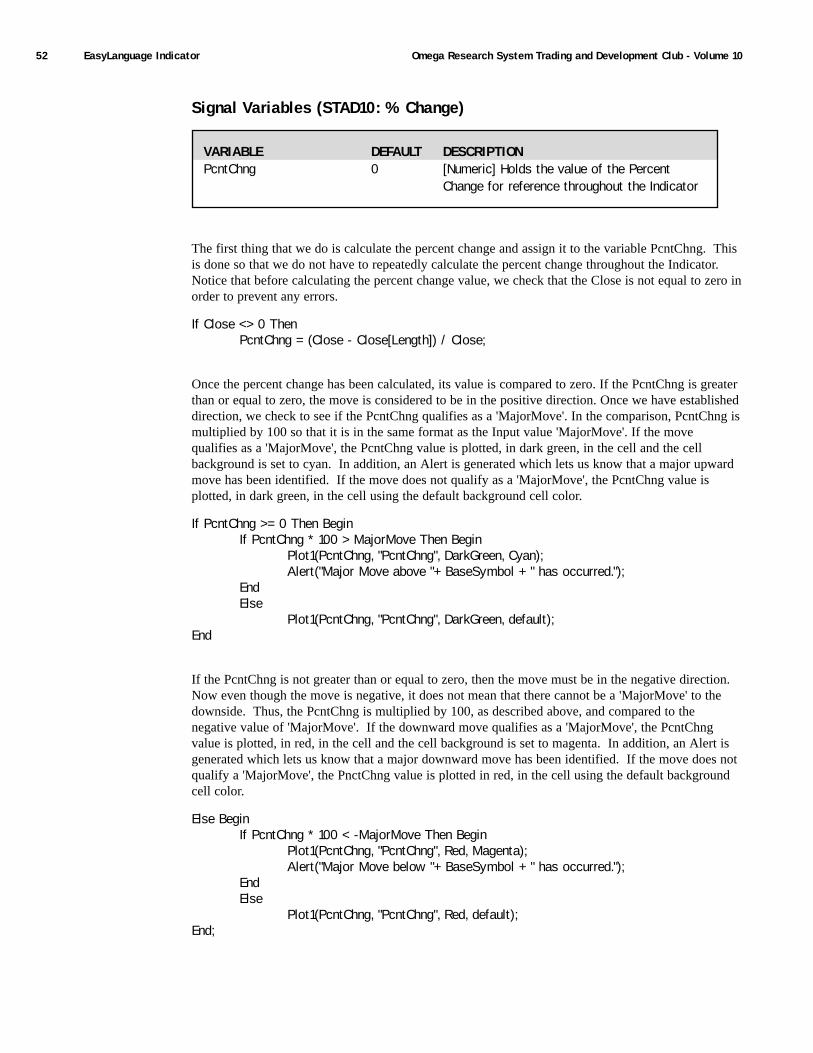
Signal Variables (STAD10: % Change)
The first thing that we do is calculate the percent change and assign it to the variable PcntChng. Thisis done so that we do not have to repeatedly calculate the percent change throughout the Indicator.Notice that before calculating the percent change value, we check that the Close is not equal to zero inorder to prevent any errors.
If Close <> 0 ThenPcntChng = (Close - Close[Length]) / Close;
Once the percent change has been calculated, its value is compared to zero. If the PcntChng is greaterthan or equal to zero, the move is considered to be in the positive direction. Once we have establisheddirection, we check to see if the PcntChng qualifies as a 'MajorMove'. In the comparison, PcntChng ismultiplied by 100 so that it is in the same format as the Input value 'MajorMove'. If the movequalifies as a 'MajorMove', the PcntChng value is plotted, in dark green, in the cell and the cellbackground is set to cyan. In addition, an Alert is generated which lets us know that a major upwardmove has been identified. If the move does not qualify as a 'MajorMove', the PcntChng value isplotted, in dark green, in the cell using the default background cell color.
If PcntChng >= 0 Then BeginIf PcntChng * 100 > MajorMove Then Begin
Plot1(PcntChng, "PcntChng", DarkGreen, Cyan);Alert("Major Move above "+ BaseSymbol + " has occurred.");
EndElse
Plot1(PcntChng, "PcntChng", DarkGreen, default);End
If the PcntChng is not greater than or equal to zero, then the move must be in the negative direction.Now even though the move is negative, it does not mean that there cannot be a 'MajorMove' to thedownside. Thus, the PcntChng is multiplied by 100, as described above, and compared to thenegative value of 'MajorMove'. If the downward move qualifies as a 'MajorMove', the PcntChngvalue is plotted, in red, in the cell and the cell background is set to magenta. In addition, an Alert isgenerated which lets us know that a major downward move has been identified. If the move does notqualify a 'MajorMove', the PnctChng value is plotted in red, in the cell using the default backgroundcell color.
Else BeginIf PcntChng * 100 < -MajorMove Then Begin
Plot1(PcntChng, "PcntChng", Red, Magenta);Alert("Major Move below "+ BaseSymbol + " has occurred.");
EndElse
Plot1(PcntChng, "PcntChng", Red, default);End;
VARIABLE DEFAULT DESCRIPTIONPcntChng 0 [Numeric] Holds the value of the Percent
Change for reference throughout the Indicator

EasyLanguage Indicator 53Chapter 5 Measuring & Comparing Performance in RadarScreen 2000i
Finally, as the entire RadarScreen window is evaluated, once the symbol that serves as the benchmark(BaseSymbol) is identified, the background color for that cell is set to yellow. Notice that thecomparison includes UpperStr() for the BaseSymbol. This is done in the event that the BaseSymbolis not entered as all CAPS in the Input.
If GetSymbolName = UpperStr(BaseSymbol) ThenSetPlotBGColor(1, Yellow);
Lets look at another example of this Indicator. In this example, the Indicator has been applied to aRadarScreen window, which contains the NASDAQ 100. The 'BaseSymbol' is tied to the NASDAQ100 index (NDX) [Figure 3].
Figure 3. Those stocks that were outperforming the NDX appear above the highlighted cell. Anystocks with a percent change that was greater than 7% are highlighted. By having RadarScreenkeep the list of symbols sorted, you can always know which stocks are on top of the market, aswell as how they compare to a specific market index.
54 EasyLanguage Indicator Omega Research System Trading and Development Club - Volume 10
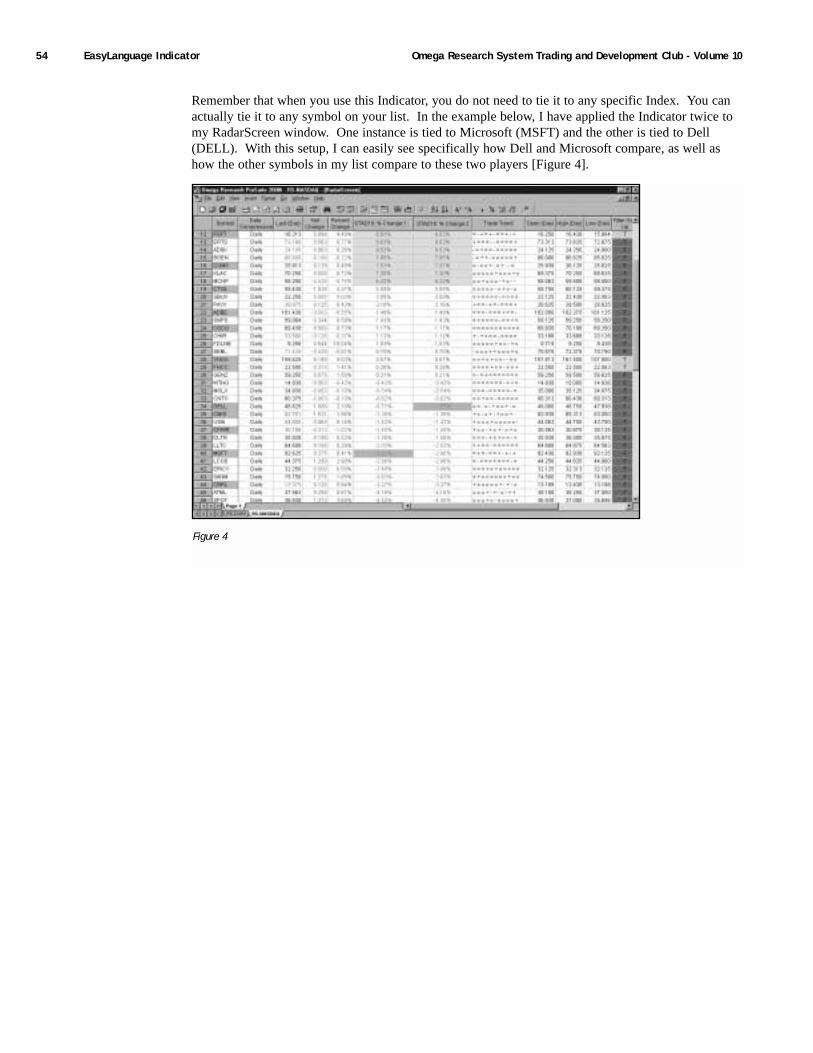
Remember that when you use this Indicator, you do not need to tie it to any specific Index. You canactually tie it to any symbol on your list. In the example below, I have applied the Indicator twice tomy RadarScreen window. One instance is tied to Microsoft (MSFT) and the other is tied to Dell(DELL). With this setup, I can easily see specifically how Dell and Microsoft compare, as well ashow the other symbols in my list compare to these two players [Figure 4].
Figure 4
C H A P T E R 6
Going In Style
Price channel breakouts are very simple: you buy when a market makes a new n-barhigh; you sell when a market makes a new n-bar low. Add a few money-managementand trade-management rules, and you may have a profitable system. In the Going in
Style system, we'll use a price channel breakout as a setup and a multiple of the AverageTrue Range (ATR) added to or subtracted from the close as an entry.
In other words, we'll identify a price channel breakout but defer our entry into the trade untilprices stage a confirming rally (in the case of a potential long position) or a confirming decline(for a potential short position). We named this system Going in Style because we're requiringthat a market not only break out of a price channel, but that it also does so with style-makinganother strong move on the bar following the breakout.
Going in Style has only three components: the price channel, the trigger, and the parabolic stop.The default value for the price channel is 20-a new 20-bar high is a setup to go long; a new 20-bar low is a setup to go short. The default value for the trigger is .50: we'll buy on the bar afteran upside price channel breakout if prices climb to the close plus .50 times the ATR; we'll sellshort on the bar after a downside breakout if prices fall to the close minus .50 times the ATR.The parabolic stop will serve as our exit in this system. We'll set the parabolic stop a multiple ofthe ATR below the low of our entry bar for a long position and a multiple of the ATR above thehigh of the entry bar for a short position. As a trade moves in our favor, the parabolic stop willrise (in an uptrend) or fall (in a downtrend) to lock in profits while still giving the trade the timeand space it needs to develop fully.

56 Defining Our Trading Rules Omega Research System Trading and Development Club - Volume 10
Defining Our Trading RulesFor the Going in Style system, we defined long and short entries and exits. We also calculated a pricechannel, an ATR, and a parabolic stop. The trading rules are described next.
Long and Short Entries
a) If a market makes a new 20-bar high, buy at the close plus 50% of the ATR.
b) If a market makes a new 20-bar low, sell short at the close minus 50% of the ATR.
Long and Short Exits
a) If long, exit on a decline to the parabolic stop.
b) If short, exit on a rally to the parabolic stop.
Designing & FormattingThis section presents the EasyLanguage instructions and formatting for the system, with theEasyLanguage instructions broken down and explained line by line.
EasyLanguage System Components: Go in Style (STAD10: Go in Style)
System Inputs (STAD10: Go in Style)
INPUT DEFAULT DESCRIPTIONAcceleration_LX .02 The acceleration factor used to calculate
the long Parabolic exitAcceleration_SX .02 The acceleration factor used to calculate the
short Parabolic exitFirstBarMult_ShortExit 3 At the first bar of a short position, the
Parabolic will start this many Average True Ranges above the high
FirstBarMult_LongExit 1.5 At the first bar of a long position, the Parabolic will start this many Average True Ranges below the low
Length 20 The number of bars used in the calculation of the Average True Range (ATR) andnew High/Low
Trigger .66 Exit Trigger used in the calculation of the Long & Short entry prices
Designing & Formatting 57Chapter 6 Going In Style
Signal Components:
1. Going in Style
2. Parabolic Trailing LX
3. Parabolic Trailing SX
4. LastBar Exit
EasyLanguage Signal: Going in Style:
Inputs: Length(20), Trigger(.66); Variable: ATR(0);
ATR = AvgTrueRange(Length);
Condition1 = High > Highest(High,Length)[1];Condition2 = Low < Lowest(Low,Length)[1];
If Condition1 ThenBuy Next Bar at Close + ATR * Constant Stop;
If Condition2 Then Sell Next Bar at Close - ATRt * Constant Stop;
Signal Inputs (Going in Style)
Signal Variables (Going in Style)
INPUT DEFAULT DESCRIPTIONLength 20 The number of bars used in the calculation
of the Average True Range (ATR)and new High/Low
Trigger .66 Entry Trigger used in the calculation of theLong & Short entry prices
VARIABLE DEFAULT DESCRIPTIONATR 0 [Numeric] Holds the value of the Average True
Range (ATR)
58 Designing & Formatting Omega Research System Trading and Development Club - Volume 10
SetupIn the first part of the setup, the Average True Range is calculated and assigned to the variable ATRfor later use.
ATR = AvgTrueRange(Length);
The second part of the setup is the establishment of the primary entry conditions. Condition1determines if the current High is a new High. This is done by comparing the current High to thehighest High calculation of 1 bar ago. Condition2 determines if the current Low is a new Low.Comparing the current Low to the lowest Low calculation of 1 bar ago does this. The lowest andhighest calculations are offset by 1 bar because we are looking for a higher/lower High/Low.
Condition1 = High > Highest(High,Length)[1];Condition2 = Low < Lowest(Low,Length)[1];
Long Entry
If the current High is a new High, a Buy stop order is placed at the Close plus a multiple of theAverage True Range (ATR).
If Condition1 ThenBuy Next Bar at Close + ATR * Constant Stop;
Short Entry
If the current Low is a new Low, a Sell stop order is placed at the Close minus a multiple of theAverage True Range (ATR).
If Condition2 Then Sell Next Bar at Close - ATR * Constant Stop;
EasyLanguage Signal: Parabolic Trailing LX:
Inputs: Acceleration(.02), FirstBarMultp(1.5);Variables: AF(0), StopPrice(0), MP(0), HighValue(0);
MP = MarketPosition;If High > HighValue Then
HighValue = High;
If MP = 1 Then BeginIf MP[1] <> 1 Then Begin
StopPrice = Low - Average(TrueRange, 3) * FirstBarMultp;AF = Acceleration;HighValue = High;
EndElse Begin
StopPrice = StopPrice + AF * (HighValue - StopPrice);If HighValue > HighValue[1] AND AF < 0.2 Then
AF = AF + MinList(Acceleration, 0.2 - AF);End;If StopPrice > Low Then
StopPrice = Low;
Designing & Formatting 59Chapter 6 Going In Style
End;
If MP = 1 ThenExitLong ("PT") Next Bar at StopPrice Stop;
Signal Inputs (Parabolic Trailing LX)
Signal Variables (Parabolic Trailing LX)
Setup
First, we will assign the MarketPosition keyword to a variable so we can reference previous values insubsequent steps.
MP = MarketPosition;
Next we will capture the highest high into the HighValue variable.
If High > HighValue ThenHighValue = High;
If the system is in a long position, and it was not in a long position one bar ago (in other words thesystem is on the first bar of a long position as shown by an MP of 1 bar ago not equal to 1) we willcalculate the stop price as the low minus the three bar average true range multiplied by the inputFirstBarMultp. Also , we will assign the Acceleration to the variable AF and the high of this bar tothe variable HighValue.
If MP = 1 Then BeginIf MP[1] <> 1 Then Begin
StopPrice = Low - Average(TrueRange, 3) * FirstBarMultp;AF = Acceleration;HighValue = High;
End
INPUT DEFAULT DESCRIPTIONAcceleration .02 The acceleration factor of the ParabolicFirstBarMultp 1.5 A factor used to multiply the three bar
Average True Range to place a stop loss order on the bar of entry
VARIABLE DEFAULT DESCRIPTIONAF 0 [Numeric] Holds the acceleration valueStopPrice 0 [Numeric] Holds the calculated Stop
price valueMP 0 [Numeric] Holds the Market Position valueHighValue 0 [Numeric] Holds the highest price of the
position
60 Designing & Formatting Omega Research System Trading and Development Club - Volume 10
If the system is in a long position, but it is not on the first bar, we will calculate the StopPrice as theprevious value of the stop price plus the difference from the high to the stop price times theacceleration value. If the market is making a higher high, and the acceleration factor is less than 0.2then we will increase the acceleration factor by the input Acceleration, or 0.2 minus the value of theAF value, whichever value is lower.
Else BeginStopPrice = StopPrice + AF * (HighValue - StopPrice);If HighValue > HighValue[1] AND AF < 0.2 Then
AF = AF + MinList(Acceleration, 0.2 - AF);End;
If the StopPrice is greater than the low, then we will assign the low to the variable StopPrice.
If StopPrice > Low ThenStopPrice = Low;
End;
Long Exit
Finally, while we are in a long position, we will place a stop order to exit the market at the stop price.
If MP = 1 ThenExitLong ("PT") Next Bar at StopPrice Stop;
EasyLanguage Signal: Parabolic Trailing SX:
Inputs: Acceleration(.02), FirstBarMult(3);Variables: SAR(0), AF(0), StopPrice(0), MP(0), LowValue(0);
MP = MarketPosition;If Low < LowValue Then
LowValue = Low;
If MP = -1 Then BeginIf MP[1] <> -1 Then Begin
StopPrice = High + Average(TrueRange, 3) * FirstBarMult;AF = Acceleration;LowValue = Low;
EndElse Begin
StopPrice = StopPrice - AF * (StopPrice - LowValue);If LowValue < LowValue[1] AND AF < 0.2 Then
AF = AF + MinList(Acceleration, 0.2 - AF);End;If StopPrice < High Then
StopPrice = High;End;
IF MP = -1 ThenExitShort ("PT") Next Bar at StopPrice Stop;
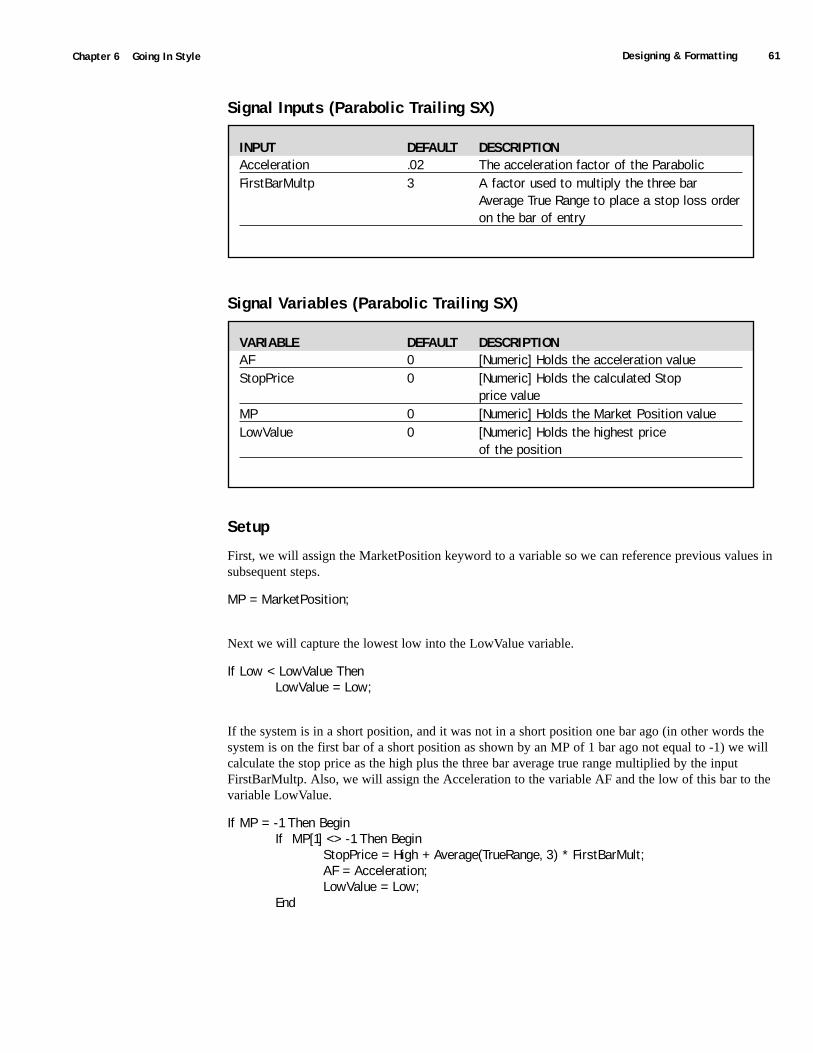
Designing & Formatting 61Chapter 6 Going In Style
Signal Inputs (Parabolic Trailing SX)
Signal Variables (Parabolic Trailing SX)
Setup
First, we will assign the MarketPosition keyword to a variable so we can reference previous values insubsequent steps.
MP = MarketPosition;
Next we will capture the lowest low into the LowValue variable.
If Low < LowValue ThenLowValue = Low;
If the system is in a short position, and it was not in a short position one bar ago (in other words thesystem is on the first bar of a short position as shown by an MP of 1 bar ago not equal to -1) we willcalculate the stop price as the high plus the three bar average true range multiplied by the inputFirstBarMultp. Also, we will assign the Acceleration to the variable AF and the low of this bar to thevariable LowValue.
If MP = -1 Then BeginIf MP[1] <> -1 Then Begin
StopPrice = High + Average(TrueRange, 3) * FirstBarMult;AF = Acceleration;LowValue = Low;
End
INPUT DEFAULT DESCRIPTIONAcceleration .02 The acceleration factor of the ParabolicFirstBarMultp 3 A factor used to multiply the three bar
Average True Range to place a stop loss order on the bar of entry
VARIABLE DEFAULT DESCRIPTIONAF 0 [Numeric] Holds the acceleration valueStopPrice 0 [Numeric] Holds the calculated Stop
price valueMP 0 [Numeric] Holds the Market Position valueLowValue 0 [Numeric] Holds the highest price
of the position
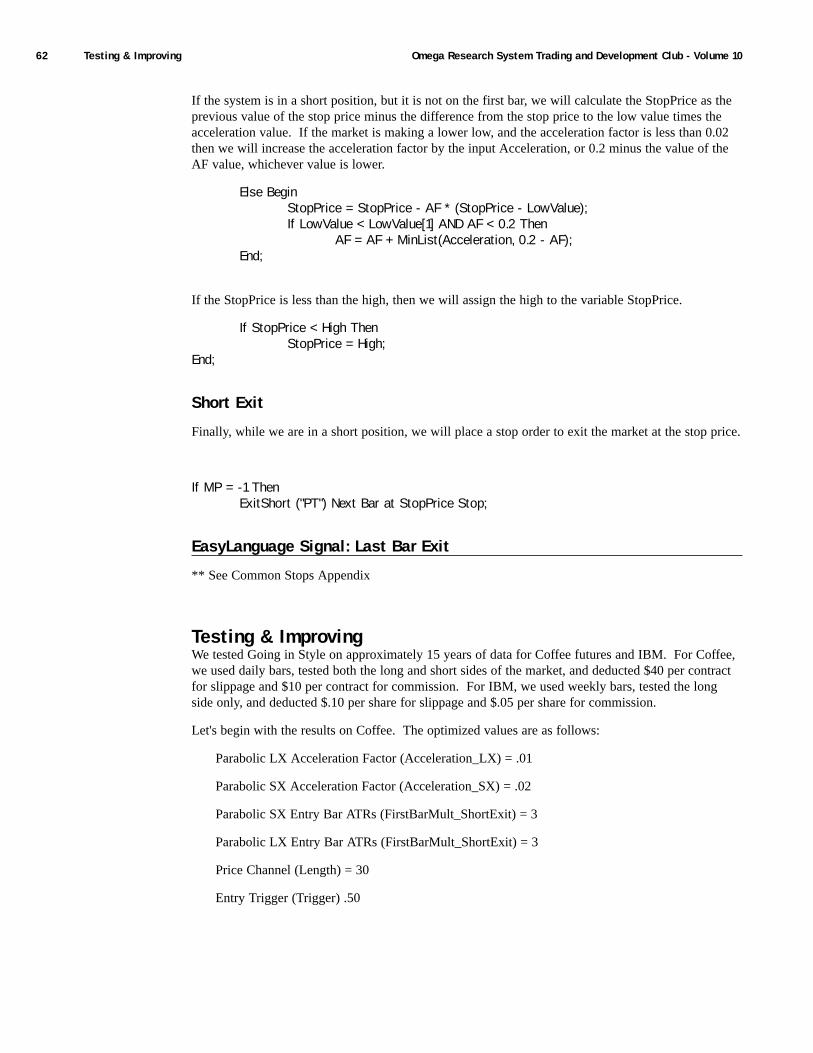
62 Testing & Improving Omega Research System Trading and Development Club - Volume 10
If the system is in a short position, but it is not on the first bar, we will calculate the StopPrice as theprevious value of the stop price minus the difference from the stop price to the low value times theacceleration value. If the market is making a lower low, and the acceleration factor is less than 0.02then we will increase the acceleration factor by the input Acceleration, or 0.2 minus the value of theAF value, whichever value is lower.
Else BeginStopPrice = StopPrice - AF * (StopPrice - LowValue);If LowValue < LowValue[1] AND AF < 0.2 Then
AF = AF + MinList(Acceleration, 0.2 - AF);End;
If the StopPrice is less than the high, then we will assign the high to the variable StopPrice.
If StopPrice < High ThenStopPrice = High;
End;
Short Exit
Finally, while we are in a short position, we will place a stop order to exit the market at the stop price.
If MP = -1 ThenExitShort ("PT") Next Bar at StopPrice Stop;
EasyLanguage Signal: Last Bar Exit
** See Common Stops Appendix
Testing & ImprovingWe tested Going in Style on approximately 15 years of data for Coffee futures and IBM. For Coffee,we used daily bars, tested both the long and short sides of the market, and deducted $40 per contractfor slippage and $10 per contract for commission. For IBM, we used weekly bars, tested the longside only, and deducted $.10 per share for slippage and $.05 per share for commission.
Let's begin with the results on Coffee. The optimized values are as follows:
Parabolic LX Acceleration Factor (Acceleration_LX) = .01
Parabolic SX Acceleration Factor (Acceleration_SX) = .02
Parabolic SX Entry Bar ATRs (FirstBarMult_ShortExit) = 3
Parabolic LX Entry Bar ATRs (FirstBarMult_ShortExit) = 3
Price Channel (Length) = 30
Entry Trigger (Trigger) .50
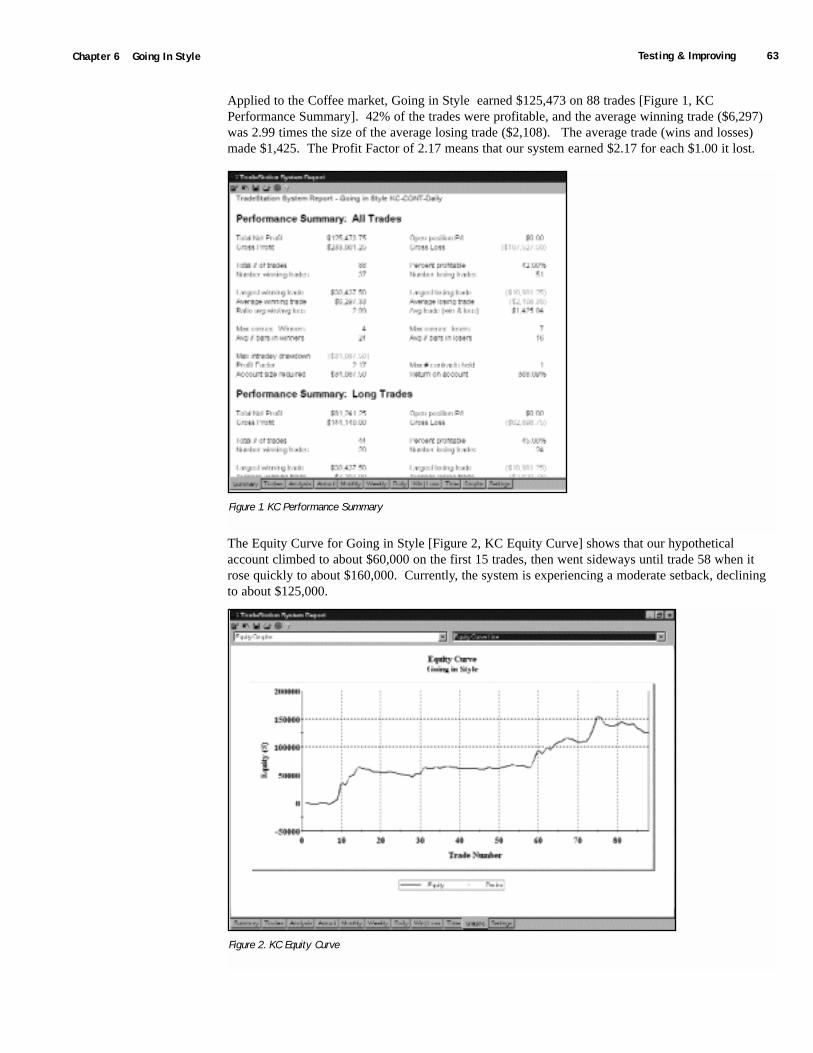
Testing & Improving 63Chapter 6 Going In Style
Applied to the Coffee market, Going in Style earned $125,473 on 88 trades [Figure 1, KCPerformance Summary]. 42% of the trades were profitable, and the average winning trade ($6,297)was 2.99 times the size of the average losing trade ($2,108). The average trade (wins and losses)made $1,425. The Profit Factor of 2.17 means that our system earned $2.17 for each $1.00 it lost.
The Equity Curve for Going in Style [Figure 2, KC Equity Curve] shows that our hypotheticalaccount climbed to about $60,000 on the first 15 trades, then went sideways until trade 58 when itrose quickly to about $160,000. Currently, the system is experiencing a moderate setback, decliningto about $125,000.
Figure 1. KC Performance Summary
Figure 2. KC Equity Curve
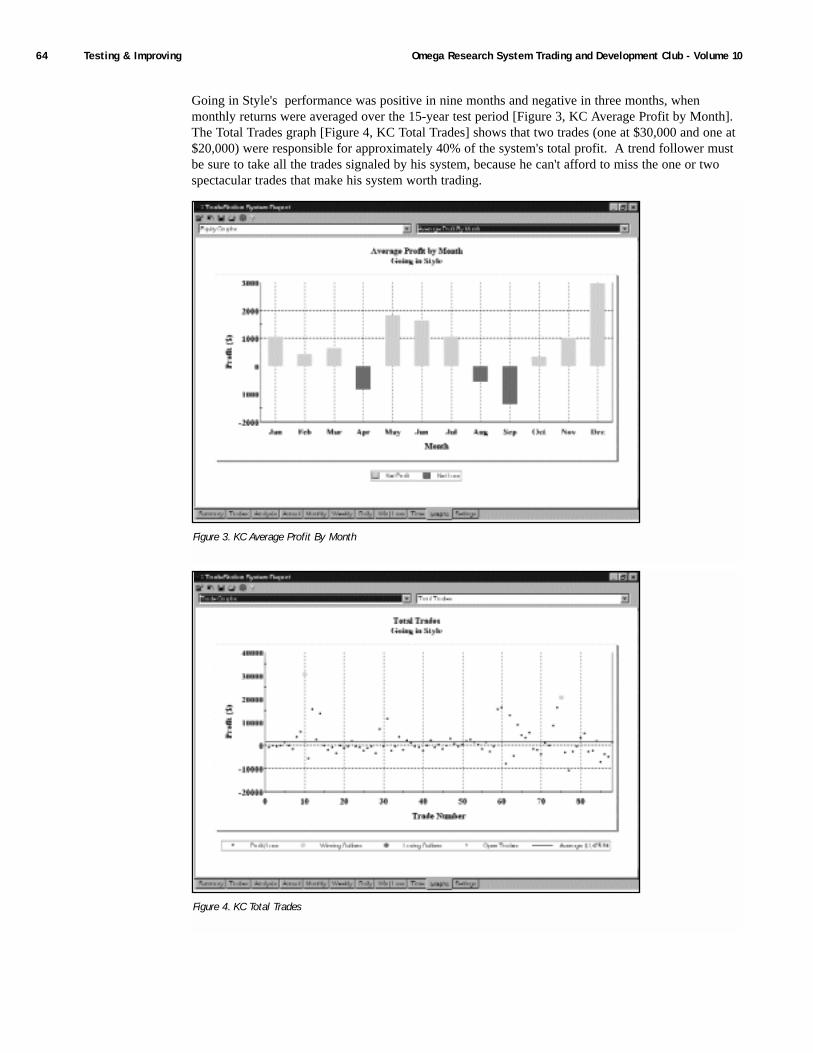
64 Testing & Improving Omega Research System Trading and Development Club - Volume 10
Going in Style's performance was positive in nine months and negative in three months, whenmonthly returns were averaged over the 15-year test period [Figure 3, KC Average Profit by Month].The Total Trades graph [Figure 4, KC Total Trades] shows that two trades (one at $30,000 and one at$20,000) were responsible for approximately 40% of the system's total profit. A trend follower mustbe sure to take all the trades signaled by his system, because he can't afford to miss the one or twospectacular trades that make his system worth trading.
Figure 3. KC Average Profit By Month
Figure 4. KC Total Trades
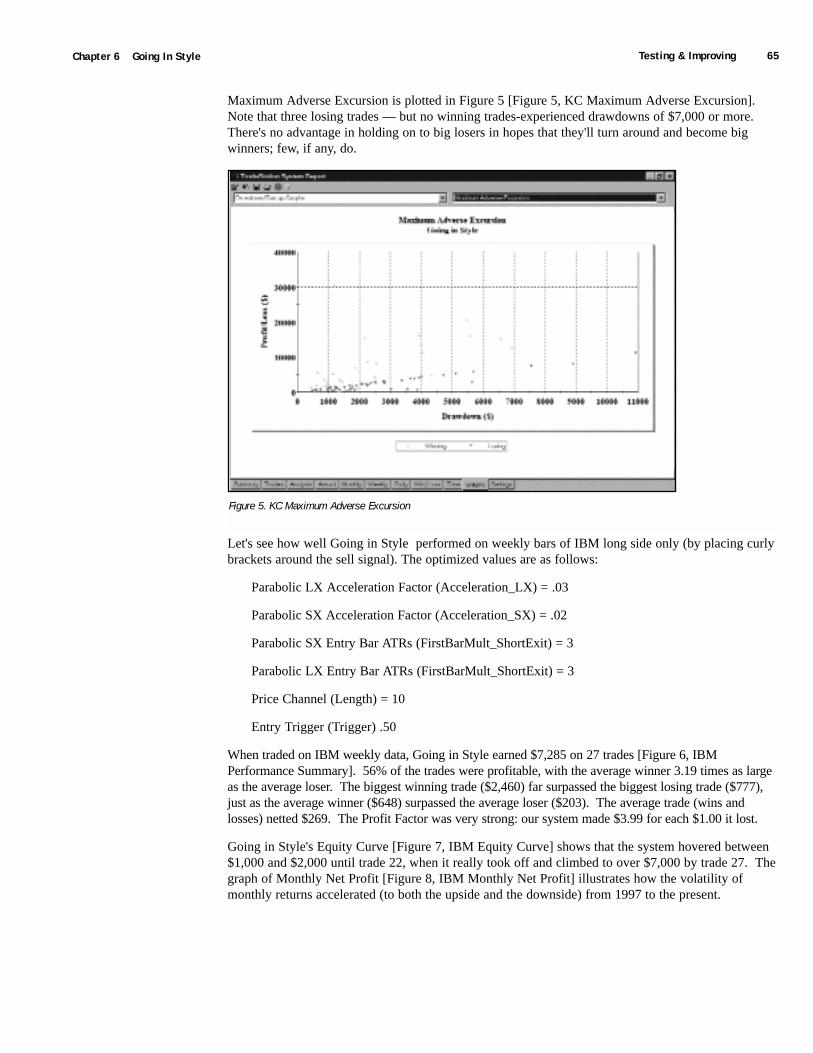
Testing & Improving 65Chapter 6 Going In Style
Maximum Adverse Excursion is plotted in Figure 5 [Figure 5, KC Maximum Adverse Excursion].Note that three losing trades — but no winning trades-experienced drawdowns of $7,000 or more.There's no advantage in holding on to big losers in hopes that they'll turn around and become bigwinners; few, if any, do.
Let's see how well Going in Style performed on weekly bars of IBM long side only (by placing curlybrackets around the sell signal). The optimized values are as follows:
Parabolic LX Acceleration Factor (Acceleration_LX) = .03
Parabolic SX Acceleration Factor (Acceleration_SX) = .02
Parabolic SX Entry Bar ATRs (FirstBarMult_ShortExit) = 3
Parabolic LX Entry Bar ATRs (FirstBarMult_ShortExit) = 3
Price Channel (Length) = 10
Entry Trigger (Trigger) .50
When traded on IBM weekly data, Going in Style earned $7,285 on 27 trades [Figure 6, IBMPerformance Summary]. 56% of the trades were profitable, with the average winner 3.19 times as largeas the average loser. The biggest winning trade ($2,460) far surpassed the biggest losing trade ($777),just as the average winner ($648) surpassed the average loser ($203). The average trade (wins andlosses) netted $269. The Profit Factor was very strong: our system made $3.99 for each $1.00 it lost.
Going in Style's Equity Curve [Figure 7, IBM Equity Curve] shows that the system hovered between$1,000 and $2,000 until trade 22, when it really took off and climbed to over $7,000 by trade 27. Thegraph of Monthly Net Profit [Figure 8, IBM Monthly Net Profit] illustrates how the volatility ofmonthly returns accelerated (to both the upside and the downside) from 1997 to the present.
Figure 5. KC Maximum Adverse Excursion
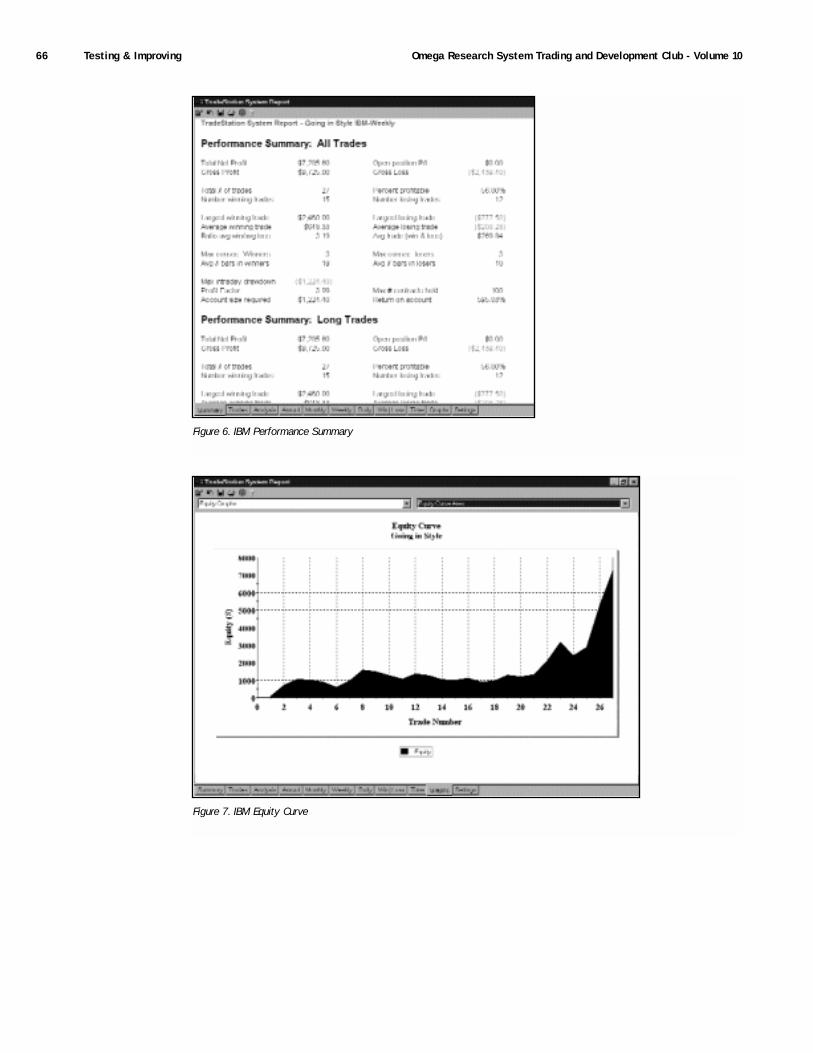
66 Testing & Improving Omega Research System Trading and Development Club - Volume 10
Figure 6. IBM Performance Summary
Figure 7. IBM Equity Curve
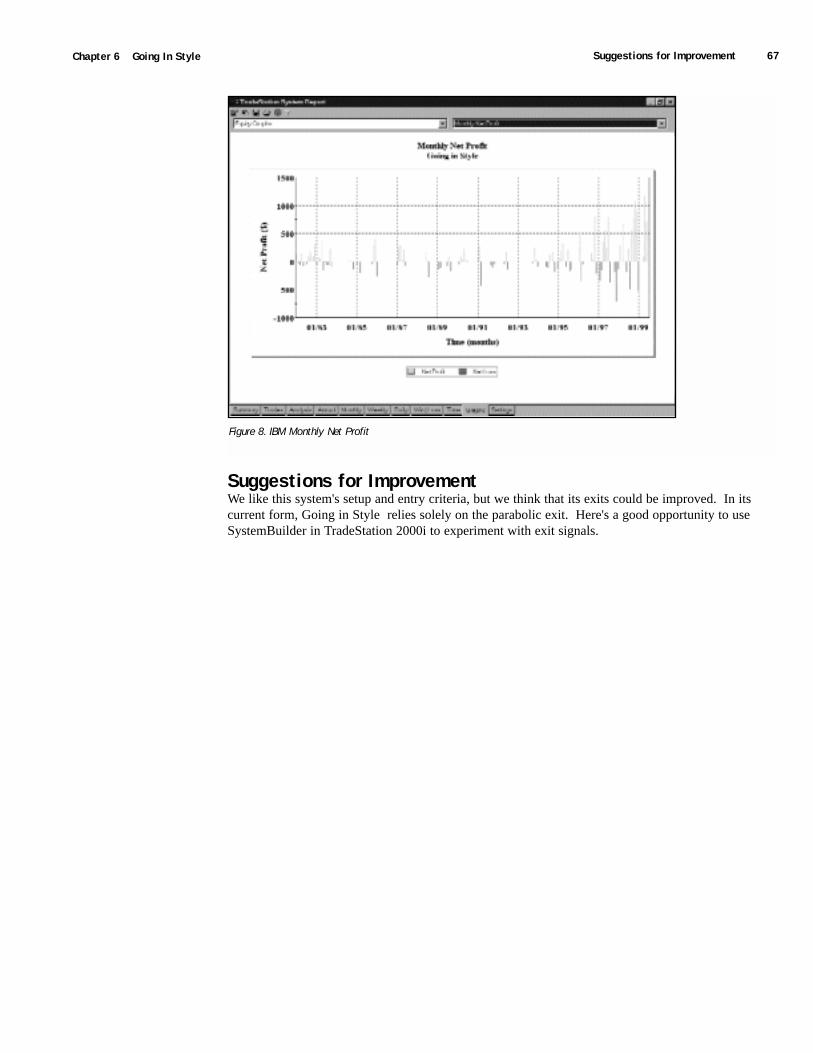
Suggestions for Improvement 67Chapter 6 Going In Style
Suggestions for ImprovementWe like this system's setup and entry criteria, but we think that its exits could be improved. In itscurrent form, Going in Style relies solely on the parabolic exit. Here's a good opportunity to useSystemBuilder in TradeStation 2000i to experiment with exit signals.
Figure 8. IBM Monthly Net Profit

68 Omega Research System Trading and Development Club - Volume 10
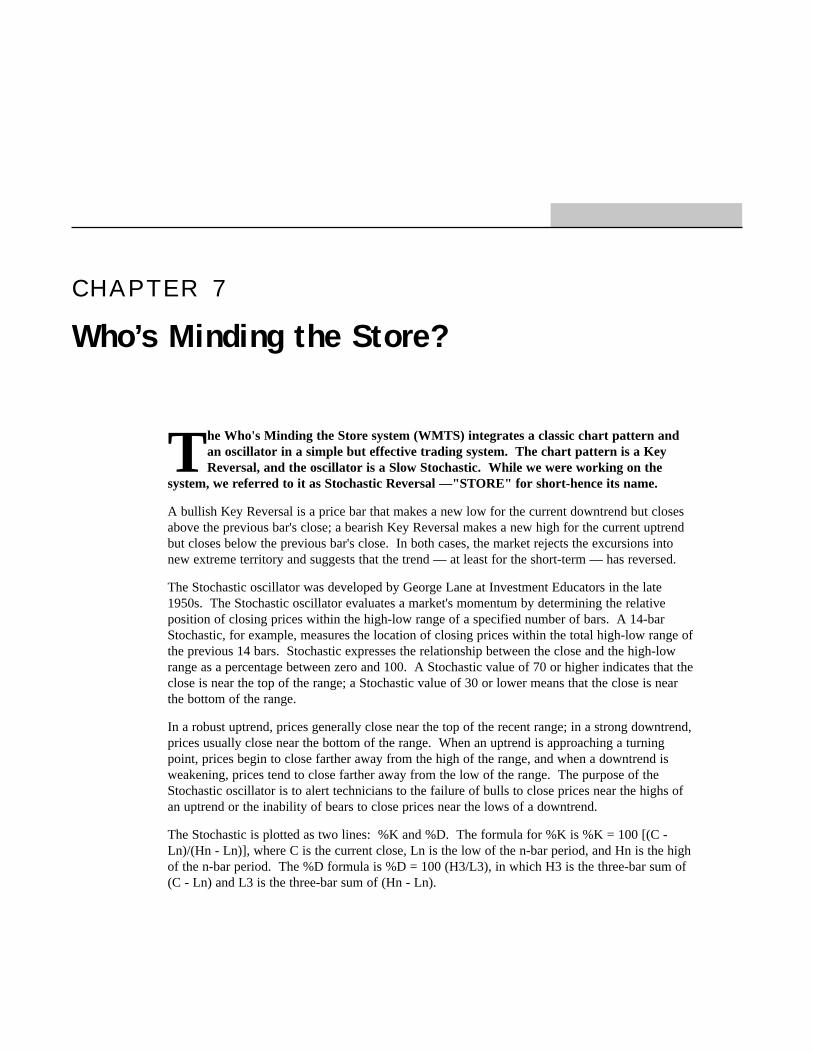
C H A P T E R 7
Who’s Minding the Store?
The Who's Minding the Store system (WMTS) integrates a classic chart pattern andan oscillator in a simple but effective trading system. The chart pattern is a KeyReversal, and the oscillator is a Slow Stochastic. While we were working on the
system, we referred to it as Stochastic Reversal —"STORE" for short-hence its name.
A bullish Key Reversal is a price bar that makes a new low for the current downtrend but closesabove the previous bar's close; a bearish Key Reversal makes a new high for the current uptrendbut closes below the previous bar's close. In both cases, the market rejects the excursions intonew extreme territory and suggests that the trend — at least for the short-term — has reversed.
The Stochastic oscillator was developed by George Lane at Investment Educators in the late1950s. The Stochastic oscillator evaluates a market's momentum by determining the relativeposition of closing prices within the high-low range of a specified number of bars. A 14-barStochastic, for example, measures the location of closing prices within the total high-low range ofthe previous 14 bars. Stochastic expresses the relationship between the close and the high-lowrange as a percentage between zero and 100. A Stochastic value of 70 or higher indicates that theclose is near the top of the range; a Stochastic value of 30 or lower means that the close is nearthe bottom of the range.
In a robust uptrend, prices generally close near the top of the recent range; in a strong downtrend,prices usually close near the bottom of the range. When an uptrend is approaching a turningpoint, prices begin to close farther away from the high of the range, and when a downtrend isweakening, prices tend to close farther away from the low of the range. The purpose of theStochastic oscillator is to alert technicians to the failure of bulls to close prices near the highs ofan uptrend or the inability of bears to close prices near the lows of a downtrend.
The Stochastic is plotted as two lines: %K and %D. The formula for %K is %K = 100 [(C -Ln)/(Hn - Ln)], where C is the current close, Ln is the low of the n-bar period, and Hn is the highof the n-bar period. The %D formula is %D = 100 (H3/L3), in which H3 is the three-bar sum of(C - Ln) and L3 is the three-bar sum of (Hn - Ln).
70 Defining Our Trading Rules Omega Research System Trading and Development Club - Volume 10
The %K and %D formulas produce the fast Stochastic oscillator, which is generally considered toosensitive and erratic. Fast Stochastic can be subjected to a further three-bar smoothing, however,which results in the slow Stochastic that most analysts prefer. In the smoother version of Stochastic,the fast %D becomes the slow %K, and a three-bar moving average of the fast %D becomes the slow%D. Slow %K is usually drawn as a solid line and slow %D as a dotted or dashed line.
In TradeStation 2000i's SystemBuilder, we added an EntryBar ATR Stop LX and SX, an ATR TrailingStop LX and SX, a BigProfit Stop LX and SX, and a LastBar Exit. The EntryBar Stops protect uswhen our system initiates a new position, but the market suddenly reverses on the same bar. The ATRTrailing Stops reduce our risk and eventually lock in profits as a trade moves in the anticipateddirection. The BigProfit Stops make our Exits more aggressive (tighter) when we've accumulatedlarger than usual profits in an open position. Finally, the LastBar Exit closes out a position on the lastbar of the data on which the system is being tested; this enables us to study the system's performanceresults without having to deal with any open profits or losses that would distort the system's results.
Defining Our Trading RulesIn Who's Minding the Store, we defined long and short entries and three types of stops. We alsocalculated a 14-bar Slow Stochastic and a price channel breakout. Our trading rules are describednext.
Long and Short Entries
a) After a bullish Key Reversal with the Slow Stochastic in oversold territory, buy at the highest highof the last four bars plus one point.
b) After a bearish Key Reversal with the Slow Stochastic in overbought territory, sell short at thelowest low of the last four bars minus one point.
Long and Short Exits
a) Exit a long position at the EntryBar ATR Stop LX, the ATR Trailing Stop LX, or the BigProfitStop LX.
b) Exit a short position at the EntryBar ATR Stop SX, the ATR Trailing Stop SX, or the BigProfitStop SX.
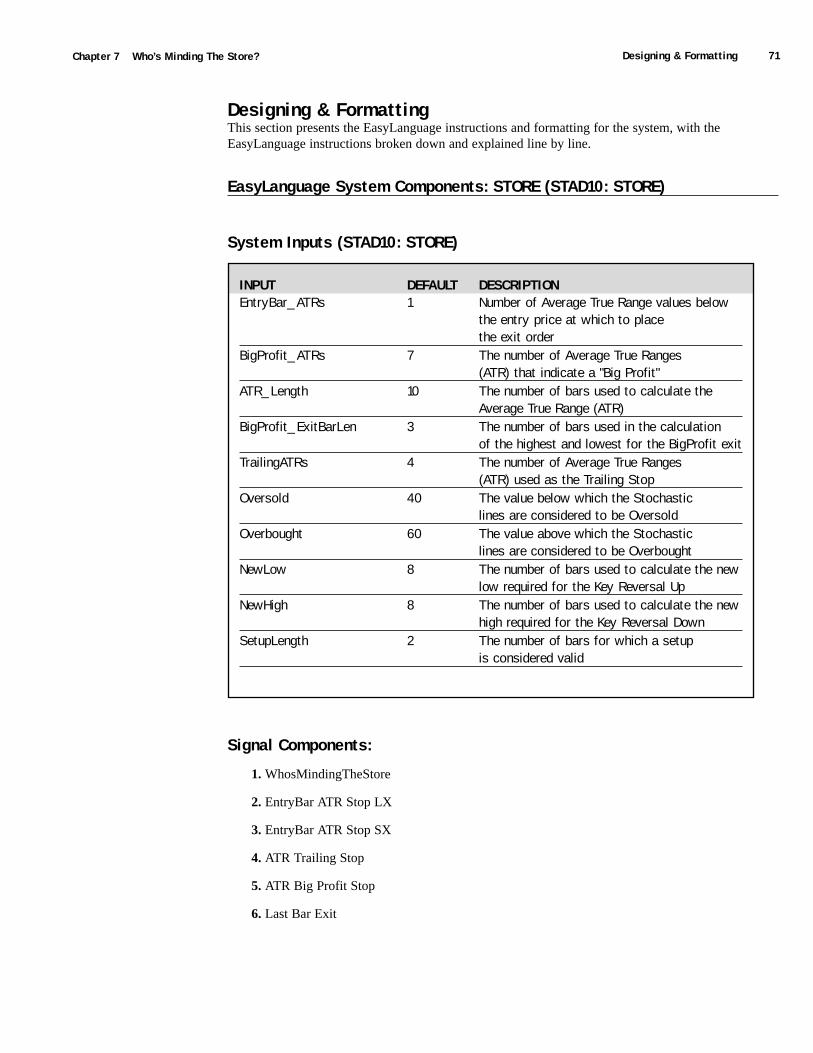
Designing & Formatting 71Chapter 7 Who’s Minding The Store?
Designing & FormattingThis section presents the EasyLanguage instructions and formatting for the system, with theEasyLanguage instructions broken down and explained line by line.
EasyLanguage System Components: STORE (STAD10: STORE)
System Inputs (STAD10: STORE)
Signal Components:
1. WhosMindingTheStore
2. EntryBar ATR Stop LX
3. EntryBar ATR Stop SX
4. ATR Trailing Stop
5. ATR Big Profit Stop
6. Last Bar Exit
INPUT DEFAULT DESCRIPTIONEntryBar_ATRs 1 Number of Average True Range values below
the entry price at which to placethe exit order
BigProfit_ATRs 7 The number of Average True Ranges(ATR) that indicate a "Big Profit"
ATR_Length 10 The number of bars used to calculate theAverage True Range (ATR)
BigProfit_ExitBarLen 3 The number of bars used in the calculationof the highest and lowest for the BigProfit exit
TrailingATRs 4 The number of Average True Ranges(ATR) used as the Trailing Stop
Oversold 40 The value below which the Stochasticlines are considered to be Oversold
Overbought 60 The value above which the Stochasticlines are considered to be Overbought
NewLow 8 The number of bars used to calculate the new low required for the Key Reversal Up
NewHigh 8 The number of bars used to calculate the new high required for the Key Reversal Down
SetupLength 2 The number of bars for which a setupis considered valid
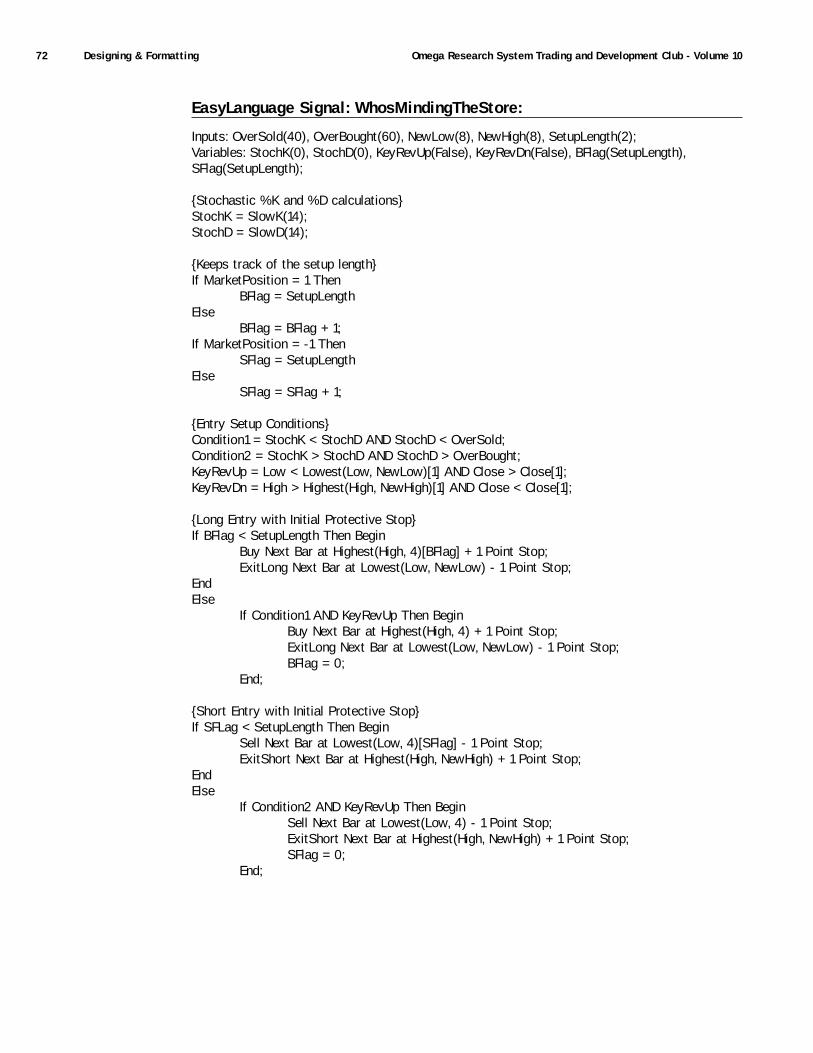
72 Designing & Formatting Omega Research System Trading and Development Club - Volume 10
EasyLanguage Signal: WhosMindingTheStore:
Inputs: OverSold(40), OverBought(60), NewLow(8), NewHigh(8), SetupLength(2);Variables: StochK(0), StochD(0), KeyRevUp(False), KeyRevDn(False), BFlag(SetupLength),SFlag(SetupLength);
{Stochastic %K and %D calculations}StochK = SlowK(14);StochD = SlowD(14);
{Keeps track of the setup length}If MarketPosition = 1 Then
BFlag = SetupLengthElse
BFlag = BFlag + 1;If MarketPosition = -1 Then
SFlag = SetupLengthElse
SFlag = SFlag + 1;
{Entry Setup Conditions}Condition1 = StochK < StochD AND StochD < OverSold;Condition2 = StochK > StochD AND StochD > OverBought;KeyRevUp = Low < Lowest(Low, NewLow)[1] AND Close > Close[1];KeyRevDn = High > Highest(High, NewHigh)[1] AND Close < Close[1];
{Long Entry with Initial Protective Stop}If BFlag < SetupLength Then Begin
Buy Next Bar at Highest(High, 4)[BFlag] + 1 Point Stop;ExitLong Next Bar at Lowest(Low, NewLow) - 1 Point Stop;
End Else
If Condition1 AND KeyRevUp Then BeginBuy Next Bar at Highest(High, 4) + 1 Point Stop;ExitLong Next Bar at Lowest(Low, NewLow) - 1 Point Stop;BFlag = 0;
End;
{Short Entry with Initial Protective Stop}If SFLag < SetupLength Then Begin
Sell Next Bar at Lowest(Low, 4)[SFlag] - 1 Point Stop;ExitShort Next Bar at Highest(High, NewHigh) + 1 Point Stop;
End Else
If Condition2 AND KeyRevUp Then BeginSell Next Bar at Lowest(Low, 4) - 1 Point Stop;ExitShort Next Bar at Highest(High, NewHigh) + 1 Point Stop;SFlag = 0;
End;
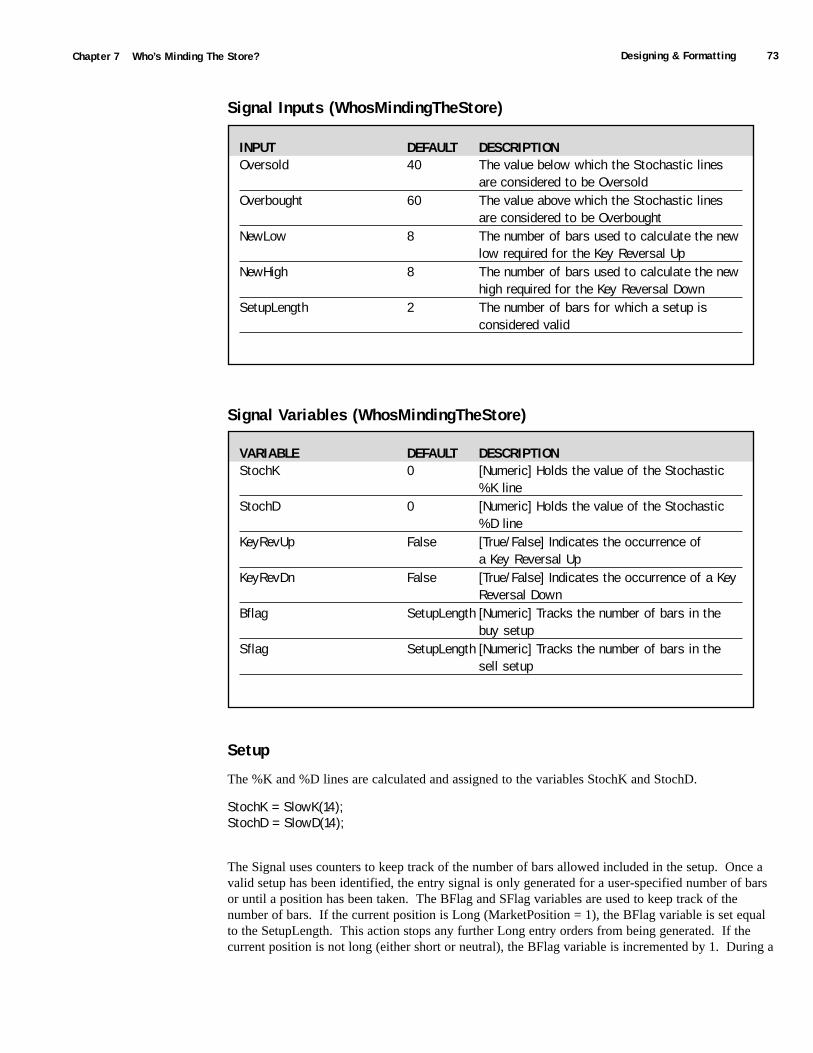
Designing & Formatting 73Chapter 7 Who’s Minding The Store?
Signal Inputs (WhosMindingTheStore)
Signal Variables (WhosMindingTheStore)
Setup
The %K and %D lines are calculated and assigned to the variables StochK and StochD.
StochK = SlowK(14);StochD = SlowD(14);
The Signal uses counters to keep track of the number of bars allowed included in the setup. Once avalid setup has been identified, the entry signal is only generated for a user-specified number of barsor until a position has been taken. The BFlag and SFlag variables are used to keep track of thenumber of bars. If the current position is Long (MarketPosition = 1), the BFlag variable is set equalto the SetupLength. This action stops any further Long entry orders from being generated. If thecurrent position is not long (either short or neutral), the BFlag variable is incremented by 1. During a
INPUT DEFAULT DESCRIPTIONOversold 40 The value below which the Stochastic lines
are considered to be OversoldOverbought 60 The value above which the Stochastic lines
are considered to be OverboughtNewLow 8 The number of bars used to calculate the new
low required for the Key Reversal UpNewHigh 8 The number of bars used to calculate the new
high required for the Key Reversal DownSetupLength 2 The number of bars for which a setup is
considered valid
VARIABLE DEFAULT DESCRIPTIONStochK 0 [Numeric] Holds the value of the Stochastic
%K lineStochD 0 [Numeric] Holds the value of the Stochastic
%D lineKeyRevUp False [True/False] Indicates the occurrence of
a Key Reversal UpKeyRevDn False [True/False] Indicates the occurrence of a Key
Reversal DownBflag SetupLength [Numeric] Tracks the number of bars in the
buy setupSflag SetupLength [Numeric] Tracks the number of bars in the
sell setup
74 Designing & Formatting Omega Research System Trading and Development Club - Volume 10
valid Long entry setup period, this accumulation keeps track of the number of bars that occurredwithin the setup and will indicate when the setup period has expired. If there is currently no Longentry setup, this accumulation has no effect. The same logic applies for Short entry setups.
If MarketPosition = 1 ThenBFlag = SetupLength
ElseBFlag = BFlag + 1;
If MarketPosition = -1 ThenSFlag = SetupLength
ElseSFlag = SFlag + 1;
In this signal the conditions that define the Long and Short entry setups are assigned to True/Falsevariables. The combination and evaluation of these variables indicate when a valid setup has occurred.Condition1 and Condition2 are used to represent the results of the evaluation of %K and %D lines.The KeyRevUp and KeyRevDn variables are used to indicate the occurrence of a Key Reversal.
Condition1 = StochK < StochD AND StochD < OverSold;Condition2 = StochK > StochD AND StochD > OverBought;KeyRevUp = Low < Lowest(Low, NewLow)[1] AND Close > Close[1];KeyRevDn = High > Highest(High, NewHigh)[1] AND Close < Close[1];
Long Entry
Now you'll remember from above that the BFlag variable is used to keep track of the number of barsthat have occurred in the Long entry setup. If the BFlag value is greater than the SetupLength, theSignal is not currently in a Long entry setup so Condition1 and KeyRevUp are evaluated for thepossible initiation of a setup. If both criteria are met, a Long entry stop order is placed at the highestHigh of the last 4 bars plus 1 point. In addition, a Long exit stop order is placed at the lowest Lowfor the NewLow period, as an initial protective stop, and the BFlag variable is set to 0. Once this hasoccurred, a Long entry setup has been initiated. During the Long entry setup period, as indicated by aBFlag value that is less than the SetupLength, the original order is placed again until it is filled oruntil the Long entry setup period has ended. Thus, the highest High calculation of the entry is offsetby BFlag bars so that the same calculation is used in generating the order.
If BFlag < SetupLength Then BeginBuy Next Bar at Highest(High, 4)[BFlag] + 1 Point Stop;
End Else
If Condition1 AND KeyRevUp Then BeginBuy Next Bar at Highest(High, 4) + 1 Point Stop;ExitLong Next Bar at Lowest(Low, NewLow) - 1 Point Stop;BFlag = 0;
End;

Designing & Formatting 75Chapter 7 Who’s Minding The Store?
Short Entry
The SFlag variable is used to keep track of the number of bars that have occurred in the Short entrysetup. If the SFlag value is greater than the SetupLength, the Signal is not currently in a Short entrysetup so Condition2 and KeyRevDn are evaluated for the possible initiation of a setup. If both criteriaare met, a Short entry stop order is placed at the lowest Low of the last 4 bars minus 1 point. Inaddition, a Short exit stop order is placed at the highest High for the NewHigh period, as an initialprotective stop, and the SFlag variable is set to 0. Once this has occurred, a Short entry setup hasbeen initiated. During the Short entry setup period, as indicated by a SFlag value that is less than theSetupLength, the original order is placed again until it is filled or until the Short entry setup periodhas ended. Thus, the lowest Low calculation of the entry is offset by SFlag bars so that the samecalculation is used in generating the order.
If SFLag < SetupLength Then BeginSell Next Bar at Lowest(Low, 4)[SFlag] - 1 Point Stop;
End Else
If Condition2 AND KeyRevUp Then BeginSell Next Bar at Lowest(Low, 4) - 1 Point Stop;ExitShort Next Bar at Highest(High, NewHigh) + 1 Point Stop;SFlag = 0;
End;
EasyLanguage Signal: EntryBar ATR Stop LX:
Inputs: ATRs(1);Variables: ATRVal(0);
ATRVal = AvgTrueRange(5) * ATRs;
If MarketPosition <> 1 ThenExitLong ("EBTR") Next Bar at Close - ATRVal Stop;
Signal Inputs (EntryBar ATR Stop LX)
Signal Variables (EntryBar ATR Stop LX)
INPUT DEFAULT DESCRIPTIONATRs 1 Number of Average True Range values below
the entry price at which to placethe exit order
VARIABLE DEFAULT DESCRIPTIONATRVal 0 [Numeric] Holds the value of the Average
True Range
76 Designing & Formatting Omega Research System Trading and Development Club - Volume 10
Setup
During the setup, the Average True Range is calculated and multiplied by the ATRs in order todetermine the value below the Close at which the Exit order will be placed at the bar of entry.
ATRVal = AvgTrueRange(5) * ATRs;
Long Exit
This Exit is only valid for the bar of entry, so the order will only be placed when the current positionis not Long (MarketPosition <> 1). When the current position is short or flat, a Long exit stop orderis generated at the Close minus the ATRVal.
If MarketPosition <> 1 ThenExitLong ("EBTR") Next Bar at Close - ATRVal Stop;
EasyLanguage Signal: EntryBar ATR Stop SX:
Inputs: ATRs(1);Variables: ATRVal(0);
ATRVal = AvgTrueRange(5) * ATRs;
If MarketPosition <> -1 ThenExitShort ("EBTR") Next Bar at Close + ATRVal Stop;
Signal Inputs (EntryBar ATR Stop SX)
Signal Variables (EntryBar ATR Stop SX)
INPUT DEFAULT DESCRIPTIONATRs 1 Number of Average True Range values above
the entry price at which to place theexit order
VARIABLE DEFAULT DESCRIPTIONATRVal 0 [Numeric] Holds the value of the Average
True Range
Testing & Improving 77Chapter 7 Who’s Minding The Store?
Setup
During the setup, the Average True Range is calculated and multiplied by the ATRs in order todetermine the value above the Close at which the Exit order will be placed at the bar of entry.
ATRVal = AvgTrueRange(5) * ATRs;
Short Exit
This Exit is only valid for the bar of entry, so the order will only be placed when the current positionis not Short (MarketPosition <> -1). When the current position is long or flat, a Short exit stop orderis generated at the Close plus the ATRVal.
If MarketPosition <> -1 ThenExitShort ("EBTR") Next Bar at Close + ATRVal Stop;
EasyLanguage Signal: ATR Trailing Stop
** See Common Stops Appendix
EasyLanguage Signal: ATR Big Profit Stop
** See Common Stops Appendix
EasyLanguage Signal: Last Bar Exit
** See Common Stops Appendix
Testing & ImprovingWe tested WMTS on approximately 15 years of daily data for IBM and the Japanese Yen. For IBM,we tested the long side only by adding curly brackets around the Sell signal, and deducted $.10 pershare for slippage and $.05 per share for commission. For the Yen, we tested both the long and shortsides of the market, deduction $40 per contract for slippage and $10 per contract for commission.
Let's see how our system performed on IBM. The optimized values are as follows:
EntryBar ATR Stop (EntryBar_ATRs) = 1
Big Profit Stop (BigProfit_ATRs) = 10
(ATR_Length) = 10
N bar Stop (BigProfit_ExitBarLen) = 3
ATR Trailing (TrailingATRs) = 7
Oversold = 40
Overbought = 60
NewLow = 1
NewHigh = 8
Setup Length (SetupLength) = 5
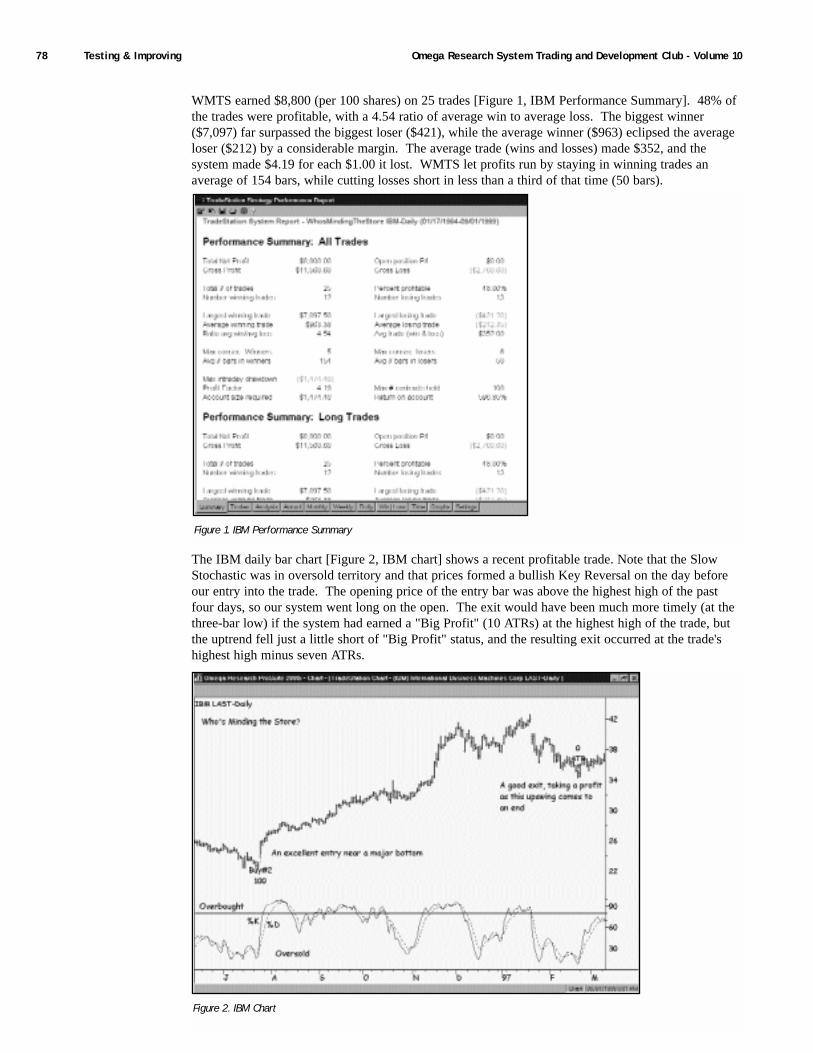
78 Testing & Improving Omega Research System Trading and Development Club - Volume 10
WMTS earned $8,800 (per 100 shares) on 25 trades [Figure 1, IBM Performance Summary]. 48% ofthe trades were profitable, with a 4.54 ratio of average win to average loss. The biggest winner($7,097) far surpassed the biggest loser ($421), while the average winner ($963) eclipsed the averageloser ($212) by a considerable margin. The average trade (wins and losses) made $352, and thesystem made $4.19 for each $1.00 it lost. WMTS let profits run by staying in winning trades anaverage of 154 bars, while cutting losses short in less than a third of that time (50 bars).
The IBM daily bar chart [Figure 2, IBM chart] shows a recent profitable trade. Note that the SlowStochastic was in oversold territory and that prices formed a bullish Key Reversal on the day beforeour entry into the trade. The opening price of the entry bar was above the highest high of the pastfour days, so our system went long on the open. The exit would have been much more timely (at thethree-bar low) if the system had earned a "Big Profit" (10 ATRs) at the highest high of the trade, butthe uptrend fell just a little short of "Big Profit" status, and the resulting exit occurred at the trade'shighest high minus seven ATRs.
Figure 1. IBM Performance Summary
Figure 2. IBM Chart
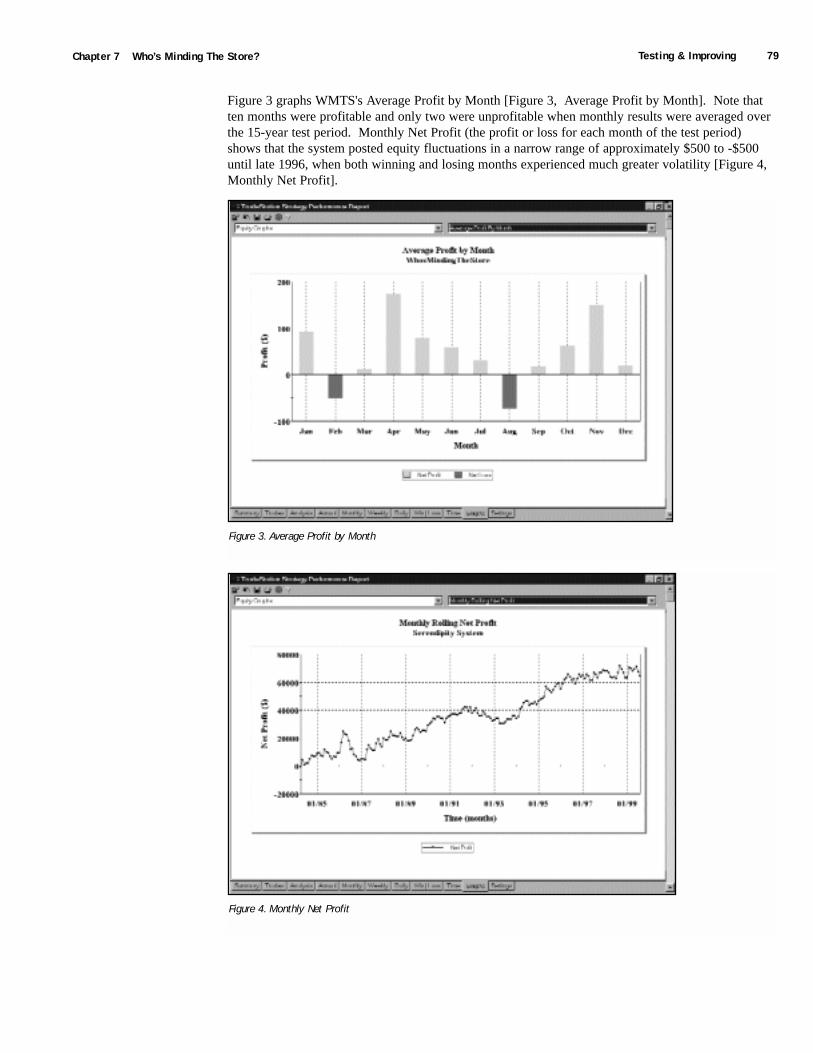
Testing & Improving 79Chapter 7 Who’s Minding The Store?
Figure 3 graphs WMTS's Average Profit by Month [Figure 3, Average Profit by Month]. Note thatten months were profitable and only two were unprofitable when monthly results were averaged overthe 15-year test period. Monthly Net Profit (the profit or loss for each month of the test period)shows that the system posted equity fluctuations in a narrow range of approximately $500 to -$500until late 1996, when both winning and losing months experienced much greater volatility [Figure 4,Monthly Net Profit].
Figure 3. Average Profit by Month
Figure 4. Monthly Net Profit

80 Testing & Improving Omega Research System Trading and Development Club - Volume 10
Suggestions for ImprovementWe didn't optimize two of the system's values that affect every trade: the length of the Slow Stochasticand the length of the price channel breakout. The values were set to the somewhat arbitrary constantsof 14 and four, respectively. Test results could probably be improved by optimizing those values.We'd suggest optimizing the Slow Stochastic from five to 20 bars and the price channel breakout fromtwo to ten bars.
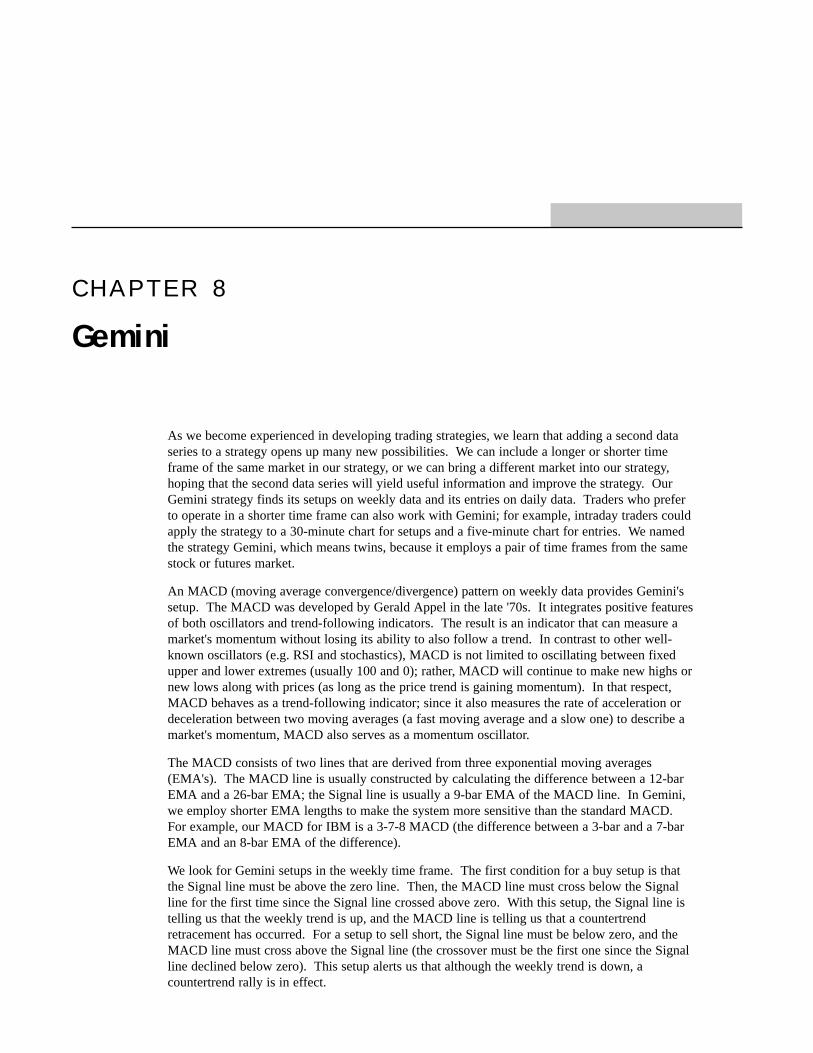
C H A P T E R 8
Gemini
As we become experienced in developing trading strategies, we learn that adding a second dataseries to a strategy opens up many new possibilities. We can include a longer or shorter timeframe of the same market in our strategy, or we can bring a different market into our strategy,hoping that the second data series will yield useful information and improve the strategy. OurGemini strategy finds its setups on weekly data and its entries on daily data. Traders who preferto operate in a shorter time frame can also work with Gemini; for example, intraday traders couldapply the strategy to a 30-minute chart for setups and a five-minute chart for entries. We namedthe strategy Gemini, which means twins, because it employs a pair of time frames from the samestock or futures market.
An MACD (moving average convergence/divergence) pattern on weekly data provides Gemini'ssetup. The MACD was developed by Gerald Appel in the late '70s. It integrates positive featuresof both oscillators and trend-following indicators. The result is an indicator that can measure amarket's momentum without losing its ability to also follow a trend. In contrast to other well-known oscillators (e.g. RSI and stochastics), MACD is not limited to oscillating between fixedupper and lower extremes (usually 100 and 0); rather, MACD will continue to make new highs ornew lows along with prices (as long as the price trend is gaining momentum). In that respect,MACD behaves as a trend-following indicator; since it also measures the rate of acceleration ordeceleration between two moving averages (a fast moving average and a slow one) to describe amarket's momentum, MACD also serves as a momentum oscillator.
The MACD consists of two lines that are derived from three exponential moving averages(EMA's). The MACD line is usually constructed by calculating the difference between a 12-barEMA and a 26-bar EMA; the Signal line is usually a 9-bar EMA of the MACD line. In Gemini,we employ shorter EMA lengths to make the system more sensitive than the standard MACD.For example, our MACD for IBM is a 3-7-8 MACD (the difference between a 3-bar and a 7-barEMA and an 8-bar EMA of the difference).
We look for Gemini setups in the weekly time frame. The first condition for a buy setup is thatthe Signal line must be above the zero line. Then, the MACD line must cross below the Signalline for the first time since the Signal line crossed above zero. With this setup, the Signal line istelling us that the weekly trend is up, and the MACD line is telling us that a countertrendretracement has occurred. For a setup to sell short, the Signal line must be below zero, and theMACD line must cross above the Signal line (the crossover must be the first one since the Signalline declined below zero). This setup alerts us that although the weekly trend is down, acountertrend rally is in effect.
Omega Research System Trading and Development Club - Volume 1082 Defining Our Trading Rules
With a setup in place on the weekly chart, we turn our attention to the daily chart for our actual entryinto a trade. If the weekly setup is bullish, we'll buy a price-channel breakout on the daily bars; if theweekly setup is bearish, we'll sell a breakout on the dailies. A bullish price-channel breakout occurswhen prices rally above the highest high of a specified number of bars, and a bearish breakout occurswhen prices decline below the lowest low of a specified number of bars. In most trading systems, thenumber of bars specified for the price channel is fairly large - in the neighborhood of 20 to 40 bars.However, in Gemini we can construct a price channel with a smaller number of bars-three to five-because the weekly setup tells us that the current environment is very favorable for an aggressiveentry in the daily time frame.
With a long setup on the weekly chart, we'll buy on the daily chart at the highest high of the last threebars plus one point; with a short setup on the weekly chart, we'll sell short at the lowest low of the lastthree bars minus one point. Of course, we'll write the number of bars to consider for our entry on thedaily chart as an input so that we can test and optimize it easily.
Once we've entered a position, we'll manage the trade with an entry bar dollar stop, a dollar risk stop,a breakeven stop, and a trailing stop. Our entry bar dollar stop will limit the amount we could lose ifthe market suddenly reversed its direction on the same day as our entry into the trade. The dollar riskstop takes effect the day after our entry and sets the dollar amount (calculated from the entry price)that we are willing to risk on the trade. The breakeven stop is implemented after the market moves inour favor by a specified dollar amount (called the breakeven floor); it's set a little above our entryprice for a long position and a little below our entry price for a short position, enabling us to cover thecost of the commission. The trailing stop is placed a point below the lowest low of a specifiednumber of bars for a long position and a point above the highest high of a specified number of barsfor a short position. As a market trades in our favor, the trailing stop protects some of our openprofits so that a trend reversal won't cause a winning trade to become a breakeven trade or a losingtrade.
Defining Our Trading RulesIn this system, we defined long and short setups, entry conditions, and four stops. We also calculateda weekly MACD and a daily price channel.
Setups
a) The setup for a long position is the weekly MACD line crossing below the weekly Signal line forthe first time since the Signal line crossed above zero.
b) The setup for a short position is the weekly MACD line crossing above the weekly Signal line forthe first time since the Signal line crossed below zero.
Entries
a) The long entry is at one point above the highest high of the last n-bars on the daily chart.
b) The short entry is at one point below the lowest low of the last n-bars on the daily chart.
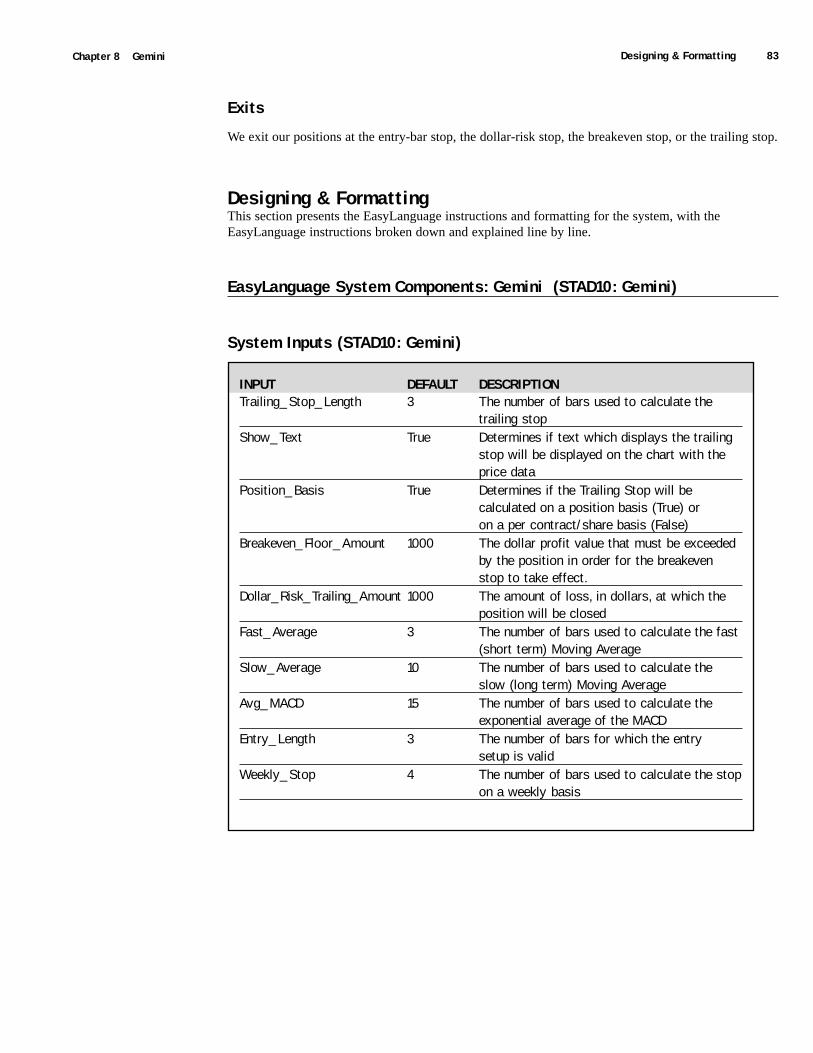
Designing & Formatting 83Chapter 8 Gemini
Exits
We exit our positions at the entry-bar stop, the dollar-risk stop, the breakeven stop, or the trailing stop.
Designing & FormattingThis section presents the EasyLanguage instructions and formatting for the system, with theEasyLanguage instructions broken down and explained line by line.
EasyLanguage System Components: Gemini (STAD10: Gemini)
System Inputs (STAD10: Gemini)
INPUT DEFAULT DESCRIPTIONTrailing_Stop_Length 3 The number of bars used to calculate the
trailing stopShow_Text True Determines if text which displays the trailing
stop will be displayed on the chart with the price data
Position_Basis True Determines if the Trailing Stop will becalculated on a position basis (True) oron a per contract/share basis (False)
Breakeven_Floor_Amount 1000 The dollar profit value that must be exceeded by the position in order for the breakevenstop to take effect.
Dollar_Risk_Trailing_Amount 1000 The amount of loss, in dollars, at which the position will be closed
Fast_Average 3 The number of bars used to calculate the fast (short term) Moving Average
Slow_Average 10 The number of bars used to calculate the slow (long term) Moving Average
Avg_MACD 15 The number of bars used to calculate the exponential average of the MACD
Entry_Length 3 The number of bars for which the entrysetup is valid
Weekly_Stop 4 The number of bars used to calculate the stop on a weekly basis
Omega Research System Trading and Development Club - Volume 1084 Designing & Formatting
Signal Components:
1. Gemini
2. Dllr Risk Trailing
3. Breakeven Stop-floor
4. Trailing Stop LX
5. Trailing Stop SX
EasyLanguage Signal: Gemini:
Inputs: FastMA(3), SlowMA(10), AvgMA(15), EntryLength(3), WklyStop(4);Variables: MACDLine(0), SignalLine(0), ZeroLine(0), UpTrend(False), DnTrend(False), UpFlag(True),DnFlag(True);
{Calculation variables}MACDLine = MACD(Close, FastMA, SlowMA) Data2;SignalLine = XAverage(MACD(Close, FastMA, SlowMA) Data2, AvgMA) Data2;
If SignalLine > ZeroLine Then BeginDnTrend = False;If MACDLine > SignalLine AND UpFlag Then Begin
UpTrend = True;UpFlag = False;DnFlag = True;
End;End;If SignalLine < ZeroLine Then Begin
UpTrend = False;If MACDLine < SignalLine AND DnFlag Then Begin
DnTrend = True;DnFlag = False;UpFlag = True;
End;End;
If UpTrend AND MACDLine < SignalLine ThenBuy Next Bar at Highest(High, EntryLength) + 1 Point Stop;
If DnTrend AND MACDLine > SignalLine ThenSell Next Bar at Lowest(Low, EntryLength) - 1 Point Stop;
If MarketPosition = 1 ThenUpTrend = False;
If MarketPosition = -1 ThenDnTrend = False;
{Weekly Trailing Stop}ExitLong Next Bar at Lowest(Low, WklyStop) Data2 - 1 Point Stop;ExitShort Next Bar at Highest(High, WklyStop) Data2 + 1 Point Stop;
Designing & Formatting 85Chapter 8 Gemini
Signal Inputs (Gemini)
Signal Variables (Gemini)
Setup
The MACD value and the Signal value are calculated based on Data2 and assigned to variables sothey can be referenced throughout the Signal.
MACDLine = MACD(Close, FastMA, SlowMA) Data2;SignalLine = XAverage(MACD(Close, FastMA, SlowMA) Data2, AvgMA) Data2;
When the SignalLine is above the ZeroLine a preliminary down trend is indicated. The DnTrend flagis then set to False. If the MACDLine is above the SignalLine and the UpFlag variable is True, an uptrend is confirmed, and the UpTrend variable is set to True. The UpFlag variable is then set to False,indicating that the MACDLine has crossed above the SignalLine for the first time. The DnFlagvariable is set to True to prepare for the next down trend (when the MACDLine is below theSignalLine).
INPUT DEFAULT DESCRIPTIONFastMA 3 The number of bars used to calculate the fast
(short term) Moving AverageSlowMA 10 The number of bars used to calculate the
slow (long term) Moving AverageAvgMA 15 The number of bars used to calculate the
exponential average of the MACDEntryLength 3 The number of bars used to calculate the
Entry signalsWklyStop 4 The number of bars used to calculate the stop
on a weekly basis
VARIABLE DEFAULT DESCRIPTIONMACDLine 0 [Numeric] Holds the value of the MACD lineSignalLine 0 [Numeric] Holds the value of the Signal lineZeroLine 0 [Numeric] Holds the zero value used
in the SignalUpTrend False [True/False] Indicates the presence of an
Up trendDnTrend False [True/False] Indicates the presence of a
Down trendUpFlag True [True/False] Indicates the first time the
MACD line crosses above the Signal lineDnFlag True [True/False] Indicates the first time the
MACD line crosses below the Signal line
Omega Research System Trading and Development Club - Volume 1086 Designing & Formatting
If SignalLine > ZeroLine Then BeginDnTrend = False;If MACDLine > SignalLine AND UpFlag Then Begin
UpTrend = True;UpFlag = False;DnFlag = True;
End;End;
When the SignalLine is below the ZeroLine, a preliminary down trend is indicated. The UpTrend flagis then set to False. If the MACDLine is below the SignalLine and the DnFlag variable is True, adown trend is confirmed and the DnTrend variable is set to True. The DnFlag variable is then set toFalse, indicating that the MACDLine has crossed below the SignalLine for the first time. The UpFlagvariable is set to True to prepare for the next up trend (when the MACDLine is above the SignalLine).
If SignalLine < ZeroLine Then BeginUpTrend = False;If MACDLine < SignalLine AND DnFlag Then Begin
DnTrend = True;DnFlag = False;UpFlag = True;
End;End;
Long & Short Entries
If an up trend has been confirmed, as indicated by a True UpTrend variable, and the MACDLine hasfallen below the SignalLine, a Buy Stop order is generated at the highest High plus 1 point. If a downtrend has been confirmed, as indicated by a True DnTrend variable, and the MACDLine has risenabove the SignalLine, a Sell Stop order is generated at the lowest Low minus 1 point.
If UpTrend AND MACDLine < SignalLine ThenBuy Next Bar at Highest(High, EntryLength) + 1 Point Stop;
If DnTrend AND MACDLine > SignalLine ThenSell Next Bar at Lowest(Low, EntryLength) - 1 Point Stop;
Once a Long position has been taken, as indicated by a MarketPosition value of 1, the UpTrendvariable is set to False so no additional Long Entries can be generated. Once a Short position hasbeen taken, as indicated by a MarketPosition value of -1, the DnTrend variable is set to False so noadditional Short Entries can be generated.
If MarketPosition = 1 ThenUpTrend = False;
If MarketPosition = -1 ThenDnTrend = False;
Designing & Formatting 87Chapter 8 Gemini
Trailing Stop
Trailing Stops based on the lowest Low for Long positions and the highest High for Short positionsare generated on each bar, regardless of position. By doing this, the stops will be active from the barof entry. The stops only actually affect the System when there is an open position.
ExitLong Next Bar at Lowest(Low, WklyStop) Data2 - 1 Point Stop;ExitShort Next Bar at Highest(High, WklyStop) Data2 + 1 Point Stop;
EasyLanguage Signal: Dllr Risk Trailing:
Inputs: PositionBasis(True), Amount(0);
If PositionBasis ThenSetStopPosition
ElseSetStopContract;
SetDollarTrailing(Amount);
Signal Inputs (Dllr Risk Trailing)
Signal Variables (Dllr Risk Trailing)
NONE
Setup
This section determines if the Dllr Risk Trailing calculation will be based on a position basis or percontract/share basis. If the PositionBasis Input is True, the Dollar Risk is calculated on a positionbasis. If the PositionBasis is set to False, the Dollar Risk is calculated on a per contract/share basis.
If PositionBasis ThenSetStopPosition
ElseSetStopContract;
INPUT DEFAULT DESCRIPTIONPositionBasis True Determines if the Dollar Risk will be
calculated on a position basis (True)or on a per contract/share basis (False)
Amount 0 The amount of loss, in dollars, at whichthe position will be closed
Omega Research System Trading and Development Club - Volume 1088 Designing & Formatting
Dollar Risk Trailing Exit
The SetDollarTrailing statement calculates the Dollar Risk Trailing Stop for either a Long or Shortposition.
SetDollarTrailing(Amount);
EasyLanguage Signal: Breakeven Stop-floor:
Inputs: PositionBasis(True), FloorAmnt(0);
If PositionBasis ThenSetStopPosition
ElseSetStopContract;
SetBreakeven(FloorAmnt);
Signal Inputs (Breakeven Stop-floor)
Signal Variables (Breakeven Stop-floor)
NONE
Setup
This section determines if the Breakeven calculation will be based on a position basis or percontract/share basis. If the PositionBasis Input is True, the Breakeven point is calculated on aposition basis. If the PositionBasis is set to False, the Breakeven point is calculated on a percontract/share basis.
If PositionBasis ThenSetStopPosition
ElseSetStopContract;
INPUT DEFAULT DESCRIPTIONPositionBasis True Determines if the Breakeven will be calculated
on a position basis (True) or on a percontract/share basis (False)
Amount 0 The amount of profit that must be met beforethe breakdown stop takes effect
Designing & Formatting 89Chapter 8 Gemini
Breakeven Stop
The SetBreakeven statement calculates the Breakeven Stop value for either a Long or Short position,based on the FloorAmnt specified.
SetBreakeven(FloorAmnt);
EasyLanguage Signal: Trailing Stop LX
Inputs: Length(3), ShowText(True);Variables: OrderPrice(0), StopText(0);
OrderPrice = LowestFC(Low, Length);
ExitLong ("Trl") Next Bar at OrderPrice Stop;
If ShowText AND LastBarOnChart ThenStopText = ShowLongStop(OrderPrice);
Signal Inputs (Trailing Stop LX)
Signal Variables (Trailing Stop LX)
Setup
The Trailing Stop uses the lowest Low calculation to determine the price at which the Exit ordershould be placed. This value is calculated and assigned to the 'OrderPrice' Variable.
OrderPrice = LowestFC(Low, Length);
INPUT DEFAULT DESCRIPTIONLength 3 Number of bars used in the calculation of the
Trailing StopShowText True True/False Input to determine if next Stop
price will be displayed on the chart
VARIABLE DEFAULT DESCRIPTIONOrderPrice 0 [Numeric] Holds the value of the lowest Low
calculation at which the order will be placedStopText 0 [Numeric] The Variable to which the
ShowLongStop Function is assigned.
Omega Research System Trading and Development Club - Volume 1090 Designing & Formatting
Long Exit
For each bar a Long Exit Stop order is placed at the 'OrderPrice', which represents the lowest Low fora specified period.
ExitLong ("Trl") Next Bar at OrderPrice Stop;
Additional Parameters
If the 'ShowText' Input is TRUE and the current bar is the last bar on the chart, the 'ShowLongStop'Function is utilized to place text and an arrow on the chart at the Trailing Stop price. This indicationis only placed on the chart for open orders.
If ShowText AND LastBarOnChart ThenStopText = ShowLongStop(OrderPrice);
EasyLanguage Signal: Trailing Stop SX
Inputs: Length(3), ShowText(True);Variables: OrderPrice(0), StopText(0);
OrderPrice = HighestFC(High, Length);
ExitShort ("Trl") Next Bar at OrderPrice Stop;
If ShowText AND LastBarOnChart ThenStopText = ShowShortStop(OrderPrice);
Signal Inputs (Trailing Stop SX)
Signal Variables (Trailing Stop SX)
INPUT DEFAULT DESCRIPTIONLength 3 Number of bars used in the calculation of the
Trailing StopShowText True True/False Input to determine if next Stop
price will be displayed on the chart
INPUT DEFAULT DESCRIPTIONOrderPrice 0 [Numeric] Holds the value of the highest High
calculation at which the order will be placedStopText 0 [Numeric] The Variable to which the
ShowShortStop Function is assigned.
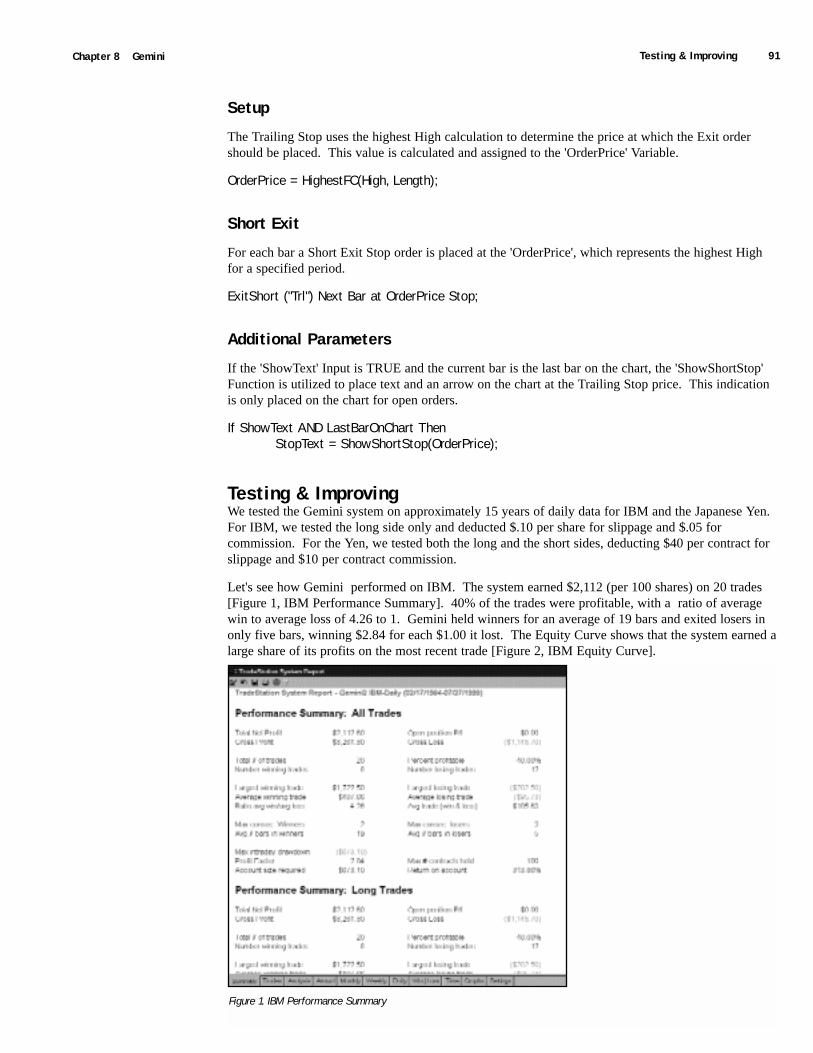
Testing & Improving 91Chapter 8 Gemini
Setup
The Trailing Stop uses the highest High calculation to determine the price at which the Exit ordershould be placed. This value is calculated and assigned to the 'OrderPrice' Variable.
OrderPrice = HighestFC(High, Length);
Short Exit
For each bar a Short Exit Stop order is placed at the 'OrderPrice', which represents the highest Highfor a specified period.
ExitShort ("Trl") Next Bar at OrderPrice Stop;
Additional Parameters
If the 'ShowText' Input is TRUE and the current bar is the last bar on the chart, the 'ShowShortStop'Function is utilized to place text and an arrow on the chart at the Trailing Stop price. This indicationis only placed on the chart for open orders.
If ShowText AND LastBarOnChart ThenStopText = ShowShortStop(OrderPrice);
Testing & ImprovingWe tested the Gemini system on approximately 15 years of daily data for IBM and the Japanese Yen.For IBM, we tested the long side only and deducted $.10 per share for slippage and $.05 forcommission. For the Yen, we tested both the long and the short sides, deducting $40 per contract forslippage and $10 per contract commission.
Let's see how Gemini performed on IBM. The system earned $2,112 (per 100 shares) on 20 trades[Figure 1, IBM Performance Summary]. 40% of the trades were profitable, with a ratio of averagewin to average loss of 4.26 to 1. Gemini held winners for an average of 19 bars and exited losers inonly five bars, winning $2.84 for each $1.00 it lost. The Equity Curve shows that the system earned alarge share of its profits on the most recent trade [Figure 2, IBM Equity Curve].
Figure 1. IBM Performance Summary
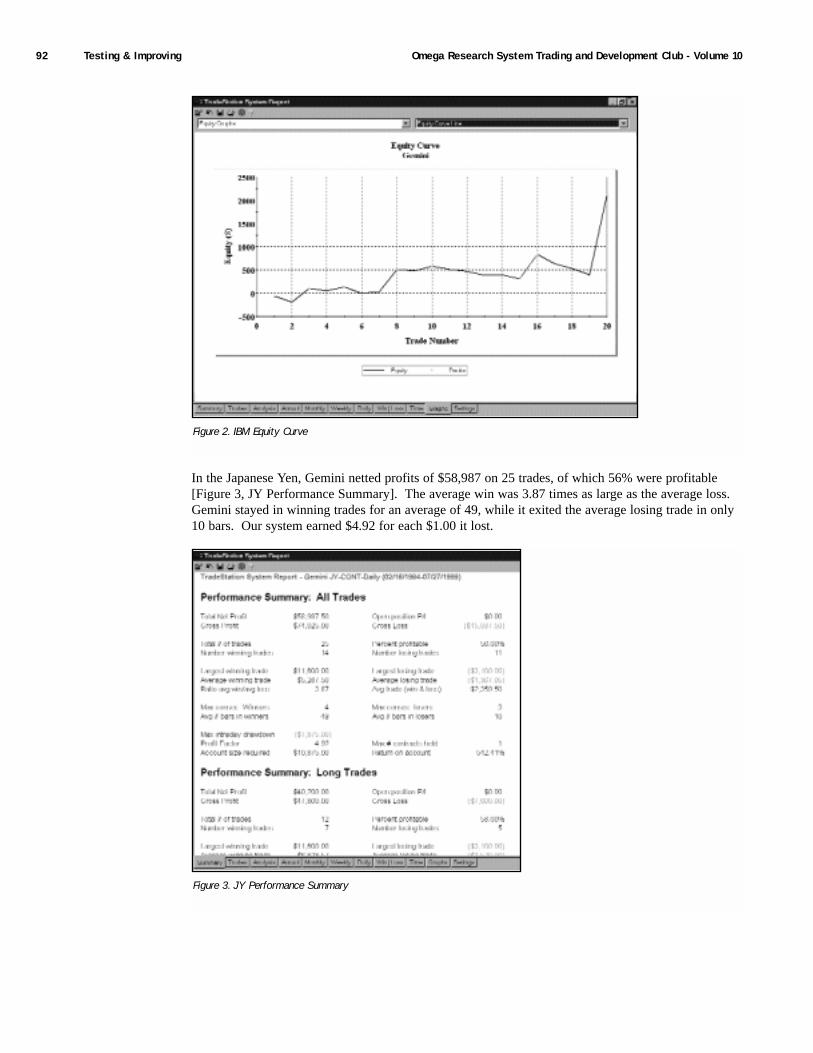
Omega Research System Trading and Development Club - Volume 1092 Testing & Improving
In the Japanese Yen, Gemini netted profits of $58,987 on 25 trades, of which 56% were profitable[Figure 3, JY Performance Summary]. The average win was 3.87 times as large as the average loss.Gemini stayed in winning trades for an average of 49, while it exited the average losing trade in only10 bars. Our system earned $4.92 for each $1.00 it lost.
Figure 2. IBM Equity Curve
Figure 3. JY Performance Summary
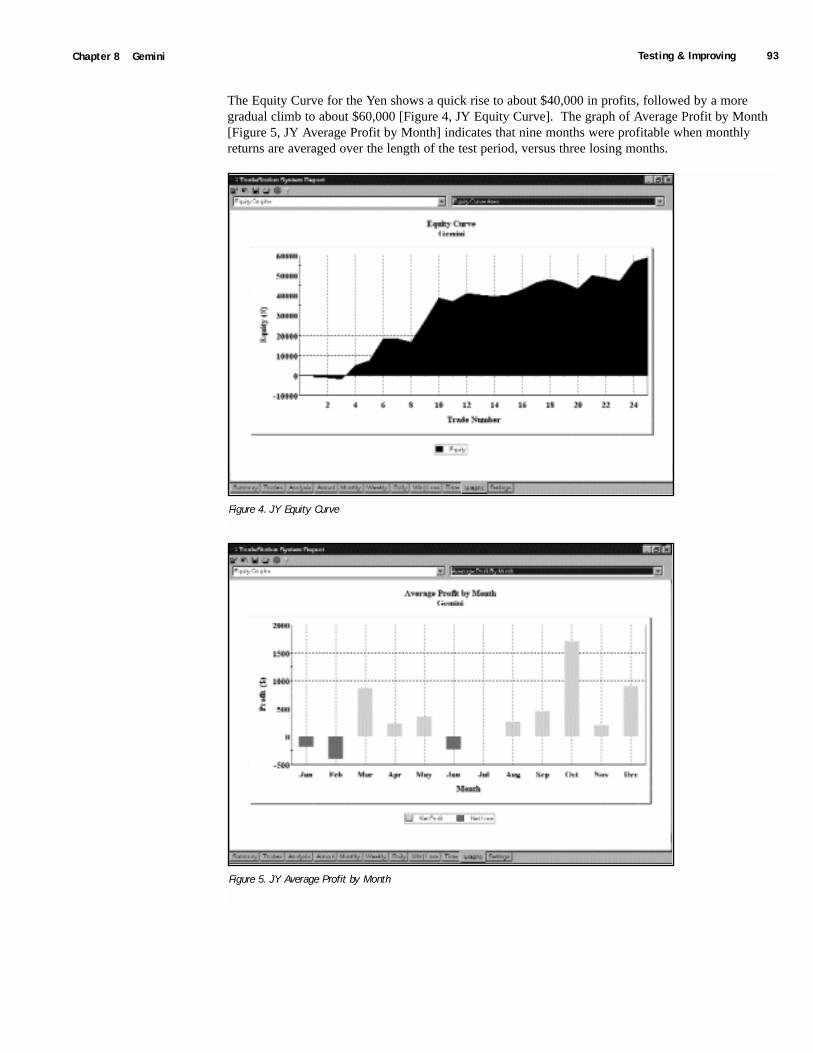
Testing & Improving 93Chapter 8 Gemini
The Equity Curve for the Yen shows a quick rise to about $40,000 in profits, followed by a moregradual climb to about $60,000 [Figure 4, JY Equity Curve]. The graph of Average Profit by Month[Figure 5, JY Average Profit by Month] indicates that nine months were profitable when monthlyreturns are averaged over the length of the test period, versus three losing months.
Figure 4. JY Equity Curve
Figure 5. JY Average Profit by Month
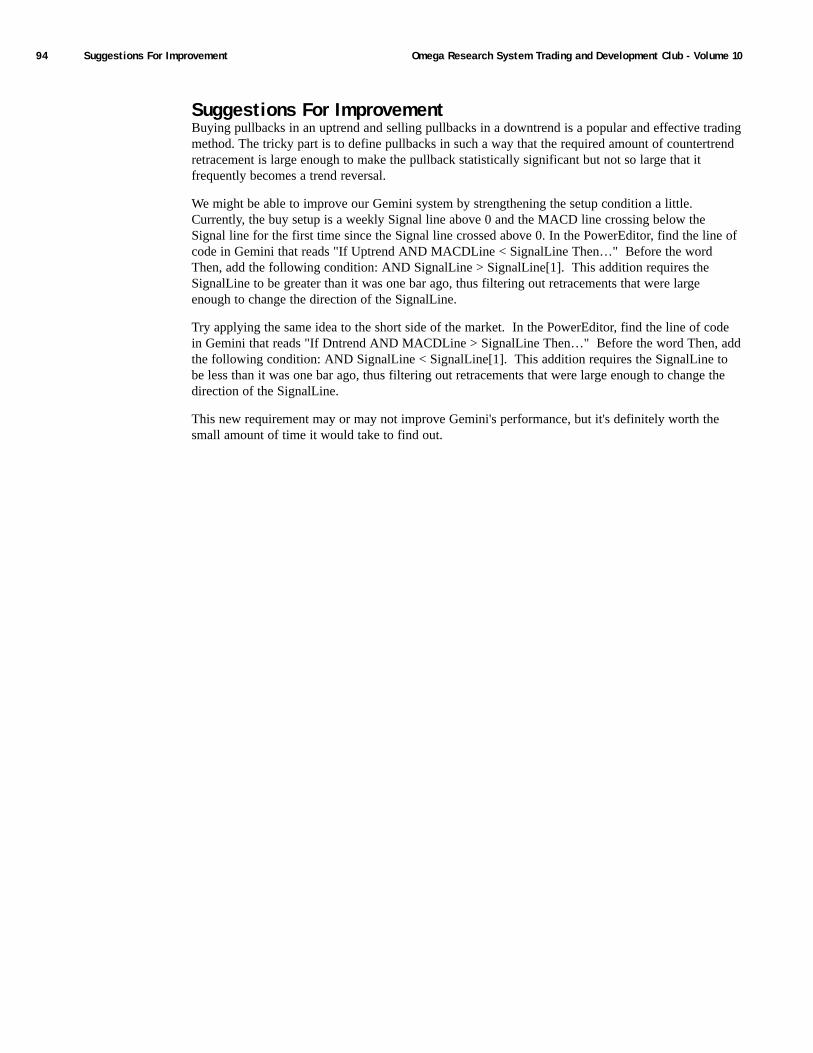
Omega Research System Trading and Development Club - Volume 1094 Suggestions For Improvement
Suggestions For ImprovementBuying pullbacks in an uptrend and selling pullbacks in a downtrend is a popular and effective tradingmethod. The tricky part is to define pullbacks in such a way that the required amount of countertrendretracement is large enough to make the pullback statistically significant but not so large that itfrequently becomes a trend reversal.
We might be able to improve our Gemini system by strengthening the setup condition a little.Currently, the buy setup is a weekly Signal line above 0 and the MACD line crossing below theSignal line for the first time since the Signal line crossed above 0. In the PowerEditor, find the line ofcode in Gemini that reads "If Uptrend AND MACDLine < SignalLine Then…" Before the wordThen, add the following condition: AND SignalLine > SignalLine[1]. This addition requires theSignalLine to be greater than it was one bar ago, thus filtering out retracements that were largeenough to change the direction of the SignalLine.
Try applying the same idea to the short side of the market. In the PowerEditor, find the line of codein Gemini that reads "If Dntrend AND MACDLine > SignalLine Then…" Before the word Then, addthe following condition: AND SignalLine < SignalLine[1]. This addition requires the SignalLine tobe less than it was one bar ago, thus filtering out retracements that were large enough to change thedirection of the SignalLine.
This new requirement may or may not improve Gemini's performance, but it's definitely worth thesmall amount of time it would take to find out.
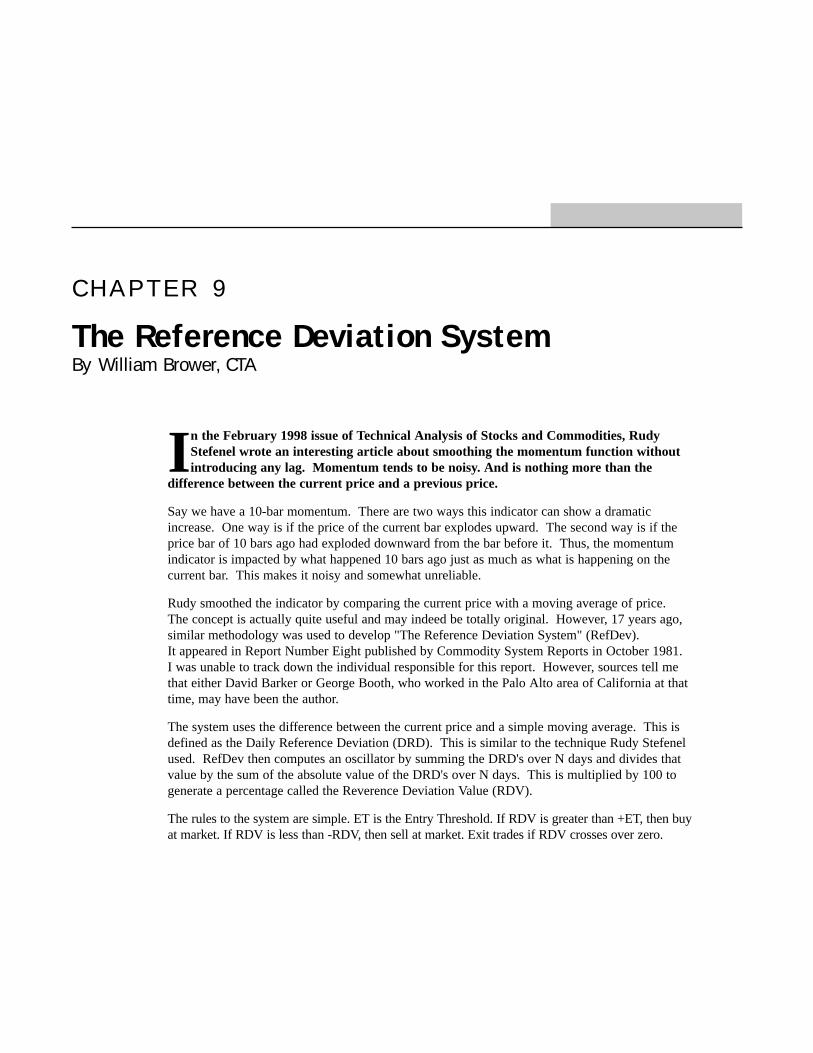
C H A P T E R 9
The Reference Deviation SystemBy William Brower, CTA
In the February 1998 issue of Technical Analysis of Stocks and Commodities, RudyStefenel wrote an interesting article about smoothing the momentum function withoutintroducing any lag. Momentum tends to be noisy. And is nothing more than the
difference between the current price and a previous price.
Say we have a 10-bar momentum. There are two ways this indicator can show a dramaticincrease. One way is if the price of the current bar explodes upward. The second way is if theprice bar of 10 bars ago had exploded downward from the bar before it. Thus, the momentumindicator is impacted by what happened 10 bars ago just as much as what is happening on thecurrent bar. This makes it noisy and somewhat unreliable.
Rudy smoothed the indicator by comparing the current price with a moving average of price.The concept is actually quite useful and may indeed be totally original. However, 17 years ago,similar methodology was used to develop "The Reference Deviation System" (RefDev).It appeared in Report Number Eight published by Commodity System Reports in October 1981.I was unable to track down the individual responsible for this report. However, sources tell methat either David Barker or George Booth, who worked in the Palo Alto area of California at thattime, may have been the author.
The system uses the difference between the current price and a simple moving average. This isdefined as the Daily Reference Deviation (DRD). This is similar to the technique Rudy Stefenelused. RefDev then computes an oscillator by summing the DRD's over N days and divides thatvalue by the sum of the absolute value of the DRD's over N days. This is multiplied by 100 togenerate a percentage called the Reverence Deviation Value (RDV).
The rules to the system are simple. ET is the Entry Threshold. If RDV is greater than +ET, then buyat market. If RDV is less than -RDV, then sell at market. Exit trades if RDV crosses over zero.
Omega Research System Trading and Development Club - Volume 1096 Designing & Formatting
Designing & FormattingThis section presents the EasyLanguage instructions and formatting for the system, with theEasyLanguage instructions broken down and explained line by line.
EasyLanguage System Components: Ref Dev (STAD10: Ref Dev2)
System Inputs (STAD10: Ref Dev2)
Signal Components:
1. Reference Deviation2
2. Last Bar Exit
EasyLanguage Signal: Ref Dev2:
Inputs:ETLong(5), {Entry Threshold for Long Trades}ETShort(-5), {Entry Threshold for Short Trades}RMALen(15); {Reference Moving Average Length}
Variables:RDV(0), {Reference Deviation Value}TDV(0), {Total Deviation Value}NDV(0), {Net Deviation Value}RMA(0), {Reference Moving Average}DRD(0); {Daily Reference Deviation}
RMA = Average(Close, RMALen);DRD = Close - RMA;NDV = Summation(DRD, RMALen);TDV = Summation(AbsValue(DRD), RMALen);
If TDV > 0 Then RDV = 100 * NDV / TDV;
{Long Entry}If RDV > ETLong Then
Buy Next Bar at Market;
INPUT DEFAULT DESCRIPTIONEntryThreshold_Long 5 The entry threshold for Long tradesEntryThreshold_Short -5 The entry threshold for Short tradesReferenceMA_Length 15 The number of bars used to calculate the
Moving Average
Designing & Formatting 97Chapter 9 The Reference Deviation System
{Short Entry}If RDV < ETShort Then
Sell Next Bar at Market;
{Long Exit}If RDV < 0 Then
ExitLong Next Bar at Market;{Short Exit}If RDV > 0 Then
ExitShort Next Bar at Market;
Signal Inputs (Ref Dev2)
Signal Variables (Ref Dev2)
Setup
In the setup, we initialize variables that represent the primary elements of the Signal
RMA = Average(Close, RMALen);
DRD = Close - RMA;
NDV = Summation(DRD, RMALen);
TDV = Summation(AbsValue(DRD), RMALen);
Before performing the calculation for the variable RDV, we first check that the TDV variable is notequal to zero. This helps us to avoid any problems with division by zero.
If TDV > 0 Then RDV = 100 * NDV / TDV;
INPUT DEFAULT DESCRIPTIONEntryThreshold_Long 5 The entry threshold for long tradesEntryThreshold_Short -5 The entry threshold for short tradesReferenceMA_Length 15 The number of bars used to calculate the
Moving Average
VARIABLE DEFAULT DESCRIPTIONRDV 0 [Numeric] Reference Deviation ValueTDV 0 [Numeric] Total Deviation ValueNDV 0 [Numeric] Net Deviation ValueRMA 0 [Numeric] Reference Moving AverageDRD 0 [Numeric] Daily Reference Deviation
Omega Research System Trading and Development Club - Volume 1098 Designing & Formatting
Long Entry
If the Reference Deviation Value (RDV) is greater than the Long Entry Threshold (ETLong), a Buyorder is generated at Market (at the Open of the next bar).
If RDV > ETLong Then Buy Next Bar at Market;
Short Entry
If the Reference Deviation Value (RDV) is less than the Short Entry Threshold (ETShort), a Sell orderis generated at Market (at the Open of the next bar).
If RDV < ETShort Then Sell Next Bar at Market;
Long Exit
If the Reference Deviation Value falls below zero, a Long Exit order is generated at Market (for theOpen of the next bar).
If RDV < 0 Then ExitLong Next Bar at Market;
Short Exit
If the Reference Deviation Value rises above zero, a Short Exit order is generated at Market (for theOpen of the next bar).
If RDV > 0 Then ExitShort Next Bar at Market;
EasyLanguage Signal: Last Bar Exit
** See Common Stops Appendix
System TestingThe author of this system recognized that some of the futures markets were very thinly traded,particularly the currencies. He cautioned not to test the system on data before 1980 on the thinmarkets. Our model includes the Japanese Yen in a basket with other commodities, so our startingdate for the basket is 1980.
Although there are inputs for the entry threshold for long and short trades, I decided not to use themin the optimization tests. The system is more robust without them. However, I did try a fewcombinations on the Japanese Yen to see where they should be placed. I settled on +5 for long and -5for short. All the rest of the testing on both In-Sample and Out-of-Sample was kept at these settings.
I optimized the moving average length for each commodity between 15 and 55 in increments of 5 onthe In-Sample data set. Then I used the optimized parameter on the Out-of-Sample data set.
System Testing 99Chapter 9 The Reference Deviation System
My In-Sample data was from 1/1/90 to 5/11/98. I used 1/1/80 to 4/1/90 as my Out-of-Sample data.The reason for the overlap with the In-Sample period of three months was to capture the trades at thebeginning of the In-Sample period that were clipped by the maxbarsback setting of 60.
This system is nearly always in the market because the oscillator can so easily hit the entry thresholdwhen crossing over the zero level. Figure 1 shows the results of the In-Sample and Out-of-Sampletesting. The system is profitable on both the long and short side. The moving average length for eachcommodity is listed in the table above.
Test Results
I initially tested about 25 different commodities on the In-Sample data and found 10 that gave resultsthat looked promising. Checking the results on the Out-of-Sample data excluded an additional threecommodities. That left me with Corn (C), Crude Light (CL), Cotton (CT), Dollar Index (DX), Coffee(KC), Japanese Yen (JY), and Orange Juice (OJ). Actually, OJ was questionable because of the largewinning trade in the In-Sample test. I would not argue that it probably should have been weeded out,but the Out-of-Sample test looked more reasonable.
Corn behaved satisfactorily on both data sets with the possible exception of the average profit per tradefalling off a bit in the Out-of-Sample set. However, some degradation of performance is expected sincethe In-Sample was optimized. Even so, a corn system that yields $377 per trade is not bad.
Crude Oil and Cotton also saw a drop in the average profit per trade. The drawdown for crudeactually improved, which is unusual.
The Dollar Index net profit in the Out-of-Sample test was only about half of what it was in the In-Sample, but the average profit per trade actually improved. This is consistent with the number of daysin the winning trades increasing and the number of days in losing trades decreasing. This would implythat the Dollar Index trended better in the 1990's than in the 1980's which is not intuitive.
Coffee is always a monster to trade. The net profit is second only to the Japanese Yen, however thedrawdowns were more than twice as bad. My favorite measure of a system is to divide the Net Profitby the drawdown to arrive at some measure of the reward-to-risk ratio. The ratio of Coffee is greatlyreduced by the high drawdown, and there can be no justification for including it in the portfolio.Therefore, it was left out of the final portfolio test.
Orange Juice was a bit weird. The In-Sample test was worse than the Out-of-Sample test. Also, theIn-Sample test lost money on the long trades, whereas the Out-of-Sample test lost money on the shorttrades. All the other commodities were nicely balanced on both long and short trades. Again, thismight argue in favor of excluding OJ from the portfolio. However, the overall profit from thecombined In-Sample and Out-of-Sample tests on OJ was only $20,000, so it does not really changethe picture very much. In any case, I left it in the portfolio final test.
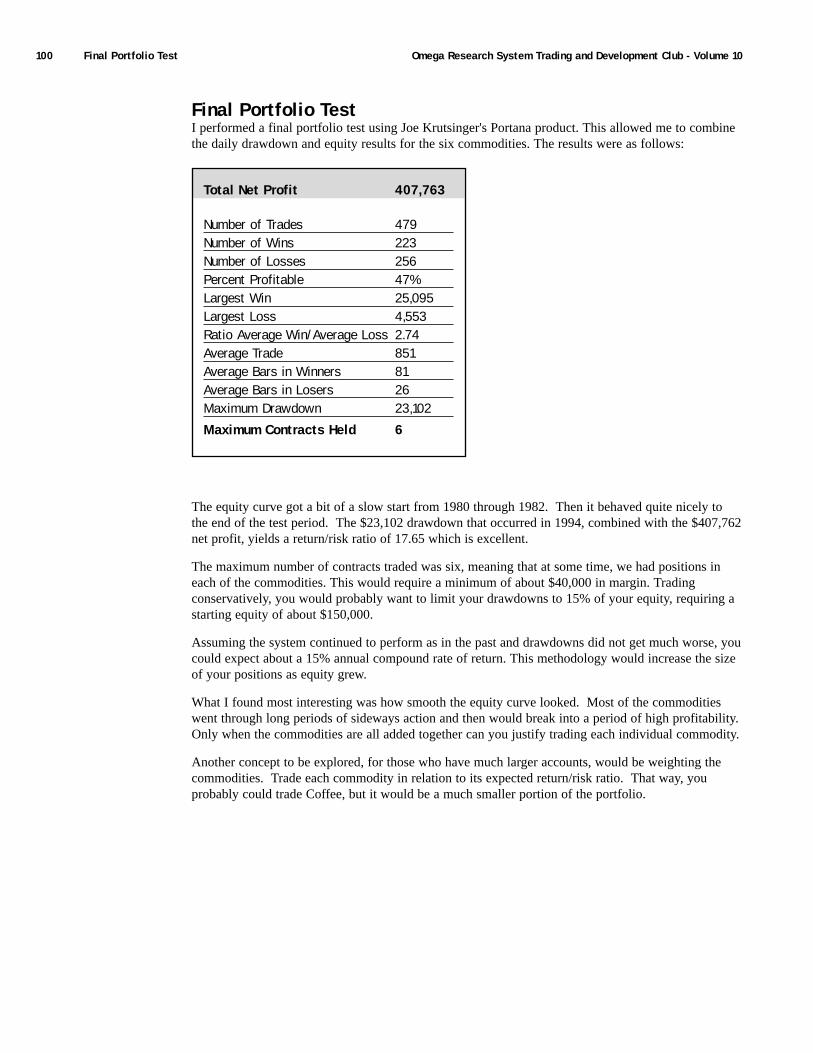
Omega Research System Trading and Development Club - Volume 10100 Final Portfolio Test
Final Portfolio TestI performed a final portfolio test using Joe Krutsinger's Portana product. This allowed me to combinethe daily drawdown and equity results for the six commodities. The results were as follows:
The equity curve got a bit of a slow start from 1980 through 1982. Then it behaved quite nicely tothe end of the test period. The $23,102 drawdown that occurred in 1994, combined with the $407,762net profit, yields a return/risk ratio of 17.65 which is excellent.
The maximum number of contracts traded was six, meaning that at some time, we had positions ineach of the commodities. This would require a minimum of about $40,000 in margin. Tradingconservatively, you would probably want to limit your drawdowns to 15% of your equity, requiring astarting equity of about $150,000.
Assuming the system continued to perform as in the past and drawdowns did not get much worse, youcould expect about a 15% annual compound rate of return. This methodology would increase the sizeof your positions as equity grew.
What I found most interesting was how smooth the equity curve looked. Most of the commoditieswent through long periods of sideways action and then would break into a period of high profitability.Only when the commodities are all added together can you justify trading each individual commodity.
Another concept to be explored, for those who have much larger accounts, would be weighting thecommodities. Trade each commodity in relation to its expected return/risk ratio. That way, youprobably could trade Coffee, but it would be a much smaller portion of the portfolio.
Total Net Profit 407,763
Number of Trades 479Number of Wins 223Number of Losses 256Percent Profitable 47%Largest Win 25,095Largest Loss 4,553Ratio Average Win/Average Loss 2.74Average Trade 851Average Bars in Winners 81Average Bars in Losers 26Maximum Drawdown 23,102Maximum Contracts Held 6
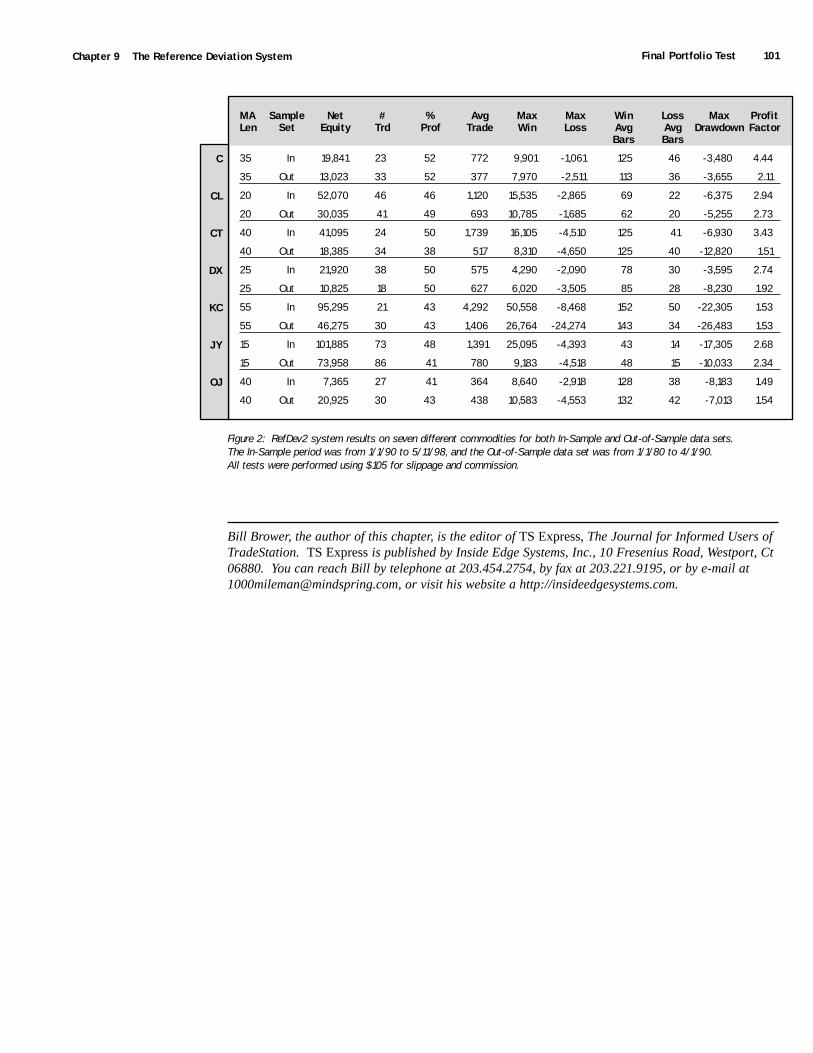
Final Portfolio Test 101Chapter 9 The Reference Deviation System
Figure 2: RefDev2 system results on seven different commodities for both In-Sample and Out-of-Sample data sets.The In-Sample period was from 1/1/90 to 5/11/98, and the Out-of-Sample data set was from 1/1/80 to 4/1/90.All tests were performed using $105 for slippage and commission.
Bill Brower, the author of this chapter, is the editor of TS Express, The Journal for Informed Users ofTradeStation. TS Express is published by Inside Edge Systems, Inc., 10 Fresenius Road, Westport, Ct06880. You can reach Bill by telephone at 203.454.2754, by fax at 203.221.9195, or by e-mail [email protected], or visit his website a http://insideedgesystems.com.
MA Sample Net # % Avg Max Max Win Loss Max ProfitLen Set Equity Trd Prof Trade Win Loss Avg Avg Drawdown Factor
Bars Bars
35 In 19,841 23 52 772 9,901 -1,061 125 46 -3,480 4.44
35 Out 13,023 33 52 377 7,970 -2,511 113 36 -3,655 2.11
20 In 52,070 46 46 1,120 15,535 -2,865 69 22 -6,375 2.94
20 Out 30,035 41 49 693 10,785 -1,685 62 20 -5,255 2.73
40 In 41,095 24 50 1,739 16,105 -4,510 125 41 -6,930 3.43
40 Out 18,385 34 38 517 8,310 -4,650 125 40 -12,820 1.51
25 In 21,920 38 50 575 4,290 -2,090 78 30 -3,595 2.74
25 Out 10,825 18 50 627 6,020 -3,505 85 28 -8,230 1.92
55 In 95,295 21 43 4,292 50,558 -8,468 152 50 -22,305 1.53
55 Out 46,275 30 43 1,406 26,764 -24,274 143 34 -26,483 1.53
15 In 101,885 73 48 1,391 25,095 -4,393 43 14 -17,305 2.68
15 Out 73,958 86 41 780 9,183 -4,518 48 15 -10,033 2.34
40 In 7,365 27 41 364 8,640 -2,918 128 38 -8,183 1.49
40 Out 20,925 30 43 438 10,583 -4,553 132 42 -7,013 1.54
C
CL
CT
DX
KC
JY
OJ

Omega Research System Trading and Development Club - Volume 10102
C H A P T E R 1 0
Superman
Although our Superman system can't "leap tall buildings in a single bound,"it does measure both the strength and the speed of a market to findtrading opportunities.
Superman employs a new function called MarketStrength to determine if a market is strongenough to set up a buying opportunity or weak enough to set up a selling opportunity. TheMarketStrength function looks at the most recent five bars and calculates the difference in theirclosing prices. A day that closes higher than the previous bar's close is positive by the amount ofthe difference; a close below the previous bar's close is negative by the amount of the difference.If the total over the five-day period is positive (or zero), the MarketStrength function divides thetotal by the sum of the up closes and multiplies the result by 100. When the total is negative,MarketStrength divides the negative total by the sum of the down closes (using the absolute valueof the negative numbers) and multiplies by 100. MarketStrength is always between +100 and -100. A buy setup is identified when MarketStrength is greater than 95; a setup to sell short isidentified when MarketStrength is less than -95.
After measuring a stock or commodity's MarketStrength, the Superman system next applies twoindicators — DollarsPerBar1 and DollarsPerBar2 — to express the market's momentum in termsof an increase or decrease in the dollar value per price bar.
The formula for DollarsPerBar1 is:
DollarsPerBar1 = BigPointValue * ((Close - Close[4]) /4);
The formula for DollarsPerBar2 is:
DollarsPerBar2 = BigPointValue * ((Close[4] - Close[8]) / 5);
The Superman system identifies a buy setup when MarketStrength is 95 or higher, DollarsPerBar1 isgreater than 0, and DollarsPerBar2 is less than 0. Superman signals a setup to sell short whenMarketStrength is -95 or lower, DollarsPerBar1 is less than 0, and DollarsPerBar2 is greater than 0.
With a buy setup in effect, we place our entry order one point above the highest high of the last fivebars; when there's a sell setup, we place our entry order one point below the lowest low of the lastfive bars. Once we've entered a long position, we trail a protective stop at the lowest low of the last nbars and take profits at our entry price plus a multiple of the trade's initial risk. When we're in a shortposition, we trail a stop at the highest high of the last n bars and take our profit at the entry priceminus a multiple of the initial risk.
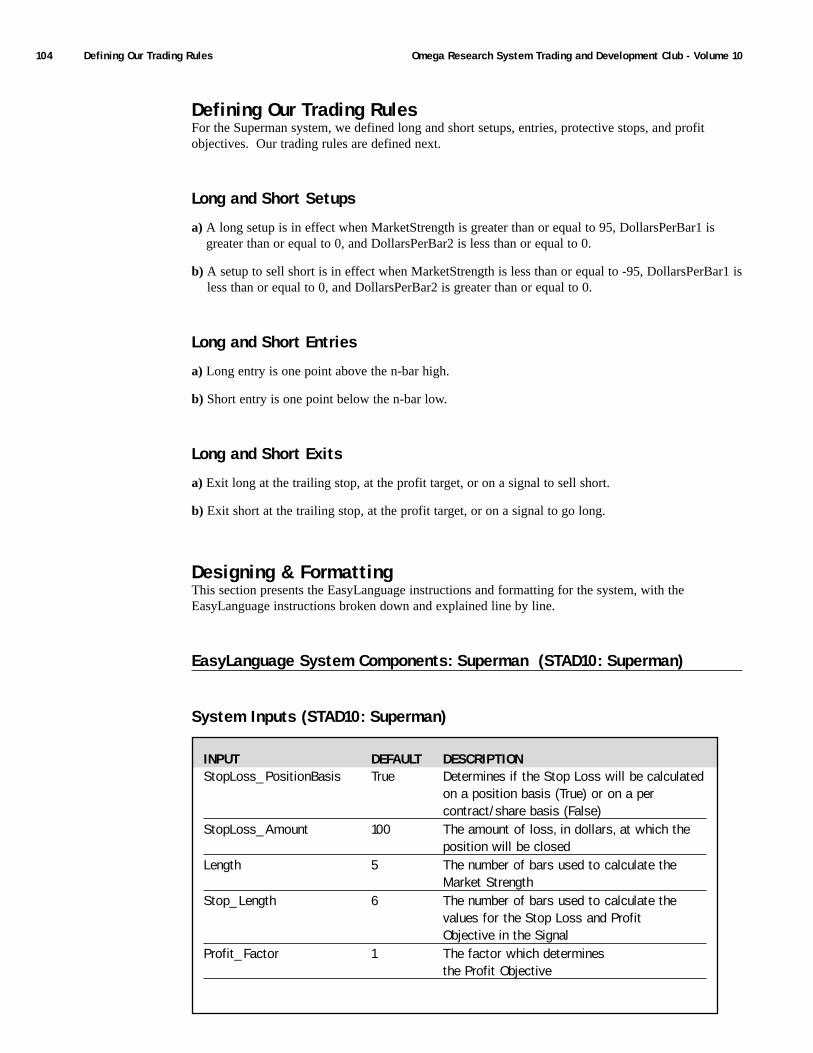
Omega Research System Trading and Development Club - Volume 10104 Defining Our Trading Rules
Defining Our Trading RulesFor the Superman system, we defined long and short setups, entries, protective stops, and profitobjectives. Our trading rules are defined next.
Long and Short Setups
a) A long setup is in effect when MarketStrength is greater than or equal to 95, DollarsPerBar1 isgreater than or equal to 0, and DollarsPerBar2 is less than or equal to 0.
b) A setup to sell short is in effect when MarketStrength is less than or equal to -95, DollarsPerBar1 isless than or equal to 0, and DollarsPerBar2 is greater than or equal to 0.
Long and Short Entries
a) Long entry is one point above the n-bar high.
b) Short entry is one point below the n-bar low.
Long and Short Exits
a) Exit long at the trailing stop, at the profit target, or on a signal to sell short.
b) Exit short at the trailing stop, at the profit target, or on a signal to go long.
Designing & FormattingThis section presents the EasyLanguage instructions and formatting for the system, with theEasyLanguage instructions broken down and explained line by line.
EasyLanguage System Components: Superman (STAD10: Superman)
System Inputs (STAD10: Superman)
INPUT DEFAULT DESCRIPTIONStopLoss_PositionBasis True Determines if the Stop Loss will be calculated
on a position basis (True) or on a percontract/share basis (False)
StopLoss_Amount 100 The amount of loss, in dollars, at which the position will be closed
Length 5 The number of bars used to calculate the Market Strength
Stop_Length 6 The number of bars used to calculate thevalues for the Stop Loss and ProfitObjective in the Signal
Profit_Factor 1 The factor which determinesthe Profit Objective
Designing & Formatting 105Chapter 10 Superman
Signal Components:
1. Superman
2. Stop Loss
EasyLanguage Signal: Superman:
Inputs: Length(5), StopLen(6), ProfitFactor(1);Variables: MktStrength(0), DollarsPerBar1(0), DollarsPerBar2(0), StopLoss(0);
MktStrength = MarketStrength(Length);DollarsPerBar1 = BigPointValue * ((Close - Close[4]) / 4);DollarsPerBar2 = BigPointValue * ((Close[4] - Close[8]) / 5);
Condition1 = DollarsPerBar1 >= 0;Condition2 = DollarsPerBar2 >= 0;
If MktStrength >= 95 AND Condition1 = True AND Condition2 = False Then BeginIf High = Highest(High, Length) AND MarketPosition <> 1 Then Begin
Buy Next Bar at Highest(High, Length) Stop;ExitShort ("LngRev") This Bar on Close;StopLoss = Lowest(Low, StopLen);ExitLong ("InitLng") Next Bar at StopLoss Stop;
End;End;
If MktStrength <= -95 AND Condition1 = False AND Condition2 = True Then BeginIf Low = Lowest(Low, Length) AND MarketPosition <> -1 Then Begin
Sell Next Bar at Lowest(Low, Length) Stop;ExitLong ("ShrtRev") This Bar on Close;StopLoss = Highest(High, StopLen);ExitShort ("InitShrt") Next Bar at StopLoss Stop;
End;End;
{Stop Loss}If MarketPosition = 1 Then
ExitLong ("LngStp") Next Bar at StopLoss Stop;If MarketPosition = -1 Then
ExitShort ("ShrtStp") Next Bar at StopLoss Stop;
{Profit Objective}If MarketPosition = 1 Then
ExitLong ("LngPrft") Next Bar at EntryPrice + ((EntryPrice - StopLoss) * ProfitFactor)Limit;If MarketPosition = -1 Then
ExitShort ("ShrtPrft") Next Bar at EntryPrice - ((StopLoss - EntryPrice) * ProfitFactor)Limit;

Omega Research System Trading and Development Club - Volume 10106 Designing & Formatting
Signal Inputs (Superman)
Signal Variables (Superman)
Setup
We first initialize several variables with values that will be used later in the Signal. MktStrength isused to hold the value from the MarketStrength Function. By doing this, we only need to call theFunction once throughout the Signal. DollarsPerBar1 and DollarsPerBar2 measure the rate of changein dollars from 4 bars ago and between 4 and 8 bars ago.
MktStrength = MarketStrength(Length);DollarsPerBar1 = BigPointValue * ((Close - Close[4]) / 4);DollarsPerBar2 = BigPointValue * ((Close[4] - Close[8]) / 5);
We assign the result of the comparison of DollarsPerBar1 and DollarsPerBar2 to the variablesCondition1 and Condition2 for use later in the Signal.
Condition1 = DollarsPerBar1 >= 0;Condition2 = DollarsPerBar2 >= 0;
INPUT DEFAULT DESCRIPTIONLength 5 The number of bars used to calculate the
Market StrengthStopLen 6 The number of bars used to calculate the
values for the Stop Loss and ProfitObjective in the Signal
ProfitFactor 1 The factor which determines theProfit Objective
VARIABLE DEFAULT DESCRIPTIONMktStrength 0 [Numeric] Holds the result from the
MarketStrength FunctionDollarsPerBar1 0 [Numeric] Dollar Rate of Change from
4 bars agoDollarsPerBar2 0 [Numeric] Dollar Rate of Change between
4 and 8 bars agoStopLoss 0 [Numeric] Holds the calculated StopLoss
Designing & Formatting 107Chapter 10 Superman
Long Entry and Stop Setups
There are a total of five conditions that must be met in order for the Long Entry Signal and StopSetups to be calculated. The five conditions have been broken-up into two groups (3 and 2); mainlyfor readability. In the first group, we evaluate the value of MktStrength, Condition1, and Condition2.In the second group, we determine if the current High is a new High and we use MarketPosition toverify that we are not currently in a Long position. If the five criteria are all met, a Long Entry orderis generated, as well as both Long and Short Exits. The Buy (Long Entry) is a Stop order based onthe highest High. The Short Exit order (ExitShort) closes any existing Short positions on the Close ofthe current bar. The StopLoss value is calculated using the lowest low and a Long Exit (ExitLong) isgenerated to protect the position.
If MktStrength >= 95 AND Condition1 = True AND Condition2 = False Then BeginIf High = Highest(High, Length) AND MarketPosition <> 1 Then Begin
Buy Next Bar at Highest(High, Length) Stop;ExitShort ("LngRev") This Bar on Close;StopLoss = Lowest(Low, StopLen);ExitLong ("InitLng") Next Bar at StopLoss Stop;
End;End;
Short Entry and Stop Setups
For the Short Entry, there are also a total of five conditions that must be met in order for the ShortEntry Signal and Stop Setups to be calculated. The five conditions have been broken-up into twogroups (3 and 2) mainly for readability. In the first group, we evaluate the value of MktStrength,Condition1, and Condition2. In the second group, we determine if the current Low is a new Low andwe use MarketPosition to verify that we are not currently in a Short position. If the five criteria areall met, a Short Entry order is generated, as well as both Short and Long Exits. The Sell (Short Entry)is a Stop order based on the lowest low. The Long Exit order (ExitLong) closes any existing Longpositions on the Close of the current bar. The StopLoss value is calculated using the highest high anda Short Exit (ExitShort) is generated to protect the position.
If MktStrength <= -95 AND Condition1 = False AND Condition2 = True Then BeginIf Low = Lowest(Low, Length) AND MarketPosition <> -1 Then Begin
Sell Next Bar at Lowest(Low, Length) Stop;ExitLong ("ShrtRev") This Bar on Close;StopLoss = Highest(High, StopLen);ExitShort ("InitShrt") Next Bar at StopLoss Stop;
End;End;
Stop Loss
Once we have entered a position, Long or Short, as indicated by MarketPosition, a stop loss order isgenerated for the respective position based on the previously calculated StopLoss value.
If MarketPosition = 1 ThenExitLong ("LngStp") Next Bar at StopLoss Stop;
If MarketPosition = -1 ThenExitShort ("ShrtStp") Next Bar at StopLoss Stop;
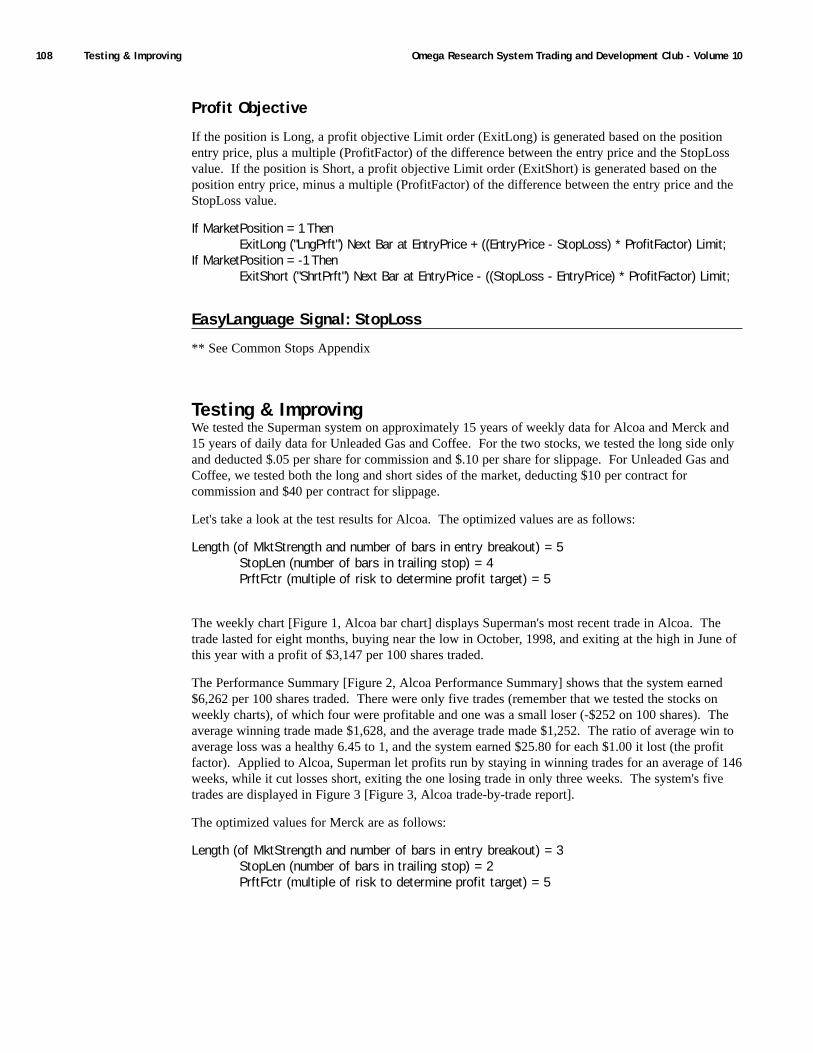
Omega Research System Trading and Development Club - Volume 10108 Testing & Improving
Profit Objective
If the position is Long, a profit objective Limit order (ExitLong) is generated based on the positionentry price, plus a multiple (ProfitFactor) of the difference between the entry price and the StopLossvalue. If the position is Short, a profit objective Limit order (ExitShort) is generated based on theposition entry price, minus a multiple (ProfitFactor) of the difference between the entry price and theStopLoss value.
If MarketPosition = 1 ThenExitLong ("LngPrft") Next Bar at EntryPrice + ((EntryPrice - StopLoss) * ProfitFactor) Limit;
If MarketPosition = -1 ThenExitShort ("ShrtPrft") Next Bar at EntryPrice - ((StopLoss - EntryPrice) * ProfitFactor) Limit;
EasyLanguage Signal: StopLoss
** See Common Stops Appendix
Testing & ImprovingWe tested the Superman system on approximately 15 years of weekly data for Alcoa and Merck and15 years of daily data for Unleaded Gas and Coffee. For the two stocks, we tested the long side onlyand deducted $.05 per share for commission and $.10 per share for slippage. For Unleaded Gas andCoffee, we tested both the long and short sides of the market, deducting $10 per contract forcommission and $40 per contract for slippage.
Let's take a look at the test results for Alcoa. The optimized values are as follows:
Length (of MktStrength and number of bars in entry breakout) = 5StopLen (number of bars in trailing stop) = 4PrftFctr (multiple of risk to determine profit target) = 5
The weekly chart [Figure 1, Alcoa bar chart] displays Superman's most recent trade in Alcoa. Thetrade lasted for eight months, buying near the low in October, 1998, and exiting at the high in June ofthis year with a profit of $3,147 per 100 shares traded.
The Performance Summary [Figure 2, Alcoa Performance Summary] shows that the system earned$6,262 per 100 shares traded. There were only five trades (remember that we tested the stocks onweekly charts), of which four were profitable and one was a small loser (-$252 on 100 shares). Theaverage winning trade made $1,628, and the average trade made $1,252. The ratio of average win toaverage loss was a healthy 6.45 to 1, and the system earned $25.80 for each $1.00 it lost (the profitfactor). Applied to Alcoa, Superman let profits run by staying in winning trades for an average of 146weeks, while it cut losses short, exiting the one losing trade in only three weeks. The system's fivetrades are displayed in Figure 3 [Figure 3, Alcoa trade-by-trade report].
The optimized values for Merck are as follows:
Length (of MktStrength and number of bars in entry breakout) = 3StopLen (number of bars in trailing stop) = 2PrftFctr (multiple of risk to determine profit target) = 5
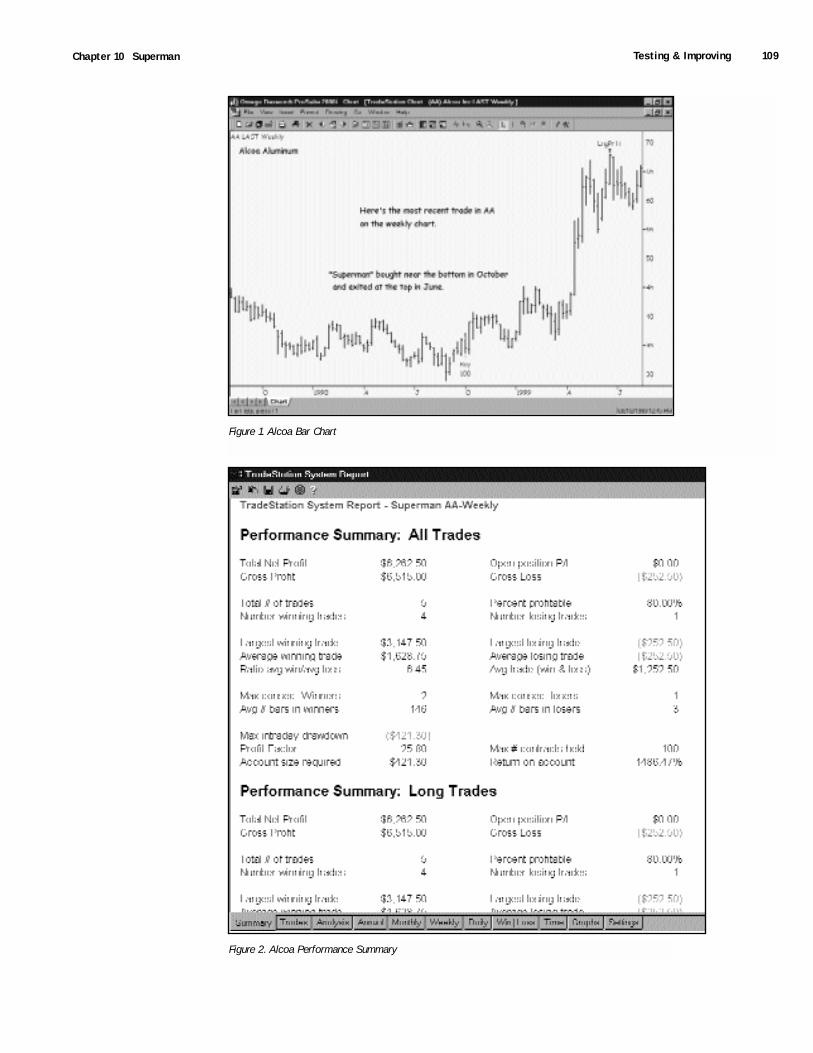
Testing & Improving 109Chapter 10 Superman
Figure 1. Alcoa Bar Chart
Figure 2. Alcoa Performance Summary
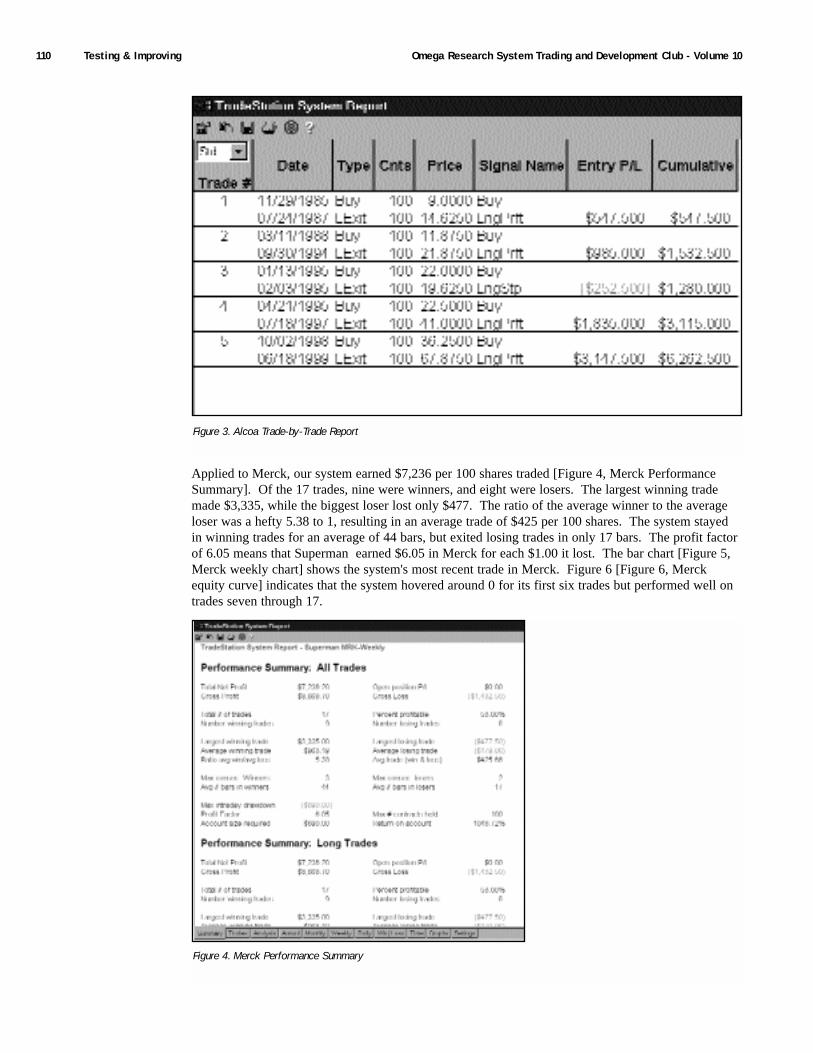
Omega Research System Trading and Development Club - Volume 10110 Testing & Improving
Applied to Merck, our system earned $7,236 per 100 shares traded [Figure 4, Merck PerformanceSummary]. Of the 17 trades, nine were winners, and eight were losers. The largest winning trademade $3,335, while the biggest loser lost only $477. The ratio of the average winner to the averageloser was a hefty 5.38 to 1, resulting in an average trade of $425 per 100 shares. The system stayedin winning trades for an average of 44 bars, but exited losing trades in only 17 bars. The profit factorof 6.05 means that Superman earned $6.05 in Merck for each $1.00 it lost. The bar chart [Figure 5,Merck weekly chart] shows the system's most recent trade in Merck. Figure 6 [Figure 6, Merckequity curve] indicates that the system hovered around 0 for its first six trades but performed well ontrades seven through 17.
Figure 3. Alcoa Trade-by-Trade Report
Figure 4. Merck Performance Summary

Testing & Improving 111Chapter 10 Superman
Now let's turn our attention to the commodities we tested. For Unleaded Gas, the optimized valuesare as follows:
Length (of MktStrength and number of bars in entry breakout) = 5StopLen (number of bars in trailing stop) = 3PrftFctr (multiple of risk to determine profit target) = 5
Figure 5. Merck Weekly Chart
Figure 6. Merck Equity Curve
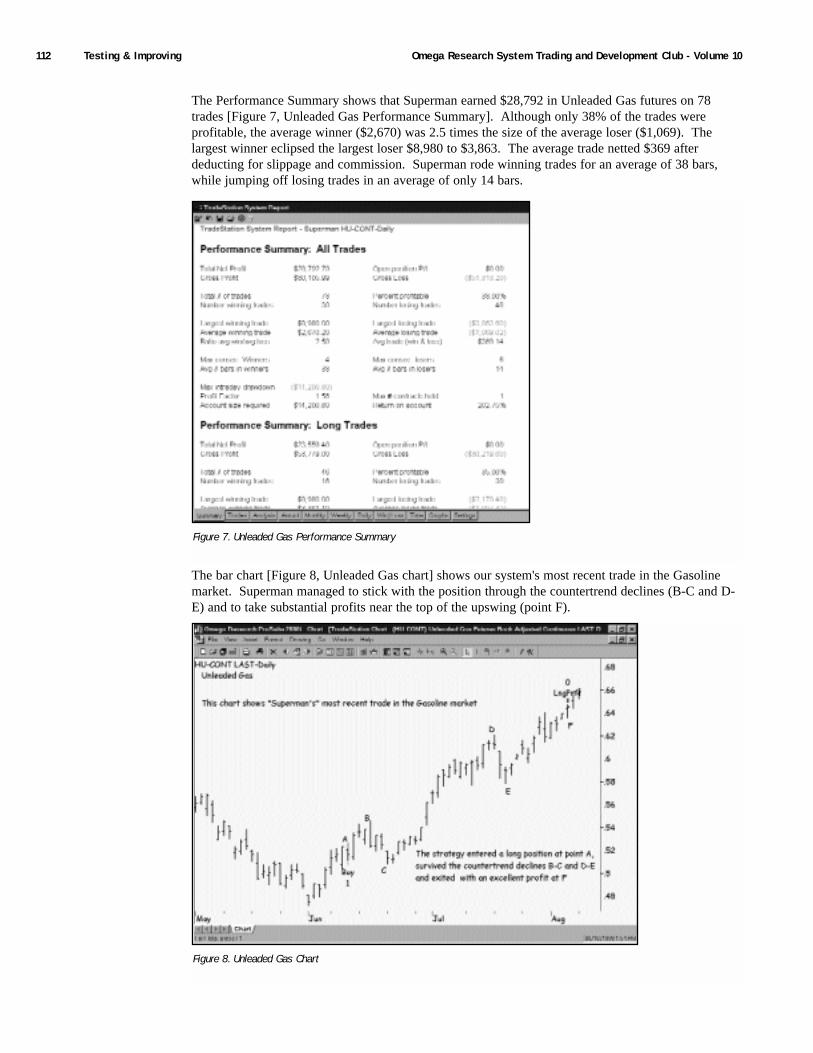
Omega Research System Trading and Development Club - Volume 10112 Testing & Improving
The Performance Summary shows that Superman earned $28,792 in Unleaded Gas futures on 78trades [Figure 7, Unleaded Gas Performance Summary]. Although only 38% of the trades wereprofitable, the average winner ($2,670) was 2.5 times the size of the average loser ($1,069). Thelargest winner eclipsed the largest loser $8,980 to $3,863. The average trade netted $369 afterdeducting for slippage and commission. Superman rode winning trades for an average of 38 bars,while jumping off losing trades in an average of only 14 bars.
The bar chart [Figure 8, Unleaded Gas chart] shows our system's most recent trade in the Gasolinemarket. Superman managed to stick with the position through the countertrend declines (B-C and D-E) and to take substantial profits near the top of the upswing (point F).
Figure 7. Unleaded Gas Performance Summary
Figure 8. Unleaded Gas Chart
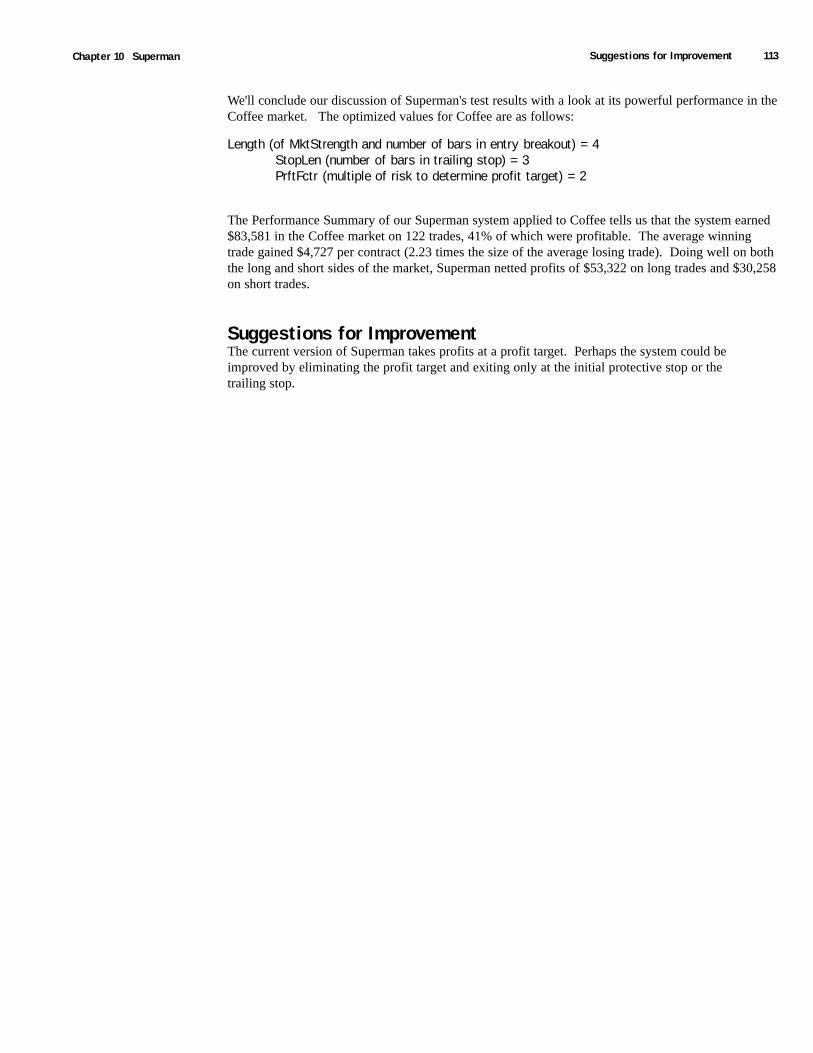
Suggestions for Improvement 113Chapter 10 Superman
We'll conclude our discussion of Superman's test results with a look at its powerful performance in theCoffee market. The optimized values for Coffee are as follows:
Length (of MktStrength and number of bars in entry breakout) = 4StopLen (number of bars in trailing stop) = 3PrftFctr (multiple of risk to determine profit target) = 2
The Performance Summary of our Superman system applied to Coffee tells us that the system earned$83,581 in the Coffee market on 122 trades, 41% of which were profitable. The average winningtrade gained $4,727 per contract (2.23 times the size of the average losing trade). Doing well on boththe long and short sides of the market, Superman netted profits of $53,322 on long trades and $30,258on short trades.
Suggestions for ImprovementThe current version of Superman takes profits at a profit target. Perhaps the system could beimproved by eliminating the profit target and exiting only at the initial protective stop or thetrailing stop.

Omega Research System Trading and Development Club - Volume 10114
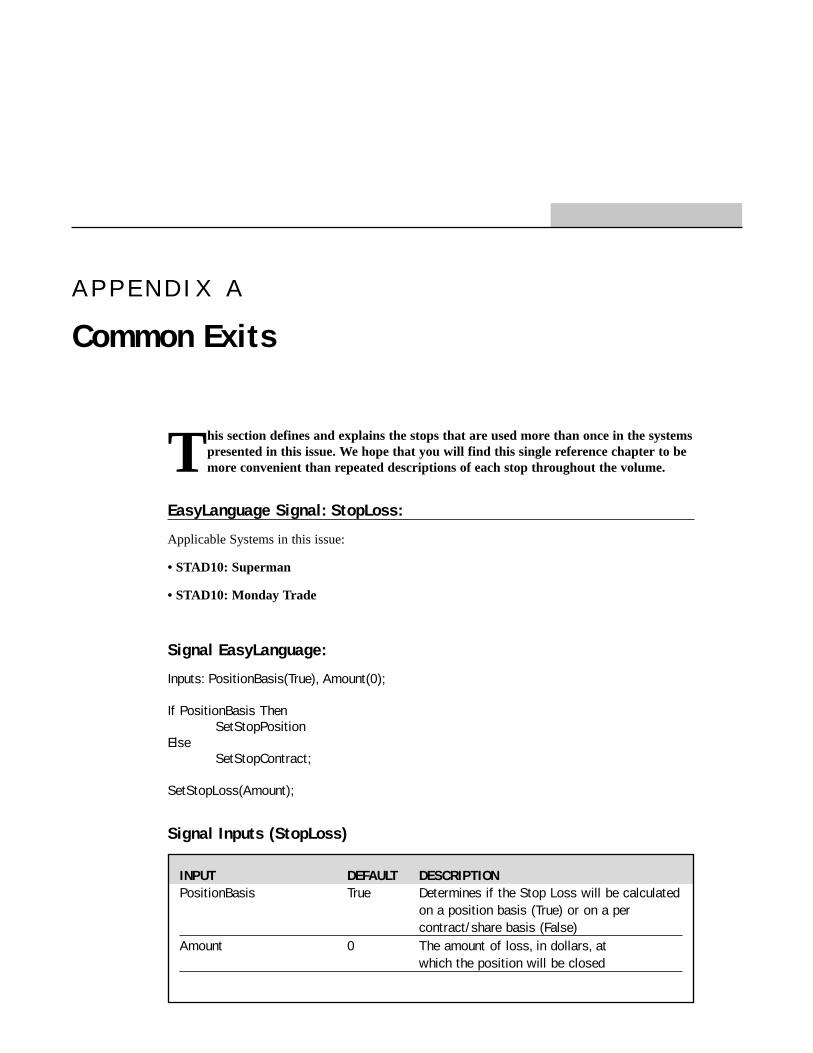
A P P E N D I X A
Common Exits
This section defines and explains the stops that are used more than once in the systemspresented in this issue. We hope that you will find this single reference chapter to bemore convenient than repeated descriptions of each stop throughout the volume.
EasyLanguage Signal: StopLoss:
Applicable Systems in this issue:
• STAD10: Superman
• STAD10: Monday Trade
Signal EasyLanguage:
Inputs: PositionBasis(True), Amount(0);
If PositionBasis ThenSetStopPosition
ElseSetStopContract;
SetStopLoss(Amount);
Signal Inputs (StopLoss)
INPUT DEFAULT DESCRIPTIONPositionBasis True Determines if the Stop Loss will be calculated
on a position basis (True) or on a percontract/share basis (False)
Amount 0 The amount of loss, in dollars, atwhich the position will be closed
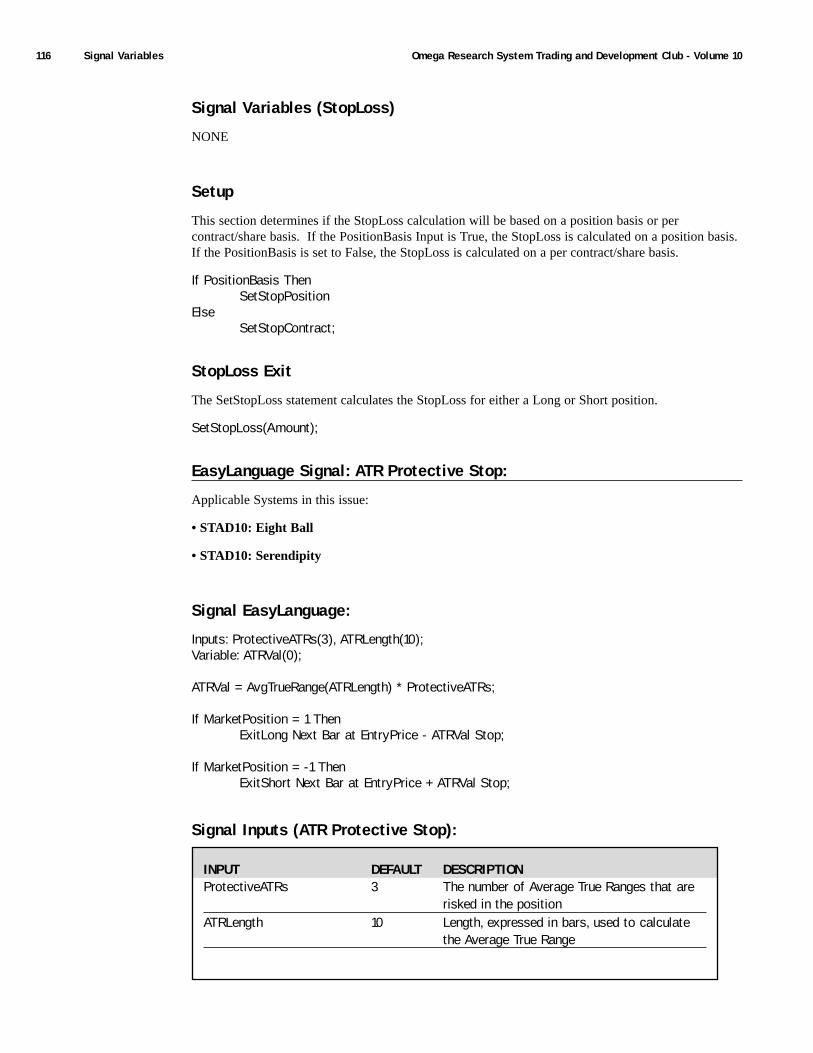
Omega Research System Trading and Development Club - Volume 10116 Signal Variables
Signal Variables (StopLoss)
NONE
Setup
This section determines if the StopLoss calculation will be based on a position basis or percontract/share basis. If the PositionBasis Input is True, the StopLoss is calculated on a position basis.If the PositionBasis is set to False, the StopLoss is calculated on a per contract/share basis.
If PositionBasis ThenSetStopPosition
ElseSetStopContract;
StopLoss Exit
The SetStopLoss statement calculates the StopLoss for either a Long or Short position.
SetStopLoss(Amount);
EasyLanguage Signal: ATR Protective Stop:
Applicable Systems in this issue:
• STAD10: Eight Ball
• STAD10: Serendipity
Signal EasyLanguage:
Inputs: ProtectiveATRs(3), ATRLength(10);Variable: ATRVal(0);
ATRVal = AvgTrueRange(ATRLength) * ProtectiveATRs;
If MarketPosition = 1 ThenExitLong Next Bar at EntryPrice - ATRVal Stop;
If MarketPosition = -1 ThenExitShort Next Bar at EntryPrice + ATRVal Stop;
Signal Inputs (ATR Protective Stop):
INPUT DEFAULT DESCRIPTIONProtectiveATRs 3 The number of Average True Ranges that are
risked in the positionATRLength 10 Length, expressed in bars, used to calculate
the Average True Range
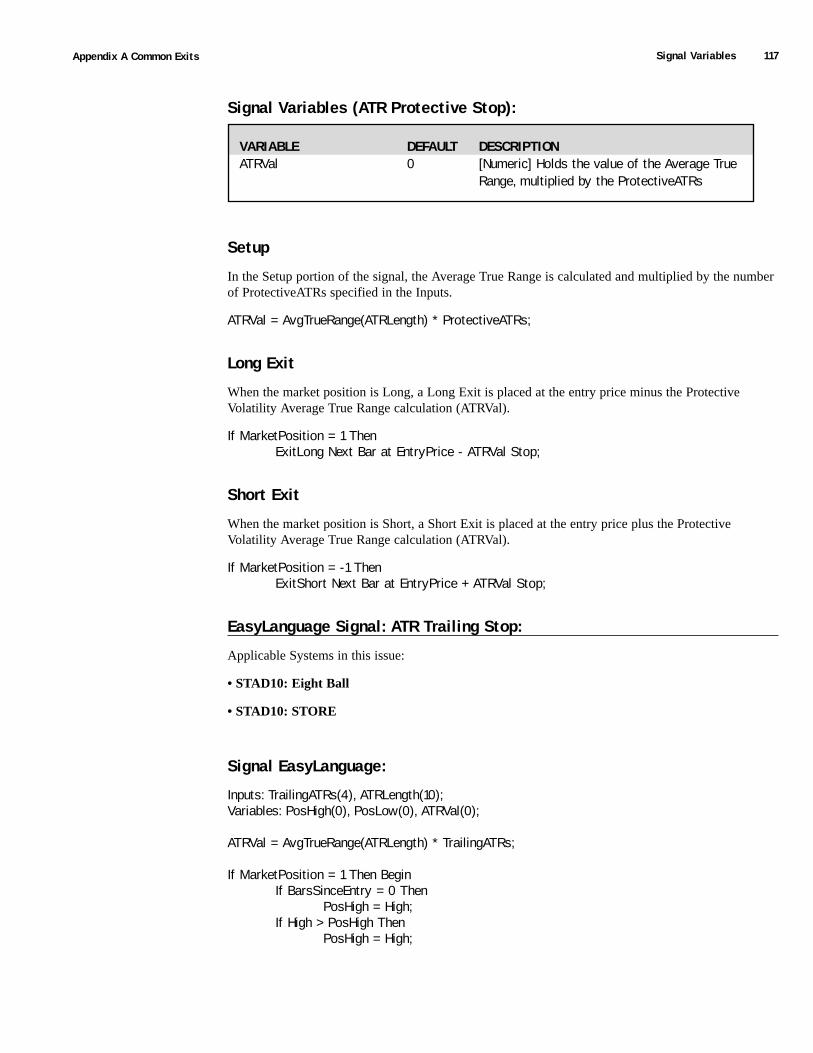
Signal Variables 117Appendix A Common Exits
Signal Variables (ATR Protective Stop):
Setup
In the Setup portion of the signal, the Average True Range is calculated and multiplied by the numberof ProtectiveATRs specified in the Inputs.
ATRVal = AvgTrueRange(ATRLength) * ProtectiveATRs;
Long Exit
When the market position is Long, a Long Exit is placed at the entry price minus the ProtectiveVolatility Average True Range calculation (ATRVal).
If MarketPosition = 1 ThenExitLong Next Bar at EntryPrice - ATRVal Stop;
Short Exit
When the market position is Short, a Short Exit is placed at the entry price plus the ProtectiveVolatility Average True Range calculation (ATRVal).
If MarketPosition = -1 ThenExitShort Next Bar at EntryPrice + ATRVal Stop;
EasyLanguage Signal: ATR Trailing Stop:
Applicable Systems in this issue:
• STAD10: Eight Ball
• STAD10: STORE
Signal EasyLanguage:
Inputs: TrailingATRs(4), ATRLength(10);Variables: PosHigh(0), PosLow(0), ATRVal(0);
ATRVal = AvgTrueRange(ATRLength) * TrailingATRs;
If MarketPosition = 1 Then BeginIf BarsSinceEntry = 0 Then
PosHigh = High;If High > PosHigh Then
PosHigh = High;
VARIABLE DEFAULT DESCRIPTIONATRVal 0 [Numeric] Holds the value of the Average True
Range, multiplied by the ProtectiveATRs

Omega Research System Trading and Development Club - Volume 10118 Signal Inputs
ExitLong Next Bar at PosHigh - ATRVal Stop;End;
If MarketPosition = -1 Then BeginIf BarsSinceEntry = 0 Then
PosLow = Low;If Low < PosLow Then
PosLow = Low;ExitShort Next Bar at PosLow + ATRVal Stop;
End;
Signal Inputs (ATR Trailing Stop)
Signal Variables (ATR Trailing Stop)
Setup
In the Setup portion of the signal, the Average True Range is calculated and multiplied by the numberof TrailingATRs specified in the Inputs.
ATRVal = AvgTrueRange(ATRLength) * TrailingATRs;
INPUT DEFAULT DESCRIPTIONTrailingATRs 4 The number of Average True Ranges that are
risked from the highest/lowest price ofthe position
ATRLength 10 Length, expressed in bars, used to calculate the Average True Range
VARIABLE DEFAULT DESCRIPTIONPosHigh 0 [Numeric] Holds the value of the position HighPosLow 0 [Numeric] Holds the value of the position LowATRVal 0 [Numeric] Holds the value of the Average True
Range multiplied by the number of TrailingATRs
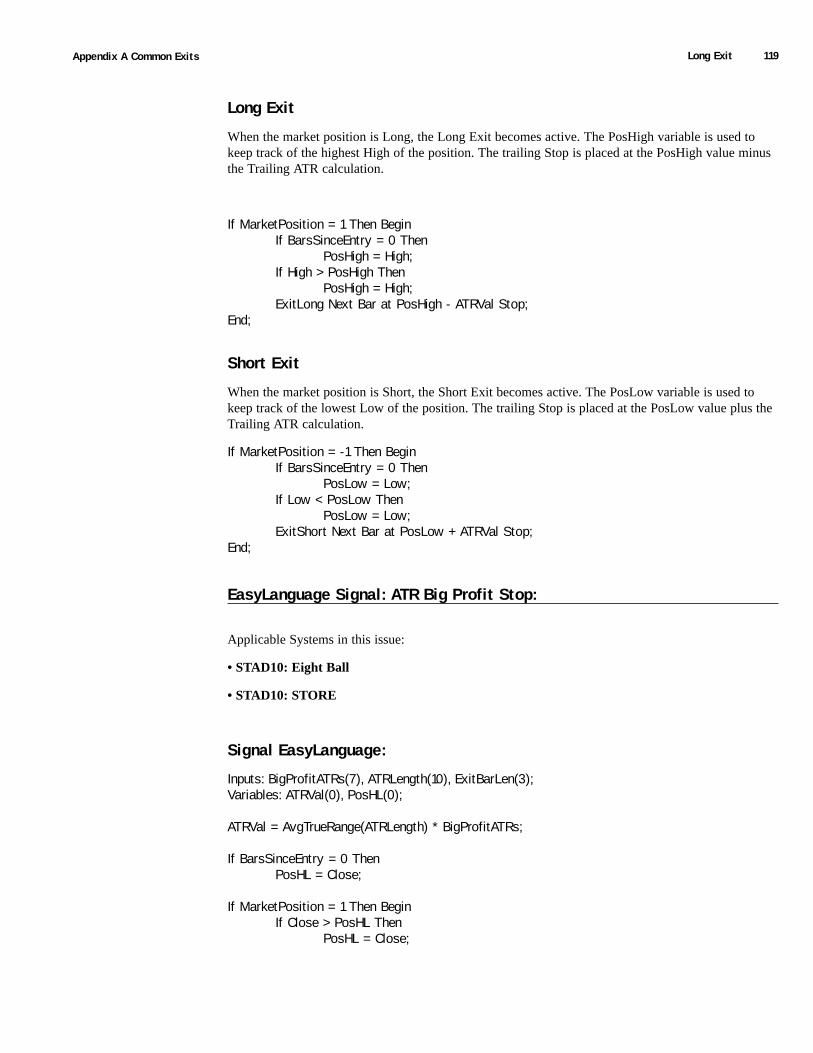
Long Exit 119Appendix A Common Exits
Long Exit
When the market position is Long, the Long Exit becomes active. The PosHigh variable is used tokeep track of the highest High of the position. The trailing Stop is placed at the PosHigh value minusthe Trailing ATR calculation.
If MarketPosition = 1 Then BeginIf BarsSinceEntry = 0 Then
PosHigh = High;If High > PosHigh Then
PosHigh = High;ExitLong Next Bar at PosHigh - ATRVal Stop;
End;
Short Exit
When the market position is Short, the Short Exit becomes active. The PosLow variable is used tokeep track of the lowest Low of the position. The trailing Stop is placed at the PosLow value plus theTrailing ATR calculation.
If MarketPosition = -1 Then BeginIf BarsSinceEntry = 0 Then
PosLow = Low;If Low < PosLow Then
PosLow = Low;ExitShort Next Bar at PosLow + ATRVal Stop;
End;
EasyLanguage Signal: ATR Big Profit Stop:
Applicable Systems in this issue:
• STAD10: Eight Ball
• STAD10: STORE
Signal EasyLanguage:
Inputs: BigProfitATRs(7), ATRLength(10), ExitBarLen(3);Variables: ATRVal(0), PosHL(0);
ATRVal = AvgTrueRange(ATRLength) * BigProfitATRs;
If BarsSinceEntry = 0 ThenPosHL = Close;
If MarketPosition = 1 Then BeginIf Close > PosHL Then
PosHL = Close;
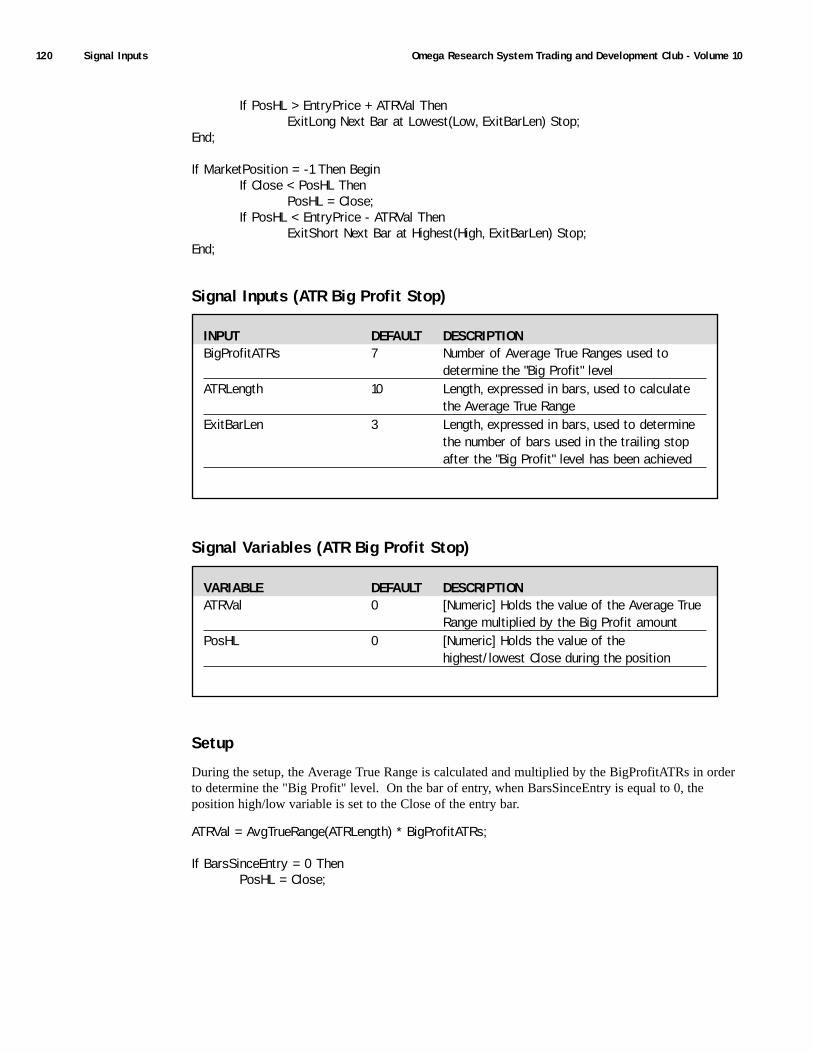
Omega Research System Trading and Development Club - Volume 10120 Signal Inputs
If PosHL > EntryPrice + ATRVal ThenExitLong Next Bar at Lowest(Low, ExitBarLen) Stop;
End;
If MarketPosition = -1 Then BeginIf Close < PosHL Then
PosHL = Close;If PosHL < EntryPrice - ATRVal Then
ExitShort Next Bar at Highest(High, ExitBarLen) Stop;End;
Signal Inputs (ATR Big Profit Stop)
Signal Variables (ATR Big Profit Stop)
Setup
During the setup, the Average True Range is calculated and multiplied by the BigProfitATRs in orderto determine the "Big Profit" level. On the bar of entry, when BarsSinceEntry is equal to 0, theposition high/low variable is set to the Close of the entry bar.
ATRVal = AvgTrueRange(ATRLength) * BigProfitATRs;
If BarsSinceEntry = 0 ThenPosHL = Close;
INPUT DEFAULT DESCRIPTIONBigProfitATRs 7 Number of Average True Ranges used to
determine the "Big Profit" levelATRLength 10 Length, expressed in bars, used to calculate
the Average True RangeExitBarLen 3 Length, expressed in bars, used to determine
the number of bars used in the trailing stop after the "Big Profit" level has been achieved
VARIABLE DEFAULT DESCRIPTIONATRVal 0 [Numeric] Holds the value of the Average True
Range multiplied by the Big Profit amountPosHL 0 [Numeric] Holds the value of the
highest/lowest Close during the position
Long Exit 121Appendix A Common Exits
Long Exit
When the market position is Long, the Long Exit becomes active. The PosHL variable is used to keeptrack of the highest Close of the position. If the PosHL (the highest Close of the position) exceeds theentry price plus the big profit amount (ATRVal), a Long Exit order is placed at the lowest Low ofExitBarLen bars.
If MarketPosition = 1 Then BeginIf Close > PosHL Then
PosHL = Close;If PosHL > EntryPrice + ATRVal Then
ExitLong Next Bar at Lowest(Low, ExitBarLen) Stop;End;
Short Exit
When the market position is short, the Short Exit becomes active. The PosHL variable is used to keeptrack of the lowest Close of the position. If the PosHL (the lowest Close of the position) descendsbelow the entry price minus the big profit amount (ATRVal), a Short Exit order is placed at the highestHigh of ExitBarLen bars.
If MarketPosition = -1 Then BeginIf Close < PosHL Then
PosHL = Close;If PosHL < EntryPrice - ATRVal Then
ExitShort Next Bar at Highest(High, ExitBarLen) Stop;End;
EasyLanguage Signal: Last Bar Exit:
Applicable Systems in this issue:
• STAD10: Go in Style
• STAD10: Ref Dev
• STAD10: STORE
Signal EasyLanguage:
If LastBarOnChart Then BeginExitLong This Bar on Close;
ExitShort This Bar on Close;End;
This Signal does not contain any Inputs or Variables.

Omega Research System Trading and Development Club - Volume 10122 Long/Short Exits
Long/Short Exits
On the last bar of the chart, any Long or Short positions are closed out in order to insure that alltrades are included in the System Report.
If LastBarOnChart Then BeginExitLong This Bar on Close;ExitShort This Bar on Close;
End
A P P E N D I X B
Volume In Review
A STAD Club member sent us the following question:
I am using all the stops you have published in a system I have...Protective, Trailing,Volatility, and Big Profit. I am trading on daily data. Yesterday, I set my trailing stop forHOZ9 at 5695 on a long trade. Today the Tracking Center is telling me to reset the stop to5638. Surely, this is not correct. I was under the impression that the system would never gobelow a previously set trailing stop (long). What is going on here? Also, do you recommendadding a breakeven stop to the above stops?
Our response:
The two most common trailing stops are an n-bar stop and an Average True Range (ATR)stop. The former will never move against the direction of the trade, but the latter might. Then-bar stop is set at the low of the last n-bars in a long position or at the high of the last n-barsin a short position. The ATR stop for a long position is set at the highest high since entry intothe trade minus n-ATRs; for a short position, it's set at the lowest low since entry plus n-ATRs. How can the ATR stop move lower in a long trade or higher in a short trade? Ifyou're long, and the highest high stays the same, but the ATR increases, the stop will be setlower; if you're short, and the lowest low stays the same, but the ATR increases, the stop willbe set higher. Of course, you can just ignore TradeStation's instruction to lower your trailingstop in an uptrend or raise your trailing stop in a downtrend.
As for breakeven stops, they can be beneficial in keeping trades with significant open profits(e.g. 3-4 ATRs) from becoming losers, but they can also keep you out of trades that wouldhave gone on to become major winners. If you use breakeven stops, you should also use are-entry method so that if the trade starts moving in your direction again, you can get backinto the market and capture the move. Hope this helps.
Omega Research System Trading and Development Club - Volume 10124 Index
AAdditional Educational Services .............................................6Appendix A .........................................................................115Appendix B .........................................................................123Average True Range..............................................................31
BBenefits of System Trading.....................................................8Breakeven Stop ...................................................................123Brower, William............................................................95, 101Building a Trading System......................................................9
CCommon Exits.....................................................................115
EEasyLanguage Resource Center..............................................6EasyLanguage Support Department........................................7Eight Ball .............................................................................31Exponential Moving Average ...............................................81
GGemini ...................................................................................81Getting Ideas for Systems .......................................................8Getting Started ........................................................................6Going in Style .......................................................................55
IIntroduction .............................................................................5
JJK Money We Trade..............................................................11
KKey Reversal ........................................................................69Krutsinger, Joe.......................................................................11
LLeBeau, Chuck......................................................................19
MMACD...................................................................................81MarketStrength....................................................................103Measuring and Comparing Performance ..............................49
PParabolic Stop .......................................................................55Price Channel ........................................................................55
RRadarScreen ..........................................................................49Reference Deviation System.................................................95RSI.........................................................................................21
SSerendipity Entry Trigger......................................................19Serendipity System................................................................21Simple Moving Average........................................................11STAD Club E-Mail Address ...................................................8Stochastic ..............................................................................69Superman.............................................................................103
TTrailing Stop........................................................................123
VVolume in Review ...............................................................123
WWelcome..................................................................................5Who's Minding the Store ......................................................69Workshops ...............................................................................6
INDEX