Embed Size (px)
Citation preview

Office of the Chief Financial Officer | Office of Budget and Planning1350 Pennsylvania Avenue, Suite 229, Washington, DC 20004 | 202.727.6234 | fax 202.727.1400www.cfo.dc.gov | www.dc.gov
GOVERNMENT OF THE DISTRICT OF COLUMBIA
FY 2
019
PR
OP
OS
ED B
UD
GET
AN
D FIN
AN
CIA
L PLA
NV
OLU
ME 1 EX
ECU
TIVE SU
MM
ARY
GO
VER
NM
ENT O
F THE
DISTR
ICT O
F CO
LUM
BIA
Submitted to the COUNCIL OF THE DISTRICT OF COLUMBIAby MURIEL BOWSER, MAYOR Government of the District of Columbia
March 21, 2018
A FAIR SHOTVOLUME 1
EXECUTIVE SUMMARY
215750_2019_Budget_Cvrs.indd 1-3 3/15/18 10:09 AM

Government of the District of ColumbiaFY 2019 Proposed Budget and Financial Plan
A FAIR SHOTVolume 1
Executive Summary
Submitted to the
Council of the District of Columbia
byMuriel Bowser, Mayor
March 21, 2018


The Government Finance Officers Association of the United States and Canada (GFOA) presented a Distinguished Budget
Presentation Award to District of Columbia Government, District of Columbia, for its annual budget for the
fiscal year beginning October 1, 2017. In order to receive this award, a governmental unit must publish a budget
document that meets program criteria as a policy document, as an operations guide, as a financial plan, and as a
communications device. This award is the eighteenth in the history of the District of Columbia.
This award is valid for a period of one year only. We believe our current budget continues to conform to
program requirements, and we are submitting it to GFOA to determine its eligibility for another award.


Government of the District of Columbia
Muriel Bowser, Mayor
Rashad M. YoungCity Administrator
Members of the Council
Phil MendelsonChairman
Anita Bonds...................................................................At-LargeDavid Grosso ................................................................At-LargeElissa Silverman...........................................................At-LargeRobert C. White, Jr. ...................................................At-LargeBrianne K. Nadeau ........................................................Ward 1Jack Evans ......................................................................Ward 2Mary M. Cheh ................................................................Ward 3Brandon T. Todd ............................................................Ward 4Kenyan R. McDuffie .....................................................Ward 5Charles Allen....................................................................Ward 6Vincent C. Gray ..............................................................Ward 7Trayon White, Sr.............................................................Ward 8
Jennifer BudoffBudget Director
Jeffrey S. DeWittChief Financial Officer
John FalcicchioChief of Staff
Mark H. TuoheyMayor’s Office of Legal Counsel
Beverly PerrySenior Advisor
HyeSook ChungDeputy Mayor for Health and
Human Services
Ahnna SmithInterim Deputy Mayor for Education
Brian KennerDeputy Mayor for Planning and
Economic Development
Courtney SnowdenDeputy Mayor for Greater Economic Opportunity
Kevin DonahueDeputy City Administrator
and Deputy Mayor for Public Safety and Justice


Delicia V. MooreHuman Support Services
George DinesGovernment Services
Angelique Hayes RiceInterim, Government Operations
Cyril Byron, Jr.Economic Development and Regulation
Shelly GrahamInterim, Public Safety and Justice
Deloras ShepherdEducation
Jeffrey Barnette
Deputy Chief Financial Officer
Office of Finance and Treasury
Fitzroy Lee
Deputy Chief Financial Officer
Office of Revenue Analysis
Keith Richardson
Deputy Chief Financial Officer
Office of Tax and Revenue
Bill Slack
Deputy Chief Financial Officer
Office of Financial Operations and Systems
Associate Chief Financial Officers
Angell JacobsDeputy Chief Financial Officer and Chief of Staff
Office of the CIOAlok Chadda, Interim Chief Information Officer
Sandra M. Pinder, DirectorNarayan Ayyagari, IT Manager
Assistant General Counsels
Patricia Gracyalny
Aaron Droller
David Tseng
General Counsel
Office of the Chief Financial Officer


Office of Budget and PlanningGordon McDonald
Deputy Chief Financial Officer
Lakeia Williams, Executive Assistant
James SpauldingAssociate Deputy Chief Financial Officer
OPERATING BUDGETEric Cannady, Director
Randall Myers, Manager
Stacy-Ann White, Manager
Renee Alford, Executive Assistant
Operating Budget Advisors
Joshua Agbebakun
William Powell
Charles Pryor
Senior Operating Budget Analysts
Rasheed Dawodu
Lee Hayward
Melissa Lavasani
Robin Moore
SebleWengel Mulaw
Oluwatosin Onifade
Naila Tengra
Operating Budget Analysts
Alex Akporji
Cynthia Holman
Veda Hunter
Benjamin Iyun
Administrative Clerk
Mishae Pate
FINANCIAL PLANNING, ANALYSIS,AND MANAGEMENT SERVICES
Leticia Stephenson, Director
Samuel Terry, Manager
Tayloria Stroman, Budget Controller
Senior Financial Systems Analysts
Robert Johnson
Carlotta Osorio
Sue Taing
Financial Systems Analyst
Darryl Miller
Senior Cost Analyst
Duane Smith
CAPITAL BUDGET/CIPDavid Clark, Director
Sherrie Greenfield, Manager
Haroun Dumbuya, Budget Technician
Senior Capital Budget Analysts
Omar Herzi
Bharat Kothari
Alex Tessema
OPERATIONSMargaret Myers, Office and Production Manager
Sharon Nelson, Staff Assistant


Office of Budget and Performance Management
Jennifer ReedDirector
Saesha CarlileDeputy Director
Chris Murray Senior Budget Analyst
Daniel KornfieldSenior Budget Analyst
Colin SollittBudget Analyst
John McGaw Director
Capital Improvements Program
Nathan Mulat Deputy Director
Capital Improvements Program
Alexis GriffinSenior Budget Analyst
Jared BotchwaySenior Budget Analyst
Office of the City Administrator


District of Columbia
Organization Chart


• Metropolitan Washington Council of Governments• National Capital Planning Commission (federal)• Washington Metropolitan Area Transit Authority• Washington Metropolitan Area Transit Commission• Washington Metropolitan Airports Authority
MAYOR
Advisory Neighborhood Commissions
DC Auditor
Commission on JudicialDisabilities and Tenure
Joint Committee onJudicial Administration
Council of theDistrict of Columbia
Judicial Nomination Commission
DC Court of Appeals
Sentencing and Criminal Code Revision Commission
GOVERNMENT OF THE DISTRICT OF COLUMBIA
City Administrator
Office of theGeneral Counsel:
Office of Partnerships and Grants
Office of Communications:Mayor’s Correspondence
Unit
Mayor’s Office of Talent and Appointments
Office of Scheduling and Advance
Mayor’s Office of Community Affairs:Clean City OfficeMayor’s Office of
Community Relationsand Services
ServeDCMayor’s Office on
African AffairsMayor’s Office on Asian
and Pacific Islander AffairsMayor’s Office ofLGBTQ Affairs
Mayor’s Office onLatino Affairs
Mayor’s Office ofReligious AffairsMayor’s Office of Veteran Affairs
Mayor’s Office on Returning Citizens Affairs
Mayor’s Office on Women’s Policy and
Initiatives
Deputy Mayor forEducation
Deputy Mayor forPlanning and Economic
Development
Deputy City Administrator/ Deputy Mayor for Public Safety
and Justice
Deputy Mayor forHealth and Human
Services
Department of Housing and Community Development
Department of Consumer and Regulatory Affairs
Department of Transportation
Office of Planning
Department of Energy and Environment
Department of Insurance,Securities, and Banking
Office of Cable Television, Film, Music, and Entertainment
Commission on theArts and Humanities
Department of For-Hire Vehicles
Department of HumanResources
Department of Public Works
Department of General Services
Office of the ChiefTechnology Officer
Office of Contracting andProcurement
Department of Motor Vehicles
Office of Risk Management
Office of Disability Rights
Office of Human Rights
Metropolitan PoliceDepartment
Fire and Emergency Medical Services
Department
Homeland Security and Emergency Management
Agency
Department of Corrections
Department of Forensic Sciences
Office of Unified Communications
Office of the Chief Medical Examiner
Office of Victim Services and Justice Grants
DC National Guard (DC)
Department of Health
Department of Human Services
Child and Family Services Agency
Department of DisabilityServices
Department of Behavioral Health
Department of YouthRehabilitation Services
Department of Health CareFinance
Office on Aging
Deputy Mayor for Greater Economic Opportunity
Office of Policy andLegislative Affairs
Office of Federal and Regional Affairs
Office of the Secretary
Executive Officeof the Mayor
Office of Budget and Finance
Office of theAttorney General
Office of theInspector General
DC Superior Court
Corrections Information Council
Criminal Justice Coordinating Council
Office of Police ComplaintsUniform Law Commission
Health BenefitExchange Authority
Not-for-ProfitHospital Corporation
DC Public LibraryPublic CharterSchool Board
Public Charter Schools**State Board of EducationUniversity of the District of Columbia (including UDC
Community College)
Alcoholic Beverage Regulation Administration
DC Housing AuthorityDC Water
Housing Finance AgencyOffice of the People’s CounselOffice of the Tenant Advocate
Office of ZoningPublic Service Commission*
Real Property TaxAppeals Commission
Washington Convention and Sports Authority
Zoning Commission*
Office of theChief Financial Officer
Office of Budget andPlanning
Office of Tax and RevenueOffice of Finance and
Treasury
Office of Revenue AnalysisOffice of Financial
Operations and SystemsLottery and Charitable Games Control Board
DC Public Schools
Office of the State Superintendent of
Education
Department of Parks and Recreation
REGIONAL BODIES
Office of theSenior Advisor
RESIDENTS
EXECUTIVE BRANCH
JUDICIAL BRANCH
LEGISLATIVE BRANCH
NOTES Entities enclosed within dashed boxes are
independent agencies or entities. They appear on this organizational chart in proximity to the
Executive Branch cluster with which their functions most align.
* Agencies marked with an asterisk areCharter independent agencies.
** Entities marked with two asterisks arenon-governmental entities.
‡ The New Columbia Statehood Commission is co-chaired by the Mayor and the Council
Chairman.
Department of Small and Local Business Development
Department of Employment Services
Office of African-American Affairs
Commission on Fathers, Men, and Boys
New Columbia Statehood Commission‡
Office of the Statehood Delegation
Board of Elections* (including the Office of
Campaign Finance)Board of Ethics and
Government Accountability (including the Office of
Open Government)Contract Appeals BoardDC Retirement Board
Office of Administrative Hearings
Office of Employee Appeals
Public Employee Relations Board
Mayor’s Office of Legal Counsel


Transmittal Letters


Table of Contents


FY 2019 Proposed Budget and Financial Plan
Government of the District of Columbia
FY 2019 Proposed Budget and
Financial Plan
Table of Contents
Volume 1 - Executive Summary
How to Read the FY 2019 Proposed Budget and Financial Plan
1. Introduction ...........................................................................................................................1-1
2. Financial Plan ........................................................................................................................2-1
3. Revenue.................................................................................................................................3-1
4. Operating Expenditures.........................................................................................................4-1
5. FY 2019 - FY 2024 Capital Improvements Plan...................................................................5-1
Appendices
A. D. C. Comprehensive Financial Management Policy.........................................................................A-1
B. Basis of Budgeting and Accounting .....................................................................................................B-1
C. Fund Structure and Relationship to Budget Structure.........................................................................C-1
D. Recurring Budget and Current Services Funding Level (CSFL) Development...............................D-1
E. Agency Performance Plans....................................................................................................................E-1
F. FY 2019 Proposed - General Fund........................................................................................................F-1
G. FY 2019 Proposed - Gross Funds.........................................................................................................G-1
H. FY 2019 Proposed - FTEs - General Fund ..........................................................................................H-1
I. FY 2019 Proposed - FTEs - Gross Funds..............................................................................................I-1
J. Glossary of Budget Terms ......................................................................................................................J-1
The FY 2019 Local Budget Act
The FY 2019 Federal Portion Budget Request Act

FY 2019 Proposed Budget and Financial Plan
Volume 2 - Agency Budget Chapters - Part I
(Governmental Direction and Support, Economic Development and Regulation,
and Public Safety and Justice)
A. Governmental Direction and Support
1. Council of the District of Columbia (AB0) .........................................................................................A-1
2. Office of the District of Columbia Auditor (AC0)..............................................................................A-7
3. Advisory Neighborhood Commissions (DX0).................................................................................A-13
4. Uniform Law Commission (AL0) .....................................................................................................A-17
5. Office of the Mayor (AA0) ................................................................................................A-21
6. Mayor’s Office of Legal Counsel (AH0)...........................................................................A-29
7. Office of the Senior Advisor (AI0) ....................................................................................A-33
8. Office of the Secretary (BA0)............................................................................................A-37
9 Office of the City Administrator (AE0) .............................................................................................A-49
10. Office of the Deputy Mayor for Greater Economic Opportunity (EM0) .......................................A-61
11. D.C. Office of Risk Management (RK0)...........................................................................................A-73
12. D.C. Department of Human Resources (BE0)..................................................................................A-87
13. Office of Disability Rights (JR0)......................................................................................................A-103
14. Captive Insurance Agency (RJ0)......................................................................................................A-113
15. Office of Finance and Resource Management (AS0).....................................................................A-119
16. Office of Contracting and Procurement (PO0) ...............................................................................A-125
17. Purchase Card Transactions (PX0) ..................................................................................................A-139
18. Office of the Chief Technology Officer (TO0) ...............................................................................A-143
19. Department of General Services (AM0) .........................................................................................A-163
20. Contract Appeals Board (AF0).........................................................................................................A-185
21. Board of Elections (DL0) .................................................................................................................A-193
22. Office of Campaign Finance (CJ0) ..................................................................................................A-203
23. Public Employee Relations Board (CG0) .......................................................................................A-213
24. Office of Employee Appeals (CH0).................................................................................................A-223
25. Metropolitan Washington Council of Governments (EA0)...........................................................A-231
26. Office of the Attorney General for the District of Columbia (CB0)..............................................A-237
27. D.C. Board of Ethics and Government Accountability (AG0)......................................................A-249
28. Statehood Initiatives (AR0) ..............................................................................................................A-259
29. Office of the Inspector General (AD0) ...........................................................................................A-263
30. Office of the Chief Financial Officer (AT0)....................................................................................A-275

B. Economic Development and Regulation
1. Office of the Deputy Mayor for Planning and
Economic Development (EB0) ........................................................................................................B-1
2. Office of Planning (BD0)................................................................................................................B-15
3. Department of Small and Local Business Development (EN0)..................................................B-29
4. Office of Cable Television, Film, Music, and Entertainment (CI0) ............................................B-43
5. Office of Zoning (BJ0)....................................................................................................................B-57
6. Department of Housing and Community Development (DB0) ..................................................B-67
7. Department of Employment Services (CF0).................................................................................B-87
8. Real Property Tax Appeals Commission (DA0).........................................................................B-103
9. Department of Consumer and Regulatory Affairs (CR0)...........................................................B-113
10. Office of the Tenant Advocate (CQ0) ..........................................................................................B-129
11. D.C. Commission on the Arts and Humanities (BX0)...............................................................B-135
12. Alcoholic Beverage Regulation Administration (LQ0) .............................................................B-149
13. Public Service Commission (DH0)..............................................................................................B-159
14. Office of the People's Counsel (DJ0)...........................................................................................B-171
15. Department of Insurance, Securities, and Banking (SR0)..........................................................B-181
16. Housing Authority Subsidy (HY0) ..............................................................................................B-197
17. Housing Production Trust Fund Subsidy (HP0) .........................................................................B-201
18. Business Improvement Districts Transfer (ID0) .........................................................................B-205
C. Public Safety and Justice
1. Metropolitan Police Department (FA0) ...........................................................................................C-1
2. Fire and Emergency Medical Services Department (FB0) ..........................................................C-17
3. Police Officers’ and Fire Fighters’ Retirement System (FD0) .....................................................C-35
4. Department of Corrections (FL0)...................................................................................................C-39
5. District of Columbia National Guard (FK0) .................................................................................C-55
6. Homeland Security and Emergency Management Agency (BN0) .............................................C-61
7. Commission on Judicial Disabilities and Tenure (DQ0)..............................................................C-75
8. Judicial Nomination Commission (DV0)......................................................................................C-83
9. Office of Police Complaints (FH0) ................................................................................................C-91
10. District of Columbia Sentencing Commission (FZ0).................................................................C-101
11. Criminal Code Reform Commission (MA0) ..............................................................................C-111
12. Neighborhood Safety and Engagement (NS0) ...........................................................................A-117
13. Office of the Chief Medical Examiner (FX0) .............................................................................C-123
14. Office of Administrative Hearings (FS0).....................................................................................C-137
15. Criminal Justice Coordinating Council (FJ0)..............................................................................C-147
16. Office of Unified Communications (UC0)..................................................................................C-163
17. Homeland Security Grants (FT0).................................................................................................C-175
18 Department of Forensic Sciences (FR0)......................................................................................C-181
19. Corrections Information Council (FI0)........................................................................................C-193
20. Office of Victim Services and Justice Grants (FO0)...................................................................C-201
21. Office of the Deputy Mayor for Public Safety and Justice (FQ0).............................................C-215
FY 2019 Proposed Budget and Financial Plan

Volume 3 - Agency Budget Chapters - Part IIPublic Education System
1. How to Read the Agency Budget Chapters
2. Public Education System
1. District of Columbia Public Schools (GA0)
Agency Budget Chapter ................................................................................................................................D-1
Appendices:
Appendix A - School Profiles Appendix B - School-Wide (Budget) Appendix C - Central Office and School Support (Budget)
2. Teachers’ Retirement System (GX0)..........................................................................................................D-21
3. Office of the State Superintendent of Education (GD0)...........................................................................D-25
4. District of Columbia Public Charter Schools (GC0) ...............................................................................D-47
5. University of the District of Columbia Subsidy Account (GG0).............................................................D-55
6. District of Columbia Public Library (CE0) ...............................................................................................D-59
7. District of Columbia Public Charter School Board (GB0).......................................................................D-73
8. Non-Public Tuition (GN0) ..........................................................................................................................D-81
9. Special Education Transportation (GO0)...................................................................................................D-85
10. D.C. State Board of Education (GE0)........................................................................................................D-97
11. District of Columbia State Athletics Commission (GL0) ......................................................................D-101
12. Office of the Deputy Mayor for Education (GW0) ................................................................................D-107
3. Operating Appendices - Public Education System Agencies
FY 2019 Proposed Budget and Financial Plan

Volume 4 - Agency Budget Chapters - Part III
(Human Support Services, Public Works, Financing and Other,
and Enterprise and Other Funds)
E. Human Support Services
1. Department of Human Services (JA0) ...................................................................................................................................E-1
2. Child and Family Services Agency (RL0)...........................................................................................................................E-19
3. Department of Behavioral Health (RM0) ............................................................................................................................E-33
4. Department of Health (HC0).................................................................................................................................................E-55
5. Department of Parks and Recreation (HA0)........................................................................................................................E-89
6. D.C. Office on Aging (BY0)...............................................................................................................................................E-103
7. Unemployment Compensation Fund (BH0) .....................................................................................................................E-115
8. Employees’ Compensation Fund (BG0)............................................................................................................................E-119
9. Office of Human Rights (HM0) .........................................................................................................................................E-123
10. Mayor’s Office on Latino Affairs (BZ0)............................................................................................................................E-137
11. Office on Asian and Pacific Islander Affairs (AP0) ..........................................................................................................E-147
12. Office of Veterans’ Affairs (VA0) .......................................................................................................................................E-155
13. Department of Youth Rehabilitation Services (JZ0) ......................................................................................E-165
14. Department on Disability Services (JM0)......................................................................................................E-177
15. Department of Health Care Finance (HT0)....................................................................................................E-191
16. Not-for-Profit Hospital Corporation Subsidy (HX0) .....................................................................................E-209..
17. Office of the Deputy Mayor for Health and Human Services (HG0) ............................................................E-213
F. Public Works
1. Department of Public Works (KT0)......................................................................................................................F-1
2. District Department of Transportation (KA0)....................................................................................................F-15
3. Department of Motor Vehicles (KV0) ................................................................................................................F-33
4. Department of Energy and Environment (KG0) ...............................................................................................F-45
5. Department of For-Hire Vehicles (TC0).............................................................................................................F-61
6. Washington Metropolitan Area Transit Commission (KC0) ............................................................................F-73
7. Washington Metropolitan Area Transit Authority (KE0)..................................................................................F-77
G. Financing and Other
1. Debt Service (DS0, ZB0, DT0, ZC0)...................................................................................................................G-1
2. Settlements and Judgments (ZH0) .....................................................................................................................G-13
3. John A. Wilson Building Fund (ZZ0) ................................................................................................................G-17
4. Workforce Investments (UP0) ............................................................................................................................G-21
4. Non-Departmental (DO0)...................................................................................................................................G-25
5. Emergency Planning and Security Fund (EP0).................................................................................................G-29
6. Master Equipment Lease/Purchase Program (ELO) ........................................................................................G-35
7. Pay-As-You-Go Capital Fund (PA0)..................................................................................................................G-39
8. District Retiree Health Contribution (RH0).......................................................................................................G-43
9. Highway Transportation Fund – Transfers (KZ0)........................................................................................ G-47
10. Inaugural Expenses (SB0)............................................................................................................................... G-51
11. Convention Center Transfer – Dedicated Taxes (EZ0).................................................................................G-57
FY 2019 Proposed Budget and Financial Plan

H. Enterprise and Other Funds
1. District of Columbia Water and Sewer Authority (LA0).................................................................................H-1
2. Washington Aqueduct (LB0) .............................................................................................................................H-7
3. Office of Lottery and Charitable Games (DC0).............................................................................................H-11
4. District of Columbia Retirement Board (DY0)..............................................................................................H-17
5. Washington Convention and Sports Authority (ES0)....................................................................................H-23
6. Housing Finance Agency (HF0)......................................................................................................................H-29
7. University of the District of Columbia (GF0) ................................................................................................H-33
8. Unemployment Insurance Trust Fund (UI0) ..................................................................................................H-41
9. Housing Production Trust Fund (UZ0)...........................................................................................................H-45
10. Tax Increment Financing (TIF) Program (TX0) ............................................................................................H-49
11. Repayment of PILOT Financing (TY0) .........................................................................................................H-53
12. Ballpark Revenue Fund (BK0)........................................................................................................................H-57
13. Not-For-Profit Hospital Corporation (HW0).................................................................................H-61
14. Health Benefit Exchange Authority (HI0).....................................................................................H-65
Volumes Bound SeparatelyVolume 2 - FY 2019 Proposed Budget and Financial Plan - Agency Budget Chapters - Part IVolume 3 - FY 2019 Proposed Budget and Financial Plan - Agency Budget Chapters - Part IIVolume 4 - FY 2019 Proposed Budget and Financial Plan - Agency Budget Chapters - Part IIIVolume 5 - FY 2019 Proposed Budget and Financial Plan - FY 2019 - FY 2024 Capital Improvements Plan (Including Highway Trust Fund)Web Only: Volume 6 - FY 2019 Proposed Budget and Financial Plan - Operating Appendices
FY 2019 Proposed Budget and Financial Plan

How to Read the FY 2019 Proposed
Budget and FinancialPlan


How to Read the FY 2019 Proposed Budget and Financial Plan
i
How to Read the FY 2019 ProposedBudget and Financial Plan
The District of Columbia’s FY 2019 Proposed Budget andFinancial Plan is a communication tool that presents and explainspolicy priorities, agency operations, including programmatic/organizational structures, and performance measures in the contextof the Financial Plan, which shows the District’s sources of revenueand planned expenditures. The Budget and Financial Plan includesforecasts of economic and financial conditions, current and plannedlong-term debt financing, policy decisions, and other importantfinancial information for the District’s government, all of which areessential elements for accurate financial reporting and sound management of public resources.
This chapter, How to Read the Budget and Financial Plan, is a guide for understanding the sections of this
budget volume that define the budget priorities for the District. These sections are consistent with the National
Advisory Council on State and Local Budgeting’s recommended budget practices, which call for a
presentation of information to provide readers with a guide to government programs and organizational
structure. Additionally, these sections are consistent with the standards of the Government Finance Officers
Association for the Distinguished Budget Presentation Award.
The FY 2019 Budget and Financial Plan is presented in six volumes summarized as follows:
Executive Summary (Volume 1) – provides a high-level summary of the budget and financial information,
including sections describing new initiatives within the District’s proposed budget, the transmittal letters from
the Mayor and the Chairman of the Council of the District of Columbia, the District’s five-year financial plan,
detailed information on the District’s projected revenues and expenditures, and summary information about
the Capital Improvements Plan. In addition, this volume includes information about the District’s budgetary
and financial management policies, a glossary of budget terms, budget summary tables by agency and fund
type, and the Budget Act legislation that serves as the basis for the District’s federal appropriations act.
Agency Budget Chapters (Volumes 2, 3, and 4) – describe by appropriation title, the operating budgets for
each of the District’s agencies. Appropriation titles categorize the general areas of services provided by the
District on behalf of its citizens and are listed in the table of contents. Examples are Economic Development
and Regulation, Public Safety and Justice, and Human Support Services.

How to Read the FY 2019 Proposed Budget and Financial Plan
ii
Capital Improvements Plan (Including Highway Trust Fund) (Volume 5) – describes the District’s pro-
posed six-year Capital Improvements Plan for all of the District's agencies. The Highway Trust Fund describes
the District’s proposed FY 2019 to FY 2024 planned transportation projects including federal highway grants.
Operating Appendices (Volume 6) – includes detailed supporting tables displaying the proposed
expenditures and full-time equivalents in the operating budgets that are described in Volumes 2, 3, and 4.
Please note: This volume is available exclusively on the Government of the District of Columbia website at
http://cfo.dc.gov/.
Detailed information on the chapter contents of each volume include:
Volume 1: Executive Summary
Includes the following sections:
Introduction: FY 2019 Proposed Budget and Financial PlanThis chapter is a narrative and graphic summary of the proposed budget and financial plan. It describes the
overall proposed budget, including the sources and uses of public funds, and compares the prior year’s
approved budget to the current one. The chapter also explains the budget development process and budget
formulation calendar for FY 2019.
Financial Plan The Financial Plan summarizes actual and planned revenues and expenditures from FY 2016 through
FY 2022. This chapter includes financing sources, uses, and the assumptions used to derive the District’s short-
term and long-term economic outlook.
RevenueThis chapter shows current revenue projections for each revenue type as certified by the Office of the Chief
Financial Officer. It also details the District’s revenue sources, provides an overview of the District’s and
regional economy and economic trends, and describes the revenue outlook for FY 2019 through FY 2022.
Operating Expenditures This chapter describes the District's recent Local funds expenditures. It includes analysis of expenditures
between FY 2014 and FY 2017, both by agency and by expense category (e.g. personnel, supplies, and fixed
costs).
Capital Improvements Plan (CIP)This chapter describes the overall CIP, including the sources and uses of Capital funds.
AppendicesThe last section of the Executive Summary includes explanations of items specific to the District's budget:
• The D.C. Comprehensive Financial Management Policy provides a framework for fiscal decision-making bythe District to ensure that financial resources are available to meet the present and future needs of District citizens;
• The Basis of Budgeting and Accounting section describes the basis of budgeting and accounting, enabling thereaders to understand the presentation methods of the District's finances;

How to Read the FY 2019 Proposed Budget and Financial Plan
iii
• The Fund Structure and relationship to the Budget Structure section relates the District’s fund structure to itsbudget presentation;
• The Current Services Funding Level (CSFL) Development section describes how the CSFL was developed forthe Local funds budget;
• The Agency Performance Plans section describes how the Office of the City Administrator evaluates government agencies, services, and operations; contains details on major plan revisions or changes in the assessment process; and directs readers to the agency plans, including performance measures, on the District’swebsite;
• The Summary Tables detail the District's proposed operating budget by agency and fund type for both budgeted dollars and positions;
• The Glossary of Budget Terms section describes unique budgeting, accounting, and District terms that maynot be known by the general reader; and
• The Local Budget Act is the legislation that the District uses to enact the District's budget via local law, and istransmitted to Congress in accordance with procedures for all District legislation.
• The Federal Portion Budget Request Act is the legislation that conveys the District’s request for federal payments, to be enacted into law by the United States Congress and the President through the federal appropriations process.
Volumes 2, 3, and 4: Agency Budget Chapters - Part I, II, and III
These volumes include agency chapters that describe available resources, their uses, and the achieved and
anticipated outcomes as a result of these expenditures. Chapters in these volumes are grouped by appropria-
tion title and each chapter contains the following sections, as applicable:
Header Information:
• Agency name and budget code; • Website address and telephone; and• FY 2019 proposed operating budget table.
Introduction:
• Agency Mission; and • Summary of Services.
Financial and Program Information:
• Proposed Funding and Full-Time Equivalents by Source table; • Proposed Expenditure by Comptroller Source Group table;• Division/Program descriptions;• Proposed Expenditure by Division/Program table;• FY 2019 Proposed Budget Changes; and • FY 2018 Approved Budget to FY 2019 Proposed Budget reconciliation table.
FY 2019 Proposed Budget ChangesThe FY 2019 Proposed Budget Changes section within each agency chapter provides a comprehensive explanation
of the FY 2018 Approved Budget to FY 2019 Proposed Budget, by Revenue Type table that appears in nearly every
chapter. Please see the Recurring Budget and Current Services Funding Level (CSFL) Development appendix in
this volume for more information about the CSFL methodology, which is only applied to agencies with Local funds.

How to Read the FY 2019 Proposed Budget and Financial Plan
iv
This section includes major changes within the agency budget by program, fund, and full-time equiv-
alents, from the initial request through the policy decisions made by the Mayor. The FY 2019 Proposed
Budget Changes section uses the following terms to describe budgetary or programmatic changes:
Actions with an impact on services:
• Enhance: More funding to improve the quality or quantity of an existing service (e.g., Funding to support the new DMV service center in Georgetown).
• Create: New funding for new programs that previously didn’t exist (e.g., Establish PermanentSupportive Housing program to transition vulnerable individuals from homeless to stable housing).
• Reduce: Reduction, but not elimination of an existing service (e.g. Close a service center and provideservices at other locations; Realign staffing in the Fleet Management division).
• Eliminate: Total elimination of an existing service, with no anticipation of the service being providedby another entity (e.g. Eliminate unfunded vacant FTEs for staffing realignment).
Actions with no service impact:
• Increase: Additional funds necessary to continue service at current levels (e.g., Fund recurring operating cost of Automated Traffic Enforcement).
• Decrease: Reduction in cost without a service impact (e.g., Align energy budget with revised DGS estimate).
• Transfer-In: Shift of an existing program, operation, or personnel from another District agency (e.g.,Transfer the Central Cell Block Security activity from MPD to DOC).
• Transfer-Out: Shift of an existing program, operation, or personnel to another District agency (e.g.,Transfer APRA division from DOH to establish DBH).
• Shift: Shift an existing program or operation from one fund type to another (e.g., Shift from SpecialPurpose Revenue to Local funds to support telecommunications for the D.C. Lottery).
• Technical Adjustment: An increase or decrease to the budget that is required because of a legislative mandateor to correct an error or omission.
• No Change: The agency has no changes in funding and/or budget structures from the FY 2018approved budget to the FY 2019 proposed budget.
An example of an agency narrative is at the end of this chapter to help the reader navigate the Agency Budget
Chapter volume. The example shows an agency with a performance plan. Call-out boxes highlight the features
discussed above.
Agency Performance PlansThe Office of the City Administrator (OCA) is building a robust performance management program across the
District. This process includes making several updates to the format and submission process for annual agency
performance plans.
Under the new process, agencies had the opportunity to update major components of their performance plan
for FY 2019 including: objectives, key performance indicators and workload measures. Ultimately, the revised
performance plans will be able to communicate more effectively the important work each agency plans to do
over the coming year and how each agency will work to improve its performance. First drafts of the high level
components of each agency’s performance plan (objectives, key performance indicators, and operations) are
published with the budget volumes and other budget materials at www.cfo.dc.gov.

How to Read the FY 2019 Proposed Budget and Financial Plan
v
Volume 5: Capital Improvements Plan (Including Highway Trust Fund)This volume covers the District's FY 2019 - FY 2024 Capital Improvements Plan (CIP) and the Highway Trust
Fund. The capital volume includes:
• An Introduction chapter that describes the overall CIP, including the sources and uses of capital funds, theDistrict's policies and procedures for its capital budget and debt, and the FY 2019 planning process;
• Project Description Forms that comprise the major portion of the capital volume. The project descriptionforms provide details on capital projects funded by general obligation bonds, Pay-As-You-Go (Paygo) capital,federal grants, and the Local Street Maintenance Fund. Each page shows one project's planned allotments forFY 2019 through FY 2024, including a description, its annual operating impact, milestone data, and its loca-tion; and
• Appendices that provide supporting tables and a glossary about the District's capital budget, including:- The FY 2018 Appropriated Budget Authority Request table that summarizes proposed new projects and
changes (increase or decrease) for ongoing projects by agency, project, and funding source;- The FY 2019 - FY 2024 Planned Expenditures from New Allotments table that summarizes the new allot-
ments planned for FY 2019 - FY 2024 expenditures by agency and project;- The FY 2019 - FY 2024 Planned Funding table that summarizes the FY 2019 and six-year funding sources
for all new allotments by agency, project, and funding source;- The Capital Budget Authority and Allotment Balances table that summarizes the lifetime budget
authority and allotment, life-to-date expenditures, total commitments, and balance of budget authority andallotment for all ongoing capital projects by agency, project, and the amount of the authority request;
- The Capital Project Cost Estimate Variances table displays changes of 5 percent or greater to project costscompared to the FY 2018 approved budget;
- FY 2018 year-to-date budget actions; and - Rescissions, Redirections, and Reprogrammings that occurred between June 15, 2017 (the cut-off date for
last year’s budget book) and September 30, 2017 (the end of FY 2017)
Highway Trust Fund This appendix covers the District's FY 2018 through FY 2023 proposed Highway Trust Fund expenditures,
including:
• An Introduction chapter, which describes the Highway Trust Fund program, including the sources and uses ofthe funds, the District's policies and procedures for the trust fund, and the FY 2018 planning process;
• The Project Description Forms, which show planned allotments, for FY 2019 through FY 2024 and descriptions for Highway Trust Fund master projects; and
• Appendices that provide supporting tables for the District's Highway Trust Fund program.• An overview of the District of Columbia's Water and Sewer Authority's FY 2017 - FY 2026 Capital
Improvements Plan.

How to Read the FY 2019 Proposed Budget and Financial Plan
vi
Volume 6: Operating Appendices
This volume provides supporting tables to each agency's proposed operating budget. The tables generally
include FY 2016 and 2017 actual expenditures, the FY 2018 approved budget, the FY 2019 proposed budget,
and the change from FY 2018 to FY 2019 (unless noted).
The following tables are provided:
Schedule 30-PBB - dollars summarized by program, activity, and governmental fund (governmental fund
breakout is for FY 2017 only and includes general fund detail);
Schedule 40-PBB - dollars summarized by program, comptroller source group, and governmental fund;
Schedule 40G-PBB - dollars summarized by program, comptroller source group, and appropriated fund with-
in the General Fund;
Schedule 41 - dollars and FTEs summarized by comptroller source group and governmental fund;
Schedule 41G - dollars and FTEs summarized by comptroller source group and appropriated fund within the
General Fund; and
Schedule 80 - dollars and FTEs summarized by appropriated fund, with specific revenue source (for the FY
2019 Proposed Budget only).

How to Read the FY 2019 Proposed Budget and Financial Plan
vii
Agency budgetcode
A Summary of Services is a concise explanation of theagency’s key functions.
This section describes theagency’s mission and purpose.
Agency name, website address and telephone number (if applicable)
This shows the agency’s FY 2016 and 2017 actualexpenditures, FY 2018 approved budget, the FY 2019 proposed budget, and the percent variance from FY 2019 to FY 2018. This includes theagency’s operating budget and FTEs.

How to Read the FY 2019 Proposed Budget and Financial Plan
viii
This table also shows the agency's total operating budget from each fundingsource (Local, Dedicated Taxes, Special Purpose Revenue, Federal Payments,Federal Grants, Medicaid, Private Grants, or Intra-District sources).
This table presents the agency's total operatingbudget and Full-Time Equivalent (FTE) positions,comparing the FY 2016 and 2017 actuals, FY 2018approved, FY 2019 proposed budgets and the dollar and FTE changes.
This table lists the agency's total operating expendituresfor FY 2016 and FY 2017, the FY 2018 approved budget, andthe FY 2019 proposed budget at the Comptroller SourceGroup level.

How to Read the FY 2019 Proposed Budget and Financial Plan
ix
This table provides an overallbudgeted funding level andnumber of approved FTEs forthe FY 2016 and 2017 actuals,the FY 2018 approved budget,and the FY 2019 proposed bud-get for specific programs (ordivisions) and activities.

How to Read the FY 2019 Proposed Budget and Financial Plan
x
This indicates the specific programs (or divisions)and activities within an agency. It containsdetailed descriptions of their purpose and howthey contribute to the lives of District residentsand visitors.

How to Read the FY 2019 Proposed Budget and Financial Plan
xi
Typically referred to as Table 5, the FY 2018 ApprovedBudget compared to FY 2019 Proposed Budget, by RevenueType table describes the changes made to an agency fromthe Recurring Budget to the policy decisions, by fund, andby program.

How to Read the FY 2019 Proposed Budget and Financial Plan
xii
The FY 2019 Proposed Budget Changes sectionprovides a comprehensive explanation of Table5; it includes major internal changes within thebudget changes to the Recurring Budget andpolicy initiatives.
This section describes the changesmade to an agency during the overallbudget formulation process by fund andby program (or division).

How to Read the FY 2019 Proposed Budget and Financial Plan
xiii
The Agency Performance Plansdescribes specific agencyStrategic Objectives, Activitiesand key performance indicators.


Chapters:
1. Introduction
2. Financial Plan
3. Revenue
4. Operating Appendices
5. FY 2019 – FY 2024 Capital ImprovementsPlan


FY 2019 Proposed Budget and Financial Plan Introduction
1-1
The challenge for the District is to navigate this jurisdictional complexity while facing increasing service
needs. Totaling $14.4 billion, the gross budget in the FY 2019 Proposed Budget and Financial Plan is $409
million, or 2.9 percent, more than the FY 2018 Approved Budget of $14.0 billion, including Enterprise Fund
agencies but excluding intra-District funding. The gross budget excluding Enterprise Fund agencies is $12.5
billion. Figure 1-1 shows the major source of gross funds for FY 2019. Figure 1-2 does the same for Local
funds revenue.
The proposed budget funds services as diverse as street cleaning, affordable multi-family housing
development, voter registration, business inspection, fire-fighting, police patrol, running a lottery, managing a
vast multimodal transit system, providing health services and improving access to them, educating children
and adults, promoting economic development, encouraging people to move into the District, and protecting
at-risk youth and adults.
The District's proposed budget is similar to any other budget in that it identifies resources (revenues) and
uses (expenditures) to accomplish the specific purposes developed by citywide strategic planning and
departmental business planning. In addition to these basic elements, the proposed budget includes a financial
forecast for policy priorities and detailed cost information for agency programs and activities.
District of Columbia Fiscal Year 2019 Budget Policy and Priorities FocusThe Fiscal Year 2019 Proposed Budget and Financial Plan marks the District of Columbia’s 23nd consecutive
balanced budget – one that makes new investments in affordable housing, a safer, stronger District, a
high-quality public education system, robust infrastructure, a strong social service system, and job
opportunities for District residents. Additionally, this budget preserves the District’s 12 percent debt cap.
Investments in these priority areas will help ensure everyone in the District has a fair shot.
Continued Investments in Public Education and Youth Public education remains a top priority for the District in FY 2019. The proposed budget supports additional
educational investments, which are reflected in $94 million of increased funding for the District of Columbia
Public Schools (DCPS) and the District of Columbia Public Charter Schools (DCPCS), representing a 3.91
percent base adjustment to the Uniform Per Student Funding Formula. The DCPS schools’ budget includes
$4.4 million in targeted stabilization funding that provides support to schools that would have otherwise
experienced a reduction in funding. These investments address the at-risk student population through a funding
Introduction: FY 2019 ProposedBudget and Financial Plan
The District of Columbia government is unique and extremelycomplex. As one entity, the District government provides servicestypically delivered elsewhere by states, counties, cities, and specialtaxing districts.
1

Introduction FY 2019 Proposed Budget and Financial Plan
1-2
formula that ensures that funding follows the students who need it. The proposed budget also includes an
investment of $9.5 million in operating funds for the University of the District of Columbia for competitive
pay and to fund needed IT infrastructure improvements.
In order to address the affordability of early childhood education, the proposed budget includes a new $10
million enhancement increase to the subsidy provided to child care providers so that they can stay open and
create additional slots for infants and toddlers. The budget also includes a $1,000 refundable early learning tax
credit for families that enroll a child in licensed child development centers and do not already receive a
childcare subsidy from the District.
The proposed budget also includes nearly $15 million in funding for out-of-school time programs and will
significantly expand the number of slots available for after school and summer programs. These investments
will provide more grant opportunities for community based organizations and local education agencies and
expand the Department of Parks and Recreation summer camps to eight additional locations at DC public
schools.
Making Homelessness Rare, Brief and Non-RecurringThe District is working to transform its homeless services system to ensure that homelessness is rare, brief,
and non-recurring. The FY 2019 investments in stable housing will build a foundation from which families
can pursue important goals, including education, employment, and family stability, giving these residents a fair
shot at a pathway to the middle class.
The FY 2019 proposed budget provides $23 million in new money toward achieving the goals of
Homeward DC. This includes an increase of $9.5 million to fund permanent supportive housing, rapid
re-housing, and targeted affordable housing assistance to singles that experience homelessness and $10.5
million to continue significant investments for families who experience homelessness. The budget increases
efforts started last year to address youth who are homeless by investing $3.1 million for programs directly
targeted towards youth. Lastly, the budget invests $2.5 million to expand day-time services, provide targeted
outreach to encampments, and make improvements at low-barrier shelters for individuals experiencing
homeless. These investments will reach nearly 400 residents per day and provide much-needed daytime
services.
Additional Investments in Affordable HousingThe FY 2019 proposed budget continues to make significant investments in affordable housing. This is
reflected in $100 million of funding for the Housing Production Trust Fund. This funding level continues the
Administration’s commitment over the past three years to invest $100 million in the Housing Production Trust
Fund. Additionally, the budget includes $10 million for the Housing Preservation Fund to preserve existing
affordable housing.
To further the goals of housing affordability, the budget includes a $10 million increase for the Home
Purchase Assistance Program and Employer Assistance Housing Program at the Department of Housing and
Community Development, to assist District residents and employees, so that they can both work and live in
Washington, DC.
Investment in InfrastructureThe Capital Improvements Plan (CIP) makes major investments in the District’s infrastructure: For FY 2019,
the total CIP is $1.6 billion; the 6-year total is $8.08 billion.
Washington Metro Area Transit Authority (WMATA). In addition to the investments outlined below, the
FY 2019 budget commits to funding $178.5 million annually for infrastructure investments in WMATA. The
continued growth and vitality of our city and the region relies on a safe, efficient, and reliable Metro system
to transport residents and visitors alike. By joining our partners in Virginia and Maryland, this investment will
ensure that Metro can make critical safety and infrastructure improvements with a $500 million commitment
from the region.

FY 2019 Proposed Budget and Financial Plan Introduction
1-3
Public Schools Modernization and University Facilities. The District is currently undertaking a
comprehensive schools modernization initiative that began in 2008. So far, over $4 billion has been invested.
This CIP commits an additional investment of $1.35 billion over six years to ensure that schools are in line for
modernizations and necessary improvements. In addition, the CIP invests $132 million over the next six years
in infrastructure improvements for the University of the District of Columbia.
Roads, Sidewalks and Alleys. The proposed FY 2019 budget focuses on the basics by dedicating more than
$430 million to fix roads, sidewalks and alleys. With this investment, the District will eliminate all roads in
poor condition by FY 2024, all alleys in poor condition by FY 2021, and all sidewalks in poor condition by
FY 2020.
Integrated Premium Transit System. The CIP provides $269 million for the Circulator and streetcars, funding
the H Street – Benning Metro Station streetcar segment, and $195 million for the replacement of the H Street
Bridge.
South Capitol Street. The CIP includes $442 million for replacement of the Frederick Douglass Bridge and
improvements to the South Capitol Street corridor. South Capitol Street will be transformed into an urban
boulevard that will support economic development on both sides of the Anacostia River.
21st Century Public Libraries. Continuing efforts to fully modernize the Martin Luther King Jr. Memorial
Central Library, the CIP includes $79 million to complete the renovation of this historic landmark, resulting in
a world-class facility offering residents and visitors a vibrant center of activity for reading, learning, and
community discussion. In addition, libraries in District neighborhoods will receive $49.8 million to renovate
and modernize existing facilities, update I.T. systems including public access computers, and construct new
state-of-the-art facilities.
Saint Elizabeths Medical Center. The District places a high priority on providing public health services to all
District residents. Since taking control of the operations of the Not-for-Profit Hospital Corporation, commonly
referred to as United Medical Center (UMC), in 2010, the District has invested greatly in the District’s only
acute care hospital east of the Anacostia River. The CIP includes $300 million to replace the UMC with a new
hospital on the grounds of the Saint Elizabeths east campus.
Transitional Housing. The CIP provides $137 million for the Department of Human Services to renovate
facilities or acquire property and construct new facilities that will provide emergency and temporary housing
for families experiencing homelessness.
Details on Key Budget Areas:The proposed budget also includes a number of changes to align the budget with the District’s priorities,
improve services and accountability, and meet agency strategic business goals. They include the following:
• Funding to Improve Health Care for District Residents – The budget includes $1.6 million in funding
for Babies to Integrate Equitable Access to Services Act of 2018, or the B.A.B.I.E.S bill. This investment
ensures every pregnant woman receives patient-centered, high quality pre-natal care and every newborn
receives high-quality neonatal care in the hospital and outpatient setting. It also includes $1.4 million in
funding to develop a local individual responsibility mandate based on the pillars of the Affordable Care
Act; $7.4 million to provide school-based nursing and mental health services; and $1 million in increased
healthcare funding for women’s mental health parity within the Department of Corrections.

Introduction FY 2019 Proposed Budget and Financial Plan
1-4
• Funding for a Safer Stronger District of Columbia – This budget invests $1.7 million to expand the
Police Cadet Corps by 30 slots, from 70 to 100 positions, and $250,000 to expand the Police Officers
Retention Program for officers. It provides new resources for the Office of Neighborhood and Safety
engagement, including $1.5 million in grants for violence prevention outreach programs and $575,000 for
pathways program grants. An additional $440,000 in funding is provided to the Office of Victim Services
and Justice Grants to increase funding for community-based organizations providing trauma-specific
services for victims of crime, incarcerated and returning citizens, and truant youth. Funding is also
provided to Fire and Emergency Medical Services Department to continue the third-party ambulance
initiative, and $290,000 in new funding will allow the organization to hire three training academy
instructors for positions currently filled by uniformed personnel.
• Supporting our Senior Residents – The budget supports senior residents through a $2 million increase
in funding for Transport DC by implementing a change that will make sure property taxes for eligible
Seniors do not grow more than 5 percent a year, and providing $4.5 million through our Safe at Home
program to allow seniors to age in place. The CIP also includes $1.5 million for improvements at the Model
Cities Senior Wellness Center in Ward 5 and the Senior Wellness Center in Ward 8. It also adds $11.4
million to build a brand new senior wellness center in Ward 8 to address high demand for services.
• Investments in the Arts – The budget provides $10 million for creative economy development grants,
which provide capital support to non-profits and individuals; $4 million in programmatic support grants to
support non-profits with performance arts, festivals and exhibitions; $1 million to continue student field
trips in the arts program; $1 million to provide public school students cultural study abroad experiences;
and $300,000 to commission a statute of a historical person.
• DC Public Schools – For FY 2019, in the District’s Uniform Per Student Funding Formula (UPSFF),
which forms the basis for funding the public school system, the foundation level per student will be
increased to $10,658, an increase of 3.9 percent. Appropriations for the UPSFF are funded with 100 percent
Local dollars. Please refer to the agency budget chapters for the District of Columbia Public Schools
(DCPS) and the District of Columbia Public Charter Schools (DCPCS) to review the current allocation for
the UPSFF. DCPS student enrollment is projected to be 50,243 students.
• D.C. Public Charter Schools – The District of Columbia Public Charter Schools (DCPCS) operates as
the central agency, independent of the District’s school system, which disburses the UPSFF from District
of Columbia Local funds to charter schools, each of which operates as an autonomous school district. Both
the Residential and Non-Residential Facilities Allotments will increase in FY 2019: Residential to $8,854
per student and Non-Residential to $3,263 per student. DCPCS student enrollment is projected to increase
to 44,915 students.
• Public Works, Transportation and the Environment – The FY 2019 proposed budget includes an
increase of $2.9 million to right-size the District’s snow budget, $1 million for a rapid bus study along New
York Avenue, as well as $600,000 to assist with the management of the DC Circulator, which has been
transferred to DDOT from WMATA in FY 2019. The budget also includes $6 million of funding within
the Department of Energy and Environment to assist with water bill relief for District residents and
$593,000 for the Low Income Home Energy Assistance Program to provide benefit assistance to 1,000
additional homes.

FY 2019 Proposed Budget and Financial Plan Introduction
1-5
Where the Money Comes FromMoney for providing District services comes from a variety of sources. The District's General Fund revenue
consists of Local tax and nontax revenue, Dedicated Taxes, and Special Purpose Revenue funds. Federal
Grants, Federal Medicaid, and Federal Payments constitute the District's federal resources. Private resources
and Enterprise and Other funds make up the balance of the District's gross funds (Figure 1-1).
Local tax revenue accounts for most of the money supporting services and includes such common sources
as income, property, and sales taxes (Figure 1-2). Detailed revenue information, including FY 2019 to FY 2022
revenue estimates, projection assumptions, and the estimated revenue impact of proposed policy changes are
provided in the Revenue chapter of this budget volume.
How the Money is AllocatedTo facilitate policy decisions concerning expenditures and to provide summary information for reporting
expenditures, the District's budget is developed, presented, and executed along several dimensions. These
include fund types, appropriation titles, agencies, programs, and expense categories. As with revenues,
expenditures can be grouped by the source of funds. The total of these funds is referred to as “gross funds.”
Totaling $14.4 billion, the expenditure budget (including Enterprise and Other funds but excluding
Intra-District funds) in the FY 2019 Proposed Budget and Financial Plan is $409 million, or 2.9 percent, more
than the FY 2018 approved budget of $14.0 billion, as shown in Table 1-1.
For purposes of appropriating the District's proposed budget, agency budgets are grouped by appropriation
title or function, such as public safety and justice or public education. Within the appropriation titles are the
agencies that operate the programs, activities, and services provided to District citizens and businesses. For
example, the Public Works appropriation title includes the Department of Public Works, the District
Department of Transportation, and the Department of Motor Vehicles. Table 1-1 shows the FY 2019 proposed
gross funds expenditure budget by appropriation title and the change from FY 2018. Figure 1-3 shows the
percentage distribution of FY 2019 gross funds expenditure budget by appropriation title. The largest
appropriation titles, Public Education System and Human Support Services, represent 52.1 percent of the
District’s proposed budget – meaning more than one-half of every dollar generated is directed to these two
areas.
As shown in Table 1-2a, the proposed Local funds budget by appropriation title (excluding Dedicated
Taxes and Enterprise and Other funds) for FY 2019 is $7.8 billion, which is $100.9 million, or 1.3 percent,
more than the FY 2018 approved budget of $7.7 billion. As shown in Table 1-2b, the proposed Dedicated Tax
budget by appropriation title for FY 2019 is $522 million, which is $147 million, or 39.1 percent, more than
the FY 2018 approved budget of $375 million. The FY 2019 proposed Local funds budget includes
approximately 100 agencies receiving Local funds in seven appropriation titles.
To provide context as to the types of expenses for a particular program, information is presented by expense
category. These same categories are used by all District agencies, and all agency chapters detail specific agency
costs by expense category. Tables 1-3a and 1-3b break out the proposed FY 2018 Local funds and Dedicated
Tax budgets, respectively, by expense category.
A large expense category is personal services, totaling $2.9 billion and representing 36.8 percent of the
FY 2019 proposed Local funds budget, excluding Dedicated Taxes. This funding will support 30,104 Local
full-time equivalent (FTE) positions, an increase of 1,005 FTEs, or 3.5 percent, over FY 2018 (see Table 1-4).
Including all fringe benefits, but excluding extra compensation such as overtime and shift differential, the
average Local FTE for FY 2019 will cost $91,333. The District's FY 2019 gross funds proposed budget,
including Intra-District funds, supports 37,247 FTEs, an increase of 1,072 FTEs, or 3.0 percent, over FY 2018.
Major gross funds FTE changes by agency and appropriation title are detailed in Table 1-5.

Introduction FY 2019 Proposed Budget and Financial Plan
1-6
Organization of the FY 2019 Proposed Budget and Financial Plan The FY 2019 Proposed Budget and Financial Plan is composed of the following volumes:
• Volume 1 – Executive Summary;
• Volumes 2, 3, and 4 – Agency Budget Chapters – provides summary information of each District agency’s
proposed budget;
• Volume 5 – FY 2019 – FY 2024 Capital Improvements Plan (Including Highway Trust Fund); and
• Volume 6 – Operating Appendices – provides detailed information about operating funds by agency
(available on-line only).
Additional details about the organization of the District’s FY 2019 Proposed Budget and Financial Plan
may be found in the How to Read the Budget and Financial Plan chapter.
The FY 2019 Budget Calendar The FY 2019 Proposed Budget and Financial Plan is the culmination of a year-long process. Some of the
critical steps in the budget formulation process and their general schedule are described in Table 1-6.
The District’s Budget Process: A Brief Overview The District of Columbia Home Rule Act, approved December 24, 1973 (Public Law 93-198; D.C. Official
Code § 1-201.01 et seq.), as amended by the Local Budget Autonomy Amendment Act of 2012, effective July
25, 2013 (D.C. Law 19-321; codified in scattered sections of Chapter 2 of Title I of the D.C. Official Code),
prescribes the procedure for the approval of the annual budget for the District of Columbia government. Under
Section 424(d)(5)(A) (D.C. Official Code § 1-204.24d(5)(A)), the Chief Financial Officer prepares and
submits to the Mayor and the Council annual estimates of all revenues of the District of Columbia (without
regard to the source of such revenues), including proposed revenues. These revenue estimates are binding on
the Mayor and the Council for purposes of the annual budget to be submitted to Congress, except that the
Mayor and the Council may base the budget on estimates of revenues that are lower than those prepared by
the Chief Financial Officer. Under Section 442(a) (D.C. Official Code § 1-204.42(a)), the Mayor prepares and
submits a proposed annual budget to the Council. In preparing the annual budget, the Mayor may use a budget
prepared by the Chief Financial Officer for this purpose under Section 424(d)(2) (D.C. Official Code §
1-204.24d(2)). The Mayor may also prepare and submit supplemental or deficiency budget recommendations
to the Council from time to time, pursuant to Section 442(c) (D.C. Official Code § 1-204.24(c)). A statement
of justifications must be included.
Under Section 603(c) (D.C. Official Code § 1-206.03(c)), the Mayor is required to submit a balanced
budget and identify any tax increases that shall be required to balance the budget. The Council is required to
adopt such tax increases to the extent the budget is approved. The annual budget submitted shall include,
among other items, a multi-year plan for all agencies of the District government (as required under Section
443 (D.C. Official Code § 1-204.43)) and multi-year capital improvements plan for all agencies of the District
government (as required under Section 444 (D.C. Official Code § 1-204.44)).
The Council must hold a public hearing on the budget submission and adopt a budget by two separate acts
pursuant to the time period required by Section 446 (D.C. Official Code § 1-204.46). The acts are entitled the
Local Budget Act and the Federal Portion Budget Request Act. The Local Budget Act requires two readings
before the Council and the Federal Portion Budget Request Act requires only one reading.
Unlike other acts submitted to the Mayor for signature, the Mayor may exercise a line-item veto under
Section 404(f) (D.C. Official Code § 1-204.04(f)). If an item or provision is disapproved, the Mayor must
attach to the act a statement of the item or provision that is disapproved and, within the 10-day period for
approval or disapproval, return a copy of the act and statement with her objections to the Council.
The Council has 30 calendar days to reenact a disapproved item or provision by a two-thirds vote of the
members of the Council present and voting. If an item or provision is reenacted, the Chairman submits it to

FY 2019 Proposed Budget and Financial Plan Introduction
1-7
Congress. If a disapproved item or provision is not returned to the Council in a timely manner, the Mayor shall
be deemed to have approved the item or provision, and the Chairman will submit it to Congress.
The Local Budget Act is submitted to Congress for a 30-day period of review, like all other permanent
legislation submitted under Home Rule Act Section 602(c) (D.C. Official Code § 1-206.02(c)). This act shall
take effect upon the expiration of the 30-day period (excluding Saturdays, Sundays, holidays, and any day on
which neither House is in session because of an adjournment sine die, a recess of more than 3 days, or an
adjournment of more than 3 days) beginning on the day such act is transmitted by the Chairman to the Speaker
of the House of Representatives and the President of the Senate, unless during such 30-day period, there has
been enacted into law a joint resolution disapproving such act. In any case in which any such joint resolution
disapproving such an act has, within such 30-day period, passed both Houses of Congress and has been
transmitted to the President, such resolution, upon becoming law, subsequent to the expiration of such 30-day
period, shall be deemed to have repealed such act, as of the date such resolution becomes law.
The Federal Portion Budget Request Act is submitted by the Mayor to the President for transmission to
Congress. Unlike the Local Budget Act, the Federal Portion Budget Request Act does not become effective
after a period of congressional review; it never becomes District of Columbia local law. Ultimately, Congress
appropriates all federal funds for the District by an act. This act may, but it not required to, include some or
all provisions of the Federal Portion Budget Request Act as transmitted by the District.
The Mayor may prepare a proposed supplemental or deficiency budget plan under Home Rule Act Section
442(c) (D.C. Official Code § 1-204.42(c)), which authorizes the Mayor to submit budget recommendations
that are, in his or her judgment, necessary on account of a law passed after budget transmission or otherwise
justified as in the public interest. The process for submitting a supplemental budget is also included in Home
Rule Act Section 446 (D.C. Official Code § 1-204.46), and mirrors the statutory requirements of submitting
the annual Local Budget Act. This includes requirements for a public hearing, submission to Congress, and
Congressional review.
The District of Columbia may obligate and expend an increase in the amount of funds authorized under
Adjustments to Appropriations (D.C. Official Code § 47-369.01 et seq.) only where the Chief Financial Officer
certifies (1) the increase in revenue; and (2) that the use of the amounts is not anticipated to have a negative
impact on the long-term financial, fiscal, or economic health of the District. These funds may be increased (1)
by an aggregate amount of not more than 25 percent, in the case of amounts proposed to be allocated as
“Other-Type Funds” in the annual Budget Request Act submitted to Congress; and (2) by an aggregate amount
of not more than 6 percent, in the case of any other amounts proposed to be allocated in the Budget Request
Act. The amounts shall be obligated and expended in accordance with laws enacted by the Council in support
of each such obligation and expenditure, consistent with the requirements of this subchapter. The amounts may
not be used to fund any agencies of the District government operating under court-ordered receivership. The
amounts may not be obligated or expended unless the Mayor has notified the Committees on Appropriations
of the House of Representatives and the Senate not fewer than 30 days in advance of the obligation or
expenditure.

Introduction FY 2019 Proposed Budget and Financial Plan
1-8
Figure 1-1
Where the Money Comes From – Sources of Gross Funds for FY 2019($14.5 Billion, Excluding Intra-District funds)
Dedicated Taxes
$0.5B
3.6%
Federal Grants and
Medicaid
$3.4B
23.4%
Private Grants and
Private Donations
$0.0B*
0.0%
Special Purpose Revenue
$0.7B
4.9%
Federal Payments
$0.1B
0.3%
Local
$7.9B
54.4%
Enterprise Funds
$1.9B
13.4%
*The amount from this source is $4.2 million

FY 2019 Proposed Budget and Financial Plan Introduction
1-9
Property Tax
$2.7B
34.6%
Fund Balance,
Proposals, Transfers
and Other
$0.1B
0.8%
Lottery
$0.1B
0.6%
Non-Tax Revenue
$0.4B
5.5%
Gross Receipts Tax
$0.2B
3.1%
Other Taxes
$0.4B
5.3%
Income Tax
$2.7B
33.7%Sales Tax
$1.3B
16.4%
Figure 1-2
Where the Money Comes From – Sources of Local Fund Revenue for FY 2019 ($7.9 Billion, Excluding Dedicated Taxes)

Introduction FY 2019 Proposed Budget and Financial Plan
1-10
Figure 1-3
Where the Money Goes -Gross Funds Expenditure Budget, by Appropriation Title for FY 2019($14.4 Billion, Excluding Intra-District Funds)
Public Safety
and Justice
$1.3B
9.3%
Public Education
System
$2.6B
18.1%
Human Support Services
$4.9B
34.0%
Public Works
$0.9B
6.2%
Financing and
Other
$1.2B
8.4%
Enterprise Funds
$1.9B
13.4%
Governmental Direction
and Support
$0.9B
6.0%
Economic Development
and Regulation
$0.7B
4.6%

FY 2019 Proposed Budget and Financial Plan Introduction
1-11
Table 1-1
Gross Funds Expenditure Budget, by Appropriation Title (Excluding Intra-District Funds)(Dollars in Thousands)
FY 2018 Approved FY 2019 Proposed Change % Change
Budget Budget from FY 2018 from FY 2018
Governmental Direction and Support 807,604 862,623 55,018 6.8%
Economic Development and Regulation 649,347 666,437 17,090 2.6%
Public Safety and Justice 1,327,530 1,348,357 20,827 1.6%
Public Education System 2,473,785 2,612,140 138,355 5.6%
Human Support Services 4,769,449 4,907,047 137,598 2.9%
Public Works 877,828 900,705 22,876 2.6%
Financing and Other 1,321,826 1,211,513 -110,313 -8.3%
Subtotal, General Operating Funds 12,227,369 12,508,821 281,452 2.3%
Enterprise and Other Funds 1,806,652 1,934,146 127,494 7.1%
Total District of Columbia 14,034,021 14,442,967 408,946 2.9%
Note: Details may not sum to totals because of rounding.
Table 1-2a
Local Funds Expenditure Budget, by Appropriation Title(Excluding Dedicated Taxes and Enterprise and Other Funds)
(Dollars in Thousands)FY 2018 Approved FY 2019 Proposed Change % Change
Budget Budget from FY 2018 from FY 2018
Governmental Direction and Support 699,486 747,858 48,371 6.9%
Economic Development and Regulation 318,048 346,289 28,241 8.9%
Public Safety and Justice 1,112,225 1,135,270 23,045 2.1%
Public Education System 2,136,786 2,277,485 140,699 6.6%
Human Support Services 1,875,336 2,021,308 145,971 7.8%
Public Works 565,516 422,785 -142,731 -25.2%
Financing and Other 1,038,473 895,732 -142,741 -13.7%
Total 7,745,869 7,846,726 100,857 1.3%
Note: Details may not sum to totals because of rounding.
Table 1-2b
Dedicated Taxes Expenditure Budget, by Appropriation Title(Excluding Enterprise and Other Funds)
(Dollars in Thousands)FY 2018 Approved FY 2019 Proposed Change % Change
Budget Budget from FY 2018 from FY 2018
Governmental Direction and Support 0 1,350 1,350 N/A
Economic Development and Regulation 1,170 1,292 122 10.4%
Public Education System 4,676 4,676 0 0.0%
Human Support Services 86,907 67,527 -19,380 -22.3%
Public Works 85,572 258,489 172,917 202.1%
Financing and Other 197,081 188,807 -8,274 -4.2%
Total 375,406 522,141 146,735 39.1%
Note: Details may not sum to totals because of rounding.

Introduction FY 2019 Proposed Budget and Financial Plan
1-12
Table 1-3a
Local Funds Proposed Expenditure Budget, by Category(Excluding Dedicated Taxes and Enterprise and Other Funds)
(Dollars in Thousands)FY 2018 FY 2019 Change % Change
Approved Proposed from from
Budget Budget FY 2018 FY 2018
Regular Pay - Continuing Full Time 2,120,362 2,096,492 -23,871 -1.1%
Regular Pay - Other 160,138 194,253 34,116 21.3%
Additional Gross Pay 70,971 76,797 5,827 8.2%
Fringe Benefits - Current Personnel 429,167 458,706 29,539 6.9%
Overtime Pay 58,404 64,004 5,600 9.6%
Subtotal, Personal Services 2,839,042 2,890,252 51,211 1.8%
Supplies and Materials 42,391 47,898 5,507 13.0%
Energy, Comm. and Building Rentals 96,169 92,542 -3,627 -3.8%
Telephone, Telegraph, Telegram, Etc. 31,054 34,161 3,107 10.0%
Rentals - Land and Structures 146,552 129,350 -17,202 -11.7%
Janitorial Services 61 0 -61 -100.0%
Security Services 24,688 23,756 -932 -3.8%
Occupancy Fixed Costs 56,613 74,410 17,796 31.4%
Other Services and Charges 205,493 206,087 594 0.3%
Contractual Services - Other 385,985 446,652 60,667 15.7%
Subsidies and Transfers 3,167,854 3,097,996 -69,858 -2.2%
Equipment and Equipment Rental 27,243 28,855 1,612 5.9%
Debt Service 722,726 774,767 52,041 7.2%
Subtotal, Nonpersonal Services 4,906,827 4,956,473 49,646 1.0%
Total District of Columbia 7,745,869 7,846,726 100,857 1.3%
Note: Details may not sum to totals because of rounding.
Table 1-3b
Dedicated Taxes Proposed Expenditure Budget, by Category (Excluding Enterprise and Other Funds)
(Dollars in Thousands)FY 2018 FY 2019 Change % Change
Approved Proposed from from
Budget Budget FY 2018 FY 2018
Regular Pay - Continuing Full Time 2,142 2,404 262 12.3%
Regular Pay - Other 62 0 -62 -100.0%
Fringe Benefits - Current Personnel 495 542 48 9.6%
Subtotal, Personal Services 2,698 2,946 248 9.2%
Supplies and Materials 8 12 4 51.3%
Telephone, Telegraph, Telegram, Etc. 2 3 2 100.0%
Other Services and Charges 25 307 282 1,125.7%
Contractual Services - Other 1,822 3,008 1,186 65.1%
Subsidies and Transfers 362,999 508,000 145,001 39.9%
Equipment & Equipment Rental 20 27 7 34.1%
Debt Service 7,832 7,839 6 0.1%
Subtotal, Nonpersonal Services 372,708 519,195 146,487 39.3%
Total District of Columbia 375,406 522,141 146,735 39.1%
Note: Details may not sum to totals because of rounding.

FY 2019 Proposed Budget and Financial Plan Introduction
1-13
Table 1-4
Local Funds Proposed FTEs, by Appropriation Title (Includes Dedicated Taxes and Excludes Enterprise Funds)
(Dollars in Thousands)FY 2018 FY 2019 Change % Change
Approved Proposed from from
Budget Budget FY 2018 FY 2018
Governmental Direction and Support 3,242 3,291 49 1.5%
Economic Development and Regulation 749 834 85 11.3%
Public Safety and Justice 8,692 8,854 162 1.9%
Public Education System 9,902 10,330 428 4.3%
Human Support Services 4,260 4,590 331 7.8%
Public Works 2,214 2,205 -10 -0.5%
Financing and Other 40 0 -40 -100.0%
Subtotal, General Operating Local Fund 29,099 30,104 1,005 3.5%
Public Education System 20 22 2 9.7%
Human Support Services 6 6 -1 -9.1%
Subtotal, General Operating Dedicated Taxes 26 27 1 5.4%
Total, General Operating Local and Dedicated Tax Funds 29,125 30,131 1,006 3.5%
Note: Details may not sum to totals because of rounding.

Introduction FY 2019 Proposed Budget and Financial Plan
1-14
Table 1-5
Major Gross Funds FTE Changes (Including Enterprise and Other Funds and Intra-District Funds)
FY 2018 FY 2019
Approved Proposed Increase
Agency Name FTEs FTEs (Decrease) Explanation of Major FTE Changes
D.C. Department of Human Resources 167 153 (15) To recognize savings from a reduction in FTEs
Office of the Attorney General for the
District of Columbia 639 655 15 To align personal services with projected costs
Office of the Chief Financial Officer 1,003 1,022 19 To align personal services with projected costs
Other Agencies 2,085 2,108 23 Net Change
Governmental Direction and Support 3,895 3,937 42
Department of Employment Services 682 759 77 To align personal services with projected costs
Department of Consumer and To align personal services with projected costs
Regulatory Affairs 437 448 11 within the Licensing and Permitting Division
Other Agencies 855 860 5 Net Change
Economic Development and Regulation 1,974 2,067 93
Metropolitan Police Department 4,726 4,756 30 To reallocate resources for agency restructure
To support additional FTEs in Inmate Custody
Department of Corrections 1,247 1,321 74 Division
Transfer from Department of Parks and
Recreation to serve as Roving Leaders for
Neighborhood Safety and Engagement 16 26 10 community outreach
Other Agencies 3,251 3,255 4 Net Change
Public Safety and Justice 9,239 9,358 118
District of Columbia Public Schools 8,343 8,849 507 To align personal services with projected costs
Office of the State Superintendent of Education 449 434 (15) To align personal services with projected costs
Other Agencies 1,986 2,000 14 Net Change
Public Education System 10,777 11,284 506
To support additional FTEs in multiple
Department of Human Services 1,248 1,338 89 programs
To support additional FTEs in multiple
Department of Behavioral Health 1,383 1,414 31 programs
Department of Health 606 638 32 To support the increase in pre-trail admissions
To align personal services with projected costs
Employees' Compensation Fund 0 52 52 and move claims processing in-house
Department of Youth Rehabilitation Services 554 590 36 To align personal services with projected costs
Department of Health Care Finance 264 351 87 To reallocate resources for agency restructure
Other Agencies 2,146 2,156 11 Net Change
Human Support Services 6,200 6,538 338
(Continued on next page)

FY 2019 Proposed Budget and Financial Plan Introduction
1-15
Table 1-5 (Continued)
Major Gross Funds FTE Changes (Including Enterprise and Other Funds and Intra-District Funds)
FY 2018 FY 2019
Approved Proposed Increase
Agency Name FTEs FTEs (Decrease) Explanation of Major FTE Changes
Department of Public Works 1,488 1,464 (24) To align personal services with projected costs
Department of Energy and Environment 393 414 21 To align personal services with projected costs
Other Agencies 958 964 6 Net Change
Public Works 2,840 2,842 3
Transferred to the Employees' Compensation
Non-Departmental 40 0 (40) Fund
Other Agencies 0 0 0 Net Change
Financing and Other 40 0 (40)
Office of Lottery and Charitable Games 75 77 2 To align personal services with projected costs
D.C. Health Benefit Exchange Authority 92 101 9 To align personal services with projected costs
Other Agencies 1,043 1,043 0 Net Change
Enterprise and Other Funds 1,210 1,221 11
Grand Total, District Government 36,175 37,247 1,072
Note: Details may not sum to totals because of rounding.

Introduction FY 2019 Proposed Budget and Financial Plan
1-16
Table 1-6
How and When the FY 2019 Operating Budget was Prepared
Budget GuidanceJuly 2017 – September 2017 The FY 2019 budget process began with the development of the Current Services Funding Level (CSFL)
budget. The CSFL is a Local funds ONLY representation of the true cost of operating District agencies, before
consideration of policy decisions. The CSFL reflects changes from the FY 2018 approved budget across
multiple programs and estimates how much it would cost an agency to continue its current programs and
operations into the following fiscal year.
Agency Budget Request Development October 2017 – December 2017 Taking into consideration the Office of the City Administrator’s (OCA) citywide strategic plan, and following
the budget guidance from the OCA’s Office of Budget and Performance Management (OBPM) and the
Office of Budget and Planning (OBP), agencies began formulating their FY 2019 budget requests. Agencies
submitted their FY 2019 proposed budget to OBP by:
Tier 1 – Submission Date, November 3, 2017
Tier 2 – Submission Date, November 17, 2017
Tier 3 – Submission Date, December 8, 2017
Budget Analysis October 2017 – December 2017 OBP reviewed agency budgets during the various development stages for adherence to established guidelines,
identified opportunities for efficiencies, and incorporated revised economic data into the formulation process.
Budget Presentation January 2018 – March 2018 OBP collaborated with OBPM to conduct a thorough and sound analysis of the budget as it was developed
and revised during the Budget Review Team meetings where policy priorities were determined, and the
Mayor’s FY 2019 proposed budget was finalized for submission to the Council on March 21, 2018.
Local Budget Act, Federal Portion Budget Request Act, and Budget Support ActMarch 2018 – June 2018 During this period, the Council reviews, amends, and approves the Fiscal Year 2019 budget and corresponding
financial plan. The Council conducts numerous budget oversight hearings during which they question
Executive Branch witnesses and receive testimony from the public.
The Council approves three pieces of legislation. The Fiscal Year 2019 Local Budget Act of 2018 approves
all funding the District receives – except for Federal Payments that are unique to the District. The Fiscal Year
2019 Federal Portion Budget Request Act of 2018 requests the approval of the Federal Payments, previously
submitted in the President’s budget. The Fiscal Year 2019 Budget Support Act of 2018 reflects conforming
changes to Local law required to implement the budget.

FY 2019 Proposed Budget and Financial Plan Financial Plan
2-1
The District uses the multi-year financial plan as a working tool throughout the fiscal year to monitor the
impact of legislative proposals, programmatic initiatives, and economic changes on the District's near-term
fiscal outlook. This financial plan focuses on the FY 2019 Proposed Budget and its impact on FY 2020 through
FY 2022. It has four sections:
• Revenues and Other Resources;
• Expenditures;
• Composition of Cash Reserves; and
• Composition of Fund Balance.
The numbering scheme noted below refers to the line numbers on Tables 2-1, 2-2, 2-3, and 2-4. The
amounts in the FY 2016 and FY 2017 Actual columns are as published in the District’s Comprehensive Annual
Financial Report (CAFR) for FY 2016 and FY 2017.
2
Financial Plan
The Financial Plan projects the District’s results of operations for threefiscal years beyond the proposed FY 2019 operating budgets of theGeneral Fund (comprised of Local funds, Dedicated Taxes, andSpecial Purpose Revenue funds) and the Federal and Private Resourcesfunds (comprised of Federal Grants, Federal Payments, FederalMedicaid Payments, and Private Grants and Donations). The actualresults for the prior fiscal year and the approved and revised budgetsfor the current fiscal year are also included as context for FY 2019through FY 2022 of the financial plan.

Financial Plan FY 2019 Proposed Budget and Financial Plan
2-2
Revenues and Other Resources
2. Taxes. This category includes property, sales, income, and other taxes, which are projected by theOffice of Revenue Analysis. See the Revenue chapter for details.
3. Dedicated Taxes. This includes tax revenues that are dedicated by law to a particular agency for aparticular purpose. The dedicated portion of tax revenues is transferred out of the Local fund and is not available for general budgeting. See the Revenue chapter for details. In Table 2-3, these dedicated taxes areshown as follows:
3a. Deed Recordation and Deed Transfer Taxes transfer for HPTF debt service. The HousingProduction Trust Fund (HPTF) Second Amendment Act of 2002 requires that 15 percent of theDistrict's Deed Recordation and Transfer Tax Revenue be transferred to the HPTF annually. TheHPTF provides funds for the acquisition, construction, and rehabilitation of affordable multifamilyhousing projects. These revenues are recorded directly in the Special Revenue fund outside of theGeneral Fund. The Deed Recordation and Transfer Tax Revenue reflected in this line funds only debtservice on Revenue Bonds for New Communities projects, which is paid through the General Fundfrom the 15 percent portion of the Deed Taxes.
3b. Healthcare Provider Tax transfer to Nursing Facility Quality of Care Fund. TheHealthcare Provider Tax is an assessment per licensed bed that is paid by each nursing facility in theDistrict. Revenues from the assessments are dedicated to the Nursing Facility Quality of Care Fund.The legislation was passed in 2004.
3c. General Sales Taxes and Insurance Premiums transfer to Healthy D.C. Fund. The “FiscalYear 2007 Budget Support Act of 2006”, Section 15b, established the Healthy D.C. and HealthcareExpansion Fund. All health maintenance organizations pay taxes equal to 2 percent of their policy andmembership fees and net premium receipts with certain exclusions. Any revenues arising from con-tracts for services under the District’s Medicaid program, D.C. Health Care Alliance program, orHealthy D.C. program shall be deposited into the Healthy D.C. Fund. Of all other revenues generat-ed, 75 percent shall be deposited in the Healthy D.C. Fund and 25 percent shall be deposited in theGeneral Fund. Also deposited into the Healthy D.C. Fund is the 6 percent sales tax on purchases ofmedical marijuana. The Fund is used to finance health care and medical services for qualifying indi-viduals in the District of Columbia. This fund is administered by the Department of Health CareFinance.
3d. ICF-IDD Assessment transfer to Stevie Sellows Fund. Each institution providing care to thedevelopmentally disabled in the District of Columbia pays an assessment of 5.5 percent of gross revenue in quarterly installments. These assessments are transferred to the Stevie Sellows QualityImprovement Fund. The fund was established to fund quality of care improvements in a qualifiedICF-IDD (Intermediate Care Facility for Persons with Intellectual or Developmental Disabilities).
3e. Inpatient Hospital Bed Tax and Medicaid Hospital Outpatient Tax transfer to Hospital
Fund and Hospital Provider Fee Fund. The Medicaid Hospital Inpatient Rate Supplement Act of2017 authorized the District to continue to charge a fee on each hospital’s inpatient net patient revenue in fiscal year 2018. The tax rate for FY 2018 is .45 percent. All revenues collected from feesare deposited into the Hospital Fund. The Medicaid Hospital Outpatient Supplemental Payment Actof 2017 authorized the District to continue to charge a fee on each hospital’s outpatient gross patientrevenue in fiscal year 2018. All revenues collected from fees are deposited into the Hospital Fund.This fund must be used to make Medicaid outpatient hospital access payments and refunds. Bothtaxes sunset September 30, 2018.

FY 2019 Proposed Budget and Financial Plan Financial Plan
2-3
3f. General Sales Taxes transfer to Washington Metropolitan Area Transit Authority
(WMATA) – Parking Taxes. Beginning in FY 2012, all parking sales tax revenue is used to helpmeet the District’s funding responsibility for WMATA.
3g. General Sales Taxes transfer to Convention Center. This fund records the transfer of certain sales tax revenues from the District’s General Fund to the Washington Convention and SportsAuthority, Walter E. Washington Convention Center.
3h. Motor Fuel Tax transfer to Highway Trust Fund. This fund records the transfer of motorfuel tax revenues from the District’s General Fund to the Highway Trust Fund.
3i. General Sales Taxes transfer to Alcoholic Beverage Regulation Administration (ABRA).
Effective in FY 2012, the sales tax rate on alcoholic beverages for off-premise consumption wasincreased to 10 percent. Since FY 2014, the transfer to ABRA to fund the Reimbursable DetailSubsidy Program has been fixed at $1.170 million annually.
3j. General Sales Taxes transfer to Healthy Schools Fund. Effective in FY 2012, soft drinks(non-alcoholic beverages not containing milk, or milk substitutes, non-carbonated fruit or vegetablejuice, coffee, cocoa or tea) are no longer exempt from sales tax. An estimated $4.266 million raisedannually from taxing soft drinks goes to the Healthy Schools Fund. The FY 2018 Budget SupportAct of 2017 increased the sales taxes to be transferred to the Healthy Schools Fund from $4.266 mil-lion to $4.666 million for FY 2018 only.
3k. Deed Recordation and Deed Transfer Taxes transfer to West End Library/Firehouse
Maintenance Fund. Beginning in FY 2017, deed taxes from the sale of West End Developmentcondos (after the HPTF dedication) are transferred to the West End Library/Firehouse Maintenancefund.
4. General Purpose Non-Tax Revenues. This line includes revenue from licenses and permits, fines,
charges for services, and other revenue sources that are not dedicated to particular purposes. See the Revenue
chapter for details.
5. Special Purpose (O-Type) Revenues. Special purpose non-tax revenues, or O-Type or Other
revenues, are funds generated from fees, fines, assessments, or reimbursements that are designated for use by
the District agency that collects the revenues to cover the cost of performing the function. The designation of
the revenue for the use of the collecting agency is what distinguishes this revenue from the general-purpose
non-tax revenues.
6. Transfer from Lottery. This line reflects the portion of Office of Lottery and Charitable Games
revenue that is transferred to the District's General Fund.
7. Subtotal, General Fund Revenues. This line reflects the sum of lines 1 through 6.
8. Bond Proceeds for Issuance Costs. This is the portion of the bond proceeds that will be used to cover
the cost of issuing General Obligation (or Income Tax Revenue) bonds. The related expenditure is on line 25.
9. Fund Balance Use. This reflects the reservation of fund balance in prior years that is budgeted for
use in future years.

Financial Plan FY 2019 Proposed Budget and Financial Plan
2-4
9a. Certified Resources not used. Certified Resources not used. In Table 2-4, this line shows thetotal amount of certified resources not used by agencies in their particular funds and returned to theirrelevant fund balances.
10. Fund Balance Use from FY 2018. This reflects the reservation of fund balance in FY 2018 that is
budgeted for use in future years.
11. Revenue Transfers from FY 2017. This line represents revenue collected in FY 2017, initially
recorded in funds outside the General Fund and later transferred to the General Fund.
12. Central Services Cost Allocation from Federal Funds. This line reflects the movement of Indirect
Cost Recovery (IDCR) funds from Federal Grant funds, designated by the grantor, into Local funds, to cover
administrative costs.
13. Transfer from Enterprise and Other Funds. In Table 2-1, this line shows transfer of funds from
Enterprise and other Special Revenue Funds as itemized below and in Tables 2-2 and 2-4.
13a. Transfer from TIF/PILOT/Other. In Tables 2-2 and 2-4, the amounts include transfers intothe General Fund from Tax Increment Financing (TIF), Payment in Lieu of Taxes (PILOT), andother outside (Enterprise) funds.
13b. Transfer from Capital Fund Paygo. In Tables 2-2 and 2-4, the amounts shown are transferredinto the General Fund from the Capital Improvements Fund. No bond proceeds can be transferred;only capital funds that were originally Pay-as-you-go (Paygo) capital funds can be transferred.
14. Revenue Proposals. This line reflects proposed revenue changes that are detailed in the Revenue
chapter of this volume. Please see the Policy Proposals section in the Revenue chapter, Table 3-12.
14a. Revenue Proposals. In Tables 2-2 and 2-3, this line reflects proposed revenue changes that aredetailed in the Revenue chapter of this volume.
14b. Revenue Proposals - WMATA Dedicated Tax Funding Metro. See the Policy Proposalssection in the Revenue chapter, pages 3-21 and 3-22.
15. Total Resources. This line shows the sum of the individual revenue and fund balance items present-
ed in lines 7 through 14 above.
16. Line intentionally left blank.

FY 2019 Proposed Budget and Financial Plan Financial Plan
2-5
Expenditures (by Appropriation Title)
Lines 18-23. These lines reflect agency expenditures by appropriation title.
24. Financing and Other - Selected Agencies. This line includes items in this appropriation title that are
not specifically shown in lines 25 through 31.
25. Bond Issuance Costs. This line reflects the cost of issuing General Obligation (or Income Tax
Revenue) bonds. The related funding source is on line 8.
26. Debt Service. This line includes Repayment of Debt and other debt service agencies.
27. Subtotal, Operating Expenditures. This line shows the sum of lines 18 through 26.
28. Paygo Capital. Reflects transfers of operating revenue to the capital budget through Pay-as-you-go
(Paygo) financing.
29. Transfer to Trust Fund for Post-Employment Benefits. Tables 2-1 and 2-2 reflect a transfer to
reduce the District's accumulated liability for health insurance costs for retirees. This liability is recognized in
the CAFR in accordance with the Governmental Accounting Standards Board (GASB) ruling on the treatment
of such costs.
30. Repay Contingency Reserve Fund. This line in Tables 2-1 and 2-2 reflects the amount planned to
replenish the Contingency Reserve Fund.
31. Transfer to Enterprise and Other Funds. This shows the transfer of General Funds to Enterprise
and Other Funds as reflected in the following lines.
31a. Transfer to Highway Trust Fund. This line in Table 2-3 reflects transfers of dedicated motorfuel tax revenues and in Table 2-4 reflects transfers of a portion of Rights-of-Way revenues to theHighway Trust Fund.
31b. Transfer to Convention Center. This line in Table 2-2 reflects transfers of Local funds and inTable 2-3 reflects transfers of dedicated sales tax revenues to the Washington Convention and SportsAuthority Enterprise Fund.
32. Operating Impact of Capital Improvements Plan (CIP). This line in Tables 2-1 and 2-2 reflects
the estimated cost of operating and maintaining newly completed capital projects. See Volume 5, FY 2018–
FY 2023 Capital Improvements Plan, for details.
33. Total Expenditures and Transfers. This is the sum of lines 27 to 32.
34. Operating Margin Before Reservations. This line is the difference between lines 15 and 33
showing the surplus or deficit after subtracting total expenditures and transfers from total resources.

35. Reserves.
35a. Required Increases in Emergency, Contingency, and Debt Service Reserves.
35b. Reserve for Subsequent Years’ Expenditures. This amount in FY 2018 reflects the totalamount reserved for subsequent years.
36. Operating Margin After Reservations. This is the difference between line 34 and lines 35a and 35b.
37. Line intentionally left blank.
38. Beginning General Fund Balance. Shows the accumulated fund balance at the beginning of the
fiscal year, which is identical to the end-of-year fund balance for the previous fiscal year.
39. Operating Margin Before Reservations. This is the same as line 34.
40. Projected GAAP Adjustments (Net). GAAP adjustments are year-end adjustments necessary to
properly report the ending fund balance on an accounting basis by converting budgeted activity to resources
earned and used.
41. Fund Balance Use. The amount of fund balance from prior years used in the current year is
subtracted when calculating the current year-end fund balance. The amount is the total of lines 9 and 10.
42. Ending General Fund Balance. This line shows the sum of the beginning fund balance, the
operating margin before reservations, and GAAP and other adjustments (lines 38 through 41).
43. Line intentionally left blank.
Composition of Cash Reserves
45. Emergency Cash Reserve Balance (2 percent). The District was required to establish an
Emergency Reserve by the end of FY 2004, equal to 4 percent of the District's Local expenditures. The
requirement was satisfied in FY 2002. In FY 2005, the requirement was changed to 2 percent, and the base for
the calculation was also changed.
46. Contingency Cash Reserve Balance (4 percent). The District was required to establish a
Contingency Reserve by the end of FY 2007, equal to 3 percent of the District's Local expenditures. The
requirement was satisfied in FY 2002. In FY 2005, the requirement was changed to 4 percent, and the base for
the calculation was also changed.
47. Cash Flow Reserve (8.33 percent). The cash flow reserve may be used by the District’s CFO as
needed to manage the District’s cash flow. When a portion of the reserve is used to meet cash flow needs, this
reserve must be replenished in the same fiscal year the amounts were used. At full funding, the Cash Flow
Reserve must equal 8.33 percent of the General Fund operating budget for each fiscal year. This Account was
established by section 47-392.02(j-1) of the District of Columbia Official Code. The Fiscal Year 2011 Budget
Request Act of 2010 authorizes 50 percent of the undesignated end-of-year fund balance to be deposited in
this account.
Financial Plan FY 2019 Proposed Budget and Financial Plan
2-6

FY 2019 Proposed Budget and Financial Plan Financial Plan
2-7
48. Fiscal Stabilization Reserve (2.34 percent). The Fiscal Stabilization Reserve may be used by the
Mayor for the same purposes for which the Contingency Reserve was established. The Fiscal Year 2011
Budget Request Act of 2010 authorizes 50 percent of the undesignated end-of-year fund balance to be deposit-
ed in this account. The Fiscal Year 2017 Budget Support Act of 2016 authorized the Chief Financial Officer
to use the Fiscal Stabilization Reserve for cash flow management purposes, provided, that any amounts used
must be replenished in the same fiscal year. At full funding, the Fiscal Stabilization Reserve must equal 2.34
percent of the District’s General Fund operating expenditures for each fiscal year. This Account was estab-
lished by section 47-392.02(j-1) of the District of Columbia Official Code.
49. Total Cash Reserves. This is the sum of lines 45 - 48.

Financial Plan FY 2019 Proposed Budget and Financial Plan
2-8
Table 2-1 FY 2019 - FY 2022 Proposed Budget and Financial Plan: GENERAL FUND($ thousands)
FY 2016 FY 2017 FY 2018 FY 2018 FY 2019 FY 2020 FY 2021 FY 2022Actual Actual Approved Revised Proposed Projected Projected Projected
1 Revenues
2 Taxes 6,732,024 6,944,891 7,042,789 7,103,774 7,335,593 7,572,441 7,826,689 8,104,139
3 Dedicated Taxes 318,259 332,837 340,655 372,208 367,285 377,022 390,184 398,895
4 General Purpose Non-Tax Revenues 509,009 474,380 405,827 429,424 429,995 422,211 423,143 418,411
5 Special Purpose (O-type) Revenues 533,557 548,367 575,424 617,554 640,589 623,997 628,216 611,965
6 Transfer from Lottery 53,287 45,600 45,000 45,000 45,000 45,000 45,000 45,000
7 Subtotal, General Fund Revenues 8,146,136 8,346,074 8,409,695 8,567,960 8,818,461 9,040,670 9,313,233 9,578,410
8 Bond Proceeds for Issuance Costs 2,600 5,565 8,000 8,000 8,000 6,000 6,000 6,000
9 Fund Balance Use 63,812 0 348,408 494,820 169,988 116,147 57,123 19,089
10 Fund Balance Use from FY 2018 0 0 0 0 0 0 0 107,231
11 Revenue Transfers from FY 2017 0 25,491 0 0 0 0 0 0
12 Central Services Cost Allocation from Federal Funds 1,318 500 2,363 2,363 954 954 954 954
13 Transfer from Enterprise and Other Funds 25,898 32,960 11,941 39,156 14,493 13,194 14,575 10,962
14 Revenue Proposals 0 0 4,288 (4,714) 83,238 86,860 89,078 91,623
15 Total General Fund Resources 8,239,764 8,410,591 8,784,695 9,107,584 9,095,134 9,263,825 9,480,963 9,814,270
16
17 Expenditures (by Appropriation Title)
18 Governmental Direction and Support 761,189 759,770 774,540 813,230 829,391 818,349 834,427 856,853
19 Economic Development and Regulation 470,338 439,701 555,105 560,257 578,311 449,428 453,790 443,523
20 Public Safety and Justice 1,227,296 1,188,028 1,160,565 1,190,814 1,182,681 1,201,137 1,210,915 1,232,278
21 Public Education System 1,933,143 2,058,235 2,162,396 2,261,210 2,303,274 2,317,458 2,358,351 2,399,762
22 Human Support Services 1,855,732 1,914,422 2,003,391 2,052,451 2,133,674 2,126,467 2,162,124 2,198,747
23 Public Works 698,215 731,261 837,634 856,726 860,619 862,038 879,825 898,085
24 Financing and Other - Selected Agencies (DO0, UP0, ZH0, ZZ0) 37,242 25,502 213,105 105,109 83,552 143,502 157,941 160,697
25 Bond Issuance Costs (ZB0) 2,945 5,721 8,000 8,000 8,000 6,000 6,000 6,000
26 Debt Service (DS0, ZA0, SM0, DT0, ZC0, ELO) 622,145 670,943 728,089 728,089 771,085 837,427 900,549 1,064,965
27 Subtotal, Operating Expenditures 7,608,244 7,793,583 8,442,825 8,575,886 8,750,587 8,761,806 8,963,923 9,260,910
28 Paygo Capital (PA0) 144,105 133,380 130,298 106,410 81,706 247,487 258,917 285,949
29 Transfer to Trust Fund for Post-Employment Benefits (RH0) 29,000 31,000 44,500 44,500 46,000 49,000 49,800 51,500
30 Repay Contingency Reserve Fund (SV0) 0 0 0 96,603 0 0 0 0
31 Transfer to Enterprise and Other Funds (KZ0, EZ0) 157,248 167,901 166,572 176,455 191,645 199,339 202,129 209,717
32 Operating Impact of CIP 0 0 0 0 0 5,694 5,694 5,694
33 Total Expenditures and Transfers 7,938,597 8,125,864 8,784,195 8,999,854 9,069,938 9,263,325 9,480,463 9,813,770
34 Operating Margin Before Reservations 301,167 284,726 500 107,731 25,196 500 500 500
35 Reserved for Subsequent Years' Expenditures 0 0 0 107,231 24,696 0 0 0
36 Operating Margin After Reservations 301,167 284,726 500 500 500 500 500 500
37
(Continued on next page)

FY 2019 Proposed Budget and Financial Plan Financial Plan
2-9
Table 2-1 (Continued)FY 2019 - FY 2022 Proposed Budget and Financial Plan: GENERAL FUND($ thousands)
FY 2016 FY 2017 FY 2018 FY 2018 FY 2019 FY 2020 FY 2021 FY 2022Actual Actual Approved Revised Proposed Projected Projected Projected
38 Beginning General Fund Balance 2,167,062 2,389,088 2,676,292 2,676,292 2,280,303 2,126,611 2,002,064 1,936,541
39 Operating Margin Before Reservations 301,167 284,726 500 107,731 25,196 500 500 500
40 Projected GAAP Adjustments (Net) (15,329) 2,477 (15,000) (8,900) (8,900) (8,900) (8,900) (8,900)
41 Fund Balance Use (see lines 9 and 10) (63,812) 0 (348,408) (494,820) (169,988) (116,147) (57,123) (126,320)
42 Ending General Fund Balance 2,389,088 2,676,292 2,313,384 2,280,303 2,126,611 2,002,064 1,936,541 1,801,821
43
44 Composition of Cash Reserves
45 Emergency Cash Reserve Balance (2%) 129,022 137,967 139,835 139,835 151,844 152,308 156,247 159,189
46 Contingency Cash Reserve Balance(4%) 258,043 275,934 279,670 279,670 303,689 304,615 312,495 318,379
47 Cash Flow Reserve Account (8.33%) 592,346 592,346 567,456 562,410 525,241 519,826 503,426 487,300
48 Fiscal Stabilization Reserve Account (2.34%) 185,763 185,763 205,550 210,597 212,237 216,762 221,843 229,642
49 Total Cash Reserves 1,165,174 1,192,010 1,192,511 1,192,511 1,193,011 1,193,511 1,194,011 1,194,511
(Numbers may not add due to rounding)

Financial Plan FY 2019 Proposed Budget and Financial Plan
2-10
FY 2016 FY 2017 FY 2018 FY 2018 FY 2019 FY 2020 FY 2021 FY 2022Actual Actual Approved Revised Proposed Projected Projected Projected
1 Revenues
2 Taxes 6,732,024 6,944,891 7,042,789 7,103,774 7,335,593 7,572,441 7,826,689 8,104,139
4 General Purpose Non-Tax Revenues 509,009 474,380 405,827 429,424 429,995 422,211 423,143 418,411
6 Transfer from Lottery 53,287 45,600 45,000 45,000 45,000 45,000 45,000 45,000
7 Subtotal, Local Fund Revenues 7,294,320 7,464,871 7,493,616 7,578,198 7,810,588 8,039,651 8,294,832 8,567,550
8 Bond Proceeds for Issuance Costs 2,600 5,565 8,000 8,000 8,000 6,000 6,000 6,000
9 Fund Balance Use 0 0 254,624 393,428 108,973 116,147 57,123 19,089
10 Fund Balance Use from FY 2018 0 0 0 0 0 0 0 107,231
11 Revenue Transfers from FY 2017 0 25,491 0 0 0 0 0 0
12 Central Services Cost Allocation from Federal Funds 1,318 500 2,363 2,363 954 954 954 954
13a Transfer from TIF/PILOT/Other 11,816 13,518 11,941 12,076 14,493 13,194 14,575 10,962
13b Transfer from Capital Fund Paygo 14,082 19,442 0 27,080 0 0 0 0
14a Revenue Proposals 0 0 (24,175) 19,461 107,413 111,035 113,253 115,798
14b Revenue Proposal-WMATA Dedicated Tax Funding Metro 0 0 0 0 (178,500) (178,500) (183,855) (189,371)
15 Total Local Fund Resources 7,324,136 7,529,387 7,746,370 8,040,605 7,871,922 8,108,482 8,302,882 8,638,213
16
17 Expenditures (by Appropriation Title)
18 Governmental Direction and Support 724,729 726,567 699,486 734,844 747,858 740,774 756,602 778,678
19 Economic Development and Regulation 301,316 264,876 318,048 317,629 346,289 253,205 257,830 262,541
20 Public Safety and Justice 1,188,692 1,148,235 1,112,225 1,141,451 1,135,270 1,158,578 1,170,219 1,191,582
21 Public Education System 1,921,708 2,048,509 2,136,786 2,228,002 2,277,485 2,294,988 2,335,521 2,376,596
22 Human Support Services 1,755,182 1,802,236 1,875,336 1,928,325 2,021,308 2,020,948 2,052,041 2,089,829
23 Public Works 505,672 508,211 565,516 555,494 422,785 609,522 623,035 638,568
24 Financing and Other - Selected Agencies (DO0, UP0, ZH0, ZZ0) 37,242 25,502 211,287 103,341 80,068 143,502 157,941 160,697
25 Bond Issuance Costs (ZB0) 2,945 5,721 8,000 8,000 8,000 6,000 6,000 6,000
26 Debt Service (DS0, ZA0, SM0, ZC0, ELO) 609,209 657,799 714,726 714,726 757,493 823,605 884,936 1,049,039
27 Subtotal, Operating Expenditures 7,046,695 7,187,656 7,641,409 7,731,811 7,796,554 8,051,122 8,244,125 8,553,529
28 Paygo Capital (PA0) 88,043 76,410 59,960 59,960 4,171 2,167 2,764 26,991
29 Transfer to Trust Fund for Post-Employment Benefits (RH0) 29,000 31,000 44,500 44,500 46,000 49,000 49,800 51,500
30 Repay Contingency Reserve Fund (SV0) 0 0 0 96,603 0 0 0 0
31b Transfer to Convention Center (EZ0) 8,365 3,486 0 0 0 0 0 0
32 Operating Impact of CIP 0 0 0 0 0 5,694 5,694 5,694
33 Total Local Fund Expenditures and Transfers 7,172,102 7,298,553 7,745,869 7,932,874 7,846,726 8,107,982 8,302,382 8,637,713
34 Operating Margin Before Reservations 152,034 230,835 500 107,731 25,196 500 500 50035a Required Increases in Emergency, Contingency,
and Debt Service Reserves 0 0 0 0 24,696 0 0 0
35b Reserved for Subsequent Years' Expenditures 0 0 0 107,231 0 0 0 0
36 Operating Margins After Reservations 152,034 230,835 500 500 500 500 500 500
(Numbers may not add due to rounding)
Table 2-2 FY 2019 - FY 2022 GENERAL FUND - Local Funds Component($ thousands)

FY 2019 Proposed Budget and Financial Plan Financial Plan
2-11
The following table details the sources of fund balance from FY 2015 through FY 2017 that are used in
FY 2018 through FY 2022, as shown in line 9 of the Local funds financial plan (table 2-2). These amounts
come from the FY 2015, FY 2016, and FY 2017 Comprehensive Annual Financial Report (CAFR). Some are
displayed as specific lines in CAFR table N60a (Note 11), while others are within broader categories displayed
in that table.
Table 2-2a (Continued)Details on Fund Balance Use (line 9 of Local funds component)($ thousands)
FY 2017 FY 2018 FY 2018 FY 2019 FY 2020 FY 2021 FY 2022Fund Balance Use Actual Approved Revised Proposed Projected Projected Projected
Agency Local Fund Balance Carryover 0 0 42,200 0 0 0 0
Commodity Cost Reserve (FY 2016 Value) 0 0 0 5,000 0 0 0
FY 2015 Interfund Transfers from SPR and Other Funds 0 1,389 1,389 0 0 0 0
FY 2016 Carryover 0 9,393 9,393 0 53,318 0 0
FY 2017 Carryover 0 148,414 148,414 32,802 19,683 33,085 16,433
FY 2017/2018 Interfund Transfers from SPR and Other Funds 0 18,517 18,517 23,161 0 0 0
FY 2018 Contingency Cash 0 0 96,603 0 0 0 0
FY 2019 Interfund Transfers from SPR and Other Funds 0 0 0 8,952 10,898 1,638 2,656
Reserved for Future Pay Agreements 0 16,000 16,000 0 0 0 0
Reserved for Universal Paid Leave 0 20,039 20,039 0 0 0 0
Soccer Stadium Financing Fund 0 5,096 5,096 5,712 7,997 2,401 0
WMATA Operations Support Fund 0 35,777 35,777 0 0 0 0
Workforce Investments _ FY 2017 Carryover 0 0 0 33,346 24,250 20,000 0
Total 0 254,624 393,428 108,973 116,147 57,123 19,089
(Numbers may not add due to rounding)

Financial Plan FY 2019 Proposed Budget and Financial Plan
2-12
Table 2-3FY 2019 - FY 2022 General Fund - Dedicated Taxes Component($ thousands)
FY 2016 FY 2017 FY 2018 FY 2018 FY 2019 FY 2020 FY 2021 FY 2022Actual Actual Approved Revised Proposed Projected Projected Projected
1 Revenues
3a Deed Recordation and Deed Transfer Taxes
transfer to HPTF for debt service 7,822 7,913 7,832 7,832 7,839 7,839 7,836 7,837
3b Healthcare Provider Tax transfer to Nursing
Facility Quality of Care Fund 17,014 13,949 14,928 14,283 14,917 15,215 15,519 15,830
3c General Sales Taxes and Insurance Premiums
transfer to Healthy DC Fund 45,083 46,303 50,471 46,276 47,132 48,074 49,036 50,016
3d ICF-IDD Assessment transfer to Stevie Sellows Fund 4,860 4,913 5,704 4,918 5,479 5,479 5,479 5,479
3e Inpatient Hospital Bed Tax & Provider Fee transfer
to Hospital Fund 16,806 15,928 14,330 14,819 0 0 0 0
3f General Sales Taxes transfer to WMATA 72,355 74,167 76,480 100,897 104,164 107,534 111,709 114,337
3g General Sales Taxes transfer to Convention Center 123,551 138,128 140,138 149,196 155,543 162,090 170,201 175,307
3h Motor Fuel Tax transfer to Highway Trust Fund 25,332 26,099 24,936 25,761 25,426 25,095 24,769 24,447
3i General Sales Taxes transfer to ABRA 1,170 1,170 1,170 1,170 1,170 1,170 1,170 1,170
3j General Sales Taxes transfer to Healthy Schools Fund 4,266 4,266 4,666 4,666 4,266 4,266 4,266 4,266
3k Deed Recordation and Deed Transfer Taxes transfer
to West End Library/Firehouse Maintenance Fund 0 0 0 2,391 1,350 260 199 205
7 Subtotal, Dedicated Taxes 318,259 332,837 340,655 372,208 367,285 377,022 390,184 398,895
9 Fund Balance Use 0 0 10,576 14,617 532 0 0 0
14a Revenue Proposals 0 0 24,175 (24,175) (24,175) (24,175) (24,175) (24,175)
14b Revenue Proposal-WMATA Dedicated Tax Funding Metro 0 0 0 0 178,500 178,500 183,855 189,371
15 Total Dedicated Taxes 318,259 332,837 375,406 362,651 522,141 531,347 549,864 564,091
16
17 Expenditures (by Appropriation Title)
18 Governmental Direction and Support 0 0 0 2,391 1,350 260 199 205
19 Economic Development and Regulation 1,170 1,048 1,170 1,170 1,292 1,170 1,170 1,170
20 Public Safety and Justice 0 0 0 0 0 0 0 0
21 Public Education System 4,436 4,597 4,676 7,508 4,676 4,266 4,266 4,266
22 Human Support Services 73,248 79,241 86,907 82,979 67,527 68,768 70,034 71,325
23 Public Works 68,809 74,429 85,572 85,814 258,489 83,359 87,534 90,162
24 Financing and Other - Selected Agencies 0 0 0 0 0 0 0 0
26 Debt Service (DT0) 7,822 7,825 7,832 7,832 7,839 7,839 7,836 7,837
27 Subtotal, Operating Expenditures 155,485 167,140 186,157 187,694 341,172 165,662 171,039 174,966
28 Paygo Capital (PA0) 0 0 24,175 0 0 178,500 183,855 189,371
31a Transfer to Highway Trust Fund (KZ0) 25,332 26,099 24,936 25,761 25,426 25,095 24,769 24,447
31b Transfer to Convention Center (EZ0) 123,551 138,128 140,138 149,196 155,543 162,090 170,201 175,307
33 Total Dedicated Taxes Expenditures and Transfers 304,368 331,367 375,406 362,650 522,141 531,347 549,864 564,091
34 Operating Margin 13,891 1,470 0 0 0 0 0 0
(Numbers may not add due to rounding)
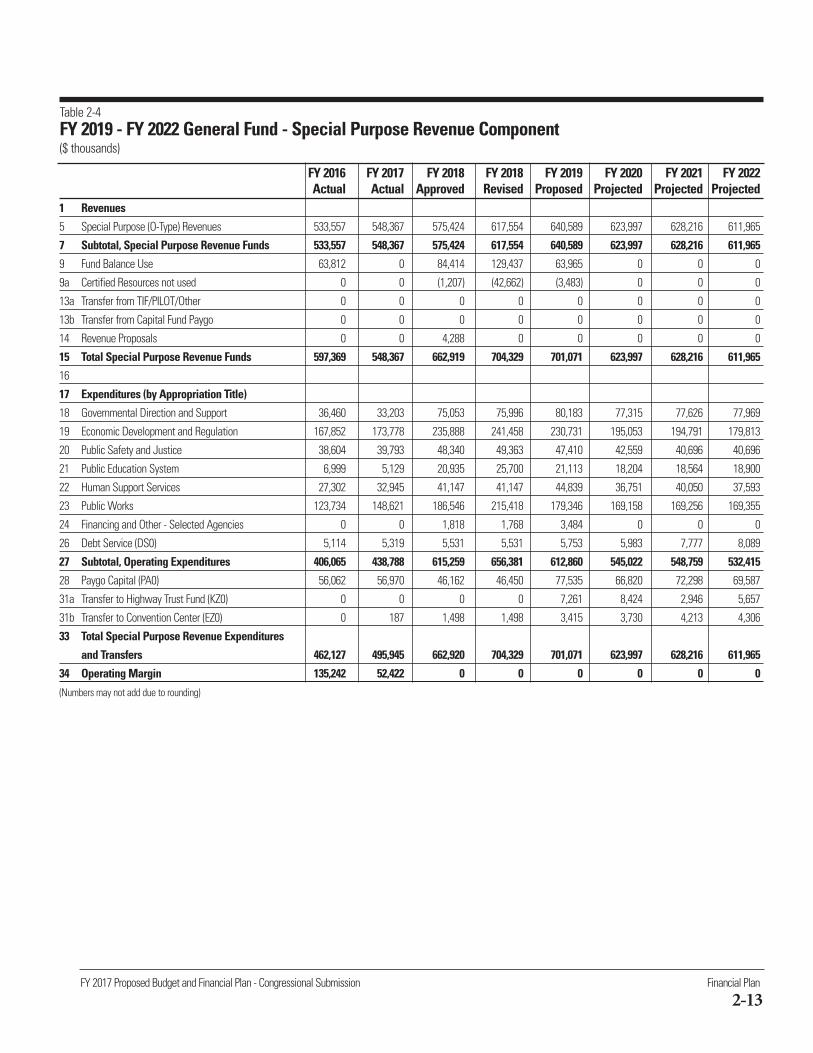
FY 2017 Proposed Budget and Financial Plan - Congressional Submission Financial Plan
2-13
Table 2-4FY 2019 - FY 2022 General Fund - Special Purpose Revenue Component($ thousands)
FY 2016 FY 2017 FY 2018 FY 2018 FY 2019 FY 2020 FY 2021 FY 2022Actual Actual Approved Revised Proposed Projected Projected Projected
1 Revenues
5 Special Purpose (O-Type) Revenues 533,557 548,367 575,424 617,554 640,589 623,997 628,216 611,965
7 Subtotal, Special Purpose Revenue Funds 533,557 548,367 575,424 617,554 640,589 623,997 628,216 611,965
9 Fund Balance Use 63,812 0 84,414 129,437 63,965 0 0 0
9a Certified Resources not used 0 0 (1,207) (42,662) (3,483) 0 0 0
13a Transfer from TIF/PILOT/Other 0 0 0 0 0 0 0 0
13b Transfer from Capital Fund Paygo 0 0 0 0 0 0 0 0
14 Revenue Proposals 0 0 4,288 0 0 0 0 0
15 Total Special Purpose Revenue Funds 597,369 548,367 662,919 704,329 701,071 623,997 628,216 611,965
16
17 Expenditures (by Appropriation Title)
18 Governmental Direction and Support 36,460 33,203 75,053 75,996 80,183 77,315 77,626 77,969
19 Economic Development and Regulation 167,852 173,778 235,888 241,458 230,731 195,053 194,791 179,813
20 Public Safety and Justice 38,604 39,793 48,340 49,363 47,410 42,559 40,696 40,696
21 Public Education System 6,999 5,129 20,935 25,700 21,113 18,204 18,564 18,900
22 Human Support Services 27,302 32,945 41,147 41,147 44,839 36,751 40,050 37,593
23 Public Works 123,734 148,621 186,546 215,418 179,346 169,158 169,256 169,355
24 Financing and Other - Selected Agencies 0 0 1,818 1,768 3,484 0 0 0
26 Debt Service (DS0) 5,114 5,319 5,531 5,531 5,753 5,983 7,777 8,089
27 Subtotal, Operating Expenditures 406,065 438,788 615,259 656,381 612,860 545,022 548,759 532,415
28 Paygo Capital (PA0) 56,062 56,970 46,162 46,450 77,535 66,820 72,298 69,587
31a Transfer to Highway Trust Fund (KZ0) 0 0 0 0 7,261 8,424 2,946 5,657
31b Transfer to Convention Center (EZ0) 0 187 1,498 1,498 3,415 3,730 4,213 4,306
33 Total Special Purpose Revenue Expenditures
and Transfers 462,127 495,945 662,920 704,329 701,071 623,997 628,216 611,965
34 Operating Margin 135,242 52,422 0 0 0 0 0 0
(Numbers may not add due to rounding)

Financial Plan FY 2019 Proposed Budget and Financial Plan
2-14
Federal and Private Resources Fund
■ Federal Grants are grants the District receives from federal agencies, including block grants, formula
grants, certain entitlements, and competitive grants.
■ Federal Payments are direct appropriations from the Congress to the District, usually to a particular
District agency for a particular purpose.
■ Federal Medicaid Payments are the federal share of the District's Medicaid costs. Generally, the
federal government pays 70 percent of the cost of Medicaid while the District pays 30 percent, although
the proportions differ in certain circumstances.
■ Private Grants and donations are grants or donations the District receives from non-federal sources.
Table 2-5 displays a summary financial plan for the Federal and Private Resources Fund. The line items are as
follows:
F2. Federal Grants. Federal grant awards received by District agencies.
F3. Federal Payments. Funding contributed by the federal government for specific projects. These
funds are restricted in use by the federal government.
F4. Private Grants and Donations. Revenues received from private grants and donations.
F5. Subtotal, Federal and Private Resources. This line is the sum of lines F2 through F4.
F6. Fund Balance Use. In Table 2-5, this line shows $2.9 million of fund balance use in FY 2016 as
certified in the District’s Comprehensive Annual Financial Report (CAFR), Exhibit 2-d.
F7. Transfer to General Fund. This line represents funds used to pay for indirect costs, as shown on line
12 in Tables 2-1 and 2-2.
F8. Total Federal and Private Resources. This is the sum of lines F5 through F7.
F9. Line intentionally left blank.
F11-F17. Expenditures by Appropriation Title. These items reflect agency expenditures by appropriation
title.
F18. Debt Service. This line includes expenditures related to Repayment of Debt.
F19. Total Federal and Private Expenditures. This is the sum of lines F11 through F18.
F20. Operating Margin. This is the difference between Total Federal and Private Resources (line F8) and
Total Federal and Private Expenditures (line F19).

FY 2019 Proposed Budget and Financial Plan Financial Plan
2-15
Table 2-5FY 2019 - FY 2022 Federal and Private Resources Financial Plan($ thousands)
FY 2016 FY 2017 FY 2018 FY 2018 FY 2019 FY 2020 FY 2021 FY 2022Actual Actual Approved Revised Proposed Projected Projected Projected
F1 Revenues
F2 Federal Grants 2,950,272 3,087,994 3,360,771 3,477,359 3,385,765 3,445,624 3,506,549 3,568,560
F3 Federal Payments 64,512 88,975 80,900 103,349 49,900 49,900 49,900 49,900
F4 Private Grants and Donations 5,389 11,731 3,866 14,373 4,172 4,249 4,329 4,409
F5 Subtotal, Federal and Private Resources 3,020,173 3,188,700 3,445,537 3,595,082 3,439,837 3,499,773 3,560,778 3,622,869
F6 Fund Balance Use 2,863 11,912 0 0 0 0 0 0
F7 Transfer to General Fund (1,318) (500) (2,363) (2,363) (954) (954) (954) (954)
F8 Total Federal and Private Resources 3,021,719 3,200,112 3,443,174 3,592,719 3,438,883 3,498,819 3,559,824 3,621,915
F9
F10 Expenditures (by Appropriation Title)
F11 Governmental Direction and Support 27,034 27,746 33,065 35,724 33,232 33,852 34,484 35,129
F12 Economic Development and Regulation 69,841 71,636 94,242 104,575 88,126 89,725 91,354 93,013
F13 Public Safety and Justice 80,112 121,892 166,964 173,755 165,676 168,570 171,515 174,514
F14 Public Education System 261,867 252,426 311,388 341,972 308,866 313,805 318,831 323,948
F15 Human Support Services 2,522,613 2,632,056 2,766,058 2,855,158 2,773,373 2,822,219 2,871,933 2,922,529
F16 Public Works 25,613 31,812 40,195 44,841 40,085 40,817 41,563 42,323
F17 Financing and Other - Selected Agencies 14,281 44,412 13,000 18,431 12,000 12,000 12,000 12,000
F18 Debt Service (DS0) 18,361 18,132 18,262 18,262 17,525 17,831 18,143 18,461
F19 Total Federal and Private Expenditures 3,019,722 3,200,112 3,443,174 3,592,719 3,438,883 3,498,819 3,559,824 3,621,915
F20 Operating Margin 1,997 0 0 0 0 0 0 0
(Numbers may not add due to rounding)

Financial Plan FY 2019 Proposed Budget and Financial Plan
2-16
General Fund A fund is a fiscal and accounting entity with a self-balancing set of accounts that the District uses to keep track
of specific sources of funding and spending for a particular purpose. An appropriated fund is a collection of
appropriated revenues and expenditures set up by congressional authority. The General Fund is the principal
operating fund of the District, which is used to account for all financial resources except those required to be
accounted for in another fund. The General Fund consists of three appropriated funds: Local, Dedicated Taxes,
and Special Purpose Revenue (O-type or other) funds.
The Local fund is funded by tax and non-tax revenues that are not earmarked for a particular purpose and
are allocated to fund District programs during the annual budget process. The Dedicated Tax fund is funded
by tax revenues dedicated by law to a particular agency for a particular purpose. The Special Purpose Revenue
fund is used to account for proceeds for specific non-tax revenue sources (other than expendable trusts, spe-
cial assessments, or major capital projects) that are legally restricted to expenditures for specified purposes.
An intra-District fund is an accounting mechanism set up to track payments for services provided by one
District agency to another District agency, similar to an internal service fund. Intra-District budgets represent
agreements between two agencies whereby one agency purchases services from the other. The buying agency
spends its own budget (Local, Special Purpose Revenue, Federal, or Private). The selling agency receives this
expenditure as intra-District revenue, establishes intra-District budget authority, and spends against that
authority to provide the service. Intra-District revenues and expenditures are not included in District-wide
totals or in the financial plan because to do so would create a double-count.

FY 2019 Proposed Budget and Financial Plan Revenue
3-1
This chapter presents the revenue outlook for the District of Columbia’s General Fund for FY 2018 to
FY 2022. The chapter is divided into four broad sections:
• Economic Outlook: Underlying condition of the District’s economy with analysis of key variables that
drive the revenue estimate.
• Baseline Revenues: Local, dedicated and special purpose revenues before proposals that affect revenues.
• Policy Proposals: Summary of all proposals that have not been incorporated in the baseline revenues.
• Detailed Tables:Additional tables showing dedicated taxes, non-tax revenue, special purpose revenue and
current tax rates.
Revenue is derived from both tax and non-tax sources. Non-tax sources consist of fees, fines, assessments,
and reimbursements, while tax sources are levies on broad measures of citizens’ ability to pay (e.g., income,
consumption, wealth). Some tax revenues are dedicated to special uses and are not available for general
budgeting; these are called dedicated taxes. Similarly, some non-tax sources are dedicated to the agency that
collects the revenues and are known as special purpose revenues.
3
Revenue
TOTAL GENERAL FUND REVENUE - FISCAL YEAR 2019
NET TAX REVENUE 83.2%

Revenue FY 2019 Proposed Budget and Financial Plan
3-2
SUMMARYThe FY 2018 baseline estimate of $7.58 billion in total Local fund revenue, which excludes dedicated taxes
and special purpose revenue, is $100.2 million (1.3%) higher than FY 2017 revenue. (See Table 3-1.) The
$7.81 billion estimate for FY 2019 is an increase of $232.4 million (3.1%) from FY 2018.
Including dedicated and special purpose revenues and policy initiatives, total FY 2018 general fund
revenue in the financial plan is $8.56 billion, $204.1 million more than in FY 2017 and $8.90 billion in
FY 2019, $338.5 million more than FY 2018.
Various policy initiatives increase general fund revenue in FY 2019 by $83.2 million. The policy initiatives
are summarized in Table 3-12 and are discussed in the context of the specific revenue item for each proposal.
Table 3-1General Fund Revenues, FY 2017-2022(Dollars in Thousands)
FY 2017 FY 2018 FY 2019 FY 2020 FY 2021 FY 2022Type of Revenue Actual Revised Original Projected Projected Projected
Local Fund - Baseline 7,477,966 7,578,198 7,810,588 8,039,651 8,294,832 8,567,550
Level Change 100,232 232,391 229,063 255,181 272,718
% Change Annual 1.3% 3.1% 2.9% 3.2% 3.3%
Taxes 6,944,852 7,103,774 7,335,593 7,572,441 7,826,689 8,104,139
General Purpose Non-Tax Revenues 487,514 429,424 429,995 422,211 423,143 418,411
Transfer from Lottery 45,600 45,000 45,000 45,000 45,000 45,000
Dedicated/Special Purpose - Baseline 881,203 989,762 1,007,873 1,001,018 1,018,401 1,010,860
Level Change 108,559 18,111 -6,855 17,382 -7,541
% Change Annual 12.3% 1.8% -0.7% 1.7% -0.7%
Dedicated Taxes 332,837 372,208 367,285 377,022 390,184 398,895
Special Purpose (O-Type) Revenues 548,367 617,554 640,589 623,997 628,216 611,965
Total Revenue - Baseline 8,359,169 8,567,960 8,818,461 9,040,670 9,313,233 9,578,410
Level Change 208,791 250,502 222,208 272,564 265,177
% Change Annual 2.5% 2.9% 2.5% 3.0% 2.8%
Revenue Policy Proposals (4,714) 83,238 86,860 89,078 91,623
Total Revenue with Proposals 8,359,169 8,563,246 8,901,700 9,127,529 9,402,311 9,670,033
Level Change 204,077 338,454 225,830 274,782 267,722
% Change Annual 2.4% 4.0% 2.5% 3.0% 2.8%
Addendum: Dedicated tax revenue to enterprise funds 194,996 209,965 225,968 249,530 264,707 255,202

FY 2019 Proposed Budget and Financial Plan Revenue
3-3
ECONOMIC OUTLOOKA variety of sources provides the basis for this outlook for the District of Columbia economy over the course
of the financial plan. They include: cash collection reports; federal data on District population, employment,
and income; discussions with revenue, business, and real property advisory groups about the District’s
economy; and forecasts of the U.S. and regional economies prepared by private sector firms. This economic
outlook is similar to last year’s, with additional population, employment, and income expected over the next
several fiscal years.
PopulationPopulation growth has been a major factor in increasing the District’s income and sales tax bases and is also
a driver of rising home values. In the last five years (2012 to 2017) the District’s population has grown by
58,342 (9.4%), an increase that averaged almost 1,000 net new residents per month. Population growth was,
however, slower in 2017 than the average of the last five years due to slower net in-migration. From 2016 to
2017 the increase was 9,636, 44.6 percent of which was from natural increase (births minus deaths). For
FY 2018 and FY 2019, the financial plan assumes that population will grow an average of 8,700 per year.
Federal SpendingFederal civilian employment accounts for about 25 percent of all jobs located in the District of Columbia and
33 percent of the wages and salaries that are generated in the city. Also, approximately 13 percent of employed
D.C. residents work for the federal government. Federal contracting accounts for additional jobs and income.
Because the federal government is such a dominant presence in the District’s economy, trends in federal
spending have a major impact on the District of Columbia’s economy and revenues.
The bipartisan budget resolution enacted by Congress in February increased the federal budget
authorization for the next two years and raised the debt ceiling. This action removed one source of uncertainty
around federal fiscal policy, but the outlook for this sector remains a source of concern. For example, whether
increased appropriations for domestic programs that will benefit the District of Columbia economy will
actually occur is not yet clear. Furthermore, although the federal tax reform legislation enacted in December
is expected to provide an immediate boost to economic growth, it also adds to the national debt, increases the
risks of inflation and steeper rise in interest rates, and may eventually lead to additional efforts to control
domestic spending. The financial plan is therefore somewhat cautious in its outlook, particularly as it relates
to federal spending and growth of total jobs, population, and income in the city. It should be noted, however,
that even with uncertainty in the federal sector, income growth in the District of Columbia is still expected to
be about equal to the 10-year average growth rate.
National EconomyThe national economy has continued its pattern of steady growth that has now lasted over eight years. Real
GDP was 2.5 percent higher in the December 2017 quarter than a year earlier and nominal growth was 4.4
percent higher, the highest year-over-year growth rates in over two years. Employment is increasing, and the
unemployment rate remains low. However, interest rates and inflation are also starting to increase.
The outlook is for continued moderate growth in the national economy for the next several years. In
February 2018 the consensus forecast of 50 economists contributing to the Blue Chip Economic Indicators
was that national real GDP growth would rise 2.7 percent in FY 2018 and 2.5 percent in FY 2019, up from the
2.1 percent rate of FY 2017. Nominal growth is expected to be 4.8 percent in FY 2018 and 4.9 percent in
FY 2019, up from 3.8 percent in FY 2017.
• The U.S. economy added 2.2 million jobs (1.5%) from December 2016 to December 2017.
• The U.S. unemployment rate (seasonally adjusted) was 4.1 percent in December 2017, down from 4.7
percent a year earlier.
• U.S. Personal Income in the December 2017 quarter was 4.3 percent above a year ago.

Revenue FY 2019 Proposed Budget and Financial Plan
3-4
• The S&P 500 stock market index average for January 2018 was 9.1 percent above the level of three months
earlier, and 22.6 percent above a year earlier. In February, however, the stock market became more volatile
closing the month 5.5 percent below the peak reached in January.
• Employment in the Washington metropolitan area has remained high during the past year. In the three-
month period ending December, wage and salary jobs in the region grew by 50,465 (1.5%) compared to a
year earlier. The District of Columbia accounted for about 15 percent of the increase in area employment.
• The D.C. metropolitan area unemployment rate was 3.3 percent in December (not seasonally adjusted),
down from 3.5 percent a year earlier.
The District of Columbia EconomyIn recent months, job growth in the District has been quite strong, though less than in FY 2017, and
unemployment has been rising. More apartment units have been rented, and the pace of housing sales has been
strong with selling prices higher than last year. Hotel stays continue to outpace those in the prior year.
• In the three months ending December 2017, there were 7,667 (1.0%) more wage and salary jobs located
in the District than a year earlier.
• Federal government jobs in December were down by 2,533 (1.3%) from a year earlier, and private sector
jobs increased by 9,333 (1.7%).
• The increase in private sector jobs was concentrated in two sectors: food service (up by 3,900), and
education (up by 3,267).
• District resident employment in the three months ending December 2017 increased by 5,666 (1.5%)
compared to a year earlier.
• The December unemployment rate was 6.0 percent (seasonally adjusted), up from 5.7 percent a year ago.
• Wages earned in the District of Columbia grew 2.1 percent in the September 2017 quarter, compared to
the prior year. DC Personal Income was 2.2 percent higher.
• Single family home sales for the three-month period ending January 2018 were up 4.8 percent from a year
ago, with a 2.5 percent increase in the average selling price. Condominium sales were up 6.7 percent, while
the average selling price was 5.2 percent higher. The value of all home sale settled contracts for the three-
month period ending January 2018 was 9.0 percent more than a year ago. For the past 12 months, the value
of all sales increased 9.8 percent.
• For the 12-month period ending December 2017, 5,326 housing permits were issued, up 14.1 percent from
a year ago; the 3-month total, 2,347, was 124 percent more than in the same period of 2016.
• According to CoStar, occupied commercial office space in December 2017 was up 0.8 percent from a year
ago, while the vacancy rate fell slightly over the past year from 11.4 percent in the December quarter of
2016 to 10.9 percent in the December quarter of this year. Average rents were 2.3 percent higher in the
December quarter than a year earlier.
• The market value of real property transfers subject to the deed transfer and economic interest taxes was
10.8 percent higher than a year earlier for the 12 months ending December. For the last three months, the
value was 4.1 percent higher than a year earlier.
• Hotel room-days sold for the three months ending December 2017 were 5.3 percent above the prior year,
and hotel room revenues were up 6.9 percent.
Economic Forecast for D.C.The economic forecasting services IHS Global Insight and Moody’s Analytics both assume that growth in
District employment will be slower in FY 2018 and FY 2019 than it was in FY 2017. (These forecasts were
made after the enactment of federal tax legislation.) They also agree that the federal sector will play a smaller
role in the economy and the annual increase in population will be slower in coming years. This financial plan
anticipates continued growth in jobs, population, and income, with the fastest growth in personal income
expected to be in FY 2019 when the full impact of federal tax cuts will be felt in the economy.

FY 2019 Proposed Budget and Financial Plan Revenue
3-5
Advisory GroupsIn February we convened three advisory groups to provide us with insights into current developments and
expectations for the next several years. The Business Advisory Group discussed leading business sectors in the
District and the connections between D.C.’s economy and the larger regional and national economies. The
Real Estate Advisory Group discussed both commercial and residential real estate markets. The Revenue
Advisory Group discussed economic trends, federal fiscal policy, and revenue trends with representatives from
the Congressional Budget Office, officials from surrounding states and local jurisdictions, and others familiar
with national trends and revenue estimation issues.
Highlights from the discussions include:
• The Washington metropolitan area has finally recovered from the fiscal constraints associated with federal
sequestration, but although the region’s economy is growing again, it is not growing as fast as most other
major metropolitan areas.
• The District of Columbia still faces risks due to uncertainties about federal policies. The risks are not just
tied to policies related to federal employment and spending, but also involve possible changes in
immigration policies that could affect businesses and universities and in health care policies that could
affect the substantial health services sector in the District.
• Many of the region’s non-profit organizations, which account for about 10 percent of the region’s
employment, face possible funding difficulties from two sources. Individual charitable contributions may
decline due to features of the new federal tax law and possible cutbacks may occur in federal grant and
contracting programs to address federal deficits.
• Population growth in the District of Columbia has thus far kept pace with new multifamily housing
construction. Vacancy rates have not increased very much, but rents are not increasing much and many
more units are under construction.
• Neither modest increases in interest rates nor provisions of the recent federal tax law affecting mortgage
interest and state and local tax deductions are expected to have a major impact on housing sales or prices
in D.C..
• Progress has been slow in diversifying the economies of the District of Columbia and the region, and a
challenge is to attract and retain professional and similar higher-wage employment where success depends
not on federal government spending but on competing successfully in regional, national, and even global
markets.
• Overall demand for office space will remain fairly weak by historical standards due to federal lease
cutbacks, limited growth in office-using jobs, and tenants seeking fewer square feet per employee. On the
positive side, prospective tenants looking for space are coming from more sectors.
• Although the District of Columbia has slipped in terms of global rankings, premier real estate in the District
of Columbia remains attractive to foreign investors and is a major factor in office sales.
• Hotel and restaurant options continue to increase, but international tourism has not kept up with the
increase in domestic visitors.
• Restoring reliable Metrorail service is essential to the economies of the District of Columbia and the region.
Economic Assumptions for the Revenue EstimateAs noted earlier, the economic assumptions for the FY 2019 Budget and Financial Plan (See Table 3-2.) take
into consideration expectations of moderate growth in the national economy, uncertainty in federal fiscal and
other policies, recent employment and income trends, forecasts from IHS Global Insight and Moody’s
Analytics, and comments from the advisory groups. Highlights include:
• D.C.’s Gross Domestic Product. Growth rates in D.C. Gross Domestic Product (GDP-DC), a measure of
economic activity in D.C., are projected to be 4.3 percent and 4.6 percent, respectively, in FY 2018 and
FY 2019. Real GDP-DC, adjusted for inflation, is expected to grow 2.0 percent in FY 2018 and 1.6 percent
in FY 2019.

Revenue FY 2019 Proposed Budget and Financial Plan
3-6
• D.C.’s Personal Income. The growth rate in Personal Income, which is mostly wages, salaries, proprietors’
income, and benefits, but which also includes investment income and transfer payments, is expected to be
3.7 percent in FY 2018, and 4.9 percent in FY 2019. Increases in the number of persons and households
residing in D.C. contribute to the District’s higher Personal Income levels.
• Jobs located in D.C. The number of jobs in the District is expected to show a net increase of 7,500 (0.9%)
in FY 2018 and 6,500 (0.8%) in FY 2019.
• Resident employment. In FY 2018, the D.C. labor force is expected to increase by 5,600 (1.4%) and rise
by 5,700 (1.4%) in FY 2019. Resident employment is expected to rise by 3,900 (1.1%) in FY 2018. For
FY 2019, it is forecast to rise by 5,600 (1.5%) with an unemployment rate of 5.9 percent in that year.
• Home sales and prices. The number of housing sales (the combined total of single family and
condominium units) is projected to rise by 1.5 percent in FY 2018, with prices increasing by 4.1 percent.
Sales then increase by 0.5 percent in FY 2019, with a 4.9 percent rise in average prices.
• Inflation. The Financial Plan assumes that the D.C. Consumer Price Index will rise 2.1 percent in FY 2018
and 2.3 percent in FY 2019. The rate in FY 2017 was 2.0 percent.
• Households and population. The Financial Plan assumes estimated households in FY 2018 of 308,900,
up 3,900 (1.3%) from FY 2017, and 312,900 in FY 2019 (an increase of 4,000 or 1.3%). Population rises
by 9,200 in FY 2018 to 701,900; in FY 2019 it reaches 710,100.
Looking further ahead to FY 2020 through FY 2022, the expectation for the Budget and Financial Plan is
that this will be a period of continued moderate economic growth, both nationally and in the District of
Columbia, with the District’s economy continuing to be affected by restraints in federal expenditures. Growth
in nominal GDP-DC is expected to average about 4.2 percent per year during the FY 2020 through FY 2022
period, and Personal Income will increase at about 4.5 percent per year; close to 4,000 additional jobs will be
added each year. Inflation is expected to rise to 2.4 percent per year by FY 2020, and interest rates also rise (to
a 3.7 percent rate for 10-year Treasury securities in FY 2020). The stock market is expected to grow at a steady,
relatively slow pace after the large increases over the past year (a gain of about 8 percent over the 3-year
period). In the years 2020 through 2022, 9,365 new housing starts are anticipated, and an additional 9,200
households are expected. During this period, the number of housing sales is expected to remain steady, while
average prices rise each year at a rate comparable to the rate of growth in Personal Income. In FY 2022 the
average home sale price is estimated to be over $1 million.
RisksAs noted, federal government fiscal policy uncertainty remains a primary concern, and developments in the
national economy also pose risks to the forecast. These include the possibility of slower national economic
growth (26 percent of the economists participating in the February 2018 Blue Chip Forecast expect a recession
to start in 2019), volatility in the stock market, increases in interest rates, and financial market problems as the
Federal Reserve phases in interest rate increases. Possible disruptions arising from uncertainties around the
world and potential national security events are other sources of risks to the forecast. On the positive side,
investment in workforce and real estate may increase, at least in the short term, because of federal tax
legislation as companies and individuals decide what to do with increased after-tax income.
Continued population growth of the magnitude included in this forecast assumes that in-migration
continues to be a significant contributor to that growth. This expectation would not be met if the District
became less able to attract new residents and retain existing ones.

FY 2019 Proposed Budget and Financial Plan Revenue
3-7
Table 3-2Estimated Key Variables for the D.C. Economy for the Forecast Period, Fiscal Years 2016-2022
FY 2016 FY 2017 FY 2018 FY 2019 FY 2020 FY 2021 FY 2022Actual Actual Estimate Estimate Estimate Estimate Estimate
Gross State Product (nominal, billions of $) 125.27 130.09 135.71 141.95 148.00 154.11 160.48
3.9% 3.9% 4.3% 4.6% 4.3% 4.1% 4.1%
Personal Income (billions of $) 51.35 53.14 55.09 57.79 60.48 63.22 65.87
5.1% 3.5% 3.7% 4.9% 4.6% 4.5% 4.2%
Wages and Salaries of D.C. Residents (billions of $) 25.6 26.5 27.5 28.8 30.1 31.4 32.8
4.7% 3.3% 3.8% 4.8% 4.5% 4.4% 4.4%
Population (thousands) 682.8 692.7 701.9 710.1 717.3 723.9 730.0
1.7% 1.5% 1.3% 1.2% 1.0% 0.9% 0.8%
Households (thousands) 301.1 305.0 308.9 312.9 316.2 319.3 322.1
1.3% 1.3% 1.3% 1.3% 1.1% 1.0% 0.9%
At-Place Employment (thousands) 780.0 789.9 797.4 803.9 808.3 812.0 814.9
2.0% 1.3% 0.9% 0.8% 0.6% 0.5% 0.4%
Civilian Labor Force (thousands) 391.4 396.9 402.5 408.2 413.0 417.6 421.2
1.7% 1.4% 1.4% 1.4% 1.2% 1.1% 0.9%
Resident Employment (thousands) 367.2 374.7 378.6 384.2 388.7 392.9 396.4
2.7% 2.1% 1.1% 1.5% 1.2% 1.1% 0.9%
Unemployment Rate (%) 6.2% 6.0% 5.9% 5.9% 5.9% 5.9% 5.9%
Housing Starts 4,418 4,320 4,544 3,277 3,241 3,072 3,052
Housing Stock (thousands) 320.3 323.9 327.0 331.0 334.4 337.5 340.6
1.3% 1.1% 1.0% 1.2% 1.0% 0.9% 0.9%
Sale of Housing Units 8,340 8,598 8,727 8,771 8,771 8,771 8,771
5.2% 3.1% 1.5% 0.5% 0.0% 0.0% 0.0%
Average Housing Price (thousands of $) 794.7 824.9 859.4 901.5 943.3 986.1 1,027.4
3.5% 3.8% 4.2% 4.9% 4.6% 4.5% 4.2%
Washington Area CPI (% change from prior year) 0.9% 2.0% 2.1% 2.3% 2.4% 2.4% 2.4%
Interest Rate on 10-year Treasury Notes (%) 1.9% 2.3% 2.7% 3.6% 3.7% 3.7% 3.7%
Change in S&P 500 Index of Common Stock (%)* 6.4% 19.2% 2.7% 2.7% 2.7% 2.7% 2.7%
* Change in S&P 500 Index of Common Stock is the change from the 4th quarter to the 4th quarter on a calendar year (rather than fiscal year)basis. (For example, the value in FY 2017 is the percent change from CY 2016.4 to CY 2017.4)
Note: Estimated by the D.C. Office of Revenue Analysis based on forecasts of the D.C. and national economies prepared by IHS Global Insight (February2018) and Moody's Analytics (Economy.com) (January 2018); forecasts of the national economy prepared by the Congressional Budget Office (June 2017)and Blue Chip Economic Indicators (February 2018); BLS labor market information from December 2017; the Census Bureau estimates of the D.C. population(2017); Bureau of Economic Analysis estimates of D.C. Personal Income (September 2017); Metropolitan Regional Information System (MRIS) D.C. homesales data (December 2017), accessed in part through the Greater Capital Area Association of Realtors (GCAAR); CoStar information on commercial officebuildings and residential property in D.C. (December 2017); and Delta Associates information on commercial office buildings and apartments in D.C.(December 2017).

Revenue FY 2019 Proposed Budget and Financial Plan
3-8
GENERAL FUND REVENUEThe General fund, used to finance government operations, is composed of three funds: Local, Dedicated, and
Special Purpose. Table 3-3 reports estimated Local fund revenue by major revenue source for the period
FY 2018 to FY 2022, along with actual FY 2017 revenues. Tables 3-13 and 3-14, at the end of this chapter,
provide information on year-to-year percentage and absolute changes for the major revenue sources.
The Local fund includes both tax revenue and non-tax revenue. The following section highlights the
components and discusses the transfers from the Local fund to Dedicated funds. Special Purpose funds are
discussed at the end.
Table 3-3General Fund, Local Revenue by Source, Fiscal Years 2017-2022(Dollars in Thousands)
FY 2017 FY 2018 FY 2019 FY 2020 FY 2021 FY 2022Revenue Source Actual Estimate Estimate Projected Projected Projected
Real Property 2,473,328 2,588,414 2,678,396 2,767,465 2,852,710 2,940,805
Transfer to TIF/Pilot (45,587) (44,033) (49,336) (63,559) (68,744) (59,399)
Real Property (net) 2,427,742 2,544,381 2,629,061 2,703,905 2,783,966 2,881,405
Personal Property 63,305 62,580 62,820 63,121 63,321 63,522
Public Space Rental 32,468 33,507 34,579 35,686 36,828 38,007
Total Property (net) 2,523,515 2,640,468 2,726,460 2,802,712 2,884,115 2,982,934
General Sales 1,419,197 1,481,046 1,546,609 1,611,032 1,686,653 1,743,651
Transfer to Convention Center Fund (138,128) (149,196) (155,543) (162,090) (170,201) (175,307)
Transfer to TIF (32,102) (45,488) (55,112) (61,868) (69,275) (66,529)
Transfer to Ballpark Revenue Fund (17,764) (15,900) (15,900) (15,900) (15,900) (15,900)
Transfer to Healthy DC and Health Care Expansion Fund (835) (808) (808) (825) (841) (858)
Transfer to WMATA Subsidy (parking tax) (74,167) (100,897) (104,164) (107,534) (111,709) (114,337)
Transfer to Healthy Schools Fund (4,266) (4,666) (4,266) (4,266) (4,266) (4,266)
Transfer to ABRA Program (1,170) (1,170) (1,170) (1,170) (1,170) (1,170)
General Sales (net) 1,150,763 1,162,921 1,209,645 1,257,380 1,313,291 1,365,284
Alcohol 6,641 6,746 6,827 6,960 7,178 7,286
Cigarette 29,530 29,750 29,018 28,589 28,260 27,977
Motor Vehicle 45,915 45,521 45,698 45,923 46,323 46,555
Motor Fuel Tax 26,099 25,761 25,426 25,095 24,769 24,447
Transfer to Highway Trust Fund (26,099) (25,761) (25,426) (25,095) (24,769) (24,447)
Total Sales (net) 1,232,850 1,244,937 1,291,188 1,338,852 1,395,052 1,447,102
Individual Income 1,958,277 2,054,640 2,142,789 2,224,425 2,316,352 2,408,578
Corporate Franchise 389,218 337,563 347,164 357,240 360,485 373,106
Unincorporated Business Franchise 165,027 162,061 167,570 173,105 179,650 186,477
Total Income 2,512,522 2,554,264 2,657,523 2,754,770 2,856,488 2,968,161 (Continued on next page)

FY 2019 Proposed Budget and Financial Plan Revenue
3-9
Table 3-3 (Continued)General Fund, Local Revenue by Source, Fiscal Years 2017-2022(Dollars in Thousands)
FY 2017 FY 2018 FY 2019 FY 2020 FY 2021 FY 2022Revenue Source Actual Estimate Estimate Projected Projected Projected
Public Utility 138,124 136,927 137,611 138,299 138,991 139,686
Transfer to Ballpark Revenue Fund (7,938) (8,268) (8,351) (8,434) (8,518) (8,603)
Public Utility (net) 130,186 128,659 129,260 129,865 130,473 131,084
Toll Telecommunications 49,543 51,382 51,608 51,834 52,060 52,287
Transfer to Ballpark Revenue Fund (2,484) (2,564) (2,704) (2,843) (2,983) (3,130)
Toll Telecommunications (net) 47,059 48,818 48,904 48,991 49,077 49,157
Insurance Premiums 108,213 110,324 112,433 114,583 116,776 119,011
Transfer to Healthy D.C. and Health Care Expansion Fund (45,467) (45,467) (46,323) (47,250) (48,195) (49,159)
Insurance Premiums (net) 62,745 64,857 66,110 67,333 68,581 69,852
Healthcare Provider Tax 13,949 14,283 14,917 15,215 15,519 15,830
Transfer to Nursing Facility Quality of Care Fund (13,949) (14,283) (14,917) (15,215) (15,519) (15,830)
Ballpark Fee 31,107 33,900 33,900 33,900 33,900 33,900
Transfer to Ballpark Revenue Fund (31,107) (33,900) (33,900) (33,900) (33,900) (33,900)
Hospital Bed Tax and Hospital Provider Fee 15,928 14,819 - - - -
Transfer to Hospital Fund and Hospital Provider Fee Fund (15,928) (14,819) - - - -
ICF-IDD Assessment 4,913 4,918 5,479 5,479 5,479 5,479
Transfer to Stevie Sellows Quality Improvement Fund (4,913) (4,918) (5,479) (5,479) (5,479) (5,479)
Total Gross Receipts (net) 239,990 242,334 244,274 246,189 248,131 250,093
Estate 41,215 23,019 12,459 12,731 13,262 13,837
Deed Recordation 250,740 257,099 260,981 269,876 278,755 287,615
Transfer to HPTF/Bond Repayment/West End (37,653) (39,760) (39,822) (40,611) (41,913) (43,245)
Deed Recordation (net) 213,087 217,339 221,159 229,265 236,842 244,370
Deed Transfer 188,781 193,864 195,708 202,553 209,398 216,242
Transfer to HPTF/Bond Repayment/West End (28,445) (30,275) (30,031) (30,513) (31,509) (32,539)
Deed Transfer (net) 160,336 163,589 165,677 172,040 177,888 183,703
Economic Interests 21,336 17,824 16,852 15,881 14,910 13,938
Total Other Taxes (net) 435,974 421,771 416,148 429,918 442,903 455,849
TOTAL TAXES NET OF DEDICATED TAXES 6,944,852 7,103,774 7,335,593 7,572,441 7,826,689 8,104,139
Licenses and Permits 92,549 89,992 98,793 94,454 99,483 96,849
Fines and Forfeits 167,385 156,460 152,469 148,589 144,814 141,135
Charges for Services 81,371 82,079 77,443 78,697 78,452 78,840
Miscellaneous 146,208 100,893 101,290 100,471 100,394 101,588
TOTAL NON-TAX 487,514 429,424 429,995 422,211 423,143 418,411
Lottery 45,600 45,000 45,000 45,000 45,000 45,000
TOTAL LOCAL FUND REVENUE NET OF DEDICATED TAXES 7,477,966 7,578,198 7,810,588 8,039,651 8,294,832 8,567,550

Revenue FY 2019 Proposed Budget and Financial Plan
3-10
Real Property TaxIn FY 2017, $2.473 billion was collected before dedicated distributions; a 4.9 percent increase from FY 2016.
The increase in collections was driven by growth in both commercial property (Class 2) and residential
property (Class 1). Commercial property tax collections increased by 4.5 percent and residential property tax
collections increased by 6.0 percent in FY 2017 compared to FY 2016. Commercial property collections have
an out-sized impact on total real property tax collections because the residential tax rate is $0.85 per $100 of
assessment value while the major commercial tax rate of $1.85 per $100 of assessment value is more than
double the residential rate. The total assessment value of all commercial properties in the District is almost as
high as the total assessment value of all residential properties, but Class 2 tax collections account for
approximately 67 percent of total real property tax collections and Class 1 collections account for
approximately 32 percent of total real property tax collections in FY 2017.
Residential Property. D.C.’s residential market continued to show price appreciation in FY 2017, with average
home prices increasing by 3.8 percent compared to FY 2016. The pace of appreciation is expected to increase
throughout the forecast period, with home prices rising by about 4.9 percent on average from FY 2017 to
FY 2022. Consequently, residential property (Class 1) tax collections are expected grow by 4.5 percent on
average throughout the forecast period.
Commercial Property. Class 2 property taxes increased by 4.5 percent in FY 2017 and are projected to
increase by 4.1 percent in FY 2018. This growth is not expected to remain through the forecast period.
Uncertainty in capital markets and expected increases in interest rates are reflected by a more moderate
predicted growth in Class 2 tax revenues from FY 2017 to FY 2022 averaging 3.0 percent annually.
Taking these factors into consideration, overall real property tax collections are expected to grow by
3.5 percent on average from FY 2017 to FY 2022.
General Obligation Bonds. In addition to providing revenue for government services, real property taxes
support the District’s general obligation bonds used for capital investment. For FY 2018, the percentage of real
property tax collections dedicated to the repayment of principal and interest on the District’s General
Obligation Bonds is 14.0 percent.
Transfer to Tax Increment Financing (TIF) Fund. In FY 2018, a net amount of $44.0 million of real property
tax collections will be dedicated to the repayment of Tax Increment Financing (TIF) and Payment in Lieu of
Taxes (PILOT) bonds. This amount will be $49.3 million in FY 2019 and increase to an estimated $68.7
million in FY 2021. In FY 2022, the debt for three projects – Mandarin Hotel, Howard Theater, and the
Department of Transportation - will be paid off and the dedication to TIF decreases to $59.4 million.
Table 3-4Property Tax Revenue, Fiscal Years 2017-2022(Dollars in Thousands)
FY 2017 FY 2018 FY 2019 FY 2020 FY 2021 FY 2022Revenue Source Actual Estimate Estimate Projected Projected Projected
Real Property 2,473,328 2,588,414 2,678,396 2,767,465 2,852,710 2,940,805
Transfer to TIF/Pilot (45,587) (44,033) (49,336) (63,559) (68,744) (59,399)
Real Property (net) 2,427,742 2,544,381 2,629,061 2,703,905 2,783,966 2,881,405
Personal Property 63,305 62,580 62,820 63,121 63,321 63,522
Public Space Rental 32,468 33,507 34,579 35,686 36,828 38,007
Total Property Taxes (net) 2,523,515 2,640,468 2,726,460 2,802,712 2,884,115 2,982,934
Policy Proposals - (3,284) 13,287 13,526 13,696 13,855
Property Taxes

FY 2019 Proposed Budget and Financial Plan Revenue
3-11
Personal Property TaxIn FY 2017, gross total personal property tax collections totaled $63.3 million. This increase of 7.1 percent
from FY 2016 was likely due to capital investments in the legal and hotel industries. In FY 2017, the number
of hotels increased by five in the downtown area and several major law firms relocated within the District.
Personal property taxes are not expected to be as strong, declining about 1 percent and then grow by less than
one percent annually from FY 2019 to FY 2022.
Public Space RentalIn FY 2017 revenue from public space rentals amounted to $32.5 million. FY 2018 revenue is projected to
increase to $33.5 million and increase approximately 3.2 percent annually over the FY 2017 to FY 2021
period, returning to the long-term trend.
Property Tax Policy Proposals:• National Community Reinvestment Coalition Tax Abatement
• Increase Commercial Property Tax Rate
• Four Unit Rental Housing Grandfathering
• Africare Real Property Abatement
• Elderly and Tenants with Disabilities Protection Amendment
• Senior Homestead 5% Cap on Real Property Tax Increases
General Sales and Use TaxesIn FY 2017, revenue from gross sales and use taxes was $1.42 billion, compared to FY 2016 gross sales and
use tax revenue of $1.34 billion, an increase of 5.7 percent. The revenue in FY 2017 benefited from several
mega-events in the District: the presidential inauguration ceremony, women’s march, and other political
activities. These events and activities had contributed to faster sales tax revenue growth but are one-time
events. We estimate continued strong growth of 4.4 percent in FY 2019 due to robust growth in personal
income, and near full employment both for the D.C. metro area and for the rest of the nation.
Growth rates in FY 2020 to FY 2022 are estimated to be between 3.4 percent and 4.7 percent. We anticipate
taxes from e-commerce sales helping to balance weakness in taxes from sales at brick and mortar businesses.
We also anticipate continued strength in the hospitality sector and FY 2021 includes the next presidential
Table 3-5General Sales and Use Tax Revenue, Fiscal Years 2017-2022(Dollars in Thousands)
FY 2017 FY 2018 FY 2019 FY 2020 FY 2021 FY 2022Revenue Source Actual Estimate Estimate Projected Projected Projected
General Sales 1,419,197 1,481,046 1,546,609 1,611,032 1,686,653 1,743,651
Transfer to Convention Center Fund (138,128) (149,196) (155,543) (162,090) (170,201) (175,307)
Transfer to TIF (32,102) (45,488) (55,112) (61,868) (69,275) (66,529)
Transfer to Ballpark Revenue Fund (17,764) (15,900) (15,900) (15,900) (15,900) (15,900)Transfer to Healthy DC and Health Care Expansion Fund (835) (808) (808) (825) (841) (858)
Transfer to WMATA Subsidy (parking tax) (74,167) (100,897) (104,164) (107,534) (111,709) (114,337)
Transfer to Healthy Schools Fund (4,266) (4,666) (4,266) (4,266) (4,266) (4,266)
Transfer to ABRA Program (1,170) (1,170) (1,170) (1,170) (1,170) (1,170)
General Sales Taxes (net) 1,150,763 1,162,921 1,209,645 1,257,380 1,313,291 1,365,284
Policy Proposals - 24,175 (111,449) (109,563) (113,038) (116,360)

Revenue FY 2019 Proposed Budget and Financial Plan
3-12
inauguration which provides a one-time jolt of revenue.
Total transfers from sales and use tax revenue are estimated to be $318.1 million in FY 2018. This is a large
increase from FY 2017 due to higher dedication to the convention center and WMATA. In FY 2019, the sum
of transfers from sales and use taxes is estimated to be $340 million, 22 percent of gross sales tax revenue.
Transfer to Convention Center Fund. The formula financing the Convention Center Fund includes only taxes
directly linked to the hospitality sector. The hotel tax rate is 14.8 percent. Of this tax, 4.75 percent is dedicated
to the Convention Center Fund and 10.05 percent goes to the District’s General Fund. The 10 percent sales tax
rate applied mainly to restaurants and bars is also the tax rate applied to rental cars, prepaid telephone cards,
tickets for events and merchandise sold at both the Baseball Stadium and the Verizon Center. Except for sales
at the Baseball Stadium and the Verizon Center, the 10 percent rate includes 9 percent for the General Fund
and one percent dedicated to the Convention Center Fund. There is also a 10 percent sales tax rate on alcoholic
beverages not sold for immediate consumption. Revenue from this category at 10 percent does not go to the
Convention Center Fund. As of FY 2018, 0.3 percent of the 4.75 percent of hotel tax is to be used for
Destination DC marketing programs.
Transfer to Tax Increment Financing. The District utilizes an economic development tool called Tax
Increment Financing (TIF) to assist in financing economic development projects. TIF allows the incremental
future revenue stream from a development project to be pledged to pay back bonds issued to help finance the
development. In March 2008, in order to service a loan to renovate the Verizon Center at Gallery Place,
merchandise and tickets for events at the Verizon Center became subject to a tax of 10 percent (compared to
the prior rate of 5.75 percent). The revenue collected from the increased rate at that time (10 percent less 5.75
percent or 4.25 percent) goes to a separate fund and is used to make principal and interest payments on the
loan.
There are currently seven projects included in the TIF program: Gallery Place, The Mandarin Oriental
Hotel, Capital One Arena (formerly Verizon Center), City Market at O Street, Fort Lincoln Retail, Special
Retail and Great Streets, Convention Center Hotel, and the Waterfront Park Maintenance Fund. The TIF
program, which previously included the SW Waterfront/The Wharf project, has been re-categorized to the
PILOT program but the dedication continues to be shown here. The Wharf opening last October is the primary
Table 3-6Estimated Sales Tax Base, Collections and Transfers by Sales Tax Type, FY 2017(Dollars in Millions)
MedicalRetail Marijuana** Liquor Restaurants Hotel Parking Transfers Total
Base 9,468.2 13.9 647.8 4,226.1 2,154.3 412.0 Rate 5.75% 6.0% 10.0% 10.0% 14.5% 18.0%General Sales Tax Collections (gross) 544.4 0.8 64.8 422.6 312.4 74.2 - 1,419.2
Transfer to Convention Center Fund 42.3 95.9 138.1 138.1Transfer to TIF 32.1 32.1Transfer to WMATA Subsidy (parking tax) 74.2 74.2 74.2Transfer to Ballpark Revenue Fund 17.8 17.8Transfer to Healthy DC Fund 0.8 0.8Transfer to Healthy Schools Fund 4.3 4.3Transfer to ABRA Program 1.2 1.2
General Sales Taxes to Local Fund 544.4 0.8 64.8 380.3 216.5 0.0 268.4 1,150.8Note: **Medical marijuana tax and the transfer to the Healthy DC Fund is reported in the Other Taxes row in the FY 2017 CAFR (Table MDA-5, p. 32) rather than the Sales Taxes row.

FY 2019 Proposed Budget and Financial Plan Revenue
3-13
reason dedications have increased in FY 2018 and subsequent years. In order to provide additional financing
security to selected TIF projects, the District created the Downtown TIF Area. Incremental revenue from the
Downtown TIF Area is only used in the event project increment is not sufficient to cover debt service. Only
those revenues required to address projected TIF project shortfalls are included in the TIF budget. Dedications
to two special retail and great streets projects – Howard Theater and Forever 21 – as well as the Mandarin
Hotel end in FY 2021 (Forever 21) and FY 2022.
Transfer to Ballpark Fund. Stadium related sales tax streams are dedicated to the Ballpark Fund to pay the
debt service on the baseball stadium revenue bonds. These revenue streams include taxes on tickets sold, taxes
on parking at the stadium, taxes on merchandise sold at the stadium and taxes on food and beverages sold in
the stadium.
Transfer to Healthy D.C. Effective in FY 2012, any revenues from the sales tax on medical marijuana are
transferred to the Healthy D.C. and Health Care Expansion Fund. The transfer amount is estimated to be
$808,000 in FY 2018.
Transfer to WMATA. Beginning in FY 2012 all parking sales tax revenue is used to help meet the District’s
funding responsibility for the Washington Metropolitan Area Transit Authority (WMATA). Effective FY 2012,
the sales tax rate on parking was raised from 12 percent to 18 percent. We estimate revenue from sales tax on
parking to be $76.7 million in FY 2018. Beginning FY 2018, an additional $24.175 million annually was
dedicated to the long term capital financing needs of Metro.
Transfer to Healthy Schools. Effective in FY 2012, soft-drinks (non-alcoholic beverages not containing milk,
or milk substitutes, non-carbonated fruit or vegetable juice, coffee, cocoa or tea) are no longer exempt from
sales tax. $4.266 million raised annually from taxing soft drinks goes to the Healthy Schools Fund. In FY 2018,
an additional $400,000 was dedicated for one year only.
Transfer to ABRA. Effective in FY 2012, the sales tax rate on alcoholic beverages for off-premise
consumption was increased to 10 percent. Initially, $460,000 of the revenue raised annually was dedicated to
fund the Reimbursable Detail Subsidy Program in the Alcoholic Beverage Regulation Administration
(ABRA). Effective in FY 2014, the transfer to ABRA was increased to $1.170 million annually.
General Sales and Use Tax Policy Proposals:
• Feminine Hygiene Product Sales Tax Exemption
• Increase Sales Tax Rates
• Extend Bar Hours Around Holidays
• Reverse Current WMATA Dedicated Funding
• WMATA New Dedicated Funding

Revenue FY 2019 Proposed Budget and Financial Plan
3-14
Alcoholic Beverage
In FY 2017, revenue from the alcoholic beverage tax was $6.6 million, a 2.7 percent increase over revenue in
FY 2016. This was lower than the 3.6 percent growth in FY 2016, but higher than the 0.2 percent growth in
FY 2015. We estimate growth of 1.6 percent in FY 2018 bringing alcoholic beverage tax revenue to $6.8
million. The growth rate is projected to be between 1.2 and 3.1 percent during the FY 2019 and FY 2022
period.
Cigarette
Revenue in FY 2017 was $29.53 million, a 3.0 percent decrease from FY 2016. Cigarette tax collections are
expected to increase by 0.7 percent in FY 2018 to $29.75 million. Collections are expected to decrease 2.5
percent to $29.02 million in FY 2019. The growth rate for FY 2020 through FY 2022 is estimated to be
between negative 1.5 percent and negative 1.0 percent annually, reflecting a continued decrease in tobacco
consumption.
Motor Vehicle
Motor vehicle excise tax revenue totaled $45.9 million in FY 2017, which is a negative 0.2 percent growth rate
from FY 2016. Revenue is projected to decline at a rate of 0.9 percent to $45.5 million in FY 2018 and is
projected to return to growth of 0.4 percent to $45.7 million in FY 2019. The growth rate is projected to be
between 0.5 percent and 0.9 percent in the out years giving projected revenue of $45.9 million, $46.3 million
and $46.6 million respectively, in FY 2020, FY 2021 and FY 2022.
Motor Fuel
Collections for the motor vehicle fuel tax in FY 2017 were $26.1 million. Despite increases in the local
population, continuing increases in fuel efficiencies are expected to result in fuel tax revenues declining about
1.3 percent a year – from a projected FY 2018 level of $25.8 million to $24.4 million in FY 2022.
Transfer to Highway Trust Fund. Motor fuel excise tax revenues are dedicated to the Highway Trust Fund
(HTF). The HTF uses both local-source and federal matching funds to construct, repair and manage eligible
District roads and bridges. Approximately 400 of the 1,020 miles (39 percent) of streets and highways and 229
bridges in the District are eligible.
Table 3-7Selective Sales and Excise Tax Revenue, Fiscal Years 2017-2022(Dollars in Thousands)
FY 2017 FY 2018 FY 2019 FY 2020 FY 2021 FY 2022Revenue Source Actual Estimate Estimate Projected Projected ProjectedAlcohol 6,641 6,746 6,827 6,960 7,178 7,286
Cigarette 29,530 29,750 29,018 28,589 28,260 27,977
Motor Vehicle 45,915 45,521 45,698 45,923 46,323 46,555
Motor Fuel Tax 26,099 25,761 25,426 25,095 24,769 24,447
Transfer to Highway Trust Fund (26,099) (25,761) (25,426) (25,095) (24,769) (24,447)
Total Selective Sales and Excise Taxes (net) 82,087 82,017 81,543 81,472 81,761 81,818
Policy Proposals - - - - - -
Selective Sales and Use TaxesIn addition to the multi-rate general sales and use tax, the District imposes excise taxes on alcoholic beverages,
cigarettes, motor vehicles, and motor fuel.

FY 2019 Proposed Budget and Financial Plan Revenue
3-15
Individual Income TaxIn FY 2017, individual income tax revenue was $1,958.3 million, an increase of 2.6 percent from FY 2016.
Even though the non-withholding component declined by almost 32 percent in FY 2017, this was buoyed by
an 8.5 percent growth in the withholding (compared to 4.8 percent growth in FY 2016). The double-digit
decline in the revenue from the volatile non-withholding component of the individual income tax is related to
the performance of capital gains and the stock market. The other component of income tax revenue,
withholding, is closely associated with the wages and salaries of D.C. residents and accounts for two thirds of
all income tax revenue.
The weak performance of the non-withholding component, relative to the previous year, was influenced
by a 14 percent decline in declarations (also referred to as estimated payments), which was compounded by a
5.2 percent increase in refunds and a 1 percent increase in final payments. The stock market experienced
growth in FY 2017. Slower growth is forecasted for the Standard and Poor’s 500 index for FY 2018 given the
volatility of the financial markets.
For FY 2018 it is anticipated that revenue will increase by 4.9 percent. For the out years from FY 2019 to
FY 2022, revenue will grow at an average rate of 4.1 percent. It is anticipated that the withholding component
will grow at an average rate of 4.0 percent. For FY 2019 it is expected that the non-withholding component
will grow by 7.8 percent, considerably lower than the 22.1 percent expected in FY 2018. With the cautious and
uncertain expectation of the stock market’s performance the average growth for non-withholding for FY 2019
through FY 2022 is expected to be 2.7 percent.
As part of the Tax Revision Commission changes, effective January 2018 the District established a
standard deduction and personal exemption equal to the federal levels. However, the passage of federal tax
legislation late in 2017, effective January 2018 means the District’s personal exemption, slated to increase, was
suspended, and the standard deduction increased to $12,000 for single filers, $18,000 for head of household
filers and $24,000 for married filers. In 2026, the federal changes to individual income tax expire and the
federal tax reverts to the 2017 law.
Business FranchiseCorporate franchise tax revenue grew by 0.6 percent and unincorporated franchise income tax declined 2.6
percent in FY 2017 compared to FY 2016. Legislation triggered last year reduced the tax rate from 9.0 to 8.25
in tax year 2018, which was reflected partially in declarations filed in 2017. The forecast is for additional
contraction as the full impact of the District tax cut is realized but, because of federal changes, we remain
cautious about the outlook.
Table 3-8Income Tax Revenue, Fiscal Years 2017-2022(Dollars in Thousands)
FY 2017 FY 2018 FY 2019 FY 2020 FY 2021 FY 2022Revenue Source Actual Estimate Estimate Projected Projected Projected
Individual Income 1,958,277 2,054,640 2,142,789 2,224,425 2,316,352 2,408,578
Corporate Franchise 389,218 337,563 347,164 357,240 360,485 373,106
Unincorporated Business Franchise 165,027 162,061 167,570 173,105 179,650 186,477
Total Income Taxes 2,512,522 2,554,264 2,657,523 2,754,770 2,856,488 2,968,161
Policy Proposals - - 9,812 10,739 10,336 9,903
Income Taxes

Revenue FY 2019 Proposed Budget and Financial Plan
3-16
Income Tax Policy Proposals:
• Deferred Compensation Auto-Enrollment
• Four Unit Rental Housing Grandfathering
• Child Care Tax Credit: Sunsets After One Year
• OTR Compliance Initiatives.
Gross ReceiptsTaxes in this category include: a tax on the gross receipts of public utilities and toll telecommunications
companies operating in the District (the rate is 10 percent for residential use and 11 percent for nonresidential
use where 1.0 percent of the 11 percent is dedicated to financing the baseball stadium), a tax of 2.0 percent on
the gross receipts of insurance companies, various health care related taxes that are dedicated to specific
purposes, and a fee on companies for baseball stadium funding.
Public Utility TaxThis tax is directly related to energy use, so tax revenue collections are closely linked to weather extremes and
fuel cost. (See tax rates in Table 3-18 at the end of the chapter.) Gross revenue from the Public Utility Tax
(before the transfer to the Ballpark Fund) is estimated to be $136.9 million in FY 2018 and $137.6 million in
FY 2019. It is expected to grow at an average rate of 0.5 percent for FY 2020 through FY 2022.
Table 3-9Gross Receipts Tax Revenue, Fiscal Years 2017-2022(Dollars in Thousands)
FY 2017 FY 2018 FY 2019 FY 2020 FY 2021 FY 2022Revenue Source Actual Estimate Estimate Projected Projected ProjectedPublic Utility 138,124 136,927 137,611 138,299 138,991 139,686
Transfer to Ballpark Revenue Fund (7,938) (8,268) (8,351) (8,434) (8,518) (8,603)
Public Utility (net) 130,186 128,659 129,260 129,865 130,473 131,084
Toll Telecommunications 49,543 51,382 51,608 51,834 52,060 52,287
Transfer to Ballpark Revenue Fund (2,484) (2,564) (2,704) (2,843) (2,983) (3,130)
Toll Telecommunications (net) 47,059 48,818 48,904 48,991 49,077 49,157
Insurance Premiums 108,213 110,324 112,433 114,583 116,776 119,011
Transfer to Healthy DC and Health Care Expansion Fund (45,467) (45,467) (46,323) (47,250) (48,195) (49,159)
Insurance Premiums (net) 62,745 64,857 66,110 67,333 68,581 69,852
Healthcare Provider Tax 13,949 14,283 14,917 15,215 15,519 15,830
Transfer to Nursing Facility Quality of Care Fund (13,949) (14,283) (14,917) (15,215) (15,519) (15,830)
Ballpark Fee 31,107 33,900 33,900 33,900 33,900 33,900
Transfer to Ballpark Revenue Fund (31,107) (33,900) (33,900) (33,900) (33,900) (33,900)
Hospital Bed Tax and Hospital Provider Fee 15,928 14,819 - - - -
Transfer to Hospital Fund and Hospital Provider Fee Fund (15,928) (14,819) - - - -
ICF-IDD Assessment 4,913 4,918 5,479 5,479 5,479 5,479
Transfer to Stevie Sellows Quality Improvement Fund (4,913) (4,918) (5,479) (5,479) (5,479) (5,479)
Total Gross Receipts Taxes (net) 239,990 242,334 244,274 246,189 248,131 250,093
Policy Proposals - - 17,263 17,833 18,404 19,029

FY 2019 Proposed Budget and Financial Plan Revenue
3-17
Transfer to Ballpark Fund. There is a surcharge on nonresidential rates that finances the baseball stadium. In
FY 2017, $7.9 million was collected and transferred. In FY 2018 and FY 2019, $8.3 million and $8.4 million,
respectively, are expected to be transferred to the Ballpark Fund.
Toll Telecommunication TaxThe gross revenue from the Toll Telecommunications Tax (before the 1 percent transfer of the gross receipts
of non-residential customers for baseball stadium funding) is estimated to be approximately $51.4 million in
FY 2018 and $51.6 million in FY 2019. It is forecast to have an average growth of 0.4 percent for the period
FY 2020 to FY 2022.
Transfer to Ballpark Fund. There is a surcharge on nonresidential rates that finances the baseball stadium. In
FY 2017, $2.5 million was collected and transferred. The transfer is expected to increase in FY 2018 to $2.6
million followed by $2.7 million in FY 2019. In FY 2020 the transfer is estimated to be approximately $2.8
million, $3.0 million in FY 2021 and in FY 2022 it is expected to be around $3.1 million.
Insurance Premiums TaxIn FY 2017, revenue collected from the Insurance Premiums Tax, before the transfer to the Healthy D.C. and
Health Care Expansion Fund was $108.2 million; net revenue (after the transfer) was $62.7 million. Revenue
(after transfer to the Healthy D.C. Fund) from Insurance Premiums Tax collections is estimated to be $64.9
million in FY 2018 and $66.1 million in FY 2019. This would be followed by an estimated increase to $67.3
million in FY 2020 followed by estimated revenue of $68.6 million in FY 2021 and $69.9 million in FY 2022.
Transfer to Healthy D.C. Fund. Of the insurance premiums taxes generated by policies with health
maintenance organizations (HMO), 75 percent is distributed to the Healthy D.C. Fund for the purpose of
providing affordable health insurance to eligible individuals.
Healthcare Provider Tax (Transferred to Nursing Facility Quality of Care Fund)The Healthcare Provider Tax is an assessment per licensed bed that is paid by each nursing facility in the
District. Revenues from the assessments are dedicated to the Nursing Facility Quality of Care Fund, which is
used to fund quality of care initiatives. In FY 2017 the revenue from the Healthcare Provider Tax was $13.9
million. Revenue for FY 2018 is estimated to be $14.3 million. It is projected to grow in FY 2019 through
FY 2022 from $14.9 million to $15.8 million.
Ballpark Fee (Transferred to Ballpark Fund)The Ballpark Fee is a gross receipts fee that is a multi-tiered fee levied on businesses within the District with
over $5 million in gross receipts. The fees are due in a single payment on June 15th annually. Revenue from
the Ballpark Fee was $31.1 million in FY 2017. Revenue is estimated to increase to $33.9 million in FY 2018
and is expected to remain unchanged to FY 2022.
Inpatient Hospital Bed Tax (Transferred to Hospital Fund)The Medicaid Hospital Inpatient Rate Supplement Act (FY 2018 Budget Support Act of 2017, Subtitle V-G)
authorized the District to continue to charge a fee on each hospital’s impatient net patient revenue in fiscal year
2018. The tax rate for FY 2018 (0.448% of total inpatient net patient revenue) was set to generate $8.8 million
in revenue. All revenues collected from fees are deposited into a non-lapsing Hospital Fund. The Fund must
be used to fund District Medicaid inpatient fee-for-service. The subtitle expires on September 30, 2018.
Medicaid Hospital Outpatient Tax (Transferred to Hospital Provider Fee Fund)The Medicaid Hospital Outpatient Supplemental Payment Act (FY 2018 Budget Support Act of 2017, Subtitle
V-F) authorized the District to continue to charge a fee on each hospital’s outpatient gross patient revenue in

Revenue FY 2019 Proposed Budget and Financial Plan
3-18
fiscal year 2018. All revenues collected from fees are deposited into a non-lapsing Hospital Provider Fee Fund.
The Fund must be used to make Medicaid outpatient hospital access payments and refunds. The subtitle
specifies that the Fund can be used to pay for administrative expenses incurred by the Department of Health
Care Finance and limits the amount that can be used for this purposes to $150,000. The subtitle expires on
September 30, 2018.
ICF-IDD Assessment (Transferred to Stevie Sellows Fund)Each institution providing care to the developmentally disabled in the District of Columbia pays an assessment
of 5.5 percent of gross revenue in quarterly installments. These assessments are transferred to the Stevie
Sellows Quality Improvement Fund. The fund was established to fund quality of care improvements in a
qualified ICF-IDD (Intermediate Care Facility for Persons with Intellectual or Developmental Disabilities).
The assessment generated $4.9 million in FY 2017. For FY 2018 through FY 2022 revenue is expected to
increase in each year, starting at $4.9 million and growing to $5.5 million.
Gross Receipts Policy Proposals:
• Increase the Gross Receipts Tax on For-Hire Vehicles (excludes taxicabs) from 1% to 4.75%
Estate TaxFor FY 2017, estate tax revenue was $41.2 million, a decline of 23.6 percent from FY 2016. In 2016, the
District’s estate tax exclusion, the amount exempted from estate tax, was raised to $2 million from $1 million.
This increase contributes to the estimated 44 percent decline in FY 2018, reflecting the time between death
and tax filing. As part of the Tax Revision Commission changes, effective January 2018 the District’s estate
tax threshold conformed to the federal level and with the implementation of the federal tax legislation in
January 2018 the threshold was doubled. With the federal legislation, it is expected that FY 2019 will
experience another double-digit decline of 45.9% before stabilizing in FY 2020 with 2.2 percent growth.
FY 2021 and FY 2022 are expected to have an average growth rate of 4.3 percent.
Table 3-10Other Tax Revenue, Fiscal Years 2017-2022(Dollars in Thousands)
FY 2017 FY 2018 FY 2019 FY 2020 FY 2021 FY 2022Revenue Source Actual Estimate Estimate Projected Projected ProjectedEstate 41,215 23,019 12,459 12,731 13,262 13,837
Deed Recordation 250,740 257,099 260,981 269,876 278,755 287,615
Transfer to HPTF/Bond Repayment/West End (37,653) (39,760) (39,822) (40,611) (41,913) (43,245)
Deed Recordation (net) 213,087 217,339 221,159 229,265 236,842 244,370
Deed Transfer 188,781 193,864 195,708 202,553 209,398 216,242
Transfer to HPTF/Bond Repayment/West End (28,445) (30,275) (30,031) (30,513) (31,509) (32,539)
Deed Transfer (net) 160,336 163,589 165,677 172,040 177,888 183,703
Economic Interests 21,336 17,824 16,852 15,881 14,910 13,938
Total Other Taxes (net) 435,974 421,771 416,148 429,918 442,903 455,849
Policy Proposals - (1,430) - - - -
Other Taxes

FY 2019 Proposed Budget and Financial Plan Revenue
3-19
Deed and Economic Interest TaxesIn FY 2017, deed recordation and transfer taxes, including economic interest, totaled $460.9 million, which is
an increase from the FY 2016 level of the $444.1 million but a decline from the record high of $480.6 million
in FY 2015. The exceptional result in FY 2015 was driven in large part by an unprecedented volume of sales
of commercial properties valued more than $200 million. Deed tax revenues are expected to continue to rise
to an expected $468.8 million in FY 2018 and grow 2.5 percent annually on average from FY 2019 to
FY 2022.
Transfer to Housing Production Trust Fund (HPTF)/Bond Repayment. The “Housing Production Trust
Fund Second Amendment Act of 2002” requires that 15 percent of the District’s deed recordation and transfer
tax revenue be transferred to the Housing Production Trust Fund annually. The total transferred amount is
$67.6 million in FY 2017 growing to $68.5 million in 2022. These amounts include the Revenue Bond
repayments.
Transfer to West End. Beginning in FY 2017, the deed taxes from sale of West End Development condos
(after the HPTF dedication) are distributed to the West End Library/Firehouse Maintenance fund. In FY 2017,
the amount distributed was $88 thousand and is expected to grow to $2.4 million in FY 2018 as the initial
condos sell and then eventually drop back to about $200 thousand annually reflecting turnover in condo
ownership.
Other Tax Revenue Policy Proposals:
• National Community Reinvestment Coalition Tax Abatement

Revenue FY 2019 Proposed Budget and Financial Plan
3-20
Total non-tax revenue for FY 2017 was down 4.2 percent from FY 2016 due to a significant drop in traffic
fine revenue and it is expected to decline again in FY 2018 due primarily to a 31 percent decline in
miscellaneous revenues. Licenses and permits revenue and fines are both expected to decline in FY 2018 from
the FY 2017 level, by 2.8 percent and 6.5 percent respectively. Miscellaneous revenue is projected to be down
by 31 percent. This is due to the impact of onetime revenue in FY 2017 mainly due to prior year cost recoveries
which are volatile.
Transfers from the District’s Office of Lottery and Charitable Games (OLCG) were $45.6 million in
FY 2017. Projected transfers decrease to $45.0 million in FY 2018 and remain at this level to FY 2022.
Presently, there are more than 150 general-purpose, non-tax revenue sources that provide operating support
to District government agencies and programs. These revenue sources are listed in Table 3-15. A September
2015 D.C. Office of Revenue Analysis report (District of Columbia Non-Tax Revenue Report) provides
detailed background information and relevant data about these general-purpose, non-tax revenues. The report
is available under “Studies” in the “Reports” section of the Office of the Chief Financial Officer web site:
http://cfo.dc.gov/sites/default/files/dc/sites/ocfo/publication/attachments/Non-Tax%20Revenue%20Report%
20_September%202015.pdf .
Special Purpose Non-Tax RevenueSpecial purpose non-tax revenues, often referred to as O-Type or Other revenues, are funds generated from
fees, fines, assessments, or reimbursements that are dedicated to the District agency that collects the revenues
to cover the cost of performing the function. The “dedication” of the revenue to the collecting agency is what
distinguishes this revenue from the general-purpose non-tax revenues. The legislation that creates the fee, fine
or assessment must stipulate its purpose-designation and must also state whether any unspent funds are to
retain designation at the conclusion of the fiscal year or revert to general-purpose funds. Unspent revenue in
certain funds cannot revert to general purpose funds. Dedicated revenues limit the use of the District's General
Table 3-11General Purpose Non-Tax Revenue and Lottery Transfer, Fiscal Years 2017-2022(Dollars in Thousands)
FY 2017 FY 2018 FY 2019 FY 2020 FY 2021 FY 2022Revenue Source Actual Estimate Estimate Projected Projected ProjectedLicenses and Permits 92,549 89,992 98,793 94,454 99,483 96,849 Fines and Forfeits 167,385 156,460 152,469 148,589 144,814 141,135 Charges for Services 81,371 82,079 77,443 78,697 78,452 78,840 Miscellaneous 146,208 100,893 101,290 100,471 100,394 101,588 Total Non-Tax 487,514 429,424 429,995 422,211 423,143 418,411 Lottery 45,600 45,000 45,000 45,000 45,000 45,000 Total Non-Tax Plus Lottery 533,114 474,424 474,995 467,211 468,143 463,411Policy Proposals - - - - - -Note: Table 3-15 (presented later in this chapter) provides a detailed listing of non-tax revenue by source.
Non-Tax Revenue and LotteryLocal non-tax revenue consists of Licenses and Permits, Fines and Forfeitures, Charges for Services, and
Miscellaneous categories, which include payments in lieu of taxes (PILOTS), revenues from long-outstanding
traffic fines collected through the Central Collection Unit (CCU), proceeds from unclaimed properties, and
other revenue sources.

FY 2019 Proposed Budget and Financial Plan Revenue
3-21
Fund revenue by earmarking a portion of the revenue for special purposes. Prior to FY 2002 dedicated
non-tax revenues were not considered local revenues and as such were reported differently in the
Comprehensive Annual Financial Report (CAFR) and reported with the District's federal and private grants in
the Financial Plan.
In FY 2019 the District is anticipating approximately $640.6 million in revenue and use of fund balance
of $64.0 million for a total of $704.6 million to cover the cost of performing the functions associated with these
resources. The use of fund balance is a one-time revenue source and as such is not projected for FY 2020 –
FY 2022. Table 3-17 (at the end of this chapter) shows the current law or baseline dedicated non-tax revenue
by agency and fund. Proposed policy initiatives that would change the D.C. Official Code or the D.C.
Municipal Regulations may, if enacted, provide additional revenue to specific Special Purpose Revenue funds
in addition to the current law projected revenues shown in this table. Table 3-12 shows proposed policy
initiatives affecting Special Purpose Revenue funds and their estimated revenue impact.
POLICY PROPOSALSFollowing are changes that are included in the FY 2019 Budget Support Act of 2018 (BSA) along with other
changes that affect revenue since the most recent revenue estimate. Full information on all of the proposals
included in the BSA can be found in the OCFO fiscal impact statement.
Several of the policy options are in the budget under the heading “Dedicated Funding for the Washington
Metropolitan Transit Authority Act (BSA Subtitle VI-A).” These are identified with the word METRO in the
descriptions below and in Table 3-12. This proposal dedicates $178.5 million of general retail sales tax
revenues to the WMATA Dedicated Funding Fund and increases such amount 3% annually from FY2021.
Starting in FY 2020, revenue from the fund can be provided to WMATA by the Mayor as a capital
improvement grant, provided that other WMATA jurisdictions have enacted dedicated capital funding for
WMATA capital improvements.

Revenue FY 2019 Proposed Budget and Financial Plan
3-22
Table 3-12 Policy Proposals Impacting General Fund Revenues, Fiscal Years 2018-2022(Dollars in Thousands)
FY 2018 FY 2019 FY 2020 FY 2021 FY 2022Revenue Source Revised Original Projected Projected ProjectedLocal Fund Revenue (February 2018 Estimates) 7,578,198 7,810,588 8,039,651 8,294,832 8,567,550
plus Local Fund Policy Proposals 19,461 (71,087) (67,465) (70,602) (73,572)
PROPERTY TAXES (3,284) 13,287 13,526 13,696 13,855 BSA Subtitle VII-B: National Community Reinvestment Coalition Tax Abatement (2,781) (1,269) (1,347) (1,429) (1,472)BSA Subtitle VI-A: Increase Commercial Property Tax Rate (METRO) 16,754 17,306 17,843 18,396 BSA Subtitle VII-B: Four Unit Rental Housing Grandfathering (18) (20) (22) (24)BSA Subtitle VII-B: Africare Real Property Abatement (503) (103) (105) (106) (110)BSA Subtitle VII-B: Elderly and Tenants with Disabilities Protection Amendment (1,281) (1,313) (1,346) (1,380)BSA Subtitle VII-A: Senior Homestead 5% cap on real property tax increases (796) (995) (1,244) (1,555)
SALES / USE TAXES 24,175 (111,449) (109,563) (113,038) (116,360)
BSA Subtitle VII-C: Feminine hygiene product exemption (403) (419) (436) (453)
BSA Subtitle VI-A: Increase sales tax rates (METRO) 42,966 44,856 46,740 48,937
BSA Subtitle II-F: Extended bar hours around holidays 313 325 338 352 BSA Subtitle VI-A: Reverse current WMATA Dedicated Funding (METRO) 24,175 24,175 24,175 24,175 24,175
BSA Subtitle VI-A: 'WMATA New Dedicated Funding (METRO) (178,500) (178,500) (183,855) (189,371)
INCOME TAXES
Individual Income Tax 0 9,812 10,739 10,336 9,903
BSA Subtitle VII-B: Deferred compensation auto enrollment (176) (548) (950) (1,381)
BSA Subtitle VII-B: Four Unit Rental Housing Grandfathering (12) (13) (14) (16)
BSA Subtitle IV-E: Child Care Tax Credit: Sunsets after one year (2,500) - - -
OTR Compliance Initiatives 12,500 11,300 11,300 11,300
GROSS RECEIPTS TAXES 0 17,263 17,833 18,404 19,029 BSA Subtitle VI-A: Increase tax on vehicles for hire (excludes taxicabs) from 1% to 4.75% (METRO) 17,263 17,833 18,404 19,029
DEED RECORDATION AND TRANSFER TAXES (1,430) 0 0 0 0 BSA Subtitle VII-B: National Community Reinvestment Coalition Tax Abatement (1,430) 0 0 0 0
Local Fund Revenue With Policy Proposals 7,597,659 7,739,501 7,972,186 8,224,231 8,493,977 (Continued on next page)

FY 2019 Proposed Budget and Financial Plan Revenue
3-23
PROPERTY TAX CHANGES:
Subject to Appropriations Repeal - National Community Reinvestment Coalition Real Property Tax
Exemption Amendment Act (BSA Subtitle VII-B)
The proposal lowers expected real property tax revenues to fund the National Community Reinvestment
Coalition Real Property Tax Exemption Amendment Act of 2018 (D.C. Act 22-247). The law forgives and
exempts qualified real property taxes for the National Community Reinvestment Coalition located at 740 15th
St NW and 727 15th Street beginning fiscal year 2018.
Increase Commercial Property Tax Rate (METRO)
The subtitle increases the top commercial property tax rate from $1.85 per $100 of assessed value over $3
million to $1.87 per $100. The $1.65 per $100 on assessed value up to $3 million is unchanged.
Subject to Appropriations Repeal - Four-unit Rental Housing Tenant Grandfathering Amendment
Act of 2016 (BSA Subtitle VII-B)
The subtitle funds an Act extending rent control to properties of four or fewer rent-controlled units that were
transferred to a new owner via an intra-family transfer or other transfers exempt from the Tenant Opportunity
to Purchase Act. The Act reduces District property tax revenue and income taxes.
Subject to Appropriations Repeal: Africare Real Property Tax Relief Implementation Act (BSA
Subtitle VII-B)
This subtitle funds part the Africare Real Property Tax Relief Act of 2018 (D.C. Act 22-250), exempting the
organization’s real property on R Street, NW from real property taxation as of October 1, 2017 and forgives
taxes, penalties and interest from October 1, 2013.
Subject to Appropriations Repeal - Elderly and Tenants with Disabilities Protection Amendment Act
(BSA Subtitle VII-B)
The subtitle funds this D.C. Law 21-239, which restricts landlords of rent-controlled apartment buildings from
applying certain petition-based rent increases to qualified elderly and disabled tenants. The act allows the
Table 3-12 Policy Proposals Impacting General Fund Revenues, Fiscal Years 2018-2022(Dollars in Thousands)
FY 2018 FY 2019 FY 2020 FY 2021 FY 2022Revenue Source Revised Original Projected Projected Projected
Dedicated Revenue 372,208 367,285 377,022 390,184 398,895 plus Dedicated Revenue Policy Proposals (24,175) 154,325 154,325 159,680 165,196 BSA Subtitle VI-A: 'WMATA New Dedicated Funding (METRO) 178,500 178,500 183,855 189,371 BSA Subtitle VI-A: Reverse current WMATA Dedicated Funding (METRO) (24,175) (24,175) (24,175) (24,175) (24,175)
Dedicated Revenue With Policy Proposals 348,033 521,610 531,347 549,864 564,091 Special Purpose (O-Type) Revenue 617,554 640,589 623,997 628,216 611,965 plus Special Purpose Policy Proposals 0 0 0 0 0
Special Purpose Revenue With Policy Proposals 617,554 640,589 623,997 628,216 611,965
All Proposals (4,714) 83,238 86,860 89,078 91,623
General Fund Revenue with Policy Proposals 8,563,246 8,901,700 9,127,529 9,402,311 9,670,033

District to provide up to a total of $1.25 million of property and income tax credits to landlords to make up for
the rent lost on such exemptions.
Senior Homestead 5% Cap on Real Property Tax Increases (BSA Subtitle VII-A)
The subtitle applies to senior citizens (age 65 and older) and persons with disabilities who own and occupy a
home in the District of Columbia, provided their household income is within the maximum amounts specified.
The proposal limits the taxable assessed value of the individual’s home to a 5 percent increase from the prior
tax year.
GENERAL SALES/USE TAX CHANGES:
Feminine Hygiene Product Sales Tax Exemption Implementation Amendment Act (BSA Subtitle
VII-C)
The proposed budget and financial plan funds a section of the Feminine Hygiene and Diapers Sales Tax
Exemption Amendment Act of 2016 (D.C. Law21-201), exempting feminine hygiene products from the
general retail sales tax.
Increase Sales Tax Rates (METRO)
The subtitle increases all of the sales tax rates by 0.25 percentage points. The rate for general retail sales and
live performances increases to 6 percent, the rate for alcohol purchases at stores and bars, restaurants, and rental
cars, increases to 10.25 percent, and the rate for hotel rooms increases to 10.3 percent (excluding the 4.75
percent surtax that funds the Convention Center and DestinationDC).
Extended Bar Hours on Certain Holiday Weekends (BSA Subtitle II-F)
This proposal allows bars to remain open 24 hours a day and serve alcohol until 4:00 a.m. on the Saturday and
Sunday preceding Martin Luther King, Jr.’s Birthday, Washington’s Birthday, Memorial Day, Labor Day, and
Columbus Day as well as the Friday, Saturday, and Sunday following Thanksgiving.
Reverse Current WMATA Dedicated Funding (METRO)
The subtitle reverses a current dedication of $24.175 million of sales tax.
New Dedicated Funding for WMATA (METRO)
The subtitle provides for a new dedication of $178.5 million in FY 2019 and FY 2020, growing 3 percent
annually after FY 2020.
INCOME TAX CHANGES:
Subject to Appropriations Repeal – Deferred Compensation Program Enrollment Amendment Act
(BSA Subtitle VII-B)
This proposal lowers expected income tax revenue to fund the Deferred Compensation Program Enrollment
Amendment Act of 2018, which is currently under review by Council. Under the bill, new District
Government employees will be automatically enrolled in the government’s deferred compensation retirement
plan and 5 percent of their pre-tax wages will be deposited into the plan, unless employees opt out of the
program.
Subject to Appropriation Repeal - Four-unit Rental Housing Grandfathering Amendment Act of
2016 (BSA Subtitle VII-B)
The subtitle funds D.C. Law 21-270, extending rent control to properties of four or fewer rent-controlled units
that were transferred to a new owner via an intra-family transfer or other transfers exempt from the Tenant
Revenue FY 2019 Proposed Budget and Financial Plan
3-24

FY 2019 Proposed Budget and Financial Plan Revenue
3-25
Opportunity to Purchase Act. The Act reduces District property tax revenue and income taxes.
District Child Care Tax Credit Act (BSA Subtitle IV-E)
This proposal provides a $1,000 tax credit for tax filers who have enrolled a child aged 0-3 and paid tuition to
a licensed child care center in the District of Columbia. The proposed tax credit is subject to certain income
limits and is also not available for families already receiving a child care subsidy.
Office of Tax and Revenue Compliance Initiatives.
These initiatives of the Office of Tax and Revenue will improve compliance with individual and business
income taxes primarily by increased use and analysis of federal IRS data sharing, including data warehouse
matching to identify underreported income.
GROSS RECIEPTS TAX CHANGES:
Increase Tax on Private For-Hire Vehicles (METRO)
Currently, the Department of For-Hire Vehicles assesses for-hire vehicles other than taxicabs a 1 percent tax
on gross receipts which is directed to a special purpose fund. This proposal will increase the rate to 4.75 percent
and direct 3.75 percent to local funds.
DEED RECORDATION AND TRANSFER TAX CHANGES:
Subject to Appropriations Repeal – National Community Reinvestment Coalition Real Property Tax
Exemption Amendment Act (BSA Subtitle VII-B)
The proposal funds the National Community Reinvestment Coalition Real Property Tax Exemption
Amendment Act of 2018 (D.C. Act 22-247). The law exempts real property located at 740 15th Street, N.W.,
and 727 15th Street, N.W. from recordation taxation, so long as the property is owned by the National
Community Reinvestment Coalition (“NCRC”), and used for the purposes and activities of NCRC.
DEDICATED TAX REVENUE CHANGES:
Reverse Current WMATA Dedicated Funding (METRO)
The subtitle reverses a current dedication of $24.175 million of sales tax.
New Dedicated Funding for WMATA (METRO)
The subtitle provides for a new dedication of $178.5 million in FY 2019 and FY 2020, growing 3 peercent
annually after FY 2020.
ADDITIONAL INFORMATION ON D.C. REVENUESThe following tables provide additional detail on District taxes. Additional information on District of Columbia
taxes and its economy is available on the OCFO website under “Reports and Publications”
(http://cfo.dc.gov/page/reports-and-publications). These include:
• Tax Facts
• District of Columbia Data Book: Revenue and Economy.
• Economic Indicators and Review of District of Columbia Economic and Revenue Trends.
• Special Reports on non-tax revenue, tax expenditures, and special purpose funds.

Revenue FY 2019 Proposed Budget and Financial Plan
3-26
Table 3-13Percentage Changes from Prior Fiscal Year in General Fund,Local Revenue by Source, Fiscal Years 2017-2022
FY 2017 FY 2018 FY 2019 FY 2020 FY 2021 FY 2022Revenue Source Actual Estimate Estimate Projected Projected ProjectedReal Property 4.9% 4.7% 3.5% 3.3% 3.1% 3.1%
Transfer to TIF/Pilot 34.5% -3.4% 12.0% 28.8% 8.2% -13.6%
Real Property (net) 4.5% 4.8% 3.3% 2.8% 3.0% 3.5%
Personal Property 7.1% -1.1% 0.4% 0.5% 0.3% 0.3%
Public Space Rental -19.6% 3.2% 3.2% 3.2% 3.2% 3.2%
Total Property (net) 4.1% 4.6% 3.3% 2.8% 2.9% 3.4%General Sales 5.7% 4.4% 4.4% 4.2% 4.7% 3.4%
Transfer to Convention Center Fund 11.8% 8.0% 4.3% 4.2% 5.0% 3.0%
Transfer to TIF -5.5% 41.7% 21.2% 12.3% 12.0% -4.0%
Transfer to Ballpark Revenue Fund 8.2% -10.5% 0.0% 0.0% 0.0% 0.0%
Transfer to Healthy DC Fund 75.2% -3.2% 0.0% 2.0% 2.0% 2.0%
Transfer to WMATA Subsidy (parking tax) 2.5% 36.0% 3.2% 3.2% 3.9% 2.4%
Transfer to Healthy Schools Fund 0.0% 9.4% -8.6% 0.0% 0.0% 0.0%
Transfer to ABRA Program 0.0% 0.0% 0.0% 0.0% 0.0% 0.0%
General Sales (net) 5.5% 1.1% 4.0% 3.9% 4.4% 4.0%Alcohol 2.7% 1.6% 1.2% 2.0% 3.1% 1.5%
Cigarette -3.0% 0.7% -2.5% -1.5% -1.2% -1.0%
Motor Vehicle -0.2% -0.9% 0.4% 0.5% 0.9% 0.5%
Motor Fuel Tax 3.0% -1.3% -1.3% -1.3% -1.3% -1.3%
Transfer to Highway Trust Fund 3.0% -1.3% -1.3% -1.3% -1.3% -1.3%
Total Sales (net) 5.0% 1.0% 3.7% 3.7% 4.2% 3.7%Individual Income 2.6% 4.9% 4.3% 3.8% 4.1% 4.0%
Corporate Franchise 0.6% -13.3% 2.8% 2.9% 0.9% 3.5%
Unincorporated Business Franchise -2.6% -1.8% 3.4% 3.3% 3.8% 3.8%
Total Income 2.0% 1.7% 4.0% 3.7% 3.7% 3.9%Public Utility 1.9% -0.9% 0.5% 0.5% 0.5% 0.5%
Transfer to Ballpark Revenue Fund -2.1% 4.2% 1.0% 1.0% 1.0% 1.0%
Public Utility (net) 2.1% -1.2% 0.5% 0.5% 0.5% 0.5%
Toll Telecommunications -2.7% 3.7% 0.4% 0.4% 0.4% 0.4%
Transfer to Ballpark Revenue Fund 8.6% 3.2% 5.5% 5.1% 4.9% 4.9%
Toll Telecommunications (net) -3.3% 3.7% 0.2% 0.2% 0.2% 0.2%
Insurance Premiums 3.1% 2.0% 1.9% 1.9% 1.9% 1.9%
Transfer to Healthy DC and Health Care Expansion Fund 1.9% 0.0% 1.9% 2.0% 2.0% 2.0%
Insurance Premiums (net) 4.0% 3.4% 1.9% 1.9% 1.9% 1.9%
Healthcare Provider Tax -18.0% 2.4% 4.4% 2.0% 2.0% 2.0%
Transfer to Nursing Facility Quality of Care Fund -18.0% 2.4% 4.4% 2.0% 2.0% 2.0%
Ballpark Fee -5.1% 9.0% 0.0% 0.0% 0.0% 0.0%
Transfer to Ballpark Revenue Fund -5.1% 9.0% 0.0% 0.0% 0.0% 0.0%
Hospital Bed Tax and Hospital Provider Fee -5.2% -7.0% -100.0% NA NA NA
Transfer to Hospital Fund and Hospital Provider Fee Fund -5.2% -7.0% -100.0% NA NA NA
ICF-IDD Assessment 1.1% 0.1% 11.4% 0.0% 0.0% 0.0%
Transfer to Stevie Sellows Quality Improvement Fund 1.1% 0.1% 11.4% 0.0% 0.0% 0.0%
Total Gross Receipts (net) 1.5% 1.0% 0.8% 0.8% 0.8% 0.8%
(Continued on next page)

FY 2019 Proposed Budget and Financial Plan Revenue
3-27
Table 3-13 (Continued)Percentage Changes from Prior Fiscal Year in General Fund,Local Revenue by Source, Fiscal Years 2017-2022
FY 2017 FY 2018 FY 2019 FY 2020 FY 2021 FY 2022Revenue Source Actual Estimate Estimate Projected Projected Projected
Estate -23.6% -44.1% -45.9% 2.2% 4.2% 4.3%
Deed Recordation 0.3% 2.5% 1.5% 3.4% 3.3% 3.2%
Transfer to HPTF/Bond Repayment/West End 0.4% 5.6% 0.2% 2.0% 3.2% 3.2%
Deed Recordation (net) 0.3% 2.0% 1.8% 3.7% 3.3% 3.2%
Deed Transfer 8.1% 2.7% 1.0% 3.5% 3.4% 3.3%
Transfer to HPTF/Bond Repayment/West End 8.6% 6.4% -0.8% 1.6% 3.3% 3.3%
Deed Transfer (net) 8.0% 2.0% 1.3% 3.8% 3.4% 3.3%
Economic Interests 9.7% -16.5% -5.4% -5.8% -6.1% -6.5%
Total Other Taxes (net) 0.4% -3.3% -1.3% 3.3% 3.0% 2.9%
TOTAL TAXES NET OF DEDICATED TAXES 3.2% 2.3% 3.3% 3.2% 3.4% 3.5%
Licenses and Permits 2.3% -2.8% 9.8% -4.4% 5.3% -2.6%
Fines and Forfeits -15.2% -6.5% -2.6% -2.5% -2.5% -2.5%
Charges for Services 1.4% 0.9% -5.6% 1.6% -0.3% 0.5%
Miscellaneous 3.8% -31.0% 0.4% -0.8% -0.1% 1.2%
TOTAL NON-TAX -4.2% -11.9% 0.1% -1.8% 0.2% -1.1%
Lottery -14.4% -1.3% 0.0% 0.0% 0.0% 0.0%
TOTAL LOCAL FUND REVENUE NET OF DEDICATED TAXES 2.5% 1.3% 3.1% 2.9% 3.2% 3.3%

Revenue FY 2019 Proposed Budget and Financial Plan
3-28
Table 3-14 Changes from Prior Fiscal Year in General Fund, Local Revenue by Source, Fiscal Years 2017-2022(Dollars in Thousands)
FY 2017 FY 2018 FY 2019 FY 2020 FY 2021 FY 2022Revenue Source Actual Estimate Estimate Projected Projected ProjectedReal Property 115,869 115,085 89,983 89,068 85,246 88,095
Transfer to TIF/Pilot 11,700 (1,554) 5,303 14,224 5,184 (9,345)
Real Property (net) 104,170 116,639 84,680 74,844 80,061 97,439
Personal Property 4,204 (725) 240 301 200 201
Public Space Rental (7,918) 1,039 1,072 1,107 1,142 1,179
Total Property (net) 100,456 116,952 85,992 76,252 81,403 98,818
General Sales 76,123 61,849 65,563 64,423 75,621 56,998
Transfer to Convention Center Fund 14,577 11,068 6,347 6,547 8,111 5,106
Transfer to TIF (1,861) 13,386 9,624 6,756 7,407 (2,746)
Transfer to Ballpark Revenue Fund 1,344 (1,864) - - - -
Transfer to Healthy DC Fund 358 (27) - 16 16 17
Transfer to WMATA Subsidy (parking tax) 1,812 26,730 3,267 3,370 4,175 2,628
Transfer to Healthy Schools Fund - 400 (400) - - -
Transfer to ABRA Program - - - - - -
General Sales (net) 59,891 12,157 46,725 47,734 55,911 51,993
Alcohol 173 105 81 134 218 108
Cigarette (921) 220 (732) (430) (329) (283)
Motor Vehicle (82) (394) 177 225 400 232
Motor Fuel Tax 768 (338) (335) (331) (326) (322)
Transfer to Highway Trust Fund 768 (338) (335) (331) (326) (322)
Total Sales (net) 59,062 12,087 46,251 47,664 56,200 52,050
Individual Income 50,415 96,364 88,149 81,635 91,928 92,225
Corporate Franchise 2,137 (51,655) 9,601 10,076 3,245 12,620
Unincorporated Business Franchise (4,360) (2,966) 5,509 5,535 6,545 6,827
Total Income 48,192 41,742 103,259 97,246 101,718 111,672
Public Utility 2,556 (1,197) 684 688 692 695
Transfer to Ballpark Revenue Fund (167) 330 83 83 84 85
Public Utility (net) 2,723 (1,527) 601 605 608 611
Toll Telecommunications (1,387) 1,839 226 226 226 227
Transfer to Ballpark Revenue Fund 198 80 140 139 140 147
Toll Telecommunications (net) (1,585) 1,759 86 87 86 80
Insurance Premiums 3,296 2,111 2,109 2,150 2,193 2,235
Transfer to Healthy DC and Health Care Expansion Fund 862 - 856 926 945 964
Insurance Premiums (net) 2,433 2,111 1,253 1,224 1,248 1,271
Healthcare Provider Tax (3,065) 333 634 298 304 310
Transfer to Nursing Facility Quality of Care Fund (3,065) 333 634 298 304 310
Ballpark Fee (1,657) 2,793 - - - -
Transfer to Ballpark Revenue Fund (1,657) 2,793 - - - -
Hospital Bed Tax and Hospital Provider Fee (878) (1,109) (14,819) NA NA NA
Transfer to Hospital Fund and Hospital Provider Fee Fund (878) (1,109) (14,819) NA NA NA
ICF-IDD Assessment 53 5 561 - - -
Transfer to Stevie Sellows Quality Improvement Fund 53 5 561 - - -
Total Gross Receipts (net) 3,571 2,343 1,940 1,916 1,942 1,962 (Continued on next page)

FY 2019 Proposed Budget and Financial Plan Revenue
3-29
Table 3-14 (Continued)Changes from Prior Fiscal Year in General Fund, Local Revenue by Source, Fiscal Years 2017-2022(Dollars in Thousands)
FY 2017 FY 2018 FY 2019 FY 2020 FY 2021 FY 2022Revenue Source Actual Estimate Estimate Projected Projected ProjectedEstate (12,752) (18,196) (10,560) 272 531 575
Deed Recordation 712 6,359 3,882 8,895 8,879 8,860
Transfer to HPTF/Bond Repayment/West End 149 2,107 62 789 1,302 1,332
Deed Recordation (net) 563 4,252 3,820 8,106 7,577 7,528
Deed Transfer 14,141 5,083 1,845 6,845 6,845 6,845
Transfer to HPTF/Bond Repayment/West End 2,249 1,829 (244) 481 997 1,030
Deed Transfer (net) 11,892 3,253 2,088 6,363 5,848 5,815
Economic Interests 1,886 (3,512) (971) (971) (971) (971)
Total Other Taxes (net) 1,589 (14,203) (5,623) 13,770 12,985 12,947
TOTAL TAXES NET OF DEDICATED TAXES 212,871 158,922 231,819 236,848 254,249 277,449
Licenses and Permits 2,117 (2,558) 8,801 (4,339) 5,028 (2,634)
Fines and Forfeits (30,054) (10,925) (3,991) (3,880) (3,775) (3,679)
Charges for Services 1,120 708 (4,636) 1,254 (245) 388
Miscellaneous 5,322 (45,315) 397 (820) (76) 1,193
TOTAL NON-TAX (21,494) (58,090) 572 (7,785) 932 (4,732)
Lottery (7,687) (600) - - - -
TOTAL LOCAL FUND REVENUE NET OF DEDICATED TAXES 183,690 100,232 232,391 229,063 255,181 272,718

Revenue FY 2019 Proposed Budget and Financial Plan
3-30
Table 3-15General Purpose Non-Tax Revenue by Source, Fiscal Years 2017-2022(Dollars in Thousands)AgencyObject FY 2017 FY 2018 FY 2019 FY 2020 FY 2021 FY 2022Code Agency Revenue Object Title Actual Projection Projection Projection Projection Projection
BUSINESS LICENSES AND PERMITS
2003 Public Service Commission Electric License 10 10 10 11 11 11
2004 Public Service Commission Gas License 4 4 4 4 4 4
3001 Depart of Insurance, Securities and Banking Insurance Licenses 15,449 14,115 16,221 14,906 17,500 15,659
3002 Public Service Commission Electric License 1 1 1 1 1 1
3012 Dept. of Consumer and Regulatory Affairs Building Structures and Equipment 29,242 29,000 29,000 29,000 30,000 28,500
3013 Dept. of Consumer and Regulatory Affairs Certificate of Occupancy Fee 461 470 479 489 501 511
3014 Dept. of Consumer and Regulatory Affairs Refrigeration and Plumbing Permit 4,813 4,500 4,500 4,500 4,500 4,500
3015 Dept. of Consumer and Regulatory Affairs Electrical Permit 3,790 3,482 3,552 3,494 3,564 3,564
3025 Dept. of Consumer and Regulatory Affairs Capacity Placard Permit 7 7 7 7 7 7
3026 Dept. of Consumer and Regulatory Affairs Demolition Permit 460 469 479 489 504 514
3028 Dept. of Consumer and Regulatory Affairs Fence Permit 17 17 17 18 18 19
3029 Dept. of Consumer and Regulatory Affairs Foundation Permit 18 18 18 19 19 20
3030 Dept. of Consumer and Regulatory Affairs Garage Permit 3 3 3 4 4 4
3031 Dept. of Consumer and Regulatory Affairs Miscellaneous Permit 250 255 260 265 273 279
3034 Dept. of Consumer and Regulatory Affairs Raze Permit 396 404 412 420 433 442
3035 Dept. of Consumer and Regulatory Affairs Retaining Wall Permit 109 111 113 116 119 121
3036 Dept. of Consumer and Regulatory Affairs Shed Permit 2 2 2 2 2 2
3037 Dept. of Consumer and Regulatory Affairs Sheeting and Shoring Permit 33 33 34 35 36 36
3038 Dept. of Consumer and Regulatory Affairs Sign Permit 91 93 95 97 100 102
3039 Dept. of Consumer and Regulatory Affairs Special Sign Permit 34 34 35 36 37 37
3040 Dept. of Consumer and Regulatory Affairs Swimming Pool Permit 21 21 22 22 23 23
3041 Dept. of Consumer and Regulatory Affairs Tenant Layout Permit 28 29 29 30 31 32
3042 Dept. of Consumer and Regulatory Affairs Postcard Permit 145 148 151 154 159 162
3044 Dept. of Consumer and Regulatory Affairs Public Space Sidewalk Cafe Permit 136 139 141 144 148 151
3048 Dept. of Consumer and Regulatory Affairs Solar Permit 189 193 197 200 206 211
3053 Department of Motor Vehicles Dealer Registration Application Fee 1 1 1 1 1 1
9201 Department of Behavioral Health Other License Fees 5 5 6 5 6 5
TOTAL BUSINESS LICENSES AND PERMITS 55,714 53,566 55,791 54,468 58,206 54,917
NONBUSINESS LICENSES AND PERMITS
3100 Office of the Chief Financial Officer Drivers License 1 1 1 1 1 1
3101 Department of Motor Vehicles Drivers License-First Time/Renewals 5,534 5,534 6,221 5,371 5,558 5,560
3105 Department of Motor Vehicles Cancel Road Test Fee 72 72 72 72 72 72
3106 Department of Motor Vehicles Change of Address Fee 1 1 1 1 1 1
3107 Department of Motor Vehicles Drivers License-Knowledge Test 465 465 465 465 465 465
3108 Department of Motor Vehicles Drivers License-Road Test 118 118 118 118 118 118
3120 Metropolitan Police Department Boat Registration 120 120 120 120 120 120
3141 Department of Motor Vehicles Reciprocity Permit-Military/Congressional 620 620 620 620 620 620
3144 Department of Motor Vehicles Digital Certificate Fee 1 1 1 1 1 1
3145 Department of Motor Vehicles Personalized Tags - RSC 9100 106 106 106 106 106 106
3147 Department of Motor Vehicles Dctc Issuances - RSC9100 521 521 521 521 521 521 (Continued on next page)

FY 2019 Proposed Budget and Financial Plan Revenue
3-31
Table 3-15 (Continued)General Purpose Non-Tax Revenue by Source, Fiscal Years 2017-2022(Dollars in Thousands)AgencyObject FY 2017 FY 2018 FY 2019 FY 2020 FY 2021 FY 2022Code Agency Revenue Object Title Actual Projection Projection Projection Projection Projection
NONBUSINESS LICENSES AND PERMITS (Continued)
3148 Department of Motor Vehicles Temporary Dealer Tags 5 5 5 5 5 5
3149 Department of Motor Vehicles Transfer of Tags - RSC 9100 45 45 45 45 45 45
3151 Department of Motor Vehicles Motor Vehicle Registration 28,215 27,807 33,694 31,529 32,633 33,285
3160 Department of Motor Vehicles Associated Fee for One (1) Year 7 7 7 7 7 7
3161 Department of Motor Vehicles Associated Fee for Thirty (30) Days 3 3 3 3 3 3
3165 Department of Motor Vehicles Destiny CC Time/No Chrg/Over(Short) 1,010 1,010 1,010 1,010 1,010 1,010
TOTAL NON-BUSINESS LICENSES AND PERMITS 36,835 36,427 43,002 39,986 41,277 41,931
FINES AND FORFEITURES
3301 Department of Energy and Environment Underground Storage Tank Fines only 5 5 5 5 5 5
3302 Department of Energy and Environment Underground Storage Tank Fines and Fees 350 350 350 350 350 350
3303 Department of Energy and Environment Asbestos Certification and Abatement Fees 316 316 316 316 316 316
3304 Department of Transportation Adjudication Hearing-Traffic Control 205 205 205 205 205 205
3305 Department of Energy and Environment Adjudication Hearing (Air Quality) Enfor 8 8 8 8 8 8
3306 Department of Energy and Environment Adjudication Hearing (Water Quality) 13 13 13 13 13 13
3308 Department of Energy and Environment Lead Poisoning Prevention Fund 100 100 100 100 100 100
3309 Department of Energy and Environment Hazardous Generator Fees 293 293 293 293 293 293
3311 Department of Energy and Environment General Enforcement Fines and Fees 146 146 146 146 146 146
3315 Department of Energy and Environment Lead Poisoning Prevention Fines and Fees 5 5 5 5 5 5
3316 Department of Energy and Environment Wildlife Control Operator Fees 1 1 1 1 1 1
3515 Department of Energy and Environment Apiculture Registration Fee 1 1 1 1 1 1
3517 Department of Energy and Environment Apiculture Registration Fines 0 0 0 0 0 0
5000 Department of for-Hire Vehicles Hackers Fines 26 26 26 26 26 26
5001 Department of for-Hire Vehicles Adjudicated Hacker Fines 5 5 5 5 5 5
5001 Metropolitan Police Department Red Light Revenue 14,112 13,227 13,434 12,762 12,124 11,518
5002 Metropolitan Police Department Stop Sign 9 8 8 8 7 7
5003 Metropolitan Police Department No Thru Truck 152 142 145 137 131 124
5004 Metropolitan Police Department Gridlock 3 3 3 3 3 3
5005 Metropolitan Police Department Crosswalk 684 641 651 619 588 558
5010 Department of Motor Vehicles Traffic Fines - RSC 1501 58,473 54,096 48,091 48,091 48,091 48,091
5012 Metropolitan Police Department Photo Radar O/T Reimbursements 86,710 81,274 83,069 79,901 76,803 73,766
5013 Department of for-Hire Vehicles DCTC Violation 35 35 35 35 35 35
5015 Department of Motor Vehicles Traffic Fines - Timing Difference 4,268 4,094 4,094 4,094 4,094 4,094
5020 Department of Public Works Sale of Abandoned Property 13 13 13 13 13 13
5030 Department of Public Works Booting Fees - RSC 1504 47 47 47 47 47 47
5040 Department of Public Works Towing Fees - RSC 1505 196 196 196 196 196 196
5050 Department of Public Works Impoundment Fees - RSC 1506 224 224 224 224 224 224
5060 Alcoholic Beverage Regulation Admin. Fines and Forfeitures - Other 567 567 567 567 567 567
5060 Depart of Insurance, Securities and Banking Fines 330 330 330 330 330 330
5060 Metropolitan Police Department Fines and Forfeitures - Other 248 248 248 248 248 248
9020 Department of Public Works Refund for Sale of Abandoned Property 4 4 4 4 4 4
9030 Department of Public Works Booting Fees - RSC1504 - Revenue Refund 39 39 39 39 39 39
9040 Department of Public Works Towing Fees - RSC 1505 - Revenue Refund 50 50 50 50 50 50
9050 Department of Public Works Impoundment Fees - RSC 1506 - Rev Refund 139 139 139 139 139 139
TOTAL FINES AND FORFEITURES 167,385 156,460 152,469 148,589 144,814 141,135
(Continued on next page)

Revenue FY 2019 Proposed Budget and Financial Plan
3-32
Table 3-15 (Continued)General Purpose Non-Tax Revenue by Source, Fiscal Years 2017-2022(Dollars in Thousands)AgencyObject FY 2017 FY 2018 FY 2019 FY 2020 FY 2021 FY 2022Code Agency Revenue Object Title Actual Projection Projection Projection Projection Projection
MISCELLANEOUS
0638 Department of Health Animal Control Dog License Fees 53 53 53 53 53 53
1610 D.C. Public Library Misc Revenue (Parking and Vending) 35 35 35 35 35 35
2002 Dept. of Housing and Comm. Development Appr HPAP Repay 1,278 1,278 1,278 1,278 1,278 1,278
2538 D.C. Public Library Library Book Fines 101 101 101 101 101 101
2582 D.C. Public Library Copy Machine Revenue - - - - - -
3317 Department of Transportation Child Safety Seat Program 6 6 6 6 6 6
3318 Department of Transportation Citizen Light and Traffic Control Project 5 5 5 5 5 5
3450 Dept. of Housing and Comm. Development Employers Assistance Housing Program 52 52 52 52 52 52
5300 Office of the Chief Financial Officer Pay-In-Lieu-Tax Private 15,957 16,276 16,602 16,934 17,272 17,618
5600 Dept. of Housing and Comm. Development Interest Income 0 0 0 0 0 0
5600 Deputy Mayor for Planning and Econ Dev Interest Income 0 0 0 0 0 0
5600 Medical Liability Captive Ins Agency Interest Income 27 27 27 27 27 27
5600 Office of the Chief Financial Officer Interest Income 5,341 5,383 5,431 5,479 5,529 5,529
5600 Statehood Initiative Agency Interest Income 1 1 1 1 1 1
5701 Office of the Chief Financial Officer Unclaimed Property National Audit 01 23,178 15,000 15,000 15,000 15,000 15,000
6100 Metropolitan Police Department Surplus Vehicle Revenue 731 731 731 731 731 731
6101 Metropolitan Police Department Subrogation Revenue 344 344 344 344 344 344
6101 Office of Planning Planning Map Sales 1 1 1 1 1 1
6101 Office of Risk Management Subrogation Revenue 158 158 158 158 158 158
6103 Advisory Neighborhood Commissions Reimbursements (0) (0) (0) (0) (0) (0)
6103 Office of Contracting and Procurement Reimbursements 27 27 27 27 27 27
6103 Office of the Chief Technology Officer Reimbursements 108 108 108 108 108 108
6105 Department of Transportation Other Revenue - Freedom of Information 75 75 75 75 75 75
6106 Child and Family Services Agency Other Revenues - - - - - -
6106 Commission on Arts and Humanities Other Revenues - - - - - -
6106 Depart of Insurance, Securities and Banking Service Fees 2 2 2 2 2 2
6106 Department of Corrections Other Revenues 150 150 150 150 150 150
6106 Department of Forensics Sciences Other Revenues - - - - - -
6106 Dept. of Consumer and Regulatory Affairs Other Revenue 48 48 48 48 48 48
6106 Fire and Emergency Medical Services Other Revenues 590 590 590 590 590 590
6106 Metropolitan Police Department Other Revenues 18 18 18 18 18 18
6106 Office of Administrative Hearings Other Revenues 8 8 8 8 8 8
6106 Office of Planning Other Revenues 0 0 0 0 0 0
6106 Office of the Attorney General Other/ Revenue 7,533 7,533 7,533 7,533 7,533 7,533
6106 Office of the Chief Financial Officer Other Revenues 3,165 3,165 3,165 3,165 3,165 3,165
6106 Office of the Chief Medical Examiner Other Revenues 280 280 280 280 280 280
6106 Office of the Mayor Other Revenues - - - - - -
6106 Office of Victim Svcs and Justice Grants Other Revenues 0 0 0 0 0 0
6106 Office of Zoning Other Revenues 1,569 1,569 1,569 1,569 1,569 1,569
6106 Repayment of Loans and Interest Other Revenues 5,479 5,479 5,479 5,479 5,479 5,479
(Continued on next page)

FY 2019 Proposed Budget and Financial Plan Revenue
3-33
Table 3-15 (Continued)General Purpose Non-Tax Revenue by Source, Fiscal Years 2017-2022(Dollars in Thousands)AgencyObject FY 2017 FY 2018 FY 2019 FY 2020 FY 2021 FY 2022Code Agency Revenue Object Title Actual Projection Projection Projection Projection Projection
MISCELLANEOUS (Continued)
6107 Department of Public Works Other Revenue - Fleet Auto Auction 1,305 1,305 1,305 1,305 1,305 1,305
6107 Dept. of Consumer and Regulatory Affairs Civil Infraction Fees 925 925 925 925 925 925
6107 Public Service Commission Civil Infractions/Fines 17 17 17 17 17 17
6111 Board of Elections Other Revenue - Other 3 3 3 3 3 3
6111 CFRReclass - Office of Adm Hearing Other Revenue - Other 2 2 2 2 2 2
6111 Council of the District of Columbia Other Revenue - Other 0 0 0 0 0 0
6111 D.C. Public Library Other Revenue - Other (0) (0) (0) (0) (0) (0)
6111 Department of Employment Services Other Revenue - Other 1 1 1 1 1 1
6111 Department of Energy and Environment Other Revenue 1 1 1 1 1 1
6111 Department of General Services Other Revenue - Other 3,352 3,352 3,352 3,352 3,352 3,352
6111 Department of Motor Vehicles Other Revenue 1 1 1 1 1 1
6111 Department of Public Works Other Revenue (29) (29) (29) (29) (29) (29)
6111 Department of Transportation Other Revenue 1 1 1 1 1 1
6111 Dept of Small and Local Business Development Other Revenue - Other 300 300 300 300 300 300
6111 Dept. of Housing and Comm. Development Appr Hpap Repay (0) (0) (0) (0) (0) (0)
6111 Deputy Mayor for Planning and Econ Dev Other Revenue - Other 3,284 3,284 3,284 3,284 3,284 3,284
6111 District of Columbia Public Schools Other Revenue - Other - - - - - -
6111 Employees' Compensation Fund Other Revenue - Other - - - - - -
6111 Mass Transit Subsidies Other Revenue - Other - - - - - -
6111 Office of Campaign Finance Other Revenue - Other 30 30 30 30 30 30
6111 Office of Contracting and Procurement Other Revenue - Other 2,044 2,044 2,044 2,044 2,044 2,044
6111 Office of Finance and Resource Mgmt Other Revenue - Other 3 3 3 3 3 3
6111 Office of Risk Management Other Revenue - Other 23 23 23 23 23 23
6111 Office of the Attorney General Other Revenue - Other 1 1 1 1 1 1
6111 Office of the Chief Financial Officer Other Revenue - Other 43,900 29,405 30,896 31,091 30,626 31,474
6111 Office of the Chief Technology Officer Other Revenue-Other - - - - - -
6111 Office of the Inspector General Other Revenue - Other 98 98 98 98 98 98
6111 Office of the Mayor Other Revenue - Other 0 0 0 0 0 0
6111 Office on Aging Other Revenue - Other 1 1 1 1 1 1
6112 Department of Energy and Environment Ddoe Freedom of Information 3 3 3 3 3 3
6118 Various Prior Year Cost Recovery 23,003
6201 Department of Health AFDC/TANFCollections-IV-D - - - - - -
6321 Department of Health Food Hand lers Certification 426 426 426 426 426 426
6955 Department of Human Services Miscellaneous Revenue 1,135 1,135 1,135 1,135 1,135 1,135
6955 Department on Disability Services Miscellaneous Revenue 52 52 52 52 52 52
6955 Office of Disability Rights Misc. Revenue and Donation 0 0 0 0 0 0
9004 D.C. Public Library Inter Library Loan Fees 0 0 0 0 0 0
9005 Department of Motor Vehicles Other Revenue - Dishonored Check Fees 2 2 2 2 2 2
9006 Office of the Chief Financial Officer Other Revenue - Recorder of Deeds Surchg 7 7 7 7 7 7
9106 Office of the Chief Financial Officer Other Revenue - RAA Assessments Fees 0 0 0 0 0 0
Total Miscellaneous 146,208 100,893 101,290 100,471 100,394 101,588
(Continued on next page)

Revenue FY 2019 Proposed Budget and Financial Plan
3-34
Table 3-15 (Continued)General Purpose Non-Tax Revenue by Source, Fiscal Years 2017-2022(Dollars in Thousands)AgencyObject FY 2017 FY 2018 FY 2019 FY 2020 FY 2021 FY 2022Code Agency Revenue Object Title Actual Projection Projection Projection Projection Projection
CHARGES FOR SERVICES
3200 Public Service Commission Teleco Registration 1 1 1 1 1 1
3201 Dept. of Consumer and Regulatory Affairs Home Occupation License 92 92 92 92 92 92
3202 Dept. of Consumer and Regulatory Affairs Boiler Inspection Permit 68 68 68 68 68 68
3203 Department of Motor Vehicles Expedited Service Fees 15 15 15 15 15 15
3203 Dept. of Consumer and Regulatory Affairs Welding Certificate 5 5 5 5 5 5
3204 Dept. of Consumer and Regulatory Affairs Elevator Inspection License 763 763 763 763 763 763
3206 Dept. of Consumer and Regulatory Affairs Commission Certificate 0 0 0 0 0 0
3206 Metropolitan Police Department Fingerprints, Photos 490 490 490 490 490 490
3207 Department of Corrections Other Service Charges 5 5 5 5 5 5
3207 Department of Motor Vehicles Reinstatement/ Insurance Lapse Fees 1,481 1,481 1,450 1,481 1,481 1,481
3208 Department of for-Hire Vehicles Copy of Reports et al 5 5 5 5 5 5
3208 Department of Motor Vehicles Reproduction of Reports 4,138 4,138 3,800 4,000 4,000 4,000
3208 Department of Transportation Reproduction of Reports - - - - - -
3208 Dept. of Consumer and Regulatory Affairs Reproduction of Reports 42 42 42 42 42 42
3208 Metropolitan Police Department Reproduction of Reports 79 79 79 79 79 79
3208 Office of the Tenant Advocate Reproduction of Reports 0 0 0 0 0 0
3209 Dept. of Consumer and Regulatory Affairs FOIA for DCRA 0 0 0 0 0 0
3209 Fire and Emergency Medical Services Emergency Ambulance 24,602 25,310 25,055 25,055 25,055 24,950
3210 Metropolitan Police Department Transcription of Records 219 219 219 219 219 219
3211 Metropolitan Police Department Firearm User Fee 80 80 80 80 80 80
3214 Department of Motor Vehicles Motor Vehicle Inspection - RSC 1258 (0) (0) (0) (0) (0) (0)
3215 Department of Motor Vehicles Motor Vehicle Titles - RSC 1259 2,343 2,343 2,343 2,343 2,343 2,316
3216 Department of Motor Vehicles Inspection Late Fee (0) (0) (0) (0) (0) (0)
3217 Department of Motor Vehicles Re-Inspection Fee 0 0 0 0 0 0
3219 Department of Motor Vehicles Courtesy Sticker Fee 0 0 0 0 0 0
3219 Dept. of Consumer and Regulatory Affairs Wharves and Markets 900 500 500 500 500 500
3220 Dept. of Consumer and Regulatory Affairs Surveyor Fees 507 507 507 507 507 507
3221 Department of Motor Vehicles Recordation Fee - RSC 1275 634 634 634 634 634 634
3221 Office of the Chief Financial Officer Deed Recordation Fee 6,661 6,661 6,400 6,500 6,500 6,500
3222 Dept. of Consumer and Regulatory Affairs Corporate Recordation Fee 15,073 15,000 12,000 12,500 12,000 12,500
3223 Department of General Services Parking Permits and Fees 2,777 2,777 2,400 2,500 2,500 2,500
3223 Department of Motor Vehicles Residential Parking Permits and Fees 4,840 4,840 4,500 4,571 4,626 4,550
3228 Dept. of Consumer and Regulatory Affairs Condo/Coop Registration Fee 0 0 0 0 0 0
3230 Department of Health Health Facility Fee 191 191 191 191 191 191
3232 Dept. of Consumer and Regulatory Affairs Re-Review Fees - - - - - -
3234 D.C. Public Library Other Charges for Services - Other 4 4 4 4 4 4
3234 Department of Motor Vehicles Other Charges for Services 330 330 330 330 330 330
3234 Department of Transportation Other Services as Charged - - - - - -
3234 Dept. of Consumer and Regulatory Affairs Other Charges for Services - Other 70 70 70 70 70 70
3234 Deputy Mayor for Education Other Charges for Services 50 50 50 50 50 50
3234 Office of the Tenant Advocate Other Charges for Services - Other 705 698 705 705 705 705
(Continued on next page)

FY 2019 Proposed Budget and Financial Plan Revenue
3-35
Table 3-15 (Continued)General Purpose Non-Tax Revenue by Source, Fiscal Years 2017-2022(Dollars in Thousands)AgencyObject FY 2017 FY 2018 FY 2019 FY 2020 FY 2021 FY 2022Code Agency Revenue Object Title Actual Projection Projection Projection Projection Projection
CHARGES FOR SERVICES
3234 State Superintendent of Education (OSSE) Other Charges for Services - Other - - - - - -
3235 Department of Transportation Lost Nextel DDOT 4 4 4 4 4 4
3235 Dept. of Consumer and Regulatory Affairs Special Purpose Revenues (0) (0) (0) (0) (0) (0)
3236 Dept. of Consumer and Regulatory Affairs Re-Inspection Fees 20 20 20 20 20 20
3237 Department of Motor Vehicles Business - Insurance Lapse Fee 7 7 7 7 7 7
3240 Dept. of Consumer and Regulatory Affairs Suppression Systems for Hoods and Ducts 12 12 12 12 12 12
3241 Dept. of Consumer and Regulatory Affairs Modification and Variance Requests 56 56 55 56 56 56
3242 Dept. of Consumer and Regulatory Affairs Designation of a New Address 11 11 11 11 11 11
3246 Dept. of Consumer and Regulatory Affairs Building Plats(Up To 3 Usual Shaped Lots 117 117 117 117 117 117
3247 Dept. of Consumer and Regulatory Affairs Registration of Land Surveyors-Renewal 0 0 0 0 0 0
3248 Dept. of Consumer and Regulatory Affairs Registration of Land Surveyors-Applicant 0 0 0 0 0 0
3249 Dept. of Consumer and Regulatory Affairs Street and Alley Closing or Revisions 35 35 35 35 35 35
3250 Dept. of Consumer and Regulatory Affairs Subdiv of Land Plats (> 3 Usual Lots) 181 181 181 181 181 181
3251 Dept. of Consumer and Regulatory Affairs Private Surveyor Plan-Filing Wall Exam 52 52 52 52 52 52
3251 Office of the Chief Financial Officer Tax Certificates 236 236 236 236 236 236
3253 Dept. of Consumer and Regulatory Affairs Opt. Surveyors Prelim RVW-District SVYR - - - - - -
3254 Dept. of Consumer and Regulatory Affairs Optional Expedited Building Plats 18 18 18 18 18 18
3255 Dept. of Consumer and Regulatory Affairs Optional Electronic Building Plats 4 4 4 4 4 4
3258 Dept. of Consumer and Regulatory Affairs Certificate of Inclusionary Zoning 16 16 16 16 16 16
3259 Dept. of Consumer and Regulatory Affairs EISF Review Fees 277 286 275 277 277 277
3281 Fire and Emergency Medical Services FEMS Nontax - General 102 102 102 102 102 102
3282 Fire and Emergency Medical Services FEMS Nontax - FPD Permit - Hazard 234 234 234 234 234 230
3283 Fire and Emergency Medical Services FEMS Nontax - FPD Permit - Pub. Assembly 56 56 56 56 56 56
3291 Fire and Emergency Medical Services FEMS SPR- Training 1 1 1 1 1 1
3293 Fire and Emergency Medical Services FEMS SPR - Special Events - General 17 17 17 17 17 17
3294 Fire and Emergency Medical Services FEMS SPR- FPDFire Watch 18 18 18 18 18 18
3295 Fire and Emergency Medical Services FEMS SPR - FPDEvacuation Review (15) (15) (15) (15) (15) (15)
3296 Fire and Emergency Medical Services FEMS SPR- FPD Apparatus Use 1 1 1 1 1 1
3320 Department of General Services Rentals - Other 12,710 13,180 13,150 13,400 13,600 13,700
3400 Department of Transportation Parking Meters - RSC 1256 4 4 4 4 4 4
9012 D.C. Public Library Bookstore - On Line Sales 28 28 28 28 28 28
9120 Department of Behavioral Health Patient Revenues-Medicare and 3rd Party - - - - - -
9204 Department of Behavioral Health Medical Record Fees 1 1 1 1 1 1
9214 Department of Motor Vehicles Motor Vehicle Inspection-Rev Refund (0) (0) (0) (0) (0) (0)
9215 Department of Motor Vehicles Motor Vehicle Titles - Rev Refund (0) (0) (0) (0) (0) (0)
Total Charges for Services 81,371 82,079 77,443 78,697 78,452 78,840
Remark: 1) Actual revenue for agencies with corresponding revenue object titles starting or containing "other revenue" may include other one-time minor revenue revenues such as a refund of an overpayment. 2) Numbers are rounded to the nearest whole dollar. total sum of each revenue category may slightly differ from the sum of the individual revenue items due to the exclusion of negative revenues or adjustments.

Page intentionally left blank

FY 2019 Proposed Budget and Financial Plan Revenue
3-37
Table 3-16: Dedicated Tax Fund Revenue
Table 3-16, which follows, reports the certified revenues and fund balance use for the District’s Dedicated Tax
funds. The revenues reported in this table are those Office of Revenue Analysis (ORA) projections based on
current law. They do not include any policy proposals affecting revenues or fund balances included in this
FY 2019 Proposed Budget and Financial Plan. Any such policy changes are reported earlier in this chapter in
Table 3-12 (Policy Proposals Impacting General Fund Revenues).
The first column in Table 3-16 reports each fund’s available fund balance at the end of FY 2017. Certain
funds, by legislation, can retain and carry over to succeeding fiscal years revenue received during the fiscal
year that exceeds the fund’s expenditures. This retained fund balance is an available resource for those funds
in future fiscal years. In the case of other funds, the legislation that created the fund did not specify that the
fund could retain its revenue. Therefore, at the end of the fiscal year, that excess revenue is transferred to the
Local fund. The amounts shown in the “FY 2017 End of Year Fund Balance” column were calculated by the
Office of Financial Operations and Systems (OFOS) during the preparation of the District’s Fiscal Year 2017
Comprehensive Annual Financial Report (CAFR).
The next three columns show, for FY 2018, projected revenue under current law and fund balance use by
fund. The “Certified Resources” column is the total of the “Certified Revenues” and the “Certified Fund
Balance Use Columns.”
The next three columns of the table report, for FY 2019, projected revenue under current law, projected
fund balance use by fund, and total certified resources.
The final three columns report the amount of projected revenue under current law for FY 2020, FY 2021,
and FY 2022. Fund balance use is not projected over this three-year period due to the uncertainty of the amount
of available fund balances that far into the future.
For each fund, the table reports the tax revenue source(s) from which the dedication is made.
The Dedicated Tax funds in Table 3-16 are divided into two sections. Those Dedicated Tax funds that are
part of General Fund revenue are reported in the first section of the table. These funds are categorized in the
District’s accounting system within Appropriated Fund 0110 (Dedicated Taxes). The second section of the
table includes three Dedicated Tax funds that are categorized within Appropriated Fund 0610 (Enterprise and
Other Funds – Dedicated Tax).
Table 3-16A presents actual revenues and end-of-fiscal year available fund balances information for FY
2016 and FY 2017 for the Dedicated Tax funds.
A July 2017 D.C. Office of Revenue Analysis report (District of Columbia Dedicated Taxes Report)
describes in some detail the Dedicated Tax funds listed in Table 3-16. It is available under “Studies” in the
“Reports” section of the Office of the Chief Financial Officer web site:
https://cfo.dc.gov/sites/default/files/dc/sites/ocfo/publication/attachments/Dedicated%20Taxes%20Report
%202017.pdf

Revenue FY 2019 Proposed Budget and Financial Plan
3-38
Tabl
e 3-
16De
dica
ted
Tax
Reve
nue
Fund
s by
Sou
rce
of R
even
ue, F
isca
l Yea
rs 2
018-
2022
FY 2
017
End
ofFY
201
8 FY
201
8FY
201
8 FY
201
9 FY
201
9FY
201
9 FY
202
0FY
202
1FY
202
2Ye
ar F
und
Certi
fied
Certi
fied
Fund
Ce
rtifie
dCe
rtifie
dCe
rtifie
d Fu
ndCe
rtifie
dCe
rtifie
dCe
rtifie
dCe
rtifie
dBa
lanc
eRe
venu
esBa
lanc
e Us
eRe
sour
ces
Reve
nues
Bala
nce
Use
Reso
urce
sRe
venu
esRe
venu
esRe
venu
es
TOTA
L DE
DICA
TED
TAX
REVE
NUE
375,
872,
627
582,
173,
147
14,6
17,4
26
596,
790,
573
593,
252,
533
535,
932
593,
788,
465
626,
551,
401
654,
891,
105
654,
097,
057
Wes
t End
Lib
rary
/ Fi
reho
use
Mai
nten
ance
Fu
nd (A
M0
2225
)87
,988
2,
390,
641
0 2,
390,
641
1,35
0,03
8 0
1,35
0,03
8 25
9,51
9 19
9,21
4 20
5,19
0 De
ed R
ecor
datio
n Ta
x1,
195,
321
675,
019
129,
760
99,6
07
102,
595
Deed
Tran
sfer
Tax
1,19
5,32
1 67
5,01
9 12
9,76
0 99
,607
10
2,59
5
Repa
ymen
t of R
even
ue B
onds
(DT0
011
0)0
7,83
2,38
9 0
7,83
2,38
9 7,
838,
539
0 7,
838,
539
7,83
9,03
9 7,
836,
089
7,83
7,33
9 De
ed R
ecor
datio
n Ta
x5,
589,
373
5,59
3,76
2 5,
594,
119
5,59
2,01
4 5,
592,
906
Deed
Tran
sfer
Tax
2,24
3,01
6 2,
244,
777
2,24
4,92
0 2,
244,
075
2,24
4,43
3
Conv
entio
n Ce
nter
Fun
d (E
Z0 0
110)
0 14
9,19
5,95
3 0
149,
195,
953
155,
543,
045
0 15
5,54
3,04
5 16
2,08
9,94
3 17
0,20
1,17
7 17
5,30
7,19
7 Sa
les T
ax14
9,19
5,95
3 15
5,54
3,04
5 16
2,08
9,94
3 17
0,20
1,17
7 17
5,30
7,19
7
Heal
thy
Scho
ols
Fund
(GD0
011
1)3,
251,
683
4,66
6,00
0 2,
841,
918
7,50
7,91
8 4,
266,
000
409,
765
4,67
5,76
5 4,
266,
000
4,26
6,00
0 4,
266,
000
Sale
s Tax
4,66
6,00
0 4,
266,
000
4,26
6,00
0 4,
266,
000
4,26
6,00
0
Nur
sing
Fac
ility
Qua
lity
of C
are
Fund
(HT0
011
0)4,
035,
269
14,2
82,5
27
645,
575
14,9
28,1
02
14,9
16,6
62
3,85
0 14
,920
,512
15
,214
,995
15
,519
,295
15
,829
,681
He
alth
care
Pro
vider
Tax
14,2
82,5
27
14,9
16,6
62
15,2
14,9
95
15,5
19,2
95
15,8
29,6
81
Heal
thy
DC F
und
(HT0
011
1)2,
033,
267
46,2
75,8
83
2,03
3,26
7 48
,309
,150
47
,131
,612
0
47,1
31,6
12
48,0
74,2
44
49,0
35,7
29
50,0
16,4
44
Sale
s Tax
808,
442
808,
442
824,
611
841,
103
857,
925
Insu
ranc
e Pr
emiu
ms T
ax45
,467
,441
46
,323
,170
47
,249
,634
48
,194
,626
49
,158
,519
Stev
ie S
ello
ws
Qual
ity Im
prov
emen
t Fun
d (H
T0 0
112)
4,19
6 4,
917,
926
4,19
64,
922,
122
5,47
9,09
4 0
5,47
9,09
4 5,
479,
094
5,47
9,09
4 5,
479,
094
ICF-
IDD
Asse
ssm
ent
4,91
7,92
6 5,
479,
094
5,47
9,09
4 5,
479,
094
5,47
9,09
4
Hosp
ital F
und
(HT0
011
4)0
8,80
0,00
0 0
8,80
0,00
0 0
0 0
0 0
0 M
edica
id H
ospi
tal I
npat
ient
Fee
8,80
0,00
0 -
-
-
-
Hosp
ital P
rovi
der F
ee F
und
(HT0
011
5)20
4,26
1 6,
019,
415
0 6,
019,
415
0 0
0 0
0 0
Med
icaid
Hos
pita
l Out
patie
nt Fe
e6,
019,
415
-
-
-
-
(Con
tinue
d on
nex
t pag
e)

FY 2019 Proposed Budget and Financial Plan Revenue
3-39
Tabl
e 3-
16 (C
ontin
ued)
Dedi
cate
d Ta
x Re
venu
e Fu
nds
by S
ourc
e of
Rev
enue
, Fis
cal Y
ears
201
8-20
22FY
201
7En
d of
FY 2
018
FY 2
018
FY 2
018
FY 2
019
FY 2
019
FY 2
019
FY 2
020
FY 2
021
FY 2
022
Year
Fun
dCe
rtifie
dCe
rtifie
d Fu
nd
Certi
fied
Certi
fied
Certi
fied
Fund
Certi
fied
Certi
fied
Certi
fied
Certi
fied
Bala
nce
Reve
nues
Bala
nce
Use
Reso
urce
sRe
venu
esBa
lanc
e Us
eRe
sour
ces
Reve
nues
Reve
nues
Reve
nues
WM
ATA
(KE0
011
0)9,
493,
645
76,7
21,6
62
9,09
2,47
0 85
,814
,132
79
,988
,745
0
79,9
88,7
45
83,3
58,6
75
87,5
33,8
26
90,1
62,0
83
Sale
s Tax
(par
king)
76,7
21,6
62
79,9
88,7
45
83,3
58,6
75
87,5
33,8
26
90,1
62,0
83
WM
ATA
(KE0
011
1)0
24,1
75,0
00
0 24
,175
,000
24
,175
,000
0
24,1
75,0
00
24,1
75,0
00
24,1
75,0
00
24,1
75,0
00
Sale
s Tax
24,1
75,0
00
24,1
75,0
00
24,1
75,0
00
24,1
75,0
00
24,1
75,0
00
High
way
Tru
st F
und
(KZ0
011
0)0
25,7
60,7
00
0 25
,760
,700
25
,425
,811
0
25,4
25,8
11
25,0
95,2
75
24,7
69,0
37
24,4
47,0
39
Mot
or Fu
el Ta
x25
,760
,700
25
,425
,811
25
,095
,275
24
,769
,037
24
,447
,039
ABRA
(LQ0
011
0)12
2,31
7 1,
170,
000
0 1,
170,
000
1,17
0,00
0 12
2,31
7 1,
292,
317
1,17
0,00
0 1,
170,
000
1,17
0,00
0 Sa
les T
ax1,
170,
000
1,17
0,00
0 1,
170,
000
1,17
0,00
0 1,
170,
000
Sub
Tota
l - G
ENER
AL F
UND
19,2
32,6
27
372,
208,
095
14,6
17,4
26
386,
825,
521
367,
284,
546
535,
932
367,
820,
478
377,
021,
785
390,
184,
462
398,
895,
067
Ballp
ark
Fund
(BK0
061
0)0
60,6
32,0
00
0 60
,632
,000
60
,855
,000
0
60,8
55,0
00
61,0
77,0
00
61,3
01,0
00
61,5
32,7
31
Sale
s Tax
15,9
00,0
00
15,9
00,0
00
15,9
00,0
00
15,9
00,0
00
15,9
00,0
00
Publ
ic Ut
ility T
ax8,
268,
000
8,35
1,00
0 8,
434,
000
8,51
8,00
0 8,
602,
837
Toll
Tele
com
mun
icatio
ns Ta
x2,
564,
000
2,70
4,00
0 2,
843,
000
2,98
3,00
0 3,
129,
894
Ballp
ark F
ee33
,900
,000
33
,900
,000
33
,900
,000
33
,900
,000
33
,900
,000
Hous
ing
Prod
uctio
n Tr
ust F
und
(UZ0
061
0)23
6,98
8,00
0 59
,812
,074
0
59,8
12,0
74
60,6
64,9
21
0 60
,664
,921
63
,025
,370
65
,386
,868
67
,741
,299
De
ed R
ecor
datio
n Ta
x32
,975
,542
33
,553
,447
34
,887
,334
36
,221
,283
37
,549
,368
De
ed Tr
ansf
er Ta
x26
,836
,532
27
,111
,474
28
,138
,036
29
,165
,585
30
,191
,931
Tax
Incr
emen
t Fin
anci
ng/P
ILOT
(TX0
/TY0
061
0)11
9,65
2,00
0 89
,520
,978
0
89,5
20,9
78
104,
448,
066
0 10
4,44
8,06
6 12
5,42
7,24
6 13
8,01
8,77
5 12
5,92
7,96
0 Re
al P
rope
rty Ta
x44
,032
,685
49
,335
,751
63
,559
,397
68
,743
,867
59
,399
,236
Sa
les T
ax45
,488
,293
55
,112
,315
61
,867
,849
69
,274
,908
66
,528
,724
Sub
Tota
l - E
NTE
RPRI
SE F
UND
356,
640,
000
209,
965,
052
0 20
9,96
5,05
2 22
5,96
7,98
7 0
225,
967,
987
249,
529,
616
264,
706,
643
255,
201,
990

Revenue FY 2019 Proposed Budget and Financial Plan
3-40
Table 3-16A
Dedicated Tax Revenue Funds, Revenues and Fund Balances, Fiscal Years 2016 and 2017
FY 2016 FY 2017FY 2016 End of FY 2017 End ofActual Year Fund Actual Year Fund
Revenue Balance Revenue Balance
TOTAL DEDICATED TAX REVENUE 501,561,620 424,516,402 527,832,393 375,872,627
West End Library / Firehouse Maintenance Fund (AM0 2225) 0 0 87,988 87,988
Deed Recordation Tax 0 43,994
Deed Transfer Tax 0 43,994
Repayment of Revenue Bonds (DT0 0110) 7,822,389 0 7,825,339 0
Deed Recordation Tax 6,711,537 5,603,138
Deed Transfer Tax 1,110,852 2,222,200
Convention Center Fund (EZ0 0110) 123,551,109 0 138,128,188 0
Sales Tax 123,551,109 138,128,188
Healthy Schools Fund (GD0 0111) 4,266,000 3,582,225 4,266,000 3,251,683
Sales Tax 4,266,000 4,266,000
Nursing Facility Quality of Care Fund (HT0 0110) 17,013,798 2,796,798 13,949,205 4,035,269
Healthcare Provider Tax 17,013,798 13,949,205
Healthy DC Fund (HT0 0111) 45,082,529 13,063,591 46,302,923 2,033,267
Sales Tax (Medical Marijuana) 477,372 835,482
Insurance Premiums Tax 44,605,157 45,467,441
Stevie Sellows Quality Improvement Fund (HT0 0112) 4,859,741 4,196 4,912,684 4,196
ICF-IDD Assessment 4,859,741 4,912,684
Hospital Fund (HT0 0114) 10,400,000 0 10,400,000 0
Medicaid Hospital Inpatient Fee 10,400,000 10,400,000
Hospital Provider Fee Fund (HT0 0115) 6,406,221 150,000 5,528,182 204,261
Medicaid Hospital Outpatient Fee 6,406,221 5,528,182
WMATA (KE0 0110) 72,354,875 9,755,593 74,167,134 9,493,645
Sales Tax (Parking) 72,354,875 74,167,134
(Continued on next page)

FY 2019 Proposed Budget and Financial Plan Revenue
3-41
Table 3-16A (Continued)
Dedicated Tax Revenue Funds, Revenues and Fund Balances, Fiscal Years 2016 and 2017
FY 2016 FY 2017FY 2016 End of FY 2017 End ofActual Year Fund Actual Year Fund
Revenue Balance Revenue Balance
Highway Trust Fund (KZ0 0110) 25,332,460 0 26,098,974 0
Motor Fuel Tax 25,332,460 26,098,974
ABRA (LQ0 0110) 1,170,000 0 1,170,000 122,317
Sales Tax 1,170,000 1,170,000
Sub Total - GENERAL FUND 318,259,121 29,352,402 332,836,616 19,232,627
Ballpark Fund (BK0 0610) 59,574,356 0 59,293,567 0
Sales Tax 16,419,551 17,764,413
Public Utility Tax 8,105,243 7,938,334
Toll Telecommunications Tax 2,285,617 2,483,687
Ballpark Fee 32,763,945 31,107,133
Housing Production Trust Fund (UZ0 0610) 55,877,916 250,311,000 58,013,719 236,988,000
Deed Recordation Tax 30,792,707 31,918,760
Deed Transfer Tax 25,085,210 26,094,959
Tax Increment Financing Program (TX0 0610) 51,048,950 52,647,000 51,862,385 48,711,000
Real Property Tax 17,086,202 19,760,420
Sales Tax 33,962,748 32,101,965
PILOT (TY0 0610) 16,801,276 92,206,000 25,826,105 70,941,000
Real Property Tax 16,801,276 25,826,105
Sub Total - ENTERPRISE FUND 183,302,499 395,164,000 194,995,777 356,640,000

Revenue FY 2019 Proposed Budget and Financial Plan
3-42
Table 3-17: Special Purpose (O-type) Revenue Funds
Table 3-17, which follows, reports the certified revenues and fund balance use for the District’s Special
Purpose (O-type) Revenue funds. The revenues reported in this table are District agency projections based on
current law. They do not include any policy proposals affecting revenues or fund balances included in this
FY 2019 Proposed Budget and Financial Plan. Any such policy changes are reported earlier in this chapter in
Table 3-12 (Policy Proposals Impacting General Fund Revenues).
The first column in Table 3-17 reports each fund’s available fund balance at the end of FY 2017. Certain
funds, by legislation, can retain and carry over to succeeding fiscal years revenue received during the fiscal
year that exceeds the fund’s expenditures. This retained fund balance is an available resource for those funds
in future fiscal years. In the case of other funds, the legislation that created the fund did not specify that the
fund could retain its revenue. Therefore, at the end of the fiscal year, that excess revenue is transferred to the
Local fund. The amounts shown in the “FY 2017 End of Year Fund Balance” column were calculated by the
Office of Financial Operations and Systems (OFOS) during the preparation of the District’s Fiscal Year 2017
Comprehensive Annual Financial Report (CAFR).
The next three columns show, for FY 2018, projected revenue under current law and fund balance use by
fund. The “Certified Resources” column is the total of the “Certified Revenues” and the “Certified Fund
Balance Use Columns.” The total certified resources column does not account for any legislated revenue
transfers from the fund.
The next three columns of the table report, for FY 2019, projected revenue under current law, projected
fund balance use by fund, and total certified resources.
The final three columns report the amount of projected revenue under current law for FY 2020, FY 2021,
and FY 2022. Fund balance use is not projected over this three-year period due to the uncertainty of the amount
of available fund balances that far into the future.
Table 3-17A presents actual revenues and end-of-fiscal year available fund balances information for
FY 2016 and FY 2017 for the District’s Special Purpose Revenue funds. The table also identifies whether the
fund is lapsing or non-lapsing. For the non-lapsing funds, the “Classification” column indicates whether the
fund balance is Committed or Restricted. This classification is based on Statement No. 54 of the Governmental
Accounting Standards Board (GASB): “The restricted fund balance category includes amounts that can be
spent only for the specific purposes stipulated by constitution, external resource providers, or through enabling
legislation. The committed fund balance classification includes amounts that can be used only for the specific
purposes determined by a formal action of the government’s highest level of decision-making authority.”
A February 2015 D.C. Office of Revenue Analysis report (District of Columbia Special Purpose Revenue
Funds Report) describes in some detail the Special Purpose Revenue funds listed in Table 3-17. It is available
under “Studies” in the “Reports” section of the Office of the Chief Financial Officer web site:
http://cfo.dc.gov/sites/default/files/dc/sites/ocfo/publication/attachments/Special-Purpose%20Report%202
015.pdf.
An update to the February 2015 report is currently being prepared and will be posted on the Office of the
Chief Financial Officer web site upon its completion.

FY
2019 P
roposed
Budget an
d F
inan
cial Plan
Rev
enue
3-43
Table 3-17Special Purpose (O-type) Fund Revenue, by Fund, Fiscal Years 2018-2022
FY 2017
End of FY 2018 FY 2018 FY 2018 FY 2019 FY 2019 FY 2019 FY 2020 FY 2021 FY 2022
Year Fund Certified Certified Fund Certified Certified Certified Fund Certified Certified Certified Certified
Balance Revenues Balance Use Resources Revenues Balance Use Resources Revenues Revenues RevenuesA. Governmental Direction and Support
Council of the District of Columbia (AB0) 2,865 0 0 0 0 0 0 0 0 0 0629 Council Reimbursement Fund 2,865 0 0 0 0 0 0 0 0 0
Office of the City Administrator (AE0) 0 280,000 0 280,000 550,000 0 550,000 250,000 250,000 250,000 0602 Independent Agencies 0 30,000 0 30,000 300,000 0 300,000 0 0 0 1243 Public-Private Partnership Administration Fund 0 250,000 0 250,000 250,000 0 250,000 250,000 250,000 250,000
D.C. Board of Ethics and Government Accountability (AG0) 194,561 120,000 30,000 150,000 122,652 30,000 152,652 120,000 120,000 120,000 0601 Board of Ethics and Accountability Fund (Fines) 89,454 30,000 30,000 60,000 30,000 30,000 60,000 30,000 30,000 30,000 0602 Lobbying Registration Fee Fund 105,107 90,000 0 90,000 92,652 0 92,652 90,000 90,000 90,000
Department of General Services (AM0) 630,420 8,242,303 630,420 8,872,724 8,376,988 0 8,376,988 8,332,710 8,332,710 8,332,710 1150 Utility Payments for Non-D.C. Agencies 0 4,080,298 0 4,080,298 4,166,794 0 4,166,794 4,166,794 4,166,794 4,166,794 1440 RFK & D.C. Armory Maintenance Fund 0 3,064,183 0 3,064,183 2,837,133 0 2,837,133 2,806,297 2,806,297 2,806,297 1460 Eastern Market Enterprise Fund 630,420 990,000 630,420 1,620,420 1,088,061 0 1,088,061 1,074,619 1,074,619 1,074,619 1500 Facilities Service Request Fund 0 107,823 0 107,823 285,000 0 285,000 285,000 285,000 285,000
Office of Finance and Resource Management (AS0) 0 442,218 0 442,218 472,147 0 472,147 472,147 472,147 472,147 1150 Utilities Payment for Non-D.C. Agencies 0 442,218 0 442,218 472,147 0 472,147 472,147 472,147 472,147
Office of the Chief Financial Officer (AT0) 28,378,439 44,172,839 9,619 44,182,458 44,792,771 785,922 45,578,693 45,046,277 45,174,608 45,313,206 0602 Payroll Service Fees 0 363,388 0 363,388 365,000 0 365,000 365,000 365,000 365,000 0603 Service Contracts 0 1,200,000 0 1,200,000 1,200,000 0 1,200,000 1,200,000 1,200,000 1,200,000 0605 Dishonored Check Fees 0 110,742 0 110,742 34,000 0 34,000 34,000 34,000 34,000 0606 Recorder of Deeds Surcharge 1,756,995 1,375,292 9,619 1,384,911 1,485,315 785,922 2,271,237 1,604,141 1,732,472 1,871,070 0608 Drug Pre Trust 0 8,000 0 8,000 8,136 0 8,136 8,136 8,136 8,136 0610 Bank Fees 0 5,500,000 0 5,500,000 5,500,000 0 5,500,000 6,000,000 6,000,000 6,000,000 0611 Tax Collection Fees 0 13,684,036 0 13,684,036 13,916,665 0 13,916,665 13,950,000 13,950,000 13,950,000 0613 Unclaimed Property Contingency Fund 0 3,844,380 0 3,844,380 4,125,479 0 4,125,479 4,200,000 4,200,000 4,200,000 0614 Defined Contribution Plan Administration 0 856,708 0 856,708 902,093 0 902,093 750,000 750,000 750,000 0619 D.C. Lottery Reimbursement 0 1,786,442 0 1,786,442 1,772,583 0 1,772,583 1,800,000 1,800,000 1,800,000 0623 OPEB Trust Administration 0 337,522 0 337,522 348,500 0 348,500 0 0 0 0626 Tobacco Fund Reimbursement 0 120,956 0 120,956 135,000 0 135,000 135,000 135,000 135,000 6115 OFT Central Collections Unit (CCU) O Type 26,621,444 14,985,374 0 14,985,374 15,000,000 0 15,000,000 15,000,000 15,000,000 15,000,000 (Continued on next page)

Rev
enue
FY
2019 P
roposed
Budget an
d F
inan
cial Plan
3-44 Table 3-17 (Continued)Special Purpose (O-type) Fund Revenue, by Fund, Fiscal Years 2018-2022
FY 2017
End of FY 2018 FY 2018 FY 2018 FY 2019 FY 2019 FY 2019 FY 2020 FY 2021 FY 2022
Year Fund Certified Certified Fund Certified Certified Certified Fund Certified Certified Certified Certified
Balance Revenues Balance Use Resources Revenues Balance Use Resources Revenues Revenues RevenuesA. Governmental Direction and Support (continued)
Office of the Secretary (BA0) 0 1,100,000 0 1,100,000 1,100,000 0 1,100,000 1,000,000 1,000,000 1,000,000 1243 Distribution Fees 0 1,100,000 0 1,100,000 1,100,000 0 1,100,000 1,000,000 1,000,000 1,000,000
D.C. Department of Human Resources (BE0) 0 522,905 0 522,905 561,040 0 561,040 556,619 568,584 585,848 0615 Defined Benefits Retirement Program 0 322,455 0 322,455 345,004 0 345,004 341,655 348,488 358,942 0639 Agreement with Independent Agencies 0 100,250 0 100,250 103,233 0 103,233 103,258 106,355 109,546 1555 Reimbursables from Other Governments 0 100,200 0 100,200 112,802 0 112,802 111,707 113,741 117,359
Office of the Attorney General (CB0) 14,809,102 6,510,000 7,686,539 14,196,539 8,510,000 4,309,443 12,819,443 8,510,000 8,510,000 8,510,000 0603 Child Support - TANF/AFDC Collections 12,010,011 2,500,000 5,686,539 8,186,539 2,500,000 4,309,443 6,809,443 2,500,000 2,500,000 2,500,000 0604 Child Support - Reimbursements & Fees 188,408 0 0 0 0 0 0 0 0 0 0605 Child Support - Interest Income 2,428 0 0 0 0 0 0 0 0 0 0615 Nuisance Abatement Fund 0 10,000 0 10,000 10,000 0 10,000 10,000 10,000 10,000 0616 Litigation Support Fund 2,608,255 3,000,000 2,000,000 5,000,000 5,000,000 0 5,000,000 5,000,000 5,000,000 5,000,000 0617 Attorney General Restitution Fund 0 1,000,000 0 1,000,000 1,000,000 0 1,000,000 1,000,000 1,000,000 1,000,000
Office of Contracting and Procurement (PO0) 0 1,275,966 0 1,275,966 1,551,764 0 1,551,764 1,706,940 1,877,635 2,065,398 4010 D.C. Surplus Personal Property Sales Oper. 0 1,275,966 0 1,275,966 1,551,764 0 1,551,764 1,706,940 1,877,635 2,065,398
Captive Insurance Agency (RJ0) 460,147 35,000 163,471 198,471 73,000 137,811 210,811 70,000 70,000 70,000 1240 Captive Insurance Fund 460,147 35,000 163,471 198,471 73,000 137,811 210,811 70,000 70,000 70,000
Office of the Chief Technology Officer (TO0) 1,760,753 10,791,351 1,760,753 12,552,104 10,095,222 0 10,095,222 11,250,000 11,250,000 11,250,000 0602 D.C. NET Services Support 1,760,753 10,223,497 1,760,753 11,984,250 9,845,222 0 9,845,222 11,000,000 11,000,000 11,000,000 1200 SERVUS Program 0 567,854 0 567,854 250,000 0 250,000 250,000 250,000 250,000
Sub-total: Governmental Direction and Support 46,236,287 73,492,583 10,280,802 83,773,385 76,205,585 5,263,176 81,468,761 77,314,694 77,625,684 77,969,309 (Continued on next page)

FY
2019 P
roposed
Budget an
d F
inan
cial Plan
Rev
enue
3-45
Table 3-17 (Continued)Special Purpose (O-type) Fund Revenue, by Fund, Fiscal Years 2018-2022
FY 2017
End of FY 2018 FY 2018 FY 2018 FY 2019 FY 2019 FY 2019 FY 2020 FY 2021 FY 2022
Year Fund Certified Certified Fund Certified Certified Certified Fund Certified Certified Certified Certified
Balance Revenues Balance Use Resources Revenues Balance Use Resources Revenues Revenues RevenuesB. Economic Development and Regulation
Office of Planning (BD0) 315,199 10,000 180,199 190,199 100,000 135,000 235,000 100,000 100,000 100,000 2001 Historic Landmark and Historic District Filing Fees 265,199 10,000 165,199 175,199 100,000 100,000 200,000 100,000 100,000 100,000 2002 Reimbursables from Other Governments 50,000 0 15,000 15,000 0 35,000 35,000 0 0 0
Commission on the Arts and Humanities (BX0) 332,754 0 133,000 133,000 0 199,000 199,000 0 0 0 0600 Special Purpose Revenue 332,754 0 133,000 133,000 0 199,000 199,000 0 0 0
Department of Employment Services (CF0) 21,683,502 37,274,515 5,847,918 43,122,433 35,077,169 6,330,782 41,407,951 21,815,805 19,235,805 3,260,000 0610 Workers' Compensation Special Fund 9,601,123 4,500,000 0 4,500,000 0 3,000,000 3,000,000 0 0 3,000,000 0611 Workers' Compensation Administration Fund 0 18,564,515 0 18,564,515 19,487,540 0 19,487,540 18,975,805 18,975,805 0 0612 UI Interest/Penalties 3,277,362 2,250,000 1,001,000 3,251,000 2,579,748 953,012 3,532,760 2,580,000 0 0 0618 Wage Theft 121,110 150,000 0 150,000 200,000 0 200,000 200,000 200,000 200,000 0619 D.C. Jobs Trust Fund 60,280 60,000 0 60,000 60,000 0 60,000 60,000 60,000 60,000 0624 UI Administrative Assessment 8,623,626 11,750,000 4,846,918 16,596,918 12,749,881 2,377,770 15,127,651 0 0 0
Office of Cable TV, Film, Music, and Entertainment (CI0) 3,783,129 12,095,000 3,783,129 15,878,129 13,000,000 0 13,000,000 13,100,000 13,200,000 13,300,000 0600 Special Purpose Revenue 3,783,129 12,095,000 3,783,129 15,878,129 13,000,000 0 13,000,000 13,100,000 13,200,000 13,300,000
Office of the Tenant Advocate (CQ0) 0 500,000 0 500,000 529,470 0 529,470 567,000 567,000 567,000 6000 Rental Unit Fee Fund 0 500,000 0 500,000 529,470 0 529,470 567,000 567,000 567,000
Dept. of Consumer and Regulatory Affairs (CR0) 19,439,831 31,115,000 7,025,867 38,140,867 33,546,104 5,377,790 38,923,894 32,315,000 33,245,000 32,815,000 6006 Nuisance Abatement 3,991,371 5,900,000 1,238,676 7,138,676 5,000,000 2,473,607 7,473,607 5,500,000 6,000,000 5,500,000 6008 Real Estate Guarantee and Education Fund 4,697,730 750,000 76,620 826,620 2,500,000 0 2,500,000 750,000 2,500,000 750,000 6009 Real Estate Appraisal Fee 4,781 215,000 0 215,000 35,000 54,899 89,899 215,000 35,000 215,000 6010 OPLA - Special Account 2,145,885 5,000,000 847,087 5,847,087 4,000,000 1,250,963 5,250,963 5,000,000 3,000,000 5,000,000 6012 Boxing Commission Revolving Account 0 150,000 0 150,000 82,104 0 82,104 150,000 80,000 150,000 6013 Basic Business License Fund 3,457,230 12,500,000 2,479,210 14,979,210 13,300,000 902,854 14,202,854 12,500,000 13,000,000 12,500,000 6020 Board of Engineers Fund 126,443 1,000,000 0 1,000,000 189,000 275,524 464,524 1,000,000 190,000 1,000,000 6030 Green Building Fund 1,148,255 2,000,000 722,120 2,722,120 1,920,000 419,943 2,339,943 2,000,000 1,900,000 2,000,000 6040 Corporate Recordation Fund 3,095,452 2,500,000 889,472 3,389,472 5,000,000 0 5,000,000 4,000,000 5,000,000 4,500,000 6045 Vending Regulations Fund 772,682 1,100,000 772,682 1,872,682 1,520,000 0 1,520,000 1,200,000 1,540,000 1,200,000 (Continued on next page)

Rev
enue
FY
2019 P
roposed
Budget an
d F
inan
cial Plan
3-46 Table 3-17 (Continued)Special Purpose (O-type) Fund Revenue, by Fund, Fiscal Years 2018-2022
FY 2017
End of FY 2018 FY 2018 FY 2018 FY 2019 FY 2019 FY 2019 FY 2020 FY 2021 FY 2022
Year Fund Certified Certified Fund Certified Certified Certified Fund Certified Certified Certified Certified
Balance Revenues Balance Use Resources Revenues Balance Use Resources Revenues Revenues RevenuesB. Economic Development and Regulation (continued)
Dept. of Housing and Community Development (DB0) 588,049 4,627,019 0 4,627,019 3,633,812 0 3,633,812 3,634,905 3,627,354 3,619,830 0602 Home Purchase Assistance Program Repayment 588,049 1,596,951 0 1,596,951 1,596,951 0 1,596,951 1,601,236 1,602,696 1,603,998 0610 DHCD Unified Fund 0 2,030,068 0 2,030,068 2,036,861 0 2,036,861 2,033,669 2,024,658 2,015,832 6110 MOU with Office on Aging 0 1,000,000 0 1,000,000 0 0 0 0 0 0
Public Service Commission (DH0) 1,377,778 13,608,791 655,000 14,263,791 15,145,219 18,236 15,163,455 15,599,575 16,067,564 16,549,804 0631 Operating - Utility Assessment 1,339,542 13,608,791 635,000 14,243,791 15,145,219 0 15,145,219 15,599,575 16,067,564 16,549,804 0661 Allocation from PJM Settlement Fund 38,236 0 20,000 20,000 0 18,236 18,236 0 0 0
Office of the People's Counsel (DJ0) 629,593 8,062,744 315,000 8,377,744 8,970,586 0 8,970,586 8,970,586 8,970,586 8,970,586 0631 Advocate for Consumers 629,593 8,062,744 315,000 8,377,744 8,970,586 0 8,970,586 8,970,586 8,970,586 8,970,586
Office of the Deputy Mayor for Econ. Develop. (EB0) 28,908,598 18,470,961 18,620,308 37,091,269 12,580,547 8,296,222 20,876,768 12,355,000 12,355,000 12,355,000 0419 H Street NE Retail Priority Area Grant Fund 2,911,287 0 2,195,181 2,195,181 0 0 0 0 0 0 0603 St. Elizabeth's Redevelopment Fund 0 0 0 0 855,000 0 855,000 855,000 855,000 855,000 0609 Industrial Revenue Bond Program 1,325,938 1,500,000 49,976 1,549,976 1,318,775 0 1,318,775 1,500,000 1,500,000 1,500,000 0616 Walter Reed Redevelopment Fund 0 6,000,000 0 6,000,000 6,000,000 0 6,000,000 6,000,000 6,000,000 6,000,000 0617 Walter Reed Reinvestment Fund 0 5,000,000 0 5,000,000 0 0 0 0 0 0 0632 AWC & NCRC Development (ED Special Account) 24,671,373 5,970,961 16,375,152 22,346,112 4,406,771 8,296,222 12,702,993 4,000,000 4,000,000 4,000,000
Department of Small and Local Business Development (EN0) 247,009 0 0 0 0 0 0 0 0 0 0632 Small Business Capital Access Fund 247,009 0 0 0 0 0 0 0 0 0
Business Improvements Districts Transfer (ID0) 0 47,000,000 0 47,000,000 55,000,000 0 55,000,000 55,000,000 55,000,000 55,000,000 2003 Business Improvement Districts (BIDS) 0 47,000,000 0 47,000,000 55,000,000 0 55,000,000 55,000,000 55,000,000 55,000,000
Alcoholic Beverage Regulation Administration (LQ0) 6,402,642 4,000,000 3,485,315 7,485,315 5,225,000 2,886,683 8,111,683 4,000,000 4,000,000 4,000,000 6017 ABC - Import and Class License Fees 6,402,642 4,000,000 3,485,315 7,485,315 5,225,000 2,886,683 8,111,683 4,000,000 4,000,000 4,000,000 (Continued on next page)

FY
2019 P
roposed
Budget an
d F
inan
cial Plan
Rev
enue
3-47
Table 3-17 (Continued)Special Purpose (O-type) Fund Revenue, by Fund, Fiscal Years 2018-2022
FY 2017
End of FY 2018 FY 2018 FY 2018 FY 2019 FY 2019 FY 2019 FY 2020 FY 2021 FY 2022
Year Fund Certified Certified Fund Certified Certified Certified Fund Certified Certified Certified Certified
Balance Revenues Balance Use Resources Revenues Balance Use Resources Revenues Revenues RevenuesB. Economic Development and Regulation (continued)
Dept. of Insurance, Securities, and Banking (SR0) 15,012,180 23,519,548 4,465,808 27,985,356 26,791,078 2,000,000 28,791,078 27,594,810 28,422,655 29,275,334 2100 HMO Assessment 209,273 945,474 209,273 1,154,747 1,162,759 0 1,162,759 1,197,642 1,233,571 1,270,578 2200 Insurance Assessment 1,607,157 6,829,345 1,606,805 8,436,150 8,565,898 0 8,565,898 8,822,875 9,087,561 9,360,188 2350 Securities and Banking Fund 0 13,156,725 0 13,156,725 14,426,648 0 14,426,648 14,859,447 15,305,231 15,764,388 2800 Captive Insurance 0 2,588,004 0 2,588,004 2,635,773 0 2,635,773 2,714,846 2,796,292 2,880,180 2910 Foreclosure Mediation Fund 111,750 0 0 0 0 0 0 0 0 0 2911 Foreclosure Mediation Fund (Temporary) 649,730 0 649,730 649,730 0 0 0 0 0 0 2950 Capital Access Fund 4,316,966 0 0 0 0 0 0 0 0 0 2951 Loan Participation Fund 8,117,305 0 2,000,000 2,000,000 0 2,000,000 2,000,000 0 0 0
Sub-total: Economic Development and Regulation 98,720,264 200,283,578 44,511,545 244,795,123 209,598,984 25,243,713 234,842,696 195,052,681 194,790,964 179,812,554
C. Public Safety and Justice
Metropolitan Police Department (FA0) 2,042,812 7,400,000 800,000 8,200,000 7,400,000 800,000 8,200,000 7,363,978 5,500,000 5,500,000 1555 Reimbursable from Other Governments 0 1,900,000 0 1,900,000 1,900,000 0 1,900,000 1,863,978 0 0 1614 Miscellaneous 0 5,500,000 0 5,500,000 5,500,000 0 5,500,000 5,500,000 5,500,000 5,500,000 7278 Asset Forfeiture 2,042,812 0 800,000 800,000 0 800,000 800,000 0 0 0
Fire and Emergency Medical Services Dept. (FB0) 5,044 2,088,747 5,044 2,093,790 1,765,500 0 1,765,500 1,765,500 1,765,500 1,765,500 0601 FEMS Reform Fund 0 983,000 0 983,000 983,000 0 983,000 983,000 983,000 983,000 1200 Automated Ext Defib Reg Fee Fund 5,044 500 5,044 5,544 500 0 500 500 500 500 1555 Reimbursable from Other Governments 0 378,247 0 378,247 255,000 0 255,000 255,000 255,000 255,000 1613 Other Revenue (CPR Training) 0 27,000 0 27,000 27,000 0 27,000 27,000 27,000 27,000 6100 Special Events 0 700,000 0 700,000 500,000 0 500,000 500,000 500,000 500,000
Department of Corrections (FL0) 2,936,426 24,610,191 1,200,581 25,810,772 20,800,000 450,000 21,250,000 20,800,000 20,800,000 20,800,000 0600 Corrections Trustee Reimbursement 1,734,222 23,143,130 724,741 23,867,871 18,500,000 0 18,500,000 18,500,000 18,500,000 18,500,000 0601 Concession Income 0 1,300,000 0 1,300,000 2,000,000 0 2,000,000 2,000,000 2,000,000 2,000,000 0602 Welfare Account 751,722 30,000 210,901 240,901 300,000 450,000 750,000 300,000 300,000 300,000 0605 Correction Reimbursement - Juveniles 450,482 137,061 264,939 402,000 0 0 0 0 0 0 (Continued on next page)

Rev
enue
FY
2019 P
roposed
Budget an
d F
inan
cial Plan
3-48 Table 3-17 (Continued)Special Purpose (O-type) Fund Revenue, by Fund, Fiscal Years 2018-2022
FY 2017
End of FY 2018 FY 2018 FY 2018 FY 2019 FY 2019 FY 2019 FY 2020 FY 2021 FY 2022
Year Fund Certified Certified Fund Certified Certified Certified Fund Certified Certified Certified Certified
Balance Revenues Balance Use Resources Revenues Balance Use Resources Revenues Revenues RevenuesC. Public Safety and Justice (continued)
Office of Victim Services and Justice Grants (FO0) 4,957,012 750,000 2,084,999 2,834,999 1,080,000 2,128,034 3,208,034 1,080,000 1,080,000 1,080,000 0620 Crime Victims Assistance Fund 4,932,489 750,000 2,084,999 2,834,999 1,080,000 2,103,511 3,183,511 1,080,000 1,080,000 1,080,000 0621 Dom. Violence Shelter and Transition Housing Fund 24,523 0 0 0 0 24,523 24,523 0 0 0
Office of Unified Communications (UC0) 8,623,181 11,550,000 3,806,809 15,356,809 11,550,000 2,746,020 14,296,020 11,550,000 11,550,000 11,550,000 1630 911 and 311 Assessments 7,437,247 11,000,000 3,605,083 14,605,083 11,000,000 1,761,812 12,761,812 11,000,000 11,000,000 11,000,000 1631 Prepaid Wireless 911 Charges 1,185,934 550,000 201,726 751,726 550,000 984,208 1,534,208 550,000 550,000 550,000
Sub-total: Public Safety and Justice 18,564,474 46,398,938 7,897,433 54,296,371 42,595,500 6,124,054 48,719,554 42,559,478 40,695,500 40,695,500
D. Public Education System
District of Columbia Public Library (CE0) 3,337,521 1,055,000 460,000 1,515,000 905,000 450,878 1,355,878 915,000 965,000 965,000 0104 Gifts-Donations 5,863 0 0 0 0 0 0 0 0 0 0140 Restricted Gifts and Donations 7,318 0 0 0 0 0 0 0 0 0 1601 Albert Atwood Memorial Fund 6,162 0 0 0 0 0 0 0 0 0 1602 Thomas J Brown Memorial Fund 5,551 0 0 0 0 0 0 0 0 0 1603 Kathleen Dillon Fraze Memorial Trust Fund 4,344 0 0 0 0 0 0 0 0 0 1604 Frederick McReynolds Trust Fund 723 0 0 0 0 0 0 0 0 0 1605 Miner Trust Fund 2,903 0 0 0 0 0 0 0 0 0 1606 Theodore W Noyes Trust Fund 19,070 0 0 0 0 0 0 0 0 0 1607 Henry Pastor Memorial Trust Fund 167 0 0 0 0 0 0 0 0 0 1608 Georgetown Peabody 1,276,751 0 0 0 0 0 0 0 0 0 1609 Sophy Carr Stanton Memorial Trust Fund 18,969 0 0 0 0 0 0 0 0 0 1610 Hattie M Strong Trust Fund 3,233 0 0 0 0 0 0 0 0 0 1611 Womens Anthropological Society Trust - DCPL 25,539 0 0 0 0 0 0 0 0 0 1612 Miscellaneous 321,061 0 0 0 0 0 0 0 0 0 1613 Henrietta Winant Trust Fund 5,674 0 0 0 0 0 0 0 0 0 1614 Marion F Rockefeller Gift 429 0 0 0 0 0 0 0 0 0 6108 Copies and Printing 447,279 100,000 210,000 310,000 0 200,878 200,878 10,000 10,000 10,000 6150 SLD E-Rate Reimbursement 1,186,487 850,000 250,000 1,100,000 850,000 250,000 1,100,000 850,000 850,000 850,000 6160 Revenue Generating Activities 0 105,000 0 105,000 55,000 0 55,000 55,000 105,000 105,000 (Continued on next page)

FY
2019 P
roposed
Budget an
d F
inan
cial Plan
Rev
enue
3-49
Table 3-17 (Continued)Special Purpose (O-type) Fund Revenue, by Fund, Fiscal Years 2018-2022
FY 2017
End of FY 2018 FY 2018 FY 2018 FY 2019 FY 2019 FY 2019 FY 2020 FY 2021 FY 2022
Year Fund Certified Certified Fund Certified Certified Certified Fund Certified Certified Certified Certified
Balance Revenues Balance Use Resources Revenues Balance Use Resources Revenues Revenues RevenuesD. Public Education System (continued)
District of Columbia Public Schools (GA0) 15,957,758 8,182,779 6,800,602 14,983,381 7,365,984 2,765,576 10,131,560 7,662,905 7,973,278 8,309,344 0602 ROTC 1,126,249 842,904 1,125,878 1,968,782 868,191 0 868,191 894,237 921,064 948,696 0607 Custodial 0 422,383 0 422,383 443,503 0 443,503 465,678 488,962 513,410 0609 Security 0 866,034 0 866,034 959,959 0 959,959 1,086,354 1,216,716 1,362,722 0611 Cafeteria 0 930,475 0 930,475 995,608 0 995,608 1,065,301 1,139,872 1,219,663 0613 Vending Machine Sales 0 58,129 0 58,129 62,198 0 62,198 66,552 71,210 76,195 0621 Parking Fees 0 169,198 0 169,198 177,658 0 177,658 186,541 195,868 205,661 0633 DHHS Afterschool Program - Copayment 731,696 750,000 726,498 1,476,498 787,500 0 787,500 826,875 868,219 911,630 0634 E-Rate Education Fund 2,912,790 2,821,367 2,912,790 5,734,157 2,821,367 0 2,821,367 2,821,367 2,821,367 2,821,367 0640 DCPS Nonprofit School Fund Service 11,187,023 1,322,289 2,035,437 3,357,726 250,000 2,765,576 3,015,576 250,000 250,000 250,000
Public Charter School Board (GB0) 0 9,109,827 0 9,109,827 8,524,878 0 8,524,878 8,524,878 8,524,878 8,524,878 6632 Administrative Fees 0 9,109,827 0 9,109,827 8,524,878 0 8,524,878 8,524,878 8,524,878 8,524,878
Office of the State Superintendent of Education (GD0) 13,762,722 1,047,018 0 1,047,018 1,000,974 0 1,000,974 1,000,974 1,000,974 1,000,974 0603 State Superintendent of Education Fees 0 252,000 0 252,000 200,000 0 200,000 200,000 200,000 200,000 0610 Charter School Credit Enhancement Fund 13,328,207 0 0 0 0 0 0 0 0 0 0618 Student Residency Verification Fund 434,515 520,000 0 520,000 520,000 0 520,000 520,000 520,000 520,000 6007 Site Evaluation 0 275,018 0 275,018 280,974 0 280,974 280,974 280,974 280,974
District of Columbia State Athletics Commission (GL0) 149,333 100,000 0 100,000 100,000 0 100,000 100,000 100,000 100,000 0619 State Athletic Acts Program and Office Fund 149,333 100,000 0 100,000 100,000 0 100,000 100,000 100,000 100,000
Sub-total: Public Education System 33,207,334 19,494,624 7,260,602 26,755,227 17,896,836 3,216,454 21,113,291 18,203,757 18,564,130 18,900,196 (Continued on next page)

Rev
enue
FY
2019 P
roposed
Budget an
d F
inan
cial Plan
3-50 Table 3-17 (Continued)Special Purpose (O-type) Fund Revenue, by Fund, Fiscal Years 2018-2022
FY 2017
End of FY 2018 FY 2018 FY 2018 FY 2019 FY 2019 FY 2019 FY 2020 FY 2021 FY 2022
Year Fund Certified Certified Fund Certified Certified Certified Fund Certified Certified Certified Certified
Balance Revenues Balance Use Resources Revenues Balance Use Resources Revenues Revenues RevenuesE. Human Support Services
Department of Parks and Recreation (HA0) 1,651,761 2,700,000 1,651,761 4,351,761 2,800,000 0 2,800,000 2,900,000 3,000,000 3,100,000 0602 Enterprise Fund Account 1,651,761 2,700,000 1,651,761 4,351,761 2,800,000 0 2,800,000 2,900,000 3,000,000 3,100,000
Department of Health (HC0) 12,538,681 19,148,333 4,518,574 23,666,907 22,384,231 5,010,483 27,394,714 19,230,584 22,383,965 19,781,084 0605 SHPDA Fees 935,033 748,955 0 748,955 713,488 934,088 1,647,576 708,975 723,155 737,618 0606 Vital Records Revenue 0 2,535,908 0 2,535,908 2,717,433 0 2,717,433 2,664,849 2,718,146 2,772,508 0632 Pharmacy Protection 2,296,946 2,350,272 969,107 3,319,379 2,962,314 1,327,839 4,290,153 2,920,718 2,979,132 3,038,715 0633 Radiation Protection 0 855,000 0 855,000 742,924 0 742,924 742,924 742,924 742,924 0641 Other Medical Licenses and Fees 0 556,800 0 556,800 497,178 0 497,178 491,342 501,169 511,192 0643 Board of Medicine 6,317,795 7,907,952 3,549,467 11,457,419 10,485,688 2,748,556 13,234,244 7,427,496 10,367,040 7,546,046 0644 Spay and Neutering Fund 29,419 0 0 0 0 0 0 0 0 0 0655 SHPDA Admission Fee 286 466,574 0 466,574 384,171 0 384,171 368,324 368,324 368,324 0656 EMS Fees 0 74,942 0 74,942 98,925 0 98,925 98,285 100,250 102,255 0661 ICF/MR Fees and Fines 50,602 111,729 0 111,729 120,561 0 120,561 122,972 125,432 127,940 0662 Civic Monetary Penalties 1,320,887 0 0 0 0 0 0 0 0 0 0673 DOH - Regulatory Enforcement Fund 128,275 0 0 0 0 0 0 0 0 0 0676 Communicable and Chronic Disease Fund 1,459,438 3,540,201 0 3,540,201 3,661,549 0 3,661,549 3,684,699 3,758,393 3,833,561
Department of Health Care Finance (HT0) 852,564 3,668,083 0 3,668,083 2,955,610 0 2,955,610 2,930,970 2,976,658 3,023,328 0631 Medicaid Collections - 3rd Party Liability 202,688 2,146,143 0 2,146,143 865,835 0 865,835 876,450 902,743 929,825 0632 Bill of Rights - Grievance and Appeals 606,957 1,406,644 0 1,406,644 1,972,445 0 1,972,445 1,939,386 1,958,779 1,978,367 0634 Assessment Fund 42,918 115,296 0 115,296 117,329 0 117,329 115,135 115,135 115,135
Department of Human Services (JA0) 493,522 1,100,000 493,522 1,593,522 1,032,431 0 1,032,431 1,032,431 1,032,431 1,032,431 0603 SSI Payback 493,522 800,000 493,522 1,293,522 832,431 0 832,431 832,431 832,431 832,431 0613 Food Stamps Collection - Fraud 0 200,000 0 200,000 200,000 0 200,000 200,000 200,000 200,000 0629 Agreement with Independent Agencies 0 100,000 0 100,000 0 0 0 0 0 0
Department on Disabilities Services (JM0) 1,916,849 7,300,000 0 7,300,000 7,300,000 0 7,300,000 7,300,000 7,300,000 7,300,000 0610 Vocational Rehab. Service Reimbursement 0 100,000 0 100,000 100,000 0 100,000 100,000 100,000 100,000 0611 Cost of Care - Non-Medicaid Clients 1,829,422 6,000,000 0 6,000,000 6,000,000 0 6,000,000 6,000,000 6,000,000 6,000,000 0616 Randolph Shepherd Unassigned Facilities 87,427 1,200,000 0 1,200,000 1,200,000 0 1,200,000 1,200,000 1,200,000 1,200,000 (Continued on next page)

FY
2019 P
roposed
Budget an
d F
inan
cial Plan
Rev
enue
3-51
Table 3-17 (Continued)Special Purpose (O-type) Fund Revenue, by Fund, Fiscal Years 2018-2022
FY 2017
End of FY 2018 FY 2018 FY 2018 FY 2019 FY 2019 FY 2019 FY 2020 FY 2021 FY 2022
Year Fund Certified Certified Fund Certified Certified Certified Fund Certified Certified Certified Certified
Balance Revenues Balance Use Resources Revenues Balance Use Resources Revenues Revenues RevenuesE. Human Support Services (continued)
Child and Family Services Agency (RL0) 0 1,000,000 0 1,000,000 1,000,000 0 1,000,000 1,000,000 1,000,000 1,000,000 0601 H.U.M.N. - Human Res. - ES 0 1,000,000 0 1,000,000 1,000,000 0 1,000,000 1,000,000 1,000,000 1,000,000
Department of Behavioral Health (RM0) 552,288 4,234,099 0 4,234,099 2,351,648 0 2,351,648 2,351,648 2,351,648 2,351,648 0610 DMH Federal Beneficiary Reimbursement 0 3,909,099 0 3,909,099 1,826,648 0 1,826,648 1,826,648 1,826,648 1,826,648 0640 DMH Medicare and 3rd Party Reimbursement 552,288 300,000 0 300,000 500,000 0 500,000 500,000 500,000 500,000 0641 DMH Enterprise Fund 0 25,000 0 25,000 25,000 0 25,000 25,000 25,000 25,000
Office of Veterans Affairs (VA0) 14,934 5,000 0 5,000 5,000 0 5,000 5,000 5,000 5,000 0600 Office of Veterans Affairs Fund 14,934 5,000 0 5,000 5,000 0 5,000 5,000 5,000 5,000
Sub-total: Human Support Services 18,020,599 39,155,515 6,663,857 45,819,372 39,828,919 5,010,483 44,839,402 36,750,633 40,049,701 37,593,490
F. Public Works
Department of Transportation (KA0) 9,632,577 29,261,895 4,694,683 33,956,578 23,532,750 0 23,532,750 29,132,750 29,132,750 29,132,7506000 General "O" Type Revenue Sources 0 500,000 0 500,000 500,000 0 500,000 500,000 500,000 500,000 6030 D.C. Circulator Bus System 56,168 3,100,000 0 3,100,000 3,100,000 0 3,100,000 3,100,000 3,100,000 3,100,000 6031 D.C. Circulator Bus System - NPS Mall Route 413,520 1,200,000 0 1,200,000 1,200,000 0 1,200,000 1,200,000 1,200,000 1,200,000 6140 Tree Fund 720,820 1,200,000 720,820 1,920,820 572,750 0 572,750 572,750 572,750 572,750 6555 Mall Tunnel Lighting 0 260,000 0 260,000 260,000 0 260,000 260,000 260,000 260,000 6901 DDOT Enterprise Fund - Non- Tax Revenues 2,432,298 7,310,577 2,432,298 9,742,875 6,900,000 0 6,900,000 6,900,000 6,900,000 6,900,000 6903 Bicycle Sharing Fund 2,328,884 6,700,000 0 6,700,000 7,200,000 0 7,200,000 7,200,000 7,200,000 7,200,000 6905 Parking Meter Pay by Phone Transaction Fee 0 3,491,318 0 3,491,318 3,300,000 0 3,300,000 3,300,000 3,300,000 3,300,000 6909 Transportation Infrastructure Mitigation 3,231,421 5,000,000 1,092,099 6,092,099 0 0 0 5,600,000 5,600,000 5,600,0006910 Vision Zero Pedestrian and Bicycle Safety 449,466 500,000 449,466 949,466 500,000 0 500,000 500,000 500,000 500,000
Washington Metropolitan Area Transit Authority (KE0) 2,563,863 45,200,000 2,563,863 47,763,863 43,000,000 0 43,000,000 43,000,000 43,000,000 43,000,000 0601 Parking Meter WMATA 2,563,863 45,200,000 2,563,863 47,763,863 43,000,000 0 43,000,000 43,000,000 43,000,000 43,000,000
District Dept. of Energy and the Environment (KG0) 60,157,878 64,852,614 40,652,612 105,505,226 67,881,433 15,392,588 83,274,021 71,243,102 71,243,102 71,243,102 0602 Air Quality Construction Permits 29,644 60,000 10,923 70,923 49,521 18,720 68,241 50,000 50,000 50,000 0603 Fishing License 149,029 96,706 20,000 116,706 96,706 11,311 108,017 96,705 96,705 96,705 0609 LUST Trust Fund 323,384 0 35,000 35,000 0 35,000 35,000 0 0 0 (Continued on next page)

Rev
enue
FY
2019 P
roposed
Budget an
d F
inan
cial Plan
3-52 Table 3-17 (Continued)Special Purpose (O-type) Fund Revenue, by Fund, Fiscal Years 2018-2022
FY 2017
End of FY 2018 FY 2018 FY 2018 FY 2019 FY 2019 FY 2019 FY 2020 FY 2021 FY 2022
Year Fund Certified Certified Fund Certified Certified Certified Fund Certified Certified Certified Certified
Balance Revenues Balance Use Resources Revenues Balance Use Resources Revenues Revenues RevenuesF. Public Works (continued)
District Dept. of Energy and the Environment (KG0) - continued0634 Soil Erosion/Sediment Control 424,447 1,280,367 0 1,280,367 1,309,415 424,447 1,733,862 1,290,000 1,290,000 1,290,000 0645 Pesticide Product Registration 1,799,234 2,388,977 475,088 2,864,065 2,091,937 1,324,146 3,416,083 2,091,937 2,091,937 2,091,937 0646 Storm Water Fees 1,462,550 2,023,693 690,054 2,713,747 2,023,693 772,497 2,796,190 2,024,000 2,024,000 2,024,000 0647 Mold Assessment and Remediation Fund 50,354 42,867 50,354 93,221 42,867 0 42,867 42,867 42,867 42,867 0650 Product Stewardship Fund 120,001 124,000 120,001 244,001 124,010 0 124,010 124,010 124,010 124,010 0654 Storm Water Permit Review 10,798,704 12,592,184 2,005,659 14,597,843 9,592,185 5,692,545 15,284,730 12,592,184 12,592,184 12,592,184 0655 Storm Water in Lieu Fee 38 850,000 0 850,000 399,962 38 400,000 400,000 400,000 400,000 0662 Renewable Energy Development Fund 32,193,058 15,329,988 31,576,441 46,906,429 20,000,000 616,619 20,616,619 20,000,000 20,000,000 20,000,000 0663 Clean Land Fund/Brownfield Revitalization 2,891,761 338,440 1,610,895 1,949,335 338,440 769,210 1,107,650 338,440 338,440 338,440 0667 Wetlands Fund 1,701,817 1,000 1,056,644 1,057,644 1,000 515,752 516,752 1,000 1,000 1,000 0670 Anacostia River Clean Up Fund 3,513,569 2,550,484 1,119,998 3,670,482 2,050,484 2,393,569 4,444,053 2,550,484 2,550,484 2,550,484 0680 Payments from Independent Agencies 0 97,353 0 97,353 105,086 0 105,086 0 0 0 6201 Economy II 0 26,000 0 26,000 26,000 0 26,000 26,000 26,000 26,000 6202 Residential Aid Discount (RAD) 0 131,628 0 131,628 135,853 0 135,853 131,454 131,454 131,454 6203 Residential Essential Services (RES) 0 131,754 0 131,754 135,985 0 135,985 131,582 131,582 131,582 6204 WASA Utility Discount Program 0 131,912 0 131,912 136,152 0 136,152 131,740 131,740 131,740 6400 D.C. Municipal Aggregation Program 150,632 150,875 89,516 240,391 150,875 61,116 211,991 150,875 150,875 150,875 6500 Benchmarking Enforcement Fund 93,720 32,331 78,081 110,412 33,770 15,638 49,409 32,331 32,331 32,331 6700 Sustainable Energy Trust Fund 4,009,859 21,277,466 1,450,719 22,728,185 21,037,492 2,559,140 23,596,632 21,037,493 21,037,493 21,037,493 6800 Energy Assistance Trust Fund 440,668 5,000,000 257,828 5,257,828 5,000,000 182,840 5,182,840 5,000,000 5,000,000 5,000,000 6900 Special Energy Assessment Fund 5,411 194,589 5,411 200,000 3,000,000 0 3,000,000 3,000,000 3,000,000 3,000,000
Department of Public Works (KT0) 6,278,424 7,529,784 3,905,140 11,434,924 7,283,272 500,000 7,783,272 7,075,000 7,075,000 7,075,000 6000 General "O" Type Revenue Sources 0 500,000 0 500,000 500,000 0 500,000 500,000 500,000 500,000 6010 Super Can Program 172,638 150,000 0 150,000 150,000 0 150,000 150,000 150,000 150,000 6072 District Recycle Program 0 325,000 0 325,000 325,000 0 325,000 325,000 325,000 325,000 6082 Solid Waste Disposal Fee Fund 6,105,787 4,700,000 3,905,140 8,605,140 4,780,324 500,000 5,280,324 4,600,000 4,600,000 4,600,000 6591 Clean City Fund 0 1,854,784 0 1,854,784 1,527,948 0 1,527,948 1,500,000 1,500,000 1,500,000
Department of Motor Vehicles (KV0) 1,527,450 9,064,577 496,692 9,561,269 9,065,771 1,014,681 10,080,452 8,875,016 8,875,016 8,875,016 6000 General "O" Type Revenue Sources 0 3,168,139 0 3,168,139 2,922,614 0 2,922,614 2,915,201 2,915,201 2,915,201 6100 Fee - Out-of-State Vehicle Registration 0 245,816 0 245,816 161,975 0 161,975 161,975 161,975 161,975 6258 Motor Vehicle Inspection Station 1,527,450 5,650,622 496,692 6,147,314 5,981,182 1,014,681 6,995,863 5,797,840 5,797,840 5,797,840 (Continued on next page)

FY
2019 P
roposed
Budget an
d F
inan
cial Plan
Rev
enue
3-53
Table 3-17 (Continued)Special Purpose (O-type) Fund Revenue, by Fund, Fiscal Years 2018-2022
FY 2017
End of FY 2018 FY 2018 FY 2018 FY 2019 FY 2019 FY 2019 FY 2020 FY 2021 FY 2022
Year Fund Certified Certified Fund Certified Certified Certified Fund Certified Certified Certified Certified
Balance Revenues Balance Use Resources Revenues Balance Use Resources Revenues Revenues RevenuesF. Public Works (continued)
Department of For-Hire Vehicles (TC0) 2,874,521 9,546,644 510,000 10,056,644 9,735,137 2,200,000 11,935,137 9,832,288 9,930,411 10,029,515 2100 Justice Department Fingerprints 0 22,000 0 22,000 20,000 0 20,000 20,000 20,000 20,000 2400 Public Vehicles for Hire Consumer Service 2,874,521 9,524,644 510,000 10,034,644 9,715,137 2,200,000 11,915,137 9,812,288 9,910,411 10,009,515
Sub-total: Public Works 83,034,713 165,455,515 52,822,990 218,278,504 160,498,363 19,107,269 179,605,632 169,158,156 169,256,279 169,355,383
G . Financing and OtherDS0 6462 Public Space Rental Fees for Debt Service 0 5,531,000 0 5,531,000 5,753,000 0 5,753,000 5,983,000 7,777,000 8,089,000 EZ0 6100 Convention Center Hotel Ground Lease Payment 0 1,498,341 0 1,498,341 3,415,469 0 3,415,469 3,729,981 4,212,863 4,305,546 KZ0 6330 Transfer Dedicated Capital Revenues (ROW) 0 0 0 0 7,261,000 0 7,261,000 8,424,000 2,946,050 5,657,000 PA0 0600 Cable TV - Paygo 0 1,000,000 0 1,000,000 0 0 0 0 0 0 PA0 0654 Storm Water Permit Review - Paygo 0 0 0 0 3,000,000 0 3,000,000 0 0 0 PA0 0670 Anacostia River Clean Up Fund - Paygo 0 0 0 0 500,000 0 500,000 0 0 0 PA0 6140 Tree Fund - Paygo 0 0 0 0 452,000 0 452,000 0 0 0 PA0 6330 Local Transportation Revenue (ROW) - Paygo 0 45,244,121 0 45,244,121 37,983,121 0 37,983,121 36,820,121 42,298,071 39,587,121 PA0 6909 Transportation Infrastructure Mitigation 0 0 0 0 5,600,000 0 5,600,000 0 0 0 PA0 6913 PEPCO Cost-Sharing Fund (D.C. PLUG) 0 20,000,000 0 20,000,000 30,000,000 0 30,000,000 30,000,000 30,000,000 30,000,000 Sub-total: Financing and Other 0 73,273,462 0 73,273,462 93,964,590 0 93,964,590 84,957,102 87,233,984 87,638,667
District-Wide Total 297,783,671 617,554,213 129,437,230 746,991,443 640,588,776 63,965,149 704,553,925 623,996,501 628,216,242 611,965,100

Rev
enue
FY
2019 P
roposed
Budget an
d F
inan
cial Plan
3-54 Table 3-17ASpecial Purpose (O-type) Revenue Funds, Revenues and Fund Balances, Fiscal Years 2016 and 2017
FY 2016 FY 2016 FY 2017 FY 2017
Actual End of Year Actual End of Year
Type Classification Revenue Fund Balance Revenue Fund Balance
GOVERNMENTAL DIRECTION AND SUPPORT 42,056,634 38,624,888 45,603,083 46,236,287AB0 COUNCIL OF THE DISTRICT OF COLUMBIA 0629 COUNCIL REIMBURSEMENT FUND Non Lapsing Committed 2,865 2,865AE0 CITY ADMINISTRATOR / DEPUTY MAYOR 0602 INDEPENDENT AGENCIES Lapsing Not Applicable 330,000 330,000
1243 PUBLIC-PRIVATE PARTNERSHIP ADMIN FUND Non Lapsing Committed 50,000AG0 DC BD OF ETHICS AND GOVT ACCOUNTABILITY 0601 BOARD OF ETHICS AND ACCOUNTABILITY FUND Non Lapsing Committed 22,635 72,887 16,540 89,454
0602 LOBBYING REGISTRATION FEE FUND Non Lapsing Committed 89,249 156,665 100,176 105,107AM0 DEPARTMENT OF GENERAL SERVICES 1150 UTILITY PAYMENTS FOR NON-DC AGENCIES Lapsing Not Applicable 2,380,612 3,121,092
1440 RFK & DC ARMORY MAINTENANCE FUND Lapsing Not Applicable 2,054,911 2,055,4561459 RENT Repealed Not Applicable 2,5401460 EASTERN MARKET ENTERPRISE FUND Non Lapsing Committed 893,702 497,029 941,795 630,4201500 FACILITIES SERVICE REQUEST FUND Lapsing Not Applicable 106,107 212,635
AS0 OFFICE OF FINANCE & RESOURCE MGMT 1150 UTILITIES PAYMENT FOR NON-DC AGENCIES Lapsing Not Applicable 240,132 224,311AT0 OFFICE OF THE CHIEF FINANCIAL OFFICER 0602 PAYROLL SERVICE FEES Lapsing Not Applicable 351,151 345,243
0603 SERVICE CONTRACTS Lapsing Not Applicable 1,110,704 1,081,4090605 DISHONORED CHECK FEES Lapsing Not Applicable 32,632 22,0620606 RECORDER OF DEEDS SURCHARGE Non Lapsing Committed 1,311,628 1,920,173 1,523,099 1,756,9950608 DRUG PRE TRUST Lapsing Not Applicable 6,565 5,9280610 BANK FEES Lapsing Not Applicable 4,532,235 2,561,5660611 TAX COLLECTION FEES Lapsing Not Applicable 2,353,009 1,706,0510613 UNCLAIMED PROPERTY CONTINGENCY FUND Lapsing Not Applicable 1,727,811 1,827,8460614 DEFINED CONTRIBUTION PLAN ADMINISTRATION Lapsing Not Applicable 688,211 517,6330619 DC LOTTERY REIMBURSEMENT Lapsing Not Applicable 1,529,938 602,0500626 TOBACCO FUND REIMBURSEMENT Lapsing Not Applicable 85,000 85,0006115 OFT CENTRAL COLLECTION UNIT (CCU) O TYPE Semi Lapsing Semi Committed 8,367,698 21,397,428 13,134,928 26,621,444
BA0 OFFICE OF THE SECRETARY 1243 DISTRIBUTION FEES Lapsing Not Applicable 912,465 1,023,901BE0 D.C. DEPARTMENT OF HUMAN RESOURCES 0615 DEFINED BENEFITS RETIREMENT PROGRAM Lapsing Not Applicable 188,341 204,778
0639 AGREEMENT WITH INDEPENDENT AGENCIES Lapsing Not Applicable 297,169 168,5901555 REIMBURSABLES FROM OTHER GOVERNMENTS Lapsing Not Applicable 106,301 27,868
CB0 OFFICE OF THE ATTORNEY GENERAL 0603 CHILD SPT - TANF/AFDC COLLECTIONS Non Lapsing Committed 2,220,767 11,485,888 2,392,664 12,010,0110604 CHILD SPT-REIMBURSEMENTS & FEES Non Lapsing Committed 0 188,408 0 188,4080605 CHILD SPT - INTEREST INCOME Non Lapsing Committed 2,428 2,4280615 NUISANCE ABATEMENT Semi Lapsing Committed 700 62,0410616 LITIGATION SUPPORT FUND Semi Lapsing Committed 617,179 617,179 4,113,365 2,608,255
PO0 OFFICE OF CONTRACTING AND PROCUREMENT 4010 DC SURPLUS PERSONAL PROPERTY SALES OPER. Lapsing Not Applicable 378,176 459,741RJ0 MEDICAL LIABILITY CAPTIVE INS AGENCY 1240 CAPTIVE INSURANCE FUND Non Lapsing Committed 106,681 382,563 77,584 460,147TO0 OFFICE OF THE CHIEF TECHNOLOGY OFFICER 0602 DC NET SERVICES SUPPORT Non Lapsing Committed 7,988,829 1,842,199 6,436,843 1,760,753
1200 SERV US PROGRAM Lapsing Not Applicable 1,023,557 230,065(Continued on next page)

FY
2019 P
roposed
Budget an
d F
inan
cial Plan
Rev
enue
3-55
Table 3-17A (Continued)Special Purpose (O-type) Revenue Funds, Revenues and Fund Balances, Fiscal Years 2016 and 2017
FY 2016 FY 2016 FY 2017 FY 2017
Actual End of Year Actual End of Year
Type Classification Revenue Fund Balance Revenue Fund Balance
ECONOMIC DEVELOPMENT AND REGULATION 209,643,242 121,472,878 201,832,355 98,720,264BD0 OFFICE OF PLANNING 2001 HIST. LANDMARK & HIST. DIST. FILING FEES Non Lapsing Committed 108,300 265,112 99,620 265,199
2002 REIMBURSABLES FROM OTHER GOVERNMENTS Non Lapsing Committed 75,000 50,000BX0 COMMISSION ON ARTS & HUMANITIES 0600 SPECIAL PURPOSE REVENUE Non Lapsing Committed 332,754 332,754CF0 DEPARTMENT OF EMPLOYMENT SERVICES 0610 WORKERS' COMPENSATION SPECIAL FUND Non Lapsing Restricted 4,542,417 5,285,716 6,892,039 9,601,123
0611 WORKERS' COMPENSATION ADMIN. Non Lapsing Restricted 16,244,486 15,052,6990612 U. I. INTEREST/PENALTIES Semi Lapsing Restricted 2,375,868 2,440,757 2,904,714 3,277,3620618 WAGE THEFT Non Lapsing Committed 29,850 29,850 171,110 121,1100619 DC JOBS TRUST FUND Non Lapsing Committed 60,280 60,2800624 UI ADMINISTRATIVE ASSESSMENT Non Lapsing Restricted 11,643,803 15,192,072 12,145,461 8,623,626
CI0 OFFICE OF CABLE TV,FILM,MUSIC & ENTNMENT 0600 SPECIAL PURPOSE REVENUE Non Lapsing Committed 11,283,590 6,704,862 13,471,179 3,783,1290610 PRODUCTION SUPPORT Inactive-Lapsing Not Applicable 113,719 87,540
CR0 DEPT. OF CONSUMER AND REGULATORY AFFAIRS 6006 NUISANCE ABATEMENT Non Lapsing Committed 5,935,343 4,001,145 6,531,288 3,991,3716008 R-E GUAR. & EDUC. FUND Non Lapsing Committed 779,517 4,053,173 2,497,673 4,697,7306009 R-E APPRAISAL FEE Non Lapsing Committed 216,641 1,578,354 35,400 4,7816010 OPLA - SPECIAL ACCOUNT Non Lapsing Committed 5,433,615 3,424,140 2,998,090 2,145,8856011 SPECIAL EVENTS REVOLVING Lapsing Not Applicable 52,074 38,3946012 BOXING COMMISSION-REVOLVING ACCOUNT Lapsing Not Applicable 173,220 71,9376013 BASIC BUSINESS LICENSE FUND Non Lapsing Committed 13,180,407 4,228,174 12,865,857 3,457,2306014 FIRE PROTECTION SPECIAL REVOLVING Repealed Not Applicable 124,569 115,1186020 BOARD OF ENGINEERS FUND Non Lapsing Committed 1,050,320 817,250 189,202 126,4436030 GREEN BUILDING FUND Non Lapsing Committed 2,024,426 1,363,718 1,896,147 1,148,2556040 CORPORATE RECORDATION FUND Non Lapsing Committed 4,358,470 2,461,526 5,115,631 3,095,4526045 VENDING REGULATION FUND Non Lapsing Committed 1,198,809 1,143,747 1,213,585 772,682
DB0 DEPT. OF HOUSING AND COMM. DEVELOPMENT 0602 HPAP - REPAY Non Lapsing Committed 1,445,086 1,477,388 1,435,435 588,0490610 DHCB UNIFIED FUND Non Lapsing Committed 2,770,653 1,688,055 1,999,771
DH0 PUBLIC SERVICE COMMISSION 0631 OPERATING - UTILITY ASSESSMENT Non Lapsing Committed 12,573,393 846,645 13,338,357 1,339,5420661 ALLOCATION FROM PJM SETTLEMENT FUND Non Lapsing Restricted 38,236 38,236
DJ0 OFFICE OF PEOPLE'S COUNSEL 0631 ADVOCATE FOR CONSUMERS Non Lapsing Committed 7,630,103 1,010,943 7,519,498 629,593EB0 DEPUTY MAYOR FOR PLANNING AND ECON DEV 0419 H ST RETAIL PRIORITY AREA GRANT FUND Non Lapsing Committed 10,183,303 2,195,181 8,330,918 2,911,287
0602 SOCCER STADIUM FINANCING FUND Non Lapsing Committed 15,022,1690609 INDUSTRIAL REVENUE BOND PROGRAM Non Lapsing Committed 1,479,620 2,683,783 1,394,080 1,325,9380632 AWC & NCRC DEVELOPMENT (ED SPECIAL ACCT) Non Lapsing Committed 21,265,057 24,493,812 9,113,359 24,671,373
EN0 DEPT OF SMALL & LOCAL BUSINESS DEVELOPMT 0632 SMALL BUSINESS CAPITAL ACCESS FUND Non Lapsing Committed 247,009 247,009ID0 BUSINESS IMPROVEMENT DISTRICTS TRANSFER 2003 BUSINESS IMPROVEMENT DISTRICTS (BIDS) Lapsing Not Applicable 28,507,042 27,403,754LQ0 ALCOHOLIC BEVERAGE REGULATION ADMIN. 6017 ABC - IMPORT AND CLASS LICENSE FEES Non Lapsing Committed 7,857,089 6,877,123 5,724,789 6,402,642(Continued on next page)

Rev
enue
FY
2019 P
roposed
Budget an
d F
inan
cial Plan
3-56 Table 3-17A (Continued)Special Purpose (O-type) Revenue Funds, Revenues and Fund Balances, Fiscal Years 2016 and 2017
FY 2016 FY 2016 FY 2017 FY 2017
Actual End of Year Actual End of Year
Type Classification Revenue Fund Balance Revenue Fund Balance
ECONOMIC DEVELOPMENT AND REGULATION (continued)SR0 DEPART OF INSURANCE,SECURITIES & BANKING 2100 HMO ASSESSMENT Non Lapsing Committed 906,763 150,439 1,057,015 209,273
2200 INSURANCE ASSESSMENT Non Lapsing Committed 5,711,176 2,067,534 6,009,683 1,607,1572300 SECURITIES BROKER/DEALER LICENSES Lapsing Not Applicable 3,319,770 3,693,5622350 SECURITIES AND BANKING FUND Lapsing Not Applicable 8,905,647 9,144,6112500 INVESTMENT ADVISORS LICENSES Lapsing Not Applicable 546,065 558,3902600 SECURITIES REGISTRATION FEES Lapsing Not Applicable 13,575,444 13,523,0642800 CAPTIVE INSURANCE Lapsing Not Applicable 2,021,298 2,241,9462910 FORECLOSURE MEDIATION FUND Non Lapsing Committed 12,350 117,900 11,750 111,7502911 FORECLOSURE MEDIATION FUND (TEMPORARY) Non Lapsing Restricted 1,604,451 649,7302950 CAPITAL ACCESS FUND Non Lapsing Restricted 44,413 4,301,967 14,999 4,316,9662951 LOAN PARTICIPATION FUND Non Lapsing Restricted 19,525 3,574,902 4,542,402 8,117,305
PUBLIC SAFETY AND JUSTICE 35,751,175 21,189,359 38,680,145 18,564,474FA0 METROPOLITAN POLICE DEPARTMENT 1555 REIMBURSABLE FROM OTHER GOVERNMENTS Lapsing Not Applicable 722,301 846,486
1614 MISCELLANEOUS Lapsing Not Applicable 4,381,252 4,121,8771650 MONETARY EVIDENCE Lapsing Not Applicable 137278 ASSET FORFEITURE Non Lapsing Restricted 224,110 2,015,812 675,587 2,042,812
FB0 FIRE AND EMERGENCY MEDICAL SERVICES 1200 AUTOMATED EXT DEFIB REG FEE FUND Non Lapsing Committed 4,944 4,944 100 5,0441555 REIMBURSABLE FROM OTHER GOVERNMENTS Lapsing Not Applicable 90,9091613 OTHER REVENUE Lapsing Not Applicable 25,800 28,7066100 SPECIAL EVENTS Lapsing Not Applicable 552,421 278,492
FL0 DEPARTMENT OF CORRECTIONS 0600 CORRECTIONS TRUSTEE REIMBURSEMENT Non Lapsing Committed 15,826,433 2,071,725 17,507,444 1,734,2220601 CONCESSION INCOME Non Lapsing Committed 927,134 1,506,7210602 WELFARE ACCOUNT Non Lapsing Committed 93,605 721,282 315,973 751,7220605 CORRECTIONS REIMBURSEMENT -JUVENILES Non Lapsing Restricted 610,966 538,267 211,182 450,482
FO0 OFFICE OF VICTIM SVCS AND JUSTICE GRANTS 0620 CRIME VICTIMS ASSISTANCE FUND Non Lapsing Restricted 422,018 1,311,434 4,932,4890621 DOM VIOLENCE SHELTER&TRANS HOUSING FUND Non Lapsing Restricted 24,523
FQ0 DEPUTY MAYOR FOR PUBLIC SAFETY & JUSTICE 0620 CRIME VICTIMS ASSISTANCE FUND Inactive Restricted 4,744,8590621 DOM VIOLENCE SHELTER&TRANS HOUSING FUND Inactive Restricted 1,024,523
FW0 MOTOR VEHICLE THEFT PREVENTION COMM 0601 INSURANCE VIOLATION FINES Repealed Not Applicable 80,793 25,090UC0 OFFICE OF UNIFIED COMMUNICATIONS 1630 911 & 311 ASSESSMENTS Non Lapsing Committed 11,283,867 6,937,911 11,187,070 7,437,247
1631 PREPAID WIRELESS 911 CHARGES Non Lapsing Committed 595,519 3,130,037 573,072 1,185,934(Continued on next page)

FY
2019 P
roposed
Budget an
d F
inan
cial Plan
Rev
enue
3-57
Table 3-17A (Continued)Special Purpose (O-type) Revenue Funds, Revenues and Fund Balances, Fiscal Years 2016 and 2017
FY 2016 FY 2016 FY 2017 FY 2017
Actual End of Year Actual End of Year
Type Classification Revenue Fund Balance Revenue Fund Balance
PUBLIC EDUCATION SYSTEM 8,757,515 29,616,090 9,321,238 33,207,334CE0 DC PUBLIC LIBRARY 0104 GIFTS-DONATIONS Non Lapsing Restricted 5,863 5,863
0140 RESTRICTED GIFTS AND DONATIONS Non Lapsing Restricted 7,318 7,3181601 ALBERT ATWOOD MEMORIAL FUND Non Lapsing Restricted 70 5,717 135 6,1621602 THOMAS J BROWN MEMORIAL FUND Non Lapsing Restricted 63 5,162 133 5,5511603 KATHLEEN DILLON FRAZE MEM TRUST FUND Non Lapsing Restricted 49 4,030 104 4,3441604 FREDERICK MCREYNOLDS TRUCT FUND Non Lapsing Restricted 8 671 17 7231605 MINER TRUST FUND Non Lapsing Restricted 33 2,693 69 2,9031606 THEODORE W NOYES TRUST FUND Non Lapsing Restricted 217 17,691 456 19,0701607 HENRY PASTOR MEMORIAL TRUST FUND Non Lapsing Restricted 2 154 4 1671608 GEORGETOWN PEABODY Non Lapsing Restricted 28,426 1,184,315 30,596 1,276,7511609 SOPHY CARR STANTON MEM TRUST FUND Non Lapsing Restricted 216 17,597 454 18,9691610 HATTIE M STRONG TRUST FUND Non Lapsing Restricted 37 2,999 77 3,2331611 WOMENS ANTROPOLOGICAL SOCIETY TRST-DCPL Non Lapsing Restricted 291 23,693 611 25,5391612 MISCELLANEOUS Non Lapsing Restricted 3,679 297,839 7,695 321,0611613 HENRIETTA WINANT TRUST FUND Non Lapsing Restricted 65 5,264 136 5,6741614 MARION F. ROCKEFELLER GIFT Non Lapsing Restricted 5 398 10 4296108 COPIES AND PRINTING Non Lapsing Committed 192,404 410,878 186,401 447,2796150 SLD E-RATE REIMBURSEMENT Non Lapsing Restricted 828,061 791,841 918,818 1,186,4876160 REVENUE GENERATING ACTIVITIES Lapsing Not Applicable 106,176 51,345
GA0 DISTRICT OF COLUMBIA PUBLIC SCHOOLS 0602 ROTC Non Lapsing Restricted 865,305 311,837 814,413 1,126,2490607 CUSTODIAL Lapsing Not Applicable 344,455 402,2700609 SECURITY Lapsing Not Applicable 662,026 773,2450611 CAFETERIA Lapsing Not Applicable 762,897 869,6030613 VENDING MACHINE SALES Lapsing Not Applicable 46,071 60,7350621 PARKING FEES Lapsing Not Applicable 160,091 125,4770633 DHHS AFTERSCHOOL PROG-COPAYMENT Non Lapsing Committed 493,250 10,452 721,243 731,6960634 E-RATE EDUCATION FUND Non Lapsing Restricted 2,201,594 91,423 2,821,367 2,912,7900640 DCPS NONPROFIT SCHOOL FOOD SERVICE Non Lapsing Restricted 456,843 12,028,368 324,534 11,187,023
GD0 STATE SUPERINTENDENT OF EDUCATION (OSSE) 0603 STATE SUPERINTENDENT OF EDUCATION FEES Lapsing Not Applicable 166,147 223,6930604 GED TESTING FEES Repealed Not Applicable 40,794 00610 CHARTER SCHOOL CREDIT ENHANCEMENT FUND Non Lapsing Restricted 387,561 13,303,843 24,363 13,328,2070618 STUDENT RESIDENCY VERTIFICATION FUND Non Lapsing Committed 522,265 936,913 358,131 434,5150619 STATE ATHLETIC ACTS PROG & OFFICE FUND Non Lapsing Committed 98,210 149,132 96,229 149,3336007 SITE EVALUATION Lapsing Not Applicable 306,577 331,6996011 PRE-K PROGRAM ASSISTANCE FUND Repealed Not Applicable 83,625 177,175
(Continued on next page)

Rev
enue
FY
2019 P
roposed
Budget an
d F
inan
cial Plan
3-58 Table 3-17A (Continued)Special Purpose (O-type) Revenue Funds, Revenues and Fund Balances, Fiscal Years 2016 and 2017
FY 2016 FY 2016 FY 2017 FY 2017
Actual End of Year Actual End of Year
Type Classification Revenue Fund Balance Revenue Fund Balance
HUMAN SUPPORT SERVICES 33,783,084 15,846,110 39,215,849 18,020,599HA0 DEPARTMENT OF PARKS AND RECREATION 0602 ENTERPRISE FUND ACCOUNT Non Lapsing Committed 2,654,028 1,868,425 2,772,584 1,651,761HC0 DEPARTMENT OF HEALTH 0605 SHPDA FEES Non Lapsing Committed 1,145,965 942,379 871,730 935,033
0606 VITAL RECORDS REVENUE Lapsing Not Applicable 2,548,699 2,616,0230612 FOOD HANDLERS CERTIFICATION Repealed Not Applicable 420,980 00614 ADJUDICATION FINES Lapsing Not Applicable 135,531 97,7550632 PHARMACY PROTECTION Non Lapsing Committed 1,199,973 1,968,189 2,892,628 2,296,9460633 RADIATION PROTECTION Lapsing Not Applicable 102,014 216,3990638 ANIMAL CONTROL DOG LICENSE FEES Repealed Not Applicable 68,914 00641 OTHER MEDICAL LICENSES AND FEES Repealed Not Applicable 557,290 528,3240643 BOARD OF MEDICINE Non Lapsing Committed 7,754,321 3,951,197 10,981,642 6,317,7950644 NON-LAPSING: SPAY AND NEUTERING FUND Non Lapsing Committed 12,813 16,606 29,4190649 HEALTH FACILITY FEE Repealed Not Applicable 214,908 00655 SHPDA ADMISSION FEE Non Lapsing Committed 407,616 26,899 387,709 2860656 EMS FEES Lapsing Not Applicable 124,192 95,6490661 ICF / MR FEES & FINES Non Lapsing Committed 142,503 202,503 135,541 50,6020662 CIVIC MONETARY PENALTIES Non Lapsing Restricted 111,186 831,370 489,517 1,320,8870673 DOH - REGULATORY ENFORCEMENT FUND Partial Repealed Restricted 26,342 176,473 28,275 128,2750676 COMMUNICABLE AND CHRONIC DISEASE Non Lapsing Committed 2,303,840 1,459,438
HT0 DEPARTMENT OF HEALTH CARE FINANCE 0631 MEDICAID COLLECTIONS-3RD PARTY LIABILITY Non Lapsing Committed 2,149,294 595,296 1,061,747 202,6880632 BILL OF RIGHTS-(GRIEVANCE & APPEALS) Non Lapsing Committed 871,257 755,352 793,477 606,9570633 MEDICAID RECOVERY AUDIT CONTRACTOR Non Lapsing Committed 142 00634 ASSESSMENT FUND Non Lapsing Committed 115,135 58,954 58,053 42,9180653 DC GENERAL COLLECTIONS Repealed Not Applicable 245 420
JA0 DEPARTMENT OF HUMAN SERVICES 0603 SSI PAYBACK Non Lapsing Committed 871,340 2,427,153 793,522 493,5220613 FOOD STAMPS COLLECTION-FRAUD Lapsing Not Applicable 228,045 245,3770629 AGREEMENT WITH INDEPENDENT AGENCIES Lapsing Not Applicable 767,000 447,132
JM0 DEPARTMENT ON DISABILITY SERVICES 0610 VOCATION REHAB SERVICE REIMBURSEMENT Lapsing Not Applicable 104,475 53,0560611 COST OF CARE-NON-MEDICAID CLIENTS Non Lapsing Restricted 5,694,389 1,826,647 5,416,032 1,829,4220616 RANDOLPH SHEPHERD UNASSIGNED FACILITIES Non Lapsing Restricted 1,114,245 14,648 1,158,303 87,427
RL0 CHILD AND FAMILY SERVICES AGENCY 0601 H.U.M.N. - HUMAN RES. - ES Non Lapsing Restricted 1,200,000 1,200,000RM0 DEPARTMENT OF BEHAVIORAL HEALTH 0610 DMH FEDERAL BENEFICIARY REIMBURSEMENT Lapsing Not Applicable 2,650,601 3,021,655
0640 DMH MEDICARE & 3RD PARTY REIMBURSEMENT Non Lapsing Restricted 384,682 168,429 508,838 552,2880641 DMH ENTERPRISE FUND Lapsing Not Applicable 11,805 18,426
VA0 OFFICE OF VETERANS AFFAIRS 0600 OFFICE OF VETERANS AFFAIS FUND Non Lapsing Committed 6,110 19,240 5,590 14,934(Continued on next page)

FY
2019 P
roposed
Budget an
d F
inan
cial Plan
Rev
enue
3-59
Table 3-17A (Continued)Special Purpose (O-type) Revenue Funds, Revenues and Fund Balances, Fiscal Years 2016 and 2017
FY 2016 FY 2016 FY 2017 FY 2017
Actual End of Year Actual End of Year
Type Classification Revenue Fund Balance Revenue Fund Balance
PUBLIC WORKS 142,417,800 125,347,012 151,238,142 83,034,713KA0 DEPARTMENT OF TRANSPORTATION 6000 GENERAL "O" TYPE REVENUE SOURCES Lapsing Not Applicable 648,524 562,055
6140 TREE FUND Non Lapsing Committed 1,399,905 1,891,882 572,734 720,8206555 MALL TUNNEL LIGHTING Lapsing Not Applicable 246,010 236,2836901 DDOT ENTERPRISE FUND-NON TAX REVENUES Non Lapsing Committed 7,516,235 5,697,764 6,028,875 2,432,2986903 BICYCLE SHARING FUND Non Lapsing Committed 5,576,291 -61,528 9,126,645 2,328,8846905 PARKING METER PAY BY PHONE TRANSN FEE Lapsing Not Applicable 0 5,800,0006909 TRANSPORTATION INFRASTRUCTURE MITIGATION Non Lapsing Committed 912,084 3,131,421 100,000 3,231,4216910 VISION ZERO PEDESTRIAN & BICYCLE SAFETY Non Lapsing Committed 500,065 268,627 500,000 449,466
KE0 MASS TRANSIT SUBSIDIES 0601 PARKING METER WMATA Non Lapsing Committed 42,546,549 4,442,230 42,907,195 2,563,8636030 WASH MET AREA TRANSIT AUTHORITY PROJECTS Non Lapsing Committed 3,140,431 56,168 1,898,196 56,1686031 DC CIRCULATOR FUND - NPS MALL ROUTE Non Lapsing Committed 56,853 56,853 356,667 413,5206501 WMATA OPERATIONS SUPPORT FUND Non Lapsing Committed 35,777,018 0
KG0 DEPARTMENT OF ENERGY AND ENVIRONMENT 0602 AIR QUALITY CONSTRUCTION PERMITS Non Lapsing Restricted 35,212 67,864 20,426 29,6440603 FISHING LICENSE Non Lapsing Restricted 94,423 235,142 96,705 149,0290609 LUST TRUST FUND Non Lapsing Restricted 328,384 323,3840634 SOIL EROSION/SEDIMENT CONTROL Non Lapsing Committed 1,280,946 448,232 1,280,367 424,4470645 PESTICIDE PRODUCT REGISTRATION Non Lapsing Committed 2,184,826 1,819,088 2,388,977 1,799,2340646 STORM WATER FEES Non Lapsing Committed 1,694,490 1,003,724 1,989,524 1,462,5500647 MOLD ASSESSMENT AND REMEDIATION FUND Non Lapsing Committed 7,487 7,487 42,867 50,3540650 PRODUCT STEWARDSHIP FUND Non Lapsing Committed 124,000 120,0010654 STORM WATER PERMIT REVIEW Non Lapsing Restricted 6,633,331 23,249,535 8,092,184 10,798,7040655 STORMWATER IN LIEU FEE Non Lapsing Restricted 5,812 5,812 8,034 380662 RENEWABLE ENERGY DEVELOPMENT FUND Non Lapsing Committed 19,921,033 23,347,682 15,883,168 32,193,0580663 CLEAN LAND FUND/BROWNFIELD REVITALIZATIO Non Lapsing Committed 131,301 4,126,554 338,440 2,891,7610667 WETLANDS FUND Semi Lapsing Committed 5,461 1,495,687 501,000 1,701,8170670 ANACOSTIA RIVER CLEAN UP FUND Non Lapsing Committed 902,579 3,539,231 2,550,483 3,513,5690680 PAYMENTS FROM INDEPENDENT AGENCIES Lapsing Not Applicable 32,481 84,0786201 ECONOMY II Non Lapsing Committed 25,970 25,8826202 RESIDENTIAL AID DISCOUNT (RAD) Lapsing Not Applicable 107,493 124,8236203 RESIDENTIAL ESSENTIAL SERVICES (RES) Lapsing Not Applicable 107,493 124,8236204 WASA UTILITY DISCOUNT PROGRAM Lapsing Not Applicable 107,644 124,8236400 DC MUNICIPAL AGGREGATION PROGRAM Non Lapsing Committed 180,836 125,069 150,874 150,6326500 BENCHMARKING ENFORCEMENT FUND Non Lapsing Committed 39,258 39,258 54,462 93,7206700 SUSTAINABLE ENERGY TRUST FUND Non Lapsing Committed 20,483,782 5,230,362 21,687,493 4,009,8596800 ENERGY ASSISTANCE TRUST FUND Non Lapsing Committed 2,045,237 524,794 2,044,304 440,6686900 SPECIAL ENERGY ASSESSMENT FUND Non Lapsing Committed 35,987 3,223 125,470 5,411
(Continued on next page)

Rev
enue
FY
2019 P
roposed
Budget an
d F
inan
cial Plan
3-60 Table 3-17A (Continued)Special Purpose (O-type) Revenue Funds, Revenues and Fund Balances, Fiscal Years 2016 and 2017
FY 2016 FY 2016 FY 2017 FY 2017
Actual End of Year Actual End of Year
Type Classification Revenue Fund Balance Revenue Fund Balance
PUBLIC WORKS (continued)KT0 DEPARTMENT OF PUBLIC WORKS 6000 GENERAL "O" TYPE REVENUE SOURCES Lapsing Not Applicable 305,509 353,050
6010 SUPER CAN PROGRAM Non Lapsing Committed 114,239 39,238 133,399 172,6386072 DISTRICT RECYCLE PROGRAM Lapsing Not Applicable 304,059 269,0206082 SOLID WASTE DISPOSAL FEE FUND Non Lapsing Committed 4,290,791 4,905,140 4,469,226 6,105,7876591 CLEAN CITY FUND Lapsing Not Applicable 1,627,439 1,756,304
KV0 DEPARTMENT OF MOTOR VEHICLES 6000 GENERAL "O" TYPE REVENUE SOURCES Lapsing Not Applicable 3,115,240 2,915,2796100 FEE - OUT-OF-STATE VEHICLE REGISTRATION Lapsing Not Applicable 245,451 160,4636258 MOTOR VEHICLE INSPECTION STATION Non Lapsing Committed 5,093,470 1,142,173 5,759,351 1,527,450
TC0 DEPARTMENT OF FOR-HIRE VEHICLES 2100 JUSTICE DEPARTMENT FINGERPRINTS Lapsing Not Applicable 15,296 6,3362400 PUBLIC VEHICLES FOR HIRE CONSUMER SERVIC Non Lapsing Committed 8,700,279 2,402,899 9,463,856 2,874,521
FINANCING AND OTHER 61,147,100 0 62,475,874 0DS0 REPAYMENT OF LOANS AND INTEREST 6462 PUBLIC SPACE RENTAL FEES FOR DEBT SRVC Lapsing Not Applicable 5,114,000 5,319,000EZ0 CONVENTION CENTER TRANSFER 6100 CONVENTION CENTER HOTEL GROUND LEASE PMT Lapsing Not Applicable 187,293PA0 PAY GO - CAPITAL 0600 SPECIAL PURPOSE REVENUE FUND Inactive Not Applicable 1,900,000
0609 IRB REVENUE FOR PAYGO Lapsing Not Applicable 737,5700654 STORM WATER PERMIT REVIEW - PAYGO Lapsing Not Applicable 4,500,000 4,500,0000667 WETLANDS FUND Lapsing Not Applicable 500,0000670 ANACOSTIA RIVER CLEAN UP FUND Lapsing Not Applicable 1,500,0006140 TREE FUND (EST DC ACT 14-614) Lapsing Not Applicable 452,0006330 LOCAL TRANSPORTATION REVENUE - PAYGO Lapsing Not Applicable 45,162,445 45,244,1216901 DDOT ENTERPRISE FUND NON TAX REVENUES Lapsing Not Applicable 1,309,891 972,3076903 BICYCLE SHARING FUND Inactive Not Applicable 1,164,1006909 TRANSPORTATION INFRASTRUCTURE MITIGATION Lapsing Not Applicable 496,663 4,563,584
Grand Total 533,556,533 352,096,337 548,366,686 297,783,671

FY 2019 Proposed Budget and Financial Plan Revenue
3-61
FY 2017RATE REVENUE
TAX DESCRIPTION (As of 1/1/2018) ($ in thousands)
REAL PROPERTY TAX All real property, unless expressly exempted, is subject tothe real property tax and is assessed at 100% of marketvalue.
The District of Columbia has four property classes:
Class 1 – improved residential real property that isoccupied and is used exclusively for non-transient residential dwellingpurposesClass 2 – commercial propertyClass 3 – vacant real propertyClass 4 – blighted real property
D.C. Code Citation: Title 47, Chapters 7-10, 13, 13A
Class 1 = $0.85 per $100 of assessed value
Note: For Class 1 owner-occupied residential real property,the first $73,350 of assessed value is exempt from tax.
Class 2 = $1.65 per $100 for the first $3 million ofassessed value; $1.85 per $100 for assessed value morethan $3 million
Class 3 = $5.00 per $100 of assessed value
Class 4 = $10.00 per $100 of assessed value
$2,427,742
Amount is net of$45,587 TaxIncrement Financing(TIF/PILOT) transfer.
PERSONAL PROPERTYTAX
Tax on all tangible property, except inventories, used oravailable for use in a trade or business. Such propertyincludes machinery, equipment, furniture, and fixtures.
D.C. Code Citation: Title 47, Chapter 15.
$3.40 per $100 of assessed value
Note: The first $225,000 of taxable value is excluded from tax.
$63,305
SALES AND USE TAX Tax on all tangible personal property and certain selectedservices sold or rented to businesses or individuals atretail in the District.
Groceries, prescription and non-prescription drugs, andresidential utility services are among those items exemptfrom the sales tax.
The use tax is imposed at the same rate as the sales taxon purchases made outside the District and then broughtinto the District to be used, stored or consumed, providingthat the purchaser has not paid the sales tax on thepurchases to another jurisdiction.
D.C. Code Citation: Title 47, Chapters 20 and 22.
A five-tier rate structure is presently in effect:
5.75% – General rate for tangible personal property andselected services
6% – Medical Marijuana sales are taxed at a 6% rateand are dedicated to the Healthy D.C. Fund.
10% – Restaurant meals, liquor for consumption off andon the premises, rental vehicles, prepaid telephone callingcards, merchandise sold at the baseball stadium, ticketssold for events at the Verizon Center, and merchandisesold at the Verizon Center.
14.8% – Hotels (transient accommodations)
18% – Parking motor vehicles in commercial lots
Note: The following portions of the sales tax go to theConvention Center Fund: 1% from restaurant meals and4.75% from transient accommodations.
Note: The 18% parking in commercial lots tax is dedicatedto WMATA
Note: Stadium-related sales tax revenue is dedicated tothe Ballpark Revenue Fund.
$1,150,763
Amount is net of transfers to: the ConventionCenter ($138,128),the Tax IncrementFinancing (TIF)Fund ($32,102),the BallparkRevenue Fund($17,764),WMATA($74,167), HealthySchools Fund($4,266), ABRA($1,170) and theHealthy D.C. Fund($835)
Table 3-18Summary of Major Taxes in the District of Columbia, Fiscal Year 2018

Revenue FY 2019 Proposed Budget and Financial Plan
3-62
ALCOHOLIC BEVERAGE TAX Tax on alcoholic beverages manufactured by a holder of amanufacturer’s license and beverages brought into D.C. bythe holder of a wholesaler’s license.
D.C. Code Citation: Title 25, Chapter 9
Beer = $2.79 per 31-gallon barrel
Champagne/sparkling wine = $0.45 per gallon
Distilled Spirits = $1.50 per gallon
Light wine (alcohol content 14% or less) = $0.30 per gallon
Heavy wine (alcohol content above 14%) = $0.40 pergallon
$6,641
FY 2017RATE REVENUE
TAX DESCRIPTION (As of 1/1/2018) ($ in thousands)
CIGARETTE TAX Tax on the sale or possession of cigarettes in the District.Cigarettes sold to the military and to the federalgovernment are exempt.
D.C. Code Citation: Title 47, Chapter 24.
$0.146 per cigarette ($2.94 per pack of 20 cigarettes andlittle cigars that weigh no more than 4.5 pounds perthousand). This includes a $0.42 per pack surtax in lieu of aretail sales tax (for packs of 20 or fewer cigarettes). Formore than 20 per pack, the surtax will be incrementallyincreased by $0.022 per each cigarette above 20.
$0.75 per ounce on moist snuff (finely cut, ground, orpowdered tobacco that is not intended to be smoked).
$29,530
CORPORATEFRANCHISE TAX
Tax on the net income of corporations having nexus in theDistrict. All corporations engaging in a trade, business orprofession in the District of Columbia must register.
D.C. Code Citation: Title 47, Chapter 18.
8.25% of taxable income
$250 minimum tax if gross receipts are $1 million or less;$1,000 minimum tax if gross receipts are over $1 million
$389,218
INDIVIDUAL INCOMETAX
Tax on the taxable income of an individual who isdomiciled in the District at any time during the tax year, orwho maintains an abode in the District for 183 or moredays during the year.
D.C. Code Citation: Title 47, Chapter 18.
First $10,000 = 4.0%
$10,000 < $40,000 = $400 + 6.0% of excess above$10,000
$40,000 < $60,000 = $2,200 + 6.5% of excess above$40,000
$60,000 < $350,000 = $3,500 + 8.5% of excess above$60,000
$350,000 < $1,000,000 = $28,150 + 8.75% of excessabove $350,000
More than $1,000,000 = $85,025+ 8.95% of excess above$1,000,000
$1,958,277
MOTOR VEHICLE EXCISETAX
Tax on the Issuance of every original and subsequentcertificate of title on motor vehicles and trailers.
D.C. Code Citation: Title 50, Chapter 22.
Based on manufacturer's shipping weight:
6% of fair market value – 3,499 lbs or less
7% of fair market value – 3,500 to 4,999 lbs
8% of fair market value – more than 5,000 lbs.
$45,915
Table 3-18Summary of Major Taxes in the District of Columbia, Fiscal Year 2018 (Continued)

FY 2019 Proposed Budget and Financial Plan Revenue
3-63
TOLL TELECOMMUNICATIONSTAX
Tax on gross receipts of companies providing tolltelecommunication service in the District, includingwireless telecommunication providers.
D.C. Code Citation: Title 47, Chapter 39.
10% of gross charges – residential11% of gross charges – nonresidential
Note: 1% of nonresidential telecommunications taxrevenue is dedicated to the Ballpark Revenue Fund.
$47,059
Amount is net of$2,484 Ballpark Revenue Fundtransfer.
INSURANCE PREMIUMSTAX
Tax on gross insurance premiums received on risks in theDistrict, less premiums received for reinsurance assumed,returned premiums and dividends paid to policy-holders.The tax is in lieu of all other taxes except real estate taxesand fees provided for by the District's insurance law.
D.C. Code Citation: Title 31; Title 47, Chapter 26.
1.7% on policy and membership fees and net premium receipts; 2.0% on companies that issueaccident and loss of health insurance (as of 10/1/08)and on HMOs (as of 1/1/09).
Note: The 2.0% premium tax on health insurers and75% of the 2.0% premium tax from HMOs is currentlydedicated to the Healthy D.C. Fund.
$62,745
Amount is net of$45,467 HealthyD.C. Fund Transfer.
ESTATE TAX Tax levied on the estate of every decedent dying while aresident of the District, and on the estate of everynonresident decedent owning property having a taxablestatus in the District at the time of his or her death.
D.C. Code Citation: Title 47, Chapter 37.
Tax due is determined by using the D.C. estate taxcomputation worksheet after computing the exempted amounts.
The estate tax threshold now conforms to the federallevel.
$41,215
PUBLIC UTILITY TAX The tax is imposed on the gross receipts of telephone,television, and radio companies, and on the unitsdelivered to customers of natural gas, electricity, andheating oil.
D.C. Code Citation: Title 47, Chapter 25.
Television, radio and telephone companies:10% of gross charges – residential11% of gross charges – nonresidential
Heating oil utilities:$0.17 per gallon – residential$0.187 per gallon – nonresidential
Natural gas utilities:$0.0707 per therm – residential$0.07777 per therm – nonresidential
Electric distribution utilities:$0.0070 per kilowatt hour – residential$0.0077 per kilowatt hour – nonresidential
Note: The additional surcharges on non-residential customers are dedicated to the BallparkRevenue Fund.
$130,186
Amount is net of$7,938 Ballpark Revenue Fundtransfer.
UNINCORPORATEDBUSINESS FRANCHISETAX
Tax on the net income of unincorporated businesses withgross receipts more than $12,000. A 30% salaryallowance for owners and a $5,000 exemption aredeductible from net income to arrive at taxable income.
A business is exempt if more than 80% of gross income isderived from personal services rendered by the membersof the entity and capital is not a material income-producing factor. A trade, business or professionalorganization that by law, customs or ethics cannot beincorporated is exempt.
D.C. Code Citation: Title 47, Chapter 18.
8.25% of taxable income
$250 minimum tax if gross receipts are $1 million or less; $1,000 minimum tax if gross receipts are over $1 million
$165,027
FY 2017RATE REVENUE
TAX DESCRIPTION (As of 1/1/2018) ($ in thousands)
Table 3-18 Summary of Major Taxes in the District of Columbia, Fiscal Year 2018 (Continued)

Revenue FY 2019 Proposed Budget and Financial Plan
3-64
DEED TRANSFER TAX Tax on each transfer of real property at the time the deedis submitted for recordation. The tax is based upon theconsideration paid for the transfer. Where there is noconsideration or where the amount is nominal, the basisof the transfer tax is the fair market value of the propertyconveyed.
D.C. Code Citation: Title 47, Chapter 9.
1.45% of consideration or fair market value
Note: For residential properties under $400,000, therate is 1.1% of consideration or fair market value.
Note: 15% of the deed transfer tax is dedicated to theHousing Production Trust Fund.
$160,336
Amount is net oftransfers to: theHousingProduction TrustFund ($28,445).
ECONOMIC INTERESTTAX
This tax is triggered by either one of the following twoelements:
(1) 80% or more of the assets of a corporation consist ofreal property located in the District of Columbia; or
(2) More than 50% of the gross receipts of the entity arederived from ownership or disposition of real property inDC.
The consideration is not always equal to the assessedvalue of the property. The consideration is what is paid forthe interest being transferred. If there is no tangibleconsideration, then the tax basis will be the assessedvalue of the property owned by the corporation.
DC Code Citation: Title 42, Chapter 11.
2.9% of consideration or fair market value $15,544
DEED RECORDATIONTAX
Tax on the recording of all deeds to real estate in theDistrict. The basis of the tax is the value of considerationgiven for the property. Where there is no consideration orwhere the consideration is nominal, the tax is imposed onthe basis of the fair market value of the property.
D.C. Code Citation: Title 42, Chapter 11.
1.45% of consideration or fair market value
Note: For residential properties under $400,000, therate is 1.1% of consideration or fair market value.
Note: Rate of 0.725% to elegible first-timehomebuyers for properties purchased for less than$625,000.
Note: 15% of the deed recordation tax is dedicated to the Housing Production Trust Fund.
$213,087
Amount is net oftransfers to: the HousingProduction TrustFund ($37,653).
Every transfer of an interest in a cooperative housingassociation in connection with the grant, transfer, orassignment of a proprietary leasehold or other proprietaryinterest, in whole or in part, shall be a transfer of aneconomic interest, and subject to the CooperativeRecordation Tax.
DC Code Citation: Title 42, Chapter 11.
2.9% of the consideration allocable to a deed thatevidences a transfer of an economic interest in acooperative housing association. For transfers ofeconomic interests in cooperative housing associations where the consideration allocable to thereal property is less than $400,000, the rate of the tax is2.2%.
$5,792CO-OP RECORDATION
PUBLIC SPACE RENTAL Tax on the commercial use of publicly owned propertybetween the property line and the street.
D.C. Code Citation: Title 10, Chapter 11.
Various rates exist for the following: Vault, Sidewalk(enclosed and unenclosed), Sidewalk Surface, and Fuel Oil Tank
$32,468
FY 2017RATE REVENUE
TAX DESCRIPTION (As of 1/1/2018) ($ in thousands)
Table 3-18 Summary of Major Taxes in the District of Columbia, Fiscal Year 2018 (Continued)

FY 2019 Proposed Budget and Financial Plan Revenue
3-65
BALLPARK FEE A fee on annual District gross receipts. It is levied onDistrict businesses with over $5 million in gross receipts.
D.C. Code Citation: Title 47, Chapter 27B.
Ballpark Fee Schedule:District gross receipts $5 million - $8 million = $5,500District gross receipts $8 million - $12 million =$10,800District gross receipts $12 million - $16 million =$14,000District gross receipts over $16 million = $16,500
Note: All revenue from this fee is dedicated to theBallpark Revenue Fund.
$0
Amount is net of$31,107 BallparkRevenue Fundtransfer.
MOTOR VEHICLE FUELTAX
The tax is imposed on every importer of motor fuels,including gasoline, diesel fuel, benzol, benzene, naphtha,kerosene, heating oils, all liquefied petroleum gases, andall combustible gases and liquids suitable for thegeneration of power for motor vehicles.
DC Code Citation: Title 47, Chapter 23
$0.235 per gallon
Note: All revenue from this tax is dedicated to theHighway Trust Fund.
$0
Amount is net of$26,099 HighwayTrust Fund transfer.
HEALTHCARE PROVIDERASSESSMENT
Assessment on the net resident revenue of each nursingfacility in the District.
D.C. Code Citation: Title 47, Chapter 12C.
A uniform amount per licensed bed (as specified byrules issued by the Mayor) is assessed up to 6% of anursing facility’s net resident revenue.
Note: All revenue from this assessment is dedicated to the Nursing Facility Quality of Care Fund.
$0
Amount is net of$13,949 Nursing Facility Quality ofCare Fund transfer
ICF-IDD ASSESSMENT The tax is assessed on the gross revenue of eachintermediate care facility for individuals with intellectual ordevelopmental disabilities (ICF-IDD) in the District.
DC Code Citation: Title 47, Chapter 12D
5.5% of gross revenue
Note: All revenue from this tax is dedicated to theStevie Sellows Quality Improvement Fund.
$0
Amount is net of$4,913 transfer toStevie Sellows.
FY 2017RATE REVENUE
TAX DESCRIPTION (As of 1/1/2018) ($ in thousands)
Table 3-18Summary of Major Taxes in the District of Columbia, Fiscal Year 2018 (Continued)
MEDICAID HOSPITALINPATIENT FEE
Hospitals in the District are charged a fee based on thehospital’s inpatient net patient revenue. The fee is in effectfor the fiscal year beginning October 1, 2017.
D.C. Code Citation: Title 44, Chapter 6D
0.448% of the hospital’s inpatient net patient revenue.
Note: All revenue from this fee is dedicated to theHospital Fund.
$0
Amount is net of$10,400 HospitalFund transfer.
MEDICAID HOSPITALOUTPATIENT FEE
Hospitals in the District are charged a fee based on thehospital’s outpatient gross patient revenue. The fee is ineffect for the fiscal year beginning October 1, 2017.
D.C. Code Citation: Title 44, Chapter 6C
0.142% of the hospital’s outpatient gross patientrevenue.
Note: All revenue from this fee is dedicated to theHospital Provider Fee Fund.
$0
Amount is net of$5,528 HospitalProvider Fee Fundtransfer.
___________________________Source of General Fund Revenue Amounts: Government of the District of Columbia Comprehensive Annual Financial Report. Year Ended September 30, 2017.


FY 2019 Proposed Budget and Financial Plan Operating Expenditures
4-1
4
Operating Expenditures
In FY 2017, the District's Local funds expenditures, excluding Dedicated Taxes, increased by $126.4
million, or 1.8 percent, over FY 2016. Since FY 2014, expenditures have increased by an average of 4.6
percent annually as depicted in Figure 4-1 and referenced in Table 4A-1. Table 4A-1 of the Appendix
displays Local funds expenditures by fiscal year for selected agencies and each appropriation title.
Dedicated Tax funds were segregated as separate funds beginning in FY 2007; their expenditures are
shown by agency and appropriation title in Table 4A-2 of the Appendix. They totaled $331.4 million in
FY 2017.
The $126.4 million Local funds increase in FY 2017 was partly due to spending increases of $25.1
million in the Department of Human Services, $22.3 million in the Department of Health Care Finance,
and a net of $126.8 million in the Public Education System agencies. Major spending decreases included
$89.6 million in Public Safety and Justice Settlement and Judgements, $47.4 million in the Housing
Production Trust Fund subsidy, and $35.7 million in the Office of Contracting and Procurement.
Figure 4-1Local Funds Actual Expenditures (Excluding Dedicated Taxes)Does Not Include Enterprise and Other Funds(Dollars in millions)
6,000
6,250
6,500
6,750
7,000
7,250
7,500
FY 2014 Expenditures FY 2015 Expenditures FY 2016 Expenditures FY 2017 Expenditures

Operating Expenditures FY 2019 Proposed Budget and Financial Plan
4-2
Figure 4-2 Local Funds Actual Expenditures (Excluding Dedicated Taxes) byAppropriation Title, by Fiscal YearDoes Not Include Enterprise and Other Funds(Dollars in millions)
On a general operating funds basis, including non-Local funds as well as Local, total expenditures
increased by an average of 5.2 percent annually from FY 2014 to FY 2017 (Table 4A-3 in the Appendix).
This chapter examines operating expenditures for the District and reflects expenditure trends.
Specifically, the chapter:
• Examines the growth in expenditures from FY 2014 to FY 2017 by area of spending (agency and
function); and
• Examines the growth by such categories as personal services, contractual services, and subsidies and
transfers.
This chapter focuses primarily on the District's Local funds actual expenditures. It does not discuss
capital expenditures, which are described in the Capital Appendices volume. Furthermore, it does not
include agencies whose operations are captured in other funds, such as proprietary funds and component
units of the District.
Figure 4-2 shows the growth trends of Local funds expenditures by appropriation title from FY 2014
through FY 2017. Tables 4A-1, 4A-2, and 4A-3 in the Appendix to this chapter provide additional detail
on Local, Dedicated Tax, and gross funds (including federal and private funds) expenditures in the largest
District agencies from FY 2014 through FY 2017. The following sections describe major elements of
growth during this time period, by appropriation title.
0
500
1,000
1,500
2,000
2,500
FY 2014 Expenditures FY 2015 Expenditures FY 2016 Expenditures FY 2017 Expenditures
Governmental Direction and Support Economic Development and Regulation Public Safety and Justice
Public Education System Human Support Services Public Works
Financing and Other

FY 2019 Proposed Budget and Financial Plan Operating Expenditures
4-3
Human Support ServicesThe FY 2017 Local funds expenditures of $1,802.2 million in this appropriation title reflect an
increase of $47.1 million, or 2.7 percent, from the FY 2016 expenditures of $1,755.2 million. Local
funds expenditures in the Human Support Services area increased by 3.1 percent (annual average)
from FY 2014 to FY 2017. The three agencies in this appropriation title that have the largest average
annual increases are the Department of Human Services (DHS), the Department on Disability Services
(DDS), and the Department of Parks and Recreation (DPR), accounting for 58.0 percent of the
expenditures of this appropriation title.
• Department of Health Care Finance (DHCF) - Even though expenditures were fairly flat from
FY 2014 to FY 2017, DHCF is the largest agency in the Human Support Services appropriation.
• Department of Human Services (DHS) - This is the second largest agency in the Human Support
Services appropriation title based on annual expenditures. There was a Local funds average annual
increase of 10.8 percent over the FY 2014 – FY 2017 period.
• Department on Disability Services (DDS) – Although only the fifth largest agency in the Human
Support Services appropriation title based on annual expenditures, DDS has the largest average
annual increase. The Local funds average annual increase for DDS is 26.4 percent over the FY
2014 – FY 2017 period.
• Department of Parks and Recreation (DPR) – As the eighth largest agency in the Human
Support Services appropriation title based on annual expenditures, DPR has the third largest
average annual increase. The Local funds average annual increase for DPR is 8.4 percent over the
FY 2014 – FY 2017 period.
Public Education System Local funds expenditures in the Public Education appropriation title increased by 5.9 percent (annual
average) from FY 2014 to FY 2017. District of Columbia Public Schools (DCPS) and the District of
Columbia Public Charter Schools (DCPCS) are budgeted through the Uniform Per Student Funding
Formula (UPSFF) (see District of Columbia Official Code §38-29). This formula provides a foundation
funding level for each student and weighting factors for such characteristics as grade levels and special
education categories. It also accounts for annual inflation and for changes in enrollment. Local funds
expenditures by the District of Columbia Public Charter Schools (DCPCS) were higher than any other
District agency in FY 2017, when DCPCS expenditures surpassed DCPS. Although DCPCS enrollment
is lower than that of DCPS, a facilities allowance is added to the DCPCS budget, making its total Local
funds expenditures higher. The facilities allowance is added because the District supports DCPS, but not
DCPCS, through its capital budget. DCPS Local fund expenditures surpassed DHCF expenditures in FY
2016. DHCF had the highest expenditures in the District from FY 2013 until FY 2015. DCPS also
employs more than one-fifth of all District employees.
Table 4-1 shows enrollment and Local funds expenditure trends for DCPS and DCPCS. Enrollment
in the two systems combined has consistently increased in the last 4 fiscal years.
• District of Columbia Public Schools (DCPS) – Expenditures in FY 2017 at DCPS increased by 6.7
percent over FY 2016. Enrollment increased by 0.2 percent from FY 2016 to FY 2017, and the
foundation level for the UPSFF increased to $9,682 in FY 2017, in accordance with the provisions of
District of Columbia Official Code §38-2909.
• District of Columbia Public Charter Schools (DCPCS) – Expenditures in FY 2017 for DCPCS in
Local funds increased by 5.5 percent over FY 2016. Enrollment increased by 6.7 percent from
FY 2016 to FY 2017, and expenditures per enrolled student increased.

Operating Expenditures FY 2019 Proposed Budget and Financial Plan
4-4
• Office of the State Superintendent of Education (OSSE) – As a result of the Public Education
Reform Amendment Act of 2007, a number of functions from the Department of Human Services,
the University of the District of Columbia, and DCPS moved to OSSE, and the agency has become
the state administering agency for most of the District’s grant funds for public education. Local funds
expenditures showed an increase of $9.4 million, or 7.4 percent, in FY 2017 over FY 2016.
• University of the District of Columbia (UDC) – The District’s subsidy to the University increased
by 8.0 percent from $71.9 million in FY 2016 to $77.7 million in FY 2017.
Public Safety and Justice
Local funds expenditures in the public safety area increased by 4.2 percent (annual average) from
FY 2014 to FY 2017. The two largest agencies in this appropriation title are the Metropolitan Police
Department (MPD) and the Fire and Emergency Medical Services Department (FEMS), accounting
for 65.8 percent of the expenditures of the appropriation title.
• Metropolitan Police Department (MPD) and Fire and Emergency Medical Services
Department (FEMS) – Expenditures at MPD increased from FY 2014 to FY 2017 by an average of
1.1 percent annually. Expenditures for FEMS increased by 4.9 percent (annual average) from
FY 2014 to FY 2017.
• Department of Corrections – This is the fourth largest agency in the Public Safety appropriation
title based on annual expenditures. There was a Local funds average annual increase of 5.7 percent
over the FY 2014 – FY 2017 period.
• Police Officers’ and Fire Fighters’ Retirement System – This is the third largest agency in the
Public Safety appropriation title based on annual expenditures. Under the 1997 Revitalization Act,
the Federal government assumed the District’s pre-June 1997 unfunded pension liability. In
subsequent years, salaries and the sizes of the FEMS and MPD workforce have increased. The
pension contribution has fluctuated in recent years and has increased by 10.1 percent overall between
FY 2014 and FY 2017.
Table 4-1Enrollments and Expenditures in Two Schools Systems (Local Funds Only)
DC Public Schools Public Charter Schools Combined Systems
Enrollment Expenditures Enrollment Expenditures Enrollment Expenditures Expenditures
(dollars in (dollars in (dollars in per enrolled
thousands) thousands) thousands) student*2014 46,393 $653,800 36,565 $627,979 82,958 $1,281,778 $15,451 2015 47,548 $708,087 37,684 $661,074 85,232 $1,369,161 $16,064 2016 48,439 $728,787 38,905 $738,844 87,344 $1,467,630 $16,803 2017 48,555 $777,577 41,506 $779,669 90,061 $1,557,246 $17,291 Annual Growth Rate (2014 - 2017) 1.5% 5.9% 4.3% 7.5% 2.8% 6.7% 3.8%Note: *enrolled student (whole dollars, not thousands). All enrollment numbers were provided by the Office of the State Superintendent of Education (OSSE) on 2/15/18 form their website(https://osse.dc.gov/sites/default/files/dc/sites/osse/release_content/attachments/More%20Families%20Choose%20DC’s%20Public%20Schools%20for%20Ninth%20Consecutive%20Year%20Press%20Release.pdf) and may not match previous years reports.
Details may not sum due to rounding.
Source of student enrollment: http://www.dcpcsb.org/data/student-enrollment

FY 2019 Proposed Budget and Financial Plan Operating Expenditures
4-5
Financing and OtherAgencies in the Financing and Other appropriation title include various debt service functions as well
as the District's reserve funds.
• Repayment of Loans and Interest – The District may issue long-term debt in the form of General
Obligation Bonds or Income Tax Secured Revenue Bonds to finance capital projects and to refund
indebtedness of the District. Such bond issuances are not permitted during any fiscal year if total debt
service on tax-supported debt exceeds 12 percent of total District general fund expenditures in any
year during the 6-year capital plan period. The Capital Improvements Plan included bond issuance
authority to finance specific capital projects totaling $1.15 billion in Fiscal Year 2017. The District
had approximately $4.08 billion of General Obligation Bonds and approximately $4.03 billion of
Income Tax Secured Revenue Bonds outstanding as of September 30, 2017.
• Bond Anticipation Notes (BANs) – The District may issue Bond Anticipation Notes in the form of
Commercial Paper, Draw-Down Bonds, and other short-term facilities to meet interim capital
funding needs. Up to $600 million of the total $1.15 billion bond issuance authority can be financed
through the issuance of BANs.
• Equipment Lease Operating – The Master Equipment Lease/Purchase Program provides
tax-exempt financing for projects with short-term to intermediate-term useful lives. Rolling stock
such as police, emergency, and public works vehicles, as well as information technology equipment,
are acquired on a short-term lease/purchase basis. The District has financed approximately $537
million of its capital equipment needs through the program and has approximately $34.7 million in
principal outstanding as of September 30, 2017. This financing mechanism is being replaced and the
District began to issue short-term bonds for the acquisition of these types of assets in FY 2017.
• Repayment of Revenue Bonds – The Council may authorize the issuance of revenue bonds, notes,
or other obligations (including refunding bonds, notes, or other obligations) to borrow funds to
finance governmental projects by creating a security interest in any District revenues. Such bonds,
notes, or other obligations, if issued, are to be secured by a pledge of the revenues realized from the
property, facilities, developments, and improvements financed by the issuance of such bonds, notes,
or other obligations or by the mortgage of real property or the creation of security interest in available
revenues, assets, or other property. In FY 2007, FY 2010, and FY 2013, the District issued bonds for
its New Communities Initiative, with such bonds secured by a portion of revenues dedicated to the
Housing Production Trust Fund. The District had approximately $110 million of these bonds
outstanding as September 30, 2017.
• Pay-As-You-Go (Paygo) Capital Fund – Paygo capital financing is a transfer of funds from the
General Fund to the Capital Improvements Fund to pay for capital project expenditures. Although
Paygo is essentially cash financing, capital activities funded with Paygo dollars must be
capital-eligible as defined by the Home Rule Act and OCFO policy. Significant amounts of Paygo
capital funding is planned for the current 6-year capital plan period.
Other Appropriation TitlesExpenditures in other appropriation titles are:
• Governmental Direction and Support
This appropriation title funds agencies that manage overall government operations, including the
Department of General Services, the Office of the Mayor, the Council of the District of Columbia,
the Office of the City Administrator, the Office of the Chief Technology Officer, the Office of the
Attorney General, and the Office of the Chief Financial Officer. Local funds expenditures in this

Operating Expenditures FY 2019 Proposed Budget and Financial Plan
4-6
appropriation title have shown an average increase in growth at 6.8 percent annually from FY 2014
to FY 2017.
• Economic Development and Regulation
This is the smallest of the appropriation titles. The Department of the Consumer and Regulatory
Affairs, the Housing Authority Subsidy, the Office of the Deputy Mayor for Planning and Economic
Development, the Department of Employment Services, the Housing Production Trust Fund Subsidy,
and the Department of Housing and Community Development accounted for 80.6 percent of the
expenditures in this title in FY 2017. Local funds expenditures increased from FY 2014 to FY 2017
at an average rate of 8.5 percent annually.
• Public Works
The Public Works appropriation title is dominated, in Local funds expenditures, by three agencies:
the Department of Public Works (DPW), the Department of Transportation (DDOT), and the subsidy
to the Washington Metropolitan Area Transit Authority (WMATA). DPW increased by 2.0 percent,
on average, annually from FY 2014 to FY 2017 for Local funds, while the Department of
Transportation decreased by 1.8 percent for Local funds. The Washington Metropolitan Area Transit
Authority (WMATA) increased by 7.1 percent, on average, annually from FY 2014 to FY 2017 for
Local funds. Local funds expenditures in this appropriation title have shown an average increase in
growth at 4.0 percent annually from FY 2013 to FY 2016.
Summary of Local Funds Expenditure Growth by Agency and FunctionAll appropriation titles experienced increases in total average annual expenditures since FY 2014. As
shown in Table 4A-1, the average annual rate for all appropriation titles District-wide from FY 2014
through FY 2017 is 4.6 percent. Public Education, the largest appropriation title and comprising 28.1
percent of total Local funds expenditures, grew faster than average at an average annual rate of 5.9
percent. The second largest appropriation group, Human Support Services and comprising 28.1
percent share of total Local funds expenditures, grew at a slower than average rate at 3.1 percent.
Financing and Other Funds, Public Works and Public Safety and Justice also grew at a slower rate at
2.9 percent, 4.0 percent and 4.2 percent respectively, while Governmental Direction and Support and
Economic Development and Regulations grew faster at 6.8 percent and 8.5 percent respectively.
Federal Payment ExpendituresA federal payment is a direct payment made to the District by the Federal government. The
authorization for each payment is found in Division A, Title 1, of the District’s annual Appropriations
Act. Federal payments to the District are subject to federal Government Accountability Office (GAO)
guidelines and government-wide rescissions. During FY 2017, the federal government appropriated a
total of $122.9 million in federal payments to the District that could be spent by the agencies. Table
4A-5 of the Appendix details the federal payments made to the District from FY 2014 through
FY 2017, by agency. These funds have various availability periods and, in some cases, will be spent
over subsequent years. Federal payments are detailed within each agency’s budget chapter.
In addition, in FY 2017 the District spent $17.1 million from the federal payment for Emergency
Planning and Security Costs. This payment was previously reimbursable, subject to the approval of
the Office of Management and Budget (OMB). In FY 2009, this became a direct federal payment. The
details of the FY 2017 expenses are found in the agency budget chapter for the Emergency Planning
and Security Fund, which is located within the Financing and Other section of Volume 4, Agency
Budget Chapters.

FY 2019 Proposed Budget and Financial Plan Operating Expenditures
4-7
Federal Grants ExpendituresUnlike federal payments, which come directly from the U.S. Treasury as authorized by the annual
Appropriations Act, federal grants are awarded by federal agencies.
Table 4A-6 of the Appendix shows federal grant expenditures from FY 2014 through FY 2017 by
agency. Overall, their annual growth rate was 5.6 percent. The Department of Health Care Finance
received the majority of the funds, consisting primarily of funding for Medicaid.
Expenditure Growth by Object Class, FY 2013 to FY 2016This section examines expenditures by object class – that is, by the type of services paid for, such as
personal services, supplies, or fixed costs for rent or utilities – from FY 2014 through FY 2017. Since
FY 2014, the rate of growth for Local funds expenditures for nonpersonal services (NPS), such as
contractual services, equipment and equipment rental, subsidies and transfers, and debt service, has
risen along with personal services (PS), which include regular salaries and wages and other additional
costs (Figure 4-3). The average annual growth rate from FY 2014 to FY 2017 for Locally funded
personal services (PS) has increased 5.6 percent. Tables 4A-7 and 4A-8 in the appendix to this chapter
provide details.
Personal ServicesFrom FY 2014 to FY 2017, total Local Funds personal services costs including salaries, extra pay (the
category including overtime), differential pay (for night or weekend work, for example), and fringe
benefits (primarily health insurance costs) increased at an average annual rate of 5.6 percent (see table
4A-7).
Table 4-2 shows overtime expenses from FY 2014 through FY 2017 by agency. The Metropolitan Police
Department, Fire and Emergency Medical Services Department, Department of Public Works, Department of
General Services, Department of Corrections, DC Public Schools, Department of Behavioral Health,
Department of Youth Rehabilitation Services, and Special Education Transportation comprise 88.6 percent of
the total FY 2017 overtime expenditures.
Nonpersonal Services As shown in Table 4A-7 of the Appendix, the average annual growth rate from FY 2014 to FY 2017
for Local Funds nonpersonal expenditures, excluding retirement, is 4.4 percent.

Operating Expenditures FY 2019 Proposed Budget and Financial Plan
4-8
Figure 4-3Local Personal Services and Nonpersonal Services Actual Expenditures (Excluding Dedicated Taxes) (Does Not Include Enterprise and Other Funds)(Dollars in millions)
2,204 2,343 2,505 2,594
4,166 4,377
4,667 4,704
0
1,000
2,000
3,000
4,000
5,000
6,000
7,000
8,000
FY 2014 Expenditures FY 2015 Expenditures FY 2016 Expenditures FY 2017 Expenditures
Nonpersonal Services
Personal Services

FY 2019 Proposed Budget and Financial Plan Operating Expenditures
4-9
Table 4-2 Overtime Actual Expenditures from Local Funds and Dedicated Taxes(Excluding Enterprise and Other Funds)(Dollars in thousands)
Agency Name FY 2014 FY 2015 FY 2016 FY 2017Metropolitan Police Department 21,198 20,849 19,014 23,872 Fire and Emergency Medical Services Department 10,584 10,451 21,205 21,442 Department of Corrections 3,739 4,225 9,684 15,062 Department of Public Works 6,350 6,190 7,164 8,341 Special Education Transportation 3,754 3,284 4,152 5,322 Department of Youth Rehabilitation Services 2,681 2,012 4,304 4,910 Department of General Services 2,928 4,744 6,559 4,756 District of Columbia Public Schools 3,130 3,447 3,043 2,769 Department of Behavioral Health 2,377 3,380 2,678 2,473 Office of Unified Communications 1,113 2,254 2,366 2,243 Department of Transportation 1,185 2,324 2,959 2,227 Department of Human Services 906 2,071 1,736 1,718 Child and Family Services Agency 1,294 1,326 1,304 1,387 Department of Parks and Recreation 665 564 961 991 Office of the Chief Financial Officer 541 638 479 312 Rest of District 1,881 2,253 2,908 2,555 Total Local Funds 64,326 70,011 90,518 100,381 Notes:1) The 15 selected agencies reflected overtime costs in excess of $600,000 in any one year2) The "Rest of District" is comprised of the remaining 46 agencies.3) Details may not sum due to rounding.

Operating Expenditures FY 2019 Proposed Budget and Financial Plan
4-10
Appendix: Data Tables for Operating Expenditures
Table 4A-1
Local Funds Actual Expenditures by Fiscal Year for Selected Large Agencies(Excluding Dedicated Taxes and Enterprise and Other Funds)(Dollars in thousands)
Average AnnualGrowth Rate
Agency Name FY 2014 FY 2015 FY 2016 FY 2017 2014-2017
Department of General Services 248,468 286,950 318,410 327,877 9.7%
Office of the Chief Financial Officer 108,865 113,840 118,045 124,908 4.7%
Office of the Chief Technology Officer 53,499 55,750 55,353 65,740 7.1%
Office of the Attorney General 59,813 64,039 53,937 56,616 -1.8%
Office of Finance and Resource Management 19,091 18,999 20,800 23,230 6.8%
Office of Contracting and Procurement 12,116 16,123 58,338 22,664 23.2%
Council of the District of Columbia 19,745 19,511 21,174 22,289 4.1%
Office of the Inspector General 13,010 14,009 12,591 13,807 2.0%
The Innovation Fund 15,000 0 0 0 -100.0%
All Other Agencies 47,586 53,503 66,081 69,437 13.4%
Total Governmental Direction and Support 597,192 642,724 724,729 726,567 6.8%
Department of Employment Services 46,058 56,819 58,144 61,079 9.9%Housing Authority Subsidy 34,934 37,699 55,696 54,623 16.1%Housing Production Trust Fund (Subsidy) 38,966 0 90,179 42,732 3.1%Commission on Arts and Humanities 14,935 13,639 14,336 19,884 10.0%Department of Consumer and Regulatory Affairs 13,978 13,804 17,222 19,317 11.4%Department of Housing and Community Development 11,569 10,472 20,853 19,173 18.3%Deputy Mayor for Planning and Economic Development 18,266 20,186 17,171 16,461 -3.4%All Other Agencies 28,718 25,131 27,716 31,606 3.2%
Total Economic Development and Regulation 207,423 177,751 301,316 264,875 8.5%
Metropolitan Police Department 490,703 478,360 496,864 507,188 1.1%Fire and Emergency Medical Services Department 215,284 216,672 239,097 248,566 4.9%Police and Firefighters' Retirement System 109,199 103,430 135,577 145,627 10.1%Department of Corrections 114,521 117,540 123,167 135,051 5.7%Office of Unified Communications 28,042 27,090 28,750 31,399 3.8%Department of Forensic Sciences 11,856 15,205 20,865 20,529 20.1%Deputy Mayor for Public Safety and Justice 18,348 19,517 683 1,683 -54.9%Section 103 Judgements and Settlements - Public Safety and Justice 421 0 89,938 340 -6.9%All Other Agencies 25,380 29,427 53,750 57,852 31.6%
Total Public Safety and Justice 1,013,756 1,007,241 1,188,692 1,148,235 4.2%(Continued on next page)

FY 2019 Proposed Budget and Financial Plan Operating Expenditures
4-11
Table 4A-1 (continued)
Local Funds Actual Expenditures by Fiscal Year for Selected Large Agencies(Excluding Dedicated Taxes and Enterprise and Other Funds)(Dollars in thousands)
Average AnnualGrowth Rate
Agency FY 2014 FY 2015 FY 2016 FY 2017 2014-2017Public Charter Schools 627,979 661,074 738,844 779,669 7.5%
District of Columbia Public Schools 653,800 708,087 728,787 777,577 5.9%
State Superintendent of Education (OSSE) 122,677 137,856 126,659 136,062 3.5%
Special Education Transportation 86,052 86,222 85,649 89,300 1.2%
University of the District of Columbia Subsidy 66,691 73,458 71,942 77,671 5.2%
Non-Public Tuition 77,413 74,340 66,092 64,752 -5.8%
Teachers' Retirement System 31,573 39,443 44,359 56,618 21.5%
District of Columbia Public Library 53,095 56,206 55,074 55,887 1.7%Section 103 Judgements and Settlements - Public Education System 0 0 0 5,482 N/A
All Other Agencies 3,839 3,841 4,302 5,492 12.7%
Total Public Education System 1,723,119 1,840,525 1,921,708 2,048,509 5.9%
Department of Health Care Finance 716,045 739,256 685,919 708,248 -0.4%Department of Human Services 216,068 233,116 268,511 293,589 10.8%Department of Behavioral Health 205,866 227,869 228,301 231,904 4.0%Child and Family Services Agency 156,889 164,796 155,353 163,432 1.4%Department on Disability Services 57,216 113,724 113,829 115,430 26.4%Department of Youth Rehabilitation Services 99,826 94,967 98,823 90,344 -3.3%Department of Health 67,584 77,647 74,485 72,862 2.5%Department of Parks and Recreation 34,593 38,994 42,537 44,083 8.4%All Other Agencies 89,944 78,919 87,425 82,343 -2.9%
Total Human Support Services 1,644,030 1,769,285 1,755,182 1,802,236 3.1%
Mass Transit Subsidies (WMATA) 200,810 221,317 248,489 246,901 7.1%Department of Public Works 131,933 124,804 128,867 139,847 2.0%Department of Transportation 74,187 75,050 81,680 70,155 -1.8%All Other Agencies 44,560 45,866 46,637 51,308 4.8%
Total Public Works 451,490 467,037 505,672 508,211 4.0%
Repayment of Loans and Interest 497,173 538,214 555,097 616,832 7.5%Pay Go - Capital 26,415 98,238 88,043 76,410 42.5%District Retiree Health Contribution 86,600 91,400 29,000 31,000 -29.0%Master Equipment Lease / Purchase Program 45,617 43,778 38,914 27,445 -15.6%Settlements and Judgments Fund 21,292 17,222 32,953 21,292 0.0%All Other Agencies 56,216 26,108 30,796 26,940 -21.7%
Total Financing and Other 733,314 814,961 774,803 799,919 2.9%
Grand Total 6,370,325 6,719,522 7,172,102 7,298,551 4.6%
Notes:1) Details may not sum due to rounding.2) Selected large agencies in each appropriation title constitutes at least 80 percent of each title's FY 2017 expenditures

Operating Expenditures FY 2019 Proposed Budget and Financial Plan
4-12
Table 4A-2:
Dedicated Taxes Funds Actual Expenditures by Fiscal Year by Agency Fund(Excluding Enterprise and Other Funds) (Dollars in thousands)
Average Annual
Growth Rate
Agency FY 2014 FY 2015 FY 2016 FY 2017 2014-2017Alcoholic Beverage Regulation Administration 534 925 1,170 1,048 25.2%Economic Development and Regulation Total 534 925 1,170 1,048 25.2%
State Superintendent of Education (OSSE) 4,984 4,848 4,436 4,597 -2.7%Public Education System Total 4,984 4,848 4,436 4,597 -2.7%
Department of Health Care FinanceNursing Homes Quality of Care Fund 13,367 12,854 15,117 12,711 -1.7%Healthy DC Fund 15,474 45,058 36,619 45,744 43.5%Hospital Assessment Tax 14,099 0 10,400 10,400 -9.6%Stevie Sellows 4,732 4,866 4,855 4,913 1.3%DC Provider Fee 17,838 0 6,256 5,474 -32.5%
Human Support Services Total 65,510 62,778 73,248 79,241 6.5%
Mass Transit Subsidies (WMATA) 66,985 71,648 68,809 74,429 3.6%Public Works Total 66,985 71,648 68,809 74,429 3.6%
Convention Center Transfer-Dedicated Tax 105,451 116,448 123,551 138,128 9.4%Highway Transportation Fund - Transfers 22,961 25,256 25,332 26,099 4.4%Repayment of Revenue Bonds
Housing Production Trust Fund 7,824 7,829 7,822 7,825 0.0%Financing and Other Total 136,236 149,533 156,706 172,053 8.1%
Grand Total 274,249 289,733 304,368 331,367 6.5%
Details may not sum due to rounding.

FY 2019 Proposed Budget and Financial Plan Operating Expenditures
4-13
Table 4A-3Gross Funds Actual Expenditures by Fiscal Year for Selected Large Agencies(Excluding Intra-District Funds and Enterprise and Other Funds)(Dollars in thousands)
Average Annual
Growth Rate
Agency FY 2014 FY 2015 FY 2016 FY 2017 2014-2017Department of General Services 253,148 292,066 323,806 333,818 Office of the Chief Financial Officer 122,159 128,909 136,916 139,958 Office of Tthe Attorney General 78,396 83,604 73,364 78,863 Office of the Chief Technology Officer 61,024 64,673 64,532 72,531 Office of Finance and Resource Management 19,192 19,190 21,037 23,450 Office of Contracting and Procurement 12,145 16,427 58,635 23,036 Council of the District of Columbia 19,901 19,511 21,276 22,329 Office of the Inspector General 15,042 16,103 14,683 15,890 Office of the Mayor 11,420 13,340 11,043 13,478 All Other Agencies 57,094 46,095 62,932 64,163 Total, Governmental Direction and Support 649,521 699,918 788,223 787,515 6.6%
Department of Employment Services 99,056 113,744 119,528 125,040 Department of Housing and Community Development 42,556 42,570 61,793 62,867 Housing Authority Subsidy 34,934 37,699 55,696 54,623 Department of Consumer and Regulatory Affairs 34,890 41,623 48,385 50,830 Housing Production Trust Fund (Subsidy) 38,966 0 90,179 42,732 Deputy Mayor for Planning and Economic Development 36,225 34,039 32,634 34,498 Business Improvement Districts Transfer 22,343 25,137 28,507 27,404 Commission on Arts and Humanities 15,595 14,412 15,135 20,604 Department of Insurance, Securities and Banking 17,858 18,416 20,565 19,813 All Other Agencies 58,806 59,012 67,757 72,927 Total, Economic Development and Regulation 401,230 386,652 540,179 511,338 8.4%
Metropolitan Police Department 500,579 485,308 506,869 515,962 Fire and Emergency Medical Services Department 218,185 219,215 240,584 253,240 Department of Corrections 135,313 136,250 140,999 154,955 Police / Firefighters Retirement System 109,199 103,430 135,577 145,627 Homeland Security/Emergency Management 80,567 74,971 60,738 97,998 Office of Unified Communications 37,792 40,923 43,577 44,604 Section 103 Judgements and Settlements - Public Safety and Justice 421 0 89,938 340 All Other Agencies 65,337 77,021 89,126 97,194Total, Public Safety and Justice 1,147,393 1,137,120 1,307,408 1,309,920 4.5%
District of Columbia Public Schools 704,177 767,628 778,615 815,780 Public Charter Schools 627,979 661,074 738,844 779,669 State Superintendent of Education (OSSE) 362,373 365,986 348,729 358,369 Special Education Transportation 86,052 86,222 85,649 89,300 University of the District of Columbia Subsidy 66,691 73,458 71,942 77,671 Office for Non-Public Tuition 77,413 74,340 66,092 64,752 All Other Agencies 89,726 100,705 105,138 125,121 Total, Public Education System 2,014,411 2,129,413 2,195,010 2,310,662 4.7%(Continued on next page)

Operating Expenditures FY 2019 Proposed Budget and Financial Plan
4-14
Table 4A-3 (continued)Gross Funds Actual Expenditures by Fiscal Year for Selected Large Agencies(Excluding Intra-District Funds and Enterprise and Other Funds)(Dollars in thousands)
Average Annual
Growth Rate
Agency FY 2014 FY 2015 FY 2016 FY 2017 2014-2017
Department of Health Care Finance 2,594,746 2,664,592 2,834,778 2,958,961
Department of Human Services 348,017 386,217 467,030 508,409
Department of Behavioral Health 229,314 255,872 256,053 255,290
Child and Family Services Agency 222,193 228,683 216,299 222,129
Department of Health 198,782 203,293 206,124 208,453
Department on Disability Services 96,433 156,205 158,767 164,661
Department of Youth Rehabilitation Services 99,826 94,967 98,823 90,342
All Other Agencies 134,644 127,109 140,472 138,232
Total, Human Support Services 3,923,955 4,116,938 4,378,345 4,546,477 5.0%
Mass Transit Subsidies (WMATA) 309,436 335,702 359,097 368,014
Department of Public Works 137,389 130,681 134,556 145,320
Department of Energy and Environment 75,063 78,443 83,213 100,244
Department of Transportation 87,583 91,506 101,603 99,923
All Other Agencies 39,402 42,611 45,359 49,571
Total, Public Works 648,872 678,943 723,828 763,072 5.6%
Repayment of Loans and Interest 520,508 586,572 578,572 640,283
Convention Center Transfer-Dedicated Tax 108,701 120,448 131,916 141,801
Pay Go - Capital 59,798 136,245 144,105 133,380
District Retiree Health Contribution 41,488 40,210 25,332 31,000
Master Equipment Lease / Purchase Program 86,600 91,400 29,000 27,445
Highway Transportation Fund - Transfers 21,292 17,222 32,953 26,099
Settlements and Judgements Fund 45,617 43,778 38,914 21,292
TIF and PILOT Transfer - Dedicated Taxes 12,627 0 0 0
All Other Agencies 55,746 70,047 44,534 75,691
Total, Financing and Other 952,377 1,105,921 1,025,326 1,096,991 4.8%
Grand Total 9,737,760 10,254,906 10,958,319 11,325,975 5.2%
Notes:1) Details may not sum due to rounding.2) Selected large agencies in each appropriation title constitute at least 80 percent of each title's FY 2017 expenditures.

FY 2019 Proposed Budget and Financial Plan Operating Expenditures
4-15
Table 4A-4Local Funds Actual Expenditures by Appropriation Year and Fiscal Year(Education Agencies)(Dollars in thousands)
FY 2014 FY 2015 FY 2016 FY 2017
DC Public SchoolsExpenditures, current AY and FY 644,563 695,390 717,674 777,577 PLUS: AY Expenditures in prior FY 0 9,237 12,697 11,113 EQUALS: Total AY expenditures 644,563 704,627 730,371 788,690 LESS: AY Expenditures in prior FY 0 (9,237) (12,697) (11,113)PLUS: FY expenditures from following AY 9,237 12,697 11,113 0 EQUALS: Total FY expenditures(as shown in CAFR and Table 4-1 and 4A-1 above) 653,800 708,087 728,787 777,577
DC Public Charter SchoolsExpenditures, current AY and FY 426,696 458,690 485,700 496,750 PLUS: AY Expenditures in prior FY 178,903 201,283 202,384 253,144 EQUALS: Total AY expenditures 605,599 659,973 688,084 749,894 LESS: AY Expenditures in prior FY (178,903) (201,283) (202,384) (253,144)PLUS: FY expenditures from following AY 201,283 202,384 253,144 282,919 EQUALS: Total FY expenditures(as shown in CAFR and Table 4-1 and 4A-1 above) 627,979 661,074 738,844 779,669
Details may not sum due to rounding.
Public Education expenditures are tracked by appropriation year (AY) and fiscal year (FY). Table
4A-4 provides a crosswalk between the AY and FY expenditures for key school systems. The FY data
are used throughout this chapter, although the AY data reflect more comparable data over time.

Operating Expenditures FY 2019 Proposed Budget and Financial Plan
4-16
Table 4A-5 Federal Payments Awarded to the District in its Appropriations Act, FY 2014-2017(Dollars in thousands)
FY 2014 FY 2015 FY 2016 FY 2017Agency Name Approved Approved Approved ApprovedDC National Guard 375 435 435 450 DC Public Schools 16,000 15,000 15,000 20,000 Emergency Planning and Security Costs 23,800 12,500 13,000 34,895 Criminal Justice Coordinating Council 1,800 1,900 1,900 2,000 Office of the State Superintendent of Education:
Resident Tuition Assistance 30,000 30,000 40,000 30,000 Public Charter School Improvement/Expansion 16,000 15,000 20,000 20,000
Commission on Judicial Disabilities and Tenure 295 295 295 310 Judicial Nomination Commission 205 270 270 275 Department of Health 5,000 5,000 5,000 5,000 Total 93,475 80,400 95,900 112,930 Details may not sum due to rounding.
Notes:
1) This table shows appropriations made to the District that could be expended by District agencies. Unless specified below, the table does not show payments madeto WASA or pass-through payments where the District passes the payment to the designated recipients
2) The FY 2014 $23,800 for Emergency Planning and Security Costs includes $8.9 million for the Presidential Inauguration. The $8.9 million was a reimbursement for aprior year inaugural Local fund cost, for which associated revenues were recorded in Local funds. This was later reversed in the system of record.
3) The FY 2014 $16M for DCPS and OSSE was later transferred to Federal Grants
4) The FY 2015 $15M for DCPS and OSSE was later transferred to Federal Grants.
5) The FY 2016 $20M for DCPS was later transferred to Federal Grants.
6. The FY 2016 $20M for OSSE was reduced to $15M and later transferred to Federal Grants.

FY 2019 Proposed Budget and Financial Plan Operating Expenditures
4-17
Table 4A-6Federal Grant Actual Expenditures (including Medicaid), by Fiscal Year(Excluding Federal Payments, and Enterprise and Other Funds)(Dollars in thousands)
Average Annual
Growth RateAgency FY 2014 FY 2015 FY 2016 FY 2017 2014-2017
Department of Health Care Finance 1,812,204 1,859,296 2,073,505 2,169,926 6.2%
Department of Human Services 131,786 153,002 197,652 212,808 17.3%
State Superintendent of Education (OSSE) 191,300 182,602 180,472 183,495 -1.4%
Department of Health 118,124 109,299 115,508 113,978 -1.2%
Child and Family Services Agency 64,058 62,664 59,716 57,462 -3.6%
Homeland Security and Emergency Management Agency 78,500 71,246 56,189 93,333 5.9%
District of Columbia Public Schools 36,359 51,520 41,096 31,904 -4.3%
Department of Housing and Community Development 27,881 29,048 39,311 38,811 11.7%
Department on Disability Services 34,672 37,371 38,311 42,681 7.2%
Department of Employment Services 31,568 33,901 26,801 26,727 -5.4%
Department of Behavioral Health 20,253 24,716 24,669 20,284 0.1%
Department of Energy and Environment 20,149 19,972 21,682 22,596 3.9%
Repayment of Loans and Interest 18,606 18,440 18,361 18,132 -0.9%
Office of the Attorney General for the District of Columbia 17,616 17,925 17,991 18,393 1.4%
Sub Total - Selected Agencies 2,603,075 2,671,002 2,911,263 3,050,530 5.4%
All other agencies 39,588 42,248 45,192 57,309 13.1%
Total General Operating Funds 2,642,662 2,713,249 2,956,454 3,107,839 5.6%
Details may not sum due to rounding.

Operating Expenditures FY 2019 Proposed Budget and Financial Plan
4-18
Table 4A-7Local Funds Actual Expenditures by Fiscal Year for Selected Object Classes(Excluding Dedicated Taxes, and Enterprise and Other Funds)(Dollars in thousands)
Average Annual
Growth Rate Selected Object Classes FY 2014 FY 2015 FY 2016 FY 2017 2014-2017
Regular salaries and wages (0011, 0012, 0099) 1,739,728 1,837,363 1,903,928 2,001,924 4.8%
Extra pay & Overtime (0013, 0015) 137,601 152,327 224,129 187,881 10.9%
Fringe Benefits (0014) 326,586 353,015 376,760 404,340 7.4%
Subtotal, PS 2,203,915 2,342,706 2,504,817 2,594,145 5.6%
FD0 - PS Paid by NPS (0050) - Police/Fire Fighters' Retirement 109,199 103,430 135,577 145,627 10.1%
GX0 - PS Paid by NPS (0050) - Teachers' Retirement 31,573 39,443 44,359 56,618 21.5%
BG0 - PS Paid by NPS (0050) - Employees' Compensation Fund 12,998 13,327 13,987 8,235 -14.1%
BH0 - PS Paid by NPS (0050) - D.C. Unemployment Compensation Fund 6,620 5,055 4,508 5,326 -7.0%
RH0 - PS Paid by NPS (0050) - District Retiree Health Contribution 86,600 91,400 29,000 31,000 -29.0%
Subtotal, PS from Selected Subsidies and Transfers 246,990 252,655 227,431 246,806 0.0%
Fixed Cost (0030-0035) 245,424 325,153 351,199 368,843 14.5%Subsidies and transfers (0050 less Selected Subsidies and Transfers Subtotal Above ) 2,384,109 2,544,913 2,734,179 2,716,231 4.4%
Debt service (0080) 589,191 609,752 622,141 673,270 4.5%
Contractual services (0041) 424,828 386,382 398,018 410,990 -1.1%
Other NPS (0020, 0040, 0060, 0070, 0082, 0083, 0084, 0091) 275,869 257,961 334,317 288,268 1.5%
Subtotal, NPS excluding Retirement 3,919,421 4,124,161 4,439,853 4,457,602 4.4%
Total Expenditures 6,370,325 6,719,522 7,172,102 7,298,551 4.6%
Details may not sum due to rounding.

FY 2019 Proposed Budget and Financial Plan Operating Expenditures
4-19
Table 4A-8Dedicated Taxes Funds Actual Expenditures by Fiscal Year for Selected Object Classes(Excluding Enterprise and Other Funds)(Dollars in thousands)
Average Annual Growth Rate
Selected Object Classes FY 2014 FY 2015 FY 2016 FY 2017 2014-2017
Regular salaries and wages (0011, 0012) 881 1,047 1,056 1,608 22.2%
Extra pay & Overtime (0013, 0015) 2 20 6 8 71.0%
Fringe Benefits (0014) 180 222 218 325 21.9%
Subtotal, PS 1,063 1,289 1,280 1,941 22.3%
Fixed Cost (0030-0035) 0 1 0 4 N/A
Subsidies and transfers (0050) 263,923 278,370 290,414 318,396 6.5%
Debt service (0080) 7,824 7,829 7,822 7,825 0.0%
Contractual services (0041) 1,407 2,178 4,811 3,070 29.7%
Other NPS (0020, 0040, 0060, 0070, 0082, 0083, 0084, 0091) 32 67 41 130 59.3%
Subtotal, NPS 273,186 288,445 303,088 329,426 6.4%
Total Expenditures 274,249 289,734 304,368 331,367 6.5%
Details may not sum due to rounding.


FY 2019 Proposed Budget and Financial Plan FY 2019 – FY 2024 Capital Improvements Plan
5-1
Introduction The District’s proposed capital budget for FY 2019 - FY 2024 calls for financing $1.630 billion of capital
expenditures in FY 2019. The FY 2019 budget highlights are:
• $615.5 million for the District Department of Transportation, to include $214.4 million for improvements to
the South Capitol Street corridor and replacement of the Frederick Douglass Bridge, $34.5 million for local
streets rehabilitation, $30.0 million for PEPCO Utility Lines Undergrounding, $26.5 million for sidewalk and
alley maintenance and rehabilitation, $25.0 million for the Circulator, and $9.0 million for expansion of the
Streetcar line;
• $335.2 million for D.C. Public Schools, to include $109.9 million for renovation of elementary schools, $87.8
million for renovation of middle schools, $84.5 million for renovation of high schools, and $4.9 million for
swing space needed during construction;
• $110.7 million for the Washington Metropolitan Transit Authority (WMATA), to include $59.7 million for the
inter-jurisdictional Capital Funding Agreement and $50.0 million for the Passenger Rail Investment and
Improvement Act (PRIIA) Funding Agreement;
• $87.1 million for the District of Columbia Public Library, to include $61.3 million for the Martin Luther King,
Jr. Memorial central library and $15.0 million for the Lamond Riggs Library;
• $86.2 million for the Department of Parks and Recreation to include $48.9 million for recreation and
community centers and $29.5 million for parks and pools;
• $62.0 million for the Department of Human Services, to include $53.8 million for temporary housing;
• $47.0 million for the Office of the Chief Technology Officer, to include $30.0 million for the relocation of the
data center; and
• $36.8 million for the Deputy Mayor for Planning and Economic Development, to include $17.8 million for
McMillan Site Redevelopment and $14.0 million for St. Elizabeths infrastructure.
The proposed capital budget calls for financing of general capital expenditures in FY 2019 from the following
sources:
• $1,321.3 million of General Obligation (G.O.) or Income Tax (I.T.) revenue bonds including $168.1 million in
Grant Anticipation Revenue Vehicle (GARVEE) bonds, $223.3 million in short-term bonds, and $18 million
in taxable bonds;
• $173.7 million of federal grants, mostly from Highway Trust Fund revenue;
• $43.7 million of pay-as-you-go capital (Paygo) capital financing, which is a transfer of funds from the General
Fund to the General Capital Improvements Fund for the purchase of capital-eligible assets;
• $38.0 million of Local Transportation Fund special purpose (Rights-of-Way occupancy fees) revenue;
• $34.0 million of Local Highway Trust Fund revenue (motor fuel taxes) for the local match to support federal
highway grants;
• $17.8 million from the sale of assets (land at McMillan); and
• $1.0 million of private grants.
5
FY 2019 – FY 2024Capital Improvements Plan

FY 2019 – FY 2024 Capital Improvements Plan FY 2019 Proposed Budget and Financial Plan
5-2
This overview chapter summarizes:
• The District’s proposed FY 2019 - FY 2024 capital budget and planned expenditures;
• Major capital efforts; and
• Fund balance of the District’s capital fund;
The Highway Trust Fund and related projects are presented in Appendix H, and the D.C. Water and Sewer
Authority's capital program is presented in Appendix I of Volume 5, the Capital Improvements Plan.
The Proposed FY 2019 - FY 2024 Capital Budget and Planned Expenditures The District budgets for capital projects using a six-year Capital Improvements Plan (CIP), which is updated
annually.
The CIP consists of:
• The appropriated budget authority request for the upcoming CIP six-year period, and
• An expenditure plan with projected funding over the next 6 years.
Each year’s CIP includes many of the projects from the previous year’s CIP, but some projects are proposed to
receive different levels of funding than in the previous year’s budget plan. New projects are added each year as
well.
The CIP is used as the basis for formulating the District's annual capital budget. The Council and the Congress
adopt the budget as part of the District's overall six-year CIP. Inclusion of a project in a congressionally adopted
capital budget and approval of requisite financing gives the District the authority to spend funds for each project.
The remaining five years of the program show the official plan for making improvements to District-owned
facilities in future years.
Following approval of the capital budget, bond acts and bond resolutions are adopted to authorize financing for
the majority of projects identified in the capital budget. The District has issued Income Tax (I.T.) revenue bonds
and General Obligation (G.O.) bonds (both tax-exempt and taxable) to finance some or all of its capital projects.
Where this chapter refers to G.O. bond financing for capital projects, the District might ultimately use I.T. bond
financing depending on market conditions. Capital projects in the CIP are also financed with short-term bonds,
GARVEE bonds, and pay-as-you-go (Paygo) financing. Taxable bonds may be issued by the District where that
funding is appropriate for certain projects.
Table 5-1
Overview(Dollars in thousands)
Total number of projects receiving funding 256
Number of ongoing projects receiving funding 191
Number of new projects receiving funding 65
FY 2019 new budget allotments $1,629,621
Total FY 2019 to FY 2024 planned funding $8,088,787
Total FY 2019 to FY 2024 planned expenditures $8,088,787
FY 2019 Appropriated Budget Authority Request $2,665,888
FY 2019 Planned Debt Service (G.O./I.T. Bonds) $741,402
FY 2019-FY 2024 Planned Debt Service (G.O./I.T. Bonds) $5,684,443

FY 2019 Proposed Budget and Financial Plan FY 2019 – FY 2024 Capital Improvements Plan
5-3
The District uses two terms in describing budgets for capital projects:
• Budget authority is given to a project at its outset in the amount of its planned lifetime budget; later it can be
increased or decreased during the course of implementing the project. The District's appropriation request
consists of changes to budget authority for all projects in the CIP.
• Allotments are planned expenditure amounts on an annual basis. A multi-year project receives full budget
authority in its first year but only receives an allotment in the amount that is projected to be spent in that first
year. In later years, additional allotments are given annually. If a year's allotment would increase the total
allotments above the current lifetime budget amount, an increase in budget authority is required to cover the
difference.
Agencies may obligate funds up to the limit of (lifetime) budget authority for a project but cannot spend more
than the total of allotments the project has received to date (see Appendix D, Volume 5). The FY 2019 to FY 2024
CIP proposes a net increase in budget authority of $2,666 million during the next six fiscal years (an increase of
$3,272 million of new budget authority offset by $606 million of rescissions).
Planned capital expenditures from local sources in FY 2019 total $1,455 million to be funded primarily by
bonds, Paygo, and the local transportation fund special purpose revenue. To finance these expenditures, the District
plans to borrow $930 million in new G.O./I.T. bonds (including $18 million in taxable bonds), borrow $223 million
in short-term bonds, use $168 million from the sale of GARVEE bonds, fund $44 million using Paygo, use $38
million in Local Transportation Fund Special Purpose Revenue, use $1 million from private grants, use $18 million
from the sale of assets, and use $34 million for the local match to the federal grants from the Federal Highway
Administration. Proposed funding sources are shown in Figure 5-1 and proposed borrowing is shown in Table 5-7.
In recent years, the District has increased its capital expenditures to reinvest in its aging infrastructure. The
District is limited by funding constraints as well as multiple competing demands on capital and is not able to fund
all identified capital needs. As a result of these demands, the District has taken action to meet its priorities while
also maintaining a fiscally sound CIP. This plan has been accomplished by prioritizing capital projects and
rescinding budget authority from projects deemed less important, and by reallocating budget to existing and new
high priority projects to meet the most pressing infrastructure needs.
Figure 5-2 illustrates FY 2019 capital budget allotments by major agency. Funding for the District Department
of Transportation constitutes the largest share of the planned expenditures. Large shares of funding also go toward
the District of Columbia Public Schools, and the Washington Metropolitan Area Transit Authority. In addition, as
with all agencies, unspent capital budget allotments from prior years will be available to be spent in FY 2019.
Table 5-2 summarizes planned expenditure amounts for FY 2019 and budget authority requests for FY 2019-
FY 2024. It includes local funds (G.O./I.T, taxable and short-term bonds, Paygo, and local transportation funds)
and federal grants.
The capital fund pro forma, Table 5-3, summarizes sources and uses in the District’s CIP. The Project
Description Forms that constitute the detail of this capital budget document include projects receiving new
allotments in FY 2019 through FY 2024, as included in the pro forma, totaling $1.630 billion in FY 2019.
FY 2019 Operating Budget ImpactIn general, each $13.0 million in borrowing has approximately a $1 million impact on the operating budget for
annual debt service. The capital budget's primary impact on the operating budget is the debt service cost, paid from
local revenue in the operating budget, associated with issuing long-term bonds to finance the CIP. Debt service is
funded in the FY 2019 operating budget and financial plan.
A secondary impact on the operating budget is the cost of operating and maintaining newly completed capital
projects. For example, the replacement of a building’s roof, windows, and mechanical systems may decrease the
cost of utilities, which would effectively lower the owner agency’s operating costs. Conversely, the construction of
a new recreation center is likely to increase the owner agency’s operating costs for staffing the facility and operating
programs there. Similarly, completed information technology projects will likely entail additional operating costs
such as upgrades, license renewals, or training of staff to operate new systems as required.

FY 2019 – FY 2024 Capital Improvements Plan FY 2019 Proposed Budget and Financial Plan
5-4
Figure 5-1
FY 2019 Capital Budget Funding Sources(Dollars in thousands)
Table 5-2
FY 2019 Planned Expenditures from New Allotments and AppropriatedBudget Authority Request(Dollars in thousands)
Planned FY 2019 Proposed Increase Expenditures (Decrease) in Budget
Source (Allotments) AuthorityG.O./I.T. Bonds $929,954
Paygo (transfer from the General Fund) $43,723
Short-term Bonds $223,271
Sale of Assets $17,836
Private Grants/Donations $1,000
Subtotal $1,215,784 $2,356,705
Local Transportation Fund
Rights-of-Way (ROW) Occupancy Fees $37,983 $23,647
Subtotal, Local Transportation Fund Revenue $37,983 $23,647
Federal Highway Administration Grants $173,722 $236,274
Local Match (from motor fuel tax) $34,032 $49,263
GARVEE Bonds $168,100 $0
Subtotal, Highway Trust Fund $375,854 $285,536
Federal Payments $0 -
Total, District of Columbia $1,629,621 $2,665,888
G.O./I.T. Bonds
$929,954
57.1%
Local Highway Trust
Fund
$34,032
2.1%
Short Term
Bonds
$223,271
13.7%
Paygo
$43,723
2.7%
Local Transportation
Fund Revenue
$37,983
2.3%
Federal Grants
$173,722
10.7%
GARVEE Bonds
$168,100
10.3%Private Grants
$1,000
0.1%
Sale of Assets
$17,836
1.1%

FY 2019 Proposed Budget and Financial Plan FY 2019 – FY 2024 Capital Improvements Plan
5-5
Table 5-3Capital Fund Pro Forma(Dollars in thousands)
Percent6 Year of FY 2019
FY 2019 FY 2020 FY 2021 FY 2022 FY 2023 FY 2024 Total Total
Sources:G.O. / I.T. Bonds (Tax Exempt) $911,954 $848,972 $603,372 $413,741 $467,348 $608,483 $3,853,869 56.0%
Short-Term Bonds 223,271 169,352 90,429 73,491 69,054 40,517 $666,115 13.7%
G.O. / I.T. Bonds (Taxable) 18,000 46,000 72,000 87,000 35,000 51,000 $309,000 1.1%
Sale of Assets 17,836 - - - - - $17,836 1.1%
Private Grants 1,000 - - - - - $1,000 0.1%
GARVEE Bonds 168,100 - - - - - $168,100 10.3%
Local Highway Trust Fund 34,032 33,519 27,715 30,104 33,610 37,052 $196,033 2.1%
Federal Grants 173,722 177,178 181,383 185,688 190,097 194,612 $1,102,681 10.7%
Local Funds TransferPaygo 43,723 211,119 217,071 246,814 396,210 434,757 $1,549,693 2.7%
Local Transportation Fund Revenue 37,983 36,820 42,298 39,587 35,763 32,008 $224,460 2.3%
Total Local Funds Transfer 81,706 247,939 259,369 286,401 431,974 466,765 $1,774,153 5.0%Total Sources $1,629,621 $1,522,960 $1,234,268 $1,076,426 $1,227,083 $1,398,429 $8,088,787 100.0%
Uses:Department of Transportation $615,480 $523,858 $426,777 $456,488 $471,868 $439,635 $2,934,107 37.8%
Local Transportation Fund 408,376 313,161 217,679 240,695 248,161 207,971 1,636,043
Highway Trust Fund 207,104 210,697 209,098 215,793 223,707 231,664 1,298,064
District of Columbia Public Schools 335,200 234,584 210,294 114,197 205,715 247,129 $1,347,118 20.6%
Washington Metropolitan Area Transit Authority 110,701 306,442 264,105 271,649 280,129 288,502 $1,521,529 6.8%
District of Columbia Public Library 87,100 37,950 - - 1,500 3,750 $130,300 5.3%
Department of Parks and Recreation 86,219 47,750 50,514 7,500 59,300 44,374 $295,657 5.3%
Department of Human Services 61,967 65,524 9,540 - - - $137,031 3.8%
Office of the Chief Technology Officer 47,000 17,000 - - 6,750 - $70,750 2.9%
Office of the Deputy Mayor for Planning and Economic Development 36,836 40,000 70,000 54,000 - 36,402 $237,237 2.3%
Fire and Emergency Medical Services Department 32,250 23,000 11,750 13,500 39,020 78,679 $198,199 2.0%
Department of Public Works 31,582 6,770 4,934 2,994 14,120 11,759 $72,159 1.9%
Department of Employment Services 30,555 8,750 - - - - $39,305 1.9%
Department of Health Care Finance 28,525 71,864 86,164 109,379 53,464 56,000 $405,398 1.8%
Department of General Services 21,550 11,000 - 1,500 14,562 68,500 $117,112 1.3%
Office of the Chief Financial Officer 13,900 25,200 41,500 18,500 10,000 - $109,100 0.9%
Special Education Transportation 13,507 6,237 301 1,949 7,195 5,700 $34,890 0.8%
Department of Corrections 13,500 6,000 - - - - $19,500 0.8%
Department of Energy and Environment 12,750 11,100 3,300 3,000 2,230 45,000 $77,380 0.8%
University of the District of Columbia 12,202 12,000 8,000 5,000 35,000 60,000 $132,202 0.7%
Metropolitan Police Department 10,536 5,887 6,439 9,275 7,330 11,949 $51,416 0.6%
Office of Unified Communications 9,650 17,450 6,500 4,793 7,300 1,050 $46,743 0.6%
Office of Contracts and Procurement 4,092 1,736 - - - - $5,828 0.3%
Department of Forensic Sciences 3,125 4,234 200 200 200 - $7,959 0.2%
Office of the Chief Medical Examiner 2,975 175 - - - - $3,150 0.2%
Department of Behavioral Health 2,420 1,675 - - - - $4,095 0.1%
Office of State Superintendent of Education 1,500 - - - 2,500 - $4,000 0.1%
Department of Youth Rehabilitation Services 1,500 1,498 - - - - $2,998 0.1%
Department of Consumer and Regulatory Affairs 1,500 - - - - - $1,500 0.1%
D.C. Department of Aging 1,500 - - 2,500 8,900 - $12,900 0.1%
Office of the Secretary - 35,275 33,949 - - - $69,224 0.0%
Total Uses $1,629,621 $1,522,960 $1,234,268 $1,076,426 $1,227,083 $1,398,429 $8,088,787 100.0%Note: Details may not sum to totals due to rounding

FY 2019 – FY 2024 Capital Improvements Plan FY 2019 Proposed Budget and Financial Plan
5-6
Table 5-5 reflects the summary of the projected impacts, by agency, and by fiscal year for the 6-year CIP period.
Individual project pages in the “Project Description Forms” section of volume 5, the FY 2019 Capital
Improvements Plan, show more details of the operating impact resulting from placing a particular newly completed
project into service.
Capital-Funded PositionsAgencies may receive approval to charge certain personnel expenses to capital projects. However, in order to
qualify and receive approval, the primary duties and responsibilities of a position charged to capital funds must be
directly related to a specific capital project. Full-Time Equivalent (FTE) positions that generally qualify are (a)
architects; (b) engineers; (c) cost estimators; (d) project managers; (e) system developers; (f) construction
managers; and (g) inspectors.
Table 5-6 reflects capital-funded FTE data for each agency for FY 2017 through FY 2019. Additional details
on the FY 2019 FTEs, including the specific number of FTEs approved by project, can be found on the project
pages in the “Project Description Forms” section of this volume. They are also summarized on the appropriate
agency pages, for those agencies that have approved FTEs.
Figure 5-3 shows the total number of capital-funded positions between FY 2012 and FY 2017, the approved
positions for FY 2018, and the planned positions in the CIP for FY 2019.
Figure 5-2
FY 2019 Capital Budget Allotments, by Agency(Dollars in thousands)
Department of
Transportation
$615,480
37.8%
District of Columbia
Public Library
$87,100
5.3%
Department of
Human Services
$61,967
3.8%
Department of
Health Care
Finance
$32,061
2.5%
Department of Parks
and Recreation
$86,219
5.3%
Washington
Metropolitan Area
Transit Authority
$110,701
6.8%
District of Columbia
Public Schools
$335,200
20.6%
Total All Other
$156,411
12.4%

FY 2019 Proposed Budget and Financial Plan FY 2019 – FY 2024 Capital Improvements Plan
5-7
FY 2019 FY 2020 FY 2021 FY 2022 FY 2023 FY 2024
Existing General Obligation (G.O.) and Income Tax (I.T.)
Bonds Debt Service (Agency DS0) $704,321,050 $718,672,364 $724,616,580 $743,041,166 $738,513,416 $721,369,204
Prospective I.T./G.O. Bonds Debt Service
FY 2018 (June 2018) Bond Sale ($350.0M) $15,750,000 $15,750,000 $15,850,000 $25,385,500 $25,381,700 $25,383,550
FY 2019 (December 2018) Bond Sale ($853.2M) $21,330,625 $42,661,250 $42,761,250 $64,811,250 $64,813,500 $64,810,250
FY 2019 (June 2019) Bond Sale ($300.0M) $- $15,000,000 $15,000,000 $22,240,000 $22,243,000 $22,242,750
FY 2020 (December 2019) Bond Sale ($764.3M) $- $21,018,938 $42,037,875 $59,367,875 $59,364,725 $59,364,325
FY 2020 (June 2020) Bond Sale ($300.0M) $- $- $16,500,000 $22,810,000 $22,812,950 $22,811,650
FY 2021 (December 2020) Bond Sale ($870.8M) $- $- $23,947,138 $66,214,275 $66,211,675 $66,213,800
FY 2021 (June 2021) Bond Sale ($300.0M) $- $- $- $22,365,000 $22,362,425 $22,367,250
FY 2022 (Dec 2021) Bond Sale ($311.0M) $- $- $- $18,982,500 $22,856,350 $22,853,475
FY 2022 (June 2022) Bond Sale ($263.2M) $- $- $- $- $19,622,925 $19,624,950
FY 2023 (Dec 2022) Bond Sale ($311.6M) $- $- $- $- $19,019,825 $22,899,900
FY 2023 (June 2023) Bond Sale ($259.8M) $- $- $- $- $- $19,367,625
FY 2024(Dec 2023) Bond Sale ($516.2M) $- $- $- $- $- $31,496,788
FY 2024 (June 2024) Bond Sale ($300.9M) $- $- $- $- $- $-
Total I.T./G.O. Bonds Debt Service (Agency DS0) $741,401,675 $813,102,552 $880,712,843 $1,045,217,566 $1,083,202,491 $1,120,805,516
Housing Production Trust Fund (Agency DT0) $7,838,539 $7,839,039 $7,836,089 $7,837,339 $7,830,339 $7,835,089
Total Long-Term Debt Service $749,240,214 $820,941,591 $888,548,932 $1,053,054,905 $1,091,032,830 $1,128,640,605
Commercial Paper (Agency ZC0) $10,000,000 $12,000,000 $12,000,000 $12,000,000 $12,000,000 $12,000,000
Payments on Master Lease Equipment Purchases (Agency EL0) $11,844,303 $4,485,688 $- $- $- $-
Total Debt Service, General Fund Budget $771,084,517 $837,427,279 $900,548,932 $1,065,054,905 $1,103,032,830 $1,140,640,605
Other (Non-General Fund) Debt Service $126,953,257 $126,439,966 $125,702,005 $110,307,191 $87,290,945 $85,551,241
Total Debt Service $898,037,774 $963,867,245 $1,026,250,937 $1,175,362,096 $1,190,323,775 $1,226,191,846
Total Expenditures $8,968,889,971 $9,306,982,412 $9,535,079,512 $9,802,260,788 $10,087,044,071 $10,334,862,250
Ratio of Debt Service to Total Expenditures 10.013% 10.356% 10.763% 11.991% 11.801% 11.865%
Balance of Debt Service Capacity 178,229,023 152,970,644 117,958,606 909,199 20,121,513 13,991,624
Table 5-4
OFFICE OF FINANCE AND TREASURY Fiscal Years 2019 – 2024 Debt Service Expenditure Projections

FY 2019 – FY 2024 Capital Improvements Plan FY 2019 Proposed Budget and Financial Plan
5-8
Table 5-6FTE Data by Agency
FY 2017 FY 2018 FY 2019Agency Actual Approved Plan
AM0 – Department of General Services 20.9 39.7 36.7
AT0 – Office of the Chief Financial Officer 18.4 26.0 26.0
CE0 – D.C. Public Library 5.0 5.0 5.0
CF0 – Department of Employment Services 10.3 8.0 16.0
GF0 – University of the District of Columbia 3.4 5.0 5.0
HA0 – Department of Parks and Recreation 2.0 1.0 1.0
KA0 – Department of Transportation 291.5 331.4 340.3
PO0- Office of Contracting and Procurement 0.0 0.0 1.0
TO0 - Office of the Chief Technology Officer 2.4 3.0 2.0
Total 353.9 419.1 433.0
Agency 6-Year
Code Agency Name FY 2019 FY 2020 FY 2021 FY 2022 FY 2023 FY 2024 Total
AT0 Office of the Chief Financial Officer $1,041,441 $5,678,537 $5,678,537 $5,678,537 $5,678,537 $5,678,537 $29,434,126
HT0 Department of Healthcare Finance 957,900 - - - - - 957,900
HA0 Department of Parks and Recreation 940,624 - - - - - 940,624
CE0 District of Columbia Public Library 964,903 15,000 15,000 15,000 15,000 227,685 1,252,588
TO0 Office of the Chief Technology Officer 1,431,082 - - - - - 1,431,082
Total $5,335,950 $5,693,537 $5,693,537 $5,693,537 $5,693,537 $5,906,222 $34,016,320
Note: The FY 2019 operating impacts for these agencies are already included in the Local funds budget
Table 5-5
Summary of Capital Estimated Operating Impacts for FY 2019 - FY 2024

FY 2019 Proposed Budget and Financial Plan FY 2019 – FY 2024 Capital Improvements Plan
5-9
Details on the District's Sources of Funds for Capital ExpendituresThe District's proposed FY 2019 - FY 2024 capital budget includes a number of funding sources. The District uses
the following sources to fund capital budget authority across a large number of agencies that have capital programs:
• G.O. or I.T bonds, including taxable, and short-term bonds;
• Paygo capital funding;
• Sale of assets;
• Federal Grants; and
• Private Grants.
In addition to the above sources, the District's Department of Transportation (DDOT) uses the following
sources to fund its capital projects:
Table 5-7
Proposed Bond Borrowing, FY 2018 Through FY 2024(Dollars in thousands)
Actual Plan Proposed Proposed Proposed Proposed Proposed Proposed
Source FY 2017 FY 2018 FY 2019 FY 2020 FY 2021 FY 2022 FY 2023 FY 2024 Total
Budget Allotment for Bonds $897,076 $948,447 $1,321,325 $1,064,324 $765,801 $574,232 $571,402 $700,000 $5,945,531
G.O. and I.T Bond Borrowing Plan $451,000 $1,050,000 $1,153,225 $1,064,324 $1,170,801 $574,232 $571,402 $817,000 $6,400,984
GARVEE Bond Borrowing Plan - $98,000 $168,100 - - - - $266,100
Total Bond Borrowing $451,000 $1,148,000 $1,321,325 $1,064,324 $1,170,801 $574,232 $571,402 $817,000 $6,667,084
Notes: All amounts and methods of borrowing are subject to change depending on status of projects and market conditions.
Figure 5-3
Number of Capital-Funded FTE Positions From FY 2012 to FY 2019

FY 2019 – FY 2024 Capital Improvements Plan FY 2019 Proposed Budget and Financial Plan
5-10
• Federal Highway Administration grants, for Highway Trust Fund projects;
• Grant Anticipation Revenue Vehicle (GARVEE) bonds, which are repaid from future Federal funding;
• Dedicated motor fuel tax revenues and a portion of the Rights-of-Way Occupancy Fees for Highway Trust
Fund projects (these provide the local match for the Federal Highway Administration grants); and
• Local Transportation Fund (a portion of the Rights-of-Way Occupancy Fees, Public Inconvenience Fees,
and Utility Marking Fees).
Projects funded by these sources are detailed in the project description pages for DDOT and in Appendix H, in
Volume 5.
Major Capital EffortsThe FY 2019 – FY 2024 Capital Improvements Plan (CIP) provides for major investments in the following areas:
• Transportation Infrastructure;
• Education;
• Public Health and Wellness;
• Economic Development;
• Fiscal Stability; and
• Public Safety.
Transportation Infrastructure
Metrorail and Metrobus. The continued growth and vitality of the city and region greatly relies on a safe, efficient,
and reliable Metro system to transport residents and visitors alike. The CIP includes $1.4 billion for safety
improvements, improving the effectiveness of the current rail and bus networks, increasing system capacity, and
rebuilding the Metro system, including enhanced capital funding beginning in FY 2020 as part of the required
commitment to long-term Metro capital funding goal of $500 million annually region-wide..
Streetcar, Circulator, and H Street Bridge. A retooled streetcar system and an expanded Circulator system will
add capacity to the District’s transportation network, provide links to activity centers that complement Metrorail
service, and offer a potentially cleaner and more sustainable transportation alternative. The CIP provides $464
million for Circulator and streetcars, giving priority to the H Street line extension to Benning Road Metro station
– and replacement of the H Street Bridge. The H Street Bridge is an important link in the line that provides for rider
transfers to Amtrak’s Union Station and the Metrorail system, and it must be replaced. The CIP provides $195
million to support the cost of replacing the bridge. Availability of varied modes of transportation is critically
important in the District. To further this effort, the CIP includes $5 million for Bikeshare expansion.
South Capitol Street. The CIP includes $442 million for replacement of the Frederick Douglass Bridge over the
Anacostia River and improvements to the South Capitol Street Corridor. South Capitol Street will be transformed
from an expressway to an urban boulevard and gateway to the Monumental Core of the city that will support
economic development on both sides of the Anacostia River.
Streetscapes, Trails, and Green Space. The concept of park-like landscaping in the District’s public right-of-ways
dates back to surveyor Pierre L’Enfant, who outlined how to landscape his exceptionally wide avenues. The
District’s investment in streetscapes, trails, and green space will beautify the city, improve quality of life, and
complement investments in transit by providing safe and convenient bicycle and pedestrian access throughout the
city. The 6-year capital budget plans for $209 million of investment in streetscapes, trails, trees, green space, and
streetlights.

FY 2019 Proposed Budget and Financial Plan FY 2019 – FY 2024 Capital Improvements Plan
5-11
Local Streets and Alleys. The 6-year capital budget also plans for $425 million of investment in the District’s local
roadways, alleys, curbs, and sidewalks across the eight wards to ensure they are safe, reliable, and functional.
Education
Public Schools Modernization. The District is currently undertaking a comprehensive schools modernization
initiative that began in 2008. So far, over $4 billion has been invested. This CIP commits to an additional
investment of $1 billion over the next six years for modernization of elementary, middle, and high school facilities.
The budget includes funding for twenty-six elementary schools, two modernized middle schools, and three
modernized high schools.
21st Century Public Libraries. Continuing efforts to fully modernize the Martin Luther King Jr. Memorial Library,
the CIP includes $79 million that will be used to renovate and reconfigure this historic landmark. The result will
be a world-class central library offering residents and visitors a vibrant center of activity for reading, learning, and
community discussion. Libraries in District neighborhoods will receive an additional $41 million to renovate and
modernize facilities, including the Southeast Library, and construct new state-of-the-art facilities, including new
Lamond Riggs and Southwest Libraries.
University Facilities. The University of the District of Columbia is making campus improvements that will
enhance the collegiate experience for its students, faculty, staff, and guests. The CIP provides $132 million of
budget authority for University improvements.
Public Health and Wellness
Replacement of D.C. General Shelter. The CIP includes $44 million for the Department of Human Services to
construct small scale emergency and temporary housing for families.
Senior Wellness Centers. The FY 2019 capital budget includes $1 million for improvements to the Senior
Wellness Centers in Ward 5 and in Ward 8. The budget also includes $11 million in FY 2022 and FY 2023 to
construct a new Senior Wellness Center in Ward 8.
Access to Health and Human Support Services. The CIP includes $91 million to complete development of a new,
state-of-the-art information technology application designed to assist persons seeking assistance with health and
other human support services.
Parks and Recreation Facilities. Public parks and recreation facilities enhance the quality of life and wellness of
District residents. The District is committed to providing all residents of the District, and especially the District’s
youth, with access to quality recreation centers, athletic fields, swimming pools, tennis courts, play areas, and parks.
This 6-year capital budget plans for $296 million for investments in parks and recreation facilities across the city,
including new recreation centers for Congress Heights, the Upshur community, and Ward 8.
Saint Elizabeths Medical Center. The District places a high priority on providing public health services to all
District residents. Since taking control of the operations of the Not-for-Profit Hospital Corporation, commonly
referred to as United Medical Center (“UMC”), in 2010, the District has invested hundreds of millions of dollars
in the District’s only acute care hospital on the city’s East End. The CIP includes $14 million for additional
improvements at that facility and $300 million for construction of a new facility to continue the repositioning of
the hospital in the marketplace.

FY 2019 – FY 2024 Capital Improvements Plan FY 2019 Proposed Budget and Financial Plan
5-12
Anacostia River Clean-Up. The Anacostia River, once a pristine river, is now degraded mainly because of its
highly urbanized location. The river and adjacent former Kenilworth landfill are the focus of large-scale restoration
efforts by the District of Columbia. The District’s goal is to restore the Anacostia to a fishable and swimmable river
by the year 2032. The $69 million of capital budget for hazardous material remediation on the Anacostia River and
its shoreline will fund continued efforts to achieve this goal.
Economic Development
New Communities. The CIP provides $55 million of budget that will be used to replace severely distressed housing
and decrease concentrations of poverty by redeveloping public housing properties into mixed-use, mixed-income
communities for current and future residents.
Saint Elizabeths East Campus Infrastructure. The 183-acre lot will be transformed into a marketplace of ideas,
innovation, and communication. The CIP provides $104 million to design and build public infrastructure.
McMillan Redevelopment. The 25-acre former McMillan Reservoir Sand Filtration Plant site will be redeveloped
into a mixed-use project that will include historic preservation, open space, residential, retail, office, and hotel uses.
The goal is to create an architecturally distinct, vibrant, mixed-use development that provides housing,
employment, retail, cultural, and recreational opportunities for District residents. The project will include affordable
and workforce housing, and 35 percent of the local contracting opportunities must go to Certified Business
Enterprises. The CIP provides $64 million for site infrastructure over the 6-year CIP.
Fiscal Stability
Financial System Modernization. The Office of the Chief Financial Officer has modernized its tax system to add
the functionality found in modern systems, support real-time financial management, provide greater integration
with other District IT systems, and increase tax compliance and collections. The CIP includes $101 million for the
modernization of the general ledger and budget systems and $7 million for the continued modernization of the
integrated tax system.
Public Safety
Emergency Vehicles. Older emergency vehicles must be replaced on a regular basis to ensure that responders have
reliable equipment. The CIP provides $85 million for purchase of pumpers, ladder trucks, heavy rescue trucks,
ambulances, and large support vehicles. An additional $36 million is provided for replacement of police cruisers
and specialty/support vehicles.
Power Line Undergrounding. The CIP includes $171 million to move key overhead power lines to underground
lines in the District to improve safety and reliability of the District’s electrical system. Placing select power feeders
underground will result in a reduction in the frequency and the duration of power outages experienced in affected
service areas.

FY 2019 Proposed Budget and Financial Plan FY 2019 – FY 2024 Capital Improvements Plan
5-13
Fund Balance of the Capital Fund From FY 2008 through FY 2017, the District's Comprehensive Annual Financial Report (CAFR) showed a deficit
for 4 years in the General Capital Improvements Fund (the "capital fund") (see Table 5-8). The shortfalls reflect
that capital expenditures had exceeded financing sources by that amount on a cumulative basis. The timing and
amounts of borrowing for all the deficit years resulted in the temporary negative fund balance. The District's
General Fund had advanced funds to the capital fund to cover the expenditures.
The FY 2017 CAFR reports a General Capital Improvements Fund deficit of $642 million. This represents a
decrease of $413 million from the FY 2016 ending negative fund balance of almost $229 million. This decrease
is due primarily to the difference in timing of revenues/borrowing and expenditures in the fund. The balance as of
the end of FY 2017 is representative of the activity in the fund as of that date. The District borrowed $700 million
in December of 2017, thereby erasing the deficit, and plans an additional borrowing of $350 million for early
summer of 2018 to cover ongoing capital expenditures.
The District must keep a close watch on the underlying status of the capital fund. In past years, the District
borrowed amounts above new capital budget allotments, to help repay the General Fund for advances it made to
the capital fund. The current plans include extra borrowing of $405 million in FY 2021 and an additional $117
million in FY 2024. These amounts can be seen in Table 5-7 as reflected by the borrowing amounts that exceed
the planned budget allotments. In addition to the extra borrowing, the solution to the capital fund shortfall includes
the use of a Commercial Paper program (a form of short-term borrowing not to exceed 270 days) to help ensure
cash flow needs are balanced with the timing of borrowing.
Table 5-8
Fund Balance in the General Capital Improvements Fund, FY 2009-FY 2017(Dollars in millions)
Positive/(Negative)Fiscal Year Fund Balance
2009 406.9
2010 133.4
2011 5.0
2012 (116.3)
2013 102.4
2014 (114.2)
2015 35.8
2016 (228.9)
2017 (642.0)


Appendices


Appendix A:
D.C. Comprehensive FinancialManagementPolicy


FY 2019 Proposed Budget and Financial Plan D.C. Comprehensive Financial Management Policy
Appendix A-1
IntroductionIn accordance with requirements set forth in the District of Columbia Home Rule Act, approved December
24, 1973 (Pub. L. No. 93-198; 87 Stat. 774; D.C. Official Code §§1-201.01 et seq.) (Home Rule Act), this
Comprehensive Financial Management Policy provides a framework for fiscal decision-making for the Office
of the Chief Financial Officer (“OCFO”) and the Government of the District of Columbia (“District govern-
ment” or “District”). The intent of this document is to establish policies that ensure the availability of finan-
cial resources to meet the present and future needs of the citizens of the District of Columbia. This document
establishes the District government’s policies in the following areas:
• Debt Management
• Financial Asset Management
• Capital Asset Management
• Reserve Management
• Fiscal Management
• Economic Development
These financial management policies were established by the OCFO subject to continuing review and
comment by the Mayor of the District of Columbia (Mayor) and the Council of the District of Columbia. The
OCFO will consider amendments to this document on a continuing basis using the established review and
approval process.
Debt Management Policy
Responsibility and AuthorizationThe District government will maintain, at all times, debt management policies that are fiscally prudent,
consistent with District and federal laws, and reflect the District’s unique municipal status and limitations.
Collectively, Title IV, Part E of the Home Rule Act and the Income Tax Secured Bond Authorization Act
authorize the District to issue bonds, to provide for the payment of undertaking capital projects, and notes, to
pay general governmental expenses in anticipation of the collection or receipt of revenues.
Credit RatingsThe District will do everything in its power to attain and maintain the highest possible credit ratings for its
outstanding bonds, including producing balanced budgets and financial statements with “clean” audit opinions
annually, implementing and maintaining sound financial and debt management policies and practices, and
maintaining regular communications with the major rating agencies.
Appendix A
District of Columbia
Comprehensive Financial ManagementPolicy

D.C. Comprehensive Financial Management Policy FY 2019 Proposed Budget and Financial Plan
Appendix A-2
Long-Term Debt CapacityThe District will stay within its statutorily mandated debt limits: (a) total debt service on long-term tax
supported debt in any fiscal year cannot exceed 17 percent of General Fund revenue, and (b) total debt service
on long-term tax supported debt in any fiscal year, or the five succeeding fiscal years as reflected in the finan-
cial plan and capital improvements plan, cannot exceed 12 percent of General Fund expenditures. Also, the
District will maintain other debt ratios and practices that are prudent in light of industry standards, rating
agencies’ benchmarks and the District’s long-term financial health. The District will seek to balance the need
for improvements to its capital infrastructure with the need to maintain reasonable debt ratios and debt service
expense levels.
Timing and Amount of Long-Term BorrowingWhen the District engages in long-term borrowing for its capital projects, it shall do so in amounts that are
planned and reasonably expected to be spent within two years after the date of such borrowing. Such
borrowing amounts will be determined in the context of an ongoing effort to balance the need for continuing
development and refurbishment of the District’s infrastructure with the need to prudently manage the District’s
debt obligations.
Method of Bond SalePrior to coming to market, the District shall monitor and evaluate market conditions to determine which
method of sale, competitive or negotiated, is optimal. A final determination will be made by the Chief Financial
Officer (“CFO”), supported by a recommendation of the Treasurer, to proceed with the sale method that is
likely to yield a more favorable result for the District.
Composition of Debt PortfolioThe District shall issue general obligation bonds, income tax secured bonds, or tax-supported revenue bonds,
depending on a determination by the CFO regarding the type of bond issuance that is most favorable for the
District. The District shall issue tax-exempt bonds, except under circumstances in which the nature of the
project(s) being financed (or some portion thereof) require the issuance of taxable bonds, or circumstances in
which taxable bonds are deemed to provide a more favorable result (for example, the issuance of Build
America Bonds pursuant to the American Recovery and Reinvestment Act). The District shall issue fixed-rate
or variable-rate debt; however, not more than 20 percent of outstanding debt may be variable-rate bonds. This
policy allows the District to take advantage of the generally lower interest rates associated with variable-rate
debt without overexposure to higher levels of risk associated with such debt. In addition, with every issuance
of debt, the District shall evaluate whether or not it is financially beneficial to issue the debt with bond
insurance or some other form of credit enhancement, and shall structure the issuance accordingly. The District
will regularly examine its financing structures and the financial marketplace to determine what form of debt
is most beneficial to issue (e.g. income tax secured revenue bonds, general obligation bonds, other revenue
bonds, or master lease/purchase financing) to fund certain governmental projects.
Timely Debt Service PaymentsThe District shall escrow funds received from its Special Real Property Tax levy in amounts sufficient to
ensure timely payment of all principal and interest due on its outstanding general obligation bonds, and shall
set aside income tax revenues in amounts sufficient to ensure timely payment of all principal and interest due
on its outstanding income tax secured revenue bonds, as required by the relevant debt statutes, bond
indentures, and covenants.
Compliance with Arbitrage RegulationsThe District shall contract with a reputable firm to perform annual analyses of the District’s investment and
expenditure of bond proceeds in order to ensure compliance with federal arbitrage regulations.

FY 2019 Proposed Budget and Financial Plan D.C. Comprehensive Financial Management Policy
Appendix A-3
Refunding of Outstanding DebtThe District will regularly monitor its outstanding debt for optimal opportunities and timing to refund
(refinance) such debt at lower interest rates to produce debt service savings to the District, to remove or change
outdated or unwanted bond covenants, or for other reasons that may benefit the District.
Selection of Financial Consultants and Service ProvidersTo assist with issuing bonds in the most efficient and effective manner, and to ensure compliance with all
applicable legal requirements, the District shall select Bond Counsel, Disclosure Counsel, and Financial
Advisors, and generally does so on a competitive basis through a Request for Proposals (RFP) process.
However, this process does not preclude the District from engaging Bond Counsel, Disclosure Counsel, or
Financial Advisors without the competitive process where a unique or emergency situation warrants such
engagement as permitted by law. The District will document such situations in writing.
Equipment Financing ProgramThe District maintains a program to finance (on a tax-exempt basis) the acquisition of agency capital
equipment with estimated useful lives of five to ten years. This program is part of the District’s policy of
matching the useful life of capital assets to the duration of the debt that finances them, identifying low-cost
financing, and managing agency operating costs associated with equipment lease financing. The District is not
currently purchasing new assets through the program but is obligated to pay outstanding debt until it is retired.
New financings could resume if the CFO determines it is in the best interest of the District.
Independent Agency/Instrumentality Debt IssuanceThe CFO shall determine whether or not it is advisable for certain independent agencies/instrumentalities of
the District that have segregated revenue streams to pursue issuing bonds supported by such revenue streams.
If the CFO determines that such a transaction is advisable, the CFO shall, through the Mayor, submit a
written request to the District Council for enactment of the necessary authorizing legislation. The CFO must
approve the ultimate structure of any such transaction, and must approve the transaction itself. In the event of
such a financing, the independent agency/instrumentality shall provide pertinent information and documents
to the CFO related to such financing (including the project or program financed) on an ongoing basis and upon
request.
Short-Term BorrowingThe District’s policy is to issue short-term debt in the form of Tax Revenue Anticipation Notes (TRANs) to
finance any intra-year seasonal cash flow needs if necessary. TRANs must be repaid by the end of the fiscal
year in which they are issued. A long-term policy goal is for the District to obtain and maintain sufficient
operating cash balances in order to minimize or eliminate the need for short-term borrowing.
The District may utilize additional short-term financing vehicles including Bond Anticipation Notes,
Commercial Paper, and others to meet interim capital funding needs. Bond Anticipation Notes and
Commercial Paper may be rolled or redeemed with the issuance of long-term debt.
Financial Asset Management Policy
Authorization and ResponsibilityThe CFO, established by the District of Columbia Financial Responsibility and Management Assistance Act
of 1995, approved April 17, 1995 (Pub.L. No. 104-8, §302(a), 109 Stat 142, D.C. Official Code §1-204.24a),
is responsible for maintaining custody of all public funds belonging to or under the control of the District
government and depositing all amounts paid in such depositories pursuant to Section 424 of the Home Rule
Act and under such terms and conditions as may be designated by the District Council. Except where
prescribed by law, the CFO has delegated this responsibility to the Treasurer of the District of Columbia
(Treasurer).

D.C. Comprehensive Financial Management Policy FY 2019 Proposed Budget and Financial Plan
Appendix A-4
The Treasurer, on behalf of the CFO, maintains custody of all public funds belonging to or under the
control of the District government or its agencies and deposits all funds in depositories pursuant to D.C.
Official Code §1-204.24d(11). The Treasurer is responsible for the administration and supervision of the
Office of Finance and Treasury (OFT), which includes the responsibility for the collection and deposit of all
receipts. The Treasurer shall also specify operational procedures and standards to be used for all depository
intake facilities.
Deposit of Cash Receipts PolicyAll District government agencies and instrumentalities, including component units, boards, commissions and
other public entities, are subject to D.C. Official Code §47-351 et seq. and shall deposit all cash, checks and
other negotiable instruments received within 48 hours after collection or receipt of such monies. Items
deposited pursuant to D.C. Official Code §47-351 et seq. shall be properly posted in the District’s accounting
system of record within 48 hours or two business days after the event. If cash needs to be collected by an
agency, OFT cashiers must either collect the actual cash or have oversight of the collection process.
Background: The timely deposit of monies received provides several benefits. The most important ben-
efit is effective and efficient control of these funds, which reduces the risk of loss due to errors, carelessness
or theft. In addition, the timely deposit of funds helps to maximize cash flow for interest earnings; lowers bor-
rowing needs, and lessens the risk of returned checks due to non-sufficient funds or account closure. It also
provides a responsive service to the payers who would otherwise be uncertain whether their checks were
received.
Disbursement of Public Funds PolicyAll disbursements from District depository accounts shall be made by check, electronic transfer or pay cards.
All District agencies shall comply with the OCFO’s Financial Management and Control Orders No. 08-008,
No. 07-004A*, and No. 98-16, which establish guidelines of authority and certification, indicate required
documentation, and require expediency in the processing of payment vouchers. All District agencies and
employees shall comply with the OCFO’s Financial Management and Control Order No. 12-24, which
governs the establishment, control and maintenance of bank accounts, checks and signature authority to
prevent fraud, abuse or other irregularities. Likewise, all District agencies shall also comply with the
provisions in the District’s Quick Payment Act, which ensures the timely payment of public funds to vendors,
suppliers, and contractors.
Background: OFT recognizes the financial risks associated with the issuance of checks. The prevalence
of check fraud demands that the District take measures to safeguard the District’s funds, including the use of
a single state check design. Checks issued by the District government use a controlled paper stock with
numerous security features and a background design that makes all District government checks easily
recognizable as official, legal payment instruments of the District government. In addition, the District uses
banking services and policies that prevent fraud by requiring that the District’s banking institutions only honor
checks that the District has previously identified as being validly issued. To further reduce costs and risks, the
District has and will continue to reduce its use of checks as a predominant means of disbursement.
Collateralization PolicyIt is the policy of OFT to ensure that at all times the District’s funds held at financial institutions are fully
federally insured or, at a minimum, collateralized at 102 percent in compliance with the Financial Institution
Deposit and Investment Amendment Act of 1997, effective March 18, 1998 (D.C. Law 12-56, D.C. Official
Code §47-351 et seq.) (the “Deposit Act”). The responsibility for monitoring financial institutions’ compliance
with the District’s collateral requirements on a daily basis is delegated to the Banking Services Unit in OFT.

FY 2019 Proposed Budget and Financial Plan D.C. Comprehensive Financial Management Policy
Appendix A-5
Banking Services PolicyIt is the policy of the District government to procure banking services and establish bank accounts pursuant to
competitive award practices consistent with the Deposit Act and the OCFO’s standard contracting processes.
OFT shall routinely monitor bank performance using predetermined performance standards and assess
penalties for failure to perform. Bank accounts shall only be opened by OFT. District agencies cannot open
bank accounts independently, and other District entities may open bank accounts only if explicitly permitted
by legislation.
Electronic Benefit Transfer (EBT) Payment PolicyOFT, in conjunction with the Department of Human Services, shall administer the District’s Electronic Benefit
Transfer (“EBT”) Program in compliance with the Personal Responsibility and Work Opportunity
Reconciliation Act of 1996, approved August 6, 1996 (Pub. L. No. 104-193; 110 Stat. 2105) (“Welfare Reform
Act”) and provide necessary training to eligible District of Columbia residents who participate in the EBT
Program.
Background: The Welfare Reform Act mandated that all states and the District of Columbia establish an
electronic delivery system for the distribution of food stamp benefits provided through the Supplemental
Nutrition Assistance Program (“SNAP”) by October 2002. As a result, the District’s EBT system was
implemented in 1998. The system electronically delivers both SNAP and cash assistance through Temporary
Assistance for Needy Families (“TANF”) benefits to District recipients. EBT is a special application of
electronic funds transfer (“EFT”) technology, which allows both TANF and SNAP benefits to be loaded
directly to a pay card, eliminating the former costly and cumbersome processes surrounding paper food stamps
and check writing. Also, it provides access to mainstream payment methods for District citizens, provides food
retailers with point-of-sale methods of accepting SNAP payments, enhances methods used to account for
SNAP benefits, and facilitates more efficient payments to individual merchants with funds from the U.S.
Department of Agriculture.
Internal Control Policy Related to Financial AssetsThe District government shall maintain sound internal control policies and practices to ensure: (a) compliance
with applicable laws, guidelines, regulations, and professional standards; and (b) adequate safeguarding of
assets under the control of agencies, component units, boards and commissions. Therefore, agencies must
adhere to the following policies and prescribed practices:
• Agencies are required to obtain prior approval by OFT to open a bank account. Written requests must be
submitted to the Treasurer or Associate Treasurer of OFT, and requests must be accompanied by
supporting documentation (e.g. legislation or a copy of an executed contract);
• Employees who handle cash, checks, credit cards, pay cards or any other negotiable instruments should be
bonded as a condition of employment and must not record the related transactions in the general ledger nor
maintain accounting records;
• Cash shall not be accepted or received directly by any District agencies except OFT. Exceptions to this
policy must be approved in advance and oversight provided by OFT;
• Check payments received shall be restrictively endorsed payable to the D. C. Treasurer, not to an agency
or a District employee;
• Cash receipts shall be reconciled daily and discrepancies shall be investigated promptly by the designated
authorized personnel;
• Access to cash shall be restricted to OFT cashiers and secured when not in use; and
• Any site that secures cash, checks, pay cards or other negotiable financial instruments shall maintain them
securely in a vault under dual control for access or removal. Dual control requires two people to
cooperate in maintaining and confirming assets, with the work of one employee being verified or approved
by a second employee. Both are equally accountable for the protection of the assets.

D.C. Comprehensive Financial Management Policy FY 2019 Proposed Budget and Financial Plan
Appendix A-6
Investment PrioritiesThe District will invest cash not needed for immediate disbursement in a manner consistent with applicable
District law and policy, and in doing so will: (a) provide for the safekeeping of principal amounts invested, (b)
maintain adequate liquidity to fund the District’s operations and other funding needs, and (c) maximize
earnings on invested funds, in that order of priority. The maximization of earnings will be accomplished by
analyzing up-to-date cash flow projections documenting the amounts and timing of the District’s operating
cash needs over the course of a given fiscal year, as well as the general investment environment and the
respective earnings (interest) rates available to the District from the various permissible investment
instruments. Based on these factors, the appropriate investment decision will be made.
Investment of Operating Cash BalancesEach business day, using same-day data from banks (check/ACH/wire clearings), OFT will determine if the
District has excess cash on hand for that particular day and factor in a cushion for unexpected disbursements.
Any excess cash will be invested in one or more of the permissible investment instruments in accordance with
the policy described in the “Investment Priorities” section above.
Investment of Additional Bank Account BalancesThe District government will strive to ensure that no cash balances sit idle without being invested. The
majority of the District’s operating bank accounts are structured such that all funds not utilized in collection or
disbursement accounts at the end of a given day will be consolidated to the pooled cash account and invested
or will be used to generate credit to offset bank fees.
Investment of Bond Escrow and Note Escrow FundsThe District government will invest bond escrow and note escrow balances (funds set aside for the payment
of principal and/or interest on outstanding District bonds or notes) in accordance with the same general
policy guidelines described in the “Investment Priorities” section above, except that the maximum duration of
such investments (the liquidity aspect referenced above) will be determined by the principal and/or interest
payment due dates on the bonds or notes as opposed to operating cash flow projections as well as any other
requirements contained in the respective bond or note documents.
Investment of Bond and Note ProceedsProceeds from the sale of District bonds and notes shall be invested in allowable investments in accordance
with applicable federal and District laws, stipulations in the respective bond or note documents as to how such
funds are to be invested, federal arbitrage regulations regarding the investment of bond and note proceeds (both
of which may be more restrictive than District law), and pre-determined payout schedules (or estimates) for
such proceeds (based on the purpose and manner of use of such Funds).
Investment of Debt Service Reserve FundsDebt service reserve funds established either from the proceeds from the sale of District bonds and notes or
other sources shall be invested in allowable investments in accordance with applicable federal and District
laws, stipulations in the respective bond or note documents as to how such funds are to be invested, federal
arbitrage regulations regarding the investment of bond and note proceeds (both of which may be more
restrictive than District law), and pre-determined payout schedules (or estimates) for such proceeds (based on
the purpose and manner of use of such Funds) as well as any other requirements contained in the respective
bond or note documents.
Investment of Bond and Note Related AccountsInvestment of Bond and Note related accounts shall be invested in allowable investments in accordance with
applicable federal and District laws, stipulations in the respective bond or note documents as to how such funds

FY 2019 Proposed Budget and Financial Plan D.C. Comprehensive Financial Management Policy
Appendix A-7
are to be invested, federal arbitrage regulations regarding the investment of bond and note proceeds (both of
which may be more restrictive than District law), and pre-determined payout schedules (or estimates) for such
proceeds (based on the purpose and manner of use of such Funds), as well as any other requirements contained
in the respective bond or note documents.
Investment of Statutory Reserve FundsInvestment of statutory reserve funds (see Reserve Management Policy section) of the District shall be
invested in permitted investments in accordance with District law and policy.
Limits on Placement of Funds In accordance with the Financial Institutions Deposit and Investment Act of 1997, effective March 18, 1998
(D.C. Law 12-56, D.C. Official Code §47-351.03(d)), the District will not deposit/invest more than 25 percent
of its funds on hand with any one financial institution, and will not deposit/invest an amount with any one
financial institution that amounts to more than 25 percent of the assets of such institution.
Capital Asset Management Policy
Policy for Defining Capital AssetsCapital assets are long-lived items that provide a benefit for a number of future periods. They are either
classified as “capitalized assets,” subject to the District’s standard depreciation rules, or “controllable
property,” which are neither capitalized nor depreciated for financial reporting purposes. Proper accounting for
capital assets requires the capitalization of appropriate expenditures for each of the following asset categories:
• Land - non-expendable, real property, for which title is held by the District;
• Land Improvements - including the cost of permanent attachments, other than buildings, which add value
to land;
• Buildings - all real estate, excluding land and land improvements, used for shelter, dwelling, and other
similar purpose;
• Leasehold improvements (real property) – permanent improvements or betterments that increase the
useful lives of the leased property;
• Equipment/Furniture/Vehicles - tangible personal property that is: a) complete in itself; b) does not lose
identity or become a component of the building where it resides; c) of a durable nature with an expected
service life of three or more years;
• Intangible Assets – assets that lack physical substance, are nonfinancial in nature, and have an initial
useful life extending beyond a single reporting period, including, for example, easements, water rights,
patents, trademarks, and computer software;
• Construction-in-Progress (CIP) - includes the costs incurred when constructing long-lived assets (e.g.,
buildings and other improvements); CIP represents the costs associated with incomplete projects; and
• Infrastructure Assets - long-lived capital assets that normally can be preserved for a significantly greater
number of years than most capital assets and that are normally stationary in nature. Examples of
infrastructure assets include roads, sidewalks, bridges, tunnels, drainage systems, water and sewer systems,
dams, street lighting systems and transit subway systems.

D.C. Comprehensive Financial Management Policy FY 2019 Proposed Budget and Financial Plan
Appendix A-8
General Capital Asset PolicyCapital assets must be properly authorized, classified, valued and adequately safeguarded. Physical and
accounting control policies and procedures established by the Office of Financial Operations and Systems
(OFOS) must be followed by each agency. Each agency must implement the following policies:
• All capital assets that have been capitalized shall be included on the agency’s capital asset listing;
• All capitalized or controllable assets shall be reported in the Fixed Assets Subsystem (FAS) of the System
of Accounting and Reporting (SOAR) maintained by OFOS;
• Each agency shall designate an individual who will be responsible for accounting for capital assets and
ensuring that all divisions within the agency comply with District requirements;
• All agencies shall adhere to the capitalization and controllable inventory policies and procedures
established by OFOS;
• All acquisitions and disposals of capital assets shall be properly authorized by applicable laws and
approved by the agency director or designee. In addition to the agency director, the appropriate regulating
bodies may be required to approve some acquisitions and disposals; and
• All agencies shall maintain documentation related to the acquisition, use, and disposal of capital assets.
Such documentation is to be retained throughout the life of each capital asset and for a specified period of
time after disposal, consistent with the OCFO’s and the District’s records retention policies. Where bond
proceeds are used to acquire or improve the property, all agencies shall work with the Mayor and the
OCFO to ensure that the acquisition, use, transfer or disposition of the property is in compliance with the
applicable laws.
Capitalization Policy• All land, land improvements and building additions must be capitalized regardless of cost.
• Capital improvements shall be capitalized if the total project cost is $5,000 or more, and the improvements
increase the utility of the asset or significantly extend its useful life by two years or more. Expenditures
for improvements that do not increase the service utility of the asset or significantly extend its life should
be classified as repairs and maintenance and not capitalized.
• Furniture, vehicles, and equipment shall be capitalized if the aggregate cost is $5,000 or more and the
useful life of the asset is three years or greater. Costs pertaining to computers include amounts incurred
for monitors, cables, battery packs or any additional accessories needed for the equipment to function.
Capitalizable computer costs do not include printers because printing functions can be spooled to a central
printer, which can be utilized by several computers.
• Computer software system costs shall be capitalized if the total cost including purchase, installation, and
testing is $5,000 or more, and it provides a future economic benefit of three or more years. If the
computer software system is developed in-house by District personnel or by a third-party contractor on
behalf of the District, it should be considered internally generated. Software which is commercially
available either by license or outright purchase and modified using more than minimal incremental; effort
before being put into operation should also be considered internally generated. The activities of
developing and installing internally generated software can be grouped in three stages:
1. Preliminary Project Stage: Conceptual formation, evaluation of alternatives, determination of
needed technology, and final selection of alternatives;
2. Application Development Stage: Design of chosen path including configuration and interfaces,
coding, and installation to hardware; and
3. Post-Implementation/Operation Stage: Application training and software maintenance.
• Outlays associated with the preliminary project stage should be expensed as incurred. Outlays related to
the application development stage should be capitalized. Outlays in the post-implementation stage should

FY 2019 Proposed Budget and Financial Plan D.C. Comprehensive Financial Management Policy
Appendix A-9
be expensed. Training that is directly related to installation and testing should be capitalized. The cost of
training after the system has been placed in service should be expensed as incurred. Upgrades and
enhancements should only be capitalized if such costs significantly increase the life or functionality of the
system by two years or more.
• Computer hardware system costs shall be capitalized if the total cost including acquisition, installation, and
testing is $5,000 or more, and it provides a future economic benefit of three or more years. The cost of each
component of a computer hardware system should be initially recorded as controllable inventory in the
FAS. When the hardware system is ready for its intended use, the inventoried costs should be grouped and
capitalized as one unit of property in the FAS. Upgrades and enhancements should only be capitalized if
such costs significantly increase the life or functionality of the system by two years or more.
• Betterments shall be capitalized if the cost is $5,000 or more and the addition made to the capital asset is
expected to prolong its life or increase its efficiency over and above that resulting from repairs or
maintenance. The cost of the betterment is added to the book value of the asset. Betterments do not include
building improvements. Betterments that cost less than $5,000 should be classified as repairs and mainte-
nance and not capitalized.
• Equipment with a unit cost of less than $5,000 shall be identified as controllable equipment of the agency
and recorded in the FAS. The minimum unit cost level required to be identified as controllable equipment
of the agency is $1,000, except certain items. Equipment below $1,000 may be tagged with a property
identification number and recorded on a supplementary listing for stewardship and sensitivity reasons.
Controllable Property PolicyControllable property is non-capitalized, tangible property that is considered valuable and/or sensitive with a
high risk of theft with a value of less than $5,000 and/or with an expected life of less than three years. Similar
to capitalized property, controllable property is subject to the requirements of this Comprehensive Financial
Management Policy regarding security, stewardship, maintenance, and utilization. These assets shall be
excluded from depreciation calculations and financial reports. They shall, however, appear on other
management information reports and capital assets records. Persons provided with controllable property (e.g.,
cellular telephones, iPads, and laptop computers) for their direct official use shall be held responsible and liable
for the asset(s) assigned to them. Such assets shall be returned to the agency whenever an individual’s
employment with the agency terminates.
Physical Inventory PolicyTo ensure that personal property capital assets are properly safeguarded and accounted for, OFOS shall
conduct a partial physical inventory of personal property capital assets on an annual basis. Utilizing this
process shall result in the accounting for all District-owned assets (personal property) within a two-year
period. Capital assets for each financial cluster will be inventoried every other year based on two cluster
groupings. The inventory shall be conducted based upon the assets listed in the FAS as of a given date. Each
agency shall be responsible for making sure that the proper personnel are available to guide the inventory
contractor to the location of the assets. The physical inventory shall be properly managed and supervised by
the individual who is responsible for the agency’s property management function to ensure that the inventory
process is effective and efficient. OFOS shall oversee reconciliations and adjustments to the detailed
accounting records resulting from the physical inventory
Acquisition PolicyCapital assets shall be initially recorded at historical cost, which is defined as the cash or cash equivalent cost
of obtaining the asset and bringing it to the location and condition necessary for its intended use. Donated
assets shall be recorded at acquisition value, defined as “the price that would be paid to acquire an asset with
equivalent service potential in an orderly market transaction at the acquisition date.” Construction-in-progress
represents capitalization of labor, material, and overhead costs of a capital project. When the project is

D.C. Comprehensive Financial Management Policy FY 2019 Proposed Budget and Financial Plan
Appendix A-10
completed, costs in the construction-in-progress balance sheet account shall be reclassified to one or more of
the property and equipment accounts.
Valuation PolicyThe most acceptable method of valuation is original cost (historical). Such data can be determined by
retrieving original invoices, purchase orders, check copies, contracts, minutes, or auditor’s workpapers.
However, if the original cost cannot be established, estimated historical cost data may be used.
Document Retention PolicyDocuments related to the acquisition, use, and disposal of District-funded capital assets shall be retained
throughout the life of the capital asset and for a minimum of three fiscal years following the disposal of the
capital asset or as required by applicable laws and regulations. For federally funded assets, document
retention should follow the OMB circular guidance.
Depreciation PolicyThe FAS automatically calculates and posts depreciation for capital assets. Depreciation expense shall be
calculated using the straight-line method based on the useful life of the capital assets.
Property Control Policy Each agency director, working with the respective OCFO staff, shall establish custodial control policies. The
agency shall identify the individual who will be responsible for managing capital assets and ensure that all
divisions within the agency comply with the District’s accounting, custodial, and inventory policies.
Disposal PolicyAll disposals of capital assets shall be properly authorized by applicable laws and approved by the agency
director or designee. In addition to the agency director, appropriate regulatory bodies shall approve some
disposals. All proceeds from the sale of District government property shall be recorded as Miscellaneous
Revenue. Where bond proceeds are used to acquire or improve the property, all agencies shall work with the
Mayor and the OCFO to ensure that the disposition of the property is in compliance with the applicable laws.
Except for agencies with independent procurement authority, the Office of Contracting and Procurement
(OCP) is the sole agency responsible for the disposition of all excess and surplus property, excluding vehicles
that are disposed of by the Department of Public Works (DPW). After approval has been obtained from OCP
and the capital assets have been properly disposed, the agency must immediately record the capital asset as
disposed of on any internal listing and in the FAS within five working days from the date of disposal.
Reserve Management Policy
Emergency Reserve Fund ManagementIt is the policy of the District government to comply with section 450A of the Home Rule Act, D.C. Official
Code §1-204.50a, for the establishment, deposit, maintenance, use and replenishment of the District of
Columbia’s Emergency Reserve Fund. Any modifications to these requirements shall be implemented when
the law changes and reflected in the Policy.
The Emergency Reserve Fund may only be used for unanticipated and nonrecurring extraordinary needs
of an emergency nature, including a natural disaster or calamity as defined by section 102 of the Robert T.
Stafford Disaster Relief and Emergency Assistance Act (Pub. L. 100-707, effective November 23, 1988) or
unexpected obligation created by federal law. The Fund may not be used to fund any department, agency, or
office of the District government administered by a receiver or other official appointed by a court, shortfalls in
any projected reductions included in the budget proposed by the District government for the fiscal year, or
settlements and judgments made by or against the District of Columbia government. Funds may only be

FY 2019 Proposed Budget and Financial Plan D.C. Comprehensive Financial Management Policy
Appendix A-11
allocated after an analysis has been prepared by the CFO and only after a projection by the CFO that the entire
Contingency Reserve Fund (see next section) will be completely exhausted at the time of the allocation.
Interest earned on the Emergency Reserve Fund shall remain in the account for permitted uses pursuant to D.C.
Official Code §1-204.50a. For purposes of cash flow management, the CFO or his/her designee may borrow
from the Emergency Reserve Fund as long as adherence to the terms of D.C. Official Code §1-204.50a is
maintained.
The District shall budget and deposit sufficient funds in each fiscal year to maintain or replenish the
Emergency Reserve Fund as required by D.C. Official Code §1-204.50a or move unassigned fund balance into
the Fund as needed. Replenishment of an allocation may also be made within the same fiscal year through a
reprogramming of budget authority or a Supplemental Appropriation.
The District government will invest Emergency Reserve Fund account balances in accordance with the
same general policy guidelines described in the “Investment Priorities” section above.
Background: The District is required to maintain an Emergency Reserve Fund equaling a minimum of 2
percent of the qualified operating expenditures based on the applicable Comprehensive Annual Financial
Report (CAFR) pursuant to D.C. Official Code §1-204.50a.
Contingency Reserve Fund ManagementIt is the policy of the District of Columbia to comply with section 450A of the Home Rule Act, D.C. Official
Code §1-204.50a, for the establishment, deposit, maintenance, use and replenishment of the District of
Columbia’s Contingency Reserve Fund. Any modifications to these requirements shall be implemented when
the law changes and reflected in the Policy.
The Contingency Reserve Fund may be used only for nonrecurring or unforeseen needs that arise during
a fiscal year, including expenses associated with unforeseen weather or other natural disasters, unexpected
obligations created by federal law or new public safety or health needs or requirements that have been
identified after the budget process has occurred, or opportunities to achieve cost savings. The Fund may also
be used, if needed, to cover revenue shortfalls experienced by the District government for 3 consecutive
months (based on a two-month rolling average) that are 5 percent or more below the budget forecast. The
Contingency Reserve Fund may not be used to fund any shortfalls in any projected reductions that are
included in the budget proposed by the District government for the fiscal year. Funds may only be allocated
after an analysis has been prepared by the CFO and all other surplus funds available to the District have been
completely exhausted. Interest earned on the Contingency Reserve Fund shall remain in the account for
permitted uses pursuant to D.C. Official Code §1-204.50a. For purposes of cash flow management, the CFO
or his/her designee may borrow from the Contingency Reserve Fund as long as adherence to the terms of D.C.
Official Code §1-204.50a is maintained.
The District shall budget and deposit sufficient funds in each fiscal year to maintain or replenish the
Contingency Reserve Fund as required by D.C. Official Code §1-204.50a or move unassigned fund balance
into the Fund as needed. Replenishment of an allocation may also be made within the same fiscal year through
a reprogramming of budget authority or a Supplemental Appropriation.
The District government will invest Contingency Reserve Fund account balances in accordance with the
same general policy guidelines described in the “Investment Priorities” section above.
Background: The District is required to maintain a Contingency Reserve Fund equaling a minimum of 4
percent of the qualified operating expenditures based on the applicable CAFR pursuant to D.C. Official Code
§1-204.50a.
Fiscal Stabilization Reserve and Cash Flow Reserve FundsIt is the policy of the District government to comply with current requirements for building and maintaining
the District of Columbia’s Fiscal Stabilization and Cash Flow Reserve Funds as defined by D.C. Official Code

D.C. Comprehensive Financial Management Policy FY 2019 Proposed Budget and Financial Plan
Appendix A-12
§47-392.02. Any modifications to these requirements shall be implemented when the law changes and shall
be reflected in the Policy.
The District government will invest fiscal stabilization and cash flow reserve account balances in
accordance with the same general policy guidelines described in the “Investment Priorities” section above.
Background: The Fiscal Stabilization Reserve Fund may be used by the Mayor for certain purposes for
which the Contingency Reserve Fund may be used, as specified in section 450A(b)(4) of the Home Rule Act,
D.C. Official Code §1-204.50a(b)(4), as certified by the CFO, with approval of the Council by act. The Fiscal
Stabilization Reserve Fund may also be used for funding the appropriations advance to the District of
Columbia Public Schools and the District of Columbia Public Charter Schools, as authorized by the annual
budget and financial plan; provided, that any amounts used must be replenished immediately upon the
approval of the District's annual budget for that year. The Fiscal Stabilization Reserve Fund may also be used
by the Chief Financial Officer to cover cash flow needs; provided, that any amounts used must be replenished
to the Fiscal Stabilization Reserve Fund in the same fiscal year. At full funding, this reserve must equal 2.34
percent of the District’s General Fund operating expenditures for each fiscal year. The Cash Flow Reserve
may be used by the CFO or his/her designee to cover cash flow needs. When amounts are used, the Cash Flow
Reserve must be replenished in the same fiscal year of use. At full funding, this reserve must equal 8.33
percent of the General Fund operating budget for each fiscal year.
If either the Fiscal Stabilization Reserve or the Cash Flow Reserve is below full funding upon issuance of
the CAFR, the CFO must commit 50 percent of the unassigned end-of-year fund balance to each reserve, or
100 percent of the end-of-year fund balance to the remaining reserve that has not reached full capacity, to fully
fund the reserves to the extent allowed by the end-of-year fund balance. Moreover, if the amount required for
the Contingency Reserve or Emergency Reserve is reduced, the amount required to be retained in the Fiscal
Stabilization Reserve is to be increased by the same amount.
Fiscal Management Policy
Balanced BudgetPursuant to the Home Rule Act, the District shall both create and operate under a balanced budget throughout
the fiscal year. Proposed expenditures under the Mayor’s budget proposal to the Council, the local portion
adopted by Council, and the District’s federal portion proposal to Congress, must be balanced within estimat-
ed revenues and other resources as certified by the CFO (see Home Rule Act § 424(d)(5)(A); D.C. Code § 1-
204.24d(5)(A)). During the year, if revenue forecasts change (see “Revenues” below) such that an unbalanced
budget would result, the budget must be adjusted, following approved procedures, to re-attain balance.
A balanced budget for the District is comprised of budgets for each agency, which sum to a total that is
balanced within certified revenues. No agency may spend more than its budget (see “Anti-Deficiency Act”
below). As each agency spends within its budget, the District’s total spending cannot exceed its total budget,
thus assuring the District’s total spending does not exceed its revenues.
RevenuesThe District shall strive to maintain a balanced and diversified revenue system to protect against adverse
fluctuations in any one source of revenue, which may result from changes in local and/or national economic
conditions.
Quarterly Revenue Adjustments: The OCFO shall make revised quarterly adjustments to the revenue
estimated for the year in progress as required by law (D.C. Official Code §1-204.24d(5)(B)). These
adjustments, as certified by the CFO, will be submitted to the Mayor and the District Council. They shall serve
as the basis for determining whether revenues are in balance with anticipated expenditures. In addition, the
CFO’s certified revenue estimates shall be used as the basis for any request for supplemental appropriations

FY 2019 Proposed Budget and Financial Plan D.C. Comprehensive Financial Management Policy
Appendix A-13
submitted to the U.S. Congress that would increase the total amount of General Fund revenue appropriated to
the District.
General Fund BalanceIn FY 2011, the District implemented Governmental Accounting Standards Board (GASB) Statement No. 54,
Fund Balance Reporting and Governmental Fund Type Definitions. Consistent with the requirements of that
Statement, the District’s General Fund balance is comprised of five components: non-spendable, restricted,
committed, assigned, and unassigned, which are described more fully below.
• Nonspendable – resources which cannot be spent because they are either:
(a) not in spendable form; or (b) legally or contractually required to be maintained intact.
• Restricted – resources with use constraints which are either: (a) externally imposed by creditors (such as
through debt covenants), grantors, contributors, or laws or regulations of other governments; or (b)
imposed by law through constitutional provisions or enabling legislation.
• Committed – resources which can only be used for specific purposes pursuant to limitations imposed by
formal action of the District government’s highest level of decision-making authority (the Mayor and the
District Council). Amounts in this category may be redeployed for other purposes with the appropriate due
process. Committed amounts cannot be used for any other purpose unless the District government
removes or changes the specified use by taking the same type of action it used to previously commit the
amounts.
• Assigned – resources neither restricted nor committed, for which the District has a stated intended use as
established by the Mayor, District Council, or a body or official to which the Mayor or District Council has
delegated the authority to assign amounts for specific purposes. These are resources where the
constraints/restrictions are less binding than that for committed resources.
• Unassigned – resources which cannot be classified in one of the other four categories. The General Fund
is the only fund which may report a positive unassigned fund balance amount. In other governmental
funds, if expenditures incurred for specific purposes exceed the amounts restricted, committed, or assigned
to those purposes, negative unassigned fund balance may be reported.
Fund balance appropriated for the current fiscal year’s operating budget shall be used only to the extent
needed, if any, to balance the current fiscal year’s actual revenues to actual expenditures. In a given year,
actual revenues may exceed projected and appropriated revenues. When this occurs, the District shall first
apply the excess revenues before it applies any appropriated fund balance. Under no circumstances shall the
District apply more fund balance than has been duly appropriated.
Moreover, it is the policy of the District to use restricted resources first, followed by committed resources
and then assigned resources, when expenses are incurred for purposes for which any of these resources are
available.
The portion of the fund balance of the General Fund that is restricted or committed shall be maintained for
its specific purpose, unless modified by subsequent legislation. The District strives to maintain within its
restricted and/or committed fund balance components an amount up to the level that would result in sufficient
working cash to reduce the need for short-term borrowing to finance operations of the subsequent year.
Background: The fund balance of the General Fund represents the difference between the Fund’s assets
plus deferred outflows and its liabilities plus deferred inflows of resources at the end of a fiscal year, or
September 30th. The ending fund balance of a fiscal year is also the beginning fund balance of the ensuing fis-
cal year. Positive differences between revenues and expenditures, or surpluses, increase the fund balance.
Negative differences, or deficits, decrease the fund balance.
An ever-growing fund balance that is inaccessible is not advantageous to the District because it restricts the
District’s ability to allocate resources among priorities. The amount of the fund balance is not indicative of

D.C. Comprehensive Financial Management Policy FY 2019 Proposed Budget and Financial Plan
Appendix A-14
funds that may be used for any purpose in the future. Rather, unassigned fund balance would represent an
amount that may be used for District priorities after approval by both the District Council and the U.S.
Congress.
Expenditure Reporting The District shall make expenditures only in accordance with federal appropriations law and the District’s
budget approved by Congress and the District Council. Financial statements will accurately reflect these
expenditures. The District’s CAFR shall reflect expenditures in the relevant appropriation titles.
Accrual AccountingThe District shall prepare financial statements using both the modified accrual and the full accrual bases of
accounting in accordance with GASB Statement No. 34, Basic Financial Statements – and Management’s
Discussion and Analysis – for State and Local Governments.
Background: The District implemented the requirements of GASB Statements No. 34 through 38 during
FY 2002 as required by GASB. As a result of this implementation, in FY 2002 the District began issuing two
full accrual financial statements (a Statement of Net Position and a Statement of Activities) and including a
Management’s Discussion and Analysis in its CAFR. Accrual accounting reports all of the revenues and costs
of providing services each year. This approach includes not just current assets and liabilities (such as cash and
accounts payable) but also capital assets and long-term liabilities (such as buildings and infrastructure,
including bridges and roads, and general obligation debt). Accrual accounting helps the District meet the
following important objectives of financial reporting.
• Assess the finances of the government in its entirety, including the year’s operating results;
• Determine whether the government’s overall financial position has improved or deteriorated;
• Evaluate whether the government’s current-year revenues are sufficient to pay for current-year
services;
• Assess the government’s cost of providing services to its citizenry;
• Assess how the government finances its programs – through user fees and other program revenues versus
general tax revenues;
• Understand the extent to which the government has invested in capital assets, including roads, bridges,
• and other infrastructure assets; and
• Make better comparisons between governments.
Tax Expenditure BudgetThe CFO is required by law to prepare a biennial tax expenditure budget that estimates the revenue loss to the
District government resulting from tax expenditures during the current fiscal year and the next three fiscal
years.
Special Purpose Revenues Special Purpose Revenues are program revenues that are generated from fees, fines, special assessments,
charges for services, and reimbursements that are set aside for a specific purpose for the District agency that
collects the revenues to cover the cost of performing the related function. Special Purpose Revenues are
classified as General Fund revenues.
Program revenues are defined as revenues that derive directly from the program itself or from parties out-
side the reporting government's taxpayers or citizenry as a whole; they reduce the net cost of the function to
be financed from the government's general revenues.
An agency may have more than one fund within the Special Purpose Revenue category. Revenues will be
estimated for each agency’s funds on a quarterly basis consistent with all general fund revenues.

FY 2019 Proposed Budget and Financial Plan D.C. Comprehensive Financial Management Policy
Appendix A-15
It is the policy of the District government that all program revenues generated by any agency belong to the
District as a whole, unless otherwise required by law. As a general rule, all revenues should be allocated
through the budget and appropriations process. Dedicated funds limit the use of the District's general fund
revenue by earmarking a portion of the revenue for special purposes.
In certain limited cases, Special Purpose Revenue fund accounts are necessary to support a particular
program or activity. In such limited cases of need, the agency fund account must be created through the
normal legislative process and adhere to requirements to be recommended by the CFO and adopted by the
Mayor and District Council. Since program revenues are reported in a governmental fund, they should there-
fore be accounted for under the modified accrual basis of accounting in fund financial statements.
The District could commit or assign in fund balance unspent program revenues in accordance with the
criteria established by generally accepted accounting principles and make available for use in subsequent years
if permitted by the authorizing legislation that established the fund. The function of restricted or committed
fund balance is simply to isolate the portion of fund balance that is restricted by external entities or enabling
legislation, or committed through the actions of both the legislative and executive branches of the District.
Assigned fund balance represents management's intended use of resources and generally should reflect
actual plans approved by the District. District agencies must have budget authority to expend Special Purpose
Revenues, as with other revenue sources. Budget authority is backed by certified revenue estimates, planned
use of certified amounts set aside in the fund balance, or a combination of these two sources. Unassigned fund
balance represents residual resources after the allocation of resources to all other classifications.
Expenditures are limited to the lesser of budget authority or available resources, which is the sum of
realized revenues and available fund balance.
Special Purpose Revenue budgets may be modified in accordance with federal appropriations law.
Reprogramming of budget authority from one agency fund to another is also permissible pursuant to
reprograming statutes. The CFO shall have discretion to reduce budget authority for agency funds where
revenue falls short of estimates.
Any existing Special Purpose Revenue fund accounts that are not supported by legislative authority may
be converted to local revenue. In addition, when required to cover a revenue shortfall, such revenue may also
be converted to local revenue.
GrantsThe District depends on Federal and Private Grant Funds to support a wide range of services and programs for
the citizens of the District. This section sets forth the District’s policies related to resource development, grant
administration and reporting, budget authority for grants, and fairness in awarding grants.
Resource Development: To better serve District residents, all District agencies shall pursue to the maximum
extent possible federal and other funding opportunities that enhance their ability to carry out the Mayor’s
strategic plan and initiatives and address the needs of the residents of this city, without binding the District to
unrealistic financial commitments.
Background: For the last decade, grants have comprised approximately one-fourth of the District’s annu-
al budget, and as such, have contributed significantly to the District’s ability to meet the needs of its citizens.
The District’s policy is to continue and, to the extent possible, increase its use of funds from other sources to
maximize delivery of services to residents.
Grant Administration and Reporting: The District of Columbia government, by accepting grant funds, and
when designating subgrantees, agrees to administer and report on them in strict adherence to the grantors’
programmatic and financial rules and regulations, the District’s Grants Policies and Procedures Manual, and
applicable federal and District laws.

D.C. Comprehensive Financial Management Policy FY 2019 Proposed Budget and Financial Plan
Appendix A-16
Budget Authority for Grants: District agencies will spend grant funds for allowable costs only at such time
as a grant award has been received, and to the extent they have budget authority to do so. Budget authority
applies to a particular fiscal year. If a grant covers multiple fiscal years, the sum of the budget authority across
those fiscal years should not exceed the grant award amount. Changes in budget authority will be made only
in accordance with the District’s policies and procedures regarding budget modifications (increases or
decreases in overall budget authority for a grant) or reprogrammings (increases or decreases in particular line
items within a grant that leaves the overall budget authority unchanged). Spending grant funds without
budget authority is a violation of the Anti-Deficiency Act. Agency updates to the spending plans required by
the Anti-Deficiency Act should reflect all changes to grant budget authority.
Background: Many of the grants that the District receives have performance year(s) different from the
District’s fiscal year. The timing differences between the grant year(s) and the District’s fiscal year impact the
budgeting for grants. Through the budget modification process, the CFO submits documentation to the District
Council requesting the establishment of budget authority for new grant awards received during the fiscal year
or grant budget authority not included in the congressionally approved budget for the fiscal year. This process
is unique among the District’s funding types and is mainly due to the nature of grants in comparison to the
District’s fiscal year requirements. All government officials work together to ensure that this administrative
process is as efficient as possible. The efficiency of the process can play a critical role in grants management.
Fairness in Awarding Grants: It is the intent of the District to have a fair and open competitive process for
the awarding of grant funds. To that end, the following procedures shall be followed:
• A Notice of Funds Availability (NOFA) shall be prepared and published in the D.C. Register.
• The agency administering the grant shall prepare the Request for Applications (RFA).
• For the purpose of awarding grants, District government agencies shall hold fair and open competitions
that comply with the D.C. Grants Policies and Procedures Manual and the Notice of Final Rule making,
Chapter 50: Subgrants to Private and Public Agencies.
The only exception to the above procedures occurs when an organization merits a targeted grant, and the
awarding of this targeted grant becomes transparent and is justified through the budget formulation process.
After the NOFA has been published and the RFA released, the District government agency appoints a
neutral and objective review panel. The panel is comprised of a minimum of three individuals with knowledge
and expertise in the objectives of the grant and RFA, as well as in the standard administrative requirements
mandated by the source of funds. The review panel scores the submitted applications and makes
recommendations as to which applications should be funded. The head of the District agency administering
the grant makes final decisions regarding awards and amounts. After this review and before the agency issues
the award documents, the Agency Fiscal Officer at the awarding agency shall certify that the award funds are
in place and available for distribution.
Background: The receipt of grant funds triggers many requirements including, but not limited to,
spending and reporting requirements. Grant awards typically mandate the terms and conditions governing
grants and incorporate the relevant regulations and statutes. Funds that are awarded to private and public
agencies by District agencies, as subgrants, are bound by the appropriate U.S. Office of Management and
Budget (OMB) Circular and Cost Principles as well as any policy guidelines issued by the grantor. Subgrants
to other District agencies are generally awarded through the Memorandum of Understanding process. Grants
to parties outside the District government generally are awarded through a grant agreement that specifies the
performance obligations of the grantee. In the case of grant awards from general funds, grantees must
comply with both the appropriate OMB Circular and Cost Principles and any other policy guidance included
in the grant agreement. The CFO will meet the District’s reporting requirements by publishing the quarterly

FY 2019 Proposed Budget and Financial Plan D.C. Comprehensive Financial Management Policy
Appendix A-17
Congressional Grant Budget and Activity report sent to Congress and the District Council, which provides
grant-level information; and monthly financial status reports, which provide summaries at the agency level.
Donated Funds Monitoring Policy Donated funds shall be authorized and monitored pursuant to D.C. Official Code § 1-329.01, Mayor’s Order
2010-167, effective October 15, 2010, and the related donation agreement with the respective donor. All
donated funds shall be used for the specific purpose expressed in the respective donation agreement,
deposited into the appropriate account, and shall be available for the intended purpose of the donation until
expended or unless the donor, for valid reasons, requests a refund. The Office of the City Administrator (OCA)
or a designee and the respective District agency or entity that receives the donation shall be responsible for
monitoring the expenditure of the donated funds, in accordance with the applicable rules and regulations.
CapitalPrior to recommending or approving new projects, the District must ensure that the budget for all capital
expenditures, including any planned acquisitions and any necessary replacement of assets, does not exceed
designated revenue streams and available debt service capacity. The annualized cost of any proposed changes
is compared to the approved budget totals from the prior 6-year Capital Improvements Program (CIP) period
for each fiscal year. New projects may be approved only insofar as the designated revenue streams are not
exceeded and long-term financing cost of the CIP stays within available funding limits, which require that debt
service costs not exceed a cap of 12 percent of the District’s General Fund expenditures, as detailed in the Debt
Management Policy.
Anti-Deficiency ActDistrict officials and employees must comply with: (a) the federal Anti-Deficiency Act, 31 U.S.C. §§1341,
1342, 1349 through 1351, 1511 through 1519 and D.C. Official Code §§ 1-206.03(e) and 47-105 (the “Federal
ADA”); and (b) the District Anti-Deficiency Act, D.C. Official Code §§47-355.01 et seq. (the “D.C. ADA”,
and (a) and (b) together, as amended from time to time, the “Anti-Deficiency Acts”). Among other provisions,
the D.C. ADA requires agency heads and agency fiscal officers to submit a spending plan and a position
roster (Schedule A) at the beginning of each fiscal year to the CFO. Managers must submit, on a quarterly
basis, projections of year-end spending to the agency head and agency fiscal officer, with summarized reports
being forwarded to the District’s CFO no more than 30 days after the end of each quarter. Employees are
prohibited from:
• Making or authorizing an expenditure or obligation exceeding an amount available in an appropriation for
an agency or fund;
• Obligating the District for the payment of money before an appropriation is made or before a certification
of the availability of funds is made, unless authorized by law;
• Approving a disbursement without appropriate authorization;
• Allowing an expenditure or obligation to exceed apportioned amounts;
• Deferring recording a transaction incurred in the current fiscal year to a future fiscal year;
• Submitting a required plan or projection in an untimely manner;
• Knowingly reporting incorrectly on spending to date or on projected total annual spending;
• Failing to adhere to a spending plan through overspending that is greater than 5 percent of the agency’s
budget, or $1 million; or
• Making or authorizing an expenditure or obligation for one capital project from another capital project.
A review board was established, consistent with the Act and implementing regulations, to review potential
violations referred to the board, determine culpability, and recommend penalties for violations. The CFO
submits quarterly reports to the Mayor and the District Council on actual expenditures and obligations com-
pared to planned levels. The CFO also is required to develop the quarterly apportionment of funds, by source

D.C. Comprehensive Financial Management Policy FY 2019 Proposed Budget and Financial Plan
Appendix A-18
of funds, for each agency based on the spending plans submitted by the agency heads and fiscal officers.
Background: District officials and employees are bound by the Anti-Deficiency Acts, which bar them
from obligating funds except in accordance with appropriations. Further, the D.C. ADA establishes a greater
level of control than does the Federal ADA, and it provides specific penalties for violations. Spending plans
are one of the D.C. ADA's key requirements to ensure that appropriations are not exceeded.
Economic Development Policy
Real Property Tax ExemptionsThe Office of Tax and Revenue (OTR) implements real property tax exemptions in accordance with
applicable law. Except for property exempted by specific legislation or immune from taxation by the District,
real property is taxable unless an administrative exemption with respect to such property has been granted. As
a general matter, owners of property for which an exemption is sought must apply to OTR. The applicable
requirements for exemption are generally set forth in D.C. Official Code § 47-1002 and the regulations
promulgated thereunder. OTR reviews each application and determines whether the requirements for the
applicable category of exemption, including those pertaining to ownership and use of the property, have been
met. A property cannot qualify for exemption simply because its owner is exempt from federal income tax or
other taxes. Once granted, the exemption remains in effect as long as the property continues to meet the
applicable requirements and the owner files the required annual use reports. If ownership of the property
changes, the categorical exemption terminates.
Analysis of Proposed Tax Exemptions and AbatementsThe OCFO must prepare a Tax Abatement Financial Analysis (TAFA) for any bill providing a tax abatement
and exemption under Title 47 or section 42-1103 of the D.C. Official Code (other than those of general
applicability) before the bill can receive a hearing before the Council. The TAFA includes a description of the
abatement, its estimated value and any proposed community benefits to be provided by the grantee of the
abatement, as well as an analysis of whether the grantee could meet its fiscal needs without the proposed
abatement, or, in the case of a group of beneficiaries that cannot be identified, whether the abatement can be
expected to achieve the proposed public policy goal. Finally, the District’s fiscal impact analysis procedures
require that the District budget incorporate any reductions in revenue that result from newly authorized tax
abatements, prior to such abatements taking effect.
Debt Financing ToolsThe District may provide public-sector financing of economic development to qualified projects pursuant to
District laws and subject to the District’s laws on borrowing limitations (D.C. Official Code §47-334 et seq.).
The OCFO works with the executive branch of the District government in the review, consideration, and
approval of the financing of qualified projects.
The primary economic development debt financing instruments used are:
• Tax Increment Financing (TIF) bonds or notes, in which incremental tax revenues from a project area are
pledged to pay debt service on tax increment financing bonds or notes issued to finance a portion of a
qualified project; and
• Payment In-Lieu-of-Taxes (PILOT) financing bonds and notes, in which the PILOT payments from a
project area are pledged to pay debt service on PILOT bonds or notes issued to finance a portion of a
qualified project. PILOT bonds or notes are used only for projects located on parcels that were
previously exempt from the payment of real property taxes.
If the Council approves the Downtown TIF Area as a secondary source for a TIF or PILOT bond, the
OCFO shall require a dedicated reserve fund, available to pay any shortfalls between (a) the project's actual

FY 2019 Proposed Budget and Financial Plan D.C. Comprehensive Financial Management Policy
Appendix A-19
tax increment and (b) actual debt service costs.
In addition, the District assists private entities, primarily nonprofit organizations and owners of rental
apartment complexes, by issuing private activity revenue bonds on their behalf. The District’s Revenue Bond
Program is administered by the Office of the Deputy Mayor for Planning and Economic Development, and
housing development related bonds are issued by the District of Columbia Housing Finance Agency. The debt
service on these bonds is payable solely from the revenue of the private entity and is not the District’s
obligation.


Appendix B:
Basis of Budgeting and Accounting


FY 2019 Proposed Budget and Financial Plan Basis of Budgeting and Accounting
Appendix B-1
The Government of the District of Columbia provides the following information regarding key tenets of its
Basis of Budgeting and Accounting:
BackgroundFour basic differences between the basis of accounting and the basis of budgeting for state and local
governments are:
(1) Basis Differences – these differences arise when the basis of accounting used to develop and approve thebudget differs from the basis of accounting required by Generally Accepted Accounting Principles(GAAP) for financial reporting. For example, the District uses the purchase method for budgetary purposesand the consumption method for GAAP basis accounting for inventories;
(2) Perspective Differences – these differences exist when the structure of financial information for budgetarypurposes differs from the fund structure that is used to prepare the basic financial statements. For example,some governments may budget by program and not by fund type;
(3) Entity Differences – these differences arise when the appropriated budget either includes or excludesorganizations and programs. For example, the general fund of a blended component unit reported as amajor special revenue fund may not be included in the budget of the primary government and may nothave a budget of its own; and
(4) Timing Differences – these differences include a significant variance between budgetary practices andGAAP regarding the authorized carry-forward of appropriated funds. Also, in GAAP, accounting revenuesare recognized in governmental funds as soon as they are both “measurable” and “available,” whereasrevenue recognition under the budgetary basis of accounting may be deferred until amounts are actuallyreceived in cash.
When any of these differences exist, GAAP requires governments to present a reconciliation of budgetary
comparison information to GAAP information in the notes to the Financial Statements/Required
Supplementary Information, on the face of the budgetary statement, or as an attached schedule to the budgetary
statement.
Accounting SystemThe District's accounting system is organized and operated on a fund basis. A fund is a group of self-balancing
accounts combined into a separate accounting entity having its own assets, deferred outflows of resources,
liabilities, deferred inflows of resources, equity, revenue and expenditures/expenses. Funds are established for
the purpose of carrying on specific activities or attaining certain objectives in accordance with special
regulations, restrictions, or limitations. The District follows GAAP when determining the types of funds to be
Appendix B
Basis of Budgeting andAccounting

Basis of Budgeting and Accounting FY 2019 Proposed Budget and Financial Plan
Appendix B-2
established and is guided by the “minimum number of funds principle” and sound financial management
practices when determining the number of funds to be set up within each fund type. Specialized accounting
and reporting principles and practices apply to governmental funds. Proprietary and trust funds are accounted
for in the same manner as business enterprises.
Internal ControlThe District’s management team is responsible for establishing and maintaining adequate internal controls
designed to ensure that the assets of the District are protected from loss, theft or misuse and to ensure that
adequate accounting data are compiled to allow for the preparation of financial statements in conformity with
GAAP. The internal control structure is designed to provide reasonable, but not absolute, assurance that these
objectives are met within three broad, overriding categories:
(a) efficiency and effectiveness of operations;
(b) reliability of financial reporting; and
(c) compliance with applicable laws and regulations.
The concept of reasonable assurance recognizes that:
(1) The cost of a control should not exceed the benefits likely to be derived; and
(2) The valuation of costs and benefits requires estimates and judgments by management.
Basis of BudgetingThe basis of budgeting refers to the conventions used for recognition of costs and revenue in budget
development and in establishing and reporting appropriations, which provide the legal authority to spend or
collect revenues. The District uses a modified accrual basis for budgeting governmental funds. Proprietary
funds are budgeted using accrual concepts. All operating and capital expenditures and revenue are identified
in the budgeting process because of the need for appropriation authority.
The budget is fully reconciled to the accounting system at the beginning of the fiscal year and in preparing
the Comprehensive Annual Financial Report (CAFR) at the end of the fiscal year. A number of GAAP
adjustments are made to reflect balance sheet requirements and their effect on the budget.
Budgetary ControlThe District maintains budgetary controls designed to monitor compliance with expenditure limitations
contained in the annual appropriated budget approved by the United States Congress. The level of budgetary
control (that is, the level at which expenditures cannot legally exceed the appropriated amount) is established
by function within the General Fund. The District also uses an encumbrance recording system as one technique
for maintaining budgetary control. In addition, the District adopts a project-length financial plan for its capital
projects. Generally, encumbered amounts lapse at year-end in the General Fund but not in the Capital Projects
Fund, Special Revenue funds, or the fund for Federal Payments, depending on the appropriation language for
each Federal Payment.
Basis of AccountingThe District’s financial statements are prepared in accordance with GAAP. As such, the measurement focus
and basis of accounting applied in the preparation of the District’s financial statements are as follows:
• The District’s government-wide financial statements focus on all of the District’s economic resources and
use the full accrual basis of accounting; and
• The District’s fund financial statements focus primarily on the sources, uses, and balances of current
financial resources and use the modified accrual basis of accounting.

Appendix C:
Fund Structureand Relationshipto BudgetStructure


FY 2019 Proposed Budget and Financial Plan Fund Structure and Relationship to Budget Structure
Appendix C-1
The District’s budget is presented by agency, but each part of the budget is also part of a particular fund for
accounting purposes. Most of the agencies in the operating budget are reported in two funds, and most of the
agencies in the capital budget are reported in one fund, but there are some exceptions.
This section describes the District’s fund structure as presented in the District's Comprehensive Annual
Financial Report (CAFR). It then relates the District’s budget presentation to its fund structure.
Fund StructureA number of funds and reporting entities, both governmental and non-governmental, are included in the
District's CAFR and are discussed below. The primary fund and reporting entity categories are:
• Governmental Funds;
• Proprietary Funds;
• Fiduciary Funds; and
• Component Units.
Appendix C
Fund Structure and Relationship toBudget Structure
GovernmentalFunds Proprietary Funds Fiduciary Funds Component Units
Pension TrustFunds
OPEB Trust Fund
Private PurposeTrust Fund
Agency Funds
General Fund
Federal andPrivate
Resources Fund
HousingProduction Trust
Fund
General CapitalImprovements
Fund
Non-MajorGovernmental
Funds
Lottery andGames
UnemploymentCompensation
Not-for-ProfitHospital
Corporation
Fund StructureAll Funds

Fund Structure and Relationship to Budget Structure FY 2019 Proposed Budget and Financial Plan
Appendix C-2
Governmental FundsGovernmental Funds include four major and six non-major funds. The major governmental funds are:
• General Fund;
• Federal and Private Resources Fund;
• Housing Production Trust Fund; and
• General Capital Improvements Fund.
The non-major governmental funds are:
• Tobacco Settlement Financing Corporation Fund
• Tax Increment Financing Program Fund;
• Payment-in-Lieu-of-Taxes Special Revenue Fund;
• Baseball Special Revenue Fund;
• Debt Service Fund; and
• Highway Trust Fund.
General FundThe General Fund records three sources of revenue: Local funds, Dedicated Taxes, and Special Purpose
Revenues. These are known as appropriated funds.
• Local funds are the District's primary source of revenue. Nearly all of the District's tax receipts - the most
significant of which are income taxes, sales taxes, and property taxes - are recorded as Local funds. In
addition, certain non-tax revenues (those fines, fees, and miscellaneous revenues not dedicated for a
particular agency's use) are part of Local funds. Finally, an annual transfer from the Lottery goes into Local
funds.
• Dedicated Taxes are those taxes that, by law, are dedicated to a particular purpose. Examples include a
specified portion of sales tax that is dedicated to the Washington Convention and Sports Authority and the
full amount of the motor fuel tax, which is dedicated to the Highway Trust Fund. As detailed below, some
dedicated taxes are not part of the General Fund.
• Special Purpose Revenues are non-tax revenues collected by District agencies that, by law, are dedicat-
ed to support the functions those agencies perform. Examples include certain fees and permit charges that
the public pays for and whose proceeds are used by the agency to carry out operations in that same area.
Some agencies retain unused revenues collected in a given fiscal year in the restricted or committed por-
tions of the Fund Balance. They are allowed to spend those revenues, if they receive appropriation author-
ity to do so, in a succeeding year.
Descriptions of General Fund revenues, as well as historical data and estimates for FY 2019 and the next
three years, can be found in chapter 3 of this Executive Summary volume
Federal and Private Resources FundThe Federal and Private Resources Fund records five sources of revenue, each of which is an appropriated
fund.
• Federal Grants are grants the District receives from federal agencies, including block grants, formula
grants, certain entitlements, and competitive grants.
• Federal Payments are direct appropriations from the Congress to the District, usually to a particular
District agency for a particular purpose.
• Federal Medicaid Payments are the federal share of the District's Medicaid costs. Generally, the federal
government pays 70 percent of the cost of Medicaid while the District pays 30 percent, although the

FY 2019 Proposed Budget and Financial Plan Fund Structure and Relationship to Budget Structure
Appendix C-3
proportions differ in certain circumstances.
• Private Grants are grants the District receives from non-federal sources.
• Private Donations are donations to District agencies from private individuals or organizations.
Housing Production Trust FundThe Housing Production Trust Fund (HPTF) provides financial assistance to a variety of affordable housing
programs and opportunities across the District of Columbia, including initiatives to build affordable rental
housing, preserve expiring federal-assisted housing, and help provide affordable homeownership
opportunities for low-income families. It receives 15 percent of deed recordation and deed transfer tax receipts,
as well as appropriations from Local funds that are transferred from the General Fund.
General Capital Improvements FundThe General Capital Improvements Fund accounts for all District capital project activity other than activity in
the Highway Trust Fund. It records revenues from multiple sources, primarily bond proceeds of different types,
Pay-as-you-go (Paygo) transfers from the General Fund, and federal grants for capital projects, most of which
are highway construction grants.
Non-Major Governmental FundsSpecial Revenue Funds account for specific revenue that is legally restricted to expenditures for particular
purposes. They are as follows:
• The Tobacco Settlement Financing Corporation Fund accounts for activities relating to the tobacco
litigation settlement.
• The Tax Increment Financing (TIF) Program Fund accounts for activities relating to tax increment
financing development initiatives. These initiatives involve borrowing to finance a project and using the
incremental tax revenues generated by the project to repay the borrowed funds.
• The Payment-in-Lieu-of-Taxes (PILOT) Special Revenue Fund accounts for activities relating to
development initiatives that are similar to TIF projects, except that repayment is made from PILOT
revenues instead of tax revenues.
• The Baseball Special Revenue Fund accounts for the revenues that are legally restricted to expenditures
for baseball project purposes, including taxes dedicated to this fund and rent paid by the Nationals to the
District.
The Debt Service Fund accounts for the payment of principal and interest on ballpark revenue bonds. It
receives a transfer from the Baseball Special Revenue Fund in the amount required to make debt service
payments each year.
The Highway Trust Fund accounts for the District's local match to federal highway construction grants and
is primarily funded by the District’s motor fuel tax. The District typically finances about 20 percent of
federal highway projects while federal grants finance about 80 percent, but this proportion can differ for every
project.
Proprietary FundsProprietary Funds are District units that charge customers for the services provided, whether to outside
customers or to other units of the District. The District has three Proprietary Funds:
• Office of Lottery and Charitable Games, which not only operates and is financed like a private business
where net income is key to sound management, but also can finance the costs of its goods and services
provided to the public on a continuing basis primarily through user charges. The Lottery accounts for
revenue from lotteries and daily numbers games operated by the District and from licenses to conduct
charitable games, and it transfers its profits to help finance the General Fund.

Fund Structure and Relationship to Budget Structure FY 2019 Proposed Budget and Financial Plan
Appendix C-4
• Unemployment Compensation Fund, which accounts for funds used to pay benefits to unemployed
former employees of the District, federal government, and private employers within the District. The fund
is administered by the Department of Employment Services.
• Not-for-Profit Hospital Corporation, commonly known as United Medical Center and United Medical
Nursing Center, which provides inpatient, outpatient, psychiatric, and emergency care and manages a
skilled nursing facility.
Fiduciary FundsFiduciary Funds account for assets held by the District in a trustee or agency capacity. These assets cannot be
used to support the District's programs. The District's Fiduciary Funds are:
• The Pension Trust Funds, which account for resources accumulated and used for retirement annuity
payments for police officers, firefighters, public school teachers and their survivors. Resources are
contributed by employees and by the District and federal governments at amounts determined by an
annual actuarial study. The funds are administered by a 13-member Retirement Board. The administrative
costs of the board are accounted for in the funds.
• The Other Post-Employment Benefits (OPEB) Trust Fund, which accounts for resources accumulated and
used for post-employment health insurance and life insurance premiums for former District employees.
• The Private Purpose Trust Fund, which accounts for the District's sponsored college tuition savings plan.
• The agency funds, which account for refundable deposits required of various licenses, include monies held
in escrow as an agent for individuals, private organizations or other governments.
Component UnitsComponent units are legally separate organizations for which the District is financially accountable because
their governing bodies are appointed by the Mayor, with the consent of the Council, or other District officials.
The District has four discretely presented component units:
• Health Benefit Exchange Authority, which implements a health care exchange program in the District of
Columbia in accordance with the Patient Protection and Affordable Care Act.
• Washington Convention and Sports Authority, which maintains and operates the Washington Convention
Center for local public shows, civic events, and other activities; maintains and operates the National Guard
Armory for nonmilitary events and the Robert F. Kennedy Memorial Stadium; and promotes the District
as a sporting event site.
• Housing Finance Agency, which receives funds from public and private sources to alleviate the shortage
of housing through greater supply and less expensive mortgage and construction loans.
• University of the District of Columbia, which accounts for resources received and used by the University
of the District of Columbia. The unit contains four separate fund groups: Current Funds, Loan Fund,
Endowment Fund, and Plant Funds. A budget is prepared for only the Current Funds.
The District established the District of Columbia Tobacco Settlement Financing Corporation (the "Tobacco
Corporation") as a special purpose, independent instrumentality of the District government. The Tobacco
Corporation is a blended component unit because it provides services exclusively to the District, and it is
blended as a special revenue fund and listed in the non-major governmental funds section above.
The Not-for-Profit Hospital Corporation was established pursuant to the Not-for-Profit Hospital
Corporation Establishment Emergency Amendment Act of 2010, effective July 7, 2010 (D.C. Act 18-476; 57
DCR 6937), to provide community-centered health care east of the Anacostia River. The Not-for-Profit
Hospital Corporation is a blended component unit pursuant to GASB Statement No. 80 because: (a) it is orga-
nized as a not-for-profit corporation and (b) the District is its sole owner. It is blended as a proprietary fund
and listed in the proprietary funds section above.

FY 2019 Proposed Budget and Financial Plan Fund Structure and Relationship to Budget Structure
Appendix C-5
Budget Structure and Relationship to Fund StructureFor FY 2019, the District is publishing six budget volumes: this Executive Summary volume, four volumes
covering the operating budget, and one volume covering the capital budget. The operating budget includes
agencies whose revenues and expenditures are recorded in the General Fund and the Federal and Private
Resources Fund. In addition, the operating budget includes certain agencies that operate outside these two
funds. The capital budget includes agencies in the General Capital Improvements Fund and the Highway Trust
Fund.
Operating BudgetThe District’s operating budget (volumes 2 through 4 and volume 6) includes all spending in the General Fund
and the Federal and Private Resources Fund. All agencies described in volumes 2, 3, and 4 of the budget
documents, except for those in the appropriation title “Enterprise and Other Funds” (part H of volume 4), are
budgeted in, and make expenditures in, one of these two funds. These include the three General Fund revenue
sources (Local, Dedicated Tax, and Special Purpose Revenue) and the five Federal and Private Resources
revenue sources.
The "Enterprise and Other Funds” section of the budget includes agencies that operate through both
governmental and non-governmental funds. These agencies have one of two appropriated fund revenue
sources: “Enterprise and Other Funds” and “Enterprise and Other Funds – Dedicated Taxes.” These agencies
relate to fund categories as follows:
Fund Category AgencyGovernmental Funds - Major • Housing Production Trust Fund
Governmental Funds - Non-Major • Tax Increment Financing (TIF) Program
• Repayment of PILOT Financing
• Ballpark Revenue Fund
Proprietary Funds • Office of Lottery and Charitable Games
• Unemployment Insurance Trust Fund
• Not-for-Profit Hospital Corporation
Component Units • Health Benefit Exchange Authority
• Washington Convention and Sports Authority
• Housing Finance Agency
• University of the District of Columbia
Other • Water and Sewer Authority (DC Water)
• Washington Aqueduct
• District of Columbia Retirement Board
Note that the "Ballpark Revenue Fund" is the name of the agency that includes budget for expenditures
made through both the Baseball Special Revenue Fund and the Debt Service Fund, both of which are non-
major governmental funds. As such, this agency includes budget authority for the debt service portion of its
expenditures twice: once to provide budget authority to transfer revenue from the Baseball Special Revenue
Fund to the Debt Service Fund, and a second time to make the debt service expenditures from the Debt Service
Fund.

Fund Structure and Relationship to Budget Structure FY 2019 Proposed Budget and Financial Plan
Appendix C-6
Capital BudgetThe capital budget volume (volume 5) includes all revenues and expenditures related to the General Capital
Improvements Fund. All agency capital budget chapters show spending in this fund, except for a portion of
the budget of the District Department of Transportation (DDOT). Some of DDOT's projects are financed by
bond revenues or Paygo capital and are budgeted in the General Capital Improvements Fund. But its Highway
Trust Fund projects are financed by a mix of federal grants and local match. As noted above, the federal grant
portion of these projects is recorded in the General Capital Improvements Fund, while the local match is
recorded in the Highway Trust Fund, a non-major governmental fund.
Transfers Between FundsThe District’s budget includes a number of transfers between funds.
Dedicated taxes are sometimes dedicated to an agency within the General Fund, in which case they are
simply a source of revenue and budget authority for the agency. But certain dedicated taxes are allocated to
agencies outside the General Fund. Some of these are transfers through the General Fund, while others are not:
• Dedicated tax revenues flow through the General Fund to two agencies: the Washington Convention and
Sports Authority and the Highway Trust Fund. The revenues are in the Dedicated Tax appropriated fund,
in the General Fund, and the operating budget includes a General Fund transfer agency that records an
“expenditure” of these funds as the transfer is made. The budget for the Washington Convention and Sports
Authority is included in part H of volume 4, and the budget for the Highway Trust Fund is in volume 5.
• Four allocations of dedicated taxes are not transferred through the General Fund – the tax revenues go
directly to the agencies and are never considered part of General Fund revenue. These are the allocations
to the Tax Increment Financing Program, Repayment of PILOT Financing, the Ballpark Revenue Fund,
and the Housing Production Trust Fund. The budgets for these four agencies are included in part H of
volume 4.
In some cases, more dedicated tax revenue is allocated to these agencies than is needed. Specifically,
revenues for the Ballpark Revenue Fund and for some projects in the Tax Increment Financing Program and
in Repayment of PILOT Financing have accumulated faster than needed for the purposes of these agencies,
which is to pay debt service on past borrowings. Depending on legislation and bond documents in each
instance, the excess amounts may be available for transfer to the General Fund, and in recent years these
transfers have added to General Fund resources.
Other transfers are budgeted each year. Each year, the District budgets a transfer of Local Funds to the
University of the District of Columbia. In addition, the Lottery (a Proprietary Fund) transfers revenues to the
General Fund each year; these revenues become part of Local Funds.
Pay-as-you-go (Paygo) capital refers to the use of current-year operating budget revenue for a capital
project, to supplement the long-term financing that is typically used for capital projects. Similar to the
Dedicated Tax transfers above, the operating budget includes a General Fund Paygo (transfer) agency that
records an “expenditure” of these funds as the transfer is made from the General Fund to the General Capital
Improvements Fund. Occasionally, funds previously transferred through Paygo to the General Capital
Improvements Fund but not spent will be transferred back to the General Fund.
Indirect Cost Recovery refers to the District’s ability to use a portion of federal grant revenues to fund
central services that provide indirect support for grant-receiving agencies. Terms are set out in each grant
agreement. These revenues are accumulated and transferred each year from the Federal and Private Resources
Fund, where grant revenue is first recorded, to the General Fund, where the transfer helps support spending by
General Fund agencies.
Bond Issuance Costs are the costs related to issuing General Obligation Bonds, Income Tax-Secured
Revenue Bonds, and other long-term debt. These costs include (but are not limited to) expenses related to
underwriting, credit enhancement, financial advisory, documentation, and credit ratings on the bonds.

FY 2019 Proposed Budget and Financial Plan Fund Structure and Relationship to Budget Structure
Appendix C-7
A portion of the bond proceeds is used to pay these costs. Once bond proceeds are received for the General
Obligation Bonds, or the Income Tax Secured Revenue Bonds, almost all of the proceeds are recorded in the
General Capital Improvements Fund. The portion used to pay for issuance costs, however, is recorded
directly in the General Fund. The issuance costs for other long-term debt are recorded to the applicable
budget and fund at the time the bonds are issued.
Intra-District BudgetsNote that each agency’s operating budget total may also include an intra-District budget. Intra-District budget
represent agreements between two agencies whereby one agency purchases services from the other. The
buying agency makes expenditure against its own budget authority (Local, Dedicated Tax, Special Purpose
Revenue, Federal, or Private) by transferring resources to the selling agency. The selling agency receives this
expenditure as intra-District revenue, establishes intra-District budget authority, and spends against that
authority to provide the service. An agency's total "gross funds" budget includes its intra-District budget
authority. Because such arrangements appear as expenditures twice, once in each agency, the intra-District
totals are excluded from the District-wide calculations of the total "gross funds" budget. They also are
excluded from the CAFR totals reported at the end of the year.


Appendix D:
RecurringBudget andCurrent ServicesFunding Level(CSFL)Development


FY 2019 Proposed Budget and Financial Plan Recurring Budget and Current Services Funding Level (CSFL) Development
Appendix D-1
OverviewReplacing the Current Services Funding Level (CSFL) in agency budget chapters is the Recurring Budget,
which removes one-time costs included in the prior year budget so that they are not reflected in the proposed
budget and the District’s Five-Year Financial Plan. The removal of one-time items is an essential component
of the Financial Plan and is a component of the CSFL. The CSFL provides a Local funds only representation
of the true cost of operating District agencies, before consideration of policy decisions.
MethodologyRecurring Budget - The starting point in estimating the required level of programmatic funding for the
upcoming fiscal year is the approved budget of the prior fiscal year. One-time costs are typically policy
decisions that exist for only one year (e.g. funding for public art installations). The prior year budget for these
costs would be removed from consideration for the proposed budget, since they were assumed not to
continue.
The Recurring Budget is found in all chapters with Local funds, even if the agency had no one-time funding
items to remove. The Recurring Budget is located at the beginning of each chapter that contains an Approved
Budget to Proposed Budget, by Revenue Type table, also called Table 5.
CSFL - While the CSFL is no longer the starting point of the proposed budget or included in agency chapters,
it continues to be a tool that policy makers use to view changes from the prior year approved to the proposed
budget. It also provides estimates to determine how much it could cost for District agencies to continue
current programs and operations.
The CSFL includes Recurring Budget actions, such as the removal of one-time items, and several other
components that were considered basic to most agencies and required the application of a standard
methodology. In these instances, the same calculations were applied across all District agencies; however,
some calculations were restricted only to an agency or a specific group of agencies and to applicable
Comptroller Source Groups (CSGs), or expenditure types, such as salaries, Fringe Benefits, contracts, or Fixed
Costs. Finally, specific assumptions were applied to certain agencies, in some cases for known budget items
that were likely to recur, and in other cases because characteristics were unique to the agency, such as debt ser-
vice obligations.
Appendix D
Recurring Budget and CurrentServices Funding Level (CSFL)Development

Recurring Budget and Current Services Funding Level (CSFL) Development FY 2019 Proposed Budget and Financial Plan
Appendix D-2
General Assumptions Used to Develop the CSFLThe following are the general assumptions applied to nearly all District agencies:
1. Fringe Benefit Rate Adjustments (By Agency): The fringe benefit rate increase was calculated based on:
1) a four-year average of fringe data; 2) the percentage of health and other benefits
2. Consumer Price Index (CPI) Growth Factor: A 1.7 percent Year-over-Year (YoY) increase was applied
to nonpersonal services (NPS) costs. Nonpersonal Services costs cover a wide array of agency operational
costs that include supplies, equipment, and contractual agreements, but exclude Fixed Costs. The 1.7
percent inflation factor is based on the seasonally-adjusted CPI for the Metropolitan DC region, which is
forecasted by the Office of Revenue Analysis. OBP used the CPI to adjust for inflation and other economic
indices of cost variations.
Specific Assumptions Used to Develop the CSFLThe following are the specific assumptions that were applied only to certain CSGs within one particular
agency or within specific groups of agencies.
1. Removal of One-Time Items: All one-time items were removed from the CSFL.
2. Prior Year Recurring Costs: Where applicable, recurring budget items were identified to adjust CSGs 11
(Regular Pay - Continuing Full Time), 13 (Additional Gross Pay), 14 (Fringe Benefits – Current
Personnel), 15 (Overtime Pay), 40 (Other Services and Charges), 41 (Contractual Services - Other), and
50 (Subsidies and Transfers). Recurring budget items for all other CSGs were not adjusted in the CSFL
and are not one-time costs.
3. BAUR: Using the Budget Appropriation Utilization Rate (BAUR), OBP produced a numerical
representation of Local fund Fixed Costs items based on actual agency expenditures across all
commodities. The BAUR represents the percentage of the approved budget an agency expended over a
period of time, typically the most recent three years. Certain components of the BAUR used or compared
initial cost estimates provided by the District’s central fixed cost agencies. The Office of Finance and
Resource Management provided telecommunication estimates and the Department of Public Works
provided fleet estimates. Fixed costs commodities such as Rent, Energy, Water, Natural Gas, Security, and
Custodial services were provided by the Department of General Services.
4. Medicaid Growth Factor: The growth rate of 8.3 percent was provided by the Department of Health Care
Finance and used to calculate baseline funding for Medicaid.
5. Debt Service Adjustments: Projected adjustments were provided by the Office of Finance and Treasury.
6. Operating Impact of Capital: Projected adjustments were provided by the respective agencies for
completed capital projects that will have operating costs.
7. Other Adjustments: These adjustments were unique to a particular agency and did not meet the criteria
of the other adjustment scenarios.

Appendix E:
AgencyPerformancePlans


FY 2019 Proposed Budget and Financial Plan Agency Performance Plans
Appendix E-1
OverviewIn FY 2016, the Office of the City Administrator (OCA) developed a robust performance management
program across the District. This includes several updates to the format and submission process for annual
agency performance plans.
First drafts of the high-level components of each agency’s performance plan (objectives, key performance
indicators, workload measures and operations) are published with the Mayor’s annual budget submission. The
final performance plan, which also includes strategic initiatives, is posted online in November each year at
www.oca.dc.gov.
The following provides a background of annual performance plans and their uses, a description of the
major components of each plan and a summary of the performance management timeline.
Background:Annual Performance Plans can help accomplish several purposes. These include:
• Provide clear direction on how an agency plans to make progress toward achieving its mission and
aligning to the Mayor’s goals and vision for the District;
• Help to align and prioritize resources;
• Be a tool to monitor progress toward completion of strategic initiatives and key projects; and
• Communicate to the Mayor, the Council of the District of Columbia, and the public on what the agency
plans to do to improve its performance over the coming year.
I. ComponentsBelow is a summary of each component in the Annual Performance Plan.
• Strategic Objectives. Strategic Objectives describe what the agency will do, at a high level, to achieve its
Mission. These are action-based sentences that define what an agency does for its customers, whether the
customers are citizens or other District agencies .
• Key Performance Indicators. Key Performance Indicators measure how well an agency is achieving its
Strategic Objectives. They are outcome-oriented and should be used to answer the question, “What does
the agency need to measure to determine success?”
• Operations. Operations include the work that happens on a daily basis to help achieve the Strategic
Objectives. This is further divided into Daily Services, such as sanitation disposal, and long-term Key
Projects that are high profile, one-time and span several years, such as the redevelopment of Walter Reed
Army Medical Center. Many agencies will mostly have Daily Services, whereas some agencies that have
substantial amounts of capital funds will have several Key Projects.
• Workload Measures. Workload Measures cover inputs and outputs of Operations such as the number of
driver’s licenses issued. Workload Measures include major components that provide crucial information
about an agency’s work and the work that is needed to make progress toward the Strategic Objective.
Appendix E
Agency Performance Plans

Agency Performance Plans FY 2019 Proposed Budget and Financial Plan
Appendix E-2
Available in the final draft to be published on the OCA website (www.oca.dc.gov) in November:
• Strategic Initiatives. Strategic Initiatives are defined as changes and/or enhancements to Operations that
will help make progress on the Strategic Objective. Strategic Initiatives are typically completed or
implemented in one or two years. Strategic Initiatives may affect more than one Operational function.
A Strategic Initiative can encompass several areas:
1. How an agency will improve a Daily Service, for example, by streamlining the intake process for
customers accessing an agency’s service.
2. How an agency will implement a new component to a current Daily Service, for example, by rolling
out body-worn cameras for police officers on patrol.
3. How an agency will implement the current phase and expected progress for long-term Key Projects,
for example, by completing the initial design work for construction of a new District facility. Daily
Services may not always have a corresponding Strategic Initiative, but Key Projects will always have
an Initiative that describes the year’s expectations.
II. How are Performance Plans used?Annual Performance Plans will be used at several points during the year to help the Mayor, City Administrator,
and Deputy Mayors prioritize resources, track progress, and make adjustments during the year as needed. The
draft Annual Performance Plans will be used during budget meetings to understand how changes in funding
are expected to affect performance.
After Annual Performance Plans are finalized, OCA and Deputy Mayors will meet with agencies once per
quarter to assess how progress on the Performance Plan is being made. These meetings can help identify areas
where progress is stalled and talk about what adjustments and assistance are needed to help move forward. In
addition, they will also serve as a way to check in and see that the agency continues to remain focused on areas
that are important to the Mayor throughout the year. For example, adjustments could need to be made for new
laws, regulations or potential focus areas that arise after the performance plan is published. These changes will
be communicated in a transparent way where the public can see where and why a focus was changed.

Appendix F, G, Hand I:
Summary Tables:FY 2019 Proposed Budget and Financial Plan
F: FY 2019 Proposed Budget - General Fund
G: FY 2019 Proposed Budget - Gross Funds
H: FY 2019 Proposed Full-Time Equivalent
Employment Authority - General Fund
I: FY 2019 Proposed Full-Time Equivalent
Employment Authority - Gross Funds


Agency Code Agency Name
FY 2016 Actuals
General Fund
FY 2017 Actuals
General Fund
FY 2018 Approved
General Fund
FY 2019 Proposed Local
Funds
FY 2019 Proposed
Dedicated Taxes
FY 2019 Proposed Other
Funds
Total, FY 2019 Proposed
General Fund
Change from FY 2018
Approved General Fund
Governmental Direction and SupportAB0 Council of the District of Columbia 21,174 22,289 25,338 26,359 0 0 26,359 1,020AC0 Office of the District of Columbia Auditor 4,549 4,669 5,860 5,333 0 0 5,333 -527DX0 Advisory Neighborhood Commissions 788 851 1,027 1,131 0 0 1,131 104AL0 Uniform Law Commission 48 47 51 60 0 0 60 9AA0 Office of the Mayor 7,891 9,736 10,472 10,700 0 0 10,700 228AH0 Mayor's Office of Legal Counsel 1,092 1,322 1,634 1,634 0 0 1,634 -1AI0 Office of the Senior Advisor 1,877 2,123 3,149 3,219 0 0 3,219 70BA0 Office of the Secretary 3,468 3,690 4,058 3,057 0 1,100 4,157 99AE0 Office of the City Administrator 5,885 7,224 7,937 8,669 0 250 8,919 982EM0 Deputy Mayor for Greater Economic Opportunity 672 2,671 3,247 3,712 0 0 3,712 465RK0 D.C. Office of Risk Management 3,221 3,893 3,965 4,102 0 0 4,102 138BE0 D.C. Department of Human Resources 9,968 10,066 9,282 8,866 0 561 9,428 146JR0 Office of Disability Rights 983 1,041 1,105 1,133 0 0 1,133 28RJ0 Captive Insurance Agency 2,017 1,869 2,320 2,095 0 211 2,306 -15AS0 Office of Finance and Resource Management 21,037 23,450 24,706 27,123 0 472 27,595 2,889PO0 Office of Contracting and Procurement 58,635 23,036 24,116 23,393 0 1,552 24,945 829TO0 Office of the Chief Technology Officer 64,353 72,488 77,280 71,349 0 10,095 81,444 4,164AM0 Department of General Services 323,806 333,817 289,725 308,053 1,350 8,377 317,780 28,055AF0 Contract Appeals Board 1,378 1,453 1,490 1,556 0 0 1,556 66DL0 Board of Elections 7,114 7,662 7,907 10,489 0 0 10,489 2,582CJ0 Office of Campaign Finance 2,590 2,688 2,908 3,847 0 0 3,847 939CG0 Public Employee Relations Board 1,251 1,279 1,440 1,509 0 0 1,509 69CH0 Office of Employee Appeals 1,684 1,767 2,129 1,940 0 0 1,940 -189EA0 Metropolitan Washington Council of Governments 472 495 520 542 0 0 542 23CB0 Office of the Attorney General for the District of Columbia 55,046 59,989 74,120 65,842 0 12,819 78,662 4,542AG0 D.C. Board of Ethics and Government Accountability 1,789 2,166 2,329 2,214 0 153 2,366 37AR0 Statehood Initiatives 290 240 234 242 0 0 242 9
Appropriation Title (thousands of dollars)
Government of the District of ColumbiaFY 2019 Proposed Budget
General Fund
FY 2019 Proposed Budget and Financial Plan Page F-1

Agency Code Agency Name
FY 2016 Actuals
General Fund
FY 2017 Actuals
General Fund
FY 2018 Approved
General Fund
FY 2019 Proposed Local
Funds
FY 2019 Proposed
Dedicated Taxes
FY 2019 Proposed Other
Funds
Total, FY 2019 Proposed
General Fund
Change from FY 2018
Approved General Fund
Appropriation Title (thousands of dollars)
Government of the District of ColumbiaFY 2019 Proposed Budget
General Fund
AD0 Office of the Inspector General 12,591 13,807 15,521 15,943 0 0 15,943 423AT0 Office of the Chief Financial Officer 136,520 139,596 170,669 133,746 0 44,593 178,339 7,669GS0 Section 103 Judgments - Governmental Direction and Support 9,000 4,346 0 0 0 0 0 0
Total, Governmental Direction and Support 761,189 759,770 774,540 747,858 1,350 80,183 829,391 54,851
Economic Development and RegulationEB0 Office of the Deputy Mayor for Planning and Economic Development 32,164 31,364 45,096 20,583 0 20,819 41,402 -3,694BD0 Office of Planning 9,203 9,231 9,857 10,231 0 200 10,431 574EN0 Department of Small and Local Business Development 9,122 10,554 14,632 13,925 0 0 13,925 -707CI0 Office of Cable Television, Film, Music, and Entertainment 9,437 15,559 12,757 1,690 0 12,988 14,678 1,921BJ0 Office of Zoning 2,817 3,050 3,069 3,117 0 0 3,117 47DB0 Department of Housing and Community Development 22,479 24,041 27,650 31,885 0 3,634 35,519 7,869CF0 Department of Employment Services 92,602 98,052 107,084 70,106 0 39,561 109,668 2,584DA0 Real Property Tax Appeals Commission 1,643 1,640 1,715 1,763 0 0 1,763 49CR0 Department of Consumer and Regulatory Affairs 48,385 50,831 60,098 23,264 0 37,114 60,378 280CQ0 Office of the Tenant Advocate 2,738 3,075 4,008 3,128 0 509 3,637 -371BX0 D.C. Commission on the Arts and Humanities 14,443 19,884 28,968 30,565 0 199 30,764 1,796LQ0 Alcoholic Beverage Regulation Administration 7,272 7,247 8,655 0 1,292 8,007 9,299 643DH0 Public Service Commission 13,448 12,845 13,989 0 0 15,163 15,163 1,175DJ0 Office of the People's Counsel 9,683 7,901 8,063 0 0 8,971 8,971 908SR0 Department of Insurance, Securities, and Banking 19,581 19,668 28,166 0 0 28,565 28,565 400HY0 Housing Authority Subsidy 55,696 54,624 85,980 96,696 0 0 96,696 10,716HP0 Housing Production Trust Fund Subsidy 90,179 42,732 48,317 39,335 0 0 39,335 -8,982ID0 Business Improvement Districts Transfer 28,507 27,404 47,000 0 0 55,000 55,000 8,000EC0 Section 103 Judgments-Econ Development and Regulation 938 0 0 0 0 0 0 0
Total, Economic Development and Regulation 470,338 439,701 555,105 346,289 1,292 230,731 578,311 23,206
Public Safety and JusticeFA0 Metropolitan Police Department 502,006 511,395 511,929 510,230 0 8,200 518,430 6,501FB0 Fire and Emergency Medical Services Department 239,669 248,888 251,516 255,447 0 1,762 257,209 5,693FD0 Police Officers' and Fire Fighters' Retirement System 135,577 145,627 105,596 91,284 0 0 91,284 -14,312
FY 2019 Proposed Budget and Financial Plan Page F-2

Agency Code Agency Name
FY 2016 Actuals
General Fund
FY 2017 Actuals
General Fund
FY 2018 Approved
General Fund
FY 2019 Proposed Local
Funds
FY 2019 Proposed
Dedicated Taxes
FY 2019 Proposed Other
Funds
Total, FY 2019 Proposed
General Fund
Change from FY 2018
Approved General Fund
Appropriation Title (thousands of dollars)
Government of the District of ColumbiaFY 2019 Proposed Budget
General Fund
FL0 Department of Corrections 140,999 154,987 145,188 144,794 0 21,020 165,814 20,626FK0 District of Columbia National Guard 4,651 5,088 5,188 4,810 0 0 4,810 -378BN0 Homeland Security and Emergency Management Agency 4,550 4,665 4,827 5,103 0 0 5,103 276FH0 Office of Police Complaints 2,110 2,276 2,601 2,538 0 0 2,538 -63FZ0 DC Sentencing Commission 1,498 948 1,179 1,186 0 0 1,186 7MA0 Criminal Code Reform Commission 0 659 701 724 0 0 724 23NS0 Neighborhood Safety and Engagement 0 0 2,129 4,731 0 0 4,731 2,602FX0 Office of the Chief Medical Examiner 10,849 11,316 11,445 12,154 0 0 12,154 709FS0 Office of Administrative Hearings 8,312 9,060 10,009 10,135 0 0 10,135 126FJ0 Criminal Justice Coordinating Council 896 558 1,238 1,018 0 0 1,018 -219UC0 Office of Unified Communications 43,577 44,604 48,092 33,948 0 14,197 48,145 53FR0 Department of Forensic Sciences 20,865 20,529 25,787 26,101 0 0 26,101 314FI0 Corrections Information Council 441 451 748 646 0 0 646 -102FO0 Office of Victim Services and Justice Grants 20,673 24,954 30,778 28,824 0 2,231 31,055 277FQ0 Office of the Deputy Mayor for Public Safety and Justice 683 1,683 1,613 1,596 0 0 1,596 -17PJ0 Section 103 Judgments - Public Safety and Justice 89,938 340 0 0 0 0 0 0
Total, Public Safety and Justice 1,227,296 1,188,028 1,160,565 1,135,270 0 47,410 1,182,681 22,116
Public Education SystemGA0 District of Columbia Public Schools 734,766 780,970 798,830 846,634 0 10,132 856,765 57,936GX0 Teachers' Retirement System 44,359 56,618 59,046 53,343 0 0 53,343 -5,703GD0 Office of the State Superintendent of Education 131,635 141,693 171,109 161,587 4,676 1,001 167,264 -3,845GC0 District of Columbia Public Charter Schools 738,844 779,669 813,738 891,905 0 0 891,905 78,167GG0 University of the District of Columbia Subsidy Account 71,942 77,671 78,180 87,168 0 0 87,168 8,988CE0 District of Columbia Public Library 55,552 56,589 60,838 60,701 0 1,356 62,057 1,219GB0 District of Columbia Public Charter School Board 0 721 9,110 0 0 8,525 8,525 -585GN0 Non-Public Tuition 66,092 64,752 70,021 67,000 0 0 67,000 -3,021GO0 Special Education Transportation 85,649 89,300 92,292 90,090 0 0 90,090 -2,202GE0 D.C. State Board of Education 1,017 1,267 1,711 1,750 0 0 1,750 39GL0 District of Columbia State Athletics Commission 0 0 0 1,189 0 100 1,289 1,289
FY 2019 Proposed Budget and Financial Plan Page F-3

Agency Code Agency Name
FY 2016 Actuals
General Fund
FY 2017 Actuals
General Fund
FY 2018 Approved
General Fund
FY 2019 Proposed Local
Funds
FY 2019 Proposed
Dedicated Taxes
FY 2019 Proposed Other
Funds
Total, FY 2019 Proposed
General Fund
Change from FY 2018
Approved General Fund
Appropriation Title (thousands of dollars)
Government of the District of ColumbiaFY 2019 Proposed Budget
General Fund
GW0 Office of the Deputy Mayor for Education 3,285 3,504 7,520 16,116 0 0 16,116 8,597PE0 Section 103 Judgments-Public Education System 0 5,482 0 0 0 0 0 0
Total, Public Education System 1,933,143 2,058,235 2,162,396 2,277,485 4,676 21,113 2,303,274 140,877
Human Support ServicesJA0 Department of Human Services 269,378 295,601 367,069 382,982 0 1,032 384,015 16,946RL0 Child and Family Services Agency 156,553 164,632 159,633 161,201 0 1,000 162,201 2,568RM0 Department of Behavioral Health 231,168 234,766 233,300 251,519 0 2,352 253,871 20,571HC0 Department of Health 85,668 88,648 93,993 80,782 0 27,395 108,177 14,184HA0 Department of Parks and Recreation 44,998 47,072 49,462 50,639 0 2,800 53,439 3,977BY0 D.C. Office on Aging 31,011 31,426 35,617 37,958 0 0 37,958 2,341BH0 Unemployment Compensation Fund 4,508 5,326 6,680 6,680 0 0 6,680 0BG0 Employees' Compensation Fund 25,281 25,538 21,709 24,132 0 0 24,132 2,423HM0 Office of Human Rights 3,734 4,035 4,600 4,738 0 0 4,738 139BZ0 Mayor's Office on Latino Affairs 2,709 3,058 3,301 3,804 0 0 3,804 502JY0 Children and Youth Investment Collaborative 7,510 4,920 0 0 0 0 0 0AP0 Office on Asian and Pacific Islander Affairs 749 803 855 872 0 0 872 17VA0 Office of Veterans' Affairs 353 404 472 541 0 5 546 74JZ0 Department of Youth Rehabilitation Services 98,823 90,344 96,885 96,570 0 0 96,570 -315JM0 Department on Disability Services 120,446 121,970 124,375 123,842 0 7,300 131,142 6,768HT0 Department of Health Care Finance 761,273 789,035 803,653 783,264 67,527 2,956 853,747 50,094HX0 Not-for-Profit Hospital Corporation Subsidy 10,000 2,000 0 10,000 0 0 10,000 10,000HG0 Office of the Deputy Mayor for Health and Human Services 1,569 2,242 1,787 1,782 0 0 1,782 -5HS0 Section 103 Judgments-Human Services 0 2,600 0 0 0 0 0 0
Total, Human Support Services 1,855,732 1,914,422 2,003,391 2,021,308 67,527 44,839 2,133,674 130,284
Public WorksKT0 Department of Public Works 134,556 145,320 148,440 141,516 0 7,783 149,299 859KA0 District Department of Transportation 97,968 90,903 108,565 108,029 0 23,533 131,561 22,997KV0 Department of Motor Vehicles 34,718 36,938 39,362 30,100 0 10,080 40,180 819KG0 Department of Energy and Environment 61,489 77,453 97,483 26,408 0 83,274 109,682 12,200
FY 2019 Proposed Budget and Financial Plan Page F-4

Agency Code Agency Name
FY 2016 Actuals
General Fund
FY 2017 Actuals
General Fund
FY 2018 Approved
General Fund
FY 2019 Proposed Local
Funds
FY 2019 Proposed
Dedicated Taxes
FY 2019 Proposed Other
Funds
Total, FY 2019 Proposed
General Fund
Change from FY 2018
Approved General Fund
Appropriation Title (thousands of dollars)
Government of the District of ColumbiaFY 2019 Proposed Budget
General Fund
TC0 Department of For-Hire Vehicles 10,261 12,494 13,634 5,895 0 11,675 17,571 3,937KC0 Washington Metropolitan Area Transit Commission 127 139 141 151 0 0 151 10KE0 Washington Metropolitan Area Transit Authority 359,097 368,014 430,009 110,686 258,489 43,000 412,175 -17,835
Total, Public Works 698,215 731,261 837,634 422,785 258,489 179,346 860,619 22,986
Financing and OtherDS0 Repayment of Loans and Interest 560,211 622,151 692,500 735,649 0 5,753 741,402 48,902ZA0 Repayment of Interest on Short-Term Borrowings 922 0 0 0 0 0 0 0ZB0 Debt Service - Issuance Costs 2,945 5,721 8,000 8,000 0 0 8,000 0SM0 Schools Modernization Fund 14,276 13,523 0 0 0 0 0 0DT0 Repayment of Revenue Bonds 7,822 7,825 7,832 0 7,839 0 7,839 6ZC0 Commercial Paper Program 0 0 8,503 10,000 0 0 10,000 1,497ZH0 Settlements and Judgments 32,953 21,292 21,825 21,825 0 0 21,825 0ZZ0 John A. Wilson Building Fund 4,289 4,210 4,082 4,726 0 0 4,726 643UP0 Workforce Investments 0 0 181,576 51,767 0 0 51,767 -129,808DO0 Non-Departmental 0 0 5,622 1,750 0 3,484 5,234 -388ELO Master Equipment Lease/Purchase Program 38,914 27,445 19,254 11,844 0 0 11,844 -7,410PA0 Pay-As-You-Go Capital Fund 144,105 133,380 130,298 4,171 0 77,535 81,706 -48,591RH0 District Retiree Health Contribution 29,000 31,000 44,500 46,000 0 0 46,000 1,500KZ0 Highway Transportation Fund - Transfers 25,332 26,099 24,936 0 25,426 7,261 32,687 7,751EZ0 Convention Center Transfer 131,916 141,802 141,636 0 155,543 3,415 158,959 17,322
Total, Financing and Other 992,685 1,034,448 1,290,564 895,732 188,807 97,449 1,181,988 -108,576TOTAL GENERAL OPERATING FUNDS 7,938,597 8,125,864 8,784,195 7,846,726 522,141 701,071 9,069,938 285,744
Note: Agency budgets in this table are entered at the whole dollar but rounded to nearest thousands of dollars by funding type. This may cause rounding differences at the General Fund level.
FY 2019 Proposed Budget and Financial Plan Page F-5


Agency Code Agency Name
FY 2016 Actuals
Gross Funds
FY 2017 Actuals
Gross Funds
FY 2018 Approved
Budget Gross Funds Local Funds
Dedicated Taxes
Other Funds
Subtotal, General
FundFederal Funds
Private Funds
Enterprise and Other-Dedicated
TaxesEnterprise and Other
Subtotal Gross Funds - Less Intra-District
Funds
Intra-District Funds
Total FY 2019 Proposed Budget
Gross Funds
Governmental Direction and Support
AB0 Council of the District of Columbia 21,295 22,359 25,373 26,359 0 0 26,359 0 0 0 0 26,359 35 26,394
AC0 Office of the District of Columbia Auditor 4,549 4,669 5,860 5,333 0 0 5,333 0 0 0 0 5,333 0 5,333
DX0 Advisory Neighborhood Commissions 788 851 1,027 1,131 0 0 1,131 0 0 0 0 1,131 0 1,131
AL0 Uniform Law Commission 48 47 51 60 0 0 60 0 0 0 0 60 0 60
AA0 Office of the Mayor 11,760 14,453 14,506 10,700 0 0 10,700 4,083 0 0 0 14,783 683 15,466
AH0 Mayor's Office of Legal Counsel 1,092 1,322 1,634 1,634 0 0 1,634 0 0 0 0 1,634 0 1,634
AI0 Office of the Senior Advisor 1,877 2,123 3,149 3,219 0 0 3,219 0 0 0 0 3,219 0 3,219
BA0 Office of the Secretary 3,468 3,854 4,058 3,057 0 1,100 4,157 0 0 0 0 4,157 0 4,157
AE0 Office of the City Administrator 6,445 8,514 8,920 8,669 0 250 8,919 0 1,109 0 0 10,028 0 10,028
EM0 Deputy Mayor for Greater Economic Opportunity 672 4,160 3,714 3,712 0 0 3,712 0 0 0 0 3,712 916 4,628
RK0 D.C. Office of Risk Management 3,221 3,914 3,965 4,102 0 0 4,102 0 0 0 0 4,102 0 4,102
BE0 D.C. Department of Human Resources 17,418 18,591 16,029 8,866 0 561 9,428 0 0 0 0 9,428 7,100 16,528
JR0 Office of Disability Rights 1,805 1,666 2,026 1,133 0 0 1,133 638 0 0 0 1,771 293 2,064
RJ0 Captive Insurance Agency 2,017 2,001 2,320 2,095 0 211 2,306 0 0 0 0 2,306 0 2,306
AS0 Office of Finance and Resource Management 30,410 32,667 37,534 27,123 0 472 27,595 0 0 0 0 27,595 9,143 36,738
PO0 Office of Contracting and Procurement 96,867 61,638 27,145 23,393 0 1,552 24,945 0 0 0 0 24,945 3,649 28,594
PX0 Purchase Card Transactions 0 0 25,000 0 0 0 0 0 0 0 0 0 36,000 36,000
TO0 Office of the Chief Technology Officer 109,306 131,349 113,198 71,349 0 10,095 81,444 0 0 0 0 81,444 39,770 121,214
AM0 Department of General Services 447,130 469,342 432,884 308,053 1,350 8,377 317,780 0 0 0 0 317,780 137,520 455,300
AF0 Contract Appeals Board 1,378 1,453 1,490 1,556 0 0 1,556 0 0 0 0 1,556 0 1,556
DL0 Board of Elections 9,379 9,013 8,907 10,489 0 0 10,489 0 0 0 0 10,489 0 10,489
CJ0 Office of Campaign Finance 2,590 2,688 2,908 3,847 0 0 3,847 0 0 0 0 3,847 0 3,847
CG0 Public Employee Relations Board 1,251 1,279 1,440 1,509 0 0 1,509 0 0 0 0 1,509 0 1,509
CH0 Office of Employee Appeals 1,684 1,767 2,129 1,940 0 0 1,940 0 0 0 0 1,940 0 1,940
EA0 Metropolitan Washington Council of Governments 472 495 520 542 0 0 542 0 0 0 0 542 0 542
CB0 Office of the Attorney General for the District of Columbia 76,456 83,075 101,484 65,842 0 12,819 78,662 23,583 548 0 0 102,794 3,773 106,567
AG0 D.C. Board of Ethics and Government Accountability 1,789 2,166 2,329 2,214 0 153 2,366 0 0 0 0 2,366 0 2,366
AR0 Statehood Initiatives 290 240 234 242 0 0 242 0 0 0 0 242 0 242
AD0 Office of the Inspector General 14,683 15,890 18,368 15,943 0 0 15,943 2,820 0 0 0 18,763 0 18,763
Government of the District of ColumbiaFY 2019 Proposed Budget
Gross Funds
FY 2019 Proposed Budget by Type of Funding Appropriation Title (thousands of dollars)
FY 2019 Proposed Budget and Financial PlanPage G-1

Agency Code Agency Name
FY 2016 Actuals
Gross Funds
FY 2017 Actuals
Gross Funds
FY 2018 Approved
Budget Gross Funds Local Funds
Dedicated Taxes
Other Funds
Subtotal, General
FundFederal Funds
Private Funds
Enterprise and Other-Dedicated
TaxesEnterprise and Other
Subtotal Gross Funds - Less Intra-District
Funds
Intra-District Funds
Total FY 2019 Proposed Budget
Gross Funds
Government of the District of ColumbiaFY 2019 Proposed Budget
Gross Funds
FY 2019 Proposed Budget by Type of Funding Appropriation Title (thousands of dollars)
AT0 Office of the Chief Financial Officer 145,138 148,120 179,608 133,746 0 44,593 178,339 450 0 0 0 178,789 8,708 187,496
GS0 Section 103 Judgments - Governmental Direction and Support 9,000 4,346 0 0 0 0 0 0 0 0 0 0 0 0Total, Governmental Direction and Support 1,024,275 1,054,052 1,047,812 747,858 1,350 80,183 829,391 31,574 1,657 0 0 862,623 247,590 1,110,212
Economic Development and Regulation
EB0 Office of the Deputy Mayor for Planning and Economic Development 33,074 35,332 46,346 20,583 0 20,819 41,402 0 0 0 0 41,402 0 41,402
BD0 Office of Planning 9,927 10,138 10,402 10,231 0 200 10,431 547 10 0 0 10,988 0 10,988
EN0 Department of Small and Local Business Development 9,642 12,113 15,089 13,925 0 0 13,925 468 0 0 0 14,394 0 14,394
CI0 Office of Cable Television, Film, Music, and Entertainment 9,457 15,559 12,757 1,690 0 12,988 14,678 0 0 0 0 14,678 0 14,678
BJ0 Office of Zoning 2,837 3,070 3,093 3,117 0 0 3,117 0 0 0 0 3,117 24 3,141
DB0 Department of Housing and Community Development 152,396 189,573 181,393 31,885 0 3,634 35,519 55,830 20 0 0 91,369 100,000 191,369
CF0 Department of Employment Services 121,019 126,535 144,366 70,106 0 39,561 109,668 29,876 787 0 0 140,331 4,014 144,345
DA0 Real Property Tax Appeals Commission 1,643 1,640 1,715 1,763 0 0 1,763 0 0 0 0 1,763 0 1,763
CR0 Department of Consumer and Regulatory Affairs 48,578 50,851 60,098 23,264 0 37,114 60,378 0 0 0 0 60,378 0 60,378
CQ0 Office of the Tenant Advocate 2,738 3,075 4,008 3,128 0 509 3,637 0 0 0 0 3,637 0 3,637
BX0 D.C. Commission on the Arts and Humanities 15,351 20,868 29,857 30,565 0 199 30,764 0 0 0 0 30,764 168 30,932
LQ0 Alcoholic Beverage Regulation Administration 7,272 7,247 8,655 0 1,292 8,007 9,299 0 0 0 0 9,299 0 9,299
DH0 Public Service Commission 13,869 13,331 14,599 0 0 15,163 15,163 566 22 0 0 15,751 0 15,751
DJ0 Office of the People's Counsel 9,683 7,901 8,063 0 0 8,971 8,971 0 0 0 0 8,971 0 8,971
SR0 Department of Insurance, Securities, and Banking 20,684 19,933 28,748 0 0 28,565 28,565 0 0 0 0 28,565 125 28,690
HY0 Housing Authority Subsidy 55,696 54,624 85,980 96,696 0 0 96,696 0 0 0 0 96,696 0 96,696
HP0 Housing Production Trust Fund Subsidy 90,179 42,732 48,317 39,335 0 0 39,335 0 0 0 0 39,335 0 39,335
ID0 Business Improvement Districts Transfer 28,507 27,404 47,000 0 0 55,000 55,000 0 0 0 0 55,000 0 55,000
EC0 Section 103 Judgments-Econ Development and Regulation 938 0 0 0 0 0 0 0 0 0 0 0 0 0Total, Economic Development and Regulation 633,491 641,925 750,487 346,289 1,292 230,731 578,311 87,287 839 0 0 666,437 104,331 770,768
Public Safety and Justice
FA0 Metropolitan Police Department 543,434 555,012 548,703 510,230 0 8,200 518,430 3,907 0 0 0 522,337 31,356 553,693
FB0 Fire and Emergency Medical Services Department 244,689 258,311 254,570 255,447 0 1,762 257,209 0 0 0 0 257,209 259 257,468
FD0 Police Officers' and Fire Fighters' Retirement System 135,577 145,627 105,596 91,284 0 0 91,284 0 0 0 0 91,284 0 91,284
FL0 Department of Corrections 141,390 155,201 145,615 144,794 0 21,020 165,814 0 0 0 0 165,814 312 166,126
FK0 District of Columbia National Guard 12,294 12,576 13,908 4,810 0 0 4,810 9,614 0 0 0 14,425 0 14,425
FY 2019 Proposed Budget and Financial PlanPage G-2

Agency Code Agency Name
FY 2016 Actuals
Gross Funds
FY 2017 Actuals
Gross Funds
FY 2018 Approved
Budget Gross Funds Local Funds
Dedicated Taxes
Other Funds
Subtotal, General
FundFederal Funds
Private Funds
Enterprise and Other-Dedicated
TaxesEnterprise and Other
Subtotal Gross Funds - Less Intra-District
Funds
Intra-District Funds
Total FY 2019 Proposed Budget
Gross Funds
Government of the District of ColumbiaFY 2019 Proposed Budget
Gross Funds
FY 2019 Proposed Budget by Type of Funding Appropriation Title (thousands of dollars)
BN0 Homeland Security and Emergency Management Agency 60,788 98,036 136,570 5,103 0 0 5,103 137,069 0 0 0 142,172 0 142,172
DQ0 Commission on Judicial Disabilities and Tenure 290 306 295 0 0 0 0 295 0 0 0 295 0 295
DV0 Judicial Nomination Commission 251 266 270 0 0 0 0 270 0 0 0 270 0 270
FH0 Office of Police Complaints 2,110 2,276 2,601 2,538 0 0 2,538 0 0 0 0 2,538 0 2,538
FZ0 DC Sentencing Commission 1,498 948 1,179 1,186 0 0 1,186 0 0 0 0 1,186 0 1,186
MA0 Criminal Code Reform Commission 0 659 701 724 0 0 724 0 0 0 0 724 0 724
NS0 Neighborhood Safety and Engagement 0 0 2,129 4,731 0 0 4,731 0 0 0 0 4,731 0 4,731
FX0 Office of the Chief Medical Examiner 11,286 12,537 12,160 12,154 0 0 12,154 0 0 0 0 12,154 679 12,833
FS0 Office of Administrative Hearings 9,827 10,764 11,739 10,135 0 0 10,135 150 0 0 0 10,285 2,091 12,376
FJ0 Criminal Justice Coordinating Council 3,287 3,049 3,387 1,018 0 0 1,018 2,050 0 0 0 3,068 105 3,174
UC0 Office of Unified Communications 44,571 47,448 48,791 33,948 0 14,197 48,145 0 0 0 0 48,145 1,048 49,193
FT0 Homeland Security Grants 5,815 6,530 1,646 0 0 0 0 0 0 0 0 0 1,725 1,725
FR0 Department of Forensic Sciences 22,296 24,031 28,101 26,101 0 0 26,101 460 0 0 0 26,561 1,480 28,041
FI0 Corrections Information Council 441 527 748 646 0 0 646 0 0 0 0 646 0 646
FO0 Office of Victim Services and Justice Grants 28,218 35,181 44,849 28,824 0 2,231 31,055 11,862 0 0 0 42,916 7 42,923
FQ0 Office of the Deputy Mayor for Public Safety and Justice 670 1,727 1,613 1,596 0 0 1,596 0 0 0 0 1,596 0 1,596
PJ0 Section 103 Judgments - Public Safety and Justice 89,938 340 0 0 0 0 0 0 0 0 0 0 0 0Total, Public Safety and Justice 1,358,671 1,371,352 1,365,173 1,135,270 0 47,410 1,182,681 165,676 0 0 0 1,348,357 39,061 1,387,418
Public Education System
GA0 District of Columbia Public Schools 904,764 964,601 937,002 846,634 0 10,132 856,765 31,173 644 0 0 888,583 104,372 992,955
GX0 Teachers' Retirement System 44,359 56,618 59,046 53,343 0 0 53,343 0 0 0 0 53,343 0 53,343
GD0 Office of the State Superintendent of Education 393,688 401,199 488,229 161,587 4,676 1,001 167,264 275,919 0 0 0 443,183 37,764 480,946
GC0 District of Columbia Public Charter Schools 738,844 779,669 813,738 891,905 0 0 891,905 0 0 0 0 891,905 0 891,905
GG0 University of the District of Columbia Subsidy Account 71,942 77,671 78,180 87,168 0 0 87,168 0 0 0 0 87,168 0 87,168
CE0 District of Columbia Public Library 56,507 58,230 61,804 60,701 0 1,356 62,057 1,113 17 0 0 63,187 17 63,205
GB0 District of Columbia Public Charter School Board 0 721 9,110 0 0 8,525 8,525 0 0 0 0 8,525 0 8,525
GN0 Non-Public Tuition 66,092 64,752 70,021 67,000 0 0 67,000 0 0 0 0 67,000 0 67,000
GO0 Special Education Transportation 100,107 108,301 102,292 90,090 0 0 90,090 0 0 0 0 90,090 12,000 102,090
GE0 D.C. State Board of Education 1,017 1,267 1,711 1,750 0 0 1,750 0 0 0 0 1,750 0 1,750
GL0 District of Columbia State Athletics Commission 0 0 0 1,189 0 100 1,289 0 0 0 0 1,289 0 1,289
FY 2019 Proposed Budget and Financial PlanPage G-3

Agency Code Agency Name
FY 2016 Actuals
Gross Funds
FY 2017 Actuals
Gross Funds
FY 2018 Approved
Budget Gross Funds Local Funds
Dedicated Taxes
Other Funds
Subtotal, General
FundFederal Funds
Private Funds
Enterprise and Other-Dedicated
TaxesEnterprise and Other
Subtotal Gross Funds - Less Intra-District
Funds
Intra-District Funds
Total FY 2019 Proposed Budget
Gross Funds
Government of the District of ColumbiaFY 2019 Proposed Budget
Gross Funds
FY 2019 Proposed Budget by Type of Funding Appropriation Title (thousands of dollars)
GW0 Office of the Deputy Mayor for Education 3,929 4,621 7,520 16,116 0 0 16,116 0 0 0 0 16,116 0 16,116
PE0 Section 103 Judgments-Public Education System 0 5,482 0 0 0 0 0 0 0 0 0 0 0 0Total, Public Education System 2,381,250 2,523,131 2,628,654 2,277,485 4,676 21,113 2,303,274 308,205 661 0 0 2,612,140 154,153 2,766,293
Human Support Services
JA0 Department of Human Services 474,659 511,584 557,607 382,982 0 1,032 384,015 170,305 0 0 0 554,320 2,924 557,244
RL0 Child and Family Services Agency 218,462 223,594 226,496 161,201 0 1,000 162,201 60,223 23 0 0 222,446 1,795 224,241
RM0 Department of Behavioral Health 268,931 269,061 271,918 251,519 0 2,352 253,871 16,854 730 0 0 271,455 13,713 285,169
HC0 Department of Health 253,547 210,119 231,495 80,782 0 27,395 108,177 140,965 142 0 0 249,284 2,124 251,408
HA0 Department of Parks and Recreation 46,880 49,019 52,437 50,639 0 2,800 53,439 0 0 0 0 53,439 3,072 56,511
BY0 D.C. Office on Aging 43,083 45,151 46,031 37,958 0 0 37,958 9,795 0 0 0 47,753 229 47,982
BH0 Unemployment Compensation Fund 4,508 5,326 6,680 6,680 0 0 6,680 0 0 0 0 6,680 0 6,680
BG0 Employees' Compensation Fund 25,281 25,538 21,709 24,132 0 0 24,132 0 0 0 0 24,132 0 24,132
HM0 Office of Human Rights 4,202 4,533 4,930 4,738 0 0 4,738 339 27 0 0 5,105 200 5,305
BZ0 Mayor's Office on Latino Affairs 3,237 3,428 3,501 3,804 0 0 3,804 0 0 0 0 3,804 200 4,004
JY0 Children and Youth Investment Collaborative 7,510 4,920 0 0 0 0 0 0 0 0 0 0 0 0
AP0 Office on Asian and Pacific Islander Affairs 1,108 1,787 855 872 0 0 872 0 0 0 0 872 0 872
VA0 Office of Veterans' Affairs 353 404 472 541 0 5 546 0 0 0 0 546 0 546
JZ0 Department of Youth Rehabilitation Services 99,257 90,803 97,229 96,570 0 0 96,570 0 0 0 0 96,570 344 96,914
JM0 Department on Disability Services 158,817 164,713 168,156 123,842 0 7,300 131,142 41,851 0 0 0 172,993 50 173,043
HT0 Department of Health Care Finance 2,922,803 3,057,636 3,192,314 783,264 67,527 2,956 853,747 2,332,118 0 0 0 3,185,865 104,777 3,290,643
HX0 Not-for-Profit Hospital Corporation Subsidy 10,000 2,000 0 10,000 0 0 10,000 0 0 0 0 10,000 0 10,000
HG0 Office of the Deputy Mayor for Health and Human Services 1,569 2,242 1,787 1,782 0 0 1,782 0 0 0 0 1,782 0 1,782
HS0 Section 103 Judgments-Human Services 0 2,600 0 0 0 0 0 0 0 0 0 0 0 0Total, Human Support Services 4,544,207 4,674,459 4,883,618 2,021,308 67,527 44,839 2,133,674 2,772,450 923 0 0 4,907,047 129,428 5,036,475
Public Works
KT0 Department of Public Works 162,312 171,688 175,915 141,516 0 7,783 149,299 0 0 0 0 149,299 28,323 177,622
KA0 District Department of Transportation 104,015 99,923 119,972 108,029 0 23,533 131,561 11,474 0 0 0 143,036 0 143,036
KV0 Department of Motor Vehicles 40,445 43,034 45,488 30,100 0 10,080 40,180 0 0 0 0 40,180 6,207 46,387
KG0 Department of Energy and Environment 85,503 103,980 128,321 26,408 0 83,274 109,682 28,520 91 0 0 138,293 1,975 140,268
TC0 Department of For-Hire Vehicles 13,242 12,795 13,834 5,895 0 11,675 17,571 0 0 0 0 17,571 0 17,571
FY 2019 Proposed Budget and Financial PlanPage G-4

Agency Code Agency Name
FY 2016 Actuals
Gross Funds
FY 2017 Actuals
Gross Funds
FY 2018 Approved
Budget Gross Funds Local Funds
Dedicated Taxes
Other Funds
Subtotal, General
FundFederal Funds
Private Funds
Enterprise and Other-Dedicated
TaxesEnterprise and Other
Subtotal Gross Funds - Less Intra-District
Funds
Intra-District Funds
Total FY 2019 Proposed Budget
Gross Funds
Government of the District of ColumbiaFY 2019 Proposed Budget
Gross Funds
FY 2019 Proposed Budget by Type of Funding Appropriation Title (thousands of dollars)
KC0 Washington Metropolitan Area Transit Commission 127 139 141 151 0 0 151 0 0 0 0 151 0 151
KE0 Washington Metropolitan Area Transit Authority 359,097 368,014 430,009 110,686 258,489 43,000 412,175 0 0 0 0 412,175 0 412,175Total, Public Works 764,740 799,574 913,681 422,785 258,489 179,346 860,619 39,994 91 0 0 900,705 36,505 937,209
Financing and Other
DS0 Repayment of Loans and Interest 578,572 640,283 710,762 735,649 0 5,753 741,402 17,525 0 0 0 758,926 0 758,926
ZA0 Repayment of Interest on Short-Term Borrowings 922 0 0 0 0 0 0 0 0 0 0 0 0 0
ZB0 Debt Service - Issuance Costs 2,945 5,721 8,000 8,000 0 0 8,000 0 0 0 0 8,000 0 8,000
SM0 Schools Modernization Fund 14,276 13,523 0 0 0 0 0 0 0 0 0 0 0 0
DT0 Repayment of Revenue Bonds 7,822 7,825 7,832 0 7,839 0 7,839 0 0 0 0 7,839 0 7,839
ZC0 Commercial Paper Program 0 0 8,503 10,000 0 0 10,000 0 0 0 0 10,000 0 10,000
ZH0 Settlements and Judgments 32,953 21,292 21,825 21,825 0 0 21,825 0 0 0 0 21,825 0 21,825
ZZ0 John A. Wilson Building Fund 4,289 4,210 4,082 4,726 0 0 4,726 0 0 0 0 4,726 0 4,726
UP0 Workforce Investments 0 0 181,576 51,767 0 0 51,767 0 0 0 0 51,767 0 51,767
DO0 Non-Departmental 0 0 5,622 1,750 0 3,484 5,234 0 0 0 0 5,234 0 5,234
EP0 Emergency Planning and Security Fund 14,281 17,112 13,000 0 0 0 0 12,000 0 0 0 12,000 0 12,000
ELO Master Equipment Lease/Purchase Program 38,914 27,445 19,254 11,844 0 0 11,844 0 0 0 0 11,844 0 11,844
PA0 Pay-As-You-Go Capital Fund 144,105 133,380 130,298 4,171 0 77,535 81,706 0 0 0 0 81,706 0 81,706
RH0 District Retiree Health Contribution 29,000 31,000 44,500 46,000 0 0 46,000 0 0 0 0 46,000 0 46,000
KZ0 Highway Transportation Fund - Transfers 25,332 26,099 24,936 0 25,426 7,261 32,687 0 0 0 0 32,687 0 32,687
SB0 Inaugural Expenses 0 27,300 0 0 0 0 0 0 0 0 0 0 0 0
EZ0 Convention Center Transfer 131,916 141,802 141,636 0 155,543 3,415 158,959 0 0 0 0 158,959 0 158,959Total, Financing and Other 1,025,326 1,096,991 1,321,826 895,732 188,807 97,449 1,181,988 29,525 0 0 0 1,211,513 0 1,211,513
TOTAL GENERAL OPERATING FUNDS 11,731,960 12,161,485 12,911,250 7,846,726 522,141 701,071 9,069,938 3,434,711 4,172 0 0 12,508,821 711,068 13,219,889#N/A
Enterprise and Other Funds
LA0 Water and Sewer Authority* 0 0 561,947 0 0 0 0 0 0 0 582,781 582,781 0 582,781
LB0 Washington Aqueduct* 0 0 61,419 0 0 0 0 0 0 0 64,061 64,061 0 64,061
DC0 Office of Lottery and Charitable Games 228,270 218,854 240,000 0 0 0 0 0 0 0 225,282 225,282 0 225,282
DY0 District of Columbia Retirement Board* 0 0 41,644 0 0 0 0 0 0 0 43,579 43,579 0 43,579
BK0 Ballpark Revenue Fund 64,243 44,616 61,557 0 0 0 0 0 0 46,829 11,944 58,773 0 58,773
FY 2019 Proposed Budget and Financial PlanPage G-5

Agency Code Agency Name
FY 2016 Actuals
Gross Funds
FY 2017 Actuals
Gross Funds
FY 2018 Approved
Budget Gross Funds Local Funds
Dedicated Taxes
Other Funds
Subtotal, General
FundFederal Funds
Private Funds
Enterprise and Other-Dedicated
TaxesEnterprise and Other
Subtotal Gross Funds - Less Intra-District
Funds
Intra-District Funds
Total FY 2019 Proposed Budget
Gross Funds
Government of the District of ColumbiaFY 2019 Proposed Budget
Gross Funds
FY 2019 Proposed Budget by Type of Funding Appropriation Title (thousands of dollars)
ES0 Washington Convention and Sports Authority* 0 0 160,216 0 0 0 0 0 0 0 200,562 200,562 0 200,562
HF0 Housing Finance Agency* 0 0 12,320 0 0 0 0 0 0 0 12,960 12,960 0 12,960
GF0 University of the District of Columbia* 0 0 161,935 0 0 0 0 0 0 0 171,123 171,123 0 171,123
UI0 Unemployment Insurance Trust Fund 113,770 142,479 165,419 0 0 0 0 0 0 0 185,382 185,382 0 185,382
UZ0 Housing Production Trust Fund 86,903 124,487 99,156 0 0 0 0 0 0 60,665 39,335 100,000 0 100,000
TX0 Tax Increment Financing (TIF) Program 59,909 55,873 53,709 0 0 0 0 0 0 60,377 0 60,377 0 60,377
TY0 Repayment of PILOT Financing 21,889 21,639 31,189 0 0 0 0 0 0 54,123 0 54,123 0 54,123
HW0 Not-for-Profit Hospital Corporation * 0 0 128,000 0 0 0 0 0 0 0 144,000 144,000 0 144,000
HI0 D.C. Health Benefit Exchange Authority 48,091 47,976 28,143 0 0 0 0 0 0 0 31,144 31,144 0 31,144Total, Enterprise and Other Funds 623,075 655,924 1,806,652 0 0 0 0 0 0 221,994 1,712,152 1,934,146 0 1,934,146
GRAND TOTAL, DISTRICT GOVERNMENT 12,355,034 12,817,408 14,717,902 7,846,726 522,141 701,071 9,069,938 3,434,711 4,172 221,994 1,712,152 14,442,967 711,068 15,154,035
*These agencies do not use the District's financial system for their actual expenditure transactions.
Note: Agency budgets in this table are entered at the whole dollar but rounded to nearest thousands of dollars by funding type. This may cause rounding differences at the Gross Funds level.
FY 2019 Proposed Budget and Financial PlanPage G-6

Agency Code Agency Name
FY 2016 Actuals General
Fund FTEs
FY 2017 Actuals
General Fund FTEs
FY 2018 Approved
General Fund FTEs
FY 2019 Proposed
Local Funds FTEs
FY 2019 Proposed
Dedicated Taxes FTEs
FY 2019 Proposed
Other Funds FTEs
Total, FY 2019 Proposed
General Fund FTEs
Change from FY 2018
Approved General Fund
FTEs
Governmental Direction and Support
AB0 Council of the District of Columbia 180.99 185.1 197.5 205.0 0.0 0.0 205.0 7.5
AC0 Office of the District of Columbia Auditor 29.17 30.9 32.0 31.6 0.0 0.0 31.6 -0.4
DX0 Advisory Neighborhood Commissions 2.52 2.5 3.5 4.5 0.0 0.0 4.5 1.0
AA0 Office of the Mayor 66.59 80.5 91.5 92.8 0.0 0.0 92.8 1.3
AH0 Mayor's Office of Legal Counsel 7.86 9.0 10.0 10.0 0.0 0.0 10.0 0.0
AI0 Office of the Senior Advisor 15.38 17.0 18.0 18.0 0.0 0.0 18.0 0.0
BA0 Office of the Secretary 26.1 25.7 26.0 20.0 0.0 6.0 26.0 0.0
AE0 Office of the City Administrator 42 51.2 56.0 62.0 0.0 0.0 62.0 6.0
EM0 Office of the Deputy Mayor for Greater Economic Opportunity 5.2 14.0 16.0 19.3 0.0 0.0 19.3 3.3
RK0 D.C. Office of Risk Management 28.85 35.8 37.0 37.0 0.0 0.0 37.0 0.0
BE0 D.C. Department of Human Resources 98.9 88.9 90.3 88.0 0.0 5.8 93.8 3.5
JR0 Office of Disability Rights 7.63 10.9 9.0 9.0 0.0 0.0 9.0 0.0
RJ0 Captive Insurance Agency 0.13 0.0 2.0 4.0 0.0 0.0 4.0 2.0
AS0 Office of Finance and Resource Management 37.33 38.8 38.0 38.0 0.0 0.0 38.0 0.0
PO0 Office of Contracting and Procurement 170.47 192.1 199.0 191.0 0.0 8.0 199.0 0.0
TO0 Office of the Chief Technology Officer 186.22 215.8 251.6 232.7 0.0 15.9 248.6 -3.0
AM0 Department of General Services 608.09 614.8 649.9 643.5 0.0 12.0 655.5 5.6
AF0 Contract Appeals Board 9.88 10.0 10.0 10.0 0.0 0.0 10.0 0.0
DL0 Board of Elections 60.27 60.0 56.0 48.0 0.0 0.0 48.0 -8.0
CJ0 Office of Campaign Finance 28.22 30.0 30.0 33.0 0.0 0.0 33.0 3.0
CG0 Public Employee Relations Board 8.26 9.0 10.0 10.0 0.0 0.0 10.0 0.0
CH0 Office of Employee Appeals 14.11 15.0 15.0 15.0 0.0 0.0 15.0 0.0
CB0 Office of the Attorney General for the District of Columbia 373.33 370.9 453.8 447.6 0.0 21.4 469.0 15.2
AG0 D.C. Board of Ethics and Government Accountability 14.87 17.0 16.5 15.5 0.0 1.0 16.5 0.0
AR0 Statehood Initiatives 1.32 1.0 1.0 1.0 0.0 0.0 1.0 0.0
AD0 Office of the Inspector General 77.82 93.0 94.8 94.8 0.0 0.0 94.8 0.0
Appropriation Title
Government of the District of ColumbiaFY 2019 Proposed Full-Time Equivalent Employment Authority
General Fund
FY 2019 Proposed Budget and Financial PlanPage H-1

Agency Code Agency Name
FY 2016 Actuals General
Fund FTEs
FY 2017 Actuals
General Fund FTEs
FY 2018 Approved
General Fund FTEs
FY 2019 Proposed
Local Funds FTEs
FY 2019 Proposed
Dedicated Taxes FTEs
FY 2019 Proposed
Other Funds FTEs
Total, FY 2019 Proposed
General Fund FTEs
Change from FY 2018
Approved General Fund
FTEs
Appropriation Title
Government of the District of ColumbiaFY 2019 Proposed Full-Time Equivalent Employment Authority
General Fund
AT0 Office of the Chief Financial Officer 847.27 896.4 954.9 910.0 0.0 64.0 974.0 19.1Total, Governmental Direction and Support 2,948.8 3,115.3 3,369.2 3,291.2 0.0 134.1 3,425.3 56.0
Economic Development and Regulation
EB0 Office of the Deputy Mayor for Planning and Economic Development 75.05 75.1 83.2 68.0 0.0 17.0 85.0 1.8
BD0 Office of Planning 61.12 67.1 68.5 71.5 0.0 0.0 71.5 3.0
EN0 Department of Small and Local Business Development 37.82 46.3 51.0 51.0 0.0 0.0 51.0 0.0
CI0 Office of Cable Television, Film, Music, and Entertainment 38.62 48.5 48.9 7.0 0.0 44.0 51.0 2.1
BJ0 Office of Zoning 19.61 19.0 19.0 18.0 0.0 0.0 18.0 -1.0
DB0 Department of Housing and Community Development 50.34 52.9 74.0 74.2 0.0 0.0 74.2 0.2
CF0 Department of Employment Services 358.75 432.7 428.7 300.6 0.0 207.7 508.2 79.5
DA0 Real Property Tax Appeals Commission 11.33 11.0 11.0 11.0 0.0 0.0 11.0 0.0
CR0 Department of Consumer and Regulatory Affairs 335.85 391.4 437.0 187.0 0.0 261.0 448.0 11.0
CQ0 Office of the Tenant Advocate 15.45 18.0 22.0 18.7 0.0 3.4 22.0 0.0
BX0 Commission on the Arts and Humanities 10.61 21.0 21.0 27.0 0.0 0.0 27.0 6.0
LQ0 Alcoholic Beverage Regulation Administration 49.16 51.1 57.0 0.0 0.0 57.0 57.0 0.0
DH0 Public Service Commission 72.75 79.7 80.5 0.0 0.0 81.9 81.9 1.4
DJ0 Office of the People's Counsel 39.68 41.2 44.4 0.0 0.0 45.4 45.4 1.0
SR0 Department of Insurance, Securities, and Banking 110.45 124.6 149.6 0.0 0.0 150.0 150.0 0.4Total, Economic Development and Regulation 1,286.6 1,479.6 1,595.8 833.9 0.0 867.3 1,701.2 105.4
Public Safety and Justice
FA0 Metropolitan Police Department 4247.92 4,401.1 4,699.5 4,742.5 0.0 0.0 4,742.5 43.0
FB0 Fire and Emergency Medical Services Department 2014.17 1,920.1 2,112.0 2,152.0 0.0 1.0 2,153.0 41.0
FL0 Department of Corrections 841.47 1,043.5 1,245.2 1,079.2 0.0 240.0 1,319.2 74.0
FK0 District of Columbia National Guard 32.8 46.0 37.3 36.5 0.0 0.0 36.5 -0.8
BN0 Homeland Security and Emergency Management Agency 27 30.0 28.0 28.3 0.0 0.0 28.3 0.3
FH0 Office of Police Complaints 20.54 22.4 24.3 24.3 0.0 0.0 24.3 0.0
FZ0 DC Sentencing Commission 10.74 5.4 6.0 6.0 0.0 0.0 6.0 0.0
FY 2019 Proposed Budget and Financial PlanPage H-2

Agency Code Agency Name
FY 2016 Actuals General
Fund FTEs
FY 2017 Actuals
General Fund FTEs
FY 2018 Approved
General Fund FTEs
FY 2019 Proposed
Local Funds FTEs
FY 2019 Proposed
Dedicated Taxes FTEs
FY 2019 Proposed
Other Funds FTEs
Total, FY 2019 Proposed
General Fund FTEs
Change from FY 2018
Approved General Fund
FTEs
Appropriation Title
Government of the District of ColumbiaFY 2019 Proposed Full-Time Equivalent Employment Authority
General Fund
MA0 Criminal Code Reform Commission 0 5.0 5.0 5.0 0.0 0.0 5.0 0.0
NS0 Neighborhood Safety and Engagement 0 0.0 16.0 26.0 0.0 0.0 26.0 10.0
FX0 Office of the Chief Medical Examiner 67.76 88.7 86.0 89.0 0.0 0.0 89.0 3.0
FS0 Office of Administrative Hearings 67.01 74.4 73.3 71.3 0.0 0.0 71.3 -2.0
FJ0 Criminal Justice Coordinating Council 2.38 2.5 3.3 3.3 0.0 0.0 3.3 0.0
UC0 Office of Unified Communications 301.43 331.4 361.3 354.3 0.0 7.0 361.3 0.0
FR0 Department of Forensic Sciences 111.74 179.5 207.0 207.0 0.0 0.0 207.0 0.0
FI0 Corrections Information Council 5.4 5.7 7.0 7.0 0.0 0.0 7.0 0.0
FO0 Office of Victim Services and Justice Grants 10.52 11.9 12.6 12.5 0.0 2.0 14.4 1.9
FQ0 Office of the Deputy Mayor for Public Safety and Justice 4.48 15.8 11.0 10.0 0.0 0.0 10.0 -1.0Total, Public Safety and Justice 7,765.4 8,183.4 8,934.6 8,854.0 0.0 250.0 9,104.0 169.4
Public Education System
GA0 District of Columbia Public Schools 7478.32 7,362.9 7,642.8 8,043.3 0.0 18.7 8,062.0 419.2
GD0 Office of the State Superintendent of Education 236.16 258.0 319.0 291.8 21.9 4.4 318.1 -0.9
GC0 District of Columbia Public Charter Schools 1.03 1.0 1.0 1.0 0.0 0.0 1.0 0.0
CE0 District of Columbia Public Library 542.43 532.4 558.3 558.3 0.0 0.0 558.3 0.0
GN0 Non-Public Tuition 15.46 18.0 18.0 18.0 0.0 0.0 18.0 0.0
GO0 Special Education Transportation 1346.43 1,295.1 1,362.3 1,363.5 0.0 0.0 1,363.5 1.3
GE0 D.C. State Board of Education 15.49 22.0 23.0 29.0 0.0 0.0 29.0 6.0
GL0 District of Columbia State Athletics Commission 0 0.0 0.0 6.0 0.0 0.0 6.0 6.0
GW0 Office of the Deputy Mayor for Education 15.3 21.0 19.0 19.0 0.0 0.0 19.0 0.0Total, Public Education System 9,650.6 9,510.4 9,943.4 10,329.9 21.9 23.1 10,374.9 431.5
Human Support Services
JA0 Department of Human Services 552.5 595.9 615.4 696.1 0.0 0.0 696.1 80.7
FY 2019 Proposed Budget and Financial PlanPage H-3

Agency Code Agency Name
FY 2016 Actuals General
Fund FTEs
FY 2017 Actuals
General Fund FTEs
FY 2018 Approved
General Fund FTEs
FY 2019 Proposed
Local Funds FTEs
FY 2019 Proposed
Dedicated Taxes FTEs
FY 2019 Proposed
Other Funds FTEs
Total, FY 2019 Proposed
General Fund FTEs
Change from FY 2018
Approved General Fund
FTEs
Appropriation Title
Government of the District of ColumbiaFY 2019 Proposed Full-Time Equivalent Employment Authority
General Fund
RL0 Child and Family Services Agency 630.85 556.4 664.0 638.0 0.0 0.0 638.0 -26.0
RM0 Department of Behavioral Health 1229.26 1,175.0 1,161.8 1,230.1 0.0 15.3 1,245.3 83.5
HC0 Department of Health 267.52 275.8 293.1 157.1 0.0 152.4 309.6 16.5
HA0 Department of Parks and Recreation 483.43 657.7 733.3 741.5 0.0 0.0 741.5 8.2
BY0 D.C. Office on Aging 26.52 31.0 37.5 41.5 0.0 0.0 41.5 4.1
BG0 Employees' Compensation Fund 0 0.0 0.0 52.0 0.0 0.0 52.0 52.0
HM0 Office of Human Rights 34.97 35.9 41.6 42.2 0.0 0.0 42.2 0.5
BZ0 Mayor's Office on Latino Affairs 8.61 8.6 10.0 11.0 0.0 0.0 11.0 1.0
AP0 Office on Asian and Pacific Islander Affairs 4.74 6.0 6.0 6.0 0.0 0.0 6.0 0.0
VA0 Office of Veterans' Affairs 3.32 4.0 4.0 4.0 0.0 0.0 4.0 0.0
JZ0 Department of Youth Rehabilitation Services 516.74 510.4 553.5 589.5 0.0 0.0 589.5 36.0
JM0 Department on Disability Services 201.3 191.4 197.1 212.1 0.0 0.0 212.1 15.0
HT0 Department of Health Care Finance 92.57 104.7 126.8 157.4 5.5 17.8 180.7 53.9
HG0 Office of the Deputy Mayor for Health and Human Services 12.97 19.0 11.8 11.8 0.0 0.0 11.8 0.0Total, Human Support Services 4,065.3 4,171.8 4,455.7 4,590.2 5.5 185.5 4,781.2 325.4
Public Works
KT0 Department of Public Works 1225.23 1,310.0 1,330.0 1,279.0 0.0 27.0 1,306.0 -24.0
KA0 District Department of Transportation 455.41 506.6 602.4 602.4 0.0 3.0 605.4 3.0
KV0 Department of Motor Vehicles 229.82 258.6 251.0 213.0 0.0 39.0 252.0 1.0
KG0 Department of Energy and Environment 218.71 256.5 275.6 110.1 0.0 178.4 288.5 12.9
TC0 Department of For-Hire Vehicles 57.48 55.0 71.0 0.0 0.0 73.0 73.0 2.0Total, Public Works 2,186.7 2,386.7 2,530.0 2,204.5 0.0 320.4 2,524.9 -5.1
Financing and Other
DO0 Non-Departmental 0 0.0 40.0 0.0 0.0 0.0 0.0 -40.0Total, Financing and Other 0.0 0.0 40.0 0.0 0.0 0.0 0.0 -40.0
TOTAL GENERAL OPERATING FUNDS 27,903.3 28,847.2 30,868.7 30,103.7 27.4 1,780.3 31,911.3 1,042.6
Note: Details may not sum to totals because of rounding.
FY 2019 Proposed Budget and Financial PlanPage H-4

Agency Code Agency Name
FY 2016 Actuals
Gross Funds FTEs
FY 2017 Actuals
Gross Funds FTEs
FY 2018 Approved Budget
Gross Funds FTEs
Local Funds FTEs
Dedicated Taxes FTEs
Other Funds FTEs
Subtotal, General Fund
FTEs
Federal Funds FTEs
Private Funds FTEs
Enterprise and Other Funds -
Dedicated Taxes FTEs
Enterprise and Other
FTEs
Subtotal, Gross Funds -
Less Intra-District Funds
FTEs
Intra-District Funds FTEs
Total FY 2019 Proposed Budget
Gross Funds FTEs
Governmental Direction and Support
AB0 Council of the District of Columbia 181.0 186.1 197.5 205.0 0.0 0.0 205.0 0.0 0.0 0.0 0.0 205.0 0.0 205.0
AC0 Office of the District of Columbia Auditor 29.2 30.9 32.0 31.6 0.0 0.0 31.6 0.0 0.0 0.0 0.0 31.6 0.0 31.6
DX0 Advisory Neighborhood Commissions 2.5 2.5 3.5 4.5 0.0 0.0 4.5 0.0 0.0 0.0 0.0 4.5 0.0 4.5
AA0 Office of the Mayor 76.2 88.2 98.5 92.8 0.0 0.0 92.8 3.3 0.0 0.0 0.0 96.0 6.5 102.5
AH0 Mayor's Office of Legal Counsel 7.9 9.0 10.0 10.0 0.0 0.0 10.0 0.0 0.0 0.0 0.0 10.0 0.0 10.0
AI0 Office of the Senior Advisor 15.4 17.0 18.0 18.0 0.0 0.0 18.0 0.0 0.0 0.0 0.0 18.0 0.0 18.0
BA0 Office of the Secretary 26.1 25.7 26.0 20.0 0.0 6.0 26.0 0.0 0.0 0.0 0.0 26.0 0.0 26.0
AE0 Office of the City Administrator 42.2 58.2 62.0 62.0 0.0 0.0 62.0 0.0 3.0 0.0 0.0 65.0 0.0 65.0
EM0 Deputy Mayor for Greater Economic Opportunity 5.2 18.0 20.0 19.3 0.0 0.0 19.3 0.0 0.0 0.0 0.0 19.3 4.7 24.0
RK0 D.C. Office of Risk Management 28.9 35.8 37.0 37.0 0.0 0.0 37.0 0.0 0.0 0.0 0.0 37.0 0.0 37.0
BE0 D.C. Department of Human Resources 169.3 133.0 167.3 88.0 0.0 5.8 93.8 0.0 0.0 0.0 0.0 93.8 59.0 152.8
JR0 Office of Disability Rights 10.7 13.9 12.0 9.0 0.0 0.0 9.0 3.0 0.0 0.0 0.0 12.0 0.0 12.0
RJ0 Captive Insurance Agency 0.1 0.0 2.0 4.0 0.0 0.0 4.0 0.0 0.0 0.0 0.0 4.0 0.0 4.0
AS0 Office of Finance and Resource Management 42.2 45.0 45.0 38.0 0.0 0.0 38.0 0.0 0.0 0.0 0.0 38.0 7.0 45.0
PO0 Office of Contracting and Procurement 190.0 216.1 224.0 191.0 0.0 8.0 199.0 0.0 0.0 0.0 0.0 199.0 29.0 228.0
TO0 Office of the Chief Technology Officer 271.4 324.1 375.0 232.7 0.0 15.9 248.6 0.0 0.0 0.0 0.0 248.6 123.5 372.0
AM0 Department of General Services 622.5 626.8 671.9 643.5 0.0 12.0 655.5 0.0 0.0 0.0 0.0 655.5 22.0 677.5
AF0 Contract Appeals Board 9.9 10.0 10.0 10.0 0.0 0.0 10.0 0.0 0.0 0.0 0.0 10.0 0.0 10.0
DL0 Board of Elections 60.3 60.0 56.0 48.0 0.0 0.0 48.0 0.0 0.0 0.0 0.0 48.0 0.0 48.0
CJ0 Office of Campaign Finance 28.2 30.0 30.0 33.0 0.0 0.0 33.0 0.0 0.0 0.0 0.0 33.0 0.0 33.0
CG0 Public Employee Relations Board 8.3 9.0 10.0 10.0 0.0 0.0 10.0 0.0 0.0 0.0 0.0 10.0 0.0 10.0
CH0 Office of Employee Appeals 14.1 15.0 15.0 15.0 0.0 0.0 15.0 0.0 0.0 0.0 0.0 15.0 0.0 15.0
CB0 Office of the Attorney General for the District of Columbia 527.8 526.5 639.4 447.6 0.0 21.4 469.0 152.2 8.0 0.0 0.0 629.2 25.3 654.6
AG0 D.C. Board of Ethics and Government Accountability 14.9 17.0 16.5 15.5 0.0 1.0 16.5 0.0 0.0 0.0 0.0 16.5 0.0 16.5
AR0 Statehood Initiatives 1.3 1.0 1.0 1.0 0.0 0.0 1.0 0.0 0.0 0.0 0.0 1.0 0.0 1.0
AD0 Office of the Inspector General 93.3 108.3 112.0 94.8 0.0 0.0 94.8 17.3 0.0 0.0 0.0 112.0 0.0 112.0
AT0 Office of the Chief Financial Officer 900.2 942.8 1,003.0 910.0 0.0 64.0 974.0 0.0 0.0 0.0 0.0 974.0 48.0 1,022.0Total, Governmental Direction and Support 3,378.8 3,549.9 3,894.6 3,291.2 0.0 134.1 3,425.3 175.7 11.0 0.0 0.0 3,612.0 325.0 3,937.0
Government of the District of ColumbiaFY 2019 Proposed Full-Time Equivalent Employment Authority
Gross Funds
FY 2019 Proposed Budget by Type of FundingAppropriation Title
FY 2019 Proposed Budget and Financial Plan Page I-1

Agency Code Agency Name
FY 2016 Actuals
Gross Funds FTEs
FY 2017 Actuals
Gross Funds FTEs
FY 2018 Approved Budget
Gross Funds FTEs
Local Funds FTEs
Dedicated Taxes FTEs
Other Funds FTEs
Subtotal, General Fund
FTEs
Federal Funds FTEs
Private Funds FTEs
Enterprise and Other Funds -
Dedicated Taxes FTEs
Enterprise and Other
FTEs
Subtotal, Gross Funds -
Less Intra-District Funds
FTEs
Intra-District Funds FTEs
Total FY 2019 Proposed Budget
Gross Funds FTEs
Government of the District of ColumbiaFY 2019 Proposed Full-Time Equivalent Employment Authority
Gross Funds
FY 2019 Proposed Budget by Type of FundingAppropriation Title
Economic Development and Regulation
EB0 Office of the Deputy Mayor for Planning and Economic Development 79.9 77.6 85.2 68.0 0.0 17.0 85.0 0.0 0.0 0.0 0.0 85.0 0.0 85.0
BD0 Office of Planning 64.6 70.6 72.0 71.5 0.0 0.0 71.5 3.5 0.0 0.0 0.0 75.0 0.0 75.0
EN0 Department of Small and Local Business Development 40.7 49.3 54.0 51.0 0.0 0.0 51.0 3.0 0.0 0.0 0.0 54.0 0.0 54.0
CI0 Office of Cable Television, Film, Music, and Entertainment 38.6 48.5 48.9 7.0 0.0 44.0 51.0 0.0 0.0 0.0 0.0 51.0 0.0 51.0
BJ0 Office of Zoning 19.6 19.0 19.0 18.0 0.0 0.0 18.0 0.0 0.0 0.0 0.0 18.0 0.0 18.0
DB0 Department of Housing and Community Development 153.5 156.4 179.0 74.2 0.0 0.0 74.2 24.8 0.0 0.0 0.0 99.0 80.0 179.0
CF0 Department of Employment Services 583.8 654.6 682.1 300.6 0.0 207.7 508.2 217.9 6.0 0.0 0.0 732.1 27.0 759.1
DA0 Real Property Tax Appeals Commission 11.3 11.0 11.0 11.0 0.0 0.0 11.0 0.0 0.0 0.0 0.0 11.0 0.0 11.0
CR0 Department of Consumer and Regulatory Affairs 335.9 391.4 437.0 187.0 0.0 261.0 448.0 0.0 0.0 0.0 0.0 448.0 0.0 448.0
CQ0 Office of the Tenant Advocate 15.5 18.0 22.0 18.7 0.0 3.4 22.0 0.0 0.0 0.0 0.0 22.0 0.0 22.0
BX0 Commission on the Arts and Humanities 17.6 28.0 28.0 27.0 0.0 0.0 27.0 0.0 0.0 0.0 0.0 27.0 0.0 27.0
LQ0 Alcoholic Beverage Regulation Administration 49.2 51.1 57.0 0.0 0.0 57.0 57.0 0.0 0.0 0.0 0.0 57.0 0.0 57.0
DH0 Public Service Commission 76.6 83.3 84.6 0.0 0.0 81.9 81.9 3.7 0.0 0.0 0.0 85.6 0.0 85.6
DJ0 Office of the People's Counsel 39.7 41.2 44.4 0.0 0.0 45.4 45.4 0.0 0.0 0.0 0.0 45.4 0.0 45.4
SR0 Department of Insurance, Securities, and Banking 110.5 124.6 149.6 0.0 0.0 150.0 150.0 0.0 0.0 0.0 0.0 150.0 0.0 150.0Total, Economic Development and Regulation 1,636.8 1,824.6 1,973.8 833.9 0.0 867.3 1,701.2 252.9 6.0 0.0 0.0 1,960.1 107.0 2,067.1
Public Safety and Justice
FA0 Metropolitan Police Department 4,307.8 4,459.8 4,725.5 4,742.5 0.0 0.0 4,742.5 8.0 0.0 0.0 0.0 4,750.5 5.0 4,755.5
FB0 Fire and Emergency Medical Services Department 2,144.6 1,966.1 2,154.0 2,152.0 0.0 1.0 2,153.0 0.0 0.0 0.0 0.0 2,153.0 0.0 2,153.0
FL0 Department of Corrections 843.7 1,045.3 1,247.0 1,079.2 0.0 240.0 1,319.2 0.0 0.0 0.0 0.0 1,319.2 1.8 1,321.0
FK0 District of Columbia National Guard 110.6 128.4 131.0 36.5 0.0 0.0 36.5 94.5 0.0 0.0 0.0 131.0 0.0 131.0
BN0 Homeland Security and Emergency Management Agency 88.5 117.9 112.0 28.3 0.0 0.0 28.3 90.8 0.0 0.0 0.0 119.1 0.0 119.1
DQ0 Commission on Judicial Disabilities and Tenure 2.0 2.0 2.0 0.0 0.0 0.0 0.0 2.0 0.0 0.0 0.0 2.0 0.0 2.0
DV0 Judicial Nomination Commission 1.7 2.0 2.0 0.0 0.0 0.0 0.0 2.0 0.0 0.0 0.0 2.0 0.0 2.0
FH0 Office of Police Complaints 20.5 22.4 24.3 24.3 0.0 0.0 24.3 0.0 0.0 0.0 0.0 24.3 0.0 24.3
FZ0 DC Sentencing Commission 10.7 5.4 6.0 6.0 0.0 0.0 6.0 0.0 0.0 0.0 0.0 6.0 0.0 6.0
MA0 Criminal Code Reform Commission 0.0 5.0 5.0 5.0 0.0 0.0 5.0 0.0 0.0 0.0 0.0 5.0 0.0 5.0
NS0 Neighborhood Safety and Engagement 0.0 0.0 16.0 26.0 0.0 0.0 26.0 0.0 0.0 0.0 0.0 26.0 0.0 26.0
FX0 Office of the Chief Medical Examiner 69.6 94.6 92.0 89.0 0.0 0.0 89.0 0.0 0.0 0.0 0.0 89.0 4.0 93.0
FS0 Office of Administrative Hearings 76.2 84.4 83.3 71.3 0.0 0.0 71.3 0.0 0.0 0.0 0.0 71.3 10.0 81.3
FY 2019 Proposed Budget and Financial Plan Page I-2

Agency Code Agency Name
FY 2016 Actuals
Gross Funds FTEs
FY 2017 Actuals
Gross Funds FTEs
FY 2018 Approved Budget
Gross Funds FTEs
Local Funds FTEs
Dedicated Taxes FTEs
Other Funds FTEs
Subtotal, General Fund
FTEs
Federal Funds FTEs
Private Funds FTEs
Enterprise and Other Funds -
Dedicated Taxes FTEs
Enterprise and Other
FTEs
Subtotal, Gross Funds -
Less Intra-District Funds
FTEs
Intra-District Funds FTEs
Total FY 2019 Proposed Budget
Gross Funds FTEs
Government of the District of ColumbiaFY 2019 Proposed Full-Time Equivalent Employment Authority
Gross Funds
FY 2019 Proposed Budget by Type of FundingAppropriation Title
FJ0 Criminal Justice Coordinating Council 16.7 18.0 19.0 3.3 0.0 0.0 3.3 15.0 0.0 0.0 0.0 18.3 0.8 19.0
UC0 Office of Unified Communications 307.2 337.4 367.3 354.3 0.0 7.0 361.3 0.0 0.0 0.0 0.0 361.3 6.0 367.3
FR0 Department of Forensic Sciences 116.6 190.1 219.2 207.0 0.0 0.0 207.0 5.0 0.0 0.0 0.0 212.0 6.3 218.3
FI0 Corrections Information Council 5.4 5.7 7.0 7.0 0.0 0.0 7.0 0.0 0.0 0.0 0.0 7.0 0.0 7.0
FO0 Office of Victim Services and Justice Grants 14.1 15.8 16.0 12.5 0.0 2.0 14.4 2.5 0.0 0.0 0.0 17.0 0.1 17.0
FQ0 Office of the Deputy Mayor for Public Safety and Justice 4.5 15.8 11.0 10.0 0.0 0.0 10.0 0.0 0.0 0.0 0.0 10.0 0.0 10.0Total, Public Safety and Justice 8,140.4 8,516.1 9,239.5 8,854.0 0.0 250.0 9,104.0 219.8 0.0 0.0 0.0 9,323.8 33.9 9,357.6
Public Education System
GA0 District of Columbia Public Schools 8,360.6 8,382.4 8,342.5 8,043.3 0.0 18.7 8,062.0 276.7 4.0 0.0 0.0 8,342.7 506.6 8,849.2
GD0 Office of the State Superintendent of Education 339.1 360.9 448.8 291.8 21.9 4.4 318.1 115.5 0.0 0.0 0.0 433.6 0.4 434.0
GC0 District of Columbia Public Charter Schools 1.0 1.0 1.0 1.0 0.0 0.0 1.0 0.0 0.0 0.0 0.0 1.0 0.0 1.0
CE0 District of Columbia Public Library 547.1 537.9 562.8 558.3 0.0 0.0 558.3 5.5 0.0 0.0 0.0 563.8 0.0 563.8
GN0 Non-Public Tuition 15.5 18.0 18.0 18.0 0.0 0.0 18.0 0.0 0.0 0.0 0.0 18.0 0.0 18.0
GO0 Special Education Transportation 1,346.4 1,295.1 1,362.3 1,363.5 0.0 0.0 1,363.5 0.0 0.0 0.0 0.0 1,363.5 0.0 1,363.5
GE0 D.C. State Board of Education 15.5 22.0 23.0 29.0 0.0 0.0 29.0 0.0 0.0 0.0 0.0 29.0 0.0 29.0
GL0 District of Columbia State Athletics Commission 0.0 0.0 0.0 6.0 0.0 0.0 6.0 0.0 0.0 0.0 0.0 6.0 0.0 6.0
GW0 Office of the Deputy Mayor for Education 15.3 21.0 19.0 19.0 0.0 0.0 19.0 0.0 0.0 0.0 0.0 19.0 0.0 19.0Total, Public Education System 10,640.5 10,638.3 10,777.4 10,329.9 21.9 23.1 10,374.9 397.7 4.0 0.0 0.0 10,776.6 507.0 11,283.5
Human Support Services
JA0 Department of Human Services 1,041.8 1,168.2 1,248.5 696.1 0.0 0.0 696.1 620.6 0.0 0.0 0.0 1,316.7 21.0 1,337.7
RL0 Child and Family Services Agency 792.1 702.1 820.0 638.0 0.0 0.0 638.0 183.0 0.0 0.0 0.0 821.0 0.0 821.0
RM0 Department of Behavioral Health 1,345.6 1,392.5 1,382.6 1,230.1 0.0 15.3 1,245.3 99.8 1.0 0.0 0.0 1,346.1 67.8 1,413.8
HC0 Department of Health 495.8 638.5 606.2 157.1 0.0 152.4 309.6 324.3 1.0 0.0 0.0 634.9 3.0 637.9
HA0 Department of Parks and Recreation 486.4 678.8 748.9 741.5 0.0 0.0 741.5 0.0 0.0 0.0 0.0 741.5 16.5 758.0
BG0 Employees' Compensation Fund 0.0 0.0 0.0 52.0 0.0 0.0 52.0 0.0 0.0 0.0 0.0 52.0 0.0 52.0
BY0 D.C. Office on Aging 70.1 91.2 69.0 41.5 0.0 0.0 41.5 31.5 0.0 0.0 0.0 73.0 0.0 73.0
HM0 Office of Human Rights 35.8 38.3 44.0 42.2 0.0 0.0 42.2 1.9 0.0 0.0 0.0 44.0 0.0 44.0
BZ0 Mayor's Office on Latino Affairs 8.6 8.6 10.0 11.0 0.0 0.0 11.0 0.0 0.0 0.0 0.0 11.0 0.0 11.0
AP0 Office on Asian and Pacific Islander Affairs 4.7 8.0 6.0 6.0 0.0 0.0 6.0 0.0 0.0 0.0 0.0 6.0 0.0 6.0
VA0 Office of Veterans' Affairs 3.3 4.0 4.0 4.0 0.0 0.0 4.0 0.0 0.0 0.0 0.0 4.0 0.0 4.0
JZ0 Department of Youth Rehabilitation Services 516.7 510.4 553.5 589.5 0.0 0.0 589.5 0.0 0.0 0.0 0.0 589.5 0.0 589.5
FY 2019 Proposed Budget and Financial Plan Page I-3

Agency Code Agency Name
FY 2016 Actuals
Gross Funds FTEs
FY 2017 Actuals
Gross Funds FTEs
FY 2018 Approved Budget
Gross Funds FTEs
Local Funds FTEs
Dedicated Taxes FTEs
Other Funds FTEs
Subtotal, General Fund
FTEs
Federal Funds FTEs
Private Funds FTEs
Enterprise and Other Funds -
Dedicated Taxes FTEs
Enterprise and Other
FTEs
Subtotal, Gross Funds -
Less Intra-District Funds
FTEs
Intra-District Funds FTEs
Total FY 2019 Proposed Budget
Gross Funds FTEs
Government of the District of ColumbiaFY 2019 Proposed Full-Time Equivalent Employment Authority
Gross Funds
FY 2019 Proposed Budget by Type of FundingAppropriation Title
JM0 Department on Disability Services 402.1 418.5 432.0 212.1 0.0 0.0 212.1 215.4 0.0 0.0 0.0 427.5 0.0 427.5
HT0 Department of Health Care Finance 212.8 228.5 264.0 157.4 5.5 17.8 180.7 165.3 0.0 0.0 0.0 346.0 5.2 351.1
HG0 Office of the Deputy Mayor for Health and Human Services 13.0 19.0 11.8 11.8 0.0 0.0 11.8 0.0 0.0 0.0 0.0 11.8 0.0 11.8Total, Human Support Services 5,428.8 5,906.6 6,200.4 4,590.2 5.5 185.5 4,781.2 1,641.7 2.0 0.0 0.0 6,424.9 113.4 6,538.2
Public Works
KT0 Department of Public Works 1,397.9 1,468.0 1,488.0 1,279.0 0.0 27.0 1,306.0 0.0 0.0 0.0 0.0 1,306.0 158.0 1,464.0
KA0 District Department of Transportation 455.4 521.6 622.4 602.4 0.0 3.0 605.4 20.0 0.0 0.0 0.0 625.4 0.0 625.4
KV0 Department of Motor Vehicles 231.9 265.7 265.0 213.0 0.0 39.0 252.0 0.0 0.0 0.0 0.0 252.0 14.0 266.0
KG0 Department of Energy and Environment 337.4 380.9 393.4 110.1 0.0 178.4 288.5 109.8 1.1 0.0 0.0 399.4 14.7 414.0
TC0 Department of For-Hire Vehicles 58.2 55.0 71.0 0.0 0.0 73.0 73.0 0.0 0.0 0.0 0.0 73.0 0.0 73.0Total, Public Works 2,480.8 2,691.2 2,839.8 2,204.5 0.0 320.4 2,524.9 129.8 1.1 0.0 0.0 2,655.8 186.7 2,842.4
Financing and Other
DO0 Non-Departmental 0.0 0.0 40.0 0.0 0.0 0.0 0.0 0.0 0.0 0.0 0.0 0.0 0.0 0.0Total, Financing and Other 0.0 40.0 0.0 0.0 0.0 0.0 0.0 0.0 0.0 0.0 0.0 0.0 0.0
TOTAL GENERAL OPERATING FUNDS 31,706.1 33,126.7 34,965.4 30,103.7 27.4 1,780.3 31,911.3 2,817.6 24.1 0.0 0.0 34,753.1 1,272.8 36,025.9
Enterprise and Other Funds
DC0 Office of Lottery and Charitable Games 64.7 74.5 74.5 0.0 0.0 0.0 0.0 0.0 0.0 0.0 76.5 76.5 0.0 76.5
DY0 District of Columbia Retirement Board* 0.0 0.0 75.0 0.0 0.0 0.0 0.0 0.0 0.0 0.0 75.0 75.0 0.0 75.0
GF0 University of the District of Columbia* 0.0 0.0 968.4 0.0 0.0 0.0 0.0 0.0 0.0 0.0 968.4 968.4 0.0 968.4
HI0 D.C. Health Benefit Exchange Authority 60.1 73.9 92.0 0.0 0.0 0.0 0.0 0.0 0.0 0.0 101.0 101.0 0.0 101.0Total, Enterprise and Other Funds 124.8 148.4 1,209.9 0.0 0.0 0.0 0.0 0.0 0.0 0.0 1,220.9 1,220.9 0.0 1,220.9
GRAND TOTAL, DISTRICT GOVERNMENT 31,830.9 33,275.1 36,175.3 30,103.7 27.4 1,780.3 31,911.3 2,817.6 24.1 0.0 1,220.9 35,974.0 1,272.8 37,246.8
*These agencies do not use the District's financial system for their actual expenditure transactions.
Note: Details may not sum to totals because of rounding.
FY 2019 Proposed Budget and Financial Plan Page I-4

Appendix J:
Glossary ofBudget Terms


FY 2019 Proposed Budget and Financial Plan Glossary of Budget Terms
Appendix J-1
Appendix K
Glossary of Budget Terms
Accrual Basis of Accounting – An accounting method that recognizes the financial effect of
transactions, events, and interfund activities when they occur, regardless of the timing of related cash
flows. Accordingly, revenues are recognized when they are earned and expenses when they are incurred,
not when cash changes hands. Contrast this term to "modified accrual basis of accounting."
Activity - A component part of the District's program structure that is comprised of a set of services
grouped around a common purpose or result.
Additional Gross Pay - Pay other than base compensation and premium pay. Examples include Holiday
Pay, Longevity Pay, Shift Differential, and Terminal Leave.
Agency Financial Operations Program (AFO) - A program within an agency's performance plan under
Performance-Based Budgeting. AFO is used to track the funding and FTE count for all Office of the
Chief Financial Officer (OCFO) FTEs assigned to the agencies. Though many of these employees work
on-site at agency locations, all financial positions within District agencies report to the Chief Financial
Officer. Under AFO, these costs fall within one of three activities: (1) Budget Operations, (2)
Accounting Operations, (3) ACFO. Six Associate Chief Financial Officers (ACFOs), each representing
one of the major appropriation titles in the District's budget, manage agency financial operations.
Agency fiscal officers report to their respective ACFO, who serves as the key contact between the Office
of Chief Financial Officer and the Office of Budget and Performance Management, in the Office of the
City Administrator, in managing agency finances. For budgetary purposes, funding for these positions
assigned to the agencies is included in the various agency budgets. This funding is not duplicated in the
budget for the OCFO.
Agency Management Program (AMP) - A program within an agency's performance plan under
Performance-Based Budgeting. AMP is used to track costs associated with common administrative
expenses across the District. Under AMP, these costs fall within 15 activities: (1) Personnel, (2) Training
and Employee Development, (3) Labor-Management Partnerships, (4) Contracting and Procurement, (5)
Property Management, (6) Information Technology, (7) Financial Management, (8) Risk Management,
(9) Legal Services, (10) Fleet Management, (11) Communications, (12) Customer Service, (13)
Performance Management, (14) Language Access, and (15) Court-Ordered Supervision. Many agencies
do not include all 15 of these activities.
Allocable Revenue - Revenue earned, collected, and used by the agency responsible for generating the
revenue.
Allocation - The movement of budget from a central budget item, like a Reserve fund, to a specific
budget location. In the case of the Highway Trust Fund, the movement of capital budget from a master
project to a capital project authorized within the master project group.
Amendment - A proposed change to a budget that is not yet finally approved, but has been formally
submitted by the executive to the legislative branch.

Glossary of Budget Terms FY 2019 Proposed Budget and Financial Plan
Appendix J-2
Annualization - A budget increase to provide full-year budget authority for a budgetary item that was
only partially funded in the prior-year budget.
Appropriated Revenue - Authority to collect revenue by an agency on behalf of the District Treasury;
such revenue is used to support the operations of all agencies.
Appropriation - Authority to spend funds appropriated by Congress and financed by general District
revenues.
Appropriation Group (or Appropriation Title) - The eight broad areas into which the District
categorizes services to the citizens of Washington D.C. They include Governmental Direction and
Support, Economic Development and Regulation, Public Safety and Justice, Public Education System,
Human Support Services, Public Works, Financing and Other, and Enterprise and Other Funds.
Arbitrage - With respect to tax-exempt municipal debt, arbitrage is the difference between the interest
paid on tax-exempt bonds and the interest earned by investing the proceeds of the tax-exempt bonds in
higher-yielding taxable securities. Federal income tax laws generally restrict the ability to earn arbitrage
in connection with tax-exempt bonds or other federally tax-advantaged bonds.
Attrition - Voluntary employment losses, such as retirements and resignations.
Bond Anticipation Notes - Notes issued for capital projects, which are repaid from the proceeds of the
issuance of long-term bonds.
Bonds - The written evidence of debt, which upon presentation entitles the bondholder or owner to a
fixed sum of money plus interest. The debt bears a stated rate(s) of interest, or states a formula for
determining that rate, and matures on a date certain. Generally, bonds are debt securities with a final
maturity longer than the short-term range.
Bond Rating - A bond rating is an independent assessment of the creditworthiness of a bond issued by
a state or municipality (including all short and long-term indebtedness). The three primary rating agen-
cies are Standard & Poor's Ratings Services (S & P), Moody's Investors Service, Inc. (Moody's), and
Fitch Ratings, Inc. (Fitch). Bond ratings measure the probability of the timely repayment of principal and
interest of a bond. Generally, a higher credit rating would lead to a more favorable effect on the mar-
ketability of a bond and a lower cost of borrowing for the borrower. The long-term credit
rating symbols for investment grade bonds range from the highest ratings of AAA, AA, and A to BBB-,
the lowest investment grade ratings. Pluses are added to distinguish strength and minuses reflect
weaknesses. Bonds rated below BBB- are referred to as speculative, low grade or junk bonds.
Budget - A plan of financial and operational intent embodying an estimate of proposed expenditures for
a given period and proposed means of financing.
Budget Authority - Authority provided by law to enter into obligations that will result in expenditures.
It may be classified by the period of availability (one-year, multiple-year, no-year), by the timing of
congressional action (current or permanent), or by the manner of determining the amount available
(definite or indefinite).
Budget Establishment - The period immediately preceding the beginning of the budget fiscal year
during which final budgets are prepared and entered into the formal accounting records of the District.
Budget Formulation - The budget planning and development process from the initial budget call up to
and including final approval by Congress.
Budget Modification - A change in any portion of the budget during the fiscal year.
Budget Reserve - Funds that are earmarked to protect the District against shortfalls in revenue and
unforeseen expenditures.

FY 2019 Proposed Budget and Financial Plan Glossary of Budget Terms
Appendix J-3
Build America Bonds (BABs) - Taxable municipal securities issued through December 31, 2010 under
the American Recovery and Reinvestment Act of 2009. BABs may be direct pay subsidy bonds or tax
credit bonds.
CAFR - State and local governments issue an annual financial report referred to as the Comprehensive
Annual Financial Report or CAFR. The CAFR is prepared in accordance with U.S. generally accepted
accounting principles (GAAP) for state and local governments as promulgated by the Government
Accounting Standards Board (GASB) and is composed, at a minimum, of the following three parts: (1)
an introductory section, (2) a financial section, and (3) a statistical section. Some of the principal users
of the CAFR are credit or bond rating agencies (Fitch Ratings, Moody’s Investors Service, Standard and
Poor’s Ratings Services), institutions that buy and sell bonds, and those charged with managing and
governing the state or local government.
Capital Budget - The budget that provides for the acquisition of District-owned assets that help meet the
long-term and infrastructure needs, as summarized in the Capital Improvements Program.
Capital Improvements Program (CIP) - A plan for initiating the development, improvement, or
replacement of District-owned assets during a six-year period. As annually revised, this plan provides
the basis for future-year capital budget requests.
Chart of Accounts - A listing of general ledger accounts used to record financial transactions incurred
by District agencies.
Charter School - A private non-profit entity that accepts and educates public school students under the
terms of a charter granted by the District’s chartering authority. Charter Schools receive the same public
funding as D.C. Public Schools pursuant to the District’s uniform per-student funding formula;
additionally, a facilities allowance is provided.
Collateral - Security pledged to a creditor to assure that the obligor of municipal credit will meet its
payment obligations. When the obligor has performed, the creditor must release the collateral.
Commercial Paper (CP) - Short-term obligations, backed by a line of credit with a bank, that mature
within 270 days. Maturing principal of outstanding commercial paper is typically paid with newly issued
commercial paper, referred to as a “roll over,” thereby borrowing funds on a short-term basis for an
extended time period. Rate reset periods may vary from one to 270 days and different portions of a
single issue of commercial paper may simultaneously have different reset periods.
Component Unit - Legally separate organizations that meet the following criteria: (a) the primary gov-
ernment appoints a voting majority of the organization’s board; and (b) there is a financial
benefit/burden relationship between the primary government and the organization, or the primary
government is able to impose its will on the organization.
Comptroller Object - This represents the lowest level of the General Ledger Account structure for
operating statement District-wide accounting purposes. It includes revenue, expenditure, transfer, and
statistical accounts.
Comptroller Source Group - This is used to group Comptroller Objects for reporting purposes. Also
called Object Class.
Consolidated Plan - The U.S. Department of Housing and Urban Development requires a single or
consolidated plan and submission for the following federal grant programs: Community Development
Block Grants (CDBG), HOME Investment Partnerships Program, Emergency Shelter Grants (ESG), and
the Housing Opportunities for Persons with AIDS (HOPWA) grant.
Contractual Services - A budgetary classification of nonpersonal services that includes funds for
contractual services.

Glossary of Budget Terms FY 2019 Proposed Budget and Financial Plan
Appendix J-4
Controllable Property - Non-capitalized tangible property with a value that is less than $5,000 that is
considered to be sensitive with a high risk of theft or loss; such property typically has an expected
useful life of less than three years.
Current Services Funding Level (CSFL) - The CSFL is a Local funds ONLY representation of the true
cost of operating District agencies in the next budget year, without consideration of any new policy
decisions.
Debt Capacity – Generally, the maximum principal amount of debt that an issuer is permitted to have
outstanding at any time under constitutional, statutory or bond contract provisions. The District has two
statutorily mandated debt limits. The Home Rule Act provides that the debt service on the District’s
outstanding and proposed debt in any fiscal year cannot exceed 17% of local-source District revenues.
The Debt Ceiling Act imposes a further limit. Total debt service on all outstanding Tax-Supported Debt
cannot exceed 12% of annual District General Fund expenditures and transfers during a given CIP
period.
Debt Ratio – Comparative statistics showing the relationship between the issuer’s outstanding debt and
factors such as its tax base, income, or population.
Debt Service - The payment of interest on outstanding bonds, the principal payment of maturing or
redeemed bonds and any required contributions to a sinking fund for term bonds. Generally principal is
paid annually. Interest on fixed rate bonds is paid semi-annually, and interest on floating-rate bonds is
paid monthly.
Dedicated Taxes - Tax revenues that are set aside by law to a particular agency for a particular purpose.
Dedicated Tax revenue is part of General Fund revenue.
Encumbrance - An amount of funds committed for the payment of goods and services ordered but not
yet received.
Enterprise Funds - Budget and accounting units created for particular purposes, such as self-sustaining
operations for which a fee is charged to external users for goods and services, to separate the revenue and
financial control of such operations from the District's General Fund.
Entitlement - A service or grant that, under District or Federal law, must be provided to qualified
applicants.
Equipment and Equipment Rental - The name of the object class used to allocate funds for such needs.
Escrow Agreement for Refunding Bonds - An agreement that typically provides for the deposit of
funds or securities in an escrow account to refund outstanding debt. The agreement stipulates how funds
are invested until their expenditure and the schedule of on-going debt service payments and redemptions.
Expenditure - A payment for goods or services received.
FMAP (Federal Medicaid Assistance Percentage) – The percentage of Medicaid expenditures that is
reimbursed by the federal government. For the District, this percentage is generally 70 percent for most
Medicaid functions.
Federal Funds
• Federal Grants: Funding provided by the federal government via a federal agency for a specific purpose
with the conditions for the administration of the funding dictated by each grantor organization.
• Federal Payments: Funding specifically detailed in the Federal Funds portion of the District of Columbia
Appropriations Act with the conditions for the administration of the funding found within the statute and
federal appropriations law.

FY 2019 Proposed Budget and Financial Plan Glossary of Budget Terms
Appendix J-5
• Federal Medicaid Payments: Funding provided to pay for a portion of the health care costs of eligible
individuals, with oversight performed by District and federal authorities.
Fixed Costs - Expenses that do not change in proportion to the activity of a business and are related to
the everyday functioning of a business. In the District, fixed costs are categorized as electricity, heating
fuel, janitorial services, natural gas, occupancy, telecommunication, postage, rent, security services,
steam, water and sewer, and fleet fuel and services. While the expense item is fixed, the costs do have
variability. Rate fluctuations and consumption levels play a large part in determining the amount of fixed
costs.
Fringe Benefits - Part of overall employee compensation costs, including life and health insurance and
retirement and Social Security contributions.
Full-Time Equivalent (FTE) - An employment indicator that translates the total number of hours
worked in a year by all employees, including part-time workers, to an equivalent number of work years.
For example, one FTE generally equals 2,080 hours and 0.75 FTE equals 1,560 hours.
Fund - A budgeting and accounting practice used to establish accounts separating revenues and their
related obligations and expenditures for one purpose from revenues, obligations, and expenditures for
other purposes. It is a distinct accounting entity that has its own assets, liabilities, equity, revenues, and
expenditures/expenses.
Fund Accounting - Method of organizing and maintaining accounting activities on a fund basis. Under
this method, funds are established for the purpose of carrying on specific activities or attaining certain
objectives in accordance with special regulations, restrictions, or limitations.
Fund Balance - The difference between fund assets and deferred outflows of resources and fund
liabilities and deferred inflows of resources. The fund balance is cumulative over the life of the fund.
Generally Accepted Accounting Principles (GAAP) - Uniform minimum standards for accounting and
financial reporting. GAAP includes the conventions, rules, and procedures that serve as the norm for the
fair presentation of financial statements. The standard-setting body which establishes GAAP for
governmental entities is the Governmental Accounting Standards Board (GASB).
GASB – Established in June 1984, the Governmental Accounting Standards Board (GASB) is the
ultimate authoritative accounting and financial reporting standard-setting body for state and local
governments. Although GASB standards do not have the force of law, governments are required to
follow GASB standards in order to obtain unmodified (or clean) opinions from their auditors, and
failure to comply with GASB standards can adversely affect a state or local government’s bond ratings
and thus, its attempts to issue bonds.
GFOA - The Government Finance Officers Association (GFOA) of the United States and Canada is the
premier association of public finance professionals. Since its inception in 1906, originally as the
Municipal Finance Officers Association, the organization has played a major role in the development and
promotion of GAAP for state and local government. The GFOA has sponsored the Certificate of
Achievement for Excellence in Financial Reporting Program since 1946. Under this program,
governments that achieve the highest standards in financial reporting are awarded a prestigious
Certificate of Achievement. The GFOA also sponsors the Distinguished Budget Presentation Award
Program, which recognizes governments whose budgets are deemed exemplary as policy documents,
financial guides, operational guides, and communication devices. The GFOA also publishes
Governmental Accounting, Auditing, and Financial Reporting (GAAFR), also known as “the Blue
Book”.

Glossary of Budget Terms FY 2019 Proposed Budget and Financial Plan
Appendix J-6
GPRA (Government Performance and Results Act) - Legislation that requires the establishment of a
direct relationship between the use of federal funds and the delivery of services by federal agencies.
Many federal grants require GPRA performance measures as part of the reporting process.
General Fund - The principal operating fund of the District, which is used to account for all financial
resources except those required to be accounted for in another fund. General Fund revenues consist of
Local, Dedicated Tax, and Special Purpose Revenues.
General Obligation (G.O.) Bonds - Bonds issued directly by state or local governments or their
agencies to meet essential government functions, such as schools and highway construction. These bonds
are backed by the issuer’s pledge of its full faith, credit and taxing power to meet interest and principal
payments.
Gift Funds - Financial donations to the District government, which may only be accepted on behalf of
the District by the Mayor, and which may be earmarked for a specific purpose.
Grant - Contributions of assets (usually cash) by a government unit or private entity for specified
purposes. The District government receives grants from the federal government (and occasionally from
private entities) for a variety of purposes. District agencies also make grants to non-profit or other
non-District government organizations. When the source of the District’s grant to a non-District
government organization is itself a grant, the District’s grant is called a “subgrant.”
Grant Anticipation Revenue (GARVEE) Bonds - Bonds used by state or state infrastructure agencies
under the guidelines of the National Highway System Designation Act to finance major highway projects
receiving federal funding. States must repay the bonds using federal funds expected to be received in the
future; however, the federal government does not guarantee that the funds will be made available to repay
the bonds.
Gross Budget - A total budget amount that includes resources from all funding sources.
Imprest Fund - A fund of a designated amount out of which payments for expenses of small amounts
are made (sometimes referred to as petty cash).
Income Tax Secured Revenue Bond - Revenue bonds secured by and paid solely from the individual
income tax and the business franchise tax revenue received by the District.
Indirect Costs - Administrative overhead costs incurred by the District in managing grant programs.
Industrial Revenue Bond - A bond issued by the District on behalf of a non-profit or other eligible
entity to finance or refinance projects including housing, health facilities, transit, higher education, or
other industrial or commercial development
Inflation - An increase in general price of goods or services resulting in a decline in the purchasing
power of currently available money.
Infrastructure - Long-lived assets that are stationary in nature and normally can be preserved for a
significantly greater number of years than most capital assets. Examples of infrastructure include such
assets as highways, bridges, drainage systems, and water and sewer systems.
Interest Accrual - The interest that has accumulated on a bond since the last interest payment up to, but
not including, the settlement date.
Intra-District - An accounting mechanism used to track payments for services provided by one District
agency to another District agency, similar to an internal service fund.
Key Result Measures - A set of result performance measures that are contained within each program.

FY 2019 Proposed Budget and Financial Plan Glossary of Budget Terms
Appendix J-7
Local Education Agency (LEA) - An education agency at the local level that exists primarily to
operate schools or to contract for educational services. This term is used synonymously with the terms
"school district, “school system," and "local basic administrative unit."
Local Revenue - Includes tax and non-tax revenue that is not earmarked for a particular purpose and is
allocated to fund District programs during the annual budget process. Local revenue is part of General
Fund revenue.
Mandate - Any responsibility, action or procedure that is imposed by one government on another
through constitutional, legislative, administrative, executive, or judicial action as a direct order, or that is
required as a condition of aid.
MARC (Maximum Allowable Request Ceiling) - The maximum Local fund budget that the agencies
are allowed to request at the beginning of the budget formulation process.
Master Project – A designated capital project that receives the budget for a specific set of related
projects, which then subsequently obtain budget(s) through an allocation process from the master
project. Certain District capital projects are budgeted using this process.
Match - A locally provided cash or in-kind service contribution required to supplement or equal a grant
or gift as a condition for receiving the funds.
Mission - The mission is a clear, concise statement of the purpose of an agency. The mission focuses on
the broad, yet distinct, results the agency will achieve for its customers.
Modified Accrual Basis of Accounting - A basis of accounting that recognizes revenues in the period
they become measurable and available, and expenditures in the period in which governments in general
normally liquidate the associated liability rather than when that liability is first incurred (if earlier).
Municipal Bond - A debt security issued by or on behalf of a state, local government, or an agency or
instrumentality of a state or local government. Municipal bonds, for example, may be issued by states,
cities, counties, special tax districts or special agencies or authorities of state or local governments.
Generally, interest earned on municipal bonds is exempt from federal income taxes and state and local
taxes in the state if the investor lives in the issuing state.
Nonpersonal Services (NPS) - A budget category that includes budget objects for reporting other than
personnel-related expenditures. Nonpersonal services includes supplies, utilities, communications, rent,
other services and charges, subsidies and transfers, equipment and equipment rental, and debt service.
Nonrecurring Expenditures - One-time expenditures for special items, such as a new fire truck or a
computer system, that do not need to be budgeted for again in the year following their purchase.
Notice of Funding Availability (NOFA) - A public notice that an agency will issue a Request for
Applications (RFA), informing interested parties when and where an RFA may be obtained.
Object Category - The category of object classes for which the District budgets in the operating budget.
There are two object categories: Personal Services (salaries, fringe benefits, additional pay, and overtime)
and Nonpersonal Services (all object classes that are not personal services).
Object Class - A budgetary classification that breaks down the object categories of personal services and
nonpersonal services into more specific types of expenditure, such as fringe benefits (Object Class 14)
or supplies (Object Class 20). Also called Comptroller Source Group.
Objectives - Measurable activities of a program that are sought to achieve the overall mission.
Obligations - The amount of expenditures already made as well as the cost of commitments requiring
future payments.

Glossary of Budget Terms FY 2019 Proposed Budget and Financial Plan
Appendix J-8
Operating Budget - The budget that encompasses day-to-day District government activities. The
operating budget includes employee salaries, supplies, and other non-personnel items related to current
activities. The operating budget also includes debt service and overhead costs related to daily operations.
Other Services and Charges - A budgetary classification of nonpersonal services that includes funds for
printing, postage, tuition, travel, conference, and membership dues.
Overtime Pay - Pay for full-time employees whose work hours exceed their regular tour of duty,
generally, for hours of work authorized in excess of 40 hours in a pay status in a workweek in accordance
with provisions of section 7 of the Fair Labor Standards Act of 1938 (FLSA), as amended (29 USC 207).
Personal Services (PS) - A budget category that includes budget objects for reporting personnel-related
expenditures. Personal Services includes regular pay, other pay, additional gross pay, overtime, and
fringe benefits.
Performance-Based Budgeting (PBB) - A budget system in which budget decisions are based on or
informed by performance information that describes the cost or efficiency of producing an activity and
the results achieved for customers.
Performance Measures - Measures that describe the information managers and other decision-makers
need in order to make good business decisions. Different types of measures include demand/input,
output, result/outcome, and efficiency.
Performance Plan - An agency-level plan that contains the agency’s mission, summary of services,
objectives, initiatives, and performance measures for a set period of time.
Phase - A budgeted task (e.g. design, project management, construction) necessary to achieve the
completion of a capital project.
Private Revenue - Funding from private grants to fund the intended purpose of the grant.
Program - A component part of the District's program structure. Comprised of a set of activities that have
a common purpose or result, organized as a sub-unit of an agency for accounting, budgeting, planning,
and performance measurement purposes.
Program Structure - The delineation of programs, activities, and services that constitute the work of an
agency.
Project – An operating project is a SOAR attribute used to isolate selected financial activity. A capital
project is an investment in the infrastructure of the District that results in a new District-owned asset,
increases the value of an existing District-owned asset, or increases the life of a District-owned asset by
at least 2 years.
Proprietary Fund - Fund category that often emulates the private sector and focuses on the
determination of operating income, changes in net position (or cost recovery), financial position, and
cash flows. Expenditures are typically funded by user charges and fees. Governments may have two
types of proprietary funds: enterprise funds and internal service funds.
Qualified Zone Academy Bond (QZAB) - Municipal security issued to finance projects for certain
eligible public schools in conjunction with private business contributions. At the election of the issuer,
the issuer is entitled to receive a direct pay subsidy, or the bondholders are entitled to receive a federal
tax credit in lieu of interest.
Real (Constant) Dollars - An adjusted value of currency used to compare dollar values from one
period to another. Because of inflation, the purchasing power of the dollar changes over time, so in order
to compare dollar values across time periods, they can be converted from nominal (current) dollar
values to constant dollar values.

FY 2019 Proposed Budget and Financial Plan Glossary of Budget Terms
Appendix J-9
Reallocation - The modification of budget from one phase of a capital project to another. The total
budget for the project remains the same.
Redirections - The permanent shift of funds or positions within an agency.
Regular Pay - Continuing - Salary and wages for all continuing full-time employees.
Regular Pay - Other - Salary and wages for part-time, part-year, or temporary employees.
Reorganization - A change in the budget and reporting structures within an agency.
Reprogramming - Any budget modification for purposes other than those originally planned, which
results in an offsetting reallocation of budget authority from one budget category to another, or from one
capital project to another.
Request for Applications (RFA) - The document that describes the requirements for subgrant
applications.
Request for Proposals (RFP) - A solicitation document requesting from prospective contractors to
submit a business proposal with a detailed description of the manner in which they plan to achieve the
goals specified by the RFP, were they awarded a contract to do so. The plan usually includes the
proposer’s corporate and financial information, estimate of total cost, and required completion schedule.
Rescission - A legislative cancellation of budget authority previously approved by the Council and the
Congress.
Revenue Bond - A special type of municipal bond distinguished by its guarantee of repayment solely
from revenues generated by a specified revenue-generating entity or source associated with the purpose
of the bonds, rather than from general tax revenue.
Revenue - The annual income or receipts of the District from taxes, charges, grants, and investments.
Revenue Category - General types of revenue, such as taxes.
Revenue Class - Specific revenues, such as real property taxes.
Review Panel - A team of qualified individuals responsible for reviewing, scoring, and recommending
applicants for subgrant awards.
Revolving Fund - A fund that is replenished as amounts are used, either by additional appropriations or
by income/revenue from the programs the fund finances. Therefore, the fund retains a balance at all
times.
Service-Level Budgeting - The development of budgets at program level four in SOAR. This is one
level below the current level of budgeting for most agencies, which is at the activity level.
Short-Term Borrowing - A designation given to a debt obligation typically having maturities of three
to five years from issuance. As part of regular planned borrowing, the District will issue a
portion of its debt with specific maturities tied to the expected useful life of the asset being acquired, nor-
mally equipment and information technology assets. The program assists the District in its
asset/liability management by matching the useful life of the asset being financed with the amortization
of the debt liability.
Special Purpose Revenue - Funds used to account for proceeds derived from specific revenue sources
(other than expendable trusts, special assessments, or major capital projects) that are legally restricted to
expenditures for specified purposes. Formerly called O-type or other revenue, Special Purpose Revenue
is part of General Fund revenue.

Glossary of Budget Terms FY 2019 Proposed Budget and Financial Plan
Appendix J-10
Strategic Business Plan - A strategic business plan establishes and articulates the purpose, strategic
goals, operational organization, and performance expectations for an agency.
Strategic Goal – For purposes of business planning, a statement that describes in measurable terms the
significant results that an agency must accomplish over the next 2 to 5 years to respond to critical trends,
issues, and challenges.
Structural Balance - The degree to which revenues match expenditures over time.
Subgrant - The commitment of funds from a grant by a District government agency to a governmental
or private organization to support specific services and operations. See D.C. Municipal Regulations,
Title I, Chapter 50.
Subsidies and Transfers - The name of the object class used to allocate funds for a variety of public
welfare and support costs and to transfer funds to other organizations, such as the Washington
Metropolitan Area Transit Authority, providing services to District residents.
Supplemental Budget - An increase in the District’s budget during the course of the fiscal year, after the
budget has first been approved. After approval by Council and signature by the Mayor, a Supplemental
Budget must also go to Congress for review. Within certain limits, the District may implement a
Supplemental Budget after a 30-day review by Congress, if Congress does not disapprove it.
Supplies and Materials - The names of the budgetary object class used to allocate funds for
consumable materials.
System of Accounting and Reporting (SOAR) – The financial management system used by the District
as its official accounting system of record.
Tax Abatement - A decrease in the amount of tax an entity owes, as legislated by the Council. The abate-
ment could be in furtherance of an economic development strategy or to generally provide for tax relief.
For financial reporting purposes, such abatements result from an agreement between the District and an
individual or entity in which the District promises to forgo tax revenues and the individual or entity
promises to
subsequently take a specific action that contributes to economic development or otherwise benefits the
District or its citizens.
Tax Increment Financing - A method to pay for the costs of qualifying improvements necessary to
create new development or redevelopment. The financing of the qualifying improvements is paid from
increased property and/or sales taxes generated from the new development or redevelopment that would
not occur “but for” such assistance.
Tobacco Securitization - Securitization is a financing method whereby a party sells bonds backed by a
future stream of payments. With tobacco securitization, the future stream of payments is the periodic
payments tobacco companies will make as part of a settlement reached by the companies and various
states in 1998. The District received funds up front from the proceeds of the bond sale. The investors
receive principal and interest payments on their bonds from the tobacco companies’ payments.
Securitization shifts the risk that the tobacco companies will stop making settlement payments from the
government to private investors or insurers.
Trust and Agency Funds – Fiduciary funds that are used to account for assets held by the District in a
trustee capacity or as an agent for individuals, private organizations, and other governments.
Transfers - Reallocation of resources (funds or positions) among agencies or funds.
Unfunded Liabilities - Potential or actual debts for which no current funding is available.

FY 2019 Proposed Budget and Financial Plan Glossary of Budget Terms
Appendix J-11
Uniform Per Student Funding Formula (UPSFF) - Funding formula used by the District that
determines the annual appropriation of Local funds for the operation of D.C. Public Schools and D.C.
Public Charter Schools based on the number of students, the grade level, and other student
characteristics.
WAE (When-Actually-Employed) - A temporary appointment under which the employee serves on an
intermittent basis.
Weighted Student Formula (WSF) – Funding formula used by the D.C. Public School system to
annually fund each school. The formula is based on enrollment, grade level, special education needs, free
and reduced price lunch eligibility, and English as a Second Language characteristics.
Within-Grade (Step) Increase – A salary increase awarded to an employee based on longevity of
service and acceptable performance.


FY 2019 Local BudgetAct


_____________________1Chairman Phil Mendelson2
at the request of the Mayor34567
A BILL 8_________9
10IN THE COUNCIL OF THE DISTRICT OF COLUMBIA11
12__________________________________________13
1415
To adopt the local portion of the budget of the District of Columbia government for the fiscal 16year ending September 30, 2019.17
18BE IT ENACTED BY THE COUNCIL OF THE DISTRICT OF COLUMBIA, that this19
act may be cited as the “Fiscal Year 2019 Local Budget Act of 2018”.2021
Sec. 2. Adoption of the local portion of the Fiscal Year 2019 budget.22The following expenditure levels are approved and adopted as the local portion of the 23
budget for the government of the District of Columbia for the fiscal year ending September 30, 242019.25
26DISTRICT OF COLUMBIA BUDGET FOR THE FISCAL YEAR27
ENDING SEPTEMBER 30, 20192829
PART A--SUMMARY OF EXPENSES30The following amounts are appropriated for the District of Columbia government for the fiscal 31year ending September 30, 2019 (“Fiscal Year 2019”), out of the General Fund of the District of 32Columbia (“General Fund”), except as otherwise specifically provided; provided, that 33notwithstanding any other provision of law, except as provided in section 450A of the District of 34Columbia Home Rule Act, approved November 22, 2000 (114 Stat. 2440; D.C. Official Code §351-204.50a), and provisions of this act, the total amount appropriated in this act for operating36expenses for the District of Columbia for Fiscal Year 2019 shall not exceed the lesser of the sum 37of the total revenues of the District of Columbia for such fiscal year or $14,442,967,000 (of 38which $8,368,867,000 shall be from local funds (including $522,141,000 from dedicated taxes),39$1,021,919,000 shall be from Federal grant funds, $2,362,892,000 shall be from Medicaid 40payments, $701,071,000 shall be from other funds, $4,172,000 shall be from private funds,41$49,900,000 shall be from funds requested to be appropriated by the Congress as Federal 42payments pursuant to the Fiscal Year 2019 Federal Portion Budget Request Act of 2018, and 43$1,934,146,000 shall be from enterprise and other funds); provided further, that of the local 44funds, such amounts as may be necessary may be derived from the General Fund balance; 45provided further, that of these funds the intra-District authority shall be $711,068,000; in 46addition, for capital construction projects, an increase of $3,271,566,000 of which 47

2
$2,787,228,000 shall be from local funds, $650,000 shall be from private grant funds, 1$51,986,000 shall be from the Local Transportation Fund, $72,306,000 shall be from the District 2of Columbia Highway Trust Fund, and $359,396,000 shall be from Federal grant funds, and a 3rescission of $605,677,000 of which $431,173,000 shall be from local funds, $28,340,000 shall 4be from the Local Transportation Fund, $23,043,000 shall be from the District of Columbia 5Highway Trust Fund, and $123,122,000 shall be from Federal grant funds appropriated under 6this heading in prior fiscal years, for a net amount of $2,665,888,000, to remain available until 7expended; in addition, provided, that all funds provided by this act shall be available only for the 8specific projects and purposes intended; provided further, that amounts appropriated under this 9act may be increased by the amount transferred from funds appropriated in this act as Pay-10As-You-Go Capital funds; provided further, that amounts provided under this heading are to be 11available, allocated, and expended at the rates and subject to the provisions set forth under the 12heading “Division of Expenses”; provided further, that this amount may be increased by13proceeds of one-time transactions, which are expended for emergency or unanticipated operating14or capital needs; provided further, that such increases shall be approved by enactment of local 15District law and shall comply with all reserve requirements contained in the District of Columbia 16Home Rule Act, approved December 24, 1973 (87 Stat. 777; D.C. Official Code § 1-201.01 et 17seq.); provided further, that this amount may be further increased by such sums as may be 18necessary for making refunds and for the payment of legal settlements or judgments that have 19been entered against the District of Columbia government and such sums may be paid from the 20applicable or available funds of the District of Columbia; provided further, local funds are 21appropriated, without regard to fiscal year, in such amounts as may be necessary to pay vendor 22fees, including legal fees, that are obligated in this fiscal year, to be paid as a fixed percentage of 23District revenue recovered from third parties on behalf of the District under contracts that 24provided for payment of fees based upon and from such District revenue as may be recovered by 25the vendor; provided further, that amounts appropriated pursuant to this act as operating funds 26may be transferred to enterprise and capital funds and such amounts, once transferred, shall27retain appropriation authority consistent with the provisions of this act; provided further, that28there may be reprogrammed or transferred for operating expenses any local funds transferred or 29reprogrammed in this or the 4 prior fiscal years from operating funds to capital funds, and such 30amounts, once transferred or reprogrammed, shall retain appropriation authority consistent with 31the provisions of this act, except, that there may not be reprogrammed for operating expenses 32any funds derived from bonds, notes, or other obligations issued for capital projects; provided 33further, that the local funds (including dedicated tax) and other funds appropriated by this act 34may be reprogrammed and transferred as provided in subchapter IV of Chapter 3 of Title 47 of 35the District of Columbia Official Code, or as otherwise provided by law, through November 15,362019; provided further, during fiscal year 2019 and any subsequent fiscal year, notwithstanding 37any other provision of law, the District of Columbia may expend funds as necessary to pay 38capital and operating obligations created by the District of Columbia and the National Parks 39Service in annual or multi-year agreements to improve, maintain, operate, or manage National 40Parks located in the District of Columbia, and such sums may be paid from the applicable or 41available funds of the District of Columbia, which, once allocated, shall retain appropriation 42authority consistent with the provisions of this act, without any limitation as to amount, duration, 43or fiscal year; provided further, that local funds and other funds appropriated under this act may 44be expended by the Mayor for the purpose of providing food and beverages, not to exceed $3045per employee per day, to employees of the Government of the District of Columbia while such 46

3
employees are deployed in response to a declared snow emergency or other declared emergency1or severe weather event within the District of Columbia; provided further, that any unspent 2amount remaining in a non-lapsing Fund described in Part B at the end of a fiscal year is to be 3continually available, allocated, appropriated and expended for the purposes of such Fund 4without regard to fiscal year in addition to any amounts deposited in and appropriated to such 5Fund for a subsequent fiscal year; provided further, that there are appropriated any amounts 6deposited, or to be deposited, without regard to fiscal year, into the Washington Metropolitan 7Area Transit Authority (“WMATA”) Dedicated Funding Fund for the purpose of WMATA 8capital improvements which amounts shall not revert to the unrestricted fund balance of the 9General Fund of the District of Columbia at the end of a fiscal year or at any other time, but shall 10be continually available until expended for the designated purposes; provided further, that the 11Chief Financial Officer shall take such steps as are necessary to assure that the foregoing 12requirements are met, including the apportioning by the Chief Financial Officer of the 13appropriations and funds made available during Fiscal Year 2019.14
1516
PART B - - DIVISION OF EXPENSES1718
GOVERNMENTAL DIRECTION AND SUPPORT19Governmental direction and support, $862,623,000 (including $749,208,000 from local 20
funds (including $1,350,000 from dedicated taxes), $31,574,000 from Federal grant funds, 21$80,183,000 from other funds, and $1,657,000 from private funds): provided, that any program 22fees collected from the issuance of debt shall be available for the payment of expenses of the 23debt management program of the District, to be allocated as follows:24
(1) Council of the District of Columbia. - $26,359,000 from local funds; 25provided, that not to exceed $25,000 shall be available for the Chairman from this appropriation 26for official reception and representation expenses and for purposes consistent with section 26 of 27the Discretionary Funds Act of 1973, approved October 26, 1973 (87 Stat. 509; D.C. Official 28Code § 1-333.10); provided, that all funds deposited, without regard to fiscal year, into the 29Council Technology Projects Fund are authorized for expenditure and shall remain available for 30expenditure until September 30, 2019;31
(2) Office of the District of Columbia Auditor. - $5,333,000 from local funds;32(3) Office of Advisory Neighborhood Commissions. - $1,131,000 from local 33
funds; provided, that all funds deposited, without regard to fiscal year, into the Agency Fund are 34authorized for expenditure and shall remain available for expenditure until September 30, 2019;35
(4) Uniform Law Commission. - $60,000 from local funds;36(5) Office of the Mayor. - $14,783,000 (including $10,700,000 from local 37
funds and $4,083,000 from Federal grant funds); provided, that not to exceed $25,000 of such 38amount, from local funds, shall be available for the Mayor for official reception and 39representation expenses and for purposes consistent with section 26 of the Discretionary Funds 40Act of 1973, approved October 26, 1973 (87 Stat. 509; D.C. Official Code § 1-333.10); provided41further, that all funds deposited, without regard to fiscal year, into the Emancipation Day Fund 42are authorized for expenditure and shall remain available for expenditure until September 30, 432019;44
(6) Mayor’s Office of Legal Counsel. - $1,634,000 from local funds;45(7) Office of the Senior Advisor. - $3,219,000 from local funds;46

4
(8) Office of the Secretary. - $4,157,000 (including $3,057,000 from local 1funds and $1,100,000 from other funds);2
(9) Office of the City Administrator. - $10,028,000 (including $8,669,000 from 3local funds, $250,000 from other funds, and $1,109,000 from private funds); provided, that not to 4exceed $10,600 of such amount, from local funds, shall be available for the City Administrator 5for official reception and representation expenses and for purposes consistent with section 26 of 6the Discretionary Funds Act of 1973, approved October 26, 1973 (87 Stat. 509; D.C. Official 7Code § 1-333.10);8
(10) Office of the Deputy Mayor for Greater Economic Opportunity. -9$3,712,000 from local funds;10
(11) Office of Risk Management. - $4,102,000 from local funds;11(12) Department of Human Resources. - $9,428,000 (including $8,866,00012
from local funds and $561,000 from other funds);13(13) Office of Disability Rights. - $1,771,000 (including $1,133,000 from local 14
funds and $638,000 from Federal grant funds);15(14) Captive Insurance Agency. - $2,306,000 (including $2,095,000 from local16
funds and $211,000 from other funds); provided, that all funds deposited, without regard to fiscal 17year, into the Agency Fund (Free Standing Clinics/Insurance Fund) are authorized for 18expenditure and shall remain available for expenditure until September 30, 2019; provided 19further, that all funds deposited, without regard to fiscal year, into the Captive Insurance Fund20are authorized for expenditure and shall remain available for expenditure until September 30,212019;22
(15) Office of Finance and Resource Management. - $27,595,000 (including23$27,123,000 from local funds and $472,000 from other funds);24
(16) Office of Contracting and Procurement. - $24,945,000 (including25$23,393,000 from local funds and $1,552,000 from other funds);26
(17) Office of the Chief Technology Officer. - $81,444,000 (including27$71,349,000 from local funds and $10,095,000 from other funds); provided, that all funds 28deposited, without regard to fiscal year, into the DC-NET Services Support Fund are authorized 29for expenditure and shall remain available for expenditure until September 30, 2019;30
(18) Department of General Services. - $317,780,000 (including $309,403,00031from local funds (including $1,350,000 of dedicated taxes), and $8,377,000 from other funds); 32provided, that all funds deposited, without regard to fiscal year, into the Eastern Market 33Enterprise Fund are authorized for expenditure and shall remain available for expenditure until 34September 30, 2019; provided further, that all funds deposited, without regard to fiscal year, into 35the West End Library/Firehouse Maintenance Fund are authorized for expenditure and shall 36remain available for expenditure until September 30, 2019;37
(19) Contract Appeals Board. - $1,556,000 from local funds;38(20) Board of Elections. - $10,489,000 from local funds;39(21) Office of Campaign Finance. - $3,847,000 from local funds; provided, that 40
all funds deposited, without regard to fiscal year, into the Fair Elections Fund are authorized for 41expenditure and shall remain available for expenditure until September 30, 2019;42
(22) Public Employee Relations Board. - $1,509,000 from local funds;43(23) Office of Employee Appeals. - $1,940,000 from local funds;44(24) Metropolitan Washington Council of Governments. - $542,000 from local45
funds;46

5
(25) Office of the Attorney General for the District of Columbia. -1$102,794,000 (including $65,842,000 from local funds, $23,583,000 from Federal grant funds, 2$12,819,000 from other funds, and $548,000 from private funds); provided, that not to exceed 3$10,600 of such amount, from local funds, shall be available for the Attorney General for official 4reception and representation expenses; provided further, that all funds deposited, without regard 5to fiscal year, into the Child SPT-TANF/AFDC Collections Fund are authorized for expenditure 6and shall remain available for expenditure until September 30, 2019; provided further, that all 7funds deposited, without regard to fiscal year, into the Child SPT-Reimbursements and Fees 8Fund are authorized for expenditure and shall remain available for expenditure until September 930, 2019; provided further, that all funds deposited, without regard to fiscal year, into the Child 10SPT-Interest Income Fund are authorized for expenditure and shall remain available for 11expenditure until September 30, 2019; provided further, that all funds deposited, without regard 12to fiscal year, into the Drug-, Firearm-, or Prostitution-Related Nuisance Abatement Fund are 13authorized for expenditure and shall remain available for expenditure until September 30, 2019; 14provided further, that all funds deposited, without regard to fiscal year, into the Litigation 15Support Fund are authorized for expenditure and shall remain available for expenditure until 16September 30, 2019;17
(26) D.C. Board of Ethics and Government Accountability. - $2,366,00018(including $2,214,000 from local funds and $153,000 from other funds); provided, that all funds 19deposited, without regard to fiscal year, into the Lobbyist Administration and Enforcement Fund 20are authorized for expenditure and shall remain available for expenditure until September 30, 212019; provided further, that all funds deposited, without regard to fiscal year, into the Board of 22Ethics and Government Accountability Fund are authorized for expenditure and shall remain 23available for expenditure until September 30, 2019;24
(27) Statehood Initiatives - $242,000 from local funds; provided, that all funds 25deposited, without regard to fiscal year, into the New Columbia Statehood Fund are authorized 26for expenditure and shall remain available for expenditure until September 30, 2019;27
(28) Office of the Inspector General. - $18,763,000 (including $15,943,00028from local funds and $2,820,000 from Federal grant funds); provided, that all funds deposited, 29without regard to fiscal year, into the Office of the Inspector General Operational Projects Fund 30are authorized for expenditure and shall remain available for expenditure until September 30, 312019; and32
(29) Office of the Chief Financial Officer. - $178,789,000 (including33$133,746,000 from local funds, $450,000 from Federal grant funds, and $44,593,000 from other 34funds); provided, that not to exceed $10,600 of such amount, from local funds, shall be available 35for the Chief Financial Officer for official reception and representation expenses; provided 36further, that amounts appropriated by this act may be increased by the amount required to pay 37banking fees for maintaining the funds of the District of Columbia; provided further, that all 38funds deposited, without regard to fiscal year, into the OFT Central Collection Unit Fund are 39authorized for expenditure and shall remain available for expenditure until September 30, 2019;40provided further, that all funds deposited, without regard to fiscal year, into the Recorder of 41Deeds Surcharge Fund are authorized for expenditure and shall remain available for expenditure 42until September 30, 2019.43
44ECONOMIC DEVELOPMENT AND REGULATION45
Economic development and regulation, $666,437,000 (including $347,581,000 from local 46

6
funds (including $1,292,000 from dedicated taxes), $87,287,000 from Federal grant funds,1$230,731,000 from other funds, and $839,000 from private funds), to be allocated as follows:2
(1) Office of the Deputy Mayor for Planning and Economic Development. -3$41,402,000 (including $20,583,000 from local funds and $20,819,000 from other funds); 4provided, that all funds deposited, without regard to fiscal year, into the Industrial Revenue Bond 5program are authorized for expenditure and shall remain available for expenditure until 6September 30, 2019; provided further, that all funds deposited, without regard to fiscal year, into 7the H Street Retail Priority Area Grant Fund are authorized for expenditure and shall remain 8available for expenditure until September 30, 2019; provided further, that all funds deposited, 9without regard to fiscal year, into the Soccer Stadium Financing Fund are authorized for 10expenditure and shall remain available for expenditure until September 30, 2019; provided 11further, that all funds deposited, without regard to fiscal year, into the Economic Development 12Special Account are authorized for expenditure and shall remain available for expenditure until 13September 30, 2019; provided further, that all funds deposited, without regard to fiscal year, into 14the Walter Reed Redevelopment Fund are authorized for expenditure and shall remain available 15for expenditure until September 30, 2019; provided further, that all funds deposited, without 16regard to fiscal year, into the Walter Reed Reinvestment Fund are authorized for expenditure and 17shall remain available for expenditure until September 30, 2019; provided further, that all funds 18deposited, without regard to fiscal year, into the St. Elizabeths East Campus Redevelopment 19Fund are authorized for expenditure and shall remain available for expenditure until September 2030, 2019;21
(2) Office of Planning. - $10,988,000 (including $10,231,000 from local funds,22$547,000 from Federal grant funds, $200,000 from other funds, and $10,000 from private funds); 23provided, that all funds deposited, without regard to fiscal year, into the Historic Landmark and 24Historic District Filing Fees (Local) Fund are authorized for expenditure and shall remain 25available for expenditure until September 30, 2019; provided further, that all funds deposited, 26without regard to fiscal year, into the Historical Landmark and Historic District Filing Fees (O-27Type) Fund are authorized for expenditure and shall remain available for expenditure until 28September 30, 2019;29
(3) Department of Small and Local Business Development. - $14,394,00030(including $13,925,000 from local funds and $468,000 from Federal grant funds); provided, that 31all funds deposited, without regard to fiscal year, into the Small Business Capital Access Fund32are authorized for expenditure and shall remain available for expenditure until September 30, 332019; provided further, that all funds deposited, without regard to fiscal year, into the Streetscape 34Loan Relief Fund are authorized for expenditure and shall remain available for expenditure until 35September 30, 2019;36
(4) Office of Cable Television, Film, Music, and Entertainment. - $14,678,00037(including $1,690,000 from local funds and $12,988,000 from other funds); provided, that all 38funds deposited, without regard to fiscal year, into the Film, Television and Entertainment 39Rebate Fund are authorized for expenditure and shall remain available for expenditure until40September 30, 2019; provided further, that all funds deposited, without regard to fiscal year, into41the Cable Franchise Fees Fund are authorized for expenditure and shall remain available for 42expenditure until September 30, 2019;43
(5) Office of Zoning. - $3,117,000 from local funds;44(6) Department of Housing and Community Development. - $91,369,00045
(including $31,885,000 from local funds, $55,830,000 from Federal grant funds, $3,634,00046

7
from other funds, and $20,000 from private funds); provided, that all funds deposited, without 1regard to fiscal year, into the Compensation Units 1 and 2 Affordable Housing Fund are2authorized for expenditure and shall remain available for expenditure until September 30, 2019;3provided further, that all funds deposited, without regard to fiscal year, into the Department of 4Housing and Community Development Unified Fund are authorized for expenditure and shall 5remain available for expenditure until September 30, 2019; provided further, that all funds 6deposited, without regard to fiscal year, into the Land Acquisition for Housing Development 7Opportunities (LAHDO) Fund are authorized for expenditure and shall remain available for 8expenditure until September 30, 2019; provided further, that all funds deposited, without regard 9to fiscal year, into the RLF Escrow Fund are authorized for expenditure and shall remain 10available for expenditure until September 30, 2019; provided further, that all funds deposited, 11without regard to fiscal year, into the Rehab Repay Fund are authorized for expenditure and shall 12remain available for expenditure until September 30, 2019; provided further, that all funds 13deposited, without regard to fiscal year, into the Home Again Revolving Fund are authorized for 14expenditure and shall remain available for expenditure until September 30, 2019; provided 15further, that all funds deposited, without regard to fiscal year, into the Home Purchase Assistance 16Program-Repay Fund are authorized for expenditure and shall remain available for expenditure 17until September 30, 2019; provided further, that all funds deposited, without regard to fiscal year, 18into the Housing Preservation Fund are authorized for expenditure and shall remain available for 19expenditure until September 30, 2019;20
(7) Department of Employment Services. - $140,331,000 (including 21$70,106,000 from local funds, $29,876,000 from Federal grant funds, $39,561,000 from other 22funds, and $787,000 from private funds); provided, that all funds deposited, without regard to 23fiscal year, into the Workers’ Compensation Administration Fund are authorized for expenditure 24and shall remain available for expenditure until September 30, 2019; provided further, that all 25funds deposited, without regard to fiscal year, into the Unemployment Insurance Administrative 26Assessment Tax Fund are authorized for expenditure and shall remain available for expenditure 27until September 30, 2019; provided further, that all funds deposited, without regard to fiscal year, 28into the Unemployment Insurance Interest/Penalties Fund are authorized for expenditure and 29shall remain available for expenditure until September 30, 2019; provided further, that all funds 30deposited, without regard to fiscal year, into the Workers’ Compensation Special Fund are 31authorized for expenditure and shall remain available for expenditure until September 30, 2019;32provided further, that all funds deposited, without regard to fiscal year, into the Reed Act Fund 33are authorized for expenditure and shall remain available for expenditure until September 30, 342019;35
(8) Real Property Tax Appeals Commission. - $1,763,000 from local funds;36(9) Department of Consumer and Regulatory Affairs. - $60,378,000 (including37
$23,264,000 from local funds and $37,114,000 from other funds); provided, that all funds 38deposited, without regard to fiscal year, into the Basic Business License Fund are authorized for 39expenditure and shall remain available for expenditure until September 30, 2019; provided 40further, that all funds deposited, without regard to fiscal year, into the Green Building Fund are 41authorized for expenditure and shall remain available for expenditure until September 30, 2019;42provided further, that all funds deposited, without regard to fiscal year, into the Real Estate 43Guaranty and Education Fund are authorized for expenditure and shall remain available for 44expenditure until September 30, 2019; provided further, that all funds deposited, without regard 45to fiscal year, into the Nuisance Abatement Fund are authorized for expenditure and shall remain 46

8
available for expenditure until September 30, 2019; provided further, that all funds deposited, 1without regard to fiscal year, into the Occupational and Professional Licensing Administration -2Special Account are authorized for expenditure and shall remain available for expenditure until 3September 30, 2019; provided further, that all funds deposited, without regard to fiscal year, into 4the Board of Engineers Fund are authorized for expenditure and shall remain available for 5expenditure until September 30, 2019; provided further, that all funds deposited, without regard 6to fiscal year, into the Corporate Recordation Fund are authorized for expenditure and shall 7remain available for expenditure until September 30, 2019; provided further, that all funds 8deposited, without regard to fiscal year, into the Re-Appraisal Fee Fund are authorized for 9expenditure and shall remain available for expenditure until September 30, 2019; provided 10further, that all funds deposited, without regard to fiscal year, into the Vending Regulation Fund 11are authorized for expenditure and shall remain available for expenditure until September 30, 122019; provided further, that all funds deposited, without regard to fiscal year, into the Expedited 13Building Permit Review Program Fund are authorized for expenditure and shall remain available 14for expenditure until September 30, 2019;15
(10) Office of the Tenant Advocate. - $3,637,000 (including $3,128,000 from 16local funds and $509,000 from other funds);17
(11) Commission on the Arts and Humanities. - $30,764,000 (including18$30,565,000 from local funds and $199,000 from other funds), provided that grant funding is 19competitively awarded to nonprofit fine and performing arts organizations based in and primarily 20serving the District; provided further, that all funds deposited, without regard to fiscal year, into 21the Arts and Humanities Enterprise Fund are authorized for expenditure and shall remain 22available for expenditure until September 30, 2019; provided further, that funds in the Arts and 23Humanities Enterprise Fund may be obligated in Fiscal Year 2019, pursuant to grant awards,24through September 30, 2022, and that such funds, so obligated are authorized for expenditure 25and shall remain available for expenditure until September 30, 2022;26
(12) Alcoholic Beverage Regulation Administration. - $9,299,000 (including27$1,292,000 from local funds (including $1,292,000 from dedicated taxes) and $8,007,000 from 28other funds); provided, that all funds deposited, without regard to fiscal year, into the 29ABC-Import and Class License Fees Fund are authorized for expenditure and shall remain 30available for expenditure until September 30, 2019; provided further, that all funds deposited, 31without regard to fiscal year, into the Dedicated Taxes Fund are authorized for expenditure and 32shall remain available for expenditure until September 30, 2019;33
(13) Public Service Commission. - $15,751,000 (including $566,000 from 34Federal grant funds, $15,163,000 from other funds, and $22,000 from private funds); provided, 35that all funds deposited, without regard to fiscal year, into the Operating-Utility Assessment 36Fund are authorized for expenditure and shall remain available for expenditure until September 3730, 2019; provided further, that all funds deposited, without regard to fiscal year, into the PJM 38Settlement Fund are authorized for expenditure and shall remain available for expenditure until 39September 30, 2019;40
(14) Office of the People’s Counsel. - $8,971,000 from other funds; provided, 41that all funds deposited, without regard to fiscal year, into the Advocate for Consumers Fund are 42authorized for expenditure and shall remain available for expenditure until September 30, 2019;43
(15) Department of Insurance, Securities, and Banking. - $28,565,000 from 44other funds; provided, that all funds deposited, without regard to fiscal year, into the Insurance 45Regulatory Trust Fund are authorized for expenditure and shall remain available for expenditure 46

9
until September 30, 2019; provided further, that all funds deposited, without regard to fiscal year, 1into the Foreclosure Mediation Fund are authorized for expenditure and shall remain available2for expenditure until September 30, 2019; provided further, that all funds deposited, without3regard to fiscal year, into the Capital Access Fund are authorized for expenditure and shall 4remain available for expenditure until September 30, 2019;5
(16) Housing Authority Subsidy. - $96,696,000 from local funds; provided, that 6all funds deposited, without regard to fiscal year, into the DCHA Rehabilitation and Maintenance 7Fund are authorized for expenditure and shall remain available for expenditure until September 830, 2019;9
(17) Housing Production Trust Fund Subsidy. - $39,335,000 from local funds;10and11
(18) Business Improvement Districts Transfer. - $55,000,000 from other funds.1213
PUBLIC SAFETY AND JUSTICE14Public safety and justice, $1,348,357,000 (including $1,135,270,000 from local funds,15
$162,626,000 from Federal grant funds, $150,000 from Medicaid payments, $47,410,000 from 16other funds, $435,000 from Federal payment funds requested to be appropriated by the Congress 17under the heading “Federal Payment for the District of Columbia National Guard” in the Fiscal 18Year 2019 Federal Portion Budget Request Act of 2018, $1,900,000 from Federal payment funds 19requested to be appropriated by the Congress under the heading “Federal Payment to the20Criminal Justice Coordinating Council” in the Fiscal Year 2019 Federal Portion Budget Request21Act of 2018, and $565,000 from Federal payment funds requested to be appropriated by the 22Congress under the heading “Federal Payment for Judicial Commissions” in the Fiscal Year 232019 Federal Portion Budget Request Act of 2018), to be allocated as follows:24
(1) Metropolitan Police Department. - $522,337,000 (including $510,230,00025from local funds, $3,907,000 from Federal grant funds, and $8,200,000 from other funds); 26provided, that all funds deposited, without regard to fiscal year, into the Asset Forfeiture Fund 27are authorized for expenditure and shall remain available for expenditure until September 30, 282019;29
(2) Fire and Emergency Medical Services Department. - $257,209,00030(including $255,447,000 from local funds and $1,762,000 from other funds); provided, that all 31funds deposited, without regard to fiscal year, into the Fire and Emergency Medical Services 32Department EMS Reform Fund are authorized for expenditure and shall remain available for 33expenditure until September 30, 2019;34
(3) Police Officers’ and Firefighters’ Retirement System. - $91,284,000 from35local funds;36
(4) Department of Corrections. - $165,814,000 (including $144,794,000 from37local funds and $21,020,000 from other funds); provided, that all funds deposited, without regard 38to fiscal year, into the Correction Trustee Reimbursement Fund are authorized for expenditure 39and shall remain available for expenditure until September 30, 2019; provided further, that all 40funds deposited, without regard to fiscal year, into the Welfare Account are authorized for 41expenditure and shall remain available for expenditure until September 30, 2019; provided 42further, that all funds deposited, without regard to fiscal year, into the Correction43Reimbursement-Juveniles Fund are authorized for expenditure and shall remain available for44expenditure until September 30, 2019;45
(5) District of Columbia National Guard. - $14,425,000 (including $4,810,000 46

10
from local funds, $9,179,000 from Federal grant funds, and $435,000 from Federal payment 1funds requested to be appropriated by the Congress under the heading “Federal Payment for the 2District of Columbia National Guard” in the Fiscal Year 2019 Federal Portion Budget Request3Act of 2018); provided, that the Mayor shall reimburse the District of Columbia National Guard 4for expenses incurred in connection with services that are performed in emergencies by the 5National Guard in a militia status and are requested by the Mayor, in amounts that shall be 6jointly determined and certified as due and payable for these services by the Mayor and the 7Commanding General of the District of Columbia National Guard; provided further, that such 8sums as may be necessary for reimbursement to the District of Columbia National Guard under9the preceding proviso shall be available pursuant to this act, and the availability of the sums shall10be deemed as constituting payment in advance for emergency services involved;11
(6) Homeland Security and Emergency Management Agency. - $142,172,00012(including $5,103,000 from local funds and $137,069,000 from Federal grant funds);13
(7) Commission on Judicial Disabilities and Tenure. - $295,000 from Federal 14payment funds requested to be appropriated by the Congress under the heading “Federal15Payment for Judicial Commissions” in the Fiscal Year 2019 Federal Portion Budget Request Act 16of 2018;17
(8) Judicial Nomination Commission. - $270,000 from Federal payment funds18requested to be appropriated by the Congress under the heading “Federal Payment for Judicial 19Commissions” in the Fiscal Year 2019 Federal Portion Budget Request Act of 2018;20
(9) Office of Police Complaints. - $2,538,000 from local funds;21(10) District of Columbia Sentencing Commission. - $1,186,000 from local22
funds;23(11) Criminal Code Reform Commission. - $724,000 from local funds;24(12) Office of Neighborhood Safety and Engagement. - $4,731,000 from local 25
funds, provided, that all funds deposited, without regard to fiscal year, into the Public Fund for 26Drug Prevention and Children at Risk are authorized for expenditure and shall remain available 27for expenditure until September 30, 2019; provided further, that all funds deposited, without 28regard to fiscal year, into the Neighborhood Safety and Engagement Fund are authorized for 29expenditure and shall remain available for expenditure until September 30, 2019;30
(13) Office of the Chief Medical Examiner. - $12,154,000 from local funds;31(14) Office of Administrative Hearings. - $10,285,000 (including $10,135,00032
from local funds and $150,000 from Medicaid payments);33(15) Criminal Justice Coordinating Council. - $3,068,000 (including34
$1,018,000 from local funds, $150,000 from Federal grant funds, and $1,900,000 from Federal 35payment funds requested to be appropriated by the Congress under the heading “Federal 36Payment to the Criminal Justice Coordinating Council” in the Fiscal Year 2019 Federal Portion 37Budget Request Act of 2018);38
(16) Office of Unified Communications. - $48,145,000 (including $33,948,00039from local funds, and $14,197,000 from other funds); provided, that all funds deposited, without 40regard to fiscal year, into the Emergency and Non-Emergency Number Telephone Calling 41Systems Fund are authorized for expenditure and shall remain available for expenditure until 42September 30, 2019;43
(17) Department of Forensic Sciences. - $26,561,000 (including $26,101,00044from local funds and $460,000 from Federal grant funds); provided, that all funds deposited, 45without regard to fiscal year, into the DFS Laboratory Fund are authorized for expenditure and 46

11
shall remain available for expenditure until September 30, 2019;1(18) Corrections Information Council. - $646,000 from local funds;2(19) Office of Victim Services and Justice Grants. - $42,916,000 (including 3
$28,824,000 from local funds, $11,862,000 from Federal grant funds, and $2,231,000 from other 4funds); provided, that $5,027,835 shall be made available to award a grant to the District of 5Columbia Bar Foundation for the purpose of providing support to nonprofit organizations that 6deliver civil legal services to low-income and under-served District residents of which not less 7than $200,000 shall be available to fund the District of Columbia Poverty Lawyer Loan 8Repayment Assistance Program, established by section 401 of the Access to Justice Initiative 9Amendment Act of 2011, effective September 14, 2011 (D.C. Law 19-21; D.C. Official Code § 104-1704.01); provided further, that all funds deposited, without regard to fiscal year, into the 11Crime Victims Assistance Fund are authorized for expenditure and shall remain available for 12expenditure until September 30, 2019; provided further, that all funds deposited, without regard 13to fiscal year, into the Domestic Violence Shelter and Transitional Housing Fund are authorized 14for expenditure and shall remain available for expenditure until September 30, 2019; provided 15further, that all funds deposited, without regard to fiscal year, into the Community-Based 16Violence Reduction Fund are authorized for expenditure and shall remain available for 17expenditure until September 30, 2019; provided further, that all funds deposited, without regard 18to fiscal year, into the Private Security Camera Incentive Fund are authorized for expenditure 19and shall remain available for expenditure until September 30, 2019; and20
(20) Office of the Deputy Mayor for Public Safety and Justice. - $1,596,00021from local funds.22
23PUBLIC EDUCATION SYSTEM24
Public education system, including the development of national-defense education 25programs, $2,612,140,000 (including $2,282,160,000 from local funds (including $4,676,00026from dedicated taxes), $278,205,000 from Federal grant funds, $21,113,000 from other funds,27$661,000 from private funds, and $30,000,000 from Federal payment funds requested to be 28appropriated by the Congress under the heading “Federal Payment for School Improvement” in 29the Fiscal Year 2019 Federal Portion Budget Request Act of 2018), to be allocated as follows:30
(1) District of Columbia Public Schools. - $888,583,000 (including 31$846,634,000 from local funds, $16,173,000 from Federal grant funds, $10,132,000 from other 32funds, $644,000 from private funds, and $15,000,000 from Federal payment funds requested to 33be appropriated by the Congress under the heading “Federal Payment for School Improvement”34in the Fiscal Year 2019 Federal Portion Budget Request Act of 2018); provided, that not to 35exceed $10,600 of such local funds shall be available for the Chancellor for official reception 36and representation expenses; provided further, that, notwithstanding the amounts otherwise 37provided under this heading or any other provision of law, there shall be appropriated to the 38District of Columbia Public Schools on July 1, 2019, an amount equal to 10 percent of the total 39amount of the local funds appropriations provided for the District of Columbia Public Schools in 40the proposed budget of the District of Columbia for Fiscal Year 2020 (as transmitted to 41Congress), and the amount of such payment shall be chargeable against the final amount 42provided for the District of Columbia Public Schools for Fiscal Year 2020; provided further, that 43all funds deposited, without regard to fiscal year, into the E-Rate Education Fund are authorized 44for expenditure and shall remain available for expenditure until September 30, 2019; provided 45further, that all funds deposited, without regard to fiscal year, into the ROTC Fund are authorized 46

12
for expenditure and shall remain available for expenditure until September 30, 2019; provided 1further, that all funds deposited, without regard to fiscal year, into the DHHS Afterschool 2Program-Copayment Fund are authorized for expenditure and shall remain available for 3expenditure until September 30, 2019; provided further, that all funds deposited, without regard 4to fiscal year, into the At-Risk Supplemental Allocation Preservation Fund are authorized for 5expenditure and shall remain available for expenditure until September 30, 2019; provided 6further, that all funds deposited, without regard to fiscal year, into the District of Columbia 7Public Schools Revenue Generation and Sponsorship Fund are authorized for expenditure and 8shall remain available for expenditure until September 30, 2019; provided further, that all funds 9deposited, without regard to fiscal year, into the District of Columbia Public Schools’ Nonprofit 10School Food Service Fund are authorized for expenditure and shall remain available for 11expenditure until September 30, 2019; provided further, that the District of Columbia Public 12Schools (“DCPS”) is authorized to spend appropriated funds to pay for DCPS-sponsored student 13travel, including the cost of transportation, lodging, meals, and admission fees for students and 14adult chaperones, to locations and venues outside DCPS facilities in accordance with rules 15promulgated by the Chancellor pursuant to section 105(c)(5) of the District of Columbia Public 16Education Reform Amendment Act of 2007, effective June 12, 2007 (D.C. Law 17-9; D.C. 17Official Code § 38-174(c)(5)); provided further, that such travel be related to the students’18curriculum or for the purpose of rewarding student curricular or extra-curricular achievement;19
(2) Teachers’ Retirement System. - $53,343,000 from local funds;20(3) Office of the State Superintendent of Education. - $443,183,000 (including21
$166,263,000 from local funds (including $4,676,000 from dedicated taxes), $260,919,000 from 22Federal grant funds, $1,001,000 from other funds, and $15,000,000 from Federal payment funds 23requested to be appropriated by the Congress under the heading “Federal Payment for School 24Improvement” in the Fiscal Year 2019 Federal Portion Budget Request Act of 2018); provided, 25that of the amounts provided to the Office of the State Superintendent of Education, $1,000,000 26from local funds shall remain available until June 30, 2019, for an audit of the student enrollment 27of each District of Columbia public school and of each District of Columbia public charter 28school; provided further, that all funds deposited, without regard to fiscal year, into the 29Blackman and Jones Consent Decree Fund are authorized for expenditure and shall remain 30available for expenditure until September 30, 2019; provided further, that all funds deposited, 31without regard to fiscal year, into the Charter School Credit Enhancement Fund are authorized 32for expenditure and shall remain available for expenditure until September 30, 2019; provided 33further, that all funds deposited, without regard to fiscal year, into the Student Residency 34Verification Fund are authorized for expenditure and shall remain available for expenditure until 35September 30, 2019; provided further, that all funds deposited, without regard to fiscal year, into 36the Community Schools Fund are authorized for expenditure and shall remain available for 37expenditure until September 30, 2019; provided further, that all funds deposited, without regard 38to fiscal year, into the Special Education Enhancement Fund are authorized for expenditure and 39shall remain available for expenditure until September 30, 2019; provided further, that all funds 40deposited, without regard to fiscal year, into the Child Development Facilities Fund are 41authorized for expenditure and shall remain available for expenditure until September 30, 2019;42provided further, that all funds deposited, without regard to fiscal year, into the Healthy Schools 43Fund are authorized for expenditure until September 30, 2019; provided further, that all funds 44deposited, without regard to fiscal year, into the Healthy Tots Fund are authorized for 45expenditure until September 30, 2019;46

13
(4) District of Columbia Public Charter Schools. - $891,905,000 from local1funds; provided, that there shall be quarterly disbursement of funds to the District of Columbia 2public charter schools, with the first payment to occur within 15 days of the beginning of the 3fiscal year; provided further, that if the entirety of this allocation has not been provided as 4payments to any public charter schools currently in operation through the per pupil funding 5formula, the funds shall remain available for expenditure until September 30, 2019 for public 6education in accordance with section 2403(b)(2) of the District of Columbia School Reform Act 7of 1995, approved April 26, 1996 (110 Stat. 1321; D.C. Official Code § 38-1804.03(b)(2)); 8provided further, that of the amounts made available to District of Columbia public charter 9schools, $230,000 shall be made available to the Office of the Chief Financial Officer as 10authorized by section 2403(b)(6) of the District of Columbia School Reform Act of 1995, 11approved April 26, 1996 (110 Stat. 1321; D.C. Official Code § 38-1804.03(b)(6)); provided 12further, that, notwithstanding the amounts otherwise provided under this heading or any other 13provision of law, there shall be appropriated to the District of Columbia public charter schools on 14July 1, 2019, an amount equal to 35 percent, or for new charter school Local Education Agencies 15that opened for the first time after December 31, 2018, an amount equal to 45 percent, of the 16total amount of the local funds appropriations provided for payments to public charter schools in 17the proposed budget of the District of Columbia for Fiscal Year 2020 (as transmitted to 18Congress), and the amount of such payment shall be chargeable against the final amount 19provided for such payments for Fiscal Year 2020; provided further, that the annual financial 20audit for the performance of an individual District of Columbia public charter school shall be 21funded by the charter school;22
(5) University of the District of Columbia Subsidy Account. - $87,168,00023from local funds; provided, that this appropriation shall not be available to subsidize the 24education of nonresidents of the District at the University of the District of Columbia, unless the 25Board of Trustees of the University of the District of Columbia adopts, for the fiscal year ending 26September 30, 2019, a tuition-rate schedule that establishes the tuition rate for nonresident 27students at a level no lower than the nonresident tuition rate charged at comparable public 28institutions of higher education in the metropolitan area; provided further, that, notwithstanding 29the amounts otherwise provided under this heading or any other provision of law, there shall be30appropriated to the University of the District of Columbia on July 1, 2019, an amount equal to 10 31percent of the total amount of the local funds appropriations provided for the University of the 32District of Columbia in the proposed budget of the District of Columbia for Fiscal Year 2020 (as 33transmitted to Congress), and the amount of such payment shall be chargeable against the final 34amount provided for the University of the District of Columbia for Fiscal Year 2020; provided 35further, that not to exceed $10,600 of the amount provided for the University of the District of 36Columbia Subsidy Account shall be available for the President of the University of the District37of Columbia for official reception and representation expenses;38
(6) District of Columbia Public Library. - $63,187,000 (including $60,701,000 39from local funds, $1,113,000 from Federal grant funds, $1,356,000 from other funds, and 40$17,000 from private funds); provided, that not to exceed $8,500 of such amount, from local 41funds, shall be available for the Public Librarian for official reception and representation 42expenses; provided further, that all funds deposited, without regard to fiscal year, into the Copies 43and Printing Fund are authorized for expenditure and shall remain available for expenditure until 44September 30, 2019; provided further, that all funds deposited, without regard to fiscal year, into 45the SLD E-Rate Reimbursement Fund are authorized for expenditure and shall remain available 46

14
for expenditure until September 30, 2019; provided further, that all funds deposited, without 1regard to fiscal year, into the Library Collections Account are authorized for expenditure and 2shall remain available for expenditure until September 30, 2019;3
(7) District of Columbia Public Charter School Board. - $8,525,000 from other4funds;5
(8) Non-Public Tuition. - $67,000,000 from local funds;6(9) Special Education Transportation. - $90,090,000 from local funds; 7
provided, that, notwithstanding the amounts otherwise provided under this heading or any other 8provision of law, there shall be appropriated to the Special Education Transportation agency 9under the direction of the Office of the State Superintendent of Education, on July 1, 2019, an 10amount equal to 10 percent of the total amount of the local funds appropriations provided for the 11Special Education Transportation agency in the proposed budget for the District of Columbia for 12Fiscal Year 2020 (as transmitted to Congress), and the amount of such payment shall be 13chargeable against the final amount provided for the Special Education Transportation agency 14for Fiscal Year 2020; provided further, that amounts appropriated under this paragraph may be 15used to offer financial incentives as necessary to reduce the number of routes serving 2 or fewer 16students;17
(10) State Board of Education. - $1,750,000 from local funds; 18(11) District of Columbia State Athletics Commission. - $1,289,000 (including 19
$1,189,000 from local funds and $100,000 in other funds); provided, that all funds deposited, 20without regard to fiscal year, into the State Athletic Acts Program and Office Fund are 21authorized for expenditure and shall remain available for expenditure until September 30, 2019; 22and23
(12) Office of the Deputy Mayor for Education. - $16,116,000 from local 24funds; provided, that all funds deposited, without regard to fiscal year, into the Common Lottery 25Board Fund are authorized for expenditure and shall remain available for expenditure until 26September 30, 2019.27
28HUMAN SUPPORT SERVICES29
Human support services, $4,907,047,000 (including $2,088,835,000 from local funds 30(including $67,527,000 from dedicated taxes), $404,708,000 from Federal grant funds,31$2,362,742,000 from Medicaid payments, $44,839,000 from other funds, $923,000 from private 32funds, and $5,000,000 from Federal payment funds requested to be appropriated by the Congress 33under the heading “Federal Payment for Testing and Treatment of HIV/AIDS” in the Fiscal Year 342019 Federal Portion Budget Request Act of 2018); to be allocated as follows:35
(1) Department of Human Services. - $554,320,000 (including $382,982,00036from local funds, $152,925,000 from Federal grant funds, $17,381,000 from Medicaid payments, 37and $1,032,000 from other funds); provided, that all funds deposited, without regard to fiscal38year, into the SSI Payback Fund are authorized for expenditure and shall remain available for39expenditure until September 30, 2019;40
(2) Child and Family Services Agency. - $222,446,000 (including $161,201,000 41from local funds, $60,223,000 from Federal grant funds, $1,000,000 from other funds, and42$23,000 from private funds);43
(3) Department of Behavioral Health. - $271,455,000 (including $251,519,00044from local funds, $14,831,000 from Federal grant funds, $2,024,000 from Medicaid payments,45$2,352,000 from other funds, and $730,000 from private funds); provided, that all funds46

15
deposited, without regard to fiscal year, into the Addiction Prevention and Recovery 1Administration-Choice in Drug Treatment (HCSN) Fund are authorized for expenditure and shall 2remain available for expenditure until September 30, 2019;3
(4) Department of Health. - $294,284,000 (including $80,782,000 from local 4funds, $135,965,000 from Federal grant funds, $27,395,000 from other funds, $142,000 from 5private funds, and $5,000,000 from Federal payment funds requested to be appropriated by the 6Congress under the heading “Federal Payment for Testing and Treatment of HIV/AIDS” in the 7Fiscal Year 2019 Federal Portion Budget Request Act of 2018); provided, that all funds 8deposited, without regard to fiscal year, into the Health Professional Recruitment Fund (Medical 9Loan Repayment) are authorized for expenditure and shall remain available for expenditure until 10September 30, 2019; provided further, that all funds deposited, without regard to fiscal year, into 11the Board of Medicine Fund are authorized for expenditure and shall remain available for 12expenditure until September 30, 2019; provided further, that all funds deposited, without regard 13to fiscal year, into the Pharmacy Protection Fund are authorized for expenditure and shall remain 14available for expenditure until September 30, 2019; provided further, that all funds deposited, 15without regard to fiscal year, into the SHPDA Fees Fund are authorized for expenditure and shall 16remain available for expenditure until September 30, 2019; provided further, that all funds 17deposited, without regard to fiscal year, into the Civic Monetary Penalties Fund are authorized 18for expenditure and shall remain available for expenditure until September 30, 2019; provided 19further, that all funds deposited, without regard to fiscal year, into the SHPDA Admission Fee 20Fund are authorized for expenditure and shall remain available for expenditure until September 2130, 2019; provided further, that all funds deposited, without regard to fiscal year, into the 22ICF/MR Fees and Fines are authorized for expenditure and shall remain available for 23expenditure until September 30, 2019; provided further, that all funds deposited, without regard 24to fiscal year, into the Human Services Facility Fee Fund are authorized for expenditure and shall 25remain available for expenditure until September 30, 2019; provided further, that all funds 26deposited, without regard to fiscal year, into the Communicable and Chronic Disease Prevention 27and Treatment Fund are authorized for expenditure and shall remain available for expenditure 28until September 30, 2019; provided further, that all funds deposited, without regard to fiscal year, 29into the Medical Marijuana Program Fund are authorized for expenditure and shall remain 30available for expenditure until September 30, 2019;31
(5) Department of Parks and Recreation. - $53,439,000 (including $50,639,000 32from local funds and $2,800,000 from other funds); provided, that all funds deposited, without 33regard to fiscal year, into the Department of Recreation Enterprise Fund are authorized for 34expenditure and shall remain available for expenditure until September 30, 2019;35
(6) Office on Aging. - $47,753,000 (including $37,958,000 from local funds,36$7,043,000 from Federal grant funds, and $2,752,000 from Medicaid payments);37
(7) Unemployment Compensation Fund. - $6,680,000 from local funds;38(8) Employees’ Compensation Fund. - $24,132,000 from local funds; provided, 39
that all funds deposited, without regard to fiscal year, into the Workers’ Compensation 40Rev-Settlement Fund are authorized for expenditure and shall remain available for expenditure 41until September 30, 2019; provided further, that all funds deposited, without regard to fiscal year, 42into the Agency Fund are authorized for expenditure and shall remain available for expenditure 43until September 30, 2019;44
(9) Office of Human Rights. - $5,105,000 (including $4,738,000 from local 45funds, $339,000 from Federal grant funds, and $27,000 from private funds);46

16
(10) Mayor’s Office on Latino Affairs. - $3,804,000 from local funds;1(11) Office on Asian and Pacific Islander Affairs. - $872,000 from local funds;2(12) Office of Veterans’ Affairs. - $546,000 (including $541,000 from local 3
funds and $5,000 from other funds); provided, that all funds deposited, without regard to fiscal 4year, into the Office of Veterans Affairs Fund are authorized for expenditure and shall remain 5available for expenditure until September 30, 2019;6
(13) Department of Youth Rehabilitation Services. - $96,570,000 from local7funds; provided, that of the local funds appropriated for the Department of Youth Rehabilitation 8Services, $12,000 shall be used to fund the requirements of the Interstate Compact for Juveniles;9
(14) Department of Disability Services. - $172,993,000 (including $123,842,00010from local funds, $31,062,000 from Federal grant funds, $10,789,000 from Medicaid payments,11and $7,300,000 from other funds); provided that all funds deposited, without regard to fiscal 12year, into the Randolph Shepherd Unassigned Facilities Fund are authorized for expenditure and 13shall remain available for expenditure until September 30, 2019; provided further, that all funds 14deposited, without regard to fiscal year, into the Cost of Care-Non-Medicaid Clients Fund are 15authorized for expenditure and shall remain available for expenditure until September 30, 2019;16provided further, that all funds deposited, without regard to fiscal year, into the Contribution to 17Costs of Supports Fund are authorized for expenditure and shall remain available for expenditure 18until September 30, 2019;19
(15) Department of Health Care Finance. - $3,185,865,000 (including20$850,791,000 from local funds (including $67,527,000 from dedicated taxes), $2,322,000 from 21Federal grant funds, $2,329,796,000 from Medicaid payments, and $2,956,000 from other 22funds); provided, that all funds deposited, without regard to fiscal year, into the Healthy DC 23Fund are authorized for expenditure and shall remain available for expenditure until September 2430, 2019; provided further, that all funds deposited, without regard to fiscal year, into the 25Nursing Homes Quality of Care Fund are authorized for expenditure and shall remain available 26for expenditure until September 30, 2019; provided further, that all funds deposited, without 27regard to fiscal year, into the Stevie Sellows Fund are authorized for expenditure and shall 28remain available for expenditure until September 30, 2019; provided further, that all funds 29deposited, without regard to fiscal year, into the Medicaid Collections-3rd Party Liability Fund 30are authorized for expenditure and shall remain available for expenditure until September 30, 312019; provided further, that all funds deposited, without regard to fiscal year, into the Bill of 32Rights (Grievance and Appeals) Fund are authorized for expenditure and shall remain available 33for expenditure until September 30, 2019; provided further, that all funds deposited, without34regard to fiscal year, into the Hospital Provider Fee Fund are authorized for expenditure and shall 35remain available for expenditure until September 30, 2019; provided further, that all funds 36deposited, without regard to fiscal year, into the Hospital Fund are authorized for expenditure37and shall remain available for expenditure until September 30, 2019;38
(16) Not-for-Profit Hospital Corporation Subsidy. - $10,000,000 from local 39funds; and40
(17) Office of the Deputy Mayor for Health and Human Services. - $1,782,00041from local funds.42
43PUBLIC WORKS44
Public works, including rental of one passenger-carrying vehicle for use by the Mayor 45and 3 passenger-carrying vehicles for use by the Council of the District of Columbia and leasing 46

17
of passenger-carrying vehicles, $900,705,000 (including $681,274,000 from local funds 1(including $258,489,000 from dedicated taxes), $39,994,000 from Federal grant funds, 2$179,346,000 from other funds, and $91,000 from private funds), to be allocated as follows:3
(1) Department of Public Works. - $149,299,000 (including $141,516,000 from 4local funds and $7,783,000 from other funds); provided, that all funds deposited, without regard 5to fiscal year, into the Solid Waste Disposal Fee Fund are authorized for expenditure and shall 6remain available for expenditure until September 30, 2019; provided further, that all funds 7deposited, without regard to fiscal year, into the Super Can Program Fund are authorized for 8expenditure and shall remain available for expenditure until September 30, 2019;9
(2) Department of Transportation. - $143,036,000 (including $108,029,00010from local funds, $11,474,000 from Federal grant funds, and $23,533,000 from other funds); 11provided, that all funds deposited, without regard to fiscal year, into the Bicycle Sharing Fund 12are authorized for expenditure and shall remain available for expenditure until September 30, 132019; provided further, that all funds deposited, without regard to fiscal year, into the 14Performance Parking Program Fund are authorized for expenditure and shall remain available for 15expenditure until September 30, 2019; provided further, that all funds deposited, without regard 16to fiscal year, into the Tree Fund are authorized for expenditure and shall remain available for 17expenditure until September 30, 2019; provided further, that all funds deposited, without regard 18to fiscal year, into the DDOT Enterprise Fund-Non Tax Revenues Fund are authorized for 19expenditure and shall remain available for expenditure until September 30, 2019; provided 20further, that all funds deposited, without regard to fiscal year, into the Sustainable Transportation 21Fund are authorized for expenditure and shall remain available for expenditure until September 2230, 2019; provided further, that, in addition, there are appropriated any amounts received, or to 23be received, without regard to fiscal year, from the Potomac Electric Power Company, or any of 24its related companies, successors, or assigns, for the purpose of paying or reimbursing the 25District Department of Transportation for the costs of designing, constructing, acquiring, and 26installing facilities, infrastructure, and equipment for use and ownership by the Potomac Electric 27Power Company, or any of its related companies, successors, or assigns, related to or associated 28with the undergrounding of electric transmission lines in the District of Columbia, and any 29interest earned on those funds, which amounts and interest shall not revert to the unrestricted 30fund balance of the General Fund of the District of Columbia at the end of a fiscal year, but shall 31be continually available until expended for the designated purposes; provided further, that all 32funds deposited, without regard to fiscal year, into the Vision Zero Pedestrian and Bicycle Safety 33Fund are authorized for expenditure and shall remain available for expenditure until September 3430, 2019; provided further, that all funds deposited, without regard to fiscal year, into the 35Transportation Infrastructure Project Fund are authorized for expenditure and shall remain 36available for expenditure until September 30, 2019;37
(3) Department of Motor Vehicles. - $40,180,000 (including $30,100,000 from38local funds and $10,080,000 from other funds); provided, that all funds deposited, without regard 39to fiscal year, into the Motor Vehicle Inspection Station Fund are authorized for expenditure and 40shall remain available for expenditure until September 30, 2019; provided further, that all funds 41deposited, without regard to fiscal year, into the Parking, Standing, Stopping and Pedestrian 42Violation Enforcement Fund are authorized for expenditure and shall remain available for 43expenditure until September 30, 2019; provided further, that all funds deposited, without regard 44to fiscal year, into the Automated Traffic Enforcement Fund are authorized for expenditure and 45shall remain available for expenditure until September 30, 2019; provided further, that all funds 46

18
deposited, without regard to fiscal year, into the Moving Violation Enforcement Fund are 1authorized for expenditure and shall remain available for expenditure until September 30, 2019;2
(4) Department of Energy and Environment. - $138,293,000 (including3$26,408,000 from local funds, $28,520,000 from Federal grant funds, $83,274,000 from other 4funds, and $91,000 in private funds); provided, that all funds deposited, without regard to fiscal 5year, into the Storm Water Permit Review Fund are authorized for expenditure and shall remain 6available for expenditure until September 30, 2019; provided further, all funds deposited, 7without regard to fiscal year, into the Sustainable Energy Trust Fund are authorized for 8expenditure and shall remain available for expenditure until September 30, 2019; provided 9further, that all funds deposited, without regard to fiscal year, into the Brownfield Revitalization 10Fund are authorized for expenditure and shall remain available for expenditure until September 1130, 2019; provided further, that all funds deposited, without regard to fiscal year, into the 12Anacostia River Clean Up and Protection Fund are authorized for expenditure and shall remain 13available for expenditure until September 30, 2019; provided further, that all funds deposited, 14without regard to fiscal year, into the Wetlands Fund are authorized for expenditure and shall 15remain available for expenditure until September 30, 2019; provided further, that all funds 16deposited, without regard to fiscal year, into the Energy Assistance Trust Fund are authorized for 17expenditure and shall remain available for expenditure until September 30, 2019; provided 18further, that all funds deposited, without regard to fiscal year, into the LUST Trust Fund are 19authorized for expenditure and shall remain available for expenditure until September 30, 2019;20provided further, that all funds deposited, without regard to fiscal year, into the Soil 21Erosion/Sediment Control Fund are authorized for expenditure and shall remain available for 22expenditure until September 30, 2019; provided further, that all funds deposited, without regard 23to fiscal year, into the DC Municipal Aggregation Program Fund are authorized for expenditure 24and shall remain available for expenditure until September 30, 2019; provided further, that all 25funds deposited, without regard to fiscal year, into the Fishing License Fund are authorized for 26expenditure and shall remain available for expenditure until September 30, 2019; provided 27further, that all funds deposited, without regard to fiscal year, into the Renewable Energy 28Development Fund are authorized for expenditure and shall remain available for expenditure 29until September 30, 2019; provided further, that funds in the Renewable Energy Development 30Fund may be obligated in Fiscal Year 2019, pursuant to grant awards, through September 30, 312022, and that such funds, so obligated are authorized for expenditure and shall remain available 32for expenditure until September 30, 2022; provided further, that all funds deposited, without 33regard to fiscal year, into the Special Energy Assessment Fund are authorized for expenditure 34and shall remain available for expenditure until September 30, 2019; provided further, that all 35funds deposited, without regard to fiscal year, into the Air Quality Construction Permits Fund are 36authorized for expenditure and shall remain available for expenditure until September 30, 2019;37provided further, that all funds deposited, without regard to fiscal year, into the WASA Utility 38Discount Program Fund are authorized for expenditure and shall remain available for 39expenditure until September 30, 2019; provided further, that all funds deposited, without regard 40to fiscal year, into the Pesticide Product Registration Fund are, authorized for expenditure and 41shall remain available for expenditure until September 30, 2019; provided further, that all funds 42deposited, without regard to fiscal year, into the Storm Water Fees Fund are authorized for 43expenditure and shall remain available for expenditure until September 30, 2019; provided 44further, that all funds deposited, without regard to fiscal year, into the Stormwater In Lieu Fee 45Fund are authorized for expenditure and shall remain available for expenditure until September 46

19
30, 2019; provided further, that all funds deposited, without regard to fiscal year, into the 1Economy II Fund are authorized for expenditure and shall remain available for expenditure until 2September 30, 2019; provided further, that all funds deposited, without regard to fiscal year, into 3the Residential Aid Discount Fund are authorized for expenditure and shall remain available for 4expenditure until September 30, 2019; provided further, that all funds deposited, without regard 5to fiscal year, into the Residential Essential Services Fund are authorized for expenditure until 6September 30, 2019; provided further, that all funds deposited, without regard to fiscal year, into 7the Benchmarking Enforcement Fund are authorized for expenditure and shall remain available 8for expenditure until September 30, 2019; provided further, that all funds deposited, without 9regard to fiscal year, into the Product Stewardship Fund are authorized for expenditure and shall 10remain available for expenditure until September 30, 2019; provided further, that all funds 11deposited, without regard to fiscal year, into the Air Quality Construction Permits Fund are 12authorized for expenditure and shall remain available for expenditure until September 30, 2019;13provided further, that all funds deposited, without regard to fiscal year, into the Soil Erosion and 14Sediment Control Fund are authorized for expenditure and shall remain available for expenditure 15until September 30, 2019; provided further, that all funds deposited, without regard to fiscal year, 16into the Rail Safety and Security Fund are authorized for expenditure and shall remain available 17for expenditure until September 30, 2019;18
(5) Department of For-Hire Vehicles. - $17,571,000 (including $5,895,00019from local funds, and $11,675,000 from other funds); provided, that all funds deposited, without 20regard to fiscal year, into the Taxicab Assessment Act Fund are authorized for expenditure and 21shall remain available for expenditure until September 30, 2019; provided further, that all funds 22deposited, without regard to fiscal year, into the Public Vehicles for Hire Consumer Service 23Fund are authorized for expenditure and shall remain available for expenditure until September 2430, 2019;25
(6) Washington Metropolitan Area Transit Commission. - $151,000 from 26local funds; and27
(7) Washington Metropolitan Area Transit Authority. - $412,175,00028(including $369,175,000 from local funds (including $258,489,000 from dedicated taxes) and 29$43,000,000 from other funds); provided, that all funds deposited, without regard to fiscal year, 30into the Dedicated Taxes Fund are authorized for expenditure and shall remain available for 31expenditure until September 30, 2019; provided further, that all funds deposited, without regard 32to fiscal year, into the Parking Meter WMATA Fund are authorized for expenditure and shall 33remain available for expenditure until September 30, 2019.34
35FINANCING AND OTHER36
Financing and Other, $1,211,513,000 (including $1,084,539,000 from local funds 37(including $188,807,000 from dedicated taxes), $17,525,000 from Federal grant funds,38$97,449,000 from other funds, and $12,000,000 from Federal payment funds requested to be 39appropriated by the Congress under the heading “Federal Payment for Emergency Planning and 40Security Costs in the District of Columbia” in the Fiscal Year 2019 Federal Portion Budget 41Request Act of 2018), to be allocated as follows:42
(1) Repayment of Loans and Interest. - $758,926,000 (including $735,649,00043from local funds, $17,525,000 from Federal grant funds, and $5,753,000 from other funds), for 44payment of principal, interest, and certain fees directly resulting from borrowing by the District45of Columbia to fund District of Columbia capital projects as authorized by sections 462, 475, and46

20
490 of the District of Columbia Home Rule Act, approved December 24, 1973 (87 Stat. 777;1D.C. Official Code §§ 1- 204.62, 1-204.75, and 1-204.90);2
(2) Debt Service - Issuance Costs. - $8,000,000 from local funds for the 3payment of debt service issuance costs;4
(3) Repayment of Revenue Bonds. - $7,839,000 from local funds (including5$7,839,000 from dedicated taxes) for the repayment of revenue bonds;6
(4) Commercial Paper Program. - $10,000,000 from local funds;7(5) Settlements and Judgments.- $21,825,000 from local funds for making 8
refunds and for the payment of legal settlements or judgments that have been entered against the9District of Columbia government; provided, that this amount may be increased by such sums as 10may be necessary for making refunds and for the payment of legal settlements or judgments that 11have been entered against the District of Columbia government and such sums may be paid from 12the applicable or available funds of the District of Columbia;13
(6) John A. Wilson Building Fund. - $4,726,000 from local funds for expenses 14associated with the John A. Wilson building;15
(7) Workforce Investments. - $51,767,000 from local funds for workforce 16investments; provided, that all funds deposited, without regard to fiscal year, into the 17Compensation Units 1 and 2 Compensation and Classification Reform Fund are authorized for 18expenditure and shall remain available for expenditure until September 30, 2019; provided 19further, that all funds deposited, without regard to fiscal year, into the Workforce Investments 20Account are authorized for expenditure and shall remain available for expenditure until 21September 30, 2019;22
(8) Non-Departmental. - $5,234,000 (including $1,750,000 from local funds 23and $3,484,000 from other funds), to be transferred by the Mayor of the District of Columbia 24within the various appropriations headings in this act, to account for anticipated costs that cannot 25be allocated to specific agencies during the development of the proposed budget;26
(9) Emergency Planning and Security Fund. - $12,000,000 from Federal 27payment funds requested to be appropriated by the Congress under the heading “Federal 28Payment for Emergency Planning and Security Costs in the District of Columbia” in the Fiscal 29Year 2019 Federal Portion Budget Request Act of 2018; provided, that, notwithstanding any 30other law, obligations and expenditures that are pending reimbursement under the heading 31“Federal Payment for Emergency Planning and Security Costs in the District of Columbia” may 32be charged to this appropriations heading;33
(10) Master Equipment Lease/Purchase Program. - $11,844,000 from local 34funds;35
(11) Pay-As-You-Go Capital Fund. - $81,706,000 (including $4,171,000 from 36local funds and $77,535,000 from other funds) to be transferred to the Capital Fund, in lieu of 37capital financing;38
(12) District Retiree Health Contribution. - $46,000,000 from local funds for a 39District Retiree Health Contribution;40
(13) Highway Transportation Fund. - Transfers. - $32,687,000 (including 41$25,426,000 from local funds (including $25,426,000 from dedicated taxes) and $7,261,000 42from other funds); and43
(14) Convention Center Transfer. - $158,959,000 (including $155,543,00044from local funds (including $155,543,000 from dedicated taxes) and $3,415,000 from other 45funds).46

21
1ENTERPRISE AND OTHER FUNDS2
The amount of $1,934,146,000 from enterprise and other funds (including $221,994,0003from enterprise and other funds - dedicated taxes), shall be provided to enterprise funds as 4follows; provided, that, in the event that certain dedicated revenues exceed budgeted amounts, 5the General Fund budget authority may be increased as needed to transfer all such revenues, 6pursuant to local law, to the Local Transportation Fund (per D.C. Official Code § 9-111.01a), the 7Highway Trust Fund, the Washington Convention Center and Sports Authority, and the 8Washington Metropolitan Area Transit Authority.9
10DISTRICT OF COLUMBIA WATER AND SEWER AUTHORITY11
For operation of the District of Columbia Water and Sewer Authority, $582,781,000 from12enterprise and other funds, of which no outstanding debt exists for repayment of loans and 13interest incurred for capital improvement projects and payable to the District’s debt service fund. 14For construction projects, $3,614,820,000, to be distributed as follows: $757,526,000 for 15Wastewater Treatment; $493,195,000 for the Sanitary Sewer System; $678,934,000 for the 16Water System; $88,002,000 for Non Process Facilities; $1,301,873,000 for the Combined Sewer 17Overflow Program; $108,284,000 for the Washington Aqueduct; $21,770,000 for the Stormwater 18Program; and $165,236,000 for the capital equipment program; provided, that the requirements 19and restrictions that are applicable to General Fund capital improvement projects and set forth in 20this act under the Capital Outlay appropriation account shall apply to projects approved under 21this appropriation account.22
23WASHINGTON AQUEDUCT24
For operation of the Washington Aqueduct, $64,061,000 from enterprise and other funds.2526
OFFICE OF LOTTERY AND CHARITABLE GAMES27For the Lottery and Charitable Games Enterprise Fund, established by the District of 28
Columbia Appropriations Act, 1982, approved December 4, 1981 (Pub. L. No. 97-91; 95 Stat. 291174), for the purpose of implementing the Law to Legalize Lotteries, Daily Numbers Games, 30and Bingo and Raffles for Charitable Purposes in the District of Columbia, effective March 10,311981 (D.C. Law 3-172; codified in scattered cites in the D.C. Official Code), $225,282,000 from 32enterprise and other funds; provided, that, after notification to the Mayor, amounts appropriated 33herein may be increased by an amount necessary for the Lottery and Charitable Games 34Enterprise Fund to make transfers to the General Fund of the District of Columbia and to cover35prizes, agent commissions, and gaming related fees directly associated with unanticipated excess36lottery revenues not included in this appropriation.37
38DISTRICT OF COLUMBIA RETIREMENT BOARD39
For the District of Columbia Retirement Board, established pursuant to section 121 of the 40District of Columbia Retirement Reform Act of 1979, approved November 17, 1979 (93 Stat. 41866; D.C. Official Code § 1-711), $43,579,000 from the earnings of the applicable retirement 42funds to pay legal, management, investment, and other fees and administrative expenses of the 43District of Columbia Retirement Board; provided, that the District of Columbia Retirement44Board shall provide to the Congress and the Mayor and to the Council of the District of45Columbia a quarterly report of the allocations of charges by fund and of expenditures of all 46

22
funds; provided further, that the District of Columbia Retirement Board shall provide to the 1Mayor, for transmittal to the Council of the District of Columbia, an itemized accounting of the 2planned use of appropriated funds in time for each annual budget submission and the actual use 3of such funds in time for each annual audited financial report.4
5BALLPARK REVENUE FUND6
For the Ballpark Revenue Fund, $58,773,000 from enterprise and other funds (including 7$46,829,000 from enterprise and other funds - dedicated taxes).8
9WASHINGTON CONVENTION AND SPORTS AUTHORITY10
For the Washington Convention Center Enterprise Fund, including for functions 11previously performed by the District of Columbia Sports and Entertainment Commission,12$200,562,000 from enterprise and other funds.13
14HOUSING FINANCE AGENCY15
For operation of the District of Columbia Housing Finance Agency, $12,960,000 from 16enterprise and other funds, of which no outstanding debt exists for repayment of loans and17interest incurred for capital improvement projects and payable to the District’s debt service fund.18
19UNIVERSITY OF THE DISTRICT OF COLUMBIA20
For the University of the District of Columbia, $171,123,000 from enterprise and other 21funds; provided, that these funds shall not revert to the General Fund of the District of Columbia 22at the end of a fiscal year, or at any other time, but shall be continually available for expenditure 23until September 30, 2019, without regard to fiscal year limitation.24
25UNEMPLOYMENT INSURANCE TRUST FUND26
For the Unemployment Insurance Trust Fund, $185,382,000 from enterprise and other27funds.28
29HOUSING PRODUCTION TRUST FUND30
For the Housing Production Trust Fund, $100,000,000 from enterprise and other funds31(including $60,665,000 from enterprise and other funds - dedicated taxes); provided, that all 32funds deposited, without regard to fiscal year, into the Housing Production Trust Fund are33authorized for expenditure and shall remain available for expenditure until September 30, 2019.34
35TAX INCREMENT FINANCING (TIF) PROGRAM36
For Tax Increment Financing, $60,377,000 from enterprise and other funds (including 37$60,377,000 from enterprise and other funds - dedicated taxes).38
39REPAYMENT OF PILOT FINANCING40
For Repayment of Payment in Lieu of Taxes Financing, $54,123,000 from enterprise and 41other funds (including $54,123,000 from enterprise and other funds - dedicated taxes).42
43NOT-FOR-PROFIT HOSPITAL CORPORATION44
For the Not-For-Profit Hospital Corporation, $144,000,000 from enterprise and other45funds.46

23
1HEALTH BENEFIT EXCHANGE AUTHORITY2
For the District of Columbia Health Benefit Exchange Authority, $31,144,000 from 3enterprise and other funds.4
5CASH FLOW RESERVE ACCOUNT6
All funds deposited, without regard to fiscal year, into the Cash Flow Reserve Account, 7(established pursuant to D.C. Official Code § 47-392.02(j-2)) are authorized for expenditure and 8shall remain available for expenditure until September 30, 2019.9
10FISCAL STABILIZATION RESERVE ACCOUNT11
All funds deposited, without regard to fiscal year, into the Fiscal Stabilization Reserve 12Account, (established pursuant to D.C. Official Code § 47-392.02(j-1)) are authorized for 13expenditure and shall remain available for expenditure until September 30, 2019.14
15CAPITAL OUTLAY16
17For capital construction projects, an increase of $3,271,566,000 of which $2,787,228,000 18
shall be from local funds, $650,000 from private grant funds, $51,986,000 shall be from the 19Local Transportation Fund, $72,306,000 shall be from the District of Columbia Highway Trust 20Fund, and $359,396,000 shall be from Federal grant funds, and a rescission of $605,677,000 of 21which $431,173,000 shall be from local funds, $28,340,000 shall be from the Local 22Transportation Fund, $23,043,000 shall be from the District of Columbia Highway Trust Fund, 23and $123,122,000 shall be from Federal grant funds appropriated under this heading in prior 24fiscal years, for a net amount of $2,665,888,000, to remain available until expended; provided, 25that all funds provided by this act shall be available only for the specific projects and purposes 26intended; provided further, that amounts appropriated under this act may be increased by the 27amount transferred from funds appropriated in this act as Pay-As-You-Go Capital funds.28
29Sec. 3. Local portion of the budget.30The budget adopted pursuant to this act constitutes the local portion of the annual budget 31
for the District of Columbia government under section 446(a) of the District of Columbia Home 32Rule Act, approved December 24, 1973 (87 Stat. 801; D.C. Official Code § 1-204.46(a)).33
34Sec. 4. Fiscal impact statement.35The Council adopts the fiscal impact statement of the Chief Financial Officer as the fiscal 36
impact statement required by section 4a of the General Legislative Procedures Act of 1975, 37approved October 16,2006 (120 Stat. 2038; D.C. Official Code § 1-301.47a).38
39Sec. 5. Effective date.40As provided in section 446(a) of the District of Columbia Home Rule Act, approved 41
December 24, 1973 (87 Stat. 801; D.C. Official Code § 1-204.46(a)), this act shall take effect 42following approval by the Mayor (or in the event of veto by the Mayor, action by the Council to 43override the veto), a 30-day period of congressional review as provided in 602(c)(l) of the 44District of Columbia Home Rule Act, approved December 24, 1973 (87 Stat. 813; D.C. Official 45Code § 1-206.02(c)(l)), and publication in the District of Columbia Register.46


FY 2019Federal PortionBudgetRequest Act


1 _____________________ 2 Chairman Phil Mendelson 3
at the request of the Mayor 4 5 6 7
A BILL 8 9
_________ 10 11
IN THE COUNCIL OF THE DISTRICT OF COLUMBIA 12 13
_____________________________________ 14 15 To adopt, as a request to Congress for appropriation and authorization, the federal portion 16
of the budget of the government of the District of Columbia for the fiscal year 17 ending September 30, 2019. 18
19 BE IT ENACTED BY THE COUNCIL OF THE DISTRICT OF COLUMBIA, That 20
this act may be cited as the “Fiscal Year 2019 Federal Portion Budget Request Act of 2018”. 21 22
Sec. 2. Adoption of the federal portion of the Fiscal Year 2019 budget. 23 There is adopted, as a request to Congress for appropriation and authorization, the 24
following federal portion of the budget of the government of the District of Columbia for the 25 fiscal year ending September 30, 2019. 26 27
DISTRICT OF COLUMBIA FEDERAL FUNDS APPROPRIATION REQUEST 28 29
FEDERAL PAYMENT TO THE DISTRICT OF COLUMBIA COURTS 30 For salaries and expenses for the District of Columbia Courts, $244,939,000 to be 31
allocated as follows: for the District of Columbia Court of Appeals, $13,379,000, of which not to 32 exceed $2,500 is for official reception and representation expenses; for the Superior Court of the 33 District of Columbia, $121,251,000, of which not to exceed $2,500 is for official reception and 34 representation expenses; for the District of Columbia Court System, $71,909,000, of which not 35 to exceed $2,500 is for official reception and representation expenses; and $38,400,000, to 36 remain available until September 30, 2020, for capital improvements for District of Columbia 37 courthouse facilities: Provided, That funds made available for capital improvements shall be 38 expended consistent with the District of Columbia Courts master plan study and facilities 39 condition assessment: Provided further, That, in addition to the amounts appropriated herein, 40 fees received by the District of Columbia Courts for administering bar examinations and 41 processing District of Columbia bar admissions may be retained and credited to this 42 appropriation, to remain available until expended, for salaries and expenses associated with such 43 activities, notwithstanding section 450 of the District of Columbia Home Rule Act (D.C. Official 44 Code, sec. 1–204.50): Provided further, That notwithstanding any other provision of law, all 45 amounts under this heading shall be apportioned quarterly by the Office of Management and 46

Budget and obligated and expended in the same manner as funds appropriated for salaries and 1 expenses of other Federal agencies: Provided further, That 30 days after providing written notice 2 to the Committees on Appropriations of the House of Representatives and the Senate, the District 3 of Columbia Courts may reallocate not more than $9,000,000 of the funds provided under this 4 heading among the items and entities funded under this heading: Provided further, That the Joint 5 Committee on Judicial Administration in the District of Columbia may, by regulation, establish a 6 program substantially similar to the program set forth in subchapter II of chapter 35 of title 5, 7 United States Code, for employees of the District of Columbia Courts. 8
9 FEDERAL PAYMENT FOR DEFENDER SERVICES IN DISTRICT OF COLUMBIA COURTS 10
For payments authorized under section 11–2604 and section 11–2605, D.C. Official Code 11 (relating to representation provided under the District of Columbia Criminal Justice Act), 12 payments for counsel appointed in proceedings in the Family Court of the Superior Court of the 13 District of Columbia under chapter 23 of title 16, D.C. Official Code, or pursuant to contractual 14 agreements to provide guardian ad litem representation, training, technical assistance, and such 15 other services as are necessary to improve the quality of guardian ad litem representation, 16 payments for counsel appointed in adoption proceedings under chapter 3 of title 16, D.C. Official 17 Code, and payments authorized under section 21–2060, D.C. Official Code (relating to services 18 provided under the District of Columbia Guardianship, Protective Proceedings, and Durable 19 Power of Attorney Act of 1986), $46,005,000, to remain available until expended: Provided, 20 That not more than $20,000,000 in unobligated funds provided in this account may be transferred 21 to and merged with funds made available under the heading “Federal Payment to the District of 22 Columbia Courts,” to be available for the same period and purposes as funds made available 23 under that heading for capital improvements to District of Columbia courthouse facilities: 24 Provided further, That funds provided under this heading shall be administered by the Joint 25 Committee on Judicial Administration in the District of Columbia: Provided further, That, 26 notwithstanding any other provision of law, this appropriation shall be apportioned quarterly by 27 the Office of Management and Budget and obligated and expended in the same manner as funds 28 appropriated for expenses of other Federal agencies. 29 30
FEDERAL PAYMENT FOR SCHOOL IMPROVEMENT 31 For a Federal payment for a school improvement program in the District of Columbia, 32
$45,000,000, to remain available until expended, for payments authorized under the Scholarship 33 for Opportunity and Results Act (division C of Public Law 112–10): Provided, That, to the 34 extent that funds are available for opportunity scholarships and following the priorities included 35 in section 3006 of such Act, the Secretary of Education shall make scholarships available to 36 students eligible under section 3013(3) of such Act (Public Law 112–10; 125 Stat. 211) 37 including students who were not offered a scholarship during any previous school year: Provided 38 further, That within funds provided for opportunity scholarships up to $3,200,000 shall be for the 39 activities specified in sections 3007(b) through 3007(d) and 3009 of the Act. 40 41
FEDERAL PAYMENT TO THE CRIMINAL JUSTICE COORDINATING COUNCIL 42 For a Federal payment to the Criminal Justice Coordinating Council, $1,900,000, to 43
remain available until expended, to support initiatives related to the coordination of Federal and 44 local criminal justice resources in the District of Columbia. 45 46

FEDERAL PAYMENT FOR JUDICIAL COMMISSIONS 1 For a Federal payment, to remain available until September 30, 2020, to the Commission 2
on Judicial Disabilities and Tenure, $295,000, and for the Judicial Nomination Commission, 3 $270,000. 4 5
FEDERAL PAYMENT FOR THE DISTRICT OF COLUMBIA NATIONAL GUARD 6 For a Federal payment to the District of Columbia National Guard, $435,000, to remain 7 available until expended for the Major General David F. Wherley, Jr. District of Columbia 8 National Guard Retention and College Access Program. 9
10 FEDERAL PAYMENT FOR TESTING AND TREATMENT OF HIV/AIDS 11
For a Federal payment to the District of Columbia for the testing of individuals for, and 12 the treatment of individuals with, human immunodeficiency virus and acquired 13 immunodeficiency syndrome in the District of Columbia, $5,000,000. 14
15 FEDERAL PAYMENT FOR EMERGENCY PLANNING A ND SECURITY COSTS IN THE 16
DISTRICT O F COLUMBIA 17 For a Federal payment of necessary expenses, as determined by the Mayor of the District 18
of Columbia in written consultation with the elected county or city officials of surrounding 19 jurisdictions, $12,000,000, to remain available until expended, for the costs of providing public 20 safety at events related to the presence of the National Capital in the District of Columbia, 21 including support requested by the Director of the United States Secret Service in carrying out 22 protective duties under the direction of the Secretary of Homeland Security, and for the costs of 23 providing support to respond to immediate and specific terrorist threats or attacks in the District 24 of Columbia or surrounding jurisdictions. 25
26 Sec. 3. Federal portion of the budget. 27 The federal funds for which appropriation by Congress is requested by this act 28
constitute the federal portion of the Fiscal Year 2019 annual budget for the District of 29 Columbia government under section 446(a) of the District of Columbia Home Rule Act, 30 approved December 24, 1973 (87 Stat. 801; D.C. Official Code § 1-204.46(a)). 31
32 Sec. 4. Fiscal impact statement. 33 The Council adopts the fiscal impact statement of the Chief Financial Officer as the 34
fiscal impact statement required by section 4a of the General Legislative Procedures Act of 35 1975, approved October 16, 2006 (120 Stat. 2038; D.C. Official Code § 1-301.47a). 36
37 Sec. 5. Effective date. 38 This act shall take effect as provided in section 446 of the District of Columbia Home 39
Rule Act, approved December 24, 1973 (87 Stat. 801; D.C. Official Code § 1-204.46). 40


![ɷ[elliott mendelson] schaum's outline](https://img.pdfslide.us/doc/110x75/568cac071a28ab186da7e9f3/elliott-mendelson-schaums-outline.jpg)

![[Elliott mendelson] schaum's_3,000_solved_problems](https://img.pdfslide.us/doc/110x75/5550ca32b4c905f2318b480d/elliott-mendelson-schaums3000solvedproblems.jpg)