Embed Size (px)
Citation preview
2016 USRDS ANNUAL DATA REPORT | VOLUME 1 – CKD IN THE UNITED STATES
Volume 1: CKD Analytical Methods
Contents CKD Analytical Methods ................................................................................................................................................ 1
Introduction ................................................................................................................................................................2
Data Sources ................................................................................................................................................................2
National Health and Nutrition Examination Survey .............................................................................................2
Behavioral Risk Factor Surveillance System ..........................................................................................................2
Clinformatics™ Data Mart Database (OptumInsight, Eden Prairie, MN) ............................................................2
Centers for Medicare and Medicaid Services Medicare 5% Sample .................................................................... 4
Enrollment Data (Denominator File) .................................................................................................................... 4
Medicare Parts A and B Claims Files ..................................................................................................................... 4
Medicare Part D Files ..............................................................................................................................................5
Veterans Administration Heath Care Data ............................................................................................................5
ESRD Medical Evidence Form ............................................................................................................................... 6
ESRD Death Notification Form ............................................................................................................................. 6
Race and Ethnicity ..................................................................................................................................................... 6
General Methods for Health Insurance Claim Data Files .........................................................................................7
Plan Participation ....................................................................................................................................................7
Medicare Reason for Entitlement ...........................................................................................................................7
ESRD ........................................................................................................................................................................7
Identification of Major Comorbidities ...................................................................................................................... 8
Chapter 1: CKD in the General Population ............................................................................................................... 9
Chapter 2: Identification and Care of Patients with CKD ........................................................................................ 11
Chapter 3: Morbidity and Mortality ......................................................................................................................... 13
Mortality ................................................................................................................................................................ 13
Hospitalization ...................................................................................................................................................... 13
Rehospitalization .................................................................................................................................................. 15
Chapter 4: Cardiovascular Disease in Patients with CKD ....................................................................................... 15
Cardiovascular Disease Prevalence and Outcomes in CKD ................................................................................ 18
Congestive Heart Failure and Chronic Kidney Disease ....................................................................................... 18
Atrial Fibrillation and Chronic Kidney Disease ................................................................................................... 19
Chapter 5: Acute Kidney Injury ................................................................................................................................ 19
Characteristics of Patients with AKI ................................................................................................................... 20
Hospitalization with an AKI Episode ................................................................................................................... 22
Patient Care and Outcomes .................................................................................................................................. 22
Chapter 6: Medicare Expenditures for CKD ............................................................................................................ 23
Chapter 7: Medicare Part D Prescription Drug Coverage in Patients with CKD .................................................. 24
Reference Tables: CKD ............................................................................................................................................ 26
References ................................................................................................................................................................. 27
2016 USRDS ANNUAL DATA REPORT | VOLUME 1 – CKD IN THE UNITED STATES
Introduction
In this chapter we describe the data sources,
preparation and management, variable definition, and
analytic methods used to produce the statistics
presented in Volume 1 of the 2016 USRDS Annual Data
Report (ADR), which focuses on chronic kidney
disease (CKD) prior to end-stage renal disease (ESRD).
Datasets and methods used for ESRD analyses are
described in the ESRD Analytic Methods chapter of
Volume 2.
Data Sources
The USRDS uses several data sources to describe
pre-ESRD kidney disease in the United States (U.S.),
through obtaining data on diagnoses, demographic
characteristics, health care procedures, prescription
drug plan participation, and filled prescriptions. Data
on the non-institutionalized, general population were
obtained from the National Health and Nutrition
Examination Survey (NHANES) and the Behavioral
Risk Factor Surveillance System (BRFSS). For patients
with CKD, acute kidney injury (AKI) and related
comorbidities, data from three health care systems
were used: the standard Centers for Medicare and
Medicaid Services (CMS) Medicare 5% sample, the
Clinformatics™ Data Mart Database of people with
commercial health insurance plans as obtained from
OptumInsight, and the Veterans Administration.
NATIONAL HEALTH AND NUTRITION
EXAMINATION SURVEY
NHANES is a series of health examination surveys
conducted by the National Center for Health Statistics
(NCHS) of the U.S. Centers for Disease Control and
Prevention (CDC). Begun in 1959, NHANES was
designed to monitor the health and nutritional status
of the non-institutionalized civilian population in the
U.S.. NHANES III was conducted in two phases
between 1988 and 1994. In 1999, NHANES became a
continuous, annual survey to provide for regular
estimates, with the release of public-use data files
every two years. Both NHANES III and NHANES 1999–
2014 were nationally-representative, cross-sectional
surveys with a complex, stratified, multi-stage
probability cluster sampling design that included the
selection of primary sampling units (counties),
household segments within the counties, and sample
persons from selected households (Johnson et al.,
2013). Survey participants were interviewed in their
homes and/or received standardized medical
examinations in mobile examination centers. Both sets
of surveys over-sampled African Americans, Mexican
Americans, and individuals aged 60 or older to
improve the estimates for these subgroups.
BEHAVIORAL RISK FACTOR SURVEILLANCE
SYSTEM
The BRFSS is a series of telephone-based surveys of
health-related risk behaviors, chronic health
conditions, and use of preventive services; BRFSS
sampling is designed to provide state-specific
estimates (CDC, 2015). Like NHANES, it is also
conducted by the CDC through the NCHS. BRFSS
began in 1984 with 15 states, and expanded nationwide
in 1993. As of 2011, in addition to traditional land-line
subscribers, cell phone users were included in the
sample frame. A question regarding kidney health was
added in 2012—specifically, respondents were asked,
“Has a doctor, nurse, or other health professional ever
told you have kidney disease? Do NOT include kidney
stones, bladder infection or incontinence
(Incontinence is not being able to control urine flow).”
Allowable responses were “yes”, “no”, and “not sure”,
with additional coding for “refused to answer” and
“missing/not asked.” Of the 475,687 respondents in
2012, only 202 respondents refused to answer (0.04%),
three were missing, and 1,322 answered “not sure”
(0.28%).
CLINFORMATICS™ DATA MART DATABASE
(OPTUMINSIGHT, EDEN PRAIRIE, MN)
The Clinformatics™ Data Mart data provides paid
medical and prescription claims and enrollment
information for national participants in commercial
insurance plans of a large U.S. managed care health
insurance company. The data is purchased from
OptumInsight, and participants are enrolled in both a
medical and a prescription plan.
The Clinformatics™ data license requires that data
not be merged with any other data files, so we are
unable to match these individuals with the USRDS
ESRD databases to comprehensively identify ESRD
patients. Therefore, we assign these individuals a first
service date for ESRD as the date of either the first
188
VOLUME 1: CKD ANALYTICAL METHODS
claim with a diagnosis of ESRD, a procedure code for
outpatient dialysis, or a diagnosis related group (DRG)
code for a kidney transplant surgery. See Table m.1 for
specific code values. We present Clinformatics™ data
from 2005 through 2014 in the 2016 ADR.
To comply with the Health Insurance Portability
and Accountability Act of 1996 (HIPPA) and prevent
the re-identification of individuals in the database,
certain combinations of sensitive data elements are
not allowed. OptumInsight provides the data as
different “views”, each containing a limited amount of
sensitive data. For this report, we used the Date of
Death (DOD) view of the data; detailed geographic
and socio-economic data were not available in the
files, but date of death was included. The other
available data views do not contain death date.
Enrollment and member information, such as year of
birth, gender, race/ethnicity, state of residence, and
plan participation, are contained in the MEMBER and
MEMBER_DETAIL data tables. A summarized facility
detail record for each inpatient episode occurring in
an acute care hospitalization or skilled nursing facility
setting is contained the inpatient CONFINEMENT data
table, while all services for both inpatient and
outpatient care are located in the MEDICAL claims data
table.
vol 1 Table m.1 ICD-9-CM diagnosis, CPT procedure, and DRG codes used to define ESRD in the Clinformatics™ and VA datasets throughout Volume 1 of the ADR
Type of Code Code Values
ICD-9-CM Diagnosis codes 585.6, 996.81, V42.0, V45.1, V56.0, V56.1, V56.2, V56.3, V56.31, V56.32,
V56.8, E879.1
CPT Procedure codes 90935, 90937,90940, 90945, 90947, 90951-90970, 90989, 90993, 90997,
90999; codes from earlier years: 90918-90925
DRG Codes Prior to FY2007: 302,512
FY2007-present: 652,008
Abbreviations: CPT, current procedural terminology, DRG, diagnosis related group, FY, fiscal year (10/1/06 to 9/30/07), ICD-9-CM, International Classification of Diseases, Ninth Revision, Clinical Modification.
2016 USRDS ANNUAL DATA REPORT | VOLUME 1 – CKD IN THE UNITED STATES
The MEMBER and MEMBER_DETAIL are processed to
create an enrollment table by deleting observations
with data inconsistencies and combining enrollment
periods with a non-coverage gap of less than one
month. Enrollment observations are dropped if: (1) the
year of birth variable, YRDOB, is missing or zero, (2)
the year of the plan coverage effective date, ELIGEFF, is
before the year of birth, (3) the year of plan coverage
effective date is after the year of the death date, (4)
the coverage ending date, ELIGEND, is the same as or
earlier than the coverage start date, or (5) the member
has more than one year of birth reported and they
differ by more than one year. Observations from
MEMBER_DETAIL with overlapping enrollment periods
(defined as ELIGEFF through ELIGEND) are combined
into one. Observations where the gap between the end
date (ELIGEND) of the first period (i.e., observation)
and the start (ELIGEFF) of the second period is less
than one month are also combined, as beneficiaries
with brief coverage lapses do not present as
significantly different than those with continuous
coverage.
Date of death information is provided as month
and year only and not a specific date. Insurance claims
do not have information on death unless the death
occurred during a covered inpatient stay as identified
through the discharge status (DSTATUS). The insurance
company may only be informed that the member’s
coverage has ended. The Clinformatics™ Data Mart is
augmented with data from the Social Security Death
Master File (SSDMF). In November of 2011, however,
some states stopped reporting death information to
the SSDMF, causing a 30% drop in the number of
death records contained in the database
(OptumInsight 2015).
CENTERS FOR MEDICARE AND MEDICAID
SERVICES MEDICARE 5% SAMPLE
These files contain billing data from final action
claims on behalf of Medicare beneficiaries; all
adjustments have been resolved and submitted to
Medicare for reimbursement by health care providers.
CMS and its contractors produce the 5% data sets by
selecting all final action claims for Medicare
beneficiaries whose CMS Health Insurance Claims
(HIC) number has the last two digits of 05, 20, 45, 70
or 95. These five two-digit pairs were randomly
selected to create a sample containing five percent of
the total number of Medicare beneficiaries (Merriman
and Asper, 2007). The sample design has the effect of
creating a built-in longitudinal panel dataset. Once in
the sample, a beneficiary will remain a part of all
future-year data files until death or a change to their
HIC number. Since 2015, the USRDS Coordinating
Center has received the data files from the Medicare
Chronic Conditions Warehouse contractor. The files,
described below, are collectively referred to in the
ADR as the Medicare 5% files. The 2016 ADR includes
all claims for care occurring up to December 31, 2014,
that were submitted and processed by June of 2015.
ENROLLMENT DATA (DENOMINATOR FILE)
Since 2015, we have received two data files from the
Master Beneficiary Summary File—one for Medicare
Parts A and B (MBSF_AB_SUMMARY; formerly called the
Denominator file) and another for Part D
(MBSF_D_CMPNTS). The files provide demographic
information on each beneficiary in the sample, as well
as dates of enrollment in the various Medicare
programs (Hospital Insurance [Part A], Supplemental
Medical Insurance [Part B], Medicare Advantage
managed care plans [Part C] and Prescription Drug
Benefit [Part D]).
MEDICARE PARTS A AND B CLAIMS FILES
Claims files for Medicare Parts A and B were
divided into two groups based on the type of
healthcare provider—institutional or
physician/supplier. Institutional claims were divided
into five sets of files based on the type of medical
service: INPATIENT, OUTPATIENT, and HHA: home
health agency, HOSPICE, and SNF: skilled nursing
facility care. For each type of medical service, we
received six files corresponding to different parts of
the claim (<type of service>_BASE_CLAIMS_J: the base
claim file, <type of service>_REVENUE_CENTER_J: revenue
center file, <type of service>_CONDITION_CODES:
condition code file, <type of service>_OCCURRNCE_CODE:
occurrence code file, <type of service>_SPAN_CODES:
span code file, and <type of service>_VALUE_CODES:
value code file).
Physician and supplier claims (also referred to as
carrier claims) were received in one set for durable
medical equipment (DME) and another for all other
Part B covered services (BCARRIER). For each of these,
we received two files corresponding to different parts
190
VOLUME 1: CKD ANALYTICAL METHODS
of the claim (<type of service>_CLAIMS_J: the base claim
file and <type of service>_LINE_J: the line item file).
MEDICARE PART D FILES
For Part D, we received files on beneficiary
information and claims, as well as information about
plan characteristics and premiums. The
MBSF_D_CMPNTS file, mentioned above, contains
monthly enrollment information for Part D program
participation, type of plan, creditable coverage,
eligibility for cost sharing and low income subsidies,
and additional information. The Part D Events (PDE)
file contains all final action claims for prescription
drugs submitted by pharmacies on behalf of the Part
D beneficiary. This data set contains details about the
drug (name, days supplied, dose, strength, quantity,
etc.) and payment amounts.
In addition to these beneficiary and beneficiary-
prescription fill level datasets, we also received files
containing data about the Part D plan, prescribers,
and pharmacies. For the 2016 ADR, we used the Plan
Characteristics file (PLAN_CHAR) and premium
(PREMIUM) files to report on the coverage gap and
distribution of premiums.
VETERANS ADMINISTRATION HEATH CARE
DATA
The 2016 ADR is the first year we present data on
kidney disease from the Veterans Administration’s
health care system. Data is primarily from the
Corporate Data Warehouse (CDW) supplemented by
laboratory results from the Managerial Cost
Accounting (MCA, formerly Decision Support System,
DSS) National Data Extract LAR file. Data is accessed
through and stored in the VA Informatics and
Computing Infrastructure (VINCI). Data in the CDW
is refreshed nightly from the VA’s electronic medical
record and the analyses in the 2016 ADR are based on
a cohort created by the VINCI data manager on June
24, 2016. Our basic cohort is defined as all patients
with at least one outpatient encounter (a record in the
VISIT table in the OUTPAT domain) during calendar
year 2014. Age, gender, race, and date of death are
taken from the PATIENT .PATIENT table and race was
supplemented with data from the PATSUB.PATIENTRACE
table. Ethnicity was from PATSUB.PATIENTETHNICITY.
In the CDW, various types of inpatient care
provided by the VA are included in the
INPAT.INPATIENT table. These include the stays at
short-term hospitals that are commonly thought of
when referring to hospital care, but also admission to
rehabilitation hospitals, long-term care facilities, and
the VA’s Domiciliary Residential Rehabilitation
Treatment Programs, among others. We identified
short-term hospital stays by requiring the
MEDICALSERVICE variable to have one of the following
values: medicine, surgery, psychiatric, spinal cord
injury, intermediate medicine, or neurology.
Additionally, the Specialty variable must also have a
value related to the type of care provided in short-
term hospitals1.
Serum creatinine laboratory test results were
obtained from the MCA LAR file. The variable
DSSLARNO denotes the type of laboratory test result
in each observation; a value of ‘31’ denotes serum
creatinine. Lab results were categorized using the
result date variable (res_date) rather than the order
date, collection time, or date of the visit associated
with the lab order. Records with text in the result field
(such as COMMENT, CANC, PENDING, etc.) were
dropped, as were those with values less than 0.4
mg/dL or greater than 15.0 mg/dL for the CKD
analyses (20.0 mg/dL for the acute kidney injury
analyses).
1 Contact [email protected] to request a detailed listing of all
SPECIALTY variable values.
2016 USRDS ANNUAL DATA REPORT | VOLUME 1 – CKD IN THE UNITED STATES
ESRD MEDICAL EVIDENCE FORM
The analyses in this volume of the ADR often
exclude patients with ESRD or censor time-dependent
outcomes at the point when a patient reaches ESRD.
To obtain this information on ESRD, we searched the
USRDS ESRD databases for the beneficiaries in the
Medicare 5% files. The date of ESRD was determined
from the ESRD Medical Evidence form (CMS 2728),
the official form for registering ESRD patients, which
must be submitted by dialysis or transplant providers
within 45 days of ESRD initiation. First service date for
ESRD is reported on this form, and for analyses in this
Volume was used as the date when ESRD began. See
Volume 2 for additional information on how the
Medical Evidence form was used in analyses of ESRD
patients.
ESRD DEATH NOTIFICATION FORM
The Master Beneficiary Summary File delivered
with the Medicare 5% sample files contains the date of
death as reported to Medicare. For this volume, we
supplemented this date of death for patients in the
Medicare 5% file who experienced ESRD prior to
death with information from the ESRD Death
Notification form (CMS 2746; the official form for
reporting the death of a patient with ESRD).
According to CMS policy, this form must be submitted
by dialysis or transplant providers within 30 days of a
patient’s death.
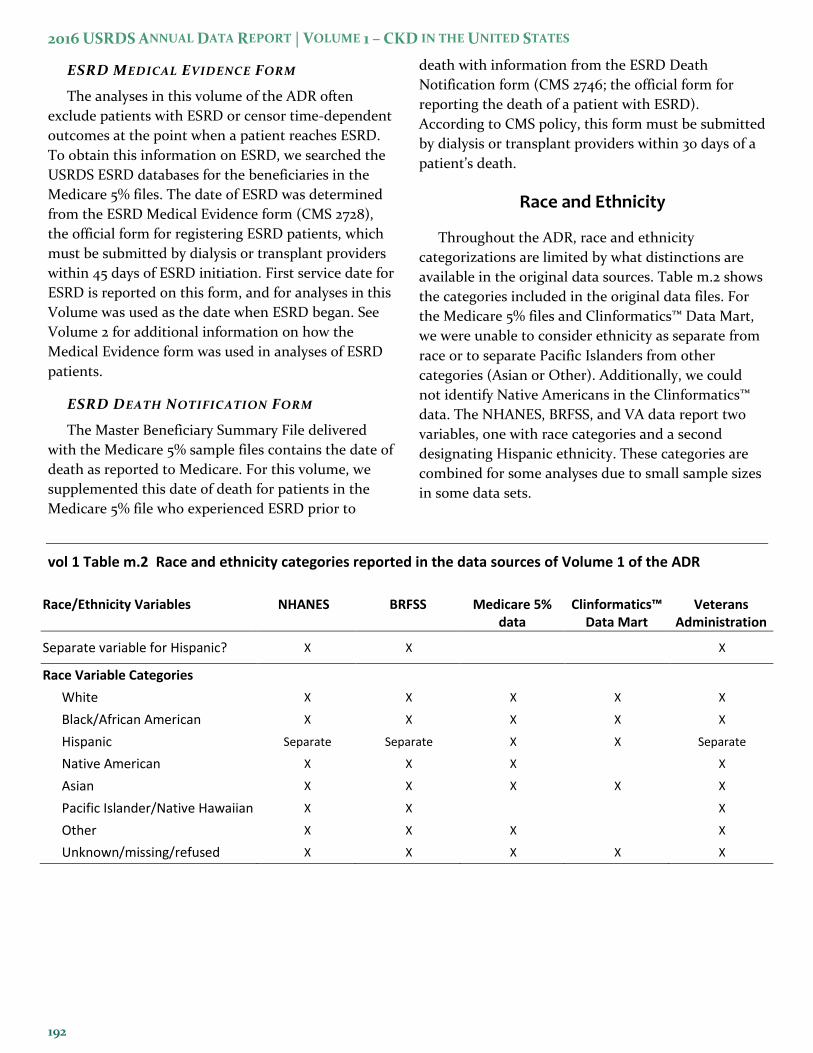
Race and Ethnicity
Throughout the ADR, race and ethnicity
categorizations are limited by what distinctions are
available in the original data sources. Table m.2 shows
the categories included in the original data files. For
the Medicare 5% files and Clinformatics™ Data Mart,
we were unable to consider ethnicity as separate from
race or to separate Pacific Islanders from other
categories (Asian or Other). Additionally, we could
not identify Native Americans in the Clinformatics™
data. The NHANES, BRFSS, and VA data report two
variables, one with race categories and a second
designating Hispanic ethnicity. These categories are
combined for some analyses due to small sample sizes
in some data sets.
vol 1 Table m.2 Race and ethnicity categories reported in the data sources of Volume 1 of the ADR
Race/Ethnicity Variables NHANES BRFSS Medicare 5% data
Clinformatics™ Data Mart
Veterans Administration
Separate variable for Hispanic? X X X
Race Variable Categories
White X X X X X
Black/African American X X X X X
Hispanic Separate Separate X X Separate
Native American X X X X
Asian X X X X X
Pacific Islander/Native Hawaiian X X X
Other X X X X
Unknown/missing/refused X X X X X
192
VOLUME 1: CKD ANALYTICAL METHODS
General Methods for Health Insurance Claim Data Files
For the purpose of analysis, several restrictions
were applied to the claims data files to create a sample
cohort. The specific restrictions used for each figure
and table are detailed in the chapter-specific sections.
The general rationale and explanation of these
restrictions apply to all analyses with the health
system data files, and are detailed here. It is important
to remember that the primary purpose of the data
collection underlying these dataset was to reimburse
health care providers for services performed for
beneficiaries; information that is not necessary to
facilitate payment for services, such as results of lab
tests, family medical history, or health behaviors such
as smoking, generally is not available in the dataset.
PLAN PARTICIPATION
Medicare currently provides medical benefits
through four programs known by the part of Title
XVIII of the Social Security Act that created them—
Part A provides hospital insurance, Part B provides
supplemental medical insurance (including physician
services, durable medical equipment, ambulance,
radiology, and laboratory services), Part C is for
enrollment in managed care plans (which provide all
part A and part B services), and Part D provides
prescription drug coverage (CMS, 2014). Part A
coverage is free to beneficiaries, while the other parts
can have premiums paid by the beneficiary and are
optional. Beneficiaries are also allowed to switch
between original Medicare (fee-for-service) to
Medicare Advantage plans (Part C) during open
enrollment. Medicare Advantage plan providers are
not paid through the claims submission process,
therefore, there are no data in the Medicare 5% claims
files for these patients. Over the course of a year,
people become newly eligible for Medicare (e.g., reach
age 65) and enroll in the program, people die and
therefore are not eligible during part of the year, and
people drop their coverage. To create appropriate
denominators for the statistics that are presented,
samples were often limited to beneficiaries that were
enrolled in both Parts A and B and were not enrolled
in a Medicare Advantage plan (Part C). In the
Clinformatics™ Data Mart, plan enrollment intervals
are provided in the MEMBER_DETAIL table with a start
date (ELIGEFF) and an end date (ELIGEND). In some
analyses for both data sets, the cohort was limited to
patients who met these plan participation
requirement on a certain date, such as January 1 of the
reported year. In other cases the sample may have
been limited to beneficiaries meeting those
enrollment requirements during entire calendar year.
In most analyses that were limited to patients with
a certain disease or disorder, such as CKD, Medicare
beneficiaries must have been enrolled in Parts A and B
and not Part C for the year prior to the reported year
(the entry period or ‘year one’), while Clinformatics™
patients must have been enrolled in their plan for that
time. This ensures that each patient has 12 months of
claims from which to determine the presence of the
disorder. The outcome under analysis was then
determined from claims in the year following the
entry period (‘year two’). Prevalence analyses,
however, were not subject to this requirement and
used claims during the reported year (the typical year
two) to determine the presence of the disorder.
MEDICARE REASON FOR ENTITLEMENT
In this volume, the majority of analyses were
restricted to beneficiaries that were age-eligible for
Medicare and, therefore, aged 65 and older.
Beneficiaries under the age of 65 may have qualified
for Medicare on the basis of disability (meeting
requirements for one of the Social Security
Administration’s income support programs for
disabled individuals) or diagnosis of ESRD (patients
that are excluded from the CKD volume) and are not
representative of the U.S. population of the same age.
In contrast, 98% of the U.S. population aged 65 and
older is eligible for Medicare (McBean, 2012).
However, unlike the chapter-specific figures and
tables, the reference tables for this Volume included
all adult (aged 20 or older), non-ESRD Medicare
beneficiaries regardless of reason for entitlement.
ESRD
As the focus of this volume is on patients that do
not have ESRD, Medicare patients under age 65 who
were only eligible for Medicare due to ESRD were
excluded. The Clinformatics™ Data Mart cannot be
linked to the USRDS ESRD database due to licensing
2016 USRDS ANNUAL DATA REPORT | VOLUME 1 – CKD IN THE UNITED STATES
restrictions, so the identification of ESRD patients is
from diagnosis and procedure codes from claims.
Most analyses for both data sources restrict the
sample to beneficiaries/plan members that did not
have ESRD, either as of a certain date or for the entire
calendar year. Additionally, analyses of time-to-event
outcomes (e.g., mortality, hospitalization,
readmission, time to the performance of a laboratory
test) often censored a patient at the start of ESRD, as
well as at death, or change in plan enrollment (for
Medicare beneficiaries, the disenrollment from Parts
A and B of Medicare, or switch to a Medicare
Advantage plan and for Clinformatics™ patients, the
end of plan participation as reported by the ELIGEND
variable. The start of ESRD was the date of first service
from the CMS 2728 form for Medicare patients and
the date of the first claim with an ESRD diagnosis,
outpatient dialysis procedure, or transplant
hospitalization starting in 2004 for Clinformatics™
plan members.
Identification of Major Comorbidities
According to a previously validated method for
using Medicare claims to identify diabetic patients
(Herbert et al., 1999), a patient is considered diabetic
if, within a one-year observation period, he or she had
a qualifying ICD-9-CM diagnosis code of diabetes
mellitus (DM) on one or more Part A institutional
claims (inpatient, skilled nursing facility, or home
health agency), or two or more institutional
outpatient claims and/or Part B physician/supplier
claims. This algorithm—one inpatient claim, or two
outpatient claims with specified diagnosis codes—was
used to determine the presence of CKD and 13 other
conditions commonly associated with CKD as risk
factors, co-occurring conditions, or consequences of
the disease. This same algorithm was also applied to
the claim data in the Clinformatics™ Data Mart with
the inpatient/outpatient determination made by
determining if the service date fell within an inpatient
confinement defined by the admission and discharge
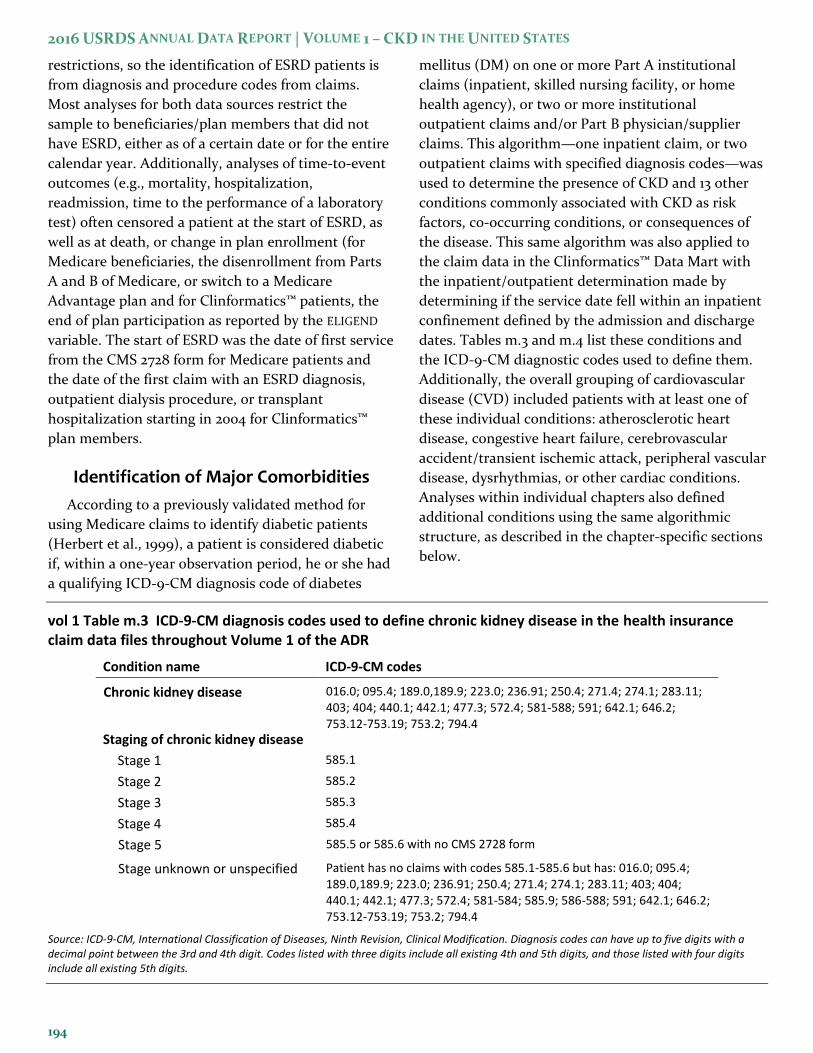
dates. Tables m.3 and m.4 list these conditions and
the ICD-9-CM diagnostic codes used to define them.
Additionally, the overall grouping of cardiovascular
disease (CVD) included patients with at least one of
these individual conditions: atherosclerotic heart
disease, congestive heart failure, cerebrovascular
accident/transient ischemic attack, peripheral vascular
disease, dysrhythmias, or other cardiac conditions.
Analyses within individual chapters also defined
additional conditions using the same algorithmic
structure, as described in the chapter-specific sections
below.
vol 1 Table m.3 ICD-9-CM diagnosis codes used to define chronic kidney disease in the health insurance claim data files throughout Volume 1 of the ADR
Condition name ICD-9-CM codes
Chronic kidney disease 016.0; 095.4; 189.0,189.9; 223.0; 236.91; 250.4; 271.4; 274.1; 283.11; 403; 404; 440.1; 442.1; 477.3; 572.4; 581-588; 591; 642.1; 646.2; 753.12-753.19; 753.2; 794.4
Staging of chronic kidney disease
Stage 1 585.1
Stage 2 585.2
Stage 3 585.3
Stage 4 585.4
Stage 5 585.5 or 585.6 with no CMS 2728 form
Stage unknown or unspecified Patient has no claims with codes 585.1-585.6 but has: 016.0; 095.4; 189.0,189.9; 223.0; 236.91; 250.4; 271.4; 274.1; 283.11; 403; 404; 440.1; 442.1; 477.3; 572.4; 581-584; 585.9; 586-588; 591; 642.1; 646.2; 753.12-753.19; 753.2; 794.4
Source: ICD-9-CM, International Classification of Diseases, Ninth Revision, Clinical Modification. Diagnosis codes can have up to five digits with a decimal point between the 3rd and 4th digit. Codes listed with three digits include all existing 4th and 5th digits, and those listed with four digits include all existing 5th digits.
194
VOLUME 1: CKD ANALYTICAL METHODS
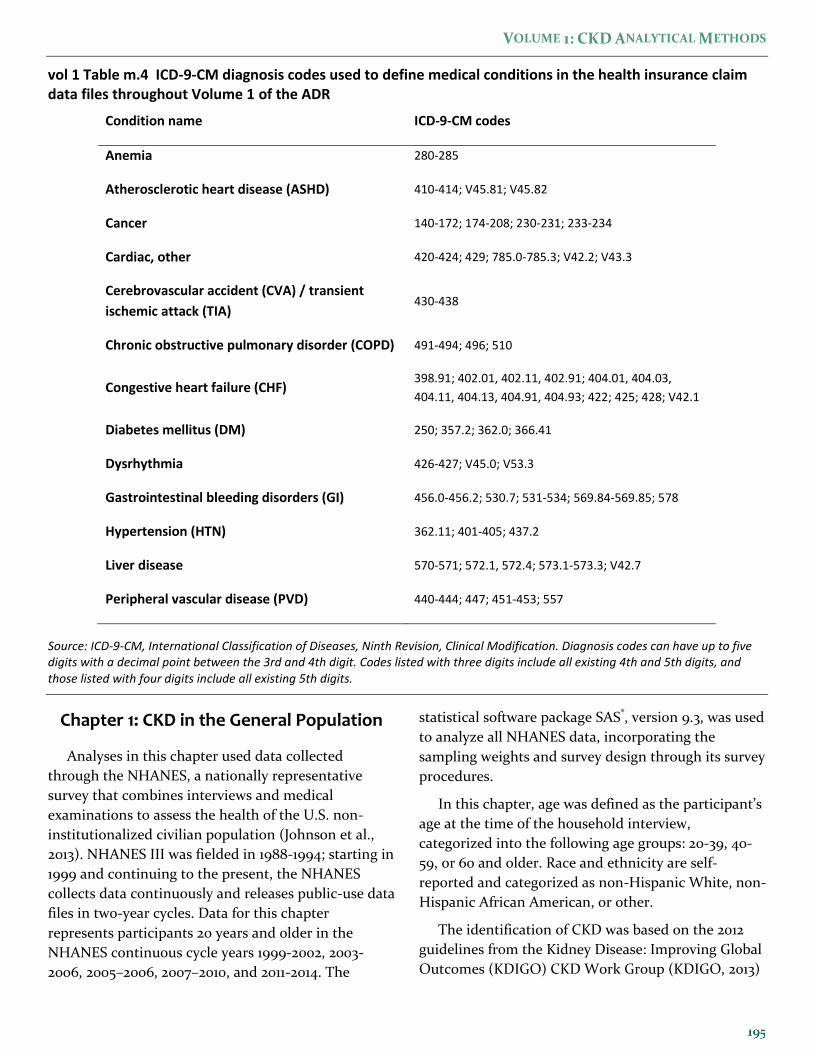
vol 1 Table m.4 ICD-9-CM diagnosis codes used to define medical conditions in the health insurance claim data files throughout Volume 1 of the ADR
Condition name ICD-9-CM codes
Anemia 280-285
Atherosclerotic heart disease (ASHD) 410-414; V45.81; V45.82
Cancer 140-172; 174-208; 230-231; 233-234
Cardiac, other 420-424; 429; 785.0-785.3; V42.2; V43.3
Cerebrovascular accident (CVA) / transient
ischemic attack (TIA) 430-438
Chronic obstructive pulmonary disorder (COPD) 491-494; 496; 510
Congestive heart failure (CHF) 398.91; 402.01, 402.11, 402.91; 404.01, 404.03,
404.11, 404.13, 404.91, 404.93; 422; 425; 428; V42.1
Diabetes mellitus (DM) 250; 357.2; 362.0; 366.41
Dysrhythmia 426-427; V45.0; V53.3
Gastrointestinal bleeding disorders (GI) 456.0-456.2; 530.7; 531-534; 569.84-569.85; 578
Hypertension (HTN) 362.11; 401-405; 437.2
Liver disease 570-571; 572.1, 572.4; 573.1-573.3; V42.7
Peripheral vascular disease (PVD) 440-444; 447; 451-453; 557
Source: ICD-9-CM, International Classification of Diseases, Ninth Revision, Clinical Modification. Diagnosis codes can have up to five digits with a decimal point between the 3rd and 4th digit. Codes listed with three digits include all existing 4th and 5th digits, and those listed with four digits include all existing 5th digits.
Chapter 1: CKD in the General Population
Analyses in this chapter used data collected
through the NHANES, a nationally representative
survey that combines interviews and medical
examinations to assess the health of the U.S. non-
institutionalized civilian population (Johnson et al.,
2013). NHANES III was fielded in 1988-1994; starting in
1999 and continuing to the present, the NHANES
collects data continuously and releases public-use data
files in two-year cycles. Data for this chapter
represents participants 20 years and older in the
NHANES continuous cycle years 1999-2002, 2003-
2006, 2005–2006, 2007–2010, and 2011-2014. The
statistical software package SAS®, version 9.3, was used
to analyze all NHANES data, incorporating the
sampling weights and survey design through its survey
procedures.
In this chapter, age was defined as the participant’s
age at the time of the household interview,
categorized into the following age groups: 20-39, 40-
59, or 60 and older. Race and ethnicity are self-
reported and categorized as non-Hispanic White, non-
Hispanic African American, or other.
The identification of CKD was based on the 2012
guidelines from the Kidney Disease: Improving Global
Outcomes (KDIGO) CKD Work Group (KDIGO, 2013)
2016 USRDS ANNUAL DATA REPORT | VOLUME 1 – CKD IN THE UNITED STATES
implemented with the data available in NHANES.
KDIGO defines CKD as “abnormalities of kidney
structure or function, present for >3 months, with
implications for health.” Decreased glomerular
filtration rate (GFR) is defined as GFR less than 60
ml/min/1.73 m2, which was calculated using the
Chronic Kidney Disease-Epidemiology Collaboration
(CKD-EPI) estimated glomerular filtration rate (eGFR)
equation (Levey et al., 2009). Markers of kidney
damage include albuminuria, a history of kidney
transplantation, and abnormalities as detected by
histology or in urine sediment, electrolytes (due to
tubular disorders), or structure (detected by imaging).
With NHANES data we used the urine albumin
creatinine ratio (ACR) to measure albuminuria, but
did not have information regarding the other markers
of kidney damage. Also, the NHANES only included a
single measurement of both serum creatinine (sCR,
used to generate eGFR) and ACR, so we could not
address the three-month persistence criteria for
defining CKD.
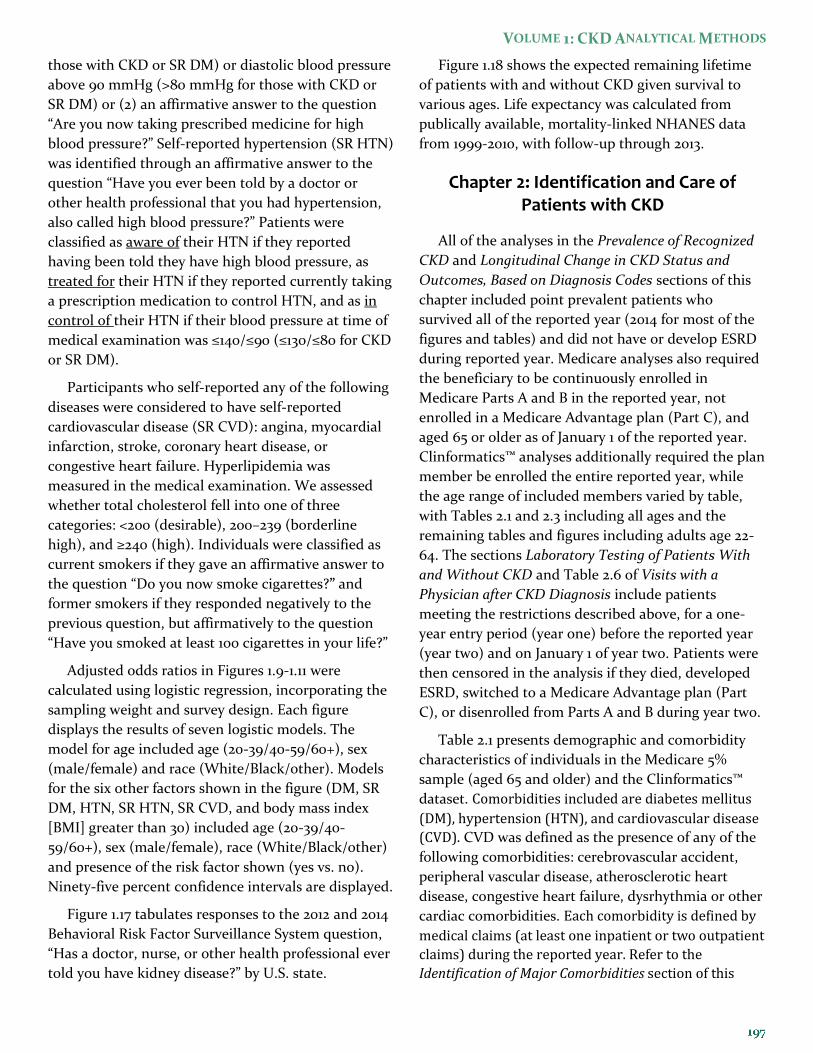
The eGFR (measured in ml/min/1.73 m2) was
calculated using the CKD-EPI equation, based on the
NCHS-recommended standardized creatinine values
(Selvin et al., 2007). The CKD-EPI equation is:
eGFR = 141 ∗ min (sCR
κ, 1)
α
∗ max (sCR
κ, 1)
−1.209
∗ 0.993AGE ∗ 1.018 ∗ F ∗ 1.159 ∗ B
where:
sCR = serum creatinine in mg/dL
к = 0.7 if female, 0.9 if male
α = -0.329 if female, -0.411 if male
F = 1 if female, 0 if male
B = 1 if Black/African American, 0 otherwise
AGE is measured in years
The ACR is the ratio of urinary albumin (mg/L) to
urinary creatinine (mg/dL). Based on an NCHS
suggestion, the urine creatinine value was adjusted to
NHANES 2007-2008 (CDC, 2009).
Staging of CKD was first introduced by the
National Kidney Foundation’s Kidney Disease
Outcomes and Quality Improvement Guidelines in
2002 (NKF, 2002). Following these guidelines, we
defined stages of CKD in this chapter as:
Stage 1: ACR ≥30 and eGFR ≥90
Stage 2: ACR ≥30 and 60 ≤ eGFR <90
Stage 3: 30≤ eGFR <60
Stage 4: 15≤ eGFR <60
Stage 5: eGFR <15
Participants with diabetes mellitus (DM) included
those with any of the following: (1) an affirmative
answer to the question “Have you ever been told by a
doctor or other health professional that you have
diabetes or sugar diabetes (other than during
pregnancy)?”, (2) an affirmative response to either “are
you now taking insulin?” or “are you now taking
diabetic pills to lower your blood sugar?”, or (3)
hemoglobin A1c (HbA1c; glycohemoglobin) ≥7%.
Participants with self-reported diabetes mellitus (SR
DM) were those who reported having been told by a
doctor that they have diabetes or sugar diabetes (other
than during pregnancy). In NHANES 2005–2012,
participants answering “borderline” were classified as
non-diabetic, to agree with NHANES III coding.
Control of DM is assessed as an HbA1c less than 7%.
Patients with hypertension (HTN) were those with
either (1) high blood pressure, defined as systolic
blood pressure above 140 mmHg (>130 mmHg for
196
VOLUME 1: CKD ANALYTICAL METHODS
those with CKD or SR DM) or diastolic blood pressure
above 90 mmHg (>80 mmHg for those with CKD or
SR DM) or (2) an affirmative answer to the question
“Are you now taking prescribed medicine for high
blood pressure?” Self-reported hypertension (SR HTN)
was identified through an affirmative answer to the
question “Have you ever been told by a doctor or
other health professional that you had hypertension,
also called high blood pressure?” Patients were
classified as aware of their HTN if they reported
having been told they have high blood pressure, as
treated for their HTN if they reported currently taking
a prescription medication to control HTN, and as in
control of their HTN if their blood pressure at time of
medical examination was ≤140/≤90 (≤130/≤80 for CKD
or SR DM).
Participants who self-reported any of the following
diseases were considered to have self-reported
cardiovascular disease (SR CVD): angina, myocardial
infarction, stroke, coronary heart disease, or
congestive heart failure. Hyperlipidemia was
measured in the medical examination. We assessed
whether total cholesterol fell into one of three
categories: <200 (desirable), 200–239 (borderline
high), and ≥240 (high). Individuals were classified as
current smokers if they gave an affirmative answer to
the question “Do you now smoke cigarettes?” and
former smokers if they responded negatively to the
previous question, but affirmatively to the question
“Have you smoked at least 100 cigarettes in your life?”
Adjusted odds ratios in Figures 1.9-1.11 were
calculated using logistic regression, incorporating the
sampling weight and survey design. Each figure
displays the results of seven logistic models. The
model for age included age (20-39/40-59/60+), sex
(male/female) and race (White/Black/other). Models
for the six other factors shown in the figure (DM, SR
DM, HTN, SR HTN, SR CVD, and body mass index
[BMI] greater than 30) included age (20-39/40-
59/60+), sex (male/female), race (White/Black/other)
and presence of the risk factor shown (yes vs. no).
Ninety-five percent confidence intervals are displayed.
Figure 1.17 tabulates responses to the 2012 and 2014
Behavioral Risk Factor Surveillance System question,
“Has a doctor, nurse, or other health professional ever
told you have kidney disease?” by U.S. state.
Figure 1.18 shows the expected remaining lifetime
of patients with and without CKD given survival to
various ages. Life expectancy was calculated from
publically available, mortality-linked NHANES data
from 1999-2010, with follow-up through 2013.
Chapter 2: Identification and Care of Patients with CKD
All of the analyses in the Prevalence of Recognized
CKD and Longitudinal Change in CKD Status and
Outcomes, Based on Diagnosis Codes sections of this
chapter included point prevalent patients who
survived all of the reported year (2014 for most of the
figures and tables) and did not have or develop ESRD
during reported year. Medicare analyses also required
the beneficiary to be continuously enrolled in
Medicare Parts A and B in the reported year, not
enrolled in a Medicare Advantage plan (Part C), and
aged 65 or older as of January 1 of the reported year.
Clinformatics™ analyses additionally required the plan
member be enrolled the entire reported year, while
the age range of included members varied by table,
with Tables 2.1 and 2.3 including all ages and the
remaining tables and figures including adults age 22-
64. The sections Laboratory Testing of Patients With
and Without CKD and Table 2.6 of Visits with a
Physician after CKD Diagnosis include patients
meeting the restrictions described above, for a one-
year entry period (year one) before the reported year
(year two) and on January 1 of year two. Patients were
then censored in the analysis if they died, developed
ESRD, switched to a Medicare Advantage plan (Part
C), or disenrolled from Parts A and B during year two.
Table 2.1 presents demographic and comorbidity
characteristics of individuals in the Medicare 5%
sample (aged 65 and older) and the Clinformatics™
dataset. Comorbidities included are diabetes mellitus
(DM), hypertension (HTN), and cardiovascular disease
(CVD). CVD was defined as the presence of any of the
following comorbidities: cerebrovascular accident,
peripheral vascular disease, atherosclerotic heart
disease, congestive heart failure, dysrhythmia or other
cardiac comorbidities. Each comorbidity is defined by
medical claims (at least one inpatient or two outpatient
claims) during the reported year. Refer to the
Identification of Major Comorbidities section of this
2016 USRDS ANNUAL DATA REPORT | VOLUME 1 – CKD IN THE UNITED STATES
chapter for the complete methodology used to identify
these comorbidities and Tables m.3 and m.4 for a list of
ICD-9-CM codes used.
Table 2.2 presents the prevalence of coded CKD,
DM, and CVD in the fee-for-service, age-eligible
Medicare population and patients aged 22-64 in the
Clinformatics™ dataset. Panel A shows the sample
counts and percent of all patients with the condition
for each condition separately. Panel B shows the
interaction between all three conditions identifying
those with all combinations of the conditions.
Table 2.3 shows the unadjusted prevalence of
diagnosed CKD by age, sex (male/female), race
(White/Black/Native American/Asian/Hispanic
[Clinformatics™ only]/other), and comorbidity in 2014.
Comorbidities included were DM, HTN and CVD.
Figure 2.1 illustrates the prevalence of CKD over time
in the fee-for-service, age-eligible Medicare
population—overall (any code) and by CKD stage-
specific codes.
Table 2.4 shows the percent of patients with CKD
by demographic characteristics, among patients
overall, those with DM (with or without HTN), and
those with HTN without DM, in the NHANES (2011-
2014, see the section Chapter 1: CKD in the General
Population in this chapter for methods), the Medicare
5% sample (2014), and the VA (2014). NHANES data
included the 2011-2014 survey years and were restricted
to participants aged 65 or older. CKD was determined
by eGFR<60 ml/min/1.73m2 for the NHANES data, by
ICD-9-CM diagnosis code in the Medicare 5% sample,
and by both methods in the VA data.
Table 2.5 shows progression of kidney disease by
CKD stage, end-stage renal disease (ESRD), or death
in 2013-2014 for the fee-for-service, age-eligible
Medicare population in 2009. The analysis cohort
required patients to be alive and eligible for Medicare
Parts A and B with no HMO coverage for all of 2009.
Death and ESRD status were examined yearly between
2010 and 2014, and carried forward if present. In the
2016 ADR, the ESRD and death information are
combined to create the three categories of ESRD-
Alive, ESRD-Death, and Death without ESRD. For
patients without death or ESRD by 2014 the last CKD
diagnosis claim in 2014 was used; if this was not
available, the last CKD diagnosis claim from 2013 was
used. Lost to follow-up status represents the patients
who were not enrolled in Medicare Part A and B
during 2013 or 2014 and who had no indication of
death or ESRD.
Figures 2.2–2.3 show statistics on laboratory testing
for serum creatinine and urine albumin among various
patient populations and by patient characteristics. For
these analyses, a one-year period was used to define
comorbid conditions (year one) and laboratory testing
was assessed in the following year (year two, the year
reported in the figures). Patients must have had
Medicare Parts A and B coverage, no Part C
participation (Medicare Advantage plans), no ESRD,
and have been alive for all of year one through to
January 1 of year two. Additionally, the sample was
limited to patients residing in the 50 states, the
District of Columbia, Puerto Rico, or the U.S.
territories. First urinary microalbumin measurement
was defined as the first claim with a Healthcare
Common Procedure Coding System (HCPCS, similar
to the Current Procedural Terminology, CPT®, system)
code of 82042, 82043, 82044, or 84156. Likewise, first
serum creatinine measurement was defined as the first
claim with a HCPCS code of 80047, 80048, 80049,
80050, 80053, 80054, 80069, or 82565.
Figures 2.3 and 2.4 show the proportion of patients
tested across time, from 2000-2013 for patients with
(Figure 2.4) and without (Figure 2.3) CKD. Figures 2.5
and 2.6 show the adjusted prevalence of testing in 2013
for those with (Figure 2.6) and without (Figure 2.5)
CKD, by comorbidity status: (1) the patient has neither
DM nor HTN; (2) the patient has HTN but not DM;
(3) the patient has DM but not HTN; and (4) the
patient has both DM and HTN. Adjustments were
made for age (65-<75/75-<85/85+), sex (male/female),
and race (White/Black/Native American/Asian
/Hispanic/other/unknown).
Table 2.6 examined physician visits in the year after
a diagnosis of CKD. Similar to the laboratory testing,
the sample included patients who were alive, without
ESRD, did not have a Medicare Advantage plan, and
had both Parts A and B coverage for all of 2012. The
date of the earliest CKD claim (any CKD or Stage 3/4/5
[585.3–585.6]) in 2012 was used as the date of CKD
diagnosis, and claims were then searched for services
provided by primary care physicians, nephrologists,
and cardiologists for the 365 days following that date.
198
VOLUME 1: CKD ANALYTICAL METHODS
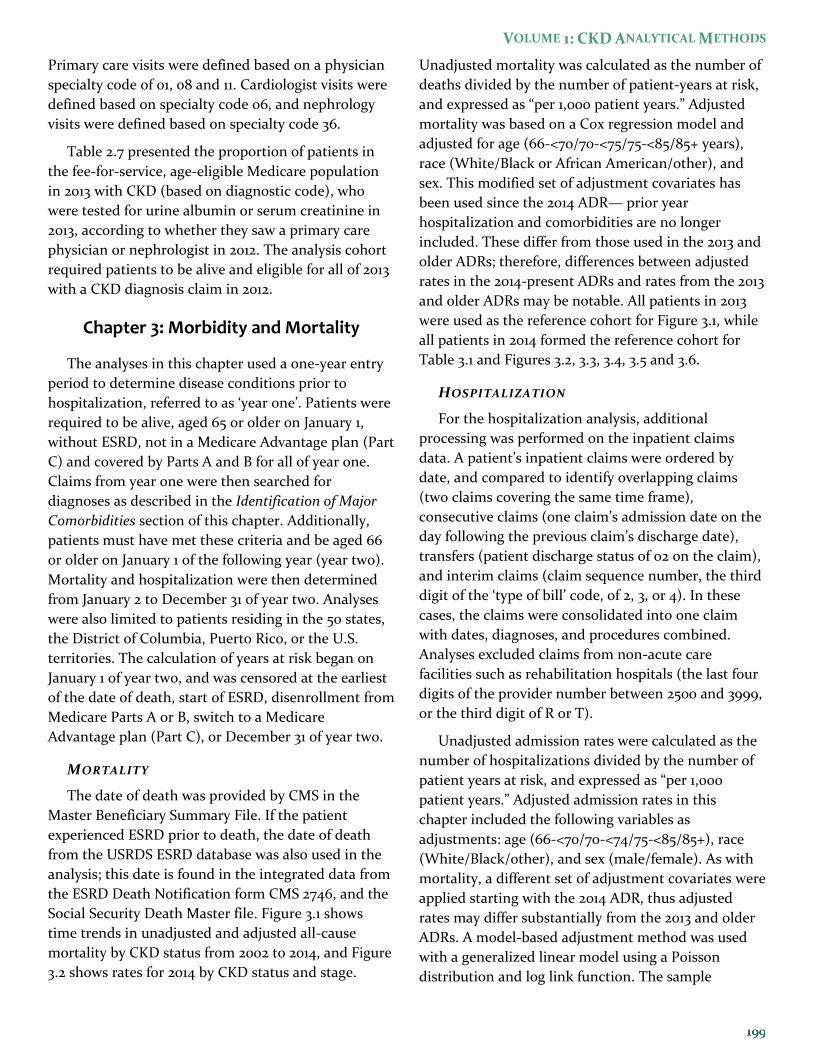
Primary care visits were defined based on a physician
specialty code of 01, 08 and 11. Cardiologist visits were
defined based on specialty code 06, and nephrology
visits were defined based on specialty code 36.
Table 2.7 presented the proportion of patients in
the fee-for-service, age-eligible Medicare population
in 2013 with CKD (based on diagnostic code), who
were tested for urine albumin or serum creatinine in
2013, according to whether they saw a primary care
physician or nephrologist in 2012. The analysis cohort
required patients to be alive and eligible for all of 2013
with a CKD diagnosis claim in 2012.
Chapter 3: Morbidity and Mortality
The analyses in this chapter used a one-year entry
period to determine disease conditions prior to
hospitalization, referred to as ‘year one’. Patients were
required to be alive, aged 65 or older on January 1,
without ESRD, not in a Medicare Advantage plan (Part
C) and covered by Parts A and B for all of year one.
Claims from year one were then searched for
diagnoses as described in the Identification of Major
Comorbidities section of this chapter. Additionally,
patients must have met these criteria and be aged 66
or older on January 1 of the following year (year two).
Mortality and hospitalization were then determined
from January 2 to December 31 of year two. Analyses
were also limited to patients residing in the 50 states,
the District of Columbia, Puerto Rico, or the U.S.
territories. The calculation of years at risk began on
January 1 of year two, and was censored at the earliest
of the date of death, start of ESRD, disenrollment from
Medicare Parts A or B, switch to a Medicare
Advantage plan (Part C), or December 31 of year two.
MORTALITY
The date of death was provided by CMS in the
Master Beneficiary Summary File. If the patient
experienced ESRD prior to death, the date of death
from the USRDS ESRD database was also used in the
analysis; this date is found in the integrated data from
the ESRD Death Notification form CMS 2746, and the
Social Security Death Master file. Figure 3.1 shows
time trends in unadjusted and adjusted all-cause
mortality by CKD status from 2002 to 2014, and Figure
3.2 shows rates for 2014 by CKD status and stage.
Unadjusted mortality was calculated as the number of
deaths divided by the number of patient-years at risk,
and expressed as “per 1,000 patient years.” Adjusted
mortality was based on a Cox regression model and
adjusted for age (66-<70/70-<75/75-<85/85+ years),
race (White/Black or African American/other), and
sex. This modified set of adjustment covariates has
been used since the 2014 ADR— prior year
hospitalization and comorbidities are no longer
included. These differ from those used in the 2013 and
older ADRs; therefore, differences between adjusted
rates in the 2014-present ADRs and rates from the 2013
and older ADRs may be notable. All patients in 2013
were used as the reference cohort for Figure 3.1, while
all patients in 2014 formed the reference cohort for
Table 3.1 and Figures 3.2, 3.3, 3.4, 3.5 and 3.6.
HOSPITALIZATION
For the hospitalization analysis, additional
processing was performed on the inpatient claims
data. A patient’s inpatient claims were ordered by
date, and compared to identify overlapping claims
(two claims covering the same time frame),
consecutive claims (one claim’s admission date on the
day following the previous claim’s discharge date),
transfers (patient discharge status of 02 on the claim),
and interim claims (claim sequence number, the third
digit of the ‘type of bill’ code, of 2, 3, or 4). In these
cases, the claims were consolidated into one claim
with dates, diagnoses, and procedures combined.
Analyses excluded claims from non-acute care
facilities such as rehabilitation hospitals (the last four
digits of the provider number between 2500 and 3999,
or the third digit of R or T).
Unadjusted admission rates were calculated as the
number of hospitalizations divided by the number of
patient years at risk, and expressed as “per 1,000
patient years.” Adjusted admission rates in this
chapter included the following variables as
adjustments: age (66-<70/70-<74/75-<85/85+), race
(White/Black/other), and sex (male/female). As with
mortality, a different set of adjustment covariates were
applied starting with the 2014 ADR, thus adjusted
rates may differ substantially from the 2013 and older
ADRs. A model-based adjustment method was used
with a generalized linear model using a Poisson
distribution and log link function. The sample
2016 USRDS ANNUAL DATA REPORT | VOLUME 1 – CKD IN THE UNITED STATES
included data from the current and previous two
years, with respective weights of 1.0, 0.25 and 0.125.
Adjusted rates reflected the distribution of a reference
cohort, specified below in the discussion of the
respective figures. With this method, the parameter
estimates from the model were used to calculate an
estimated admission rate for each patient in the
reference cohort. Overall adjusted rates were then
computed as the weighted average of these individual
rates, using the time at risk of each patient in the
reference cohort as the weight.
Table 3.2 and Figures 3.7, 3.8, and 3.12-3.15 show
adjusted all-cause admission rates for fee-for-service
Medicare patients aged 66 and older. Table 3.2 also
shows the unadjusted rates. As mentioned above,
diabetes and cardiovascular disease were ascertained
in 2013 for the analysis of hospital admissions in 2014,
as described in the Identification of Major
Comorbidities section of this chapter. All patients
must have been 66 years or older, not have had ESRD
on 1/1/2014, had Medicare Parts A and B coverage for
all of 2013 and on 1/1/2014, and were not participating
in a Medicare Advantage plan from 1/1/2013 through
1/1/2014. Rates presented by one factor were adjusted
for the others. The reference cohort included
Medicare patients in 2014, aged 66 and older.
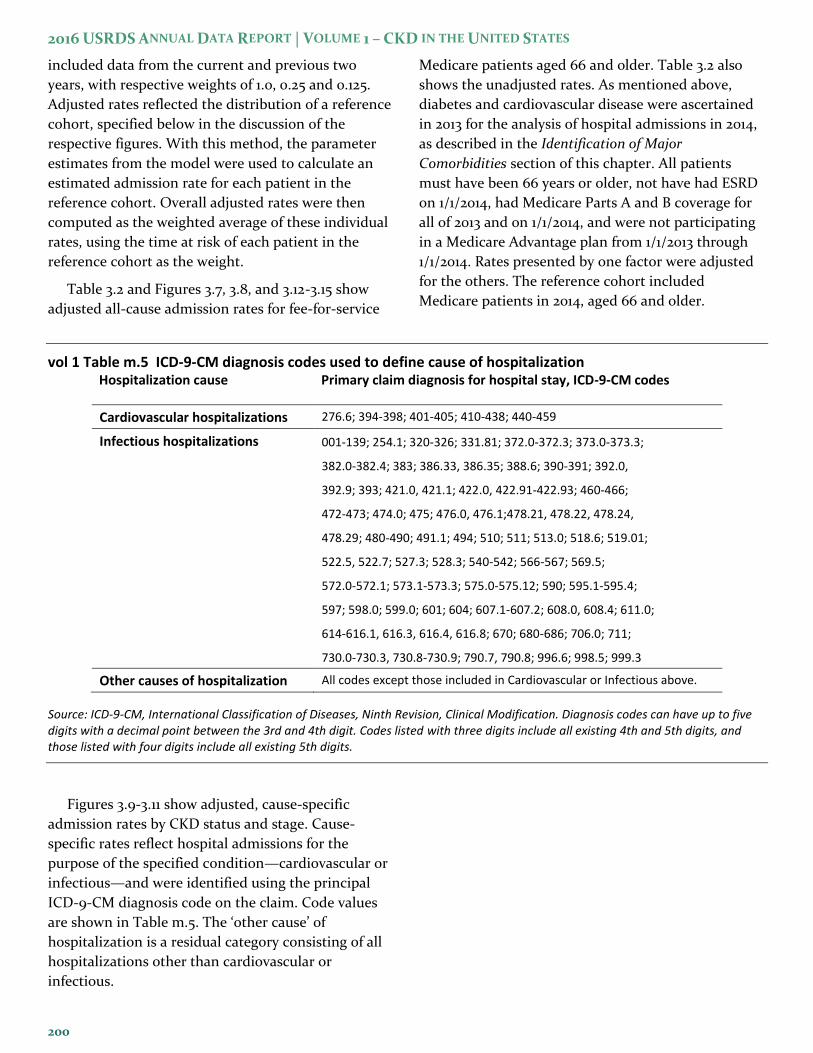
vol 1 Table m.5 ICD-9-CM diagnosis codes used to define cause of hospitalization Hospitalization cause Primary claim diagnosis for hospital stay, ICD-9-CM codes
Cardiovascular hospitalizations 276.6; 394-398; 401-405; 410-438; 440-459
Infectious hospitalizations 001-139; 254.1; 320-326; 331.81; 372.0-372.3; 373.0-373.3;
382.0-382.4; 383; 386.33, 386.35; 388.6; 390-391; 392.0,
392.9; 393; 421.0, 421.1; 422.0, 422.91-422.93; 460-466;
472-473; 474.0; 475; 476.0, 476.1;478.21, 478.22, 478.24,
478.29; 480-490; 491.1; 494; 510; 511; 513.0; 518.6; 519.01;
522.5, 522.7; 527.3; 528.3; 540-542; 566-567; 569.5;
572.0-572.1; 573.1-573.3; 575.0-575.12; 590; 595.1-595.4;
597; 598.0; 599.0; 601; 604; 607.1-607.2; 608.0, 608.4; 611.0;
614-616.1, 616.3, 616.4, 616.8; 670; 680-686; 706.0; 711;
730.0-730.3, 730.8-730.9; 790.7, 790.8; 996.6; 998.5; 999.3
Other causes of hospitalization All codes except those included in Cardiovascular or Infectious above.
Source: ICD-9-CM, International Classification of Diseases, Ninth Revision, Clinical Modification. Diagnosis codes can have up to five digits with a decimal point between the 3rd and 4th digit. Codes listed with three digits include all existing 4th and 5th digits, and those listed with four digits include all existing 5th digits.
Figures 3.9-3.11 show adjusted, cause-specific
admission rates by CKD status and stage. Cause-
specific rates reflect hospital admissions for the
purpose of the specified condition—cardiovascular or
infectious—and were identified using the principal
ICD-9-CM diagnosis code on the claim. Code values
are shown in Table m.5. The ‘other cause’ of
hospitalization is a residual category consisting of all
hospitalizations other than cardiovascular or
infectious.
200
VOLUME 1: CKD ANALYTICAL METHODS
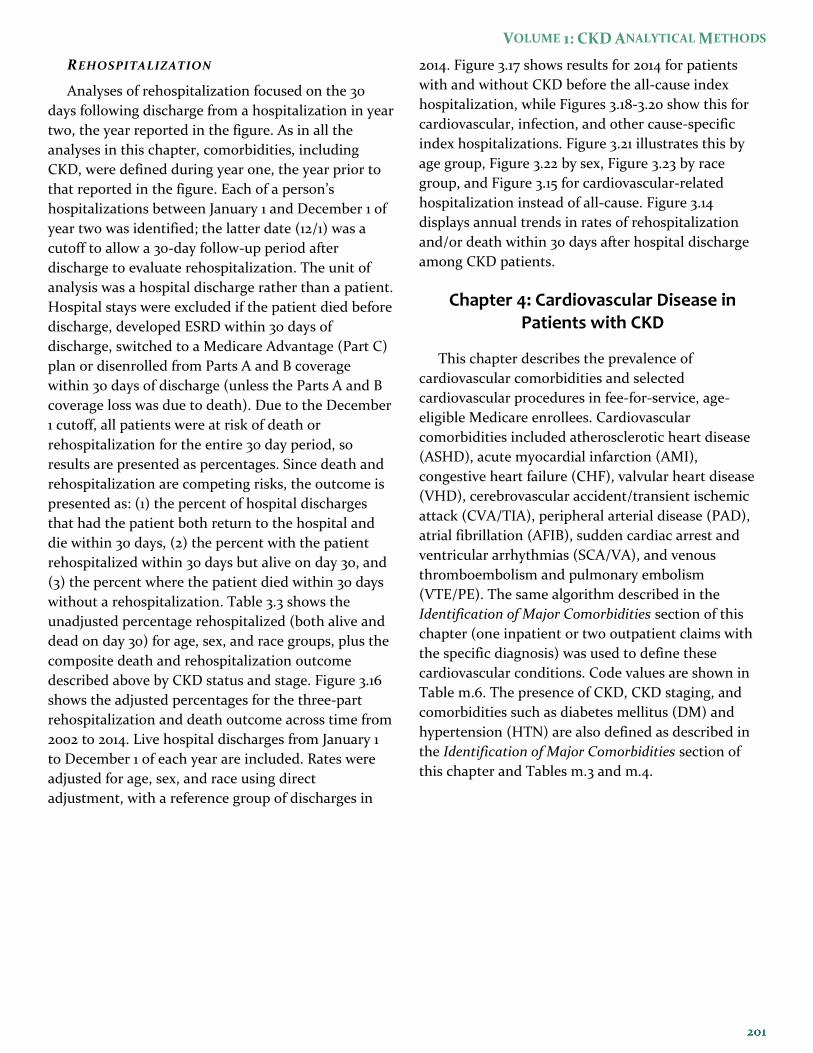
REHOSPITALIZATION
Analyses of rehospitalization focused on the 30
days following discharge from a hospitalization in year
two, the year reported in the figure. As in all the
analyses in this chapter, comorbidities, including
CKD, were defined during year one, the year prior to
that reported in the figure. Each of a person’s
hospitalizations between January 1 and December 1 of
year two was identified; the latter date (12/1) was a
cutoff to allow a 30-day follow-up period after
discharge to evaluate rehospitalization. The unit of
analysis was a hospital discharge rather than a patient.
Hospital stays were excluded if the patient died before
discharge, developed ESRD within 30 days of
discharge, switched to a Medicare Advantage (Part C)
plan or disenrolled from Parts A and B coverage
within 30 days of discharge (unless the Parts A and B
coverage loss was due to death). Due to the December
1 cutoff, all patients were at risk of death or
rehospitalization for the entire 30 day period, so
results are presented as percentages. Since death and
rehospitalization are competing risks, the outcome is
presented as: (1) the percent of hospital discharges
that had the patient both return to the hospital and
die within 30 days, (2) the percent with the patient
rehospitalized within 30 days but alive on day 30, and
(3) the percent where the patient died within 30 days
without a rehospitalization. Table 3.3 shows the
unadjusted percentage rehospitalized (both alive and
dead on day 30) for age, sex, and race groups, plus the
composite death and rehospitalization outcome
described above by CKD status and stage. Figure 3.16
shows the adjusted percentages for the three-part
rehospitalization and death outcome across time from
2002 to 2014. Live hospital discharges from January 1
to December 1 of each year are included. Rates were
adjusted for age, sex, and race using direct
adjustment, with a reference group of discharges in
2014. Figure 3.17 shows results for 2014 for patients
with and without CKD before the all-cause index
hospitalization, while Figures 3.18-3.20 show this for
cardiovascular, infection, and other cause-specific
index hospitalizations. Figure 3.21 illustrates this by
age group, Figure 3.22 by sex, Figure 3.23 by race
group, and Figure 3.15 for cardiovascular-related
hospitalization instead of all-cause. Figure 3.14
displays annual trends in rates of rehospitalization
and/or death within 30 days after hospital discharge
among CKD patients.
Chapter 4: Cardiovascular Disease in Patients with CKD
This chapter describes the prevalence of
cardiovascular comorbidities and selected
cardiovascular procedures in fee-for-service, age-
eligible Medicare enrollees. Cardiovascular
comorbidities included atherosclerotic heart disease
(ASHD), acute myocardial infarction (AMI),
congestive heart failure (CHF), valvular heart disease
(VHD), cerebrovascular accident/transient ischemic
attack (CVA/TIA), peripheral arterial disease (PAD),
atrial fibrillation (AFIB), sudden cardiac arrest and
ventricular arrhythmias (SCA/VA), and venous
thromboembolism and pulmonary embolism
(VTE/PE). The same algorithm described in the
Identification of Major Comorbidities section of this
chapter (one inpatient or two outpatient claims with
the specific diagnosis) was used to define these
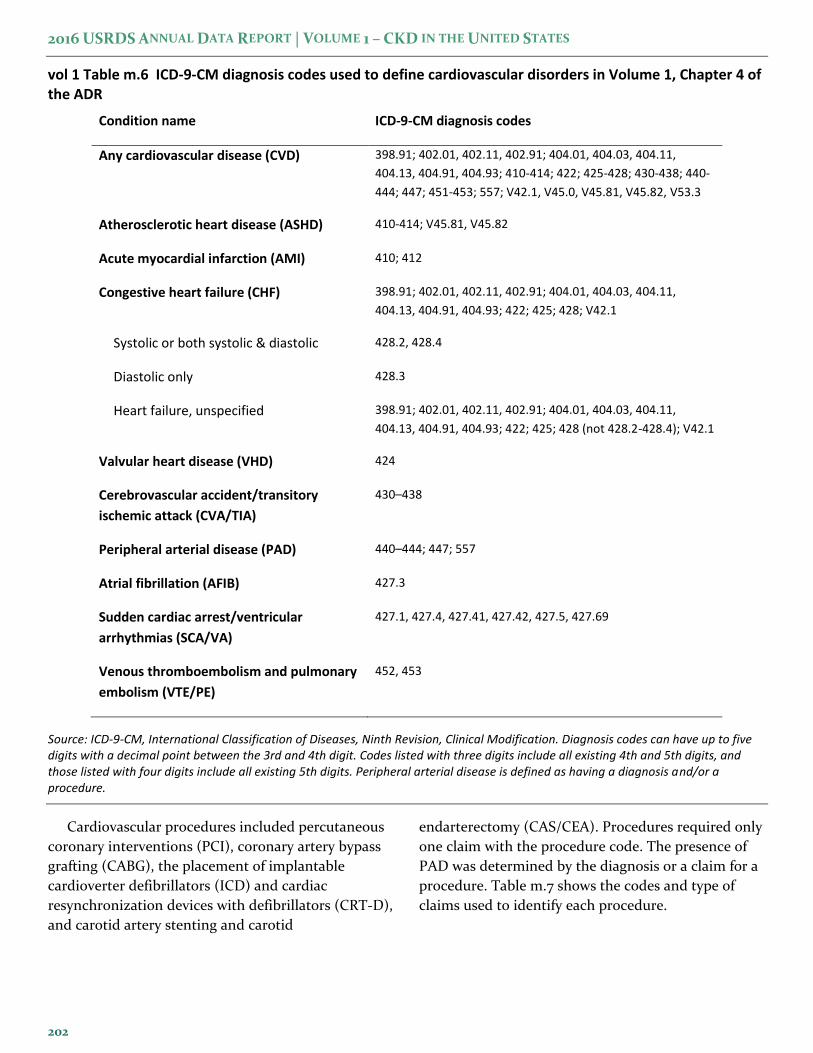
cardiovascular conditions. Code values are shown in
Table m.6. The presence of CKD, CKD staging, and
comorbidities such as diabetes mellitus (DM) and
hypertension (HTN) are also defined as described in
the Identification of Major Comorbidities section of
this chapter and Tables m.3 and m.4.
2016 USRDS ANNUAL DATA REPORT | VOLUME 1 – CKD IN THE UNITED STATES
vol 1 Table m.6 ICD-9-CM diagnosis codes used to define cardiovascular disorders in Volume 1, Chapter 4 of the ADR
Condition name ICD-9-CM diagnosis codes
Any cardiovascular disease (CVD) 398.91; 402.01, 402.11, 402.91; 404.01, 404.03, 404.11,
404.13, 404.91, 404.93; 410-414; 422; 425-428; 430-438; 440-
444; 447; 451-453; 557; V42.1, V45.0, V45.81, V45.82, V53.3
Atherosclerotic heart disease (ASHD) 410-414; V45.81, V45.82
Acute myocardial infarction (AMI) 410; 412
Congestive heart failure (CHF) 398.91; 402.01, 402.11, 402.91; 404.01, 404.03, 404.11,
404.13, 404.91, 404.93; 422; 425; 428; V42.1
Systolic or both systolic & diastolic 428.2, 428.4
Diastolic only 428.3
Heart failure, unspecified 398.91; 402.01, 402.11, 402.91; 404.01, 404.03, 404.11,
404.13, 404.91, 404.93; 422; 425; 428 (not 428.2-428.4); V42.1
Valvular heart disease (VHD) 424
Cerebrovascular accident/transitory
ischemic attack (CVA/TIA)
430–438
Peripheral arterial disease (PAD) 440–444; 447; 557
Atrial fibrillation (AFIB) 427.3
Sudden cardiac arrest/ventricular
arrhythmias (SCA/VA)
427.1, 427.4, 427.41, 427.42, 427.5, 427.69
Venous thromboembolism and pulmonary
embolism (VTE/PE)
452, 453
Source: ICD-9-CM, International Classification of Diseases, Ninth Revision, Clinical Modification. Diagnosis codes can have up to five digits with a decimal point between the 3rd and 4th digit. Codes listed with three digits include all existing 4th and 5th digits, and those listed with four digits include all existing 5th digits. Peripheral arterial disease is defined as having a diagnosis and/or a procedure.
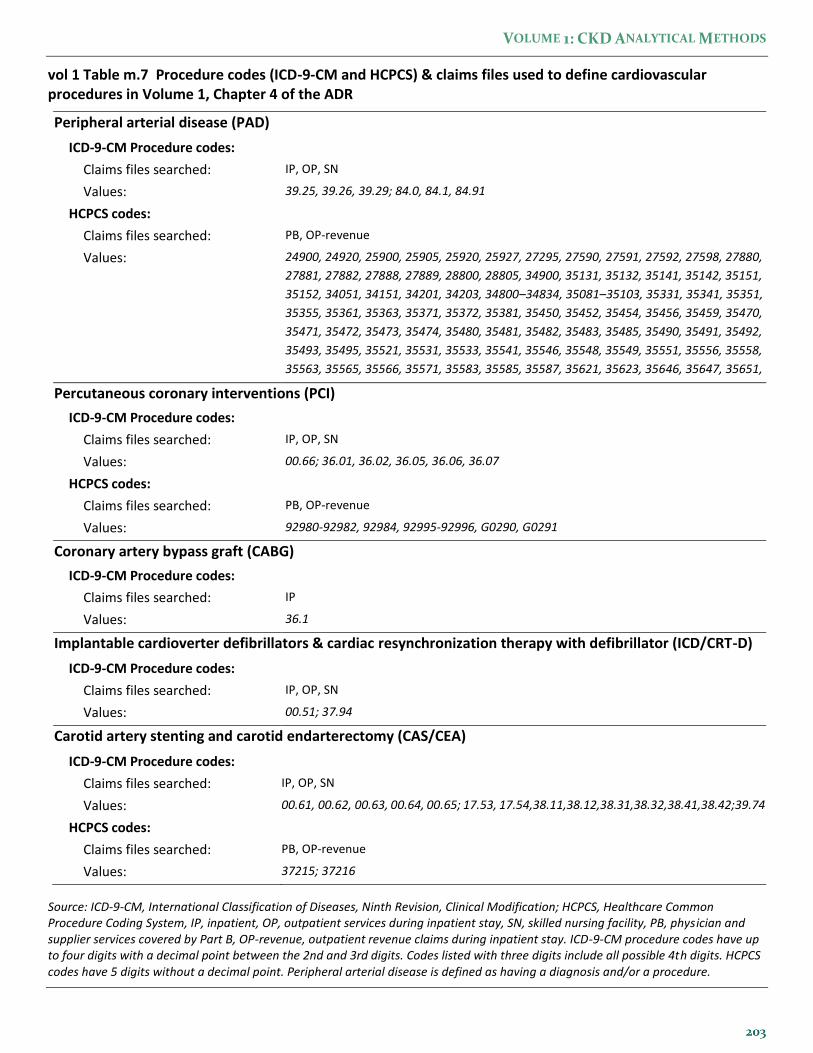
Cardiovascular procedures included percutaneous
coronary interventions (PCI), coronary artery bypass
grafting (CABG), the placement of implantable
cardioverter defibrillators (ICD) and cardiac
resynchronization devices with defibrillators (CRT-D),
and carotid artery stenting and carotid
endarterectomy (CAS/CEA). Procedures required only
one claim with the procedure code. The presence of
PAD was determined by the diagnosis or a claim for a
procedure. Table m.7 shows the codes and type of
claims used to identify each procedure.
202
VOLUME 1: CKD ANALYTICAL METHODS
vol 1 Table m.7 Procedure codes (ICD-9-CM and HCPCS) & claims files used to define cardiovascular procedures in Volume 1, Chapter 4 of the ADR
Peripheral arterial disease (PAD)
ICD-9-CM Procedure codes:
Claims files searched: IP, OP, SN
Values: 39.25, 39.26, 39.29; 84.0, 84.1, 84.91
HCPCS codes:
Claims files searched: PB, OP-revenue
Values: 24900, 24920, 25900, 25905, 25920, 25927, 27295, 27590, 27591, 27592, 27598, 27880,
27881, 27882, 27888, 27889, 28800, 28805, 34900, 35131, 35132, 35141, 35142, 35151,
35152, 34051, 34151, 34201, 34203, 34800–34834, 35081–35103, 35331, 35341, 35351,
35355, 35361, 35363, 35371, 35372, 35381, 35450, 35452, 35454, 35456, 35459, 35470,
35471, 35472, 35473, 35474, 35480, 35481, 35482, 35483, 35485, 35490, 35491, 35492,
35493, 35495, 35521, 35531, 35533, 35541, 35546, 35548, 35549, 35551, 35556, 35558,
35563, 35565, 35566, 35571, 35583, 35585, 35587, 35621, 35623, 35646, 35647, 35651,
35654, 35656, 35661, 35663, 35665, 35666, 35671 Percutaneous coronary interventions (PCI)
ICD-9-CM Procedure codes:
Claims files searched: IP, OP, SN
Values: 00.66; 36.01, 36.02, 36.05, 36.06, 36.07
HCPCS codes:
Claims files searched: PB, OP-revenue
Values: 92980-92982, 92984, 92995-92996, G0290, G0291
Coronary artery bypass graft (CABG)
ICD-9-CM Procedure codes:
Claims files searched: IP
Values: 36.1
Implantable cardioverter defibrillators & cardiac resynchronization therapy with defibrillator (ICD/CRT-D)
ICD-9-CM Procedure codes:
Claims files searched: IP, OP, SN
Values: 00.51; 37.94
Carotid artery stenting and carotid endarterectomy (CAS/CEA)
ICD-9-CM Procedure codes:
Claims files searched: IP, OP, SN
Values: 00.61, 00.62, 00.63, 00.64, 00.65; 17.53, 17.54,38.11,38.12,38.31,38.32,38.41,38.42;39.74
HCPCS codes:
Claims files searched: PB, OP-revenue
Values: 37215; 37216
Source: ICD-9-CM, International Classification of Diseases, Ninth Revision, Clinical Modification; HCPCS, Healthcare Common Procedure Coding System, IP, inpatient, OP, outpatient services during inpatient stay, SN, skilled nursing facility, PB, physician and supplier services covered by Part B, OP-revenue, outpatient revenue claims during inpatient stay. ICD-9-CM procedure codes have up to four digits with a decimal point between the 2nd and 3rd digits. Codes listed with three digits include all possible 4th digits. HCPCS codes have 5 digits without a decimal point. Peripheral arterial disease is defined as having a diagnosis and/or a procedure.
2016 USRDS ANNUAL DATA REPORT | VOLUME 1 – CKD IN THE UNITED STATES
CARDIOVASCULAR DISEASE PREVALENCE AND
OUTCOMES IN CKD
For Figure 4.1, the study cohort included Medicare
enrollees who were alive, aged 66 and older, resided in
the 50 states, the District of Columbia, Puerto Rico, or
the U.S. territories, did not have ESRD on December
31, 2014, and who were continuously enrolled in
Medicare Parts A and B and not enrolled in a
Medicare Advantage plan (Part C) for all of 2014.
Cardiovascular conditions, CKD, and CKD staging
were determined from claims in 2014.
Table 4.1 presents the prevalence data shown in
Figure 4.1 by age, race, sex, and CKD status (Panel a),
and presents data on cardiovascular procedures
performed in 2014 (Panel b). The cohort was the same
as that used for Figure 4.1. However, the denominators
for the cardiovascular procedures were not “all
patients in the cohort”, which was the denominator
for the prevalence statistics. The percent with PCI or
CABG were out of cohort members with ASHD, the
percent with ICD/CRT-D was out of cohort members
with CHF, and the percent with CAS/CEA was out of
the cohort members with ASHD, CVA or PAD.
Figures 4.2 and 4.3 present the unadjusted, two-
year survival of patients with cardiovascular
conditions (Figure 4.2) or cardiovascular procedures
(Figure 4.3). The methods for calculating these figures
have changed for this 2016 ADR; conditions are
assessed in a baseline year (2012), the origin for
survival time is January 1 of the following year
(1/1/2013), and there is no attempt to isolate incident
diagnoses, so all the diagnosis codes listed for CHF in
Table m.6 are used to define CHF for Figure 4.2.
Methods for the procedures in Figure 4.3 are the same
as in past years.
To form the study cohort for each condition in
Figure 4.2, Medicare claims from 2012 were searched
for the diagnoses (and procedure codes for PAD)
specified in Tables m.6 and m.7. To be retained in the
analysis cohort, the patient must have been alive
without ESRD and aged 66 or older on 1/1/2013, and
resided in the 50 states, the District of Columbia,
Puerto Rico, or the U.S. territories, was enrolled in
Medicare Parts A and B, and not enrolled in a
Medicare Advantage plan (Part C) for all of 2012.
Patients were then followed from 1/1/2013 until the
earliest of date of death, ESRD diagnosis, or December
31, 2014. The Kaplan-Meier method was used to
estimate survival.
To form the study cohort for each procedure in
Figure 4.3, Medicare claims from 1/1/2011 through
12/31/2014 were searched for the procedure codes
specified in Tables m.7, and the date of the first claim
with a specified code was considered the index date.
To be retained in the analysis cohort, the patient must
have been aged 66 or older on the index date, resided
in the 50 states, the District of Columbia, Puerto Rico,
or the U.S. territories, was enrolled in Medicare Parts
A and B, and not enrolled in a Medicare Advantage
plan (Part C). Patients with ESRD on or before the
index date were excluded. Claims for the patient in the
365 days prior to the index date were then searched
for a prior occurrence of the given
condition/procedure, and these patients were
excluded from the analysis. CKD status and stage were
also determined from the patient’s claims in the 365
days prior to the index date. Patients were then
followed from the index date until the earliest of date
of death, three years after the index date, ESRD
diagnosis, or December 31, 2014. The Kaplan-Meier
method was used to estimate survival.
CONGESTIVE HEART FAILURE AND CHRONIC
KIDNEY DISEASE
The type of heart failure for the calendar year was
determined by frequency of diagnoses and a hierarchy.
The presence of systolic (428.2x or 428.4), diastolic
(428.3x) and unspecified (all other CHF diagnosis
codes in Table m.6) diagnoses was determined by
searching all reported diagnoses on all claims for a
given calendar day. Each day was counted as systolic if
there were any systolic diagnoses, as diastolic if there
were no systolic diagnoses but at least one diastolic
diagnosis, and as unspecified if there were no systolic
or diastolic diagnoses but at least one unspecified
diagnosis. The number of days with systolic, diastolic,
and unspecified diagnoses was then summed for the
calendar year. The patient’s type of heart failure for
the year was then determined by a hierarchy similar to
that applied for each calendar day: if the patient had
any systolic heart failure and no diastolic-only heart
failure, he/she was classified as systolic heart failure; if
the patient had diastolic heart failure and no systolic,
he/she was classified as diastolic heart failure; and if
204
VOLUME 1: CKD ANALYTICAL METHODS
the patient had only unspecified heart failure, he/she
was classified as unspecified heart failure. When a
patient had both systolic and diastolic-only diagnosis
days during the year, he/she was assigned to the heart
failure type that was most frequent during the year.
Figure 4.4 shows the distribution of heart failure
type by CKD status in 2014. The study cohort included
Medicare enrollees who were alive, aged 66 and older,
resided in the 50 states, the District of Columbia,
Puerto Rico, or the U.S. territories, who did not have
ESRD on December 31, 2014, and who were
continuously enrolled in Medicare Parts A and B and
not enrolled in a Medicare Advantage plan (Part C) for
all of 2014. The denominators were the total numbers
of patients in each CKD status or stage group, and the
numerators were the numbers of patients with the
given heart failure type within that CKD status or
stage group.
Figure 4.5 presents the adjusted, two-year survival
of patients with and without CKD and CHF. The
adjusted probability of survival was calculated using
the results of a Cox model, in which significant factors
included age group, sex, race, diabetic (DM) status,
hypertension (HTN) status, and a four-category
variable summarizing CHF and CKD status. CHF,
CKD, DM and HTN statuses were determined from
claims for 2012; the study cohort included Medicare
enrollees who were alive and aged 66 or older on
December 31, 2012, resided in the 50 states, the District
of Columbia, Puerto Rico, or the U.S. territories, were
continuously enrolled in Medicare Parts A and B, and
were not enrolled in a Medicare Advantage plan for all
of 2012. Patients with ESRD on or before December 31,
2012 were excluded. Follow-up began on 1/1/2013 and
continued until death or 12/31/2014. Type of heart
failure was determined by the same procedure as the
previous figures using claims from 2012. Codes used to
define DM and HTN can be found in Table m.4 of this
chapter. Age was defined as of 12/31/2012. Since the
interaction between CHF status and CKD status was
significant in the Cox model, adjusted survival curves
were created for the four combination groups of CHF
status and CKD status (No CKD and no CHF, CKD
and no CHF, CHF and no CKD, and CKD and CHF).
The survival curves were adjusted for the other
significant factors in the model listed above.
ATRIAL FIBRILLATION AND CHRONIC KIDNEY
DISEASE
Table 4.2 presents the prevalence of AFIB by CKD
stage, age, race, sex, diabetic status, hypertension
status, and heart failure (CHF) status for 2013. The
cohort was the same used for Figure 4.1.
Chapter 5: Acute Kidney Injury
For the 2016 ADR, three sources of data were used
for the AKI chapter: the Medicare 5% sample,
Clinformatics™ Data Mart, and the Veterans
Administration Healthcare data. Both the Medicare
and Clinformatics™ datasets contain only diagnosis
code information on AKI, and no laboratory
measurements. For these two sources, a
hospitalization with AKI was defined as an inpatient
stay with any diagnosis code for AKI, not necessarily
as the primary diagnosis. The Veterans Administration
data sets contain serum creatinine measurements for
both routine outpatient visits and inpatient stays,
allowing the KDIGO consensus definition of AKI to be
calculated (although the data do not contain urine
output measurements), and AKI episodes to be
classified by stage (KDIGO 2012). Diagnosis codes are
also available in the VA data. As in prior years, this
chapter only examined AKI as identified during an
inpatient hospital stay.
In the Clinformatics™ data set, inpatient stays were
identified by a non-missing confinement ID variable
(CONF_ID) in the MEDICAL claims data table. We
identified more patients with at least one or more
inpatient stays from the MEDICAL claims data table
than were contained in the CONFINEMENT data table,
so the MEDICAL claims data table was used. Admission
and discharge dates are not available in the MEDICAL
claims data table and must be generated. Since the
combination of patient ID (PATID) and confinement ID
uniquely identified a hospitalization in the
CONFINEMENT data table, we created the admission
date as the minimum “claim from” date (FST_DT) and
the discharge date as the maximum “claim through”
date (LST_DT) for all claims with a given PATID-
CONF_ID combination for CONF_ID observations that
were not in the CONFINEMENT data table. Review of
inpatient stays that were included in the CONFINEMENT
data table verified that this process created
2016 USRDS ANNUAL DATA REPORT | VOLUME 1 – CKD IN THE UNITED STATES
appropriate dates. A second disadvantage of using the
MEDICAL claims data table is that each inpatient claim
only contains three ICD-9-CM procedure codes, as
compared to the five procedure codes per claim in the
CONFINEMENT data table. This may result in a
systematic underestimation of dialysis-requiring AKI
for all years of Clinformatics™ data.
Dialysis during the hospitalization with AKI was
defined using diagnosis, procedure, and revenue
center codes (for Medicare 5% sample). For the
Medicare 5% sample, the inpatient claims file was
searched for ICD-9-CM diagnosis codes V45.1, V56.0,
and V56.1, ICD-9-CM procedure codes 39.95 and
54.98, and Medicare revenue center codes 0800–0809.
Additionally, physician and supplier claims were
searched for HCPCS codes 90935, 90937, 90945, and
90947, with service dates that corresponded to the
patient’s inpatient stay. In the Clinfomatics™ Data
Mart, we searched for both inpatient (ICD-9-CM
procedure codes 39.95 and 54.98) and outpatient
procedures (HCPCS codes 90935, 90937, 90945, and
90947) in the MEDICAL claims data table that were
performed between the admission and discharge dates
of the inpatient stay. Similarly, the Veterans
Administration data was searched for dialysis
procedures during the time frame of the inpatient
stay. Patients with ESRD prior to the inpatient stay
were not counted as having AKI.
CHARACTERISTICS OF PATIENTS WITH AKI
The cohort used for Figures 5.1, 5.3a, 5.4a, 5.5a and
Table 5.1 (Medicare) included all patients alive, aged
66 or older, enrolled in Medicare Parts A and B, not
enrolled in a Medicare Advantage (Part C) program,
and without ESRD on January 1 of the reported year.
The Clinformatics™ cohort for Figures 5.2, 5.3b, 5.4b,
5.5b and Table 5.1 (Clinformatics™) included all
patients alive, aged 22 or older, enrolled in their plan,
and without ESRD on January 1 of the reported year.
The comorbidities of CKD and diabetes mellitus (DM)
were determined as described in the Identification of
Major Comorbidities section of this chapter and Tables
m.3 and m.4, using claims from a one-year entry
period (year one, the calendar year before the year in
which hospitalization was assessed for AKI) and then
assessed hospitalization in the following year (year
two, the year reported in the figures and tables).
While a patient can have more than one
hospitalization with AKI during a given calendar year,
the figures and table in this section counted only the
first AKI hospitalization per patient, per year. Each
calendar year formed a separate cohort; so a patient
can have a “first” AKI hospitalization in multiple years.
This process was used for both Medicare and
Clinformatics™ data sets.
Figures 5.1 and 5.2 show the same statistics but for
Medicare (Figure 5.1) and the Clinformatics™ (Figure
5.2) data sets. Each figure has two panels that employ
different denominators. Panel A shows the fraction of
the entire cohort (described in the previous
paragraph) that had a hospitalization with a diagnosis
of AKI in each year. Panel B, however, used the
numerator of Panel A as its denominator, showing the
fraction of cohort patients with at least one
hospitalization with AKI that received a dialysis
procedure during that hospitalization. Note that these
percentages did not take into account each patient’s
individualized time at risk—for example, a patient
who died in February was still included in the
denominator for the entire year, even though he/she
was not at risk of having an AKI hospitalization after
February. These percentages answered the question,
"What percent of people (meeting the cohort
inclusion criteria in the previous paragraph) alive on
January 1 experienced an AKI hospitalization during
the year?" Table 5.1 also used the total number of
cohort patients with at least one hospitalization with
AKI as the denominator, and presents the distribution
of age, sex, race, DM, and CKD for those with AKI for
Medicare and Clinformatics™.
Table 5.2 shows data from the Veterans
Administration Health system. Data is from fiscal year
2014 (October 1, 2013 through September 30, 2014) as
retrieved from the Corporate Data Warehouse. Short-
term hospital stays were isolated from the
INPAT.INPATIENT for discharges within the fiscal year.
(see Veterans Administration Heath Care Data earlier
in this chapter). All outpatient serum creatinine (SCR)
measurements within the 365 days prior to the
admission date were obtained from the MCA
(formerly DSS) national data extract of laboratory
results (LAR file; DSSLARNO=31 and IN_OUT=”O”). SCR
results containing text (“CANC”, “N.A.”, etc.) and
those with values greater than 20.0 mg/dL or less than
0.4 mg/dL were set to missing. Each patient was
206
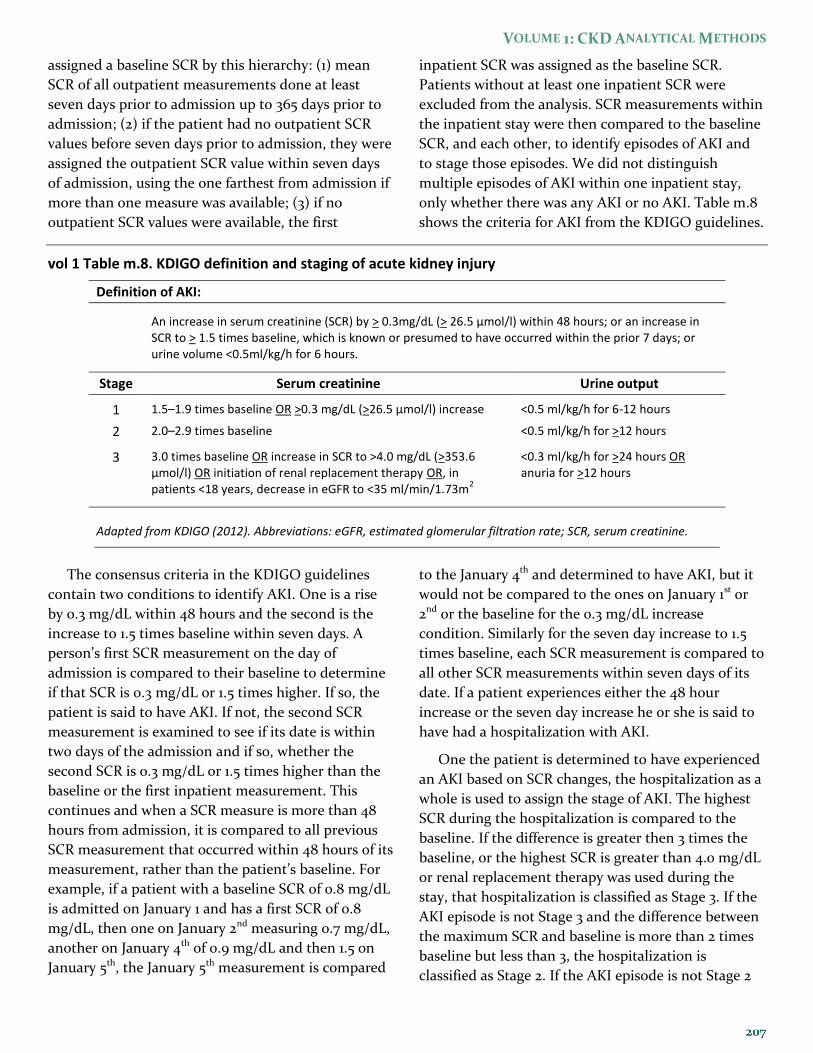
VOLUME 1: CKD ANALYTICAL METHODS
assigned a baseline SCR by this hierarchy: (1) mean
SCR of all outpatient measurements done at least
seven days prior to admission up to 365 days prior to
admission; (2) if the patient had no outpatient SCR
values before seven days prior to admission, they were
assigned the outpatient SCR value within seven days
of admission, using the one farthest from admission if
more than one measure was available; (3) if no
outpatient SCR values were available, the first
inpatient SCR was assigned as the baseline SCR.
Patients without at least one inpatient SCR were
excluded from the analysis. SCR measurements within
the inpatient stay were then compared to the baseline
SCR, and each other, to identify episodes of AKI and
to stage those episodes. We did not distinguish
multiple episodes of AKI within one inpatient stay,
only whether there was any AKI or no AKI. Table m.8
shows the criteria for AKI from the KDIGO guidelines.
vol 1 Table m.8. KDIGO definition and staging of acute kidney injury
Definition of AKI:
An increase in serum creatinine (SCR) by > 0.3mg/dL (> 26.5 μmol/l) within 48 hours; or an increase in SCR to > 1.5 times baseline, which is known or presumed to have occurred within the prior 7 days; or urine volume <0.5ml/kg/h for 6 hours.
Stage Serum creatinine Urine output
1 1.5–1.9 times baseline OR >0.3 mg/dL (>26.5 µmol/l) increase <0.5 ml/kg/h for 6-12 hours
2 2.0–2.9 times baseline <0.5 ml/kg/h for >12 hours
3 3.0 times baseline OR increase in SCR to >4.0 mg/dL (>353.6 µmol/l) OR initiation of renal replacement therapy OR, in patients <18 years, decrease in eGFR to <35 ml/min/1.73m
2
<0.3 ml/kg/h for >24 hours OR anuria for >12 hours
Adapted from KDIGO (2012). Abbreviations: eGFR, estimated glomerular filtration rate; SCR, serum creatinine.
The consensus criteria in the KDIGO guidelines
contain two conditions to identify AKI. One is a rise
by 0.3 mg/dL within 48 hours and the second is the
increase to 1.5 times baseline within seven days. A
person’s first SCR measurement on the day of
admission is compared to their baseline to determine
if that SCR is 0.3 mg/dL or 1.5 times higher. If so, the
patient is said to have AKI. If not, the second SCR
measurement is examined to see if its date is within
two days of the admission and if so, whether the
second SCR is 0.3 mg/dL or 1.5 times higher than the
baseline or the first inpatient measurement. This
continues and when a SCR measure is more than 48
hours from admission, it is compared to all previous
SCR measurement that occurred within 48 hours of its
measurement, rather than the patient’s baseline. For
example, if a patient with a baseline SCR of 0.8 mg/dL
is admitted on January 1 and has a first SCR of 0.8
mg/dL, then one on January 2nd measuring 0.7 mg/dL,
another on January 4th of 0.9 mg/dL and then 1.5 on
January 5th, the January 5th measurement is compared
to the January 4th and determined to have AKI, but it
would not be compared to the ones on January 1st or
2nd or the baseline for the 0.3 mg/dL increase
condition. Similarly for the seven day increase to 1.5
times baseline, each SCR measurement is compared to
all other SCR measurements within seven days of its
date. If a patient experiences either the 48 hour
increase or the seven day increase he or she is said to
have had a hospitalization with AKI.
One the patient is determined to have experienced
an AKI based on SCR changes, the hospitalization as a
whole is used to assign the stage of AKI. The highest
SCR during the hospitalization is compared to the
baseline. If the difference is greater then 3 times the
baseline, or the highest SCR is greater than 4.0 mg/dL
or renal replacement therapy was used during the
stay, that hospitalization is classified as Stage 3. If the
AKI episode is not Stage 3 and the difference between
the maximum SCR and baseline is more than 2 times
baseline but less than 3, the hospitalization is
classified as Stage 2. If the AKI episode is not Stage 2
2016 USRDS ANNUAL DATA REPORT | VOLUME 1 – CKD IN THE UNITED STATES
or 3, it is Stage 1, an increase of at least 0.3 mg/dL but
less than 2 times baseline.
Figures 5.3-5.5 used the entire analysis cohort as
the denominator to calculate rates of first AKI per
1,000 patient years at risk for Medicare (Panel A) and
Clinformatics™ (Panel B) beneficiaries. Only the first
hospitalization with AKI for a patient was counted as
an event, and years at risk were calculated for each
patient as the time (total days divided by 365.25)
between January 1 of the reported year (year two) to
the earliest date of hospitalization with AKI, ESRD,
disenrollment from their plan (for Medicare, Parts A
and B or a switch to a Medicare Advantage plan),
death, or December 31 of year two. Age was as of
January 1 of year two, while CKD and DM status were
determined by claims in year one. A Cox proportional
hazard model with no covariates, stratified by the
variable of interest, was used to estimate survival, and
the rate was calculated as –[log(survival)] and
multiplied by 1,000 to generate the rate per 1000
patient years at risk.
HOSPITALIZATION WITH AN AKI EPISODE
Figures 5.6 and 5.7 show the probability of having a
second hospitalization with AKI within 24 months of
the first hospitalization with AKI for Medicare (Figure
5.6) and Clinformatics™ (Figure 5.7) beneficiaries. The
sample for this figure began with the 2012 cohort as
used in the Characteristics of Patients with Acute
Kidney Injury section above—alive, aged 66 or older,
without ESRD, and enrolled in their plan (for
Medicare, Parts A and B and no Medicare Advantage
plan) on 1/1/2012. The first hospitalization with AKI in
2012 was identified. Age was as of 1/1/2012, and
comorbidities were defined by searching claims one
year prior to the AKI admission date (admission date-
365 through one day before admission). Within this
customized date range, CKD and DM status were
defined according to the algorithm and codes
described in the Identification of Major Comorbidities
section and Tables m.3 and m.4 of this chapter. The
final cohort for Figures 5.6 and 5.7 included only those
patients with at least one hospitalization with AKI in
2012 who were discharged alive. Follow-up began on
the date of discharge listed on the claim for the
hospitalization with AKI, and continued until the
earlier of a second hospitalization with AKI, death,
ESRD, disenrollment from their plan (for Medicare,
Parts A and B or a switch to a Medicare Advantage
plan), or 730 days following the first AKI discharge.
Kaplan Meier methods were used to estimate survival
with the cumulative probability of a recurrent
hospitalization with AKI defined as (1-survival).
PATIENT CARE AND OUTCOMES
Figure 5.8 shows the outcomes of death or ESRD
within one year of a live discharge from a
hospitalization with AKI. To increase the precision of
these estimates, we created the cohort for this figure
to include patients with a first hospitalization with
AKI in 2012 or 2013. Patients were alive, aged 66 or
older, without ESRD, with Parts A and B coverage, and
with no Medicare Advantage plan on January 1 of the
year of their first hospitalization with AKI. Those who
were discharged alive from their hospitalization with
AKI were followed from the date of discharge until 365
days after discharge. For the models of time to ESRD
and time to the composite end point of ESRD or
death, the survival time was calculated from the date
of discharge of the hospitalization with AKI to the
earliest date of ESRD, death, disenrollment from Parts
A or B, switch to a Medicare Advantage program, or
365 days following discharge. Note that the mortality
model in this year’s ADR was not censored at the start
of ESRD. For the mortality model, survival time was
calculated from the date of discharge from the first
hospitalization with AKI to the earliest of death,
disenrollment from Parts A or B, switch to a Medicare
Advantage program, or 365 days following discharge.
Figures 5.9-5.11 present physician visits and
laboratory tests within the first six months after a live
discharge from a hospitalization with AKI. For Figure
5.9, claims were searched for services provided by
nephrologists for 180 days following the discharge date
of the hospitalization with AKI. In the Medicare data,
nephrology visits were a provider specialty code 36,
while in the Clinformatics™ data they were identified
by a provider category code for nephrologist (PROVCAT
0597-0604). Figures 5.10 and 5.11 show time-to-first-
claim for specified laboratory tests. A first serum
creatinine measurement was defined as the first claim
with a Healthcare Common Procedure Coding System
(HCPCS) code of 80047, 80048, 80049, 80050, 80053,
80054, 80069, or 82565. Likewise, first urinary
microalbumin measurement was defined as the first
claim with an HCPCS code of 82042, 82043, 82044, or
208
VOLUME 1: CKD ANALYTICAL METHODS
84156. Time to visit or lab test began on the date of
discharge listed on the claim for the hospitalization
with AKI, and continued until the earlier of the visit or
test, death, ESRD, disenrollment from their plan (for
Medicare, Parts A and B or a switch to a Medicare
Advantage plan), or 180 days following the first AKI
discharge. Kaplan Meier methods were used to
estimate survival with the cumulative probability of a
nephrology visit or lab test defined as (1-survival).
Figure 5.12 shows the renal status after one year for
Medicare patients discharged alive from their first
hospitalization with AKI. To increase the precision of
the estimates, we created the cohort for this figure
from patients with a first hospitalization with AKI in
2012 or 2013. Patients were alive, aged 66 or older,
without ESRD, with Parts A and B coverage, with no
Medicare Advantage plan on January 1 of the year of
their hospitalization with AKI, and did not have any
claims with a diagnosis of CKD in the 365 days prior to
that admission. Renal status after AKI was determined
from claims occurring between discharge from the
hospitalization with AKI and 365 days after discharge.
CKD stage was determined by the 585.x claim closest
to 365 days after discharge and ESRD by first service
date on the ESRD Medical Evidence form.
Figure 5.13 shows discharge status following a
Medicare patient’s first hospitalization in 2014. Panel
A shows patients whose hospitalization contained an
AKI episode while Panel B shows those whose hospital
stay did not. The cohort included all patients who
experienced a hospitalization during 2014 and who
were alive, aged 66 or older, enrolled in Medicare
Parts A and B, not enrolled in a Medicare Advantage
program, and without ESRD on January 1, 2014.
Patients admitted to an acute care hospital from a
long-term care facility (‘point of origin for admission,’
previously named ‘source of admission,’ is 5) were
excluded. Patients with a ‘patient discharge status’
code of 01 (routine discharge to home) or 06
(discharged to home under care of a home health
service organization in anticipation of covered skilled
care) were identified as being discharged home. Those
with a ‘patient discharge status’ of 50 (discharged to
routine or continuous hospice at home) or 51
(transferred to an inpatient hospice program or
facility) were identified as being discharged to
hospice. Those identified as being discharged to an
institution were those whose ‘patient discharge status’
was 03 (transferred to a Skilled Nursing Facility with
Medicare certification in anticipation of skilled care),
62 (transferred to an inpatient rehabilitation facility
including distinct part units of a hospital), or 63
(transferred to long term care hospital). Death was
determined both by the date of death from the Master
Beneficiary Summary File and the ‘patient discharge
status’ of 20 (expired—this code is used only when the
patient dies). ‘Other’ is a residual category that
includes all discharges not identified by the previous
categories.
Chapter 6: Medicare Expenditures for CKD
The cohort used for this chapter continued the
methodology introduced in the 2010 ADR, which only
tabulated CKD costs for patients with CKD diagnoses
(minimum of one inpatient and/or two outpatient)
among their claims in the year prior to the reported
year (year one). For example, the total costs of CKD
for 2014 (year two) included all costs incurred by
patients with a CKD diagnosis in 2012 (year one). Prior
to the 2010 ADR, patients newly diagnosed with CKD
during year two were also included in the total.
The same general Medicare point prevalent cohort
was used to create all the tables and figures in this
chapter. Each year’s cohort included patients aged 65
and older (except for Table 6.2 which includes only
those under age 65) who were alive and without ESRD
on January 1 of the reported year (year two). Cohort
members were continuously enrolled in Medicare
Parts A and B and not enrolled in a Medicare
Advantage plan (Part C) for all of year one (the one-
year entry period prior to the year in which costs were
assessed). Costs were aggregated for the reported year
(year two). Patient years at risk were calculated as the
number of days (divided by 365.25) between January 1
of year two and the earliest of death, development of
ESRD, disenrollment from Parts A or B, switch to a
Medicare Advantage program, or December 31 of year
two. Dividing the total cost amount by the patient
years at risk yielded the per person per year (PPPY)
costs. Since these total costs and number of patients
were based on the 5% Medicare files, counts and
2016 USRDS ANNUAL DATA REPORT | VOLUME 1 – CKD IN THE UNITED STATES
expenditures were multiplied by 20 to represent 100%
of Medicare fee-for-service Parts A, B, and D
expenditures for age-eligible patients who were
continuously enrolled in Parts A and B and not
enrolled in a Medicare Advantage plan for all of the
previous year (year one).
Claims can be submitted for episodes of care that
span calendar years. The expenditures for these claims
are spilt across calendar years based on the fraction of
the claim’s total days that occurred in the reported
year. For example, if a claim began on December 29,
2013, and ended on January 7, 2014, it spanned 10 days,
with three days in 2013 and seven days in 2014. Seventy
percent of that claim’s total expenditure amount
would be added to total expenditures for 2014 and 30%
to total expenditures for 2013.
The disease conditions of CKD, congestive heart
failure (CHF), diabetes mellitus (DM), and the stage of
CKD are determined from the claims in the year prior
to the reported year (year one) with the algorithm
described in the Identification of Major Comorbidities
section of this chapter, using the diagnosis codes
listed in Tables m.3 and m.4. Age was determined as of
December 31 of year one. Race and sex were provided
by the Master Beneficiary Summary File. The cause of
hospitalization presented in Figure 6.4 was
determined using the same methods as in Chapter 3,
using the codes displayed in Table m.5.
Chapter 7: Medicare Part D Prescription Drug Coverage in Patients with CKD
This chapter describes the participation in the
Medicare Part D program by Medicare beneficiaries
overall, and by those with CKD and ESRD. CKD was
determined as described in the Identification of Major
Comorbidities section of this chapter and Table m.3,
using claims from a one-year entry period (year one,
the calendar year before the year in which Part D
utilization was assessed).Part D utilization was
assessed in the following year (year two, the year
reported in the figures and tables), while ESRD was
determined by the date of first ESRD service. In this
Part D chapter in Volume 1, both the General
Medicare cohort and the CKD cohort had the same
inclusion criteria, representing a change from the 2013
and earlier ADRs. This is also different from the
sample used to describe General Medicare patients in
Volume 2, Chapter 12, which does not apply
restrictions based on year-one Medicare participation.
In this chapter, beneficiaries must have been
enrolled in Parts A and B and not enrolled in a
Medicare Advantage plan for all of year one, and be
alive, without ESRD, and enrolled in Parts A and B on
January 1 of year two. Note that those with a Medicare
Advantage plan in January of year two were not
specifically excluded; if a beneficiary was not in a
Medicare Advantage plan for all of year one, but
switched to Medicare Advantage for year two, they
were still included in the analysis cohort. These
criteria were necessary to enable CKD identification,
as diagnosis codes were only available for those with
fee-for-service Medicare. In order to have an
appropriate comparison for the CKD cohort, the same
exclusion criteria were applied to the General
Medicare group. Unlike the other chapters in Volume
1, this chapter includes all beneficiaries aged 20 years
and older. For inclusion, those under age 65 must
have been eligible for Medicare through participation
in federal disability programs (Social Security
Disability Insurance or Supplemental Security
Income) or their entitlement related to amyotrophic
lateral sclerosis, and thus should not be viewed as
representative of the U.S. general population under
age 65.
For comparison, several figures and tables also
include the ESRD population. Patients were selected
from the USRDS ESRD database who had Medicare as
either their primary or secondary payer, and had
ESRD for at least 90 days by January 1 of the analysis
year (year two). See the ESRD Methods chapter for
more information on the USRDS ESRD database.
Figures 7.1-7.3 summarize the prescription drug
insurance coverage for Medicare beneficiaries by
source, comparing General Medicare, CKD, and ESRD
populations and by showing results by age and race
categories. The sources of coverage across the
calendar year were combined into mutually exclusive
and exhaustive categories in a hierarchical manner.
Enrollment in a Part D plan was determined by the
first digit of the Part D Plan Contract Number variable
(one for each month) being “E” (an employer direct
plan, a valid value starting in 2007), “H” (a managed
care organization other than a regional preferred
210
VOLUME 1: CKD ANALYTICAL METHODS
provider organization (PPO)), “R” (a regional PPO), or
“S” (a stand-alone prescription drug plan). A
beneficiary was considered to be enrolled in a Part D
plan for the year if he or she was enrolled for one
month or more of the analysis year. If a beneficiary
was enrolled in a Part D plan and received a low-
income subsidy (LIS) in at least one month, he or she
was classified as “Part D with LIS”, and as “Part D
without LIS” otherwise. The receipt of a low income
subsidy was determined by the monthly Cost Sharing
Group Code values “01” through “08.” For beneficiaries
not enrolled in a Part D plan, there were several
options for non-Medicare prescription drug coverage
as reported to the Medicare program. A beneficiary
was classified as “Retiree Drug Subsidy” if they were
not enrolled in a Part D plan but had at least one
month with a Part D Retiree Drug Subsidy Indicator
value of “Y” (yes), indicating he or she was enrolled in
an employer-sponsored prescription drug plan that
qualified for Part D’s retiree drug subsidy. If the
patient was not in a Part D plan or employer-
sponsored plan, they were classified as “Other
Creditable Coverage” if the Creditable Coverage
Switch has a value of “1”, indicating another form of
drug coverage that was at least as generous as the Part
D benefit. This alternate coverage is known as
creditable coverage because beneficiaries who
maintain it do not have to pay a late enrollment
penalty if they later enroll in Part D. If a beneficiary
met none of the situations described above, he or she
was classified as “No Known Coverage.” Figure 7.1
presents the distribution of this categorical variable
for the General Medicare, CKD, and ESRD cohorts
described above.
Table 7.1 is an adaptation of data presented in the
2014 Medicare Outlook section of the
www.q1medicare.com web site, and has no analyses.
Table 7.2 shows the percent of beneficiaries with Part
D coverage for the past three years in the General
Medicare, CKD, and ESRD cohorts. A beneficiary was
considered enrolled in Part D if at least one month’s
Part D Plan Contract Number had the first digit of
“E”,”H”,”R”, or “S.” Figure 7.2 shows the categories of
prescription drug coverage (described above for Figure
7.1) by age groups (20-44/45-64/65-74/75+) for
General Medicare (Panel A) and CKD (Panel B), while
Figure 7.3 shows it by race groups (White/Black or
African American/Asian/Other).
Table 7.3 was limited to beneficiaries who were
enrolled in Part D prescription plans for at least one
month of the analysis year. Part D plan enrollment
and receipt of LIS were determined as described for
Figures 7.1. Table 7.3 shows the percent of Part D
enrollees with LIS within each race group (“all ages”
row) and by age groups within the race group (also
defined as above) for the General Medicare cohort and
the CKD cohort. Figure 7.4 was limited to those
enrolled in a Part D plan with LIS and shows the
different types of LIS, as determined by the values of
the Cost Sharing Group Code, for the General
Medicare, CKD, and ESRD cohorts.
The next several tables and figures present data on
Medicare spending for Part D benefits. The Part D
benefit expenditure for a prescription drug event
(PDE) is the sum of the amount of cost sharing for the
drug that was paid by the Part D low-income subsidy
(LIS Amount) and the net amount that the Part D plan
paid for the PDE (Covered Part D Plan Paid Amount).
Table 7.4 shows the total Medicare Part D benefit
expenditures for the General Medicare, CKD, and
ESRD cohorts (defined above) for beneficiaries
enrolled in stand-alone Part D plans (i.e., spending for
Medicare Advantage prescription drug plans was not
included). These cost numbers are, therefore,
comparable to the statistics presented in Chapter 6,
which show Medicare spending on Parts A and B
benefits for those not in Medicare Advantage plans.
Figure 7.5a shows Medicare spending and patient
out-of-pocket amounts per patient per year for the
General Medicare, CKD, and ESRD cohorts, again for
only those who were in stand-alone Part D plans. Out
of pocket cost was the sum of the amounts paid by the
patient without being reimbursed by a third party
(Patient Payment Amount) which included all
copayments, coinsurance, deductible, or other patient
payment amounts, and the amount of any payment
made by other third-party payers that reduced the
beneficiary’s liability for the PDE (Other True Out-of-
Pocket Amount). Two examples of this were payments
by qualified state pharmacy assistance programs or
charities. Figure 7.5b breaks out these costs by
whether the patient received any low income
2016 USRDS ANNUAL DATA REPORT | VOLUME 1 – CKD IN THE UNITED STATES
subsidies. Table 7.5 stratifies these costs by age, sex,
and race.
All drugs in the PDE file were matched to a
therapeutic category according to the American
Hospital Formulary Service classification system. The
cohort for Tables 7.6 and 7.7 was limited to those in
the CKD cohort who have stand-alone Part D
prescription drug coverage. Each therapeutic category
was summarized and the percent of patients with CKD
who filled at least one prescription for a drug in the
given class was calculated, as well as the total amount
spent by Medicare on each drug class and its
percentage of total Part D costs. Table 7.6 shows the
top 15 drug classes ranked by the highest percent of
CKD patients with at least 1 prescription filled in that
class. Table 7.7 shows the top 15 drug classes ranked
by spending. The column following the drug class
name shows the total amount spent by Medicare on
each drug class for CKD patients with stand-alone Part
D plans and the next column shows that drug class’
cost as a percentage of all Medicare Part D costs for
these patients.
Reference Tables: CKD
Reference Tables B.1–B.6 present estimated point
prevalent (December 31) counts of the Medicare non-
ESRD population, based on the 5% Medicare sample,
for adults aged 20 and older rather than the age-
eligible (aged 65 and older) cohort presented in
Chapter 2. Each year’s cohort included all patients
alive and without ESRD, who were continuously
enrolled in Medicare Parts A and B, and not enrolled
in a Medicare Advantage program (Part C) for the
entire year. Age was calculated as of December 31 of
the reported year. Race and sex were provided by the
Master Beneficiary Summary File. The disease
conditions of CKD, congestive heart failure (CHF),
and diabetes mellitus (DM) and the stage of CKD were
determined from the claims in the reported year,
using the methods described in the Identification of
Major Comorbidities section of this chapter and the
diagnosis codes listed in Tables m.3 and m.4. Counts
were multiplied by 20 to represent 100% of the
Medicare population meeting the cohort definition.
Reference Tables B.7-B.10 are based on NHANES
data (see the NHANES methods description in the
Chapter 1: CKD in the General Population section,
above). For Table B.8, CKD is defined as an estimated
glomerular filtration rate (eGFR) less than 60
ml/min/1.73m2 (which identifies Stages 3 and 4) or
urine albumin creatinine ratio (ACR) greater than 30
mg/g (which identifies Stages 1 and 2). eGFR was
estimated from one serum creatinine measurement
using the CKD-EPI equation (Levey et al., 2009). The
consensus definition of CKD requires two
measurements of both eGFR and ACR meeting the
criteria above, within a three-month period, but only
one measurement of each is available in NHANES.
Therefore, the resulting numbers overestimate the
true number of CKD patients in the general U.S.
population. CKD staging is as defined by the Kidney
Disease Outcomes and Quality Improvement
(KDOQI) CKD guidelines (NKF, 2002). In Table B.9,
DM was defined as in Chapter 1, and eGFR and ACR as
described for Table B.8. Table B.10 presents results for
CHF, which is self-reported in NHANES as an
affirmative answer to, "Has a doctor or other health
professional ever told you that you have congestive
heart failure?"
Tables K.1–5 present estimates of per-person per-
year Parts A, B, and D Medicare expenditures for point
prevalent (December 31) general Medicare patients,
also derived from the 5% Medicare sample. Methods
for these tables were the same as those described in
the Chapter 6: Medicare Expenditures for CKD section
of this document. The reference tables include all
adult patients aged 20 and older, while the chapter
presents these costs only for those age-eligible for
Medicare (aged 65 or older).
212
VOLUME 1: CKD ANALYTICAL METHODS
References
Centers for Disease Control and Prevention (CDC).
National Center for Health Statistics, Behavioral
Risk Factors Surveillance System (BRFSS), 2015.
Accessed 10/15/2015.
http://www.cdc.gov/brfss/index.html
Centers for Disease Control and Prevention, National
Center for Health Statistics, National Health and
Nutrition Examination Survey. 2007-2008 data
documentation, codebook, and frequencies –
urinary albumin and urinary creatinine. 2009.
Accessed 10/22/2015.
http://www.cdc.gov/nchs/nhanes/nhanes2007-
2008/ALB_CR_E.htm.
Centers for Medicare and Medicare Services. Medicare
and You 2015. Publication No. CMS-10050.
Baltimore: Centers for Medicare and Medicaid
Services.
Herbert PL, Geiss LS, Tierney EF, Engelgau MM, Yawn
BP, McBean AM. Identifying persons with diabetes
using Medicare claims data. American Journal of
Medical Quality 1999 Nov/Dec: 14(6): 270-277.
Johnson CL, Paulose-Ram R, Ogden CL, Carroll MD,
Kruszon-Moran D, Dohrmann S, Curtin LR.
National Health and Nutrition Examination Survey:
analytic guidelines, 1999-2010. National Center for
Health Statistics. Vital and Health Statistics 2013:
2(161):1-16. Available at
http://www.cdc.gov/nchs/data/series/sr_02/sr02_1
61.pdf
Kidney Disease: Improving Global Outcomes (KDIGO)
Acute Kidney Injury Workgroup. KDIGO clinical
practice guideline for acute kidney injury. Kidney
Int. 2012;2:1-138.
Kidney Disease: Improving Global Outcomes (KDIGO)
CKD Work Group, 2012. KDIGO 2012 Clinical
Practice Guideline for the Evaluation and
Management of Chronic Kidney Disease. Kidney
Int., Suppl. 2013; 3: 1–150.
Levey AS, Stevens LA, Schmid CH, Zhang YL, Castro
AF, Feldman HI, Kusek JW, Eggers P, Van Lente F,
Greene T, Coresh J. A new equation to estimate
glomerular filtration rate. Annals of Internal
Medicine 2009 May: 150(9): 604-612.
McBean M. Introduction to the Use of Medicare Data
for Research. Workshop, Research Data Assistance
Center, University of Minnesota, Minneapolis, MN.
October 15, 2012, available at:
http://www.resdac.org/training/workshops/intro-
medicare/media.
Merriman K, Asper M. Differences in How the
Medicare 5% Files are Generated. Technical Brief,
ResDAC Publication Number TN-011, March 2007.
Research Data Assistance Center, University of
Minnesota, Minneapolis, MN.
http://www.resdac.umn.edu.
National Kidney Foundation. K/DOQI Clinical
Practice Guidelines for Chronic Kidney Disease:
Evaluation, Classification and Stratification.
American Journal of Kidney Diseases 2002: suppl 1
(39): S1-S266.
OptumInsight. Clinformatics Data Mart Training May
2015 – Prepared for University of Michigan.
Presentation on May 11, 2015, North Campus
Research Complex, Building 10, Research
Auditorium, Ann Arbor, MI.
Selvin E, Manzi J, Stevens LA, Van Lente F, Lacher DA,
Levey AS, Coresh J. Calibration of serum creatinine
in the National Health and Nurtition Examinations
Surveys (NHANES) 1988-1994, 1999-2004. 2007
Dec: 50(6): 918-926.

2016 USRDS ANNUAL DATA REPORT | VOLUME 1 – CKD IN THE UNITED STATES
Notes
214


![7. ANALYTICAL METHODS · 7. ANALYTICAL METHODS ... [SRM] 4200, 60,000 Bq [1.6 µCi] CESIUM 164 7. ANALYTICAL METHODS . and SRM 4207, 300,000 Bq …](https://img.pdfslide.us/doc/110x75/5ae8481b7f8b9aee078f554f/7-analytical-methods-analytical-methods-srm-4200-60000-bq-16-ci-cesium.jpg)