Embed Size (px)
Citation preview
J. Electroanal. Chem., 144 (1983) 143-152 143 Elsevier Sequoia S.A., Lausanne - Printed in The Netherlands
VOLTAMMETRIC VERIFICATION OF THE HUSH-BLACKLEDGE EQUATION FOR THE ELECTRON REPULSION ENERGY
TETSUO SAJI and SHIGERU AOYAGUI *
Department of Chemical Engineering, Tokyo Institute of Technology, Ohokayama, Meguro-ku, Tokyo 152 (Japan)
(Received 14th October 1981; in revised form 26th August 1982)
ABSTRACT
The reversible half-wave potentials of the first and the second reduction steps of thirteen hydro- carbons with condensed aromatic rings in N,N-dimethylformamide are determined by cyclic voltammetry. The theoretical equation of Hush and Blackledge concerning the repulsion energy of a pair of electrons on the highest occupied orbital of hydrocarbon dianion is verified on the basis of these data in conjunction with the electrochemically evaluated solvation energies of hydrocarbon anions and dianions. A linear relation is found to exist between the repulsion energy and the disproportionation energy of the hydrocarbon anion in solution which is identical with the difference between the first and the second half-wave potentials. This finding suggests a linear relation between the solvation energy and the repulsion energy.
INTRODUCTION
Hush and Blackledge [1] have discussed the relative ground state energies of anions ( R - ) and dianions (R 2- ) of hydrocarbons (R) on the basis of the SCF MO theory. According to them the energy of repulsion between a pair of electrons on the highest occupied antibonding orbital of R 2- (E rep ) is expressed as follows:
Erep = A , - A2= ~c~c) f q,2(1)r,7'ee2(2) d~-~ dz2 1,J
where A I and A z are respectively the electron affinities of R and R - , subscripts i a n d j denote ring carbon atoms, q,'s are the carbon 2pTr AO's, c's the coefficients of AO's in the LUMO of R, and % the distance between the ith and t h e j t h carbon atoms. Experimental verification of eqn. (1) was attempted by comparing the theoretical and the experimental values for the energy of disproportionation of R in solution, 2 R - ~ R + R 2- [2]. If the entropy of this reaction is negligible, the disproportionation energy divided by electronic charge (e) is identical with the difference between the reversible half-wave potentials for R ° / - (E°/2 ) and R /2-
* To whom correspondence should be addressed.
0022-0728/83/0000-0000/$03.00 © 1983 Elsevier Sequoia S.A.
144
(E~-//22- ), AEI/2 = E ° f i f - E l / 2 - . The AEI/2 is related in its turn to Ere p by the following equation based on the Born model of ion solvation:
e AEI/2 = E r e p - 2S (2)
with
S = e2(1 - 1/D~)/2r (3)
where D~ is the static dielectric constant and r the radius of a spherical ion. Hotink et al. [2] compared the AE1/2 value for anthracene in 1,2-dimethoxyethane (DMeE) with the calculated value. When they used eqn. (3) with the r value estimated from the molar volume of anthracene, better agreement was obtained than when they used the S value of Hush and Blackledge [1] who used a modified form of eqn. (3) based on the isolated-charge model:
S=~(qi2/2r i ) (1 - 1 /Ds)=e2(~c4)(1 - 1/Ds)/2r2p (4) i \ i /
where qi is the charge on the ith carbon atom and r i the effective radius of the 2pz atomic orbital of the itli carbon atom which is approximated by a common radius of r2p. However, the AE~/2 values of Hoijtink et al., 1.66 eV (calc) and 0.58 eV (obs), are still far from agreement. They considered that ion-pairing of R 2- could be a reason for this disagreement. They also mentioned that a detailed discussion of the numerical values of AE1/2 was of no significance, because the values for Ere p and S could only be roughly approximated.
Matsui and Date [3] stated that a good agreement could be obtained between the observed and the calculated values for AE1/2, when a proper value for the effective dielectric constant was used together with the following equation for S that had been suggested previously by Hoijtink et al. [2]:
S = E (qiqj/2rij)(1 - 1/Os) (5) i , j
where r~j is the distance between the ith and t he j t h carbon atoms when i ~=j, and is r2p when i = j . However, it is very likely that their experimental values for AEl/2 obtained with N,N-dimethylformamide (DMF) solutions were seriously affected by the decomposition of dianions. In DMF hydrocarbon dianions are associated with counter cations to much smaller extent but live for a much shorter time than in DMeE.
The aim of this paper is to verify the Hush-Blackledge equation on the basis of the reliable values for AE1/2 of thirteen hydrocarbons in DMF. A part of the results has been published in a preliminary note, where DMeE was used instead of DMF [41.
E X P E R I M E N T A L
2,3,3',2'-Dipyrenylene [5], 1,12,2,3,10,11-tribenzoperylene [6], 2,3,10,11-dibenzo- perylene [6], rubicene [7], periflanthene [8] and Fe(bpy)3(C104) 2 ( b p y = 2,2'-
145
bipyridine) [9] were prepared by the literature methods. Anthracene, 1,2-benz- anthracene, perylene, picene, rubrene, Me4NBr (TMAB) and Me4NBF 4 (TMABF) were commercially obtained and used without further purification. Purification of D M F was described elsewhere [10].
Test solutions contained respectively 0.3 m M of a hydrocarbon in the base solution, 8 m M TMAB in DMF. They were treated with neutral alumina in the way that was recommended by Parker and co-workers [11,12]. ICN W 200 Neutral alumina was dried before use under vacuum at 150°C for 5 h. About 3 ml of neutral alumina was added to 5 ml of the base solution under nitrogen atmosphere. Shortly after the mixture was stirred for about 30 min and the solid phase was allowed to settle, cyclic voltammograms were recorded on a Rikendenshi XY plotter in cases of low scan rates of 0.1-0.3 V s - t or on a Tektronics 7633 oscilloscope in cases of high scan rates of I - 100 V s - 1.
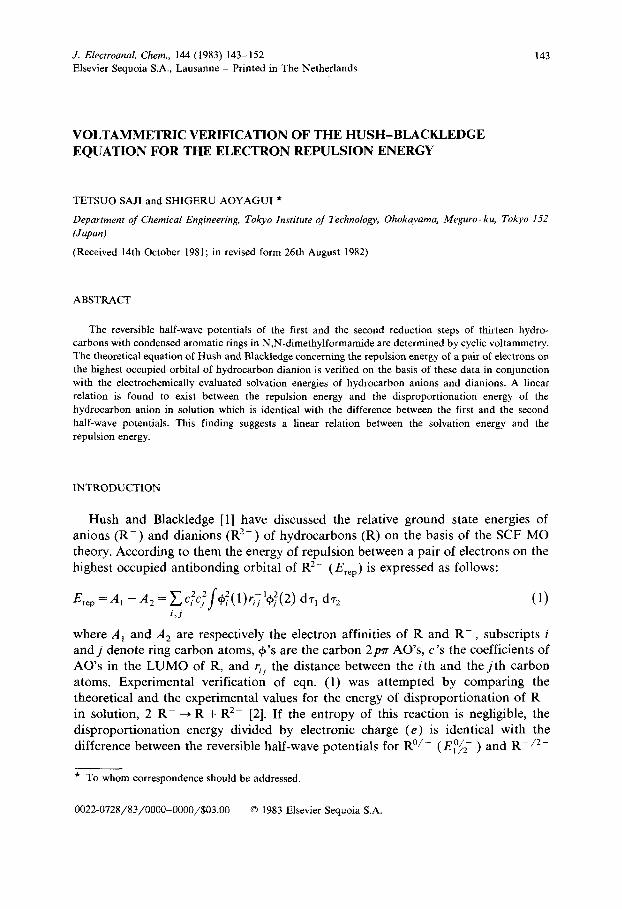
The three-electrode cell of Fig. 1 was used. A silver wire served as the reference electrode. It was placed in closest proximity to the platinum working electrode in order to reduce the ohmic potential drop, which was compensated by the conven- tional positive feedback technique. The perylene ° / - redox system was used as the inner reference [13]. When either E°/f o r E l / 2 - of this system was close to the half-wave potentials of the hydrocarbon to be studied, another proper redox system was used as the inner reference. Measurements were made at - 10°C. All potentials were referred to perylene ° / - .
In order to check the shifts of El°//2- and E t / 2 - caused by the association of R - and R 2- with Me4 N+ , which can be operative even in DMF, association constants
Pt wire'
J _ Ag wire
~ Solution Ft wire
Neu%ral alumina
Fig. h Electrolysis cell.
146
were determined by a separate experiment with perylene, rubrene and 2,3,3',2'-di- pyrenylene as typical hydrocarbons and 12.5-50 m M TMABF in DMF as base solutions. The result of this experiment is discussed in the Appendix.
RESULTS AND DISCUSSION
The aromatic hydrocarbons studied were chosen on the basis of the following criteria: they should be polycyclic hydrocarbons with no substituent groups and no steric hindrance; they should be similar in molecular structure to their respective anions and dianions.
The cyclic voltammograms of these hydrocarbons at - 1 0 ° C exhibited respec- tively two reduction steps. The reversibility is judged on the basis of the peak separation and the peak height ratio. All the first steps were reversible one-electron steps even at low scan rates below 0.3 V s-1. The appearance of the peak of the second step in the reversal scan depended on the purity of the solution, and on the scan rate as well. The second steps of perylene, tetracene, 2,3,Y,2'-dipyrenylene, 1,12,2,3,10,11-tribenzoperylene, 2,3,10,11-dibenzoperylene, rubicene and peri- flanthene were reversible at low scan rates of 0.1-0.3 V s-~. Those of anthracene, 1,2-benzanthracene, chrysene, 1,2,5,6-dibenzanthracene, picene and fluoranthene were irreversible at such low scan rates, but reversible at 1-100 V s-1. The second step of pyrene was irreversible even at 100 V s-~: Table 1 lists the midpoint
TABLE 1
Reversible half-wave potentials of the first step (E°//2- ) and the second step (El//22- ) for the reduction of aromatic hydrocarbons in 8 m M Me4NBr-DMF at - 10°C, their differences (A E l ~ 2 = E ° f ~ - - E ~ 2 - ) ,
calculated values for electronic repulsion energy (Erep) and literature values for electron affinity of
hydrocarbons (A l)
Hydrocarbon - E ° / 2 / V '~ _ E// /22-/V a A E I / 2 / V A l / e V b grep/e v
Anthracene 0.29 1.03 0.74 0.56 5.13 Benzanthracene 0.34 1.00 0.66 0.63 4.84 Fluorancene 0.11 0.83 0.72 4.83 Pyrene 0.42 irr > 0.60 0.59 4.78 Tetracene - 0.10 0.56 0.66 4.69 Chrysene 0.61 1.12 0.51 0.40 4.64 Dibenzanthracene 0.39 0.86 0.47 0.60 4.45 Perylene 0.00 0.61 0.61 4.40 Picene 0.58 1.03 0.45 0.54 4.32 Rubicene - 0.71 - 0.18 0.53 4.23 Dibenzoperylene 0.02 0.49 0.47 4.16 Tribenzoperylene 0.14 0.62 0.48 3.93 Dipyrenylene 0.29 0.78 0.49 3.67 Periflanthene - 0.68 - 0.33 0.35 3.65
a Vs. perylene ° / - . b Ref. 14.
147
potentials between the cathodic and the anodic peak potentials. They are identified with reversible half-wave potentials and denoted by E ° / 2 or E1 - / 2 - . These half-wave potentials were positive-shifted by increasing the Me4N + concentration, suggesting that the association of Me4 N+ with R - and R 2- should have a certain effect on the observed half-wave potentials, even in DMF. However, the Appendix shows that the shift in E ° / 2 is negligible, and the shift in E~-~ 2- is small and nearly independent of the hydrocarbons studied, under the given experimental condition of 8 m M TMAB. Consequently, the half-wave potentials in the absence of ion-association are written as E ° / f = ( E ° / f ) o b s and E / / z - = ( E 1 A 2 - ) o b s - 2c2, in terms of the observed values suffixed by obs and a positive constant c 2 which is common to the hydro- carbons studied.
Table 1 also lists the AE~/2 values from which, if necessary, the equilibrium constants for the disproportionation of R - can be determined. The AE~/2 values for anthracene, 1,2-benzanthracene and chrysene agree very well with those observed in D M F saturated with TMAB at 12°C [11], in spite of differences in temperature and TMAB concentration. The AE1/2 values for perylene, anthracene and pyrene of Matsui and Date [3] are smaller than ours by 70 mV, 160 mV and more than 130 mV, respectively. Evidently, their E?/~ - values are largely positive-shifted by the decomposition of R 2-.
When data for A~ are available, the quantity S in eqn. (2) can be estimated from the (E°f~ - )ob~ values by using the following equation:
S = e( E°f2 - )obs- A , - e (6)
£ i
i ~ - 1 . 5
i
- 1 , 0
-2.0 , i
4.5 5.0
Erep/eV
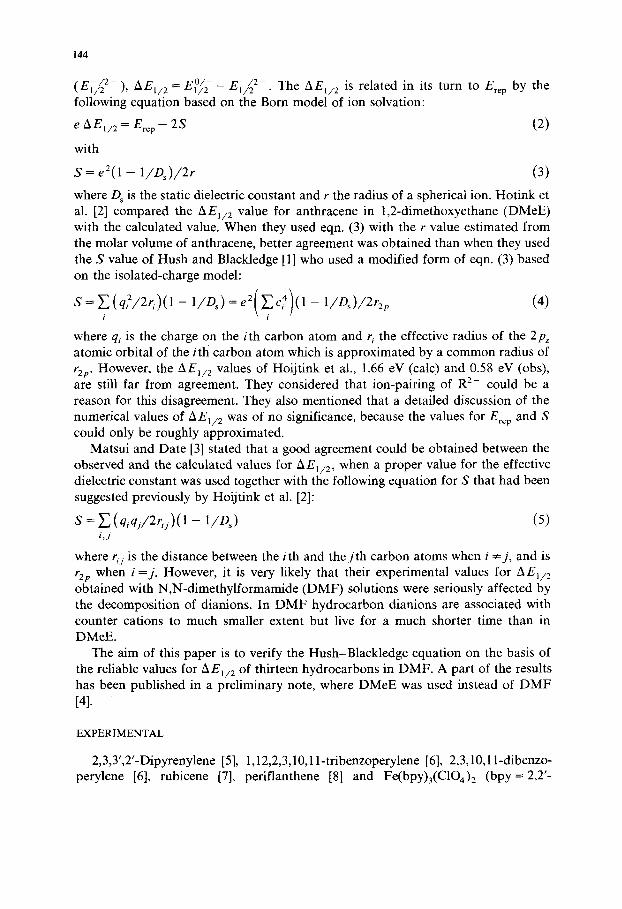
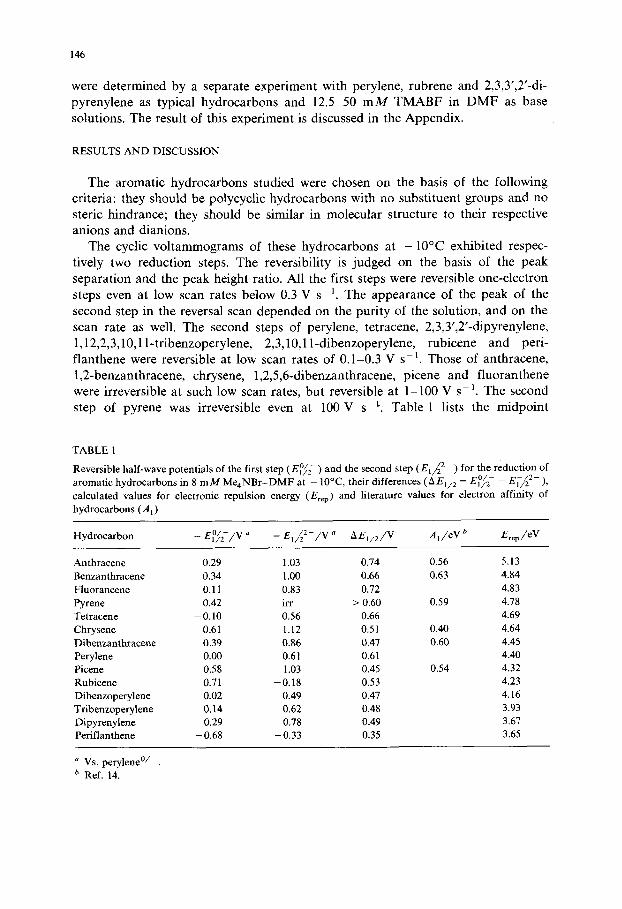
Fig. 2. Plot of 3eE°fi2- e E ~ 2- -2A, vs. Ere p. E°f2 - and Ei-~ 2- are respectively the reversible half-wave potentials of hydrocarbon molecule/anion and anion/dianion couples in DMF, A 1 the electron affinity of hydrocarbon molecule and Ere p the calculated repulsion energy of electrons in the LUMO of hydrocarbon molecule.
148
where c is a constant which is appropriate to the reference electrode employed. A c value of -2.81 eV was determined by the method of standard redox couple [15], where the formal potential of [Fe(bpy)3] + / - was obtained from the reversible half-wave potentials of [Fe(bpy)3] +/° and [Fe(bpy)3] ° / - , 0.21 V and -0 .04 V vs. perylene ° / - respectively.
The Er~ p values were calculated according to the procedure of Hush and Black- ledge [I]. The c i values were calculated by the Htickel MO method and the repulsion integrals over carbon 2p~r AO's by the method of Pariser and Parr [16] with a rij value of 0.1397 nm.
Equation (1) has been tested by previous authors [1,2] by comparing the theoreti- cal and the experimental values for AE1/2. However, it may be done better on the basis of the following equation obtained by combining eqns. (2) and (6):
3e( E°f2 - )obs- e( EI-~ 2- )obs- 2A1 = Erep + 2 c - c 2 (7 )
Figure 2 shows experimental values for the left hand side of eqn. (7) plotted against the calculated Ere p values. The experimental points fit a straight line having a unity slope, in accordance with the requirement of eqn. (7). The 2c - c 2 value determined from the intercept on the vertical axis is -6 .10 eV. The discrepancy from the value calculated with c = - 2 . 8 1 eV and c2=0.01 eV (Table AI), -5.63 eV, is not surprising, when the accuracy of calculation is considered.
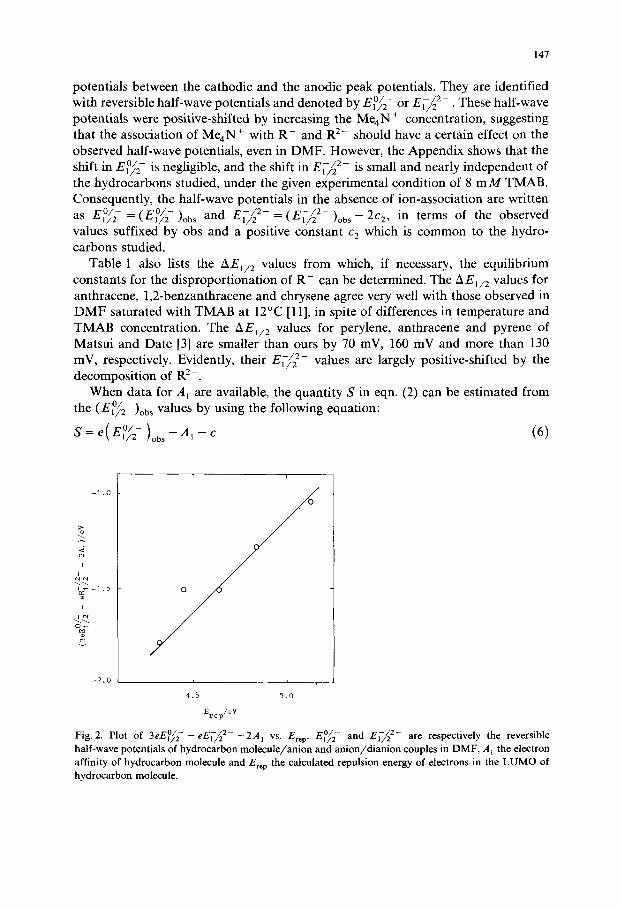
Figure 3 shows that the following linear relation exists also between AEr~ p and experimental A E] /2 :
e( A El /z )obs= O.Z9E~v-O.70 (8)
According to this equation, experimental determination of Ere p based only on voltammetric data is promising. It is worthy of noting that the slope is much smaller
1.0
..~0.5
O,0 3.0 4 .0 5.0
Erep/eg
Fig. 3. Plot of eA E1/2 vs. Erep, A E1/2 being E°/~ - - El~~2 2-.
149
0 . 1 2
0.10 o
~ ] ~
O. 08
~ cx4 = 0 . 0 6 E r e p / e g - 0 . J 8 o i t
4 .5 5,0
Erep/eV
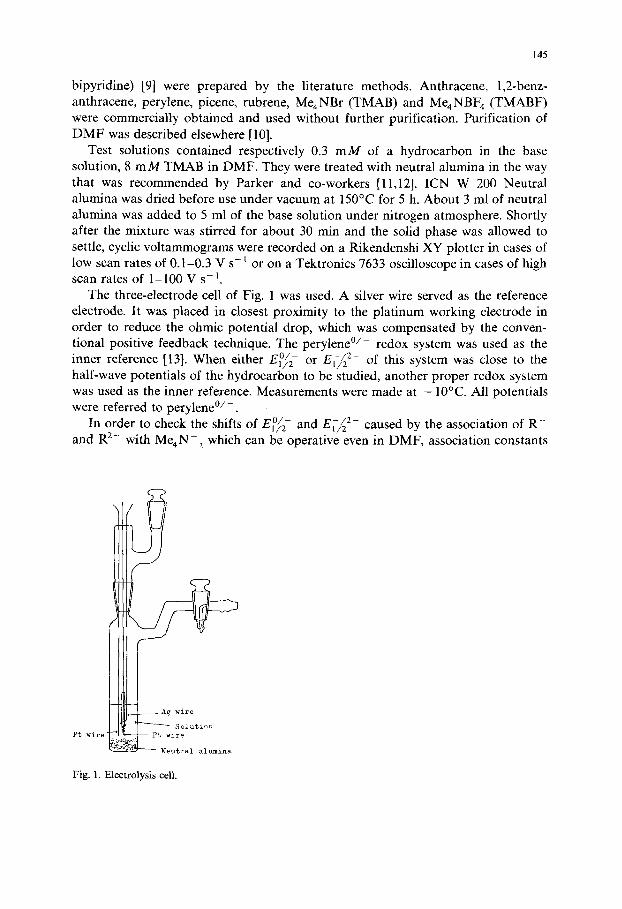
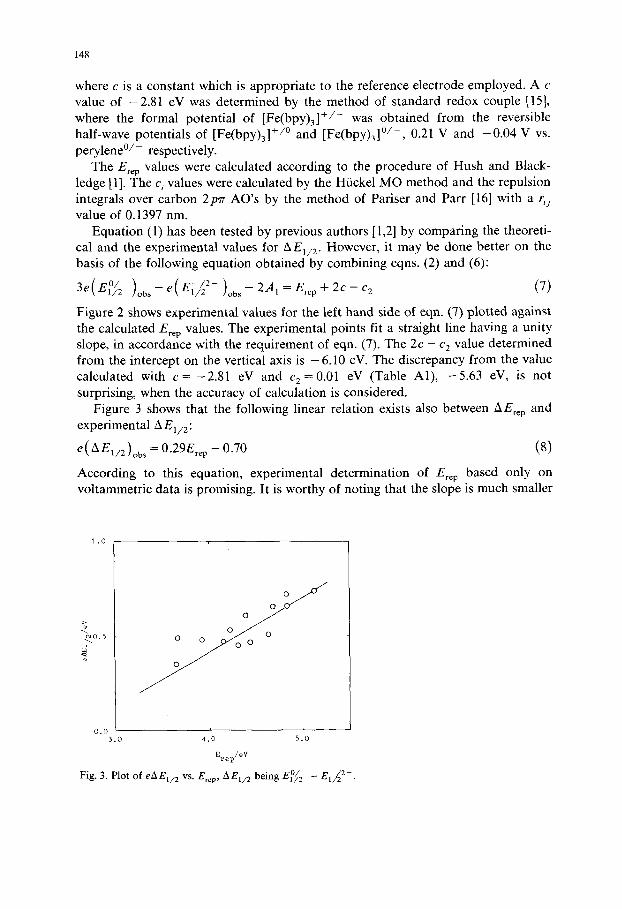
Fig. 4. Plots of S vs. Y.ic 4, G being the coefficient of the ith AO in the LUMO of hydrocarbon molecule calculated with the Hiickel MO.
than unity, the value which the slope of eAEt /2 vs. E~e p should have, when it is assumed that S is a constant of the series of hydrocarbons concerned. This assumption has been made by many authors who discussed the correlation between the E°~f2 values of aromatic hydrocarbons and their LUMO energies [17]. A comparison between eqns. (2) and (8) leads to the following linear relation between S and Erep:
S = 0.36Ere p + 0.35 - 0.5c 2 (9)
An explanation of this linear relation is given as follows, though it is tentative on the basis of the isolated-charge model of solvation. The sum Y. i jq iqJru in eqn. (5) is formally equal to Er~ p given by eqn. (1). However, the numerical values of the terms with i = j in eqns. (1) and (5) may be different from each other, because they depend on the choice of r u value. Consequently, the following relation between S and Ere p can be written:
S = 0.5(I - 1/Os)Ere p At- ~ = 0.5Ere p + 6 (10)
where 8 is the term due to the difference described above. Figure 4 shows that the quantity Y.i c4 involved in ~ also depends linearly on Ere p. However, this circum- stance cannot affect the relation between S and Ere p much, because the numerical value of 8 is about five times as small as the preceding term. Since the isolated-charge model and its application to the calculation of solvation energy involve some points to be refined, agreement between eqns. (9) and (10) may be satisfactory at this stage. Better agreement will be obtained if dielectric saturation is taken into consideration [3].
ACKNOWLEDGEM ENT
S.A. thanks Dr. K . Suga for his helpful discussion.
150
APPENDIX
Half-wave potential shift due to ion association
When an anion radical (R - ) , a dianion (R 2- ) and a counter cation (M + ) are subjected to the rapid ion-association equilibria given by
R - + M + ~ R - M + (A1)
R 2- + M + ~ R 2 - M + (a2)
1{2- M+ + M+ # R2- ( M+ )2 (A3)
and when all the chemical species involving R - have a common diffusion coeffi- cient, the observed half-wave potentials ( E ° / 2 and E ~ / 2 - ) are related to their respective standard potentials (E ° / - and E o / 2 - ) by the following equations [18]:
E° ] /2 - = E g / - +fin(I_ + Kla ) (A4)
Er/2-=Eo/2- +f ln[ (1 + K2a+ K2K3a2)/(1 + K,a)] (A5) where f stands for RT/F, a is the activity of M + , and K1, K 2 and K 3 are respectively the association constants for reactions (A1)-(A3). By adding eqns. (A4) and (A5), one obtains
E°f f + E~-/2-=E ° / - + Eo/2- + f l n ( l + Kza+ KzK3 a2) (A6)
Equations (A4) and (A6) are respectively rewritten as
exp(6E°/f / f ) = ( l + Kla ) exp(~E°o/-/f ) (A7)
1 1 ,Q L0
o
- - 0 . 5 . ~
O. ~ i O. 0 25 50
a/raM
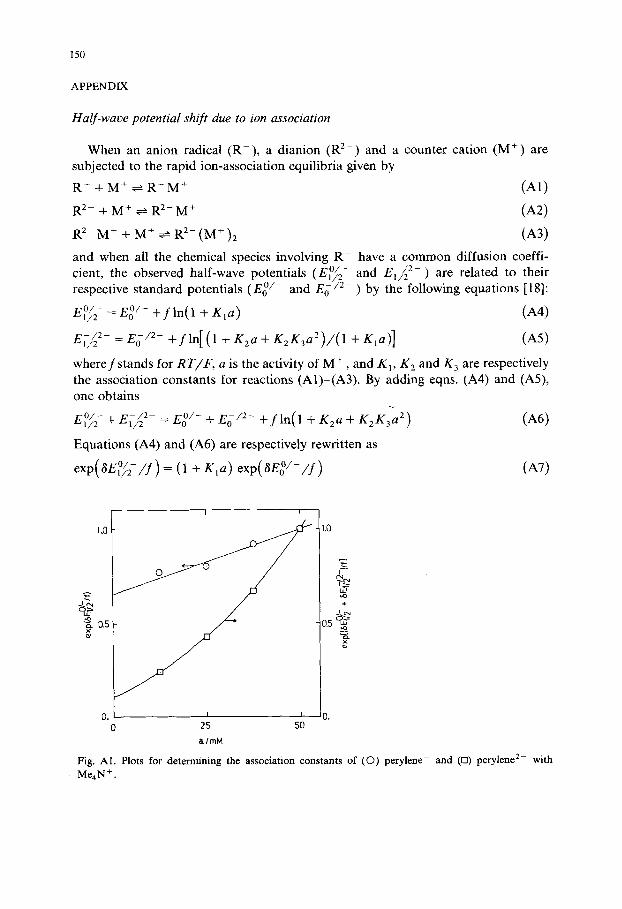
Fig. AI. Plots for determining the association constants of (©) perylene- and ([3) perylene 2- with Me4N +.
151
TABLE A1
Association constants of hydrocarbon anions (K~) and dianions ( K 2 and K 3) with Me4N + in D M F at - 10°C, and the half-wave potential shifts caused by ion association in 8 m M M e 4 N B F a - D M F
Hydrocarbon K 1 / M - l ,, K 2 / M - i ,~ K 3 / M 1 a Shift in
E°l/~- / m V E ~ - / Z - / m V
Perylene 11 69 27 2 12 Rubrene 12 43 37 2 8 Dipyrenylene 9 102 20 2 15
a The equilibrium constants for reactions (AI)-(A3) in the text.
and
exp[(3E°/2 + 6 E l / 2 - ) / f ] = ( 1 + K2a+ K2K3a 2) exp[(3E°o/- +3Eo/z - ) / f]
(AS)
with 3E1/2 = E~/2- *E~/2 and 3E o = E o -*El l2 , where *Ell2 is the half-wave potential in 0.05 M T M A B F - D M F . In practical analysis using eqns. (A7) and (A8), the ionic activity is identified with the molar concentration, for the sake of simplicity.
Half-wave potentials were measured against the potential of the [Fe(bpy)3]+/- redox electrode, for the following reasons: the transport number data for the base electrolyte are not available and, consequently, the liquid junction potential between the compartments of the working and the reference electrode is undeterminable; these complex ions may associate with Me4N + to smaller extent than R - because of
F r + / 0 greater molecular size; the shifts of ~1/2 and E°//2- due to ion association, being opposite in direction, may operate to cancel each other.
Figure A1 shows typical plots of exp(3E°f2 / f ) vs. a and exp[(3E°//2+ 3E~//2 2- ) / f] vs. a. The solid lines are calculated from eqns. (AT) and (A8) by adjusting the K~, K 2 and K 3 values so that these curves may be best fitted with the experimental points. Table A1 lists the K1, K 2 and K 3 values thus determined for three hydrocarbons in T M A B F - D M F at - 10°C. This table also shows the values for E°/2 - E ° / - and E~ - / 2 - - E o / 2 - u n d e r the experimental conditions of our present concern, i.e. those in 8 m M T M A B F - D M F . Table A1 has the following features: each of K~, K 2 and K 3 does not depend much on the hydrocarbons; the shifts of E°/~ - a n d E 1 / z - caused by ion association are respectively 2 mV and less than 20 mV, under our experimental conditions; it may be safe to assume that the second feature applies to all other hydrocarbons used in this work, because they have nearly equal molecular dimensions and similar molecular structures.
REFERENCES
1 N.S. Hush and J. Blackledge, J. Chem. Phys., 23 (1955) 514. 2 G.J. Hoijtink, E. De Boer, P.H. Van Der Meij and W.P. Weijland, Rec. Trav. Chim. Pays-Bas, 75
(1956) 487.
152
3 Y. Matsui and Y. Date, Proceeding 16th Symposium on Polarography and Electroanalytical Chem- istry, Kyoto, Oct., 1970, p. 20.
4 T. Saji and S. Aoyagui, J. Electroanal. Chem., 98 (1979) 163. 5 H. Vollman, H. Becker, M. Corell and H. Streek, Liebigs Ann. Chem., 531 (1937) 1. 6 E. Clar and M. Zander, J. Chem. Soc., (1958) 1861. 7 W. Schlenk and M.Karplus, Chem. Ber., 61 (1928) 1675. 8 V. Braun and G. Manz, Chem. Ber., 70 (1937) 1603. 9 F.H. Burstall and R.S. Nyholm, J. Chem. Soc., (1952) 3570.
10 T. Saji, T. Yamada and S. Aoyagui, J. Electroanal. Chem., 61 (1975) 147. 11 B.S. Jensen and V.D. Parker, J. Am. Chem. Soc., 97 (1975) 5211. 12 O. Hammerich and V.D. Parker, Electrochim. Acta, 18 (1973) 537. 13 T. Saji and S. Aoyagui, Chem. Lett., (1981) 983. 14 R.S. Becker and E. Chen, J. Chem. Phys., 45 (t966) 2403. 15 T. Kakutani, Y. Morihiro, M. Senda, R. Takahashi and K. Matsumoto, Bull. Chem. Soc. Jpn., 51
(1978) 2847. 16 R.Pariser and R.G. Parr, J. Chem. Phys., 21 (1953) 767. 17 C.K. Mann and K.K. Barnes, Electrochemical Reactions in Nonaqueous Systems, Marcel Dekker,
New York, 1970, Ch. 2, and references therein cited. 18 B.G. Chauhan, W.R. Fawcett and A. Lasia, J. Phys. Chem., 81 (1977) 1476.


![blackledge - capitulo 2[1]](https://img.pdfslide.us/doc/110x75/557201f94979599169a2b88a/blackledge-capitulo-21.jpg)