Embed Size (px)
Citation preview
IEEE Transactions on Power Apparatus and Systems, Vol. PAS-102, No. 5, May 1983
VOLTAGE-TIME CHARACTERISTICS OF PARTICLE-INITIATEDIMPULSE BREAKDOWN IN SF6 AND SF6-N2
Magdy B. Eteiba Farouk A.M. Rizk,Fellow IEEE
Institut de recherche d'Hydro-Quebec (IREQ)Varennes, Quebec, Canada
Abstract - The paper comprises a theoreticaland experimental investigation into the impulse break-down voltage-time characteristics of a spherical-particle-contaminated coaxial-cylinder gap in com-pressed SF6 and SF6-N2 mixture. The experimental workwas carried out on a 25/70-mm diameter coaxial-cylindergap with a 3.2-mm spherical particle attached to thehigh-voltage electrode, at a gas pressure of 0.3 MPaunder 0.5/50-ps and 1.2/50-is impulses of both polari-ties. Whenever possible the results were compared tothose previously obtained on a clean system from whichthe particle effect on impulse breakdown voltage anddelay time was identified.
The theoretical and experimental results ofbreakdown delay time distributions, 5% and 95% proba-bility voltage-time curves and breakdown voltageprobability functions were found to be in satisfactoryagreement.
INTRODUCTION
In recent years, a considerable amount of re-search has gone into the investigation of particle-initiated breakdown in compressed electronegativegases, particularly SF6 [1-4]. These studies haveestablished the extent to which the breakdown voltagedepends on particle material, size and shape as well ason the type of the applied voltage [4-71. During alightning impulse, it is generally recognized that aconducting particle will be most detrimental to impulsewithstand voltage if it is already attached to thehigh-voltage conductor [4,7].
Recent research on the impulse-breakdown voltage-time characteristics of compressed SF6 [8-12] andSF6-N2 mixtures [12] has been confined to cleansystems. For particle-contaminated systems, which areparticularly vulnerable to overvoltages, such researchrepresents considerable technical interest. Further-more, it is also scientifically very attractive for itprovides an opportunity to study breakdown processesassociated with restricted critical volumes, i.e.volumes around the most stressed electrode whereeffective electron multiplication can take place.Finally, with the growing interest in the applicationof SF6-N2 mixtures for cold climates, there seems to bea need for systematic investigation of the voltage-timecharacteristics of particle-contaminated SF6-N2 gaps.
Whereas in a practical compressed-gas-insulated(CGI) system contaminant particles could assume veryirregular shapes, a scientific investigation, particu-larly if analytical in nature, must do with a simpleparticle shape.
82 SM 407-5 A paper recommended and approved by theIEEE Insulated Conductors Cotnmittee of the IEEE PowerEngineering Society for presentation at the IEEE PES1982 Summer Meeting, San Francisco, California, July 18-23, 1982. Manuscript submitted January 29, 1982; madeavailable for printing May 5, 1982.
In the present study, the impulse breakdown volt-age-time characteristics of cylindrical gaps in SF6 andSF6-N2 mixtures with a spherical particle attached -tothe high-voltage electrode are theoretically and exper-imentally investigated at a pressure of 0.3 NPa forboth positive- and negative-polarity impulses. Thiswork could be considered a natural extension of recent-ly reported efforts on theoretical and experimentaldetermination of the impulse breakdown voltage-timecharacteristics of clean SF6 and SF6-N2 coaxial-cylinder gaps [12].
Theoretical Considerations
Free or initiatory electrons can be produced in acompressed-gas gap by cosmic radiation or naturalradioactivity. These electrons can only be effectivein initiating an avalanche within a critical volumewhere the ionization coefficient a exceeds the electronattachment coefficient n. More precisely, for posi-tive polarity voltages, the critical volume will bedetermined by two boundary surfaces shown by lines 1and 2 in Fig. 1. Line 1 corresponds to the equi-fieldsurface at which the ionization coefficient a is equalto the attachment coefficient n. Line 2 is determinedby the minimum avalanche length 4+ which is a functionof the applied field in the vicinity of the electrodesurface.
t I
Spherical particle
9
Critical..volume
Fig. 1 Critical volume VC of a 3.2-nm spherical par-ticle attached to the central electrode of acoaxial-cylinder gap at an overvoltage ratioof 0.1 p.u.
A simpler but less rigorous determination of thecritical volume uses the surface a = n as one boundaryand the electrode surface as the other [13-16]. Theerror involved in this approach becomes negligible athigher pressures and overvoltage ratios. Quantitativeestimates of the error involved in the treatment of theweighted volume Vws derived from the critical volume Vcwill be given below. If the simplified approach out-lined above is used for the determination of Vc, then
0018-9510/83/0500-1352$01.00 © 1983 IEEE
1352
I
II
for the spherical-particle-contaminated system understudy an error of approximately 7% will result in Vwsfor a pressure of 0.1 MPa and an overvoltage ratio of0.1 p.u.
It is obvious that for SF6 or other stronglyelectronegative gases, not all electrons produced with-in the critical volume will in reality be available foravalanche production, since some of them are swept awayas they become attached to form negative ions [17].Therefore, the probability PO that an electron might beswept away because of negative-ion formation has to betaken into consideration and the critical volume Vcavailable for electron multiplication must be replacedby a weighted volume Vws which can be written in thegeneral form:
1353
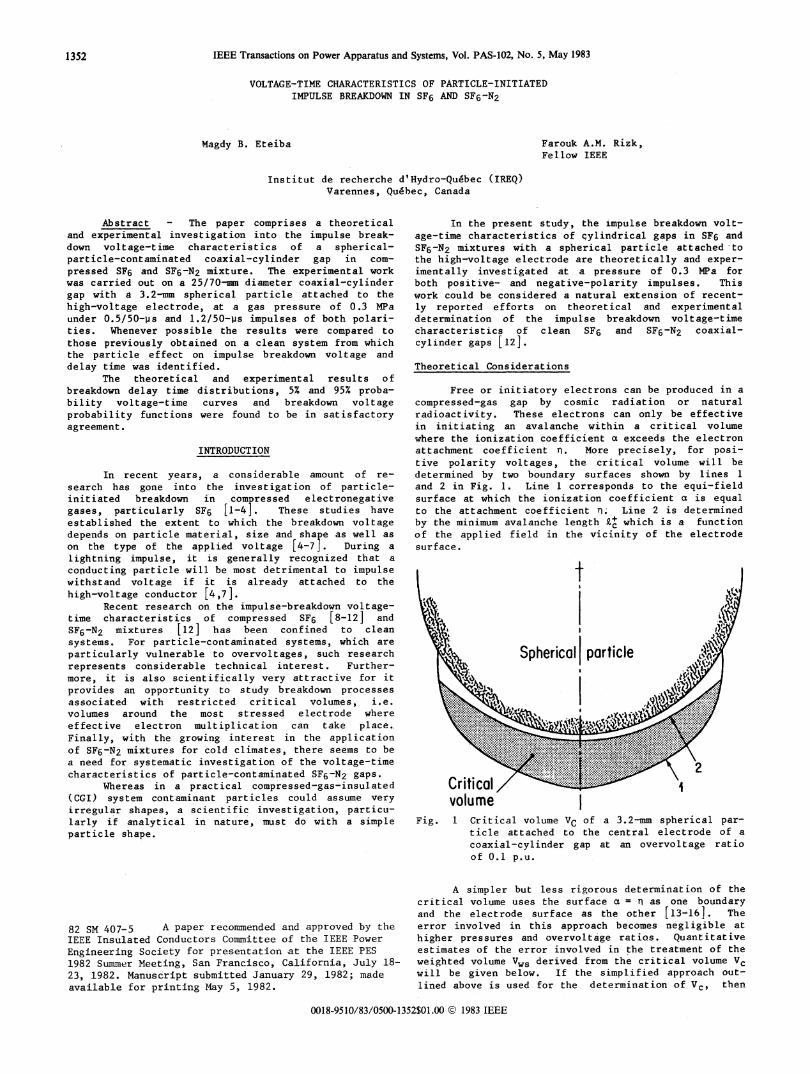
coaxial-cylinder gap can be estimated and can beexpressed as a function of (U - Uo)/UO where U is theapplied voltage and UO is the breakdown inception volt-age. Figure 2 shows the results of calculation of Vwsas a function of (U - Uo)/UO for a 3.2-mm diameterspherical particle attached to the central electrode of25/70-mm diameter coaxial-cylinder electrodes in SF6,which can be expressed in the approximate empiricalform:
U - UKU
ws X (3)
where UO is the breakdown inception voltage
X = 9 mm3VWs V
c
(1 - P ) dV0
(1)K1-1.8
Similar results were obtaine3 with the 50% SF6 -50% N2 mixture yielding X = 9.5 mm and K1 = 1.85.
The critical volume is divided into several sub-volumes. In one major subvolume, the uniform fieldvalues of PO were used according to:
P=n (E)/a (E) (2)0~~~~~~~~~~~~~~~~In the remaining subvolumes, the values of P0
were taken from [12], in which the nonuniformity alongthe electric field lines were taken into account. Thespatial field distribution necessary for the evaluationof a, n and PO was obtained using the charge simulationtechnique described in [18,19].
Adopting an approach similar to that used in cal-culating the weighted volume for the cylindrical geo-metry [12], the weighted volume for the contaminated
'I I
SF6,o c
_ l \(U
Z 1 1~~~~~~~~~~~~~~~~~~~~~~~~~~~~~~~~~~~~
,Particle contaminatedaolculotedJ-UOKUO
l
0,5 -- 1.0 1,5 2,0 2,5(Ui0O)/UO, p.U.
Fig. 2 Variation in the computed weighted volume fora spherical particle attached to the centralelectrode of an SF6 coaxial-cylinder gap as a
function of the overvoltage ratio
As previously shown by Knorr [14], the probabili-ty of occurrence of a tstatistical time lag ts due toelectron production in the gas volume can be related tothe weighted volume by:
t + t0
P (t ) = 1 - Exp - n vv O J ws
dt (4)
where to is the time corresponding to UO and No is theaverage rate of electron production.
It should be noted that the above expression isvalid only for positive-polarity impulses and that fornegative polarity account must be taken of the effectof electron production from or in the vicinity of thecathode surface. In the absence of exact knowledge onthe nature of electron emission involved in negative-polarity breakdown in compressed gases, a semiempiricalexpression for the dependence of the rate of a pre-viously developed electron production per unit area neson the electric field at the cathode surface will beused [12]:
FE El2nr 01nes E0j(5)
where ne0 and K2 are constants and Eo is the inceptionfield.
K2 and ne0 will be determined experimentally fromtime lag measurements under negative-polarity impulses.The total probability of statistical time lags due toboth independent mechanisms of electron production whenthe high-voltage electrode is negative can therefore beexpressed as:
l t + to s
P (t ) = 1 - Exp - n Vs 0 Wst0
dt
t + t
eo As E 2
o~~~~dt (6)
where As is the effective stressed area of the spheri-cal particle as defined below.
8
6fte
4
T I
10
2[
1354
The effective stressed area is readily defined asthe equivalent area stressed at the maximum fieldstrength. For uniform or quasi-uniform field gapswhere the field strength is almost constant, thestressed area coincides with the total area of the highvoltage electrode. For a spherical particle, where thefield varies over the active suface in the range Em toEo, the stressed area can be defined as:
EK m EK2E E 2 = [E - E d(
A' R dA (7)
or
A =s
ImrE - E 1K
EE o0
E - E K2m 0o
Eo
dA
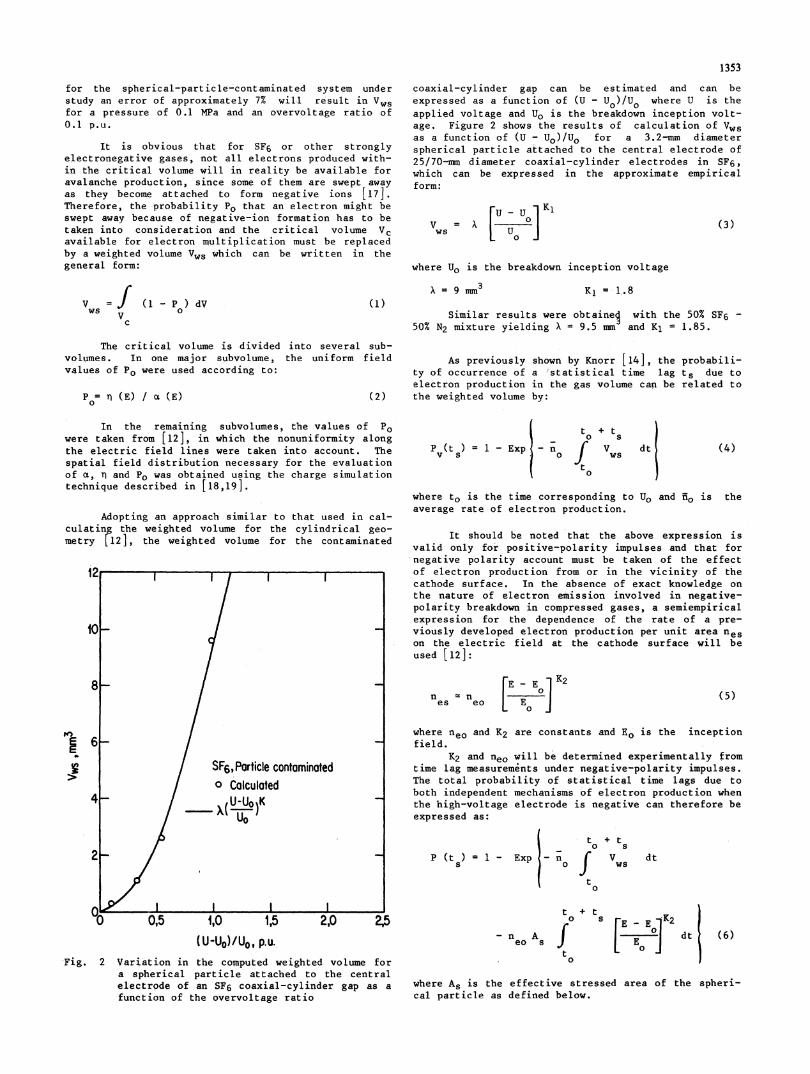
Figure 3 shows the variation in the effectivestressed area of a 3.2-mm diameter spherical particleattached to the central conductor of a coaxial-cylinderelectrode gap as a function of Em/Eo. It should benoted that the effective stressed area increases withthe increase of Em/Eo, i.e. as the overvoltage factorincreases, and vanishes as Em/Eo + 1.
20
16
N12 _ /
-o1 2 3 4 5
Em/Eo, P.U.
Fig. 3 Variation in the effective stressed area of a
3.2-mm diameter spherical particle attached tothe central electrode of a 25/70-mm coaxial-cylinder gap as a function of the ratio E /E
As previously shown [12], the probability of a
formative time lag tf corresponding to an area lessthan or equal to A between the applied voltage impulseand the threshold breakdown level UO, once an ava-
lanche-effective electron is already present, can bewritten as:
Pc (tf(A)lt5) = 1 - e (9)
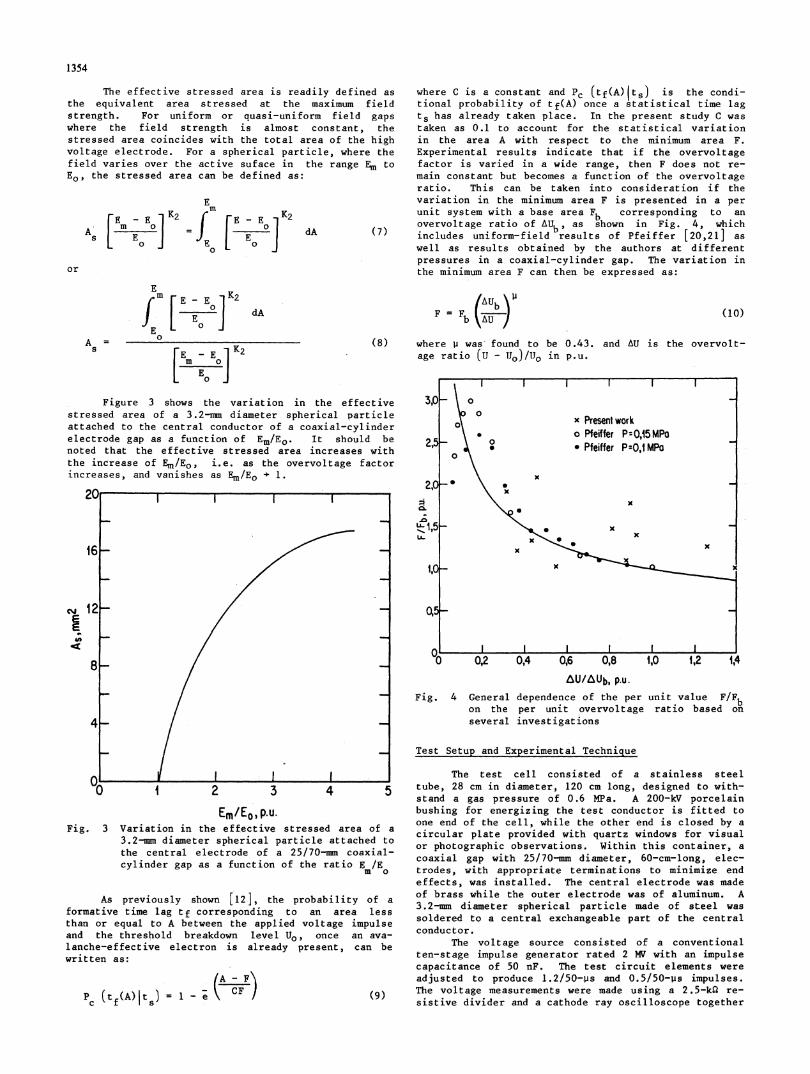
where C is a constant and Pc (tf(A)Its) is the condi-tional probability of tf(A) once a statistical time lagts has already taken place. In the present study C wastaken as 0.1 to account for the statistical variationin the area A with respect to the minimum area F.Experimental results indicate that if the overvoltagefactor is varied in a wide range, then F does not re-main constant but becomes a function of the overvoltageratio. This can be taken into consideration if thevariation in the minimum area F is presented in a perunit system with a base area F corresponding to anovervoltage ratio of AU,, as shown in Fig. 4, whichincludes uniform-field results of Pfeiffer [20,21] aswell as results obtained by the authors at differentpressures in a coaxial-cylinder gap. The variation inthe minimum area F can then be expressed as:
/AUb u1bUF -2Fb
J
(10)
where p was found to be 0.43. and AU is the overvolt-age ratio (U - uJo)/Uo in p.u.
3,0- 0
0t x Presentwork2\5-* o Pfeiffer P-0,15MPa
2, * Pfeiffer P:O,lMPo
20*x
2,C\.p15CL&
1, xl,C_ x x
o I I
0 0,2 0,4 0,6 0,8 1,0 1,2 1,4AU/AUb, p.u.
Fig. 4 General dependence of the per unit value F/Fbon the per unit overvoltage ratio based onseveral investigations
Test Setup and Experimental Technique
The test cell consisted of a stainless steeltube, 28 cm in diameter, 120 cm long, designed to with-stand a gas pressure of 0.6 MPa. A 200-kV porcelainbushing for energizing the test conductor is fitted toone end of the cell, while the other end is closed by acircular plate provided with quartz windows for visualor photographic observations. Within this container, acoaxial gap with 25/70-mm diameter, 60-cm-long, elec-trodes, with appropriate terminations to minimize endeffects, was installed. The central electrode was madeof brass while the outer electrode was of aluminum. A3.2-mm diameter spherical particle made of steel wassoldered to a central exchangeable part of the centralconductor.
The voltage source consisted of a conventionalten-stage impulse generator rated 2 MV with an impulsecapacitance of 50 nF. The test circuit elements wereadjusted to produce 1.2/50-ps and 0.5/50-us impulses.The voltage measurements were made using a 2.5-kS re-sistive divider and a cathode ray oscilloscope together
1355with an impulse peak voltmeter. The time to breakdownwas measured using a setup which was described indetail in an earlier IREQ publication [22]. The unitstep response of the voltage measuring system resultedin a total response time TR of approximately 30 ns.
From points on the impulse voltage front corre-
sponding to 30% and 90% of the impulse amplitude [23],the virtual origin from which the time to breakdown was
measured and the equivalent rate of voltage rise S was
determined. For breakdowns taking place on the impulsefront the following corrections were introduced in themeasured breakdown voltage and time to breakdown re-
spectively [24]:
6U = S.TR
and
6tb TR
(11)
(12)
No corrections were necessary for breakdowns that tookplace on the impulse tail.
The critical withstand voltage was determinedusing the a-s technique [25] with three tests per volt-age level in the a test and 25 tests per level in the ftest with the step between successive voltage levelsamounting to approximately 2% of the expected withstandlevel. Based on simulated tests [26] the determinedwithstand level will correspond to a breakdown proba-bility of approximately 2%.
The time to-breakdown was measured for voltageimpulses of prospective peak values in the range 1.1to 4.0 U0. The number of shots at each voltage levelvaried in the range of 100-150. The time intervalbetween successive impulses varied in the range of45-60 s.
Rate of Free-Electron Production
As previously shown, the rate of production offree electrons per unit volume and unit time can bedetermined from the following relation [12]:
n =0
Qn 2t50% - tf
vt0
(13)
dtws
where t5O% is the 50% breakdown delay under a positive-polarity impulse. The formative time lag tf was deter-mined as described in [12] for each set of experimentalparameters.
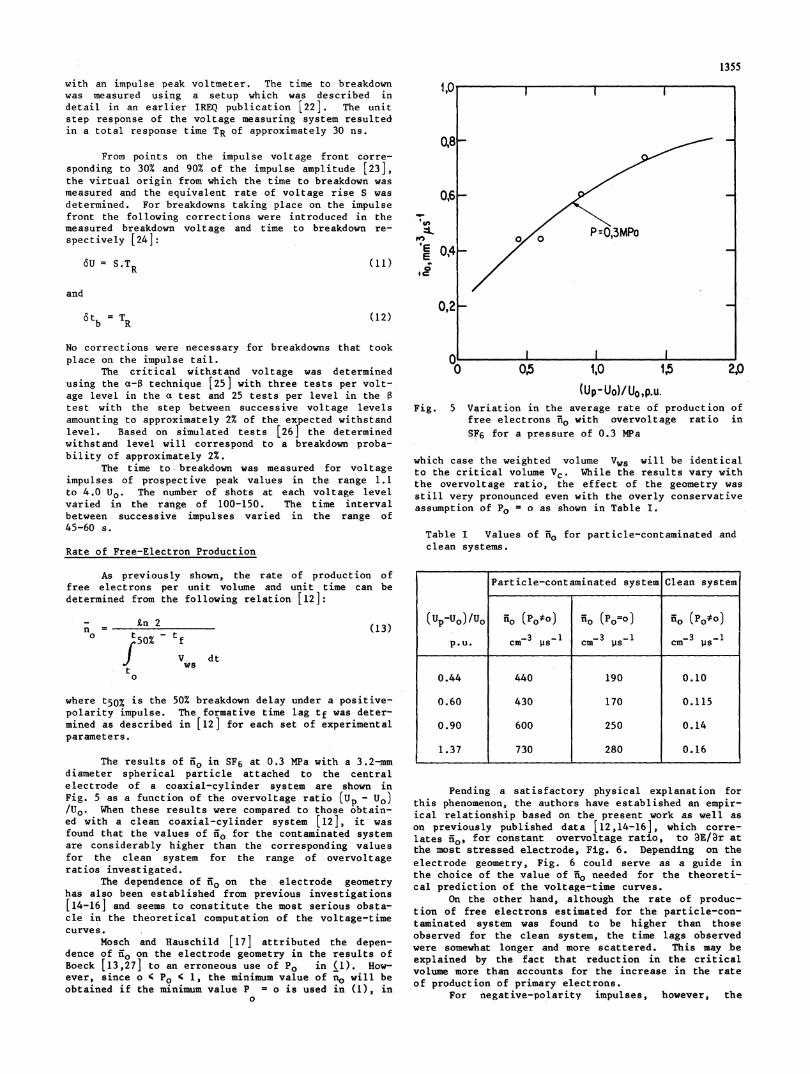
The results of io in SF6 at 0.3 MPa with a 3.2-mmdiameter spherical particle attached to the centralelectrode of a coaxial-cylinder system are shown inFig. 5 as a function of the overvoltage ratio (up - UO)/UO. When these results were compared to those obtain-ed with a clean coaxial-cylinder system [12], it was
found that the values of io for the contaminated systemare considerably higher than the corresponding valuesfor the clean system for the range of overvoltageratios investigated.
The dependence of ino on the electrode geometryhas also been established from previous investigations[14-16] and seems to constitute the most serious obsta-cle in the theoretical computation of the voltage-timecurves.
Mosch and Hauschild [17] attributed the depen-dence of no on the electrode geometry in the results ofBoeck [13,27] to an erroneous use of PO in (1). How-ever, since o 4 PO 4 1, the minimum value of no will beobtained if the minimum value P = o is used in (1), in
0
1,0
Q8_
0,6,
EE
0,2F-
-I-
0,5 1,0 15 2,0(Up- Uo)/ UO,p.u.
Fig. 5 Variation in the average rate of production offree electrons ioi with overvoltage ratio inSF6 for a pressure of 0.3 MPa
which case the weighted volume Vws will be identicalto the critical volume Vc. While the results vary withthe overvoltage ratio, the effect of the geometry was
still very pronounced even with the overly conservativeassumption of PO = o as shown in Table I.
Table I Values of Ho for particle-contaminated andclean systems.
Pending a satisfactory physical explanation forthis phenomenon, the authors have established an empir-ical relationship based on the present work as well as
on previously published data [12,14-16], which corre-
lates no, for constant overvoltage ratio, to 3E/Dr atthe most stressed electrode, Fig. 6. Depending on theelectrode geometry, Fig. 6 could serve as a guide inthe choice of the value of ho needed for the theoreti-cal prediction of the voltage-time curves.
On the other hand, although the rate of produc-tion of free electrons estimated for the particle-con-taminated system was found to be higher than thoseobserved for the clean system, the time lags observedwere somewhat longer and more scattered. This may beexplained by the fact that reduction in the criticalvolume more than accounts for the increase in the rateof production of primary electrons.
For negative-polarity impulses, however, the
Particle-contaminated system Clean system
(p-Uo)/Uo rio (Po*° no (Po=°) 0O (Po*°)-3 -1 -3 -1 -3 1p.u. cm- Ps cm- s cm7 lis-
0.44 440 190 0.10
0.60 430 170 0.115
0.90 600 250 0.14
1.37 730 280 0.16
-v lF IF
1356
1V
10
In
0IC I10
10
'v 10 102 103 404(dE/ar)r=R, kV/cm2
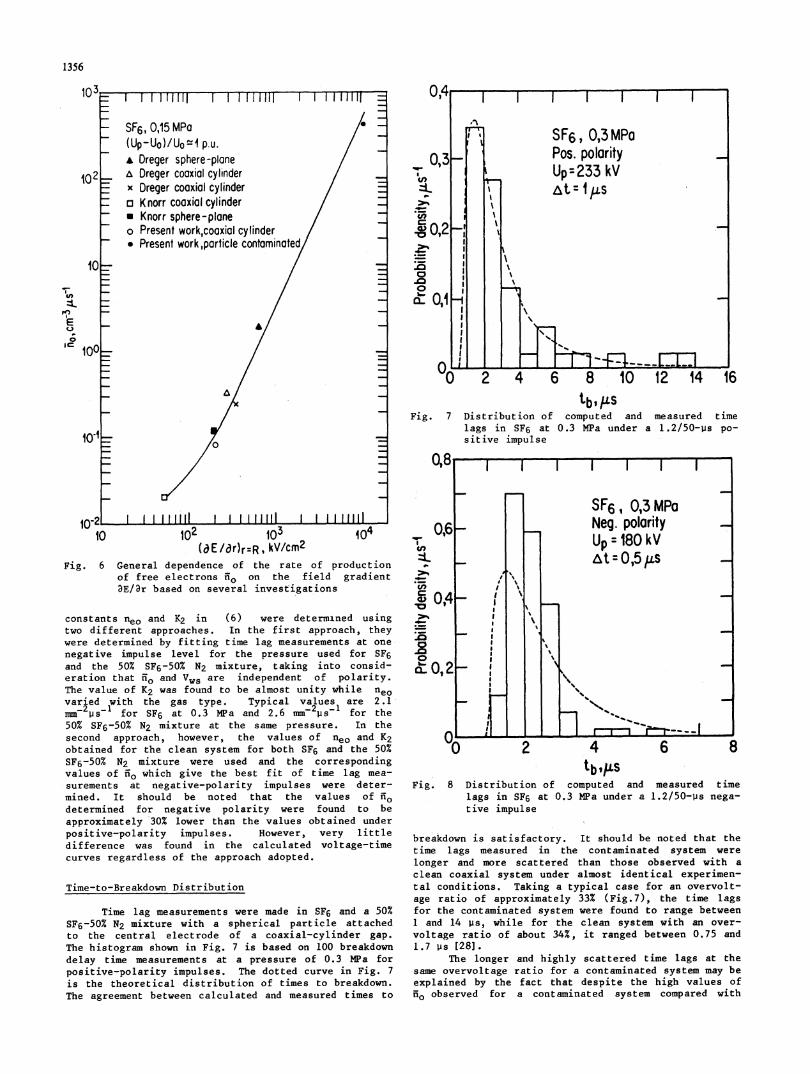
Fig. 6 General dependence of the rate of productionof free electrons Ho on the field gradientaE/ar based on several investigations
constants neo and K2 in (6) were determined usingtwo different approaches. In the first approach, theywere determined by fitting time lag measurements at one
negative impulse level for the pressure used for SF6and the 50% SF6-50% N2 mixture, taking into consid-eration that no and Vws are independent of polarity.The value of K2 was found to be almost unity while neovaried _with the gas type. Typical values are 2.1mmC us for SF6 at 0.3 NPa and 2.6 mm-2s1 for the50% SF6-50% N2 mixture at the same pressure. In thesecond approach, however, the values of neo and K2obtained for the clean system for both SF6 and the 50%SF6-50% N2 mixture were used and the correspondingvalues of n0 which give the best fit of time lag mea-
.surements at negative-polarity impulses were deter-mined. It should be noted that the values of fodetermined for negative polarity were found to beapproximately 30% lower than the values obtained underpositive-polarity impulses. However, very littledifference was found in the calculated voltage-timecurves regardless of the approach adopted.
Time-to-Breakdown Distribution
Time lag measurements were made in SF6 and a 50%SF6-50% N2 mixture with a spherical particle attachedto the central electrode of a coaxial-cylinder gap.The histogram shown in Fig. 7 is based on 100 breakdowndelay time measurements at a pressure of 0.3 MPa forpositive-polarity impulses. The dotted curve in Fig. 7is the theoretical distribution of times to breakdown.The agreement between calculated and measured times to
IU)
cn-0
:_
._O
-cxCL
"0 2 4 6 8 10 12 14 16tb,. Ls
Fig. 7 Distribution of computed and measured timelags in SF6 at 0.3 MPa under a 1.2/50-ps po-sitive impulse
O,8
0,6qlr
I._
C,-
::oUI
4)
0' 0,2
O0
Fig.
2 4 6 8tb.4LS
8 Distribution of computed and measured timelags in SF6 at 0.3 MPa under a 1.2/50-ps nega-tive impulse
breakdown is satisfactory. It should be noted that thetime lags measured in the contaminated system were
longer and more scattered than those observed with a
clean coaxial system under almost identical experimen-tal conditions. Taking a typical case for an overvolt-age ratio of approximately 33% (Fig.7), the time lagsfor the contaminated system were found to range between1 and 14 uis, while for the clean system with an over-
voltage ratio of about 34%, it ranged between 0.75 and1.7 us [28].
The longer and highly scattered time lags at thesame overvoltage ratio for a contaminated system may beexplained by the fact that despite the high values ofNo observed for a contaminated system compared with
7,. I I I I I I I
I SF6, 0,3 MPa)13- Pos. polarity
Up=233 kV
$S~~~~~~t=IL)12. .
I 11111 I 1 11111H =
SF6, 0,15 MPa /(Up-Uo)/Uo I p.u.A Dreger sphere-plane
2 a Dreger coaxial cylinder- Dreger coaxial cylinder
co Knorr coaxial cylinder* Knorr sphere-planeo Present work,coaxial cylinder* Present work,particle contaminated-
0
_O -
-2 1111 I I 1 1111 1 11111
Il I I I I I I
SF6, 0,3MPaNeg. polarityUp=180kVat = 0,5 /iLS
I'\I
-1-
0,4 _
4r
6 8 10 12 14 16tb,4S
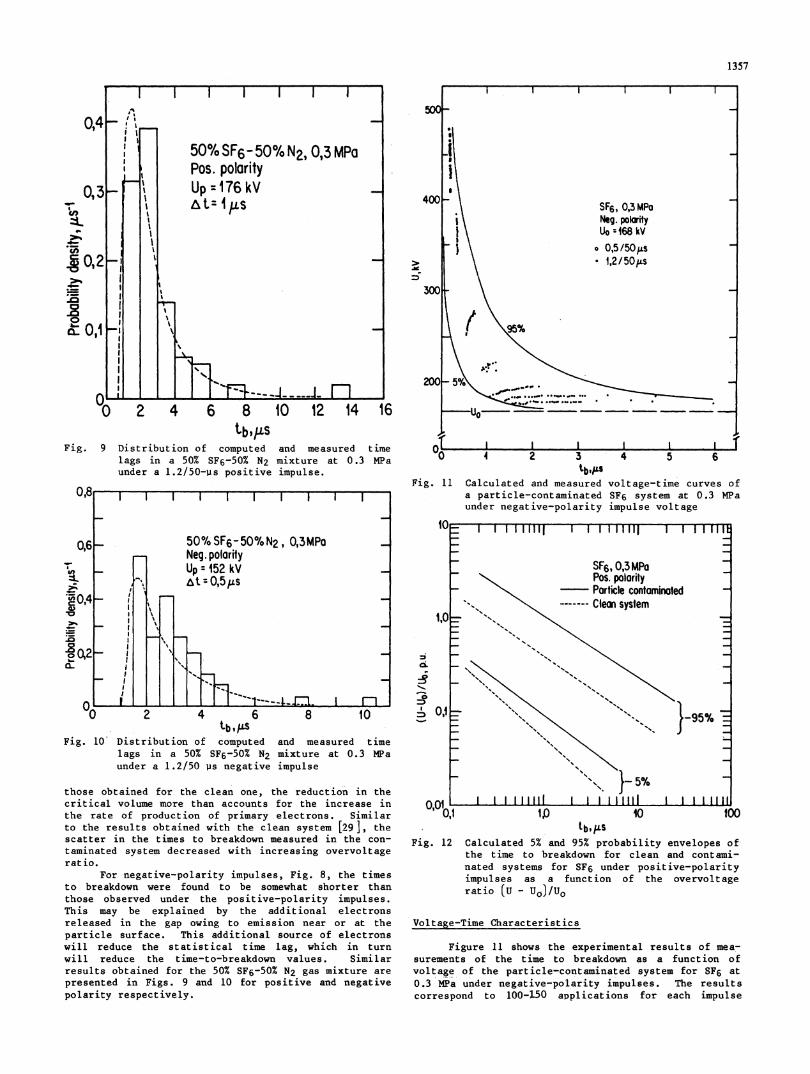
Fig. 9 Distribution of computed and measured timelags in a 50% SF6-50% N2 mixture at 0.3 MPaunder a 1.2/50-i's positive impulse.
0,6
va
c0,4'I.I
2 4 6 8tb,P.S
tb,PFig. 11 Calculated and measured voltage-time curves of
a particle-contaminated SF6 system at 0.3 MPaunder negative-polarity impulse voltage
1,0
_=i
_- I
10 D~0,1
Fig. 10 Distribution of computed and measured timelags in a 50% SF6-50% N2 mixture at 0.3 MPaunder a 1.2/50 Ps negative impulse
those obtained for the clean one, the reduction in thecritical volume more than accounts for the increase inthe rate of production of primary electrons. Similarto the results obtained with the clean system [29], thescatter in the times to breakdown measured in the con-
taminated system decreased with increasing overvoltageratio.
For negative-polarity impulses, Fig. 8, the timesto breakdown were found to be somewhat shorter thanthose observed under the positive-polarity impulses.This may be explained by the additional electronsreleased in the gap owing to emission near or at theparticle surface. This additional source of electronswill reduce the statistical time lag, which in turnwill reduce the time-to-breakdown values. Similarresults obtained for the 50% SF6-50% N2 gas mixture are
presented in Figs. 9 and 10 for positive and negativepolarity respectively.
o.oi L
,,, ,,,,I 1 11|1 111 ' 'I "".'1
SF6, 0,3MPa\_____ Pos. polarity
Particle contaminated--s\,,Clean system
5%
\ \ _
~0,I Ws 4010
tb,/LSFig. 12 Calculated 5% and 95% probability envelopes of
the time to breakdown for clean and contami-nated systems for SF6 under positive-polarityimpulses as a function of the overvoltageratio (u - UO)/UO
Voltage-Time Characteristics
Figure 11 shows the experimental results of mea-
surements of the time to breakdown as a function ofvoltage of the particle-contaminated system for SF6 at0.3 MPa under negative-polarity impulses. The resultscorrespond to 100-50 applications for each impulse
0,4
,31
1357
'I,
-5
.0_
.§0,2
._
0L& O,1
. I I I I I I_ ,I
50% SF6-50% N2, 0,3 MPaPos. polarityUp=176kV
l II
l~ ~ ~ ~ I fl
0 2
50%SF6-50%N2, 0,3MPoNeg. polarityUp:152 kVat - 0,5/.Ls
, ; T '----L
^ ^
1358
1,0
a.c.
J
s O0,
0,01L0,1 lp 10 t*tb, PS
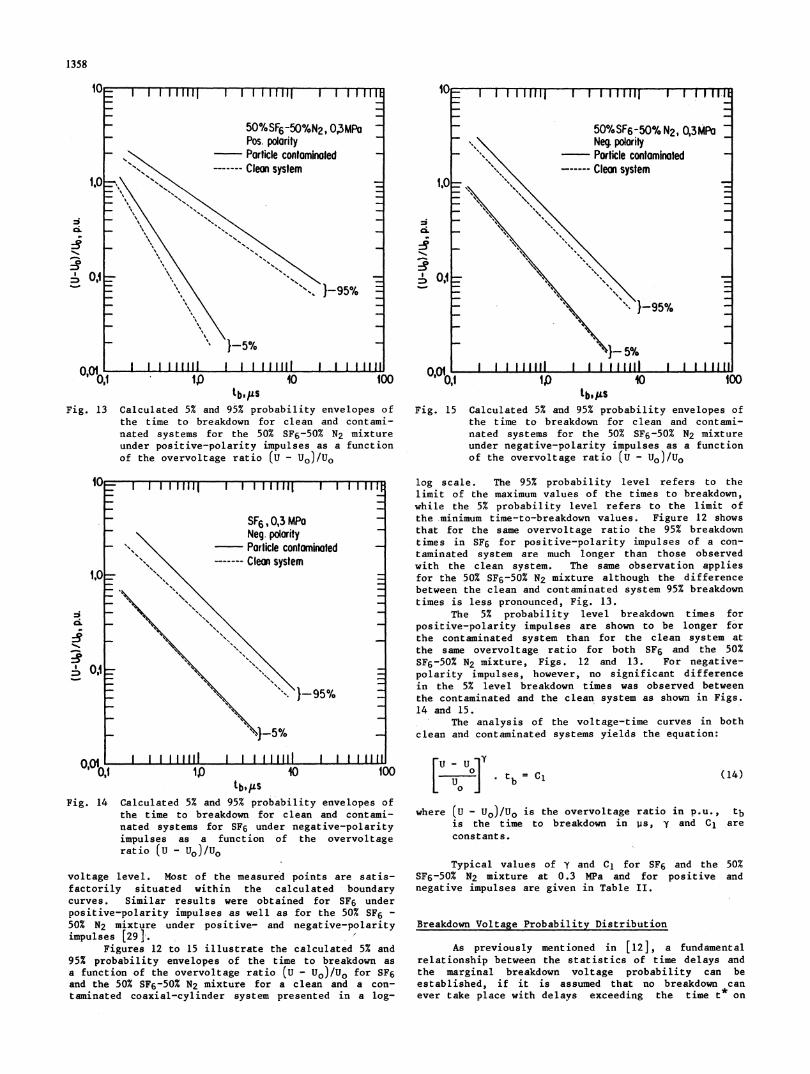
Fig. 13 Calculated 5% and 95% probability envelopes ofthe time to breakdown for clean and contami-nated systems for the 50% SF6-50% N2 mixtureunder positive-polarity impulses as a functionof the overvoltage ratio (U - UO) /UO
1,0
C.
A Ai0Oj 1I 10
tb, US
Fig. 14 Calculated 5% and 95% probability envelopes ofthe time to breakdown for clean and contami-nated systems for SF6 under negative-polarityimpulses as a function of the overvoltageratio (u - Uo)/U.
voltage level. Most of the measured points are satis-factorily situated within the calculated boundarycurves. Similar results were obtained for SF6 underpositive-polarity impulses as well as for the 50% SF6 -
50% N2 mixture under positive- and negative-polarityimpulses [29].
Figures 12 to 15 illustrate the calculated 5% and95% probability envelopes of the time to breakdown asa function of the overvoltage ratio (U - Uo)/Uo for SF6and the 50% SF6-50% N2 mixture for a clean and a con-taminated coaxial-cylinder system presented in a log-
1,0
C.
N
sO,t
li 0,01-100 0,O1
50%SF6-50% N2, Q3MPaNeq polrityPorticle contominoledClean system
I I }l11-95% 1
I tI111i11lp 10 100
tb,LSFig. 15 Calculated 5% and 95% probability envelopes of
the time to breakdown for clean and contami-nated systems for the 50% SF6-50% N2 mixtureunder negative-polarity impulses as a functionof the overvoltage ratio (u - Uo)/UO
log scale. The 95% probability level refers to thelimit of the maximum values of the times to breakdown,while the 5% probability level refers to the limit ofthe minimum time-to-breakdown values. Figure 12 showsthat for the same overvoltage ratio the 95% breakdowntimes in SF6 for positive-polarity impulses of a con-taminated system are much longer than those observedwith the clean system. The same observation appliesfor the 50% SF6-50% N2 mixture although the differencebetween the clean and contaminated system 95% breakdowntimes is less pronounced, Fig. 13.
The 5% probability level breakdown times forpositive-polarity impulses are shown to be longer forthe contaminated system than for the clean system atthe same overvoltage ratio for both SF6 and the 50%SF6-50% N2 mixture, Figs. 12 and 13. For negative-polarity impulses, however, no significant differencein the 5% level breakdown times was observed betweenthe contaminated and the clean system as shown in Figs.14 and 15.
The analysis of the voltage-time curves in bothclean and contaminated systems yields the equation:
. tb = C (14)
where (U - Uo)/U. is the overvoltage ratio in p.u., tbis the time to breakdown in ps, y and C1 areconstants.
Typical values of y and C1 for SF6 and the 50%SF6-50% N2 mixture at 0.3 MPa and for positive andnegative impulses are given in Table II.
Breakdown Voltage Probability Distribution
As previously mentioned in [12], a fundamentalrelationship between the statistics of time delays andthe marginal breakdown voltage probability can beestablished, if it is assumed that no breakdown canever take place with delays exceeding the time t* on
II I I 111111I lifIll I 1 1111
50%SF6-50%N2, 0,3MPo -Pos. polorityParticle contominaled
- Clean system
"% 1,1,
1.% %,
4,1.11
N
1-5%I I I11111 I I I 111111 I I I I1111
II I 111111 I I I lift
SF6, 0,3 MPa -Neg. polarityParlicle contominatedClean system
I I 1 111111 I I I IIIII 1 1 I1
I I I 111111
I I I 1 11111
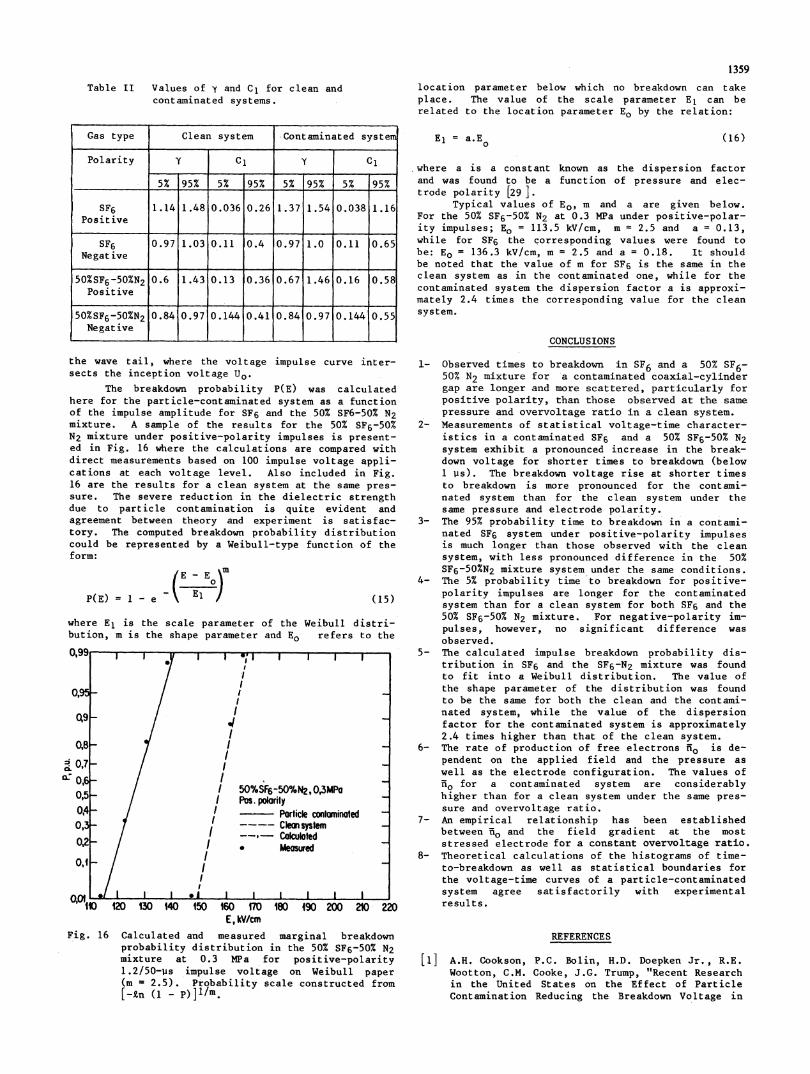
Table II Values of y and C1 for clean andcontaminated systems.
1359location parameter below which no breakdown can takeplace. The value of the scale parameter E1 can berelated to the location parameter Eo by the relation:
the wave tail, where the voltage impulse curve inter-sects the inception voltage U0.
The breakdown probability P(E) was calculatedhere for the particle-contaminated system as a functionof the impulse amplitude for SF6 and the 50% SF6-50% N2mixture. A sample of the results for the 50% SF6-50%N2 mixture under positive-polarity impulses is present-ed in Fig. 16 where the calculations are compared withdirect measurements based on 100 impulse voltage appli-cations at each voltage level. Also included in Fig.16 are the results for a clean system at the same pres-sure. The severe reduction in the dielectric strengthdue to particle contamination is quite evident andagreement between theory and experiment is satisfac-tory. The computed breakdown probability distributioncould be represented by a Weibull-type function of theform:
P(E) = 1 - e
I I
./ I I I
(E - E mo
_ El (15)
where E1 is the scale parameter of the Weibull distri-bution, m is the shape parameter and Eo refers to the
I 'I;1 II
I
III
I
/ 50%SF6-5/I Pos. polrity
I
I --#- cI * b
I01 I I-I-
IT I 1
0%N2,0,3MPa
;rticle conotninoted:ewansystem:oculatedleosued
L _ I I I
'110 120 130 140 150 160 170 180 490 200 210 220E, kV/cm
Fig. 16 Calculated and measured marginal breakdownprobability distribution in the 50% SF6-50% N2mixture at 0.3 MPa for positive-polarity1.2/50-us impulse voltage on Weibull paper
(m = 2.5). Probability scale constructed from[-in (1 - p)]l/m
El = a.E0
(16)
where a is a constant known as the dispersion factorand was found to be a function of pressure and elec-trode polarity [29 ].
Typical values of Eo, m and a are given below.For the 50% SF6-50% N2 at 0.3 MPa under positive-polar-ity impulses; E0 = 113.5 kV/cm, m = 2.5 and a = 0.13,while for SF6 the corresponding values were found tobe: Eo = 136.3 kV/cm, m = 2.5 and a = 0.18. It shouldbe noted that the value of m for SF6 is the same in theclean system as in the contaminated one, while for thecontaminated system the dispersion factor a is approxi-mately 2.4 times the corresponding value for the cleansystem.
CONCLUSIONS
1- Observed times to breakdown in SF6 and a 50% SF6-50% N2 mixture for a contaminated coaxial-cylindergap are longer and more scattered, particularly forpositive polarity, than those observed at the samepressure and overvoltage ratio in a clean system.
2- Measurements of statistical voltage-time character-istics in a contaminated SF6 and a 50% SF6-50% N2system exhibit a pronounced increase in the break-down voltage for shorter times to breakdown (below1 us). The breakdown voltage rise at shorter timesto breakdown is more pronounced for the contami-nated system than for the clean system under thesame pressure and electrode polarity.
3- The 95% probability time to breakdown in a contami-nated SF6 system under positive-polarity impulsesis much longer than those observed with the cleansystem, with less pronounced difference in the 50%SF6-50%N2 mixture system under the same conditions.
4- The 5% probability time to breakdown for positive-polarity impulses are longer for the contaminatedsystem than for a clean system for both SF6 and the50% SF6-50% N2 mixture. For negative-polarity im-pulses, however, no significant difference wasobserved.
5- The calculated impulse breakdown probability dis-tribution in SF6 and the SF6-N2 mixture was foundto fit into a Weibull distribution. The value ofthe shape parameter of the distribution was foundto be the same for both the clean and the contami-nated system, while the value of the dispersionfactor for the contaminated system is approximately2.4 times higher than that of the clean system.
6- The rate of production of free electrons No is de-pendent on the applied field and the pressure aswell as the electrode configuration. The values ofNo for a contaminated system are considerablyhigher than for a clean system under the same pres-sure and overvoltage ratio.
7- An empirical relationship has been establishedbetween %o and the field gradient at the moststressed electrode for a constant overvoltage ratio.
8- Theoretical calculations of the histograms of time-to-breakdown as well as statistical boundaries forthe voltage-time curves of a particle-contaminatedsystem agree satisfactorily with experimentalresults.
REFERENCES
[1] A.H. Cookson, P.C. Bolin, H.D. Doepken Jr., R.E.Wootton, C.M. Cooke, J.G. Trump, "Recent Researchin the United States on the Effect of ParticleContamination Reducing the Breakdown Voltage in
Gas type Clean system 'Contaminated system
Polarity y C1 C1
5% 95% 5% 95% 5% 95% 5% 95%
SF6 1.14 1.48 0.036 0.26 1.37 1.54 0.038 1.16Positive
SF6 0.97 1.03 0.11 0.4 0.97 1.0 0.11 0.65Negative
50%SF6-50%N2 0.6 1.43 0.13 0.36 0.67 1.46 0.16 0.58Positive
50%SF6-50%N2 0.84 0.97 0.144 0.41 0.84 0.97 0.144 0.55Negative
0,95
Q9~
Q0ffi 0,70: 0,A
0,50.40,1
0,2
O,l
1360
Compressed Gas Insulated Systems," CIGRE PaperNo. 15-09, 1976.
[2] S.J. Dale, R.E. Wootton, A.H. Cookson, "Effectsof Particle Contamination in SF6 CGIT Systems andMethods of Particle Control and Elimination,"Second International Symposium on Gaseous Dielec-trics, Knoxville, March 1980, pp. 256-265.
[3] C.M. Cooke, "Particle Contamination in CompressedGas Insulation, Limitations and Control," Inter-national Symposium on Gaseous Dielectrics,Knoxville, March 1978, pp. 162-189.
[4] W. Mosch, W. Hauschild, J. Speck, S. Schierig,"Phenomena in SF6 Insulation with Particles andtheir Technical Evaluation," Third InternationalSymposium on High Voltage Engineering, Milan,1979, Paper No. 32-01.
[5] F.A.M. Rizk, C. Masetti, R.P. Comsa, "Particle-Initiated Breakdown in SF6 Insulated SystemsUnder High Direct Voltage," IEEE Trans., Vol.PAS-98, 1979, pp. 825-836.
[6] C*M. Cooke, R.E. Wootton, A.H. Cookson, "Influ-ence of Particles on AC and DC ElectricalPerformance of Gas-Insulated Systems at Extra-High Voltage," IEEE Trans., Vol. PAS-96, 1977,pp. 768-778.
[7] A.H. Cookson, 0. Farish, "Particle-InitiatedBreakdown between Coaxial Electrodes in Com-pressed SF6," IEEE Trans., Vol. PAS-92, 1973,pp. 871-876.
[8] W. Taschner, "Stosskennlinien Einer Koaxialanord-nung in SF6 fur Stossspannungs und Schaltspan-nungsbeanspruchung Beider Polaritat," ETZ-A,Vol. 98, No. 2, 1977, pp. 153-155.
[9] H.M. Ryan, W.L. Watson, "Electrical Breakdown andVoltage-Time Characteristics in SF6 at High Pres-sures," IEEE Trans., Paper F 76 390-5, Presentedat the Summer Power Meeting, Portland, 1976.
[10] T. Nitta, Y. Shibuya, Y. Fujiwara, "Voltage-TimeCharacteristics of Electrical Breakdown in SF6,"IEEE Trans., Vol. PAS-94, 1975, pp. 108-115.
[11] S. Menju, H. Aoyagi, K. Takahashi, H. Ohno,"Dielectric Breakdown of High Pressure SF6 inSphere and Coaxial Cylinder Gaps," IEEE Trans.,Vol. PAS-93, 1974, pp. 1706-1710.
[12] Farouk A.M. Rizk, Magdy B. Eteiba, "ImpulseBreakdown Voltage-Time Curves of SF6 and SF6-N2Coaxial-Cylinder Gaps," IEEE Trans., Paper 82 WM174-1, PES Winter Meeting, New York, January1982.
[13] W. Boeck, W. Taschner, "Isolationsverhalten SF6-Isolierter Koaxialer Zylinderanordnungen beiStossspannungsbeanspruchnung," ETZ-A, Vol. 97,No. 6, 1976, pp. 335-340.
[14] W. Knorr, "Der Zundverzug Schwach InhomogenerElektrodenanordnungen in SF6," Dissertation,University of Aachen, Germany, 1979.
[15] G. Dreger, "The Connection Between Breakdown-Volume and Statistical Time Lag at Impulse Volt-age Stress in SF6," IEE Conf. on Gas Dischargesand their Applications, Edinburgh, September1980, pp. 188-191.
[16] G. Dreger, "The Influence of the Rate of PrimaryElectrons on the Delay of Firing at Breakdown ofImpulse Voltage in SF6 at Uniform and Inhomoge-neous Fields," Third International Symposium onHigh-Voltage Engineering, Milan 1979, Paper31.06.
[17] W. Mosch, W. Hauschild, Hochspannungsisolierun-gen mit Schwefelhexafluorid, VEB Verlag Technik,Berlin, 1979.
[18] H. Singer, H. Steinbigler, P. Weiss, "A ChargeSimulation Method for the Calculation of HighVoltage Fields," IEEE Trans., Vol. PAS-93, 1974,pp. 1660-1668.
[19] M. St.Jean, P.S. Maruvada, "Programme de Calculet de Tragage d'Equipotentielles Electrostati-ques," IREQ Internal Report, No. IREQ-1490, 1976.
[20] W. Pfeiffer, P. Volker, "Formative Time Lag inSmall Gaps with Nearly Homogeneous Field Distri-bution," Ann. Rept., Conf. on Elect. Insul. andDielect. Phen., 1979, pp. 453-460.
[21] W. Pfeiffer, P. Volker, "Discharge Formation inSF6 for Impulse Voltage Stress," Sixth Interna-tional Conference on Gas Discharges and TheirApplications," IEE Conf. Publ. No. 189, 1980,pp. 217-219.
[22] R. Malewski, A. De Champlain, "Digital ImpulseRecorder for High-Voltage Laboratories," IEEETrans., Vol. PAS-99, No. 2, March/April 1980,pp. 636-649.
[23] International Electrotechnical Commission, "High-Voltage Test Techniques," Publication 60-2, FirstEdition, 1973.
[24] International Electrotechnical Commission, "High-Voltage Test Techniques," Publication 60-3, FirstEdition, 1976.
[25] J. Fryxell, "Determination of Critical WithstandVoltages," CIGRE, 1966, Paper No. 423.
[26] F.A.M. Rizk, C. Vincent, "Testing for Low Break-down Probability with Special Reference to LiquidInsulation," IEEE Trans., Vol. Pas-96, No. 4,Nov./Dec. 1977, pp. 1892-1900.
[27] W. Boeck, "Volumen-Zeit-Gesetz bei Stossspann-ungsdurchschlag von SF61," ETZ-A, Vol. 96, No. 7,1975, pp. 300-305.
[28] M. Eteiba, F.A.M. Rizk, "Statistical Voltage-TimeCurves of SF6-Insulated Coaxial-Cylinder Gap,"Third International Symposium on Gaseous Dielec-trics, Knoxville, Tennessee, March 1982, paper 27.
[29] M. Eteiba, "Impulse Breakdown Voltage-TimeCharacteristics of Compressed SF6 and SF6-N2Insulation," Ph.D. Thesis, Electrical EngineeringDepartment, McGill University, Montreal, 1981.