Embed Size (px)
Citation preview
International Journal of Contemporary ENERGY, Vol. 1, No. 2 (2015) ISSN 2363-6440 ___________________________________________________________________________________________________________
___________________________________________________________________________________________________________ M. Qemali, R. Bualoti, M. Celo: “Voltage Stability Assessment through a new Proposed Methodology”, pp. 65–73 65
DOI: 10.14621/ce.20150208
Voltage Stability Assessment through a New Proposed Methodology
Marjela Qemali, Raimonda Bualoti, Marialis Celo
Polytechnic University-Tirana, Electrical Engineering Faculty, Power System Department
Sheshi”Nene Tereza”, Nr.4, Tirana, Albania, [email protected] Abstract In the last ten years, it is worth to mention that there is an ongoing discussion in literatures, workshops, conferences, seminars that emphasise the fact that soon the power systems will operate at the limits of capacities. This has become a cliché to countries of the world but a reality for Albanian power system. On 23 February 2010, as a result of an atmospheric discharge at Vau Dejes hydropower plant, the 220kV line Vau Dejes-Koplik was disconnected due to the distance protection action. A long scenario of corrective actions resulted to a system blackout because of the exhaustion of the power system installed capacities. Many others similar scenarios which have occurred in the last years have highlighted the fact that it is no longer worth to rely on the N-1 security criterion, as the classical security standard. In this paper we propose a new methodology with the scope: to define the time period when the voltage stability criterion is fulfilled. Time period through 24 hours a day, for minimal and maximal loading is determined. The methodology has been successfully tested on IEEE 14 bus system and then applied in Albanian power system. NEPLAN software is used to evaluate the voltage stability criteria for the proposed methodology. The obtained results give important information on Albanian power system situation and many recommendations to be taken in consideration from power system operators.
1. Introduction The complexity of transmission systems management is increasing. In this way it gets more difficult the determination of the security limits and measuring the distance between the operation point and the nearest critical limit operation. In recent years we have often heard through workshops, conferences, seminars that soon the power systems will operate at their capacity limits. It is turned into a cliché for countries of the world but a reality for the Albanian power system.
The supported actions and penalizing measures undertaken by the Albanian government in terms of non-technical losses reduction have given their impact on performance of Energy Distribution Company, as well as on the value of the consumed energy. In [1] is shown that for the year 2014, the energy demand has decreased by 164 GWh compared to the previous year. The registered peak load has decreased from 1475 MW on 2013 to 1448 MW on 2014. The Peak load continues to exceed the installed capacity of Albanian power generation (about 2%).
So, it is not possible to use the N-1 criterion, as the classic standard criteria for security system operation during all working hours of the year. The system is no longer able to "survive" without an action after a disturbance. In order to implement corrective actions, there have been builted and developed different protection and control philosophies. Equipment such as tap changer transformers, and static VAR compensator have been added to the system in order to increase its control ability. Power system is becoming more complex. The reasons for this situation are some phenomena which can not disappear in the near future [2]:
1. It is more difficult than ever to build new overhead lines. People are more and more afraid of hypothetical electromagnetic effects, or they just don’t like to see big towers in the landscape.
Keywords: Voltage stability; N-1 criteria, Albanian power system
Article history: Received: 26 July 2015 Revised: 29 October 2015 Accepted: 09 November 2015
International Journal of Contemporary ENERGY, Vol. 1, No. 2 (2015) ISSN 2363-6440 ___________________________________________________________________________________________________________
___________________________________________________________________________________________________________ M. Qemali, R. Bualoti, M. Celo: “Voltage Stability Assessment through a new Proposed Methodology”, pp. 65–73 66
It is very difficult to explain the need for new interconnection lines to people who already have access to electricity at a reasonable price and with high availability. Alternative solutions are technically complex, costly, and need even more time to be deployed.
2. The second main reason is the massive integration of renewable, generally intermittent generation in the system. Power flows in the grid are created by difference in location between power sinks and sources. With a significant amount of intermittent power generation, the predictability of the sources (location and levels of power injections) decreases and strongly affects the predictability of power flows. Furthermore, these new power plants are generally small units connected to the distribution grid. Transmission system operators (TSOs) therefore have difficulty observing these power injections, and they have no direct control over them. Another factor is the inconsistency between the relatively short time needed to build new wind farms (two or three years) or install photovoltaic panels (months) and the time it takes to go through all the administrative procedures required to build new lines (more than five years). Some TSOs have proposed to the regulators to implement a mechanism that encourage the installation of these new generators in areas where the whole system has enough physical/technical limit of reserves availability to accommodate the new injections. These locations do not generally match those of the large load centres, so a transmission network is still required, and this network will still have to deal with the variability of the power flows.
3. The third reason is related to the liberalization of the energy markets. Generators, retailers, and consumers view the transmission system as a public resource to which they should have unlimited access. This leads TSO's towards profit maximization, optimizing the assets utilization. This optimization is limited by security considerations, however, because large blackouts are unacceptable in our modern societies due to their huge economic and social costs. Since TSOs are responsible for maintaining the security of the power system, they must define the security limits that should be respected. As in any constrained optimization problem, the optimal solution toward which the market evolves tends to be limited by these security constraints. A transparent definition and assessment of the distance to these security limits thus becomes of paramount importance. To maintain the security of the supply in this
context, TSOs must adapt the transmission systems by considering the following technologies: long-distance HVAC underground cables with large reactive compensator; HVDC underground cables in parallel with the ac grid with smart controls of the ac/dc converters; HVDC grids, first to connect offshore wind farms efficiently and then to provide cheaper interconnections between distant areas.
In this paper we propose a new methodology to define the day period that the limit of voltage stability criterion is fulfilled. The methodology has been successfully tested on IEEE 14 bus system and then applied in Albanian power system for minimal and maximal day loading.
2. Relationship between voltage stability
security coefficient and N-1 criteria. Case study: 14 node IEEE network
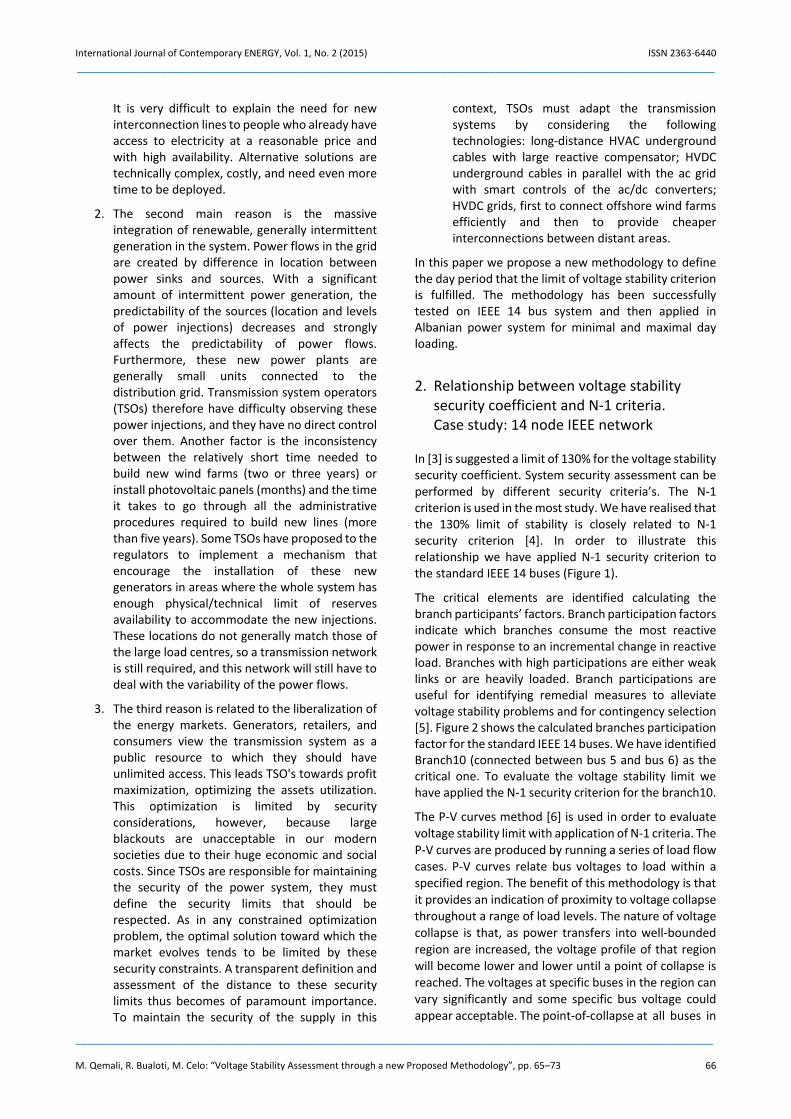
In [3] is suggested a limit of 130% for the voltage stability security coefficient. System security assessment can be performed by different security criteria’s. The N-1 criterion is used in the most study. We have realised that the 130% limit of stability is closely related to N-1 security criterion [4]. In order to illustrate this relationship we have applied N-1 security criterion to the standard IEEE 14 buses (Figure 1).
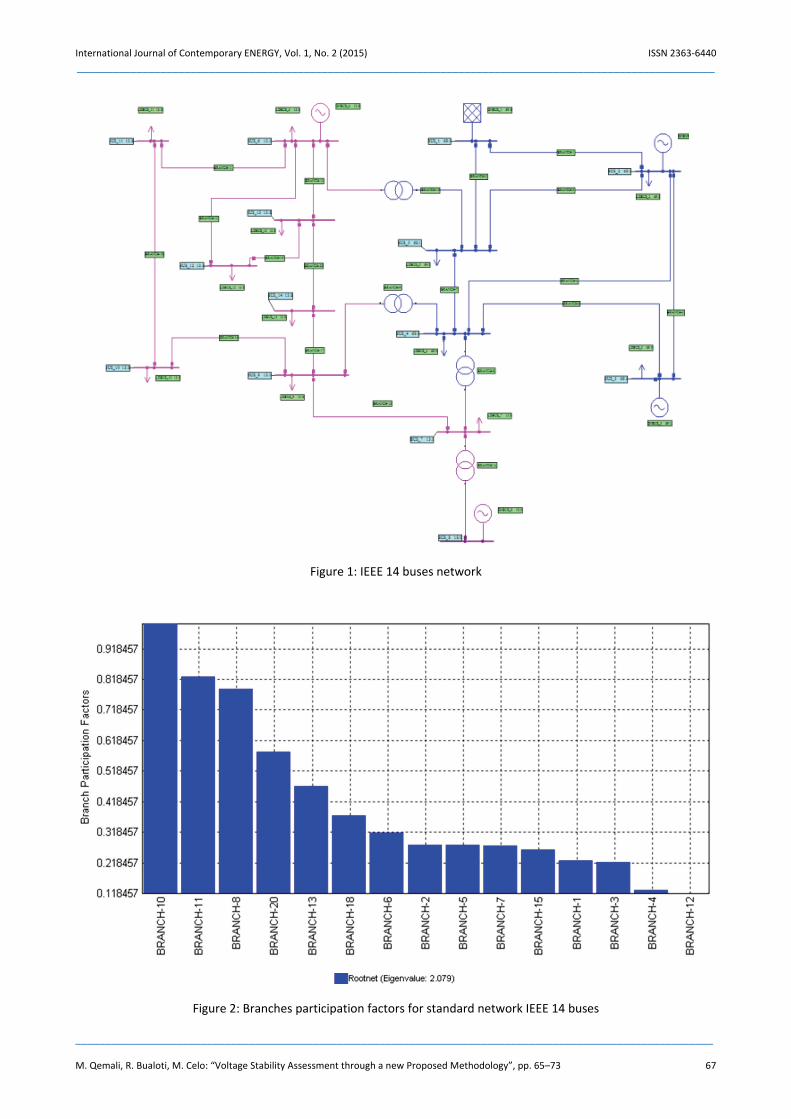
The critical elements are identified calculating the branch participants’ factors. Branch participation factors indicate which branches consume the most reactive power in response to an incremental change in reactive load. Branches with high participations are either weak links or are heavily loaded. Branch participations are useful for identifying remedial measures to alleviate voltage stability problems and for contingency selection [5]. Figure 2 shows the calculated branches participation factor for the standard IEEE 14 buses. We have identified Branch10 (connected between bus 5 and bus 6) as the critical one. To evaluate the voltage stability limit we have applied the N-1 security criterion for the branch10.
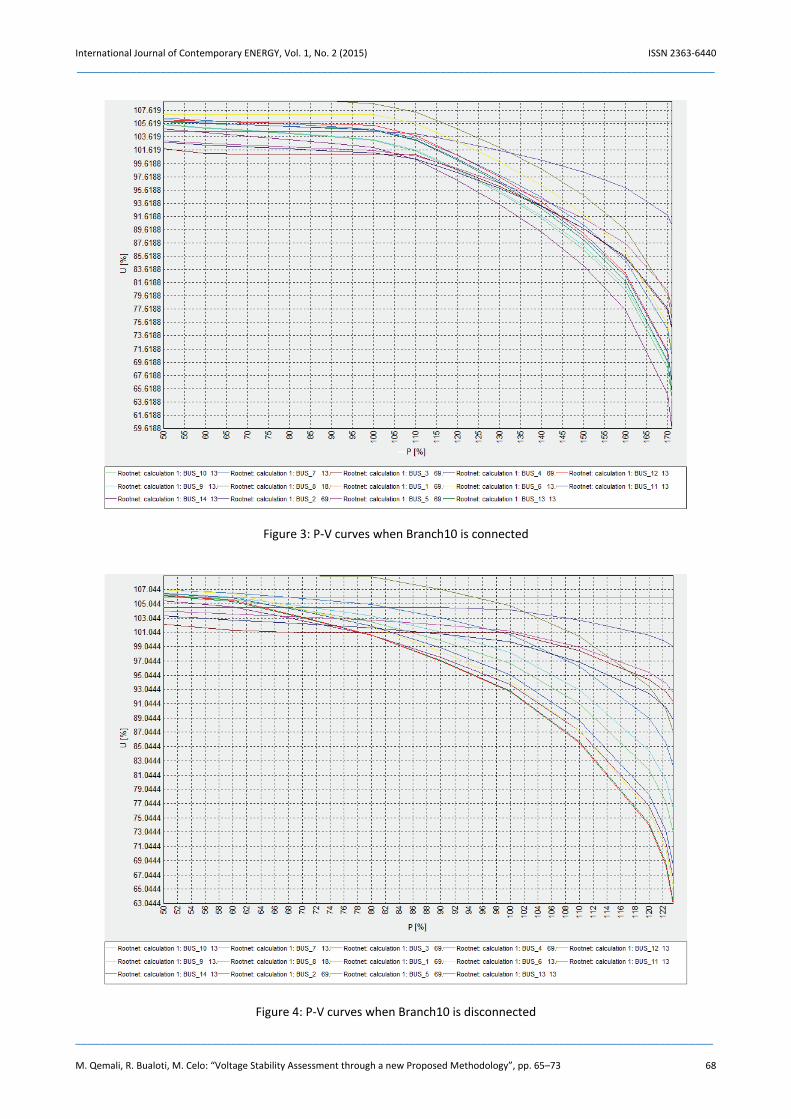
The P-V curves method [6] is used in order to evaluate voltage stability limit with application of N-1 criteria. The P-V curves are produced by running a series of load flow cases. P-V curves relate bus voltages to load within a specified region. The benefit of this methodology is that it provides an indication of proximity to voltage collapse throughout a range of load levels. The nature of voltage collapse is that, as power transfers into well-bounded region are increased, the voltage profile of that region will become lower and lower until a point of collapse is reached. The voltages at specific buses in the region can vary significantly and some specific bus voltage could appear acceptable. The point-of-collapse at all buses in
International Journal of Contemporary ENERGY, Vol. 1, No. 2 (2015) ISSN 2363-6440 ___________________________________________________________________________________________________________
___________________________________________________________________________________________________________ M. Qemali, R. Bualoti, M. Celo: “Voltage Stability Assessment through a new Proposed Methodology”, pp. 65–73 67
Figure 1: IEEE 14 buses network
Figure 2: Branches participation factors for standard network IEEE 14 buses
International Journal of Contemporary ENERGY, Vol. 1, No. 2 (2015) ISSN 2363-6440 ___________________________________________________________________________________________________________
___________________________________________________________________________________________________________ M. Qemali, R. Bualoti, M. Celo: “Voltage Stability Assessment through a new Proposed Methodology”, pp. 65–73 68
Figure 3: P-V curves when Branch10 is connected
Figure 4: P-V curves when Branch10 is disconnected

International Journal of Contemporary ENERGY, Vol. 1, No. 2 (2015) ISSN 2363-6440 ___________________________________________________________________________________________________________
___________________________________________________________________________________________________________ M. Qemali, R. Bualoti, M. Celo: “Voltage Stability Assessment through a new Proposed Methodology”, pp. 65–73 69
the study region, however, will occur at the same power import level, regardless of the specific bus voltages (Figure 3, 4). We can see that the voltage stability limit decreases from 171 % to 123.5 % when Branch10 is disconnected. We can see that the voltage stability limit decreases about 47.5%, which emphasises the fact that this branch is operating in critical conditions. While if the same operation is done for the other network branches their voltage stability limit decrease corresponds within the conditions imposed by [3] that the limit for a stable system operation is 130% [7]. For example for branch 8 the voltage stability limit decreases about 14%.
Finally we can conclude that the conditions imposed by [3] that limit for a stable system operation is 130%, is closely related to N-1 system security criterion. This relationship between voltage stability security coefficient and N-1 criteria gives us the possibility to use the verified value of voltage stability criteria in the further paper objective: to define the time period when the voltage stability criterion is fulfilled.
3. Proposed Methodology In this section is illustrated the new proposed method. The objective of the method is the evaluation of the day period (within 24 hours) during which power system operates respecting the voltage stability criterion of 130% [1].
3.1. Required data
a- Network hourly load profile. The hourly load
profile for the day with the maximal load will be used to evaluate the worst case.
b- Voltage stability limit evaluated through P-V curves maximum loading point. The analysis should be performed for different hours of network load curve and the power system loading limit values should be recorded.
3.2. Data processing
In this step a relationship between the hourly load profile (section 3.1-a) and P-V curves maximum loading point (section 3.1-b) is determined.
a- Initially has to build the hourly load duration curve.
b- The ratios between the P-V curves maximum loading point with the corresponding power value is determined.
c- To determine the polynomial data approximation, the smallest squares method is used. The following expression is determined:
= + + + + ⋯+ (1)
where b and ⋯ are constants.
The degree of the polynomial curve compatibility with data in the case of the smallest squares method is provided by R coefficient, whose value 1 determines full compliance of the selected curve with the data.
d- We obtain the variation of the power system loading limit change during 24 hours.
Knowing that the voltage stability security coefficient is 130%, can be determined the time period in which the voltage stability security criteria is fulfilled.
e- The final step consists on substituting the value of voltage stability coefficient 130% in equation (1) and determines the loading coefficient for which voltage stability security criteria is fulfilled. From the equation solution is obtained the limit power values for which the Albanian power system maintains the value of voltage stability security coefficient of 130%.
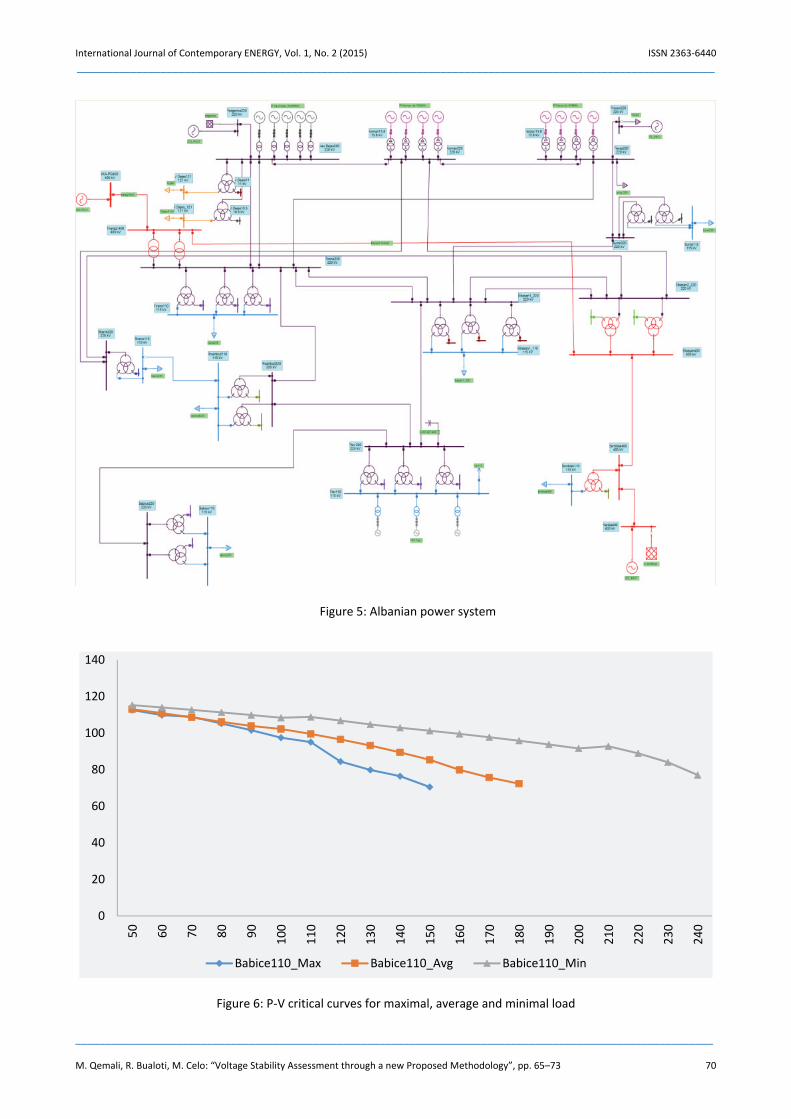
The proposed methodology is applied on the Albanian power system. Figure 5 illustrates the Albanian Power scheme which includes 65 buses and 20 generators.
4. Voltage stability assessment through a new
proposed methodology The Albanian transmission system has the longitude profile with lack of generation in the South area. The analysis of load flow results shows a shading profile of the voltage level and voltage stability problems. In paper [8], we have analysed voltage stability through different methods. The proposed methodology is applied on the Albanian power system. The NEPLAN software package has been used to study the voltage stability of the Albanian power system.
To illustrate the proposed method, the maximal, average and minimal Albanian power system load of the maximum loading day as worst case is used. Figure 6 represent the lowest P-V curve obtained from voltage stability analysis for three above loads.
The critical curve corresponds to Babica 110 node, located in the southern part of Albania. This is an expected result cause Albania power system has a longitude profile from north to south. The main generation units are located in the north Albania while the main consumption is located in the centre and southern part [9]. During the maximal load, the loading limit is 24.75%, lower than 30% which should be the minimal allowable loading limit during the static voltage stability evaluation. This result shows that during
International Journal of Contemporary ENERGY, Vol. 1, No. 2 (2015) ISSN 2363-6440 ___________________________________________________________________________________________________________
___________________________________________________________________________________________________________ M. Qemali, R. Bualoti, M. Celo: “Voltage Stability Assessment through a new Proposed Methodology”, pp. 65–73 70
Figure 5: Albanian power system
Figure 6: P-V critical curves for maximal, average and minimal load
0
20
40
60
80
100
120
140
50 60 70 80 90 100
110
120
130
140
150
160
170
180
190
200
210
220
230
240
Babice110_Max Babice110_Avg Babice110_Min
International Journal of Contemporary ENERGY, Vol. 1, No. 2 (2015) ISSN 2363-6440 ___________________________________________________________________________________________________________
___________________________________________________________________________________________________________ M. Qemali, R. Bualoti, M. Celo: “Voltage Stability Assessment through a new Proposed Methodology”, pp. 65–73 71
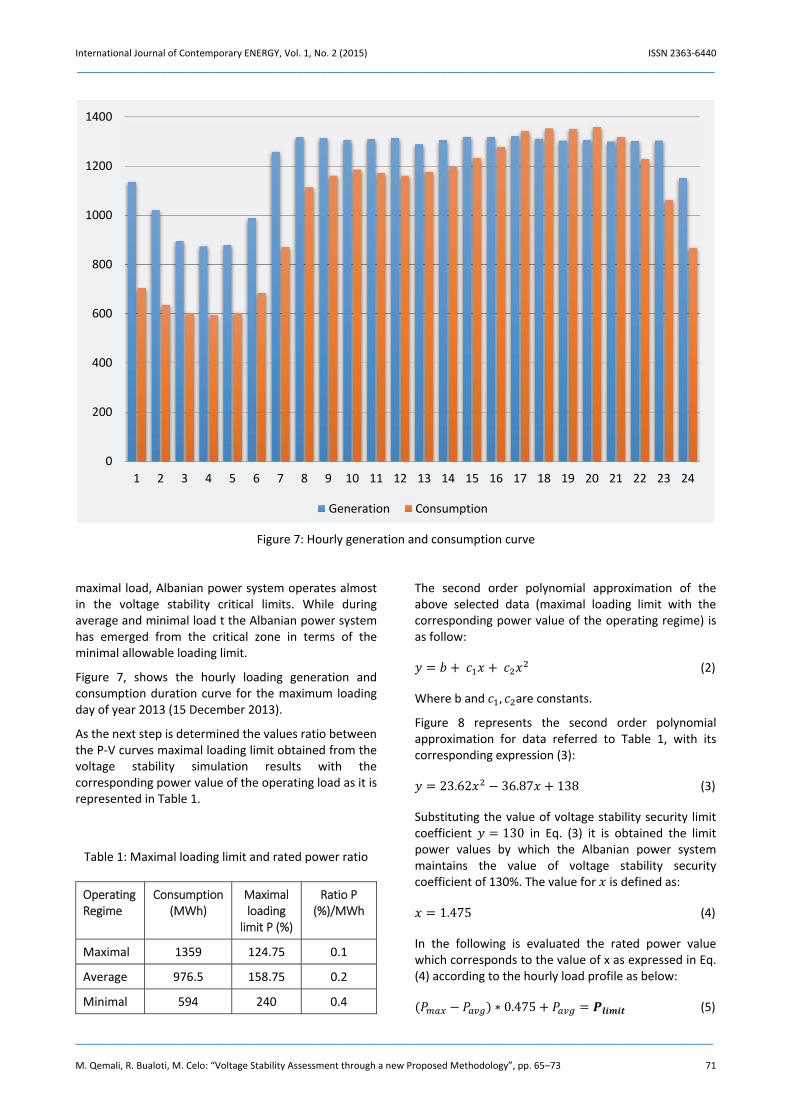
Figure 7: Hourly generation and consumption curve
maximal load, Albanian power system operates almost in the voltage stability critical limits. While during average and minimal load t the Albanian power system has emerged from the critical zone in terms of the minimal allowable loading limit.
Figure 7, shows the hourly loading generation and consumption duration curve for the maximum loading day of year 2013 (15 December 2013).
As the next step is determined the values ratio between the P-V curves maximal loading limit obtained from the voltage stability simulation results with the corresponding power value of the operating load as it is represented in Table 1.
Table 1: Maximal loading limit and rated power ratio
Operating Regime
Consumption (MWh)
Maximal loading
limit P (%)
Ratio P (%)/MWh
Maximal 1359 124.75 0.1
Average 976.5 158.75 0.2
Minimal 594 240 0.4
The second order polynomial approximation of the above selected data (maximal loading limit with the corresponding power value of the operating regime) is as follow: = + + (2)
Where b and , are constants.
Figure 8 represents the second order polynomial approximation for data referred to Table 1, with its corresponding expression (3): = 23.62 36.87 + 138 (3)
Substituting the value of voltage stability security limit coefficient = 130 in Eq. (3) it is obtained the limit power values by which the Albanian power system maintains the value of voltage stability security coefficient of 130%. The value for is defined as: = 1.475 (4)
In the following is evaluated the rated power value which corresponds to the value of x as expressed in Eq. (4) according to the hourly load profile as below: ∗ 0.475 + = (5)
0
200
400
600
800
1000
1200
1400
1 2 3 4 5 6 7 8 9 10 11 12 13 14 15 16 17 18 19 20 21 22 23 24
Generation Consumption

International Journal of Contemporary ENERGY, Vol. 1, No. 2 (2015) ISSN 2363-6440 ___________________________________________________________________________________________________________
___________________________________________________________________________________________________________ M. Qemali, R. Bualoti, M. Celo: “Voltage Stability Assessment through a new Proposed Methodology”, pp. 65–73 72
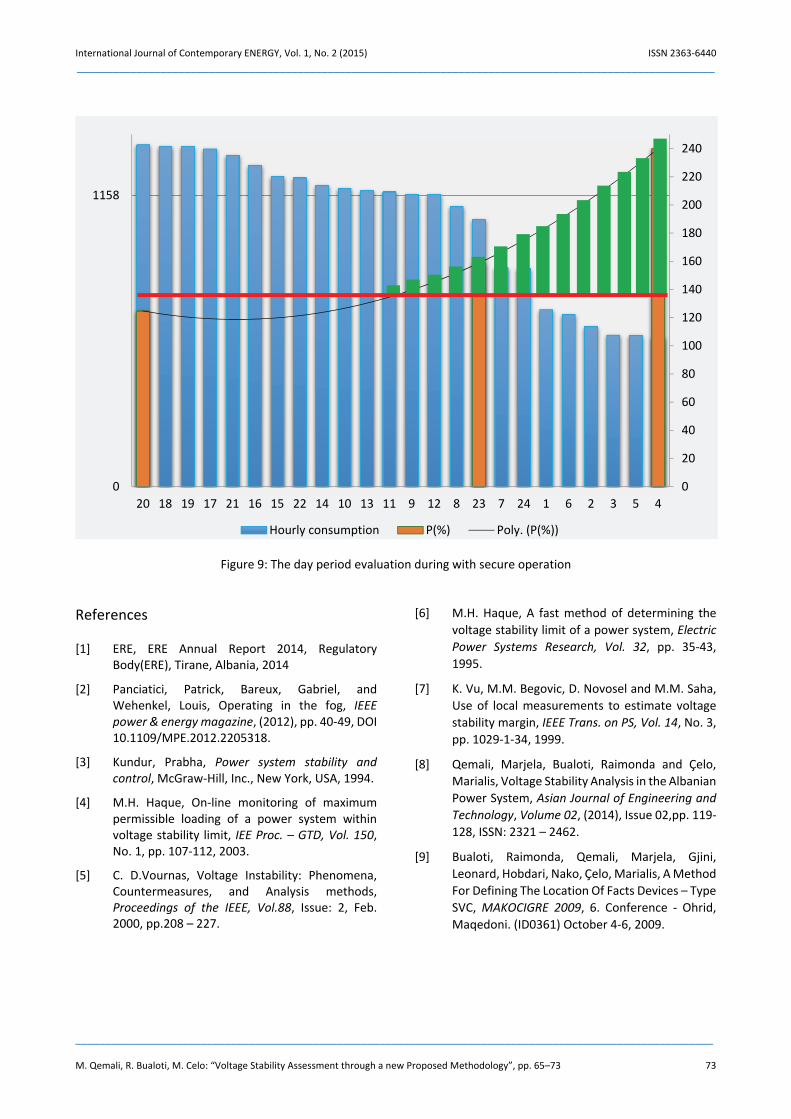
From Eq. (5) is evaluated that the power limit value is 1158 MW and this one represents the maximal limit value to which the Albanian power system maintains voltage stability security coefficient value 130%.
So, for Albanian power system loading lower than 1158 MW, Albanian power system satisfies the criteria of static voltage stability. Figure 9 represents the voltage stability security coefficient value and the day period evaluation with secure operation.
In Figure 9, the green area represents the day period with secure operation, which means the hours with the power value lower than 1158 MW.
The time limits during which the voltage stability security coefficient maintains the value of 130%, is around 13 hours. So, only 13 hours for maximum loading day Albanian power system operates within the permitted level of security toward voltage stability. During the other 11 hours (mainly corresponds to the maximal operating load), the power system operates in a critical area in terms of fulfilling the criteria of voltage stability.
5. Conclusions In this paper was presented a new methodology that can reliably assess the security operation of transmission system in conditions when power systems complexity is increasing and they require new methods for the evaluation of the operation security.
The power loading limit and the corresponding voltage stability secure operation day period that satisfies the static voltage stability criterion from P-V curve methods is defined in order to maintain the voltage stability security coefficient to 130%.
The advantage of this methodology consists on the fact that it can be applied easily in the dispatching centre. So, the system operator, day ahead can provide the power loading limit and the voltage stability secure operation.
In this way, during the risk period (when voltage stability security coefficient is less than 130%) can be undertaken adequate measures in order to maintain the security of power system.
Figure 8: The second order polynomial approximation
y = 23,625x2 - 36,875x + 138
0
50
100
150
200
250
1 2 3
Loading coefficient Ratio Poly. (Loading coefficient) Poly. (Ratio)
International Journal of Contemporary ENERGY, Vol. 1, No. 2 (2015) ISSN 2363-6440 ___________________________________________________________________________________________________________
___________________________________________________________________________________________________________ M. Qemali, R. Bualoti, M. Celo: “Voltage Stability Assessment through a new Proposed Methodology”, pp. 65–73 73
Figure 9: The day period evaluation during with secure operation References [1] ERE, ERE Annual Report 2014, Regulatory
Body(ERE), Tirane, Albania, 2014
[2] Panciatici, Patrick, Bareux, Gabriel, and Wehenkel, Louis, Operating in the fog, IEEE power & energy magazine, (2012), pp. 40-49, DOI 10.1109/MPE.2012.2205318.
[3] Kundur, Prabha, Power system stability and control, McGraw-Hill, Inc., New York, USA, 1994.
[4] M.H. Haque, On-line monitoring of maximum permissible loading of a power system within voltage stability limit, IEE Proc. – GTD, Vol. 150, No. 1, pp. 107-112, 2003.
[5] C. D.Vournas, Voltage Instability: Phenomena, Countermeasures, and Analysis methods, Proceedings of the IEEE, Vol.88, Issue: 2, Feb. 2000, pp.208 – 227.
[6] M.H. Haque, A fast method of determining the voltage stability limit of a power system, Electric Power Systems Research, Vol. 32, pp. 35-43, 1995.
[7] K. Vu, M.M. Begovic, D. Novosel and M.M. Saha, Use of local measurements to estimate voltage stability margin, IEEE Trans. on PS, Vol. 14, No. 3, pp. 1029-1-34, 1999.
[8] Qemali, Marjela, Bualoti, Raimonda and Çelo, Marialis, Voltage Stability Analysis in the Albanian Power System, Asian Journal of Engineering and Technology, Volume 02, (2014), Issue 02,pp. 119-128, ISSN: 2321 – 2462.
[9] Bualoti, Raimonda, Qemali, Marjela, Gjini, Leonard, Hobdari, Nako, Çelo, Marialis, A Method For Defining The Location Of Facts Devices – Type SVC, MAKOCIGRE 2009, 6. Conference - Ohrid, Maqedoni. (ID0361) October 4-6, 2009.
0
20
40
60
80
100
120
140
160
180
200
220
240
0
1158
20 18 19 17 21 16 15 22 14 10 13 11 9 12 8 23 7 24 1 6 2 3 5 4
Hourly consumption P(%) Poly. (P(%))