Embed Size (px)
Citation preview

PII S0016-7037(02)00950-X
Volcanic gases, black smokers, and the Great Oxidation Event
HEINRICH D. HOLLAND*Harvard University, Department of Earth and Planetary Sciences, 20 Oxford Street, Cambridge, MA 02138, USA
(Received September 7, 2001;accepted in revised form January 30, 2002)
Abstract—This paper proposes that gradual changes in the composition of volatiles that have been added tothe atmosphere-ocean system are responsible for the Great Oxidation Event (G.O.E.) ca. 2.3 Ga. Before ca.2.3 Ga, the composition of these volatiles was probably such that 20% of the carbon gases could be reducedto organic matter and all of the sulfur gases could be reduced to pyrite. Since 2.3 Ga, the composition of thesevolatiles has been such that 20% of the carbon gases could be reduced to organic matter, but only a fractionof the sulfur gases could be reduced to pyrite. This change led to the oxygenation of the atmosphere and toa large increase in the SO4
�2 concentration of seawater. A considerable body of observational data supportsthese proposals.Copyright © 2002 Elsevier Science Ltd
1. INTRODUCTION
The evidence for a major change in the oxidation state of theatmosphere between ca. 2.3 and 2.1 Ga was summarized brieflyin 1999 (Holland, 1999). Since then, the discovery of the massindependent fractionation of sulfur, its variation with time inthe geologic record (Farquhar et al., 2000), and the confirma-tion of this finding by Mojzsis et al. (2001), Farquhar et al.(2001a), and Bekker et al. (2002) now make a major change inthe oxidation state of the atmosphere during the Paleo-protero-zoic a virtual certainty. The appearance of O2 in the atmosphereca. 2.3 Ga could be explained easily if cyanobacteria evolved atthat time. However, this explanation has been rendered veryunlikely by the discovery of biomarkers in 2.7- to 2.8-Gasedimentary rocks that are characteristic of cyanobacteria(Brocks et al., 1999). An alternative explanation involves achange in the redox state of volcanic gases as the trigger for thechange in the oxidation state of the atmosphere. This wasproposed by Kasting et al. (1993). They pointed out that theloss of H2 from the top of a reducing atmosphere would haveincreased the overall oxidation state of the Earth and almostcertainly that of the mantle. This in turn would have led to anincrease in the fO2
of volcanic gases and to a change in theredox state of the atmosphere. They proposed that an increasein reduced gas emissions by a factor of�4 would be enoughtoday to preclude the presence of a significant quantity of O2 inthe atmosphere, even if organic carbon was being buried at thesame rate as today. In a more detailed analysis of the changesin the composition of volcanic gases that are required to main-tain a reduced atmosphere Kump et al. (2001) concluded thatthe average fO2
of volcanic gases had to be 2 log units belowthat of the FMQ buffer at and before the transition from areducing to an oxidizing atmosphere. Such a low value of fO2
inaverage volcanic gases is inconsistent with the data of Delano(2001) and Canil (1997, 1999) for the redox history of theEarth’s mantle. This paper reexamines the issue. It proposesthat the change in the average fO2
of volcanic gases required toaccount for the transition of the atmosphere from an anoxy-
genic to an oxygenic state is much smaller than 2 log units andthat there is no inconsistency between the required change andthat allowed by other indicators of the fO2
of volcanic gases inthe past. The hypothesis explains a wide range of geologic andgeochemical observations.
2. THEORETICAL FRAMEWORK
The oxidation state of the atmosphere at any given timedepends in large part on the composition of the contemporaryvolcanic gases. With the exception of N2 and the heavier raregases, all of the constituents of volcanic gases are removedfrom the atmosphere-ocean system into sediments and intointerplanetary space on a geologically short time scale. CO2
and CO are removed from the atmosphere-ocean system by thedeposition of organic matter and carbonate minerals. SO2 andH2S are removed by the deposition of sulfide and sulfateminerals. H2 is removed by the reduction of CO2 and CO toorganic matter, by the reduction of SO2 to sulfides, and by lossinto interplanetary space. H2 loss to interplanetary space fromvolcanic gases is significant only when the quantity of H2 in thevolcanic gases exceeds the quantity required to convert�20%of the total quantity of (CO2 � CO) to organic matter and allof the (SO2 � H2S) to a constituent of pyrite.
The proposition that the fraction of (CO2 � CO) that isremoved as organic carbon has always been close to 20% iscounterintuitive. We have long been taught that the burialproportions of organic matter in sediments are influenced oreven controlled by the exogenic system, the rates of carbonfixation, and the preservation of organic matter in sediments.However, although these processes do exert some effect on theburial proportions of organic matter, their effect seems to havebeen relatively minor. With a few notable exceptions, theisotopic composition of carbon in organic carbon and in car-bonate minerals has been roughly constant during the past 3.5Ga (e.g., Schidlowski, 1988; Strauss et al., 1992). Estimates ofthe average percentage of organic carbon in the total carbon ofsedimentary rocks range from 15 to 23% (Holser et al., 1988a).The figure 20% used here is a reasonable average of thereported estimates. The demonstrated changes in biota, thelikely changes in ocean productivity and in the preservationfraction of organic matter, and the almost certain changes in the
* Author to whom correspondence should be addressed([email protected]).
Pergamon
Geochimica et Cosmochimica Acta, Vol. 66, No. 21, pp. 3811–3826, 2002Copyright © 2002 Elsevier Science LtdPrinted in the USA. All rights reserved
0016-7037/02 $22.00� .00
3811

composition of the atmosphere and of seawater during the past3.5 Ga have apparently had only a relatively minor effect on theratio of carbon burial as a constituent of organic matter to thatin carbonate minerals.
The quantity of H2 that is needed to convert volcanic (CO2
� CO) to organic carbon (CH2O) is, therefore, and has beenduring much of the geologic time the amount required to reduce�20% of the total volcanic carbon gas content to CH2O. Thisquantity is independent of the reduction path. In the presence ofexcess H2, it makes no difference whether reduction is carriedout directly by organisms using photosystem I:
CO2 � 2H23 CH2O � H2O (1)
or indirectly by organisms using photosystem II:
CO2 � H2O3 CH2O � O2 (2)
In the latter case, the O2, which is generated by green-plantphotosynthesis, is subsequently consumed by reaction with H2
to yield H2O:
2H2 � O23 2H2O (3)
The sum of Eqn. 2 and 3 is the same as Eqn. 1; two moles ofH2 are always needed to convert one mole of CO2 to CH2O.
H2 which remains in a batch of volcanic gas after thereduction of 20% of its contained (CO2 � CO) to CH2O, isavailable to convert the contained sulfur gases into a constitu-ent of sulfide minerals. The dominant sulfide in marine sedi-ments is pyrite. The quantity of H2 required to remove thevolcanic sulfur gases as a constituent of sulfides is thereforedetermined by the quantity of H2 required to convert thevolcanic sulfur into FeS2. If the amount of available H2 is lessthan the amount required for this purpose, then only some ofthe volcanic sulfur is removed as a constituent of pyrite; theremaining sulfur is mainly removed as a constituent of sulfateminerals, dominantly gypsum and anhydrite. If the amount ofavailable H2 is greater than the quantity required to convert thevolcanic (SO2 � H2S) to pyrite, then most of the excess H2
escapes into interplanetary space.The above treatment of a batch of volcanic gas is quite
straightforward; but it remains to be shown how this treatmentis related to the operation of the Earth system as a whole. Todayboth sulfur and carbon in rocks undergoing weathering areconverted into gases and constituents of solutions. Most of thesulfides exposed to weathering are oxidized to sulfates. TheSO4
�2 from these reactions joins SO4�2 released by the solution
of sulfate minerals, enters the oceans, and is removed from theoceans as a constituent of sulfides and sulfates. Organic matterthat is exposed to weathering is largely oxidized to CO2.Carbonate minerals dissolve, and their contained carbon entersthe oceans largely as HCO3
�. In the oceans, carbon is in partdeposited as a constituent of new carbonates. At steady state,the O2 and CO2 lost during weathering are regained duringsedimentation. The total quantity of CH2O, carbonates, pyrite,and sulfates is then the total quantity of these materials weath-ered plus the quantity that is added by volcanism and hydro-thermal activity.
The total inventory of sulfur and carbon in the crust does notnecessarily change significantly with time, because during theconversion of sedimentary rocks into high-grade metamorphic
and igneous rocks, these elements are released to a significantextent. Their release apparently accounts for a good deal oftheir quantity in volcanic gases and hydrothermal solutions. Aslong as the redox state of volcanic gases is such that H2 is notpresent in excess, the redox state of subducted sediments is aptto be similar to that of volcanic gases. If, however, H2 involcanic gases is present in excess, some of this gas escapesinto interplanetary space, and subducted sediments are moreoxidized than the volcanic gases from which they were derived.
These qualitative considerations need to be converted into aquantitative treatment of the relationship between the compo-sition of volcanic gases and the disposal of their constituentsamong the phases of sediments and into interplanetary space. Aconvenient approach consists of deriving a relationship be-tween the composition of volcanic gases and the fraction, f, oftheir contained sulfur, which can be precipitated as a constitu-ent of pyrite. Let us first convert all of the CO in a volcanic gasto CO2 via the reaction
CO � H2O3 CO2 � H2 (4)
If the initial concentration of CO was omCO, that of CO2 omCO2,
and that of H2 omH2, the concentration of CO2 at the end of the
reaction is (omCO2� omCO), and that of H2 is (omH2
� omCO).Next let 20% of the total amount of CO2 be converted to CH2Ovia the reaction
CO2 � 2H23 CH2O � H2O (5)
At the end of this reaction
mH2 � omH2 � 0.6 omCO � 0.4 omCO2 (6)
Next let all of the H2S be converted to SO2 via the reaction
H2S � 2H2O3 SO2 � 3H2 (7)
At the end of this reaction
mSO2 � omSO2 � omH2S (8)
and
mH2 � omH2 � 0.6 omCO � 0.4 omCO2 � 3 omH2S (9)
Next, let all of the SO2 be removed as a constituent of FeS2 viathe reaction
FeO � 2SO2 � 5H23 FeS2 � 5H2O (10)
At the conclusion of this reaction
mH2 � omH2 � 0.6 omCO � 0.4 omCO2 � 3 omH2S
� 2.5 �omSO2 � omH2S� (11)
If not enough H2 is present in the initial volatiles to convert allof the SO2 to FeS2, let the remaining SO2 be converted toH2SO4 via the reaction
SO2 � 2H2O3 H2SO4 � H2 (12)
and let the SO4�2 be precipitated as a constituent of one or more
sulfate minerals.Now let f be the fraction of sulfur in the initial volatiles that
is converted to FeS2. Then, at the end of the process outlinedabove,
3812 H. D. Holland

mH2 � 0 � omH2 � 0.6 omCO � 0.4 omCO2 � 3 omH2S
� 2.5 f�omSO2 � omH2S� � �1 � f��omSO2 � omH2S� (13)
After collecting terms, we obtain
f �omH2 � 0.6 omCO � 0.4 omCO2 � 3 omH2S
3.5 (omSO2 � omH2S)�
1
3.5
(14)
Volcanic gases added to the atmosphere can now be dividedinto four groups based on their f value:
Group 1. f � 1.0Group 2. f � 1.0Group 3. 1.0 � f � 0Group 4. f � 0
Volatiles in group 1 contain more H2 than is required to reduce20% of the carbon gases to organic matter and all of the sulfurto FeS2. Volatiles in group 2 contain just enough H2 to effectthis conversion. Volatiles in group 3 contain enough H2 toreduce 20% of the carbon gases to organic matter but notenough H2 to convert all of the sulfur gases to FeS2. Volatilesin group 4 do not contain enough H2 to reduce 20% of theircontained carbon gases to organic matter. Reducing atmo-spheres, i.e., those in which O2 is essentially absent and thepartial pressure of reduced gases such as methane is significant,require f values �1.0, i.e., conditions under which the volatilesthat are added to the atmosphere fall in group 1.
The approach developed in this paper combines individualchemical analyses of gases from well-studied volcanoes toyield values for the average composition of gases from thesevolcanoes. These averages are used to compute the f value foreach volcano. The entire set of f values is then used to estimatethe average f value of volcanic gases as a whole. The sameresult can be achieved by using estimates of the total volcanicflux of each of the important volatiles to calculate the worldaverage of f. At present, however, the uncertainties in these fluxestimates are very large (e.g., Holser et al., 1988; Arthur, 2000),and it is difficult to choose and to combine these estimates incalculating the values of f for volcanic gases as a whole (seeAppendix). The approach based on the composition of gasesfrom well-studied volcanoes circumvents this problem. It yieldsa rather coherent set of f values for individual volcanoes andproduces a more reliable estimate of the global f value ofvolcanic gases.
3. THE AVERAGE f VALUE OF VOLATILES TODAY
It is likely that volcanic gases and gases in black smokers arequantitatively the most important source of volatiles that arebeing added to the atmosphere-ocean system today. Fortu-nately, useful approximations of their average f value can beextracted from the available data.
3.1. The Average f Value of Volcanic Gases
Symonds et al. (1994) and Giggenbach (1996) have pub-lished excellent summaries of the available data for the com-position of many volcanic gases, and Allard (1983) has com-piled a good deal of the isotopic evidence bearing on the origin
of hydrogen, carbon, sulfur, nitrogen, and the rare gases involcanic exhalations. Figure 1 shows the location of the vol-canoes for which a relatively large body of gas analyses areavailable. Although their number is small compared to the totalnumber of active volcanoes, the group contains representativesfrom spreading centers, above subduction zones, and at hotspots. The average f values of their gases are shown in Fig. 2.They scatter a great deal, but 16 of the 21 average f values fallbetween 0.2 and 0.7. The average of the set falls close to 0.5.Estimates of the total Phanerozoic inventory of sulfide andsulfate sulfur in Phanerozoic rocks (Holser et al., 1988b) areuncertain, but they suggest that sulfide sulfur accounts for�67% of the total sulfur, implying an average value of 0.67 forf as defined above (Holser et al., 1988b). This value agrees withan equally uncertain average value of f derived from the meanisotopic composition of sulfur in Phanerozoic sulfides andsulfates. The average value of �34S in sedimentary sulfatesduring the Phanerozoic is approximately �18‰. The averagevalue of �34S in sulfide minerals is ca. �7‰. The average �34Sof mantle sulfur is close to 0‰. These data suggest that thefraction of sulfide sulfur in the Phanerozoic crust is �0.72 (datafrom Holser et al., 1988b). For the Neogene alone, the value off calculated in this fashion is 0.60. Altogether, these estimatessuggest that the mean value of f in present-day volcanic gasesis slightly lower than the average value of f for the total sulfurinputs during the Phanerozoic. The difference may not be real,but it can be explained by the composition of hydrothermalfluids that are added to the atmosphere-ocean system.
3.2. The Average f Value of Hydrothermal Fluids
It is difficult to make precise estimates of the relative im-portance of the volcanic and hydrothermal contributions to thecarbon and sulfur fluxes to the atmosphere-ocean system.Marty and Tolstikhin (1998) proposed that the global magmaticflux of CO2 is �6 1012 mol/yr. This estimate is not signif-icantly different from an earlier value proposed by the author(Holland, 1978). Of this total flux, �(2.2 0.9) 1012 mol/yrare derived from hydrothermal fluxes at midocean ridges. Anestimate of the average composition of black smoker fluids atMORs is shown in Table 1. The f value of these fluids is 0.9.The inclusion of the likely contribution from such fluids to thef value of all volatiles added to the atmosphere-ocean systemincreases the estimated global f value to �0.65.
In most terrestrial geothermal fluids, the CO2/H2S ratio is sohigh that their f value is negative (Ellis, 1979; Ellis and Mahon,1977). It is likely, therefore, that their overall effect is to lowerthe f value of the worldwide volatile input. The body ofavailable data for these fluids is not large enough to make ameaningful estimate of this reduction. It is perhaps best toadopt a value of 0.6 0.1 for the average value of f in the inputof volcanic gases and hydrothermal solutions during the Pha-nerozoic.
4. THE AVERAGE f VALUE OF VOLATILES BEFORETHE G.O.E
4.1. The f Value of Volcanic Gases
As shown in Fig. 3, the fO2of volcanic gases today ranges
from slightly lower than the quartz-fayalite-magnetic (QFM)
3813Volcanic gasses, black smokers, and the great oxidation
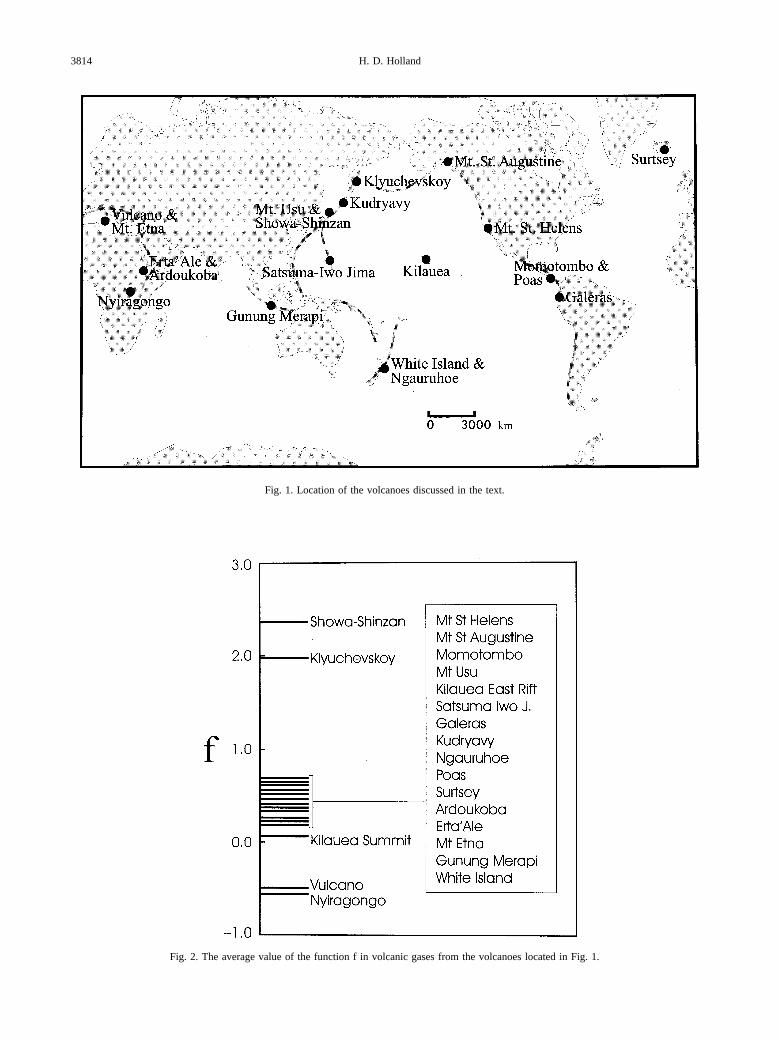
Fig. 1. Location of the volcanoes discussed in the text.
Fig. 2. The average value of the function f in volcanic gases from the volcanoes located in Fig. 1.
3814 H. D. Holland

buffer to slightly higher than the Ni-NiO (NNO) buffer. If thehypothesis outlined at the beginning of this paper is correct, theaverage value of fO2
in volcanic gases before the Great Oxida-tion Event (G.O.E.) was sufficiently lower than today, so thatthe f value of volatile inputs to the atmosphere-ocean systemwas �1.0. It must now be shown that the required decrease inthe average fO2
of volcanic gases is within the geologicallypermitted range.
The required decrease in the fO2of volcanic and hydrother-
mal gases is defined by the required increase in their hydrogen-to-water ratio. Most volcanic gases are analyzed after they havecooled somewhat below their initial preeruption temperature.During cooling, H2 reacts with SO2 to produce H2S by thereverse of Eqn. 7. imH2
, the preeruption H2 concentration involcanic gases, is therefore close to
imH2 � omH2 � 3 omH2S (15)
where omH2and omH2S
are as above the concentrations of thesegases in the analyzed samples. It is easy to calculate the value
of imH2in analyzed gas samples that would be required to raise
or to lower their f value to 1.0. Let the function � be definedas the ratio
� ��imH2�f�1
�imH2�f,now(16)
where (imH2)f,now is the value of imH2
in an analyzed gas samplebefore eruption, and where (imH2
)f�1 is the value of imH2in the
same gas sample, but with its H2 concentration raised so thatthe f value of the gas is 1.0. Figure 4 shows the value of � forthe average composition of gases from the volcanoes repre-sented in Fig. 2. For 13 of the 20 volcanoes in Fig. 4, the valueof � is between 1.4 and 3.4. The average value of � is 2.4.Since the value of fO2
varies as the inverse of (fH2)2 at a constant
value of fH2O, an increase of � by a factor of 2.4 implies a
decrease in fO2by a factor of 5.8, i.e., a decrease of 0.76 log
units. This is much smaller than the decrease of 2 log unitsproposed by Kump et al. (2001). The difference is due largelyto two factors. Kump et al. (2001) used the data for thecomposition of volcanic gases in Holland (1978) rather than themuch larger compilations which have become available sincethen. In addition, their treatment of the sulfur budget is in error,because they assumed that even in the absence of atmosphericO2, sulfur leaves the oceans as sulfate rather than as sulfide(J. F. Kasting, pers. comm., 2001).
The most direct evidence for the fO2of volcanic gases in the
past is provided by the concentration of Cr and fO2in basaltic
rocks. Canil (1997, 1999) and Delano (2001) have shown thatthe fO2
of mantle melts has changed little during the past 3.96Ga. Delano (2001) has proposed that since 3.96 Ga, the oxygen
Table 1. The concentration and f value of gases in average blacksmokers and the maximum concentration of gases observed in blacksmokers (von Damm et al., 1995; von Damm, pers. comm., 2001).
Average Maximum
CO2 20 mmol/kg 200 mmol/kgH2S 7 mmol/kg 110 mmol/kgH2 2 mmol/kg 40 mmol/kgCH4 �1 mmol/kgf 0.90 1.04
Fig. 3. Plot of log fO2vs. inverse temperature for volcanic gas compositions in Symonds et al. (1994). The quartz-
fayalite-magnetite (QFM), Ni-NiO (NNO), and hematite-magnetite (HM) oxygen buffers are shown for reference.
3815Volcanic gasses, black smokers, and the great oxidation

fugacity of these melts has been no more than 0.5 log unitslower or higher than today (see Fig. 5). The lower limit of fO2
permitted by these data is somewhat higher than the valueestimated above for the fO2
of volcanic gases before the G.O.E.It seems likely, however, that the f value of volcanic gasesbefore the G.O.E. was close to 1.0 even without a change intheir fO2
(see below). If so, the oxidation state of volcanic gasesrequired to maintain an anoxic atmosphere was well within thelimits indicated by the Delano (2001) data.
It is likely that the fO2of the upper mantle has increased
slightly with time. H2 is continually lost from the mantle as aconstituent of volcanic gases. Before the G.O.E., some of thisH2 escaped into interplanetary space. The Earth as a wholetherefore became slightly more oxidized until the H2 escaperate from the Earth was reduced to today’s insignificant valueafter the onset of the G.O.E. (Kasting et al., 1993). Unfortu-nately, it is still very difficult to assess the effect of pre-G.O.E.H2 escape on the oxidation state of the mantle. The argumentcan be made that the Fe�3/Fe�2 ratio in the upper mantleprobably changed by a few percent due to H2 escape (Kastinget al., 1993; Catling et al., 2001); but even if this is correct, theinfluence of such a small change on the fO2
of mantle melts isdifficult to determine. The major effect of a small increase inthe Fe�3/Fe�2 ratio of the mantle is to increase the proportion
of the spinel phase. Secondary effects are produced by changesin the composition of the minerals in the buffer assemblage.These are the changes that increase the fO2
of mantle melts.Unfortunately, the magnitude of these changes is not wellknown, and the buffering effects of carbon-fluid equilibria(CCO) are not well constrained (Blundy et al., 1991).
Changes other than those in the H2 concentration of volcanicgases have probably also contributed to changes in the mean fvalue of volcanic gases. In Fig. 6, the composition of thevolcanic gases which were used in the computation of theircurrent f values are plotted as a function of �C/H2O, the ratioof the total concentration of carbon gases to H2O and �S/H2O,the ratio of the total concentration of sulfur gases to H2O. Theaverage f value of these gases is listed next to each data point.The rectangle represents the best estimate of the ratio of carbonto water and sulfur to water in the Earth’s crust plus oceans.Although the position of the rectangle is somewhat uncertain, itis clear that the ratio of sulfur to carbon in volcanic gases todayis �4 times greater than the ratio of sulfur to carbon in the crustplus oceans. Sulfur apparently cycles through the mantle con-siderably more rapidly than carbon. This may be related to theprecipitation of CaSO4 in the oceanic crust during the cyclingof seawater through MORs. Currently, an undetermined frac-tion of this CaSO4 is redissolved and returned to the oceans
Fig. 4. The values of the function � for the volcanoes located in Fig. 1.
3816 H. D. Holland

during the cycling of seawater on the flanks of MORs, wherethe temperature of the cycled seawater is considerably lowerthan at the ridge crests. CaSO4 which escapes dissolution iscarried down into subduction zones, can participate in magmaproduction, and can reappear at the surface as a constituent ofvolcanic gases. The most recent estimate of the high-tempera-ture flux of seawater on-axis (0–1 Ma) is (5.6 1.7) 1013
kg/yr (Butterfield et al., 2001). The present annual high-tem-perature flux of seawater SO4
�2 into MORs is, therefore,
28mmol
kg� �5.6 � 1.7� � 1013
kg
yr
� �1.6 � 0.5� � 1012 mol/yr.
The present-day flux of S from volcanoes as estimated byWilliams et al. (1992) and Arthur (2000) is �0.3 1012
mol/yr. A somewhat different value of �1.0 1012 mol/yr isobtained by dividing the CO2 emission rate of Marty andTolstikin (1998) by the CO2/SO2 ratio used by Williams et al.(1992) for average volcanic gases. In either case, CaSO4 pre-cipitated at and near MOR crests from cycled seawater couldaccount for all or nearly all of the sulfur in volcanic gases. Theisotopic composition of sulfur in volcanic gases in rift volca-noes is close to 0‰, the composition of juvenile sulfur. Thevalue of �34S in volcanic gases from subduction zones is
usually positive, indicating that a significant part of their sulfuris derived from sources that contain oceanic sulfate (Allard,1983; Poorter et al., 1991).
There is a good deal of evidence (Canfield et al., 2000) thatthe concentration of SO4
�2 in seawater was very low, probably�1 mmol/kg before the G.O.E. If so, the precipitation ofCaSO4 in the oceanic crust was negligible before the G.O.E.,and the sulfur content of gases emitted from volcanoes in areasof convergent plate margins was almost certainly lower thantoday. The effect of a lower �S/H2O content of volcanic gaseson their f value is shown in Fig. 7. The diagram has been drawnfor a value of mH2
/mH2Oof 2.4 10�2, the ratio for the FMQ
buffer at 1400K. On the left side of this diagram, imH2/mH2O
is�0.4 times their �C/H2O ratio. Lowering the �S/H2O ratio ofvolcanic gases on this side of the diagram raises their f value.At very low �C/H2O values, a reduction of �S/H2O from 1.0 10�2 to 0.5 10�2 increases the value of f from 1.0 to 1.7.On the right side of the diagram, where the chosen imH2
/mH2O
value of 2.4 10�2 is �0.4 �C/H2O, a decrease in the�S/H2O ratio of volcanic gases lowers their f value.
Most of the gases in Fig. 6 that are emitted from volcanoesassociated with convergent plate margins fall within the leftside of Fig. 7. Before the G.O.E., the f value of gases fromvolcanoes in this setting was therefore probably higher thantoday. The f value of gases from volcanoes at divergent plate
Fig. 5. The Delano (2001) summary of the redox state of the mantle during Earth history based on the Cr content ofbasalts, slightly modified.
3817Volcanic gasses, black smokers, and the great oxidation

and hot spots was probably not much lower or perhaps notlower at all before the G.O.E. If this is correct, the average fvalue of volcanic gases before the G.O.E. was greater thantoday’s value of �0.5 simply due to their lower �S/H2O ratio.This suggests the following sequence of events. Before ca. 2.3Ga, the average value of the ratio imH2
/mH2Owas �2.4 10�2,
but not necessarily much greater, and the f value of averagevolcanic gases was �1.0. By ca. 2.3 Ga, the ratio of imH2
/mH2O
had decreased to 2.4 10�2, and the f value of averagevolcanic gases had decreased to 1.0. After the appearance ofatmospheric O2, the loss of H2 from the atmosphere decreasedto a negligibly small rate. The average value of imH2
/mH2Oin
volcanic gases has therefore decreased very little since then.However, the rise of the SO4
�2 content of seawater led to fasterS cycling and an increase in the �S/H2O ratio of volcanicgases. If correct, this sequence of events implies that the valueof imH2
/mH2Oin volcanic gases before the G.O.E. could have
been within the limit set by the Delano (2001) data for the Crcontent of basaltic rocks during the past 3.96 Ga. The incre-ment is significantly less than the factor of 5.8 that seems to berequired if the �S/H2O ratio before the G.O.E. was the same astoday.
4.2. The f Value of Hydrothermal Fluids
During the course of Earth history, the rate of internal heatgeneration has decreased significantly. During the Archean, the
rate of seafloor spreading was almost certainly more rapid andthe temperature of the upper mantle almost certainly higherthan today. It therefore seems likely that the temperature ofblack smokers was also higher than today. This suggestion isnot contradicted by the calculations of Jupp and Schultz (2000),who dealt only with the behavior of pure water in hydrothermalvent systems. The concentrations of Fe�2 and H2S in blacksmoker fluids are both strongly temperature dependent (e.g.,Nishima, 1989; Seyfried et al., 1991). Predictions of theirconcentration based on thermodynamic calculations agree withdirect observations by von Damm et al. (1995, 1997) and vonDamm (2000). The input of Fe�2 and H2S from black smokersto the oceans was therefore almost certainly greater during theArchean than it is today. This inference is supported by theabundance of banded iron formations in the Archean and Pa-leoproterozoic and by the presence of excess Fe in Precambriansandstones and shales as shown by their elevated Fe/Ti ratios(Kump and Holland, 1992).
The gas concentrations in average Archean black smokerfluids may have been similar to their maximum concentrationin present-day black smokers. Their f value of 1.04 is slightlygreater than that of average black smokers (see Table 1). It isunlikely that the f value of Archean black smokers was muchgreater than 1.04. Since the CO and SO2 content of blacksmoker fluids is very small, their f value derived from Eqn. 14is approximately equal to
Fig. 6. The ratio of sulfur to water in average gas emitted from the volcanoes sited in Fig. 1 plotted against their totalcarbon-to-water ratio. The figures next to the data points represent the f value of the volcanic gas compositions. Therectangle represents the ratios in the crust plus the oceans.
3818 H. D. Holland

f � 0.29 � mH2
mH2S� � 0.11 �mCO2
mH2S� � 1.14 (17)
Even if the CO2/H2S ratio of black smokers was very muchsmaller than in the maximum-gas analysis in the right handcolumn of Table 1, the f value of the fluids was unlikely to haveexceeded 1.25. The f value of black smoker gases has, there-fore, probably decreased only modestly with time. This de-crease, together with the decrease proposed for the f value ofvolcanic gases, can probably account for the average value off for volcanic and hydrothermal inputs today.
4.3. Other Sources of Reduced Gases
At least two other sources have contributed reduced gases tothe atmosphere-ocean system: the oxidation of Fe�2 emitted byblack smokers and serpentinization. Fe�2 emitted by blacksmokers before the G.O.E. was removed from seawater largelyby the precipitation of FeS2, FeCO3, Fe�2 silicates, iron oxides,and oxyhydroxides. The last two were probably the most im-portant of these precipitates. They are largely represented bymagnetite in BIFs. The process of magnetite precipitation canbe described by the equation
3Fe�2 � 4H2O3 Fe3O4 � 6H� � H2 (18)
which shows that both H� and H2 are generated during theprecipitation of Fe3O4.
The generation of Fe3O4 during serpentinization reactionsalso generates H2 and H�. However, H� is removed by reac-tion of the serpentinizating fluids with Mg-silicates. The result-ing fluids are therefore often alkaline (Kelley et al., 2001).Little is known about the magnitude of these sources of H2.After the G.O.E. the deposition of hydrothermal Fe occurredmainly as a constituent of hematite. The deposition of hematitegenerated more H2 per mole of Fe, or what is equivalent, usedmore O2. However, the hydrothermal input of Fe has almostcertainly decreased with time; the effect of the precipitation ofFe-oxides on the redox state of the oceans has therefore almostcertainly decreased as well. The abundance of near-surfaceultramafics and the generation of H2 during serpentinizationhave also probably decreased with time.
5. EVIDENCE FROM THE SEDIMENTARY RECORD
If a decrease in the mean f value of volatiles was responsiblefor the G.O.E., the marine geochemistry of C, N, and S before,during, and after the G.O.E. should reflect this change.
5.1. Carbon
Fig. 8 is a summary by Karhu and Holland (1996) of a gooddeal of data for the isotopic composition of carbon in marinecarbonate sediments, in carbonates associated with BIFs, and inorganic carbon. Data obtained since then have confirmed the
Fig. 7. Contours of the function f for volcanic gases in which the initial ratio of mH2/mH2O is 2.4 10�2, on the value
of the ratio in gases buffered by FMQ at 1400 K. The contours are based Eqn. 14. Note that at high temperatures, i.e., beforecooling, omCO and omH2S can be neglected.
3819Volcanic gasses, black smokers, and the great oxidation
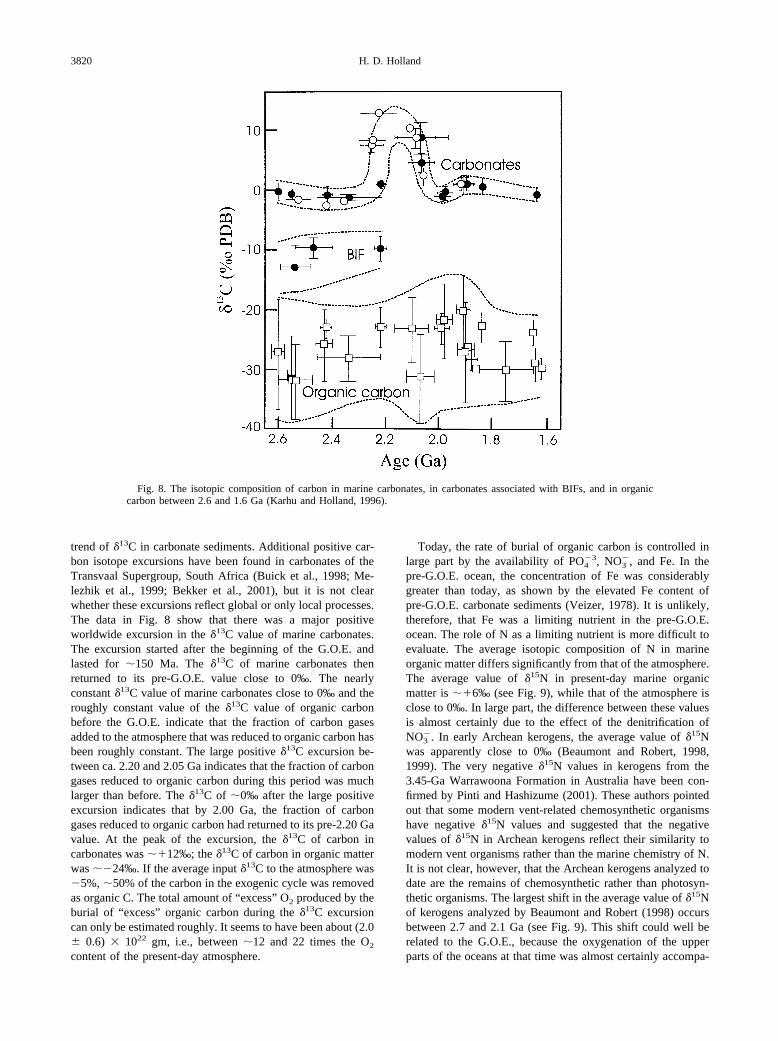
trend of �13C in carbonate sediments. Additional positive car-bon isotope excursions have been found in carbonates of theTransvaal Supergroup, South Africa (Buick et al., 1998; Me-lezhik et al., 1999; Bekker et al., 2001), but it is not clearwhether these excursions reflect global or only local processes.The data in Fig. 8 show that there was a major positiveworldwide excursion in the �13C value of marine carbonates.The excursion started after the beginning of the G.O.E. andlasted for �150 Ma. The �13C of marine carbonates thenreturned to its pre-G.O.E. value close to 0‰. The nearlyconstant �13C value of marine carbonates close to 0‰ and theroughly constant value of the �13C value of organic carbonbefore the G.O.E. indicate that the fraction of carbon gasesadded to the atmosphere that was reduced to organic carbon hasbeen roughly constant. The large positive �13C excursion be-tween ca. 2.20 and 2.05 Ga indicates that the fraction of carbongases reduced to organic carbon during this period was muchlarger than before. The �13C of �0‰ after the large positiveexcursion indicates that by 2.00 Ga, the fraction of carbongases reduced to organic carbon had returned to its pre-2.20 Gavalue. At the peak of the excursion, the �13C of carbon incarbonates was ��12‰; the �13C of carbon in organic matterwas ��24‰. If the average input �13C to the atmosphere was�5%, �50% of the carbon in the exogenic cycle was removedas organic C. The total amount of “excess” O2 produced by theburial of “excess” organic carbon during the �13C excursioncan only be estimated roughly. It seems to have been about (2.0 0.6) 1022 gm, i.e., between �12 and 22 times the O2
content of the present-day atmosphere.
Today, the rate of burial of organic carbon is controlled inlarge part by the availability of PO4
�3, NO3�, and Fe. In the
pre-G.O.E. ocean, the concentration of Fe was considerablygreater than today, as shown by the elevated Fe content ofpre-G.O.E. carbonate sediments (Veizer, 1978). It is unlikely,therefore, that Fe was a limiting nutrient in the pre-G.O.E.ocean. The role of N as a limiting nutrient is more difficult toevaluate. The average isotopic composition of N in marineorganic matter differs significantly from that of the atmosphere.The average value of �15N in present-day marine organicmatter is ��6‰ (see Fig. 9), while that of the atmosphere isclose to 0‰. In large part, the difference between these valuesis almost certainly due to the effect of the denitrification ofNO3
�. In early Archean kerogens, the average value of �15Nwas apparently close to 0‰ (Beaumont and Robert, 1998,1999). The very negative �15N values in kerogens from the3.45-Ga Warrawoona Formation in Australia have been con-firmed by Pinti and Hashizume (2001). These authors pointedout that some modern vent-related chemosynthetic organismshave negative �15N values and suggested that the negativevalues of �15N in Archean kerogens reflect their similarity tomodern vent organisms rather than the marine chemistry of N.It is not clear, however, that the Archean kerogens analyzed todate are the remains of chemosynthetic rather than photosyn-thetic organisms. The largest shift in the average value of �15Nof kerogens analyzed by Beaumont and Robert (1998) occursbetween 2.7 and 2.1 Ga (see Fig. 9). This shift could well berelated to the G.O.E., because the oxygenation of the upperparts of the oceans at that time was almost certainly accompa-
Fig. 8. The isotopic composition of carbon in marine carbonates, in carbonates associated with BIFs, and in organiccarbon between 2.6 and 1.6 Ga (Karhu and Holland, 1996).
3820 H. D. Holland

nied by a shift in the marine chemistry of N from NH4�-
dominated to NO3�-dominated. However, the range of �15N
values in kerogens of any given age is so large, that the datingof the major shift in the average �15N value of kerogensrequires a much larger number of analyses than are currentlyavailable. The time gap between the age of the upper Archeanand the Paleoproterozoic samples analyzed by Beaumont andRobert (1998) is too large to determine whether the shift in theaverage value of �15N in marine kerogen occurred before,during, or shortly after the G.O.E.
In the absence of O2 in the water column, NH4� must have
been the dominant combined-N species. This cation probablycycled efficiently between photosynthesizers, decomposers,and the water column. Losses of NH4
� by conversion to N2
were probably minor. It is likely, therefore, that NH4� was not
a limiting nutrient at that time. The situation changed drasti-cally when the concentration of O2 in the water column reached�15 �m. Nitrifying chemoautotrophs were then able to oxidize
NH4� to NO2
� and, subsequently, to NO3�. These oxidized
N-species were convertible to N2 in anaerobic settings byanaerobic microorganisms (denitrifiers). At a time when thedeeper parts of the oceans were anoxic, this process could haveconstituted a major drain on the concentration of the fixed-Nspecies (Falkowski and Berman-Frank, 2001) and could haveimposed strong limits on the total rate of photosynthesis in theoceans.
The time at which the O2 content of seawater in the photiczone reached the level at which nitrifying autotrophs becameimportant parts of the marine N cycle is not known. It couldhave been during the early Archean, if cyanobacteria hadalready developed by then. However, the data in Fig. 9 suggestthat denitrification did not shift the average �15N value ofmarine kerogen to its present value until some time between 2.7and 2.1 Ga. N-limitation of photosynthesis may therefore havebeen severe only during the transition of the atmosphere froman anoxygenic to an oxygenated state ca. 2.3 Ga. Since the
Fig. 9. The isotopic composition of nitrogen in kerogen since 3.5 Ga (Beaumont and Robert, 1998).
3821Volcanic gasses, black smokers, and the great oxidation

oxygenation of the oceans as a whole, nitrogen species do notseem to have limited the rate of marine photosynthesis on ageologic time scale. The entire matter of the role of N speciesas limiting nutrients is not, however, settled and continues to bea subject of considerable controversy.
Of the three limiting nutrients, N, Fe, and PO4�3, the last is
the constituent of seawater most likely to have limited the rateof photosynthesis and the rate of carbon burial before theG.O.E. Since the fraction of the carbon gases added to theatmosphere that were reduced to organic matter and buried withmarine sediments was nearly constant before the G.O.E., therate of PO4
�3 supply to the oceans must have scaled with therate of addition of carbon gases to the atmosphere. This is notunreasonable. The rate of chemical weathering is proportionalto the rate of CO2 addition to the atmosphere. PO4
�3 is releasedduring chemical weathering, largely by the dissolution of apa-tite. It is not surprising, therefore, that PO4
�3 addition to theoceans was coupled to the rate of carbon gas addition to theatmosphere. It is, however, somewhat puzzling that the fractionof (CO2 � CO) buried as a constituent of organic matter todayis so nearly equal to the pre-G.O.E. fraction, given the greatcomplexity of the marine geochemistry of phosphorus (e.g.,Slomp, 1997; Colman and Holland, 2000).
The large positive �13C excursion in carbonate sedimentsbetween ca. 2.22 and 2.06 Ga suggests that during this period,PO4
�3 was exceptionally available for photosynthesis and car-bon burial. Several changes probably contributed to this greateravailability. As the O2 content of the atmosphere rose, theoxidation of FeS2 during weathering must have increased dra-matically. The H2SO4 generated during FeS2 oxidation musthave increased the total rate of chemical weathering and, hence,the rate at which PO4
�3 was delivered to the oceans. At thesame time, H2S and HS� in the near-surface oceans wereprobably oxidized to SO4
�2. This process lowered the pH ofriver and seawater and perhaps made PO4
�3 more available forphotosynthesis. The combination of these effects may havebeen responsible for much of the increase in the �13C value ofmarine carbonates between 2.22 and 2.06 Ga. The deposition ofthe geologically oldest phosphorites and phosphatic BIFs fol-lowed hard on the beginning of the G.O.E. In Finland, uranif-erous phosphorites belonging to the Jatuli Group of the Kare-lian Supergroup or to the basal parts of the SvecofennianSupergroup were deposited between 2.1 and 1.9 Ga (Aikas,1989). In Western and Central India, the middle part of thePaleoproterozoic Aravalli Supergroup contains economic stro-matolitic phosphorite deposits (Verma, 1984). Unfortunately,these sediments are not well dated, and it is not yet clearwhether they were deposited shortly before, during, or after theG.O.E. The appearance of phosphorites does not prove thatPO4
�3 became more available during the rise of atmosphericO2, but their development is one of its expected consequences.
The decrease in the �13C value of carbonates following thepeak of the positive excursion suggests that the PO4
�3 flux tothe oceans decreased after ca. 2.10 Ga, and/or that PO4
�3 wasbeing removed more efficiently from the oceans. Both pro-cesses probably contributed to the decrease in the �13C ofcarbonates after ca 2.10 Ga. The FeS2 content of sedimentsdeposited after the G.O.E. was lower than that of pre-G.O.E.sediments, because some of the S�2 in the older sediments hadbeen converted to SO4
�2, which did not contribute to the gen-
eration of H� during weathering. In the oceans, the increase inthe O2 content, at least above the thermocline, must have beenaccompanied by the deposition of Fe(OH)3, which is an excel-lent scavenger for PO4
�3 (e.g., Colman and Holland, 2000).Although quantitative data are still lacking, the likely decreasein the PO4
�3 input to the oceans and the more efficient removalof PO4
�3 from the oceans probably accounted for a large part ofthe decrease in the burial rate of organic carbon and the returnof the �13C of marine carbonates to values close to 0‰ at theend of the G.O.E.
The magnitude of the �13C excursion is a measure of theexcess O2 generated during the G.O.E. (Karhu and Holland,1996). Some of this excess accumulated in the atmosphere andin the surface oceans. The majority was probably used in theoxidation of FeS2 during weathering. This resulted in a largeincrease in the SO4
�2 concentration of the oceans and in thedeposition of gypsum and anhydrite in evaporitic settings. It isinteresting and perhaps significant that the duration of theG.O.E. was roughly equal to the cycling time of sediments, i.e.,ca. 200 Ma.
The hypothesis advanced in this paper demands that all ornearly all of the sulfur in volatiles added to the ocean-atmo-sphere system before the G.O.E. was removed as a constituentof sulfides, mainly pyrite. This seems to be true. Anhydrite isknown only as a replacement mineral before 2.3 Ga. Theearliest significant anhydrite deposits are ca. 2.2 Ga (Chandler,1988; Master, 1990). Barite is reasonably common in Archeanand early Proterozoic sediments. Its quantity is very smallcompared to that of contemporaneous pyrite, but its presencedoes indicate that SO4
�2 has been present in surface ocean waterduring the past 3.45 Ga. This is not surprising. Volcanic SO2
reacts with H2O at temperatures below �400°C and dispropor-tionates to H2S and H2SO4:
4SO2 � 4H2O3 H2S � 3H2SO4 (19)
No O2 is required to generate H2SO4 via this reaction. Thepresence of barite in Archean sediments is not, therefore, proofof the presence of O2 in the atmosphere at that time. Theisotopic composition of sulfur in ca. 3.47-Ga barites fromNorth Pole, Australia (Shen et al., 2001) lends strong support tothe proposition that microbial sulfate reduction had alreadyevolved at that time. Most of the SO4
�2 generated inorganicallyby reactions such as Eqn. 19 and photochemically (Farquhar etal., 2001a) was apparently reduced to S�2 and was then re-moved by precipitation as a constituent of sulfide minerals.Microbial sulfate reduction and fractionation of sulfur isotopesbecomes rapid and efficient at SO4
�2 concentrations �1 mmol(Canfield et al., 2000). The isotopic fractionation of sulfurobserved in Archean pyrite such as that in the �2.5-Ga McRaeshale in Western Australia (Kakegawa et al., 1999) does not,therefore, require that the concentration of SO4
�2 in seawaterwas “more than one-third the present concentration” and doesnot demand that the atmosphere was oxic at �2.5 Ga.
The spread in the value of �34S in pyrite during the Precam-brian decreases with increasing age (Fig. 10). The spread isquite small until ca. 2.7 Ga, increases irregularly thereafter withdecreasing age, shows a significant increase during the G.O.E.(ca. 2.3 Ga), and reaches its full present-day range ca. 0.7 Ga.The complexity of this record probably owes something to the
3822 H. D. Holland

presence of cyanobacteria in the photic zone during at least thepast 2.7 Ga. The generation of O2 in the upper part of at leastsome of the oceans must have led to the oxidation of H2S andHS� to SO4
�2 in the photic zone and to an increase in the rateof SO4
�2 reduction within the oceans. In spite of this likelysource of SO4
�2 in the photic zone, the concentration of SO4�2
in the oceans as a whole was apparently sufficiently low beforethe G.O.E., that gypsum and anhydrite were deposited veryrarely, if ever, in evaporitic settings. The Precambrian geo-chemistry of sulfur is therefore consistent with the hypothesisproposed in this paper. However, the factors that control the�34S value of marine sulfides are so many and so varied thatreconstructions of the chemistry of the atmosphere and oceansbased on the isotopic data of sulfur are still rather uncertain.
6. CONCLUSIONS
This paper proposes that the change in the composition of theatmosphere from anoxygenic to oxygenated ca. 2.3 Ga was dueto a gradual increase in the oxidation state of volcanic gasesand hydrothermal inputs. It is shown that the required increasein the fO2
of volcanic gases was �0.5 log units, which is inkeeping with the limits set by the Cr and V content of volcanicrocks erupted during the past 3.96 Ga.
The proposed model for the evolution of the atmosphere isconsistent with what is known about the geochemistry of car-bon, nitrogen, sulfur, and phosphorus, and with the likelyescape rate of H2 from the atmosphere before the G.O.E.However, the proposed explanation for the evolution of theatmosphere is not yet rigorously quantitative and should beregarded as an attractive and likely rather than as a provenmodel.
Acknowledgments—The author wishes to thank James Kasting, LeeKump, John Delano, Karen von Damm, James Farquhar, Roger Buick,Andrew Knoll, David Catling, and Andrey Bekker for helpful andstimulating discussions, Wenbo Yang for designing several of thefigures, and NASA for financial support under grants NAG5-10631 andNCC2-1053.
Associate editor: D. E. Canfield
REFERENCES
Aikas O. (1989) Phosphate resources in early Proterozoic supracrustalrocks, Finland, with reference to the Baltic Shield. In PhosphateDeposits of the World, Vol. 2 (ed. A. G. J. Notholt et al.), chap. 69,Cambridge, Cambridge University Press.
Allard P. (1983) The origin of hydrogen, carbon, sulphur, nitrogen, andrare gases in volcanic exhalations: Evidence from isotopic chemistry.
Fig. 10. The isotopic composition of sedimentary sulfides of probable biologic origin during the past 3.5 Ga (Canfield,1998).
3823Volcanic gasses, black smokers, and the great oxidation

In Forecasting Volcanic Events (ed. H. Tazieff and J.-C. Sabroux),chap. 25, Elsevier.
Arthur M. A. (2000) Volcanic contributions to the carbon and sulfurgeochemical cycles and global change. In Encyclopedia of Volca-noes (ed. H. Sigurdsson), pp. 1045–1056. Academic Press.
Beaumont V. and Robert F. (1998) Compositions isotopiques de l’azotede la matiere organique des cherts precambriens: Nouvelles cles pourl’ evolution du cycle de l’azote. B. Soc. Geol. Fr. 169, 211–220.
Beaumont V. and Robert F. (1999) Nitrogen isotopic ratios of kerogensin Precambrian cherts: A record of the evolution of atmospherechemistry? Precambrian Res. 96, 63–82.
Bekker A., Kaufman A. J., Karhu J. A., Beukes N. J., Quinten S. D.,Coetzee L. L., and Kenneth A. E. (2001) Chemostratigraphy of thePaleoproterozoic Duitschland Formation, South Africa. Implicationsfor coupled climate change and carbon cycling. Am. J. Sci. 301,261–285.
Bekker A., Holland H. D., Rumble D., Yang W., Wang P.-L., andCoetzee L. L. (2002) MIF of oolitic ironstones, redox sensitiveelements in shales, and the rise of atmospheric oxygen. GoldschmidtConference, Davos, Switzerland.
Blundy J. D., Brodholt J. P., and Wood B. J. (1991) Carbon-fluidequilibria and the oxidation state of the upper mantle. Nature 349,321–324.
Brocks J. J., Logan G. A., Buick R., and Summons R. E. (1999)Archean molecular fossils and the early rise of eukaryotes. Science285, 1033–1036.
Buick I. S., Uken R., Gibson R. L., and Wallmach T. (1998) High-�13Cpaleoproterozoic carbonates from the Transvaal Supergroup, SouthAfrica. Geology 26, 875–878.
Butterfield D. A., Nelson B. K., Wheat C. G., Mottl M. J., and RoeK. K. (2001) Evidence for basaltic Sr in midocean ridge-flankhydrothermal systems and implications for the global oceanic Srisotope balance. Geochim. Cosmochim. Acta 65, 4141–4153.
Canfield D. E. (1998) A new model for Proterozoic ocean chemistry.Nature 396, 450–453.
Canfield D. E., Habicht K. S., and Thamdrup B. (2000) The Archeansulfur cycle and the early history of atmospheric oxygen. Science288, 658–661.
Canil D. (1997) Vanadium partitioning and the oxidation state ofArchaean komatiite magmas. Nature 389, 842–845.
Canil D. (1999) Vanadium partitioning between orthopyroxene, spineland silicate melt and the redox states of mantle source regions forprimary magmas. Geochim. Cosmochim. Acta 63, 557–572.
Catling D. C., Zahnle K. J., and McKay C. P. (2001) Biogenic methane,hydrogen escape, and the irreversible oxidation of early Earth. Sci-ence 293, 839–843.
Chandler F. W. (1988) Diagenesis of sabkha-related sulphate modulesin the Early Proterozoic Gordon Lake Formation, Ontario, Canada.Carbonate. Evaporite. 3, 75–94.
Colman A. S. and Holland H. D. (2000) The global diagenetic flux ofphosphorus from marine sediments to the oceans: Redox sensitivityand the control of atmospheric oxygen levels. In Marine Authigen-esis: From Global to Microbial (ed. C. R. Glenn, et al), pp. 53–75.SEPM Special Publication No. 66 Soc. for Sed. Geol.
Delano J. W. (2001) Redox history of the Earth’s interior: Implicationsfor the origin of life. Origins Life Evol. B. 31, 311–341.
Ellis A. J. and Mahon W. A. J. (1977) Chemistry and GeothermalSystems, Academic Press.
Ellis A. J. (1979) Explored geothermal systems. In Geochemistry ofHydrothermal Ore Deposits (ed. H. L. Barnes), chap. 13. Wiley-Interscience.
Falkowski P. G. and Berman-Frank I. (2001) The 500 Ma delay in therise of atmospheric O2 and the evolution of coupled biogeochemicalcycles (abstract), Earth System Processes, program with abstracts, p.65.
Farquhar J., Bao H., and Thiemens M. H. (2000) Atmospheric influ-ence of Earth’s earliest sulfur cycle. Science 289, 756–759.
Farquhar J., Airieau S., Savarino J., and Thiemens M. H. (2001a)Implications of mass-independent sulfur for the Archean atmosphere11th V. M. Goldschmidt Conference, May 20–24, 2001, HotSprings, Virginia (abstract #3402).
Farquhar J., Savarino J., Airieau S., and Thiemens M. H. (2001b)Observation of wavelength-sensitive mass-independent sulfur iso-
tope effects during SO2 photolysis: Implications for the early atmo-sphere. J. Geophys. Res. 106, 1–11.
Giggenbach W. F. (1996) Chemical composition of volcanic gases. InMonitoring and Mitigation of Volcano Hazards (ed. R. Scarpa andR. I. Tilling), pp. 221–256, Springer-Verlag.
Holland H. D. (1978) The Chemistry of the Atmosphere and Oceans.Wiley Interscience.
Holland H. D. (1999) When did the Earth’s atmosphere become oxic?A Reply. The Geochemical News 100, 20–22.
Holser W. T., Schidlowski M., Mackenzie F. T., and Maynard J. B.(1988a) Geochemical cycles of carbon and sulfur. In ChemicalCycles in the Evolution of the Earth (ed. C. B. Gregor, et al), chap.4, Wiley-Interscience.
Holser W. T., Maynard J. B., and Cruikshank K. M. (1988b) Modellingthe natural cycle of sulfur through Phanerozoic time. In Evolution ofthe Global Biogeochemical Sulphur Cycle (ed. P. Brimblecombe andA. Yu Lein), chap. 2, John Wiley and Sons.
Jupp T. and Schultz A. (2000) A thermodynamic explanation for blacksmoker temperatures. Nature 403, 880–883.
Kakegawa T., Kawai H., and Ohmoto H. (1999) Origins of pyrites inthe �2.5 Ga Mt. McRae shale, the Hamersley District, WesternAustralia. Geochim. Cosmochim. Acta. 62, 3205–3220.
Karhu J. A. and Holland H. D. (1996) Carbon isotopes and the rise ofatmospheric oxygen. Geology 24, 867–870.
Kasting J. F., Eggler D. H., and Raeburn S. P. (1993) Mantle redoxevolution and the oxidation state of the Archean atmosphere. J. Geol.101, 245–257.
Kelley D. S., Karson J. A., Blackman D. K., Fruh-Green G. L.,Butterfield D. A., Lilley M. D., Olson E. J., Schrenk M. O., RoeK. K., Lebon G. T., Rivizzigno P., and the AT3–60 Shipboard Party.(2001) An off-axis hydrothermal vent field near the Mid-AtlanticRidge at 30°N. Nature 412, 145–149.
Kump L. R. and Holland H. D. (1992) Iron in Precambrian rocks:Implications for the global oxygen budget of the ancient Earth.Geochim. Cosmochim. Acta 56, 3217–3223.
Kump L. R., Kasting J. F., and Barley M. E. (2001) Rise of atmosphericoxygen and the “upside-down” Archean mantle. Geochem. Geophys.Geosys. 2, Jan. 23., paper No. 2000 GC 000114.
Marty B. and Tolstikhin I. N. (1998) CO2 fluxes from mid-oceanridges, arcs, and plumes. Chem. Geol. 145, 233–248.
Master S. (1990) Oldest evaporites in Africa: 2.06 Ga continental playadeposits of the Deweras Group, Zimbabwe (abstract), p. 103 In 15thColloquium of African Geology, Sept. 10–13, 1990, University ofNancy, France.
Melezhik V. A., Fallick A. E., Medvedev P. V., and Makarikhin V. V.(1999) Extreme 13Ccarb enrichment in ca. 2.0 Ga magnesite-stromat-olite-dolomite-red beds association in a global context: A case forthe world-wide signal enhanced by a local environment. Earth-Sci.Rev. 48, 71–120.
Mojzsis S. J., Coath J. D., Greenwood J. P., McKeegan K. D., HarrisonT. M., and Runnegar B. (2001) Non-mass dependent sulfur isotopesdocumented from in-situ measurements of Precambrian sedimentarysulfides by multi-collector ion microprobe. 11th V. M. GoldschmidtConference, May, 20–24, 2001, Hot Springs, Virginia (abstract#3185).
Nishima N. (1989) A thermodynamic study of the pyrite-pyrrhotite-magnetite-water system at 300–500°C with relevance to the fugacityconcentration quotient of aqueous H2S. Geochim. Cosmochim. Acta53, 2143–2155.
Pinti D. L. and Hashizume K. (2001) 15N-depleted nitrogen in EarlyArchean kerogens: Clues to ancient marine chemosynthetic-basedecosystems? A comment to Beaumont, V. and Robert, F. Precam-brian Res. 96, 62–82; 105, 85–88.
Poorter R. P. E., Varekamp J. C., Poreda R. J., van Bergen M. J., andKreulen R. (1991) Chemical and isotopic composition of volcanicgases from the east Sunda and Bada arcs, Indonesia. Geochim.Cosmochim. Acta 55, 2795–3807.
Schidlowski M. (1988) A 3,800-million-year isotopic record of lifefrom carbon in sedimentary rocks. Nature 333, 313–318.
Seyfried W. E., Ding K., and Berndt M. E. (1991) Phase equilibriaconstraints on the chemistry of hot spring fluids at mid-ocean ridge.Geochim. Cosmochim. Acta 55, 3559–3580.
3824 H. D. Holland

Shen Y., Buick R., and Canfield D. E. (2001) Isotopic evidence formicrobial sulphate reduction in the early Archaean era. Nature 410,77–81.
Slomp C. P. (1997) Early diagenesis of phosphorus in continentalmargin sediments. Ph.D. dissertation, University of Wageningen,Netherlands.
Strauss H., Des Marais D. J., Hayes J. M., and Summons R. E. (1992)The carbon-isotopic record. In The Proterozoic Biosphere; A Mul-tidisciplinary Study (eds. J. W. Schopf, et al.), Cambridge UniversityPress.
Symonds R. B., Rose W. I., Bluth G. J. S., and Gerlach T. M. (1994)Volcanic-gas studies: Methods, results, and applications. In Volatilesin Magmas Vol. 30, (ed. M. R. Carroll and J. R. Holloway), chap. 1,Reviews of Mineralogy, Mineralogical Society of America.
Veizer J. (1978) Secular variations in the composition of sedimentarycarbonate rocks: II. Fe, Mn, Ca, Mg, Si and minor constituents.Precambrian Res. 6, 381–413.
Verma K. K. (1984) Biogenic concept for the origin of stromatoliticPrecambrian phosphorites of western and central India. In SpecialPublication No. 17. Geological Survey of India, pp. 41–46.
von Damm K. L. (2000) Chemistry of hydrothermal vent fluids from9°–10°N, East Pacific Rise: “Time zero,” the immediate posteruptiveperiod. J. Geophys. Res. 105, 11,203–11,222.
von Damm K. L., Oosting S. E., Kozlowski R., Buttermore L. G.,Colodner D. C., Edmonds H. N., Edmond J. M., and Grebmeier J. M.(1995) Evolution of East Pacific Rise hydrothermal vent fluidsfollowing a volcanic eruption. Nature 375, 47–50.
von Damm K. L., Buttermore L. G., Oosting S. E., Bray A. M., FornariD. J., Lilley M. D., and Shanks W. C. III. (1997) Direct observationof the evolution of a seafloor “black smoker” from vapor to brine.Earth Planet. Sci. Lett. 149, 101–111.
Williams S. N., Schaefer S. J., Calvache M. L., and Lopez D. (1992)Global carbon dioxide emission to the atmosphere by volcanoes.Geochim. Cosmochim. Acta 56, 1765–1770.
APPENDIX 1
DESCRIPTION OF MASS BALANCE CALCULATIONS
Mass balance calculations are the traditional way to calculate theincrease in the H2/H2O ratio of volcanic gases that is required to assurethat the Earth’s atmosphere remains anoxic. The uncertainties in themass balance data are, however, quite large, and calculations based onthem are probably less certain than those presented in the body of thispaper. Mass balance calculations are included here for the sake ofcompleteness and to show that there is no serious disagreement be-tween the results obtained with the two methods.
1. The Rate of Oxygen Use During WeatheringThe rate of O2 use during weathering is dominated by the oxidation
of C°, FeS2, and “FeO,” the quantity of ferrous iron in phases other thanFeS2. The data needed to calculate the O2 use during the weathering ofaverage rock are summarized in Table A1.
The figures in column 1 represent the concentration of C°, FeS2, and“FeO” in average rocks undergoing weathering. The figures in column2 represent the annual rate of O2 use via the three reactions. The totalrate of rock weathering today is taken to be (2.0 0.2) 1016 gm/yr,and the reactions are assumed to go to completion during weathering.
The total rate of O2 use calculated in this fashion is (15.5 6.7) 1012
mol O2/yr.
2. The Rate of Oxygen Production During SedimentationThe rate of O2 production during sedimentation is dominated by the
reverse of the three reactions in Table A1. The numbers are not,however, the same, because carbon and sulfur are added to sedimentsby volcanic and hydrothermal gases. The composition of average rockundergoing weathering is determined by the relative proportion ofigneous and high-grade metamorphic rocks vs. sedimentary and low-grade metamorphic rocks (Holland, 1978). The former group comprises�25%, the latter �75% of the rocks being weathered today. Since thecomposition of modern sediments is similar to that of sedimentaryrocks undergoing weathering, the O2 generation during the depositionof new sediments can be calculated as shown in Table A2. O2 generatedby the deposition of C° is 4/3 the rate of O2 consumption via C°oxidation of average rock exposed to weathering. O2 generated via thedeposition of FeS2 consists of two parts. The first is simply the reverseof the oxidation reaction in Table A1, which adds (0.6 0.2)% FeS2
to the new sediments. An additional (0.2 0.1)% FeS2 is generated byreactions involving volcanic and hydrothermal inputs. Reaction 3 inTable A2 describes the addition of FeS2 by the reduction of volcanicSO2. Approximately half of the volcanic and hydrothermal sulfur isremoved as a constituent of sulfates by the conversion of SO2 toH2SO4. Reaction 4 in Table A2 shows that the O2 loss via this reactionis approximately equal to (0.3 0.1) 1012 mol/yr. The reduction ofFe2O3 to “FeO” via reaction 5 yields a gain of O2 essentially equal tothe rate of O2 loss in Table A1. The inclusion of hydrothermal gasesmodifies the figure for the total O2 generation in Table A2 only slightly.
The net excess of O2 production during sedimentation over O2
consumption during weathering is �(2.9 1.0) 1012 mol/yr. Theuncertainty in this figure is taken to be the sum of the uncertainties inreactions 3 and 4 of Table A2 plus the uncertainty in the estimate of thecontribution of igneous and high-grade metamorphic rocks to thecomposition of average rock undergoing weathering.
The figures in Table A2 and the estimated O2 excess production canbe compared with figures derived from the quantity and composition ofvolcanic and hydrothermal inputs. The comparison is summarized inTable A3. The figures for C° and S in column 1 are derived from thefigures in Tables A1 and A2. They represent the increments of theseelements that are added during sedimentation. The figure for O2 incolumn 1 is the net rate of O2 generation from Table A2.
The figure for C° in column 2 is derived from an estimated flux ofvolcanic and hydrothermal (CO2 � CO) of 6.0 1012 mol/yr (Martyand Tolstikhin, 1998) and assumes that 20% of this carbon is reducedto C° and buried with sediments. The uncertainty in the estimatedburial rate of C° is large as shown, for instance, by the wide range ofestimates for the total volcanic carbon flux in compilations such asthose of Arthur (2000).
The figure for the rate of S addition to sediments in column 2 isderived from the same estimate of the total carbon flux and assumes aCO2/SO2 ratio of 6 in volcanic gases (Williams et al., 1992). AsSymonds et al. (1994) have pointed out, the ratio of CO2/SO2 in
Table A1.The rate of O2 use during weathering; data from Holland (1978). Seetext for explanation.
Reaction 1 2
1. Co � O2 3 CO2 0.45 0.1% (7.5 2.5) 1012 mol/yr2. FeS2 � 15/2O2 � 7/2H2O 3
Fe(OH)3 � 2H2SO4
0.6 0.2% (7.0 3.6) 1012
3. “FeO” � 1/4O2 3 1/2Fe2O3 1.5 0.6% (1.0 0.6) 1012
Total rate of O2 use � (15.5 6.7) 1012
Table A2.The rate of O2 production during sedimentation; data from Holland(1978).
Reaction 1 2
1. CO2 3 Co � O2 0.6 0.1% (10.0 3.3) 1012 mol/yr2. Fe(OH)3 � 2H2SO4 3 FeS2
� 15/2SO2 � 7/2H2O0.6 0.2% (7.0 3.6) 1012
3. “FeO” � 2SO2 3 FeS2 �5/2O2
0.2 0.1% (0.8 0.4) 1012
4. SO2 � 1/2O2 � H2O 3H2SO4
0.3 0.1% �(0.3 0.1) 1012
5. 1/2Fe2O3 3 “FeO” � 1/4O2 1.5 0.6% (0.9 0.4) 1012
Total rate of O2 production � (18.4 7.8) 1012
3825Volcanic gasses, black smokers, and the great oxidation

volcanic gases is highly variable. The estimate of the rate of addition ofS to sediments in column 2 is therefore quite uncertain.
The data in Fig. 6 suggest that the ratio of �C/H2O is highly variable.The average value of this ratio seems to be (0.03 0.02). If we takethe total C input to be 6 1012 mol/yr, the annual input of H2O is then(2.0 1.5) 1014 mol/yr. Since many volcanic gases have an fO2
close
to FMQ, the corresponding H2 input is �(4.8 3.6) 1012 mol/yr, aquantity that can oxidize (2.4 1.8) 1012 mol O2/yr. The differencesbetween the figures in column 1 and column 2 of Table A3 are clearlylarge, but the individual numbers agree within the stated uncertainties.
The value of � based on weathering and sedimentation calculationscan be calculated readily. When f � 1, all of the volcanic sulfur isremoved as FeS2. The rate of O2 generation due to the sulfur cycle istherefore (1.6 0.8) 1012 mol/yr, the total O2 generation rate is(19.5 7.8) 1012 mol/yr, and the difference between the rate of O2
generation and the rate of O2 use during weathering is (4.0 1.0) 1012 mol/yr rather than (2.9 1.0) 1012 mol/yr. The value of � istherefore �1.4. The addition of hydrothermal gases to the calculationsdoes not change the value of � significantly, but does increase its likelyuncertainty.
The value � for calculations based on volcanic and hydrothermaldata in column 2 of Table A3 can be estimated in a similar manner. Therate of O2 generation due to the burial of C° and the disposal ofvolcanic S is (1.6 1.0) 1012 mol/yr. If all of the S were removedas a constituent of FeS2, the rate of O2 generation would become (2.7 1.0) 1012 mol/yr. The value of � is therefore �1.7. This value of� and the value in column 1 of Table A3 are clearly �1.0. They aresomewhat lower than the value of � estimated in the body of the paperbased on analyses of volcanic gases, but perhaps not significantlylower. All three values of � suggest that rather small changes in theH2/H2O ratio of volcanic gas inputs would be sufficient to generate ananoxygenic atmosphere. The large uncertainties in all of these calcu-lations should, however, be borne in mind before assigning a great dealof weight to the numbers in Tables A1, A2, and A3.
Table A3.Comparison of the results of weathering and sedimentation calculationswith the results based on volcanic and hydrothermal gas data; see textfor explanation.
Process
1from weathering and
sedimentationcalculations
2from volcanic and
hydrothermal fluxes
1. Co added (2.5 1.0) 1012 mol/yr (1.2 0.8) 1012 mol/yr2. S added to
sedimentsas FeS2 andsulfates
(1.2 0.6) 1012 (1.0 0.8) 1012
3. O2 added toatmosphere
(2.9 1.0) 1012
4. H2 added toatmosphere
(4.8 3.6) 1012
� 1.4�0.2�0.3 1.7�0.4
�0.5
3826 H. D. Holland