Embed Size (px)
Citation preview

On the FE Modeling of FRP-Retrofitted Beam–Column Subassemblies
H. R. Ronagh, and H. Baji*
(Received February 13, 2013, Accepted July 23, 2013)
Abstract: The use of fiber reinforced polymer (FRP) composites in strengthening reinforced concrete beam–column subas-
semblies has been scrutinised both experimentally and numerically in recent years. While a multitude of numerical models are
available, and many match the experimental results reasonably well, there are not many studies that have looked at the efficiency of
different finite elements in a comparative way in order to clearly identify the best practice when it comes to modelling FRP for
strengthening. The present study aims at investigating this within the context of FRP retrofitted reinforced concrete beam–column
subassemblies. Two programs are used side by side; ANSYS and VecTor2. Results of the finite element modeling using these two
programs are compared with a recent experimental study. Different failure and yield criteria along with different element types are
implemented and a useful technique, which can reduce the number of elements considerably, is successfully employed for
modeling planar structures subjected to in-plane loading in ANSYS. Comparison of the results shows that there is good agreement
between ANSYS and VecTor2 results in monotonic loading. However, unlike VecTor2 program, implicit version of ANSYS
program is not able to properly model the cyclic behavior of the modeled subassemblies. The paper will be useful to those who
wish to study FRP strengthening applications numerically as it provides an insight into the choice of the elements and the methods
of modeling to achieve desired accuracy and numerical stability, a matter not so clearly explored in the past in any of the published
literature.
Keywords: beam–column subassembly, FRP, concrete, retrofit, finite element analysis, ANSYS, VecTor2.
1. Introduction
The use of fibre reinforced polymer (FRP) composites instrengthening, reinforced concrete structures has risen con-siderably in recent years. Combining the strength of thefibers with the stability of the polymer resin, FRP offer easeof application lowered labour cost and extra durability.Researches originally and practicing engineers with about10 years lag, have used FRP to strengthen different rein-forced concrete members such as beams, columns and slabs.Extensive experimental studies have shown that externallybonded FRP can significantly increase the stiffness and loadcarrying capacity of the retrofitted structures. However, therehave been reports of reduction in ductility associated withbrittle behaviour due to bond failure and FRP rupture.Experimental database for reinforced concrete structures
retrofitted or strengthened using FRP sheets or fabric isextensive. In the context of beam–column subassembly,numerous studies have been carried out (El-Amoury 2004;Ghobarah and El-Amoury 2005; Karayannis and Sirkelis2008; Pantelides et al. 2008; Alhaddad et al. 2012). In this
area, different issues such as joint shear strengthening;increasing member stiffness and plastic hinge relocationhave been investigated. Along with experimental studies,many researches have utilised finite element models to pre-dict the behaviour of FRP strengthened beam–column sub-assemblies (Parvin and Granata 2000; Wong and Vecchio2003; Mahini and Ronagh 2009; Alhaddad et al. 2012;Shrestha et al. 2013). Variety of finite element programs arecurrently available for the purpose of numerical study ofFRP strengthened reinforced concrete structures. Theseprograms can be divided into two categories: general-pur-pose commercial and purpose-made specialised programs.Amongst the commercial programs, ANSYS (2012) hasbeen very popular Although commercial general-purposeprograms such as ANSYS offer great flexibility and exten-sive element library, they suffer from many shortcomingswhen it comes to modelling specific features of certain typeof structures like reinforced concrete structures (solid ele-ment is the only available element for modelling concrete,lack of appropriate material softening model for concrete,tension stiffening is based on simple model rather thanfracture energy based models, lack of appropriate hystereticrules for concrete material and rebar to concrete bond,absence of special modelling features needed in modellingconcrete structures such as tension and compression soft-ening, rebar dowel action and rebar buckling). In order toovercome these shortcomings, supplementary subroutine forspecial elements or material can be added to these programs
School of Civil Engineering, The University of
Queensland, Brisbane, QLD 4072, Australia.
*Corresponding Author; E-mail: [email protected]
Copyright � The Author(s) 2013. This article is published
with open access at Springerlink.com
International Journal of Concrete Structures and MaterialsVol.8, No.2, pp.141–155, June 2014DOI 10.1007/s40069-013-0047-yISSN 1976-0485 / eISSN 2234-1315
141

by users. Examples of these subroutines can be found in theliterature (Kralik 2009). On the other hand, as a specialisedprogram, VecTor2 (Wong and Vecchio 2003) is a powerfultool especially developed for nonlinear analysis of mem-brane concrete structures especially those with shear–criticalbehaviour (Vecchio and Bucci 1999).This paper presents different modelling options available
in ANSYS for modelling FRP retrofitted beam–columnsubassemblies. Various failure and yield criteria along withdifferent element types will be investigated. Moreover,special features of the program VecTor2 (a specially devel-oped software for analysis of reinforced concrete membranestructures) in modelling beam–column subassemblies is alsodiscussed. Comparison will be made between the results ofthese program and the test results reported by Mahini (2005).This study aims to provide useful information in the contextof FE modelling of FRP retrofitted reinforced concretestructures.
2. Test Data
For comparison purposes, references is made to thespecimens tested by Mahini (2005) at the Structures Lab ofthe University of Queensland on five beam–column joints.
In his study, the scaled-down beam–column joints wereretrofitted using web-bonded FRPs in order to relocate theplastic hinge away from the joint core. The specimens aretaken from a 1/2.2 scaled reinforced concrete portal frame.The member section sizes and reinforcement that wereobtained based on this scale, satisfied the limitation of thehydraulic actuator size and the ultimate capacity of thehydraulic jacks. Buckingham’s theorem was used for scal-ing. Figure 1 shows the details of CFRP strengthened beam–column joint tested by Mahini (2005). For the purpose ofcomparison, five of his specimens are selected. Two of theseare control specimens that are not strengthened with FRP,while the other three are strengthened with FRP. Rein-forcement details are available in Mahini (2005).Table 1 shows the FRP configuration, concrete properties
and type of loading of the specimens used in Mahini (2005).The fibers are oriented along the beam. Thus, they providestiffness only in the longitudinal direction of the beam andact as a unidirectional material. In the perpendicular direc-tion, the saturant (a glue type material attaching the fibers toconcrete) is only active. If the fiber and saturant are treatedas one material, this material would be an orthotropicmaterial, in which the properties in the two perpendiculardirections are not the same. It is assumed that the fibersremain elastic up to the failure stress.
Fig. 1 Details of Mahini’s (2005) specimens.
142 | International Journal of Concrete Structures and Materials (Vol.8, No.2, June 2014)

A constant axial force equal to 305 kN was applied to thecolumn. The beam tip was subjected to either monotonicallyor cyclically varying loads. Three of the specimens (CSM0,RSM1 and RSM2) were subjected to monotonic loading,while the other two (CSC1 and RSC1) were cyclically loa-ded. The cyclic loading regime is shown in Fig. 2. For thesake of simplicity, only the first four cycles were used in thenumerical analysis of this study.Two cycles are applied at each ductility ratio level from
l ¼ D=Dy equal to 1, going up to 2, 3, 4 etc., where D is thebeam-tip displacement and l is the displacement ductilityratio. In this study, however, for the numerical analysis, onlyone cycle is applied at each ductility level. A displacement–control loading starting with the ductility ratio of one andending with the ductility ratio of four is used.
3. ANSYS Analytical Procedure
ANSYS program has been used by many researchers forFE modeling of reinforced concrete structures. With regardsto FRP strengthened reinforced concrete structures, Ka-chlakev et al. (2001) used ANSYS to examine the structuralbehavior of beams and bridges strengthened with FRPlaminates. In their numerical modeling, SOLID65, LINK8and SOLID46 elements were used to model concrete, barsand FRP laminates, respectively. Alhaddad et al. (2012)presented a detailed procedure for nonlinear finite-elementanalysis of FRP and textile reinforced mortar (TRM)upgraded reinforced concrete beam–column exterior jointsusing ANSYS. In their numerical modelling, they usedsimilar elements to those used in Kachlakev et al. (2001).The FE results were compared with the test results throughload–displacement behavior, ultimate loads, and crack pat-tern. Comparison of FE results with the experimentally
observed response indicated that the proposed nonlinear FEmodel can accurately predict the behavior and response oftested RC beam–column joints. Parvin and Granata (2000)investigated the application of FRP laminates to exteriorbeam–column joints in order to increase their momentcapacity using numerical analysis performed by ANSYS. Intheir study again SOLID65, LINK8 and SOLID46 elementswere used to simulate the concrete, rebar and the FRPlaminates, respectively. Mahini and Ronagh (2011) investi-gated the effectiveness of FRP strengthening in relocatingthe plastic hinge away from the face of the column in beam–column joints.A quick literature review on finite element analysis of
reinforced concrete structures strengthened by FRP lami-nates shows that the majority of researchers have usedSOLID65, LINK8 and SOLID46 to model concrete, rebarand FRP. There are some exceptions though; Hawileh et al.(2012) recently used the ANSYS program to simulate rein-forced concrete beams externally strengthened with short-length CFRP plates. SOLID65 and LINK8 elements wereused to model concrete and rebar. On the other hand, insteadof using SOILD46 to model the FRP laminates, they usedSHELL99 element with orthotropic material properties.Mirmiran et al. (2000) developed a nonlinear finite elementmodel for the analysis of FRP confined concrete. SOLID65was used to model concrete while the FRP sheets weremodelled by tension-only SHELL41 elements. Their modelshowed the same type of stress concentration around theedges of square sections as observed in the experiments.Furthermore, they concluded that the cyclic analysis of FRP-confined concrete confirmed capability of the model toeffectively predict the cyclic response of FRP-confinedconcrete. There has not been any study that explores thesuitability of the elements in a comparative way; andtherefore, this is the target the current study is aiming for.
3.1 ConcreteIn ANSYS, the only element that is suitable for modeling
concrete is SOLID65. This element is used for 3D modelingof solids with or without rebar. The solid is capable ofcracking in tension and crushing in compression. The ele-ment is defined by eight nodes having three degrees offreedom at each node: translations in x, y and z directions.Figure 3 shows the geometry of element SOLID65. Up tothree different rebar specifications can be defined as smearedreinforcement (uniformly distributed reinforcement definedas rebar percentage in each direction using rebar cross
Table 1 FRP configuration and concrete compressive strength (Mahini 2005).
Specimen No. of ply lf (mm) tf (mm) E (GPa) fu (MPa) erup f 0c (MPA)
CSM0 – – – – – – 40.82
RSM1 1 350 0.165 240 3,900 0.0155 40.82
RSM2 3 200 0.495 240 3,900 0.0155 47.17
CSC1 – – – – – – 41.94
RSC1 3 200 0.495 240 3,900 0.0155 41.94
-8-7-6-5-4-3-2-1012345678
0 1 2 3 4 5 6 7 8 9 10 11 12 13 14 15 16 17 18
Loading cycle
Dis
plac
emen
t du
ctili
ty Load controlDisplacement control
Fig. 2 Cyclic loading regime (Mahini 2005).
International Journal of Concrete Structures and Materials (Vol.8, No.2, June 2014) | 143

section area and spacing). SOILD65 element is capable ofplastic deformations as well as creep.ANSYS uses William-Warnke (1974) failure criterion for
assessing the state of failure. This failure surface function hasfive parameters. These parameters are used to find the tensileand compressive meridians. The five parameters that arerequired to define the William-Warnke failure surface are:
ft Ultimate uniaxial tensile strengthfc Ultimate uniaxial compressive strengthfcb Ultimate biaxial compressive strengthf1 Confined triaxial compressive strength (compressive
meridian)f2 Confined triaxial compressive strength (tensile meridian)
While the full five input parameters are needed to definethe failure surface (as well as an ambient hydrostatic stressstate on which parameters f1 and f2 are based), ANSYS canbuild the failure surface with a minimum of two constantsthat are the uniaxial tensile and compressive strengths. Forthe rest of the parameters, ANSYS uses default values takenfrom the William et al. (1974) study.It should be noted that ANSYS treats William-Warnke
function as a failure surface. Prior to failure, the behavior iselastic, and after cracking or crushing, the material com-pletely fails at that point and the material stiffness suddenlydrops to zero. In the case of having pure tension, ANSYSuses Rankin failure criteria for tension cut-off. Cracking ispermitted in three orthogonal directions at each integrationpoint. For the direction in which cracking occurs, tensile
strength essentially becomes zero. When the crack closes,compressive stresses normal to the crack can be transferred.Material property for the directions in which crack has notoccurred remains the same. Figure 4a shows the failuresurface of concrete for the plane stress case. As is seen, forthe tension stress state, ANSYS uses tension cut-off.With regards to the concrete tension model, one of the
shortcomings of ANSYS is that it does not use the conceptof fracture energy which is widely used in the analyticalmodels for concrete cracking. In ANSYS, cracking isdefined by a single material property which is the tensilestrength of concrete. To consider tension stiffening, stressrelaxation has to be considered after cracking. Figure 4bshows the model employed in ANSYS to consider tensionstiffening. A constant Tc is used to control the stiffeningmodel which acts as a multiplier for the stress relaxation.Shear behavior of SOLID65 element in ANSYS is con-
trolled by two shear transfer coefficient for open and closedcracks. These coefficients represent conditions at the crackallowing for the possibility of shear sliding across the crackface. The value of these shear transfer coefficient rangesbetween zero and one, with zero representing a smooth crack(complete loss of shear transfer) and one (no loss of sheartransfer).Even though prior to failure (cracking or crushing), the
behavior is assumed to be linear elastic, plasticity and/orcreep may be combined with the concrete base properties toprovide nonlinear behavior prior to failure. Usually, Von-Mises or Drucker–Prager (Drucker et al. 1952) plasticity isused for concrete. When a yield criterion is used in con-junction with the failure criteria, the yield surface must layinside the concrete failure surface; otherwise, no yieldingwill occur. Drucker–Prager yield criterion is a modificationof the Von-Mises criterion that accounts for the influence ofthe hydrostatic stress component; the higher is the hydro-static stress (confinement pressure), the higher would be theyield strength. Equations 1 and 2 show the yield functionsfor Von-Mises and Drucker–Prager yield surfaces.
ffiffiffiffiffi
J2p� ry ¼ 0 ð1Þ
bI1 þffiffiffiffiffi
J2p� ry ¼ 0 ð2Þ
Fig. 3 Element SOILD65 geometry (ANSYS 2012).
Fig. 4 Failure surface in principal space with nearly biaxial stress (ANSYS 2012).
144 | International Journal of Concrete Structures and Materials (Vol.8, No.2, June 2014)

where, parameters b and ry are the yield function parametersor material constants. Figure 5 shows both of the afore-mentioned yield criteria in the stress invariant plane. TheVon-Mises function depends on only one stress invariant anddoes not include the effect of hydrostatic stresses, whileDrucker–Prager includes the effect of hydrostatic stresses byadding another stress invariant.Since the Drucker–Prager yield surface is a smooth ver-
sion of the Mohr–Columb yield surface, it is often expressedin terms of the cohesion c and the angle of internal friction /that are used to describe the Mohr–Columb yield surface. Ifit is assumed that the Drucker–Prager yield surface inscribesthe Mohr–Columb yield surface, then the expressions forfinding parameters b and ry will be as follows.
b ¼ 2 sin/ffiffiffi
3p
3� sin/ð Þð3Þ
ry ¼6ðcÞ cos/ffiffiffi
3p
3� sin/ð Þð4Þ
where in Eqs. 3 and 4, / is the angle of internal friction andc is the cohesion value. The cohesion and the angle ofinternal friction for concrete are related to the concretestrength as shown in Eqs. 5 and 6.
fc0 ¼2ðcÞ cos/3� sin/
ð5Þ
k1 ¼1þ sin/1� sin/
ð6Þ
where variable f 0c0 is the unconfined strength of concrete andthe parameter k1 is the confinement effectiveness factor.Confinement effectiveness factor was first suggested as 4.1by Richart (1929). It results in a friction angle of about 37�.Others have suggested different expressions for calculatingthis factor. Rochette (1996) suggested a direct approach tocalculate c and / as given by Eqs. 7 and 8.
/ ¼ sin�13
1þ 1:592332f 0c0ðksiÞ
� �
ð7Þ
cðpsiÞ ¼ f 0c0ðpsiÞ � 1256� � 3� sin/
6 cos/ð8Þ
The internal friction angle and cohesion shown in Eqs. 8and 9 were used by other researchers (Mirmiran et al. 2000;Shahawy et al. 2000).
In order to simulate the nonlinear behavior of concrete,Von-Mises yield criterion could be used instead of Drucker–Prager. Equation 9 shows the parabolic function of Hog-nestad stress–strain curve. Post-peak behavior of concreteinvolves strain softening. Several softening models areavailable for concrete. However, in the implicit version ofANSYS, softening of material could not be considered. Inthis study, the softening branch of stress–strain curve isreplaced by a plateau.
fc ¼ f 0c2ec
0:002� ec
0:002
� �2� �
ð9Þ
3.2 Steel RebarThere are two options to model the reinforcement bars in
ANSYS; smeared and discrete. When the smeared option isused, reinforcement is defined as a part of SOLID65 con-crete element. Up to three directions could be used to definethe smeared bars. Figure 3 shows the arrangement of rein-forcing bars in the element. The smeared rebar is capable oftension and compression, but not shear. In each direction,smeared bars behave similar to a uniaxial material. Thesecond option for modeling the reinforcing bars is to modelthem as a discrete element which is attached to the concreteelements. If discrete reinforcements are to be modeled, useof LINK and COMBIN elements in ANSYS is suggested;amongst which 2-node uniaxial tension–compressionLINK8 element is the most common. As previously men-tioned, Von-Mises yield criterion is generally used for metalssuch as steel. Steel can be modeled as a bilinear or a multi-linear material. For cyclic analysis, generally one of themore common Kinematic hardening laws is used for therebar. In the current study, bilinear Kinematic materialbehavior is used for bars. Longitudinal bars of beams andcolumns are modeled using discrete LINK8 element, but theshear bars (stirrup) are modeled using smeared reinforce-ment. Because no bond slip was reported in the Mahini’s(2005) experimental study in the current research bondelements are not modeled.
3.3 Fiber Reinforced Polymer (FRP)FRP composites are anisotropic; that is, their properties
are different in different directions. A schematic of FRPcomposites is shown in Fig. 6. As is seen, the unidirectionallamina has three orthogonal planes of material properties(i.e., x–y, x–z, and y–z planes). The xyz coordinate axes arereferred to as the principal material coordinates, where the xdirection is the same as the fiber direction, and the y and zdirections are perpendicular to the x direction.As was explained in the previous sections, SOLID46 with
anisotropic material properties has been used to model FRPlaminates (Parvin and Granata 2000; Kachlakev et al. 2001;Mahini 2005). Tension-only membrane SELL41 and elasticFig. 5 Drucker–Prager and Von-Mises yield criteria.
International Journal of Concrete Structures and Materials (Vol.8, No.2, June 2014) | 145

SHELL99 have also been used for this purpose (Mirmiranet al. 2000; Hawileh et al. 2012). One possibility to bettermodel FRP in ANSYS which is not tried previously byresearchers (although used for modeling reinforcing bars inconcrete, (Hunley and Harik 2012)) is to use its reinforcedshells and solids elements. These elements constitute a baseelement that can be reinforced with additional elements. Inthe case of FRP, the saturant can be used as the base elementwhile fibers are added as reinforcing elements. Figure 6shows the saturant and the fibers as different element.Reinforcing elements can be defined as discrete or smeared,and they can act as tension-only, compression only or ten-sion and compression elements. In fact, for FRP, the tension-only fibers are used. Element SHELL181 can be used as thebase element for FRP composite material. Then, it can bereinforced using REINF265 smeared element. Each layer ofreinforcement behaves as a unidirectional material. All lay-ers including the base element perform like a parallel system.Perfect bond is assumed amongst the layers. Each layer canhave its own thickness (defined as fiber area and space),orientation and local axis coordinate system. This optionseems to be most appropriate for modeling FRP sheets inANSYS. Fibers are embedded inside the base saturant andcan have different directions without affecting each other.Even though the fibers are modeled as tension-only ele-ments, the saturant which represents the base element can bemodeled as an elastic element with isotropic properties.In this study, two options will be considered to model
FRP; tension-only membrane SHELL41 element and mem-brane-only option of SHELL181 reinforced with REINF265.
3.4 Geometry and MeshingFor verification purposes, test subassemblies were mod-
eled in ANSYS taking advantage of plane stress condition ofloading. The beam–column subassembly was represented byone row of solid elements. The beam and column sectionswere scaled down to narrower dimension. Therefore, onlyone element represents width of the section. Use of one rowof solid elements is equivalent to using shell elements with a
thickness equal to the width of solid elements. BecauseANSYS does not support reinforced concrete shell elements,the solid element is used to represent a condition that wouldbehave similarly to the plane stress case. Width of the solidelements could be chosen arbitrarily. However, in order tohave an element aspect ratio close to one, the width is setequal to the mesh size. In this method, the final results areindependent of the solid element width. Figure 7 shows themeshed model. All used element types are shown in thisfigure.As the beam and column cross section dimension is
reduced, the steel rebar and FRP sheets thickness are pro-portionally reduced. Figure 8 shows how the column andbeam cross sections are scaled down. The forces resultedfrom the analysis have to be scaled up after the analysis as aresult, in order to represent forces in the structure. It is worthmentioning that in this kind of scaling, the stresses anddeflections in the original and scaled structures remainsimilar.Using this method for the finite element analysis consid-
erably reduces the number of elements. Usually in experi-mental studies, planar loading is applied on specimens.Therefore, the method that is proposed here can be used forany analytical study. Using this method, considerable time issaved, and the designer can use a finer mesh for the planarstructure. The attention can thus be shifted from analysing acomplex system towards parametric studies on this simplerform and processing of the results.
4. VecTor2 Analytical Procedure
The second nonlinear finite element software explored inthis study is VecTor2, a two dimensional nonlinear finiteelement analysis program for reinforced concrete structuresdeveloped at the University of Toronto. VecTor2 is based onthe Modified Compression Field Theory (MCFT) by Vec-chio and Collins (1986) and the Distributed Stress FieldModel (DSFM) by Vecchio (2000). VecTor2 is capable ofmodeling two-dimensional reinforced concrete membrane
Fig. 6 Schematic of FRP composites (Kachlakev et al.2001).
Fig. 7 Geometry, meshing and element type in ANSYSmodel.
146 | International Journal of Concrete Structures and Materials (Vol.8, No.2, June 2014)

structures under monotonic, cyclic and reversed cyclicloading conditions. The element library of the program islimited. However, the element library covers many of therequired elements for reinforced concrete structures. Moreimportantly, it uses state-of-the-art material models forconcrete, reinforcing and prestressing steel.The MCFT is based on a smeared, rotating crack model for
reinforced concrete, in which cracked concrete is representedas an orthotropic material with a unique constitutive relation.VecTor2 is a nonlinear finite element program that utilizes anincremental total load and iterative secant stiffness algorithmto produce an efficient and robust nonlinear solution.Additional information on VecTor2 program is given in‘‘VecTor2 & FormWorks User’s Manual’’ by Wong (2002).Furthermore, the details of the constitutive models and theirimplementation into VecTor2 software have been describedby Vecchio (2000).VecTor2 program have been used in many studies. Vec-
chio and others undertook an analytical study on classicbeam tests (Vecchio and Shim 2004), using VecTor2. Theyconcluded that in a finite element simulation of the testbeams, three dimensional stress effects were significant.They signified importance of the out-of-plane reinforcementin the accurate estimation of load–deformation behaviour ofthe test beams. Sagbas et al. (2011) have used the VecTor2program to model beam–column subassemblies subjected tocyclic loading. They proposed general guidelines for effec-tive finite element modelling of beam–column subassem-blies. Bohl and Adebar (2011) used VecTor2 program toinvestigate the plastic hinge length in high-rise concreteshear walls. They reported that there is generally very goodagreement between the predicted and observed curvaturedistributions. In the context of FRP repaired and
strengthened structures, Vecchio and Bucci (1999) usedVecTor2 program for the analysis of repaired reinforcedconcrete structures. They concluded that it is possible toimplement modifications to nonlinear finite element proce-dures that will enable analysis of repaired, retrofitted orsequentially constructed concrete structures. Wong andVecchio (2003) investigated modelling of reinforced con-crete members with externally bonded FRP compositesbehaviour and especially bond between concrete and FRPmaterials using VecTor2 program. They showed that theimplementation of link and contact elements, along withlinear elastic and elastic–plastic bond laws produces accuratepredictions of member response.
4.1 ConcreteVecTor2 uses three node constant strain triangular ele-
ments with six degrees of freedom and four-node planestress rectangular elements with eight degrees of freedom tomodel concrete with distributed reinforcement. Plain as wellas reinforced concrete with smeared reinforcement can bemodeled using these elements. In VecTor2 program, variousconstitutive and behavioral models are available for con-crete. The concrete model in VecTor2 accounts for thereduction of compressive strength and stiffness due totransverse cracking and tensile straining. Concrete tensionstiffening, crack shear slip, concrete tension splitting, con-crete confinement and concrete dilatation can be consideredin the analysis. Description of these effects is out of scope ofthis paper and details of all these options are available inVecTor2 user’s manual (Wong and Vecchio 2003).The concrete hysteretic response can be modeled with
linear, nonlinear or nonlinear decay options. Typical tensileand compressive hysteretic responses of concrete materialare shown in Fig. 9.Palermo and Vecchio (2003) model with cyclic decay is
assigned to concrete in order to model the hystereticbehavior of beam–column subassemblies in this study. Fig-ure 9 shows the Palermo hysteretic behavior in tension andcompression. Sagbas (2007) applied this model in the cyclicanalysis of beam–column subassemblies.
4.2 Steel RebarReinforcement can be modeled using either a smeared or a
discrete representation. If bond-slip of reinforcement is to beconsidered, the use of discrete truss elements is unavoidable.On the other hand, when the longitudinal or transverse barsare sufficiently well distributed, smeared reinforcement isappropriate. Smeared reinforcement can be defined based onrebar percentage and rebar direction. The smeared rein-forcement layer behaves as a unidirectional (in the specifieddirection) material. In order to model the discrete rein-forcement, two-node truss bar element with four degrees offreedom is used.The constitutive relationship used for reinforcing steel is
based on a trilinear stress–strain behavior. The strain hard-ening effect of reinforcement until rupture is considered inVecTor2. Using the monotonic stress–strain curve as abackbone, the hysteretic response models define unloading
Fig. 8 Scaling technique for column and beam sections.
International Journal of Concrete Structures and Materials (Vol.8, No.2, June 2014) | 147

and reloading curves depending on the model selected fromthe VecTor2. By default, VecTor2 uses the model proposedby Seckin (1981) for the hysteretic response of reinforce-ment which includes the Bauschinger effect. Figure 10illustrates the Seckin model that is used in VecTor2 program.In this model, after the plastic prestressing, the local stresschanges upon load reversal resulting in premature yieldingof reinforcement. The reloading curve is defined with aRamsberg–Osgood formulation including the Bauschingereffect.Dowel action as well as reinforcement buckling can be
considered in the analytical model using VecTor2. In thisstudy, transverse rebar (stirrups) are modeled based onsmeared option, and all longitudinal reinforcement aremodeled using truss elements. Although bond slip betweenconcrete and rebar is modeled using link element, perfectbond has been assumed for this element. This means that noslip is considered between the bar truss elements and theconcrete elements.
4.3 Fiber Reinforced Polymer (FRP)Currently VecTor2 program does not have a specific ele-
ment for modeling FRP materials. However, FRP fabric orsheets can be modeled using either smeared tension-onlyreinforcement layer or discrete tension-only truss elements.If the bond between FRP fabric and concrete is to be con-sidered, only discrete truss elements can be used. FRP
material is essentially elastic; i.e. prior to reaching the ulti-mate strength the material stress–strain relationship is linearand after that the material fails in a brittle manner. As theFRP material remains elastic, no special consideration needsto be given to the cyclic behavior. Essentially, loading andreloading follow the same path.
4.4 Geometry and MeshingDue to the rectangular shape of the beam–column subas-
sembly, only the rectangular concrete element is used for thefinite element modeling of the subassembly. Because trans-verse reinforcements in different parts of beam and columnare not the same, different concrete materials are assigned tothese parts. Rectangular stirrups are replaced by smearedreinforcement in two perpendicular directions. These direc-tions lie on the cross section of beam and column members.Figure 11 shows the divided regions of beam–column sub-assembly based on their material properties.Longitudinal bars of the beam and the column are mod-
elled using discrete truss element. Even though the linkelements are defined between the nodes attached to therectangular concrete element and the truss element, perfectbond is used in this study. Mild steel properties are used tomodel the two steel plates on the top and bottom of thecolumn.
fc
fcrbase curve for tension
εcr εcpcε
stiffened response
-fc base curve for
responsecompression softened
fp
−εcεppcε
(a) Compression (b) TensionFig. 9 Palermo model of concrete hysteretic response
Fig. 10 Seckin model of reinforcement hysteretic response(Wong and Vecchio 2003).
Fig. 11 Element mesh and different material regions inVecTor2.
148 | International Journal of Concrete Structures and Materials (Vol.8, No.2, June 2014)

Table 2 summarizes different features of the selectedprograms in simulating reinforced concrete structures. As isreflected in this table, VecTor2 program offers more exten-sive options in modelling reinforced concrete structures.
5. Comparison of the Results
In this section, using ANSYS and VecTor2 programs, thefive specimens shown in Table 1 are analyzed. Three spec-imens are subjected to monotonic loading, while the othertwo are cyclically loaded. Displacement–control type load-ing is used in both programs. The maximum applied dis-placement is 80 mm for all specimens that are subjected tomonotonic loading, and for those that are subjected to cyclicloading, four cycles are considered. First cycle starts with theyield displacement and in the following cycles, the dis-placement is two, three and four times the yielddisplacement.Figure 12 shows the force–displacement curve for the
specimen CSM0 based on different options available inANSYS and VecTor2 programs. Specimen CSM0 is thecontrol specimen and is not strengthened by FRP sheets.
Drucker–Prager and Von-Mises yield criteria as well asWilliam-Warnke failure criterion are chosen in ANSYS. Inaddition, a case in which concrete behaves elastically is alsoconsidered. With regards to VecTor2, in one case, the pre-peak stress–strain of concrete is defined based on the Hog-nestad model, while the post peak behavior is based on themodified Park-Kent model (VecTor2-softening curve inFig. 12). For the second case, elastic behavior is consideredfor concrete (VecTor2-elastic curve in Fig. 12). In the thirdcase, compressive behavior of concrete is similar to case 1;however, tension stiffening is used for concrete.Figure 12 shows that the results of Drucker–Prager and
Von-Mises yield criteria are almost identical. As expectedassuming elastic behavior for concrete results in stifferbehavior. The model which is based on William-Warnkefails in properly predicting the specimen behavior, as it doesnot allow the concrete to take any load after crushing. Onceone of the concrete solid elements fails, its stiffness drops tozero and as result the stiffness of the structure reduces. Thistype of failure would not normally occur in concrete struc-tures as concrete experiences softening after reaching itspeak stress. For other considered options, the crushingoption is turned off in ANSYS.
Table 2 Summary of ANSYS and VecTor2 features in modelling RC structures.
Item ANSYS VecTor2
Concrete element SOLID65 Membrane (3 and 4 node)
Rebar element LINK8 Truss
LINK10
FRP element SOLID46 Tension only smeared rebar layer
SHELL41 External FRP sheet layer
SHELL181
Bond element COMBIN39 Link (2 node)
CONTACT Interface (4 node)
Confinement model William-Wranke Kupfer/Richard
Drucker–Prager Montaya/Ottosen Selby
Compression softening Not included Included
Tension softening Not included Included
Tension stiffening Basic linear for convergence purposes Based on fracture energy and variety of models
Concrete hysteretic rules Kinematic/isotropic Linear w/no plastic offset
Linear w/plastic offset
Nonlinear w/plastic offset
Palermo (w/decay)
Rebar hysteretic rules Kinematic/isotropic Elastic-hardening (curvilinear)
Elastic-hardening (trilinear)
Elastic–plastic (bilinear)
Bauschinger effect (seckin)
Rebar dowel action Not included Included
International Journal of Concrete Structures and Materials (Vol.8, No.2, June 2014) | 149

VecTor2 results are closer to the experimental curve.When tension stiffening is not considered in VecTor2, theresults are closer to ANSYS and also to the experimentalresults. This shows that ANSYS does not have the appro-priate tension stiffening model for concrete. One method forindirectly incorporating tension stiffening in the analysis ofconcrete structures is to modify the steel stress–strain curve(Ko et al. 2001). Nevertheless, when tension stiffening is notconsidered in VecTor2, results are closer to the experimentalload–displacement curve. Thus, for all other consideredspecimens in VecTor2 analysis, the tension stiffening is notactivated. Results in Fig. 12 show that assuming the elasticbehavior for concrete material does not change the resultsconsiderably. This was expected, as for beam members theflexural behavior is dominant and the concrete strength hasless contribution to the flexural strength. The steel yieldstrength or more broadly the steel stress–strain curve is themost important parameter. In Table 3 a comparison betweenthe experimental and the finite element results for differentstates of loading are shown. As Table 3 shows, both pro-grams well predict the crack and yield loads and displace-ments for specimen CSM0. However, they underestimate the
maximum load capacity of the specimen. Possible inaccu-racy in modeling the post yield behavior of steel rebarmaterial could be one of the reasons for this underestimation.As another comparative parameter, the distribution of
curvature along the beam is calculated in both ANSYS andVecTor2. Using the resulting displacement at the nodes ofthe finite element model, the curvature at every section isindirectly calculated. Equation 10 shows how the curvatureis calculated.
u ¼ es � ecmax
dð10Þ
In Eq. 10, es and ecmaxare the strain in the tensile steel andthe outermost concrete fiber respectively. The parameter d isthe effective depth of the cross section. Because the strain inconcrete is negative, in Eq. 10 a negative sign is used for theconcrete strain. By differentiating nodal displacements inadjacent nodes, the steel and concrete strains are calculated.Figure 13 illustrates the variation of curvature from theresults of ANSYS and VecTor2. The curvature diagramshown in Fig. 13 is based on the final stage of loading whichcorresponds to 80 mm displacement. The agreement
(a) ANSYS (b) VecTor2
0.0
5.0
10.0
15.0
20.0
25.0
30.0
0.0 10.0 20.0 30.0 40.0 50.0 60.0 70.0 80.0 90.0
Bea
m t
ip lo
ad (
kN)
Beam tip displacement (mm)
Experimental
ANSYS-Von Mises
ANSYS-Drucker Prager
ANSYS-Elastic
ANSYS-William Warnke
0.0
5.0
10.0
15.0
20.0
25.0
30.0
0.0 10.0 20.0 30.0 40.0 50.0 60.0 70.0 80.0 90.0
Bea
m t
ip lo
ad (
kN)
Beam tip displacement (mm)
Experimental
VecTor2-Softening
VecTor2-Elastic
VecTor2-Tension Stiffening
Fig. 12 Comparison between load–displacement curves predicted by ANSYS and VecTor2 results for the specimen CSM0.
Table 3 Comparison of finite element and test results for monolithically loaded specimens.
Specimen Crack Yield Max
Test ANSYS VecTor2 Test ANSYS VecTor2 Test ANSYS VecTor2
CSM0
F (kN) 5.30 4.60 4.70 17.09 17.60 17.50 24.00 21.10 21.60
D (mm) 1.70 2.30 2.00 14.00 13.30 13.00 80.00 80.00 80.00
RSM1
F (kN) 6.00 5.90 8.30 21.76 22.10 23.10 20.40 30.80 33.00
D (mm) 2.10 2.80 3.00 19.97 16.00 17.00 80.00 80.00 80.00
RSM2
F (kN) 5.20 4.50 5.70 21.80 19.90 19.80 20.30 26.50 26.80
D (mm) 1.50 1.40 2.00 18.80 13.40 13.00 80.00 80.00 80.00
150 | International Journal of Concrete Structures and Materials (Vol.8, No.2, June 2014)

between two programs is quite reasonable. It should be notedthat although the maximum mesh size used in the VecTor2and ANSYS models is 25 mm, the meshed models are notexactly identical. The points at which the curvature iscalculated are the points shown in Fig. 13 and for the spacesin between the points, a linear variation is assumed.
Now, for the retrofitted specimens that are monotonicallyloaded, the results are discussed. Figure 14 shows the load–displacement curves for specimens RSM1 and RSM2 basedon VecTor2 and ANSYS programs. For these specimens, themaximum mesh size is 25 mm and the specimens are loadedup to 80 mm at the beam tip. The specifications of thesespecimens are shown in Table 1. For comparison only, Von-Mises yield criterion along with tension cut-off is used in theANSYS program. As previously discussed, Drucker–Prageryield criterion would result in the same results as Von-Misescriterion while the William-Warnke failure criterion is notappropriate as it takes away the crushed elements. VecTor2model is based on the Hognestad curve for pre-peak and themodified Kent-Park model for the post-peak behavior. For
comparison, results of using elements SHELL41 and rein-forced SHELL181 are shown separately. The reinforcingelement REINF265 which is based on smeared reinforce-ment layer is used to reinforce the SHELL181 element.Results in Fig. 14 show that the agreement between Vec-
Tor2 and ANSYS results is reasonably good. Furthermore,SHELL41 and reinforced SHELL181 result in almost similarresults for the force–displacement curve. For the retrofittedspecimens, finite element results overestimate the loadcapacity of the both retrofitted specimens. According toMahini’s (2005) declaration, for RSM1 specimen and at thepeak load, concrete crushing occurred at the face of thecolumn, which was followed by the rupture of FRP. It wasobserved that the specimen exhibited a brittle failure modeconstituting of concrete crushing, FRP buckling and deb-onding. In both specimens, concrete cover of the compres-sion zone started to spall off at the peak load stage. In thisstudy concrete spalling and FRP to concrete surface deb-onding were not modeled. Therefore, as expected the finiteelement results obtained from VecTor2 and ANSYS do notshow any softening. VecTor2 results show small softening atthe end of loading. However, this softening is a result ofmaterial softening not concrete spalling. There are severalresearchers that have modeled bond slip between FRP andconcrete. Recently, Biscaia et al. (2013) have presented aload–displacement behavior model for bond-slip betweenFRP and concrete. Hawileh et al. (2012) utilized interfacecohesion element for modeling debonding of FRP platesusing ANSYS program. They concluded that the developedfinite element models are capable of accurately predictingand capturing capacity the debonding failure mode of RCbeams strengthened with FRP plates. Kim and Vecchio(2008) used a two-node link element in VecTor2 program formodeling FRP-retrofitted portal frame. Due to lack of ade-quate information, debonding between FRP and concretewas not modeled in this study. As shown in Fig. 14, VecTor2exhibits a stiffer post-yield behavior in comparison withANSYS. Furthermore, material softening which is consid-ered in the VecTor2 model does not have a significant impacton the structural results.The main failure indicators such as the ultimate strain of
steel, concrete and CFRP sheets were not properly reported
Fig. 13 Comparison between curvature diagrams predictedby ANSYS and VecTor2 for the specimen CSM0.
(c) RSM1 specimen (d) RSM2 specimen
0.0
5.0
10.0
15.0
20.0
25.0
30.0
35.0
0.0 20.0 40.0 60.0 80.0 100.0
Bea
m t
ip lo
ad (
kN)
Beam tip displacement (mm)
Experimental
VecTor2
ANSYS-SHELL181
ANSYS-SHELL410.0
5.0
10.0
15.0
20.0
25.0
30.0
35.0
0.0 20.0 40.0 60.0 80.0 100.0
Bea
m lo
ad (k
N)
Beam tip displacement (mm)
Experimental
VecTor2
ANSYS-SHELL181
ANSYS-SHELL41
Fig. 14 Comparison between load–displacement curves predicted by ANSYS and VecTor2 results for the specimens RSM1 andRSM2.
International Journal of Concrete Structures and Materials (Vol.8, No.2, June 2014) | 151

in the experimental program by Mahini. Therefore, in thisresearch, values corresponding to 80 mm beam tip dis-placement are used as maximum load state. Table 3 showsthat both programs well predict the load and displacement ofthe specimens at crack state. Although the yield load is wellpredicted, the yield displacement is underestimated by bothprograms. It is worth mentioning that in Mahini’s experi-mental program, the mechanical properties of FRP sheetswere not directly obtained in the laboratory and instead theinformation provided by the supplier was used. Mahini hasreported some fibers rupture during test of retrofitted speci-mens. This was not observed in the finite element analysis.One likely reason could be that the supplier’s ultimate stressfor fibers does not represent the true average value. Fur-thermore, because of the inherent uncertainty in mechanicalproperties of material, the properties of tested material couldbe different from those used in the specimens. Therefore, inthis study, the accuracy of results is limited by the accuracyof the available data.Figure 15 shows the curvature diagram along the beam
based on ANSYS and VecTor2 results. The curvature dia-gram corresponds to the final stage of loading (80 mm beamtip displacement). Results show that using either SHELL41or SHELL181 would result in the same curvature distribu-tion. VecTor2 curvature diagram is lower than those ofANSYS program. Load–displacement curves shown inFigs. 12 and 14 confirm that VecTor2 results in higher postyield stiffness and accordingly lower deformations andcurvature.Mahini and Ronagh (2011) showed that FRP web bonding
is an effective way in moving the plastic hinge away fromthe column face. The finite element results in this studyconfirm that view showing that the point of maximum cur-vature is slightly away from FRP cutting point. This meansthat the plastic hinge is moved away from the column face.In both ANSYS and VecTor2, the maximum stress in FRPfibers occurs at the column face. Table 4 shows the maxi-mum FRP sheet stress obtained from these programs at the
column face. The stress in ANSYS program is based onnodal stresses in the modeled shell elements, while in Vec-Tor2 the stresses of smeared FRP layer are taken.According to Table 4, when reinforced SHELL181 ele-
ment is used, and in comparison with SHELL41 elementoption, lower stresses are resulted. This is partly is to the factthat in this case the saturant is modeled in addition to thefibers. A part of the applied load is taken by the saturant(modeled by SHELL181 element) which is used as a basefor fibers (modeled by REINF265 element). Accepting theultimate strength of 3900 MPa for FRP, the resulted stressesshow that the FRP material remains elastic. As previouslydiscussed, the available mechanical properties of CFRPsheets were provided by the supplier and Mahini did not testthe FRP sheets in the laboratory. If the true averagemechanical properties of CFRP sheets were available, thefinite element models would have been able to capture theprogressive failure of the tested specimens.For specimens CSC1 and RSC1, cyclic load is applied.
Figure 16 shows the load–displacement results based onfinite element modeling and the experiment. Four cycles areconsidered for the cyclic analysis. In the ANSYS model,Von-Mises yield criterion and tension cut-off are used forconcrete material. Furthermore, steel rebar material is akinematic hardening material. VecTor2 options for cyclicloading were discussed in the previous sections. In bothfinite element programs, FRP is modeled as a tension-onlyelastic material.The results show that both programs are capable of cap-
turing the load capacity of the test specimen in cyclicloading. However, VecTor2 results are closer to the experi-mental results. The hysteretic cycles obtained from ANSYSdo not properly display the pinching effect which is commonin response of reinforced concrete structures to cyclic loads.Pinching effect is a result of opening and closing of thecracks. On the other hand, VecTor2 results represent thepinching in the hysteretic cycles properly. Table 5 comparesthe experimental cyclic results and the finite element
Fig. 15 Comparison between curvature diagrams predicted by ANSYS and VecTor2 for the specimens RSM1 and RSM2.
152 | International Journal of Concrete Structures and Materials (Vol.8, No.2, June 2014)

predictions for different loading cycles. As can be seen, thepredicted load capacity obtained from both programs is ingood agreement with the experimental results. The areaenclosed in each hysteretic cycle is an indicator of dissipated
energy. This measure is very important in evaluating seismicperformance of structures. Because ANSYS response doesnot capture the pinching effect properly, the dissipate energyfor each cycle of loading would be different from that of real
Table 4 Maximum stress in FRP sheet (MPa).
Specimen ANSYS VecTor2
SHELL181 SHELL41
RSM1 3,456 3,891 3,811
RSM2 1,047 1,154 1,019
(a) CSC1(ANSYS-Experimental) (b) RSC1 (ANSYS-Experimental)
(c)
(e) (f)
CSC1(VecTor2-Experimental)
CSC1(ANSYS-vecTor2)
(d) RSC1(VecTor2-Experimental)
RSC1(ANSYS-VecTor2)
-30.0
-20.0
-10.0
0.0
10.0
20.0
30.0
-80.0 -60.0 -40.0 -20.0 0.0 20.0 40.0 60.0 80.0
Bea
m r
eact
ion
(kN
)
Beam tip displacement (mm)
ANSYS
Experimental
-30
-20
-10
0
10
20
30
-80 -60 -40 -20 0 20 40 60 80
Bea
m r
eact
ion
(kN
)Beam tip displacement (mm)
Experimental
ANSYS
-30.0
-20.0
-10.0
0.0
10.0
20.0
30.0
-80.0 -60.0 -40.0 -20.0 0.0 20.0 40.0 60.0 80.0
Bea
m r
eact
ion
(kN
)
Beam tip displacement (mm)
VecTor2
Experimental
-30
-20
-10
0
10
20
30
-80 -60 -40 -20 0 20 40 60 80
Bea
m r
eact
ion
(kN
)
Beam tip displacement (mm)
Experimental
VecTor2
-30.0
-20.0
-10.0
0.0
10.0
20.0
30.0
-80.0 -60.0 -40.0 -20.0 0.0 20.0 40.0 60.0 80.0
Bea
m r
eact
ion
(kN
)
Beam tip displacement (mm)
VecTor2
ANSYS
-30.00
-20.00
-10.00
0.00
10.00
20.00
30.00
-80.00 -60.00 -40.00 -20.00 0.00 20.00 40.00 60.00 80.00
Bea
m r
eact
ion
(kN
)
Beam tip displacement (mm)
ANSYS
VecTor2
Fig. 16 Comparison between load–displacement curves predicted by ANSYS and VecTor2 results for the specimens CSC1 andRSC1.
International Journal of Concrete Structures and Materials (Vol.8, No.2, June 2014) | 153
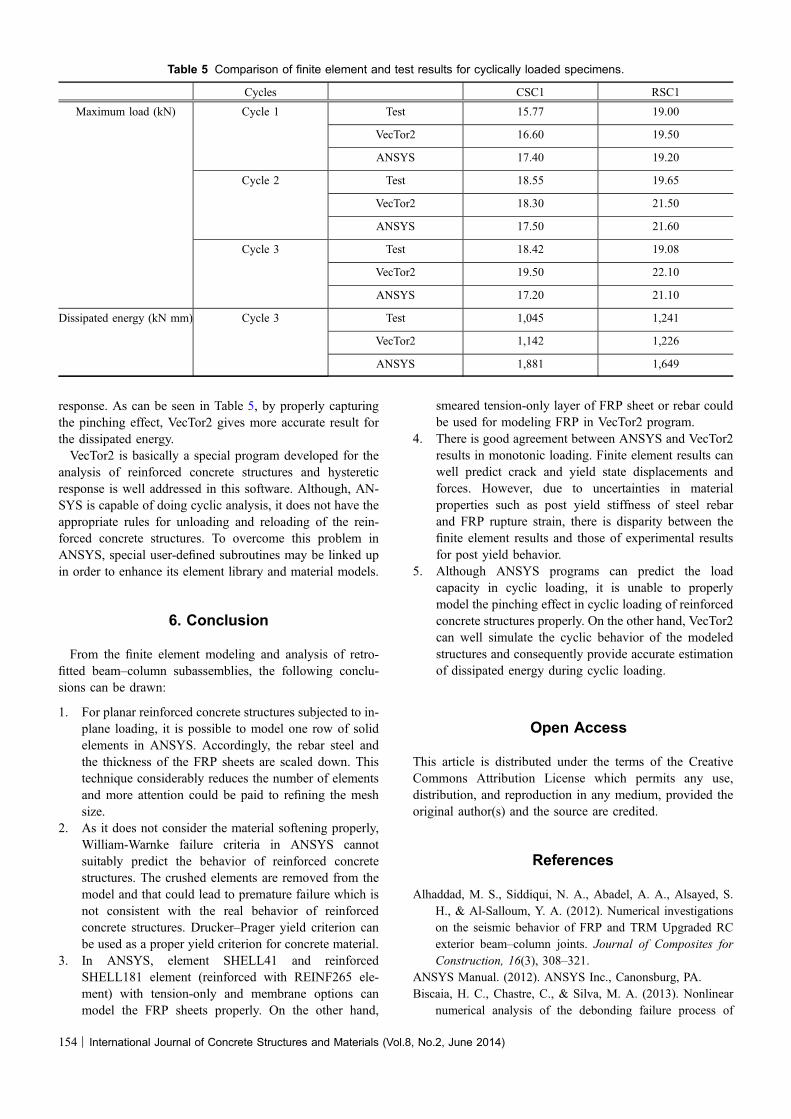
response. As can be seen in Table 5, by properly capturingthe pinching effect, VecTor2 gives more accurate result forthe dissipated energy.VecTor2 is basically a special program developed for the
analysis of reinforced concrete structures and hystereticresponse is well addressed in this software. Although, AN-SYS is capable of doing cyclic analysis, it does not have theappropriate rules for unloading and reloading of the rein-forced concrete structures. To overcome this problem inANSYS, special user-defined subroutines may be linked upin order to enhance its element library and material models.
6. Conclusion
From the finite element modeling and analysis of retro-fitted beam–column subassemblies, the following conclu-sions can be drawn:
1. For planar reinforced concrete structures subjected to in-plane loading, it is possible to model one row of solidelements in ANSYS. Accordingly, the rebar steel andthe thickness of the FRP sheets are scaled down. Thistechnique considerably reduces the number of elementsand more attention could be paid to refining the meshsize.
2. As it does not consider the material softening properly,William-Warnke failure criteria in ANSYS cannotsuitably predict the behavior of reinforced concretestructures. The crushed elements are removed from themodel and that could lead to premature failure which isnot consistent with the real behavior of reinforcedconcrete structures. Drucker–Prager yield criterion canbe used as a proper yield criterion for concrete material.
3. In ANSYS, element SHELL41 and reinforcedSHELL181 element (reinforced with REINF265 ele-ment) with tension-only and membrane options canmodel the FRP sheets properly. On the other hand,
smeared tension-only layer of FRP sheet or rebar couldbe used for modeling FRP in VecTor2 program.
4. There is good agreement between ANSYS and VecTor2results in monotonic loading. Finite element results canwell predict crack and yield state displacements andforces. However, due to uncertainties in materialproperties such as post yield stiffness of steel rebarand FRP rupture strain, there is disparity between thefinite element results and those of experimental resultsfor post yield behavior.
5. Although ANSYS programs can predict the loadcapacity in cyclic loading, it is unable to properlymodel the pinching effect in cyclic loading of reinforcedconcrete structures properly. On the other hand, VecTor2can well simulate the cyclic behavior of the modeledstructures and consequently provide accurate estimationof dissipated energy during cyclic loading.
Open Access
This article is distributed under the terms of the CreativeCommons Attribution License which permits any use,distribution, and reproduction in any medium, provided theoriginal author(s) and the source are credited.
References
Alhaddad, M. S., Siddiqui, N. A., Abadel, A. A., Alsayed, S.
H., & Al-Salloum, Y. A. (2012). Numerical investigations
on the seismic behavior of FRP and TRM Upgraded RC
exterior beam–column joints. Journal of Composites for
Construction, 16(3), 308–321.
ANSYS Manual. (2012). ANSYS Inc., Canonsburg, PA.
Biscaia, H. C., Chastre, C., & Silva, M. A. (2013). Nonlinear
numerical analysis of the debonding failure process of
Table 5 Comparison of finite element and test results for cyclically loaded specimens.
Cycles CSC1 RSC1
Maximum load (kN) Cycle 1 Test 15.77 19.00
VecTor2 16.60 19.50
ANSYS 17.40 19.20
Cycle 2 Test 18.55 19.65
VecTor2 18.30 21.50
ANSYS 17.50 21.60
Cycle 3 Test 18.42 19.08
VecTor2 19.50 22.10
ANSYS 17.20 21.10
Dissipated energy (kN mm) Cycle 3 Test 1,045 1,241
VecTor2 1,142 1,226
ANSYS 1,881 1,649
154 | International Journal of Concrete Structures and Materials (Vol.8, No.2, June 2014)

FRP-to-concrete interfaces. Composites Part B Engineer-
ing, 50, 210–223.
Bohl, A., & Adebar, P. (2011). Plastic hinge lengths in high-rise
concrete shear walls. ACI Structural Journal, 108(2),
148–157.
Drucker, D., Prager, W., & Greenberg, H. (1952). Extended
limit design theorems for continuous media. Quarterly of
Applied Mathematics, 9(4), 381–389.
El-Amoury, T. A. (2004). Seismic rehabilitation of concrete
frame beam–column joints. PhD Thesis, McMaster Uni-
versity, Ottawa, Canada, 351 pp.
Ghobarah, A., & El-Amoury, T. (2005). Seismic rehabilitation
of deficient exterior concrete frame joints. Journal of
Composites for Construction, 9(5), 408–416.
Hawileh, R. A., Naser, M. Z., & Abdalla, J. A. (2012). Finite
element simulation of reinforced concrete beams externally
strengthened with short-length CFRP plates. Composites
Part B Engineering, 45(1), 1722–1730.
Hunley, C. T., & Harik, I. E. (2012). Structural redundancy
evaluation of steel tub girder bridges. Journal of Bridge
Engineering, 17(3), 481–489.
Kachlakev, D., Miller, T., Yim, S., Chansawat, K., & Potisuk, T.
(2001). Finite element modeling of reinforced concrete
structures strengthened with FRP laminates. Final Report
SPR, 316, 2001.
Karayannis, C. G., & Sirkelis, G. M. (2008). Strengthening and
rehabilitation of RC beam–column joints using carbon-FRP
jacketing and epoxy resin injection. Earthquake Engi-
neering and Structural Dynamics, 37(5), 769–790.
Kim, S.-W., & Vecchio, F. J. (2008). Modeling of shear–critical
reinforced concrete structures repaired with fiber-reinforced
polymer composites. Journal of Structural Engineering,
134(8), 1288–1299.
Ko, M.-Y., Kim, S.-W., & Kim, J.-K. (2001). Experimental
study on the plastic rotation capacity of reinforced high
strength concrete beams. Materials and Structures, 34(5),
302–311.
Kralik, J. (2009). Seismic analysis of reinforced concrete
frame–wall systems considering ductility effects in accor-
dance to Eurocode. Engineering Structures, 31(12),
2865–2872.
Mahini, S. S. (2005). Rehabilitation of exterior RC beam–col-
umn joints using web-bonded FRP sheets. PhD Thesis,
School of Civil Engineering, The University of Queens-
land, Brisbane, Australia, 343 pp.
Mahini, S., & Ronagh, H. (2009). Numerical modelling of FRP
strengthened RC beam–column joints. Structural Engi-
neering and Mechanics, 32(5), 649–665.
Mahini, S. S., & Ronagh, H. R. (2011). Web-bonded FRPs for
relocation of plastic hinges away from the column face in
exterior RC joints.Composite Structures, 93(10), 2460–2472.
Mirmiran, A., Zagers, K., & Yuan, W. (2000). Nonlinear finite
element modeling of concrete confined by fiber composites.
Finite Elements in Analysis and Design, 35(1), 79–96.
Palermo, D., & Vecchio, F. J. (2003). Compression field mod-
eling of reinforced concrete subjected to reversed loading:
formulation. ACI Structural Journal, 100(5), 616–625.
Pantelides, C. P., Okahashi, Y., & Reaveley, L. (2008). Seismic
rehabilitation of reinforced concrete frame interior beam–
column joints with FRP composites. Journal of Composites
for Construction, 12(4), 435–445.
Parvin, A., & Granata, P. (2000). Investigation on the effects of
fiber composites at concrete joints. Composites Part B
Engineering, 31(6), 499–509.
Richart, F. E., Brandtzæg, A., & Brown, R. L. (1929). Failure of
plain and spirally reinforced concrete in compression.
Normal, IL: Illinois State University.
Rochette, P., & Labossiere, P. (1996). A plasticity approach for
concrete columns confined with composite materials. In
Second International Conference on Advanced Composite
Materials in Bridges and Structures, Montreal.
Sagbas, G. (2007). Nonlinear finite element analysis of beam–
column subassemblies. Master of Applied Science,
Department of Civil Engineering, University of Toronto,
Toronto, Canada, 182 pp.
Sagbas, G., Vecchio, F., & Christopoulos, C. (2011). Compu-
tational modeling of the seismic performance of beam–
column subassemblies. Journal of Earthquake Engineer-
ing, 15(4), 640–663.
Seckin, M. (1981). Hysteretic behaviour of cast-in-place exte-
rior beam–column-slab subassemblies. PhD thesis,
Department of Civil Engineering, University of Toronto,
Toronto, Canada, 1981, 266 pp.
Shahawy, M., Mirmiran, A., & Beitelman, T. (2000). Tests and
modeling of carbon-wrapped concrete columns. Compos-
ites Part B Engineering, 31(6), 471–480.
Shrestha, R., Smith, S. T., & Samali, B. (2013). Finite element
modelling of FRP-strengthened RC beam–column con-
nections with ANSYS. Computers and Concrete: An
International Journal, 11(1), 1–20.
Vecchio, F. (2000). Disturbed stress field model for reinforced
concrete: Formulation. Journal of Structural Engineering,
126(9), 1070–1077.
Vecchio, F., & Bucci, F. (1999). Analysis of repaired reinforced
concrete structures. Journal of Structural Engineering,
125(6), 644–652.
Vecchio, F. J., & Collins, M. P. (1986). The modified com-
pression-field theory for reinforced concrete elements
subjected to shear. ACI Journal, 83(2), 219–231.
Vecchio, F., & Shim, W. (2004). Experimental and analytical
reexamination of classic concrete beam tests. Journal of
Structural Engineering, 130(3), 460–469.
William, K. J., & Warnke, E. P. (1974). Constitutive model for
the triaxial behaviour of concrete. In Proceedings of the
International Assoc. for Bridge and Structural Engineer-
ing. Bergamo, Italy: ISMES Press.
Wong, P., & Vecchio, F. (2002). VecTor2 and FormWorks user’s
manual. Toronto, Canada: University of Toronto.
Wong, R. S. Y., & Vecchio, F. J. (2003). Towards modeling of
reinforced concrete members with externally bonded fiber-
reinforced polymer composites. ACI Structural Journal,
100(1), 47–55.
International Journal of Concrete Structures and Materials (Vol.8, No.2, June 2014) | 155