Embed Size (px)
Citation preview

19
International Journal of Concrete Structures and Materials
Vol.6, No.1, pp.19~29, March 2012
DOI 10.1007/s40069-012-0002-3
ISSN 1976-0485 / eISSN 2234-1315
Effective Punching Shear and Moment Capacity of Flat Plate-Column Connection with Shear Reinforcements for Lateral Loading
Jin-Kyu Song,1),* Jubum Kim,
2) Ho-Bum Song,
3) and Jeong-Won Song
4)
(Received September 16, 2011, Revised February 20, 2012, Accepted February 22, 2012)
Abstract: In this study, three isolated interior flat slab-column connections that include three types of shear reinforcement details;
stirrup, shear stud and shear band were tested under reversed cyclic lateral loading to observe the capacity of slab-column con-
nections. These reinforced joints are 2/3 scale miniatures designed to have identical punching capacities. These experiments showed
that the flexural failure mode appears in most specimens while the maximum unbalanced moment and energy absorbing capacity
increases effectively, with the exception of an unreinforced standard specimen. Finally, the results of the experiments, as wel l as
those of experiments previously carried out by researchers, are applied to the eccentricity shear stress model presented in ACI 318-
08. The failure mode is therefore defined in this study by considering the upper limits for punching shear and unbalanced momen t.
In addition, an intensity factor is proposed for effective widths of slabs that carry an unbalanced moment delivered by bending.
Keywords: flat plate structures, punching shear, unbalanced moment, M-V plane, shear band.
1. Introduction
Because reinforced concrete flat plate structures do not contain
beams, they are able to transfer all the loads acting on slabs
directly to the columns. At the time when the loads are transferred,
all moments that are generated by the delivery load and critical
sections that resist the moment (See Figure 1) also converge on the
slabs near the columns. When a moment is caused by a delivery
load, it is an unbalanced moment that occurs because of a direct
shear moment originating from a vertical load and eccentricity and
to the lateral load of a vertical load. In ACI 318-08,1 it is assumed
that part of an unbalanced moment (γfMunb) is transferred by
bending and that the remainder is transferred (γvMunb) by shear.
According to the eccentric shear transfer model, the shear force on
connections rises if the acting unbalanced moment increases. On
the other hand, it is assumed that the unbalanced moment strength
does not affect the punching shearing strength in terms of resis-
tance capacity, since the punching shearing strength that resists
shear force and the unbalanced moment strength that resists the
unbalanced moment are designed independently in the design cri-
teria. However, the punching shear and unbalanced moment are
interrelated in terms of the acting load as well as the resistance
strength of the member that resists them. For example, if the resis-
tance strength to the unbalanced moment increases concurrently
with an increase in the bending reinforcement ratio of the slabs
near the column, then the resistance to punching shear reduces
because the risk of damage, such as the occurrence of cracks,
decreases. In addition, if the shear reinforcing materials are
installed, not only the punching shear resistance capacity, but also
the unbalanced moment resistance and energy absorbing capacity
in the connections increases.
In ACI 318-08,1 the punching shear strength ( ) of shear
reinforcement slabs is presented as follows in Eq. 1:
(1)
In Eq. 1, Vc is the punching shear strength for concrete slabs (1/
6( )) and Vs is the punching shear strength for reinforcing
materials. In the design criteria, the maximum value of Eq. 1 is
VnPSR
VnPSR
Vc Vs+ 1/2 fckb0d( )≤=
fckb0d
1)Department of Architectural Engineering, Chonnam National
University, Gwangju 500-757, Korea.
*Corresponding Author; E-mail: jgsong@ jnu.ac.kr2)Department of Civil Engineering, Penn State Harrisburg,
Harrisburg, PA 17507, USA.3)Research Institute of Structural Engineering & System,
DongYang Structural Engineers Co., Ltd., Seoul, Korea.4)Department of Architectural Engineering, Chonnam National
University, Gwangju 500-757, Korea.
Copyright ⓒ 2012, Korea Concrete Institute. All rights reserved,
including the making of copies without the written permission of
the copyright proprietors. Fig. 1 Location of critical and effective section in flat plates.

20│International Journal of Concrete Structures and Materials (Vol.6 No.1, March 2012)
limited to 1.5 times the punching shear strength of unreinforced
slabs. However, the ACI-ASCE Committee 4216 allows the
design strength to increase when the reinforcing shear Vc is 1/4
( ) by applying a stud and the maximum value can be
increased up to 2/3( ) in Eq. 6.
On the other hand, in the design criteria, there are two types of
actions (beam action and two-way action), by dividing the slabs
into two types, long and narrow width, according to the aspect
ratio of slab β. In the case of the beam action, the maximum shear-
ing strength that concrete can resist is designed by lowering it to ½
of the punching shear strength against the two-way action. This is
necessary because it is difficult to expect an impact to occur when
two-way shear resistance is affected by the transverse restraint of
compression struts in connections between slabs and the column.
This classification of slab actions according to the aspect ratio
works mainly when gravity loads are dominant. In terms of flat
plates acting as an element of transverse resistance, if the impact
of the unbalanced moment by a transverse load is enhanced, one-
way bending behavior also appears in two way slabs. As a conse-
quence, the punching shear capacity of connections may not be
fully operated.
In Table 1, the results are examined of experiments carried out
on the transverse load of two-way slabs that have interior connec-
tions. In Row 19 of Table 1 on the shear strength ratio at the final
fckb0d
fckb0d
Table 1 Properties of test specimen.
(1) (2) (3) (4) (5) (6) (7)*1
(8)*2
(9) (10)*3
Source LabelShear
Reinforcement
fck(MPa)
(Mtest)
(kN.m)
(Vtest)
(kN)
(Vn)
(kN)
Final failure
mode
Islam & Park
(1976)5
3C None 29.7 0.23 (35.8) (177) (160) (1.00) P
6CS Stirrups 28.2 0.24 38.4 188 234 1.06 F
7CS Stirrups 29.7 0.24 41.7 202 240 1.14 F
8CS Stirrups 22.1 0.27 34.9 174 207 0.98 F
Robertson
et al. (2002)9
1C None 35.4 0.21 (58.3) (254) (260) (1.00) F/P
2CS Stirrups 31.4 0.22 68.5 288 367 1.13 F
3SL Stirrups 43.4 0.17 71.0 291 432 1.15 F
4HS Studs 38.2 0.20 67.9 286 405 1.13 F
Elgabry &
Ghali (1987)3
1 None 35.0 0.45 (130) (566) (335) (1.00) P
2 Studs 33.7 0.46 162 668 493 1.18 F
3 Studs 39.0 0.85 142 754 530 1.33 F/P
4 Studs 40.8 0.83 150 780 542 1.38 F/P
5 Studs 45.6 1.18 105 786 573 1.39 F/P
Hawkins et al.
(1989)4
9.6AH None 30.7 0.51 (97.9) (459) (369) (1.00) P
9.6EH.34 Stirrups 25.5 0.59 99.8 477 505 1.04 F
9.6EH.48 Stirrups 25.8 0.67 86.2 466 507 1.02 F
9.6AL None 28.9 0.72 (34.6) (353) (358) (1.00) F/P
9.6EL.34 Stirrups 23.4 0.90 33.3 383 483 1.08 F
9.6EL.56 Stirrups 28.5 0.97 43.1 465 533 1.32 F
14AH None 30.3 0.58 (100.2) (486) (354) (1.00) P
14EH.49 Stirrups 25.1 0.70 117.9 557 483 1.15 F
14AL None 27.0 0.95 (43.4) (441) (334) (1.00) P
14EL.49 Stirrups 26.9 1.06 44.4 479 500 1.08 F
Kang &
Wallace
(2008)7
C0 None 38.6 0.30 (103) (438) (414) (1.00) P
PS2.5 Thin plate stirrups 35.1 0.32 109 456 592 1.04 F
PS3.5 Thin plate stirrups 35.1 0.32 106 447 592 1.02 F
HS2.5 Studs 35.1 0.32 104 441 592 1.01 F
This study
(2009)
RC1 None 38.7 0.43 (81.1) (390) (361) (1.00) P
SR1 Stirrups 38.7 0.43 101.4 449 542 1.15 F
SR2 Studs 38.7 0.43 81.4 391 542 1.00 F
SR3 Bands 38.7 0.43 99.2 443 542 1.14 F
*1: Vtest=Vg+ Mtest, =Vg+ , *2: Vn= , = , *3: F - flexural failure, P - punching failure.
Vg
Vc------
MtestSR
VtestSR
VnSR Vtest
SR
Vtest----------
Vtest
Vtest----------⎝ ⎠⎛ ⎞
γvAcc
Jc------------- Vtest
SR γvAcc
Jc------------- Mtest
SR 1
3--- fckb0d Vn
SR 1
2--- fckb0d
International Journal of Concrete Structures and Materials (Vol.6 No.1, March 2012)│21
failure, the maximum shearing force is significantly less than the
maximum punching shear strength required in most design crite-
ria, with the exception of the case where the gravity load ratio on
punching shear strength is high (See Row (5) in Table 1) and
where there is no shear reinforcement. This result suggests that
flexural failure might occur due to an unbalanced moment before
the connections reach maximum shear strength, even if the correct
shear reinforcements are installed.
2. Research significance
In this study, shear governed failure and bending governed fail-
ure are defined by using an M-V plane of the unbalanced moment
and the punching shear to explain the slab-column connection
actions on the shear and unbalanced moment. Furthermore, mea-
sures are investigated to reflect the unbalanced moment strength in
determining the final punching shear strength on slabs. In addition,
the impact of shear reinforcements on punching shear strength and
unbalanced moment strength is examined and effective shear
strength and effective width enlargement factors are proposed in
order to reflect the strength improvement impact by shear rein-
forcements.
3. Unbalanced moment and punching shear
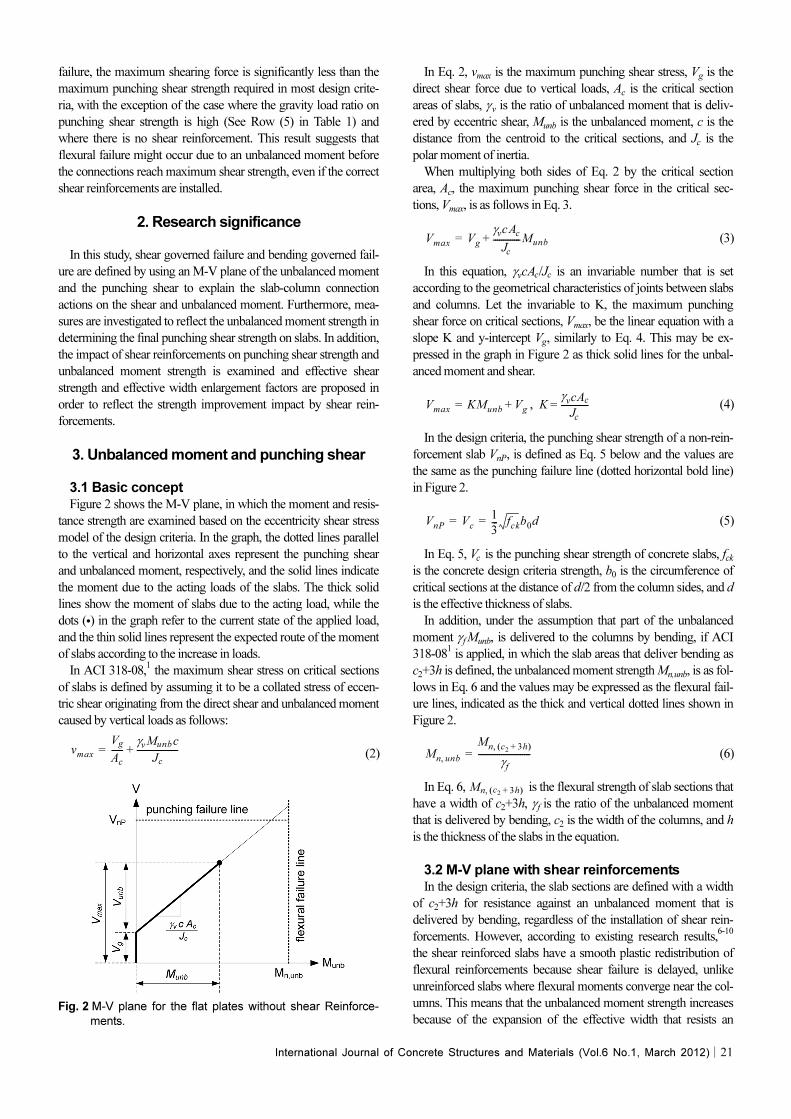
3.1 Basic conceptFigure 2 shows the M-V plane, in which the moment and resis-
tance strength are examined based on the eccentricity shear stress
model of the design criteria. In the graph, the dotted lines parallel
to the vertical and horizontal axes represent the punching shear
and unbalanced moment, respectively, and the solid lines indicate
the moment due to the acting loads of the slabs. The thick solid
lines show the moment of slabs due to the acting load, while the
dots (•) in the graph refer to the current state of the applied load,
and the thin solid lines represent the expected route of the moment
of slabs according to the increase in loads.
In ACI 318-08,1 the maximum shear stress on critical sections
of slabs is defined by assuming it to be a collated stress of eccen-
tric shear originating from the direct shear and unbalanced moment
caused by vertical loads as follows:
(2)
In Eq. 2, vmax is the maximum punching shear stress, Vg is the
direct shear force due to vertical loads, Ac is the critical section
areas of slabs, γv is the ratio of unbalanced moment that is deliv-
ered by eccentric shear, Munb is the unbalanced moment, c is the
distance from the centroid to the critical sections, and Jc is the
polar moment of inertia.
When multiplying both sides of Eq. 2 by the critical section
area, Ac, the maximum punching shear force in the critical sec-
tions, Vmax, is as follows in Eq. 3.
(3)
In this equation, γvcAc/Jc is an invariable number that is set
according to the geometrical characteristics of joints between slabs
and columns. Let the invariable to K, the maximum punching
shear force on critical sections, Vmax, be the linear equation with a
slope K and y-intercept Vg, similarly to Eq. 4. This may be ex-
pressed in the graph in Figure 2 as thick solid lines for the unbal-
anced moment and shear.
, (4)
In the design criteria, the punching shear strength of a non-rein-
forcement slab VnP, is defined as Eq. 5 below and the values are
the same as the punching failure line (dotted horizontal bold line)
in Figure 2.
(5)
In Eq. 5, Vc is the punching shear strength of concrete slabs, fckis the concrete design criteria strength, b0 is the circumference of
critical sections at the distance of d/2 from the column sides, and d
is the effective thickness of slabs.
In addition, under the assumption that part of the unbalanced
moment γfMunb, is delivered to the columns by bending, if ACI
318-081 is applied, in which the slab areas that deliver bending as
c2+3h is defined, the unbalanced moment strength Mn,unb, is as fol-
lows in Eq. 6 and the values may be expressed as the flexural fail-
ure lines, indicated as the thick and vertical dotted lines shown in
Figure 2.
(6)
In Eq. 6, is the flexural strength of slab sections that
have a width of c2+3h, γf is the ratio of the unbalanced moment
that is delivered by bending, c2 is the width of the columns, and h
is the thickness of the slabs in the equation.
3.2 M-V plane with shear reinforcementsIn the design criteria, the slab sections are defined with a width
of c2+3h for resistance against an unbalanced moment that is
delivered by bending, regardless of the installation of shear rein-
forcements. However, according to existing research results,6-10
the shear reinforced slabs have a smooth plastic redistribution of
flexural reinforcements because shear failure is delayed, unlike
unreinforced slabs where flexural moments converge near the col-
umns. This means that the unbalanced moment strength increases
because of the expansion of the effective width that resists an
vmax
Vg
Ac
------γvMunbc
Jc--------------------+=
Vmax Vg
γvcAc
Jc-------------Munb+=
Vmax KMunb Vg+= KγvcAc
Jc-------------=
VnP Vc1
3--- fckb0d= =
Mn unb,
Mn c2
3h+( ),
γf
-------------------------=
Mn c2 3h+( ),
Fig. 2 M-V plane for the flat plates without shear Reinforce-
ments.

22│International Journal of Concrete Structures and Materials (Vol.6 No.1, March 2012)
unbalanced moment when flat plate slabs are shear-reinforced.
Figure 3 demonstrates the concept of unbalanced moment strength
(Mn,unb→ ) caused by an increase in shear strength (Vnp→
) and effective width as shear reinforcements are installed, as
has been previously mentioned.
The M-V plane, as shown in Figures 2 and 3, is significantly
useful in examining slab actions because it can explain the effect
of loads acting on slabs and the resistance capacity of the moment
as well as the status of loads received by the current slabs, the
remaining load strength additionally received by the current slabs,
and the effect of shear reinforcements in the slabs. For example,
Figure 3 indicates slabs, on which act the unbalanced moment of
Munb and the maximum punching shear force of Vmax. In this
graph, the maximum punching shear force Vmax consists of a direct
shear element Vg according to vertical loads and an eccentric shear
element Vunb, due to the unbalanced moment. In Figure 2, the
punching shear and unbalanced moment strength of unreinforced
slabs are VnP and Mn,unb, respectively, while the punching shear
and unbalanced moment strength of shear reinforcement slabs are
and , respectively, as shown in Figure 3. When the
load increases continually, it is easy to estimate the final failure
mode, which is the bending governed failure and the shear gov-
erned failure, by using the M-V plane. In this plane, the bending
governed failure is defined as the case where the unbalanced
moment strength reaches maximum strength before shear strength
reaches its maximum strength; while shear governed failure is
defined as the converse case. Figure 4 is shown to explain the slab
failure mode on the M-V plane. When vertical loads on joints are
small (Vg), bending governed failure occurs on the slabs at point c
along the force line , and when vertical loads are relatively
large (V'g ), sudden shear governed failure will occur on the slabs at
d, on the force line . Meanwhile, when the geometry of joints
differs, yet the vertical loads are identical, bending governed fail-
ure such as in the force line may change into shear governed
failure such as in the force line . Consequently, the failure
mode in the slab-column joints is predicted when structures have
unexpected extreme loads and when shear reinforcement is carried
out in joints, due to the use of reinforced materials.
4. Experimental investigation
4.1 Test programA total of four, flat plate interior joints were subjected to gravity
and cyclic lateral loads. All specimens had the same configura-
tions except shear reinforcement details at the slab-column con-
nections: control specimen with no shear reinforcement (which is
denoted as RC1); stirrups (SR1); headed shear stud (SR2); and
shear bands (SR3). The specimens represented a multi-story resi-
dential building designed in accordance to ACI 318-08.1 Dead and
live loads are assumed to be 6.5 kN/m2and 3.0 kN/m
2, respec-
tively. The slabs (135 mm thick) were approximately two-thirds
scale with a bay size of 3 m × 3 m supported by a square column
of 300 mm × 300 mm as shown in Figure 5. The compressive
strength of concrete and the yield strength of reinforcement are
assumed to be 35 MPa and 400 MPa, respectively.
Table 2 shows actual material properties of the specimens. As
shown in Figure 6, the spacing of D13 top reinforcement was 100
mm in the column strip, providing 1.11% reinforcement ratio,
while the spacing was approximately 200 mm in middle strip
(0.52% reinforcement ratio). Bottom reinforcement was spaced at
approximately 150 mm throughout and two bars passed through
the column to satisfy the structural integrity requirement of ACI
code. The minimum cover was 15 mm. The column consisted of
8-D29 longitudinal reinforcement and D13 stirrups at 100 mm
spacing.
All specimens with shear reinforcement (SR series) were
designed to have nominally the same punching shear capacity and
50% greater than that of the control specimen RC1.
The reinforcing interval and the width of stirrups are in accor-
dance with the design criteria of ACI 318-08.1 With the exception
of stirrups, there are no design criteria for other reinforcing materi-
als. Therefore, the study results obtained by K. Pilakoutas and X.
li8 and the ACI Committee 421
6 were referred to for the shear
band design and stud design, respectively.
The details of shear reinforcement are explained in Figure 7.
SR1 is fabricated from a closed stirrup by using Ø6 circle rein-
forcements, while seven stirrups were placed on each side of the
Vn unb,SR
VnPSR
VnPSR
Mn unb,SR
oac
obd
oac
oae
Fig. 3 M-V plane for the flat plates with shear reinforcements.
Fig. 4 Various conditions that affect failure modes for the flat
plates.

International Journal of Concrete Structures and Materials (Vol.6 No.1, March 2012)│23
columns at 45 mm intervals. SR2 is fabricated from stud rails by
welding seven Ø10-stud bolts onto a steel rail at 52 mm intervals,
placed in two rows on each side of the columns. For SR3, holes
were drilled regularly on 30 mm wide and 3 mm thick band style
steel and bend reinforcement materials at 50 mm intervals between
vertical areas were placed on each side of the columns in three
rows.
Specimens are installed as shown in Figures 8 and 9. The lower
parts of the columns in the specimens are fabricated to be hinged
and a 3000 kN vertical load cell is installed between the hinge and
oil pressure jack for vertical loads. By connecting the hinges that
support the columns with right and left base plates by a restraining
arm, the horizontal movement in the lower part of the hinge in the
columns is restrained. For an actuator, 500 kN was connected to
the upper part of the columns and repeated vertical loads of the
north and south directions were added. At the ends of the slabs,
three vertical links on the south and north directions were installed
and by connecting pins to both ends of the vertical links, the hori-
zontal movements and turns have freedom of movement. At the
ends of the slabs on the west and east directions, guide rails were
installed in order to prevent twisting of the specimens during the
experimental process of vertical loads. To measure the responses
of the strength and displacement capacity of specimens, two load
cells and six displacement cells were installed. In the upper and
lower parts of each specimen, twenty strain gauges were attached,
with ten strain gauges in shear reinforcement. The strain gauges
measure the deformation of flexural reinforcement and shear rein-
forcing materials. Experiments are carried out according to the
gravity loading stage and vertical loading stage. For the gravity
load, displacement loads are added by using an oil pressure jack
that is installed at the lower part of the columns. A vertical load is
Fig. 5 Test specimens (unit: mm).
Table 2 Published tests of interior slab-column connection subjected to V and M.
Specimen
Compressive
strength of
concrete
Yield strength of steelColumn
size
C1, C2
(mm)
Slab length
l1, l2 (mm)
Slab
thickness
t (mm)
Effective
depth of
slab d (mm)
Steel ratio
Type of
shear reinforce-
mentfck (MPa)
Flexural
reinforce-
ments
fy (MPa)
Shear rein-
forcements
fvy (MPa)
Top bar
ρtop (%)
Bottom bar
ρbottom (%)
RC1 38.7 449 - 300 3,000 135 113.5 1.06 0.79 Unreinforced
SR1 38.7 449 631 300 3,000 135 113.5 1.06 0.79 Stirrup
SR2 38.7 449 500 300 3,000 135 113.5 1.06 0.79 Shear stud
SR3 38.7 449 346 300 3,000 135 113.5 1.06 0.79 Shear band
Fig. 6 Placements of top and bottom bars.

24│International Journal of Concrete Structures and Materials (Vol.6 No.1, March 2012)
monotonously added until it reaches 40% of the nominal punch-
ing strength (=1/3 ) of slabs. After the vertical load
reaches the targeted value, all the measurement instruments are
initialized. The history of repeated lateral loads is repeatedly added
using the displacement control method according to the displace-fckb0d( )
Fig. 7 Placements and details of the shear reinforcements (unit: mm).
Fig. 8 Installation of test specimen.
Fig. 9 Photo of set up after installation.
International Journal of Concrete Structures and Materials (Vol.6 No.1, March 2012)│25
ment ratio between stories of a load acting point by using an actu-
ator connected to the upper part of the columns (see Figure 10).
While repeated lateral load experiments are operating, we main-
tain the gravity load ratio on the joints at a certain level by control-
ling the camber load.
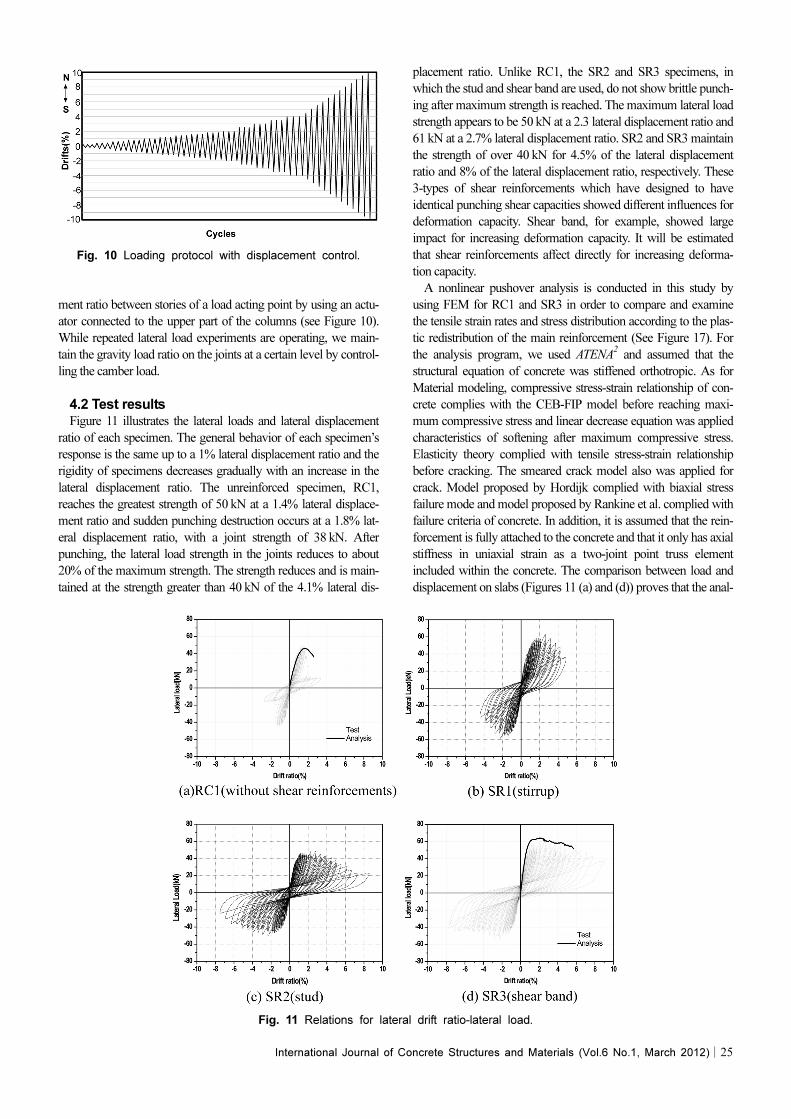
4.2 Test resultsFigure 11 illustrates the lateral loads and lateral displacement
ratio of each specimen. The general behavior of each specimen’s
response is the same up to a 1% lateral displacement ratio and the
rigidity of specimens decreases gradually with an increase in the
lateral displacement ratio. The unreinforced specimen, RC1,
reaches the greatest strength of 50 kN at a 1.4% lateral displace-
ment ratio and sudden punching destruction occurs at a 1.8% lat-
eral displacement ratio, with a joint strength of 38 kN. After
punching, the lateral load strength in the joints reduces to about
20% of the maximum strength. The strength reduces and is main-
tained at the strength greater than 40 kN of the 4.1% lateral dis-
placement ratio. Unlike RC1, the SR2 and SR3 specimens, in
which the stud and shear band are used, do not show brittle punch-
ing after maximum strength is reached. The maximum lateral load
strength appears to be 50 kN at a 2.3 lateral displacement ratio and
61 kN at a 2.7% lateral displacement ratio. SR2 and SR3 maintain
the strength of over 40 kN for 4.5% of the lateral displacement
ratio and 8% of the lateral displacement ratio, respectively. These
3-types of shear reinforcements which have designed to have
identical punching shear capacities showed different influences for
deformation capacity. Shear band, for example, showed large
impact for increasing deformation capacity. It will be estimated
that shear reinforcements affect directly for increasing deforma-
tion capacity.
A nonlinear pushover analysis is conducted in this study by
using FEM for RC1 and SR3 in order to compare and examine
the tensile strain rates and stress distribution according to the plas-
tic redistribution of the main reinforcement (See Figure 17). For
the analysis program, we used ATENA2 and assumed that the
structural equation of concrete was stiffened orthotropic. As for
Material modeling, compressive stress-strain relationship of con-
crete complies with the CEB-FIP model before reaching maxi-
mum compressive stress and linear decrease equation was applied
characteristics of softening after maximum compressive stress.
Elasticity theory complied with tensile stress-strain relationship
before cracking. The smeared crack model also was applied for
crack. Model proposed by Hordijk complied with biaxial stress
failure mode and model proposed by Rankine et al. complied with
failure criteria of concrete. In addition, it is assumed that the rein-
forcement is fully attached to the concrete and that it only has axial
stiffness in uniaxial strain as a two-joint point truss element
included within the concrete. The comparison between load and
displacement on slabs (Figures 11 (a) and (d)) proves that the anal-
Fig. 10 Loading protocol with displacement control.
Fig. 11 Relations for lateral drift ratio-lateral load.

26│International Journal of Concrete Structures and Materials (Vol.6 No.1, March 2012)
ysis results correctly predict the results of experiments.
Figure 12 shows a comparison of the hysteresis loop of each
specimen. The strength and displacement capacity of specimens
using shear reinforcement increases significantly compared to that
of the unreinforced specimen. SR3, where shear band was used,
showed high lateral displacement compared to other reinforced
joints.
Figure 13 shows the crack patterns after the addition of the final
force on the unreinforced specimen. An examination is carried out
each time the repeated lateral displacement ratio cycle ends after
the addition of gravity load. Cracks in each specimen occur due to
the process of gravity load addition and the crack patterns are dis-
tinctly similar up to about a 1.8% lateral displacement ratio load.
Brittle punching failure appears at a 1.8% lateral displacement
ratio in the RC1 specimen and punching shear is formed at a dis-
tance of about 300 mm~550 mm (about 2.5d~5.0d) from the col-
umns in the upper part of the slabs. The crack spread in reinforced
specimens appears continually even after a 1.8% lateral displace-
ment ratio, while at the final stage, crack damage in the reinforced
specimens is considerable, compared to the unreinforced speci-
men, RC1.
5. Strength estimation according to failure mode
5.1 Effective punching shear strength in flex-
ural failure modeFigure 14 shows the results of experiments of a vertical load or
combined vertical and lateral loading on existing flat plates. The
results of vertical loading are taken from an analysis of the experi-
ments carried out by Keefe(1954), Franz(1963), Marti et al.(1977),
Muller et al.(1977), Muller et al.(1984), Chana & Desai(1991),
Yamada et al.(1992), and Beutel & Hegger(1998), recorded in the
International Federation for Structural Concrete (fib) Report10
and
the results of lateral load are taken from the analysis of experi-
ments obtained by Islam & Park(1976),5 Robertson et al.(2002),
9
Elgabry & Ghali(1987),3 Hawkins et al.(1989),
4 and Kang & Wal-
lace(2008),7 for this study (see Table 1).
In Figure 14, the horizontal axis shows the maximum punching
shear stress calculated by using Eq. 2 and the vertical axis shows
the punching shear strength rate of shear reinforcement specimens
compared to the unreinforced specimen. As can be seen in the
graph, when only direct shear occurs due to vertical load (□), theaverage shear strength rate of shear reinforcement against the
unreinforced specimen is 1.63. On the other hand, when eccentric
shear due to a lateral load is combined with direct shear (▼), theaverage shear strength ratio is 1.15, which is a significantly lower
value than when only a lateral load operates. Considering the
results of the analysis according to the unbalanced moment and
punching shear on the M-V plane, when only the vertical load
operates, the slabs act along the moment line of , and when it
reaches punching failure strength , it will face shear failure.
oab
VnPSR
Fig. 12 Envelope curve of the specimens.
Fig. 13 Crack pattern of the specimens.
Fig. 14 Punching shear strength ratio of flat plates with and
without shear reinforcements.
International Journal of Concrete Structures and Materials (Vol.6 No.1, March 2012)│27
However, if the lateral load combines with the vertical load, the
slabs act along the moment line , and before reaching ,
the lateral load can initially reach . When the slabs reach
the maximum unbalanced moment strength, shear strength can no
longer be effective and failure may occur at the effective shear
strength . As a result, slabs that undergo bending governed
failure may experience failure at a much lower effective shear
strength VnF than either or 1.5VnP. During this process, the
unbalanced moment strength affects the effective shear strength.
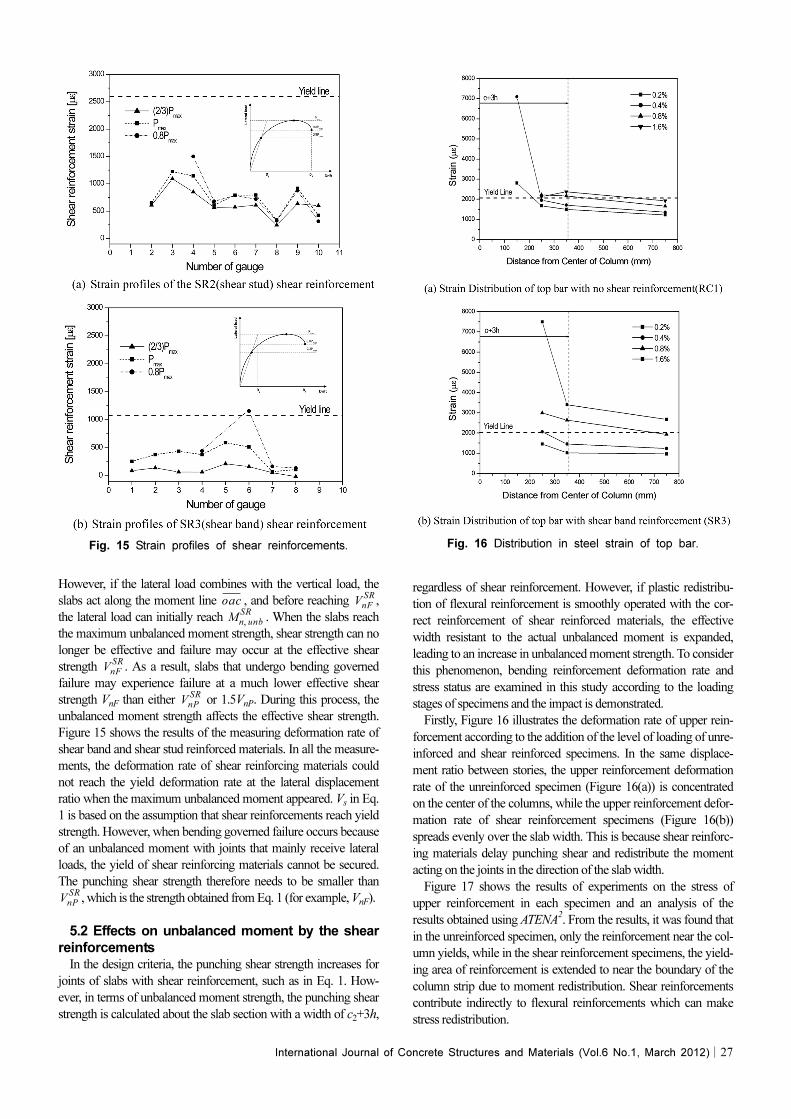
Figure 15 shows the results of the measuring deformation rate of
shear band and shear stud reinforced materials. In all the measure-
ments, the deformation rate of shear reinforcing materials could
not reach the yield deformation rate at the lateral displacement
ratio when the maximum unbalanced moment appeared. Vs in Eq.
1 is based on the assumption that shear reinforcements reach yield
strength. However, when bending governed failure occurs because
of an unbalanced moment with joints that mainly receive lateral
loads, the yield of shear reinforcing materials cannot be secured.
The punching shear strength therefore needs to be smaller than
, which is the strength obtained from Eq. 1 (for example, VnF).
5.2 Effects on unbalanced moment by the shear
reinforcementsIn the design criteria, the punching shear strength increases for
joints of slabs with shear reinforcement, such as in Eq. 1. How-
ever, in terms of unbalanced moment strength, the punching shear
strength is calculated about the slab section with a width of c2+3h,
regardless of shear reinforcement. However, if plastic redistribu-
tion of flexural reinforcement is smoothly operated with the cor-
rect reinforcement of shear reinforced materials, the effective
width resistant to the actual unbalanced moment is expanded,
leading to an increase in unbalanced moment strength. To consider
this phenomenon, bending reinforcement deformation rate and
stress status are examined in this study according to the loading
stages of specimens and the impact is demonstrated.
Firstly, Figure 16 illustrates the deformation rate of upper rein-
forcement according to the addition of the level of loading of unre-
inforced and shear reinforced specimens. In the same displace-
ment ratio between stories, the upper reinforcement deformation
rate of the unreinforced specimen (Figure 16(a)) is concentrated
on the center of the columns, while the upper reinforcement defor-
mation rate of shear reinforcement specimens (Figure 16(b))
spreads evenly over the slab width. This is because shear reinforc-
ing materials delay punching shear and redistribute the moment
acting on the joints in the direction of the slab width.
Figure 17 shows the results of experiments on the stress of
upper reinforcement in each specimen and an analysis of the
results obtained using ATENA2. From the results, it was found that
in the unreinforced specimen, only the reinforcement near the col-
umn yields, while in the shear reinforcement specimens, the yield-
ing area of reinforcement is extended to near the boundary of the
column strip due to moment redistribution. Shear reinforcements
contribute indirectly to flexural reinforcements which can make
stress redistribution.
oac VnFSR
Mn unb,SR
VnFSR
VnPSR
VnPSR
Fig. 15 Strain profiles of shear reinforcements. Fig. 16 Distribution in steel strain of top bar.

28│International Journal of Concrete Structures and Materials (Vol.6 No.1, March 2012)
To reflect this phenomenon in a structural design, an effective
width enlargement factor λ is introduced in this study, which
applies the effective width of slabs by expanding, depending on
the installation of shear reinforcing materials. When we apply an
effective width enlargement factor, the effective width of shear
reinforcement slabs becomes λ(c2+3h) by multiplying the effec-
tive width of unreinforced slabs that is defined by the structural
design criteria by the enlargement factor. Nevertheless, the unbal-
anced moment strength in the shear reinforcement joint is
as follows in Eq. 7.
(7)
In this equation, is the flexural strength of the slab
section, with a width of λ(c2+3h).
5.3 Verification of failure modeIn the experiment for the lateral load of slab-column joints, if
the existing study results (Table 1) obtained from a test performed
for an unreinforced specimen and the shear reinforced specimens
are examined simultaneously, Vg/Vc (Row 5) is the size of the act-
ing vertical load on punching shear strength of unreinforced slabs
(Eq. 5). (Row 6) and (Row 7) are the results of the
experiment carried out on unbalanced moment and punching
shear. In addition, Row 9 shows the shear strength ratio in the rein-
forcement joints against the shear strength of unreinforced joints.
If these values and normalized values of the unbalanced moment
in Row 6 are compared with the results of the unreinforced speci-
men in the lateral shear stress model, an equation can be obtained
as follows:
(8)
However, Eq. 8 does not consider the changes of critical sec-
tions according to shear reinforcement.
Figures 18 and 19 illustrate the results of experiments carried
out in this study that is defined by using Eq. 8 and the findings
from Table 1. In Figure 18, it can be seen that the specimens did
not reach the maximum punching shear force, but experienced
flexural failure. From this result, we can determine the maximum
capacity of the effective punching shear considering the flexural
failure mode from the unbalanced moment. Figure 19 shows the
relative increase in the maximum unbalanced moment according
to shear reinforcement against unreinforced joints. The behavior
of shear reinforced materials differs on the nominal unbalanced
moment capacity, yet it increases 12% on average. If this result is
explained by the plastic redistribution of flexural reinforcement by
shear reinforcement, the effective width enlargement factor λ to
define the unbalanced moment strength in Eq. 7 is 1.12.
6. Conclusions
In this study, the unbalanced moment-punching shear is defined
on M-V plane applying the eccentricity shear stress model pre-
sented in ACI 318-08, and the capacity of slab-column connec-
tions are studied employing tests about four isolated interior flat
slab-column connections under reversed cyclic lateral loading.
The following conclusions may be drawn from the present study:
1. These experiments show that the flexural failure mode
appears in most specimens with the exception of an unreinforced
standard specimen. Installing the correct shear reinforcement may
Mn unb,SR
Mn unb,SR
Mn λ c2
3h+( ),
γf
----------------------------=
Mn λ c2
3h+( ),
MtestSR
VtestSR
VtestSR
Vtest
----------⎝ ⎠⎜ ⎟⎛ ⎞ Vg
Vtest
----------⎝ ⎠⎛ ⎞ γvAcc
Jc-------------⎝ ⎠⎛ ⎞ Mtest
Vtest
------------⎝ ⎠⎛ ⎞ Mtest
SR
Mtest
------------⎝ ⎠⎜ ⎟⎛ ⎞
+=
Fig. 17 Distribution in bar stresses at peak load. Fig. 18 Graphic representation between unbalanced moment
and punching shear for normalized test results.
Fig. 19 Enlargement of unbalanced moment of the flat plate
connections with shear reinforcements.

International Journal of Concrete Structures and Materials (Vol.6 No.1, March 2012)│29
improve the seismic capacity of flat plate connections.
2. These experiments showed that the unbalanced moment
strength as well as punching shear strength increase by the shear
reinforcement for joint of slab. This is caused by the expanded
range resistant to the unbalanced moment, which is due to the
plastic redistribution of flexural stress by the shear reinforcement.
To reflect the effect, it is proposed that the effective width enlarge-
ment factor (λ) is 1.12.
3. The unbalanced moment and punching shear relation pro-
posed in this paper will be useful for defining capacity of effective
punching shear strength and designing flat plate slab-column con-
nection.
Acknowledgements
This study was financially supported by Chonnam National
University, 2008.
References
1. ACI Committee 318, Building Code Requirements for Struc-
tural Concrete(ACI 318-08) and Commentary(ACI-318R-08),
American Concrete Institute, Farmington Hills, MI, 2008.
2. Atena, ATENA Program Documentation, Cervenka Con-
sulting, Czech Republic, 2000.
3. Elgabry, A. A. and Ghali, A., “Tests on Concrete Slab-Col-
umn Connections with Stud-Shear Rein- cement Subjected to
Shear-Moment Transfer,” ACI Structural Journal, Vol. 84, No. 5,
1987, pp. 433~442.
4. Hawkins, N. M., Bao, A., and Yamazaki, J., “Moment Trans-
fer form Concrete Slabs to Column,” ACI Structural Journal, Vol.
86, No. 6, 1989, pp. 705~716.
5. Islam, S. and Park, R., “Tests on Slab-Column Connections
with Shear and Unbalanced Flexure,” Journal of the Structure
Division, Vol. 102, No.3, 1976, pp. 549~568.
6. Joint ACI-ASCE Committee 421, Shear Reinforcement for
Slabs, American Concrete Institute, Farmington Hills, MI, 1999.
7. Kang, T. H.-K. and Wallace, J. W., “Seismic Performance
of Reinforced Concrete Slab-Column Connections with Thin
Plate Stirrups,” ACI Structural Journal, Vol. 105, No.5, 2008,
pp. 617~625.
8. Pilakoutas, K. and Li, X. “Alternative Shear Reinforcement
for Reinforced Concrete Flat Slabs.” Journal of Structural Engi-
neering, Vol. 129, No.9, 2003, pp. 1164~1172.
9. Robertson, I. N., Kawai, T., Lee, J., and Enomoto, B.,
“Cyclic Testing of Slab-Column Connections with Shear Rein-
forcement,” ACI Structural Journal, Vol. 99, No.5, 2002, pp.
605~613.
10. The CEB/fib Task Group, Punching of Structural Con-
crete Slabs, International Federation for Structural Concrete(fib),
Lausanne, Switzerland, 2001.