Embed Size (px)
Citation preview

Vol. No. 11 Issue No. 7 January 2014
2 January 2014 Intouchmutually
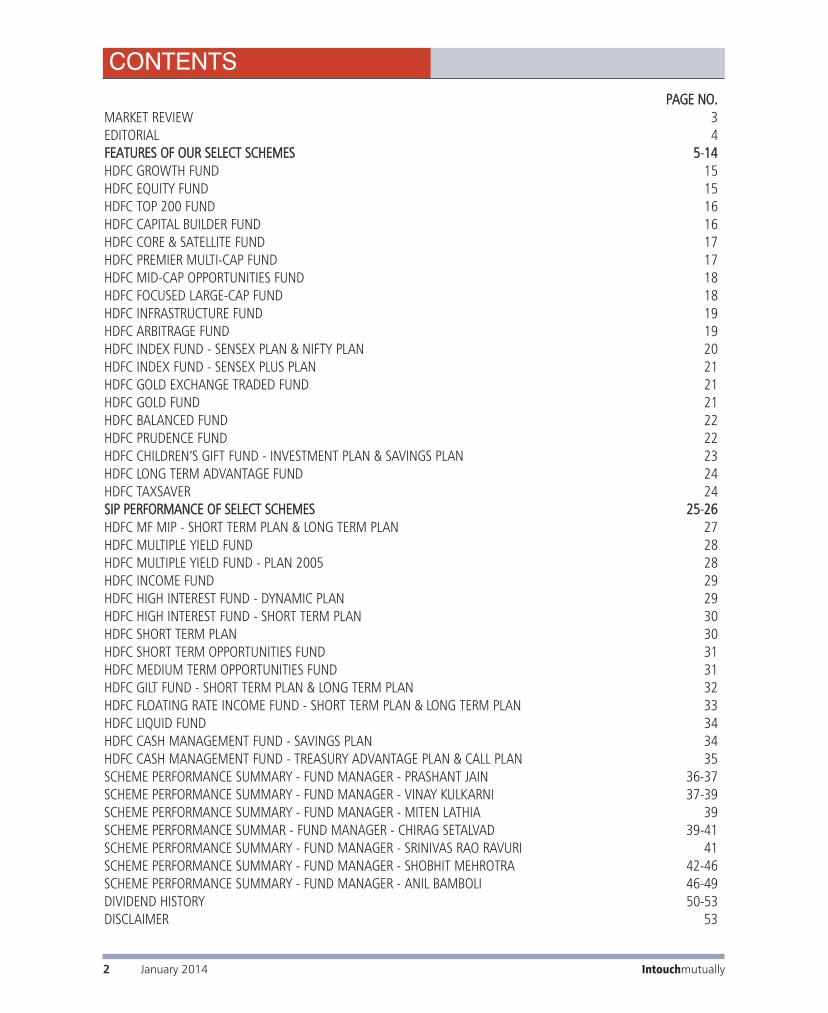
PPAAGGEE NNOO..MARKET REVIEW 3EDITORIAL 4FFEEAATTUURREESS OOFF OOUURR SSEELLEECCTT SSCCHHEEMMEESS 55-1144HDFC GROWTH FUND 15HDFC EQUITY FUND 15HDFC TOP 200 FUND 16HDFC CAPITAL BUILDER FUND 16HDFC CORE & SATELLITE FUND 17HDFC PREMIER MULTI-CAP FUND 17HDFC MID-CAP OPPORTUNITIES FUND 18HDFC FOCUSED LARGE-CAP FUND 18HDFC INFRASTRUCTURE FUND 19HDFC ARBITRAGE FUND 19HDFC INDEX FUND - SENSEX PLAN & NIFTY PLAN 20HDFC INDEX FUND - SENSEX PLUS PLAN 21HDFC GOLD EXCHANGE TRADED FUND 21HDFC GOLD FUND 21HDFC BALANCED FUND 22HDFC PRUDENCE FUND 22HDFC CHILDREN’S GIFT FUND - INVESTMENT PLAN & SAVINGS PLAN 23HDFC LONG TERM ADVANTAGE FUND 24HDFC TAXSAVER 24SSIIPP PPEERRFFOORRMMAANNCCEE OOFF SSEELLEECCTT SSCCHHEEMMEESS 2255-2266HDFC MF MIP - SHORT TERM PLAN & LONG TERM PLAN 27HDFC MULTIPLE YIELD FUND 28HDFC MULTIPLE YIELD FUND - PLAN 2005 28HDFC INCOME FUND 29HDFC HIGH INTEREST FUND - DYNAMIC PLAN 29HDFC HIGH INTEREST FUND - SHORT TERM PLAN 30HDFC SHORT TERM PLAN 30HDFC SHORT TERM OPPORTUNITIES FUND 31HDFC MEDIUM TERM OPPORTUNITIES FUND 31HDFC GILT FUND - SHORT TERM PLAN & LONG TERM PLAN 32HDFC FLOATING RATE INCOME FUND - SHORT TERM PLAN & LONG TERM PLAN 33HDFC LIQUID FUND 34HDFC CASH MANAGEMENT FUND - SAVINGS PLAN 34HDFC CASH MANAGEMENT FUND - TREASURY ADVANTAGE PLAN & CALL PLAN 35SCHEME PERFORMANCE SUMMARY - FUND MANAGER - PRASHANT JAIN 36-37SCHEME PERFORMANCE SUMMARY - FUND MANAGER - VINAY KULKARNI 37-39SCHEME PERFORMANCE SUMMARY - FUND MANAGER - MITEN LATHIA 39SCHEME PERFORMANCE SUMMAR - FUND MANAGER - CHIRAG SETALVAD 39-41SCHEME PERFORMANCE SUMMARY - FUND MANAGER - SRINIVAS RAO RAVURI 41SCHEME PERFORMANCE SUMMARY - FUND MANAGER - SHOBHIT MEHROTRA 42-46SCHEME PERFORMANCE SUMMARY - FUND MANAGER - ANIL BAMBOLI 46-49DIVIDEND HISTORY 50-53DISCLAIMER 53
CONTENTS

After ending year 2013 on a positive note, theequity markets corrected during January.The S&P BSE SENSEX and Nifty were
down 3.10% and 3.40% respectively. Midcapsunder performed with the CNX Midcap Indexdown 6.58%. IT and Healthcare sectors performedwell while Banking, Infra, Metals, Capital goods,Oil & Gas and FMCG sectors were laggards.
The INR depreciated by 1.40% in January.FII’s bought US$0.12 bn of Indian equities inJanuary. In the calendar year 2013, FII’s hadinvested US$20.1 bn.
The US Federal Open Market Committee(FOMC) in its first meeting in CY 2014 furtherreduced the asset purchase program by USD 10bnto USD 65bn per month. The committee hadtapered the asset purchase program by USD 10bnin December 2013. The FOMC reiterated thatasset purchases are not on a preset course and pacewill depend on the Committee’s outlook for labormarket and inflation.
During the month, the Dow Jones was down5.30% and the NASDAQ by 1.74%. In Europe,the DAX was down by 2.57%, FTSE down by
3.54% and CAC by 3.03%. Asian markets alsofared poorly with Nikkei being the worst per-former (down by 8.45%). The Shanghai, HangSeng and Kospi indices were down 3.92%, 5.45%and 3.49%.
On the commodities front, most prices weredown during the month. Aluminium, Lead, Zincand Copper were down almost 4-5%, howeverGold was up 3.57%. Crude fell by 3.74% duringthe month and crude prices are now lower thanFY13 average.
The S&P BSE SENSEX currently trades at a PEof 13-14x one-year forward earnings. Third Quarterof FY14 earnings so far have been better than expec-tations. FMCG stocks earnings have been belowexpectations generally. In our opinion, earningsdowngrade cycle is over and earnings estimates arewitnessing upgrades. Past data suggests that invest-ments in equities made in low P/E markets (say aP/E below 15) have done well over 3-5 years. In ouropinion therefore, this is a time to increase alloca-tion to equities (for those with a medium to longterm view) in a phased manner to reduce volatilityin the short term and stay invested.
Equity market update
During the month of January 2014, the yieldon 10-year benchmark Government bond(8.83% GoI 2023) ended at 8.73 % as
against 8.82% at the end of December 2013.The liquidity availed through various sources
(Liquidity Adjustment Facility, export refinance,marginal standing facility and term repos) fromRBI during the month was higher at ` 147,723 crsas compared to ` 115,167 crs in December 2013.The NSE overnight MIBOR ended at 8.12%, lowerthan the rate seen in end December 2013 (9.07%).
The annual rate of inflation, based on monthlyWPI, stood at 6.16% (provisional) for the month ofDecember 2013 (over December 2012) as com-pared to 7.52% (provisional) for the previousmonth and 7.31% during the corresponding monthof the previous year.
The INR depreciated to 62.66 against the USdollar as compared to 61.80 at the end of previousmonth, a loss of about 1.4% for the month. The netFII investments in equities & debt was an inflow ofUSD 2.2 billion in January 2014 as compared to aninflow of USD 3.5 billion in December 2013.
In the Third Quarter review of Monetary Policy2013-14, as against consensus expectations of no
change in rates, RBI surprisingly increased policyrepo rate by 25bps from 7.75% to 8.00%. In its guid-ance, RBI stated that “The extent and direction offurther policy steps will be data dependent, though ifthe disinflationary process evolves according to thisbaseline projection, further policy tightening in thenear term is not anticipated at this juncture.”
During the last moth RBI released the Dr. UrjitPatel Committee report on strengthening the mone-tary policy framework in India. The key recom-mendation of the report is that headline ConsumerPrice Inflation (CPI) should be the nominal anchorfor monetary policy. The report recommended thatbringing CPI down to 8% in the next one year andto 6% in two years before finally committing to atarget of 4% with a corridor of +/- 2%
OutlookGiven the improving fiscal deficit, low CAD andfalling inflation, chances are, current rate hike is thelast hike. In our opinion, Dr. Urjit Patel committeerecommendations make a strong case for achievingmeaningfully lower inflation and consequentlylower bond yields in the medium term, thoughexact timing is uncertain.
Debt market update
January 2014 3Intouchmutually
Market Review - January 2014
Source for various data points: Bloomberg, Reuters, www.sebi.gov.in, www.rbi.org.in and Central Statistics Office (CSO).

As learning moves out of the four wallsof the classroom, travel companies aremaking the most of the opportunity.
You could bike across Coorg, go star-gazingin astronomy camps or visit villages and takepart in local projects, master the arts of kite-flying and photography while on a camp in
Uttarakhand, or take nature walks and learn topreserve the environment. The idea is not justlimited to sight-seeing but also extends tobuilding life skills such as leadership, team-work and innovation.
Education tourism, though still at a nascentstage in India, is seeing both new and estab-lished players coming up with strategies tograb a bigger share of the pie. At one leadingleisure travel company, for instance, this seg-ment alone contributes over 35 per cent to rev-enues. The company expects this “recession-proof” tourism segment to be its biggestgrowth driver, and is looking at 60 per cent ofits revenue coming from education tourism inanother two years.
“Schools now have included field trips aspart of their curriculum. The response fromparents has been very positive and schools areencouraged by this phenomenon,” says a sen-ior official of this company. The companyacquired a United Kingdom-based specialisteducation tour company in 2012 to transformitself from a tour operator to an education spe-cialist. It now plans to roll out its programmesin Australia too.
Alongside established players, specialisedadventure-based camping tour companieshave found a niche market catering to around15,000 children and 30 schools. “The idea ofthis segment is to present what lies beyondthe classroom through experiential learningprogrammes, industrial tours, adventure trips, university visits, language courses andexchange programmes. Hence, the focus ofinterest for an individual can be recreational,educational, or even a combination of thetwo,” says the director of an adventure-basedcamping tour company.
The company’s strategy is to strike part-nerships with schools and educational insti-tutes for conducting “life skills-driven, focusedprogrammes” for children in the age group ofnine to 17 years, across key locations in India.“The concept of education tourism is growingin other parts of the world,” says the execu-
tive, adding that the concept is taking off inIndia too.
The cost of packages starts at `18,000 ahead and can go up to a few lakhs, dependingupon the destination and activities undertaken.In India the concept is still just limited to met-ros in the upper strata of the society, a seniortravel company executive said.
The spokesman of another company thatoffers educational tours says that studying canbe a pleasure, and that tourism is one of themost attractive methods of imparting educa-tion to young minds. The company uses itseducational tours to teach some of the mostvaluable lessons of life to students. It promotesactivities in which leadership skills, team spir-it, impromptu decision making, time manage-ment and self-confidence are put to the test.
The company offers yoga training tours (ata reputed yoga institute), Hindi languagelearning tours (at a reputed language insti-tute), dance training tours (at a renowneddance institute or under a prominent danceguru), and ‘professional’ tours for social sci-ence students, management students, law stu-dents, information technology students, engi-neering students and medical students. Thetour for engineering students includes a visit toa leading engineering institution; a meetingwith a distinguished engineer or an eminentprofessor; and a visit to a prominent engineer-ing organization or company and a factory.Tours for medical students include a visit to aleading medical institution; a meeting with aprominent medical practitioner; and a visit to aspecialised medical facility. Interestingly, ayoga teacher accompanies the studentsthroughout the programmes, which are of onemonth’s duration.
Educational tours, says an executive of aneducational services and solutions provider,introduce students to new experiences, teach-ing and learning techniques, people andlifestyles; they help them make critical decisions such as whether to study abroadand if so, where. The tours treat every desti-nation as an opportunity to contribute to thelearning experience.
B S REPORTER
This article is issued in general investor interest.
Please refer Page No. 53 for disclaimer.
Education tourism
Intouchmutually4 January 2014
Intouchmutually January 2014 5
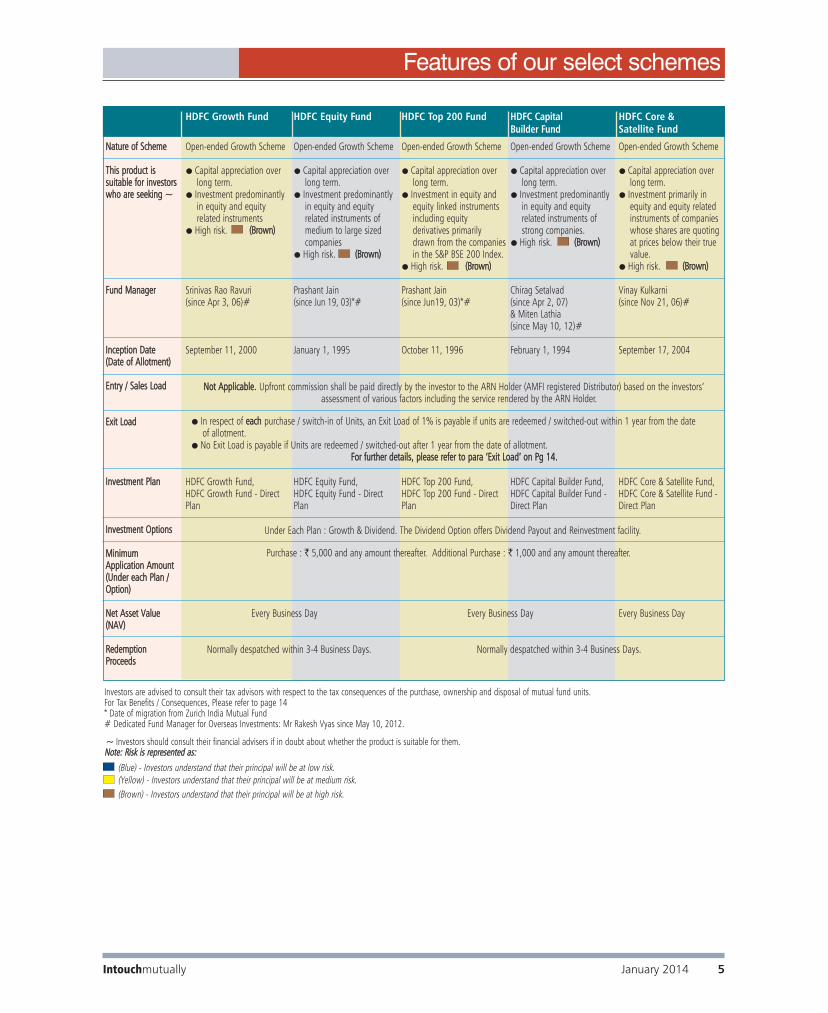
NNaattuurree ooff SScchheemmee
TThhiiss pprroodduucctt iiss ssuuiittaabbllee ffoorr iinnvveessttoorrsswwhhoo aarree sseeeekkiinngg ~~
FFuunndd MMaannaaggeerr
IInncceeppttiioonn DDaattee((DDaattee ooff AAlllloottmmeenntt))
EEnnttrryy // SSaalleess LLooaadd
EExxiitt LLooaadd
IInnvveessttmmeenntt PPllaann
IInnvveessttmmeenntt OOppttiioonnss
MMiinniimmuumm AApppplliiccaattiioonn AAmmoouunntt((UUnnddeerr eeaacchh PPllaann //OOppttiioonn))
NNeett AAsssseett VVaalluuee((NNAAVV))
RReeddeemmppttiioonnPPrroocceeeeddss
HDFC Growth Fund
Open-ended Growth Scheme
● Capital appreciation over long term.
● Investment predominantlyin equity and equity related instruments
● High risk. ((BBrroowwnn))
Srinivas Rao Ravuri(since Apr 3, 06)#
September 11, 2000
HDFC Growth Fund, HDFC Growth Fund - DirectPlan
HDFC Equity Fund
Open-ended Growth Scheme
● Capital appreciation over long term.
● Investment predominantlyin equity and equity related instruments ofmedium to large sizedcompanies
● High risk. ((BBrroowwnn))
Prashant Jain(since Jun 19, 03)*#
January 1, 1995
HDFC Equity Fund, HDFC Equity Fund - DirectPlan
HDFC Top 200 Fund
Open-ended Growth Scheme
● Capital appreciation over long term.
● Investment in equity andequity linked instrumentsincluding equity derivatives primarilydrawn from the companiesin the S&P BSE 200 Index.
● High risk. ((BBrroowwnn))
Prashant Jain(since Jun19, 03)*#
October 11, 1996
HDFC Top 200 Fund, HDFC Top 200 Fund - DirectPlan
HDFC Capital Builder Fund
Open-ended Growth Scheme
● Capital appreciation over long term.
● Investment predominantlyin equity and equity related instruments ofstrong companies.
● High risk. ((BBrroowwnn))
Chirag Setalvad (since Apr 2, 07) & Miten Lathia(since May 10, 12)#
February 1, 1994
HDFC Capital Builder Fund,HDFC Capital Builder Fund - Direct Plan
Investors are advised to consult their tax advisors with respect to the tax consequences of the purchase, ownership and disposal of mutual fund units. For Tax Benefits / Consequences, Please refer to page 14* Date of migration from Zurich India Mutual Fund# Dedicated Fund Manager for Overseas Investments: Mr Rakesh Vyas since May 10, 2012.
Features of our select schemes
Every Business Day Every Business Day
Normally despatched within 3-4 Business Days.
HDFC Core &Satellite Fund
Open-ended Growth Scheme
● Capital appreciation over long term.
● Investment primarily inequity and equity relatedinstruments of companieswhose shares are quotingat prices below their truevalue.
● High risk. ((BBrroowwnn))
Vinay Kulkarni(since Nov 21, 06)#
September 17, 2004
HDFC Core & Satellite Fund,HDFC Core & Satellite Fund -Direct Plan
Every Business Day
NNoott AApppplliiccaabbllee.. Upfront commission shall be paid directly by the investor to the ARN Holder (AMFI registered Distributor) based on the investors’assessment of various factors including the service rendered by the ARN Holder.
Under Each Plan : Growth & Dividend. The Dividend Option offers Dividend Payout and Reinvestment facility.
(Brown) - Investors understand that their principal will be at high risk.
(Blue) - Investors understand that their principal will be at low risk.(Yellow) - Investors understand that their principal will be at medium risk.
~~ Investors should consult their financial advisers if in doubt about whether the product is suitable for them.NNoottee:: RRiisskk iiss rreepprreesseenntteedd aass::
● In respect of eeaacchh purchase / switch-in of Units, an Exit Load of 1% is payable if units are redeemed / switched-out within 1 year from the date of allotment.
● No Exit Load is payable if Units are redeemed / switched-out after 1 year from the date of allotment.FFoorr ffuurrtthheerr ddeettaaiillss,, pplleeaassee rreeffeerr ttoo ppaarraa ‘‘EExxiitt LLooaadd’’ oonn PPgg 1144..
Normally despatched within 3-4 Business Days.
Purchase : ` 5,000 and any amount thereafter. Additional Purchase : ` 1,000 and any amount thereafter.
Features of our select schemes
Intouchmutually6 January 2014
NNaattuurree ooff SScchheemmee
TThhiiss pprroodduucctt iiss ssuuiittaabbllee ffoorr iinnvveessttoorrsswwhhoo aarree sseeeekkiinngg ~~
FFuunndd MMaannaaggeerr
IInncceeppttiioonn DDaattee((DDaattee ooff AAlllloottmmeenntt))
EEnnttrryy // SSaalleess LLooaadd
EExxiitt LLooaadd
IInnvveessttmmeenntt PPllaann
IInnvveessttmmeenntt OOppttiioonnss
MMiinniimmuumm AApppplliiccaattiioonn AAmmoouunntt((UUnnddeerr eeaacchh PPllaann //OOppttiioonn))
NNeett AAsssseett VVaalluuee((NNAAVV))
RReeddeemmppttiioonnPPrroocceeeeddss
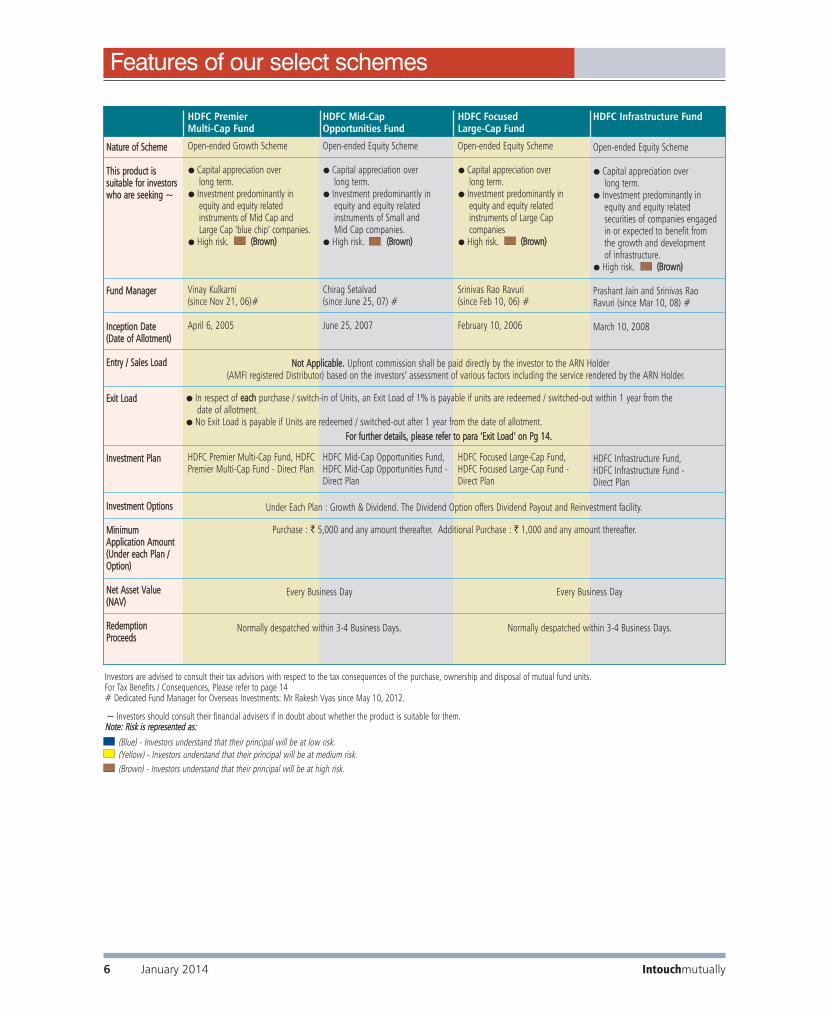
HDFC Premier Multi-Cap Fund
Open-ended Growth Scheme
● Capital appreciation over long term.
● Investment predominantly in equity and equity related instruments of Mid Cap and Large Cap ‘blue chip’ companies.
● High risk. ((BBrroowwnn))
Vinay Kulkarni(since Nov 21, 06)#
April 6, 2005
HDFC Premier Multi-Cap Fund, HDFCPremier Multi-Cap Fund - Direct Plan
HDFC Mid-Cap Opportunities Fund
Open-ended Equity Scheme
● Capital appreciation over long term.
● Investment predominantly in equity and equity related instruments of Small and Mid Cap companies.
● High risk. ((BBrroowwnn))
Chirag Setalvad (since June 25, 07) #
June 25, 2007
HDFC Mid-Cap Opportunities Fund,HDFC Mid-Cap Opportunities Fund -Direct Plan
HDFC Focused Large-Cap Fund
Open-ended Equity Scheme
● Capital appreciation over long term.
● Investment predominantly in equity and equity related instruments of Large Cap companies
● High risk. ((BBrroowwnn))
Srinivas Rao Ravuri (since Feb 10, 06) #
February 10, 2006
HDFC Focused Large-Cap Fund,HDFC Focused Large-Cap Fund -Direct Plan
HDFC Infrastructure Fund
Open-ended Equity Scheme
● Capital appreciation over long term.
● Investment predominantly in equity and equity related securities of companies engagedin or expected to benefit from the growth and development of infrastructure.
● High risk. ((BBrroowwnn))
Prashant Jain and Srinivas RaoRavuri (since Mar 10, 08) #
March 10, 2008
HDFC Infrastructure Fund, HDFC Infrastructure Fund - Direct Plan
NNoott AApppplliiccaabbllee.. Upfront commission shall be paid directly by the investor to the ARN Holder (AMFI registered Distributor) based on the investors’ assessment of various factors including the service rendered by the ARN Holder.
● In respect of eeaacchh purchase / switch-in of Units, an Exit Load of 1% is payable if units are redeemed / switched-out within 1 year from the date of allotment.
● No Exit Load is payable if Units are redeemed / switched-out after 1 year from the date of allotment.FFoorr ffuurrtthheerr ddeettaaiillss,, pplleeaassee rreeffeerr ttoo ppaarraa ‘‘EExxiitt LLooaadd’’ oonn PPgg 1144..
Under Each Plan : Growth & Dividend. The Dividend Option offers Dividend Payout and Reinvestment facility.
Purchase : ` 5,000 and any amount thereafter. Additional Purchase : ` 1,000 and any amount thereafter.
Every Business Day Every Business Day
Normally despatched within 3-4 Business Days. Normally despatched within 3-4 Business Days.
Investors are advised to consult their tax advisors with respect to the tax consequences of the purchase, ownership and disposal of mutual fund units. For Tax Benefits / Consequences, Please refer to page 14# Dedicated Fund Manager for Overseas Investments: Mr Rakesh Vyas since May 10, 2012.
(Brown) - Investors understand that their principal will be at high risk.
(Blue) - Investors understand that their principal will be at low risk.(Yellow) - Investors understand that their principal will be at medium risk.
~~ Investors should consult their financial advisers if in doubt about whether the product is suitable for them.NNoottee:: RRiisskk iiss rreepprreesseenntteedd aass::
NNaattuurree ooff SScchheemmee
TThhiiss pprroodduucctt iiss ssuuiittaabbllee ffoorr iinnvveessttoorrsswwhhoo aarree sseeeekkiinngg ~~
FFuunndd MMaannaaggeerr
IInncceeppttiioonn DDaattee((DDaattee ooff AAlllloottmmeenntt))
EEnnttrryy // SSaalleess LLooaadd
EExxiitt LLooaadd
IInnvveessttmmeenntt PPllaann
IInnvveessttmmeenntt OOppttiioonnss
MMiinniimmuumm AApppplliiccaattiioonn AAmmoouunntt((UUnnddeerr eeaacchh PPllaann //OOppttiioonn))
NNeett AAsssseett VVaalluuee((NNAAVV))
RReeddeemmppttiioonnPPrroocceeeeddss
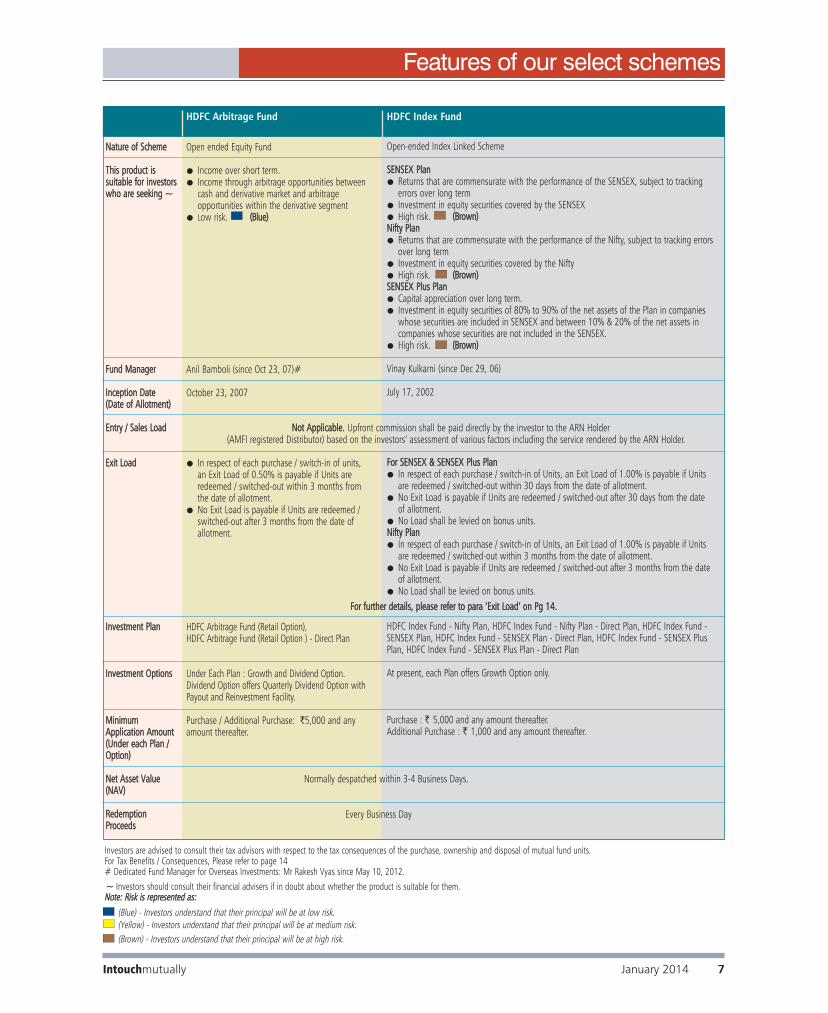
HDFC Index Fund
Open-ended Index Linked Scheme
SSEENNSSEEXX PPllaann● Returns that are commensurate with the performance of the SENSEX, subject to tracking
errors over long term● Investment in equity securities covered by the SENSEX● High risk. ((BBrroowwnn))NNiiffttyy PPllaann● Returns that are commensurate with the performance of the Nifty, subject to tracking errors
over long term● Investment in equity securities covered by the Nifty ● High risk. ((BBrroowwnn))SSEENNSSEEXX PPlluuss PPllaann● Capital appreciation over long term. ● Investment in equity securities of 80% to 90% of the net assets of the Plan in companies
whose securities are included in SENSEX and between 10% & 20% of the net assets in companies whose securities are not included in the SENSEX.
● High risk. ((BBrroowwnn))
Vinay Kulkarni (since Dec 29, 06)
July 17, 2002
FFoorr SSEENNSSEEXX && SSEENNSSEEXX PPlluuss PPllaann● In respect of each purchase / switch-in of Units, an Exit Load of 1.00% is payable if Units
are redeemed / switched-out within 30 days from the date of allotment.● No Exit Load is payable if Units are redeemed / switched-out after 30 days from the date
of allotment.● No Load shall be levied on bonus units.NNiiffttyy PPllaann● In respect of each purchase / switch-in of Units, an Exit Load of 1.00% is payable if Units
are redeemed / switched-out within 3 months from the date of allotment.● No Exit Load is payable if Units are redeemed / switched-out after 3 months from the date
of allotment.● No Load shall be levied on bonus units.
HDFC Index Fund - Nifty Plan, HDFC Index Fund - Nifty Plan - Direct Plan, HDFC Index Fund -SENSEX Plan, HDFC Index Fund - SENSEX Plan - Direct Plan, HDFC Index Fund - SENSEX PlusPlan, HDFC Index Fund - SENSEX Plus Plan - Direct Plan
At present, each Plan offers Growth Option only.
Purchase : ` 5,000 and any amount thereafter. Additional Purchase : ` 1,000 and any amount thereafter.
HDFC Arbitrage Fund
Open ended Equity Fund
● Income over short term. ● Income through arbitrage opportunities between
cash and derivative market and arbitrage opportunities within the derivative segment
● Low risk. ((BBlluuee))
Anil Bamboli (since Oct 23, 07)#
October 23, 2007
● In respect of each purchase / switch-in of units, an Exit Load of 0.50% is payable if Units areredeemed / switched-out within 3 months fromthe date of allotment.
● No Exit Load is payable if Units are redeemed /switched-out after 3 months from the date of allotment.
HDFC Arbitrage Fund (Retail Option), HDFC Arbitrage Fund (Retail Option ) - Direct Plan
Under Each Plan : Growth and Dividend Option.Dividend Option offers Quarterly Dividend Option withPayout and Reinvestment Facility.
Purchase / Additional Purchase: `5,000 and anyamount thereafter.
NNoott AApppplliiccaabbllee.. Upfront commission shall be paid directly by the investor to the ARN Holder (AMFI registered Distributor) based on the investors’ assessment of various factors including the service rendered by the ARN Holder.
Every Business Day
Normally despatched within 3-4 Business Days.
Investors are advised to consult their tax advisors with respect to the tax consequences of the purchase, ownership and disposal of mutual fund units. For Tax Benefits / Consequences, Please refer to page 14# Dedicated Fund Manager for Overseas Investments: Mr Rakesh Vyas since May 10, 2012.
FFoorr ffuurrtthheerr ddeettaaiillss,, pplleeaassee rreeffeerr ttoo ppaarraa ‘‘EExxiitt LLooaadd’’ oonn PPgg 1144..
Intouchmutually January 2014 7
Features of our select schemes
(Brown) - Investors understand that their principal will be at high risk.
(Blue) - Investors understand that their principal will be at low risk.(Yellow) - Investors understand that their principal will be at medium risk.
~~ Investors should consult their financial advisers if in doubt about whether the product is suitable for them.NNoottee:: RRiisskk iiss rreepprreesseenntteedd aass::
Investors are advised to consult their tax advisors with respect to the tax consequences of the purchase, ownership and disposal of mutual fund units. For Tax Benefits / Consequences, Please refer to page 14* Date of migration from Zurich India Mutual Fund # Dedicated Fund Manager for Overseas Investments: Mr Rakesh Vyas since May 10, 2012. $ For Large Investors, subscriptions shall only be allowed by payment of requisite Cash through RTGS/NEFT or Funds Transfer Letter/ Transfer Cheque of a bank where the Scheme has a collection account.
NNaattuurree ooff SScchheemmee
TThhiiss pprroodduucctt iiss ssuuiittaabbllee ffoorr iinnvveessttoorrsswwhhoo aarree sseeeekkiinngg ~~
FFuunndd MMaannaaggeerr
IInncceeppttiioonn DDaattee((DDaattee ooff AAlllloottmmeenntt))
EEnnttrryy // SSaalleess LLooaadd
EExxiitt LLooaadd
IInnvveessttmmeenntt PPllaann
IInnvveessttmmeenntt OOppttiioonnss
MMiinniimmuumm AApppplliiccaattiioonn AAmmoouunntt((UUnnddeerr eeaacchh PPllaann //OOppttiioonn))
NNeett AAsssseett VVaalluuee((NNAAVV))
RReeddeemmppttiioonnPPrroocceeeeddss
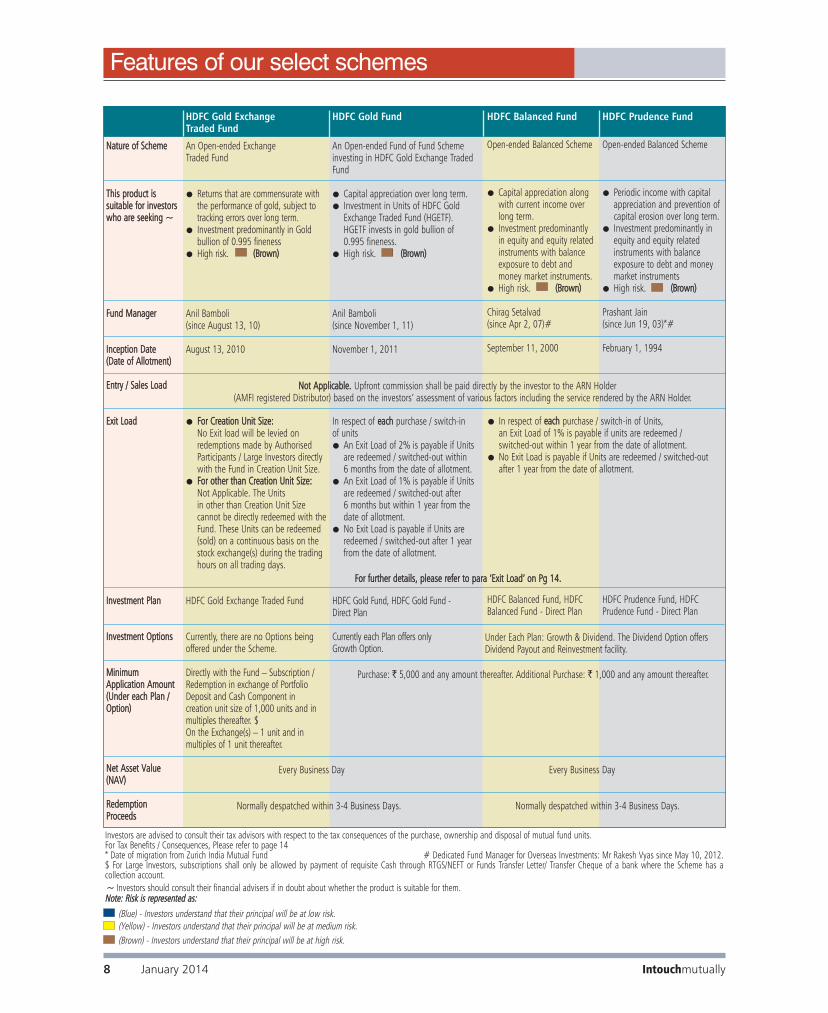
HDFC Gold Exchange Traded Fund
An Open-ended Exchange Traded Fund
● Returns that are commensurate withthe performance of gold, subject totracking errors over long term.
● Investment predominantly in Goldbullion of 0.995 fineness
● High risk. ((BBrroowwnn))
Anil Bamboli (since August 13, 10)
August 13, 2010
● FFoorr CCrreeaattiioonn UUnniitt SSiizzee::No Exit load will be levied on redemptions made by AuthorisedParticipants / Large Investors directlywith the Fund in Creation Unit Size.
● FFoorr ootthheerr tthhaann CCrreeaattiioonn UUnniitt SSiizzee::Not Applicable. The Units in other than Creation Unit Size cannot be directly redeemed with theFund. These Units can be redeemed(sold) on a continuous basis on thestock exchange(s) during the tradinghours on all trading days.
HDFC Gold Exchange Traded Fund
Currently, there are no Options beingoffered under the Scheme.
Directly with the Fund – Subscription /Redemption in exchange of PortfolioDeposit and Cash Component in creation unit size of 1,000 units and inmultiples thereafter. $ On the Exchange(s) – 1 unit and in multiples of 1 unit thereafter.
HDFC Gold Fund
An Open-ended Fund of Fund Schemeinvesting in HDFC Gold Exchange TradedFund
● Capital appreciation over long term.● Investment in Units of HDFC Gold
Exchange Traded Fund (HGETF). HGETF invests in gold bullion of 0.995 fineness.
● High risk. ((BBrroowwnn))
Anil Bamboli (since November 1, 11)
November 1, 2011
In respect of eeaacchh purchase / switch-in of units ● An Exit Load of 2% is payable if Units
are redeemed / switched-out within 6 months from the date of allotment.
● An Exit Load of 1% is payable if Unitsare redeemed / switched-out after 6 months but within 1 year from thedate of allotment.
● No Exit Load is payable if Units areredeemed / switched-out after 1 yearfrom the date of allotment.
HDFC Gold Fund, HDFC Gold Fund - Direct Plan
Currently each Plan offers only Growth Option.
HDFC Balanced Fund
Open-ended Balanced Scheme
● Capital appreciation alongwith current income overlong term.
● Investment predominantlyin equity and equity related instruments with balance exposure to debt andmoney market instruments.
● High risk. ((BBrroowwnn))
Chirag Setalvad (since Apr 2, 07)#
September 11, 2000
HDFC Balanced Fund, HDFCBalanced Fund - Direct Plan
HDFC Prudence Fund
Open-ended Balanced Scheme
● Periodic income with capitalappreciation and prevention ofcapital erosion over long term.
● Investment predominantly inequity and equity related instruments with balance exposure to debt and moneymarket instruments
● High risk. ((BBrroowwnn))
Prashant Jain (since Jun 19, 03)*#
February 1, 1994
HDFC Prudence Fund, HDFCPrudence Fund - Direct Plan
NNoott AApppplliiccaabbllee.. Upfront commission shall be paid directly by the investor to the ARN Holder (AMFI registered Distributor) based on the investors’ assessment of various factors including the service rendered by the ARN Holder.
FFoorr ffuurrtthheerr ddeettaaiillss,, pplleeaassee rreeffeerr ttoo ppaarraa ‘‘EExxiitt LLooaadd’’ oonn PPgg 1144..
● In respect of eeaacchh purchase / switch-in of Units, an Exit Load of 1% is payable if units are redeemed / switched-out within 1 year from the date of allotment.
● No Exit Load is payable if Units are redeemed / switched-outafter 1 year from the date of allotment.
Under Each Plan: Growth & Dividend. The Dividend Option offersDividend Payout and Reinvestment facility.
Purchase: ` 5,000 and any amount thereafter. Additional Purchase: ` 1,000 and any amount thereafter.
Every Business Day Every Business Day
Normally despatched within 3-4 Business Days. Normally despatched within 3-4 Business Days.
Intouchmutually8 January 2014
Features of our select schemes
(Brown) - Investors understand that their principal will be at high risk.
(Blue) - Investors understand that their principal will be at low risk.(Yellow) - Investors understand that their principal will be at medium risk.
~~ Investors should consult their financial advisers if in doubt about whether the product is suitable for them.NNoottee:: RRiisskk iiss rreepprreesseenntteedd aass::

^̂ EElliiggiibbiilliittyy ((ooff UUnniitt hhoollddeerr)) :: Children less than 18 years of age as on the date of investment by the Investor / Applicant are eligible as Unit holders in the Scheme. @@ Personal Accident InsuranceCover for Parent / Legal Guardian (upto the age of 80 years) of the Unit holder, equivalent to 10 times the cost value of the outstanding Units held by the Unit holder under all the applications /account statements / folios, subject to a maximum amount of ` 10 lakhs per Unit holder. The insurance premium in respect of the personal accident insurance cover will be borne by the AMC. Thisaccident insurance cover is subject to conditions of the group personal accident insurance policy. Investors are advised to consult their tax advisors with respect to the tax consequences of the purchase, ownership and disposal of mutual fund units. For Tax Benefits / Consequences, Please refer to page 14 # Dedicated Fund Manager for Overseas Investments: Mr Rakesh Vyas since May 10, 2012.
NNaattuurree ooff SScchheemmee
TThhiiss pprroodduucctt iiss ssuuiittaabbllee ffoorr iinnvveessttoorrsswwhhoo aarree sseeeekkiinngg ~~
FFuunndd MMaannaaggeerr
IInncceeppttiioonn DDaattee((DDaattee ooff AAlllloottmmeenntt))
EEnnttrryy // SSaalleess LLooaadd
EExxiitt LLooaadd
IInnvveessttmmeenntt PPllaann
IInnvveessttmmeenntt OOppttiioonnss
MMiinniimmuumm AApppplliiccaattiioonn AAmmoouunntt((UUnnddeerr eeaacchh PPllaann //OOppttiioonn))
LLoocckk-iinn PPeerriioodd
NNeett AAsssseett VVaalluuee((NNAAVV))
RReeddeemmppttiioonnPPrroocceeeeddss
HDFC Children’s Gift Fund (CGF)^@
Open-ended Balanced Scheme
CCGGFF - IInnvveessttmmeenntt PPllaann ● Capital appreciation over long term ● Investment in equity and equity related instruments as well
as debt and money market instruments.● High risk. ((BBrroowwnn))CCGGFF - SSaavviinnggss PPllaann● Capital appreciation over medium to long term.● Investment in debt and money market instruments as well
as equity and equity related instruments.● Medium risk. ((YYeellllooww))
Chirag Setalvad (since Apr 2, 07)#
March 2, 2001
● For Units subject to Lock-in Period: NIL● For Units not subject to Lock-in Period: 3% if the Units are
redeemed / switched-out within one year from the date ofallotment; 2% if the Units are redeemed / switched-outbetween the first and second year of the date of allotment;1% if Units are redeemed / switched-out between the second and third year of the date of allotment; Nil if the Units are redeemed / switched-out after third year fromthe date of allotment.
EEqquuiittyy OOrriieenntteedd - Investment Plan, Investment Plan - Direct Plan DDeebbtt OOrriieenntteedd - Savings Plan, Savings Plan - Direct Plan
Nil
Purchase : ` 5,000 and any amount thereafter. Additional Purchase : ` 1,000 and any amount thereafter.
IIff oopptteedd :: Until the Unit holder (being the beneficiary child)attains the age of 18 years or until completion of 3 years fromdate of allotment, whichever is later.
Every Business Day
Normally despatched within 3-4 Business Days (Redemption issubject to completion of Lock-in Period, if opted).
HDFC TaxSaver
Open-ended Equity Linked Savings Schemewith a lock-in period of 3 years
● Growth of capital over long term.● Investment predominantly in equity and
equity related instruments.● High risk. ((BBrroowwnn))
Vinay Kulkarni (since Nov 21, 06)#
March 31, 1996
Nil
HDFC TaxSaver, HDFC TaxSaver - Direct Plan
HDFC Long Term Advantage Fund
Open-ended Equity Linked Savings Schemewith a lock-in period of 3 years
● Capital appreciation over long term.● Investment predominantly in equity and
equity related instruments.● High risk. ((BBrroowwnn))
Chirag Setalvad (since Apr 2, 07)#
January 2, 2001
Nil
HDFC Long Term Advantage Fund, HDFC LongTerm Advantage Fund - Direct Plan
NNoott AApppplliiccaabbllee.. Upfront commission shall be paid directly by the investor to the ARN Holder (AMFI registered Distributor) based on the investors’ assessment of various factors including the service rendered by the ARN Holder.
FFoorr ffuurrtthheerr ddeettaaiillss,, pplleeaassee rreeffeerr ttoo ppaarraa ‘‘EExxiitt LLooaadd’’ oonn PPgg 1144..
Under Each Plan: Growth & Dividend. The Dividend Option offers Dividend Payout andReinvestment facility
Purchase & Additional Purchase : ` 500 and in multiples of ` 500 thereafter.
3 years from the date of allotment of the respective Units(including Units allotted under dividend reinvestment)
Every Business Day
Normally despatched within 3-4 Business Days (Redemption issubject to completion of Lock-in Period, if applicable).
Intouchmutually January 2014 9
Features of our select schemes
(Brown) - Investors understand that their principal will be at high risk.
(Blue) - Investors understand that their principal will be at low risk.(Yellow) - Investors understand that their principal will be at medium risk.
~~ Investors should consult their financial advisers if in doubt about whether the product is suitable for them.NNoottee:: RRiisskk iiss rreepprreesseenntteedd aass::
NNaattuurree ooff SScchheemmee
TThhiiss pprroodduucctt iiss ssuuiittaabbllee ffoorr iinnvveessttoorrsswwhhoo aarree sseeeekkiinngg ~~
FFuunndd MMaannaaggeerr
IInncceeppttiioonn DDaattee((DDaattee ooff AAlllloottmmeenntt))
EEnnttrryy // SSaalleess LLooaadd
EExxiitt LLooaadd
IInnvveessttmmeenntt PPllaann
IInnvveessttmmeenntt OOppttiioonnss
MMiinniimmuumm AApppplliiccaattiioonn AAmmoouunntt((UUnnddeerr eeaacchh PPllaann //OOppttiioonn))
NNeett AAsssseett VVaalluuee((NNAAVV))
RReeddeemmppttiioonnPPrroocceeeeddss
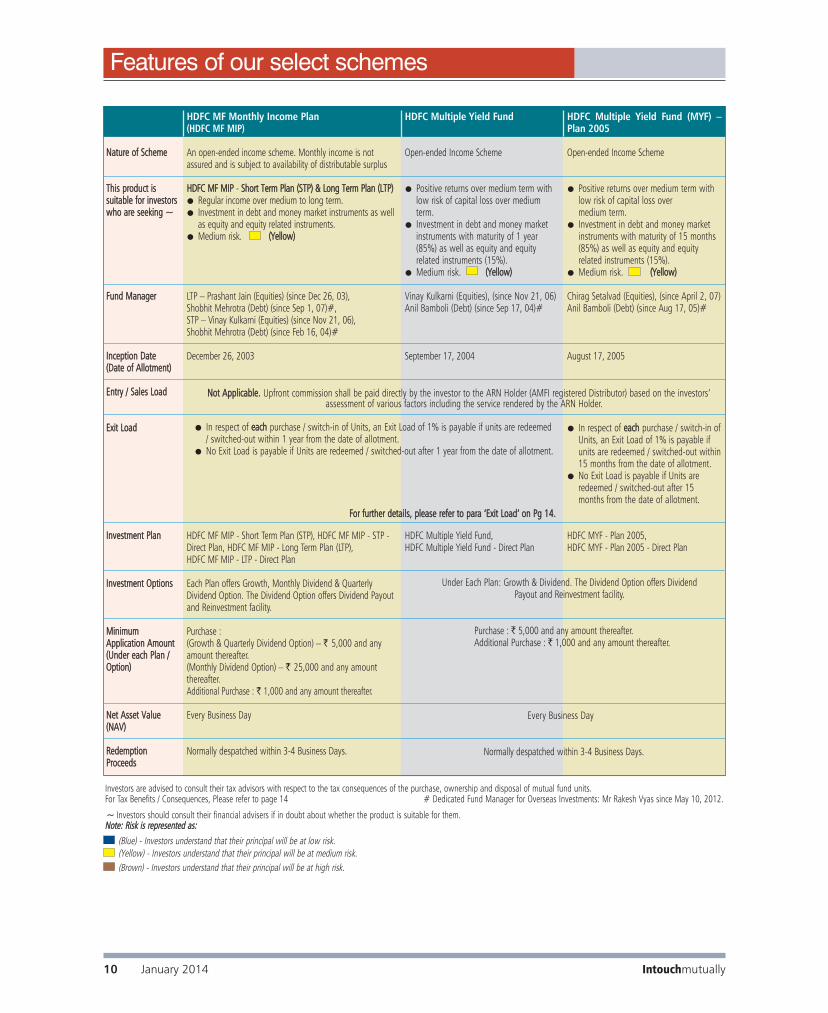
HDFC MF Monthly Income Plan(HDFC MF MIP)
An open-ended income scheme. Monthly income is notassured and is subject to availability of distributable surplus
HHDDFFCC MMFF MMIIPP - SShhoorrtt TTeerrmm PPllaann ((SSTTPP)) && LLoonngg TTeerrmm PPllaann ((LLTTPP))● Regular income over medium to long term.● Investment in debt and money market instruments as well
as equity and equity related instruments.● Medium risk. ((YYeellllooww))
LTP – Prashant Jain (Equities) (since Dec 26, 03),Shobhit Mehrotra (Debt) (since Sep 1, 07)#,STP – Vinay Kulkarni (Equities) (since Nov 21, 06),Shobhit Mehrotra (Debt) (since Feb 16, 04)#
December 26, 2003
HDFC MF MIP - Short Term Plan (STP), HDFC MF MIP - STP -Direct Plan, HDFC MF MIP - Long Term Plan (LTP), HDFC MF MIP - LTP - Direct Plan
Each Plan offers Growth, Monthly Dividend & QuarterlyDividend Option. The Dividend Option offers Dividend Payoutand Reinvestment facility.
Purchase :(Growth & Quarterly Dividend Option) – ` 5,000 and anyamount thereafter.(Monthly Dividend Option) – ` 25,000 and any amountthereafter. Additional Purchase : ` 1,000 and any amount thereafter.
Every Business Day
Normally despatched within 3-4 Business Days.
HDFC Multiple Yield Fund
Open-ended Income Scheme
● Positive returns over medium term withlow risk of capital loss over mediumterm.
● Investment in debt and money marketinstruments with maturity of 1 year(85%) as well as equity and equity related instruments (15%).
● Medium risk. ((YYeellllooww))
Vinay Kulkarni (Equities), (since Nov 21, 06)Anil Bamboli (Debt) (since Sep 17, 04)#
September 17, 2004
HDFC Multiple Yield Fund, HDFC Multiple Yield Fund - Direct Plan
HDFC Multiple Yield Fund (MYF) –Plan 2005
Open-ended Income Scheme
● Positive returns over medium term withlow risk of capital loss over medium term.
● Investment in debt and money marketinstruments with maturity of 15 months(85%) as well as equity and equity related instruments (15%).
● Medium risk. ((YYeellllooww))
Chirag Setalvad (Equities), (since April 2, 07)Anil Bamboli (Debt) (since Aug 17, 05)#
August 17, 2005
● In respect of eeaacchh purchase / switch-in ofUnits, an Exit Load of 1% is payable ifunits are redeemed / switched-out within15 months from the date of allotment.
● No Exit Load is payable if Units areredeemed / switched-out after 15months from the date of allotment.
HDFC MYF - Plan 2005, HDFC MYF - Plan 2005 - Direct Plan
NNoott AApppplliiccaabbllee.. Upfront commission shall be paid directly by the investor to the ARN Holder (AMFI registered Distributor) based on the investors’ assessment of various factors including the service rendered by the ARN Holder.
FFoorr ffuurrtthheerr ddeettaaiillss,, pplleeaassee rreeffeerr ttoo ppaarraa ‘‘EExxiitt LLooaadd’’ oonn PPgg 1144..
Under Each Plan: Growth & Dividend. The Dividend Option offers DividendPayout and Reinvestment facility.
Purchase : ` 5,000 and any amount thereafter. Additional Purchase : ` 1,000 and any amount thereafter.
Investors are advised to consult their tax advisors with respect to the tax consequences of the purchase, ownership and disposal of mutual fund units. For Tax Benefits / Consequences, Please refer to page 14 # Dedicated Fund Manager for Overseas Investments: Mr Rakesh Vyas since May 10, 2012.
Every Business Day
Normally despatched within 3-4 Business Days.
Intouchmutually10 January 2014
Features of our select schemes
● In respect of eeaacchh purchase / switch-in of Units, an Exit Load of 1% is payable if units are redeemed/ switched-out within 1 year from the date of allotment.
● No Exit Load is payable if Units are redeemed / switched-out after 1 year from the date of allotment.
(Brown) - Investors understand that their principal will be at high risk.
(Blue) - Investors understand that their principal will be at low risk.(Yellow) - Investors understand that their principal will be at medium risk.
~~ Investors should consult their financial advisers if in doubt about whether the product is suitable for them.NNoottee:: RRiisskk iiss rreepprreesseenntteedd aass::
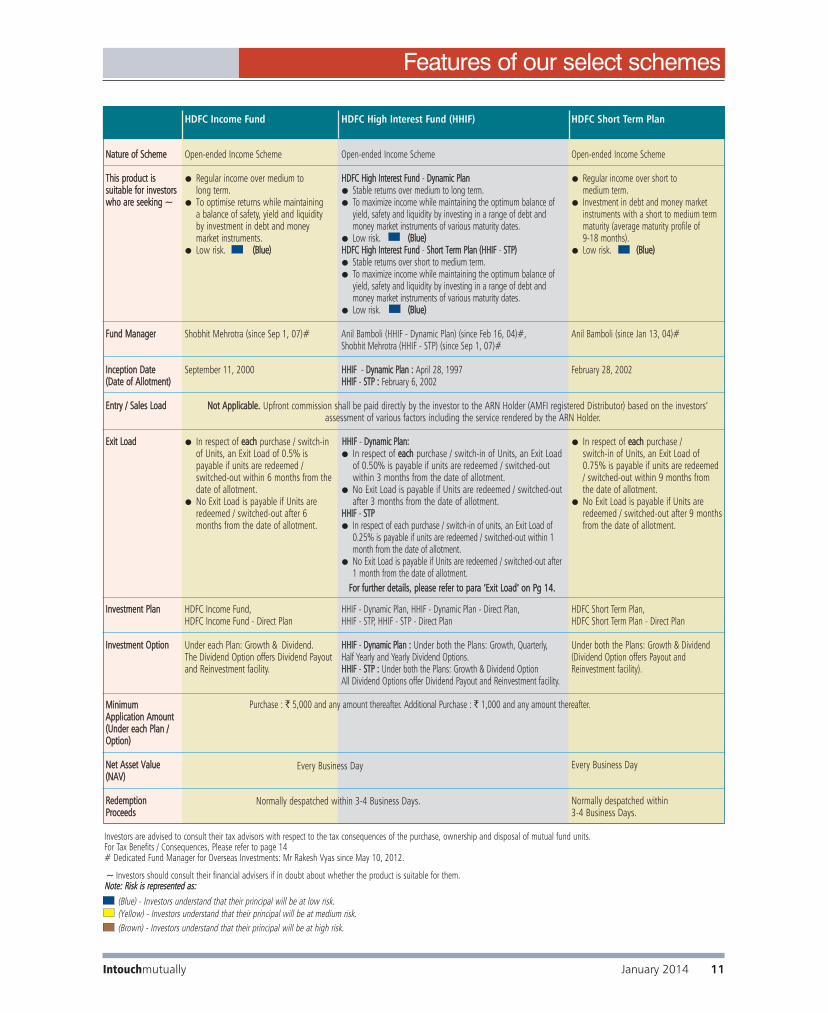
HDFC Income Fund
Open-ended Income Scheme
● Regular income over medium to long term.
● To optimise returns while maintaining a balance of safety, yield and liquidity by investment in debt and money market instruments.
● Low risk. ((BBlluuee))
Shobhit Mehrotra (since Sep 1, 07)#
September 11, 2000
● In respect of eeaacchh purchase / switch-inof Units, an Exit Load of 0.5% ispayable if units are redeemed /switched-out within 6 months from the date of allotment.
● No Exit Load is payable if Units areredeemed / switched-out after 6 months from the date of allotment.
HDFC Income Fund, HDFC Income Fund - Direct Plan
Under each Plan: Growth & Dividend. The Dividend Option offers Dividend Payoutand Reinvestment facility.
NNaattuurree ooff SScchheemmee
TThhiiss pprroodduucctt iiss ssuuiittaabbllee ffoorr iinnvveessttoorrsswwhhoo aarree sseeeekkiinngg ~~
FFuunndd MMaannaaggeerr
IInncceeppttiioonn DDaattee((DDaattee ooff AAlllloottmmeenntt))
EEnnttrryy // SSaalleess LLooaadd
EExxiitt LLooaadd
IInnvveessttmmeenntt PPllaann
IInnvveessttmmeenntt OOppttiioonn
MMiinniimmuumm AApppplliiccaattiioonn AAmmoouunntt((UUnnddeerr eeaacchh PPllaann //OOppttiioonn))
NNeett AAsssseett VVaalluuee((NNAAVV))
RReeddeemmppttiioonnPPrroocceeeeddss
Intouchmutually January 2014 11
Features of our select schemes
HDFC Short Term Plan
Open-ended Income Scheme
● Regular income over short to medium term.
● Investment in debt and money marketinstruments with a short to medium termmaturity (average maturity profile of 9-18 months).
● Low risk. ((BBlluuee))
Anil Bamboli (since Jan 13, 04)#
February 28, 2002
● In respect of eeaacchh purchase / switch-in of Units, an Exit Load of0.75% is payable if units are redeemed/ switched-out within 9 months fromthe date of allotment.
● No Exit Load is payable if Units areredeemed / switched-out after 9 monthsfrom the date of allotment.
HDFC Short Term Plan, HDFC Short Term Plan - Direct Plan
Under both the Plans: Growth & Dividend(Dividend Option offers Payout andReinvestment facility).
Every Business Day
Normally despatched within 3-4 Business Days.
HDFC High Interest Fund (HHIF)
Open-ended Income Scheme
HHDDFFCC HHiigghh IInntteerreesstt FFuunndd - DDyynnaammiicc PPllaann ● Stable returns over medium to long term.● To maximize income while maintaining the optimum balance of
yield, safety and liquidity by investing in a range of debt andmoney market instruments of various maturity dates.
● Low risk. ((BBlluuee))HHDDFFCC HHiigghh IInntteerreesstt FFuunndd - SShhoorrtt TTeerrmm PPllaann ((HHHHIIFF - SSTTPP))● Stable returns over short to medium term.● To maximize income while maintaining the optimum balance of
yield, safety and liquidity by investing in a range of debt andmoney market instruments of various maturity dates.
● Low risk. ((BBlluuee))
Anil Bamboli (HHIF - Dynamic Plan) (since Feb 16, 04)#, Shobhit Mehrotra (HHIF - STP) (since Sep 1, 07)#
HHHHIIFF - DDyynnaammiicc PPllaann :: April 28, 1997HHHHIIFF - SSTTPP :: February 6, 2002
HHHHIIFF - DDyynnaammiicc PPllaann::● In respect of eeaacchh purchase / switch-in of Units, an Exit Load
of 0.50% is payable if units are redeemed / switched-outwithin 3 months from the date of allotment.
● No Exit Load is payable if Units are redeemed / switched-outafter 3 months from the date of allotment.
HHHHIIFF - SSTTPP● In respect of each purchase / switch-in of units, an Exit Load of
0.25% is payable if units are redeemed / switched-out within 1month from the date of allotment.
● No Exit Load is payable if Units are redeemed / switched-out after1 month from the date of allotment.
HHIF - Dynamic Plan, HHIF - Dynamic Plan - Direct Plan, HHIF - STP, HHIF - STP - Direct Plan
HHHHIIFF - DDyynnaammiicc PPllaann :: Under both the Plans: Growth, Quarterly, Half Yearly and Yearly Dividend Options.HHHHIIFF - SSTTPP :: Under both the Plans: Growth & Dividend OptionAll Dividend Options offer Dividend Payout and Reinvestment facility.
FFoorr ffuurrtthheerr ddeettaaiillss,, pplleeaassee rreeffeerr ttoo ppaarraa ‘‘EExxiitt LLooaadd’’ oonn PPgg 1144..
Every Business Day
Normally despatched within 3-4 Business Days.
NNoott AApppplliiccaabbllee.. Upfront commission shall be paid directly by the investor to the ARN Holder (AMFI registered Distributor) based on the investors’ assessment of various factors including the service rendered by the ARN Holder.
Investors are advised to consult their tax advisors with respect to the tax consequences of the purchase, ownership and disposal of mutual fund units. For Tax Benefits / Consequences, Please refer to page 14# Dedicated Fund Manager for Overseas Investments: Mr Rakesh Vyas since May 10, 2012.
Purchase : ` 5,000 and any amount thereafter. Additional Purchase : ` 1,000 and any amount thereafter.
(Brown) - Investors understand that their principal will be at high risk.
(Blue) - Investors understand that their principal will be at low risk.(Yellow) - Investors understand that their principal will be at medium risk.
~~ Investors should consult their financial advisers if in doubt about whether the product is suitable for them.NNoottee:: RRiisskk iiss rreepprreesseenntteedd aass::
Intouchmutually12 January 2014
Features of our select schemes
NNaattuurree ooff SScchheemmee
TThhiiss pprroodduucctt iiss ssuuiittaabbllee ffoorr iinnvveessttoorrsswwhhoo aarree sseeeekkiinngg ~~
FFuunndd MMaannaaggeerr
IInncceeppttiioonn DDaattee((DDaattee ooff AAlllloottmmeenntt))
EEnnttrryy // SSaalleess LLooaadd
EExxiitt LLooaadd
IInnvveessttmmeenntt PPllaann
IInnvveessttmmeenntt OOppttiioonn
MMiinniimmuumm AApppplliiccaattiioonn AAmmoouunntt ((UUnnddeerr eeaacchh PPllaann)) //OOppttiioonn
NNeett AAsssseett VVaalluuee((NNAAVV))
RReeddeemmppttiioonnPPrroocceeeeddss
Investors are advised to consult their tax advisors with respect to the tax consequences of the purchase, ownership and disposal of mutual fund units. For Tax Benefits / Consequences, Please refer to page 14# Dedicated Fund Manager for Overseas Investments: Mr Rakesh Vyas since May 10, 2012.
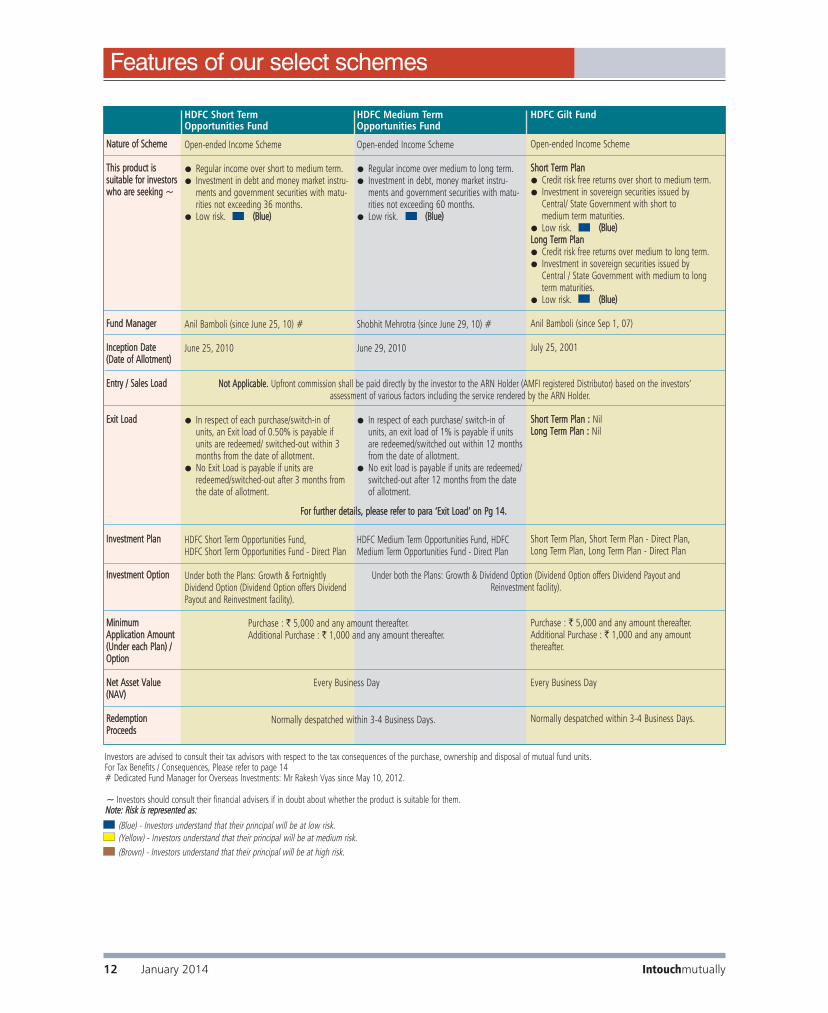
HDFC Gilt Fund
Open-ended Income Scheme
SShhoorrtt TTeerrmm PPllaann● Credit risk free returns over short to medium term. ● Investment in sovereign securities issued by
Central/ State Government with short to medium term maturities.
● Low risk. ((BBlluuee))LLoonngg TTeerrmm PPllaann● Credit risk free returns over medium to long term.● Investment in sovereign securities issued by
Central / State Government with medium to long term maturities.
● Low risk. ((BBlluuee))
Anil Bamboli (since Sep 1, 07)
July 25, 2001
SShhoorrtt TTeerrmm PPllaann :: NilLLoonngg TTeerrmm PPllaann :: Nil
Short Term Plan, Short Term Plan - Direct Plan,Long Term Plan, Long Term Plan - Direct Plan
Purchase : ` 5,000 and any amount thereafter.Additional Purchase : ` 1,000 and any amount thereafter.
Every Business Day
Normally despatched within 3-4 Business Days.
HDFC Medium Term Opportunities Fund
Open-ended Income Scheme
● Regular income over medium to long term.● Investment in debt, money market instru-
ments and government securities with matu-rities not exceeding 60 months.
● Low risk. ((BBlluuee))
Shobhit Mehrotra (since June 29, 10) #
June 29, 2010
● In respect of each purchase/ switch-in ofunits, an exit load of 1% is payable if unitsare redeemed/switched out within 12 monthsfrom the date of allotment.
● No exit load is payable if units are redeemed/switched-out after 12 months from the dateof allotment.
HDFC Medium Term Opportunities Fund, HDFCMedium Term Opportunities Fund - Direct Plan
HDFC Short Term Opportunities Fund
Open-ended Income Scheme
● Regular income over short to medium term.● Investment in debt and money market instru-
ments and government securities with matu-rities not exceeding 36 months.
● Low risk. ((BBlluuee))
Anil Bamboli (since June 25, 10) #
June 25, 2010
● In respect of each purchase/switch-in ofunits, an Exit load of 0.50% is payable ifunits are redeemed/ switched-out within 3months from the date of allotment.
● No Exit Load is payable if units areredeemed/switched-out after 3 months fromthe date of allotment.
HDFC Short Term Opportunities Fund, HDFC Short Term Opportunities Fund - Direct Plan
Under both the Plans: Growth & FortnightlyDividend Option (Dividend Option offers DividendPayout and Reinvestment facility).
NNoott AApppplliiccaabbllee.. Upfront commission shall be paid directly by the investor to the ARN Holder (AMFI registered Distributor) based on the investors’ assessment of various factors including the service rendered by the ARN Holder.
FFoorr ffuurrtthheerr ddeettaaiillss,, pplleeaassee rreeffeerr ttoo ppaarraa ‘‘EExxiitt LLooaadd’’ oonn PPgg 1144..
Purchase : ` 5,000 and any amount thereafter.Additional Purchase : ` 1,000 and any amount thereafter.
Every Business Day
Normally despatched within 3-4 Business Days.
(Brown) - Investors understand that their principal will be at high risk.
(Blue) - Investors understand that their principal will be at low risk.(Yellow) - Investors understand that their principal will be at medium risk.
~~ Investors should consult their financial advisers if in doubt about whether the product is suitable for them.NNoottee:: RRiisskk iiss rreepprreesseenntteedd aass::
Under both the Plans: Growth & Dividend Option (Dividend Option offers Dividend Payout andReinvestment facility).

HDFC Floating Rate Income Fund
Open-ended Income Scheme
SShhoorrtt TTeerrmm PPllaann● Regular income over short term.● Investment in floating rate debt / money market instruments, fixed rate debt / money market
instruments swapped for floating rate returns and fixed rate debt and money market instruments of short term maturities with higher liquidity.
● Low risk. ((BBlluuee))LLoonngg TTeerrmm PPllaann● Regular income over short to medium term.● Investment in floating rate debt / money market instruments, fixed rate debt / money market
instruments swapped for floating rate returns and fixed rate debt and money market instruments of longer term maturities.
● Low risk. ((BBlluuee))
Shobhit Mehrotra (since Feb 16, 04)#
LLoonngg TTeerrmm PPllaann ((LLTTPP)) :: January 16, 2003 SShhoorrtt TTeerrmm PPllaann ((SSTTPP)) - WWhhoolleessaallee OOppttiioonn:: October 23, 2007
SSTTPP :: NilLLTTPP :: ● In respect of eeaacchh purchase / switch-in of Units, an Exit Load of 0.50% is payable if units are
redeemed / switched-out within 3 months from the date of allotment.● No Exit Load is payable if Units are redeemed / switched-out after 3 months from the
date of allotment.
STP - Wholesale Option, STP - Wholesale Option - Direct Plan,LTP, LTP - Direct Plan
SSTTPP –– WWhhoolleessaallee OOppttiioonn :: Under both the Plans: Growth and Dividend Option. The DividendOption offers Daily Dividend Option (with Reinvestment facility only) and Weekly and MonthlyDividend Option (with Payout and Reinvestment facility).LLTTPP :: Under both the Plans: Growth and Weekly Dividend Option (with Reinvestment facility only).
SSTTPP –– WWhhoolleessaallee OOppttiioonn :: Purchase : ` 10 lakh and any amount thereafter. Additional Purchase : ` 1 and and any amount thereafter.LLTTPP :: For Purchase : ` 5,000 and any amount thereafter.Additional Purchase : ` 1,000 and any amount thereafter.
Every Business Day
Normally despatched within 3-4 Business Days.
NNaattuurree ooff SScchheemmee
TThhiiss pprroodduucctt iiss ssuuiittaabbllee ffoorr iinnvveessttoorrsswwhhoo aarree sseeeekkiinngg ~~
FFuunndd MMaannaaggeerr
IInncceeppttiioonn DDaattee((DDaattee ooff AAlllloottmmeenntt))
EEnnttrryy // SSaalleess LLooaadd
EExxiitt LLooaadd
IInnvveessttmmeenntt PPllaann
IInnvveessttmmeenntt OOppttiioonn
MMiinniimmuumm AApppplliiccaattiioonn AAmmoouunntt((UUnnddeerr eeaacchh PPllaann //OOppttiioonn))
NNeett AAsssseett VVaalluuee((NNAAVV))
RReeddeemmppttiioonnPPrroocceeeeddss
Investors are advised to consult their tax advisors with respect to the tax consequences of the purchase, ownership and disposal of mutual fund units. For Tax Benefits / Consequences, Please refer to page 14^ Calculated on all calendar days# Dedicated Fund Manager for Overseas Investments: Mr Rakesh Vyas since May 10, 2012.
HDFC Liquid Fund
Open-ended Liquid Income Scheme
● Income over short term.● Investment in debt and money market instruments.● Low risk. ((BBlluuee))
Shobhit Mehrotra (since Feb 16, 04)#
October 17, 2000
Nil
HDFC Liquid Fund, HDFC Liquid Fund - Direct Plan
Under both the Plans: Growth & Dividend Option. TheDividend Option offers Daily Dividend Option(Reinvestment facility only) and Weekly and MonthlyDividend Option (with Payout and Reinvestment facility).
Purchase ` 10,000 and any amount thereafter; Additional Purchase ` 5,000 and any amount thereafter.
Every Business Day ^
Normally despatched within 1 Business Day.
NNoott AApppplliiccaabbllee.. Upfront commission shall be paid directly by the investor to the ARN Holder (AMFI registered Distributor) based on the investors’ assessment of various factors including the service rendered by the ARN Holder.
FFoorr ffuurrtthheerr ddeettaaiillss,, pplleeaassee rreeffeerr ttoo ppaarraa ‘‘EExxiitt LLooaadd’’ oonn PPgg 1144..
Intouchmutually January 2014 13
Features of our select schemes
(Brown) - Investors understand that their principal will be at high risk.
(Blue) - Investors understand that their principal will be at low risk.(Yellow) - Investors understand that their principal will be at medium risk.
~~ Investors should consult their financial advisers if in doubt about whether the product is suitable for them.NNoottee:: RRiisskk iiss rreepprreesseenntteedd aass::
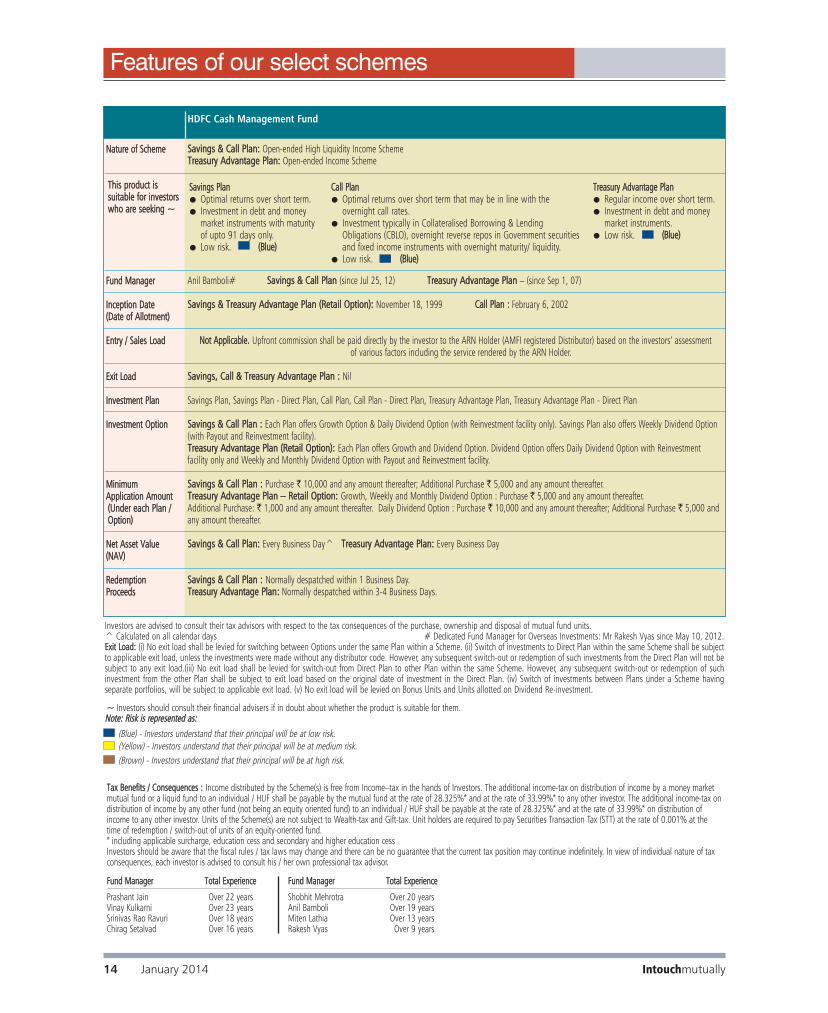
Investors are advised to consult their tax advisors with respect to the tax consequences of the purchase, ownership and disposal of mutual fund units.^ Calculated on all calendar days # Dedicated Fund Manager for Overseas Investments: Mr Rakesh Vyas since May 10, 2012. EExxiitt LLooaadd:: (i) No exit load shall be levied for switching between Options under the same Plan within a Scheme. (ii) Switch of investments to Direct Plan within the same Scheme shall be subjectto applicable exit load, unless the investments were made without any distributor code. However, any subsequent switch-out or redemption of such investments from the Direct Plan will not besubject to any exit load.(iii) No exit load shall be levied for switch-out from Direct Plan to other Plan within the same Scheme. However, any subsequent switch-out or redemption of such investment from the other Plan shall be subject to exit load based on the original date of investment in the Direct Plan. (iv) Switch of investments between Plans under a Scheme having separate portfolios, will be subject to applicable exit load. (v) No exit load will be levied on Bonus Units and Units allotted on Dividend Re-investment.
TTaaxx BBeenneeffiittss // CCoonnsseeqquueenncceess :: Income distributed by the Scheme(s) is free from Income–tax in the hands of Investors. The additional income-tax on distribution of income by a money marketmutual fund or a liquid fund to an individual / HUF shall be payable by the mutual fund at the rate of 28.325%* and at the rate of 33.99%* to any other investor. The additional income-tax ondistribution of income by any other fund (not being an equity oriented fund) to an individual / HUF shall be payable at the rate of 28.325%* and at the rate of 33.99%* on distribution ofincome to any other investor. Units of the Scheme(s) are not subject to Wealth-tax and Gift-tax. Unit holders are required to pay Securities Transaction Tax (STT) at the rate of 0.001% at the time of redemption / switch-out of units of an equity-oriented fund.* including applicable surcharge, education cess and secondary and higher education cessInvestors should be aware that the fiscal rules / tax laws may change and there can be no guarantee that the current tax position may continue indefinitely. In view of individual nature of taxconsequences, each investor is advised to consult his / her own professional tax advisor.
Prashant Jain Over 22 yearsVinay Kulkarni Over 23 yearsSrinivas Rao Ravuri Over 18 yearsChirag Setalvad Over 16 years
Shobhit Mehrotra Over 20 yearsAnil Bamboli Over 19 yearsMiten Lathia Over 13 yearsRakesh Vyas Over 9 years
FFuunndd MMaannaaggeerr TToottaall EExxppeerriieennccee FFuunndd MMaannaaggeerr TToottaall EExxppeerriieennccee
Nature of Scheme
TThhiiss pprroodduucctt iiss ssuuiittaabbllee ffoorr iinnvveessttoorrsswwhhoo aarree sseeeekkiinngg ~~
Fund Manager
Inception Date(Date of Allotment)
Entry / Sales Load
Exit Load
Investment Plan
Investment Option
Minimum Application Amount((UUnnddeerr eeaacchh PPllaann //OOppttiioonn))
Net Asset Value (NAV)
RedemptionProceeds
HDFC Cash Management Fund
Savings & Call Plan: Open-ended High Liquidity Income SchemeTreasury Advantage Plan: Open-ended Income Scheme
Anil Bamboli# Savings & Call Plan (since Jul 25, 12) Treasury Advantage Plan – (since Sep 1, 07)
Savings & Treasury Advantage Plan (Retail Option): November 18, 1999 CCaallll PPllaann :: February 6, 2002
NNoott AApppplliiccaabbllee.. Upfront commission shall be paid directly by the investor to the ARN Holder (AMFI registered Distributor) based on the investors’ assessment of various factors including the service rendered by the ARN Holder.
Savings, Call & Treasury Advantage Plan : Nil
Savings Plan, Savings Plan - Direct Plan, Call Plan, Call Plan - Direct Plan, Treasury Advantage Plan, Treasury Advantage Plan - Direct Plan
Savings & Call Plan : Each Plan offers Growth Option & Daily Dividend Option (with Reinvestment facility only). Savings Plan also offers Weekly Dividend Option(with Payout and Reinvestment facility). Treasury Advantage Plan (Retail Option): Each Plan offers Growth and Dividend Option. Dividend Option offers Daily Dividend Option with Reinvestment facility only and Weekly and Monthly Dividend Option with Payout and Reinvestment facility.
Savings & Call Plan : Purchase ` 10,000 and any amount thereafter; Additional Purchase ` 5,000 and any amount thereafter.Treasury Advantage Plan – Retail Option: Growth, Weekly and Monthly Dividend Option : Purchase ` 5,000 and any amount thereafter.Additional Purchase: ` 1,000 and any amount thereafter. Daily Dividend Option : Purchase ` 10,000 and any amount thereafter; Additional Purchase ` 5,000 andany amount thereafter.
Savings & Call Plan: Every Business Day^ Treasury Advantage Plan: Every Business Day
Savings & Call Plan : Normally despatched within 1 Business Day.Treasury Advantage Plan: Normally despatched within 3-4 Business Days.
SSaavviinnggss PPllaann● Optimal returns over short term. ● Investment in debt and money
market instruments with maturityof upto 91 days only.
● Low risk. ((BBlluuee))
TTrreeaassuurryy AAddvvaannttaaggee PPllaann● Regular income over short term.● Investment in debt and money
market instruments.● Low risk. ((BBlluuee))
CCaallll PPllaann● Optimal returns over short term that may be in line with the
overnight call rates. ● Investment typically in Collateralised Borrowing & Lending
Obligations (CBLO), overnight reverse repos in Government securitiesand fixed income instruments with overnight maturity/ liquidity.
● Low risk. ((BBlluuee))
Intouchmutually14 January 2014
Features of our select schemes
(Brown) - Investors understand that their principal will be at high risk.
(Blue) - Investors understand that their principal will be at low risk.(Yellow) - Investors understand that their principal will be at medium risk.
~~ Investors should consult their financial advisers if in doubt about whether the product is suitable for them.NNoottee:: RRiisskk iiss rreepprreesseenntteedd aass::

Portfolio – Top 10 Holdings
HDFC Growth Fund
$ Sponsor
An open-ended growth scheme
HDFC Equity FundAn open-ended growth scheme
Banks 16.69Software 16.53Petroleum Products 10.49Pharmaceuticals 8.03Consumer Non Durables 7.79Finance 5.16Industrial Capital Goods 4.64Oil 4.37Chemicals 3.95Auto 3.50
Construction 2.56Gas 2.28Minerals / Mining 2.17Cement 2.00Telecom - Services 1.73Textile - Synthetic 1.44Construction Project 1.37Ferrous Metals 1.30Power 0.98Industrial Products 0.47
Industry Allocation of Equity Holding (% of Net Assets)
PPoorrttffoolliioo TTuurrnnoovveerr RRaattiioo ((LLaasstt 11 YYeeaarr)) 2233..4499%%
NAV NAV per Unit (`)
Growth Option 88.358Dividend Option 25.342Direct Plan - Growth Option 88.777Direct Plan - Dividend Option 25.463
Std Deviation Beta Sharpe Ratio*
Risk Ratio 5.09% 0.9591 -0.097(for the 3-yr period ended Jan 31, 14)Based on month-end NAV
Std Deviation Beta Sharpe Ratio*
Risk Ratio 5.94% 1.0572 -0.070(for the 3-yr period ended Jan 31, 14)Based on month-end NAV
NAV NAV per Unit (`)
Growth Option 289.523Dividend Option 40.142Direct Plan - Growth Option 291.625Direct Plan - Dividend Option 40.439
Portfolio – Top 10 Holdings
PPoorrttffoolliioo TTuurrnnoovveerr RRaattiioo ((LLaasstt 11 YYeeaarr)) 3399..0077%%
Banks 20.70Software 18.09Petroleum Products 9.76Auto 6.70Consumer Non Durables 6.36Pharmaceuticals 5.59Finance 4.80Construction Project 4.16Oil 4.15Power 3.24Industrial Capital Goods 2.89
Construction 1.61Auto Ancillaries 1.54Telecom - Services 1.48Minerals / Mining 1.32Ferrous Metals 1.26Textile Products 1.23Transportation 1.23Industrial Products 0.91Cement 0.81Media And Entertainment 0.65Fertilisers 0.46
Industry Allocation of Equity Holding (% of Net Assets)
CCoommppaannyy IInndduussttrryy++ %% ttoo NNAAVV
EEQQUUIITTYY && EEQQUUIITTYY RREELLAATTEEDD
Infosys Ltd. Software 9.60
ICICI Bank Ltd. Banks 7.97
ITC Ltd. Consumer Non Durables 7.79
Reliance Industries Ltd. Petroleum Products 6.51
Housing Development Finance Corporation Ltd. $ Finance 5.16
State Bank of India Banks 4.64
Tata Consultancy Services Ltd. Software 4.12
Bharat Petroleum Corporation Ltd. Petroleum Products 3.98
Solar Industries India Ltd. Chemicals 3.95
Tata Motors Ltd. DVR Auto 3.50
TToottaall ooff TToopp TTeenn EEqquuiittyy && EEqquuiittyy RReellaatteedd HHoollddiinnggss 5577..2222
TToottaall EEqquuiittyy && EEqquuiittyy RReellaatteedd HHoollddiinnggss 9977..4455
Cash, Cash Equivalents and Net Current Assets 2.55
GGrraanndd TToottaall 110000..0000
AAvveerraaggee AAUUMM ffoorr tthhee qquuaarrtteerr eennddeedd DDeecceemmbbeerr 3311,, 22001133 ((`̀ IInn LLaakkhhss)) 110011,,990033..4444
CCoommppaannyy IInndduussttrryy++ %% ttoo NNAAVV
EEQQUUIITTYY && EEQQUUIITTYY RREELLAATTEEDD
Infosys Ltd. Software 9.83
ICICI Bank Ltd. Banks 6.91
State Bank of India Banks 5.88
Aurobindo Pharma Ltd. Pharmaceuticals 4.19
Reliance Industries Ltd. Petroleum Products 3.77
Tata Consultancy Services Ltd. Software 3.77
Tata Motors Ltd. DVR Auto 3.75
Larsen & Toubro Ltd. Construction Project 3.73
ITC Ltd. Consumer Non Durables 3.52
Bharat Petroleum Corporation Ltd. Petroleum Products 3.15
TToottaall ooff TToopp TTeenn EEqquuiittyy && EEqquuiittyy RReellaatteedd HHoollddiinnggss 4488..5500
TToottaall EEqquuiittyy && EEqquuiittyy RReellaatteedd HHoollddiinnggss 9988..9944
Cash, Cash Equivalents and Net Current Assets 1.06
GGrraanndd TToottaall 110000..0000
AAvveerraaggee AAUUMM ffoorr tthhee qquuaarrtteerr eennddeedd DDeecceemmbbeerr 3311,, 22001133 ((`̀ IInn LLaakkhhss)) 11,,002244,,994488..7777
Source for Risk ratio: CRISIL Fund Analyser * Risk-free rate assumed to be 8.90% (364-day Treasury Bill yield on 31-01-14
Face Value per Unit: ` 10 unless otherwise specified + Industry Classification as recommended by AMFI Data is as of January 31, 2014 unless otherwise specified.
Intouchmutually January 2014 15
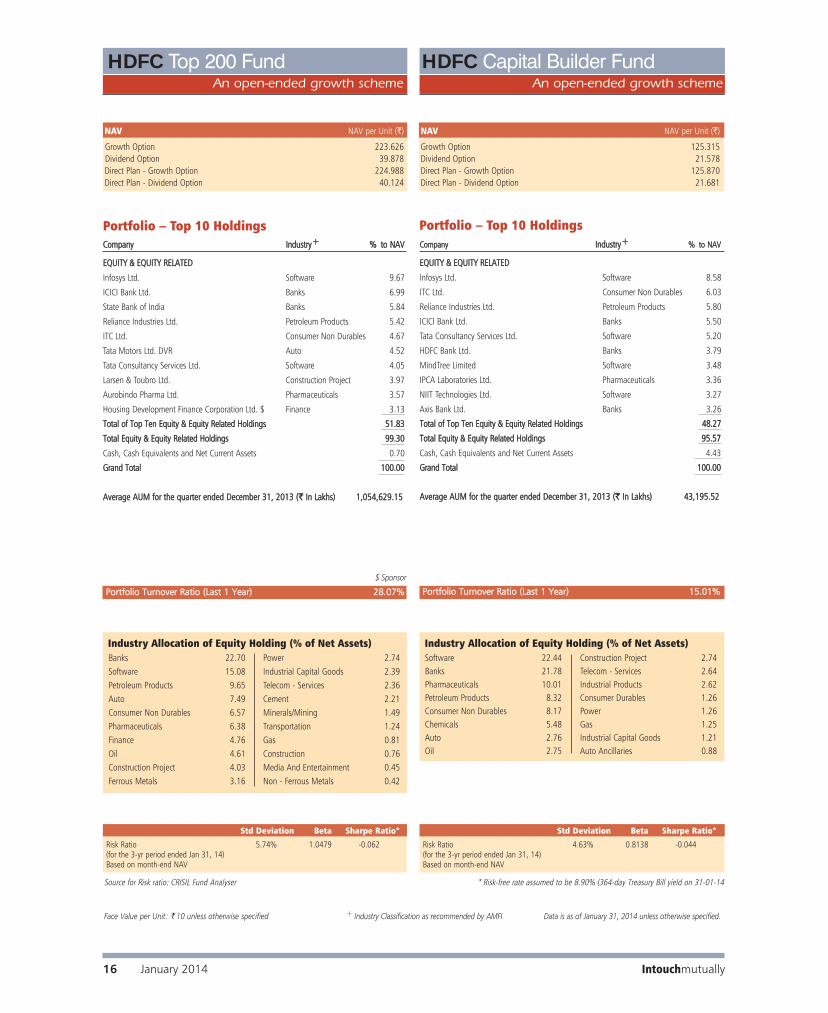
HDFC Top 200 FundAn open-ended growth scheme
HDFC Capital Builder FundAn open-ended growth scheme
NAV NAV per Unit (`)
Growth Option 125.315Dividend Option 21.578Direct Plan - Growth Option 125.870Direct Plan - Dividend Option 21.681
NAV NAV per Unit (`)
Growth Option 223.626Dividend Option 39.878Direct Plan - Growth Option 224.988Direct Plan - Dividend Option 40.124
CCoommppaannyy IInndduussttrryy++ %% ttoo NNAAVV
EEQQUUIITTYY && EEQQUUIITTYY RREELLAATTEEDD
Infosys Ltd. Software 9.67
ICICI Bank Ltd. Banks 6.99
State Bank of India Banks 5.84
Reliance Industries Ltd. Petroleum Products 5.42
ITC Ltd. Consumer Non Durables 4.67
Tata Motors Ltd. DVR Auto 4.52
Tata Consultancy Services Ltd. Software 4.05
Larsen & Toubro Ltd. Construction Project 3.97
Aurobindo Pharma Ltd. Pharmaceuticals 3.57
Housing Development Finance Corporation Ltd. $ Finance 3.13
TToottaall ooff TToopp TTeenn EEqquuiittyy && EEqquuiittyy RReellaatteedd HHoollddiinnggss 5511..8833
TToottaall EEqquuiittyy && EEqquuiittyy RReellaatteedd HHoollddiinnggss 9999..3300
Cash, Cash Equivalents and Net Current Assets 0.70
GGrraanndd TToottaall 110000..0000
AAvveerraaggee AAUUMM ffoorr tthhee qquuaarrtteerr eennddeedd DDeecceemmbbeerr 3311,, 22001133 ((`̀ IInn LLaakkhhss)) 11,,005544,,662299..1155
Portfolio – Top 10 Holdings Portfolio – Top 10 Holdings
PPoorrttffoolliioo TTuurrnnoovveerr RRaattiioo ((LLaasstt 11 YYeeaarr)) 1155..0011%%
CCoommppaannyy IInndduussttrryy++ %% ttoo NNAAVV
EEQQUUIITTYY && EEQQUUIITTYY RREELLAATTEEDD
Infosys Ltd. Software 8.58
ITC Ltd. Consumer Non Durables 6.03
Reliance Industries Ltd. Petroleum Products 5.80
ICICI Bank Ltd. Banks 5.50
Tata Consultancy Services Ltd. Software 5.20
HDFC Bank Ltd. Banks 3.79
MindTree Limited Software 3.48
IPCA Laboratories Ltd. Pharmaceuticals 3.36
NIIT Technologies Ltd. Software 3.27
Axis Bank Ltd. Banks 3.26
TToottaall ooff TToopp TTeenn EEqquuiittyy && EEqquuiittyy RReellaatteedd HHoollddiinnggss 4488..2277
TToottaall EEqquuiittyy && EEqquuiittyy RReellaatteedd HHoollddiinnggss 9955..5577
Cash, Cash Equivalents and Net Current Assets 4.43
GGrraanndd TToottaall 110000..0000
AAvveerraaggee AAUUMM ffoorr tthhee qquuaarrtteerr eennddeedd DDeecceemmbbeerr 3311,, 22001133 ((`̀ IInn LLaakkhhss)) 4433,,119955..5522
Banks 22.70Software 15.08Petroleum Products 9.65Auto 7.49Consumer Non Durables 6.57Pharmaceuticals 6.38Finance 4.76Oil 4.61Construction Project 4.03Ferrous Metals 3.16
Power 2.74Industrial Capital Goods 2.39Telecom - Services 2.36Cement 2.21Minerals/Mining 1.49Transportation 1.24Gas 0.81Construction 0.76Media And Entertainment 0.45Non - Ferrous Metals 0.42
Industry Allocation of Equity Holding (% of Net Assets)Software 22.44Banks 21.78Pharmaceuticals 10.01Petroleum Products 8.32Consumer Non Durables 8.17Chemicals 5.48Auto 2.76Oil 2.75
Construction Project 2.74Telecom - Services 2.64Industrial Products 2.62Consumer Durables 1.26Power 1.26Gas 1.25Industrial Capital Goods 1.21Auto Ancillaries 0.88
Industry Allocation of Equity Holding (% of Net Assets)
Std Deviation Beta Sharpe Ratio*
Risk Ratio 5.74% 1.0479 -0.062(for the 3-yr period ended Jan 31, 14)Based on month-end NAV
Std Deviation Beta Sharpe Ratio*
Risk Ratio 4.63% 0.8138 -0.044(for the 3-yr period ended Jan 31, 14)Based on month-end NAV
PPoorrttffoolliioo TTuurrnnoovveerr RRaattiioo ((LLaasstt 11 YYeeaarr)) 2288..0077%%
Face Value per Unit: ` 10 unless otherwise specified + Industry Classification as recommended by AMFI Data is as of January 31, 2014 unless otherwise specified.
16 January 2014 Intouchmutually
Source for Risk ratio: CRISIL Fund Analyser * Risk-free rate assumed to be 8.90% (364-day Treasury Bill yield on 31-01-14
$ Sponsor
An open-ended growth scheme An open-ended growth scheme
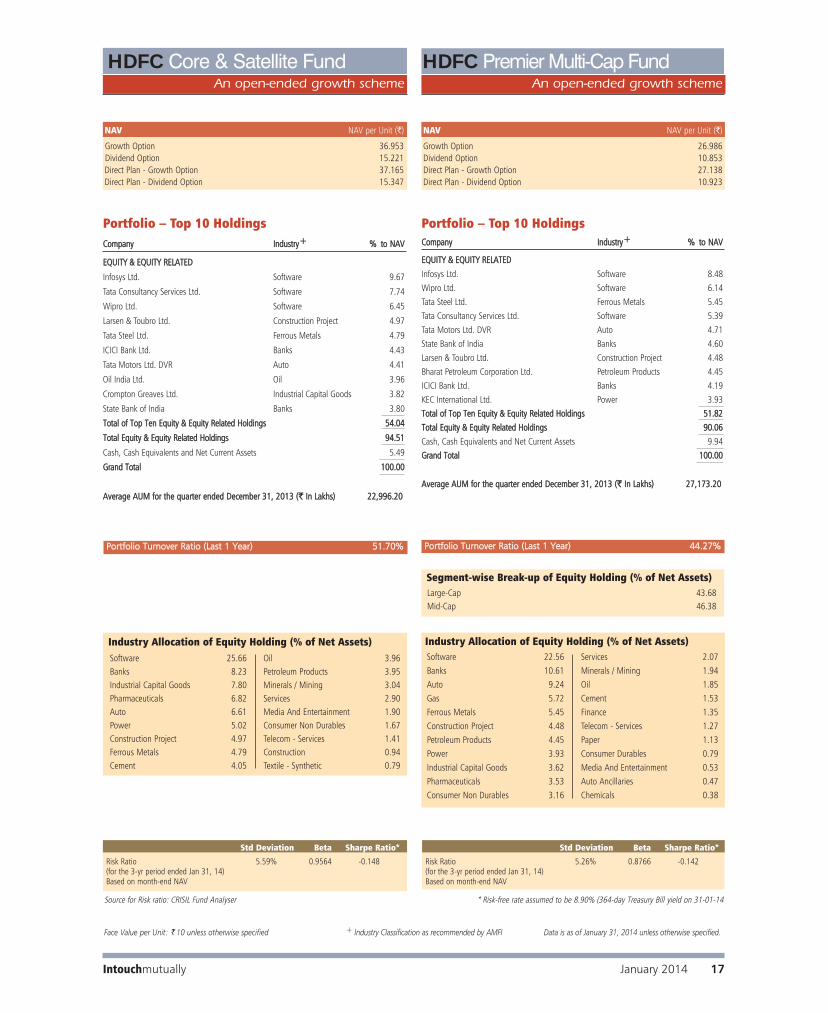
HDFC Core & Satellite Fund
PPoorrttffoolliioo TTuurrnnoovveerr RRaattiioo ((LLaasstt 11 YYeeaarr)) 5511..7700%%
Software 25.66Banks 8.23Industrial Capital Goods 7.80Pharmaceuticals 6.82Auto 6.61Power 5.02Construction Project 4.97Ferrous Metals 4.79Cement 4.05
Oil 3.96Petroleum Products 3.95Minerals / Mining 3.04Services 2.90Media And Entertainment 1.90Consumer Non Durables 1.67Telecom - Services 1.41Construction 0.94Textile - Synthetic 0.79
Industry Allocation of Equity Holding (% of Net Assets)
NAV NAV per Unit (`)
Growth Option 36.953Dividend Option 15.221Direct Plan - Growth Option 37.165Direct Plan - Dividend Option 15.347
NAV NAV per Unit (`)
Growth Option 26.986Dividend Option 10.853Direct Plan - Growth Option 27.138Direct Plan - Dividend Option 10.923
Software 22.56Banks 10.61Auto 9.24Gas 5.72Ferrous Metals 5.45Construction Project 4.48Petroleum Products 4.45Power 3.93Industrial Capital Goods 3.62Pharmaceuticals 3.53Consumer Non Durables 3.16
Services 2.07Minerals / Mining 1.94Oil 1.85Cement 1.53Finance 1.35Telecom - Services 1.27Paper 1.13Consumer Durables 0.79Media And Entertainment 0.53Auto Ancillaries 0.47Chemicals 0.38
Industry Allocation of Equity Holding (% of Net Assets)
PPoorrttffoolliioo TTuurrnnoovveerr RRaattiioo ((LLaasstt 11 YYeeaarr)) 4444..2277%%
HDFC Premier Multi-Cap Fund
CCoommppaannyy IInndduussttrryy++ %% ttoo NNAAVV
EEQQUUIITTYY && EEQQUUIITTYY RREELLAATTEEDD
Infosys Ltd. Software 9.67
Tata Consultancy Services Ltd. Software 7.74
Wipro Ltd. Software 6.45
Larsen & Toubro Ltd. Construction Project 4.97
Tata Steel Ltd. Ferrous Metals 4.79
ICICI Bank Ltd. Banks 4.43
Tata Motors Ltd. DVR Auto 4.41
Oil India Ltd. Oil 3.96
Crompton Greaves Ltd. Industrial Capital Goods 3.82
State Bank of India Banks 3.80
TToottaall ooff TToopp TTeenn EEqquuiittyy && EEqquuiittyy RReellaatteedd HHoollddiinnggss 5544..0044
TToottaall EEqquuiittyy && EEqquuiittyy RReellaatteedd HHoollddiinnggss 9944..5511
Cash, Cash Equivalents and Net Current Assets 5.49
GGrraanndd TToottaall 110000..0000
AAvveerraaggee AAUUMM ffoorr tthhee qquuaarrtteerr eennddeedd DDeecceemmbbeerr 3311,, 22001133 ((`̀ IInn LLaakkhhss)) 2222,,999966..2200
Portfolio – Top 10 Holdings
Std Deviation Beta Sharpe Ratio*
Risk Ratio 5.59% 0.9564 -0.148(for the 3-yr period ended Jan 31, 14)Based on month-end NAV
Source for Risk ratio: CRISIL Fund Analyser * Risk-free rate assumed to be 8.90% (364-day Treasury Bill yield on 31-01-14
Std Deviation Beta Sharpe Ratio*
Risk Ratio 5.26% 0.8766 -0.142(for the 3-yr period ended Jan 31, 14)Based on month-end NAV
Large-Cap 43.68Mid-Cap 46.38
Segment-wise Break-up of Equity Holding (% of Net Assets)
CCoommppaannyy IInndduussttrryy++ %% ttoo NNAAVV
EEQQUUIITTYY && EEQQUUIITTYY RREELLAATTEEDD
Infosys Ltd. Software 8.48
Wipro Ltd. Software 6.14
Tata Steel Ltd. Ferrous Metals 5.45
Tata Consultancy Services Ltd. Software 5.39
Tata Motors Ltd. DVR Auto 4.71
State Bank of India Banks 4.60
Larsen & Toubro Ltd. Construction Project 4.48
Bharat Petroleum Corporation Ltd. Petroleum Products 4.45
ICICI Bank Ltd. Banks 4.19
KEC International Ltd. Power 3.93 TToottaall ooff TToopp TTeenn EEqquuiittyy && EEqquuiittyy RReellaatteedd HHoollddiinnggss 5511..8822
TToottaall EEqquuiittyy && EEqquuiittyy RReellaatteedd HHoollddiinnggss 9900..0066
Cash, Cash Equivalents and Net Current Assets 9.94 GGrraanndd TToottaall 110000..0000
AAvveerraaggee AAUUMM ffoorr tthhee qquuaarrtteerr eennddeedd DDeecceemmbbeerr 3311,, 22001133 ((`̀ IInn LLaakkhhss)) 2277,,117733..2200
Portfolio – Top 10 Holdings
Face Value per Unit: ` 10 unless otherwise specified + Industry Classification as recommended by AMFI Data is as of January 31, 2014 unless otherwise specified.
Intouchmutually January 2014 17

PPoorrttffoolliioo TTuurrnnoovveerr RRaattiioo ((LLaasstt 11 YYeeaarr)) 2233..4455%% PPoorrttffoolliioo TTuurrnnoovveerr RRaattiioo ((LLaasstt 11 YYeeaarr)) 3399..1177%%
HDFC Mid-Cap Opportunities FundAn open-ended equity scheme
NAV NAV per Unit (`)
Growth Option 19.938Dividend Option 16.750Direct Plan - Growth Option 20.044Direct Plan - Dividend Option 16.846
Portfolio – Top 10 Holdings
Pharmaceuticals 17.07Software 14.15Industrial Products 13.77Banks 12.74Consumer Durables 7.97Auto Ancillaries 6.51Chemicals 4.12Industrial Capital Goods 4.06Consumer Non Durables 2.76
Construction 2.31Pesticides 2.25Media And Entertainment 1.70Transportation 1.51Oil 1.26Petroleum Products 1.15Finance 1.12Construction Project 1.06Power 0.26
Industry Allocation of Equity Holding (% of Net Assets)
Mid-Cap 93.63Small-Cap 2.14
Segment-wise Break-up of Equity Holding (% of Net Assets)
CCoommppaannyy IInndduussttrryy++ %% ttoo NNAAVV
EEQQUUIITTYY && EEQQUUIITTYY RREELLAATTEEDD
IPCA Laboratories Ltd. Pharmaceuticals 4.26
Aurobindo Pharma Ltd. Pharmaceuticals 4.22
Supreme Industries Ltd. Industrial Products 3.88
MindTree Limited Software 3.67
NIIT Technologies Ltd. Software 3.24
Torrent Pharmaceuticals Ltd. Pharmaceuticals 2.91
eClerx Services Ltd. Software 2.67
Divi's Laboratories Ltd. Pharmaceuticals 2.66
Persistent Systems Limited Software 2.54
Lupin Ltd. Pharmaceuticals 2.53
TToottaall ooff TToopp TTeenn EEqquuiittyy && EEqquuiittyy RReellaatteedd HHoollddiinnggss 3322..5588
TToottaall EEqquuiittyy && EEqquuiittyy RReellaatteedd HHoollddiinnggss 9955..7777
Cash, Cash Equivalents and Net Current Assets 4.23
GGrraanndd TToottaall 110000..0000
AAvveerraaggee AAUUMM ffoorr tthhee qquuaarrtteerr eennddeedd DDeecceemmbbeerr 3311,, 22001133 ((`̀ IInn LLaakkhhss)) 228800,,229966..0011
Std Deviation Beta Sharpe Ratio*
Risk Ratio 5.11% 0.7551 0.044(for the 3-yr period ended Jan 31, 14)Based on month-end NAV
Source for Risk ratio: CRISIL Fund Analyser * Risk-free rate assumed to be 8.90% (364-day Treasury Bill yield on 31-01-14
HDFC Focused Large-Cap FundAn open-ended equity scheme
Portfolio – Top 10 Holdings
NAV NAV per Unit (`)
Growth Option 16.212Dividend Option 10.390Direct Plan - Growth Option 16.304Direct Plan - Dividend Option 10.429
CCoommppaannyy IInndduussttrryy++ %% ttoo NNAAVV
EEQQUUIITTYY && EEQQUUIITTYY RREELLAATTEEDD
Infosys Ltd. Software 8.66
ICICI Bank Ltd. Banks 7.71
Reliance Industries Ltd. Petroleum Products 7.49
ITC Ltd. Consumer Non Durables 7.40
Tata Consultancy Services Ltd. Software 5.55
Oil India Ltd. Oil 5.35
State Bank of India Banks 5.10
Bharat Petroleum Corporation Ltd. Petroleum Products 4.24
HDFC Bank Ltd. Banks 4.13
Tata Motors Ltd. DVR Auto 3.42
TToottaall ooff TToopp TTeenn EEqquuiittyy && EEqquuiittyy RReellaatteedd HHoollddiinnggss 5599..0055
TToottaall EEqquuiittyy && EEqquuiittyy RReellaatteedd HHoollddiinnggss 9988..1111
Cash, Cash Equivalents and Net Current Assets 1.89
GGrraanndd TToottaall 110000..0000
AAvveerraaggee AAUUMM ffoorr tthhee qquuaarrtteerr eennddeedd DDeecceemmbbeerr 3311,, 22001133 ((`̀ IInn LLaakkhhss)) 4400,,778822..0033
Banks 23.16Software 17.14Petroleum Products 11.73Consumer Non Durables 7.96Oil 7.67Pharmaceuticals 4.77Minerals / Mining 4.41Auto 4.32Telecom - Services 3.55
Construction Project 2.69Cement 2.36Ferrous Metals 1.80Construction 1.71Power 1.69Transportation 1.43Finance 0.91Gas 0.81
Industry Allocation of Equity Holding (% of Net Assets)
Std Deviation Beta Sharpe Ratio*
Risk Ratio 5.61% 1.0176 -0.096(for the 3-yr period ended Jan 31, 14)Based on month-end NAV
Face Value per Unit: ` 10 unless otherwise specified + Industry Classification as recommended by AMFI Data is as of January 31, 2014 unless otherwise specified.
18 January 2014 Intouchmutually
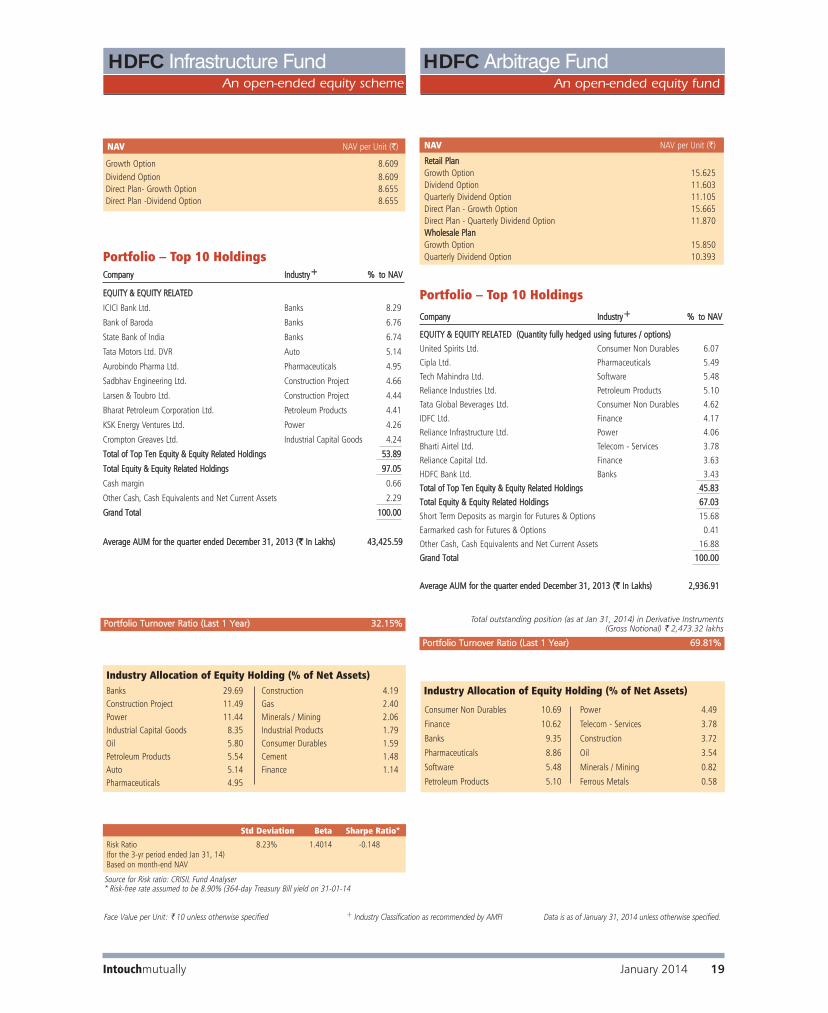
NAV NAV per Unit (`)
RReettaaiill PPllaannGrowth Option 15.625Dividend Option 11.603Quarterly Dividend Option 11.105Direct Plan - Growth Option 15.665Direct Plan - Quarterly Dividend Option 11.870WWhhoolleessaallee PPllaannGrowth Option 15.850Quarterly Dividend Option 10.393
An open-ended equity fund
HDFC Arbitrage Fund
Consumer Non Durables 10.69
Finance 10.62
Banks 9.35
Pharmaceuticals 8.86
Software 5.48
Petroleum Products 5.10
Power 4.49
Telecom - Services 3.78
Construction 3.72
Oil 3.54
Minerals / Mining 0.82
Ferrous Metals 0.58
Industry Allocation of Equity Holding (% of Net Assets)
CCoommppaannyy IInndduussttrryy++ %% ttoo NNAAVV
EEQQUUIITTYY && EEQQUUIITTYY RREELLAATTEEDD ((QQuuaannttiittyy ffuullllyy hheeddggeedd uussiinngg ffuuttuurreess // ooppttiioonnss))
United Spirits Ltd. Consumer Non Durables 6.07
Cipla Ltd. Pharmaceuticals 5.49
Tech Mahindra Ltd. Software 5.48
Reliance Industries Ltd. Petroleum Products 5.10
Tata Global Beverages Ltd. Consumer Non Durables 4.62
IDFC Ltd. Finance 4.17
Reliance Infrastructure Ltd. Power 4.06
Bharti Airtel Ltd. Telecom - Services 3.78
Reliance Capital Ltd. Finance 3.63
HDFC Bank Ltd. Banks 3.43TToottaall ooff TToopp TTeenn EEqquuiittyy && EEqquuiittyy RReellaatteedd HHoollddiinnggss 4455..8833
TToottaall EEqquuiittyy && EEqquuiittyy RReellaatteedd HHoollddiinnggss 6677..0033
Short Term Deposits as margin for Futures & Options 15.68
Earmarked cash for Futures & Options 0.41
Other Cash, Cash Equivalents and Net Current Assets 16.88GGrraanndd TToottaall 110000..0000
AAvveerraaggee AAUUMM ffoorr tthhee qquuaarrtteerr eennddeedd DDeecceemmbbeerr 3311,, 22001133 ((`̀ IInn LLaakkhhss)) 22,,993366..9911
Portfolio – Top 10 Holdings
PPoorrttffoolliioo TTuurrnnoovveerr RRaattiioo ((LLaasstt 11 YYeeaarr)) 6699..8811%%
HDFC Infrastructure FundAn open-ended equity scheme
Portfolio – Top 10 Holdings
NAV NAV per Unit (`)
Growth Option 8.609Dividend Option 8.609Direct Plan- Growth Option 8.655Direct Plan -Dividend Option 8.655
CCoommppaannyy IInndduussttrryy++ %% ttoo NNAAVV
EEQQUUIITTYY && EEQQUUIITTYY RREELLAATTEEDD
ICICI Bank Ltd. Banks 8.29
Bank of Baroda Banks 6.76
State Bank of India Banks 6.74
Tata Motors Ltd. DVR Auto 5.14
Aurobindo Pharma Ltd. Pharmaceuticals 4.95
Sadbhav Engineering Ltd. Construction Project 4.66
Larsen & Toubro Ltd. Construction Project 4.44
Bharat Petroleum Corporation Ltd. Petroleum Products 4.41
KSK Energy Ventures Ltd. Power 4.26
Crompton Greaves Ltd. Industrial Capital Goods 4.24
TToottaall ooff TToopp TTeenn EEqquuiittyy && EEqquuiittyy RReellaatteedd HHoollddiinnggss 5533..8899
TToottaall EEqquuiittyy && EEqquuiittyy RReellaatteedd HHoollddiinnggss 9977..0055
Cash margin 0.66
Other Cash, Cash Equivalents and Net Current Assets 2.29
GGrraanndd TToottaall 110000..0000
AAvveerraaggee AAUUMM ffoorr tthhee qquuaarrtteerr eennddeedd DDeecceemmbbeerr 3311,, 22001133 ((`̀ IInn LLaakkhhss)) 4433,,442255..5599
Banks 29.69Construction Project 11.49Power 11.44Industrial Capital Goods 8.35Oil 5.80Petroleum Products 5.54Auto 5.14Pharmaceuticals 4.95
Construction 4.19Gas 2.40Minerals / Mining 2.06Industrial Products 1.79Consumer Durables 1.59Cement 1.48Finance 1.14
Industry Allocation of Equity Holding (% of Net Assets)
PPoorrttffoolliioo TTuurrnnoovveerr RRaattiioo ((LLaasstt 11 YYeeaarr)) 3322..1155%%
Std Deviation Beta Sharpe Ratio*
Risk Ratio 8.23% 1.4014 -0.148(for the 3-yr period ended Jan 31, 14)Based on month-end NAV
Source for Risk ratio: CRISIL Fund Analyser* Risk-free rate assumed to be 8.90% (364-day Treasury Bill yield on 31-01-14
Face Value per Unit: ` 10 unless otherwise specified + Industry Classification as recommended by AMFI Data is as of January 31, 2014 unless otherwise specified.
Intouchmutually January 2014 19
Total outstanding position (as at Jan 31, 2014) in Derivative Instruments(Gross Notional) ` 2,473.32 lakhs

HDFC Index Fund
NIFTY Plan (Face Value per Unit: ` 10.3260)
NAV NAV per Unit (`)
Growth Option 53.0163Direct Plan - Growth Option 53.1400
CCoommppaannyy IInndduussttrryy++ %% ttoo NNAAVV
EEQQUUIITTYY && EEQQUUIITTYY RREELLAATTEEDD
Infosys Ltd. Software 8.60
ITC Ltd. Consumer Non Durables 8.55
Reliance Industries Ltd. Petroleum Products 6.53
Housing Development Finance Corporation Ltd. $ Finance 6.01
HDFC Bank Ltd. Banks 5.56
Tata Consultancy Services Ltd. Software 5.53
ICICI Bank Ltd. Banks 5.51
Larsen & Toubro Ltd. Construction Project 3.86
Tata Motors Ltd. Auto 3.00
Oil & Natural Gas Corporation Ltd. Oil 2.32
TToottaall ooff TToopp TTeenn EEqquuiittyy && EEqquuiittyy RReellaatteedd HHoollddiinnggss 5555..4477
TToottaall EEqquuiittyy && EEqquuiittyy RReellaatteedd HHoollddiinnggss 9955..8866
Cash, Cash Equivalents and Net Current Assets 4.14
GGrraanndd TToottaall 110000..0000
AAvveerraaggee AAUUMM ffoorr tthhee qquuaarrtteerr eennddeedd DDeecceemmbbeerr 3311,, 22001133 ((`̀ IInn LLaakkhhss)) 44,,886666..9933
Portfolio – Top 10 Holdings
PPoorrttffoolliioo TTuurrnnoovveerr RRaattiioo ((LLaasstt 11 YYeeaarr)) 5544..3366%%
$ Sponsor
An open-ended index linked scheme
Software 17.78
Banks 17.45
Consumer Non Durables 11.62
Auto 8.44
Petroleum Products 6.99
Finance 6.56
Pharmaceuticals 5.96
Construction Project 3.86
Oil 3.26
Power 2.80
Cement 2.66
Minerals / Mining 2.36
Telecom - Services 1.86
Ferrous Metals 1.64
Gas 0.79
Non - Ferrous Metals 0.71
Industrial Capital Goods 0.67
Construction 0.45
Industry Allocation of Equity Holding (% of Net Assets)
TTrraacckkiinngg EErrrroorr SSiinnccee IInncceeppttiioonn ((AAnnnnuuaalliisseedd)) 22..6600%%
CCoommppaannyy IInndduussttrryy++ %% ttoo NNAAVV
EEQQUUIITTYY && EEQQUUIITTYY RREELLAATTEEDD
Infosys Ltd. Software 9.85
ITC Ltd. Consumer Non Durables 9.82
Reliance Industries Ltd. Petroleum Products 8.05
Tata Consultancy Services Ltd. Software 7.16
Housing Development Finance Corporation Ltd. $ Finance 6.97
HDFC Bank Ltd. Banks 6.59
ICICI Bank Ltd. Banks 6.26
Larsen & Toubro Ltd. Construction Project 4.45
Tata Motors Ltd. Auto 3.53
Oil & Natural Gas Corporation Ltd. Oil 3.30
TToottaall ooff TToopp TTeenn EEqquuiittyy && EEqquuiittyy RReellaatteedd HHoollddiinnggss 6655..9988
TToottaall EEqquuiittyy && EEqquuiittyy RReellaatteedd HHoollddiinnggss 9977..6655
Cash, Cash Equivalents and Net Current Assets 2.35
GGrraanndd TToottaall 110000..0000
AAvveerraaggee AAUUMM ffoorr tthhee qquuaarrtteerr eennddeedd DDeecceemmbbeerr 3311,, 22001133 ((`̀ IInn LLaakkhhss)) 33,,554400..7744
Portfolio – Top 10 Holdings
PPoorrttffoolliioo TTuurrnnoovveerr RRaattiioo ((LLaasstt 11 YYeeaarr)) 3399..5555%%
$ Sponsor
SENSEX Plan (Face Value per Unit: ` 32.1610)
NAV NAV per Unit (`)
Growth Option 173.3382Direct Plan - Growth Option 173.9373
An open-ended index linked scheme
HDFC Index Fund
Software 19.36
Banks 17.13
Consumer Non Durables 12.17
Auto 10.03
Petroleum Products 8.05
Finance 6.97
Pharmaceuticals 5.75
Construction Project 4.45
Oil 3.30
Minerals / Mining 2.23
Telecom - Services 2.15
Power 2.13
Ferrous Metals 1.31
Gas 0.99
Industrial Capital Goods 0.82
Non - Ferrous Metals 0.81
Industry Allocation of Equity Holding (% of Net Assets)
TTrraacckkiinngg EErrrroorr SSiinnccee IInncceeppttiioonn ((AAnnnnuuaalliisseedd)) 22..8855%%
+ Industry Classification as recommended by AMFI Data is as of January 31, 2014 unless otherwise specified.
20 January 2014 Intouchmutually

CCoommppaannyy IInndduussttrryy++ %% ttoo NNAAVV
EEQQUUIITTYY && EEQQUUIITTYY RREELLAATTEEDD
ITC Ltd. Consumer Non Durables 8.49
Infosys Ltd. Software 8.42
Reliance Industries Ltd. Petroleum Products 6.85
Tata Consultancy Services Ltd. Software 6.16
Housing Development Finance Corporation Ltd. $ Finance 5.76
HDFC Bank Ltd. Banks 5.58
ICICI Bank Ltd. Banks 5.31
Larsen & Toubro Ltd. Construction Project 3.78
Solar Industries India Ltd. Chemicals 3.17
Tata Motors Ltd. Auto 3.06
TToottaall ooff TToopp TTeenn EEqquuiittyy && EEqquuiittyy RReellaatteedd HHoollddiinnggss 5566..5588
TToottaall EEqquuiittyy && EEqquuiittyy RReellaatteedd HHoollddiinnggss 9955..7766
Cash, Cash Equivalents and Net Current Assets 4.24
GGrraanndd TToottaall 110000..0000
AAvveerraaggee AAUUMM ffoorr tthhee qquuaarrtteerr eennddeedd DDeecceemmbbeerr 3311,, 22001133 ((`̀ IInn LLaakkhhss)) 77,,779999..1144
Portfolio – Top 10 Holdings
PPoorrttffoolliioo TTuurrnnoovveerr RRaattiioo ((LLaasstt 11 YYeeaarr)) 3388..8866%%
+ Industry Classification as recommended by AMFI $ Sponsor
SENSEX Plus Plan (Face Value per Unit: ` 32.1610)
NAV NAV per Unit (`)
Growth Option 255.1274Direct Plan - Growth Option 256.0200
An open-ended index linked scheme
HDFC Index Fund
Banks 16.58
Software 16.26
Consumer Non Durables 12.34
Petroleum Products 8.75
Auto 8.51
Pharmaceuticals 5.31
Finance 4.32
Construction Project 3.78
Chemicals 3.51
Oil 2.66
Minerals / Mining 1.95
Telecom - Services 1.94
Power 1.48
Services 1.44
Cement 1.37
Ferrous Metals 1.17
Gas 0.94
Industrial Capital Goods 0.73
Non - Ferrous Metals 0.72
Industrial Products 0.56
Industry Allocation of Equity Holding (% of Net Assets)
%% ttoo NNAAVV
Gold Bar 1 Kg (0.995 purity) 99.74
Cash, Cash Equivalents and Net Current Assets 0.26
GGrraanndd TToottaall 110000..0000
AAvveerraaggee AAUUMM ffoorr tthhee qquuaarrtteerr eennddeedd DDeecceemmbbeerr 3311,, 22001133 ((`̀ IInn LLaakkhhss)) 7755,,330011..8811
Portfolio
%% ttoo NNAAVV
MMUUTTUUAALL FFUUNNDD UUNNIITTSS
HDFC Gold Exchange Traded Fund 98.79
Cash, Cash Equivalents and Net Current Assets 1.21
GGrraanndd TToottaall 110000..0000
AAvveerraaggee AAUUMM ffoorr tthhee qquuaarrtteerr eennddeedd DDeecceemmbbeerr 3311,, 22001133 ((`̀ IInn LLaakkhhss)) 4400,,227755..4400
Portfolio
NAV NAV per Unit (`)
HDFC Gold Exchange Traded Fund 2,663.1203
An open-ended Exchange Traded Fund
HDFC Gold Exchange Traded Fund
An open-ended fund of fund scheme investing inHDFC Gold Exchange Traded Fund
HDFC Gold Fund
(Face Value per unit: ` 100)
TTrraacckkiinngg EErrrroorr SSiinnccee IInncceeppttiioonn ((AAnnnnuuaalliisseedd)) 11..5533%%
NAV NAV per Unit (`)
Growth Option 10.3504Direct Plan - Growth Option 10.3715
Data is as of January 31, 2014 unless otherwise specified.
(Face Value per Unit: ` 10)
Intouchmutually January 2014 21
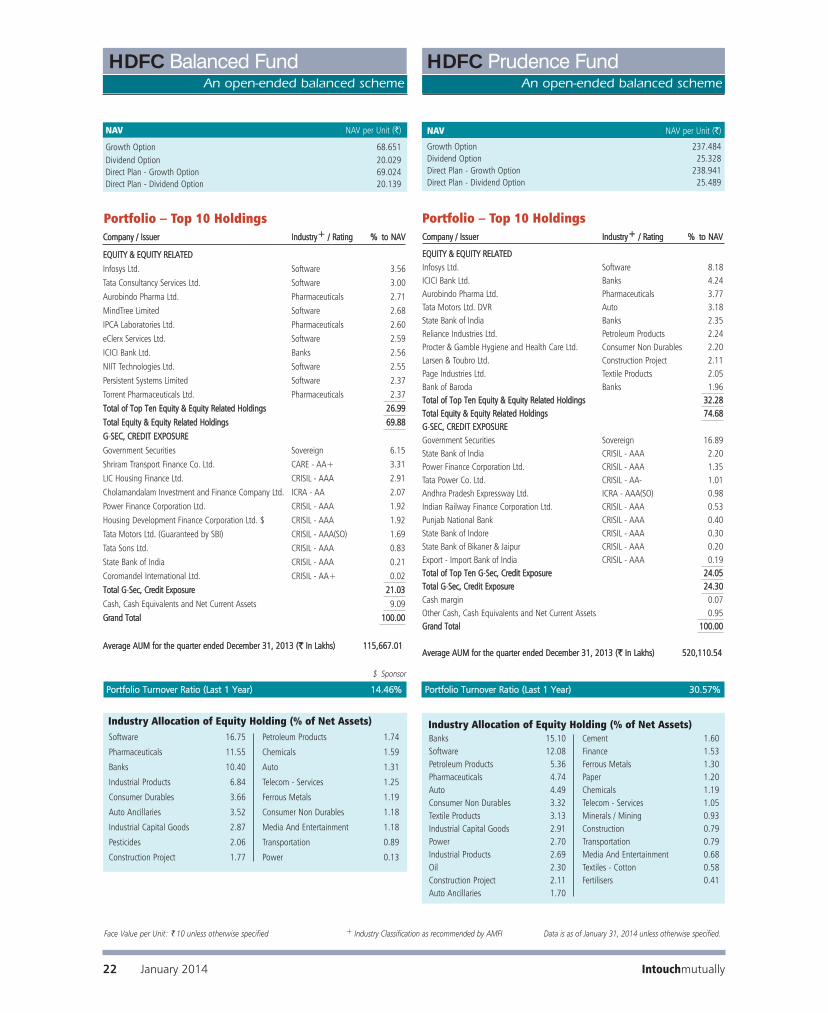
$ Sponsor
NAV NAV per Unit (`)
Growth Option 68.651Dividend Option 20.029Direct Plan - Growth Option 69.024Direct Plan - Dividend Option 20.139
PPoorrttffoolliioo TTuurrnnoovveerr RRaattiioo ((LLaasstt 11 YYeeaarr)) 1144..4466%% PPoorrttffoolliioo TTuurrnnoovveerr RRaattiioo ((LLaasstt 11 YYeeaarr)) 3300..5577%%
HDFC Balanced FundAn open-ended balanced scheme
HDFC Prudence FundAn open-ended balanced scheme
NAV NAV per Unit (`)
Growth Option 237.484Dividend Option 25.328Direct Plan - Growth Option 238.941Direct Plan - Dividend Option 25.489
CCoommppaannyy // IIssssuueerr IInndduussttrryy++ // RRaattiinngg %% ttoo NNAAVV
EEQQUUIITTYY && EEQQUUIITTYY RREELLAATTEEDD
Infosys Ltd. Software 3.56
Tata Consultancy Services Ltd. Software 3.00
Aurobindo Pharma Ltd. Pharmaceuticals 2.71
MindTree Limited Software 2.68
IPCA Laboratories Ltd. Pharmaceuticals 2.60
eClerx Services Ltd. Software 2.59
ICICI Bank Ltd. Banks 2.56
NIIT Technologies Ltd. Software 2.55
Persistent Systems Limited Software 2.37
Torrent Pharmaceuticals Ltd. Pharmaceuticals 2.37TToottaall ooff TToopp TTeenn EEqquuiittyy && EEqquuiittyy RReellaatteedd HHoollddiinnggss 2266..9999
TToottaall EEqquuiittyy && EEqquuiittyy RReellaatteedd HHoollddiinnggss 6699..8888
GG-SSEECC,, CCRREEDDIITT EEXXPPOOSSUURREE
Government Securities Sovereign 6.15
Shriram Transport Finance Co. Ltd. CARE - AA+ 3.31
LIC Housing Finance Ltd. CRISIL - AAA 2.91
Cholamandalam Investment and Finance Company Ltd. ICRA - AA 2.07
Power Finance Corporation Ltd. CRISIL - AAA 1.92
Housing Development Finance Corporation Ltd. $ CRISIL - AAA 1.92
Tata Motors Ltd. (Guaranteed by SBI) CRISIL - AAA(SO) 1.69
Tata Sons Ltd. CRISIL - AAA 0.83
State Bank of India CRISIL - AAA 0.21
Coromandel International Ltd. CRISIL - AA+ 0.02TToottaall GG-SSeecc,, CCrreeddiitt EExxppoossuurree 2211..0033
Cash, Cash Equivalents and Net Current Assets 9.09GGrraanndd TToottaall 110000..0000
AAvveerraaggee AAUUMM ffoorr tthhee qquuaarrtteerr eennddeedd DDeecceemmbbeerr 3311,, 22001133 ((`̀ IInn LLaakkhhss)) 111155,,666677..0011
Portfolio – Top 10 HoldingsCCoommppaannyy // IIssssuueerr IInndduussttrryy++ // RRaattiinngg %% ttoo NNAAVV
EEQQUUIITTYY && EEQQUUIITTYY RREELLAATTEEDDInfosys Ltd. Software 8.18ICICI Bank Ltd. Banks 4.24Aurobindo Pharma Ltd. Pharmaceuticals 3.77Tata Motors Ltd. DVR Auto 3.18State Bank of India Banks 2.35Reliance Industries Ltd. Petroleum Products 2.24Procter & Gamble Hygiene and Health Care Ltd. Consumer Non Durables 2.20Larsen & Toubro Ltd. Construction Project 2.11Page Industries Ltd. Textile Products 2.05Bank of Baroda Banks 1.96 TToottaall ooff TToopp TTeenn EEqquuiittyy && EEqquuiittyy RReellaatteedd HHoollddiinnggss 3322..2288 TToottaall EEqquuiittyy && EEqquuiittyy RReellaatteedd HHoollddiinnggss 7744..6688 GG-SSEECC,, CCRREEDDIITT EEXXPPOOSSUURREE Government Securities Sovereign 16.89State Bank of India CRISIL - AAA 2.20Power Finance Corporation Ltd. CRISIL - AAA 1.35Tata Power Co. Ltd. CRISIL - AA- 1.01Andhra Pradesh Expressway Ltd. ICRA - AAA(SO) 0.98Indian Railway Finance Corporation Ltd. CRISIL - AAA 0.53Punjab National Bank CRISIL - AAA 0.40State Bank of Indore CRISIL - AAA 0.30State Bank of Bikaner & Jaipur CRISIL - AAA 0.20Export - Import Bank of India CRISIL - AAA 0.19 TToottaall ooff TToopp TTeenn GG-SSeecc,, CCrreeddiitt EExxppoossuurree 2244..0055 TToottaall GG-SSeecc,, CCrreeddiitt EExxppoossuurree 2244..3300 Cash margin 0.07Other Cash, Cash Equivalents and Net Current Assets 0.95 GGrraanndd TToottaall 110000..0000
AAvveerraaggee AAUUMM ffoorr tthhee qquuaarrtteerr eennddeedd DDeecceemmbbeerr 3311,, 22001133 ((`̀ IInn LLaakkhhss)) 552200,,111100..5544
Portfolio – Top 10 Holdings
Software 16.75
Pharmaceuticals 11.55
Banks 10.40
Industrial Products 6.84
Consumer Durables 3.66
Auto Ancillaries 3.52
Industrial Capital Goods 2.87
Pesticides 2.06
Construction Project 1.77
Petroleum Products 1.74
Chemicals 1.59
Auto 1.31
Telecom - Services 1.25
Ferrous Metals 1.19
Consumer Non Durables 1.18
Media And Entertainment 1.18
Transportation 0.89
Power 0.13
Industry Allocation of Equity Holding (% of Net Assets)
Banks 15.10Software 12.08Petroleum Products 5.36Pharmaceuticals 4.74Auto 4.49Consumer Non Durables 3.32Textile Products 3.13Industrial Capital Goods 2.91Power 2.70Industrial Products 2.69Oil 2.30Construction Project 2.11Auto Ancillaries 1.70
Cement 1.60Finance 1.53Ferrous Metals 1.30Paper 1.20Chemicals 1.19Telecom - Services 1.05Minerals / Mining 0.93Construction 0.79Transportation 0.79Media And Entertainment 0.68Textiles - Cotton 0.58Fertilisers 0.41
Industry Allocation of Equity Holding (% of Net Assets)
Face Value per Unit: ` 10 unless otherwise specified + Industry Classification as recommended by AMFI Data is as of January 31, 2014 unless otherwise specified.
22 January 2014 Intouchmutually

HDFC Children’s Gift FundAn open-ended balanced scheme
HDFC Children’s Gift FundAn open-ended balanced scheme
Investment Plan
NAV NAV per Unit (`)
Investment Plan 56.631Investment Plan - Direct Plan 57.035
PPoorrttffoolliioo TTuurrnnoovveerr RRaattiioo ((LLaasstt 11 YYeeaarr)) 1144..6600%%
$ Sponsor
Savings Plan
NAV NAV per Unit (`)
Savings Plan 27.8272Savings Plan - Direct Plan 28.0712
YYiieelldd ttoo MMaattuurriittyy ** 88..9922%%
MMooddiiffiieedd DDuurraattiioonn ** 11..8800 yyeeaarrss
AAvveerraaggee MMaattuurriittyy ** 22..5577 yyeeaarrss
* Computed on the invested amount for debt portfolio
$ Sponsor
Portfolio – Top 10 HoldingsCCoommppaannyy // IIssssuueerr IInndduussttrryy++ // RRaattiinngg %% ttoo NNAAVV
EEQQUUIITTYY && EEQQUUIITTYY RREELLAATTEEDDInfosys Ltd. Software 1.61ICICI Bank Ltd. Banks 0.92Torrent Pharmaceuticals Ltd. Pharmaceuticals 0.83AIA Engineering Ltd. Industrial Capital Goods 0.82NIIT Technologies Ltd. Software 0.81Divi's Laboratories Ltd. Pharmaceuticals 0.79IPCA Laboratories Ltd. Pharmaceuticals 0.78Bajaj Finance Ltd. Finance 0.74Suprajit Engineering Ltd. Auto Ancillaries 0.73Vesuvius India Ltd. Industrial Products 0.70TToottaall ooff TToopp TTeenn EEqquuiittyy && EEqquuiittyy RReellaatteedd HHoollddiinnggss 88..7733 TToottaall EEqquuiittyy && EEqquuiittyy RReellaatteedd HHoollddiinnggss 1188..8844GG-SSEECC,, CCRREEDDIITT EEXXPPOOSSUURREEGovernment Securities Sovereign 17.01Housing Development Finance Corporation Ltd. $ CRISIL - AAA 8.01Tata Sons Ltd. CRISIL - AAA 6.67LIC Housing Finance Ltd. CRISIL - AAA 6.64Power Finance Corporation Ltd. CRISIL - AAA 6.14Tata Motors Ltd. (Guaranteed by SBI) CRISIL - AAA(SO) 3.60State Bank of India CRISIL - AAA 3.39Bajaj Auto Ltd. CRISIL - AAA(SO) 0.03TToottaall ooff GG-SSeecc,, CCrreeddiitt EExxppoossuurree 5511..4499 Cash, Cash Equivalents and Net Current Assets 29.67 GGrraanndd TToottaall 110000..0000
AAvveerraaggee AAUUMM ffoorr tthhee qquuaarrtteerr eennddeedd DDeecceemmbbeerr 3311,, 22001133 ((`̀ IInn LLaakkhhss)) 77,,332211..7777
Portfolio – Top 10 Holdings
Software 14.16Pharmaceuticals 12.50Industrial Products 10.50Banks 8.69Auto Ancillaries 5.15Consumer Non Durables 3.05Industrial Capital Goods 2.94Finance 2.43Petroleum Products 2.26
Construction Project 1.68Pesticides 1.67Media And Entertainment 1.41Auto 1.17Telecom - Services 1.07Ferrous Metals 1.01Consumer Durables 0.46Fertilisers 0.46
Industry Allocation of Equity Holding (% of Net Assets)
CCoommppaannyy // IIssssuueerr IInndduussttrryy++ // RRaattiinngg %% ttoo NNAAVV
EEQQUUIITTYY && EEQQUUIITTYY RREELLAATTEEDDSun Pharmaceuticals Industries Ltd. Pharmaceuticals 4.41Infosys Ltd. Software 4.20Astral Poly Technik Limited Industrial Products 2.89Motherson Sumi Systems Ltd. Auto Ancillaries 2.87IPCA Laboratories Ltd. Pharmaceuticals 2.82Tata Consultancy Services Ltd. Software 2.54Persistent Systems Limited Software 2.52Reliance Industries Ltd. Petroleum Products 2.26NIIT Technologies Ltd. Software 2.24Lupin Ltd. Pharmaceuticals 2.00 TToottaall ooff TToopp TTeenn EEqquuiittyy && EEqquuiittyy RReellaatteedd HHoollddiinnggss 2288..7755TToottaall EEqquuiittyy && EEqquuiittyy RReellaatteedd HHoollddiinnggss 7700..6611GG-SSEECC,, CCRREEDDIITT EEXXPPOOSSUURREETata Motors Ltd. (Guaranteed by SBI) CRISIL - AAA(SO) 3.98Housing Development Finance Corporation Ltd. $ CRISIL - AAA 3.62LIC Housing Finance Ltd. CRISIL - AAA 2.26Power Finance Corporation Ltd. CRISIL - AAA 2.26Government Securities Sovereign 0.85Coromandel International Ltd. CRISIL - AA+ 0.08Bajaj Auto Ltd. CRISIL - AAA(SO) 0.01TToottaall GG-SSeecc,, CCrreeddiitt EExxppoossuurree 1133..0066 Cash, Cash Equivalents and Net Current Assets 16.33GGrraanndd TToottaall 110000..0000
AAvveerraaggee AAUUMM ffoorr tthhee qquuaarrtteerr eennddeedd DDeecceemmbbeerr 3311,, 22001133 ((`̀ IInn LLaakkhhss)) 4411,,228899..2200
Face Value per Unit: ` 10 unless otherwise specified + Industry Classification as recommended by AMFI Data is as of January 31, 2014 unless otherwise specified.
Intouchmutually January 2014 23

HDFC Long Term Advantage FundAn open-ended equity linked savings scheme with
a lock-in period of 3 years
HDFC TaxSaverAn open-ended equity linked savings scheme with
a lock-in period of 3 years
Portfolio – Top 10 Holdings
NAV NAV per Unit (`)
Growth Option 159.046Dividend Option 32.475Direct Plan - Growth Option 159.978Direct Plan - Dividend Option 32.653
$ Sponsor
PPoorrttffoolliioo TTuurrnnoovveerr RRaattiioo ((LLaasstt 11 YYeeaarr)) 66..8833%%
CCoommppaannyy IInndduussttrryy++ // RRaattiinngg %% ttoo NNAAVV
EEQQUUIITTYY && EEQQUUIITTYY RREELLAATTEEDD
Infosys Ltd. Software 9.58
Tata Consultancy Services Ltd. Software 7.94
ICICI Bank Ltd. Banks 7.00
ITC Ltd. Consumer Non Durables 5.38
Larsen & Toubro Ltd. Construction Project 4.72
Reliance Industries Ltd. Petroleum Products 4.52
Balkrishna Industries Ltd. Auto Ancillaries 3.85
Housing Development Finance Corporation Ltd. $ Finance 3.82
Motherson Sumi Systems Ltd. Auto Ancillaries 3.80
Tata Motors Ltd. DVR Auto 3.62
TToottaall ooff TToopp TTeenn EEqquuiittyy && EEqquuiittyy RReellaatteedd HHoollddiinnggss 5544..2233
TToottaall EEqquuiittyy && EEqquuiittyy RReellaatteedd HHoollddiinnggss 9955..2211
Cash, Cash Equivalents and Net Current Assets 4.79
GGrraanndd TToottaall 110000..0000
AAvveerraaggee AAUUMM ffoorr tthhee qquuaarrtteerr eennddeedd DDeecceemmbbeerr 3311,, 22001133 ((`̀ IInn LLaakkhhss)) 8833,,557755..3333
NAV NAV per Unit (`)
Growth Option 246.153Dividend Option 49.645Direct Plan - Growth Option 247.877Direct Plan - Dividend Option 49.995
Portfolio – Top 10 Holdings
PPoorrttffoolliioo TTuurrnnoovveerr RRaattiioo ((LLaasstt 11 YYeeaarr)) 3355..2222%%
Software 17.80Banks 13.35Industrial Products 10.05Auto Ancillaries 7.65Consumer Non Durables 7.01Petroleum Products 6.28Pharmaceuticals 5.65Finance 4.72Construction Project 4.72
Industrial Capital Goods 3.74Auto 3.62Oil 3.02Telecom - Services 2.98Consumer Durables 2.15Ferrous Metals 1.26Chemicals 0.70Media And Entertainment 0.51
Industry Allocation of Equity Holding (% of Net Assets)
Software 20.31Banks 17.74Pharmaceuticals 7.31Auto 6.68Construction Project 5.25Consumer Non Durables 4.68Petroleum Products 3.93Industrial Capital Goods 3.93Auto Ancillaries 3.89Ferrous Metals 3.48Oil 3.47Telecom - Services 2.30
Finance 2.02Industrial Products 1.93Cement 1.80Power 1.22Media And Entertainment 1.11Minerals / Mining 1.10Transportation 0.87Chemicals 0.56Services 0.48Gas 0.40Paper 0.27
Industry Allocation of Equity Holding (% of Net Assets)
CCoommppaannyy IInndduussttrryy++ %% ttoo NNAAVV
EEQQUUIITTYY && EEQQUUIITTYY RREELLAATTEEDD
Infosys Ltd. Software 9.73
ICICI Bank Ltd. Banks 5.97
State Bank of India Banks 5.53
Tata Consultancy Services Ltd. Software 4.58
Larsen & Toubro Ltd. Construction Project 4.32
Wipro Ltd. Software 4.21
Tata Steel Ltd. Ferrous Metals 3.48
Oil India Ltd. Oil 3.47
Bharat Petroleum Corporation Ltd. Petroleum Products 3.42
Tata Motors Ltd. DVR Auto 3.42
TToottaall ooff TToopp TTeenn EEqquuiittyy && EEqquuiittyy RReellaatteedd HHoollddiinnggss 4488..1133
TToottaall EEqquuiittyy && EEqquuiittyy RReellaatteedd HHoollddiinnggss 9944..7733
Cash, Cash Equivalents and Net Current Assets 5.27
GGrraanndd TToottaall 110000..0000
AAvveerraaggee AAUUMM ffoorr tthhee qquuaarrtteerr eennddeedd DDeecceemmbbeerr 3311,, 22001133 ((`̀ IInn LLaakkhhss)) 334422,,444433..6600
Std Deviation Beta Sharpe Ratio*
Risk Ratio 4.86% 0.9106 -0.029(for the 3-yr period ended Jan 31, 14)Based on month-end NAV
Std Deviation Beta Sharpe Ratio*
Risk Ratio 4.91% 0.8629 -0.083(for the 3-yr period ended Jan 31, 14)Based on month-end NAV
Source for Risk ratio: CRISIL Fund Analyser * Risk-free rate assumed to be 8.90% (364-day Treasury Bill yield on 31-01-14
Face Value per Unit: ` 10 unless otherwise specified + Industry Classification as recommended by AMFI Data is as of January 31, 2014 unless otherwise specified.
24 January 2014 Intouchmutually
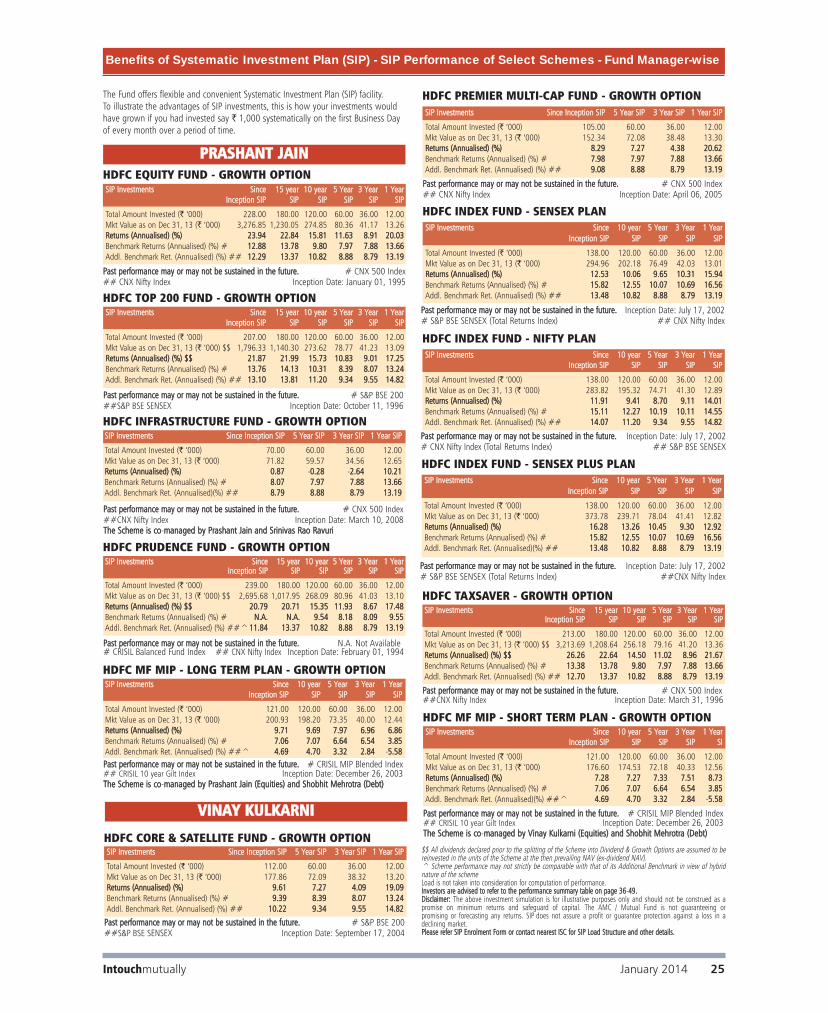
Benefits of Systematic Investment Plan (SIP) - SIP Performance of Select Schemes - Fund Manager-wise
PPaasstt ppeerrffoorrmmaannccee mmaayy oorr mmaayy nnoott bbee ssuussttaaiinneedd iinn tthhee ffuuttuurree.. # S&P BSE 200##S&P BSE SENSEX Inception Date: September 17, 2004
SSIIPP IInnvveessttmmeennttss SSiinnccee IInncceeppttiioonn SSIIPP 55 YYeeaarr SSIIPP 33 YYeeaarr SSIIPP 11 YYeeaarr SSIIPP
Total Amount Invested (` ‘000) 112.00 60.00 36.00 12.00Mkt Value as on Dec 31, 13 (` ‘000) 177.86 72.09 38.32 13.20RReettuurrnnss ((AAnnnnuuaalliisseedd)) ((%%)) 99..6611 77..2277 44..0099 1199..0099Benchmark Returns (Annualised) (%) # 99..3399 88..3399 88..0077 1133..2244Addl. Benchmark Ret. (Annualised) (%) ## 1100..2222 99..3344 99..5555 1144..8822
HDFC CORE & SATELLITE FUND - GROWTH OPTION
PPaasstt ppeerrffoorrmmaannccee mmaayy oorr mmaayy nnoott bbee ssuussttaaiinneedd iinn tthhee ffuuttuurree.. # CNX 500 Index ## CNX Nifty Index Inception Date: January 01, 1995
SSIIPP IInnvveessttmmeennttss SSiinnccee 1155 yyeeaarr 1100 yyeeaarr 55 YYeeaarr 33 YYeeaarr 11 YYeeaarrIInncceeppttiioonn SSIIPP SSIIPP SSIIPP SSIIPP SSIIPP SSIIPP
Total Amount Invested (` ‘000) 228.00 180.00 120.00 60.00 36.00 12.00Mkt Value as on Dec 31, 13 (` ‘000) 3,276.85 1,230.05 274.85 80.36 41.17 13.26RReettuurrnnss ((AAnnnnuuaalliisseedd)) ((%%)) 2233..9944 2222..8844 1155..8811 1111..6633 88..9911 2200..0033Benchmark Returns (Annualised) (%) # 1122..8888 1133..7788 99..8800 77..9977 77..8888 1133..6666Addl. Benchmark Ret. (Annualised) (%) ## 1122..2299 1133..3377 1100..8822 88..8888 88..7799 1133..1199
HDFC EQUITY FUND - GROWTH OPTION
PPaasstt ppeerrffoorrmmaannccee mmaayy oorr mmaayy nnoott bbee ssuussttaaiinneedd iinn tthhee ffuuttuurree.. # S&P BSE 200##S&P BSE SENSEX Inception Date: October 11, 1996
SSIIPP IInnvveessttmmeennttss SSiinnccee 1155 yyeeaarr 1100 yyeeaarr 55 YYeeaarr 33 YYeeaarr 11 YYeeaarrIInncceeppttiioonn SSIIPP SSIIPP SSIIPP SSIIPP SSIIPP SSIIPP
Total Amount Invested (` ‘000) 207.00 180.00 120.00 60.00 36.00 12.00Mkt Value as on Dec 31, 13 (` ‘000) $$ 1,796.33 1,140.30 273.62 78.77 41.23 13.09RReettuurrnnss ((AAnnnnuuaalliisseedd)) ((%%)) $$$$ 2211..8877 2211..9999 1155..7733 1100..8833 99..0011 1177..2255Benchmark Returns (Annualised) (%) # 1133..7766 1144..1133 1100..3311 88..3399 88..0077 1133..2244Addl. Benchmark Ret. (Annualised) (%) ## 1133..1100 1133..8811 1111..2200 99..3344 99..5555 1144..8822
HDFC TOP 200 FUND - GROWTH OPTION
PPaasstt ppeerrffoorrmmaannccee mmaayy oorr mmaayy nnoott bbee ssuussttaaiinneedd iinn tthhee ffuuttuurree.. # CNX 500 Index ##CNX Nifty Index Inception Date: March 10, 2008TThhee SScchheemmee iiss ccoo-mmaannaaggeedd bbyy PPrraasshhaanntt JJaaiinn aanndd SSrriinniivvaass RRaaoo RRaavvuurrii
SSIIPP IInnvveessttmmeennttss SSiinnccee IInncceeppttiioonn SSIIPP 55 YYeeaarr SSIIPP 33 YYeeaarr SSIIPP 11 YYeeaarr SSIIPP
Total Amount Invested (` ‘000) 70.00 60.00 36.00 12.00Mkt Value as on Dec 31, 13 (` ‘000) 71.82 59.57 34.56 12.65RReettuurrnnss ((AAnnnnuuaalliisseedd)) ((%%)) 00..8877 -00..2288 -22..6644 1100..2211Benchmark Returns (Annualised) (%) # 88..0077 77..9977 77..8888 1133..6666Addl. Benchmark Ret. (Annualised)(%) ## 88..7799 88..8888 88..7799 1133..1199
HDFC INFRASTRUCTURE FUND - GROWTH OPTION
PPaasstt ppeerrffoorrmmaannccee mmaayy oorr mmaayy nnoott bbee ssuussttaaiinneedd iinn tthhee ffuuttuurree.. N.A. Not Available# CRISIL Balanced Fund Index ## CNX Nifty Index Inception Date: February 01, 1994
SSIIPP IInnvveessttmmeennttss SSiinnccee 1155 yyeeaarr 1100 yyeeaarr 55 YYeeaarr 33 YYeeaarr 11 YYeeaarrIInncceeppttiioonn SSIIPP SSIIPP SSIIPP SSIIPP SSIIPP SSIIPP
Total Amount Invested (` ‘000) 239.00 180.00 120.00 60.00 36.00 12.00Mkt Value as on Dec 31, 13 (` ‘000) $$ 2,695.68 1,017.95 268.09 80.96 41.03 13.10RReettuurrnnss ((AAnnnnuuaalliisseedd)) ((%%)) $$$$ 2200..7799 2200..7711 1155..3355 1111..9933 88..6677 1177..4488Benchmark Returns (Annualised) (%) # NN..AA.. NN..AA.. 99..5544 88..1188 88..0099 99..5555Addl. Benchmark Ret. (Annualised) (%) ##^1111..8844 1133..3377 1100..8822 88..8888 88..7799 1133..1199
HDFC PRUDENCE FUND - GROWTH OPTION
PPaasstt ppeerrffoorrmmaannccee mmaayy oorr mmaayy nnoott bbee ssuussttaaiinneedd iinn tthhee ffuuttuurree.. # CNX 500 Index##CNX Nifty Index Inception Date: March 31, 1996
SSIIPP IInnvveessttmmeennttss SSiinnccee 1155 yyeeaarr 1100 yyeeaarr 55 YYeeaarr 33 YYeeaarr 11 YYeeaarrIInncceeppttiioonn SSIIPP SSIIPP SSIIPP SSIIPP SSIIPP SSIIPP
Total Amount Invested (` ‘000) 213.00 180.00 120.00 60.00 36.00 12.00Mkt Value as on Dec 31, 13 (` ‘000) $$ 3,213.69 1,208.64 256.18 79.16 41.20 13.36RReettuurrnnss ((AAnnnnuuaalliisseedd)) ((%%)) $$$$ 2266..2266 2222..6644 1144..5500 1111..0022 88..9966 2211..6677Benchmark Returns (Annualised) (%) # 1133..3388 1133..7788 99..8800 77..9977 77..8888 1133..6666Addl. Benchmark Ret. (Annualised) (%) ## 1122..7700 1133..3377 1100..8822 88..8888 88..7799 1133..1199
HDFC TAXSAVER - GROWTH OPTION
PPaasstt ppeerrffoorrmmaannccee mmaayy oorr mmaayy nnoott bbee ssuussttaaiinneedd iinn tthhee ffuuttuurree.. # CRISIL MIP Blended Index## CRISIL 10 year Gilt Index Inception Date: December 26, 2003TThhee SScchheemmee iiss ccoo-mmaannaaggeedd bbyy PPrraasshhaanntt JJaaiinn ((EEqquuiittiieess)) aanndd SShhoobbhhiitt MMeehhrroottrraa ((DDeebbtt))
SSIIPP IInnvveessttmmeennttss SSiinnccee 1100 yyeeaarr 55 YYeeaarr 33 YYeeaarr 11 YYeeaarrIInncceeppttiioonn SSIIPP SSIIPP SSIIPP SSIIPP SSIIPP
Total Amount Invested (` ‘000) 121.00 120.00 60.00 36.00 12.00Mkt Value as on Dec 31, 13 (` ‘000) 200.93 198.20 73.35 40.00 12.44RReettuurrnnss ((AAnnnnuuaalliisseedd)) ((%%)) 99..7711 99..6699 77..9977 66..9966 66..8866Benchmark Returns (Annualised) (%) # 77..0066 77..0077 66..6644 66..5544 33..8855Addl. Benchmark Ret. (Annualised) (%) ##^ 44..6699 44..7700 33..3322 22..8844 -55..5588
HDFC MF MIP - LONG TERM PLAN - GROWTH OPTION
PPaasstt ppeerrffoorrmmaannccee mmaayy oorr mmaayy nnoott bbee ssuussttaaiinneedd iinn tthhee ffuuttuurree.. # CNX 500 Index ## CNX Nifty Index Inception Date: April 06, 2005
SSIIPP IInnvveessttmmeennttss SSiinnccee IInncceeppttiioonn SSIIPP 55 YYeeaarr SSIIPP 33 YYeeaarr SSIIPP 11 YYeeaarr SSIIPP
Total Amount Invested (` ‘000) 105.00 60.00 36.00 12.00Mkt Value as on Dec 31, 13 (` ‘000) 152.34 72.08 38.48 13.30RReettuurrnnss ((AAnnnnuuaalliisseedd)) ((%%)) 88..2299 77..2277 44..3388 2200..6622Benchmark Returns (Annualised) (%) # 77..9988 77..9977 77..8888 1133..6666Addl. Benchmark Ret. (Annualised) (%) ## 99..0088 88..8888 88..7799 1133..1199
HDFC PREMIER MULTI-CAP FUND - GROWTH OPTION
PPaasstt ppeerrffoorrmmaannccee mmaayy oorr mmaayy nnoott bbee ssuussttaaiinneedd iinn tthhee ffuuttuurree.. Inception Date: July 17, 2002# S&P BSE SENSEX (Total Returns Index) ## CNX Nifty Index
SSIIPP IInnvveessttmmeennttss SSiinnccee 1100 yyeeaarr 55 YYeeaarr 33 YYeeaarr 11 YYeeaarrIInncceeppttiioonn SSIIPP SSIIPP SSIIPP SSIIPP SSIIPP
Total Amount Invested (` ‘000) 138.00 120.00 60.00 36.00 12.00Mkt Value as on Dec 31, 13 (` ‘000) 294.96 202.18 76.49 42.03 13.01RReettuurrnnss ((AAnnnnuuaalliisseedd)) ((%%)) 1122..5533 1100..0066 99..6655 1100..3311 1155..9944Benchmark Returns (Annualised) (%) # 1155..8822 1122..5555 1100..0077 1100..6699 1166..5566Addl. Benchmark Ret. (Annualised) (%) ## 1133..4488 1100..8822 88..8888 88..7799 1133..1199
HDFC INDEX FUND - SENSEX PLAN
PPaasstt ppeerrffoorrmmaannccee mmaayy oorr mmaayy nnoott bbee ssuussttaaiinneedd iinn tthhee ffuuttuurree.. Inception Date: July 17, 2002# CNX Nifty Index (Total Returns Index) ## S&P BSE SENSEX
SSIIPP IInnvveessttmmeennttss SSiinnccee 1100 yyeeaarr 55 YYeeaarr 33 YYeeaarr 11 YYeeaarrIInncceeppttiioonn SSIIPP SSIIPP SSIIPP SSIIPP SSIIPP
Total Amount Invested (` ‘000) 138.00 120.00 60.00 36.00 12.00Mkt Value as on Dec 31, 13 (` ‘000) 283.82 195.32 74.71 41.30 12.89RReettuurrnnss ((AAnnnnuuaalliisseedd)) ((%%)) 1111..9911 99..4411 88..7700 99..1111 1144..0011Benchmark Returns (Annualised) (%) # 1155..1111 1122..2277 1100..1199 1100..1111 1144..5555Addl. Benchmark Ret. (Annualised) (%) ## 1144..0077 1111..2200 99..3344 99..5555 1144..8822
HDFC INDEX FUND - NIFTY PLAN
PPaasstt ppeerrffoorrmmaannccee mmaayy oorr mmaayy nnoott bbee ssuussttaaiinneedd iinn tthhee ffuuttuurree.. Inception Date: July 17, 2002# S&P BSE SENSEX (Total Returns Index) ##CNX Nifty Index
SSIIPP IInnvveessttmmeennttss SSiinnccee 1100 yyeeaarr 55 YYeeaarr 33 YYeeaarr 11 YYeeaarrIInncceeppttiioonn SSIIPP SSIIPP SSIIPP SSIIPP SSIIPP
Total Amount Invested (` ‘000) 138.00 120.00 60.00 36.00 12.00Mkt Value as on Dec 31, 13 (` ‘000) 373.78 239.71 78.04 41.41 12.82RReettuurrnnss ((AAnnnnuuaalliisseedd)) ((%%)) 1166..2288 1133..2266 1100..4455 99..3300 1122..9922Benchmark Returns (Annualised) (%) # 1155..8822 1122..5555 1100..0077 1100..6699 1166..5566Addl. Benchmark Ret. (Annualised)(%) ## 1133..4488 1100..8822 88..8888 88..7799 1133..1199
HDFC INDEX FUND - SENSEX PLUS PLAN
The Fund offers flexible and convenient Systematic Investment Plan (SIP) facility. To illustrate the advantages of SIP investments, this is how your investments wouldhave grown if you had invested say ` 1,000 systematically on the first Business Dayof every month over a period of time.
PRASHANT JAIN
VINAY KULKARNI PPaasstt ppeerrffoorrmmaannccee mmaayy oorr mmaayy nnoott bbee ssuussttaaiinneedd iinn tthhee ffuuttuurree.. # CRISIL MIP Blended Index## CRISIL 10 year Gilt Index Inception Date: December 26, 2003TThhee SScchheemmee iiss ccoo-mmaannaaggeedd bbyy VViinnaayy KKuullkkaarrnnii ((EEqquuiittiieess)) aanndd SShhoobbhhiitt MMeehhrroottrraa ((DDeebbtt))
SSIIPP IInnvveessttmmeennttss SSiinnccee 1100 yyeeaarr 55 YYeeaarr 33 YYeeaarr 11 YYeeaarrIInncceeppttiioonn SSIIPP SSIIPP SSIIPP SSIIPP SSII
Total Amount Invested (` ‘000) 121.00 120.00 60.00 36.00 12.00Mkt Value as on Dec 31, 13 (` ‘000) 176.60 174.53 72.18 40.33 12.56RReettuurrnnss ((AAnnnnuuaalliisseedd)) ((%%)) 77..2288 77..2277 77..3333 77..5511 88..7733Benchmark Returns (Annualised) (%) # 77..0066 77..0077 66..6644 66..5544 33..8855Addl. Benchmark Ret. (Annualised)(%) ##^ 44..6699 44..7700 33..3322 22..8844 -55..5588
HDFC MF MIP - SHORT TERM PLAN - GROWTH OPTION
$$ All dividends declared prior to the splitting of the Scheme into Dividend & Growth Options are assumed to bereinvested in the units of the Scheme at the then prevailing NAV (ex-dividend NAV).^ Scheme performance may not strictly be comparable with that of its Additional Benchmark in view of hybridnature of the schemeLoad is not taken into consideration for computation of performance. IInnvveessttoorrss aarree aaddvviisseedd ttoo rreeffeerr ttoo tthhee ppeerrffoorrmmaannccee ssuummmmaarryy ttaabbllee oonn ppaaggee 3366-4499.. DDiissccllaaiimmeerr:: The above investment simulation is for illustrative purposes only and should not be construed as apromise on minimum returns and safeguard of capital. The AMC / Mutual Fund is not guaranteeing or promising or forecasting any returns. SIP does not assure a profit or guarantee protection against a loss in a declining market.PPlleeaassee rreeffeerr SSIIPP EEnnrroollmmeenntt FFoorrmm oorr ccoonnttaacctt nneeaarreesstt IISSCC ffoorr SSIIPP LLooaadd SSttrruuccttuurree aanndd ootthheerr ddeettaaiillss..
Intouchmutually January 2014 25
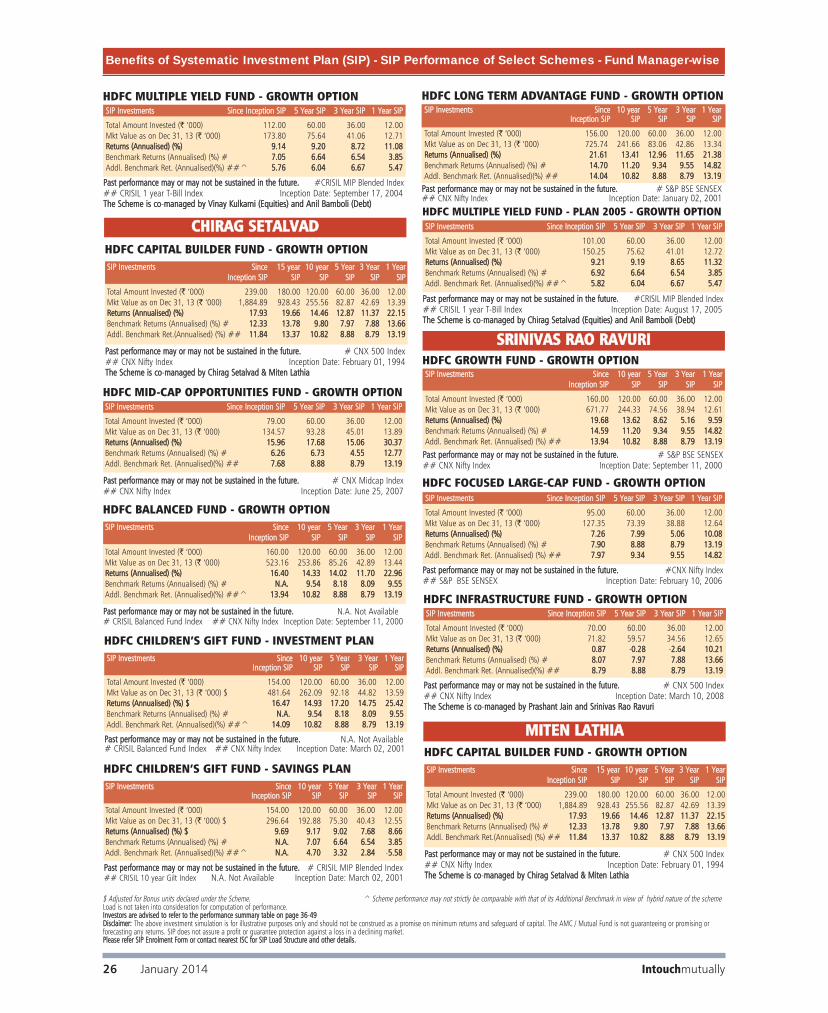
Benefits of Systematic Investment Plan (SIP) - SIP Performance of Select Schemes - Fund Manager-wise
PPaasstt ppeerrffoorrmmaannccee mmaayy oorr mmaayy nnoott bbee ssuussttaaiinneedd iinn tthhee ffuuttuurree.. #CRISIL MIP Blended Index## CRISIL 1 year T-Bill Index Inception Date: September 17, 2004TThhee SScchheemmee iiss ccoo-mmaannaaggeedd bbyy VViinnaayy KKuullkkaarrnnii ((EEqquuiittiieess)) aanndd AAnniill BBaammbboollii ((DDeebbtt))
SSIIPP IInnvveessttmmeennttss SSiinnccee IInncceeppttiioonn SSIIPP 55 YYeeaarr SSIIPP 33 YYeeaarr SSIIPP 11 YYeeaarr SSIIPP
Total Amount Invested (` ‘000) 112.00 60.00 36.00 12.00Mkt Value as on Dec 31, 13 (` ‘000) 173.80 75.64 41.06 12.71RReettuurrnnss ((AAnnnnuuaalliisseedd)) ((%%)) 99..1144 99..2200 88..7722 1111..0088Benchmark Returns (Annualised) (%) # 77..0055 66..6644 66..5544 33..8855Addl. Benchmark Ret. (Annualised)(%) ##^ 55..7766 66..0044 66..6677 55..4477
HDFC MULTIPLE YIELD FUND - GROWTH OPTION
PPaasstt ppeerrffoorrmmaannccee mmaayy oorr mmaayy nnoott bbee ssuussttaaiinneedd iinn tthhee ffuuttuurree.. #CRISIL MIP Blended Index## CRISIL 1 year T-Bill Index Inception Date: August 17, 2005TThhee SScchheemmee iiss ccoo-mmaannaaggeedd bbyy CChhiirraagg SSeettaallvvaadd ((EEqquuiittiieess)) aanndd AAnniill BBaammbboollii ((DDeebbtt))
SSIIPP IInnvveessttmmeennttss SSiinnccee IInncceeppttiioonn SSIIPP 55 YYeeaarr SSIIPP 33 YYeeaarr SSIIPP 11 YYeeaarr SSIIPP
Total Amount Invested (` ‘000) 101.00 60.00 36.00 12.00Mkt Value as on Dec 31, 13 (` ‘000) 150.25 75.62 41.01 12.72RReettuurrnnss ((AAnnnnuuaalliisseedd)) ((%%)) 99..2211 99..1199 88..6655 1111..3322Benchmark Returns (Annualised) (%) # 66..9922 66..6644 66..5544 33..8855Addl. Benchmark Ret. (Annualised)(%) ##^ 55..8822 66..0044 66..6677 55..4477
HDFC MULTIPLE YIELD FUND - PLAN 2005 - GROWTH OPTION
PPaasstt ppeerrffoorrmmaannccee mmaayy oorr mmaayy nnoott bbee ssuussttaaiinneedd iinn tthhee ffuuttuurree.. #CNX Nifty Index## S&P BSE SENSEX Inception Date: February 10, 2006
SSIIPP IInnvveessttmmeennttss SSiinnccee IInncceeppttiioonn SSIIPP 55 YYeeaarr SSIIPP 33 YYeeaarr SSIIPP 11 YYeeaarr SSIIPP
Total Amount Invested (` ‘000) 95.00 60.00 36.00 12.00Mkt Value as on Dec 31, 13 (` ‘000) 127.35 73.39 38.88 12.64RReettuurrnnss ((AAnnnnuuaalliisseedd)) ((%%)) 77..2266 77..9999 55..0066 1100..0088Benchmark Returns (Annualised) (%) # 77..9900 88..8888 88..7799 1133..1199Addl. Benchmark Ret. (Annualised) (%) ## 77..9977 99..3344 99..5555 1144..8822
HDFC FOCUSED LARGE-CAP FUND - GROWTH OPTION
PPaasstt ppeerrffoorrmmaannccee mmaayy oorr mmaayy nnoott bbee ssuussttaaiinneedd iinn tthhee ffuuttuurree.. # S&P BSE SENSEX## CNX Nifty Index Inception Date: January 02, 2001
SSIIPP IInnvveessttmmeennttss SSiinnccee 1100 yyeeaarr 55 YYeeaarr 33 YYeeaarr 11 YYeeaarrIInncceeppttiioonn SSIIPP SSIIPP SSIIPP SSIIPP SSIIPP
Total Amount Invested (` ‘000) 156.00 120.00 60.00 36.00 12.00Mkt Value as on Dec 31, 13 (` ‘000) 725.74 241.66 83.06 42.86 13.34RReettuurrnnss ((AAnnnnuuaalliisseedd)) ((%%)) 2211..6611 1133..4411 1122..9966 1111..6655 2211..3388Benchmark Returns (Annualised) (%) # 1144..7700 1111..2200 99..3344 99..5555 1144..8822Addl. Benchmark Ret. (Annualised)(%) ## 1144..0044 1100..8822 88..8888 88..7799 1133..1199
HDFC LONG TERM ADVANTAGE FUND - GROWTH OPTION
PPaasstt ppeerrffoorrmmaannccee mmaayy oorr mmaayy nnoott bbee ssuussttaaiinneedd iinn tthhee ffuuttuurree.. # CNX 500 Index ## CNX Nifty Index Inception Date: February 01, 1994TThhee SScchheemmee iiss ccoo-mmaannaaggeedd bbyy CChhiirraagg SSeettaallvvaadd && MMiitteenn LLaatthhiiaa
SSIIPP IInnvveessttmmeennttss SSiinnccee 1155 yyeeaarr 1100 yyeeaarr 55 YYeeaarr 33 YYeeaarr 11 YYeeaarrIInncceeppttiioonn SSIIPP SSIIPP SSIIPP SSIIPP SSIIPP SSIIPP
Total Amount Invested (` ‘000) 239.00 180.00 120.00 60.00 36.00 12.00Mkt Value as on Dec 31, 13 (` ‘000) 1,884.89 928.43 255.56 82.87 42.69 13.39 RReettuurrnnss ((AAnnnnuuaalliisseedd)) ((%%)) 1177..9933 1199..6666 1144..4466 1122..8877 1111..3377 2222..1155Benchmark Returns (Annualised) (%) # 1122..3333 1133..7788 99..8800 77..9977 77..8888 1133..6666Addl. Benchmark Ret.(Annualised) (%) ## 1111..8844 1133..3377 1100..8822 88..8888 88..7799 1133..1199
HDFC CAPITAL BUILDER FUND - GROWTH OPTION
PPaasstt ppeerrffoorrmmaannccee mmaayy oorr mmaayy nnoott bbee ssuussttaaiinneedd iinn tthhee ffuuttuurree.. N.A. Not Available # CRISIL Balanced Fund Index ## CNX Nifty Index Inception Date: September 11, 2000
SSIIPP IInnvveessttmmeennttss SSiinnccee 1100 yyeeaarr 55 YYeeaarr 33 YYeeaarr 11 YYeeaarrIInncceeppttiioonn SSIIPP SSIIPP SSIIPP SSIIPP SSIIPP
Total Amount Invested (` ‘000) 160.00 120.00 60.00 36.00 12.00Mkt Value as on Dec 31, 13 (` ‘000) 523.16 253.86 85.26 42.89 13.44RReettuurrnnss ((AAnnnnuuaalliisseedd)) ((%%)) 1166..4400 1144..3333 1144..0022 1111..7700 2222..9966Benchmark Returns (Annualised) (%) # NN..AA.. 99..5544 88..1188 88..0099 99..5555Addl. Benchmark Ret. (Annualised)(%) ##^ 1133..9944 1100..8822 88..8888 88..7799 1133..1199
HDFC BALANCED FUND - GROWTH OPTION
PPaasstt ppeerrffoorrmmaannccee mmaayy oorr mmaayy nnoott bbee ssuussttaaiinneedd iinn tthhee ffuuttuurree.. N.A. Not Available# CRISIL Balanced Fund Index ## CNX Nifty Index Inception Date: March 02, 2001
SSIIPP IInnvveessttmmeennttss SSiinnccee 1100 yyeeaarr 55 YYeeaarr 33 YYeeaarr 11 YYeeaarrIInncceeppttiioonn SSIIPP SSIIPP SSIIPP SSIIPP SSIIPP
Total Amount Invested (` ‘000) 154.00 120.00 60.00 36.00 12.00Mkt Value as on Dec 31, 13 (` ‘000) $ 481.64 262.09 92.18 44.82 13.59RReettuurrnnss ((AAnnnnuuaalliisseedd)) ((%%)) $$ 1166..4477 1144..9933 1177..2200 1144..7755 2255..4422Benchmark Returns (Annualised) (%) # NN..AA.. 99..5544 88..1188 88..0099 99..5555Addl. Benchmark Ret. (Annualised)(%) ##^ 1144..0099 1100..8822 88..8888 88..7799 1133..1199
HDFC CHILDREN’S GIFT FUND - INVESTMENT PLAN
PPaasstt ppeerrffoorrmmaannccee mmaayy oorr mmaayy nnoott bbee ssuussttaaiinneedd iinn tthhee ffuuttuurree.. # CRISIL MIP Blended Index## CRISIL 10 year Gilt Index N.A. Not Available Inception Date: March 02, 2001
SSIIPP IInnvveessttmmeennttss SSiinnccee 1100 yyeeaarr 55 YYeeaarr 33 YYeeaarr 11 YYeeaarrIInncceeppttiioonn SSIIPP SSIIPP SSIIPP SSIIPP SSIIPP
Total Amount Invested (` ‘000) 154.00 120.00 60.00 36.00 12.00Mkt Value as on Dec 31, 13 (` ‘000) $ 296.64 192.88 75.30 40.43 12.55RReettuurrnnss ((AAnnnnuuaalliisseedd)) ((%%)) $$ 99..6699 99..1177 99..0022 77..6688 88..6666Benchmark Returns (Annualised) (%) # NN..AA.. 77..0077 66..6644 66..5544 33..8855Addl. Benchmark Ret. (Annualised)(%) ##^ NN..AA.. 44..7700 33..3322 22..8844 -55..5588
HDFC CHILDREN’S GIFT FUND - SAVINGS PLAN
PPaasstt ppeerrffoorrmmaannccee mmaayy oorr mmaayy nnoott bbee ssuussttaaiinneedd iinn tthhee ffuuttuurree.. # CNX Midcap Index ## CNX Nifty Index Inception Date: June 25, 2007
SSIIPP IInnvveessttmmeennttss SSiinnccee IInncceeppttiioonn SSIIPP 55 YYeeaarr SSIIPP 33 YYeeaarr SSIIPP 11 YYeeaarr SSIIPP
Total Amount Invested (` ‘000) 79.00 60.00 36.00 12.00Mkt Value as on Dec 31, 13 (` ‘000) 134.57 93.28 45.01 13.89RReettuurrnnss ((AAnnnnuuaalliisseedd)) ((%%)) 1155..9966 1177..6688 1155..0066 3300..3377Benchmark Returns (Annualised) (%) # 66..2266 66..7733 44..5555 1122..7777Addl. Benchmark Ret. (Annualised)(%) ## 77..6688 88..8888 88..7799 1133..1199
HDFC MID-CAP OPPORTUNITIES FUND - GROWTH OPTION
PPaasstt ppeerrffoorrmmaannccee mmaayy oorr mmaayy nnoott bbee ssuussttaaiinneedd iinn tthhee ffuuttuurree.. # S&P BSE SENSEX ## CNX Nifty Index Inception Date: September 11, 2000
SSIIPP IInnvveessttmmeennttss SSiinnccee 1100 yyeeaarr 55 YYeeaarr 33 YYeeaarr 11 YYeeaarrIInncceeppttiioonn SSIIPP SSIIPP SSIIPP SSIIPP SSIIPP
Total Amount Invested (` ‘000) 160.00 120.00 60.00 36.00 12.00Mkt Value as on Dec 31, 13 (` ‘000) 671.77 244.33 74.56 38.94 12.61RReettuurrnnss ((AAnnnnuuaalliisseedd)) ((%%)) 1199..6688 1133..6622 88..6622 55..1166 99..5599Benchmark Returns (Annualised) (%) # 1144..5599 1111..2200 99..3344 99..5555 1144..8822Addl. Benchmark Ret. (Annualised) (%) ## 1133..9944 1100..8822 88..8888 88..7799 1133..1199
HDFC GROWTH FUND - GROWTH OPTION
PPaasstt ppeerrffoorrmmaannccee mmaayy oorr mmaayy nnoott bbee ssuussttaaiinneedd iinn tthhee ffuuttuurree.. # CNX 500 Index ## CNX Nifty Index Inception Date: March 10, 2008TThhee SScchheemmee iiss ccoo-mmaannaaggeedd bbyy PPrraasshhaanntt JJaaiinn aanndd SSrriinniivvaass RRaaoo RRaavvuurrii
SSIIPP IInnvveessttmmeennttss SSiinnccee IInncceeppttiioonn SSIIPP 55 YYeeaarr SSIIPP 33 YYeeaarr SSIIPP 11 YYeeaarr SSIIPP
Total Amount Invested (` ‘000) 70.00 60.00 36.00 12.00Mkt Value as on Dec 31, 13 (` ‘000) 71.82 59.57 34.56 12.65RReettuurrnnss ((AAnnnnuuaalliisseedd)) ((%%)) 00..8877 -00..2288 -22..6644 1100..2211Benchmark Returns (Annualised) (%) # 88..0077 77..9977 77..8888 1133..6666Addl. Benchmark Ret. (Annualised)(%) ## 88..7799 88..8888 88..7799 1133..1199
HDFC INFRASTRUCTURE FUND - GROWTH OPTION
$ Adjusted for Bonus units declared under the Scheme. ^ Scheme performance may not strictly be comparable with that of its Additional Benchmark in view of hybrid nature of the schemeLoad is not taken into consideration for computation of performance.IInnvveessttoorrss aarree aaddvviisseedd ttoo rreeffeerr ttoo tthhee ppeerrffoorrmmaannccee ssuummmmaarryy ttaabbllee oonn ppaaggee 3366-4499 DDiissccllaaiimmeerr:: The above investment simulation is for illustrative purposes only and should not be construed as a promise on minimum returns and safeguard of capital. The AMC / Mutual Fund is not guaranteeing or promising or forecasting any returns. SIP does not assure a profit or guarantee protection against a loss in a declining market.PPlleeaassee rreeffeerr SSIIPP EEnnrroollmmeenntt FFoorrmm oorr ccoonnttaacctt nneeaarreesstt IISSCC ffoorr SSIIPP LLooaadd SSttrruuccttuurree aanndd ootthheerr ddeettaaiillss..
CHIRAG SETALVAD
PPaasstt ppeerrffoorrmmaannccee mmaayy oorr mmaayy nnoott bbee ssuussttaaiinneedd iinn tthhee ffuuttuurree.. # CNX 500 Index ## CNX Nifty Index Inception Date: February 01, 1994TThhee SScchheemmee iiss ccoo-mmaannaaggeedd bbyy CChhiirraagg SSeettaallvvaadd && MMiitteenn LLaatthhiiaa
SSIIPP IInnvveessttmmeennttss SSiinnccee 1155 yyeeaarr 1100 yyeeaarr 55 YYeeaarr 33 YYeeaarr 11 YYeeaarrIInncceeppttiioonn SSIIPP SSIIPP SSIIPP SSIIPP SSIIPP SSIIPP
Total Amount Invested (` ‘000) 239.00 180.00 120.00 60.00 36.00 12.00Mkt Value as on Dec 31, 13 (` ‘000) 1,884.89 928.43 255.56 82.87 42.69 13.39 RReettuurrnnss ((AAnnnnuuaalliisseedd)) ((%%)) 1177..9933 1199..6666 1144..4466 1122..8877 1111..3377 2222..1155Benchmark Returns (Annualised) (%) # 1122..3333 1133..7788 99..8800 77..9977 77..8888 1133..6666Addl. Benchmark Ret.(Annualised) (%) ## 1111..8844 1133..3377 1100..8822 88..8888 88..7799 1133..1199
HDFC CAPITAL BUILDER FUND - GROWTH OPTION
MITEN LATHIA
SRINIVAS RAO RAVURI
Intouchmutually26 January 2014
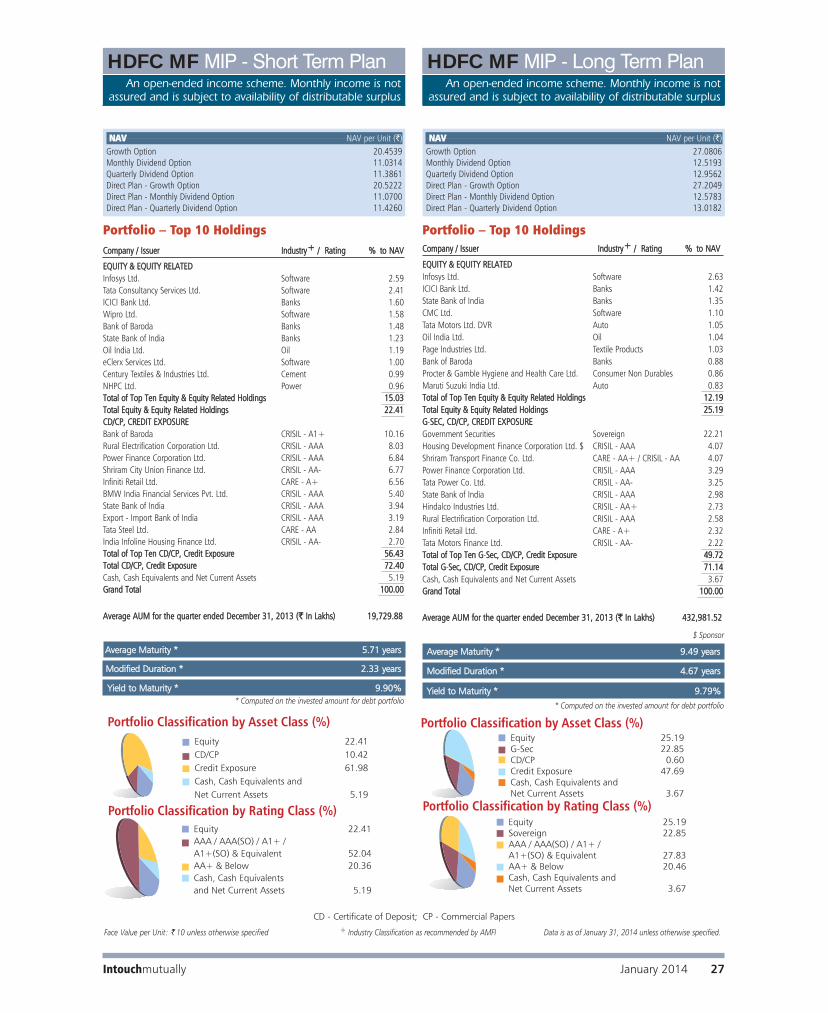
CCoommppaannyy // IIssssuueerr IInndduussttrryy++ // RRaattiinngg %% ttoo NNAAVV
EEQQUUIITTYY && EEQQUUIITTYY RREELLAATTEEDDInfosys Ltd. Software 2.59Tata Consultancy Services Ltd. Software 2.41ICICI Bank Ltd. Banks 1.60Wipro Ltd. Software 1.58Bank of Baroda Banks 1.48State Bank of India Banks 1.23Oil India Ltd. Oil 1.19eClerx Services Ltd. Software 1.00Century Textiles & Industries Ltd. Cement 0.99NHPC Ltd. Power 0.96TToottaall ooff TToopp TTeenn EEqquuiittyy && EEqquuiittyy RReellaatteedd HHoollddiinnggss 1155..0033 TToottaall EEqquuiittyy && EEqquuiittyy RReellaatteedd HHoollddiinnggss 2222..4411CCDD//CCPP,, CCRREEDDIITT EEXXPPOOSSUURREEBank of Baroda CRISIL - A1+ 10.16Rural Electrification Corporation Ltd. CRISIL - AAA 8.03Power Finance Corporation Ltd. CRISIL - AAA 6.84Shriram City Union Finance Ltd. CRISIL - AA- 6.77Infiniti Retail Ltd. CARE - A+ 6.56BMW India Financial Services Pvt. Ltd. CRISIL - AAA 5.40State Bank of India CRISIL - AAA 3.94Export - Import Bank of India CRISIL - AAA 3.19Tata Steel Ltd. CARE - AA 2.84India Infoline Housing Finance Ltd. CRISIL - AA- 2.70TToottaall ooff TToopp TTeenn CCDD//CCPP,, CCrreeddiitt EExxppoossuurree 5566..4433TToottaall CCDD//CCPP,, CCrreeddiitt EExxppoossuurree 7722..4400 Cash, Cash Equivalents and Net Current Assets 5.19 GGrraanndd TToottaall 110000..0000
AAvveerraaggee AAUUMM ffoorr tthhee qquuaarrtteerr eennddeedd DDeecceemmbbeerr 3311,, 22001133 ((`̀ IInn LLaakkhhss)) 1199,,772299..8888
Portfolio – Top 10 HoldingsCCoommppaannyy // IIssssuueerr IInndduussttrryy++ // RRaattiinngg %% ttoo NNAAVV
EEQQUUIITTYY && EEQQUUIITTYY RREELLAATTEEDDInfosys Ltd. Software 2.63ICICI Bank Ltd. Banks 1.42State Bank of India Banks 1.35CMC Ltd. Software 1.10Tata Motors Ltd. DVR Auto 1.05Oil India Ltd. Oil 1.04Page Industries Ltd. Textile Products 1.03Bank of Baroda Banks 0.88Procter & Gamble Hygiene and Health Care Ltd. Consumer Non Durables 0.86Maruti Suzuki India Ltd. Auto 0.83 TToottaall ooff TToopp TTeenn EEqquuiittyy && EEqquuiittyy RReellaatteedd HHoollddiinnggss 1122..1199 TToottaall EEqquuiittyy && EEqquuiittyy RReellaatteedd HHoollddiinnggss 2255..1199GG-SSEECC,, CCDD//CCPP,, CCRREEDDIITT EEXXPPOOSSUURREEGovernment Securities Sovereign 22.21Housing Development Finance Corporation Ltd. $ CRISIL - AAA 4.07Shriram Transport Finance Co. Ltd. CARE - AA+ / CRISIL - AA 4.07Power Finance Corporation Ltd. CRISIL - AAA 3.29Tata Power Co. Ltd. CRISIL - AA- 3.25State Bank of India CRISIL - AAA 2.98Hindalco Industries Ltd. CRISIL - AA+ 2.73Rural Electrification Corporation Ltd. CRISIL - AAA 2.58Infiniti Retail Ltd. CARE - A+ 2.32Tata Motors Finance Ltd. CRISIL - AA- 2.22TToottaall ooff TToopp TTeenn GG-SSeecc,, CCDD//CCPP,, CCrreeddiitt EExxppoossuurree 4499..7722TToottaall GG-SSeecc,, CCDD//CCPP,, CCrreeddiitt EExxppoossuurree 7711..1144Cash, Cash Equivalents and Net Current Assets 3.67 GGrraanndd TToottaall 110000..0000
AAvveerraaggee AAUUMM ffoorr tthhee qquuaarrtteerr eennddeedd DDeecceemmbbeerr 3311,, 22001133 ((`̀ IInn LLaakkhhss)) 443322,,998811..5522
Portfolio – Top 10 Holdings
* Computed on the invested amount for debt portfolio
$ Sponsor
MMooddiiffiieedd DDuurraattiioonn ** 44..6677 yyeeaarrss
YYiieelldd ttoo MMaattuurriittyy ** 99..7799%%YYiieelldd ttoo MMaattuurriittyy ** 99..9900%%
AAvveerraaggee MMaattuurriittyy ** 99..4499 yyeeaarrss
* Computed on the invested amount for debt portfolio
MMooddiiffiieedd DDuurraattiioonn ** 22..3333 yyeeaarrss
AAvveerraaggee MMaattuurriittyy ** 55..7711 yyeeaarrss
NNAAVV NAV per Unit (`) Growth Option 20.4539Monthly Dividend Option 11.0314Quarterly Dividend Option 11.3861Direct Plan - Growth Option 20.5222Direct Plan - Monthly Dividend Option 11.0700Direct Plan - Quarterly Dividend Option 11.4260
NNAAVV NAV per Unit (`) Growth Option 27.0806Monthly Dividend Option 12.5193Quarterly Dividend Option 12.9562Direct Plan - Growth Option 27.2049Direct Plan - Monthly Dividend Option 12.5783Direct Plan - Quarterly Dividend Option 13.0182
HDFC MF MIP - Short Term PlanAn open-ended income scheme. Monthly income is not
assured and is subject to availability of distributable surplus
HDFC MF MIP - Long Term PlanAn open-ended income scheme. Monthly income is not
assured and is subject to availability of distributable surplus
January 2014 27Intouchmutually
CD - Certificate of Deposit; CP - Commercial Papers
Face Value per Unit: ` 10 unless otherwise specified + Industry Classification as recommended by AMFI Data is as of January 31, 2014 unless otherwise specified.

HDFC Multiple Yield FundAn open-ended income scheme
* Computed on the invested amount for debt portfolio * Computed on the invested amount for debt portfolio
NNAAVV NAV per Unit (`) Growth Option 22.2810Dividend Option 11.5518Direct Plan - Growth Option 22.3615Direct Plan - Dividend Option 11.5920
NNAAVV NAV per Unit (`) Growth Option 20.2680Dividend Option 11.4636Direct Plan - Growth Option 20.4019Direct Plan - Dividend Option 11.5375
HDFC Multiple Yield Fund - Plan 2005An open-ended income scheme
MMooddiiffiieedd DDuurraattiioonn ** 118844 ddaayyss
AAvveerraaggee MMaattuurriittyy ** 220066 ddaayyss AAvveerraaggee MMaattuurriittyy ** 225500 ddaayyss
CCoommppaannyy // IIssssuueerr IInndduussttrryy++ // RRaattiinngg %% ttoo NNAAVV
EEQQUUIITTYY && EEQQUUIITTYY RREELLAATTEEDDIPCA Laboratories Ltd. Pharmaceuticals 0.89eClerx Services Ltd. Software 0.83Tata Motors Ltd. DVR Auto 0.82NIIT Technologies Ltd. Software 0.82Fag Bearings India Ltd. Industrial Products 0.81Bajaj Finance Ltd. Finance 0.80Solar Industries India Ltd. Chemicals 0.79Navneet Education Ltd. Media And Entertainment 0.77VST Industries Ltd. Consumer Non Durables 0.77Grindwell Norton Ltd. Industrial Products 0.77TToottaall ooff TToopp TTeenn EEqquuiittyy && EEqquuiittyy RReellaatteedd HHoollddiinnggss 88..0077TToottaall EEqquuiittyy && EEqquuiittyy RReellaatteedd HHoollddiinnggss 1177..3355CCDD//CCPP,, CCRREEDDIITT EEXXPPOOSSUURREENational Housing Bank CARE - AAA 13.09Small Industries Development Bank of India [SIDBI] CARE - AAA 13.04Export - Import Bank of India CRISIL - A1+ 12.44State Bank of Mysore ICRA - A1+ 12.32IDFC Ltd. ICRA - AAA 7.86Power Finance Corporation Ltd. CRISIL - AAA 7.78Cholamandalam Investment and Finance Co. Ltd. ICRA - AA 5.23Shriram City Union Finance Ltd. CARE - AA 2.95Sundaram BNP Paribas Home Finance Ltd. CARE - AA+ 2.92Vijaya Bank CARE - A1+ 2.59TToottaall ooff TToopp TTeenn CCDD//CCPP,, CCrreeddiitt EExxppoossuurree 8800..2222TToottaall CCDD//CCPP,, CCrreeddiitt EExxppoossuurree 8800..3344 Cash, Cash Equivalents and Net Current Assets 2.31 GGrraanndd TToottaall 110000..0000
AAvveerraaggee AAUUMM ffoorr tthhee qquuaarrtteerr eennddeedd DDeecceemmbbeerr 3311,, 22001133 ((`̀ IInn LLaakkhhss)) 2200,,224422..9999
Portfolio – Top 10 Holdings
MMooddiiffiieedd DDuurraattiioonn ** 222277 ddaayyss
CCoommppaannyy // IIssssuueerr IInndduussttrryy++ // RRaattiinngg %% ttoo NNAAVV
EEQQUUIITTYY && EEQQUUIITTYY RREELLAATTEEDD
Tata Motors Ltd. DVR Auto 1.81
Wipro Ltd. Software 1.78
Cipla Ltd. Pharmaceuticals 1.41
Tata Steel Ltd. Ferrous Metals 1.23
Tata Consultancy Services Ltd. Software 1.23
Britannia Industries Ltd. Consumer Non Durables 1.20
eClerx Services Ltd. Software 1.09
Oil India Ltd. Oil 1.05
Bharat Petroleum Corporation Ltd. Petroleum Products 1.00
Federal Bank Ltd. Banks 0.82
TToottaall ooff TToopp TTeenn EEqquuiittyy && EEqquuiittyy RReellaatteedd HHoollddiinnggss 1122..6622
TToottaall EEqquuiittyy && EEqquuiittyy RReellaatteedd HHoollddiinnggss 2200..4422
CCDD//CCPP,, CCRREEDDIITT EEXXPPOOSSUURREE
IDFC Ltd. ICRA - AAA 13.77
Power Finance Corporation Ltd. CRISIL - AAA 13.72
LIC Housing Finance Ltd. CRISIL - AAA 13.70
Central Bank of India CARE - A1+ 7.62
Rural Electrification Corporation Ltd. CRISIL - AAA 6.82
Sundaram BNP Paribas Home Finance Ltd. CARE - AA+ 3.41
TToottaall CCDD//CCPP,, CCrreeddiitt EExxppoossuurree 5599..0044
Cash, Cash Equivalents and Net Current Assets 20.54
GGrraanndd TToottaall 110000..0000
AAvveerraaggee AAUUMM ffoorr tthhee qquuaarrtteerr eennddeedd DDeecceemmbbeerr 3311,, 22001133 ((`̀ IInn LLaakkhhss)) 77,,664488..9911
Portfolio – Top 10 Holdings
Intouchmutually28 January 2014
CD - Certificate of Deposit; CP - Commercial Papers
Face Value per Unit: ` 10 unless otherwise specified + Industry Classification as recommended by AMFI Data is as of January 31, 2014 unless otherwise specified.
YYiieelldd ttoo MMaattuurriittyy ** 99..4466%% YYiieelldd ttoo MMaattuurriittyy ** 99..8811%%
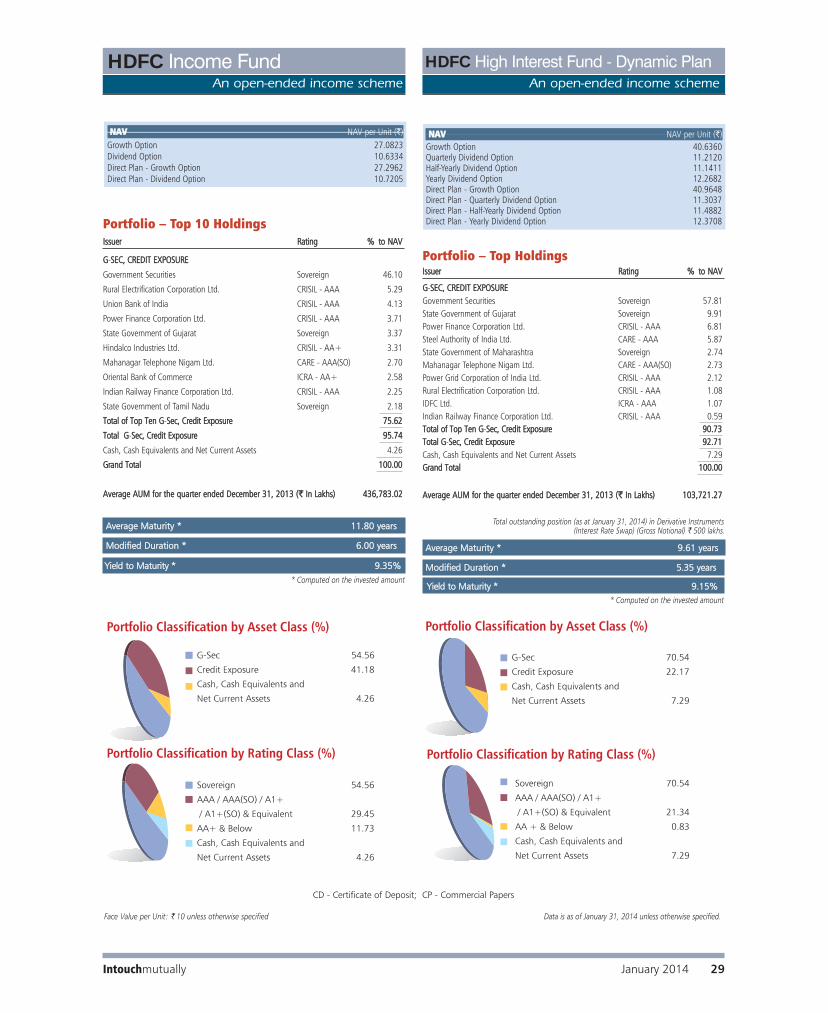
NNAAVV NAV per Unit (`)Growth Option 27.0823Dividend Option 10.6334Direct Plan - Growth Option 27.2962Direct Plan - Dividend Option 10.7205
NNAAVV NAV per Unit (`)Growth Option 40.6360Quarterly Dividend Option 11.2120Half-Yearly Dividend Option 11.1411Yearly Dividend Option 12.2682Direct Plan - Growth Option 40.9648Direct Plan - Quarterly Dividend Option 11.3037Direct Plan - Half-Yearly Dividend Option 11.4882Direct Plan - Yearly Dividend Option 12.3708
HDFC Income FundAn open-ended income scheme
MMooddiiffiieedd DDuurraattiioonn ** 66..0000 yyeeaarrss AAvveerraaggee MMaattuurriittyy ** 99..6611 yyeeaarrss
AAvveerraaggee MMaattuurriittyy ** 1111..8800 yyeeaarrss
HDFC High Interest Fund - Dynamic PlanAn open-ended income scheme
MMooddiiffiieedd DDuurraattiioonn ** 55..3355 yyeeaarrss
IIssssuueerr RRaattiinngg %% ttoo NNAAVV
GG-SSEECC,, CCRREEDDIITT EEXXPPOOSSUURREE
Government Securities Sovereign 46.10
Rural Electrification Corporation Ltd. CRISIL - AAA 5.29
Union Bank of India CRISIL - AAA 4.13
Power Finance Corporation Ltd. CRISIL - AAA 3.71
State Government of Gujarat Sovereign 3.37
Hindalco Industries Ltd. CRISIL - AA+ 3.31
Mahanagar Telephone Nigam Ltd. CARE - AAA(SO) 2.70
Oriental Bank of Commerce ICRA - AA+ 2.58
Indian Railway Finance Corporation Ltd. CRISIL - AAA 2.25
State Government of Tamil Nadu Sovereign 2.18
TToottaall ooff TToopp TTeenn GG-SSeecc,, CCrreeddiitt EExxppoossuurree 7755..6622
TToottaall GG-SSeecc,, CCrreeddiitt EExxppoossuurree 9955..7744
Cash, Cash Equivalents and Net Current Assets 4.26
GGrraanndd TToottaall 110000..0000
AAvveerraaggee AAUUMM ffoorr tthhee qquuaarrtteerr eennddeedd DDeecceemmbbeerr 3311,, 22001133 ((`̀ IInn LLaakkhhss)) 443366,,778833..0022
Portfolio – Top 10 Holdings
IIssssuueerr RRaattiinngg %% ttoo NNAAVV
GG-SSEECC,, CCRREEDDIITT EEXXPPOOSSUURREEGovernment Securities Sovereign 57.81State Government of Gujarat Sovereign 9.91Power Finance Corporation Ltd. CRISIL - AAA 6.81Steel Authority of India Ltd. CARE - AAA 5.87State Government of Maharashtra Sovereign 2.74Mahanagar Telephone Nigam Ltd. CARE - AAA(SO) 2.73Power Grid Corporation of India Ltd. CRISIL - AAA 2.12Rural Electrification Corporation Ltd. CRISIL - AAA 1.08IDFC Ltd. ICRA - AAA 1.07Indian Railway Finance Corporation Ltd. CRISIL - AAA 0.59 TToottaall ooff TToopp TTeenn GG-SSeecc,, CCrreeddiitt EExxppoossuurree 9900..7733 TToottaall GG-SSeecc,, CCrreeddiitt EExxppoossuurree 9922..7711 Cash, Cash Equivalents and Net Current Assets 7.29 GGrraanndd TToottaall 110000..0000
AAvveerraaggee AAUUMM ffoorr tthhee qquuaarrtteerr eennddeedd DDeecceemmbbeerr 3311,, 22001133 ((`̀ IInn LLaakkhhss)) 110033,,772211..2277
Portfolio – Top Holdings
* Computed on the invested amount
* Computed on the invested amount
Total outstanding position (as at January 31, 2014) in Derivative Instruments(Interest Rate Swap) (Gross Notional) ` 500 lakhs.
Intouchmutually January 2014 29
CD - Certificate of Deposit; CP - Commercial Papers
Face Value per Unit: ` 10 unless otherwise specified Data is as of January 31, 2014 unless otherwise specified.
YYiieelldd ttoo MMaattuurriittyy ** 99..1155%%
YYiieelldd ttoo MMaattuurriittyy ** 99..3355%%

NNAAVV NAV per Unit (`)Growth Option 23.9236Dividend Option 10.3057Direct Plan - Growth Option 23.9866Direct Plan - Dividend Option 10.3060
NNAAVV NAV per Unit (`)Growth Option 24.4022Dividend Option 10.5590Direct Plan - Growth Option 24.5140Direct Plan - Dividend Option 10.5596
HDFC Short Term PlanAn open-ended income scheme
HDFC High Interest Fund - Short Term PlanAn open-ended income scheme
MMooddiiffiieedd DDuurraattiioonn ** 11..1177 yyeeaarrss
AAvveerraaggee MMaattuurriittyy ** 11..4444 yyeeaarrss
MMooddiiffiieedd DDuurraattiioonn ** 11..8866 yyeeaarrss
AAvveerraaggee MMaattuurriittyy ** 22..4433 yyeeaarrss
Portfolio – Top 10 HoldingsIIssssuueerr RRaattiinngg %% ttoo NNAAVV
GG-SSEECC,, CCRREEDDIITT EEXXPPOOSSUURREE
Housing Development Finance Corporation Ltd. $ CRISIL - AAA 7.20
Tube Investments of India Ltd. CRISIL - AA 7.16
Cholamandalam Investment and Finance Co. Ltd. ICRA - AA 7.15
Rural Electrification Corporation Ltd. CRISIL - AAA 6.54
Volkswagen Finance Private Limited FITCH - AAA 6.34
Government Securities Sovereign 5.04
Shriram City Union Finance Ltd. CRISIL - AA- 4.37
BMW India Financial Services Pvt. Ltd. CRISIL - AAA 4.36
Power Grid Corporation of India Ltd. CRISIL - AAA 3.45
Tata Motors Ltd. CARE - AA 3.44
TToottaall ooff TToopp TTeenn GG-SSeecc,, CCrreeddiitt EExxppoossuurree 5555..0055
TToottaall GG-SSeecc,, CCrreeddiitt EExxppoossuurree 8877..3366
Cash, Cash Equivalents and Net Current Assets 12.64
GGrraanndd TToottaall 110000..0000
AAvveerraaggee AAUUMM ffoorr tthhee qquuaarrtteerr eennddeedd DDeecceemmbbeerr 3311,, 22001133 ((`̀ IInn LLaakkhhss)) 223300,,444433..7799
Portfolio – Top 10 HoldingsIIssssuueerr RRaattiinngg %% ttoo NNAAVV
GG-SSEECC,, TT-BBIILLLLSS,, CCDD//CCPP,, CCRREEDDIITT EEXXPPOOSSUURREEPower Finance Corporation Ltd. CRISIL - AAA 6.39Canara Bank CRISIL - A1+ 5.52LIC Housing Finance Ltd. CARE - AAA / CRISIL - AAA 5.05Tata Motors Ltd.# CARE - AA / CRISIL - AAA(SO) 5.03Housing Development Finance Corporation Ltd. $ CRISIL - AAA 4.63Madura Garments Lifestyle Retail Co (100% Put on ABNL) ICRA - AA+(SO) 4.57Jay Properties Private Ltd. Unrated 4.00Shriram Transport Finance Co. Ltd. CARE - AA+ / CRISIL - AA 3.99Rural Electrification Corporation Ltd. CRISIL - AAA 3.70Shriram City Union Finance Ltd. CRISIL - AA- 3.21TToottaall ooff TToopp TTeenn GG-SSeecc,, TT-BBiillllss,, CCDD//CCPP,, CCrreeddiitt EExxppoossuurree 4466..0099 TToottaall GG-SSeecc,, TT-BBiillllss,, CCDD//CCPP,, CCrreeddiitt EExxppoossuurree 8888..2266 Cash, Cash Equivalents and Net Current Assets 11.74 GGrraanndd TToottaall 110000..0000
AAvveerraaggee AAUUMM ffoorr tthhee qquuaarrtteerr eennddeedd DDeecceemmbbeerr 3311,, 22001133 ((`̀ IInn LLaakkhhss)) 220088,,881111..6677
* Computed on the invested amount
# Includes 0.27% exposure Guaranteed by SBI$ Sponsor
* Computed on the invested amount
$ Sponsor
Intouchmutually30 January 2014
CD - Certificate of Deposit; CP - Commercial Papers
Face Value per Unit: ` 10 unless otherwise specified Data is as of January 31, 2014 unless otherwise specified.
YYiieelldd ttoo MMaattuurriittyy ** 99..8800%% YYiieelldd ttoo MMaattuurriittyy ** 99..7788%%
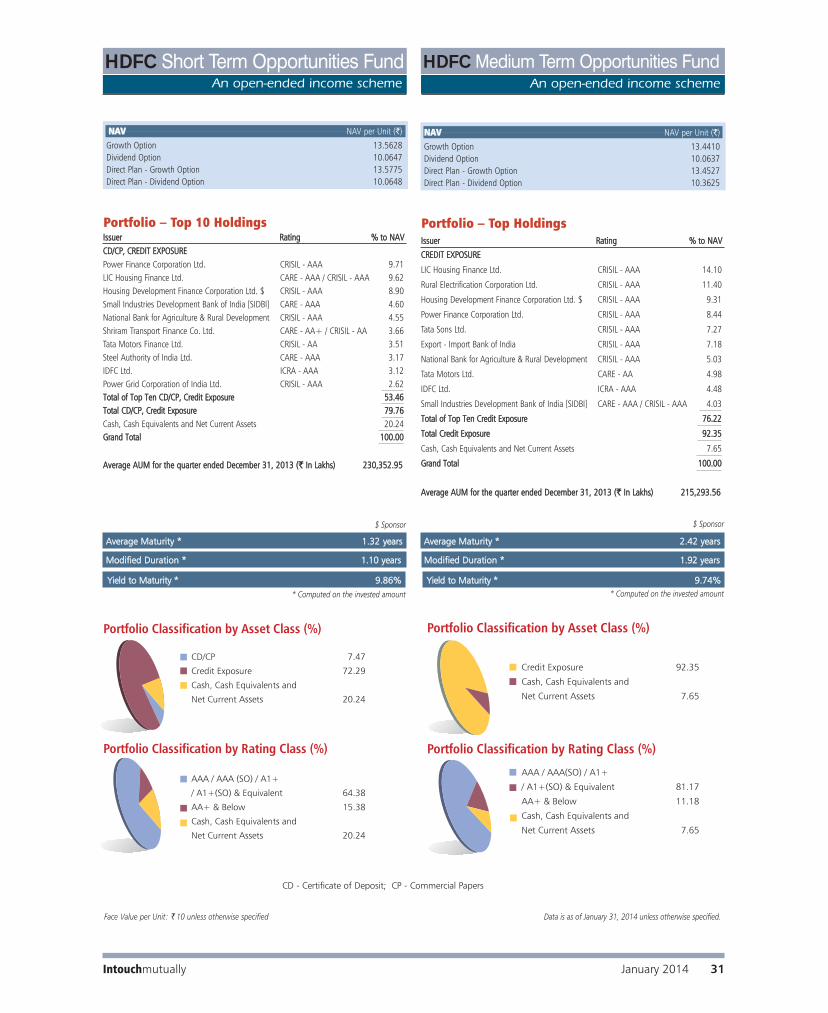
Intouchmutually January 2014 31
Portfolio – Top 10 HoldingsIIssssuueerr RRaattiinngg %% ttoo NNAAVV
HDFC Short Term Opportunities FundAn open-ended income scheme An open-ended income scheme
HDFC Medium Term Opportunities Fund
* Computed on the invested amount
$ Sponsor$ Sponsor
AAvveerraaggee MMaattuurriittyy ** 22..4422 yyeeaarrssAAvveerraaggee MMaattuurriittyy ** 11..3322 yyeeaarrss
MMooddiiffiieedd DDuurraattiioonn ** 11..1100 yyeeaarrss MMooddiiffiieedd DDuurraattiioonn ** 11..9922 yyeeaarrss
Portfolio – Top HoldingsIIssssuueerr RRaattiinngg %% ttoo NNAAVV
NNAAVV NAV per Unit (`)
Growth Option 13.5628Dividend Option 10.0647Direct Plan - Growth Option 13.5775Direct Plan - Dividend Option 10.0648
NNAAVV NAV per Unit (`)
Growth Option 13.4410Dividend Option 10.0637Direct Plan - Growth Option 13.4527Direct Plan - Dividend Option 10.3625
CCRREEDDIITT EEXXPPOOSSUURREE
LIC Housing Finance Ltd. CRISIL - AAA 14.10
Rural Electrification Corporation Ltd. CRISIL - AAA 11.40
Housing Development Finance Corporation Ltd. $ CRISIL - AAA 9.31
Power Finance Corporation Ltd. CRISIL - AAA 8.44
Tata Sons Ltd. CRISIL - AAA 7.27
Export - Import Bank of India CRISIL - AAA 7.18
National Bank for Agriculture & Rural Development CRISIL - AAA 5.03
Tata Motors Ltd. CARE - AA 4.98
IDFC Ltd. ICRA - AAA 4.48
Small Industries Development Bank of India [SIDBI] CARE - AAA / CRISIL - AAA 4.03
TToottaall ooff TToopp TTeenn CCrreeddiitt EExxppoossuurree 7766..2222
TToottaall CCrreeddiitt EExxppoossuurree 9922..3355
Cash, Cash Equivalents and Net Current Assets 7.65
GGrraanndd TToottaall 110000..0000
AAvveerraaggee AAUUMM ffoorr tthhee qquuaarrtteerr eennddeedd DDeecceemmbbeerr 3311,, 22001133 ((`̀ IInn LLaakkhhss)) 221155,,229933..5566
CCDD//CCPP,, CCRREEDDIITT EEXXPPOOSSUURREEPower Finance Corporation Ltd. CRISIL - AAA 9.71LIC Housing Finance Ltd. CARE - AAA / CRISIL - AAA 9.62Housing Development Finance Corporation Ltd. $ CRISIL - AAA 8.90Small Industries Development Bank of India [SIDBI] CARE - AAA 4.60National Bank for Agriculture & Rural Development CRISIL - AAA 4.55Shriram Transport Finance Co. Ltd. CARE - AA+ / CRISIL - AA 3.66Tata Motors Finance Ltd. CRISIL - AA 3.51Steel Authority of India Ltd. CARE - AAA 3.17IDFC Ltd. ICRA - AAA 3.12Power Grid Corporation of India Ltd. CRISIL - AAA 2.62TToottaall ooff TToopp TTeenn CCDD//CCPP,, CCrreeddiitt EExxppoossuurree 5533..4466TToottaall CCDD//CCPP,, CCrreeddiitt EExxppoossuurree 7799..7766 Cash, Cash Equivalents and Net Current Assets 20.24 GGrraanndd TToottaall 110000..0000
AAvveerraaggee AAUUMM ffoorr tthhee qquuaarrtteerr eennddeedd DDeecceemmbbeerr 3311,, 22001133 ((`̀ IInn LLaakkhhss)) 223300,,335522..9955
CD - Certificate of Deposit; CP - Commercial Papers
* Computed on the invested amount
Face Value per Unit: ` 10 unless otherwise specified Data is as of January 31, 2014 unless otherwise specified.
YYiieelldd ttoo MMaattuurriittyy ** 99..7744%%YYiieelldd ttoo MMaattuurriittyy ** 99..8866%%

An open-ended income schemeHDFC Gilt Fund
Short Term Plan Long Term Plan
MMooddiiffiieedd DDuurraattiioonn ** 33..5555 yyeeaarrss MMooddiiffiieedd DDuurraattiioonn ** 55..8877 yyeeaarrss
AAvveerraaggee MMaattuurriittyy ** 55..1177 yyeeaarrss AAvveerraaggee MMaattuurriittyy ** 1111..0088 yyeeaarrss
IIssssuueerr RRaattiinngg %% ttoo NNAAVV
GG-SSEECC // SSDDLL
8.07 GOI 2017 Sovereign 23.87
6.49 GOI 2015 Sovereign 19.69
7.83 GOI 2018 Sovereign 15.60
7.28 GOI 2019 Sovereign 15.11
8.28 GOI 2027 Sovereign 15.06
State Government of Punjab Sovereign 4.31
8.19 GOI 2020 Sovereign 0.12
TToottaall GG-SSeecc // SSDDLL 9933..7766
Cash, Cash Equivalents and Net Current Assets 6.24
GGrraanndd TToottaall 110000..0000
AAvveerraaggee AAUUMM ffoorr tthhee qquuaarrtteerr eennddeedd DDeecceemmbbeerr 3311,, 22001133 ((`̀ IInn LLaakkhhss)) 775588..9955
Portfolio – Top HoldingsIIssssuueerr RRaattiinngg %% ttoo NNAAVV
GG-SSEECC
8.83 GOI 2023 Sovereign 16.72
9.20 GOI 2030 Sovereign 16.64
7.28 GOI 2019 Sovereign 15.55
8.32 GOI 2032 Sovereign 15.39
8.28 GOI 2027 Sovereign 7.50
8.33 GOI 2026 Sovereign 5.20
8.07 GOI 2017 Sovereign 3.69
8.30 GOI 2042 Sovereign 2.52
7.83 GOI 2018 Sovereign 2.41
8.20 GOI 2025 Sovereign 1.94
TToottaall ooff TToopp TTeenn GG-SSeecc 8877..5566
TToottaall GG-SSeecc 8888..2211
Cash, Cash Equivalents and Net Current Assets 11.79
GGrraanndd TToottaall 110000..0000
AAvveerraaggee AAUUMM ffoorr tthhee qquuaarrtteerr eennddeedd DDeecceemmbbeerr 3311,, 22001133 ((`̀ IInn LLaakkhhss)) 3322,,333355..8899
Portfolio – Top 10 Holdings
Intouchmutually32 January 2014
Face Value per Unit: ` 10 unless otherwise specified Data is as of January 31, 2014 unless otherwise specified.
NNAAVV NAV per Unit (`)
Growth Option 20.3175Dividend Option 10.9239Direct Plan - Growth Option 20.3802Direct Plan - Dividend Option 10.9596
NNAAVV NAV per Unit (`)
Growth Option 23.3749Dividend Option 10.4722Direct Plan - Growth Option 23.43870Direct Plan - Dividend Option 10.5009
* Computed on the invested amount * Computed on the invested amount
YYiieelldd ttoo MMaattuurriittyy ** 88..8899%%YYiieelldd ttoo MMaattuurriittyy ** 88..7788%%

MMooddiiffiieedd DDuurraattiioonn ** 7766 ddaayyss
YYiieelldd ttoo MMaattuurriittyy ** 99..0000%%
Short Term Plan
TT-BBIILLLLSS,, CCDD//CCPP,, CCRREEDDIITT EEXXPPOOSSUURREEGovernment Securities Sovereign 11.87Housing Development Finance Corporation Ltd. $ CRISIL - AAA 6.53IDFC Ltd. ICRA - A1+, AAA 5.22Sesa Sterlite Ltd. CRISIL - A1+ 3.53Ranbaxy Laboratories Ltd. CRISIL - A1+ 2.95Shriram Transport Finance Co. Ltd. CARE - AA+ 2.76Sundaram Finance Ltd. CRISIL - AA+ / ICRA - AA+ 2.37UCO Bank CRISIL - A1+ 2.36Bank of Baroda CRISIL - A1+ 2.36Corporation Bank CRISIL - A1+ 2.34TToottaall ooff TToopp TTeenn TT-BBiillllss,, CCDD//CCPP,, CCrreeddiitt EExxppoossuurree 4422..2299TToottaall TT-BBiillllss,, CCDD//CCPP,, CCrreeddiitt EExxppoossuurree 7799..0099Cash, Cash Equivalents and Net Current Assets 20.91GGrraanndd TToottaall 110000..0000
AAvveerraaggee AAUUMM ffoorr tthhee qquuaarrtteerr eennddeedd DDeecceemmbbeerr 3311,, 22001133 ((`̀ IInn LLaakkhhss)) 443355,,991133..4499
Portfolio – Top 10 HoldingsIIssssuueerr RRaattiinngg %% ttoo NNAAVV
CCDD//CCPP
UCO Bank CRISIL - A1+ 16.16
Export - Import Bank of India CRISIL - A1+ 16.15
IDBI Bank Ltd. ICRA - A1+ 15.84
Allahabad Bank CRISIL - A1+ 12.93
ICICI Bank Ltd. ICRA - A1+ 11.31
Vijaya Bank CARE - A1+ 9.70
Indian Bank FITCH - A1+ 5.17
Dena Bank CRISIL - A1+ 3.56
Karur Vysya Bank Ltd. ICRA - A1+ 3.46
Kotak Mahindra Bank Ltd. CRISIL - A1+ 3.23
TToottaall ooff TToopp TTeenn CCDD//CCPP 9977..5511
TToottaall CCDD//CCPP 9999..7733
Cash, Cash Equivalents and Net Current Assets 0.27
GGrraanndd TToottaall 110000..0000
AAvveerraaggee AAUUMM ffoorr tthhee qquuaarrtteerr eennddeedd DDeecceemmbbeerr 3311,, 22001133 ((`̀ IInn LLaakkhhss)) 115588,,447788..1188
Portfolio – Top 10 HoldingsIIssssuueerr RRaattiinngg %% ttoo NNAAVV
HDFC Floating Rate Income FundAn open-ended income scheme
HDFC Floating Rate Income FundAn open-ended income scheme
Long Term Plan
MMooddiiffiieedd DDuurraattiioonn ** 4477 ddaayyss
YYiieelldd ttoo MMaattuurriittyy ** 88..6600%%
AAvveerraaggee MMaattuurriittyy ** 8833 ddaayyss
AAvveerraaggee MMaattuurriittyy ** 5511 ddaayyss
NNAAVV NAV per Unit (`)RReettaaiill OOppttiioonnGrowth Option 21.1120Daily Dividend Reinvestment Option 10.0809Weekly Dividend Option 10.1417Monthly Dividend Option 10.1503WWhhoolleessaallee OOppttiioonnGrowth Option 21.5557Daily Dividend Reinvestment Option 10.0809Weekly Dividend Option 10.1420Monthly Dividend Option 10.1507Direct Plan - Growth Option 21.5679Direct Plan - Daily Dividend Reinvestment Option 10.0809Direct Plan - Weekly Dividend Option 10.1421Direct Plan - Monthly Dividend Option 10.1508
NNAAVV NAV per Unit (`)Growth Option 21.9749Weekly Dividend Reinvestment Option 10.2084Direct Plan - Growth Option 21.9855Direct Plan - Weekly Dividend Reinvestment Option 10.2084
CD - Certificate of Deposit; CP - Commercial Papers
* Computed on the invested amount
* Computed on the invested amount
Face Value per Unit: ` 10 unless otherwise specified Data is as of January 31, 2014 unless otherwise specified.
$ Sponsor
Intouchmutually January 2014 33

Savings PlanAn open-ended high liquidity income scheme
Portfolio – Top 10 HoldingsIIssssuueerr RRaattiinngg %% ttoo NNAAVV
HDFC Liquid FundAn open-ended liquid income scheme
HDFC Cash Management Fund
* Computed on the invested amount
* Computed on the invested amount
AAvveerraaggee MMaattuurriittyy ** 2277 ddaayyss
AAvveerraaggee MMaattuurriittyy ** 3322 ddaayyss
MMooddiiffiieedd DDuurraattiioonn ** 2299 ddaayyss
MMooddiiffiieedd DDuurraattiioonn ** 2255 ddaayyss
Portfolio – Top 10 HoldingsIIssssuueerr RRaattiinngg %% ttoo NNAAVV
NNAAVV NAV per Unit (`)Growth Option 26.3969Daily Dividend Reinvestment Option 10.6364Weekly Dividend Option 10.6423Direct Plan - Growth Option 26.4134Direct Plan - Daily Dividend Reinvestment Option 10.6364Direct Plan - Weekly Dividend Option 10.6423
NNAAVV NAV per Unit (`)
HHDDFFCC LLiiqquuiidd FFuunnddGrowth Option 24.9363Daily Dividend Reinvestment Option 10.1982Weekly Dividend Option 10.3199Monthly Dividend Option 10.2726Direct Plan - Growth Option 24.9547Direct Plan - Daily Dividend Reinvestment Option 10.1982Direct Plan - Weekly Dividend Option 10.3199Direct Plan - Monthly Dividend Option 10.2727HHDDFFCC LLiiqquuiidd FFuunndd - PPrreemmiiuumm PPllaannGrowth Option 25.3443Daily Dividend Reinvestment Option 12.2598 GG-SSEECC,, TT-BBIILLLLSS,, CCDD//CCPP
Indian Oil Corporation Ltd. ICRA - A1+ 6.67
Government Securities Sovereign 6.26
Bank of Baroda CRISIL - A1+ 5.96
Corporation Bank CRISIL - A1+ 5.23
Export - Import Bank of India CRISIL - A1+ 5.21
Central Bank of India CARE - A1+ 4.49
Small Industries Development Bank of India [SIDBI] CARE - A1+ 3.72
Indian Bank FITCH - A1+ 3.35
India infoline Finance Ltd. ICRA - A1+ 2.98
Piramal Enterprises Ltd. ICRA - A1+ 2.62
TToottaall ooff TToopp TTeenn GG-SSeecc,, TT-BBiillllss,, CCDD//CCPP 4466..4499
TToottaall GG-SSeecc,, TT-BBiillllss,, CCDD//CCPP 7766..0066
Cash, Cash Equivalents and Net Current Assets 23.94
GGrraanndd TToottaall 110000..0000
AAvveerraaggee AAUUMM ffoorr tthhee qquuaarrtteerr eennddeedd DDeecceemmbbeerr 3311,, 22001133 ((`̀ IInn LLaakkhhss)) 667711,,229999..4455
GG-SSEECC,, TT-BBIILLLLSS,, BBRRDDSS,, CCDD//CCPP,, CCRREEDDIITT EEXXPPOOSSUURREE
Government Securities Sovereign 10.61
Indian Oil Corporation Ltd. ICRA - A1+ 6.60
Andhra Bank FITCH - A1+ 5.64
Export - Import Bank of India CRISIL - A1+, AAA 3.95
Bajaj Finance Ltd. ICRA - A1+ 2.76
Oriental Bank of Commerce CRISIL - A1+ 2.63
Bank of India CRISIL - A1+ 2.49
Corporation Bank CRISIL - A1+ 2.19
IDBI Bank Ltd. ICRA - A1+ 2.07
Axis Bank Ltd. CRISIL - A1+ / BRDS 1.93TToottaall ooff TToopp TTeenn GG-SSeecc,, TT-BBiillllss,, BBRRDDSS,, CCDD//CCPP,,
CCrreeddiitt EExxppoossuurree 4400..8877 TToottaall GG-SSeecc,, TT-BBiillllss,, BBRRDDSS,, CCDD//CCPP,, CCrreeddiitt EExxppoossuurree 7766..6644
Cash, Cash Equivalents and Net Current Assets 23.36 GGrraanndd TToottaall 110000..0000
AAvveerraaggee AAUUMM ffoorr tthhee qquuaarrtteerr eennddeedd DDeecceemmbbeerr 3311,, 22001133 ((`̀ IInn LLaakkhhss)) 11,,556688,,997733..1100
BRDS - Bills Rediscounting (not rated); CD - Certificate of Deposit; CP - Commercial Papers
Face Value per Unit: ` 10 unless otherwise specified Data is as of January 31, 2014 unless otherwise specified.
Intouchmutually34 January 2014
YYiieelldd ttoo MMaattuurriittyy ** 88..7711%%
YYiieelldd ttoo MMaattuurriittyy ** 88..7766%%

Portfolio – Top 10 HoldingsAAvveerraaggee MMaattuurriittyy ** 33 ddaayyss
MMooddiiffiieedd DDuurraattiioonn ** 11 ddaayy
HDFC Cash Management Fund HDFC Cash Management Fund
NNoottee ffoorr AAllll AAffoorreessaaiidd OOppeenn-EEnnddeedd SScchheemmeess ((aass aatt JJaannuuaarryy 3311 22001144))i) Total NPAs provided for and its percentage to NAV : Nilii) Investment in ADR/GDR/Foreign Securities : Niliii) Total outstanding exposure in derivative instruments (Gross Notional)
a) Equity : NilHDFC Arbitrage Fund `̀ 2,473.32 lakhs
Total `̀ 22,,447733..3322 llaakkhhssb) Debt : Interest Rates Swaps / Forward Rate Agreement :
HDFC High Interest Fund - Dynamic Plan (Interest Rates Swaps) `̀ 500.00 lakhsTotal `̀ 550000..0000 llaakkhhss
Treasury Advantage Plan Call PlanAn open-ended income scheme An open-ended high liquidity income scheme
* Computed on the invested amount
* Computed on the invested amount
AAvveerraaggee MMaattuurriittyy ** 110022 ddaayyss
MMooddiiffiieedd DDuurraattiioonn ** 9922 ddaayyss
IIssssuueerr RRaattiinngg %% ttoo NNAAVV
NNAAVV NAV per Unit (`)RReettaaiill OOppttiioonnGrowth Option 26.8430Daily Dividend Reinvestment Option 10.0315Weekly Dividend Option 10.0503Monthly Dividend Option 10.0542Direct Plan - Growth Option 27.0397Direct Plan - Daily Dividend Reinvestment Option 10.0315Direct Plan - Weekly Dividend Option 10.0509Direct Plan - Monthly Dividend Option 10.0550WWhhoolleessaallee OOppttiioonnGrowth Option 27.5955Daily Dividend Reinvestment Option 10.0315Weekly Dividend Option 10.0509Monthly Dividend Option 10.0549
NNAAVV NAV per Unit (`)Growth Option 20.0903Daily Dividend Reinvestment Option 10.4266Direct Plan - Growth Option 20.1021Direct Plan - Daily Dividend Reinvestment Option 10.4266
TT-BBIILLLLSS,, CCDD//CCPP,, CCRREEDDIITT EEXXPPOOSSUURREEHousing Development Finance Corporation Ltd. $ CRISIL - AAA 7.01Government Securities Sovereign 5.41Corporation Bank CRISIL - A1+ 3.09Ranbaxy Laboratories Ltd. CRISIL - A1+ / ICRA - A1+ 2.78Shriram Transport Finance Co. Ltd. CARE - AA+ 2.67LIC Housing Finance Ltd. CRISIL - AAA 2.63National Bank for Agriculture & Rural Development CRISIL - AAA 2.58Rural Electrification Corporation Ltd. CARE - A1+ / CRISIL - AAA 2.50Fullerton India Credit Company Ltd. ICRA - A1+ 2.47National Housing Bank CRISIL - AAA / FITCH - AAA /
ICRA - A1+ 2.36 TToottaall ooff TToopp TTeenn TT-BBiillllss,, CCDD//CCPP,, CCrreeddiitt EExxppoossuurree 3333..5500 TToottaall TT-BBiillllss,, CCDD//CCPP,, CCrreeddiitt EExxppoossuurree 7766..1177 Cash, Cash Equivalents and Net Current Assets 23.83 GGrraanndd TToottaall 110000..0000
AAvveerraaggee AAUUMM ffoorr tthhee qquuaarrtteerr eennddeedd DDeecceemmbbeerr 3311,, 22001133 ((`̀ IInn LLaakkhhss)) 667711,,229999..4455
Portfolio – HoldingsIIssssuueerr %% ttoo NNAAVVCash, Cash Equivalents and Net Current Assets 100.00
GGrraanndd TToottaall 110000..0000
AAvveerraaggee AAUUMM ffoorr tthhee qquuaarrtteerr eennddeedd DDeecceemmbbeerr 3311,, 22001133 ((`̀ IInn LLaakkhhss)) 6600,,999955..6655
CD - Certificate of Deposit CP - Commercial Papers
Face Value per Unit: ` 10 unless otherwise specified Data is as of January 31, 2014 unless otherwise specified.
Intouchmutually January 2014 35
YYiieelldd ttoo MMaattuurriittyy ** 99..2200%%
YYiieelldd ttoo MMaattuurriittyy ** 88..0044%%
$ Sponsor

SCHEME PERFORMANCE SUMMARY (FUND MANAGER-WISE)
Date Period NAV Scheme Benchmark Additional Value of investment of ` 10,000@ per Unit Returns Returns Benchmark Scheme Benchmark Additional
(`) (%)^ (%)# Returns (`) #(`) Benchmark##(%) (`) ##
^̂PPaasstt ppeerrffoorrmmaannccee mmaayy oorr mmaayy nnoott bbee ssuussttaaiinneedd iinn tthhee ffuuttuurree.. Returns greater than 1 year period are compounded annualized (CAGR). # CNX 500 Index ## CNX Nifty Index
A. Cumulative performance
Dec 31, 12 Last 1 Year 293.424 3.82 3.61 6.76 10,382 10,361 10,676Dec 30, 11 Last 2 Years 218.737 17.96 16.83 16.71 13,927 13,661 13,632Dec 31, 10 Last 3 Years 298.501 0.68 -0.18 0.91 10,205 9,947 10,276Jan 01, 95 Since Inception 10.000 19.69 8.89 N.A. 304,632 50,465 N.A.
Period Scheme Benchmark Additional ^ # Benchmark
##
B. Discrete 12 month returns (%)
Dec 31, 12 to Dec 31, 13 3.82 3.61 6.76
Dec 30, 11 to Dec 31, 12 33.93 31.65 27.53
Dec 31, 10 to Dec 30, 11 -26.72 -27.19 -24.62
HDFC EQUITY FUND - GROWTH OPTION NAV as at December 31, 2013 ` 304.632
Date Period NAV Scheme Benchmark Additional Value of investment of ` 10,000@ per Unit Returns Returns Benchmark Scheme Benchmark Additional
(`) (%)^$$ (%)# Returns (`) $$ #(`) Benchmark(%)## (`) ##
^̂PPaasstt ppeerrffoorrmmaannccee mmaayy oorr mmaayy nnoott bbee ssuussttaaiinneedd iinn tthhee ffuuttuurree.. Returns greater than 1 year period are compounded annualized (CAGR). # S&P BSE 200 ## S&P BSE SENSEX$$ All dividends declared prior to the splitting of the Scheme into Dividend & Growth Options are assumed to be reinvested in the units of the Scheme at the then prevailing NAV (ex-dividend NAV).
A. Cumulative performance
Dec 31, 12 Last 1 Year 226.241 4.05 4.38 8.98 10,405 10,438 10,898Dec 30, 11 Last 2 Years 170.834 17.33 16.88 16.99 13,780 13,672 13,698Dec 31, 10 Last 3 Years 225.661 1.42 -0.04 1.06 10,432 9,987 10,323Oct 11, 96 Since Inception 10.000 21.51 12.88 11.66 287,024 80,707 66,889
Period Scheme Benchmark Additional ^$$ # Benchmark
##
B. Discrete 12 month returns (%)
Dec 31, 12 to Dec 31, 13 4.05 4.38 8.98
Dec 30, 11 to Dec 31, 12 32.23 30.79 25.54
Dec 31, 10 to Dec 30, 11 -24.30 -26.95 -24.64
HDFC TOP 200 FUND - GROWTH OPTION NAV as at December 31, 2013 ` 235.401
PRASHANT JAIN
Date Period NAV Scheme Benchmark Additional Value of investment of ` 10,000@ per Unit Returns Returns Benchmark Scheme Benchmark Additional
(`) (%)^ (%)# Returns (`) #(`) Benchmark(%)## (`) ##
^̂PPaasstt ppeerrffoorrmmaannccee mmaayy oorr mmaayy nnoott bbee ssuussttaaiinneedd iinn tthhee ffuuttuurree.. Returns greater than 1 year period are compounded annualized (CAGR). # CNX 500 Index ## CNX Nifty Index The Scheme is co-mmanaged by Prashant Jain and Srinivas Rao Ravuri.
A. Cumulative performance
Dec 31, 12 Last 1 Year 11.004 -14.43 3.61 6.76 8,557 10,361 10,676Dec 30, 11 Last 2 Years 8.126 7.62 16.83 16.71 11,588 13,661 13,632Dec 31, 10 Last 3 Years 12.731 -9.56 -0.18 0.91 7,396 9,947 10,276Mar 10, 08 Since Inception 10.000 -1.03 3.93 4.80 9,416 12,513 13,132
Period Scheme Benchmark Additional ^ # Benchmark
##
B. Discrete 12 month returns (%)
Dec 31, 12 to Dec 31, 13 -14.43 3.61 6.76
Dec 30, 11 to Dec 31, 12 35.19 31.65 27.53
Dec 31, 10 to Dec 30, 11 -36.17 -27.19 -24.62
HDFC INFRASTRUCTURE FUND - GROWTH OPTION NAV as at December 31, 2013 ` 9.416
Date Period NAV Scheme Benchmark Additional Value of investment of ` 10,000@ per Unit Returns Returns Benchmark Scheme Benchmark Additional
(`) (%)^$$ (%)# Returns (`) $$ #(`) Benchmark(%)## (`) ##
^̂PPaasstt ppeerrffoorrmmaannccee mmaayy oorr mmaayy nnoott bbee ssuussttaaiinneedd iinn tthhee ffuuttuurree.. Returns greater than 1 year period are compounded annualized (CAGR). # CRISIL Balanced Fund Index ## CNX Nifty Index$$ All dividends declared prior to the splitting of the Scheme into Dividend & Growth Options are assumed to be reinvested in the units of the Scheme at the then prevailing NAV (ex-dividend NAV).Scheme performance may not strictly be comparable with that of its Additional Benchmark in view of balanced nature of the scheme where a portion of scheme's investments are made in debt instruments
A. Cumulative performance
Dec 31, 12 Last 1 Year 241.012 2.06 6.05 6.76 10,206 10,605 10,676Dec 30, 11 Last 2 Years 185.270 15.18 13.37 16.71 13,276 12,861 13,632Dec 31, 10 Last 3 Years 220.120 3.77 3.26 0.91 11,175 11,010 10,276Feb 01, 94 Since Inception 10.000 18.96 N.A. 8.55 317,920 N.A. 51,255
Period Scheme Benchmark Additional ^$$ # Benchmark
##
B. Discrete 12 month returns (%)
Dec 31, 12 to Dec 31, 13 2.06 6.05 6.76
Dec 30, 11 to Dec 31, 12 29.90 21.15 27.53
Dec 31, 10 to Dec 30, 11 -15.83 -14.39 -24.62
HDFC PRUDENCE FUND - GROWTH OPTION NAV as at December 31, 2013 ` 245.973
Performance of dividend option under the schemes for the investors would be net of distribution tax as applicable. Load is not taken into consideration for computation of performance. N.A.: Not Available@ shows the current value of ` 10,000/- invested at the beginning of a given periodWhere either NAV or Benchmark Index value is not available for the start/end date of a concerned period, the previous date where both NAV and Benchmark Index value are available, is considered for returns computation except for since inception returns
Intouchmutually36 January 2014
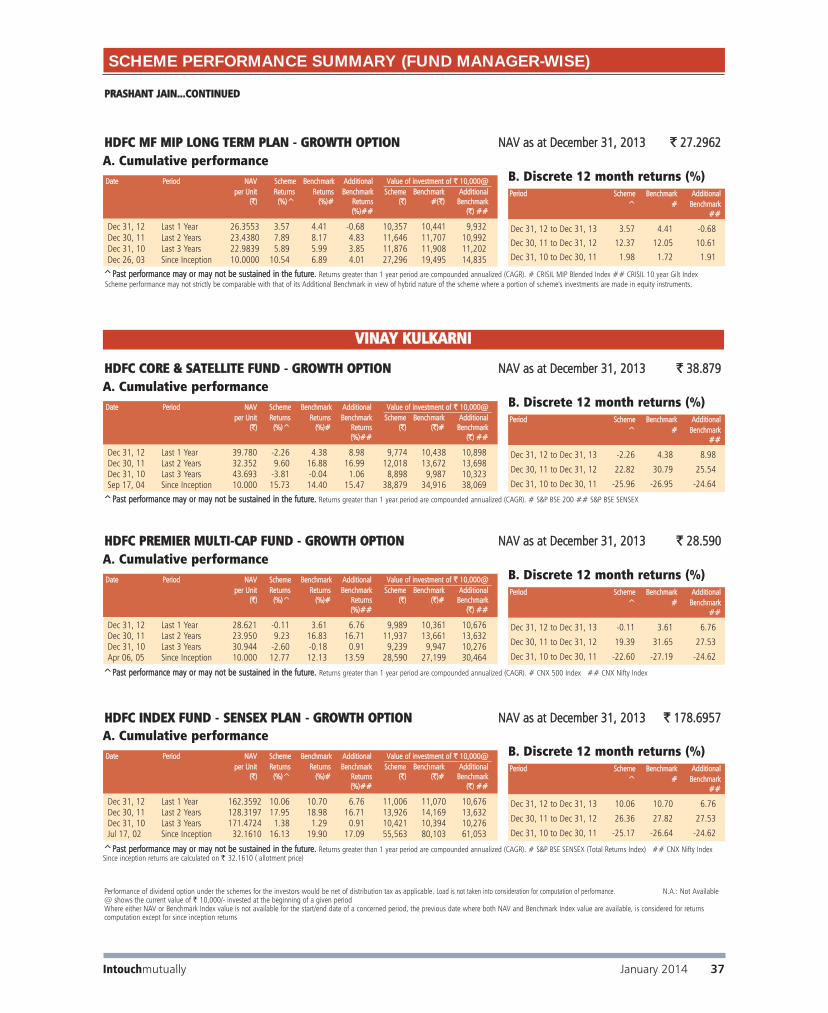
VINAY KULKARNI
Date Period NAV Scheme Benchmark Additional Value of investment of ` 10,000@ per Unit Returns Returns Benchmark Scheme Benchmark Additional
(`) (%)^ (%)# Returns (`) (`)# Benchmark(%)## (`) ##
^̂PPaasstt ppeerrffoorrmmaannccee mmaayy oorr mmaayy nnoott bbee ssuussttaaiinneedd iinn tthhee ffuuttuurree.. Returns greater than 1 year period are compounded annualized (CAGR). # S&P BSE SENSEX (Total Returns Index) ## CNX Nifty IndexSince inception returns are calculated on ` 32.1610 ( allotment price)
A. Cumulative performance
Dec 31, 12 Last 1 Year 162.3592 10.06 10.70 6.76 11,006 11,070 10,676Dec 30, 11 Last 2 Years 128.3197 17.95 18.98 16.71 13,926 14,169 13,632Dec 31, 10 Last 3 Years 171.4724 1.38 1.29 0.91 10,421 10,394 10,276Jul 17, 02 Since Inception 32.1610 16.13 19.90 17.09 55,563 80,103 61,053
Period Scheme Benchmark Additional ^ # Benchmark
##
B. Discrete 12 month returns (%)
Dec 31, 12 to Dec 31, 13 10.06 10.70 6.76
Dec 30, 11 to Dec 31, 12 26.36 27.82 27.53
Dec 31, 10 to Dec 30, 11 -25.17 -26.64 -24.62
HDFC INDEX FUND - SENSEX PLAN - GROWTH OPTION NAV as at December 31, 2013 ` 178.6957
Date Period NAV Scheme Benchmark Additional Value of investment of ` 10,000@ per Unit Returns Returns Benchmark Scheme Benchmark Additional
(`) (%)^ (%)# Returns (`) (`)# Benchmark(%)## (`) ##
^̂PPaasstt ppeerrffoorrmmaannccee mmaayy oorr mmaayy nnoott bbee ssuussttaaiinneedd iinn tthhee ffuuttuurree.. Returns greater than 1 year period are compounded annualized (CAGR). # CNX 500 Index ## CNX Nifty Index
A. Cumulative performance
Dec 31, 12 Last 1 Year 28.621 -0.11 3.61 6.76 9,989 10,361 10,676Dec 30, 11 Last 2 Years 23.950 9.23 16.83 16.71 11,937 13,661 13,632Dec 31, 10 Last 3 Years 30.944 -2.60 -0.18 0.91 9,239 9,947 10,276Apr 06, 05 Since Inception 10.000 12.77 12.13 13.59 28,590 27,199 30,464
Period Scheme Benchmark Additional ^ # Benchmark
##
B. Discrete 12 month returns (%)
Dec 31, 12 to Dec 31, 13 -0.11 3.61 6.76
Dec 30, 11 to Dec 31, 12 19.39 31.65 27.53
Dec 31, 10 to Dec 30, 11 -22.60 -27.19 -24.62
HDFC PREMIER MULTI-CCAP FUND - GROWTH OPTION NAV as at December 31, 2013 ` 28.590
Date Period NAV Scheme Benchmark Additional Value of investment of ` 10,000@ per Unit Returns Returns Benchmark Scheme Benchmark Additional
(`) (%)^ (%)# Returns (`) (`)# Benchmark(%)## (`) ##
^̂PPaasstt ppeerrffoorrmmaannccee mmaayy oorr mmaayy nnoott bbee ssuussttaaiinneedd iinn tthhee ffuuttuurree.. Returns greater than 1 year period are compounded annualized (CAGR). # S&P BSE 200 ## S&P BSE SENSEX
A. Cumulative performance
Dec 31, 12 Last 1 Year 39.780 -2.26 4.38 8.98 9,774 10,438 10,898Dec 30, 11 Last 2 Years 32.352 9.60 16.88 16.99 12,018 13,672 13,698Dec 31, 10 Last 3 Years 43.693 -3.81 -0.04 1.06 8,898 9,987 10,323Sep 17, 04 Since Inception 10.000 15.73 14.40 15.47 38,879 34,916 38,069
Period Scheme Benchmark Additional ^ # Benchmark
##
B. Discrete 12 month returns (%)
Dec 31, 12 to Dec 31, 13 -2.26 4.38 8.98
Dec 30, 11 to Dec 31, 12 22.82 30.79 25.54
Dec 31, 10 to Dec 30, 11 -25.96 -26.95 -24.64
HDFC CORE & SATELLITE FUND - GROWTH OPTION NAV as at December 31, 2013 ` 38.879
SCHEME PERFORMANCE SUMMARY (FUND MANAGER-WISE)
Date Period NAV Scheme Benchmark Additional Value of investment of ` 10,000@ per Unit Returns Returns Benchmark Scheme Benchmark Additional
(`) (%)^ (%)# Returns (`) #(`) Benchmark(%)## (`) ##
^̂PPaasstt ppeerrffoorrmmaannccee mmaayy oorr mmaayy nnoott bbee ssuussttaaiinneedd iinn tthhee ffuuttuurree.. Returns greater than 1 year period are compounded annualized (CAGR). # CRISIL MIP Blended Index ## CRISIL 10 year Gilt IndexScheme performance may not strictly be comparable with that of its Additional Benchmark in view of hybrid nature of the scheme where a portion of scheme's investments are made in equity instruments.
A. Cumulative performance
Dec 31, 12 Last 1 Year 26.3553 3.57 4.41 -0.68 10,357 10,441 9,932Dec 30, 11 Last 2 Years 23.4380 7.89 8.17 4.83 11,646 11,707 10,992Dec 31, 10 Last 3 Years 22.9839 5.89 5.99 3.85 11,876 11,908 11,202Dec 26, 03 Since Inception 10.0000 10.54 6.89 4.01 27,296 19,495 14,835
Period Scheme Benchmark Additional ^ # Benchmark
##
B. Discrete 12 month returns (%)
Dec 31, 12 to Dec 31, 13 3.57 4.41 -0.68
Dec 30, 11 to Dec 31, 12 12.37 12.05 10.61
Dec 31, 10 to Dec 30, 11 1.98 1.72 1.91
HDFC MF MIP LONG TERM PLAN - GROWTH OPTION NAV as at December 31, 2013 ` 27.2962
PRASHANT JAIN...CONTINUED
Performance of dividend option under the schemes for the investors would be net of distribution tax as applicable. Load is not taken into consideration for computation of performance. N.A.: Not Available@ shows the current value of ` 10,000/- invested at the beginning of a given periodWhere either NAV or Benchmark Index value is not available for the start/end date of a concerned period, the previous date where both NAV and Benchmark Index value are available, is considered for returns computation except for since inception returns
Intouchmutually January 2014 37

Date Period NAV Scheme Benchmark Additional Value of investment of ` 10,000@ per Unit Returns Returns Benchmark Scheme Benchmark Additional
(`) (%)^$$ (%)# Returns (`) $$ (`)# Benchmark(%)## (`) ##
^̂PPaasstt ppeerrffoorrmmaannccee mmaayy oorr mmaayy nnoott bbee ssuussttaaiinneedd iinn tthhee ffuuttuurree.. Returns greater than 1 year period are compounded annualized (CAGR). # CNX 500 Index ## CNX Nifty Index$$ All dividends declared prior to the splitting of the Scheme into Dividend & Growth Options are assumed to be reinvested in the units of the Scheme at the then prevailing NAV (ex-dividend NAV).
A. Cumulative performance
Dec 31, 12 Last 1 Year 243.978 5.09 3.61 6.76 10,509 10,361 10,676Dec 30, 11 Last 2 Years 192.725 15.30 16.83 16.71 13,304 13,661 13,632Dec 31, 10 Last 3 Years 249.066 0.97 -0.18 0.91 10,294 9,947 10,276Mar 31, 96 Since Inception 10.000 26.45 11.59 N.A. 646,790 70,199 N.A.
Period Scheme Benchmark Additional ^$$ # Benchmark
##
B. Discrete 12 month returns (%)
Dec 31, 12 to Dec 31, 13 5.09 3.61 6.76
Dec 30, 11 to Dec 31, 12 26.43 31.65 27.53
Dec 31, 10 to Dec 30, 11 -22.62 -27.19 -24.62
HDFC TAXSAVER - GROWTH OPTION NAV as at December 31, 2013 ` 256.398
Date Period NAV Scheme Benchmark Additional Value of investment of ` 10,000@ per Unit Returns Returns Benchmark Scheme Benchmark Additional
(`) (%)^ (%)# Returns (`) (`)# Benchmark(%)## (`) ##
^̂PPaasstt ppeerrffoorrmmaannccee mmaayy oorr mmaayy nnoott bbee ssuussttaaiinneedd iinn tthhee ffuuttuurree.. Returns greater than 1 year period are compounded annualized (CAGR). # CRISIL MIP Blended Index ## CRISIL 10 year Gilt IndexScheme performance may not strictly be comparable with that of its Additional Benchmark in view of hybrid nature of the scheme where a portion of scheme's investments are made in equity instruments. The Scheme is co-mmanaged by Vinay Kulkarni (Equities) and Shobhit Mehrotra (Debt).
A. Cumulative performance
Dec 31, 12 Last 1 Year 19.5192 5.61 4.41 -00.68 10,561 10,441 9,932Dec 30, 11 Last 2 Years 17.3645 8.93 8.17 4.83 11,871 11,707 10,992Dec 31, 10 Last 3 Years 17.0703 6.48 5.99 3.85 12,076 11,908 11,202Dec 26, 03 Since Inception 10.0000 7.49 6.89 4.01 20,614 19,495 14,835
Period Scheme Benchmark Additional ^ # Benchmark
##
B. Discrete 12 month returns (%)
Dec 31, 12 to Dec 31, 13 5.61 4.41 -0.68
Dec 30, 11 to Dec 31, 12 12.34 12.05 10.61
Dec 31, 10 to Dec 30, 11 1.72 1.72 1.91
HDFC MF MIP SHORT TERM PLAN - GROWTH OPTION NAV as at December 31, 2013 ` 20.6142
SCHEME PERFORMANCE SUMMARY (FUND MANAGER-WISE)
Performance of dividend option under the schemes for the investors would be net of distribution tax as applicable. Load is not taken into consideration for computation of performance. N.A.: Not Available@ shows the current value of ` 10,000/- invested at the beginning of a given periodWhere either NAV or Benchmark Index value is not available for the start/end date of a concerned period, the previous date where both NAV and Benchmark Index value are available, is considered for returns computation except for since inception returns
VINAY KULKARNI...CONTINUED
Date Period NAV Scheme Benchmark Additional Value of investment of ` 10,000@ per Unit Returns Returns Benchmark Scheme Benchmark Additional
(`) (%)^ (%)# Returns (`) (`)# Benchmark(%)## (`) ##
^̂PPaasstt ppeerrffoorrmmaannccee mmaayy oorr mmaayy nnoott bbee ssuussttaaiinneedd iinn tthhee ffuuttuurree.. Returns greater than 1 year period are compounded annualized (CAGR). # CNX Nifty Index (Total Returns Index) ## S&P BSE SENSEXSince inception returns are calculated on ` 10.3260 ( allotment price)
A. Cumulative performance
Dec 31, 12 Last 1 Year 50.9836 7.44 8.07 8.98 10,744 10,807 10,898Dec 30, 11 Last 2 Years 39.9581 17.03 18.22 16.99 13,709 13,988 13,698Dec 31, 10 Last 3 Years 53.1624 1.00 2.14 1.06 10,304 10,658 10,323Jul 17, 02 Since Inception 10.3260 15.67 18.85 17.86 53,049 72,455 65,828
Period Scheme Benchmark Additional ^ # Benchmark
##
B. Discrete 12 month returns (%)
Dec 31, 12 to Dec 31, 13 7.44 8.07 8.98
Dec 30, 11 to Dec 31, 12 27.42 29.25 25.54
Dec 31, 10 to Dec 30, 11 -24.84 -23.81 -24.64
HDFC INDEX FUND - NIFTY PLAN - GROWTH OPTION NAV as at December 31, 2013 ` 54.7785
Date Period NAV Scheme Benchmark Additional Value of investment of ` 10,000@ per Unit Returns Returns Benchmark Scheme Benchmark Additional
(`) (%)^ (%)# Returns (`) (`)# Benchmark(%)## (`) ##
^̂PPaasstt ppeerrffoorrmmaannccee mmaayy oorr mmaayy nnoott bbee ssuussttaaiinneedd iinn tthhee ffuuttuurree.. Returns greater than 1 year period are compounded annualized (CAGR). # S&P BSE SENSEX (Total Returns Index) ## CNX Nifty IndexSince inception returns are calculated on ` 32.1610 ( allotment price)
A. Cumulative performance
Dec 31, 12 Last 1 Year 249.5258 6.04 10.70 6.76 10,604 11,070 10,676Dec 30, 11 Last 2 Years 194.1368 16.70 18.98 16.71 13,630 14,169 13,632Dec 31, 10 Last 3 Years 244.5856 2.65 1.29 0.91 10,818 10,394 10,276Jul 17, 02 Since Inception 32.1610 20.18 19.90 17.09 82,275 80,103 61,053
Period Scheme Benchmark Additional ^ # Benchmark
##
B. Discrete 12 month returns (%)
Dec 31, 12 to Dec 31, 13 6.04 10.70 6.76
Dec 30, 11 to Dec 31, 12 28.36 27.82 27.53
Dec 31, 10 to Dec 30, 11 -20.63 -26.64 -24.62
HDFC INDEX FUND - SENSEX PLUS PLAN - GROWTH OPTION NAV as at December 31, 2013 ` 264.6035
Intouchmutually38 January 2014

SCHEME PERFORMANCE SUMMARY (FUND MANAGER-WISE)
Performance of dividend option under the schemes for the investors would be net of distribution tax as applicable. Load is not taken into consideration for computation of performance. N.A.: Not Available@ shows the current value of ` 10,000/- invested at the beginning of a given periodWhere either NAV or Benchmark Index value is not available for the start/end date of a concerned period, the previous date where both NAV and Benchmark Index value are available, is considered for returns computation except for since inception returns
Date Period NAV Scheme Benchmark Additional Value of investment of ` 10,000@ per Unit Returns Returns Benchmark Scheme Benchmark Additional
(`) (%)^ (%)# Returns (`) (`)# Benchmark(%)## (`) ##
^̂PPaasstt ppeerrffoorrmmaannccee mmaayy oorr mmaayy nnoott bbee ssuussttaaiinneedd iinn tthhee ffuuttuurree.. Returns greater than 1 year period are compounded annualized (CAGR). # CNX Midcap Index ## CNX Nifty Index
A. Cumulative performance
Dec 31, 12 Last 1 Year 18.637 9.64 -5.10 6.76 10,964 9,490 10,676Dec 30, 11 Last 2 Years 13.348 23.66 14.87 16.71 15,309 13,206 13,632Dec 31, 10 Last 3 Years 16.339 7.73 -3.05 0.91 12,506 9,113 10,276Jun 25, 07 Since Inception 10.000 11.58 5.12 6.19 20,434 13,851 14,800
Period Scheme Benchmark Additional ^ # Benchmark
##
B. Discrete 12 month returns (%)
Dec 31, 12 to Dec 31, 13 9.64 -5.10 6.76
Dec 30, 11 to Dec 31, 12 39.37 38.91 27.53
Dec 31, 10 to Dec 30, 11 -18.31 -31.00 -24.62
HDFC MID-CCAP OPPORTUNITIES FUND - GROWTH OPTION NAV as at December 31, 2013 ` 20.434
CHIRAG SETALVAD
Date Period NAV Scheme Benchmark Additional Value of investment of ` 10,000@ per Unit Returns Returns Benchmark Scheme Benchmark Additional
(`) (%)^ (%)# Returns (`) (`)# Benchmark(%)## (`) ##
^̂PPaasstt ppeerrffoorrmmaannccee mmaayy oorr mmaayy nnoott bbee ssuussttaaiinneedd iinn tthhee ffuuttuurree. Returns greater than 1 year period are compounded annualized (CAGR). # CNX 500 Index ## CNX Nifty IndexThe Scheme is co-mmanaged by Chirag Setalvad & Miten Lathia
A. Cumulative performance
Dec 31, 12 Last 1 Year 116.776 10.37 3.61 6.76 11,037 10,361 10,676Dec 30, 11 Last 2 Years 90.936 18.99 16.83 16.71 14,173 13,661 13,632Dec 31, 10 Last 3 Years 119.089 2.67 -0.18 0.91 10,822 9,947 10,276Feb 01, 94 Since Inception 10.000 13.69 7.99 8.55 128,883 46,244 51,255
Period Scheme Benchmark Additional ^ # Benchmark
##
B. Discrete 12 month returns (%)
Dec 31, 12 to Dec 31, 13 10.37 3.61 6.76
Dec 30, 11 to Dec 31, 12 28.24 31.65 27.53
Dec 31, 10 to Dec 30, 11 -23.64 -27.19 -24.62
HDFC CAPITAL BUILDER FUND - GROWTH OPTION NAV as at December 31, 2013 128.883
Date Period NAV Scheme Benchmark Additional Value of investment of ` 10,000@ per Unit Returns Returns Benchmark Scheme Benchmark Additional
(`) (%)^ (%)# Returns (`) (`)# Benchmark(%)## (`) ##
^̂PPaasstt ppeerrffoorrmmaannccee mmaayy oorr mmaayy nnoott bbee ssuussttaaiinneedd iinn tthhee ffuuttuurree.. Returns greater than 1 year period are compounded annualized (CAGR). # CRISIL MIP Blended Index ## CRISIL 1 year T-Bill IndexScheme performance may not strictly be comparable with that of its Additional Benchmark in view of hybrid nature of the scheme where a portion of scheme's investments are made in equity instruments. The Scheme is co-mmanaged by Vinay Kulkarni (Equities) and Anil Bamboli (Debt).
A. Cumulative performance
Dec 31, 12 Last 1 Year 20.9932 6.76 4.41 5.86 10,676 10,441 10,586Dec 30, 11 Last 2 Years 18.6795 9.51 8.17 6.96 11,999 11,707 11,445Dec 31, 10 Last 3 Years 17.6826 8.21 5.99 6.79 12,675 11,908 12,180Sep 17, 04 Since Inception 10.0000 9.07 7.52 5.51 22,413 19,618 16,455
Period Scheme Benchmark Additional ^ # Benchmark
##
B. Discrete 12 month returns (%)
Dec 31, 12 to Dec 31, 13 6.76 4.41 5.86
Dec 30, 11 to Dec 31, 12 12.31 12.05 8.06
Dec 31, 10 to Dec 30, 11 5.64 1.72 6.42
HDFC MULTIPLE YIELD FUND - GROWTH OPTION NAV as at December 31, 2013 ` 22.4127
MITEN LATHIA
Date Period NAV Scheme Benchmark Additional Value of investment of ` 10,000@ per Unit Returns Returns Benchmark Scheme Benchmark Additional
(`) (%)^ (%)# Returns (`) (`)# Benchmark(%)## (`) ##
^̂PPaasstt ppeerrffoorrmmaannccee mmaayy oorr mmaayy nnoott bbee ssuussttaaiinneedd iinn tthhee ffuuttuurree. Returns greater than 1 year period are compounded annualized (CAGR). # CNX 500 Index ## CNX Nifty IndexThe Scheme is co-mmanaged by Chirag Setalvad & Miten Lathia
A. Cumulative performance
Dec 31, 12 Last 1 Year 116.776 10.37 3.61 6.76 11,037 10,361 10,676Dec 30, 11 Last 2 Years 90.936 18.99 16.83 16.71 14,173 13,661 13,632Dec 31, 10 Last 3 Years 119.089 2.67 -0.18 0.91 10,822 9,947 10,276Feb 01, 94 Since Inception 10.000 13.69 7.99 8.55 128,883 46,244 51,255
Period Scheme Benchmark Additional ^ # Benchmark
##
B. Discrete 12 month returns (%)
Dec 31, 12 to Dec 31, 13 10.37 3.61 6.76
Dec 30, 11 to Dec 31, 12 28.24 31.65 27.53
Dec 31, 10 to Dec 30, 11 -23.64 -27.19 -24.62
HDFC CAPITAL BUILDER FUND - GROWTH OPTION NAV as at December 31, 2013 ` 128.883
VINAY KULKARNI...CONTINUED
Intouchmutually January 2014 39

SCHEME PERFORMANCE SUMMARY (FUND MANAGER-WISE)
CHIRAG SETALVAD...CONTINUED
Performance of dividend option under the schemes for the investors would be net of distribution tax as applicable. Load is not taken into consideration for computation of performance.@ shows the current value of ` 10,000/- invested at the beginning of a given periodWhere either NAV or Benchmark Index value is not available for the start/end date of a concerned period, the previous date where both NAV and Benchmark Index value are available, is considered for returns computation except for since inception returns
Date Period NAV Scheme Benchmark Additional Value of investment of ` 10,000@ per Unit Returns Returns Benchmark Scheme Benchmark Additional
(`) (%)^ (%)# Returns (`) (`)# Benchmark(%)## (`) ##
^̂PPaasstt ppeerrffoorrmmaannccee mmaayy oorr mmaayy nnoott bbee ssuussttaaiinneedd iinn tthhee ffuuttuurree.. Returns greater than 1 year period are compounded annualized (CAGR). #S&P BSE SENSEX ## CNX Nifty Index
A. Cumulative performance
Dec 31, 12 Last 1 Year 146.794 10.96 8.98 6.76 11,096 10,898 10,676Dec 30, 11 Last 2 Years 113.944 19.50 16.99 16.71 14,295 13,698 13,632Dec 31, 10 Last 3 Years 148.900 3.03 1.06 0.91 10,939 10,323 10,276Jan 02, 01 Since Inception 10.000 23.94 13.63 13.10 162,886 52,678 49,568
Period Scheme Benchmark Additional ^ # Benchmark
##
B. Discrete 12 month returns (%)
Dec 31, 12 to Dec 31, 13 10.96 8.98 6.76
Dec 30, 11 to Dec 31, 12 28.65 25.54 27.53
Dec 31, 10 to Dec 30, 11 -23.48 -24.64 -24.62
HDFC LONG TERM ADVANTAGE FUND - GROWTH OPTION NAV as at December 31, 2013 ` 162.886
Date Period NAV Scheme Benchmark Additional Value of investment of ` 10,000@ per Unit Returns Returns Benchmark Scheme Benchmark Additional
(`) (%)^ (%)# Returns (`) (`)# Benchmark(%)## (`) ##
^̂PPaasstt ppeerrffoorrmmaannccee mmaayy oorr mmaayy nnoott bbee ssuussttaaiinneedd iinn tthhee ffuuttuurree.. Returns greater than 1 year period are compounded annualized (CAGR). # CRISIL Balanced Fund Index ## CNX Nifty IndexScheme performance may not strictly be comparable with that of its Additional Benchmark in view of balanced nature of the scheme where a portion of scheme's investments are made in debt instruments
A. Cumulative performance
Dec 31, 12 Last 1 Year 63.913 8.78 6.05 6.76 10,878 10,605 10,676Dec 30, 11 Last 2 Years 50.499 17.28 13.37 16.71 13,767 12,861 13,632Dec 31, 10 Last 3 Years 56.469 7.17 3.26 0.91 12,312 11,010 10,276Sep 11, 00 Since Inception 10.000 15.68 N.A. 11.64 69,523 N.A. 43,286
Period Scheme Benchmark Additional ^ # Benchmark
##
B. Discrete 12 month returns (%)
Dec 31, 12 to Dec 31, 13 8.78 6.05 6.76
Dec 30, 11 to Dec 31, 12 26.40 21.15 27.53
Dec 31, 10 to Dec 30, 11 -10.57 -14.39 -24.62
HDFC BALANCED FUND - GROWTH OPTION NAV as at December 31, 2013 ` 69.523
Date Period NAV Scheme Benchmark Additional Value of investment of ` 10,000@ per Unit Returns Returns Benchmark Scheme Benchmark Additional
(`) (%)^$ (%)# Returns (`) $ (`)# Benchmark(%)## (`) ##
^̂PPaasstt ppeerrffoorrmmaannccee mmaayy oorr mmaayy nnoott bbee ssuussttaaiinneedd iinn tthhee ffuuttuurree.. Returns greater than 1 year period are compounded annualized (CAGR). # CRISIL Balanced Fund Index ## CNX Nifty Index$ Adjusted for bonus units declared under the schemeScheme performance may not strictly be comparable with that of its Additional Benchmark in view of balanced nature of the scheme where a portion of scheme's investments are made in debt instruments
A. Cumulative performance
Dec 31, 12 Last 1 Year 50.575 12.96 6.05 6.76 11,296 10,605 10,676Dec 30, 11 Last 2 Years 39.722 19.87 13.37 16.71 14,383 12,861 13,632Dec 31, 10 Last 3 Years 42.940 9.98 3.26 0.91 13,305 11,010 10,276Mar 02, 01 Since Inception 10.000 16.90 N.A. 13.04 74,272 N.A. 48,257
Period Scheme Benchmark Additional ^$ # Benchmark
##
B. Discrete 12 month returns (%)
Dec 31, 12 to Dec 31, 13 12.96 6.05 6.76
Dec 30, 11 to Dec 31, 12 27.15 21.15 27.53
Dec 31, 10 to Dec 30, 11 -7.49 -14.39 -24.62
HDFC CHILDREN’S GIFT FUND - INVESTMENT PLAN NAV as at December 31, 2013 ` 57.132
Date Period NAV Scheme Benchmark Additional Value of investment of ` 10,000@ per Unit Returns Returns Benchmark Scheme Benchmark Additional
(`) (%)^$ (%)# Returns (`) $ (`)# Benchmark(%)## (`) ##
^̂PPaasstt ppeerrffoorrmmaannccee mmaayy oorr mmaayy nnoott bbee ssuussttaaiinneedd iinn tthhee ffuuttuurree.. Returns greater than 1 year period are compounded annualized (CAGR). # CRISIL MIP Blended Index ## CRISIL 10 year Gilt Index$ Adjusted for bonus units declared under the schemeScheme performance may not strictly be comparable with that of its Additional Benchmark in view of hybrid nature of the scheme where a portion of scheme's investments are made in equity instruments.
A. Cumulative performance
Dec 31, 12 Last 1 Year 26.3913 5.53 4.41 -0.68 10,553 10,441 9,932Dec 30, 11 Last 2 Years 23.4380 8.98 8.17 4.83 11,883 11,707 10,992Dec 31, 10 Last 3 Years 22.3260 7.64 5.99 3.85 12,475 11,908 11,202Mar 02, 01 Since Inception 10.0000 10.54 N.A. N.A. 36,206 N.A. N.A.
Period Scheme Benchmark Additional ^$ # Benchmark
##
B. Discrete 12 month returns (%)
Dec 31, 12 to Dec 31, 13 5.53 4.41 -0.68
Dec 30, 11 to Dec 31, 12 12.53 12.05 10.61
Dec 31, 10 to Dec 30, 11 4.98 1.72 1.91
HDFC CHILDREN’S GIFT FUND - SAVINGS PLAN NAV as at December 31, 2013 ` 27.8509
Intouchmutually40 January 2014

SCHEME PERFORMANCE SUMMARY (FUND MANAGER-WISE)
Performance of dividend option under the schemes for the investors would be net of distribution tax as applicable. Load is not taken into consideration for computation of performance.@ shows the current value of ` 10,000/- invested at the beginning of a given periodWhere either NAV or Benchmark Index value is not available for the start/end date of a concerned period, the previous date where both NAV and Benchmark Index value are available, is considered for returns computation except for since inception returns
Date Period NAV Scheme Benchmark Additional Value of investment of ` 10,000@ per Unit Returns Returns Benchmark Scheme Benchmark Additional
(`) (%)^ (%)# Returns (`) (`)# Benchmark(%)## (`) ##
^̂PPaasstt ppeerrffoorrmmaannccee mmaayy oorr mmaayy nnoott bbee ssuussttaaiinneedd iinn tthhee ffuuttuurree.. Returns greater than 1 year period are compounded annualized (CAGR). # CRISIL MIP Blended Index ## CRISIL 1 year T-Bill IndexScheme performance may not strictly be comparable with that of its Additional Benchmark in view of hybrid nature of the scheme where a portion of scheme's investments are made in equity instruments. The Scheme is co-mmanaged by Chirag Setalvad (Equities) and Anil Bamboli (Debt).
A. Cumulative performance
Dec 31, 12 Last 1 Year 19.1032 6.65 4.41 5.86 10,665 10,441 10,586Dec 30, 11 Last 2 Years 17.0809 9.19 8.17 6.96 11,928 11,707 11,445Dec 31, 10 Last 3 Years 16.0976 8.16 5.99 6.79 12,657 11,908 12,180Aug 17, 05 Since Inception 10.0000 8.87 7.30 5.57 20,374 18,051 15,752
Period Scheme Benchmark Additional ^ # Benchmark
##
B. Discrete 12 month returns (%)
Dec 31, 12 to Dec 31, 13 6.65 4.41 5.86
Dec 30, 11 to Dec 31, 12 11.77 12.05 8.06
Dec 31, 10 to Dec 30, 11 6.11 1.72 6.42
HDFC MULTIPLE YIELD FUND - PLAN 2005 - GROWTH OPTION NAV as at December 31, 2013 ` 20.3744
Date Period NAV Scheme Benchmark Additional Value of investment of ` 10,000@ per Unit Returns Returns Benchmark Scheme Benchmark Additional
(`) (%)^ (%)# Returns (`) (`)# Benchmark(%)## (`) ##
^̂PPaasstt ppeerrffoorrmmaannccee mmaayy oorr mmaayy nnoott bbee ssuussttaaiinneedd iinn tthhee ffuuttuurree.. Returns greater than 1 year period are compounded annualized (CAGR). # CNX Nifty Index ## S&P BSE SENSEX
A. Cumulative performance
Dec 31, 12 Last 1 Year 16.928 0.77 6.76 8.98 10,077 10,676 10,898Dec 30, 11 Last 2 Years 13.314 13.15 16.71 16.99 12,812 13,632 13,698Dec 31, 10 Last 3 Years 17.254 -0.38 0.91 1.06 9,886 10,276 10,323Feb 10, 06 Since Inception 10.000 7.00 9.74 9.81 17,058 20,822 20,938
Period Scheme Benchmark Additional ^ # Benchmark
##
B. Discrete 12 month returns (%)
Dec 31, 12 to Dec 31, 13 0.77 6.76 8.98
Dec 30, 11 to Dec 31, 12 26.98 27.53 25.54
Dec 31, 10 to Dec 30, 11 -22.84 -24.62 -24.64
HDFC FOCUSED LARGE-CCAP FUND - GROWTH OPTION NAV as at December 31, 2013 ` 17.058
Date Period NAV Scheme Benchmark Additional Value of investment of ` 10,000@ per Unit Returns Returns Benchmark Scheme Benchmark Additional
(`) (%)^ (%)# Returns (`) (`) # Benchmark(%)## (`) ##
^̂PPaasstt ppeerrffoorrmmaannccee mmaayy oorr mmaayy nnoott bbee ssuussttaaiinneedd iinn tthhee ffuuttuurree.. Returns greater than 1 year period are compounded annualized (CAGR). # CNX 500 Index ## CNX Nifty IndexThe Scheme is co-mmanaged by Prashant Jain and Srinivas Rao Ravuri.
A. Cumulative performance
Dec 31, 12 Last 1 Year 11.004 -14.43 3.61 6.76 8,557 10,361 10,676Dec 30, 11 Last 2 Years 8.126 7.62 16.83 16.71 11,588 13,661 13,632Dec 31, 10 Last 3 Years 12.731 -9.56 -0.18 0.91 7,396 9,947 10,276Mar 10, 08 Since Inception 10.000 -1.03 3.93 4.80 9,416 12,513 13,132
Period Scheme Benchmark Additional ^ # Benchmark
##
B. Discrete 12 month returns (%)
Dec 31, 12 to Dec 31, 13 -14.43 3.61 6.76
Dec 30, 11 to Dec 31, 12 35.19 31.65 27.53
Dec 31, 10 to Dec 30, 11 -36.17 -27.19 -24.62
HDFC INFRASTRUCTURE FUND - GROWTH OPTION NAV as at December 31, 2013 ` 9.416
SRINIVAS RAO RAVURI
Date Period NAV Scheme Benchmark Additional Value of investment of ` 10,000@ per Unit Returns Returns Benchmark Scheme Benchmark Additional
(`) (%)^ (%)# Returns (`) (`)# Benchmark(%)## (`) ##
^̂PPaasstt ppeerrffoorrmmaannccee mmaayy oorr mmaayy nnoott bbee ssuussttaaiinneedd iinn tthhee ffuuttuurree.. Returns greater than 1 year period are compounded annualized (CAGR). # S&P BSE SENSEX ## CNX Nifty Index
A. Cumulative performance
Dec 31, 12 Last 1 Year 93.853 -1.40 8.98 6.76 9,860 10,898 10,676Dec 30, 11 Last 2 Years 73.422 12.23 16.99 16.71 12,604 13,698 13,632Dec 31, 10 Last 3 Years 93.228 -0.25 1.06 0.91 9,926 10,323 10,276Sep 11, 00 Since Inception 10.000 18.19 11.98 11.64 92,540 45,077 43,286
Period Scheme Benchmark Additional ^ # Benchmark
##
B. Discrete 12 month returns (%)
Dec 31, 12 to Dec 31, 13 -1.40 8.98 6.76
Dec 30, 11 to Dec 31, 12 27.66 25.54 27.53
Dec 31, 10 to Dec 30, 11 -21.24 -24.64 -24.62
HDFC GROWTH FUND - GROWTH OPTION NAV as at December 31, 2013 ` 92.540
CHIRAG SETALVAD...CONTINUED
Intouchmutually January 2014 41
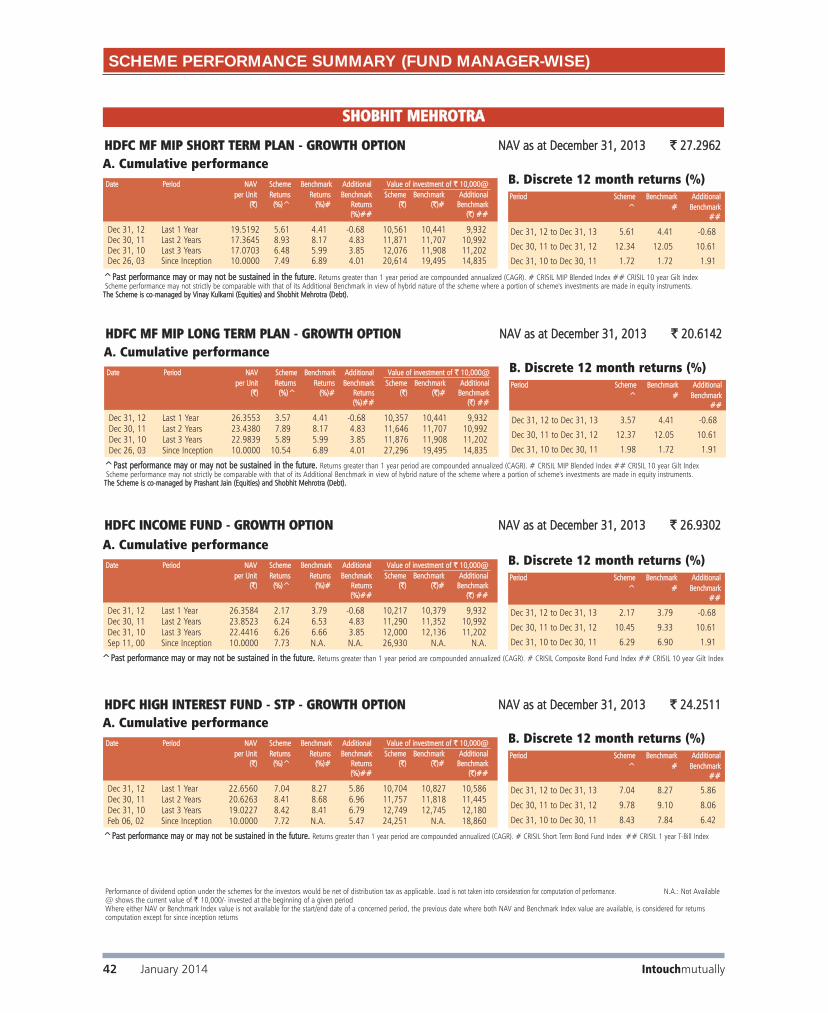
SHOBHIT MEHROTRA
Date Period NAV Scheme Benchmark Additional Value of investment of ` 10,000@ per Unit Returns Returns Benchmark Scheme Benchmark Additional
(`) (%)^ (%)# Returns (`) (`)# Benchmark(%)## (`) ##
^̂PPaasstt ppeerrffoorrmmaannccee mmaayy oorr mmaayy nnoott bbee ssuussttaaiinneedd iinn tthhee ffuuttuurree.. Returns greater than 1 year period are compounded annualized (CAGR). # CRISIL MIP Blended Index ## CRISIL 10 year Gilt IndexScheme performance may not strictly be comparable with that of its Additional Benchmark in view of hybrid nature of the scheme where a portion of scheme's investments are made in equity instruments.
The Scheme is co-mmanaged by Prashant Jain (Equities) and Shobhit Mehrotra (Debt).
A. Cumulative performance
Dec 31, 12 Last 1 Year 26.3553 3.57 4.41 -0.68 10,357 10,441 9,932Dec 30, 11 Last 2 Years 23.4380 7.89 8.17 4.83 11,646 11,707 10,992Dec 31, 10 Last 3 Years 22.9839 5.89 5.99 3.85 11,876 11,908 11,202Dec 26, 03 Since Inception 10.0000 10.54 6.89 4.01 27,296 19,495 14,835
Period Scheme Benchmark Additional ^ # Benchmark
##
B. Discrete 12 month returns (%)
Dec 31, 12 to Dec 31, 13 3.57 4.41 -0.68
Dec 30, 11 to Dec 31, 12 12.37 12.05 10.61
Dec 31, 10 to Dec 30, 11 1.98 1.72 1.91
HDFC MF MIP LONG TERM PLAN - GROWTH OPTION NAV as at December 31, 2013 ` 20.6142
Date Period NAV Scheme Benchmark Additional Value of investment of ` 10,000@ per Unit Returns Returns Benchmark Scheme Benchmark Additional
(`) (%)^ (%)# Returns (`) (`)# Benchmark(%)## (`) ##
^̂PPaasstt ppeerrffoorrmmaannccee mmaayy oorr mmaayy nnoott bbee ssuussttaaiinneedd iinn tthhee ffuuttuurree.. Returns greater than 1 year period are compounded annualized (CAGR). # CRISIL MIP Blended Index ## CRISIL 10 year Gilt IndexScheme performance may not strictly be comparable with that of its Additional Benchmark in view of hybrid nature of the scheme where a portion of scheme's investments are made in equity instruments.
The Scheme is co-mmanaged by Vinay Kulkarni (Equities) and Shobhit Mehrotra (Debt).
A. Cumulative performance
Dec 31, 12 Last 1 Year 19.5192 5.61 4.41 -0.68 10,561 10,441 9,932Dec 30, 11 Last 2 Years 17.3645 8.93 8.17 4.83 11,871 11,707 10,992Dec 31, 10 Last 3 Years 17.0703 6.48 5.99 3.85 12,076 11,908 11,202Dec 26, 03 Since Inception 10.0000 7.49 6.89 4.01 20,614 19,495 14,835
Period Scheme Benchmark Additional ^ # Benchmark
##
B. Discrete 12 month returns (%)
Dec 31, 12 to Dec 31, 13 5.61 4.41 -0.68
Dec 30, 11 to Dec 31, 12 12.34 12.05 10.61
Dec 31, 10 to Dec 30, 11 1.72 1.72 1.91
HDFC MF MIP SHORT TERM PLAN - GROWTH OPTION NAV as at December 31, 2013 ` 27.2962
Date Period NAV Scheme Benchmark Additional Value of investment of ` 10,000@ per Unit Returns Returns Benchmark Scheme Benchmark Additional
(`) (%)^ (%)# Returns (`) (`)# Benchmark(%)## (`) ##
^̂PPaasstt ppeerrffoorrmmaannccee mmaayy oorr mmaayy nnoott bbee ssuussttaaiinneedd iinn tthhee ffuuttuurree.. Returns greater than 1 year period are compounded annualized (CAGR). # CRISIL Composite Bond Fund Index ## CRISIL 10 year Gilt Index
A. Cumulative performance
Dec 31, 12 Last 1 Year 26.3584 2.17 3.79 -0.68 10,217 10,379 9,932Dec 30, 11 Last 2 Years 23.8523 6.24 6.53 4.83 11,290 11,352 10,992Dec 31, 10 Last 3 Years 22.4416 6.26 6.66 3.85 12,000 12,136 11,202Sep 11, 00 Since Inception 10.0000 7.73 N.A. N.A. 26,930 N.A. N.A.
Period Scheme Benchmark Additional ^ # Benchmark
##
B. Discrete 12 month returns (%)
Dec 31, 12 to Dec 31, 13 2.17 3.79 -0.68
Dec 30, 11 to Dec 31, 12 10.45 9.33 10.61
Dec 31, 10 to Dec 30, 11 6.29 6.90 1.91
HDFC INCOME FUND - GROWTH OPTION NAV as at December 31, 2013 ` 26.9302
Date Period NAV Scheme Benchmark Additional Value of investment of ` 10,000@ per Unit Returns Returns Benchmark Scheme Benchmark Additional
(`) (%)^ (%)# Returns (`) (`)# Benchmark(%)## (`)##
^Past performance may or may not be sustained in the future. Returns greater than 1 year period are compounded annualized (CAGR). # CRISIL Short Term Bond Fund Index ## CRISIL 1 year T-Bill Index
A. Cumulative performance
Dec 31, 12 Last 1 Year 22.6560 7.04 8.27 5.86 10,704 10,827 10,586Dec 30, 11 Last 2 Years 20.6263 8.41 8.68 6.96 11,757 11,818 11,445Dec 31, 10 Last 3 Years 19.0227 8.42 8.41 6.79 12,749 12,745 12,180Feb 06, 02 Since Inception 10.0000 7.72 N.A. 5.47 24,251 N.A. 18,860
Period Scheme Benchmark Additional ^ # Benchmark
##
B. Discrete 12 month returns (%)
Dec 31, 12 to Dec 31, 13 7.04 8.27 5.86
Dec 30, 11 to Dec 31, 12 9.78 9.10 8.06
Dec 31, 10 to Dec 30, 11 8.43 7.84 6.42
HDFC HIGH INTEREST FUND - STP - GROWTH OPTION NAV as at December 31, 2013 ` 24.2511
Performance of dividend option under the schemes for the investors would be net of distribution tax as applicable. Load is not taken into consideration for computation of performance. N.A.: Not Available@ shows the current value of ` 10,000/- invested at the beginning of a given periodWhere either NAV or Benchmark Index value is not available for the start/end date of a concerned period, the previous date where both NAV and Benchmark Index value are available, is considered for returns computation except for since inception returns
SCHEME PERFORMANCE SUMMARY (FUND MANAGER-WISE)
Intouchmutually42 January 2014

Performance of dividend option under the schemes for the investors would be net of distribution tax as applicable. Load is not taken into consideration for computation of performance. N.A.: Not Available@ shows the current value of ` 10,000/- invested at the beginning of a given periodWhere either NAV or Benchmark Index value is not available for the start/end date of a concerned period, the previous date where both NAV and Benchmark Index value are available, is considered for returns computation except for since inception returns
SHOBHIT MEHROTRA...CONTINUED
Date Period NAV Scheme Benchmark Additional Value of investment of ` 10,000@ per Unit Returns Returns Benchmark Scheme Benchmark Additional
(`) (%)^ (%)# Returns (`) (`)# Benchmark(%)## (`)##
^̂PPaasstt ppeerrffoorrmmaannccee mmaayy oorr mmaayy nnoott bbee ssuussttaaiinneedd iinn tthhee ffuuttuurree.. Returns greater than 1 year period are compounded annualized (CAGR). # Crisil Liquid Fund Index ## CRISIL 1 year T-Bill IndexSince inception returns are calculated on ` 10.0104 ( allotment price)
A. Cumulative performance
Dec 31, 12 Last 1 Year 20.0603 8.76 9.03 5.86 10,876 10,903 10,586Dec 30, 11 Last 2 Years 18.0943 9.78 8.76 6.96 12,058 11,835 11,445Dec 31, 10 Last 3 Years 16.4499 9.86 8.57 6.79 13,263 12,799 12,180Jan 16, 03 Since Inception 10.0104 7.36 6.43 5.37 21,795 19,801 17,747
Period Scheme Benchmark Additional ^ # Benchmark
##
B. Discrete 12 month returns (%)
Dec 31, 12 to Dec 31, 13 8.76 9.03 5.86
Dec 30, 11 to Dec 31, 12 10.80 8.49 8.06
Dec 31, 10 to Dec 30, 11 10.00 8.15 6.42
HDFC FLOATING RATE INCOME FUND - LTP - GROWTH OPTION NAV as at December 31, 2013 ` 21.8172
Date Period NAV Scheme Benchmark Additional Value of investment of ` 10,000@ per Unit Returns Returns Benchmark Scheme Benchmark Additional
(`) (%)^ (%)# Returns (`) (`)# Benchmark(%)## (`)##
^̂PPaasstt ppeerrffoorrmmaannccee mmaayy oorr mmaayy nnoott bbee ssuussttaaiinneedd iinn tthhee ffuuttuurree.. Returns greater than 1 year period are compounded annualized (CAGR). # Crisil Liquid Fund Index ## CRISIL 1 year T-Bill IndexSince inception returns are calculated on ` 13.1821 ( allotment price)
A. Cumulative performance
Dec 31, 12 Last 1 Year 19.6237 9.08 9.03 5.86 10,908 10,903 10,586Dec 30, 11 Last 2 Years 17.8659 9.43 8.76 6.96 11,981 11,835 11,445Dec 31, 10 Last 3 Years 16.3939 9.29 8.57 6.79 13,056 12,799 12,180Oct 23, 07 Since Inception 13.1821 8.14 7.31 5.72 16,238 15,479 14,118
Period Scheme Benchmark Additional ^ # Benchmark
##
B. Discrete 12 month returns (%)
Dec 31, 12 to Dec 31, 13 9.08 9.03 5.86
Dec 30, 11 to Dec 31, 12 9.78 8.49 8.06
Dec 31, 10 to Dec 30, 11 8.98 8.15 6.42
HDFC FLOATING RATE INCOME FUND - STP - WHOLESALE OPTION - GROWTH OPTION NAV as at December 31, 2013 ` 21.4046
Date Period NAV Scheme Benchmark Additional Value of investment of ` 10,000@ per Unit Returns Returns Benchmark Scheme Benchmark Additional
(`) (%)^ (%)# Returns (`) (`)# Benchmark(%)## (`)##
^̂PPaasstt ppeerrffoorrmmaannccee mmaayy oorr mmaayy nnoott bbee ssuussttaaiinneedd iinn tthhee ffuuttuurree.. Returns greater than 1 year period are compounded annualized (CAGR). # CRISIL Composite Bond Fund Index. ## CRISIL 10 year Gilt Index
A. Cumulative performance
Dec 31, 12 Last 1 Year 12.4304 7.56 3.79 -0.68 10,756 10,379 9,932Dec 30, 11 Last 2 Years 11.2507 8.99 6.53 4.83 11,883 11,352 10,992Dec 31, 10 Last 3 Years 10.3523 8.89 6.66 3.85 12,915 12,136 11,202Jun 29, 10 Since Inception 10.0000 8.63 6.24 3.76 13,370 12,368 11,384
HDFC MEDIUM TERM OPPORTUNITIES FUND - GROWTH OPTION NAV as at December 31, 2013 ` 13.3696
Period Scheme Benchmark Additional ^ # Benchmark
##
B. Discrete 12 month returns (%)
Dec 31, 12 to Dec 31, 13 7.56 3.79 -0.68Dec 30, 11 to Dec 31, 12 10.43 9.33 10.61Dec 31, 10 to Dec 30, 11 8.68 6.90 1.91
SCHEME PERFORMANCE SUMMARY (FUND MANAGER-WISE)
Intouchmutually January 2014 43
Date Period NAV Scheme Benchmark Additional Value of investment of ` 10,000@ per Unit Returns Returns Benchmark Scheme Benchmark Additional
(`) (%)^ (%)# Returns (`) (`)# Benchmark(%)## (`)##
^̂PPaasstt ppeerrffoorrmmaannccee mmaayy oorr mmaayy nnoott bbee ssuussttaaiinneedd iinn tthhee ffuuttuurree.. Returns greater than 1 year period are compounded annualized (CAGR). # Crisil Liquid Fund Index ## CRISIL 1 year T-Bill Index
A. Cumulative performance
Dec 24, 13 Last 7 days 24.7088 0.17 0.12 0.17 10,017 10,012 10,017Dec 16, 13 Last 15 days 24.6607 0.37 0.33 0.35 10,037 10,033 10,035Nov 29, 13 Last 1 Month 24.5583 0.79 0.78 0.60 10,079 10,078 10,060Dec 31, 12 Last 1 Year 22.6510 9.28 9.03 5.86 10,928 10,903 10,586Dec 30, 11 Last 2 Years 20.6752 9.39 8.76 6.96 11,972 11,835 11,445Dec 31, 10 Last 3 Years 19.0032 9.20 8.57 6.79 13,025 12,799 12,180Oct 17, 00 Since Inception 10.0000 7.10 N.A. 6.01 24,752 N.A. 21,636
Period Scheme Benchmark Additional ^ # Benchmark
##
B. Discrete 12 month returns (%)
Dec 31, 12 to Dec 31, 13 9.28 9.03 5.86
Dec 30, 11 to Dec 31, 12 9.50 8.49 8.06
Dec 31, 10 to Dec 30, 11 8.80 8.15 6.42
HDFC LIQUID FUND - GROWTH OPTION NAV as at December 31, 2013 ` 24.7520

Performance of dividend option under the schemes for the investors would be net of distribution tax as applicable. Load is not taken into consideration for computation of performance.@ shows the current value of ` 10,000/- invested at the beginning of a given periodWhere either NAV or Benchmark Index value is not available for the start/end date of a concerned period, the previous date where both NAV and Benchmark Index value are available, is considered for returns computation except for since inception returns
SHOBHIT MEHROTRA...CONTINUED
Date Period NAV Scheme Benchmark Additional Value of investment of ` 10,000@ per Unit Returns Returns Benchmark Scheme Benchmark Additional
(`) (%)^ (%)# Returns (`) (`)# Benchmark(%)## (`)##
^̂PPaasstt ppeerrffoorrmmaannccee mmaayy oorr mmaayy nnoott bbee ssuussttaaiinneedd iinn tthhee ffuuttuurree.. Returns greater than 1 year period are compounded annualized (CAGR). # CRISIL Short Term Bond Fund Index. ## CRISIL 1 year T-Bill IndexPerformance of FMP schemes, being close-ended in nature, is not strictly comparable with that of open-ended schemes since the investment strategy for FMP schemes is primarily buy-and-hold whereas open-ended schemes are actively managed.
A. Cumulative performance
Dec 31, 12 Last 1 Year 11.1566 9.21 8.27 5.86 10,921 10,827 10,586Dec 30, 11 Last 2 Years 10.1108 9.75 8.68 6.96 12,051 11,818 11,445Dec 01, 11 Since Inception 10.0000 9.94 8.71 6.98 12,185 11,903 11,510
HDFC FMP 36M NOVEMBER 2011 (1) - GROWTH OPTION NAV as at December 31, 2013 ` 12.1845
Period Scheme Benchmark Additional ^ # Benchmark
##
B. Discrete 12 month returns (%)
Dec 31, 12 to Dec 31, 13 9.21 8.27 5.86Dec 30, 11 to Dec 31, 12 10.28 9.10 8.06
Date Period NAV Scheme Benchmark Additional Value of investment of ` 10,000@ per Unit Returns Returns Benchmark Scheme Benchmark Additional
(`) (%)^ (%)# Returns (`) (`)# Benchmark(%)## (`)##
^̂PPaasstt ppeerrffoorrmmaannccee mmaayy oorr mmaayy nnoott bbee ssuussttaaiinneedd iinn tthhee ffuuttuurree.. Returns greater than 1 year period are compounded annualized (CAGR). # CRISIL Short Term Bond Fund Index. ## CRISIL 1 year T-Bill IndexPerformance of FMP schemes, being close-ended in nature, is not strictly comparable with that of open-ended schemes since the investment strategy for FMP schemes is primarily buy-and-hold whereas open-ended schemes are actively managed.
A. Cumulative performance
Dec 31, 12 Last 1 Year 11.2600 9.26 8.27 5.86 10,926 10,827 10,586Dec 30, 11 Last 2 Years 10.1859 9.87 8.68 6.96 12,078 11,818 11,445Nov 11, 11 Since Inception 10.0000 10.17 8.73 7.17 12,303 11,961 11,597
HDFC FMP 36M OCTOBER 2011 (1) - GROWTH OPTION NAV as at December 31, 2013 ` 12.3025
Period Scheme Benchmark Additional ^ # Benchmark
##
B. Discrete 12 month returns (%)
Dec 31, 12 to Dec 31, 13 9.26 8.27 5.86Dec 30, 11 to Dec 31, 12 10.48 9.10 8.06
SCHEME PERFORMANCE SUMMARY (FUND MANAGER-WISE)
Intouchmutually44 January 2014
Date Period NAV Scheme Benchmark Additional Value of investment of ` 10,000@ per Unit Returns Returns Benchmark Scheme Benchmark Additional
(`) (%)^ (%)# Returns (`) (`)# Benchmark(%)## (`)##
^̂PPaasstt ppeerrffoorrmmaannccee mmaayy oorr mmaayy nnoott bbee ssuussttaaiinneedd iinn tthhee ffuuttuurree.. Returns greater than 1 year period are compounded annualized (CAGR). # CRISIL Short Term Bond Fund Index. ## CRISIL 1 year T-Bill IndexPerformance of FMP schemes, being close-ended in nature, is not strictly comparable with that of open-ended schemes since the investment strategy for FMP schemes is primarily buy-and-hold whereas open-ended schemes are actively managed.
A. Cumulative performance
Dec 31, 12 Last 1 Year 10.8677 9.30 8.27 5.86 10,930 10,827 10,586Feb 08, 12 Since Inception 10.0000 9.50 8.62 6.98 11,878 11,696 11,365
HDFC FMP 846D JANUARY 2012 (1) - GROWTH OPTION NAV as at December 31, 2013 ` 11.8782
Period Scheme Benchmark Additional ^ # Benchmark
##
B. Discrete 12 month returns (%)
Dec 31, 12 to Dec 31, 13 9.30 8.27 5.86
Date Period NAV Scheme Benchmark Additional Value of investment of ` 10,000@ per Unit Returns Returns Benchmark Scheme Benchmark Additional
(`) (%)^ (%)# Returns (`) (`)# Benchmark(%)## (`)##
^̂PPaasstt ppeerrffoorrmmaannccee mmaayy oorr mmaayy nnoott bbee ssuussttaaiinneedd iinn tthhee ffuuttuurree.. Returns greater than 1 year period are compounded annualized (CAGR). # CRISIL Composite Bond Fund Index. ## CRISIL 1 year T-Bill IndexPerformance of FMP schemes, being close-ended in nature, is not strictly comparable with that of open-ended schemes since the investment strategy for FMP schemes is primarily buy-and-hold whereas open-ended schemes are actively managed.
A. Cumulative performance
Dec 31, 12 Last 1 Year 10.8182 8.98 3.79 5.86 10,898 10,379 10,586Feb 15, 12 Since Inception 10.0000 9.17 6.12 6.92 11,789 11,179 11,338
HDFC FMP 1203D JANUARY 2012 (1) - GROWTH OPTION NAV as at December 31, 2013 ` 11.7894
Period Scheme Benchmark Additional ^ # Benchmark
##
B. Discrete 12 month returns (%)
Dec 31, 12 to Dec 31, 13 8.98 3.79 5.86
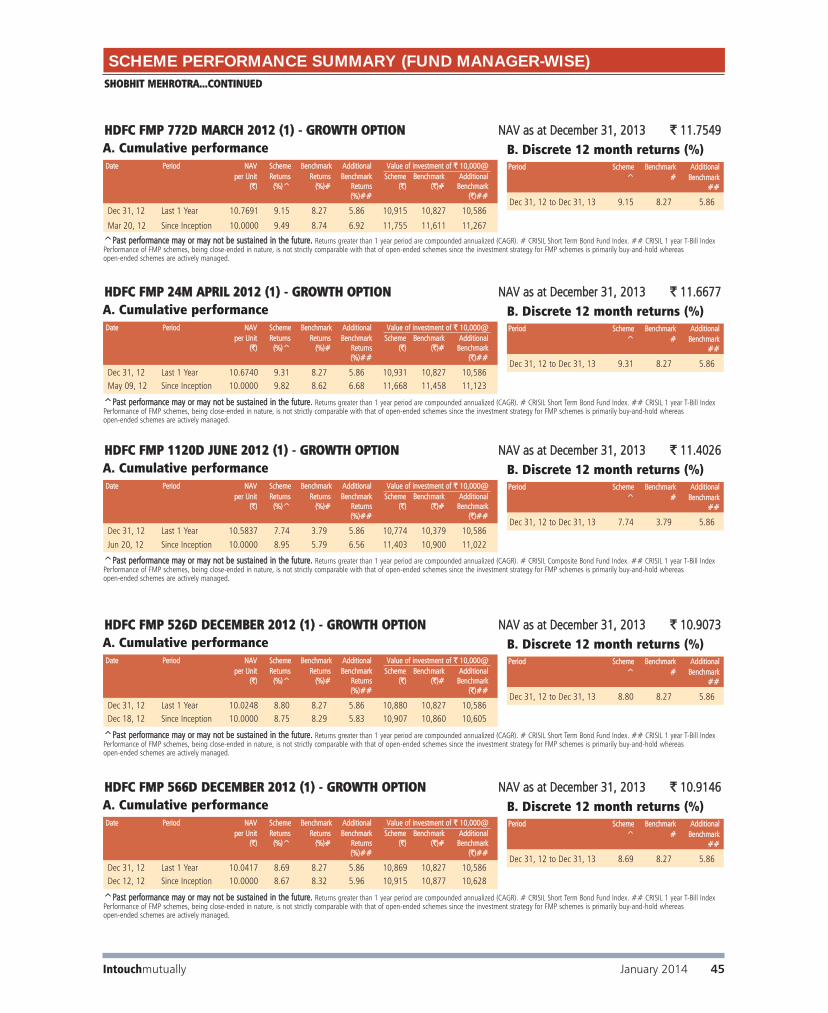
SHOBHIT MEHROTRA...CONTINUED
SCHEME PERFORMANCE SUMMARY (FUND MANAGER-WISE)
Intouchmutually January 2014 45
Date Period NAV Scheme Benchmark Additional Value of investment of ` 10,000@ per Unit Returns Returns Benchmark Scheme Benchmark Additional
(`) (%)^ (%)# Returns (`) (`)# Benchmark(%)## (`)##
^̂PPaasstt ppeerrffoorrmmaannccee mmaayy oorr mmaayy nnoott bbee ssuussttaaiinneedd iinn tthhee ffuuttuurree.. Returns greater than 1 year period are compounded annualized (CAGR). # CRISIL Short Term Bond Fund Index. ## CRISIL 1 year T-Bill IndexPerformance of FMP schemes, being close-ended in nature, is not strictly comparable with that of open-ended schemes since the investment strategy for FMP schemes is primarily buy-and-hold whereas open-ended schemes are actively managed.
A. Cumulative performance
Dec 31, 12 Last 1 Year 10.6740 9.31 8.27 5.86 10,931 10,827 10,586May 09, 12 Since Inception 10.0000 9.82 8.62 6.68 11,668 11,458 11,123
HDFC FMP 24M APRIL 2012 (1) - GROWTH OPTION NAV as at December 31, 2013 ` 11.6677
Period Scheme Benchmark Additional ^ # Benchmark
##
B. Discrete 12 month returns (%)
Dec 31, 12 to Dec 31, 13 9.31 8.27 5.86
Date Period NAV Scheme Benchmark Additional Value of investment of ` 10,000@ per Unit Returns Returns Benchmark Scheme Benchmark Additional
(`) (%)^ (%)# Returns (`) (`)# Benchmark(%)## (`)##
^̂PPaasstt ppeerrffoorrmmaannccee mmaayy oorr mmaayy nnoott bbee ssuussttaaiinneedd iinn tthhee ffuuttuurree.. Returns greater than 1 year period are compounded annualized (CAGR). # CRISIL Composite Bond Fund Index. ## CRISIL 1 year T-Bill IndexPerformance of FMP schemes, being close-ended in nature, is not strictly comparable with that of open-ended schemes since the investment strategy for FMP schemes is primarily buy-and-hold whereas open-ended schemes are actively managed.
A. Cumulative performance
Dec 31, 12 Last 1 Year 10.5837 7.74 3.79 5.86 10,774 10,379 10,586Jun 20, 12 Since Inception 10.0000 8.95 5.79 6.56 11,403 10,900 11,022
HDFC FMP 1120D JUNE 2012 (1) - GROWTH OPTION NAV as at December 31, 2013 ` 11.4026
Period Scheme Benchmark Additional ^ # Benchmark
##
B. Discrete 12 month returns (%)
Dec 31, 12 to Dec 31, 13 7.74 3.79 5.86
Date Period NAV Scheme Benchmark Additional Value of investment of ` 10,000@ per Unit Returns Returns Benchmark Scheme Benchmark Additional
(`) (%)^ (%)# Returns (`) (`)# Benchmark(%)## (`)##
^̂PPaasstt ppeerrffoorrmmaannccee mmaayy oorr mmaayy nnoott bbee ssuussttaaiinneedd iinn tthhee ffuuttuurree.. Returns greater than 1 year period are compounded annualized (CAGR). # CRISIL Short Term Bond Fund Index. ## CRISIL 1 year T-Bill IndexPerformance of FMP schemes, being close-ended in nature, is not strictly comparable with that of open-ended schemes since the investment strategy for FMP schemes is primarily buy-and-hold whereas open-ended schemes are actively managed.
A. Cumulative performance
Dec 31, 12 Last 1 Year 10.0248 8.80 8.27 5.86 10,880 10,827 10,586Dec 18, 12 Since Inception 10.0000 8.75 8.29 5.83 10,907 10,860 10,605
HDFC FMP 526D DECEMBER 2012 (1) - GROWTH OPTION NAV as at December 31, 2013 ` 10.9073
Period Scheme Benchmark Additional ^ # Benchmark
##
B. Discrete 12 month returns (%)
Dec 31, 12 to Dec 31, 13 8.80 8.27 5.86
Date Period NAV Scheme Benchmark Additional Value of investment of ` 10,000@ per Unit Returns Returns Benchmark Scheme Benchmark Additional
(`) (%)^ (%)# Returns (`) (`)# Benchmark(%)## (`)##
^̂PPaasstt ppeerrffoorrmmaannccee mmaayy oorr mmaayy nnoott bbee ssuussttaaiinneedd iinn tthhee ffuuttuurree.. Returns greater than 1 year period are compounded annualized (CAGR). # CRISIL Short Term Bond Fund Index. ## CRISIL 1 year T-Bill IndexPerformance of FMP schemes, being close-ended in nature, is not strictly comparable with that of open-ended schemes since the investment strategy for FMP schemes is primarily buy-and-hold whereas open-ended schemes are actively managed.
A. Cumulative performance
Dec 31, 12 Last 1 Year 10.0417 8.69 8.27 5.86 10,869 10,827 10,586Dec 12, 12 Since Inception 10.0000 8.67 8.32 5.96 10,915 10,877 10,628
HDFC FMP 566D DECEMBER 2012 (1) - GROWTH OPTION NAV as at December 31, 2013 ` 10.9146
Period Scheme Benchmark Additional ^ # Benchmark
##
B. Discrete 12 month returns (%)
Dec 31, 12 to Dec 31, 13 8.69 8.27 5.86
Date Period NAV Scheme Benchmark Additional Value of investment of ` 10,000@ per Unit Returns Returns Benchmark Scheme Benchmark Additional
(`) (%)^ (%)# Returns (`) (`)# Benchmark(%)## (`)##
^̂PPaasstt ppeerrffoorrmmaannccee mmaayy oorr mmaayy nnoott bbee ssuussttaaiinneedd iinn tthhee ffuuttuurree.. Returns greater than 1 year period are compounded annualized (CAGR). # CRISIL Short Term Bond Fund Index. ## CRISIL 1 year T-Bill IndexPerformance of FMP schemes, being close-ended in nature, is not strictly comparable with that of open-ended schemes since the investment strategy for FMP schemes is primarily buy-and-hold whereas open-ended schemes are actively managed.
A. Cumulative performance
Dec 31, 12 Last 1 Year 10.7691 9.15 8.27 5.86 10,915 10,827 10,586
Mar 20, 12 Since Inception 10.0000 9.49 8.74 6.92 11,755 11,611 11,267
HDFC FMP 772D MARCH 2012 (1) - GROWTH OPTION NAV as at December 31, 2013 ` 11.7549
Period Scheme Benchmark Additional ^ # Benchmark
##
B. Discrete 12 month returns (%)
Dec 31, 12 to Dec 31, 13 9.15 8.27 5.86

SCHEME PERFORMANCE SUMMARY (FUND MANAGER-WISE)
Date Period NAV Scheme Benchmark Additional Value of investment of ` 10,000@ per Unit Returns Returns Benchmark Scheme Benchmark Additional
(`) (%)^ (%)# Returns (`) (`)# Benchmark(%)## (`) ##
^̂PPaasstt ppeerrffoorrmmaannccee mmaayy oorr mmaayy nnoott bbee ssuussttaaiinneedd iinn tthhee ffuuttuurree.. Returns greater than 1 year period are compounded annualized (CAGR). # CRISIL MIP Blended Index ## CRISIL 1 year T-Bill IndexScheme performance may not strictly be comparable with that of its Additional Benchmark in view of hybrid nature of the scheme where a portion of scheme's investments are made in equity instruments. The Scheme is co-mmanaged by Vinay Kulkarni (Equities) and Anil Bamboli (Debt).
A. Cumulative performance
Dec 31, 12 Last 1 Year 20.9932 6.76 4.41 5.86 10,676 10,441 10,586Dec 30, 11 Last 2 Years 18.6795 9.51 8.17 6.96 11,999 11,707 11,445Dec 31, 10 Last 3 Years 17.6826 8.21 5.99 6.79 12,675 11,908 12,180Sep 17, 04 Since Inception 10.0000 9.07 7.52 5.51 22,413 19,618 16,455
Period Scheme Benchmark Additional ^ # Benchmark
##
B. Discrete 12 month returns (%)
Dec 31, 12 to Dec 31, 13 6.76 4.41 5.86
Dec 30, 11 to Dec 31, 12 12.31 12.05 8.06
Dec 31, 10 to Dec 30, 11 5.64 1.72 6.42
HDFC MULTIPLE YIELD FUND - GROWTH OPTION NAV as at December 31, 2013 ` 22.4127
ANIL BAMBOLI
Date Period NAV Scheme Benchmark Additional Value of investment of ` 10,000@ per Unit Returns Returns Benchmark Scheme Benchmark Additional
(`) (%)^ (%)# Returns (`) (`)# Benchmark(%)## (`) ##
^̂PPaasstt ppeerrffoorrmmaannccee mmaayy oorr mmaayy nnoott bbee ssuussttaaiinneedd iinn tthhee ffuuttuurree.. Returns greater than 1 year period are compounded annualized (CAGR). # CRISIL Liquid Fund Index ## CNX Nifty IndexScheme performance is not strictly comparable with that of its Additional Benchmark since the scheme does not take directional call in equity markets but is limited to availing arbitrage opportunities, etc.
A. Cumulative performance
Dec 31, 12 Last 1 Year 14.307 8.18 9.03 6.76 10,818 10,903 10,676Dec 30, 11 Last 2 Years 13.158 8.43 8.76 16.71 11,763 11,835 13,632Dec 31, 10 Last 3 Years 12.244 8.12 8.57 0.91 12,641 12,799 10,276Oct 23, 07 Since Inception 10.000 7.31 7.31 2.31 15,478 15,479 11,517
Period Scheme Benchmark Additional ^ # Benchmark
##
B. Discrete 12 month returns (%)
Dec 31, 12 to Dec 31, 13 8.18 9.03 6.76
Dec 30, 11 to Dec 31, 12 8.68 8.49 27.53
Dec 31, 10 to Dec 30, 11 7.46 8.15 -24.62
HDFC ARBITRAGE FUND - RETAIL PLAN - GROWTH OPTION NAV as at December 31, 2013 ` 15.478
Performance of dividend option under the schemes for the investors would be net of distribution tax as applicable. Load is not taken into consideration for computation of performance. N.A.: Not Available@ shows the current value of ` 10,000/- invested at the beginning of a given periodWhere either NAV or Benchmark Index value is not available for the start/end date of a concerned period, the previous date where both NAV and Benchmark Index value are available, is considered for returns computation except for since inception returns
Intouchmutually46 January 2014
Date Period NAV Scheme Benchmark Additional Value of investment of ` 10,000@ per Unit Returns Returns Benchmark Scheme Benchmark Additional
(`) (%)^ (%)# Returns (`) (`)# Benchmark(%)## (`) ##
^̂PPaasstt ppeerrffoorrmmaannccee mmaayy oorr mmaayy nnoott bbee ssuussttaaiinneedd iinn tthhee ffuuttuurree.. Returns greater than 1 year period are compounded annualized (CAGR). # CRISIL MIP Blended Index ## CRISIL 1 year T-Bill IndexScheme performance may not strictly be comparable with that of its Additional Benchmark in view of hybrid nature of the scheme where a portion of scheme's investments are made in equity instruments. The Scheme is co-mmanaged by Chirag Setalvad (Equities) and Anil Bamboli (Debt).
A. Cumulative performance
Dec 31, 12 Last 1 Year 19.1032 6.65 4.41 5.86 10,665 10,441 10,586Dec 30, 11 Last 2 Years 17.0809 9.19 8.17 6.96 11,928 11,707 11,445Dec 31, 10 Last 3 Years 16.0976 8.16 5.99 6.79 12,657 11,908 12,180Aug 17, 05 Since Inception 10.0000 8.87 7.30 5.57 20,374 18,051 15,752
Period Scheme Benchmark Additional ^ # Benchmark
##
B. Discrete 12 month returns (%)
Dec 31, 12 to Dec 31, 13 6.65 4.41 5.86
Dec 30, 11 to Dec 31, 12 11.77 12.05 8.06
Dec 31, 10 to Dec 30, 11 6.11 1.72 6.42
HDFC MULTIPLE YIELD FUND - PLAN 2005 - GROWTH OPTION NAV as at December 31, 2013 ` 20.3744
Date Period NAV Scheme Benchmark Additional Value of investment of ` 10,000@ per Unit Returns Returns Benchmark Scheme Benchmark Additional
(`) (%)^ (%)# Returns (`) (`)# Benchmark(%)## (`) ##
^̂PPaasstt ppeerrffoorrmmaannccee mmaayy oorr mmaayy nnoott bbee ssuussttaaiinneedd iinn tthhee ffuuttuurree.. Returns greater than 1 year period are compounded annualized (CAGR). # CRISIL Composite Bond Fund Index ## CRISIL 10 year Gilt Index
A. Cumulative performance
Dec 31, 12 Last 1 Year 38.3012 5.33 3.79 -0.68 10,533 10,379 9,932Dec 30, 11 Last 2 Years 34.6230 7.92 6.53 4.83 11,652 11,352 10,992Dec 31, 10 Last 3 Years 32.6068 7.35 6.66 3.85 12,373 12,136 11,202Apr 28, 97 Since Inception 10.0000 8.72 N.A. N.A. 40,344 N.A. N.A.
Period Scheme Benchmark Additional ^ # Benchmark
##
B. Discrete 12 month returns (%)
Dec 31, 12 to Dec 31, 13 5.33 3.79 -0.68
Dec 30, 11 to Dec 31, 12 10.56 9.33 10.61
Dec 31, 10 to Dec 30, 11 6.18 6.90 1.91
HDFC HIGH INTEREST FUND - DYNAMIC PLAN - GROWTH OPTION NAV as at December 31, 2013 ` 40.3442
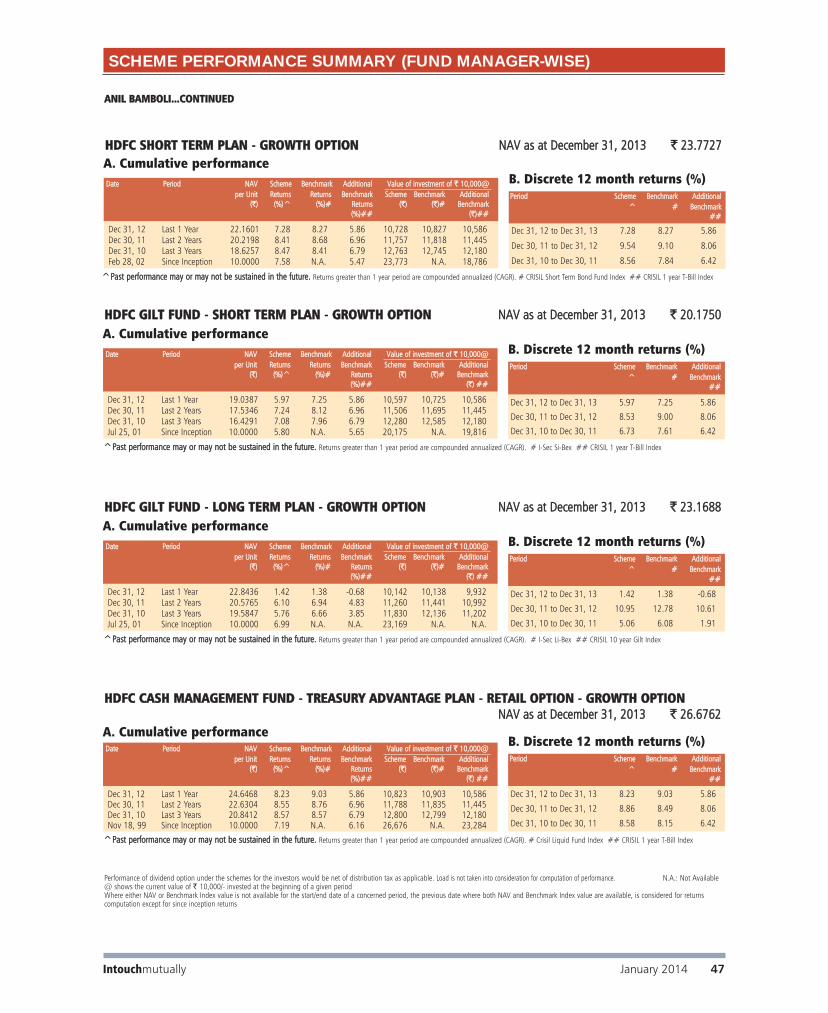
Performance of dividend option under the schemes for the investors would be net of distribution tax as applicable. Load is not taken into consideration for computation of performance. N.A.: Not Available@ shows the current value of ` 10,000/- invested at the beginning of a given periodWhere either NAV or Benchmark Index value is not available for the start/end date of a concerned period, the previous date where both NAV and Benchmark Index value are available, is considered for returns computation except for since inception returns
SCHEME PERFORMANCE SUMMARY (FUND MANAGER-WISE)
ANIL BAMBOLI...CONTINUED
Date Period NAV Scheme Benchmark Additional Value of investment of ` 10,000@ per Unit Returns Returns Benchmark Scheme Benchmark Additional
(`) (%)^ (%)# Returns (`) (`)# Benchmark(%)## (`)##
^̂PPaasstt ppeerrffoorrmmaannccee mmaayy oorr mmaayy nnoott bbee ssuussttaaiinneedd iinn tthhee ffuuttuurree.. Returns greater than 1 year period are compounded annualized (CAGR). # CRISIL Short Term Bond Fund Index ## CRISIL 1 year T-Bill Index
A. Cumulative performance
Dec 31, 12 Last 1 Year 22.1601 7.28 8.27 5.86 10,728 10,827 10,586Dec 30, 11 Last 2 Years 20.2198 8.41 8.68 6.96 11,757 11,818 11,445Dec 31, 10 Last 3 Years 18.6257 8.47 8.41 6.79 12,763 12,745 12,180Feb 28, 02 Since Inception 10.0000 7.58 N.A. 5.47 23,773 N.A. 18,786
Period Scheme Benchmark Additional ^ # Benchmark
##
B. Discrete 12 month returns (%)
Dec 31, 12 to Dec 31, 13 7.28 8.27 5.86
Dec 30, 11 to Dec 31, 12 9.54 9.10 8.06
Dec 31, 10 to Dec 30, 11 8.56 7.84 6.42
HDFC SHORT TERM PLAN - GROWTH OPTION NAV as at December 31, 2013 ` 23.7727
Intouchmutually January 2014 47
Date Period NAV Scheme Benchmark Additional Value of investment of ` 10,000@ per Unit Returns Returns Benchmark Scheme Benchmark Additional
(`) (%)^ (%)# Returns (`) (`)# Benchmark(%)## (`) ##
^̂PPaasstt ppeerrffoorrmmaannccee mmaayy oorr mmaayy nnoott bbee ssuussttaaiinneedd iinn tthhee ffuuttuurree.. Returns greater than 1 year period are compounded annualized (CAGR). # I-Sec Li-Bex ## CRISIL 10 year Gilt Index
A. Cumulative performance
Dec 31, 12 Last 1 Year 22.8436 1.42 1.38 -0.68 10,142 10,138 9,932Dec 30, 11 Last 2 Years 20.5765 6.10 6.94 4.83 11,260 11,441 10,992Dec 31, 10 Last 3 Years 19.5847 5.76 6.66 3.85 11,830 12,136 11,202Jul 25, 01 Since Inception 10.0000 6.99 N.A. N.A. 23,169 N.A. N.A.
Period Scheme Benchmark Additional ^ # Benchmark
##
B. Discrete 12 month returns (%)
Dec 31, 12 to Dec 31, 13 1.42 1.38 -0.68
Dec 30, 11 to Dec 31, 12 10.95 12.78 10.61
Dec 31, 10 to Dec 30, 11 5.06 6.08 1.91
HDFC GILT FUND - LONG TERM PLAN - GROWTH OPTION NAV as at December 31, 2013 ` 23.1688
Date Period NAV Scheme Benchmark Additional Value of investment of ` 10,000@ per Unit Returns Returns Benchmark Scheme Benchmark Additional
(`) (%)^ (%)# Returns (`) (`)# Benchmark(%)## (`) ##
^̂PPaasstt ppeerrffoorrmmaannccee mmaayy oorr mmaayy nnoott bbee ssuussttaaiinneedd iinn tthhee ffuuttuurree.. Returns greater than 1 year period are compounded annualized (CAGR). # I-Sec Si-Bex ## CRISIL 1 year T-Bill Index
A. Cumulative performance
Dec 31, 12 Last 1 Year 19.0387 5.97 7.25 5.86 10,597 10,725 10,586Dec 30, 11 Last 2 Years 17.5346 7.24 8.12 6.96 11,506 11,695 11,445Dec 31, 10 Last 3 Years 16.4291 7.08 7.96 6.79 12,280 12,585 12,180Jul 25, 01 Since Inception 10.0000 5.80 N.A. 5.65 20,175 N.A. 19,816
Period Scheme Benchmark Additional ^ # Benchmark
##
B. Discrete 12 month returns (%)
Dec 31, 12 to Dec 31, 13 5.97 7.25 5.86
Dec 30, 11 to Dec 31, 12 8.53 9.00 8.06
Dec 31, 10 to Dec 30, 11 6.73 7.61 6.42
HDFC GILT FUND - SHORT TERM PLAN - GROWTH OPTION NAV as at December 31, 2013 ` 20.1750
Date Period NAV Scheme Benchmark Additional Value of investment of ` 10,000@ per Unit Returns Returns Benchmark Scheme Benchmark Additional
(`) (%)^ (%)# Returns (`) (`)# Benchmark(%)## (`) ##
^̂PPaasstt ppeerrffoorrmmaannccee mmaayy oorr mmaayy nnoott bbee ssuussttaaiinneedd iinn tthhee ffuuttuurree.. Returns greater than 1 year period are compounded annualized (CAGR). # Crisil Liquid Fund Index ## CRISIL 1 year T-Bill Index
A. Cumulative performance
Dec 31, 12 Last 1 Year 24.6468 8.23 9.03 5.86 10,823 10,903 10,586Dec 30, 11 Last 2 Years 22.6304 8.55 8.76 6.96 11,788 11,835 11,445Dec 31, 10 Last 3 Years 20.8412 8.57 8.57 6.79 12,800 12,799 12,180Nov 18, 99 Since Inception 10.0000 7.19 N.A. 6.16 26,676 N.A. 23,284
Period Scheme Benchmark Additional ^ # Benchmark
##
B. Discrete 12 month returns (%)
Dec 31, 12 to Dec 31, 13 8.23 9.03 5.86
Dec 30, 11 to Dec 31, 12 8.86 8.49 8.06
Dec 31, 10 to Dec 30, 11 8.58 8.15 6.42
HDFC CASH MANAGEMENT FUND - TREASURY ADVANTAGE PLAN - RETAIL OPTION - GROWTH OPTIONNAV as at December 31, 2013 ` 26.6762

Performance of dividend option under the schemes for the investors would be net of distribution tax as applicable. Load is not taken into consideration for computation of performance. N.A.: Not Available@ shows the current value of ` 10,000/- invested at the beginning of a given periodWhere either NAV or Benchmark Index value is not available for the start/end date of a concerned period, the previous date where both NAV and Benchmark Index value are available, is considered for returns computation except for since inception returns
ANIL BAMBOLI...CONTINUED
SCHEME PERFORMANCE SUMMARY (FUND MANAGER-WISE)
Period Scheme Benchmark Additional ^ # Benchmark
##
B. Discrete 12 month returns (%)
Dec 31, 12 to Dec 31, 13 8.39 8.27 5.86Dec 30, 11 to Dec 31, 12 10.03 9.10 8.06Dec 31, 10 to Dec 30, 11 9.24 7.84 6.42
Date Period NAV Scheme Benchmark Additional Value of investment of ` 10,000@ per Unit Returns Returns Benchmark Scheme Benchmark Additional
(`) (%)^ (%)# Returns (`) (`)# Benchmark(%)## (`) ##
^̂PPaasstt ppeerrffoorrmmaannccee mmaayy oorr mmaayy nnoott bbee ssuussttaaiinneedd iinn tthhee ffuuttuurree.. Returns greater than 1 year period are compounded annualized (CAGR). # CRISIL Short-Term Bond Fund Index. ## CRISIL 1 year T-Bill Index
A. Cumulative performance
Dec 31, 12 Last 1 Year 12.4381 8.39 8.27 5.86 10,839 10,827 10,586Dec 30, 11 Last 2 Years 11.2988 9.21 8.68 6.96 11,932 11,818 11,445Dec 31, 10 Last 3 Years 10.3430 9.23 8.41 6.79 13,035 12,745 12,180Jun 25, 10 Since Inception 10.0000 8.86 7.78 6.22 13,482 13,017 12,366
HDFC SHORT TERM OPPORTUNITIES FUND - GROWTH OPTION NAV as at December 31, 2013 ` 13.4818
Intouchmutually48 January 2014
Period Scheme Benchmark^ #
B. Discrete 12 month returns (%)
Dec 31, 12 to Dec 31, 13 -14.12 -13.27Dec 30, 11 to Dec 31, 12 10.84 11.99Dec 31, 10 to Dec 30, 11 30.63 32.21
Date Period NAV Scheme Benchmark Value of investment of ` 10,000@ per Unit Returns Returns Scheme Benchmark
(`) (%)^ (%)# (`) (`)#
^̂PPaasstt ppeerrffoorrmmaannccee mmaayy oorr mmaayy nnoott bbee ssuussttaaiinneedd iinn tthhee ffuuttuurree.. Returns greater than 1 year period are compounded annualized (CAGR). # Domestic Price of Physical GoldSince inception returns are calculated on ` 1800.3288 (allotment price)
A. Cumulative performance
Dec 31, 12 Last 1 Year 2974.2994 -14.12 -13.27 8,588 8,673Dec 30, 11 Last 2 Years 2681.8780 -2.40 -1.42 9,524 9,718Dec 31, 10 Last 3 Years 2053.0957 7.54 8.71 12,441 12,849Aug 13, 10 Since Inception 1800.3288 10.88 11.18 14,188 14,319
HDFC GOLD EXCHANGE TRADED FUND NAV as at December 31, 2013 ` 2554.2262
Period Scheme Benchmark Additional ^ # Benchmark
##
B. Discrete 12 month returns (%)
Dec 31, 12 to Dec 31, 13 7.63 8.27 5.86Dec 30, 11 to Dec 31, 12 9.47 9.10 8.06
Date Period NAV Scheme Benchmark Additional Value of investment of ` 10,000@ per Unit Returns Returns Benchmark Scheme Benchmark Additional
(`) (%)^ (%)# Returns (`) (`)# Benchmark(%)## (`) ##
^̂PPaasstt ppeerrffoorrmmaannccee mmaayy oorr mmaayy nnoott bbee ssuussttaaiinneedd iinn tthhee ffuuttuurree.. Returns greater than 1 year period are compounded annualized (CAGR). # CRISIL Short-Term Bond Fund Index. ## CRISIL 1 year T-Bill IndexReturns of HDFC Debt Fund For Cancer Cure are computed based on NAV of Dividend Option and all dividends (after statutory levy) are assumed to be reinvested in the units of the scheme at the then prevailing NAV (ex-dividend NAV).
A. Cumulative performance
Dec 31, 12 Last 1 Year 10.3075 7.63 8.27 5.86 10,763 10,827 10,586Dec 30, 11 Last 2 Years 10.2265 8.55 8.68 6.96 11,788 11,818 11,445Mar 11, 11 Since Inception 10.0000 8.72 8.59 6.74 12,650 12,608 12,011
HDFC DEBT FUND FOR CANCER CURE - DIVIDEND OPTION NAV as at December 31, 2013 ` 10.2668
Period Scheme Benchmark^ #
B. Discrete 12 month returns (%)
Dec 31, 12 to Dec 31, 13 -7.18 -13.27Dec 30, 11 to Dec 31, 12 11.98 11.99
Date Period NAV Scheme Benchmark Value of investment of ` 10,000@ per Unit Returns Returns Scheme Benchmark
(`) (%)^ (%)# (`) (`)#
^̂PPaasstt ppeerrffoorrmmaannccee mmaayy oorr mmaayy nnoott bbee ssuussttaaiinneedd iinn tthhee ffuuttuurree.. Returns greater than 1 year period are compounded annualized (CAGR). # Domestic Price of Physical Gold
A. Cumulative performance
Dec 31, 12 Last 1 Year 11.0095 -7.18 -13.27 9,282 8,673Dec 30, 11 Last 2 Years 9.8257 1.98 -1.42 10,400 9,718Nov 01, 11 Since Inception 10.0000 1.00 -1.13 10,219 9,758
HDFC GOLD FUND NAV as at December 31, 2013 ` 10.2190
Date Period NAV Scheme Benchmark Additional Value of investment of ` 10,000@ per Unit Returns Returns Benchmark Scheme Benchmark Additional
(`) (%)^ (%)# Returns (`) (`)# Benchmark(%)## (`) ##
^̂PPaasstt ppeerrffoorrmmaannccee mmaayy oorr mmaayy nnoott bbee ssuussttaaiinneedd iinn tthhee ffuuttuurree.. Returns greater than 1 year period are compounded annualized (CAGR). # Crisil Liquid Fund Index ## CRISIL 1 year T-Bill IndexScheme performance may not strictly be comparable with that of its Additional Benchmark as the Scheme can invest only in instruments having maturity upto the opening of the immediately following specified transaction period, which is at quarterly intervals.
Dec 31, 12 Last 1 Year 16.0508 9.24 9.03 5.86 10,924 10,903 10,586Dec 30, 11 Last 2 Years 14.6092 9.53 8.76 6.96 12,002 11,835 11,445Dec 31, 10 Last 3 Years 13.3595 9.48 8.57 6.79 13,125 12,799 12,180Mar 30, 07 Since Inception 10.0000 8.66 7.37 5.86 17,534 16,176 14,693
Period Scheme Benchmark Additional ^ # Benchmark
##
B. Discrete 12 month returns (%)
Dec 31, 12 to Dec 31, 13 9.24 9.03 5.86
Dec 30, 11 to Dec 31, 12 9.81 8.49 8.06
Dec 31, 10 to Dec 30, 11 9.35 8.15 6.42
HDFC QUARTERLY INTERVAL FUND - PLAN A - RETAIL PLAN - GROWTH OPTIONNAV as at December 31, 2013 ` 17.5337
A. Cumulative performance

Date Period NAV Scheme Benchmark Additional Value of investment of ` 10,000@ per Unit Returns Returns Benchmark Scheme Benchmark Additional
(`) (%)^ (%)# Returns (`) (`)# Benchmark(%)## (`) ##
^̂PPaasstt ppeerrffoorrmmaannccee mmaayy oorr mmaayy nnoott bbee ssuussttaaiinneedd iinn tthhee ffuuttuurree.. Returns greater than 1 year period are compounded annualized (CAGR). # CRISIL Liquid Fund Index ## CRISIL 1 year T-Bill IndexScheme performance may not strictly be comparable with that of its Additional Benchmark as the Scheme can invest only in instruments having maturity upto the opening of the immediately following specified transaction period, which is at quarterly intervals.
A. Cumulative performance
Dec 31, 12 Last 1 Year 15.6118 9.54 9.03 5.86 10,954 10,903 10,586Dec 30, 11 Last 2 Years 14.2684 9.45 8.76 6.96 11,986 11,835 11,445Dec 31, 10 Last 3 Years 13.0625 9.39 8.57 6.79 13,092 12,799 12,180May 15, 07 Since Inception 10.0000 8.42 7.28 5.78 17,102 15,942 14,516
Period Scheme Benchmark Additional ^ # Benchmark
##
B. Discrete 12 month returns (%)
Dec 31, 12 to Dec 31, 13 9.54 9.03 5.86Dec 30, 11 to Dec 31, 12 9.36 8.49 8.06Dec 31, 10 to Dec 30, 11 9.23 8.15 6.42
HDFC QUARTERLY INTERVAL FUND - PLAN C - RETAIL PLAN - GROWTH OPTIONNAV as at December 31, 2013 ` 17.1016
ANIL BAMBOLI...CONTINUED
SCHEME PERFORMANCE SUMMARY (FUND MANAGER-WISE)
Returns of the Wholesale Plans under HDFC Quarterly Interval Fund – Plans A, B & C cannot be computed, as there have been periods since the launch of the Scheme / Plans when there were no unit holders underthe Plans. Performance of dividend option under the schemes for the investors would be net of distribution tax as applicable. Load is not taken into consideration for computation of performance. N.A.: Not Available@ shows the current value of ` 10,000/- invested at the beginning of a given periodWhere either NAV or Benchmark Index value is not available for the start/end date of a concerned period, the previous date where both NAV and Benchmark Index value are available, is considered for returns computation except for since inception returns
Date Period NAV Scheme Benchmark Additional Value of investment of ` 10,000@ per Unit Returns Returns Benchmark Scheme Benchmark Additional
(`) (%)^ (%)# Returns (`) (`)# Benchmark(%)## (`) ##
^̂PPaasstt ppeerrffoorrmmaannccee mmaayy oorr mmaayy nnoott bbee ssuussttaaiinneedd iinn tthhee ffuuttuurree.. Returns greater than 1 year period are compounded annualized (CAGR). # CRISIL Liquid Fund Index ## CRISIL 1 year T-Bill IndexScheme performance may not strictly be comparable with that of its Additional Benchmark as the Scheme can invest only in instruments having maturity upto the opening of the immediately following specified transaction period, which is at quarterly intervals.
A. Cumulative performance
Dec 31, 12 Last 1 Year 15.6649 8.84 9.03 5.86 10,884 10,903 10,586Dec 30, 11 Last 2 Years 14.3056 9.15 8.76 6.96 11,918 11,835 11,445Dec 31, 10 Last 3 Years 13.1320 9.08 8.57 6.79 12,984 12,799 12,180Apr 18, 07 Since Inception 10.0000 08.28 7.31 5.77 17,050 16,049 14,574
Period Scheme Benchmark Additional ^ # Benchmark
##
B. Discrete 12 month returns (%)
Dec 31, 12 to Dec 31, 13 8.84 9.03 5.86
Dec 30, 11 to Dec 31, 12 9.45 8.49 8.06
Dec 31, 10 to Dec 30, 11 8.94 8.15 6.42
HDFC QUARTERLY INTERVAL FUND - PLAN B - RETAIL PLAN - GROWTH OPTIONNAV as at December 31, 2013 ` 17.0501
Date Period NAV Scheme Benchmark Additional Value of investment of ` 10,000@ per Unit Returns Returns Benchmark Scheme Benchmark Additional
(`) (%)^$$ (%)# Returns (`) $$ (`)# Benchmark(%)## (`)##
^̂PPaasstt ppeerrffoorrmmaannccee mmaayy oorr mmaayy nnoott bbee ssuussttaaiinneedd iinn tthhee ffuuttuurree.. Returns greater than 1 year period are compounded annualized (CAGR). # Crisil Liquid Fund Index ## CRISIL 1 year T-Bill Index$$ All dividends declared prior to the splitting of the Scheme into Dividend & Growth Options are assumed to be reinvested in the units of the Scheme at the then prevailing NAV (ex-dividend NAV).
A. Cumulative performance
Dec 24, 13 Last 7 days 26.1559 0.18 0.12 0.17 10,018 10,012 10,017Dec 16, 13 Last 15 days 26.1053 0.37 0.33 0.35 10,037 10,033 10,035Nov 29, 13 Last 1 Month 25.9968 0.79 0.78 0.60 10,079 10,078 10,060Dec 31, 12 Last 1 Year 23.9920 9.21 9.03 5.86 10,921 10,903 10,586Dec 30, 11 Last 2 Years 21.8654 9.44 8.76 6.96 11,983 11,835 11,445Dec 31, 10 Last 3 Years 20.0875 9.25 8.57 6.79 13,044 12,799 12,180Nov 18, 99 Since Inception 10.0000 7.08 N.A. 6.16 26,291 N.A. 23,284
Period Scheme Benchmark Additional ^$$ # Benchmark
##
B. Discrete 12 month returns (%)
Dec 31, 12 to Dec 31, 13 9.21 9.03 5.86
Dec 30, 11 to Dec 31, 12 9.67 8.49 8.06
Dec 31, 10 to Dec 30, 11 8.85 8.15 6.42
HDFC CASH MANAGEMENT FUND - SAVINGS PLAN - GROWTH OPTION NAV as at December 31, 2013 ` 26.2017
Date Period NAV Scheme Benchmark Additional Value of investment of ` 10,000@ per Unit Returns Returns Benchmark Scheme Benchmark Additional
(`) (%)^ (%)# Returns (`) (`)# Benchmark(%)## (`)##
^̂PPaasstt ppeerrffoorrmmaannccee mmaayy oorr mmaayy nnoott bbee ssuussttaaiinneedd iinn tthhee ffuuttuurree.. Returns greater than 1 year period are compounded annualized (CAGR). # Crisil Liquid Fund Index ## CRISIL 1 year T-Bill Index
A. Cumulative performance
Dec 24, 13 Last 7 days 19.9280 0.16 0.12 0.17 10,016 10,012 10,017Dec 16, 13 Last 15 days 19.8921 0.34 0.33 0.35 10,034 10,033 10,035Nov 29, 13 Last 1 Month 19.8257 0.67 0.78 0.60 10,067 10,078 10,060Dec 31, 12 Last 1 Year 18.4446 8.21 9.03 5.86 10,821 10,903 10,586Dec 30, 11 Last 2 Years 17.0408 8.20 8.76 6.96 11,712 11,835 11,445Dec 31, 10 Last 3 Years 15.8580 7.96 8.57 6.79 12,586 12,799 12,180Feb 06, 02 Since Inception 10.0000 5.98 N.A. 5.47 19,959 N.A. 18,860
Period Scheme Benchmark Additional ^ # Benchmark
##
B. Discrete 12 month returns (%)
Dec 31, 12 to Dec 31, 13 8.21 9.03 5.86
Dec 30, 11 to Dec 31, 12 8.19 8.49 8.06
Dec 31, 10 to Dec 30, 11 7.46 8.15 6.42
HDFC CASH MANAGEMENT FUND - CALL PLAN - GROWTH OPTION NAV as at December 31, 2013 ` 19.9590
Intouchmutually January 2014 49

Mar 22, 11 49.043 4.00 4.00Mar 23, 12 43.951 4.00 4.00Mar 21, 13 41.388 4.00 4.00
DDiirreecctt PPllaannMar 21, 13 41.447 4.00 4.00
RReeccoorrdd CCuumm DDiivv DDiivviiddeenndd PPeerr uunniitt ((`̀)) FFoorr DDaattee NNAAVV ((`̀)) IInnddiivviidduuaallss && HHUUFF OOtthheerrss
RReeccoorrdd CCuumm DDiivv DDiivviiddeenndd PPeerr uunniitt ((`̀)) FFoorr DDaattee NNAAVV ((`̀)) IInnddiivviidduuaallss && HHUUFF OOtthheerrss
HDFC Equity Fund (Past 3 years)
Mar 10, 11 48.000 4.00 4.00Mar 07, 12 42.778 4.00 4.00Mar 07, 13 43.247 4.00 4.00
DDiirreecctt PPllaannMar 07, 13 43.293 4.00 4.00
RReeccoorrdd CCuumm DDiivv DDiivviiddeenndd PPeerr uunniitt ((`̀)) FFoorr DDaattee NNAAVV ((`̀)) IInnddiivviidduuaallss && HHUUFF OOtthheerrss
RReeccoorrdd CCuumm DDiivv DDiivviiddeenndd PPeerr uunniitt ((`̀)) FFoorr DDaattee NNAAVV ((`̀)) IInnddiivviidduuaallss && HHUUFF OOtthheerrss
HDFC Top 200 Fund (Past 3 years)
Feb 24, 11 24.791 2.50 2.50Mar 07, 12 22.595 2.50 2.50Feb 21, 13 22.391 2.50 2.50
RReeccoorrdd CCuumm DDiivv DDiivviiddeenndd PPeerr uunniitt ((`̀)) FFoorr DDaattee NNAAVV ((`̀)) IInnddiivviidduuaallss && HHUUFF OOtthheerrss
HDFC Capital Builder Fund (Past 3 years)
Feb 24, 11 31.392 3.00 3.00Feb 23, 12 30.629 3.00 3.00Feb 21, 13 29.331 3.00 3.00
DDiirreecctt PPllaannFeb 21, 13 29.352 3.00 3.00
RReeccoorrdd CCuumm DDiivv DDiivviiddeenndd PPeerr uunniitt ((`̀)) FFoorr DDaattee NNAAVV ((`̀)) IInnddiivviidduuaallss && HHUUFF OOtthheerrss
HDFC Growth Fund
RReeccoorrdd CCuumm DDiivv DDiivviiddeenndd PPeerr uunniitt ((`̀)) FFoorr DDaattee NNAAVV ((`̀)) IInnddiivviidduuaallss && HHUUFF OOtthheerrss
DDiirreecctt PPllaannFeb 21, 13 22.408 2.50 2.50
HDFC Balanced Fund (Past 3 years)
RReeccoorrdd CCuumm DDiivv DDiivviiddeenndd PPeerr uunniitt ((`̀)) FFoorr DDaattee NNAAVV ((`̀)) IInnddiivviidduuaallss && HHUUFF OOtthheerrss
Mar 03, 11 20.785 2.25 2.25Mar 01, 12 20.353 2.25 2.25Feb 27, 13 19.322 1.25 1.25
RReeccoorrdd CCuumm DDiivv DDiivviiddeenndd PPeerr uunniitt ((`̀)) FFoorr DDaattee NNAAVV ((`̀)) IInnddiivviidduuaallss && HHUUFF OOtthheerrss
DDiirreecctt PPllaannFeb 27, 13 19.339 1.25 1.25
Mar 17, 11 31.286 3.50 3.50Mar 15, 12 29.516 3.50 3.50Feb 27, 13 27.526 3.00 3.00
DDiirreecctt PPllaannFeb 27, 13 27.552 3.00 3.00
RReeccoorrdd CCuumm DDiivv DDiivviiddeenndd PPeerr uunniitt ((`̀)) FFoorr DDaattee NNAAVV ((`̀)) IInnddiivviidduuaallss && HHUUFF OOtthheerrss
RReeccoorrdd CCuumm DDiivv DDiivviiddeenndd PPeerr uunniitt ((`̀)) FFoorr DDaattee NNAAVV ((`̀)) IInnddiivviidduuaallss && HHUUFF OOtthheerrss
HDFC Prudence Fund (Past 3 years)
RReeccoorrdd CCuumm DDiivv DDiivviiddeenndd PPeerr uunniitt ((`̀)) FFoorr DDaattee NNAAVV ((`̀)) IInnddiivviidduuaallss && HHUUFF OOtthheerrss
Dividend Option
Dividend Option
Dividend Option
Dividend Option
Feb 17, 11 25.562 2.00 2.00Feb 16, 12 19.647 2.00 2.00Feb 14, 13 17.613 2.00 2.00
RReeccoorrdd CCuumm DDiivv DDiivviiddeenndd PPeerr uunniitt ((`̀)) FFoorr DDaattee NNAAVV ((`̀)) IInnddiivviidduuaallss && HHUUFF OOtthheerrss
HDFC Core & Satellite Fund ((Past 3 years))
RReeccoorrdd CCuumm DDiivv DDiivviiddeenndd PPeerr uunniitt ((`̀)) FFoorr DDaattee NNAAVV ((`̀)) IInnddiivviidduuaallss && HHUUFF OOtthheerrss
DDiirreecctt PPllaannFeb 14, 13 17.602 2.00 2.00
Dividend Option
Feb 10, 11 15.046 1.50 1.50Feb 09, 12 13.912 1.50 1.50Feb 07, 13 12.762 1.50 1.50
RReeccoorrdd CCuumm DDiivv DDiivviiddeenndd PPeerr uunniitt ((`̀)) FFoorr DDaattee NNAAVV ((`̀)) IInnddiivviidduuaallss && HHUUFF OOtthheerrss
HDFC Premier Multi-Cap Fund ((Past 3 years))
RReeccoorrdd CCuumm DDiivv DDiivviiddeenndd PPeerr uunniitt ((`̀)) FFoorr DDaattee NNAAVV ((`̀)) IInnddiivviidduuaallss && HHUUFF OOtthheerrss
DDiirreecctt PPllaannFeb 07, 13 12.769 1.50 1.50
Dividend Option
Dividend Option
Dividend Option
(Past 3 years)
Feb 10, 11 37.085 4.00 4.00Feb 09, 12 34.468 4.00 4.00Feb 07, 13 34.167 4.00 4.00
DDiirreecctt PPllaannFeb 07, 13 34.186 4.00 4.00
RReeccoorrdd CCuumm DDiivv DDiivviiddeenndd PPeerr uunniitt ((`̀)) FFoorr DDaattee NNAAVV ((`̀)) IInnddiivviidduuaallss && HHUUFF OOtthheerrss
HDFC Long Term Advantage Fund (Past 3 years)
(An open-ended equity linked savings scheme with a lock-in period of 3 years)
RReeccoorrdd CCuumm DDiivv DDiivviiddeenndd PPeerr uunniitt ((`̀)) FFoorr DDaattee NNAAVV ((`̀)) IInnddiivviidduuaallss && HHUUFF OOtthheerrss
Dividend Option
Mar 03, 11 62.686 6.00 6.00Mar 01, 12 56.738 6.00 6.00Mar 14, 13 53.602 6.00 6.00
DDiirreecctt PPllaannMar 14, 13 53.675 6.00 6.00
RReeccoorrdd CCuumm DDiivv DDiivviiddeenndd PPeerr uunniitt ((`̀)) FFoorr DDaattee NNAAVV ((`̀)) IInnddiivviidduuaallss && HHUUFF OOtthheerrss
RReeccoorrdd CCuumm DDiivv DDiivviiddeenndd PPeerr uunniitt ((`̀)) FFoorr DDaattee NNAAVV ((`̀)) IInnddiivviidduuaallss && HHUUFF OOtthheerrss
HDFC TaxSaver (Past 3 years)
(An open-ended equity linked savings scheme with a lock-in period of 3 years)Dividend Option
WWhhoolleessaallee PPllaannJun 25, 13 10.471 0.191 0.191
Sep 25, 13 10.466 0.187 0.187Dec 26, 13 10.522 0.243 0.243
RReeccoorrdd CCuumm DDiivv DDiivviiddeenndd PPeerr uunniitt ((`̀)) FFoorr DDaattee NNAAVV ((`̀)) IInnddiivviidduuaallss && HHUUFF OOtthheerrss
RReeccoorrdd CCuumm DDiivv DDiivviiddeenndd PPeerr uunniitt ((`̀)) FFoorr DDaattee NNAAVV ((`̀)) IInnddiivviidduuaallss && HHUUFF OOtthheerrss
Quarterly (Dividend Option) (Past 3 quarters)
HDFC Arbitrage Fund
Dividend History ^
Mar 22, 11 13.017 1.00 1.00Mar 23, 12 12.024 1.00 1.00Mar 14, 13 11.7670 1.00 1.00
DDiirreecctt PPllaannMar 14, 13 11.7780 1.00 1.00
RReeccoorrdd CCuumm DDiivv DDiivviiddeenndd PPeerr uunniitt ((`̀)) FFoorr DDaattee NNAAVV ((`̀)) IInnddiivviidduuaallss && HHUUFF OOtthheerrss
RReeccoorrdd CCuumm DDiivv DDiivviiddeenndd PPeerr uunniitt ((`̀)) FFoorr DDaattee NNAAVV ((`̀)) IInnddiivviidduuaallss && HHUUFF OOtthheerrss
HDFC Focused Large-Cap Fund (Past 3 years)
Dividend Option
Feb 23, 12 16.058 1.50 1.50Feb 27, 13 15.980 1.15 1.15
DDiirreecctt PPllaannFeb 27, 13 15.994 1.15 1.15
RReeccoorrdd CCuumm DDiivv DDiivviiddeenndd PPeerr uunniitt ((`̀)) FFoorr DDaattee NNAAVV ((`̀)) IInnddiivviidduuaallss && HHUUFF OOtthheerrss
RReeccoorrdd CCuumm DDiivv DDiivviiddeenndd PPeerr uunniitt ((`̀)) FFoorr DDaattee NNAAVV ((`̀)) IInnddiivviidduuaallss && HHUUFF OOtthheerrss
HDFC Mid-Cap Opportunities Fund (Past 3 years)Dividend Option
^̂ PPaasstt ppeerrffoorrmmaannccee mmaayy oorr mmaayy nnoott bbee ssuussttaaiinneedd iinn tthhee ffuuttuurree.. All dividends are on face value of `10 per Unit. After payment of the dividend, the per Unit NAV fallsto the extent of the payout and statutory levy, if any.
50 January 2014 Intouchmutually

^̂ PPaasstt ppeerrffoorrmmaannccee mmaayy oorr mmaayy nnoott bbee ssuussttaaiinneedd iinn tthhee ffuuttuurree.. All dividends are on face value of `̀ 10 per Unit. After payment of the dividend, the per Unit NAV fallsto the extent of the payout and statutory levy, if any.* Please log on to www.hdfcfund.com for Record Date-wise listing of dividends declared
Monthly Dividend Option(Past 3 months)
RReeccoorrdd CCuumm DDiivv DDiivviiddeenndd PPeerr uunniitt ((`̀)) FFoorr DDaattee NNAAVV ((`̀)) IInnddiivviidduuaallss && HHUUFF OOtthheerrss
Nov 25, 13 11.1062 0.0600 0.0574Dec 26, 13 11.2385 0.0600 0.0574Jan 27, 14 11.1286 0.0600 0.0574
DDiirreecctt PPllaann Nov 25, 13 11.1381 0.0600 0.0574Dec 26, 13 11.2739 0.0600 0.0574Jan 27, 14 11.1668 0.0600 0.0574
Quarterly Dividend Option(Past 3 quarters)
RReeccoorrdd CCuumm DDiivv DDiivviiddeenndd PPeerr uunniitt ((`̀)) FFoorr DDaattee NNAAVV ((`̀)) IInnddiivviidduuaallss && HHUUFF OOtthheerrss
Jun 25, 13 11.6234 0.1800 0.1724Sep 25, 13 11.2906 0.1800 0.1724Dec 26, 13 11.6711 0.1800 0.1724
DDiirreecctt PPllaann Jun 25, 13 11.6424 0.1800 0.1724Sep 25, 13 11.3170 0.1800 0.1724Dec 26, 13 11.7079 0.1800 0.1724
HDFC High Interest Fund - Dynamic Plan
Jun 25, 13 11.8982 0.2500 0.2394Sep 25, 13 11.1612 0.1000 0.0958Dec 26, 13 11.2832 0.1500 0.1437
DDiirreecctt PPllaannJun 25, 13 11.9316 0.2500 0.2394Sep 25, 13 11.2124 0.1000 0.0958Dec 26, 13 11.3628 0.1500 0.1437
Mar 26, 12 11.4072 0.3500 0.3000Sep 25, 12 11.5985 0.4500 0.3857Mar 25, 13 11.6533 0.5000 0.4286Sep 25, 13 11.1219 0.2704 0.2589
DDiirreecctt PPllaannMar 25, 13 11.6687 0.5000 0.4286Sep 25, 13 11.1749 0.0787 0.0753
RReeccoorrdd CCuumm DDiivv DDiivviiddeenndd PPeerr uunniitt ((`̀)) FFoorr DDaattee NNAAVV ((`̀)) IInnddiivviidduuaallss && HHUUFF OOtthheerrss
RReeccoorrdd CCuumm DDiivv DDiivviiddeenndd PPeerr uunniitt ((`̀)) FFoorr DDaattee NNAAVV ((`̀)) IInnddiivviidduuaallss && HHUUFF OOtthheerrss
Quarterly (Dividend Option)(Past 3 quarters)
Half-yearly (Dividend Option)(Past 2 years)
Yearly (Dividend Option) (Past 3 years)
Jun 25, 13 11.5968 0.2500 0.2394Sep 25, 13 10.6093 0.1000 0.0958Dec 26, 13 10.7285 0.1500 0.1437
DDiirreecctt PPllaannJun 25, 13 11.6325 0.2500 0.2394Sep 25, 13 10.6631 0.1000 0.0958Dec 26, 13 10.8060 0.1500 0.1437
RReeccoorrdd DDaattee CCuumm DDiivviiddeenndd NNAAVV ((`̀)) DDiivviiddeenndd PPeerr uunniitt ((`̀)) FFoorr IInnddiivviidduuaallss && HHUUFF OOtthheerrss
Dividend Option (Past 3 quarters)
Mar 25, 11 12.0365 0.4500 0.4194Mar 26, 12 12.3397 0.6000 0.5143Mar 25, 13 12.9081 0.9500 0.8142
DDiirreecctt PPllaannMar 25, 13 12.9251 0.9500 0.8142
RReeccoorrdd DDaattee CCuumm DDiivviiddeenndd NNAAVV ((`̀)) DDiivviiddeenndd PPeerr uunniitt ((`̀)) FFoorr IInnddiivviidduuaallss && HHUUFF OOtthheerrss
HDFC Income Fund
Short Term Plan (Dividend Option)
Dividend History ^
HDFC MF Monthly Income Plan (MIP)(An open-ended income scheme. Monthly income is not assured and is subject to availability of distributable surplus)
Long Term Plan (Dividend Option)
Monthly Dividend Option(Past 3 months)
RReeccoorrdd CCuumm DDiivv DDiivviiddeenndd PPeerr uunniitt ((`̀)) FFoorr DDaattee NNAAVV ((`̀)) IInnddiivviidduuaallss && HHUUFF OOtthheerrss
Nov 25, 13 12.5937 0.0700 0.0670Dec 26, 13 12.7637 0.0700 0.0670Jan 27, 14 11.6277 0.0700 0.0670
DDiirreecctt PPllaannNov 25, 13 12.6425 0.0700 0.0670Dec 26, 13 12.8179 0.0700 0.0670Jan 27, 14 12.6863 0.0700 0.0670
Quarterly Dividend Option(Past 3 quarters)
RReeccoorrdd CCuumm DDiivv DDiivviiddeenndd PPeerr uunniitt ((`̀)) FFoorr DDaattee NNAAVV ((`̀)) IInnddiivviidduuaallss && HHUUFF OOtthheerrss
Jun 25, 13 13.4804 0.2100 0.2011Sep 25, 13 12.7406 0.2100 0.2011Dec 26, 13 13.2923 0.2100 0.2011
DDiirreecctt PPllaann Jun 25, 13 13.5086 0.2100 0.2011Sep 25, 13 12.7810 0.2100 0.2011Dec 26, 13 13.3492 0.2100 0.2011
HDFC Multiple Yield Fund (Past 3 years)
Feb 17, 11 11.3818 0.7500 0.6990Feb 17, 12 12.8281 0.7500 0.6428Feb 14, 13 11.6548 0.7500 0.6428
DDiirreecctt PPllaannFeb 14, 13 11.6602 0.7500 0.6428
RReeccoorrdd CCuumm DDiivv DDiivviiddeenndd PPeerr uunniitt ((`̀)) FFoorr DDaattee NNAAVV ((`̀)) IInnddiivviidduuaallss && HHUUFF OOtthheerrss
RReeccoorrdd CCuumm DDiivv DDiivviiddeenndd PPeerr uunniitt ((`̀)) FFoorr DDaattee NNAAVV ((`̀)) IInnddiivviidduuaallss && HHUUFF OOtthheerrss
(Dividend Option)
HDFC Multiple Yield Fund - Plan 2005 (Past 3 years)
Feb 17, 11 11.4214 0.7500 0.6990Feb 17, 12 11.6454 0.7500 0.6428Feb 14, 13 11.5963 0.7500 0.6428
DDiirreecctt PPllaannFeb 14, 13 11.6048 0.7500 0.6428
RReeccoorrdd CCuumm DDiivv DDiivviiddeenndd PPeerr uunniitt ((`̀)) FFoorr DDaattee NNAAVV ((`̀)) IInnddiivviidduuaallss && HHUUFF OOtthheerrss
RReeccoorrdd CCuumm DDiivv DDiivviiddeenndd PPeerr uunniitt ((`̀)) FFoorr DDaattee NNAAVV ((`̀)) IInnddiivviidduuaallss && HHUUFF OOtthheerrss
(Dividend Option)
HDFC Short Term PlanDDiivviiddeenndd RReeiinnvveessttmmeenntt OOppttiioonn (Past 3 months)
RReeccoorrdd CCuumm DDiivv DDiivviiddeenndd PPeerr uunniitt ((`̀)) FFoorr DDaattee NNAAVV ((`̀)) IInnddiivviidduuaallss && HHUUFF OOtthheerrss
RReeccoorrdd CCuumm DDiivv DDiivviiddeenndd PPeerr uunniitt ((`̀)) FFoorr DDaattee NNAAVV ((`̀)) IInnddiivviidduuaallss && HHUUFF OOtthheerrss
Nov 25, 13 10.3607 0.0339 0.0325Dec 26, 13 10.4253 0.0842 0.0807Jan 27, 14 10.4068 0.0698 0.0669
Direct PlanNov 25, 13 10.3629 0.0356 0.0341Dec 26, 13 10.4276 0.0860 0.0824Jan 27, 14 10.4090 0.0715 0.0685
Nov 11, 13 10.0940 0.0129 0.0123
Nov 25, 13 10.1129 0.0276 0.0264
Dec 10, 13 10.1409 0.0494 0.0473
Dec 26, 13 10.1206 0.0336 0.0322
Jan 10, 14 10.1155 0.0296 0.0284
Jan 27, 14 10.1236 0.0359 0.0344
DDiirreecctt PPllaann
Nov 11, 13 10.0945 0.0132 0.0127
Nov 25, 13 10.1133 0.0279 0.0267
Dec 10, 13 10.1413 0.0497 0.0476
Dec 26, 13 10.1211 0.0340 0.0325
Jan 10, 14 10.1157 0.0298 0.0285
Jan 27, 14 10.1241 0.0363 0.0348
RReeccoorrdd CCuumm DDiivv DDiivviiddeenndd PPeerr uunniitt ((`̀)) FFoorr DDaattee NNAAVV ((`̀)) IInnddiivviidduuaallss && HHUUFF OOtthheerrss
RReeccoorrdd CCuumm DDiivv DDiivviiddeenndd PPeerr uunniitt ((`̀)) FFoorr DDaattee NNAAVV ((`̀)) IInnddiivviidduuaallss && HHUUFF OOtthheerrss
DDiivviiddeenndd OOppttiioonn - FFoorrttnniigghhttllyy (Past 3 months)HDFC Short Term Opportunities Fund
Dec 26, 13 10.2961 0.2306 0.2209
RReeccoorrdd CCuumm DDiivv DDiivviiddeenndd PPeerr uunniitt ((`̀)) FFoorr DDaattee NNAAVV ((`̀)) IInnddiivviidduuaallss && HHUUFF OOtthheerrss
RReeccoorrdd CCuumm DDiivv DDiivviiddeenndd PPeerr uunniitt ((`̀)) FFoorr DDaattee NNAAVV ((`̀)) IInnddiivviidduuaallss && HHUUFF OOtthheerrss
Dividend Reinvestment Option (Past 3 months)
HDFC Medium Term Opportunities Fund
Dec 10, 13 10.6511 0.0571 0.0547Dec 26, 13 10.6123 0.0269 0.0257Jan 10, 14 10.6253 0.0370 0.0355Jan 27, 14 10.6295 0.0403 0.0386
DDiirreecctt PPllaannDec 10, 13 10.6533 0.0588 0.0563Dec 26, 13 10.6147 0.0288 0.0275Jan 10, 14 10.6275 0.0387 0.0371Jan 27, 14 10.6320 0.0421 0.0404
RReeccoorrdd CCuumm DDiivv DDiivviiddeenndd PPeerr uunniitt ((`̀)) FFoorr DDaattee NNAAVV ((`̀)) IInnddiivviidduuaallss && HHUUFF OOtthheerrss
RReeccoorrdd CCuumm DDiivv DDiivviiddeenndd PPeerr uunniitt ((`̀)) FFoorr DDaattee NNAAVV ((`̀)) IInnddiivviidduuaallss && HHUUFF OOtthheerrss
DDiivviiddeenndd OOppttiioonn - FFoorrttnniigghhttllyy (Past 2 months)HDFC High Interest Fund - Short Term Plan
January 2014 51Intouchmutually
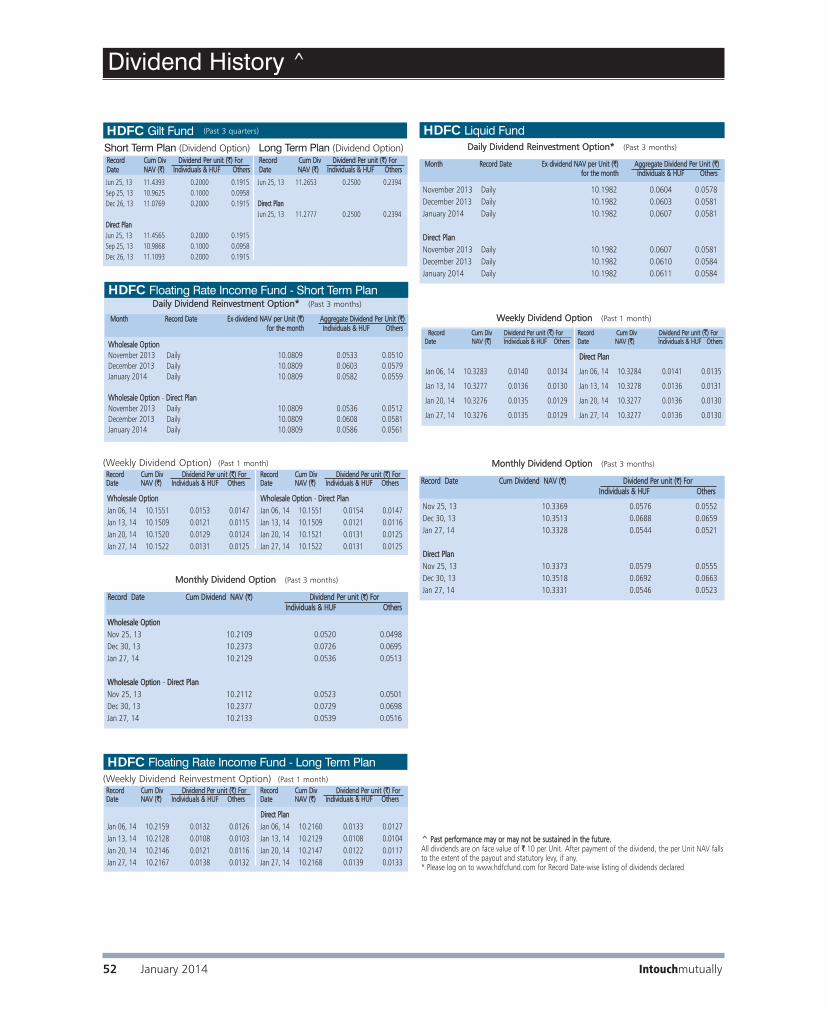
^̂ PPaasstt ppeerrffoorrmmaannccee mmaayy oorr mmaayy nnoott bbee ssuussttaaiinneedd iinn tthhee ffuuttuurree.. All dividends are on face value of `̀ 10 per Unit. After payment of the dividend, the per Unit NAV fallsto the extent of the payout and statutory levy, if any.* Please log on to www.hdfcfund.com for Record Date-wise listing of dividends declared
Dividend History ^
WWeeeekkllyy DDiivviiddeenndd OOppttiioonn (Past 1 month)
RReeccoorrdd CCuumm DDiivv DDiivviiddeenndd PPeerr uunniitt ((`̀)) FFoorr RReeccoorrdd CCuumm DDiivv DDiivviiddeenndd PPeerr uunniitt ((`̀)) FFoorr DDaattee NNAAVV ((`̀)) IInnddiivviidduuaallss && HHUUFF OOtthheerrss DDaattee NNAAVV ((`̀)) IInnddiivviidduuaallss && HHUUFF OOtthheerrss
Jan 06, 14 10.3283 0.0140 0.0134
Jan 13, 14 10.3277 0.0136 0.0130
Jan 20, 14 10.3276 0.0135 0.0129
Jan 27, 14 10.3276 0.0135 0.0129
DDiirreecctt PPllaann
Jan 06, 14 10.3284 0.0141 0.0135
Jan 13, 14 10.3278 0.0136 0.0131
Jan 20, 14 10.3277 0.0136 0.0130
Jan 27, 14 10.3277 0.0136 0.0130
Nov 25, 13 10.3369 0.0576 0.0552Dec 30, 13 10.3513 0.0688 0.0659Jan 27, 14 10.3328 0.0544 0.0521
DDiirreecctt PPllaannNov 25, 13 10.3373 0.0579 0.0555Dec 30, 13 10.3518 0.0692 0.0663Jan 27, 14 10.3331 0.0546 0.0523
RReeccoorrdd DDaattee CCuumm DDiivviiddeenndd NNAAVV ((`̀)) DDiivviiddeenndd PPeerr uunniitt ((`̀)) FFoorr IInnddiivviidduuaallss && HHUUFF OOtthheerrss
MMoonntthhllyy DDiivviiddeenndd OOppttiioonn (Past 3 months)
November 2013 Daily 10.1982 0.0604 0.0578December 2013 Daily 10.1982 0.0603 0.0581January 2014 Daily 10.1982 0.0607 0.0581
DDiirreecctt PPllaannNovember 2013 Daily 10.1982 0.0607 0.0581December 2013 Daily 10.1982 0.0610 0.0584January 2014 Daily 10.1982 0.0611 0.0584
MMoonntthh RReeccoorrdd DDaattee EExx-ddiivviiddeenndd NNAAVV ppeerr UUnniitt ((`̀)) AAggggrreeggaattee DDiivviiddeenndd PPeerr UUnniitt ((`̀)) ffoorr tthhee mmoonntthh IInnddiivviidduuaallss && HHUUFF OOtthheerrss
DDaaiillyy DDiivviiddeenndd RReeiinnvveessttmmeenntt OOppttiioonn** (Past 3 months)
HDFC Liquid Fund
WWhhoolleessaallee OOppttiioonnJan 06, 14 10.1551 0.0153 0.0147Jan 13, 14 10.1509 0.0121 0.0115Jan 20, 14 10.1520 0.0129 0.0124Jan 27, 14 10.1522 0.0131 0.0125
WWhhoolleessaallee OOppttiioonn - DDiirreecctt PPllaannJan 06, 14 10.1551 0.0154 0.0147Jan 13, 14 10.1509 0.0121 0.0116Jan 20, 14 10.1521 0.0131 0.0125Jan 27, 14 10.1522 0.0131 0.0125
RReeccoorrdd CCuumm DDiivv DDiivviiddeenndd PPeerr uunniitt ((`̀)) FFoorr DDaattee NNAAVV ((`̀)) IInnddiivviidduuaallss && HHUUFF OOtthheerrss
RReeccoorrdd CCuumm DDiivv DDiivviiddeenndd PPeerr uunniitt ((`̀)) FFoorr DDaattee NNAAVV ((`̀)) IInnddiivviidduuaallss && HHUUFF OOtthheerrss
(Weekly Dividend Option) (Past 1 month)
Jan 06, 14 10.2159 0.0132 0.0126Jan 13, 14 10.2128 0.0108 0.0103Jan 20, 14 10.2146 0.0121 0.0116Jan 27, 14 10.2167 0.0138 0.0132
DDiirreecctt PPllaannJan 06, 14 10.2160 0.0133 0.0127Jan 13, 14 10.2129 0.0108 0.0104Jan 20, 14 10.2147 0.0122 0.0117Jan 27, 14 10.2168 0.0139 0.0133
RReeccoorrdd CCuumm DDiivv DDiivviiddeenndd PPeerr uunniitt ((`̀)) FFoorr DDaattee NNAAVV ((`̀)) IInnddiivviidduuaallss && HHUUFF OOtthheerrss
RReeccoorrdd CCuumm DDiivv DDiivviiddeenndd PPeerr uunniitt ((`̀)) FFoorr DDaattee NNAAVV ((`̀)) IInnddiivviidduuaallss && HHUUFF OOtthheerrss
(Weekly Dividend Reinvestment Option) (Past 1 month)
HDFC Floating Rate Income Fund - Long Term Plan
WWhhoolleessaallee OOppttiioonnNov 25, 13 10.2109 0.0520 0.0498Dec 30, 13 10.2373 0.0726 0.0695Jan 27, 14 10.2129 0.0536 0.0513
WWhhoolleessaallee OOppttiioonn - DDiirreecctt PPllaannNov 25, 13 10.2112 0.0523 0.0501Dec 30, 13 10.2377 0.0729 0.0698Jan 27, 14 10.2133 0.0539 0.0516
RReeccoorrdd DDaattee CCuumm DDiivviiddeenndd NNAAVV ((`̀)) DDiivviiddeenndd PPeerr uunniitt ((`̀)) FFoorr IInnddiivviidduuaallss && HHUUFF OOtthheerrss
MMoonntthhllyy DDiivviiddeenndd OOppttiioonn (Past 3 months)
WWhhoolleessaallee OOppttiioonnNovember 2013 Daily 10.0809 0.0533 0.0510December 2013 Daily 10.0809 0.0603 0.0579January 2014 Daily 10.0809 0.0582 0.0559
WWhhoolleessaallee OOppttiioonn - DDiirreecctt PPllaannNovember 2013 Daily 10.0809 0.0536 0.0512December 2013 Daily 10.0809 0.0608 0.0581January 2014 Daily 10.0809 0.0586 0.0561
MMoonntthh RReeccoorrdd DDaattee EExx-ddiivviiddeenndd NNAAVV ppeerr UUnniitt ((`̀)) AAggggrreeggaattee DDiivviiddeenndd PPeerr UUnniitt ((`̀)) ffoorr tthhee mmoonntthh IInnddiivviidduuaallss && HHUUFF OOtthheerrss
DDaaiillyy DDiivviiddeenndd RReeiinnvveessttmmeenntt OOppttiioonn** (Past 3 months)
HDFC Floating Rate Income Fund - Short Term Plan
HDFC Gilt Fund (Past 3 quarters)
Jun 25, 13 11.4393 0.2000 0.1915Sep 25, 13 10.9625 0.1000 0.0958Dec 26, 13 11.0769 0.2000 0.1915
Direct PlanJun 25, 13 11.4565 0.2000 0.1915Sep 25, 13 10.9868 0.1000 0.0958Dec 26, 13 11.1093 0.2000 0.1915
Jun 25, 13 11.2653 0.2500 0.2394
Direct PlanJun 25, 13 11.2777 0.2500 0.2394
RReeccoorrdd CCuumm DDiivv DDiivviiddeenndd PPeerr uunniitt ((`̀)) FFoorr DDaattee NNAAVV ((`̀)) IInnddiivviidduuaallss && HHUUFF OOtthheerrss
RReeccoorrdd CCuumm DDiivv DDiivviiddeenndd PPeerr uunniitt ((`̀)) FFoorr DDaattee NNAAVV ((`̀)) IInnddiivviidduuaallss && HHUUFF OOtthheerrss
Short Term Plan (Dividend Option) Long Term Plan (Dividend Option)
52 January 2014 Intouchmutually
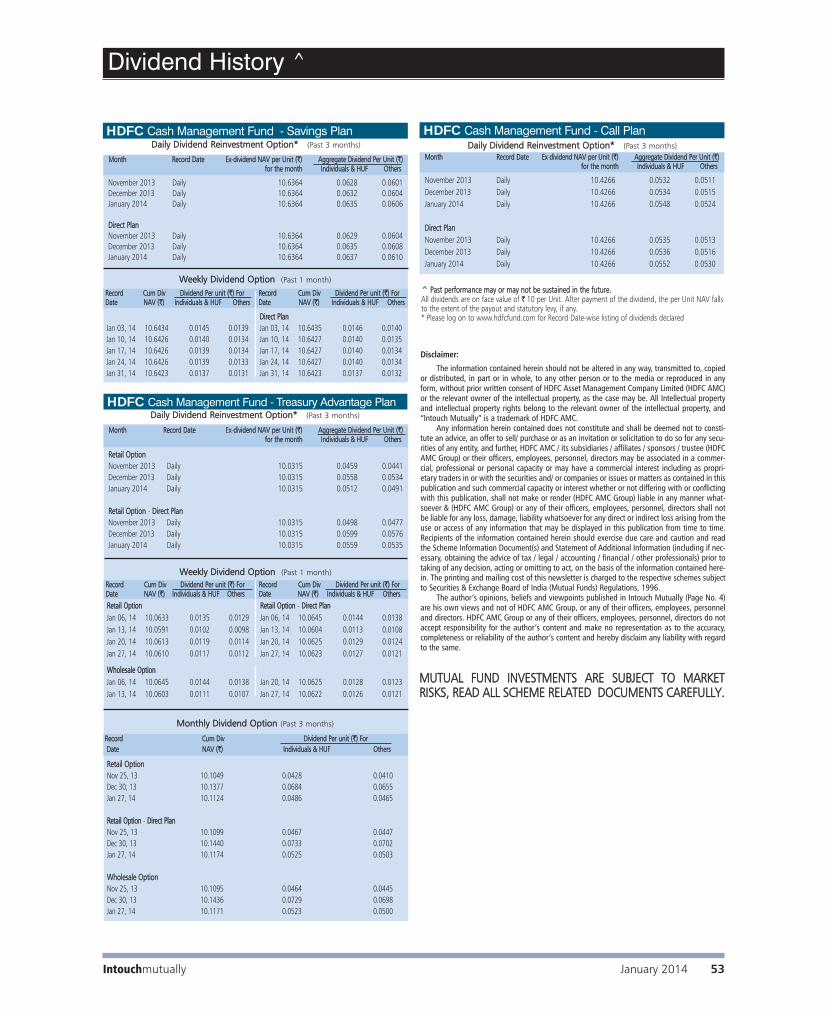
Disclaimer:
The information contained herein should not be altered in any way, transmitted to, copiedor distributed, in part or in whole, to any other person or to the media or reproduced in anyform, without prior written consent of HDFC Asset Management Company Limited (HDFC AMC)or the relevant owner of the intellectual property, as the case may be. All Intellectual propertyand intellectual property rights belong to the relevant owner of the intellectual property, and“Intouch Mutually” is a trademark of HDFC AMC.
Any information herein contained does not constitute and shall be deemed not to consti-tute an advice, an offer to sell/ purchase or as an invitation or solicitation to do so for any secu-rities of any entity, and further, HDFC AMC / its subsidiaries / affiliates / sponsors / trustee (HDFCAMC Group) or their officers, employees, personnel, directors may be associated in a commer-cial, professional or personal capacity or may have a commercial interest including as propri-etary traders in or with the securities and/ or companies or issues or matters as contained in thispublication and such commercial capacity or interest whether or not differing with or conflictingwith this publication, shall not make or render (HDFC AMC Group) liable in any manner what-soever & (HDFC AMC Group) or any of their officers, employees, personnel, directors shall notbe liable for any loss, damage, liability whatsoever for any direct or indirect loss arising from theuse or access of any information that may be displayed in this publication from time to time.Recipients of the information contained herein should exercise due care and caution and readthe Scheme Information Document(s) and Statement of Additional Information (including if nec-essary, obtaining the advice of tax / legal / accounting / financial / other professionals) prior totaking of any decision, acting or omitting to act, on the basis of the information contained here-in. The printing and mailing cost of this newsletter is charged to the respective schemes subjectto Securities & Exchange Board of India (Mutual Funds) Regulations, 1996.
The author’s opinions, beliefs and viewpoints published in Intouch Mutually (Page No. 4)are his own views and not of HDFC AMC Group, or any of their officers, employees, personneland directors. HDFC AMC Group or any of their officers, employees, personnel, directors do notaccept responsibility for the author’s content and make no representation as to the accuracy,completeness or reliability of the author’s content and hereby disclaim any liability with regardto the same.
MUTUAL FUND INVESTMENTS ARE SUBJECT TO MARKETRISKS, READ ALL SCHEME RELATED DOCUMENTS CAREFULLY.
HDFC Cash Management Fund - Treasury Advantage Plan
RReettaaiill OOppttiioonnJan 06, 14 10.0633 0.0135 0.0129Jan 13, 14 10.0591 0.0102 0.0098Jan 20, 14 10.0613 0.0119 0.0114Jan 27, 14 10.0610 0.0117 0.0112
RReettaaiill OOppttiioonn - DDiirreecctt PPllaannJan 06, 14 10.0645 0.0144 0.0138Jan 13, 14 10.0604 0.0113 0.0108Jan 20, 14 10.0625 0.0129 0.0124Jan 27, 14 10.0623 0.0127 0.0121
WWhhoolleessaallee OOppttiioonnJan 06, 14 10.0645 0.0144 0.0138Jan 13, 14 10.0603 0.0111 0.0107
Jan 20, 14 10.0625 0.0128 0.0123Jan 27, 14 10.0622 0.0126 0.0121
RReeccoorrdd CCuumm DDiivv DDiivviiddeenndd PPeerr uunniitt ((`̀)) FFoorr DDaattee NNAAVV ((`̀)) IInnddiivviidduuaallss && HHUUFF OOtthheerrss
RReeccoorrdd CCuumm DDiivv DDiivviiddeenndd PPeerr uunniitt ((`̀)) FFoorr DDaattee NNAAVV ((`̀)) IInnddiivviidduuaallss && HHUUFF OOtthheerrss
WWeeeekkllyy DDiivviiddeenndd OOppttiioonn (Past 1 month)
MMoonntthhllyy DDiivviiddeenndd OOppttiioonn (Past 3 months)
DDaaiillyy DDiivviiddeenndd RReeiinnvveessttmmeenntt OOppttiioonn** (Past 3 months)
HDFC Cash Management Fund - Call Plan
MMoonntthh RReeccoorrdd DDaattee EExx-ddiivviiddeenndd NNAAVV ppeerr UUnniitt ((`̀)) AAggggrreeggaattee DDiivviiddeenndd PPeerr UUnniitt ((`̀)) ffoorr tthhee mmoonntthh IInnddiivviidduuaallss && HHUUFF OOtthheerrss
RReettaaiill OOppttiioonnNovember 2013 Daily 10.0315 0.0459 0.0441December 2013 Daily 10.0315 0.0558 0.0534January 2014 Daily 10.0315 0.0512 0.0491
RReettaaiill OOppttiioonn - DDiirreecctt PPllaannNovember 2013 Daily 10.0315 0.0498 0.0477December 2013 Daily 10.0315 0.0599 0.0576January 2014 Daily 10.0315 0.0559 0.0535
November 2013 Daily 10.4266 0.0532 0.0511December 2013 Daily 10.4266 0.0534 0.0515January 2014 Daily 10.4266 0.0548 0.0524
DDiirreecctt PPllaannNovember 2013 Daily 10.4266 0.0535 0.0513December 2013 Daily 10.4266 0.0536 0.0516January 2014 Daily 10.4266 0.0552 0.0530
MMoonntthh RReeccoorrdd DDaattee EExx-ddiivviiddeenndd NNAAVV ppeerr UUnniitt ((`̀)) AAggggrreeggaattee DDiivviiddeenndd PPeerr UUnniitt ((`̀)) ffoorr tthhee mmoonntthh IInnddiivviidduuaallss && HHUUFF OOtthheerrss
RReeccoorrdd CCuumm DDiivv DDiivviiddeenndd PPeerr uunniitt ((`̀)) FFoorr DDaattee NNAAVV ((`̀)) IInnddiivviidduuaallss && HHUUFF OOtthheerrss
RReettaaiill OOppttiioonnNov 25, 13 10.1049 0.0428 0.0410Dec 30, 13 10.1377 0.0684 0.0655Jan 27, 14 10.1124 0.0486 0.0465
RReettaaiill OOppttiioonn - DDiirreecctt PPllaannNov 25, 13 10.1099 0.0467 0.0447Dec 30, 13 10.1440 0.0733 0.0702Jan 27, 14 10.1174 0.0525 0.0503
WWhhoolleessaallee OOppttiioonnNov 25, 13 10.1095 0.0464 0.0445Dec 30, 13 10.1436 0.0729 0.0698Jan 27, 14 10.1171 0.0523 0.0500
DDaaiillyy DDiivviiddeenndd RReeiinnvveessttmmeenntt OOppttiioonn** (Past 3 months)
HDFC Cash Management Fund - Savings PlanDDaaiillyy DDiivviiddeenndd RReeiinnvveessttmmeenntt OOppttiioonn** (Past 3 months)
MMoonntthh RReeccoorrdd DDaattee EExx-ddiivviiddeenndd NNAAVV ppeerr UUnniitt ((`̀)) AAggggrreeggaattee DDiivviiddeenndd PPeerr UUnniitt ((`̀)) ffoorr tthhee mmoonntthh IInnddiivviidduuaallss && HHUUFF OOtthheerrss
WWeeeekkllyy DDiivviiddeenndd OOppttiioonn (Past 1 month)
Jan 03, 14 10.6434 0.0145 0.0139Jan 10, 14 10.6426 0.0140 0.0134Jan 17, 14 10.6426 0.0139 0.0134Jan 24, 14 10.6426 0.0139 0.0133Jan 31, 14 10.6423 0.0137 0.0131
DDiirreecctt PPllaannJan 03, 14 10.6435 0.0146 0.0140Jan 10, 14 10.6427 0.0140 0.0135Jan 17, 14 10.6427 0.0140 0.0134Jan 24, 14 10.6427 0.0140 0.0134Jan 31, 14 10.6423 0.0137 0.0132
RReeccoorrdd CCuumm DDiivv DDiivviiddeenndd PPeerr uunniitt ((`̀)) FFoorr DDaattee NNAAVV ((`̀)) IInnddiivviidduuaallss && HHUUFF OOtthheerrss
RReeccoorrdd CCuumm DDiivv DDiivviiddeenndd PPeerr uunniitt ((`̀)) FFoorr DDaattee NNAAVV ((`̀)) IInnddiivviidduuaallss && HHUUFF OOtthheerrss
November 2013 Daily 10.6364 0.0628 0.0601December 2013 Daily 10.6364 0.0632 0.0604January 2014 Daily 10.6364 0.0635 0.0606
DDiirreecctt PPllaannNovember 2013 Daily 10.6364 0.0629 0.0604December 2013 Daily 10.6364 0.0635 0.0608January 2014 Daily 10.6364 0.0637 0.0610
Dividend History ^
^̂ PPaasstt ppeerrffoorrmmaannccee mmaayy oorr mmaayy nnoott bbee ssuussttaaiinneedd iinn tthhee ffuuttuurree.. All dividends are on face value of `̀ 10 per Unit. After payment of the dividend, the per Unit NAV fallsto the extent of the payout and statutory levy, if any.* Please log on to www.hdfcfund.com for Record Date-wise listing of dividends declared
January 2014 53Intouchmutually

INVESTOR SERVICE CENTRES (ISCs)AANNDDHHRRAA PPRRAADDEESSHHHDFC AMC Ltd., 6-3-883/7, IInd Floor, Saphire Square, Somajiguda, HHyyddeerraabbaadd - 500 282.Tel.: (040) 23417401 / 02 / 03 / 04 / 05, Fax: (040) 23417407. HDFC AMC Ltd., 18-2-299/B, 1st Floor, Leela MahalCircle, Tirumala Bypass Road, TTiirruuppaattii - 517 507. Tel: (0877) 2222 871 / 872 / 873 / 874, Fax: (0877) 2222689. HDFC AMC Ltd., 2nd Floor, Centurion Bank Complex,Near Benz Circle, M. G. Road, VViijjaayyaawwaaddaa - 520 010. Tel. No: (0866) 3988029. HDFC AMC Ltd., First Floor, Saigopal Arcade, WaltairMain Road, Siripuram, VViissaakkhhaappaattnnaamm - 530 003. Tel: (0891) 2769636, 6450306 / 9685 / 7584, Fax. No.: (0891) 2738728. HDFC AMC Ltd., 2-5-83/84, 1st Floor, MitralaxmiNarayana Arcade, Nakkala Gutta, Hanmakonda,WWaarraannggaall - 506 002. Tel: (0870) 2566 005 / 006/ 007/ 008/ 009, Fax: (0870) 2566010. AASSSSAAMMHDFC AMC Ltd., Premises- 1C, 1st Floor, GanpatiEnclave, G.S.Road, GGuuwwaahhaattii - 781 007. Tel: (0361) 2464759/60. Fax: (0361) 2464758. BBIIHHAARRHDFC AMC Ltd., Ishwari Complex, 1st Floor, Dr. Rajendra Prasad Road, BBhhaaggaallppuurr - 812 002. Tel: (0641) 2300 390, Fax: (0641) 2300391. HDFC AMC Ltd., Ravi Market, 1st Floor, JawaharlalRoad, MMuuzzaaffffaarrppuurr – 842001.Tel: (0621) 2245036/37, Fax: (0621) 2245037. HDFC AMC Ltd., C/o Hera Enclave (Above TATADocomo Office), 1st Floor, New Dak Bunglow Road,PPaattnnaa - 800 001. Tel: (0612) 6457554/6457557/3201439, Telefax: (0612) 2200747. CCHHHHAATTTTIISSGGAARRHHHDFC AMC Ltd., Shop No 1, Ground Floor, Old Sada Office Block, Nehru Nagar East, BBhhiillaaii - 490020. Tel: (0788) 4092948, 4092846, Fax: (0788) 4092901. HDFC AMC Ltd., 2nd Floor, Rama Trade Centre,Opposite Rajiv Plaza, Near Bus stand, BBiillaassppuurr – 495 001. Tel: (07752) 400305/ 06. Fax: (07752) 400307. HDFC AMC Ltd., Ground Floor, Chawla Complex,Devendra Nagar, Sai Nagar Road, Near VanijyaBhawan, Near Indhira Gandhi Square, RRaaiippuurr - 492 001. Tel: (0771) 4020 167 / 168. DDEELLHHIIHDFC AMC Ltd., Ground Floor - 2 & 3 and First Floor,Prakashdeep Building, 7, Tolstoy Marg, ConnaughtPlace, NNeeww DDeellhhii - 110 001. Tel: (011) 6632 4000,Fax: (011) 23351317 /18. HDFC AMC Ltd. Unit Nos. 402, 404, 406, 4th floor, Mahatta Tower, 54 B-1 Block, Community Center , Janakpuri, NNeeww DDeellhhii – 110 058. Fax: (011) 41082131 HDFC AMC Ltd., 134/4 , Bhandari House, Lala Lajpat Rai Marg, Kailash Colony - Main Road,Near Kailash Colony Metro Station, South Delhi, NNeeww DDeellhhii – 110 048. Tel : 011-29244801/02. Fax : 011-29244805.GGOOAAHDFC AMC Ltd., Ground Floor, G3 & G4, Jivottam,Minguel Miranda Road, Off. Abade Faria Road,MMaarrggaaoo - 403 601. Salcete. Tel: (0832) 2737410 / 11.Fax: (0832) 2736477. HDFC AMC Ltd., S1, Second Floor, Above Axis Bank,Edcon Centre, Angod, MMaappuussaa - 403 507, Bardez, Goa. Tel: (0832) 2253 460 / 461, Fax: (0832) 2253465. HDFC AMC Ltd., A-3, First Floor, Krishna Building, Opp. Education Department, Behind SusheelaBuilding, G. P. Road, PPaannaajjii - 403 001. Tel: 0832 - 2425609, 2425610, Fax: 0832 - 2425614. HDFC AMC Ltd., 6, Ground Floor, Pereira Chambers,Padre Jose Vaz Road, VVaassccoo - 403 802, Mormugao. Tel: (0832) 2513 402 / 406, Fax: (0832) 2513448. GGUUJJAARRAATTHDFC AMC Ltd., 2nd Floor, Megha House, BesidesGRUH House, Mithakhali Six Roads, AAhhmmeeddaabbaadd - 380 009. Tel.: 079 – 40220099/00, Fax: 079 - 40050506. HDFC AMC Ltd., Maruti Sharanam, No.117, 1st Floor, Anand-Vidhyanagar Road, Opposite Nandbhumi PartyPlot, AAnnaanndd - 388 001. Tel: (02692) - 398200, Fax: (02692) - 398222.
HDFC AMC Ltd., 3rd Floor, Shreemangalam Complex,Above IDBI Bank, Patel Society Road, Ward No. 1,Kasak Circle, BBhhaarruucchh - 392 012. Tel: (0264) 2227205, Fax: (0264) 2227206. HDFC AMC Ltd., 2nd Floor, Gangotri Plaza, OppositeDaxinamurty School, Waghawadi Road, BBhhaavvnnaaggaarr - 364 001. Tel: (0278) - 3988029, Fax: (0278) - 3984039. HDFC AMC Ltd., 1st Floor, B Wing, Katira Complex,RTO Circle, BBhhuujj - 370 001. Tel: (02832) 223 223, Fax: (02832) 251. 946 HDFC AMC Ltd., 2nd Floor, Keshav Complex, P N Marg, Opposite Dhanvantry, JJaammnnaaggaarr - 361 001.Tel: (0288) - 3988029, Fax: (0288) - 3982426. HDFC AMC Ltd., 1st Floor, Nos. 104 – 105, MaryGold-2 Complex, Opp. Bahhaudin College,College Road, Junagadh - 362001. Tel: (0285) 2670622/23, Fax: (0285) 2670624. HDFC AMC Ltd., 2nd Floor, Rajendra Estate, State Highway, MMeehhssaannaa - 384 002. Tel: (02762) 302000. Fax: (02762) 302020. HDFC AMC Ltd., 1st Floor, Nandini Complex, Above HDFC Bank, Opp. Daboo Hospital, Station Road, Navsari- 396445. Tel: (02637) 252681/82/83, Fax: (02637) 252684. HDFC AMC Ltd., 2nd Floor, Shiv Darshan, Dr. Radha Krishnan Road, 5, Jagnath, Plot Corner,RRaajjkkoott - 360 001. Tel: 0281- 6624881 / 82, Fax: 0281 - 6624883. HDFC AMC Ltd., U1 - U3, Jolly Plaza, Opp. AthwaGate Police Station, Athwa Gate, SSuurraatt - 395 001. Tel: 0261 – 2460082 / 83, Fax: 0261 - 2460091. HDFC AMC Ltd., Upper Ground Floor, Gokulesh, R. C. Dutt Road, VVaaddooddaarraa - 390 007. Tel: 0265 - 6621110 / 20, Fax: 0265 - 6621150. HDFC AMC Ltd., 5-B, 2nd Floor, Sapphire Building,Daulatnagar, Chala-Vapi Road, VVaappii - 396 191. Tel: (0260) 3983900, Fax: (0260) 3983908. HHAARRYYAANNAAHDFC AMC Ltd., 1st Floor, Sudarshan Tower, CrossRoad # 1, Nicholson Road, AAmmbbaallaa CCaanntttt -133 001. Tel: (0171) 2631995/6, Fax: (0171) 2631994. HDFC AMC Ltd., TA - 12A, 15-18, Third Floor, Crown Plaza, Sector 15A, Mathura Road, FFaarriiddaabbaadd - 121 001. Tel: (0124) 2221 338 / 339 /341 / 342 / 343, Fax: (0129) 2221340. HDFC AMC Ltd., Premises 105, 106 & 107, 1st Floor, Vipul Agora Building, MG Road, GGuurrggaaoonn - 122 002. Tel: (0124) 2560 450/ 51, Fax: (0124) 2560455. HDFC AMC Ltd., 1175 B Royal 1, 1st Floor, AdjoiningGurudawara, G.T Road, PPaanniippaatt - 132 103. Tel: (0180) 3985400/ 01, Fax: (0180) 3985403. HHIIMMAACCHHAALL PPRRAADDEESSHHHDFC AMC Ltd., 2nd Floor, Opposite Town Hall, 30,The Mall, SShhiimmllaa – 171 001. Tel: (0177) 2816861. JJAAMMMMUU && KKAASSHHMMIIRRHDFC AMC Ltd., Hall No-102 A/2, South Block, Bahu Plaza, Gandhi Nagar, JJaammmmuu - 180 012. Tel: (0191)-2477911/12/13 / (0191) 2474297/98/99. JJHHAARRKKHHAANNDDHDFC AMC Ltd., Vardhan Complex, 1st Floor, Opp. Woodland Showroom, Bank More, DDhhaannbbaadd - 826 001. Tel: (0326) 3205352, 2300552,Fax: (0326) 2301756. HDFC AMC Ltd., Gayatri Enclave, 2nd Floor, "K Road", Bistupur, JJaammsshheeddppuurr - 831 001. Tel: (0657) 3021203/05, Telefax: (0657) 3021204. HDFC AMC Ltd., Pradhan Towers, 1st Floor, 5, Main Road, RRaanncchhii - 834 001. Tel: (0651) 6003358, 3242077. Fax: (0651) 3988029. KKAARRNNAATTAAKKAAHDFC AMC Ltd., Nitesh Broadway, No. 9/3, 1-A, Ground Floor, M. G. Road, Opposite Trinity Metro Station, BBaannggaalloorree – 560001. Tel: 080-66205300, Fax: 080-41125255. HDFC AMC Ltd., # 493, 1st Floor, 4th Cross, 2nd Main, Sampige Road, Malleshwaram, BBaannggaalloorree - 560 003. HDFC AMC Ltd., Garla Garnet No. 119/A/36, 9th Main, 4th Block, Jayanagar, BBaannggaalloorree – 560011. Tel No: (080) 41460260/61/62, Fax No: (080) 41460263. HDFC AMC Ltd., # 145, 1st Floor, 60 ft Road, 5th Block, Koramangala, BBaannggaalloorree - 560 034. HDFC AMC Ltd., Premises No. 4830 / B, First Floor, Dr. Ambedkar Road, Opp. Civil Medical College, BBeellggaauumm - 590 002. Tel: (0831) 4206 915 / 916 / 918,Fax: (0831) 4206919.
HDFC AMC Ltd., Office No. 39 (Old No - 41), GroundFloor, Behind Maremma Temple, Opposite HDFC Bank,Kappagal Road, BBeellllaarryy – 583103. Tel: 08392-256577. Fax: 08392-256575. HDFC AMC Ltd., 190/3, 1st Floor, S.V.C. Plaza, Opposite Mothi Talkies, Gandhi Circle, DDaavvaannggeerree - 577 002. Tel: (08192) 250 240 / 241 /242, Fax: (08192) 250243. HDFC AMC Ltd., No. 1, First Floor, Revankar Comforts,Vivekanand Road, Court Circle, HHuubbllii - 580 029. Tel: (0836) 4252 294 / 95. Fax: (0836) 4252 290. HDFC AMC Ltd., UG-II, 6 & 7, Upper Ground Floor, Maximus Commercial Complex, Light House Hill Road, Opp. KMC, MMaannggaalloorree - 575 001. Tel. 0824 – 6620667/668, Fax: 0824 – 6620666. HDFC AMC Ltd., No. 2918, CH 51 / 1 B, 1st Floor, Patel Mansion, Kantharaj Urs Road, Saraswathipuram, MMyyssoorree - 570 009. Tel: (0821) 4000 530, Fax: (0821) 4000 535. KKEERRAALLAAHDFC AMC Ltd., 3rd Floor, City Mall, Opposite YMCA, Kannur Road, CCaalliiccuutt - 673 001. Tel: (0495) - 4099222 / 333, 3982310, Fax: (0495) - 3982330. HDFC AMC Ltd., Ground Floor, Cinema cumCommercial Complex, Behind Ravipuram Bus Stop, M. G. Road, KKoocchhii - 682 016. Tel: 0484 - 2357707 /8, 3243058 / 59, Fax: 0484 - 2358462. HDFC AMC Ltd., 14/868, Ground Floor, Sri KrishnaComplex, Coimbatore Road, PPaallgghhaatt - 678 001. Tel: (0491) 2548300/302, 6452188, Fax: (0491) 2548303. HDFC AMC Ltd., 2nd Floor, E-Town Shopping, College Road, East Fort, TThhrriissssuurr - 680 005. Tel: (0487) 2441976. Telefax: (0487) 2422925. HDFC AMC Ltd., 1st Floor, Kaniamparambil Arcade, G S Junction, Shastri Road, KKoottttaayyaamm - 686 001. Tel: (0481) 3018392/93. Fax: (0481) 3018397. HDFC AMC Ltd., Ground Floor, Bhadra Tower, Cotton Hill Road, Vazhuthacaud, Thycaud P.O.,TTrriivvaannddrruumm – 695 014. Tel: (0471) 3983 730 / 731 /732 Fax: (0471) 3983738. MMAADDHHYYAA PPRRAADDEESSHHHDFC AMC Ltd., 1st Floor, Ranjeet Tower, 8, Zone-II, M. P. Nagar, BBhhooppaall - 462 011. Tel: 0755 - 4285385, 4246995, Fax: 0755 - 4058890. HDFC AMC Ltd., M1, M2 & M3, Mezzanine Floor, Sterling Arcade,15 / 3, Race Course Road, IInnddoorree - 452 001. Tel: 0731 - 4022241 / 42. Fax: 0731 - 4245436. HDFC AMC Ltd., First Floor, Muthye UdyogBhawan,1039, Wright Town, Opp. TelephoneExchange, JJaabbaallppuurr - 482 002. Tel: (0761) - 4049800,3988029 Fax: (0761) - 4068814. HDFC AMC Ltd., First Floor, Alakhnanda Towers, Shrimant Madhav Rao Scindia Marg, City Centre, GGwwaalliioorr - 474 001. Tel: (0751) - 4066060, 3988029 Fax: (0751) – 3982803. MMAAHHAARRAASSHHTTRRAAHDFC AMC Ltd., 1st Floor, Amar Arcade - 2, Opp. Rajapeth Police Station, Raja Peth, AAmmrraavvaattii - 444 601. Tel: (0721) 2562 112 / 113 Fax: (0721) 2564115. HDFC AMC Ltd., 2nd Floor, Renuka CommercialComplex, Samarth Nagar, Nirala Bazar, NageshwarWadi Road, AAuurraannggaabbaadd - 431 001. Tel: (0240) 3988029, Fax: (0240) 3982068. HDFC AMC Ltd., 138, Ground Floor, Kavya RatnavaliChowk, Omkareshwar Road, JJaallggaaoonn – 425 002. Tel: (0257) 3982100/ 01. Fax: (0257) 3982114. HDFC AMC Ltd., Royal Prestige, C1/C9, 1st Floor, E - Ward, Sykes Extension, Rajarampuri Road,KKoollhhaappuurr - 416 008. Tel: (0231) - 3988029, Fax: (0231) - 3982060. HDFC AMC Ltd.**, Premises Nos.. F1, 2, 3 & 4, 1st Floor, “Center Square”, S.V. Road, Andheri (W),MMuummbbaaii – 400 058. Tel: (022) 26708239 / 26285389.Fax: (022) 26241131. HDFC AMC Ltd.** Shop # 7, Abhilasha Building,Punjabi Lane, Borivali (W), MMuummbbaaii - 400 092. Tel: (022) 28952702/ 28901497, Fax: (022) 28949392. HDFC AMC Ltd.,* HUL House, 2nd floor, H.T. ParekhMarg, 165-166 Backbay Reclamation, Churchgate,MMuummbbaaii – 400 020 Tel: (022) 66316333, Fax: (022) 66580200.
(Continued on next page)
54 January 2014 Intouchmutually

Registered Office: HUL House, 2nd floor, H.T. Parekh Marg, 165-166 Backbay Reclamation, Churchgate, Mumbai – 400 020.
Published and printed by Shailendra Sharad Kalelkar for and on behalf of Business Standard Limited from H4, Paragon Condominium, Opposite Century Mills, P B Marg, Worli, Mumbai 400013, and printed at M. P. Printers (A Unit of D.B.Corp. Ltd.), B- 220, Industrial Area, Phase – II, Noida – 201305 ( U.P.) India. Editor: Rajiv Shirali.
HDFC AMC Ltd., Mistry Bhavan, 2nd Floor, 122, Backbay Reclamation, Dinsha Vachha Road,Churchgate, MMuummbbaaii - 400 020. Tel: (022) 60006767, Fax: (022) 66580211. HDFC AMC Ltd.**, Shop No. 1 & 2, Ground Floor, Atlantic Tower, R B Mehta Road, Near Railway Station,Ghatkopar (East), MMuummbbaaii - 400 077. Tel: (022) 6525 3409/08/06/21, Fax: (022) 2511 6805. HDFC AMC Ltd.**, Unit No. 101, 1st Floor, Landmark Building, 136 Hill Road,Opp. St. PetersChurch, Bandra (West), MMuummbbaaii - 400 050. Tel: (022) 2643 4760 / 762 / 763 / 764, Fax: (022) 2643 4768. HDFC AMC Ltd.**, Shop no. 1 & 2, Ground floor,Gurangi Chambers, Opp. Damani Chambers, Near Teen Haath Naka, LBS Marg, TThhaannee (West) - 400 602. Tel: (022) 2538 5659, 2539 1125, 2538 6848, 6502 0205, 6536 5246,6536 5245, 6414 2389, Fax: (022) 25301125. HDFC AMC Ltd., 106-110, 2nd Floor, Shriram ShyamTowers, Near NIT Building, Kingsway, Sadar, NNaaggppuurr - 440 001. Tel: (0712) 663 0301/02/04, Fax: (0712) 663 0206. HDFC AMC Ltd. G- 1 & G-2, "Suyojit Heights", Opp.Rajiv Gandhi Bhavan, Sharanpur Road, NNaasshhiikk - 422 002. Tel: (0253) 6611831 / 32. Fax: (0253) 6611836. HDFC AMC Ltd., 6, Chetana Apartment, 2423, East Street, Pune Camp, PPuunnee - 411 001. Tel.: (020) 41223301/02, Fax: (020) 41223310. HDFC AMC Ltd., Ground Floor, City Mall, University Circle, Ganeshkhind Road, PPuunnee - 411 007.Tel: (020) 66073301, Fax: (020) 66073310. HDFC AMC Ltd.**, BSE 1, Tech Building, 109, A Wing, 1st Floor, Opposite Vashi Railway Station, Sector 30, VVaasshhii - 400 703. Tel: (022) 39880299. HDFC AMC Ltd.**, 1st Floor, Anant Kuti (BibikarBldg.), Manpada Road, Opp. Muncipal CorporationBldg., Dombivli (East), MMuummbbaaii - 421 201. Tel: (0251) 2860 648 / 649 / 645 / 656, Fax: (0251) 2863953. OORRIISSSSAAHDFC AMC Ltd., Sri Jagannath Complex, 1st Floor, Opposite Hari - Omm Bhawan, BBaarrbbiill - 758 035. Tel: 09238106515 / 09238106525, Fax: (06767) 275565. HDFC AMC Ltd., Vinayak, 2nd Floor, 96, Janpath, BBhhuubbaanneesswwaarr - 751 001. Tel: (0674) 6450502 / 1502, Fax: 0674 - 2531483. HDFC AMC Ltd., 1st Floor, Plot No. 2690 (P),Bajrakabati Road, Ranihat, CCuuttttaacckk – 753 001. Tel: (0671) 2323724/ 725, Fax: (0671) 2324741. HDFC AMC Ltd., Praful Tower, 1st Floor, PanposhRoad, RRoouurrkkeellaa - 769 004. Tel: (0661) 3988029,3982060/70, Fax: (0661) 3982068. HDFC AMC Ltd., Kadambari Complex, 1st Floor, Unit - 4, Nayapara, Golbazar, SSaammbbaallppuurr - 768 001. Tel: (0663) 2400 323 / 339, Fax: (0663) 2400324. PPOONNDDIICCHHEERRRRYYHDFC AMC Ltd., No.17, I Floor, Sree VelayudhamComplex, Near Indhira Gandhi Square, Natesan Nagar, PPoonnddiicchheerrrryy - 605 005. Tel: (0413) 3043 293 / 500 /600. Fax: (0413) 2206776. PPUUNNJJAABBHDFC AMC Ltd., SCO-28, 1st Floor, Taneja Towers, District Shopping Complex, Ranjit Avenue, AAmmrriittssaarr -143 001. Tel: (0183) 3988028 /29/ 2570,Fax: (0183) 3982599. HDFC AMC Ltd., Ground Floor, Liberty Chowk,
Corner Building, Municipal No. 83 - B, 3A, BBhhaattiinnddaa - 151 001. Tel.: (0164) 5001982, Fax: (0164) 5191283. HDFC AMC Ltd., 1st Floor, SCO- 2909- 2910, Sector - 22-C, Opp. Hotel J W Marriot, CChhaannddiiggaarrhh - 160 022. Tel: (0172) 5050888, Fax: (0172) 277 1219. HDFC AMC Ltd., 2nd Floor, Above ING Vysya Bank, Adjacent to Sekhon Grand Hotel, Namdev Chowk, G T Road, JJaallaannddhhaarr CCiittyy - 144 001. Tel: (0181) 3988029 / 970, Fax: (0181) 3982966. HDFC AMC Ltd., SCO 122, Feroze Gandhi Market, LLuuddhhiiaannaa - 141 001. Tel.: (0161) 277 4321 / 5014321. Fax: (0161) 3013838. RRAAJJAASSTTHHAANNHDFC AMC Ltd., 4th Floor, K.C. Complex, Opp. Daulat Bagh, AAjjmmeerr - 305 001. Tel: (0145) 3099000.Fax: (0145) 3099001. HDFC AMC Ltd., “Moondhra Bhavan”, 3-Ajmer Road, JJaaiippuurr - 302 001. Tel: (0141) 511 6681/ 82 , 237 4968, Fax: (0141) 5111126. HDFC AMC Ltd., Gulab Singh Bhavan, 11, Chopasni Road, JJooddhhppuurr - 342 003. Tel: (0291) 510 1927, 510 1937, Fax: (0291) 510 5919. HDFC AMC Ltd., 1st Floor, Gowardhan Plaza, 25, Trench Colony, Opposite Lok Kalamandal, UUddaaiippuurr - 313 001. Tel: (0294) 3988029, Fax: (0294) 3982000. TTAAMMIILL NNAADDUUHDFC AMC Ltd., ITC Centre, 1st Floor, 760, Anna Salai, CChheennnnaaii - 600 002. Tel: (044) 43979797 /43979716, Fax: (044) 28415855. HDFC AMC Ltd., 1371A, Ground Floor, Nadar Building, Trichy Road, CCooiimmbbaattoorree - 641 018. Tel: (0422) 4391861/62/63. Fax: (0422) 4391714. HDFC AMC Ltd., 127 C/3 East Veli Street, MMaadduurraaii - 625 001. TeleFax: (0452) 3988029. HDFC AMC Ltd., 1st Floor, No1 Bhimsena GardenStreet, Royapettah High Road, Mylapore, CChheennnnaaii – 600 004. Tel: (044) 30913060, Fax: (044) 30913082. HDFC AMC Ltd., 1st floor, Ram Complex, No. 454/3, Meyanoor Main Road, SSaalleemm - 636 009. HDFC AMC Ltd., 1st floor, No. 142/7, Sri Balaji Arcade, Opp. Alagar Jewellery, Trivandrum Road, Palayamkottai, TTiirruunneellvveellii - 627 002.Tel: (0462) 2576174, Fax: (0462) 2576173. Tel: (0427) 3982680/700. Fax: (0427) 2333617. HDFC AMC Ltd., No. 60, Sri Krishna Arcade, First Floor, Tennur High Road, Tennur, TTrriicchhyy - 620 017.Tel: (0431) 3982830, Fax: (0431) 3982835. HDFC AMC Ltd., Premises No.73, 1st Floor Door No. 73/19, Thiyagarjapuram Officer’sLine Officer’s Line, VVeelllloorree - 632 001, Tel: (0416) 2214670/2. Fax: (0416) 2214671. UUTTTTAARRAAKKHHAANNDDHDFC AMC Ltd., 76, Rajpur Road, Near RTO, DDeehhrraadduunn - 248 001. Tel: (0135) 3988029 / 7434, Fax: (0135) 3987444. HDFC AMC Ltd., Plot No. 1, 1st Floor, Durga City Centre, Bhotia Parao, Nainital Road,HHaallddwwaannii - 263 139. Tel: (05946) 285286 Fax: (05946) 285290.HDFC AMC Ltd., 1st Floor, Kumar Complex, Chandracharya Chowk, HHaarriiddwwaarr - 249407 Tel: (01334) 222406/7 Fax: (01334) 222410. UUTTTTAARR PPRRAADDEESSHHHDFC AMC Ltd., B2, 1st Floor, 9/4, Shankar Point,Sanjay Place, AAggrraa - 282 002. Tel: (0562) 3984761-73, Fax: (0562) 3984777. HDFC AMC Ltd., 3/260-A, Arena Complex,
Laxmibai Marg, Marris Road, AAlliiggaarrhh - 202 001. Tel: (0571) 2740 770 / 771 / 772, Fax: (0571) 2740772. HDFC AMC Ltd., 3rd Floor, Agarwal Arcade, Hyundai Motors Showroom, 4 Sardar Patel Marg, Civil Lines, AAllllaahhaabbaadd - 211 001. Tel: (0532) 2561 035/036/038, Fax: (0532) 2561035. HDFC AMC Ltd., 146 Civil Lines, 1st Floor, Gupta Complex, Near Circuit House Chouraha, BBaarreeiillllyy - 243 001. Tel: (0581) 2510 749 / 759, Fax: (0581) 2510709. HDFC AMC Ltd., D-2, 1st Floor, Raj Nagar DistrictCentre, Raj Nagar, GGaazziiaabbaadd - 201 010. Tel: (0120)301 0635, Fax: (0120) 3010636. HDFC AMC Ltd., 4th Floor, A.D. Tower Compound,Bank Road, GGoorraakkhhppuurr -273 001, Tel. No: (0551) 6060011/2/3. HDFC AMC Ltd., 101 & 201, Sai Arcade, 16/34 Bhargava Estate, Civil Lines, KKaannppuurr - 208 001. Tel: (0512) 3935592/93/94, Fax: (0512) 3935596. HDFC AMC Ltd., 1st Floor, Narain Ford Building, 4 Shah Najaf Road, Hazratganj, LLuucckknnooww - 226 001. Tel: (0522) 4155500/ 01, Fax: (0522) 4155555. HDFC AMC Ltd., 143/145/1, Ganpati Plaza, GroundFloor, Magal Pandey Nagar, MMeeeerruutt - 250 005. Tel: (0121) 2602 380 / 2601 965, Fax: (0121) 2602380. HDFC AMC Ltd., Parsvnath Plaza-II, UGF Hall No.4,Delhi Road, MMoorraaddaabbaadd - 244 001. Tel: (0591) 3988029 / 3982131. Fax: (0591) 3982137. HDFC AMC Ltd., K-24/25, First Floor, Pearl Plaza Building, Sector-18, NNooiiddaa - 204 301. Tel: (0120) 432 5757/ 5959. Fax: (0120) 423 4349. HDFC AMC Ltd., D-64/127, 4th Floor, ArihantComplex, Sigra, VVaarraannaassii - 221 010. Tel: (0542) 6450711/ 6450712. WWEESSTT BBEENNGGAALLHDFC AMC Ltd., 2nd Floor, Chatterjee Plaza, 69/101,GT Road, Rambandhutala, AAssaannssooll - 713 303. Tel: (0341) 2221220, Fax: (0341) 2221219. HDFC AMC Ltd., City Plaza, City Centre, 1st Floor, DDuurrggaappuurr - 713 216. Tel: (0343) 3982150, Fax: (0343) 3982153. HDFC AMC Ltd., Krishna Enclave, 2nd Floor, 2/1, Bhajanlal Lohia Lane, Opposite Howrah A.C. Market, HHoowwrraahh - 711 101, Phone: (033) 33546150/163, Fax: (033) 33546157. HDFC AMC Ltd., Menaka Estate, 1st Floor, 3 Red Cross Place, KKoollkkaattaa - 700 001. Tel: (033) 22312875, 22312876, Fax: (033) 22439582. HDFC AMC Ltd., Gitanjali Complex, 2nd Floor, AboveCorporation Bank, Sevoke Road, SSiilliigguurrii - 734 001. Tel: (0353) 6453474. Fax: (0353) 2545270.
* This is not an Investor Service Centre for HDFCMutual Fund. However, this is an official point of acceptance for acceptance of all on-going transactions from Institutional Investors only, i.e.broadly covering all entities other than resident / non resident individuals. Institutional Investors are free to lodge their applications at any other officialpoints of acceptance also.
** Official points of acceptance of transactions forschemes of HDFC Mutual Fund except purchase transactions of Liquid Schemes / Plans viz. HDFC Liquid Fund, HDFC Liquid Fund - Premium Planand HDFC Cash Management Fund - Savings Plan &Call Plan.
WANT TO HAVE THE LATEST INFORMATION ABOUT US ?
Toll-free number : 1800 3010 6767/1800 419 7676
e-mail For any query or suggestions:-
Investors may contact us at: [email protected]
Distributors may contact us at: [email protected]
SMS: HDFCMF to 56767
Telephone Services
Visit us at www.hdfcfund.com
(Continued from previous page)
INVESTOR SERVICE CENTRES (ISCs)
January 2014 55Intouchmutually
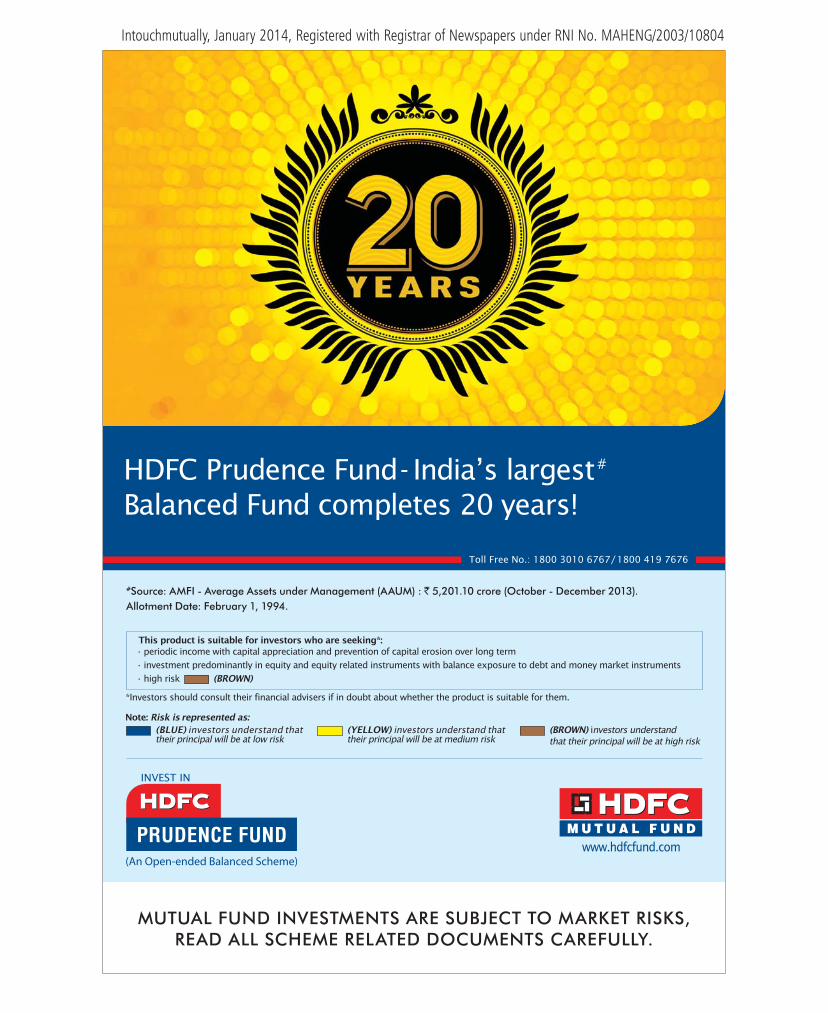
Intouchmutually, January 2014, Registered with Registrar of Newspapers under RNI No. MAHENG/2003/10804


![Mrunal » [Banking] Monetary Policy_ Quantitative & Qualitative Tools, applications & limitations MSF, LAF, Repo, OMO, CRR, SLR, Revisited before upcoming Urjit Article » Print](https://img.pdfslide.us/doc/110x75/55cf994d550346d0339caf97/mrunal-banking-monetary-policy-quantitative-qualitative-tools-applications.jpg)