Embed Size (px)
Citation preview

2UDK 66:54(05) CODEN HMIDA 8 ISSN 0367–598 X
Vol. 70 Časopis Saveza hemijskih inženjera Srbije
BEOGRAD, MART-APRIL 2016. HMIDA 8, 70 (2) 113-224 (2016)

GENERALNI POKROVITELJ
HEMOFARM KONCERN
VRŠAC, Beogradski put bb, tel. 013/821-345, 821-027, 821-129 BEOGRAD, Prote Mateje 70, tel. 011/344-26-63, faks: 344-17-87
E-pošta: [email protected]
Aktivnosti Saveza hemijskih inženjera Srbije pomažu:
MINISTARSTVO PROSVETE, NAUKE I TEHNOLOŠKOG RAZVOJA REPUBLIKE SRBIJE
Tehnološko-metalurški fakultet
Univerziteta u Beogradu, Beograd
Prirodno-matematički fakultet Univerziteta u Novom Sadu, Novi Sad
Hemijski fakutet Univerziteta u Beogradu Beograd
Institut za tehnologiju nuklearnih i drugih
mineralnih sirovina, Beograd
Institut za opštu i fizičku hemiju,
Beograd
Tehnološki fakultet Univerziteta u Novom Sadu, Novi Sad
NU Institut za hemiju, tehnologiju i metalurgiju Univerziteta u Beogradu, Beograd
Hipol a.d., Odžaci
Tehnološki fakultet Univerziteta u Nišu, Leskovac
Fakultet tehničkih nauka, Kosovska Mitrovica

Chemical Industry Химическая промышленность
Časopis Saveza hemijskih inženjera SrbijeJournal of the Association of Chemical Engineers of Serbia
Журнал Союза химических инженеров Сербии
VOL. 70 Beograd, mart−april 2016 Broj 2 Izdavač Savez hemijskih inženjera Srbije Beograd, Kneza Miloša 9/I Glavni urednik Branko Bugarski Zamenica glavnog i odgovornog urednika Nevenka Bošković-Vragolović Urednici Katarina Jeremić, Ivana Banković-Ilić, Maja Obradović, Dušan Mijin, Dragan Povrenović, orica Knežević Jugović Članovi uredništva Nikolaj Ostrovski, Milorad Cakić, Željko Čupić, Katarina Jeremić, Miodrag Lazić, Slobodan Petrović, Milovan Purenović, Aleksandar Spasić, Dragoslav Stoiljković, Radmila Šećerov-Sokolović, Slobodan Šerbanović, Nikola Nikačević, Svetomir Milojević Članovi uredništva iz inostranstva Dragomir Bukur (SAD), Jiri Hanika (Češka Republika), Valerij Meshalkin (Rusija), Ljubiša Radović (SAD), Constantinos Vayenas (Grčka) Likovno-grafičko rešenje naslovne strane Milan Jovanović Redakcija 11000 Beograd, Kneza Miloša 9/I Tel/fax: 011/3240-018 E-pošta: [email protected] www.ache.org.rs Izlazi dvomesečno, rukopisi se ne vraćaju Za izdavača Tatijana Duduković Sekretar redakcije Slavica Desnica Izdavanje časopisa pomaže Republika Srbija, Ministarstvo prosvete, nauke i tehnološkog razvoja Uplata pretplate i oglasnog prostora vrši se na tekući račun Saveza hemijskih inženjera Srbije, Beograd, broj 205-2172-71, Komercijalna banka a.d., Beograd Kompjuterska priprema Vladimir Panić Štampa Razvojno-istraživački centar grafičkog inženjerstva, Tehnološko-metalurški fakultet, Univerzitet u Beogradu, Karnegijeva 4, 11000 Beograd Indeksiranje Radovi koji se publikuju u časopisu Hemijska Industrija ideksiraju se preko Thompson Reuters Scietific® servisa Science Citation Index - ExpandedTM i Journal Citation Report (JCR)
SADRŽAJ/CONTENTS Aleksandra R. Novaković, Maja A. Karaman, Ivan Lj. Milovanović,
Miona M. Belović, Milena J. Rašeta, Tanja I. Radusin, Nebojša M. Ilić, Edible mycorrhizal species Lactarius con-troversus Pers. 1800 as a source of antioxidant and cyto-toxic agents ................................................................................. 113
Jovan T. Ćirić, Sandra S. Konstantinović, Slavica B. Ilić, Gordana Gojgić-Cvijović, Dragiša S. Savić, Vlada B. Veljković, The impact of isatin derivatives on antibiotic production by Streptomyces hygroscopicus CH-7 ............................................. 123
O. Nwokoro, Linamarase production by some microbial isolates and a comparison of the rate of degradation of cassava cyanide by microbial and cassava linamarases ........................... 129
Vesna D. Nikolić, Željko J. Kamberović, Marija S. Korać, Zoran M. Anđić, Aleksandar M. Mihajlović, Jelena B. Uljarević, Nickel- -based catalysts: Dependence of properties on nickel load-ing and modification with palladium ......................................... 137
Iva M. Atanasković, Jelena P. Jovičić Petrović, Marjan B. Biočanin, Vera M. Karličić, Vera B. Raičević, Blažo T. Lalević, Stimul-ation of diesel degradation and biosurfactant production by aminoglycosides in a novel oil-degrading bacterium Pseudomonas luteola PRO23 ..................................................... 143
Muhammad Shoaib, Hassan M. Al-Swaidan, Optimization of acti-vation temperature on the preparation of sliced porous activated carbon from date fronds by physical activation ........ 151
Ivana S. Kostić, Tatjana D. Anđelković, Darko H. Anđelković, Tat-jana P. Cvetković, Dušica D. Pavlović, Determination of di(2-ethylhexyl) phthalate in plastic medical devices ............... 159
Milovan R. Janković, Olga M. Govedarica, Snežana V. Sinadinović- -Fišer, Jelena M. Pavličević, Vesna B. Teofilović, Nevena R. Vukić, Liquid–liquid equilibrium constant for acetic acid in an olive oil–epoxidized olive oil–acetic acid–hydrogen per-oxide–water system ................................................................... 165
Anita M. Lazić, Nataša V. Valentić, Nemanja P. Trišović, Slobodan D. Petrović, Gordana S. Ušćumlić, Sinteza, struktura i svojstva biološki aktivnih derivata spirohidantoina / Syn-thesis, structure and biological properties of active spiro-hydantoin derivatives ................................................................. 177
Tomislav Lj. Trišović, Miroslav D. Spasojević, Milica M. Gvozdeno-vić, Branimir Z. Jugović, Lidija D. Rafailović, Automatski ure-djaji za elektohemijsku dezinfekciju vode sa pothlađiva-njem elektolita / Automatic devices for electrochemical water treatment with cooling of electrolyte ............................. 201
Veselin M. Delević, Refik M. Zejnilović, Biljana S. Jančić-Stojanović, Brižita I. Đorđević, Zorana N. Tokić, Milica D. Zrnić-Ćirić, Ivan M. Stanković, Kvantifikacija akrilamida u izabranim namirnicama primenom gasne hromatografije u tandemu

SADRŽAJ nastavak CONTENTS continued
sa masenom spektrometrijom / Quantification of acryl-amide in foods selected by using gas chromatography tandem mass spectrometry ........................................................ 209
Nataša Ž. Šekuljica, Nevena Ž. Prlainović, Jelena R. Jovanović, Andrea B. Stefanović, Sanja Ž. Grbavčić, Dušan Ž. Mijin, Zorica D. Knežević-Jugović, Immobilization of horseradish peroxidase onto kaolin by glutaraldehyde method and its application in decolorization of anthraquinone dye ................. 217

113
Edible mycorrhizal species Lactarius controversus Pers. 1800 as a source of antioxidant and cytotoxic agents Aleksandra R. Novaković1, Maja A. Karaman2, Ivan Lj. Milovanović1, Miona M. Belović1, Milena J. Rašeta3, Tanja I. Radusin1, Nebojša M. Ilić1 1Institute of Food Technology, University of Novi Sad, Novi Sad, Serbia 2Department of Biology and Ecology, Faculty of Sciences, University of Novi Sad, Novi Sad, Serbia 3Department of Chemistry, Biochemistry and Environmental Protection, Faculty of Sciences, University of Novi Sad, Novi Sad, Serbia
Abstract The aim of this work was to study chemical profile and antioxidant and cytotoxic activitiesof ethanol and water extracts of Lactarius controversus (Pers.) 1800 mushroom species growing in eastern Serbia. The chemical characterization of phenolic compounds per-formed by HPLC–MS/MS demonstrated the presence of quinic acid among others. Deter-mination of antioxidant activity, including radical scavenging effects on DPPH•, NO•, •OH and SOA radicals and ferric reducing ability was investigated. The highest DPPH radicalscavenging effect was obtained for water extract (LcAq) while ethanol extract (LcEtOH)demonstrated the highest FRAP activity. Hexane extract applied in antibacterial assayagainst three pathogenic strains demonstrated antibacterial effect only against S. aureusATCC25922. Anti-proliferative properties against estrogen dependent MCF 7 breast cancercell lines using MTT showed higher activity for ethanolic extract.
Keywords: Lactarius controversus, phenolic compounds, quinic acid, antioxidants, cytotoxicagents.
SCIENTIFIC PAPER
UDC 582.28(497.11-11):54:543.544
Hem. Ind. 70 (2) 113–122 (2016)
doi: 10.2298/HEMIND141229017N
Available online at the Journal website: http://www.ache.org.rs/HI/
For thousands of years, traditional oriental medi-cine has used natural products, including medicinal and toxic mushrooms, for curing and disease prevention. Most of medicinal mushroom preparations were used in a form of tonics, food or powder with unknown side-effects. Nowadays, wild-growing mushrooms still com-prise a vast and largely untapped source of powerful new pharmaceutical products for the mankind in the future [1]. The number of mushroom species on Earth is estimated to approximately 140,000 species, while only 10% of them have been already determined. According to estimates that only 5% of the total known species, which is about 7000 species, are with detected and potential benefits for mankind, means that mushrooms are still insufficiently explored sources of bioactive compounds [2–5]. Mushrooms contain a vari-ety of complex compounds derived from secondary metabolism such as phenolic compounds, polyketides, triterpenoids and steroids which are specific to each mushroom species and strain and have specific medi-cinal effects on humans, including antimicrobial, anti-tumor, antioxidant etc. [6,7]. Many such compounds have been used in the treatment of cancer [8,9]. Fur-thermore, evidence-based studies suggest that there is Correspondence: A. Novaković, Institute of Food Technology, Univer-sity of Novi Sad, Bulevar cara Lazara 1, 21000 Novi Sad, Serbia. E-mail: [email protected] Paper received: 29 December, 2014 Paper accepted: 6 March, 2015
a relationship between the physiopathology of several chronic diseases (e.g., cancer) and oxidative stress development. Therefore, the use of foods rich in anti-oxidants, such as phytochemical and mycochemical protectors, may be the most relevant factor in the prevention of oxidative stress related diseases [10]. Moreover, there is a continuous need for discovery of new molecules that are able to effectively reduce can-cer which is the leading cause of death in Europe in 2006 [11].
Some literature data suggest that L. controversus is inedible species [12], but in Serbia this species is used as food, after obligatory cooking procedure before con-sumption.
In the present work we studied whether the auto-chthonous mushroom species Lactarius controversus Pers. 1800 possesses antioxidant, antibacterial and antiproliferative properties. To our knowledge, this is the first report dealing with the antioxidant growth inhibitory properties of L. controversus against MCF 7 breast cancer cell line.
EXPERIMENTAL
Standards and reagents Folin–Ciocalteu (FC) reagent, anhydrous sodium car-
bonate, gallic acid, aluminium trichloride hexahydrate, sodium acetate trihydrate, quercetin hydrate, 2,2- -diphenyl-1-picrylhydrazyl (DPPH•), anhydrous iron(III)
A.R. NOVAKOVIĆ et al.: L. controversus Pers. 1800 AS A SOURCE OF ANTIOXIDANT AND CYTOTOXIC AGENTS Hem. ind. 70 (2) 113–122 (2016)
114
chloride, 2,4,6-Tris(2-pyridyl)-s-triazine (TPTZ), 2-thio-barbituric acid, disodium hydrogen phosphate, thiazolyl blue tetrazolium bromide, phenazine methosulfate (PMS), and β-nicotinamide adenine dinucleotide (NADH), 3-(4,5-dimethylthiazole-2-yl)-2,5-diphenyltet-razolium bromide (MTT), dimethyl sulfoxide (DMSO), sulforhodamine B (SRB), and trichloroacetic acid (TCA) were purchased from Sigma-Aldrich (Steinheim, Ger-many). Dulbecco’s Modified Eagle’s Medium with 4.5% of glucose (DMEM) and fetal calf serum (FCS) were purchased from PAA Laboratories (Pasching, Austria). Ascorbic acid, potassium dihydrogen phosphate, sodium nitroprusside dihidrate (SNP), naphthylethyl-enediamine dihydrochloride (NEDA), sulfanilamide (SA) 35% hydrogen peroxide, iron(II) sulfate heptahydrate, trichloracetic acid, and ethylenediaminetetraacetic acid (EDTA) were purchased from Lach-ner (Neratovice, Czech Republic). 2-Deoxy-D-ribose was obtained from Alfa Aesar (Karlsruhe, Germany). Reference standards of the phenolic compounds were obtained from Sigma– –Aldrich Chem (Steinheim, Germany), Fluka Chemie GmbH (Buchs, Switzerland) or from Chromadex (Santa Ana, USA). HPLC gradient grade methanol was pur-chased from J. T. Baker (Deventer, The Netherlands), and p.a. formic acid and DMSO from Merck (Darmstadt, Germany). Deionized water was produced using a Milli-pore water purification system.
Mushroom samples Lactarius controversus was collected from Sikola
area in Serbia during the year 2012. After the iden-tification of the species, a voucher specimen (12- -00663) was deposited at the Herbarium Buns, Faculty of Sciences Department of Biology and Ecology, Uni-versity of Novi Sad. The mushroom samples were pre- -frozen at –20 °C and freeze-dried (Martin Christ GmbH, Germany). Freeze dried samples were ground to a fine powder, wrapped in plastic bags and stored in the dark at room temperature prior to analysis.
Extraction The whole freeze dried and powdered sporocarps
of L. controversus (10 g) were extracted with the fol-lowing solvents: ethanol (EtOH), methanol (MeOH) or hexane (Hex) and distilled water (Aq) for 24 h on a shaker (Thermofisher Scientific, USA) at 120 rpm at room temperature (25 °C). The extracts were filtered through Whatman No.4 filter paper and the solvents were removed by rotary evaporation in vacuum at 40 °C (Bűchi, Switzerland). The extracts obtained (LcEtOH, LcMeOH, LcHex) were stored in refrigerator at 4 °C, while aqueous extract (LcAq) was stored at –20 °C prior to analysis. Dry residues were redissolved in DMSO to obtain LcAq, LcEtOH, for determination of antioxi-dant and anti-proliferative activities (5 mg/ml), and LcHex was used for evaluation of antibacterial activity.
HPLC–MS/MS screening of the phenolic compounds For HPLC–MS/MS determination of the phenolic
profile, method developed by Orčić et al. [13] was used. The Agilent 1200 series liquid chromatograph was used for separation of all analytes, using a Zorbax Eclipse XDB-C18 RR 4.6 mm×50 mm×1.8 mm (Agilent Technologies) reversed-phase column held at 40 °C. Detection was carried out by Agilent series 6410A triple-quadrupole mass spectrometer with electrospray ionization (ESI). MassHunter ver. B.03.01. software (Agilent Technologies) was used for instruments con-trol and data analysis. The binary mobile phase con-sisted of 0.05% formic acid (A) and methanol (B) and was delivered at a flow rate of 1 ml/min. Gradient elu-tion was performed using the following solvent gra-dient: starting with 70% A/30% B, reaching 30% A/70% B in 6.00 min, then 100% B at 9.00 min, holding until 12.00 min, with reequilibration time of 3 min. The injection volume for all samples was 5 μL. ESI para-meters were: drying gas (N2) temperature, 350 °C; flow, 9 L/min; nebulizer gas pressure, 40 psi; capillary voltage, 4 kV, negative polarity. All compounds were quantified in dynamic MRM mode (multiple reaction monitoring mode). Compound-specific, optimized MS/ /MS parameters are given in Table 1. The mix of stock solutions was prepared, with concentration of each compound being 100 μg/ml, and then, subsequently serially diluted in methanol–water (1:1), giving working standard solutions with concentration ranging from 0.0015 do 25.0 µg/ml, which were used for construct-ion of the calibration curves. Concentrations of stan-dard compounds in extracts were determined from the peak areas by using the equation for linear regression obtained from the calibration curves (R2 gt; 0.995).
Total phenolic content Total phenolic content (TP) in the ethanol and
water extracts was determined according to method by Singleton et al. [14] adapted for plate reader (Multi-skan Ascent, Thermo Electron Corporation). 125 μl of 0,1M Folin–Ciocalteu reagent was added to 25 μl of diluted extracts. After 10 min, 100 μl of 7.5% sodium carbonate was added and reaction mixture was incub-ated for 2 h. Absorbance was read at 690 nm after finished incubation period. In order to eliminate the interferences, correction was prepared by replacing the volume of reagents with the same volume of distilled water. Standard curve was prepared for gallic acid, and total phenolic content was expressed as mg gallic acid equivalents (GAE)/g of dry weight. Experiments were performed in triplicate.
Total flavonoid content The flavonoid (TF) content of investigated extracts
was measured spectrophotometrically in a 96-well

A.R. NOVAKOVIĆ et al.: L. controversus Pers. 1800 AS A SOURCE OF ANTIOXIDANT AND CYTOTOXIC AGENTS Hem. ind. 70 (2) 113–122 (2016)
115
Table 1. Optimized dynamic MRM parameters
Compound tR / min Precursor (m/z) Product (m/z) Vfragmentor / V Vcollision / V Gallic acid 0.58 169 125 90 10 Catechin 0.74 289 245 150 10 Protocatechuic acid 0.79 153 109 105 9 5-O-Caffeoylquinic acid 0.80 353 191 100 10 Epigallocatechin gallate 0.81 457 169 165 16 Epicatechin 0.95 289 245 150 10 Gentisic acid 1.03 153 109 100 9 p-Hydroxybenzoic acid 1.08 137 93 80 10 Esculetin 1.13 177 133 105 15 Caffeic acid 1.18 179 135 100 10 Vanillic acid 1.24 167 108 100 15 Syringic acid 1.31 197 182 90 7 p-Coumaric acid 1.69 163 119 90 9 Umbelliferone 1.73 161 133 120 19 Scopoletin 1.77 191 176 80 8 Ferulic acid 1.90 193 134 90 11 Vitexin 1.90 431 311 200 22 Sinapic acid 1.92 223 193 100 17 Luteolin 7-O-glucoside 2.13 447 285 230 30 Hyperoside 2.16 463 300 200 30 Quercetin 3-O-glucoside 2.25 463 300 210 30 Rutin 2.33 609 300 135 42 Apiin 2.60 563 269 250 36 o-Coumaric acid 2.62 163 119 100 5 Myricetin 2.67 317 179 150 20 Quercitrin 2.75 447 300 190 27 Kaempferol 3-O-glucoside 2.80 447 284 190 30 Apigenin 7-O-glucoside 2.81 431 268 135 41 Secoisolariciresinol 2.90 361 165 130 26 3,4-Dimethoxycinnamic acid 2.99 207 103 110 7 Baicalein 3.40 445 269 140 22 Daidzein 3.43 253 208 145 31 Matairesinol 3.66 357 122 130 24 Quercetin 3.74 301 151 130 15 Naringenin 3.87 271 151 130 16 Cinnamic acid 3.91 147 103 100 5 Luteolin 4.03 285 133 135 25 Genistein 4.12 269 133 145 32 Kaepferol 4.55 285 285 130 0 Apigenin 4.71 269 117 130 25 Isorhamnetin 4.79 315 300 160 21 Chrysoeriol 4.82 299 284 125 20 Baicalein 5.15 269 269 165 0 Amentoflavone 5.78 537 375 220 35
plate reader using modified method by Chang et al. [15]. 30 μl of sample was mixed with 90 μl of methanol, 6 μl of 0.75 M aluminium trichloride, 6 μl of 1 M sodium acetate and 170 μl of distilled water. Absor-
bance was measured at 414 nm after 30 min of incub-ation. Correction was prepared in the way indicated above, with aluminium trichloride solution replaced with the equivalent volume of distilled water. Standard
A.R. NOVAKOVIĆ et al.: L. controversus Pers. 1800 AS A SOURCE OF ANTIOXIDANT AND CYTOTOXIC AGENTS Hem. ind. 70 (2) 113–122 (2016)
116
curve was prepared using quercetin. Experiments were repeated three times, and results were expressed as mg quercetin equivalents (QE)/g of dry weight.
DPPH radical scavenging activity Spectrophotometrical determination of free radical
scavenging activity was based on the monitoring of DPPH radical transformation in the presence of anti-oxidants according to Espin et al. [16]. The reaction mixture in the wells consisted of 10 μl of sample, 60 μl of DPPH solution and 180 μl of methanol. Control con-tained ethanol instead of sample, and correction con-tained 10 µl of sample and 240 µl of methanol. After 60 min of incubation in the dark at room temperature, the absorbance was measured using plate reader at 540 nm. Each sample was tested at five different concentra-tions to obtain IC50, and experiments were performed in triplicate.
Ferric reducing antioxidant power (FRAP) FRAP test was performed according to modified
procedure of Benzie and Strain [17]. The FRAP reagent consisted of 300 mM acetate buffer (pH 3.6), 10 mM TPTZ in 40 mM HCl and 20 mM FeCl3 in the volume ratio 10:1:1. 10 µl of sample, 225 µl of FRAP reagent and 22,5 µl of distilled water were added in 96-well plate. Extract was replaced by the same volume of ethanol in control, and correction contained distilled water instead of FRAP reagent. Absorbance was mea-sured after 6 min at 620 nm. Ascorbic acid was used to construct the standard curve, and results were expres-sed as mg ascorbic acid equivalents (AAE)/g of dry weight. Each analysis was performed three times.
Nitric oxide radical scavenging capacity Nitric oxide scavenging capacity was determined
according to the procedure of Green et al. [18]. The reaction mixtures in the test tubes consisted of 30 µl tomato extract, 500 µl SNP, and 500 µl of phosphate buffer, pH 7.4. Control contained equivalent volume of ethanol, while the reagents were replaced by the phos-phate buffer in the correction. Test tubes were incub-ated at room temperature for 90 min, under light expo-sure. After incubation, 1 ml of Griess reagent (0.2% solution of NEDA and 2% solution of SA in 4% phos-phoric acid in the volume ratio 1:1) was added to samples, corrections, and control. Aliquots of 250 µl were transferred to the plate, and their absorbance was measured using plate reader at 540 nm. Samples were tested at five different concentrations to obtain IC50, and experiments were performed in triplicate.
Superoxide anion radical scavenging capacity Superoxide anion radical scavenging capacity of ext-
racts was determined by measuring their ability to neutralize superoxide anion radicals generated during
aerobic reduction of nitro blue tetrazolium by NADH mediated by PMS [19]. 100 µl of 677 µM NADH, 100 µl of 60 µM PMS, 200 µl of 144 µM NBT and 1,1 ml of phosphate buffer (pH 8.3) were mixed with 10 µl of extract in the test tube. Control contained ethanol instead of extract, and correction contained 10 µl of extract and 1,5 ml of phosphate buffer. After 5 minutes of incubation, aliquots of 250 µl were transferred to the plate, and their absorbance was measured at 540 nm. Five different concentrations of each sample were tested to obtain IC50, and experiments were performed in triplicate.
Hydroxyl radical scavenging capacity The content of OH radicals was determined from
the degradation reaction of 2-deoxy d-ribose into frag-ments [20], while the malonyl dialdehyde (MDA) reac-tion with TBA reagent was determined spectrophoto-metrically at 532 nm. Each reaction was performed at five different concentrations using 10 μL of fungal ext-ract (33.3–1000 μg/mL) to obtain IC50, and experiments were performed in triplicate.
Antibacterial activity In vitro antibacterial susceptibility assay was done
for LcHex extract after dissolving in 5% DMSO to reach final extract concentration of 0,5%. Standard American Type Culture Collection (ATCC) strains of two Gram- -positive bacteria, Staphylococcus aureus ATCC25922, Bacillus subtilis ATCC6633 and one Gram-negative bacteria, Escherichia coli ATCC25923were used.
Two-fold assay in 96-well microplates (Spektar, Čačak, Serbia) for determination of minimal inhibitory concentration (MIC) and minimal bactericidal concen-tration (MBC) values was employed. Pure bacterial strains were subcultured on nutrient agar slants at 37 °C 24 h, while suspensions of the tested strains were corresponding to McFarland 0.5 optical density ≈1.5×10⁸ CFU/mL. 50 µl of extract was added to 50 µl of Műeller Hinton Broth (Torlak, Belgrade, Serbia) seeded with 1 µl bacterial suspensions. Evaluation of antibacterial activity was done according to the CLSI procedure (2008) modified by Karaman et al. [21] applying extract concentration in the final range from 0.78 to 25.0 mg/mL. After incubation at 3 °C for 18–24 h, MIC was determined as the lowest extract concen-tration preventing visible bacterial growth while the complete absence of growth was considered as MBC. It was confirmed by sub-culturing aliquots of 100 μL working solutions on Müeller Hinton agar plates and incubated at 35 °C overnight. Last two wells were free from tested extracts, and hence served as a growth control (positive control) and with 5% DMSO as a nega-tive control. Reference antibiotics (ampicillin and gen-tamicin) were applied as control standards. All analysis were carried out in triplicate (n = 3).
A.R. NOVAKOVIĆ et al.: L. controversus Pers. 1800 AS A SOURCE OF ANTIOXIDANT AND CYTOTOXIC AGENTS Hem. ind. 70 (2) 113–122 (2016)
117
Evaluation of anti-proliferative activity Cells
MCF-7 cells were grown in Dulbecco’s modified Eagle’s medium with 4.5% of glucose (DMEM, PAA Laboratories) supplemented with 10% fetal calf serum (FCS). For the experiment, the cells were seeded in a 96-well microplate (5000 cells per well). After 24 h incubation, the growth medium was replaced with 100 μl of medium containing samples at four different con-centrations (33.3, 100, 300 and 900 μg/mL). Untreated cells served as the control, and DMSO was used as a positive control. The effects of the extracts on the growth of human tumor cell line were evaluated according to the two procedures. MTT Assay
After 24 and 72 h, the cell viability was determined by the proliferation test MTT assay [22], which is based on the colour reaction of mitochondrial dehydrogenase in living cells with MTT reagent. At the end of the treat-ment period, MTT was added to each well (50 μg/100 μl /well), which was then incubated at 37 °C in 5% CO2 for 3 h. The coloured crystals of produced formazan were dissolved in 100 μl acidified isopropanol (0.04 M HCl in isopropanol). The absorbance was measured at 540 nm and 690 nm on plate reader (Multiskan Ascent, Thermo Electron Corporation, USA). SRB (sulforhodamine B) Assay
This colorimetric assay estimates cell number indi-rectly, by staining cellular protein with the protein- -binding dye SRB, in adapted procedure by Skehan et al. [23]. After incubation period, the cells were fixed adding cold 50% trichloroacetic acid (TCA) and incub-ated for 1 h at 4 °C. Wells were washed with deionized water and dried; sulforhodamine solution (0.4% in 1% acetic acid) was then added to each plate well and incubated for 30 min at room temperature. Unbound SRB was removed by washing with 1% acetic acid. Plates were air dried, the bound SRB was solubilised with 10 mM Tris (pH 10.5) and absorbance was mea-sured at 492 and 690 nm in the microplate reader. The results were expressed in EC50 values (sample concen-tration that inhibited 50% of the net cell growth). DMSO was used as positive control.
Percentage of cytotoxicity was calculated as the ratio of treated group absorbance and the control group absorbance, multiplied by 100. Experiments were performed twice in triplicate, and the obtained results were expressed as IC50 values (sample concentration that inhibited 50% of the net cell growth). IC50 values were calculated from the cytotoxicity (%) – extract concentration (μg/mL) plot using the Origin v. 6.0 graphing and data analysis software (1999).
Statistical analysis Results were expressed as mean ± standard devi-
ation (SD). Statistical analysis was performed using Statistica software system (StatSoft, Inc. (2013), version 12.0 (www.statsoft.com)). Significant differences between two groups were determined by Student’s t-test. Pearson correlation coefficients were calculated between content of antioxidant compounds in extracts and their antioxidant and antiproliferative activity in different assays. Cluster analysis was performed using Mahalanobius distances.
RESULTS AND DISCUSSION
LC–MS/MS determination of phenolic compounds Forty-five phenolic compounds were recorded using
HPLC–MS/MS technique (Table 1), and only quinic acid was identified and quantified (8.9 µg/g d.w.), while concentrations of other detected compounds were under the limits of quantification (LOQ) of the method. According to the obtained results we cannot claim that other detected compounds, which could not be quan-tified in this work, are not present in examined ext-racts, but we could expect them to be present in amount lower than listed LOQ.
Quinic acid is a crystalline acid that is usually obtained from plants and it is a versatile starting material for the synthesis of new pharmaceuticals [25]. It was found in some species from genus Lactarius, L. volemus in previous studies [26]. Previous research [25,27,28] showed that quinic acid is a common con-stituent of human diet, capable of conversion into tryptophan and nicotinamide via the micro flora of the gastro intestinal (GI) tract, thus providing in situ physio-logical source of these essential metabolic ingredients to humans [25,27,29].
Antioxidant activity Antioxidant activity is manifested in a wide variety
of actions, such as inhibition of oxidizing enzymes, chelating of transition metals, transfer of hydrogen or a single electron to radicals, singlet oxygen deactivation, or enzymatic detoxification of reactive oxygen species [30,31].
The overall antioxidant activity should be evaluated by different methods in order to extensively charact-erize the antioxidant potential of pure compounds or extracts [32]. Therefore, water and ethanol extracts of L. controversus were examined with regard to scav-enging capacity towards, DPPH•, NO•, •OH and SOA radicals and ferric reducing power.
The results for antioxidant activity of analyzed ext-racts are shown in Table 2. Although both extracts pos-sessed antioxidant properties, water extract provides higher antioxidant activity (IC50 = 219.37 µg/ml) than

A.R. NOVAKOVIĆ et al.: L. controversus Pers. 1800 AS A SOURCE OF ANTIOXIDANT AND CYTOTOXIC AGENTS Hem. ind. 70 (2) 113–122 (2016)
118
ethanol extract for the DPPH and SOA assay, while ethanolic extract showed higher activity than water extract according to reducing power capacity (FRAP). Moreover, both analyzed extracts did not differ signific-antly only in •OH and NO• assay according to IC50 values. Investigated extracts showed higher activities for DPPH assay than L. piperatus and methanol extract of L. deliciosus [30].
Results showed that ethanol extract contained more total phenols than water extract (Table 2).These results showed higher values than in the previous stu-dies for the genus Lactarius [33]. The content of flavo-noids between extracts did not differ significantly. Phe-nols are expected to be the key components account-ing for the demonstrated results that are statistically determined via correlations (Table 3).
Antibacterial activity Hexane extract provides antibacterial activity against
only one strain S. aureusat concentration of 3.12 mg/ml for MIC and 6.25 mg/ml for MBC. Analyzed extract showed lower activities than antibiotics (gentamicin and ampicillin: MIC, 2.5 and 8 µg/ml and MBC, 10 and 128 µg/ml, respectively). These results are in agree-ment with previous data for chloroformic extracts [21].
Antiproliferative activity Antiproliferative activity of water and ethanol ext-
racts of L.controversus against MCF 7 human breast cancer cell line evaluated by MTT and SRB assays are presented in Table 4. Under the experimental condi-tions both extracts showed cytotoxic activity in two different assays applied at the highest concentration (900 µg/mg), percentage of cytotoxic inhibition was in the range from 53.12%-LcAq to 95.35%-LcEtOH after 24 h and from 36.15%-LcAq to 79.96-LcEtOH after 72 h. In particular, LcEtOH displayed the strongest growth inhi-bitory activity after 24 h acute phase (IC50 = 166.42 µg/ml). Differences in IC50 values obtained for the same samples by the two assays can probably be attributed to the difference in sensitivity of targets they reflect, since they measure distinct biological parameters in living cells. While SRB assay does not depend on enz-ymatic activity but on protein content of the cells, in MTT assay the results reflect the activity of mitochon-drial dehydrogenase which is more sensitive para-meter, and therefore in many cases with changes det-ectable in lower concentrations. However, the effects observed for each sample also strongly depend on the specific mixture of compounds present in the sample, their interaction and action of their metabolites that induce specific and often unexpected cellular responses.
Table 2. Antioxidant activity of L. controversus extracts and their total phenolic and total flavonoid content; *,**: significant differences between two groups were determined by student’s t-test (p < 0.001)
Parameter LCEtOH LCAq Antiradical assaysa, IC50 / µg ml–1
DPPH• 355.64*±41.5 219.37**±5.7 NO• 52.61*±5.7 90.2*±24.4 SOA 128*±6.6 4.41**±4.4 OH• 12.05*±3.9 12.80*±1.1
Antioxidant assayb FRAP 10.93*±0.9 3.0**±0.8
Total contentc TP 45.84*±0.9 3.50**±0.9 TF 25.05*±0.31 1.20**±0.3 aResults are expressed as IC50 (µg/ml) – concentration of extracts that caused 50% (25%) of activity in assays (in NO assay); bferric reducing antioxidant power (FRAP) is expressed as mg ascorbic acid equivalents/g extract dry weight (mg AAE/g d.w.); ctotal phenol content (TP) was expressed as mg gallic acid equivalents/g extract dry weight (mg GAE /g d.w.) and total flavonoid content (TF) was expressed in mg quercetine equivalents/g extract dry weight (mg QE/g d.w.)
Table 3. Cytotoxic activities of L. controversus extracts on MCF7 (IC50; µg/ml); *: correlations are significant at p < 0.05; **: correl-ations are significant at p < 0.01; ***: correlations are significant at p < 0.001
Extract MTT assay SRB assay 24 h 72 h 24 h 72 h
LCAq 306.17*±15.5 <900* 623.80*±49.81 249.02**±44.8 LCEtOH 166.42**±3.1 302.74**±9.6 526.98*±35.4 696.37*±8.4 aTotal flavonoid content (TF) was expressed in mg quercetine equivalents/g extract dry weight (mg QE/g d.w.); btotal phenol content (TP) was expressed as mg gallic acid equivalents/g extract dry weight (mg GAE/g d.w.)
A.R. NOVAKOVIĆ et al.: L. controversus Pers. 1800 AS A SOURCE OF ANTIOXIDANT AND CYTOTOXIC AGENTS Hem. ind. 70 (2) 113–122 (2016)
119
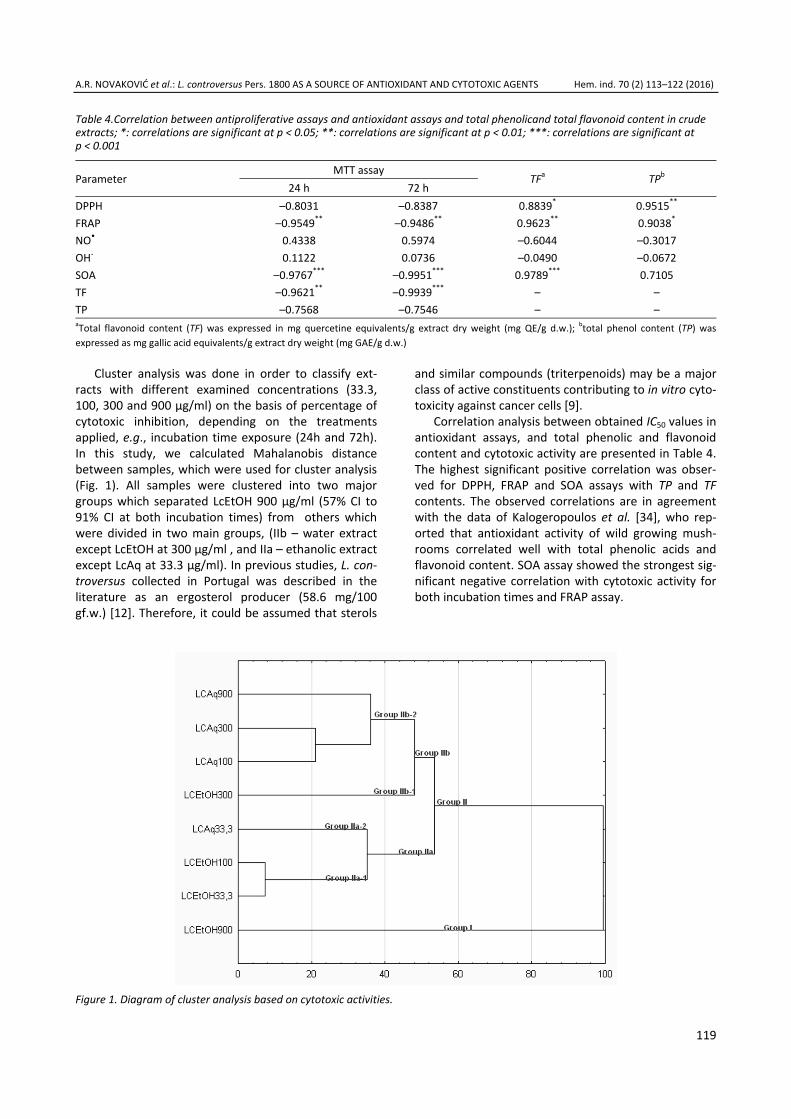
Cluster analysis was done in order to classify ext-racts with different examined concentrations (33.3, 100, 300 and 900 µg/ml) on the basis of percentage of cytotoxic inhibition, depending on the treatments applied, e.g., incubation time exposure (24h and 72h). In this study, we calculated Mahalanobis distance between samples, which were used for cluster analysis (Fig. 1). All samples were clustered into two major groups which separated LcEtOH 900 µg/ml (57% CI to 91% CI at both incubation times) from others which were divided in two main groups, (IIb – water extract except LcEtOH at 300 µg/ml , and IIa – ethanolic extract except LcAq at 33.3 µg/ml). In previous studies, L. con-troversus collected in Portugal was described in the literature as an ergosterol producer (58.6 mg/100 gf.w.) [12]. Therefore, it could be assumed that sterols
and similar compounds (triterpenoids) may be a major class of active constituents contributing to in vitro cyto-toxicity against cancer cells [9].
Correlation analysis between obtained IC50 values in antioxidant assays, and total phenolic and flavonoid content and cytotoxic activity are presented in Table 4. The highest significant positive correlation was obser-ved for DPPH, FRAP and SOA assays with TP and TF contents. The observed correlations are in agreement with the data of Kalogeropoulos et al. [34], who rep-orted that antioxidant activity of wild growing mush-rooms correlated well with total phenolic acids and flavonoid content. SOA assay showed the strongest sig-nificant negative correlation with cytotoxic activity for both incubation times and FRAP assay.
Figure 1. Diagram of cluster analysis based on cytotoxic activities.
Table 4.Correlation between antiproliferative assays and antioxidant assays and total phenolicand total flavonoid content in crude extracts; *: correlations are significant at p < 0.05; **: correlations are significant at p < 0.01; ***: correlations are significant at p < 0.001
Parameter MTT assay
TFa TPb 24 h 72 h
DPPH –0.8031 –0.8387 0.8839* 0.9515**
FRAP –0.9549** –0.9486** 0.9623** 0.9038*
NO• 0.4338 0.5974 –0.6044 –0.3017 OH˙ 0.1122 0.0736 –0.0490 –0.0672 SOA –0.9767*** –0.9951*** 0.9789*** 0.7105 TF –0.9621** –0.9939*** – – TP –0.7568 –0.7546 – – aTotal flavonoid content (TF) was expressed in mg quercetine equivalents/g extract dry weight (mg QE/g d.w.); btotal phenol content (TP) was expressed as mg gallic acid equivalents/g extract dry weight (mg GAE/g d.w.)

A.R. NOVAKOVIĆ et al.: L. controversus Pers. 1800 AS A SOURCE OF ANTIOXIDANT AND CYTOTOXIC AGENTS Hem. ind. 70 (2) 113–122 (2016)
120
MTT assay results significantly correlated negatively with TF, especially after 72h (–0.9939).These negative linear correlations proved that the highest antioxidant (lowest IC50) activities showed higher cytotoxic effects.
CONCLUSION
In summary, quinic acid (8.9 µg/g d.w.) was iden-tified and quantified by HPLC-MS/MS in methanol ext-ract of L. controversus which confirms that this species is a potentially good source of nutraceuticals. Both ethanol and water extracts of L. controversus posses-sed antioxidant activity, with water extract being the most potent in DPPH and SOA assays and ethanol ext-ract in FRAP assay. In antiproliferative assay both ext-racts showed activity against MCF 7 cell line, although ethanol extract was more potent. To our knowledge, this is the first report describing antioxidant, antibac-terial activity, and growth inhibitory properties of L. controversus. Our results revealed that the ethanol and water extracts L. controversus showed anticancer, anti-oxidant, and low antibiotic capacities. Together, these activities indicate that these mushrooms are promising sources of bioactive compounds.
Acknowledgement This paper is the result of research within the pro-
jects III 46001 and 172058, financed by the Ministry of Education, Science and Technological Development, Republic of Serbia. The authors would like to thank Prof. Goran Anačkov, PhD, for his valuable support in statistical analysis performance.
REFERENCES
[1] I.C.F.R. Ferreira, J.A. Vaz, M.H. Vasconcelos, A. Martins, Compounds from wild mushrooms with antitumor pot-ential, Anti-Cancer Agents Med. Chem. 10 (2010) 424– –436.
[2] D.L. Hawksworth, Mushrooms: the extent of the unexp-lored potential, Int. J. Med. Mushrooms 3 (2001).
[3] I.C.F.R. Ferreira, L. Barros, R. Abreu, Antioxidants in wild mushrooms, Curr. Med. Chem. 16 (2009) 1543–1560.
[4] F.S. Reis, A. Martins, L. Barros, I.C.F.R. Ferreira, Antioxidant properties and phenolic profile of the most widely appreciated cultivated mushrooms: A comparative study between in vivoand in vitrosamples, Food Chem. Toxicol. 50 (2012) 1201–1207.
[5] A.R. Leal, L. Barros, J. Barreira, M. J.Sousa, A. Martins, C. Santos-Buelga, I.C.F.R. Ferreira, Portuguese wild mush-rooms at the “pharma–nutrition” interface: Nutritional characterization and antioxidant properties, Food Res. Int. 50 (2013) 1–9.
[6] S.P. Wasser, A.L. Weis, Medicinal properties of sub-stances occurring in higher basidiomycetes mushrooms: current perspectives, Int. J. Med. Mushrooms 1 (1999) 31–62.
[7] B.-Z. Zaidman, M. Yassin, J. Mahajna, S.P. Wasser, Medicinal mushroom modulators of molecular targets as cancer therapeutics, Appl. Microbiol. Biotechnol. 67 (2005) 453–468.
[8] D.D. De Silva, S. Rapior, E. Sudarman, M. Stadler, J. Xu, S.A. Alias, K.D. Hyde, Bioactive metabolites from mac-rofungi: ethnopharmacology, biological activities and chemistry, Fungal Divers. 62 (2013) 1–40.
[9] R.R. M.Paterson, Ganoderma–A therapeutic fungal biofactory, Phytochemistry 67 (2006) 1985–2001.
[10] J.A. Vaz, S.A. Heleno, A. Martins, G.M. Almeida, M.H. Vasconcelos, I.C.F.R. Ferreira, Wild mushroomsClitocybe alexandri and Lepista inversa: In vitroantioxidant activity and growth inhibition of human tumour cell lines, Food Chem. Toxicol. 48 (2010) 2881–2884.
[11] J. Ferlay, P.Autier, M. Boniol, M. Heanue, M. Colombet, P. Boyle, Estimates of the cancer incidence and mor-tality in Europe in 2006, Ann. Oncol. 18 (2007) 581–592.
[12] L.M. Carvalho, F. Carvalho, M. de Lourdes Bastos, P. Baptista, N. Moreira, A.R. Monforte, A.C.S. Ferreira, P.G. de Pinho, Non-targeted and targeted analysis of wild toxic and edible mushrooms using gas chromatography–ion trap mass spectrometry, Talanta 118 (2014) 292– –303.
[13] D. Orčić, M.Francišković, K. Bekvalac, E. Svirčev, I. Beara, M. Lesjak, N.Mimica-Dukić, Quantitative determination of plant phenolics in Urtica dioica extracts by high-performance liquid chromatography coupled with tan-dem mass spectrometric detection, Food Chem. 143 (2014) 48–53.
[14] V.L. Singleton, R. Orthofer, R.M. Lamuela-Raventos, Analysis of total phenols and other oxidation substrates and antioxidants by means of Folin-Ciocalteu reagent, Methods Enzymol. 299 (1999) 152–178.
[15] C.C. Chang, M.H. Yang, H.M. Wen, J.C. Chern, Estimation of total flavonoid content in propolis by two comple-mentary colorimetric methods, J. Food Drug Anal. 10 (2002) 178–182.
[16] J.C. Espín, C. Soler-Rivas, H.J. Wichers, Characterization of the total free radical scavenger capacity of vegetable oils and oil fractions using 2, 2-diphenyl-1-picrylhydrazyl radical, J. Agric. Food Chem. 48 (2000) 648–656.
[17] I.F. Benzie, J.J. Strain, Ferric reducing/antioxidant power assay: Direct measure of total antioxidant activity of biological fluids and modified version for simultaneous measurement of total antioxidant power and ascorbic acid concentration, Methods Enzymol. 299 (1999) 15– –27.
[18] L.C. Green, D.A. Wagner, J. Glogowski, P.L. Skipper, J.S. Wishnok, S.R. Tannenbaum, Analysis of nitrate, nitrite, and [15N] nitrate in biological fluids, Anal. Biochem. 126 (1982) 131–138.
[19] M. Nishikimi, N. Appaji Rao, K. Yagi, The occurrence of superoxide anion in the reaction of reduced phenazine methosulfate and molecular oxygen, Biochem. Biophys. Res. Commun. 46 (1972) 849–854.
[20] K.H. Cheeseman, A.Beavis, H. Esterbauer, Hydroxyl-radi-cal-induced iron-catalysed degradation of 2-deoxyri-
A.R. NOVAKOVIĆ et al.: L. controversus Pers. 1800 AS A SOURCE OF ANTIOXIDANT AND CYTOTOXIC AGENTS Hem. ind. 70 (2) 113–122 (2016)
121
bose. Quantitative determination of malondialdehyde, Biochem. J. 252 (1988) 649–653.
[21] M.Karaman, N. Mimica-Dukic, P. Knezevic, Z. Svircev, M. Matavulj, Antibacterial properties of selected lignicolous mushrooms and fungi from northern Serbia, Int. J. Med. Mushrooms 11 (2009) 269–279.
[22] T. Mosmann,Rapid colorimetric assay for cellular growth and survival: Application to proliferation and cytotox-icity assays, J. Immunol. Methods 65 (1983) 55–63.
[23] P. Skehan, R. Storeng, D. Scudiero, A. Monks, J. MacMahon, D. Vistica, J.T. Warren, H. Bokesch, S. Kenney, M.R. Boyd, New Colorimetric Cytotoxicity Assay for Anticancer-Drug Screening, J. Nat. Cancer Inst. 82 (1990) 1107–1112.
[24] Statistica (Data Analysis Software System), version 12.0. StatSoft Inc., Tulsa, OK, USA, 2013 (www.statsoft.com).
[25] R.W. Pero, H. Lund, T. Leanderson, Antioxidant meta-bolism induced by quinic acid. Increased urinary exc-retion of tryptophan and nicotinamide, Phytother. Res. 23 (2009) 335–346.
[26] L. Barros, C. Pereira, I.F.R. Ferreira, Optimized Analysis of Organic Acids in Edible Mushrooms from Portugal by Ultra Fast Liquid Chromatography and Photodiode Array Detection, Food Anal. Methods 6 (2013) 309–316.
[27] R.W. Pero, H. Lund, Dietary quinic acid supplied as the nutritional supplement AIO + AC-11® leads to induction of micromolar levels of nicotinamide and tryptophan in the urine, Phytother. Res. 25 (2011) 851–857.
[28] Y. Soh, J.A. Kim, N.W. Sohn, K.R. Lee, S.Y. Kim, Protective effects of quinic acid derivatives on tetrahydropapa-veroline-induced cell death in C6 glioma cells, Biol. Pharm. Bull. 26 (2003) 803–807.
[29] R.W. Pero, Health Consequences of Catabolic Synthesis of Hippuric Acid in Humans, Curr. Clin. Pharmacol. 5 (2010) 67–73.
[30] L. Barros, M. Dueñas, I.C. Ferreira, P. Baptista, C. Santos- -Buelga, Phenolic acids determination by HPLC–DAD– –ESI/MS in sixteen different Portuguese wild mush-rooms species, Food Chem. Toxicol. 47 (2009) 1076– –1079.
[31] B. Halliwell, Antioxidants in human health and disease, Annu. Rev. Nutr. 16 (1996) 33–50.
[32] R.L.Prior, X. Wu, K. Schaich, Standardized Methods for the Determination of Antioxidant Capacity and Phe-nolics in Foods and Dietary Supplements, J. Agric. Food Chem. 53 (2005) 4290–4302.
[33] C. Sarikurkcu, B. Tepe, M. Yamac, Evaluation of the antioxidant activity of four edible mushrooms from the Central Anatolia, Eskisehir–Turkey: Lactarius deter-rimus,Suillus collitinus, Boletus edulis, Xerocomus chry-sentero, Bioresour. Technol. 99 (2008) 6651–6655.
[34] N. Kalogeropoulos, A.E. Yanni, G. Koutrotsios, M. Aloupi, Bioactive microconstituents and antioxidant properties of wild edible mushrooms from the island of Lesvos, Greece, Food Chem. Toxicol. 55 (2013) 378–385.

A.R. NOVAKOVIĆ et al.: L. controversus Pers. 1800 AS A SOURCE OF ANTIOXIDANT AND CYTOTOXIC AGENTS Hem. ind. 70 (2) 113–122 (2016)
122
IZVOD
JESTIVA MIKORIZNA VRSTA Lactarius controversus PERS. 1800 KAO IZVOR ANTIOKSIDATIVNIH I CITOTOKSIČNIH AGENASA
Aleksandra R. Novaković1, Maja A. Karaman2, Ivan Lj Milovanović1, Miona M. Belović1, Milena J. Rašeta3, Tanja I. Radusin1, Nebojša M. Ilić1 1Institut za prehrambene tehnologije, Univerzitet u Novom Sadu, Bulevar cara Lazara 1, 21000 Novi Sad, Srbija 2Departman za biologiju i ekologiju, Prirodno–matematički fakultet, Univerzitet u Novom Sadu, Trg Dositeja Obradovića 3, 21000 Novi Sad, Srbija 3Departman za hemiju, biohemijui zaštitu okoline, Prirodno–matematički fakultet, Univerzitet u Novom Sadu, Trg Dositeja Obradovića 3, 21000 Novi Sad, Srbija
(Naučni rad)
Lactarius controversus Pers. 1800 je vrsta gljive sa veoma oštrim ukusom, alise može koristiti u ljudskoj ishrani nakon kuvanja. Cilj ovog rada je bio da se proučihemijski profil i antioksidativna i citotoksična aktivnost etanolnih i vodenih eks-trakata ove samonikle vrste sa lokacije iz istočne Srbije. Sadržaj ukupnih fenola iflavonoida je imao više vrednosti za etanolne ekstrakte (45,84 mg GAE/g d.w. i3,50 mg QE/g d.w).Takođe je ispitana i antioksidativna aktivnost, uključujućiaktivnost protiv DPPH•, NO•, •OH i SOA radikala i sposobnost redukcije gvožđa.Najveću aktivnost protiv DPPH• je imao vodeni ekstrakt (IC50 = 219,37 µg/ml) dok je etanolni ekstrakt demonstrirao najveću FRAP aktivnost od 10,93 mg AAE/g. Hemijska karakterizacija fenolnih jedinjenja izvedena pomoću HPLC–MS/MS je pokazala prisustvo hininske kiseline (8,9 µg/g d.w.). Heksanski ekstrakt primenjenu antibakterijskom testu duplog razblaženja, protiv tri patogena soja, je pokazaoantibakterijsko dejstvo samo protiv S. aureus ATCC25922, postižući MIC i MBC od 3,12 i 6,25 mg/ml, redom. Antiproliferativno dejstvo na estrogen zavisnu MCF 7ćelijsku liniju raka dojke određeno pomoću MTT testa je bilo jače za etanolneekstrakte (166,42±3,1 µg/ml). Podaci dobijeni u ovi testovima ukazuju da je ovavrsta gljive obećavajući izvor bioaktivnih jedinjenja sa antioksidativnim i citotok-sičnim dejstvom.
Ključne reči: Lactarius controversus •Fenolna jedinjenja • Hinska kiselina •Antioksidanti • Citotoksični agensi
123
The impact of isatin derivatives on antibiotic production by Streptomyces hygroscopicus CH-7 Jovan T. Ćirić1, Sandra S. Konstantinović1, Slavica B. Ilić1, Gordana Gojgić-Cvijović2, Dragiša S. Savić1, Vlada B. Veljković1 1Faculty of Technology, University of Niš, Leskovac, Serbia 2Institute of Chemistry, Technology and Metallurgy, Department of Chemistry, University of Belgrade, Belgrade, Serbia
Abstract The effect of isatin derivatives as a nitrogen source on antibiotic (hexaene H-85 and azalomycine B) production by Streptomyces hygroscopicus CH-7 was studied. Isatin-3-hyd-razone, 5-chloroisatin-3-hydrazone, isatin-3-tosylhydrazone, 5-chloroisatin-3-tosylhydra-zone, isatin-3-(4`-hidroxy)benzoilhydrazone and 5-chloroisatin-3-(4'-hidroxy)benzoylhyd-razone were synthesized in a crude glycerol, obtained during the biodiesel production fromedible sunflower oil. The highest concentration of Hexaene H-85 is achieved with 5-chlo-roisatin-3-hydrazone (197 μg/cm3) in medium, while isatin-3-hydrazone has the greatestimpact on azalomycine B production (72 µg/cm3).
Keywords: isatin derivatives, Streptomyces hygroscopicus, hexaene H-85, azalomycine.
SCIENTIFIC PAPER
UDC 547.75:615.33:579.873.7
Hem. Ind. 70 (2) 123–128 (2016)
doi: 10.2298/HEMIND141127019C
Available online at the Journal website: http://www.ache.org.rs/HI/
A large number of bacteria and fungi have the ability to produce secondary metabolites. Microorg-anisms are the main sources of bioactive components, of which more than 60% are produced by Actino-mycetales, 28% by moulds and about 11% by nonfila-mentous organisms. Antibiotics are the most important secondary metabolites [1,2], and about three-quarters of known antibiotics with different chemical structures are produced by Actinomycetales [3,4]. Species of the genus Streptomyces are known as one of the best antibiotic producers [5], whereby some strains can pro-duce more than 180 different secondary metabolites [6].
Streptomyces hygroscopicus CH-7 produces antibio-tics such as hexaene H-85, nigericin and azalomycine B. By changing the conditions of fermentation process and the composition of the nutrient medium at an early stage of trial, it is possible to increase the yield of anti-biotics [7,8].
The production of antibiotics by Streptomyces spe-cies depends on the growth phase. The secondary met-abolism occurs when growth is limited, when nutrients are worn-out or their availability is reduced. The nature of limiting nutrient is very important, and essential ing-redients of substrate are carbon, nitrogen and phos-phorus. Other nutrients, such as mineral substances, have an impact on production, but their absence is not essential [9,10].
Correspondence: S.S. Konstantinović, Faculty of Technology, Univer-sity of Niš, Bulevar oslobodjenja 124, Leskovac 16000, Serbia. E-mail: [email protected] Paper received: 27 November, 2014 Paper accepted: 17 March, 2015
Isatin derivatives possess different biological acti-vity, such as antimicrobial, anticonvulsative, anticancer, antiHIV, etc. [11,12]. The usage of some isatin deri-vatives, such as isatin-3-thiosemicarbazone, isatin-3- -semicarbazone and isatin-3-phenylhydrazone as a nitrogen source for antibiotic production of S. hygro-scopicus CH-7 significantly increased hexaene H-85 and azalomycine B production [9,13,14]. Since those isatin derivatives were synthesized in crude glycerol as a green solvent, and similar compounds have a positive effect on antibiotic production, the idea was to replace a part of tryptophan with isatin products and gained even better results in hexaene H-85 and azalomycine B production.
MATERIALS AND METHODS
Organism, media and growth conditions A strain Streptomyces hygroscopicus CH-7 (NCAIM
(P) B-001336) was gained from the Microbial Collection at Faculty of Chemistry and Institute of Chemistry, Technology and Metallurgy in Belgrade, Serbia [15,16]. The culture was stored at 4 °C at soybean medium containing the following: 15 g/dm3 glucose; 10 g/dm3 soybean; 3 g/dm3 CaCO3; 3 g/ dm3 NaCl; 2 g/ dm3 agar (pH 7.2). Flasks (250 ml) that contained 50 ml of this media were inoculated with 0.1 ml of spore suspension and incubated at 30 °C with shaking at 200 rpm. The fermentation media were inoculated with 5 vol.% of a preculture after 48 h growth and incubated at 30 °C for 240 h under the standard condition of aeration and agi-tation (200 rpm). The composition of media used for fermentation were: basal medium (M1, 15 g/dm3 glu-cose; 10 g/dm3 soybean; 5 g/dm3 yeast extract; 3 g/dm3 CaCO3; 3 g/dm3 NaCl; 0.5 g/dm3 MgSO4⋅7H2O; 0.5
J.T. ĆIRIĆ et al.: ISATIN DERIVATIVES AND ANTIBIOTIC PRODUCTION BY S. hygroscopicus Hem. ind. 70 (2) 123–128 (2016)
124
g/dm3 (NH4)2HPO4; 1 g/dm3 K2HPO4); medium with tryptophan (M2, 15 g/dm3 glucose; 15 g/dm3 trypto-phan; 3 g/dm3 CaCO3; 3 g/dm3 NaCl; 0.5 g/dm3 MgSO4×7H2O; 0.5 g/dm3 (NH4)2HPO4; 1 g/dm3 K2HPO4) and media with isatin derivatives (15 g/dm3 glucose; 10 g/dm3 isatin derivatives; 5 g/dm3 tryptophan; 3 g/dm3 CaCO3 ; 3 g/dm3 NaCl; 0.5 g/dm3 MgSO4×7H2O; 0.5 g/dm3 (NH4)2HPO4; 1 g/dm3 K2HPO4).
The results were obtained by measuring absorbance at λmax = 364 nm (Hexaene H-85) and λmax = 252 nm (azalomycine B) with Perkin-Elmer Lambda 15 UV/Vis spectrophotometer [15,16]. Microbial growth was determined by measuring dry weights of cells [16].
Synthesis of isatin derivatives in the crude glycerol All chemicals, except crude glycerol, were of anal-
ytical grade and used without further purification. They were purchased from Sigma Aldrich. The crude glycerol, a by-product in the production of biodiesel from sunflower oil, was obtained from the Laboratory for Chemical Engineering, Faculty of Technology, Leskovac. The excess of methanol was removed from the crude glycerol by distillation. After distillation, the acidity of crude glycerol was adjusted to pH 5 by addition of 85% phosphoric acid. The inorganic salts formed in this stage were then removed by centrifugation at 400 rpm for 15 min.
Isatin derivatives were synthesized by the reaction of equimolar amounts of isatin and amine components in the crude glycerol as a green solvent [17]. The mix-ture was refluxed at 80 °C. The products, precipitated
as a colored solid, were filtered and washed out with water.
RESULTS AND DISCUSSION
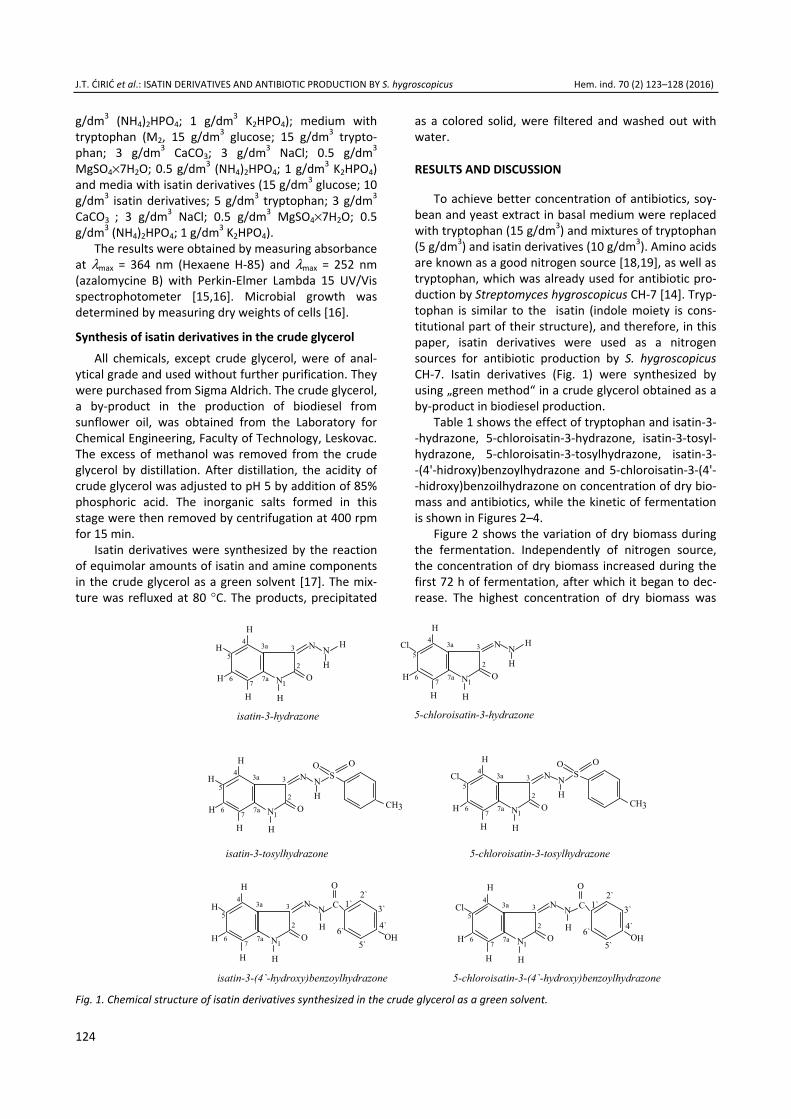
To achieve better concentration of antibiotics, soy-bean and yeast extract in basal medium were replaced with tryptophan (15 g/dm3) and mixtures of tryptophan (5 g/dm3) and isatin derivatives (10 g/dm3). Amino acids are known as a good nitrogen source [18,19], as well as tryptophan, which was already used for antibiotic pro-duction by Streptomyces hygroscopicus CH-7 [14]. Tryp-tophan is similar to the isatin (indole moiety is cons-titutional part of their structure), and therefore, in this paper, isatin derivatives were used as a nitrogen sources for antibiotic production by S. hygroscopicus CH-7. Isatin derivatives (Fig. 1) were synthesized by using „green method“ in a crude glycerol obtained as a by-product in biodiesel production.
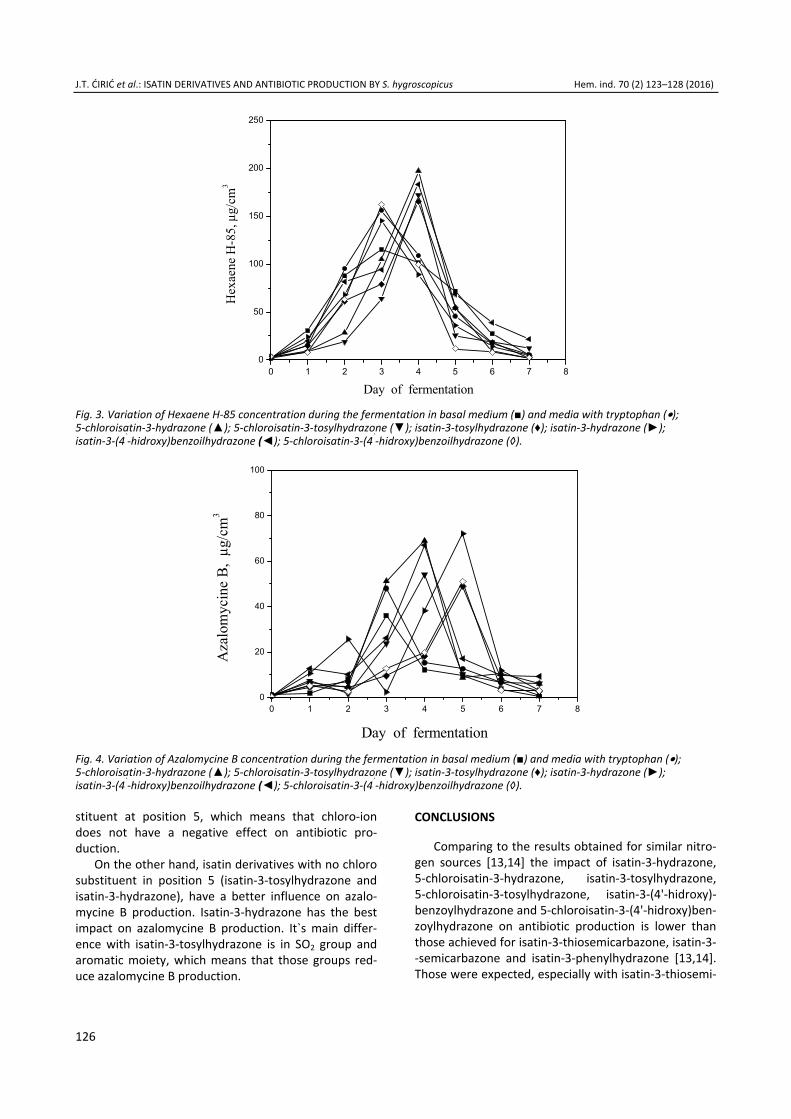
Table 1 shows the effect of tryptophan and isatin-3- -hydrazone, 5-chloroisatin-3-hydrazone, isatin-3-tosyl-hydrazone, 5-chloroisatin-3-tosylhydrazone, isatin-3- -(4'-hidroxy)benzoylhydrazone and 5-chloroisatin-3-(4'- -hidroxy)benzoilhydrazone on concentration of dry bio-mass and antibiotics, while the kinetic of fermentation is shown in Figures 2–4.
Figure 2 shows the variation of dry biomass during the fermentation. Independently of nitrogen source, the concentration of dry biomass increased during the first 72 h of fermentation, after which it began to dec-rease. The highest concentration of dry biomass was
Cl
5-chloroisatin-3-hydrazone
HN
N
N
O
H
H
H
H 1
2
33a4
5
6 7 7a
HH
7a76
5
4 3a 3
2
1H
H
H
H
O
N
N
NH
isatin-3-hydrazone
H
isatin-3-tosylhydrazone 5-chloroisatin-3-tosylhydrazone
O OS
CH37a76
5
4 3a 3
2
1H
H
H
H
O
N
N
NH
Cl
HN
N
N
O
H
H
H
H 1
2
33a4
5
6 7 7a CH3
SOO
6`5`
4`
3`2`
1`
OH
C
O
H7a
76
5
43a 3
2
1H
H
H
H
H
O
N
N
N
isatin-3-(4`-hydroxy)benzoylhydrazone 5-chloroisatin-3-(4`-hydroxy)benzoylhydrazone
N
N
N
O
H
H
H
H 1
2
33a4
5
67
7aH
O
C
HO
1`2`
3`
4`
5`6`
Cl
H
Fig. 1. Chemical structure of isatin derivatives synthesized in the crude glycerol as a green solvent.

J.T. ĆIRIĆ et al.: ISATIN DERIVATIVES AND ANTIBIOTIC PRODUCTION BY S. hygroscopicus Hem. ind. 70 (2) 123–128 (2016)
125
achieved in medium M1 and medium modified with isa-tin-3-hydrazone, after 48 h (9.0 g/dm3). Comparing to all tested media, the lowest value of dry biomass was achieved with 5-chloroisatin-3-tosylhydrazone (8.0 g/dm3).
The results obtained during the ferementation show that isatin derivatives have different impact on antibiotic production by Streptomyces hygroscopicus CH-7 (Table 1 and Fig. 3). The concentration of hexaene H-85 increases in first 48 h and reaches the highest values (197 μg/cm3) with 5-chloroisatin-3-hydrazone as a nitrogen source in 4th day of fermentation. This is 72% higher, while the yield of hexaene H-85 in medium with 5-chloroisatin-3-tosylhydrazone is higher for 51% than value for medium M1, actually 26 and 11% higher than medium M2. Higher values for antibiotic concen-tration, comparing to basal medium and medium with tryptophan were also obtained in media with isatin-3- -tosylhydrazone (165 μg/cm3) and isatin-3-hydrazone (183 μg/cm3). The highest concentration of hexaene H-85 in a medium with tryptophan is achieved during
the 72 h of fermentation (156 μg/cm3), which is 36% higher than in medium with soybean and yeast extract.
The variation of azalomycine B during the ferment-ation is given in a Fig. 4. The highest concentration of azalomycine B in basal medium was reached after 72 h of fermentation (36 µg/cm3) and in the media with tryptophan and isatin derivatives during 72–96 h. The increase of azalomycine B concentration in the medium with tryptophan is 33% higher than basal medium (Table 1). The addition of 5-chloroisatin-3-hydrazone and 5-chloroisatin-3-tosylhydrazone stimulates azalo-mycine B production, with maximum 61 and 54 µg/cm3,
respectively. The higher yield was achieved in media with isatin-3-tosylhydrazone (67 µg/cm3) and isatin-3- -hydrazone (72 µg/cm3).
It`s very difficult to find a connection between the structure of isatin derivatives and antibiotic production. The results show that isatin-3-hydrazone and 5-chloro-isatin-3-hydrazone have greater influence on hexaene H-85 production. The main structure of those com-pounds is identical, and the only difference is in sub-
Table 1. The effect of tryptophan and isatin derivatives as a nitrogen source on the maximum dry biomass concentration (Xmax) and the maximum antibiotic concentration (cmax)
Nitrogen source Dry biomass Xmax / g dm–3
Hexaene H-85 cHmax / μg cm–3
Azalomycine B cEmax / μg cm–3
M1 9.0 114 36 M2 8.3 156 48 5-chloroisatin-3-hydrazone + tryptophan (10 g/dm3+5 g/dm3) 8.6 197 61 5-chloroisatin-3-tosylhydrazone + tryptophan (10g/dm3+5g/dm3) 8.0 172 54 Isatin-3-tosylhydrazone + tryptophan (10g/dm3+5g/dm3) 8.1 165 67 Isatin-3-hydrazone + tryptophan (10g/dm3+5g/dm3) 9.0 183 72 Isatin-3-(4`-hidroxy)benzoylhydrazone + tryptophan (10g/dm3+5g/dm3) 8.2 145 49 5-chloroisatin-3-(4`-hidroxy)benzoilhydrazone + tryptophan (10g/dm3+5g/dm3)
7.9 162 51
0 1 2 3 4 5 6 7 80
2
4
6
8
10
Dry
bio
mas
s, g
/dm
3
Day of fermentation Fig. 2. Variation of dry biomass concentration during the fermentation of Streptomyces hygroscopicus CH-7 in basal medium (■) and media with tryptophan (•); 5-chloroisatin-3-hydrazone (▲); 5-chloroisatin-3-tosylhydrazone (▼); isatin-3-tosylhydrazone (♦); isatin-3-hydrazone (►); isatin-3-(4`-hidroxy)benzoilhydrazone (◄); 5-chloroisatin-3-(4`-hidroxy)benzoilhydrazone (◊).
J.T. ĆIRIĆ et al.: ISATIN DERIVATIVES AND ANTIBIOTIC PRODUCTION BY S. hygroscopicus Hem. ind. 70 (2) 123–128 (2016)
126
0 1 2 3 4 5 6 7 80
50
100
150
200
250
Hex
aene
H-8
5, μ
g/cm
3
Day of fermentation Fig. 3. Variation of Hexaene H-85 concentration during the fermentation in basal medium (■) and media with tryptophan (•); 5-chloroisatin-3-hydrazone (▲); 5-chloroisatin-3-tosylhydrazone (▼); isatin-3-tosylhydrazone (♦); isatin-3-hydrazone (►); isatin-3-(4`-hidroxy)benzoilhydrazone (◄); 5-chloroisatin-3-(4`-hidroxy)benzoilhydrazone (◊).
0 1 2 3 4 5 6 7 80
20
40
60
80
100
Aza
lom
ycin
e B,
μg/
cm3
Day of fermentation Fig. 4. Variation of Azalomycine B concentration during the fermentation in basal medium (■) and media with tryptophan (•); 5-chloroisatin-3-hydrazone (▲); 5-chloroisatin-3-tosylhydrazone (▼); isatin-3-tosylhydrazone (♦); isatin-3-hydrazone (►); isatin-3-(4`-hidroxy)benzoilhydrazone (◄); 5-chloroisatin-3-(4`-hidroxy)benzoilhydrazone (◊).
stituent at position 5, which means that chloro-ion does not have a negative effect on antibiotic pro-duction.
On the other hand, isatin derivatives with no chloro substituent in position 5 (isatin-3-tosylhydrazone and isatin-3-hydrazone), have a better influence on azalo-mycine B production. Isatin-3-hydrazone has the best impact on azalomycine B production. It`s main differ-ence with isatin-3-tosylhydrazone is in SO2 group and aromatic moiety, which means that those groups red-uce azalomycine B production.
CONCLUSIONS
Comparing to the results obtained for similar nitro-gen sources [13,14] the impact of isatin-3-hydrazone, 5-chloroisatin-3-hydrazone, isatin-3-tosylhydrazone, 5-chloroisatin-3-tosylhydrazone, isatin-3-(4'-hidroxy)-benzoylhydrazone and 5-chloroisatin-3-(4'-hidroxy)ben-zoylhydrazone on antibiotic production is lower than those achieved for isatin-3-thiosemicarbazone, isatin-3- -semicarbazone and isatin-3-phenylhydrazone [13,14]. Those were expected, especially with isatin-3-thiosemi-

J.T. ĆIRIĆ et al.: ISATIN DERIVATIVES AND ANTIBIOTIC PRODUCTION BY S. hygroscopicus Hem. ind. 70 (2) 123–128 (2016)
127
carbazone and isatin-3-semicarbazone, since their structure is the most similar with tryptophan.
Acknowledgements This work has been funded by the Ministry of Edu-
cation, Science and Technological Development of the Republic of Serbia (Project III 45001).
REFERENCES
[1] Y. Okami, K. Hotta, Search and discovery of new anti-biotics, Actinomycetes in biotechnology, Academic Press, 1988, pp. 33–67.
[2] G. Lancini, R. Lorenzetti, iotechnology of antibiotics and other bioactive microbial metabolites, Plenum Press, New York, 1993, pp. 1, 29, 95, 133, 145.
[3] H. Schrempf, Streptomycetaceae: Life Style, Genome, Metabolism and Habitats. In: Encyclopedia of Life Sci-ences (ELS). John Wiley & Sons Ltd, Chichester, 2008.
[4] J. Berdy, Bioactive Microbial Metabolites, J. Antibiot. 58 (2005) 1–26.
[5] B. Mythili, M.P. Ayyappa Das, Studies on Antimicrobial Activity of Streptomycin spp. Isolates from Tea Plan-tation Soil, Res. J. Agricul. Scien. 2 (2011) 104–106.
[6] A.L. Demain, Pharmaceutically active secondary meta-bolites of microorganisms, Appl. Microbial. Biot. 52 (1999) 455–463.
[7] S.B. Ilić, S.S. Konstantinović, G. Gojgić-Cvijović, D.S. Savić, V.B. Veljković, The impact of glycerol and some carbohydrates on antibiotic production by Streptomyces hygroscopicus CH-7, Med. Chem. Res. 22 (2013) 934– –937.
[8] J.T. Ćirić, S.B. Ilić, S.S. Konstantinović, V.B. Veljkovic, G. Gojgić-Cvijović, D.S. Savić, The fermentation of glycerol by Streptomyces hygroscopius CH-7 bacteria, Savremene tehnologije 2 (2012) 20–25.
[9] S.B. Ilić, Uticaj sastava i reoloških svojstava hranljive podloge na kinetiku produkcije antibiotika pomoću bak-terije Streptomyces hygroscopicus CH-7, Doktorska
disertacija, Tehnološki fakultet, Univerzitet u Nišu, Leskovac, 2010.
[10] T. Neumann, W. Piepersberg, J. Distler, Decision phase regulation of streptomycin production in Streptomyces griseus, Microbiology 142 (1996) 1953–1963.
[11] S.S. Konstantinović, Sinteza, struktura i antimikrobna aktivnost koordinacionih jedinjenja izatin-Schiff-ovih baza, Doktorska disertacija, Prirodno-Matematički fakul-tet, Univerzitet u Nišu, Niš, 2007.
[12] S.S. Konstantinović, B.C. Radovanović, S.P. Sovilj, S.S. Stanojević, Antimicrobial activity of some isatin-3-thio-semicarbazone complexes, J. Serb. Chem. Soc. 72 (2008) 7–13.
[13] S.B. Ilić, S.S. Konstantinović, V.B. Veljković, D.S. Savić, G. Gojgić-Cvijović, The impact of different carbon and nit-rogen sources on antibiotic production by Streptomyces hygroscopicus CH-7 in: Current Research, Technology and Education Topics in Applied Microbiology and Mic-robial Biotechnology, Formatex, Spain, 2010.
[14] S.B. Ilić, S.S. Konstantinović, D.S. Savić, V.B. Veljković, G. Gojgić-Cvijović, The impact of Schiff bases on antibiotic production by Streptomyces hygroscopicus, Med. Chem. Res. 19 (2010) 690–697.
[15] J. Vučetić, I. Karadžić, G. Gojgić-Cvijović, E. Radovanović, Improving hexaene H-85 production by Streptomyces hygroscopicus, J. Serb. Chem. Soc. 59 (1994) 973–980.
[16] I. Karadžić, G. Gojgić-Cvijović, J. Vučetić, Hexaene H-85, A hexaene H-85 macrolide complex, J. Antibiot. 12 (1991) 1452–1453.
[17] M. Jovanović, S. Konstantinović, S. Ilić, V. Veljković, The synthesis of vanillin- semicarbazone in crude glycerol as a green solvent, Adv. Technol. 2 (2013) 38–44.
[18] M. Mahesh, N. Meenakshi, Effect of carbon and nitro-gen source for the production of tetracycline analysis by using HPLC, Int. J. Adv. Biotechnol. Res. 4 (2013) 218– –223.
[19] S. Rattleff, Heterologous protein production in Strepto-myces lividans, Phd thesis, Technical University of Den-mark, Denmark, 2013.

J.T. ĆIRIĆ et al.: ISATIN DERIVATIVES AND ANTIBIOTIC PRODUCTION BY S. hygroscopicus Hem. ind. 70 (2) 123–128 (2016)
128
IZVOD
UTICAJ DERIVATA IZATINA NA PRODUKCIJU ANTIBIOTIKA POMOĆU Streptomyces hygroscopicus CH-7 Jovan T. Ćirić1, Sandra S. Konstantinović1, Slavica B. Ilić1, Gordana Gojgić-Cvijović2, Dragiša S. Savić1, Vlada B. Veljković1
Tehnološki fakultet u Leskovcu, Univerzitet u Nišu, Bulevar oslobođenja 124, 16000 Leskovac, Srbija 2Institut za hemiju, tehnologiju i metalurgiju, Njegoševa 12, P.O. Box 815, Beograd 11000, Srbija
(Naučni rad)
Intenzivna istraživanja poslednjih godina vrše se na polju poboljšanja produk-cije sekundarnih metabolita sa različitom aktivnošću i primenom u biotehnologiji.Streptomiceta Steptomyces hygroscopicus raste i produkuje sekundarne meta-bolite na podlogama različitog sastava. Izvor azota značajno utiče kako na primar-ni tako i na sekundarni metabolizam, odnosno na rast, razvoj i produkciju sekun-darnih metabolita. Pri fermentaciji u tečnoj podlozi, ovaj soj proizvodi smešuantibiotika. U ovom radu je proučavan uticaj derivata izatina, kao izvora azota naprodukciju antibiotika heksaena H-85 i azalomicina B pomoću soja Streptomyces hygroscopicus CH-7. Derivati izatina poseduju različite biološke aktivnost i dosa-dašnjim istraživanjima je ustanovljeno da imaju stimulativno dejstvo kako na pri-marni tako i na sekundarni metabolizam. Izatin-3-tozilhidrazon, izatin-3-hidrazon, izatin-3-(4`-hidroksi)benzoilhidrazon, 5-hloroizatin-3-(4`-hidroksi)benzoilhidrazon, 5-hloroizatin-3-tozilhidrazon i 5-hloroizatin-3-hidrazon su sintetisani u sirovomglicerolu dobijenom tokom procesa proizvodnje biodizela od jestivog suncokre-tovog ulja. Najviša koncentracija Heksaena H-85 je postignuta u podlozi sa 5-hlo-roizatin-3-hidrazonom (197 μg/cm3) dok je izatin-3-hidrazon imao najveći uticaj naprodukciju azalomicina B (72 µg/cm3).
Ključne reči: Derivati izatina • Strepto-myces hygroscopicus • Heksaena H-85 •Azalomicina B

129
Linamarase production by some microbial isolates and a comparison of the rate of degradation of cassava cyanide by microbial and cassava linamarases Ogbonnaya Nwokoro Industrial Microbiology and Biotechnology Laboratory, Department of Microbiology, University of Nigeria, Nsukka, Nigeria
Abstract Production of linamarase and the effects of media composition on enzyme productionwere studied. A total of eight linamarase-producing bacteria were isolated from fer-menting cassava tubers and soil samples. Selection of the isolates was based on their fastgrowth in media containing 800 mg/L potassium cyanide solution. Eight of the isolateswhich showed very fast growth in the growth medium as demonstrated by increase intheir optical density readings to at least 0.6 in the cyanide containing media were selectedfor further studies. The isolates were identified as Lactobacillus plantarum, Lactobacillus fermentum, Lactobacillus amylovorus, Lactobacillus cellobiosus, Leuconostoc mesente-roides, Pseudomonas stutzeri, Bacillus pumilus and Bacillus subtilis. All the isolates were grown in media containing Tween 80 solution and in control media without the surfactant.Best enzyme activity of 6.82 U/mL was obtained in the medium containing Tween 80 sol-ution and Lactobacillus fermentum as the test bacterium. Comparatively, linamaraseproduction by the isolates in media without Tween 80 showed lower enzyme productivity.Cassava endogenous and microbial enzymes were tested for their abilities to hydrolyzecyanide in cassava flour samples pretreated to either remove the endogenous or microbialenzyme. Residual cyanide in cassava flour samples treated with linamarase of Lactobacillus plantarum was undetected in 30 h, while in contrast, the residual cyanide in cassava floursamples treated with endogenous linamarase was 0.39 mg/10 g cassava flour after 80 h. Residual cyanide in the untreated control sample was 1.98 mg HCN /10 g cassava flour after 80 h. The results from this finding demonstrated improved cassava cyanide degrad-ation with microbial linamarase as compared to endogenous cassava linamarase. Massiveinoculation of fermenting cassava tubers with the isolates reported in this study wouldenable better control of the cassava fermentation process and may lead to the production of standardized and non-toxic cassava food products.
Keywords: linamarase, cassava cyanide reduction, microorganisms, surfactant.
SCIENTIFIC PAPER
UDC 579:547:66.0:66.094.941
Hem. Ind. 70 (2) 129–136 (2016)
doi: 10.2298/HEMIND141028021O
Available online at the Journal website: http://www.ache.org.rs/HI/
Cassava, the vital food in the tropical areas of Africa, Asia and Latin America is the third most important source of calories in the tropics after rice and corn [1]. Cassava is toxic as it contains large amounts of cyanogenic glucosides, linamarin and lotaustralin [2–4]. Daily consumption of foodstuffs which still contain residual levels of these cyanogenic compounds can result in chronic diseases such as goitre, cretinism, tropical atoxic neuropathy and tro-pical diabetes [5,6].
Cassava processing allows the reduction of toxic endogenous cyanogens which are present in variable concentrations in cassava tubers by volatilization of HCN present in the cassava tubers and consequent reduction of the cyanide levels. During the consequent fermentation, roots are softened, the disintegration of Correspondence: [email protected] Paper received: 28 October, 2014 Paper accepted: 3 March, 2015
the tissue structures result in the contact of linamarin with linamarase and subsequent hydrolysis to glucose and cyanohydrins which easily break down to ketone and hydrocyanic acid [7]. Retting is one of the simplest methods for the processing of cassava tubers into various African staple foods. In some conditions, retting may take considerably longer periods particularly with tubers older than 24 months and some of the tubers steeped under this condition may fail to soften. Other processing techniques such as cooking, sun-drying, oven-drying and roasting have been developed in dif-ferent parts of the world to reduce the cyanide content of cassava-based foods to an acceptable level. However none has achieved a complete detoxification [8]. The rate of fermentation depends on the processing method, size of cut tubers and the age of roots. With the increasing demand for foods due to a rapid popul-ation growth in many developing countries, the need has arisen to reduce the process time for retting of cas-sava roots.
O. NWOKORO: LINAMARASE PRODUCTION BY MICROBIAL ISOLATES AND DEGRADATION OF CASSAVA CYANIDE Hem. ind. 70 (2) 129–136 (2016)
130
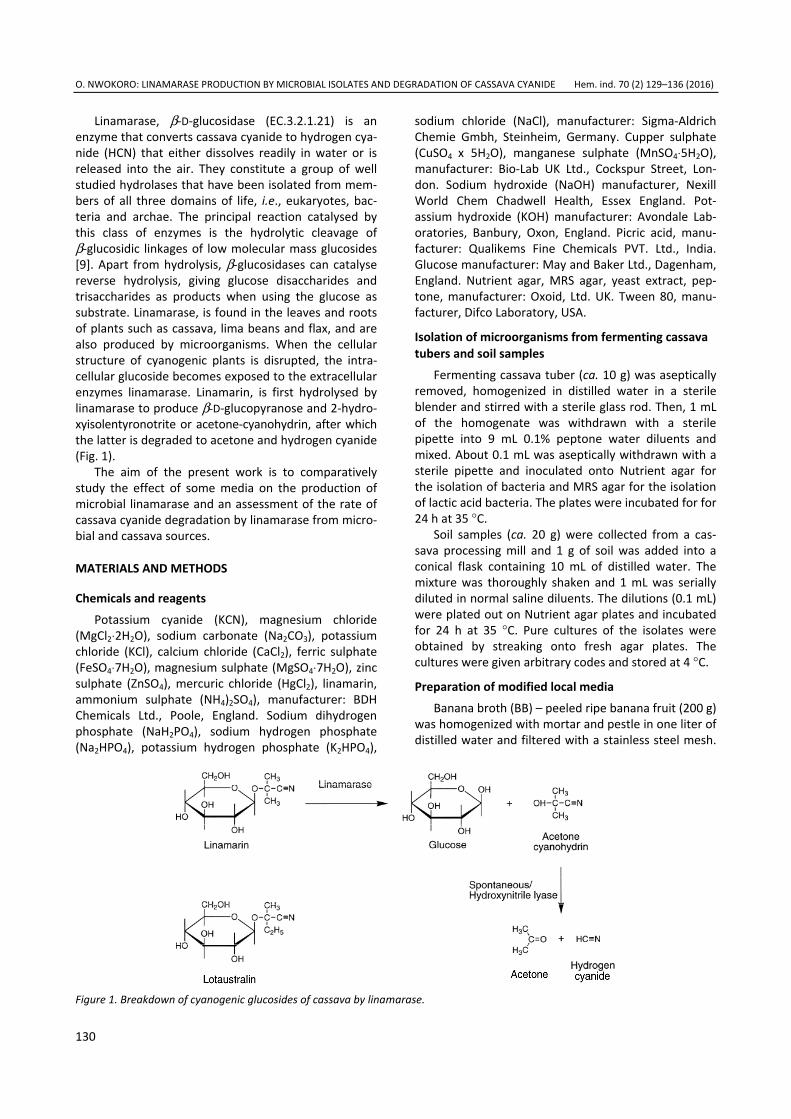
Linamarase, β-D-glucosidase (EC.3.2.1.21) is an enzyme that converts cassava cyanide to hydrogen cya-nide (HCN) that either dissolves readily in water or is released into the air. They constitute a group of well studied hydrolases that have been isolated from mem-bers of all three domains of life, i.e., eukaryotes, bac-teria and archae. The principal reaction catalysed by this class of enzymes is the hydrolytic cleavage of β-glucosidic linkages of low molecular mass glucosides [9]. Apart from hydrolysis, β-glucosidases can catalyse reverse hydrolysis, giving glucose disaccharides and trisaccharides as products when using the glucose as substrate. Linamarase, is found in the leaves and roots of plants such as cassava, lima beans and flax, and are also produced by microorganisms. When the cellular structure of cyanogenic plants is disrupted, the intra-cellular glucoside becomes exposed to the extracellular enzymes linamarase. Linamarin, is first hydrolysed by linamarase to produce β-D-glucopyranose and 2-hydro-xyisolentyronotrite or acetone-cyanohydrin, after which the latter is degraded to acetone and hydrogen cyanide (Fig. 1).
The aim of the present work is to comparatively study the effect of some media on the production of microbial linamarase and an assessment of the rate of cassava cyanide degradation by linamarase from micro-bial and cassava sources.
MATERIALS AND METHODS
Chemicals and reagents Potassium cyanide (KCN), magnesium chloride
(MgCl2⋅2H2O), sodium carbonate (Na2CO3), potassium chloride (KCl), calcium chloride (CaCl2), ferric sulphate (FeSO4⋅7H2O), magnesium sulphate (MgSO4⋅7H2O), zinc sulphate (ZnSO4), mercuric chloride (HgCl2), linamarin, ammonium sulphate (NH4)2SO4), manufacturer: BDH Chemicals Ltd., Poole, England. Sodium dihydrogen phosphate (NaH2PO4), sodium hydrogen phosphate (Na2HPO4), potassium hydrogen phosphate (K2HPO4),
sodium chloride (NaCl), manufacturer: Sigma-Aldrich Chemie Gmbh, Steinheim, Germany. Cupper sulphate (CuSO4 x 5H2O), manganese sulphate (MnSO4⋅5H2O), manufacturer: Bio-Lab UK Ltd., Cockspur Street, Lon-don. Sodium hydroxide (NaOH) manufacturer, Nexill World Chem Chadwell Health, Essex England. Pot-assium hydroxide (KOH) manufacturer: Avondale Lab-oratories, Banbury, Oxon, England. Picric acid, manu-facturer: Qualikems Fine Chemicals PVT. Ltd., India. Glucose manufacturer: May and Baker Ltd., Dagenham, England. Nutrient agar, MRS agar, yeast extract, pep-tone, manufacturer: Oxoid, Ltd. UK. Tween 80, manu-facturer, Difco Laboratory, USA.
Isolation of microorganisms from fermenting cassava tubers and soil samples
Fermenting cassava tuber (ca. 10 g) was aseptically removed, homogenized in distilled water in a sterile blender and stirred with a sterile glass rod. Then, 1 mL of the homogenate was withdrawn with a sterile pipette into 9 mL 0.1% peptone water diluents and mixed. About 0.1 mL was aseptically withdrawn with a sterile pipette and inoculated onto Nutrient agar for the isolation of bacteria and MRS agar for the isolation of lactic acid bacteria. The plates were incubated for for 24 h at 35 °C.
Soil samples (ca. 20 g) were collected from a cas-sava processing mill and 1 g of soil was added into a conical flask containing 10 mL of distilled water. The mixture was thoroughly shaken and 1 mL was serially diluted in normal saline diluents. The dilutions (0.1 mL) were plated out on Nutrient agar plates and incubated for 24 h at 35 °C. Pure cultures of the isolates were obtained by streaking onto fresh agar plates. The cultures were given arbitrary codes and stored at 4 °C.
Preparation of modified local media Banana broth (BB) – peeled ripe banana fruit (200 g)
was homogenized with mortar and pestle in one liter of distilled water and filtered with a stainless steel mesh.
Figure 1. Breakdown of cyanogenic glucosides of cassava by linamarase.

O. NWOKORO: LINAMARASE PRODUCTION BY MICROBIAL ISOLATES AND DEGRADATION OF CASSAVA CYANIDE Hem. ind. 70 (2) 129–136 (2016)
131
The filtrate was re-filtered with a Whatman No. 1 filter paper. The broth was fortified with 0.1% ammonium sulphate and sterilized by autoclaving at 121 °C for 10 min.
Orange broth (OB) – fully-ripped oranges (200 g) were peeled and ground with a Corona mill (Medellin, Colombia) after removing the seeds in one liter of dis-tilled water, and filtered with a stainless steel mesh. The filtrate was re-filtered with a Whatman No. 1 filter and fortified with 0.1% ammonium sulphate and ster-ilized by autoclaving at 121 °C for 10 min.
Tomatoj broth (TJB) – fresh tomato fruits (200 g) were homogenized in distilled water and filtered with a stainless steel mesh. The filtrate was re-filtered with a Whatman No. 1 filter paper and made up to 100 ml with distilled water. The broth was fortified with 0.1% ammonium sulphate and autoclaved at 121 °C for 10 min.
Screening the isolates for their resistance to cyanide Test tubes each containing 5 mL of screening
medium (yeasts extract, 0.5%; peptone 0.7%, glucose, 2% in 100 mL of distilled water) were autoclaved at 121 °C for 15 min. Then, aliquots (0.1 mL), potassium cyanide (KCN) solution (800 mg/L) which was sterilized by tyndallization according to Collins and Lyne [10] was added into each test tube containing the screening medium. A loopful of each bacterial isolate was ino-culated into each test tube. The test tubes were incub-ated at room temperature (30±2 °C) for 2 days. The sensitivity/ resistance of each isolate to cyanide were monitored with a Spectrumlab 23A spectrophotometer at 600 nm against distilled water blank. Isolates that gave OD readings of at least 0.6 after 2 d incubation period were selected for further work. The isolates were identified respectively as Lactobacillus plantarum, Lactobacillus fermentum, Lactobacillus amylovorus, Lactobacillus cellobiosus, Leuconostoc mesenteroides, Pseudomonas stutzeri, Bacillus pumilus and Bacillus subtilis based on the taxonomic descriptions given by Holt et al. [11] and Skinner and Lovelock [12].
Development of inocula of lactic acid bacterial iso-lates. Inoculum was prepared from a stock culture by transferring to an Erlenmeyer flask (250 ml) containing 100 ml of medium described by Okafor and Ejiofor [13]: NaCl, 0.3%; (NH4)2SO4, 0.1%; KH2PO4, 0.05%; MgSO4, 0.02%; CaCl2, 0.02%; lactose, 3%; linamarin, 0.15%. The medium was sterilized at 121 °C for 15 min. The ino-culum was grown for 24 h in a Gallenkamp orbital incubator at 50g at 30 °C. The cells were collected by centrifugation at 2515g for 15 min in a Gallenkamp junior centrifuge, washed and diluted with sterile dis-tilled water to an optical density of 0.1 measured in a Spectrumlab 23A spectrophotometer at 600 nm.
Development of inoculum of Pseudomonas sutzeri. The medium for multiplication of Pseudomonas sutzeri
had the following composition per litre of distilled water: K2HPO4, 1 g; MgSO4⋅7H2O, 0.2 g; CaCl2, 0.01 g; NaCl, 0.01 g; MnSO4, 2 mg; CuSO4⋅5H2O, 0.2 mg; ZnSO4, 0.2 mg; glucose, 2 g; tryptone, 1 g; and linamarin, 3 g. The medium was sterilized at 121 °C for 15 min. The inoculum was grown for 24 h in a Gallenkamp orbital incubator at 50g at 30 °C. The cells were collected by centrifugation at 2515g for 15 min, washed and diluted with sterile distilled water to an optical density of 0.1 measured in a Spectrumlab 23A spectrophotometer at 600 nm.
Development of inocula of Bacillus pumilus and Bac-illus subtilis. The medium contained the following per litre: linamarin 3 g; peptone, 10 g; KCl, 1.0 g; MgCl2⋅2H2O, 0.2 g; CaCl2⋅2H2O, 0.25 g; FeSO4⋅7H2O, 5 mg; MnSO4⋅5H2O, 1 mg; Na2HPO4 5.26 g; NaH2PO4 5.4 g. The medium was sterilized at 121 °C for 15 min. The inoculum was grown for 24 h in a Gallenkamp orbital incubator at 50g at 30 °C. The cells were collected by centrifugation at 2515g for 15 min, washed and diluted with sterile distilled water to an optical density of 0.1 measured in a Spectrumlab 23A spectrophotometer at 600 nm.
Cultivation of bacteria Lactic acid bacterial isolates were grown in the fol-
lowing media: OB, TJB, BB and MRS broth. Pseudo-monas stutzeri, Bacillus pumilus and Bacillus subtilis were cultured in OB, TJB, BB and Nutrient broth. The isolates were added into 100 mL media containing 2% linamarin solution and incubated at 32±2 °C for 24 h. At the end of the incubation period, the culture was cen-trifuged at 2515g for 10 min. The effects of Tween 80 on the production and activity of the linamarase were studied by adding 0.1% Tween 80 into each duplicate culture flasks at the time of incubation. At the end of the incubation period, the culture was centrifuged at 2515g for 10 min.
Bacterial enzyme extraction The harvested cells were washed with 0.2 M phos-
phate buffer (pH 6.5) and the washed cell suspension was disrupted by sonication for 10 min. using Biologics Ultrasonic homogenizer, model 150VT (115V/60Hz). Following disruption, the mixture was centrifuged at 2515g for 15 min. The supernatants of the two centri-fugations were combined and suspended in 0.2 M phosphate buffer (pH 6.5). Ammonium sulphate was added with stirring to 40% saturation followed by cen-trifugation at 2515g for 10 min. Linamarase activity was then determined.
Extraction of endogenous cassava linamarase enzyme. Fresh cassava peel (100 g) was homogenized in 300 mL 0.2 M phosphate buffer (pH 6.5) using a mortar and pestle chilled by ice. The homogenate was centrifuged at 2515g for 15 min. The supernatant was

O. NWOKORO: LINAMARASE PRODUCTION BY MICROBIAL ISOLATES AND DEGRADATION OF CASSAVA CYANIDE Hem. ind. 70 (2) 129–136 (2016)
132
applied to a column of Sephadex G-25 (7 cm×62 cm) pre equilibrated with phosphate buffer (pH 6.5) and eluted with the same buffer to remove lower molecular weight compounds. Fractions were collected from the column and measured for linamarase activity.
Comparison of the rate of detoxification of cassava flour by microbial and endogenous cassava linamarases
Cassava tubers (NR 8082) were employed for this assay. The cassava tubers were peeled with knife and washed with tap water. The tubers were cut into cubes of approximately 10 cm and sun dried. The dried cassava tubers were milled with a mechanical greater.
To determine the effects of endogenous linamarase activity on the cyanogenic glucoside of cassava, cassava flour (10 g) contained in glass bottles was sterilized with 0.1% HgCl2 solution for 5 min, rinsed with distilled water and finally treated with 1% of hypochlorite solution for 5 min. To wash off the effects of these chemicals, the cassava flour was finally rinsed for 15 min in sterile distilled water.
To assess the role of microbial fermentation on the degradation of the cyanogenic glucoside of cassava, 1, 5-gluconolactone (an inhibitor of endogenous gluco-sidase enzyme) was added to cassava flour at 10% con-centration [14]. The effect of the inhibitor was rem-oved by treating the cassava pulp with 50% ethanol solution and rinsing with sterile distilled water.
Buffered linamarase enzymes of both microbial and cassava origin (20 mL each) were added into 10 g of treated cassava flour contained in glass bottles. Samples of untreated and uninoculated cassava flour (10 g) served as control. Then 2 mL of 2% KOH and 1mL of picric acid:Na2CO3:H2O, 1 mL:5 g:200 mL, contained in test tube were suspended in each bottle just before the bottles were sealed. The system was incubated at intervals of 10 h for 80 h at 30 °C. The HCN liberated from the cassava flour was absorbed by the alkaline picrate solution in the test tube [14]. After incubation, the reaction was stopped by placing the bottles in iced water. The colour that developed was read at 510 nm. Cyanide levels were extrapolated from KCN standard curve.
Analyses Cyanide was determined by a modification of the
alkaline picric acid method of Williams and Edwards [15] as follows: various quantities of standard (50, 100, 150 and 200 µg/ml) solution of KCN were added into tubes containing 2 ml of 2% KOH and 1ml of picric acid:Na2CO3:H2O, 1 mL:5 g:200 mL. The tubes were incubated for 10 min in a 37 °C water bath, cooled for 20 min in a refrigerator and read in a Spectrum lab 23A spectrophotometer at 510 nm. The readings were used
to draw a standard curve for micrograms KCN per mL against absorbance.
Linamarase activity was assayed by determining the HCN librated from linamarase as follows: 0.5 ml of enzyme solution in 0.2 M phosphate buffer (pH 6.5) contained in Eppendorf tubes was added to 0.5 ml of 1 mM buffered (same buffer) solution of linamarin (BDH, Poole, England). After 20 min of incubation at 32±2 °C, 2 mL of 2% KOH and 1 ml of picric acid:Na2CO3:H2O (1 mL:5 g:200 mL) were added into the reaction mix-ture. The reaction was stopped by placing the tubes in iced water. The red colour that developed was read at 510 nm in a spectrophotometer. Under the above con-ditions, one unit of activity was defined as the amount of enzyme that released 1 µg HCN in 10 min under the assay condition.
Statistical analysis The results are presented as the mean values of
duplicate sampling. The significance of the tests was evaluated by analysis of variance (ANOVA). Significance of the test was accepted at (p < 0.05)
RESULTS AND DISCUSSION
Eight bacterial isolates which exhibited increased growth in the cyanide-containing medium were sel-ected. The isolates designated RDS 6, RDS 12, RDS 13, RDS 20, RDS 26, RDS 28, RDS 31 and RDS 34 were selected for further studies because they grew and gave optical density readings of at least 0.6 in the cya-nide containing medium (Table 1). The isolates were identified respectively as Lactobacillus plantarum, Lac-tobacillus fermentum, Lactobacillus amylovorus, Lacto-bacillus cellobiosus, Leuconostoc mesenteroides, Pseu-domonas stutzeri, Bacillus pumilus and Bacillus subtilis.
Some nutritional factors relating to the production of linamarase enzyme by the isolates were investigated (Tables 2 and 3). There were no significant (p > 0.05) differences in the ability of standard media to cause more enzyme productivity by the isolates in com-parison to locally formulated media. Under the con-ditions used, the enzyme activity that developed in the culture was higher in the presence of Tween 80 sol-ution than in control experiments without Tween 80. Linamarase production by the isolates in media without Tween 80 showed the best enzyme activity of 2.67 U/mL produced with Pseudomonas stutzeri as the test organism. In comparison, best enzyme activity of 6.82 U/mL was obtained in the medium containing Tween 80 solution and Lactobacillus fermentum as the test bacterium. Incorporation of Tween 80 significantly (p < 0.05) increased the linamarase productivity of the isolates in all the media tested. This report agrees with the findings of Abalaka and Garba [16] who reported
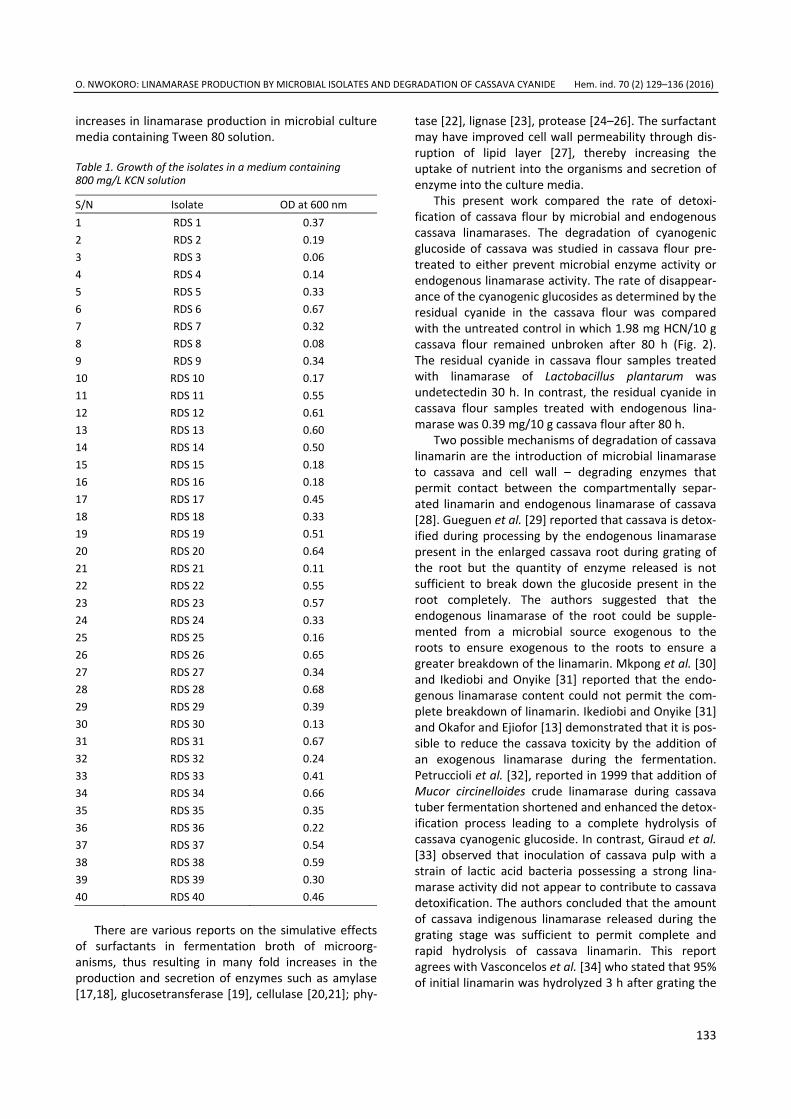
O. NWOKORO: LINAMARASE PRODUCTION BY MICROBIAL ISOLATES AND DEGRADATION OF CASSAVA CYANIDE Hem. ind. 70 (2) 129–136 (2016)
133
increases in linamarase production in microbial culture media containing Tween 80 solution.
Table 1. Growth of the isolates in a medium containing 800 mg/L KCN solution
S/N Isolate OD at 600 nm 1 RDS 1 0.37 2 RDS 2 0.19 3 RDS 3 0.06 4 RDS 4 0.14 5 RDS 5 0.33 6 RDS 6 0.67 7 RDS 7 0.32 8 RDS 8 0.08 9 RDS 9 0.34 10 RDS 10 0.17 11 RDS 11 0.55 12 RDS 12 0.61 13 RDS 13 0.60 14 RDS 14 0.50 15 RDS 15 0.18 16 RDS 16 0.18 17 RDS 17 0.45 18 RDS 18 0.33 19 RDS 19 0.51 20 RDS 20 0.64 21 RDS 21 0.11 22 RDS 22 0.55 23 RDS 23 0.57 24 RDS 24 0.33 25 RDS 25 0.16 26 RDS 26 0.65 27 RDS 27 0.34 28 RDS 28 0.68 29 RDS 29 0.39 30 RDS 30 0.13 31 RDS 31 0.67 32 RDS 32 0.24 33 RDS 33 0.41 34 RDS 34 0.66 35 RDS 35 0.35 36 RDS 36 0.22 37 RDS 37 0.54 38 RDS 38 0.59 39 RDS 39 0.30 40 RDS 40 0.46
There are various reports on the simulative effects of surfactants in fermentation broth of microorg-anisms, thus resulting in many fold increases in the production and secretion of enzymes such as amylase [17,18], glucosetransferase [19], cellulase [20,21]; phy-
tase [22], lignase [23], protease [24–26]. The surfactant may have improved cell wall permeability through dis-ruption of lipid layer [27], thereby increasing the uptake of nutrient into the organisms and secretion of enzyme into the culture media.
This present work compared the rate of detoxi-fication of cassava flour by microbial and endogenous cassava linamarases. The degradation of cyanogenic glucoside of cassava was studied in cassava flour pre-treated to either prevent microbial enzyme activity or endogenous linamarase activity. The rate of disappear-ance of the cyanogenic glucosides as determined by the residual cyanide in the cassava flour was compared with the untreated control in which 1.98 mg HCN/10 g cassava flour remained unbroken after 80 h (Fig. 2). The residual cyanide in cassava flour samples treated with linamarase of Lactobacillus plantarum was undetectedin 30 h. In contrast, the residual cyanide in cassava flour samples treated with endogenous lina-marase was 0.39 mg/10 g cassava flour after 80 h.
Two possible mechanisms of degradation of cassava linamarin are the introduction of microbial linamarase to cassava and cell wall – degrading enzymes that permit contact between the compartmentally separ-ated linamarin and endogenous linamarase of cassava [28]. Gueguen et al. [29] reported that cassava is detox-ified during processing by the endogenous linamarase present in the enlarged cassava root during grating of the root but the quantity of enzyme released is not sufficient to break down the glucoside present in the root completely. The authors suggested that the endogenous linamarase of the root could be supple-mented from a microbial source exogenous to the roots to ensure exogenous to the roots to ensure a greater breakdown of the linamarin. Mkpong et al. [30] and Ikediobi and Onyike [31] reported that the endo-genous linamarase content could not permit the com-plete breakdown of linamarin. Ikediobi and Onyike [31] and Okafor and Ejiofor [13] demonstrated that it is pos-sible to reduce the cassava toxicity by the addition of an exogenous linamarase during the fermentation. Petruccioli et al. [32], reported in 1999 that addition of Mucor circinelloides crude linamarase during cassava tuber fermentation shortened and enhanced the detox-ification process leading to a complete hydrolysis of cassava cyanogenic glucoside. In contrast, Giraud et al. [33] observed that inoculation of cassava pulp with a strain of lactic acid bacteria possessing a strong lina-marase activity did not appear to contribute to cassava detoxification. The authors concluded that the amount of cassava indigenous linamarase released during the grating stage was sufficient to permit complete and rapid hydrolysis of cassava linamarin. This report agrees with Vasconcelos et al. [34] who stated that 95% of initial linamarin was hydrolyzed 3 h after grating the

O. NWOKORO: LINAMARASE PRODUCTION BY MICROBIAL ISOLATES AND DEGRADATION OF CASSAVA CYANIDE Hem. ind. 70 (2) 129–136 (2016)
134
Table 2. Production of linamarase by the isolates in different media without Tween 80 solution – total activity units in 40% (NH4)2SO4 fraction (mean ± SD)
Isolate Banana broth Orange broth Tomato juice broth MRS broth Czapek dox broth Nutrient broth Lactobacillus plantarum 0.26±0.028 1.33±0.41 2.18±0.099 2.11±0.180 0.12±0.042 0.17±0.042 Lactobacillus fermentum 0.29±0.048 0.76±0.021 2.08±0.056 2.13±0.014 0.43±0.021 0.16±0.014 Lactobacillus amylovorus 0.21±0.028 0.53±0.070 1.58±0.184 1.88±0.550 0.24±0.198 0.09±0.057 Lactobacillus cellobiosus 0.39±0.127 0.46±0.090 1.40±0.400 1.31±0.020 0.26±0.093 0.18±0.028 Leuconostoc mesenteroides 0.20±0.127 0.88±0.113 2.06±0.350 1.46±0.085 0.35±0.078 0.30±0.100 Pseudomonas stutzeri 2.67±0.099 1.77±0.042 0.12±0.042 0.15±0.085 0.48±0.099 2.36±0.240 Bacilus pumilus 2.46±0.099 1.61±0.040 0.08±0.071 0.19±0.170 0.23±0.042 2.55±0.35 Bacilus subtilis 2.18±0.098 2.40±0.032 0.15±0.040 0.28±0.099 2.56±0.052 0.42±0.042
Table 3. Production of linamarase by the isolates in different media with Tween 80 solution – total activity units in 40% (NH4)2SO4 fraction (mean ± SD)
Isolate Banana broth Orange broth Tomato juice broth MRS broth Czapek dox broth Nutrient brothLactobacillus plantarum 3.43±0.042 2.53±0.100 5.96±0.230 5.62±0.420 1.94±0.570 2.22±0.230 Lactobacillus fermentum 2.09±0.049 3.66±0.44 6.82±0.82 4.88±0.049 4.16±0.035 2.67±0.047 Lactobacillus amylovorus 2.60±0.070 2.86±0.300 5.65±0.040 4.80±0.680 2.46±0.070 2.85±0.510 Lactobacillus cellobiosus 4.92±0.140 4.34±0.070 4.21±0.160 5.28±0.170 3.13±0.180 3.58±0.040 Leuconostoc mesenteroides 3.44±0.180 3.57±0.040 5.18±0.240 4.65±0.210 2.89±0.170 2.07±0.100 Pseudomonas stutzeri 4.29±0.610 4.25±0.042 3.37±0.060 2.91±0.140 4.61±0.110 5.16±0.240 Bacilus pumilus 6.61±0.590 5.90±0.300 2.84±0.310 3.40±0.170 4.93±0.042 6.09±0.090 Bacilus subtilis 5.78±0.170 6.17±0.400 2.63±0.200 3.88±0.130 5.11±0.230 2.40±0.030
0
0.5
1
1.5
2
0 10 20 30 40 50 60 70 80
Time (h)
HCN
cont
ent (
mg/
10 g
cas
sava
flou
r)
Lactobacillus plantarumLactobacillus fermentumLactobacillus amylovorusLactobacillus cellobiosusLeuconostoc mesenteroidesPseudomonas stutzeriBacillus pumilusBacillus subtilisCassava linamaraseControl
Figure 2. Comparison of the rate of detoxification of cassava flour by microbial and endogenous cassava linamarase enzymes.
roots. Maduagwu [35] observed that the degradation of cyanogenic glucoside in mashed cassava roots during fermentation was essentially effected by endogenous linamarase and that the role of microbial linamarase activity was complementary.
CONCLUSION
Eight linamarase-producing bacteria were selected based on their high growth in media containing 800 mg/L potassium cyanide solution. The isolates showed very high growth in the growth medium as demon-
strated by increase in their optical density readings to at least 0.6. The isolates were identified as Lacto-bacillus plantarum, Lactobacillus fermentum, Lacto-bacillus amylovorus, Lactobacillus cellobiosus, Leuco-nostoc mesenteroides, Pseudomonas stutzeri, Bacillus pumilus and Bacillus subtilis. All the isolates were grown in media containing Tween 80 solution and in control media without the surfactant. Best enzyme activity of 6.82 U/mL was obtained in the medium con-taining Tween 80 solution and Lactobacillus fermentum as the test bacterium. Linamarase production by the isolates in media without Tween 80 was much lower
O. NWOKORO: LINAMARASE PRODUCTION BY MICROBIAL ISOLATES AND DEGRADATION OF CASSAVA CYANIDE Hem. ind. 70 (2) 129–136 (2016)
135
than in media with the surfactant. Residual cyanide in cassava flour samples treated with linamarase of Lac-tobacillus plantarum was undetected in 30 h; while in contrast, the residual cyanide in cassava flour samples treated with endogenous cassava linamarase was 0.39 mg/10 g cassava flour after 80 h. Residual cyanide in the untreated control sample was 1.98 mg HCN/10 g cassava flour after 80 h.
REFERENCES
[1] K. Murugan, K.Y. Sekar, S. Al-Sohaibani, Detoxification of cyanide in cassava flour by linamarase of Bacillus subtilis KM05 isolated from cassava peel, Afr. J. Biotechnol. 11 (2012) 7232–7237.
[2] D.D. Roger, E.N. Jean-Justin, E. Francois-Xvier, Nutritive value, toxicological and hygienic quality of some cas-sava-based products consumed in Cameroon, Pak. J. Nutrition 6 (2007) 404–408.
[3] S. Soryotha, K.L. Kyu, K. Ratanakhanokchai, Purification and detection of linamarin from cassava root cortex by high performance liquid chromatography, Food Chem. 104 (2007) 1750–1754.
[4] S. Soryotha, K.L. Kyu, K. Ratanakhanokchai, An efficient treatment for detoxification process of cassava starch by plant cell wall-degrading enzymes, J Biosc. Bioeng. 109 (2010) 9–14.
[5] M. Ernesto, A.P. Cardoso, D. Nicala, M.R. Mirione, F. Massaza, J. Cliff, M.R. Haque, J.H. Bradbury, Persistent konzo and cyanogens toxicity from cassava in northern Mozambique, Acta Trop. 82 (2002) 357–362.
[6] I. Ahaotu, C.C. Ogueke, C.I. Owuamanam, N.N. Ahaotu, J.N. Nwosu, Fermentation of underwatered cassava pulp by linamarase producing microorganisms: effect of nutritional composition and residual cyanide, American J. Food Nutr. 3 (2013) 1–8.
[7] R.D. Cooke, An enzymatic assay for the total cyanide content of cassava (Manihot esculenta Crantz), J. Sci. Food Agric. 29 (1978) 345–352.
[8] A.P. Cardoso, E. Mirione, M. Ernesto, F. Massaza, J. Cliff, R.M. Haque, H.J. Bradbury, Processing of cassava roots to remove cyanogens, J. Food Comp. Analysis 18 (2005) 451–460.
[9] O. Nwokoro, F. O. Anya, Linamarase enzyme from Lactobacillus delbrueckii NRRL B-763: Purification and some properties of a β-glucosidase, J. Mex. Chem. Soc. 55 (2011) 246–250.
[10] C.H. Collins, P.M. Lyne, Microbiological Methods, Butherworths, London, 1970.
[11] J.G. Holt, N.R. Krieg, P.H.A. Sneath, J.T. Staley, S.T. Wil-liams, Bergey’s Manual of Determinative Bacteriology, 9th ed., Williams and Wilkins, Baltimore, MD, 1994.
[12] F.A. Skinner, D.W. Lovelock, Identification Methods for Microbiologists, Second edition, Academic Press, London, 1979.
[13] N. Okafor, A.N. Ejiofor, The linamarase of Leuconostoc mesenteroides: production, isolation and some properties, J. Sci. Food Agric. 36(1985):669–678.
[14] T. Wood, The isolation, properties and enzymatic break-down of linamarin from cassava, J. Sci. Food Agric. 17(1965):85–90.
[15] H.J. Willians, T.G. Edwards, Estimation of cyanide with alcaline picrate, J. Sci. Food Agric. 31 (1980) 15–22.
[16] J.A. Abalaka, Garba, S.A., Influence of media compo-sition on linamarase production by some fungi, Agric Biol. Chem. 53 (1989) 561–563.
[17] R.M. Reedy, P.G.G. Reedy, G. Seenayya, Enhanced production of the thermostable ß-amylase and pullul-anase in the presence of surfactants by Clostridium thermosulfurogenes SV2, Process Biochem. 34 (1999) 87–92.
[18] E. Thies, T. Jenkins, F. Stutzenberger, Effects of deter-gent Tween 80 on Thermomonospora curvata, World J. Microbiol. Biotechnol. 10 (1994) 657–663.
[19] Y. Umesaki, Y. Kawai, M. Mutai, Effect of Tween 80 on glucosyl transferase production in Streptococcus mutants, Appl. Environ. Microbiol. 34 (1977) 115–119.
[20] A.G. Pardo, Effect of surfactants on cellulose production by Nectria catalinensis, Curr. Microbiol. 33 (1996) 275– –278.
[21] H. Hwang, C.H. Lee, S.W. Kim, H.G. Sung, S.Y. Lee, S.S. Lee, H. Hong, Y. Kwak, J.K. Ha, Effects of mixtures of Tween 80 and cellulolytic enzymes on nutrient digestion and cellulolytic bacterial adhesion, Asian-Aust J. Anim Sci 21 (2008) 1604 – 1609.
[22] A. Ebune, S. Al-Asheh, Z. Duvnjak, Effects of phosphate, surfactants and glucose on phytase production and hydrolysis of phytic acid in canola meal by Aspergillus ficum during solid-state fermentation, Bioresour. Tech-nol. 54 (1995) 241–247.
[23] A. Jager, S. Coran, T.K. Kirk, production of lignases and degradation of lignin in agitated submerged culture of Phanerochaete chrysosporium, Appl. Environ. Microbiol. 50 (1985) 1274–1278.
[24] H.S. Joo, C.G. Kumar, G.C. Park, K.T. Kim, S.R. Paik, C.S. Chan, Optimization of the production of an extracelluar alkaline protease from Bacillus horikoshii, Process Bio-chem. 37(2002):139–144.
[25] G.M. Kamande, J. Baah, K.J.T. Cheng, T.A. McAllister, J.A. Shelford, Effects of Tween 60 and Tween 80 on protease activity, thiol group reactivity, protein adsorption and cellulose degradation by rumen microbial enzymes, J. Dairy Sci. 83 (2000) 536–554.
[26] R.N.A. Rahman, L.P. Geok, M. Basrins, A.B. Saleh, Factors affecting the production of organic solvent- tolerant protease by Pseudomonas aeruginosa strain K, Bioresour. Technol. 96(2005):429–436.
[27] R. Goto, Q.K. Beg, P. Lorenz, Hydrophobic moiety of surfactants, 3rd ed. Worth Publications, New York, 1997, p. 3.
[28] A.J.A. Essers, M.H.J. Bennik, M.J.R. Nout, Mechanisms of increased linamarin degradation during solid-substrate fermentation of cassava, World J. Microbiol. Biotechnol. 11 (1995) 266–270.
[29] Y. Gueguen, P. Chemardin, P. Labrot, A. Arnaud, P. Galzy, Purification and characterization of an intracel-lular β-glucosidase from a new strain of Lenconostoc
O. NWOKORO: LINAMARASE PRODUCTION BY MICROBIAL ISOLATES AND DEGRADATION OF CASSAVA CYANIDE Hem. ind. 70 (2) 129–136 (2016)
136
mesenteroides isolated from cassava, J. Appl. Microbiol. 82 (1997) 469–476.
[30] O.E. Mkpong, H. Yang, G. Chism, R. Sayre, Purification, characterization, and localization of linamarase in cassava, Plant Physiol. 93 (1990) 176–181.
[31] C.O. Ikediobi, E. Onyike, The use of linamarase in gari production. Process Biochem. 17 (1982) 2–5.
[32] M. Petruccioli, L. Brimer, A.R. Cicalini, F. Federici, The linamarase of Mucor cicinelloides LU M40 and its detoxifying activity on cassava, J. Appl. Microb. 86 (1999) 302–310.
[33] E. Giraud, L. Gosselin, M. Raimbault, Production of a Lactobacillus plantarum starter with linamarase and amylase activities for cassava fermentation, J. Sci. Food Agric. 62 (1993) 77–82.
[34] A.T. Vasconcelos, D.R. Twiddy, A. Westby, P.J.A. Reilly, Detoxification of cassava during gari preparation, Int J. Food Sci. Tech. 25 (1990) 198–203.
[35] E.N. Maduagwu, Differential effects on the cyanogenic glycoside content of fermenting cassava root pulp by β-glucosidase and microbial activities, Toxicol. Lett. 15 (1982) 335–339.
IZVOD
PROIZVODNJA LINAMARAZE POMOĆU MIKROORGANIZAMA I POREĐENJE BRZINE RAZGRADNJE CIJANIDA KASAVE MIKROBNIM LINAMARAZAMA I LINAMARAZAMA KASAVENwokoro Ogbonnaya
Industrial Microbiology and Biotechnology Laboratory, Department of Microbiology, University of Nigeria, Nsukka, Nigeria
(Naučni rad)
U radu je proučena mikrobna proizvodnja linamaraze i uticaj sastava hranljivepodloge na proizvodnju enzima. Izolovano je ukupno osam bakterija producenatalinamaraze iz krtola kasave i tla. Izbor izolata je izvršen na osnovu kriterijumabrzog rasta u medijumu koji sadrži 800 mg/L kalijum-cijanida. Osam izolata, koji su pokazali vrlo brz rast u hranljivoj podlozi sa cijanidom detektovan rastom optičkegustine do 0,6, izabrani su za dalje istraživanje. Ovi izolati su identifikovani kao:Lactobacillus plantarum, Lactobacillus fermentum, Lactobacillus amylovorus, Lac-tobacillus cellobiosus, Leuconostoc mesenteroides, Pseudomonas stutzeri, Bacilluspumilus i Bacillus subtilis. Svi izolati su gajeni u medijumu koji sadrži Tween 80 i ukontrolnom medijumu bez ovog surfaktanta. Najviša enzimska aktivnost od 6,82 U/ml dobijena je u medijumu koji sadrži Tween 80 i sa Lactobacillus fermentum kao testiranim mikroorganizmom. Mikrobnom proizvodnjom linamaraze u medi-jumu bez Tween 80 postignuta je manja enzimska aktivnost. Sposobnost endo-genih enzima kasave i mikrobnih enzima da hidrolizuju cijanide brašna kasave jetestirana na uzorcima brašna pretretiranim radi uklanjanja enzima prisutnih ubrašnu. Cijanidi u brašnu tretiranom linamarazom iz Lactobacillus plantarum nakon 30 h nisu bili detektovani, dok je u uzorcima tretiranim endogenim linama-razama kasave nakon 80 h detektovano 0,39 mg/10 g kasavinog brašna. Koncen-tracija cijanida u kontrolnom uzorku, bez enzima, nakon 80 h je bila 1,98 mgHCN/10 g brašna. Rezultati ovog istraživanja pokazuju da primena mikrobnih lina-maraza donosi unapređenje u razgradnji cijanida kasave u odnosu na razgradnjuzasnovanu samo na endogenim linamarazama. Inokuliranje fermentišućih krtolakasave mikrobnim izolatima selektovanim u ovom radu će omogućiti bolju kon-trolu procesa fermentacije kasave i može da dovede do proizvodnje standardi-zovanih i netoksičnih prehrambenih proizvoda od kasave.
Ključne reči: Linamaraza • Smanjenje koncentracije cijanida kasave • Mikro-organizmi • Surfactant

137
Nickel-based catalysts: Dependence of properties on nickel loading and modification with palladium Vesna D. Nikolić1, Željko J. Kamberović2, Marija S. Korać2, Zoran M. Anđić3, Aleksandar M. Mihajlović1, Jelena B. Uljarević1 1Innovation Center of the Faculty of Technology and Metallurgy, University of Belgrade, Belgrade, Serbia
2Faculty of Technology and Metallurgy, University of Belgrade, Belgrade, Serbia 3Innovation Center of the Faculty of Chemistry, University of Belgrade, Belgrade, Serbia
Abstract The aim of this study was comparative analysis of catalysts with 5 and 20 wt.% Ni loading,with and without Pd additive, and it included: determination of reduction degrees, inves-tigation on microstructure by scanning electron microscopy and chemical analysis by energy-dispersive spectroscopy. Ni/Al2O3 and Ni–Pd/Al2O3 catalysts supported on α-Al2O3--based foams were synthesized by aerosol assisted impregnation. Impregnation of the foams by ultrasonically aerosolized chlorides was followed by drying at 473 K and hydro-gen reduction at 533 and 633 K. Lower Ni loading resulted in higher reduction degrees. Ni loading of 20 wt.% enabled relatively uniform coverage of the foam with a metallic coating. Nearly complete reduction was achieved at both temperatures with activity modifier (Pd). Reduction degrees reached 99.4 and 98.2 wt.% at 533 K for 5 and 20 wt.% of Ni, res-pectively.
Keywords: catalysts, Ni, Pd, modification, α-Al2O3-based foam, aerosol assisted impreg-nation.
SCIENTIFIC PAPER
UDC 544.47:66.097:543:546.47
Hem. Ind. 70 (2) 137–142 (2016)
doi: 10.2298/HEMIND140928090N
Available online at the Journal website: http://www.ache.org.rs/HI/
Metal-ceramic composite systems have been int-ensively researched in recent years because properties of a base material can be significantly enhanced by a small quantity of additive. For instance, there are com-posites such as metals reinforced with ceramic par-ticles, dispersed in a metal matrix. Multiple strength-ened Cu–Al2O3 systems, that could be suitable for using at elevated temperatures, are produced from ultra-fine and nanocomposite Cu–Al2O3 powders. Those powders can be synthesized by using novel method that includes spray drying of dissolved metal salts [1,2]. Composite catalytic materials with metallic particles dispersed on oxide supports are applied in various heterogeneous catalysis processes [3,4]. As an example, Ni/Al2O3 cat-alysts are commonly used for reforming of hydrocar-bons [5–7]. Metallic particles are supported on γ-Al2O3 powder [5,8], reticulated α-Al2O3 foams [9,10], etc. Reticulated ceramic foams have high pore volumes and exhibit good mass transfer, good heat conductivity and low pressure drops for the duration of the fluid flow. Therefore, industrial application of ceramic foams as catalyst support could be favorable [10–12].
Although catalysts based on noble metals are com-mon due to excellent catalytic activity, stability and Correspondence: V.D. Nikolić, Innovation Center of the Faculty of Technology and Metallurgy, University of Belgrade, Karnegijeva 4, 11120 Belgrade, Serbia. E-mail: [email protected] Paper received: 28 September, 2014 Paper accepted: 23 December, 2014
selectivity [8], they are expensive for using in industry [13]. Ni is an effective alternative for noble metals because of low cost [6,7,14] and excellent catalytic pro-perties [15]. Ni-based catalysts can be rapidly deact-ivated due to deposits that form on active sites and sintering of Ni at elevated temperatures. However, dif-ferent supports, synthesis methods and catalytic acti-vity modifiers (additives), improve catalytic activity, deactivation resistance and selectivity [6,7,14,15]. Modification with low amount of Pd (0.01 [16] to 0.3 wt. % [6]) greatly enhances catalysts properties. Cat-alyst’s activity and selectivity can be drastically deteri-orated if metals are unevenly dispersed on support [6,16]. Conventional thermochemical methods for Ni- -based catalysts synthesis include oxidative calcination and reduction by hydrogen (activation). Calcination causes formation of NiAl2O4 spinel phase, especially in the case of impregnation and γ-Al2O3 support. NiAl2O4 is hardly reducible and it can inhibit catalytic activity because of low amount of Ni particles [5–7]. As rep-orted by Gayan et al. [17], α-Al2O3 support minimizes NiAl2O4 presence in the Ni/Al2O3 system obtained by impregnation. Novel methods that involve ultrasonic-ally generated aerosols provide synthesis of fine spher-ical particles with precise stoichiometry and high purity [18–20]. Ultrasonic spray pyrolysis is favored in large scale production in industry [21]. Gurmen et al. [22] pyrolized and reduced ultrasonically aerosolized NiCl2 and FeCl2 solution in hydrogen flow. They obtained fine

V.D. NIKOLIĆ et al.: NICKEL-BASED CATALYSTS PROPERTIES Hem. ind. 70 (2) 137–142 (2016)
138
spherical Fe–Ni particles in a single step, without cal-cination.
Previously, Ni/Al2O3 and Ni–M/Al2O3 catalysts, mod-ified by additives M = Pd, Cu or Fe, were synthesized by aerosol assisted impregnation [23]. Oxides and chlor-ides were used as precursors for metals. Reduction of chloride precursor at 633 K, without previous calcin-ation, resulted in optimal morphology of Ni coating. Modification with Pd enabled the highest reduction efficiency of all precursors [23] due to the hydrogen spillover effect [24, 25]. Chloride precursors for Ni–Pd coating reached significantly higher reduction degree (98.2 wt. %) than oxide precursors (20.0 wt. %) at 533 K [23].
On the basis of previously obtained results [23], Ni- -based catalysts were synthesized by aerosol assisted impregnation using chlorides as precursors. Catalysts were supported on previously prepared α-Al2O3-based foams [26,27]. The aim of the presented research was to investigate dependence of catalysts properties from different Ni loading and from modification by Pd addi-tive. Comparative analysis of the catalysts included determination of reduction degrees in hydrogen stream and microstructure development, which was investigated by scanning electron microscopy (SEM). An additional investigation included point analysis of red-uced Ni–Pd/Al2O3 samples by energy-dispersive spec-troscopy (EDS).
EXPERIMENTAL
Non-modified Ni/Al2O3 and modified Ni–Pd/Al2O3 catalysts with 5 and 20 wt.% Ni loading were syn-thesized by aerosol assisted impregnation method. Considering Ni–Pd/Al2O3 catalysts, Ni was modified with 0.1 wt.% of Pd. Used materials included: NiCl2⋅6H2O, PdCl2 (MERCK, pro analysis) and α-Al2O3- -based foams. The foams were produced by polymer replication route that is described elsewhere [26,27]. First, the foams were pre-heated at 473 K in a tubular quartz reactor and then impregnated with aerosolized chloride solutions at that temperature. Subsequently, samples were dried at 473 K for 60 min in air. The catalysts were reduced by hydrogen at 533 and 633 K for 90 min. Set-up for the aerosol assisted impreg-nation and the synthesis method details are presented elsewhere [23].
Reduction degrees of chlorides on the foam surface were determined on the basis of chlorine mass loss before and after hydrogen reduction. After the impreg-nation and subsequent drying at 473 K for 60 min, the samples were stored in desiccators with silica gel until the mass measurements to prevent absorption of mois-ture from the air. Mass ratio of chlorides and the foam was a known value. The reduction experiments were performed under static conditions as follows. First, the
samples were set into a quartz tube and reaction area was purified by nitrogen flow. Then, nitrogen flow was stopped and hydrogen was introduced into the tube. Hydrogen flow was conducted through system for puri-fication and drying that was consisted of: columns with silica gel, Cu powder and CaCl2 and wash bottle with H2SO4. A tubular electric resistance furnace was heated to the selected temperature and then the tube was put in. Measuring of reduction time started at that moment. Reduction of the dried samples was carried out at 533 and 633 K for 90 min (H2 flow rate 20 L/h). Reduced samples were placed in desiccators, cooled down to room temperature and their mass was deter-mined afterward.
Microstructures of the samples after drying and after reduction experiments were investigated with a JEOL JSM-5800LV scanning electron microscope (SEM) equipped with an energy-dispersive spectrometer (EDS). SEM/EDS point analysis was carried out for Ni– –Pd/Al2O3 catalysts with different metal loading, red-uced at 533 K for 90 min.
RESULTS AND DISCUSSION
Reduction degrees of NiCl2 on the foam surface are presented in Table 1.
Table 1. Reduction degrees, wt.%, of NiCl2 on α-Al2O3 based foam after 90 min
Sample description Temperature, K
533 633 5 wt.% of Ni 60.2 67.7 20 wt.% of Ni 23.7 35.2
As expected, higher reduction degrees were obtained at 633 than at 533 K for all the samples. However, when Ni loading was lower, significantly higher amount of NiCl2 was reduced at both tempe-ratures due to the better exposure of NiCl2 particles to H2 flow when NiCl2 content was lower. These results could be explained with microstructures of the samples before and after hydrogen reduction (Figs. 1–3).
SEM photographs of the dried samples are pre-sented in Fig. 1a and b.
After SEM analysis of the dried sample with 5 wt.% Ni loading, presence of relatively unevenly distributed, fine, submicron-sized NiCl2 particles was noted, as shown in Fig. 1a. Agglomerates were not detected. Despite relatively uneven particle distribution, satis-fying reduction degrees of NiCl2 were achieved at both temperatures (Table 1). These results could be exp-lained by obtained morphology, because fine particles were non-agglomerated and, consequently, they had good exposure to H2. In addition, good mass and heat transfer through the foam was one of the reasons for
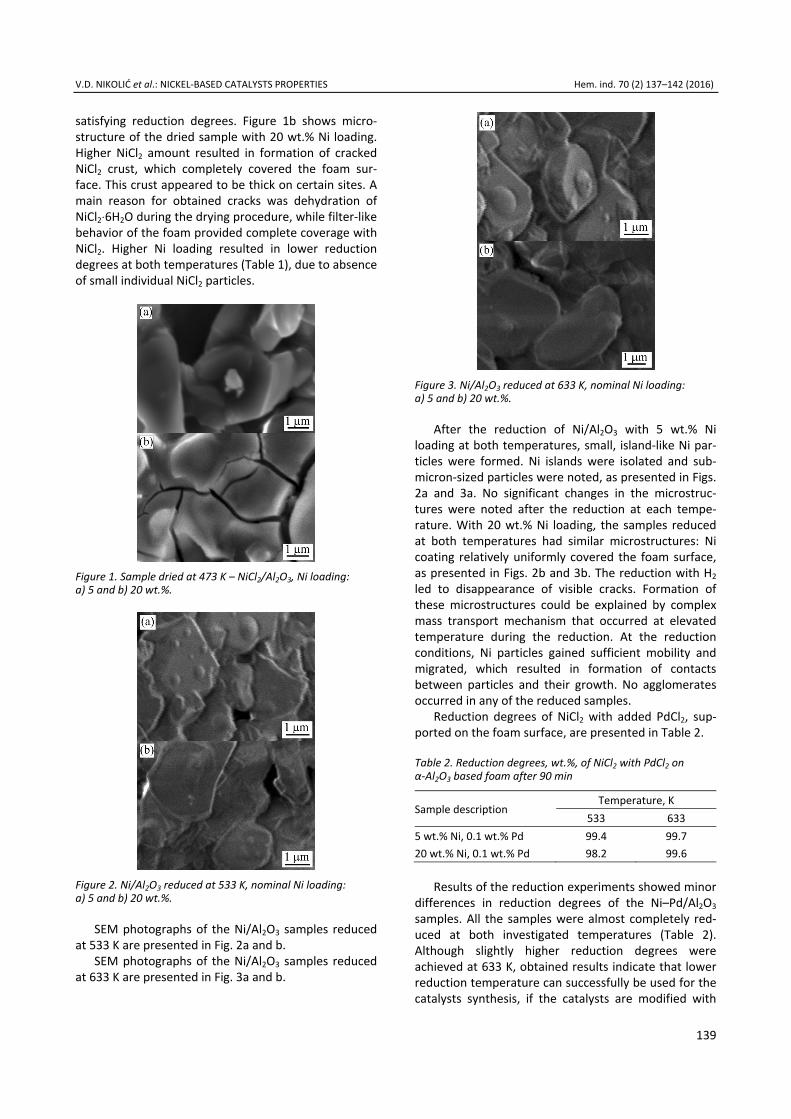
V.D. NIKOLIĆ et al.: NICKEL-BASED CATALYSTS PROPERTIES Hem. ind. 70 (2) 137–142 (2016)
139
satisfying reduction degrees. Figure 1b shows micro-structure of the dried sample with 20 wt.% Ni loading. Higher NiCl2 amount resulted in formation of cracked NiCl2 crust, which completely covered the foam sur-face. This crust appeared to be thick on certain sites. A main reason for obtained cracks was dehydration of NiCl2⋅6H2O during the drying procedure, while filter-like behavior of the foam provided complete coverage with NiCl2. Higher Ni loading resulted in lower reduction degrees at both temperatures (Table 1), due to absence of small individual NiCl2 particles.
Figure 1. Sample dried at 473 K – NiCl2/Al2O3, Ni loading: a) 5 and b) 20 wt.%.
Figure 2. Ni/Al2O3 reduced at 533 K, nominal Ni loading: a) 5 and b) 20 wt.%.
SEM photographs of the Ni/Al2O3 samples reduced at 533 K are presented in Fig. 2a and b.
SEM photographs of the Ni/Al2O3 samples reduced at 633 K are presented in Fig. 3a and b.
Figure 3. Ni/Al2O3 reduced at 633 K, nominal Ni loading: a) 5 and b) 20 wt.%.
After the reduction of Ni/Al2O3 with 5 wt.% Ni loading at both temperatures, small, island-like Ni par-ticles were formed. Ni islands were isolated and sub-micron-sized particles were noted, as presented in Figs. 2a and 3a. No significant changes in the microstruc-tures were noted after the reduction at each tempe-rature. With 20 wt.% Ni loading, the samples reduced at both temperatures had similar microstructures: Ni coating relatively uniformly covered the foam surface, as presented in Figs. 2b and 3b. The reduction with H2 led to disappearance of visible cracks. Formation of these microstructures could be explained by complex mass transport mechanism that occurred at elevated temperature during the reduction. At the reduction conditions, Ni particles gained sufficient mobility and migrated, which resulted in formation of contacts between particles and their growth. No agglomerates occurred in any of the reduced samples.
Reduction degrees of NiCl2 with added PdCl2, sup-ported on the foam surface, are presented in Table 2.
Table 2. Reduction degrees, wt.%, of NiCl2 with PdCl2 on α-Al2O3 based foam after 90 min
Sample description Temperature, K
533 633 5 wt.% Ni, 0.1 wt.% Pd 99.4 99.7 20 wt.% Ni, 0.1 wt.% Pd 98.2 99.6
Results of the reduction experiments showed minor differences in reduction degrees of the Ni–Pd/Al2O3 samples. All the samples were almost completely red-uced at both investigated temperatures (Table 2). Although slightly higher reduction degrees were achieved at 633 K, obtained results indicate that lower reduction temperature can successfully be used for the catalysts synthesis, if the catalysts are modified with

V.D. NIKOLIĆ et al.: NICKEL-BASED CATALYSTS PROPERTIES Hem. ind. 70 (2) 137–142 (2016)
140
Pd. The main reason for increased reduction efficiency was modification by Pd additive, which caused the hydrogen spillover effect. In general, this effect occurs in the presence of Pd surface, when H2 molecules dis-sociate into atoms and rapidly diffuse into crystal lat-tices of Ni species [24,25].
SEM photographs of Ni–Pd/Al2O3 catalysts with 5 and 20 wt.% Ni loading, reduced at 533 K, are pre-sented in Fig. 4a and b, respectively.
Fig. 4. Ni–Pd/Al2O3 reduced at 533 K, nominal Ni loading: a) 5 and b) 20 wt. %.
Similar microstructures were obtained for Ni–Pd/ /Al2O3 catalysts, reduced at 533 K, and for Ni/Al2O3 catalysts, reduced at 533 and 633 K. Ni–Pd/Al2O3 samples with 5 wt.% of Ni had fine, submicron-sized and isolated island-like particles dispersed on the foam surface, as presented in Fig. 4a. With higher Ni loading (20 wt.%), metallic coating relatively evenly covered the foam, as presented in Fig. 4b. Particles agglomer-ation did not occur in any of the samples. Modification with 0.1 wt.% of Pd enabled almost completed hyd-rogen reduction at 533 K. Ni-based catalysts prepared by conventional thermochemical methods are calcined before hydrogen reduction. The calcination treatment (e.g., at 823 K [6] or 873–923 K [5, 7]) provides forming of oxide mixtures that contain oxide precursors for cat-alytically active components. During that treatment, especially in the case of impregnation method, hardly reducible NiAl2O4 phase is commonly formed [5–7]. In addition, the authors concluded that Ni-based catal-ysts, prepared by using aerosol assisted impregnation and calcined at 773 K, had undesirable agglomerates on the α-Al2O3-based foam surface. Ni-based catalysts prepared by using the same method and obtained from chloride precursors reached significantly higher red-uction degrees at same temperatures [23].
Point SEM/EDS analysis was performed for Ni–Pd/ /Al2O3 catalysts with different Ni loading, reduced at 533 K. Analyzed points are marked in Fig. 5a and b. The results are presented in Table 3.
Figure 5. SEM micrographs of Ni–Pd/Al2O3 reduced at 533 K, nominal Ni loading: a) 5 and b) 20 wt.%.
Table 3. Point SEM/EDS analysis (wt. %) of Ni–Pd/Al2O3 reduced at 533 K
Metal loading Mark Ni Al Si O 5 wt.% Ni, 0.1 wt.% Pd 1 93.50 1.97 0.63 3.90
2 1.50 40.32 5.16 53.0220 wt.% Ni, 0.1 wt.% Pd 1 94.21 1.53 0.58 3.68
Considering the sample with 5 wt.% Ni loading, island-like metallic particle mainly consisted of Ni. Pd was not detected due to very low concentration. Small amounts of Al, Si and O from the α-Al2O3 based foam were also detected. EDS analysis of point with no visible metallic particles showed predominance of elements that correspond to oxides in the α-Al2O3 based foam. With Ni loading of 20 wt.%, chemical analysis of a random point revealed that the main ele-ment in the metal coating was Ni. Similar to the sample with lower metal content, Pd was not detected because of low concentration. In addition, small amounts of Al, Si and O from the foam were noted. These results confirmed that higher metal loading enabled relatively uniform dispersion of metallic particles over the foam surface.
The conclusion is that Ni–Pd/Al2O3 catalysts sup-ported on the α-Al2O3 based foams can successfully be produced by hydrogen reduction of chloride instead of oxide precursors, without the calcination step. Chloride precursors for Ni and Pd can be reduced at very low temperature (533 K). Optimal metal loading is 20 wt.%
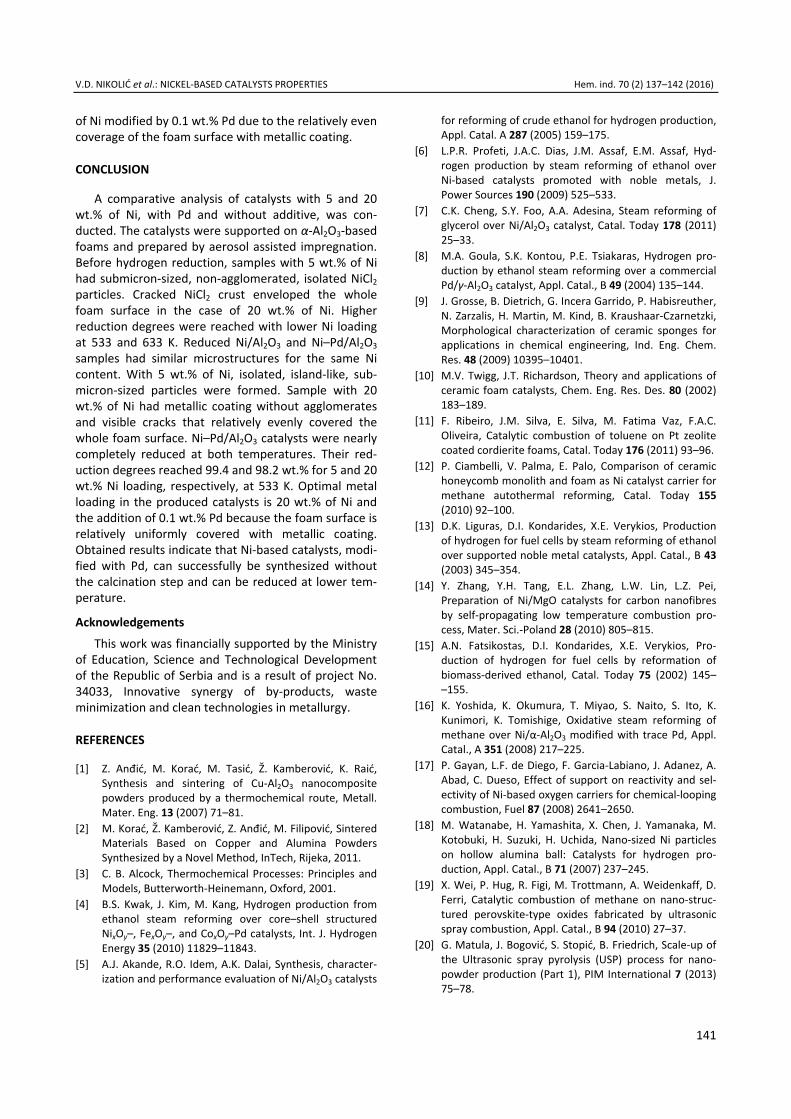
V.D. NIKOLIĆ et al.: NICKEL-BASED CATALYSTS PROPERTIES Hem. ind. 70 (2) 137–142 (2016)
141
of Ni modified by 0.1 wt.% Pd due to the relatively even coverage of the foam surface with metallic coating.
CONCLUSION
A comparative analysis of catalysts with 5 and 20 wt.% of Ni, with Pd and without additive, was con-ducted. The catalysts were supported on α-Al2O3-based foams and prepared by aerosol assisted impregnation. Before hydrogen reduction, samples with 5 wt.% of Ni had submicron-sized, non-agglomerated, isolated NiCl2 particles. Cracked NiCl2 crust enveloped the whole foam surface in the case of 20 wt.% of Ni. Higher reduction degrees were reached with lower Ni loading at 533 and 633 K. Reduced Ni/Al2O3 and Ni–Pd/Al2O3 samples had similar microstructures for the same Ni content. With 5 wt.% of Ni, isolated, island-like, sub-micron-sized particles were formed. Sample with 20 wt.% of Ni had metallic coating without agglomerates and visible cracks that relatively evenly covered the whole foam surface. Ni–Pd/Al2O3 catalysts were nearly completely reduced at both temperatures. Their red-uction degrees reached 99.4 and 98.2 wt.% for 5 and 20 wt.% Ni loading, respectively, at 533 K. Optimal metal loading in the produced catalysts is 20 wt.% of Ni and the addition of 0.1 wt.% Pd because the foam surface is relatively uniformly covered with metallic coating. Obtained results indicate that Ni-based catalysts, modi-fied with Pd, can successfully be synthesized without the calcination step and can be reduced at lower tem-perature.
Acknowledgements This work was financially supported by the Ministry
of Education, Science and Technological Development of the Republic of Serbia and is a result of project No. 34033, Innovative synergy of by-products, waste minimization and clean technologies in metallurgy.
REFERENCES
[1] Z. Anđić, M. Korać, M. Tasić, Ž. Kamberović, K. Raić, Synthesis and sintering of Cu-Al2O3 nanocomposite powders produced by a thermochemical route, Metall. Mater. Eng. 13 (2007) 71–81.
[2] M. Korać, Ž. Kamberović, Z. Anđić, M. Filipović, Sintered Materials Based on Copper and Alumina Powders Synthesized by a Novel Method, InTech, Rijeka, 2011.
[3] C. B. Alcock, Thermochemical Processes: Principles and Models, Butterworth-Heinemann, Oxford, 2001.
[4] B.S. Kwak, J. Kim, M. Kang, Hydrogen production from ethanol steam reforming over core–shell structured NixOy–, FexOy–, and CoxOy–Pd catalysts, Int. J. Hydrogen Energy 35 (2010) 11829–11843.
[5] A.J. Akande, R.O. Idem, A.K. Dalai, Synthesis, character-ization and performance evaluation of Ni/Al2O3 catalysts
for reforming of crude ethanol for hydrogen production, Appl. Catal. A 287 (2005) 159–175.
[6] L.P.R. Profeti, J.A.C. Dias, J.M. Assaf, E.M. Assaf, Hyd-rogen production by steam reforming of ethanol over Ni-based catalysts promoted with noble metals, J. Power Sources 190 (2009) 525–533.
[7] C.K. Cheng, S.Y. Foo, A.A. Adesina, Steam reforming of glycerol over Ni/Al2O3 catalyst, Catal. Today 178 (2011) 25–33.
[8] M.A. Goula, S.K. Kontou, P.E. Tsiakaras, Hydrogen pro-duction by ethanol steam reforming over a commercial Pd/γ-Al2O3 catalyst, Appl. Catal., B 49 (2004) 135–144.
[9] J. Grosse, B. Dietrich, G. Incera Garrido, P. Habisreuther, N. Zarzalis, H. Martin, M. Kind, B. Kraushaar-Czarnetzki, Morphological characterization of ceramic sponges for applications in chemical engineering, Ind. Eng. Chem. Res. 48 (2009) 10395–10401.
[10] M.V. Twigg, J.T. Richardson, Theory and applications of ceramic foam catalysts, Chem. Eng. Res. Des. 80 (2002) 183–189.
[11] F. Ribeiro, J.M. Silva, E. Silva, M. Fatima Vaz, F.A.C. Oliveira, Catalytic combustion of toluene on Pt zeolite coated cordierite foams, Catal. Today 176 (2011) 93–96.
[12] P. Ciambelli, V. Palma, E. Palo, Comparison of ceramic honeycomb monolith and foam as Ni catalyst carrier for methane autothermal reforming, Catal. Today 155 (2010) 92–100.
[13] D.K. Liguras, D.I. Kondarides, X.E. Verykios, Production of hydrogen for fuel cells by steam reforming of ethanol over supported noble metal catalysts, Appl. Catal., B 43 (2003) 345–354.
[14] Y. Zhang, Y.H. Tang, E.L. Zhang, L.W. Lin, L.Z. Pei, Preparation of Ni/MgO catalysts for carbon nanofibres by self-propagating low temperature combustion pro-cess, Mater. Sci.-Poland 28 (2010) 805–815.
[15] A.N. Fatsikostas, D.I. Kondarides, X.E. Verykios, Pro-duction of hydrogen for fuel cells by reformation of biomass-derived ethanol, Catal. Today 75 (2002) 145– –155.
[16] K. Yoshida, K. Okumura, T. Miyao, S. Naito, S. Ito, K. Kunimori, K. Tomishige, Oxidative steam reforming of methane over Ni/α-Al2O3 modified with trace Pd, Appl. Catal., A 351 (2008) 217–225.
[17] P. Gayan, L.F. de Diego, F. Garcia-Labiano, J. Adanez, A. Abad, C. Dueso, Effect of support on reactivity and sel-ectivity of Ni-based oxygen carriers for chemical-looping combustion, Fuel 87 (2008) 2641–2650.
[18] M. Watanabe, H. Yamashita, X. Chen, J. Yamanaka, M. Kotobuki, H. Suzuki, H. Uchida, Nano-sized Ni particles on hollow alumina ball: Catalysts for hydrogen pro-duction, Appl. Catal., B 71 (2007) 237–245.
[19] X. Wei, P. Hug, R. Figi, M. Trottmann, A. Weidenkaff, D. Ferri, Catalytic combustion of methane on nano-struc-tured perovskite-type oxides fabricated by ultrasonic spray combustion, Appl. Catal., B 94 (2010) 27–37.
[20] G. Matula, J. Bogović, S. Stopić, B. Friedrich, Scale-up of the Ultrasonic spray pyrolysis (USP) process for nano-powder production (Part 1), PIM International 7 (2013) 75–78.
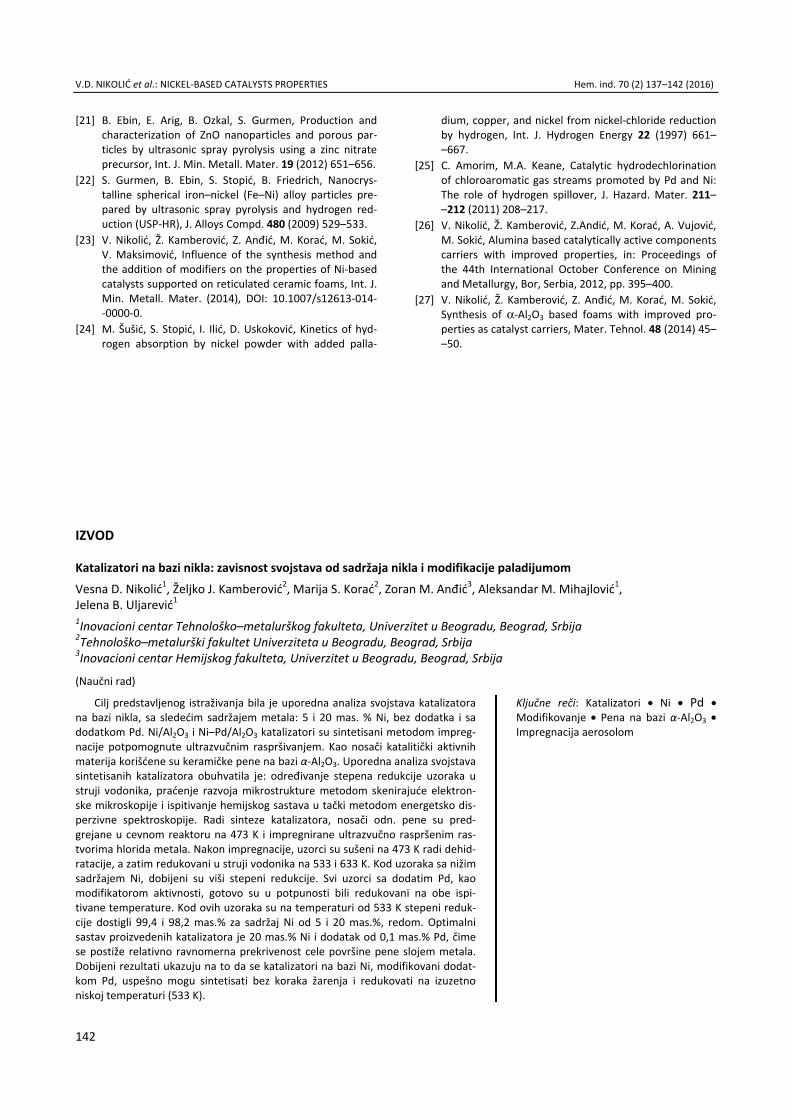
V.D. NIKOLIĆ et al.: NICKEL-BASED CATALYSTS PROPERTIES Hem. ind. 70 (2) 137–142 (2016)
142
[21] B. Ebin, E. Arig, B. Ozkal, S. Gurmen, Production and characterization of ZnO nanoparticles and porous par-ticles by ultrasonic spray pyrolysis using a zinc nitrate precursor, Int. J. Min. Metall. Mater. 19 (2012) 651–656.
[22] S. Gurmen, B. Ebin, S. Stopić, B. Friedrich, Nanocrys-talline spherical iron–nickel (Fe–Ni) alloy particles pre-pared by ultrasonic spray pyrolysis and hydrogen red-uction (USP-HR), J. Alloys Compd. 480 (2009) 529–533.
[23] V. Nikolić, Ž. Kamberović, Z. Anđić, M. Korać, M. Sokić, V. Maksimović, Influence of the synthesis method and the addition of modifiers on the properties of Ni-based catalysts supported on reticulated ceramic foams, Int. J. Min. Metall. Mater. (2014), DOI: 10.1007/s12613-014- -0000-0.
[24] M. Šušić, S. Stopić, I. Ilić, D. Uskoković, Kinetics of hyd-rogen absorption by nickel powder with added palla-
dium, copper, and nickel from nickel-chloride reduction by hydrogen, Int. J. Hydrogen Energy 22 (1997) 661– –667.
[25] C. Amorim, M.A. Keane, Catalytic hydrodechlorination of chloroaromatic gas streams promoted by Pd and Ni: The role of hydrogen spillover, J. Hazard. Mater. 211– –212 (2011) 208–217.
[26] V. Nikolić, Ž. Kamberović, Z.Andić, M. Korać, A. Vujović, M. Sokić, Alumina based catalytically active components carriers with improved properties, in: Proceedings of the 44th International October Conference on Mining and Metallurgy, Bor, Serbia, 2012, pp. 395–400.
[27] V. Nikolić, Ž. Kamberović, Z. Anđić, M. Korać, M. Sokić, Synthesis of α-Al2O3 based foams with improved pro-perties as catalyst carriers, Mater. Tehnol. 48 (2014) 45– –50.
IZVOD
Katalizatori na bazi nikla: zavisnost svojstava od sadržaja nikla i modifikacije paladijumom Vesna D. Nikolić1, Željko J. Kamberović2, Marija S. Korać2, Zoran M. Anđić3, Aleksandar M. Mihajlović1, Jelena B. Uljarević1
1Inovacioni centar Tehnološko–metalurškog fakulteta, Univerzitet u Beogradu, Beograd, Srbija 2Tehnološko–metalurški fakultet Univerziteta u Beogradu, Beograd, Srbija 3Inovacioni centar Hemijskog fakulteta, Univerzitet u Beogradu, Beograd, Srbija
(Naučni rad)
Cilj predstavljenog istraživanja bila je uporedna analiza svojstava katalizatorana bazi nikla, sa sledećim sadržajem metala: 5 i 20 mas. % Ni, bez dodatka i sadodatkom Pd. Ni/Al2O3 i Ni–Pd/Al2O3 katalizatori su sintetisani metodom impreg-nacije potpomognute ultrazvučnim raspršivanjem. Kao nosači katalitički aktivnih materija korišćene su keramičke pene na bazi α-Al2O3. Uporedna analiza svojstava sintetisanih katalizatora obuhvatila je: određivanje stepena redukcije uzoraka u struji vodonika, praćenje razvoja mikrostrukture metodom skenirajuće elektron-ske mikroskopije i ispitivanje hemijskog sastava u tački metodom energetsko dis-perzivne spektroskopije. Radi sinteze katalizatora, nosači odn. pene su pred-grejane u cevnom reaktoru na 473 K i impregnirane ultrazvučno raspršenim ras-tvorima hlorida metala. Nakon impregnacije, uzorci su sušeni na 473 K radi dehid-ratacije, a zatim redukovani u struji vodonika na 533 i 633 K. Kod uzoraka sa nižimsadržajem Ni, dobijeni su viši stepeni redukcije. Svi uzorci sa dodatim Pd, kaomodifikatorom aktivnosti, gotovo su u potpunosti bili redukovani na obe ispi-tivane temperature. Kod ovih uzoraka su na temperaturi od 533 K stepeni reduk-cije dostigli 99,4 i 98,2 mas.% za sadržaj Ni od 5 i 20 mas.%, redom. Optimalni sastav proizvedenih katalizatora je 20 mas.% Ni i dodatak od 0,1 mas.% Pd, čime se postiže relativno ravnomerna prekrivenost cele površine pene slojem metala.Dobijeni rezultati ukazuju na to da se katalizatori na bazi Ni, modifikovani dodat-kom Pd, uspešno mogu sintetisati bez koraka žarenja i redukovati na izuzetnoniskoj temperaturi (533 K).
Ključne reči: Katalizatori • Ni • Pd •Modifikovanje • Pena na bazi α-Al2O3 •Impregnacija aerosolom
143
Stimulation of diesel degradation and biosurfactant production by aminoglycosides in a novel oil-degrading bacterium Pseudomonas luteola PRO23 Iva M. Atanasković1, Jelena P. Jovičić Petrović2, Marjan B. Biočanin1, Vera M. Karličić2, Vera B. Raičević2, Blažo T. Lalević2 1University of Belgrade, Faculty of Biology, Belgrade, Serbia 2University of Belgrade, Faculty of Agriculture, Belgrade-Zemun, Serbia
Abstract Bioremediation is promising technology for dealing with oil hydrocarbons contamination. In this research growth kinetics and oil biodegradation efficiency of Pseudomonas luteola PRO23, isolated from crude oil-contaminated soil samples, were investigated under differ-ent concentrations (5, 10 and 20 g/L) of light and heavy crude oil. More efficient biodeg-radation and more rapid adaptation and cell growth were obtained in conditions with lightoil. The 5 to 10 g/L upgrade of light oil concentration stimulated the microbial growth andthe biodegradation efficiency. Further upgrade of light oil concentration and the upgradeof heavy oil concentration both inhibited the microbial growth, as well as biodegradationprocess. Aminoglycosides stimulated biosurfactant production in P. luteola in the range of sub-inhibitory concentrations (0.3125, 0.625 μg/mL). Aminoglycosides also induced biofilmformation. The production of biosurfactants was the most intense during lag phase andcontinues until stationary phase. Aminoglycosides also induced changes in P. luteolagrowth kinetics. In the presence of aminoglycosides this strain degraded 82% of diesel for96 h. These results indicated that P. luteola PRO23 potentially can be used in biorem-ediation of crude oil-contaminated environments and that aminoglycosides could stimul-ate this process.
Keywords: biodegradation, crude oil, aminoglycosides, Pseudomonas luteola.
SCIENTIFIC PAPER
UDC 665.61:502/504:579.841.1
Hem. Ind. 70 (2) 143–150 (2016)
doi: 10.2298/HEMIND141127020A
Available online at the Journal website: http://www.ache.org.rs/HI/
Oil pollution accidents have become a common phenomenon and have caused serious environmental problems, such as introduction of toxic compounds in food chains and changes in physical and chemical pro-perties of the soil [1]. One of the highly efficient methods in remediation of oil polluted soil is biorem-ediation, where contaminants are degraded or trans-formed to less hazardous compounds through biolog-ical processes [2].
Bacteria of the genus Pseudomonas are highly cap-able to adapt on conditions in oil contaminated sites and can use different hydrocarbons as energy sources [3,4]. Therefore, Pseudomonas strains are commonly applied in ex situ bioremediation methods [5]. In these methods the first step is to isolate and characterize microorganisms that can use the oil contaminant as an energy source. Another step is to define conditions in applied bioreactors which are optimal for microbial growth and biodegradation [6]. These conditions inc-lude the type of oil and its concentration [7]. Some oil Correspondence: B. Lalević, University of Belgrade, Faculty of Agri-culture, Department of Microbial Ecology, Nemanjina 6, 11080 Bel-grade-Zemun, Serbia. E-mail: [email protected] Paper received: 27 November, 2014 Paper accepted: 19 March, 2015
types stimulate microbial activity with an upgrade of its concentration. This is happening until reaching a spe-cific concentration threshold, afterwards toxic com-pounds in oil can inhibit microbial growth and the bio-degradation process [8]. This raises the importance of defining optimal concentrations for specific oil types.
Furthermore, microbial activity could be stimulated by adding chemical inducers in the bioreactors. For defining such inducers it is crucial to know how the strain of interest adapts to oil as its only carbon source. In genus Pseudomonas adaptation is achieved by bio-surfactant production and biofilm formation [9]. Bio-surfactants allow more efficient oil emulsification, which increases its accessibility for degradation. Bio-surfactant production and oil degradation could be stimulated by aminoglycosides [10]. In subinhibitory concentrations aminoglycosides start acting as alter-native signaling molecules, modulating gene expres-sion, biosurfactant production and biofilm formation in Pseudomonas [11].
The aim of this research was isolation and iden-tification of new oil and diesel degrading bacterial strain, and stimulation of biosurfactant production and diesel degradation using the aminoglycosides in sub- -inhibitory concentrations.

I.M. ATANASKOVIĆ et al.: NOVEL OIL-DEGRADING BACTERIUM P. luteola PRO23 Hem. ind. 70 (2) 143–150 (2016)
144
MATERIAL AND METHODS
The soil samples were aseptically collected from the zone of used oil re-refining facility in the Belgrade Oil Refinery (Serbia). Isolation of microorganisms resistant on light and heavy crude oil was achieved by diluting 1 g of soil in 100 mL of liquid mineral medium [12], containing 1g/L NH4NO3, 0.25g/L K2HPO4, 50mL/L soil extract, with addition of 10 g/L light or heavy crude oil (oil drill “Rusija”, Serbia). Those enriched suspensions were then incubated on orbital shaker (ES-20, Biosan, Latvia) at 30 °C and 200 rpm for 30 days. Isolation and enumeration of Pseudomonas sp. from enrichment sus-pensions were proceeded on Pseudomonas Cetrimide agar with addition of Pseudomonas C-N SR0102E supplement (Oxoid). After 48 h of incubation (30 °C) all developed colonies were morphologically identical and further purification and identification was continued on nutrient agar. Ability of the isolate to use crude oil as the only carbon source was investigated by cultivating the strain on solid mineral medium with addition of 10 g/L of heavy or light crude oil. Biosurfactant production was investigated by drop-collapse test [13].
Identification of isolate was performed by API and APIWEB technique (Biomerieux, France).
Effect of different oil type concentrations was stu-died by cultivating the strain in shaking flask bioreac-tors [14]. Gas phase–liquid phase ratio in the shaking flasks was 1:1, while the total bioreactor volume was 500 mL. The liquid phase was composed of liquid min-eral medium (described above) with 10% of isolated strain suspension. The tested concentrations of oil were: 5, 10 and 20 g/L for each oil type. An un-ino-culated shaking flask bioreactor represents control for each oil concentration. For each oil concentration an abiotic control group was created, where no bacterial culture was added to the liquid phase. All bioreactors were incubated (30 °C, 200 rpm) for 6 days. Cell num-ber in liquid phase was measured every 24 h by quan-titative plate method. The absorbance (OD600) of the liquid phase was measured using a T70 UV/Vis spectrometer (PG Instruments, UK).
The efficiency of crude oil biodegradation was determined by measuring the residual amount of crude oil present in the experimental and abiotic groups. The remaining oil was extracted from bioreactors after 6 days of incubation by n-hexane as previously described [15], where the efficiency of biodegradation was exp-ressed as a percentage of degraded oil and calculated according to previous research [16], as follows:
1) Weight of residual crude oil = weight of beaker containing extracted crude oil – weight of empty beaker;
2) Amount of crude oil degraded = weight of crude oil added in the media – weight of residual crude oil;
3) % degradation = amount of crude oil deg-raded/amount of crude oil added in the media×100
Different tobramycin and gentamicin concentra-tions (0.3125–1.25 μg/mL) were used for testing the effect of aminoglycosides on diesel degradation. The bioreactors contained 1g/L of diesel D-2, while the basic liquid mineral medium and incubation conditions were as described previously. Quantitative plate method was used for measuring the microbial growth. Biosurfactant production was simultaneously measured by the oil-spreading test [17]. Diesel degradation was determined after 96 h by n-hexane extraction, as des-cribed above [15].
RESULTS AND DISCUSSION
Strain characterization The selected isolate, named PRO23, could grow on
solid medium where heavy or light oil was the only carbon source. By drop-collapse test the strains ability to produce biosurfactants was observed (data not shown).
The results of biochemical test showed positive reactions for arginine, citrate, urea, glucose, sucrose, melibiose and arabinose, and negative for oxydase, lysine, ornithine, mannitol, inositol, sorbitol, rhamnose and amygdalin. Based on APIWEB database, this strain shows maximal similarity with species Pseudomonas luteola.
Light and heavy crude oil degradation The strain had adapted to all concentrations of light
oil and lower concentrations of heavy oil in period shorter than 24 h (Figs. 1 and 2). The longest lag phase was expressed for the highest concentration of heavy oil. In all conditions log phase of growth is noticeable during the first 48 h of incubation. The highest cell number occurred in conditions with 10 g/L of light oil, where the upgrade of oil concentration from 5 to 10 g/L stimulated the microbial growth. Further upgrade of light oil concentration to 20 g/L, as well as all the upgrades in heavy oil concentration, inhibited the mic-robial growth. Cell number growth in the first 48 h of incubation was followed by absorbance growth in all experimental groups, but cell number decrease was not followed by absorbance decrease.
The most efficient biodegradation and highest cell number in the lag phase was obtained in 10 g/L of light oil (Fig. 3). In a case of heavy oil as a carbon source, the most efficient biodegradation (29.7 %) was obtained in the lowest oil concentration.
So far, there is no literature data referring to the ability of P. luteola to degrade crude oil, but some stu-dies show that it was capable to degrade a selective

I.M. ATANASKOVIĆ et al.: NOVEL OIL-DEGRADING BACTERIUM P. luteola PRO23 Hem. ind. 70 (2) 143–150 (2016)
145
Figure 1. Growth of Pseudomonas luteola PRO23 in the presence of light crude oil.
Figure 2. Growth of Pseudomonas luteola PRO23 in the presence of heavy crude oil.
Figure 3. Biodegradation of light and heavy crude oil by Pseudomonas luteola PRO23.
herbicide diclofop-methyl [18], phenolic compounds [19], and decolorize several groups of azo dyes [20].
In genus Pseudomonas the main way of adaptation on conditions where the nutrients are hydrophobic is formation of oil in water emulsion with biosurfactants [13]. Higher hydrophobic phase shares [21] and higher
viscosity of oil [22] can inhibit the emulsification pro-cess. This explains why lag phase was shorter in the light oil and why the highest concentration of heavy oil prolonged it. The highest light and heavy oil concen-trations inhibited the microbial growth. In this higher concentration range, some toxic compounds could
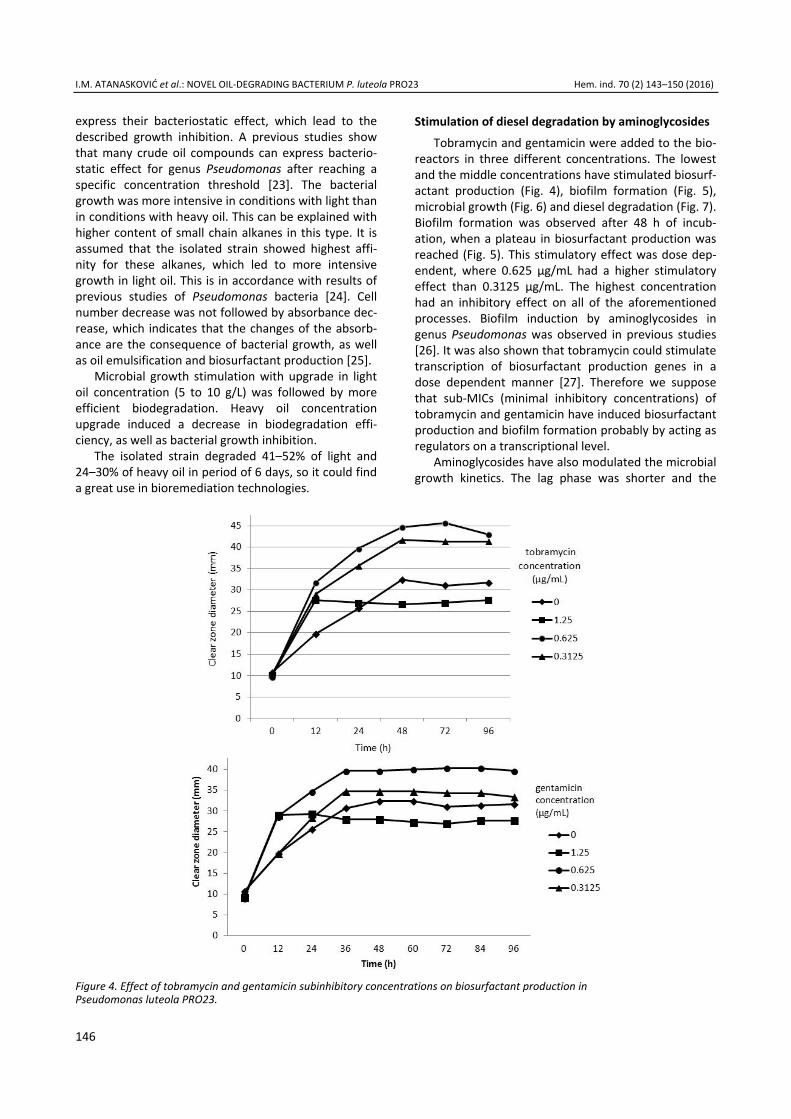
I.M. ATANASKOVIĆ et al.: NOVEL OIL-DEGRADING BACTERIUM P. luteola PRO23 Hem. ind. 70 (2) 143–150 (2016)
146
express their bacteriostatic effect, which lead to the described growth inhibition. A previous studies show that many crude oil compounds can express bacterio-static effect for genus Pseudomonas after reaching a specific concentration threshold [23]. The bacterial growth was more intensive in conditions with light than in conditions with heavy oil. This can be explained with higher content of small chain alkanes in this type. It is assumed that the isolated strain showed highest affi-nity for these alkanes, which led to more intensive growth in light oil. This is in accordance with results of previous studies of Pseudomonas bacteria [24]. Cell number decrease was not followed by absorbance dec-rease, which indicates that the changes of the absorb-ance are the consequence of bacterial growth, as well as oil emulsification and biosurfactant production [25].
Microbial growth stimulation with upgrade in light oil concentration (5 to 10 g/L) was followed by more efficient biodegradation. Heavy oil concentration upgrade induced a decrease in biodegradation effi-ciency, as well as bacterial growth inhibition.
The isolated strain degraded 41–52% of light and 24–30% of heavy oil in period of 6 days, so it could find a great use in bioremediation technologies.
Stimulation of diesel degradation by aminoglycosides Tobramycin and gentamicin were added to the bio-
reactors in three different concentrations. The lowest and the middle concentrations have stimulated biosurf-actant production (Fig. 4), biofilm formation (Fig. 5), microbial growth (Fig. 6) and diesel degradation (Fig. 7). Biofilm formation was observed after 48 h of incub-ation, when a plateau in biosurfactant production was reached (Fig. 5). This stimulatory effect was dose dep-endent, where 0.625 µg/mL had a higher stimulatory effect than 0.3125 µg/mL. The highest concentration had an inhibitory effect on all of the aforementioned processes. Biofilm induction by aminoglycosides in genus Pseudomonas was observed in previous studies [26]. It was also shown that tobramycin could stimulate transcription of biosurfactant production genes in a dose dependent manner [27]. Therefore we suppose that sub-MICs (minimal inhibitory concentrations) of tobramycin and gentamicin have induced biosurfactant production and biofilm formation probably by acting as regulators on a transcriptional level.
Aminoglycosides have also modulated the microbial growth kinetics. The lag phase was shorter and the
Figure 4. Effect of tobramycin and gentamicin subinhibitory concentrations on biosurfactant production in Pseudomonas luteola PRO23.
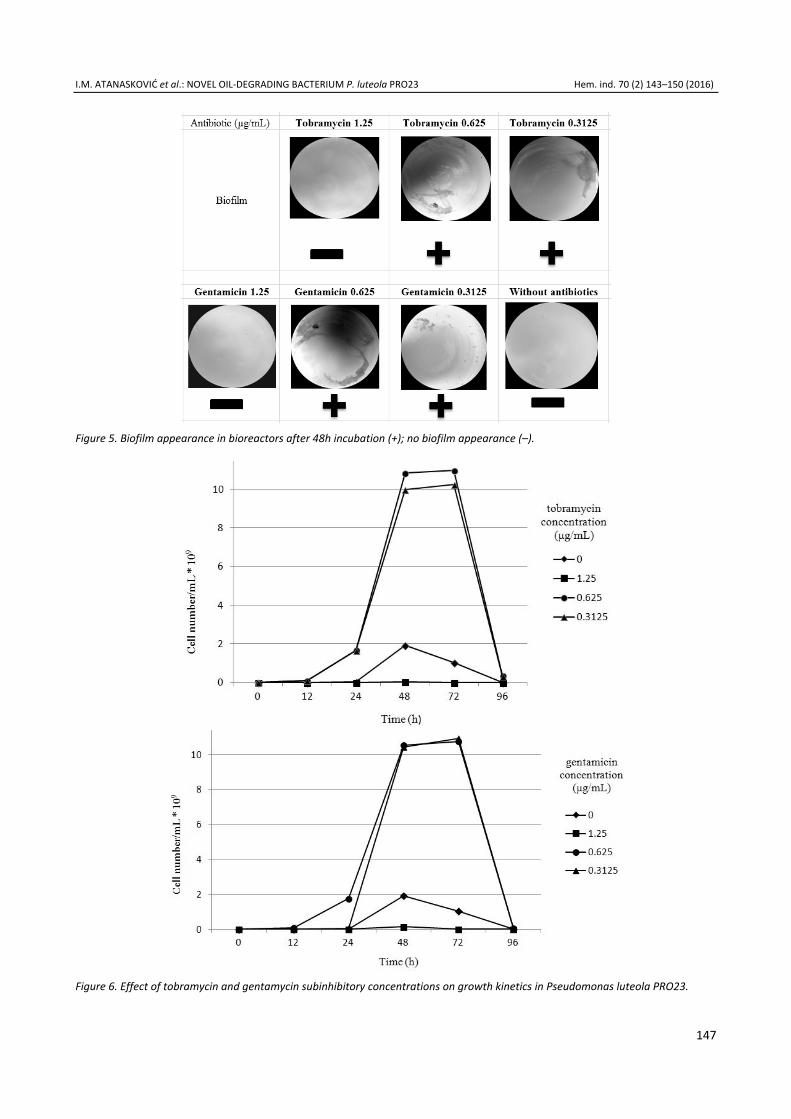
I.M. ATANASKOVIĆ et al.: NOVEL OIL-DEGRADING BACTERIUM P. luteola PRO23 Hem. ind. 70 (2) 143–150 (2016)
147
Figure 5. Biofilm appearance in bioreactors after 48h incubation (+); no biofilm appearance (–).
Figure 6. Effect of tobramycin and gentamycin subinhibitory concentrations on growth kinetics in Pseudomonas luteola PRO23.

I.M. ATANASKOVIĆ et al.: NOVEL OIL-DEGRADING BACTERIUM P. luteola PRO23 Hem. ind. 70 (2) 143–150 (2016)
148
Figure 7. Effect of aminoglycosides on diesel biodegradation efficiency in Pseudomonas luteola PRO23.
higher cell number was reached in the presence of tobramycin and gentamicin sub-MICs (Fig. 6). In these conditions stationary phase was longer then in the control group, probably because biosurfactant pro-duction increased the nutrients availability. The optical density of the cultures was growing even in the lag phase, when no growth of bacterial cell number was observed. This OD increase is probably caused by biosurfactant production, which starts before the end-ing of the lag phase. OD changes could also be induced by the orange pigmentation of the strain, or other met-abolite production. It didn’t drop during the decrease of CFUs, which was only observed in biofilm containing bioreactors. OD consistency in the liquid phase of bio-film containing cultures was previously described [28].
We also compared the kinetics of biosurfactant production with the growth kinetics. The highest rate of biosurfactant production was observed in the lag phase, when the strain was adapting to diesel as its only nutrient source. The production level reaches a plateau in the stationary phase, although viable cells are still present in the culture. This result is in accord-ance with previous studies, which show that ramnolipid production stops after reaching a certain threshold [29].
Subinhibitory concentrations of tobramycin and gentamicin have also stimulated diesel biodegradation. The highest rate of biodegradation was observed for 0.625 µg/mL of tobramycin, where 82 % of diesel was degraded in 96 h. This degradation rate was three times higher than in the control group, where no aminoglycoside was present. In previous studies it was shown that biosurfactant production and biofilm form-ation led to more efficient oil degradation [14]. We suppose that tobramycin and gentamicin stimulate these processes in P. luteola, which resulted in better diesel degradation and higher cell growth. Both chem-icals had a very similar effect on strains’ adaptation to diesel. They exhibit the similar effect probably because they both belong to the same class of antibiotics.
Therefore, we propose the structure of aminoglyco-sides as a reference for new biodegradation inducing agents.
CONCLUSION
Pseudomonas luteola PRO23 strain, isolated from oil contaminated soil, is capable of using light and heavy crude oil as the only carbon and energy source. The strain showed different growth kinetics depending on oil type and concentration. The growth was more intensive in conditions with light oil as a sole carbon source. The most intensive growth was obtained in 10 g/L light oil concentration. The increase of heavy oil concentration and the highest light oil concentration inhibited the microbial growth. According to these results, optimal conditions for ex situ oil biodegrad-ation and growth of P. luteola PRO23 are 5–10 g/L of light oil type. Aminoglycosides tobramicin and genta-micin stimulated microbial growth in the bioreactors. Growth stimulation was followed by more intense bio-surfactant production, biofilm formation and more effi-cient oil degradation. Therefore aminoglycosides could serve as reference molecules for designing new ind-ucers of bioremediation.
Acknowledgements This study was partially supported by the Ministry
of Education, Science and Technological Development of the Republic of Serbia, grant number TR31080, and by EU Comission project AREA, contract No. 316004.
REFERENCES
[1] B.O. Okonokhua, B. Ikhajiagbe, G.O. Anoliefo, T.O. Emede, The effects of spent engine oil on soil properties and growth of maize (Zea mays L.), J. Appl. Sci. Environ. Manage. 11 (2007) 147–152.
[2] B. Thapa, K.C. Ajay Kumar, A. Ghimire, A review on bioremediation of petroleum hydrocarbon contamin-

I.M. ATANASKOVIĆ et al.: NOVEL OIL-DEGRADING BACTERIUM P. luteola PRO23 Hem. ind. 70 (2) 143–150 (2016)
149
ants in soil, Kathmandu Univ. J. Sci. Eng. Technol. 8 (2012) 164–170.
[3] A.O. Nwadinigwe, E.G. Onyeidu, Bioremediation of crude oil-polluted soil using bacteria and poultry manure monitored through soybean productivity, Pol. J. Environ. Stud. 21 (2012) 171–176.
[4] T.T. Tsai, C.M. Kao, R.Y. Surampalli, H.Y. Chien, Enhanced bioremediation of fuel-oil contaminated soils: Laboratory feasibility study, J. Environ. Eng. 135 (2009) 845–853.
[5] M.A.R. Muftah, T. Šolević, M. Antić, V.P. Beškoski, M.M. Vrvić, J. Schwarzbauer, B. Jovančićević, Degradability of n-alkanes during ex situ natural bioremediation of soil contaminated by heavy residual fuel oil (mazut), J. Serb. Chem. Soc. 78 (2013) 1035–1043.
[6] V. Raičević, B. Lalević, D. Dabić, D. Kiković, Lj. Jovanović, M. Nikšić, Mikroorganizmi u remedijaciji zemljišta i voda, Zast. Mater. 2 (2007) 49–52 (in Serbian).
[7] F. Haus, J. German, G.A. Junter GA, Primary biodeg-rability of mineral base oils in relation to their chemical and physical characteristics, Chemosphere 45 (2001) 983–990.
[8] K. Das, A.K. Mukherjee, Crude petroleum-oil biodeg-radation effciency of Bacillus subtilis and Pseudomonas aeruginosa strains isolated from a petroleum-oil con-taminated soil from North-East India, Bioresour. Technol. 98 (2006) 1339–1345.
[9] G. Emtiazi, H. Shakarami, I. Nahvi, S.H. Mirdamadian, Utilization of petroleum hydrocarbons by Pseudomonas sp. and transformed Escherichia coli, Afr. J. Biotechnol. 4 (2005) 172–176.
[10] L.R. Hoffman, D.A. D’Argenio, M.J. MacCoss, Z. Zhang, R.A. Jones, S.I. Miller, Aminoglycoside antibiotics induce bacterial biofilm formation, Nature 436 (2005) 1171– –1175.
[11] T. Kievit, Quorum sensing in Pseudomonas aeruginosa biofilms, Environ. Microbiol. 11 (2009) 279–288.
[12] J.S. Terzić, Research of biodegradation potential of oil hydrocarbons in soils by detection of catabolytic genes. MSc thesis. Faculty of chemistry, Belgrade (1998).
[13] T. Tugrul, C. Emir, Detecting surfactant-producing mic-roorganisms by the drop collapse test, World J. Mic-robiol. Biotechnol. 21 (2005) 851–853.
[14] G. Zhang, Y. Wu, X. Qian, Q. Meng Q, Biodegradation of crude oil by Pseudomonas aeruginosa in the presence of rhamnolipids, J. Zhejiang Univ. Sci., B 6 (2005) 725–730.
[15] US EPA, Method 1664, Revision A: N-Hexane Extractable Material (HEM; Oil and Grease) and Silica Gel Treated N-Hexane Extractable Material (SGTHEM; Non-polar Material) by Extraction and Gravimetry. US Office of Water, Washington DC, 1999.
[16] K. Sakalle, S. Rajkumar, Isolation of crude oil degrading marine bacteria and assessment for biosurfactant pro-
duction, Int. J. Microb. 7 (2009), http:// //dx.doi:10.5580/1d0e
[17] N.H. Youssefa, K.E. Duncana, D.P. Naglea, K.N. Savagea, R.M. Knappb, M.J. McInerneya, Comparison of methods to detect biosurfactant production by diverse micro-organisms, J. Microbiol. Meth. 56 (2004) 339–347.
[18] L.L. Smith-Greenier, A. Adkins, Degradation of diclofop-methyl by pure cultures of bacteria isolated from Manitoban soils, Can. J. Microbiol. 42 (1996) 227–233.
[19] G. Buitron, A. Gonzalez, L.M. Lopez-Marin, Biodegrad-ation of phenolic compounds by an acclimated activated sludge and isolated bacteria, Water Sci. Technol. 37 (1998) 371–378.
[20] J. Chang, C. Chou, Y. Lin, P. Lin, J. Ho, T. Hu, Kinetic characteristics of bacterial azo-dye decolorization by Pseudomonas luteola, Water Res. 35 (2001) 2841–2850.
[21] O.P. Ward, Microbial biosurfactants and biodegradation, In: Ramkrishna sen. (Eds.) Biosurfactants, Chapter 5, Landes Biosciences and Springer Science+Business Media (2010) 65–74.
[22] A. Silset, Emulsion (w/o and o/w) of heavy crude oils. Characterization, stabilization, destabilization and pro-duced water quality. Thesis for the degree of philo-sophiae doctor, Norwegian University of Science and Technology, Trondhaim, 2008, p. 79.
[23] S.V. Cook, A. Chu, H.R. Goodman, Leachability and toxicity of hydrocarbons, metals and salt contamination from flare pit soil, Water, Air, Soil Pollut. 133 (2001) 297–314.
[24] R.M.P. Silva, A.A. Rodriguez, J.M.G.M. de Oca, D.C. Moreno, Biodegradation of crude oil by Pseudomonas aeruginosa AT18 strain, Tecnol. Quim. 26 (2006) 70–77.
[25] Y. Prabhu, P.S. Phale, Biodegradation of phenanthrene by pseudomonas sp. strain PP2: Novel metabolic path-way, role of biosurfactant and cell surface hydropho-bicity in hydrocarbon assimilation, Appl. Microbiol. Biotechnol. 61 (2003) 342–351.
[26] W. Khan, S. Bernier, S. Kuchma, J. Hammond, F. Hasan, G. O’Toolel, Aminoglycoside resistance of Pseudomonas aeruginosa biofilms modulated by extracellular polysac-charide, Int. Microbiol. 13 (2010) 207–212.
[27] J. Linares, I. Gustafsson, F. Baquero, J. Martinez, Anti-biotics as intermicrobial signaling agents instead of weapons, Proc. Natl. Acad. Sci. U.S.A. 103 (2006) 19484– –19489.
[28] M. Meyer, V. Roy, W. Bentley, R. Ghodssi, Development and validation of a microfluidic reactor for biofilm monitoring via optical methods, J. Micromech. Micro-eng., 21 (2011) 054023.
[29] Y. Zhang, R. Miller, R., Enhanced octadecane dispersion and biodegradation by a Pseudomonas rhamnolipid surfactant (biosurfactant), Appl. Environ. Microbiol. 58 (1992) 3276–3282.
I.M. ATANASKOVIĆ et al.: NOVEL OIL-DEGRADING BACTERIUM P. luteola PRO23 Hem. ind. 70 (2) 143–150 (2016)
150
IZVOD
STIMULACIJA DEGRADACIJE DIZELA I PRODUKCIJA BIOSURFAKTANATA POMOĆU AMINOGLIKOZIDA I NOVE BAKTERIJE Pseudomonas luteola PRO23 KOJA RAZGRAĐUJE NAFTU
Iva M. Atanasković1, Jelena P. Jovičić Petrović2, Marjan B. Biočanin1, Vera M. Karličić2, Vera B. Raičević2, Blažo T. Lalević2 1Univerzitet u Beogradu, Biološki fakultet, Beograd, Srbija 2Univerzitet u Beogradu, Poljoprivredni fakultet, Beograd-Zemun, Srbija
(Naučni rad)
Jedna od naprednih tehnologija za rešavanje problema kontaminacije naftomje bioremedijacija. U ovim istraživanjima ispitana je kinetika rasta i efikasnostbiodegradacije nafte bakterije Pseudomonas luteola PRO23, izolovane iz uzoraka zemljišta kontaminiranih sirovom naftom, pri različitim koncentracijama (5, 10and 20 g/L) lake i teške sirove nafte. U uslovima prisustva lake nafte konstatovanaje znatno efikasnija biodegradacija, brža adaptacija i brži rast ćelija. Povećanjekoncentracije lake nafte od 5 do 10 g/L stimulisala je mikrobni rast i efikasnostbiodegradacije. Dalje povećanje koncentracije lake nafte, kao i povećanje koncen-tracije teške nafte, inhibiralo je mikrobni rast, kao i biodegradaciju. Aminogli-kozidi su stimulisali produkciju biosurfaktanata kod P. luteola pri subinhibitornim koncentracijama (0,3125, 0,625 μg/mL). Aminoglikozidi su takođe indukovali stva-ranje biofilma. Produkcija biosurfaktanata bila je najintenzivnija tokom lag faze inastavila se do stacionarne faze. Aminoglikozidi su izazvali promene u kinetici rasta P. luteola. U prisustvu aminoglikozida, stepen degradacije dizela u prisustvuovog soja iznosio je 82% za 96 h. Ovi rezultati ukazuju da Pseudomonas luteolaPRO23 se potencijalno može koristiti u bioremedijaciji ekosistema kontaminiranog sirovom naftom i da aminoglikozidi mogu da stimulišu ovaj proces.
Ključne reči: Biodegradacija • Sirova nafta • Aminoglikozidi • Pseudomonas luteola
151
Optimization of activation temperature on the preparation of sliced porous activated carbon from date fronds by physical activation Muhammad Shoaib, Hassan M. Al-Swaidan Department of Chemistry, College of Science, King Saud University, , Riyadh, Kingdom of Saudi Arabia
Abstract Saudi Arabia is the major date producer in the world. In order to get the maximum pro-duction from date tree there is a need to prune the trees on annual basis and is consideredas a serious environmental threat. The single step procedure for the synthesis of porous activated carbon (AC) from Saudi date tree fronds using mixture of gases (N2 and CO2) was carried out at different carbonization/activation temperatures staring from 700 to 1000 °C at a ramp rate of 10 °C/min. Alloy 330 horizontal reactor was used in tube furnace. Flowrate of N2 and CO2 gases were kept at 150 and 50 ml/min, respectively. Results revealed that at 850 °C larger surface area was achieved and can offer higher potential to produceactivated carbon of greater adsorption capacity from date fronds waste. The BET surface area of the activated carbon prepared at 850 °C after 30 min activation time is 1094 m2/g.
Keywords: activated carbon, physical activation, gaseous mixture, Saudi date fronds, agro waste.
PROFESSIONAL PAPER
UDC 661.183:58(532):66
Hem. Ind. 70 (2) 151–157 (2016)
doi: 10.2298/HEMIND140916022S
Available online at the Journal website: http://www.ache.org.rs/HI/
Any cheap material, with a high carbon content and low in organics, can be used as a raw material for the production of activated carbon (AC) [1]; agricultural by-products have proved to be promising raw materials for the production of activated carbons (ACs) because of their availability at a low price. They can be used for the production of activated carbon (AC) with a high adsorption capacity, considerable mechanical strength, and low ash content [2]. Literature survey indicates that there have been many attempts to obtain low-cost activated carbons (AC) or adsorbent from agricultural wastes [3–7].
Saudi Arabia is the major date producer in the world. In order to get the maximum production from date tree there is a need to prune the trees on annual basis. About twelve million of date-palm trees exist in Saudi Arabia. Approximately about three million trees were cut and then pruned every year. It is reported that about 75,000 tons of palm tree fronds, also con-sisted of foliar parts and thorns, are left during pruning process [8]. This quantity is either disposed off as waste or burnt and ultimately ends up with a harmful effect to the environment. Carbonaceous material can be used to produce activated carbon. Many studies have been reported for the preparation of activated carbon (AC) through agricultural waste material [9–14]. Therefore, the plenty of this agriculture waste material (palm tree fronds) is available in Saudi Arabia and con-sidered as an ideal source as a precursor for production Correspondence: H.M. Al-Swaidan, Department of Chemistry, King Saud University, Riyadh 11451, P.O. Box 2455, Saudi Arabia. E-mail: [email protected] Paper received: 16 September, 2014 Paper accepted: 13 February, 2015
of activated carbon (AC). For the manufacturing of acti-vated carbon (AC) two methods have been reported, i.e., physical and chemical activation [15–20]. In the present study the aim is to prepare activated carbon (AC) of high surface area and porosity using physical method.
Pyrolysis is one form of energy recovery process, which has the potential to generate char, oil and gas product [21]. Because of the thermal treatment, which removes the moisture and the volatile matter contents of the biomass, the remaining solid char shows dif-ferent properties than the parent biomass materials. The remarkable differences are mainly in porosity, sur-face area, pore structures (micro pores, mesopores and macropores) and physicochemical properties such as composition, elemental analysis and ash content. These changes in the properties usually lead to high reactivity, and hence, an alternative usage of char as an adsorb-ent material becomes possible [22]. Thus, the char becomes an attractive by-product, with applications including production of activated carbons (ACs), which is useful as a sorbent for air pollution control [23]. Acti-vated carbons (ACs) are carbons of highly micro porous form with both high internal surface area and porosity, and commercially the most common adsorbents used for the removal of organic compounds from air and water streams.
EXPERIMENTAL
The fronds were dried at 105 °C for 8 h to reduce the moisture content, sliced with sophisticated wood cutter to a size range of 2–3 mm. Pyrolysis of the palm fronds and activation of the resulting chars were both
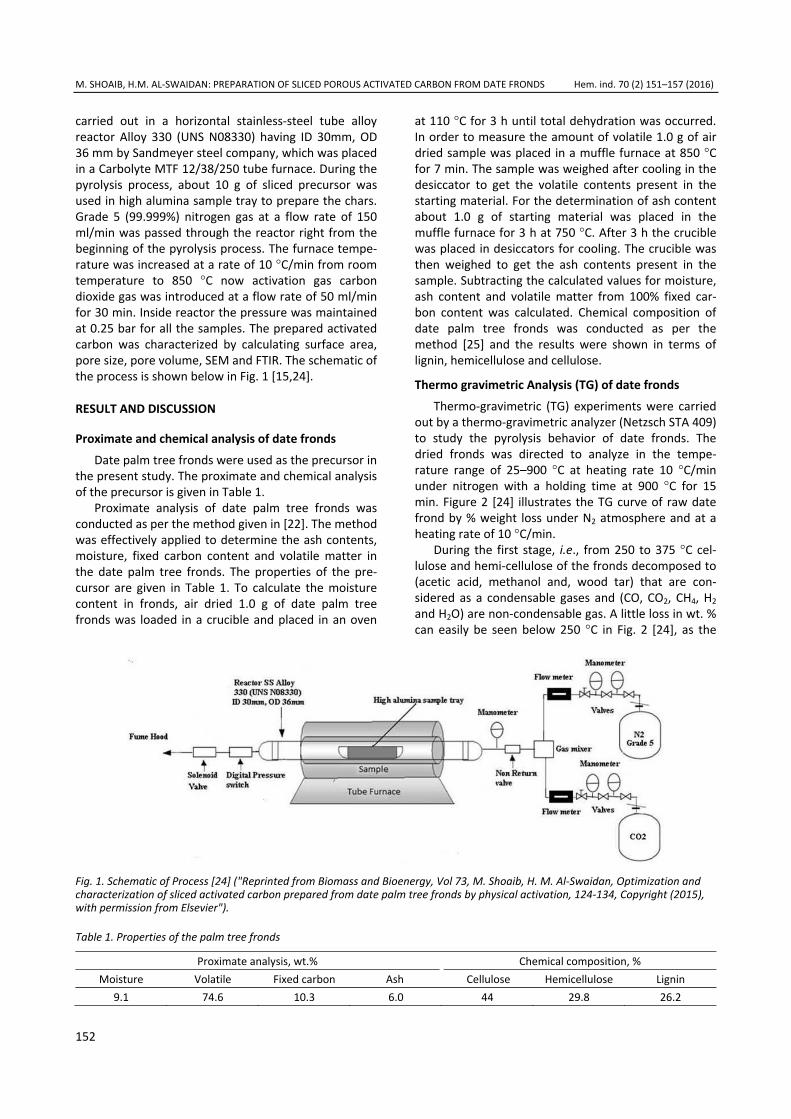
M. SHOAIB, H.M. AL-SWAIDAN: PREPARATION OF SLICED POROUS ACTIVATED CARBON FROM DATE FRONDS Hem. ind. 70 (2) 151–157 (2016)
152
carried out in a horizontal stainless-steel tube alloy reactor Alloy 330 (UNS N08330) having ID 30mm, OD 36 mm by Sandmeyer steel company, which was placed in a Carbolyte MTF 12/38/250 tube furnace. During the pyrolysis process, about 10 g of sliced precursor was used in high alumina sample tray to prepare the chars. Grade 5 (99.999%) nitrogen gas at a flow rate of 150 ml/min was passed through the reactor right from the beginning of the pyrolysis process. The furnace tempe-rature was increased at a rate of 10 °C/min from room temperature to 850 °C now activation gas carbon dioxide gas was introduced at a flow rate of 50 ml/min for 30 min. Inside reactor the pressure was maintained at 0.25 bar for all the samples. The prepared activated carbon was characterized by calculating surface area, pore size, pore volume, SEM and FTIR. The schematic of the process is shown below in Fig. 1 [15,24].
RESULT AND DISCUSSION
Proximate and chemical analysis of date fronds Date palm tree fronds were used as the precursor in
the present study. The proximate and chemical analysis of the precursor is given in Table 1.
Proximate analysis of date palm tree fronds was conducted as per the method given in [22]. The method was effectively applied to determine the ash contents, moisture, fixed carbon content and volatile matter in the date palm tree fronds. The properties of the pre-cursor are given in Table 1. To calculate the moisture content in fronds, air dried 1.0 g of date palm tree fronds was loaded in a crucible and placed in an oven
at 110 °C for 3 h until total dehydration was occurred. In order to measure the amount of volatile 1.0 g of air dried sample was placed in a muffle furnace at 850 °C for 7 min. The sample was weighed after cooling in the desiccator to get the volatile contents present in the starting material. For the determination of ash content about 1.0 g of starting material was placed in the muffle furnace for 3 h at 750 °C. After 3 h the crucible was placed in desiccators for cooling. The crucible was then weighed to get the ash contents present in the sample. Subtracting the calculated values for moisture, ash content and volatile matter from 100% fixed car-bon content was calculated. Chemical composition of date palm tree fronds was conducted as per the method [25] and the results were shown in terms of lignin, hemicellulose and cellulose.
Thermo gravimetric Analysis (TG) of date fronds Thermo-gravimetric (TG) experiments were carried
out by a thermo-gravimetric analyzer (Netzsch STA 409) to study the pyrolysis behavior of date fronds. The dried fronds was directed to analyze in the tempe-rature range of 25–900 °C at heating rate 10 °C/min under nitrogen with a holding time at 900 °C for 15 min. Figure 2 [24] illustrates the TG curve of raw date frond by % weight loss under N2 atmosphere and at a heating rate of 10 °C/min.
During the first stage, i.e., from 250 to 375 °C cel-lulose and hemi-cellulose of the fronds decomposed to (acetic acid, methanol and, wood tar) that are con-sidered as a condensable gases and (CO, CO2, CH4, H2 and H2O) are non-condensable gas. A little loss in wt. % can easily be seen below 250 °C in Fig. 2 [24], as the
Fig. 1. Schematic of Process [24] ("Reprinted from Biomass and Bioenergy, Vol 73, M. Shoaib, H. M. Al-Swaidan, Optimization and characterization of sliced activated carbon prepared from date palm tree fronds by physical activation, 124-134, Copyright (2015), with permission from Elsevier").
Table 1. Properties of the palm tree fronds
Proximate analysis, wt.% Chemical composition, % Moisture Volatile Fixed carbon Ash Cellulose Hemicellulose Lignin
9.1 74.6 10.3 6.0 44 29.8 26.2

M. SHOAIB, H.M. AL-SWAIDAN: PREPARATION OF SLICED POROUS ACTIVATED CARBON FROM DATE FRONDS Hem. ind. 70 (2) 151–157 (2016)
153
frond had been dried under 105 °C for 8 h. Curve at temperature over 850 °C showed the weight unchanged at this stage. The carbon at this stage is acceptable as a precursor for producing activated car-bon because a carbon with 10–15% volatile is not too tight, and can easily react with activating gas to pro-duce big surface and huge pore volume. So it is appar-ent that date frond can be as good raw material.
BET surface area, pore size and pore volume Specific surface areas pore size and pore volumes of
the activated carbons were determined by N2 gas adsorption at 77 K with an automated adsorption instrument (Gemini VII, 2390 Micromeritics). Prior to the determination, the sample (about 0.05 g) was degassed for 45 min at 15 °C under nitrogen to remove moisture and other volatiles from the sample. The surface areas of activated carbon produced at various activation temperatures are shown in Table 2.
Increasing temperature causes increasing release of volatiles and increasing carbon burn off due to carbon–
–CO2 reaction. Hence, the yield decreases with inc-reasing temperature. For an activation temperature of 100 °C, the yield has reached at 8.5% and it mainly contains the ash whereas at 850 °C 18.75% yield was obtained with high surface area and pore volume as shown in Table 2. Increasing the activation tempe-rature enhances the existing pores and forms new pores from 700 to 850 °C by continual devolatilization of the chars and carbon burn off due to the carbon–CO2 reaction, resulting in increasing BET surface area, pore volume, and non-pore volume. A decreasing trend from 900 °C and above was also observed and this is maybe because of the accumulation of carbon in the pores. The pore size may have started increasing and pore fusions might occur, causing decrease in surface area. The highest surface area 1094 m2 g–1 for AC prepared at 850 °C was obtained.
Fourier transform Infrared spectroscopy (FTIR) FTIR spectra give details about different functional
group information of the materials. Figure 3 illustrates
Fig. 2. Thermogravimetric Analysis (TG) of date fronds (this material is reproduced with kind permission of Elsevier) [24] ("Reprinted from Biomass and Bioenergy, Vol 73, M. Shoaib, H. M. Al-Swaidan, Optimization and characterization of sliced activated carbon prepared from date palm tree fronds by physical activation, 124-134, Copyright (2015), with permission from Elsevier").
Table 2. Activation temperature effect on surface area, pore volume, pore size and yield %age of activated carbon; : a-b-c-d-e-f denotes sliced activated carbon: activation temperature (°C), heating ramp rate (°C/min), activation dwell time (min), CO2 flow rate (ml), reaction vessel pressure (bar)
Sample No. Sample name Surface area, m2/g Pore volume, cm3/g Pore size, Å Yield, % 1 Raw date frond 2 – – – 2 SACa-700b-10c-30d-50e-0.25f 385 0.1663 17.27 28.42 3 SACa-750b-10c-30d-50e-0.25f 587 0.2562 17.44 24.65 4 SACa-800b-10c-30d-50e-0.25f 633 0.2716 17.14 20.62 5 SACa-850b-10c-30d-50e-0.25f 1094 0.4382 16.09 18.75 6 SACa-900b-10c-30d-50e-0.25f 727 0.3063 16.83 16.0 7 SACa-950b-10c-30d-50e-0.25f 515 0.2270 17.38 14.3 8 SACa-1000b-10c-30d-50e-0.25f ND ND ND 8.5 mainly ash

M. SHOAIB, H.M. AL-SWAIDAN: PREPARATION OF SLICED POROUS ACTIVATED CARBON FROM DATE FRONDS Hem. ind. 70 (2) 151–157 (2016)
154
the FTIR spectra of Raw Date Frond, SAC-850-10-30-50- -0.25. Strong absorption band between 3600–3400 cm–1 can be seen in all the spectra’s shown in Fig. 3 [24], which is the characteristic of OH group and the broad-ening of the band is due to the high degree of hydrogen bonding. The Raw date frond in Fig. 3 shows the most crowded spectrum. A strong and broad adsorption peak appeared at 3386.23 cm–1, which is due to the stretching of O–H group in the raw date frond sample. Peak observed at 2923.75 cm–1 belongs to the alkane C–H stretching. The peak at 1733.44 cm–1 is a C=O stretching and a C=C peak also observed around 1618.30 cm–1. The peak at 1425.46–1375.25 corres-ponds to C–H bends and rock in alkane, respectively. Absorption peaks at 1330.98, 1160.53, 1243.99 and 1055.98 cm–1 which is the characteristic of C–O group can also be observed. The spectrum for SAC-850-10-30- -50-0.25, in Fig. 3 shows reduction in absorption peaks because most of the groups are reduced at 850 °C.
Scanning electron microscopy (SEM) SEM analysis was carried out by using Jeol JSM-
6380 LA instrument. Figure 4a shows the scanning electron micrographs for the raw date fronds. The image clearly shows the surface is curvy due to cellu-lose, hemicelluloses and lignin and with less slit like fractures or cracks. Mesoporosity can be seen in Fig.4b. Microporous and mesoporous combination can easily be interpreted in Fig. 4c and small pores, transitional pores, and slit like pores with different shapes could also be clearly identified in Fig. 4d. SEM images account for the higher BET surface area and pore volume.
Fig. 4. SEM micrographs showing the surface morphologies of: a) raw date frond, b) mesopores, c) micropores and meso-pores and d) slit like pores for SACa-850b-10c-30d-50e-0.25f [24] ("Reprinted from Biomass and Bioenergy, Vol 73, M. Shoaib, H. M. Al-Swaidan, Optimization and characterization of sliced activated carbon prepared from date palm tree fronds by physical activation, 124-134, Copyright (2015), with permission from Elsevier").
Nitrogen adsorption isotherm The N2 adsorption isotherms of the selected five
activated carbons are presented in Fig. 5. Here the quantity of N2 adsorbed is plotted against the relative pressure p/p0 of N2. It can be seen that the N2 ads-orption isotherm of Sample SAC-850-10-30-50-0.25 shows the maximum adsorption, which indicates pre-dominantly the presence of micro porosity with minor
Fig. 3. FTIR spectra for date palm tree frond and SAC-850-10-30-50-0.25 [24] ("Reprinted from Biomass and Bioenergy, Vol 73, M. Shoaib, H.M. Al-Swaidan, Optimization and characterization of sliced activated carbon prepared from date palm tree fronds by physical activation, 124-134, Copyright (2015), with permission from Elsevier").

M. SHOAIB, H.M. AL-SWAIDAN: PREPARATION OF SLICED POROUS ACTIVATED CARBON FROM DATE FRONDS Hem. ind. 70 (2) 151–157 (2016)
155
presence of mesoporosity in the activated carbon. This result is similar to as observed in SEM studies.
Nitrogen adsorption-desorption isotherm Figure 6 shows the nitrogen adsorption-desorption
isotherm at 77 K of the activated carbon prepared from 700 to 950 °C. The effects of temperatures provided
different performances of the nitrogen isotherms. All the nitrogen isotherm curves significantly increase in the low-relative pressure (p/p0 < 0.2) indicating the presence of pore structures with the Type I isotherm indicates the presence of mono layers. However, at higher relative pressure (p/p0 > 0.2), the knee of nit-rogen isotherm curves became more open and steadily
Fig. 5. Adsorption Isotherm for synthesized activated carbon [24] ("Reprinted from Biomass and Bioenergy, Vol 73, M. Shoaib, H. M. Al-Swaidan, Optimization and characterization of sliced activated carbon prepared from date palm tree fronds by physical activation, 124-134, Copyright (2015), with permission from Elsevier").
Fig. 6. Nitrogen adsorption desorption isotherm of activated carbon synthesized at various temperatures [24] ("Reprinted from Biomass and Bioenergy, Vol 73, M. Shoaib, H. M. Al-Swaidan, Optimization and characterization of sliced activated carbon prepared from date palm tree fronds by physical activation, 124-134, Copyright (2015), with permission from Elsevier").

M. SHOAIB, H.M. AL-SWAIDAN: PREPARATION OF SLICED POROUS ACTIVATED CARBON FROM DATE FRONDS Hem. ind. 70 (2) 151–157 (2016)
156
increased to the maximum relative pressure (p/p0 ≈ ≈ 0.9). These results suggested that large amount of nitrogen was adsorbed during the adsorption process indicating the presence of wider porosity (mesopores) with the Type IV isotherm. The entire relative pressure ranges suggested that the nitrogen adsorption exhi-bited a combination of the Type I and IV isotherms, indicating the presence of micro and mesoporosity in the activated carbon. Additionally, the presence of hys-teresis loops with H4 type in the desorption isotherms closure at p/p0 ≈ 0.4 indicates presence of small meso-pores. This hysteresis was associated with capillary condensation in micro and mesopores. This pheno-menon shows that the activated carbon production may have a combination of micro and mesopores. The lower curves being an significance of microporosity [26], whereas the upper curves look like a Types H4 that also verifies the presence of slit-shaped pores as shown in SEM images.
CONCLUSION
The optimum activation temperature conditions for the synthesis of activated carbon from date palm tree fronds using the physical activation were a tempera-ture of 850 °C. The above conditions verified that the activation has occurred, BET surface area of 1094 m2/g has been achieved moreover the synthesized activated carbon has predominantly microporous. SEM images verified the presence of porosities and pore develop-ment during the pyrolysis and activation process. Thus, it is feasible to produce high-quality porous activated carbon from date frond agro waste using N2 carbon-ization followed by physical activation with CO2 and N2 mixture.
Acknowledgements This research was supported by King Saud Univer-
sity, Deanship of Scientific Research, College of Science Research Center.
REFERENCES
[1] D. Savova, E. Apak, E. Ekinci, F. Yardim, N. Petrova, T. Budinova, Biomass conversion to carbon adsorbents and gas, Biomass Bioenergy 21 (2001) 133–142.
[2] M. Lanzetta, C. di Blasi, Pyrolysis kinetics of wheat and corn straw, J. Anal. Appl. Pyrolysis 44 (1998) 181–192.
[3] M. Ahmedna, W.E. Marshall, R. M. Rao, Production of granular activated carbons from select agricultural by-products and evaluation of their physical, chemical and adsorption properties, Bioresour. Technol. 71 (2000) 113–123.
[4] A. Aygun, S. Yenisoy-Karakas, I. Duman, Production of granular activated carbon from fruit stones and nut-shells and evaluation of their physical, chemical, and
adsorptionproperties. Micropor. Mesopor. Mater. 66 (2003) 189–195.
[5] E. Cetin, B. Moghtaderi, R. Gupta, T.F Wall, Influence of pyrolysis conditions on the structure and gasification reactivity of biomass chars, Fuel 83 (2004) 2139–2150.
[6] A. Marcilla, S. García-García, M. Asensio, J.A. Conesa, Influence of thermal treatment regime on the density and reactivity of activated carbons from almond shells, Carbon 38 (2000) 429–440.
[7] V. Minkova, S.P. Marinov, R. Zanzi, E. Bjornbom, T. Budinova, M. Stefanova, Thermochemical treatment of biomass in a flow of steam or in a mixture of steam and carbon dioxide, Fuel Process. Technol. 62 (2000) 45–52.
[8] M. Shoaib, H.M. Al-Swaidan, Synthesis of Activated Car-bon from Saudi Date Tree. Fronds by Gaseous Mixture (N2 and CO2), J. Chem. Soc. Pak. 36 (2014) 771–774.
[9] S. Balcı, T. Doğu, H. Yücel, J. Chem. Technol. Biotechnol. 60 (1994) 419–426.
[10] J. Laine, S. Yunes, Effect of the preparation method on the pore size distribution of activated carbon from coconut shell, Carbon 30 (1992) 601–604.
[11] Z. Hu, E.F. Vansant, Chemical activation of elutrilithe producing carbon-aluminosilicate composite adsorbent, Carbon 33 (1995) 561–567.
[12] F. Rodriguez-Reinoso, J. M. Martin-Martinaz, M. Molina-Sabio, I. Petez-Lledo, C. Prado-Burguete, Rodriguez-Reinoso, Carbon 23 (1985) 19–24.
[13] K. Gergova, N. Petrov, S. Eser, Adsorption properties and microstructure of activated carbons produced from agricultural by-products by steam pyrolysis, Carbon 32 (1994) 693–702.
[14] J. Rodriguez-Mirasol, T. Cordero, J.J. Rodriguez, High-temperature carbons from kraft lignin, Carbon 31 (1993) 87–95.
[15] M. Shoaib, H.M. Al-Swaidan, Ramp Rate Influence on Synthesis of Sliced Porous Activated Carbon from Date Palm Tree by Physical Activation Method, Asian J. Chem. 26 (2014) 5295–5297.
[16] A. Ahmadpour, D.D. Do, Ahmadpour, The preparation of active carbons from coal by chemical and physical acti-vation, Carbon 34 (1996) 471–479.
[17] T. Kazimierz, S. Teresa, C. Franciszek, J. Anna, Formation of porous structures in activated brown-coal chars using O2, CO2 and H2O as activating agents, Fuel 56 (1977) 121–124.
[18] H. Haykiri-Acma, S. Yaman, S. Kucukbayrak, Gasification of biomass chars in steam–nitrogen mixture, Energy Convers. Manage. 47 (2006) 1004–1013.
[19] V. Fierro, V. Torné-Fernández, A. Celzard, Highly micro-porous carbons prepared by activation of kraft lignin with KOH, Stud. Surf. Sci. Catal. 160 (2006) 607-614.
[20] J. Yang, Z.M. Shen, Z.B. Hao, Preparation of highly mic-roporous and mesoporous carbon from the mesophase pitch and its carbon foams with KOH, Carbon 42 (2004) 1872–1875.
[21] A.E. Putun, N. Ozbay, E.P. Onal, E. Putun, Fixed-bed pyrolysis of cotton stalk for liquid and solid products, Fuel Process. Technol. 86 (2005) 1207–1219.

M. SHOAIB, H.M. AL-SWAIDAN: PREPARATION OF SLICED POROUS ACTIVATED CARBON FROM DATE FRONDS Hem. ind. 70 (2) 151–157 (2016)
157
[22] M. Fan, W. Marshall, D. Daugaard, R.C. Brown, Steam activation of chars produced from oat hulls and corn stover, Bioresour. Technol. 93 (2004) 103–107.
[23] W.T. Tsai, C.Y. Chang, S.L. Lee, Preparation and charac-terization of activated carbons from corn cob, Carbon 35 (1997) 1198–2000.
[24] M. Shoaib, H.M. Al-Swaidan, Optimization and charac-terization of sliced activated carbon prepared from date palm tree fronds by physical activation, Biomass Bio-energy 73 (2015) 124–134.
[25] H. Ammar, M. Abid, S. Abid, Cellulose fibers obtained by organosolv process from date palm rachis (Phoenix dactylifera L.), IOP Conf. Series Mater. Sci. Eng. 28 (2012) 012002.
[26] C.F. Chiung, C.Y. Chang, W.T. Tsai, Effects of burn-off and activation temperature on preparation of activated carbon from corn cob agrowaste by CO(2) and steam, J. Colloid Interface Sci. 232 (2000) 45–49.
IZVOD
OPTIMIZACIJA TEMPERATURE AKTIVACIJE ZA PRIPREMU POROZNOG UGLJENIKA DOBIJENOG IZ LISTOVA URME FIZIČKOM AKTIVACIJOM Muhammad Shoaib, Hassan M. Al-Swaidan
Department of Chemistry, College of Science, King Saud University, P.O. Box 2455, Riyadh 11451, Kingdom of Saudi Arabia
(Stručni rad)
Saudijska Arabija je vodeći proizvođač urmi u svetu. U cilju postizanja maksi-malne proizvodnje koristeći drvo urme, postoji potreba da se drveće seče na go-dišnjem nivou, što se smatra ozbiljnom pretnjom za životnu sredinu. U radu jeprikazan jednostavan postupak (u jednom koraku) za sintezu poroznog aktivnoguglja (AC) iz urminog drveta iz Saudijske Arabije, korišćenjem smeše gasova (N2 i CO2). Postupak je izveden na različitim temperaturama karbonizacije/aktivacije od 700 to 1000 °C pri brzini od od 10 °C/min. Horizontalni reaktor tipa Alloy 330 je korišćen u cevnoj peći. Protok gasova N2 i CO2 je bio 150 i 50 ml/min, redom. Rezultati pokazuju da je za 850 °C dobijena veća površina, i ovi uslovi mogu ponu-diti veće mogućnosti za proizvodnju aktivnog uglja sa većim adsopcionim kapa-citetom iz otpada od lišća urme. Površina aktivnog uglja, određena BET analizom,dobijenog na 850 °C posle vremena aktivacije od 30 min je iznosila 1094 m2/g.
Ključne reči: Aktivni ugalj • Fizička akti-vacija • Mešavina gasova • Urme iz Sau-dijske Arabije • Agro otpad


159
Determination of di(2-ethylhexyl) phthalate in plastic medical devicesIvana S. Kostić1, Tatjana D. Anđelković1, Darko H. Anđelković1, Tatjana P. Cvetković2, Dušica D. Pavlović2 1University of Niš, Faculty of Sciences and Mathematics, Niš, Serbia 2University of Niš, Faculty of Medicine, Niš, Serbia
Abstract The presence of DEHP in dialysis and infusion sets for peritoneal dialysis and parenteralnutrition, which are made of PVC and other plastic polymeric materials, were investigated.Phthalate determination was carried out by gas chromatography–mass spectrometry method (GC–MS). The results showed that the peritoneal dialysis set (bag and tubing)made of PVC contains DEHP in significant amount, about 31–34%. Solution for peritoneal dialysis which was stored in the investigated PVC bag, contains low amount of DEHP, about3.72 µg dm–3. Infusion bottles which are made of LDPE, also contain DEHP but in loweramount than PVC bags. LDPE bottle for packaging physiological saline solution (0.9% NaCl)showed higher amount of DEHP than LDPE bottle for packaging Ringer’s solution. In con-trast, solution stored in bottle with lower DEHP level, i.e., Ringer’s solution, contained about three times higher concentration of DEHP than physiological saline solution storedin bottle with higher DEHP level. Concentrations of DEHP in Ringer’s solution and physio-logical saline solution are 17.30 and 5.83 µg dm–3, respectively. The obtained values areunder estimated upper-bound dose of DEHP received by adult patients undergoing pro-cedures of peritoneal dialysis and parenteral nutrition.
Keywords: phthalate, plastic material, medical devices, infusion set, peritoneal dialysis set.
SCIENTIFIC PAPER
UDC 547.584:678.743:543:615.47
Hem. Ind. 70 (2) 159–164 (2016)
doi: 10.2298/HEMIND141129023K
Available online at the Journal website: http://www.ache.org.rs/HI/
Phthalates, as diesteres of orto-phthalic acid, are organic lipophilic compounds, which are used as plasti-cizers. Phthalates are used as plasticizers to increase the softness and flexibility of plastics, notably PVC. But, they are not chemically bound in plastic materials and they can be leached into the environment [1–3]. About one million tonnes of phthalates are produced in Europe per year, and the most dominant phthalates are di-(2-ethylhexyl) phthalate (DEHP), diisodecyl phthalate (DiDP) and diisononyl phthalate (DiNP). In PVC mater-ials, DEHP is the most used plasticizer [4,5].
Humans are exposed to phthalates in numerous ways, by dermal resorption, foodstuff or by inhaling air which contains phthalates. These compounds are pre-sent in a wide variety of products, which are often used by people, such as cosmetics, personal care products, food packaging, children toys, water bottles, rainwear, tablecloths, upholstery, etc. [6–10].
PVC medical devices contain on average 20–40% DEHP by weight. A lot of medical devices are made from PVC, such as intravenous bags and tubing, infus-ion tubing, blood bags, catheters, oxygen masks, peri-toneal dialysis bags and tubing, enteral nutrition feed-ing bags, etc. [10,11]. Medical devices which contain phthalates may be important sources in susceptible subpopulations, including neonatal infants who are Correspondence: I. Kostić, Faculty of Sciences and Mathematics, Višegradska 33, 18000 Niš, Serbia. E-mail: [email protected] Paper received: 29 November, 2014 Paper accepted: 16 March, 2015
undergoing surgical interventions, but also to other hospital patients who receive nutritional supplements intravenously [13]. Phthalates are lipophilic com-pounds, and can be found in fats due to bioaccumul-ation process. The tolerable daily intake (TDI) values established by the European Food Safety Authority panel (2013) for benzyl butil phthalate (BBP), DEHP and dibutil phthalate (DBP) are 500, 50 and 10 μg/kg of bw per day, respectively [2]. Study of these types of chem-ical substances has increased in recent years because some of these compounds, such as DBP, BBP and DEHP, are suspected as endocrine disruptors and carcinogenic to humans. There is great concern about the toxicity of DEHP, especially for risk groups. Some of studied effects are mutagenic activity, carcinogenicity, peroxi-some proliferation, infertility, etc [9].
DEHP is not chemically bound to the polymer and it can migrate when the medical device comes into contact with certain media such as blood, drugs, saline or water. Also, DEHP can be released when the device is heated. Due to these facts, the major factors deter-mining the degree to which DEHP leaches from medical devices are temperature and storage time. Patients who are undergoing medical procedures, such as blood transfusions and haemodialysis potentially can be exp-osed to DEHP. When DEHP enters the human body, it is metabolized into various substances that are more readily excreted. The most important metabolite is mono-ethylhexyl phthalate (MEHP). Because conver-sion of DEHP to MEHP occurs primarily in the intestinal tract, exposures to DEHP by ingestion may be more

I.S. KOSTIĆ et al.: DETERMINATION OF DI(2-ETHYLHEXYL) PHTHALATE IN PLASTIC MEDICAL DEVICES Hem. ind. 70 (2) 159–164 (2016)
160
hazardous than by intravenous exposure, because this path bypasses the intestinal tract. Some studies showed that DEHP can cause liver cancer in laboratory animals. It can be caused through the induction of peroxisome proliferation, which leads to oxidative stress and the generation of electrophilic free radicals, and then indirectly causing damage to DNA damage [14–16].
Phthalates can be detected using different methods, such as mass spectrometry (MS) [17,18], electron capture detection (ECD) [19], and flame ionization det-ection (FID) [20]. The analysis of phthalates is mostly performed by gas chromatography (GC) and this method presents better sensitivity than HPLC methods. Also, there are different preconcentration methods, such as solid-phase extraction (SPE), solid-phase micro-extraction (SPME), headspace solid-phase microext-raction (HS-SPME), liquid-phase microextraction (LPME) and dispersive liquid-liquid microextraction (DLLME) [22–24]. The most conventional liquid-liquid extraction methods (LLE) performed with hexane, dichlorometh-ane, ethyl acetate or acetone have recovery values in the range between 70 and 100% and is relatively short and easily performed. Because of that, LLE method for extraction and GC for the separation and analysis seem to be the best choices for extraction and detection of phthalates [25] .
Due to the fact that these compounds are present in the environment, the major problem in phthalate determination is the sample contamination during the analysis. This problem can be reduced or even avoided by reduction of number of sample preparation steps [26,27].
The aim of this work was DEHP determination in medical devices, such as dialysis set (bags and tubing) and infusion set (bottles and tubing) which is made of polyvinyl chloride (PVC) and low density polyethylene (LDPE). In this study, we compared PVC and LDPE plastic medical equipment in their capability of leaching DEHP into solutions. DEHP was determined in solutions Dianeal Low Calcium Peritoneal Dialysis Solution (con-tains 1.5% dextrose and 2.5 meq Ca L–1), physiological saline solution (0.9% NaCl) and Ringer’s solution which were stored in the investigated bags and bottles for three years and in the PVC and LDPE plastic medical equipmen by liquid extraction and GC–MS analysis. Based on the obtained results, the migration of phthal-ates from packaging to the stored infusion/dialysis solutions can be defined.
EXPERIMENTAL
Chemical reagents and instrumentation High-purity DEHP was purchased from Sigma Ald-
rich (St. Louis, MO, USA). Dibutil adipate (DBA), which
was used as internal standard, was purchased from Fluka (Buchs, Swizerland). HPLC grade n-hexane was purchased from Sigma Aldrich.
Preparation of stock and working solutions Special care was taken to avoid the contamination
of sample due to contact of reagents and solvents with plastic laboratory materials during sample preparation. All glassware was washed with hot water and soap, rinsed with ultrapure deionized water and sub-sequently thoroughly rinsed with dichlormethane. Glassware was then sealed with aluminum foil and stored in a clean environment to avoid adsorption of phthalates from the air. Usage of plastic consumables during the analysis is avoided whenever possible. No laboratory gloves were used during sample preparation and analysis.
All stock and working solutions were prepared in hexane. Individual stock solutions of DEHP and DBA were initially prepared at a concentration of 1 mg cm–3. The stock standard was diluted stepwise with n-hexane to prepare at least 5 concentration levels of inter-mediate and working standards. Intermediate solutions were prepared by dilution of stock solution, and con-centrations of intermediate solutions were 100 and 10 µg cm–3. Working solutions were prepared by dilution of intermediate solutions and by adding DBA at con-centration 1 µg cm–3. All solutions were stored at 4 °C.
Sample preparation Plastic medical devices, which are used for various
techniques in medicine, were collected from the local hospital. Samples consisted of filled plastic dialysis bags and tubing from dialysis set (Baxter), infusion bottles (Hemofarm and Zdravlje) and tubing from infusion set (Mediset). Plastic materials were cut into pieces with area of about 1 cm2. All samples were extracted for 3, 6, 15 and 30 days with 5 ml of n-hexane in glass vials.
Individual solutions which are usually present in formulations for peritoneal dialysis and parenteral nut-rition were stored in PVC bags and LDPE bottles at room temperature. The analyzed samples were: sol-ution for peritoneal dialysis (1.5% dextrose), physio-logical saline solution (0.9% NaCl) and Ringer’s solution (NaCl, KCl and CaCl2) for parenteral nutrition. Liquid samples were collected in glass flasks and stored at 4 °C until analysis. Since the usual shelf-life of infusion solutions is three years, migration rates of DEHP from plastic containers were measured after a period of 36 months in order to determine the maximum possible leached concentration of DEHP before expiration period of the medical product. The extraction proce-dure was carried out with 5 cm3 of hexane for extract-ion of 500 cm3 sample. To 500 cm3 of each sample, 5 cm3 of hexane was added and mixed 60 min and 24 h. The organic layers were transferred to glass vials, inter-

I.S. KOSTIĆ et al.: DETERMINATION OF DI(2-ETHYLHEXYL) PHTHALATE IN PLASTIC MEDICAL DEVICES Hem. ind. 70 (2) 159–164 (2016)
161
nal standard was added and aliquots were injected into GC–MS directly with no clean up stage.
GC–MS technique Determination of phthalates was performed by
Hewlett Packard 6890 gas chromatograph equipped with an Agilent 5973 mass selective detector and a DB-5 MS capillary column (30 m×250 mm×0.25 mm, Agilent, USA) for chromatographic separation. The oven is programmed from 60 (1 min) to 220 °C (1 min) at rate of 20 °C min–1 and after to 280 °C (4 min) at rate of 5 °C min–1. The gas chromatograph was operated in splitless injection mode. The operating temperature of the MSD was 280 °C with the electronic impact at 70 eV. The MSD was used in the ion-monitoring (SIM) mode at m/z 149. The identification of target com-pounds was based on the relative retention time, the presence of target ions and their relative abundance. The quantification ion is m/z 149 for DEHP. The dwell time was 100 ms.
RESULTS AND DISCUSSION
The chromatogram in Figure 1 shows that the sep-aration of DEHP and DBA, as internal standard, occur-red within a running time of 20 min. Retention times for DBA and DEHP were 9.945 and 18.266 min, respect-ively.
Figure 1. Chromatogram of a standard solution containing DEHP in concentration 0.25 µg cm–3 and DBA in concentration 1 µg cm–3.
The analytical curve obtained for DEHP in concen-tration range 0.25–2.5 µg cm–3 is linear for the given range with coefficient of determination, R2, of 0.9970
and linear equation y = -34868.945 + 170366.584x (Fig-ure 2). Values of standard deviation for both coeffi-cients, intercept and slope, were 1224.711 and 3329.021, respectively. P-value for obtained coefficient of determination was P < 0.0001.
The hexane extraction of solid samples has been applied for determination of DEHP due to high extract-ion efficiency for phthalates. The yield of extraction showed that more than 90% of the phthalates in solid samples are extracted in the first 15 days. Presented results are obtained after the extraction procedure which was carried out with the time period of 30 days.
Figure 2. Analytical curve for DEHP for concentration range 0.25–2.5 µg cm–3.
Table 1 presents the amount of plasticizers in the investigated set for peritoneal dialysis. DEHP was found in extracts from the bag and the tubing.
The determined DEHP concentration levels of 33– –38% by weight of bag and tubing from peritoneal dialysis set are high but expected, bearing in mind the type of plastic material used for medical device pro-duction. The DEHP concentration levels in tubing were higher than DEHP concentration levels in dialysis bag, which is also expected due to more flexibile and soft performances of the tubing material.
Table 2 presents the amount of DEHP extracted from investigated LDPE solid materials. DEHP was found in the obtained extracts from the samples, although in low amounts.
Infusion bottle of physiological saline solution shows the higher concentration of DEHP than infusion bottle of Ringer’s solution. But in both cases, about 90% of amount was extracted after 6 days. Despite of
Table 1. Concentration of DEHP in the packaging material (mg g–1) from plastic medical devices (PVC) used for peritoneal dialysis determined for different extraction times (3, 6, 15 and 30 days); SD – standard deviation (n = 3); a–c: values with the same letter within a row are not statistically significant different at the p < 0.05 level (Tukey's HSD test)
Sample Extraction time, days
3 6 15 30 Dialysis bag 23.02±1.24a 25.82±1.05a 301.00±23.58b 324.98±14.17c Tubing from dialysis set 162.63±11.38a 319.13±28.37b 325.33±8.10b 351.18±28.74b
I.S. KOSTIĆ et al.: DETERMINATION OF DI(2-ETHYLHEXYL) PHTHALATE IN PLASTIC MEDICAL DEVICES Hem. ind. 70 (2) 159–164 (2016)
162
that, extraction procedure was carried out for 30 days, due to maximum possible leaching amount determin-ation. Tubing materials show much higher amount of DEHP by weight of sample.
Even though, the investigated plastic LDPE material commonly does not possess plasticizers, the DEHP was found in the infusion bottles and also in the physio-logical saline solution and Ringer’s solution which were stored in the infusion bottles. The contamination of these solutions is higher which is not expected due to low level of phthalate in packaging. This can indicate that the contamination is probably not only from the bottles where they are stored but from the tubing material that are used in their industrial preparation.
The results obtained by liquid–liquid extraction of DEHP from peritoneal dialysis solution and solutions for parenteral nutrition are given in Table 3. Very low amounts were leached by Peritoneal Dialysis Solution from PVC dialysis bag, despite the fact that dialysis bag contains DEHP in high concentration level. Concentra-tion of DEHP in Ringer’s solutions is higher than con-centration in peritoneal dialysis solution and physio-logical saline solution. While bottle of physiological saline solution shows higher percentage DEHP than bottle of Ringer’s solution, liquid sample from the same bottle shows lower concentration of DEHP.
Table 3. DEHP concentrations (μg dm–3) in peritoneal dialysis solution, physiological saline solution and Ringer’s solution stored in PVC bags and LDPE infusion bottles for different ext-raction times (60 min and 24 h); SD – standard deviation (n = 3); a, b: values with the same letter within a row are not statistically significant different at the p < 0.05 level (Tukey's HSD test)
Sample Extraction time
60 min 24 h Dialysis solution 3.58±0.29a 3.72±0.21a Physiological saline solution 5.83±0.55a 8.83±0.19b Ringer's solution 17.30±0.25a 21.16±2.51b
Difference between values of DEHP concentrations obtained for different extraction times were compared to a critical value in order to see if the difference is significant. The post-hoc test, Tukey’s test, was per-formed and the test compares the difference between
each pair of mean values with appropriate adjustment for the multiple testing. The critical value of q was obtained from table values, and it is the point when a mean difference becomes honestly significantly differ-ent. Critical values for solid and liquid samples are 3.96 and 3.46, respectively [28]. Values of HSD (honest sig-nificant difference) for each pair were computed by Origin© program. Comparing was performed in case p < 0.05.
Results obtained after performing Tukey’s post-hoc test shows that there is no significant difference between result obtained for 3 days extraction period and 6 day extraction period for dialysis bag, while for tubing from dialysis set, obtained results show that there are significant differences only between results obtained for 3 day extraction period and other ext-raction periods (6, 15 and 30 days). The same results as for tubing dialysis set were obtained in testing solid samples of infusion bottles with physiological saline solution, while in the case of infusion bottles with Rin-ger’s solution, there is significant difference, except for the extraction period between 15 days and 30 days. Results obtained in testing solid samples of tubing from infusion set show that there is significant difference, except for extraction period between 6 days and 3 days.
Results obtained in testing of liquid samples show that there is significant difference between obtained mean values for 60 min and 24 h extraction period for liquid samples of solutions for parenteral nutrition, while there is no significant difference between obtained mean values for 60 min and 24 h extraction period for liquid samples of dialysis solution.
On average, patient under peritoneal dialysis pro-cedure receives about 8 dm3 of peritoneal dialysis solution a day and it means that human body receives about 30 μg DEHP in total. This value is under esti-mated upper-bound dose of DEHP received by adult patients undergoing procedures of peritoneal dialysis 0.01 mg/kg per day (for adult with average body weight 70 kg). Furthermore, a considerable amount of the infused DEHP will be returned upon drainage of the perfusate from the peritoneum. Also, levels of DEHP which were detected in physiological saline solutions and Ringer’s solutions are under estimated upper-bound dose of DEHP for these kinds of medical pro-
Table 2. Concentration of DEHP in the packaging material (mg g–1) from plastic medical devices (LDPE) used for parenteral nutrition determined for different extraction times (3, 6, 15 and 30 days) SD – standard deviation (n = 3); a–c: values with the same letter within a row are not statistically significant different at the p < 0.05 level (Tukey's HSD test)
Sample Extraction time, days
3 6 15 30 Infusion bottle (physiological saline solution) 0.0608±0.0087a 0.0706±0.0238b 0.0729±0.0013b 0.0748±0.0019b Infusion bottle (Ringer's solution) 0.0104±0.0016a 0.0277±0.0015b 0.0453±0.0033c 0.0481±0.0053c Tubing from infusion set 106.05±3.89a 112.51±8.79a 321.25±3.15b 394.49±3.47c

I.S. KOSTIĆ et al.: DETERMINATION OF DI(2-ETHYLHEXYL) PHTHALATE IN PLASTIC MEDICAL DEVICES Hem. ind. 70 (2) 159–164 (2016)
163
ducts, 0.005 mg/kg per day (for adult with average body weight 70 kg) [29].
CONCLUSION
A migration of DEHP from set for peritoneal dialysis that are made from PVC into dialysis solution and set for infusion parenteral nutrition that were made from LDPE into infusion solutions has been investigated. Concentrations of DEHP which are determined in peri-toneal dialysis solution were about 3.72 µg dm–3. Even though the determined concentrations in the dialysis set are higher than expected, the leached amount of DEHP in the dialysis solution is not significant. Although in low amounts, LDPE bags also showed DEHP in their composition. DEHP leached from PVC into solution is much higher than leached from LDPE bottles. The obtained values are under estimated upper-bound dose of DEHP received by adult patients undergoing proce-dures of peritoneal dialysis and parenteral nutrition.
The proposed sample preparation and sample ext-raction methods can be applied for the determination of these compounds in solid samples of different bot-tles used as medical devices and solutions stored in these bottles and bags. The presence of these com-pounds in the solid samples can be attributed to the different compositions of the plastic containers.
Control of material which is used for production of the plastic medical devices is essential to avoid human exposure to phthalates.
Acknowledgement This study was supported by the Ministry of Edu-
cation, Science and Technological Development of the Republic of Serbia and was performed as a part of Project III 41018.
REFERENCES
[1] T. Fierens, K. Servaes, M. Van Holerbeke, L. Geerts, S. De Henauw, I. Sioen, G. Vanermen, Analysis of phthalates in food products and packaging materials sold on the Belgian market, Food Chem. Toxicol. 50 (2012) 2575– –2583.
[2] S. Keresztes, E. Tatar, Zsuzsanna Czegeny, G. Zaray, V.G. Mihucz, Study on the leaching of phthalates from polyethylene terephthalate bottles into mineral water, Sci. total Environ. 458-460 (2013) 451–458.
[3] S. Pradeep, S. Benjamin, Mycelial fungi completely rem-ediate di(2-ethylhexyl)phthalate, the hazardous plasti-cizer in PVC blood storage bag, J. Hazard. Mater. 235– –236 (2012) 69–77.
[4] D. Zhang, H. Lui, Y. Liang, C. Wang, H. Liang, H. Cai, Distribution of phthalate esters in the groundwater of Jianghan plain, Hubei, China, Earth Sci. China 3 (2009) 73–79.
[5] H.M. Koch, B. Rossbach, H. Drexler, J. Angerer, Internal exposure of the general population to DEHP and other phthalates – determination of secondary and primary phthalate monoester metabolites in urine, Environ. Res. 93 (2003) 177–185.
[6] P. Serôdio, J.M.F. Nogueira, Considerations on Ultra-trace Analysis of Phthalates in Drinking Water, Water Res. 40 (2006) 2572–2582.
[7] J. Bošnir, D. Puntarić, A. Galić, I. Škeš, T. Dijanić, M. Klarić, M. Grgić, M. Čurković, Z. Šmit, Migration of phthalates from plastic containers into soft drinks and mineral water, Food Technol. Biotechnol. 45 (2007) 91–95.
[8] G. Latini, Monitoring phthalate exposure in humans, Clin. Chim. Acta 361 (2005) 200.
[9] H.M. Koch, L.M. Gonzales-Reche, J. Angerer, On-line clean-up by multidimensional liquid chromatography–electrospray ionization tandem mass spectrometry for high throughput quantification of primary and second-ary phthalate metabolites in human urine, J. Chro-matogr., B 784 (2003) 169–182.
[10] Z. Guo, S. Wang, D. Wei, M. Wang, H. Zhang, P. Gai, J. Duan, Development and application of a method for analysis of phthalates in ham sausages by solid-phase extraction and gas chromatography-mass spectrometry, Meat Sci. 84 (2010) 484–490.
[11] H. Liu, W. Den, S. Chan, K.T. Kin, Analysis of trace contamination of phthalate esters in ultrapure water using a modified solid-phase extraction procedure and automated thermal desorption–gas chromatography/ /mass spectrometry, J. Chromatogr., A 1188 (2008) 286––294.
[12] G. Latini, M.Ferri, F. Chiellini, Materials degradation in PVC medical devices, DEHP leaching and neonatal outcomes, Curr. Med. Chem. 17 (2010) 2979–2989.
[13] H.G. Wahl, A. Hoffmann, H-U. Haring, H.M. Liebich, Identification of plasticizers in medical products by a combined direct thermodesorption-cooled injection sys-tem and gas chromatography-mass spectrometry, J. Chromatogr., A 847 (1999) 1–7.
[14] F. Gonzalez, M. Peters, R. Cattley, Mechanism of Action of the Nongenotoxic Peroxisome Proliferators: Role of the Peroxisome Proliferator-Activated Receptor α, J. Natl. Cancer I. 90 (1998) 1702–1709.
[15] Swedish National Chemicals Inspectorate, Risk Assess-ment for bis(2-ethylhexyl) phthalate, February 1999, EINECS-NO: 204-211-0.
[16] M.J. Silva, E. Samandar, J.L. Preau Jr., L.L. Needham, A.M. Calafat, Urinary oxidative metabolites of di(2-ethylhexyl) phthalate in humans, Toxicology 219 (2006) 22–32.
[17] K. Holadova, G. Prokupkova, J. Hajslova, J. Poustka, Headspace SPME of phthalic acid esters from vegetable oil employing solvent based matrix modification, Anal. Chim. Acta 528 (2007) 24–33.
[18] L.K. Sorensen, Determination of phthalates in milk and milk products by liquid chromatography/tandem mass spectrometry, Rapid Commun. Mass Spectrom. 20 (2006) 1135–1143.

I.S. KOSTIĆ et al.: DETERMINATION OF DI(2-ETHYLHEXYL) PHTHALATE IN PLASTIC MEDICAL DEVICES Hem. ind. 70 (2) 159–164 (2016)
164
[19] X. Li, M. Zhong, S. Xu, C. Sun, Determination of phthal-ates in water samples using polyaniline-based solid-phase microextraction coupled with gas chromato-graphy, J. Chromatogr., A 1135 (2006) 101–108.
[20] B. Cavaliere, B. Macchione, G. Sindona, A. Tagarelli, Tandem mass spectrometry in food safety assessment : the determination of phthalates in olive oil, J. Chro-matogr., A 1205 (2008) 137–143.
[21] D. Xu, X. Deng, E. Fang, X. Zheng, Y. Zhou, L. Lin, L. Chen, M. Wu, Z. Huang, Determination of 23 phthalic acid esters in food by liquid chromatography tandem mass spectrometry, J. Chromatogr., A 1324 (2014) 49–56.
[22] H-Y. Shen, Simultaneous screening and determination eight phthalates in plastic produscts for food use by sonication-assisted extraction/GC-MS methods, Talanta 66 (2005) 734–739.
[23] P. Liang, J. Xu, Q. Li, Application of dispersive liquid–liquid microextraction and high-performance liquid chromatography for the determination of three phthal-ate esters in water samples, Anal. Chim. Acta 609 (2008) 53–58.
[24] R.Y. Su, X.W. Zhao, Z.Y. Li, Q. Jia, P. Liu, J.B. Jia, Poly(methacrylic acid-co-ethylene glycol dimethacryl-ate) monolith microextraction coupled with high per-formance liquid chromatography for the determination of phthalate esters in cosmetics, Anal. Chim. Acta 676 (2010) 103–108.
[25] P. Kueseng, P. Thavarungkul, P. Kanatharana, Trace phthalate and adipate esters contaminated in packaged food, J. Environ. Sci. Heal., B 42 (2007) 569–576.
[26] A. Reid, C. Brougham, A. Fogarty, J. Roche, An inves-tigation into possible sources of phthalate contamin-ation in the environmental analytical laboratory, Intern. J. Environ. Anal. Chem. 87 (2007) 125–133.
[27] C. Perez, M.C. Baricela Alonso, E. Pena Vasquez, P. Herbello Hermelo, P. Barmejo Barera, Phthalates deter-mination in physiological saline solutions by HPLC–ES- -MS, Talanta 75 (2008) 1184–1189.
[28] R. Hampton, J. Havel, Introdustory biological statistics, 2nd ed., Waveland Press, Inc., Long Grove, IL, 2006.
[29] [FDA, Safety Assessment of Di(2-ethylhexyl)phthalate (DEHP) Released from PVC Medical Devices, U.S. Food and Drug Administration, 2001, pp. 10–20.
IZVOD
ODREĐIVANJE DIETILHEKSIL FTALATA U PLASTIČNOJ MEDICINSKOJ OPREMI Ivana S. Kostić1, Tatjana D. Anđelković1, Darko H. Anđelković1, Tatjana P. Cvetković2, Dušica D. Pavlović2 1Univerzitet u Nišu, Prirodno–matematički fakultet, Višegradska 33, 18000 Niš 2Univerzitet u Nišu, Medicinski fakultet, Bul. Zorana Đinđića 81, 18000 Niš
(Naučni rad)
Ispitivano je prisustvo dietilheksil-ftalata (DEHP) u medicinskoj opremi naprav-ljenoj od polivinil-hlorida (PVC) i polietilena niske gustine (LDPE) koja se koristi uprocesima peritonealne dijalize i parenteralne prehrane. Određivanje ftalata jeizvršeno gasnom hromatografijom sa masenom detekcijom (GC–MS). Rezultati su pokazali da set koji se koristi u procesu peritonealne dijalize (kesa sa rastvorom i cevčica) napravljen od PVC sadrži DEHP u značajnoj količini, oko 31–34%. Rastvor za peritonealnu dijalizu, koji je čuvan u ispitivanoj PVC kesi, sadrži malu količinu DEHP, oko 3,72 µg dm–3. Infuzione boce koje su napravljene od polietilena niskegustine (LDPE), takođe sadrže DEHP, ali u manjoj količini u odnosu na PVC kese.LDPE boca u kojoj se nalazio fiziološki rastvor (0,9% NaCl) sadrži veću količinu DEHP od LDPE boce u kojoj se nalazio Ringerov rastvor. Nasuprot tome, rastvorikoji se se nalazili u bocama sa nižim sadržajem DEHP, tj. Ringerov rastvor sadržioko tri puta veću koncentraciju DEHP od fiziološkog rastvora (0,9% NaCl) koji senalazio u boci sa većim sadržajem DEHP. Određene koncentracije DEHP u Ringe-rovom rastvoru i fiziološkom rastvoru bile su 17,30 i 5,83 µg dm–3, redom. Dobi-jeni rezultati su ispod utvrđenih dozvoljenih doza za DEHP kojima je odrastaočovek izložen tokom peritonealne dijalize i parenteralne prehrane.
Ključne reči: Ftalati • Plastični materijali •Medicinska oprema • Infuzioni set • Set za peritonealnu dijalizu

165
Liquid–liquid equilibrium constant for acetic acid in an olive oil–epoxidized olive oil–acetic acid–hydrogen peroxide–water system Milovan R. Janković, Olga M. Govedarica, Snežana V. Sinadinović-Fišer, Jelena M. Pavličević, Vesna B. Teofilović, Nevena R. Vukić Faculty of Technology, University of Novi Sad, Novi Sad, Serbia
Abstract The liquid–liquid equilibrium constant for acetic acid in a quinary system olive oil–epox-idized olive oil–acetic acid–hydrogen peroxide–water was experimentally determined fortemperatures and component ratios relevant for in situ epoxidation of plant oils. The values have the constant range from 1.52 to 2.73. To predict the equilibrium constant foracetic acid, the experimental data were correlated with UNIQUAC (universal quasi chem-ical) and NRTL (non-random two liquid) activity coefficient models. For simplified calcul-ation of the phase equilibrium the insolubility of olive oil and epoxidized olive oil in thewater, as well as insolubility of water and hydrogen peroxide in the olive oil and epoxidized olive oil, was assumed. The root mean square deviation (RMSD) of the experimental and calculated values of the liquid–liquid equilibrium constant for acetic acid is 0.1910 for theUNIQUAC model and 0.1815 for the NRTL model. For rigorous flash calculation, when the partitioning of all components between the phases was assumed, the RMSD for the NRTL model is 0.1749.
Keywords: Liquid–liquid equilibrium, acetic acid, plant oil, epoxidation.
SCIENTIFIC PAPER
UDC 66.094.39:665.3:547.292:544.35
Hem. Ind. 70 (2) 165–175 (2016)
doi: 10.2298/HEMIND141210024J
Available online at the Journal website: http://www.ache.org.rs/HI/
Percarboxylic acid, such as performic or peracetic acid, is a common oxidizing agent in a large scale pro-duction of epoxidized plant oils. The percarboxylic acid is generated in situ through the acid catalyzed reaction of corresponding organic acid with hydrogen peroxide in an aqueous solution. A soluble mineral acid, usually sulfuric acid, or an acidic cation exchange resin can be used as a catalyst for this reaction [1,2]. Depending on applied catalyst, the reaction system of epoxidation is either two- (oil–water) or three-phase (oil–water–ion exchange resin) system. Thus, it is important to obtain the liquid-liquid equilibrium data for modeling and optimization of the epoxidation process. A rigorous two- or three-phase model of the epoxidation reaction system should include a partition coefficient for organic acid [3–6]. The coefficient is dependent on a liquid– –liquid equilibrium constant for organic acid and molar densities of the phases [7–9]. A few authors investi-gated partitioning of formic acid or acetic acid between the oil and water phases of the epoxidation reaction system. Rangarajan et al. determined experimentally the partition coefficient for acetic acid in a soybean oil-acetic acid-water system at 313 and 333 K [3]. On the basis of experimental data for the liquid-liquid equilib-rium constant for acetic acid, Sinadinović-Fišer and Jan-ković calculated the partition coefficient for acetic acid Correspondence: S.V. Sinadinović-Fišer, Faculty of Technology, Uni-versity of Novi Sad, Bul. cara Lazara 1, 21000 Novi Sad, Serbia. E-mail: [email protected] Paper received: 10 December, 2014 Paper accepted: 3 March, 2015
in the soybean oil–acetic acid–water system at tempe-rature range of 293–353 K [7]. Campanella et al. deter-mined the partition coefficient for formic acid/acetic acid in the soybean oil–formic acid/acetic acid–water system at 313 K [8]. A presence of epoxidized plant oil in the system was taken into account when the liquid-liquid equilibrium constant for acetic acid was inves-tigated for the epoxidized soybean oil–acetic acid– –water system [9]. In aforementioned works, neither the changing of the oil phase composition during the reaction of epoxidation, i.e., different ratios of plant oil and epoxidized plant oil, nor the presence of hydrogen peroxide in the system was considered. In this work, however, the temperature and composition depen-dency of the liquid-liquid equilibrium constant for ace-tic acid (KA) in a system containing five reaction com-ponents was investigated. To predict the liquid–liquid equilibrium constant for acetic acid in an olive oil (OO)– –epoxidized olive oil (EOO)–acetic acid (A)–hydrogen peroxide (HP)–water (W) system, the interaction para-meters of the UNIQUAC (universal quasi chemical) [10] and NRTL (non-random two liquid) [11] models for the activity coefficient were determined by fitting the experimental data obtained for the equilibrium cons-tant at different temperatures and compositions. The results of simplified and rigorous calculation of the phase equilibrium were compared.

M.R. JANKOVIĆ et al.: LIQUID–LIQUID EQUILIBRIUM CONSTANT FOR ACETIC ACID Hem. ind. 70 (2) 165–175 (2016)
166
Determination of the liquid–liquid equilibrium constant
For the same reference state in two phases, L1 and L2, the liquid–liquid equilibrium condition for com-ponent j is:
γ γ=1 1 2 2L L L Lj j j jx x (1)
where γ Lj is the activity coefficient of component j in
phase L; and Ljx is the mole fraction of component j in
phase L. The mole fraction of component j in the phase L can
be expressed by the following equation:
=
=
LL
NCL
1
/
/
j jj
k kk
m Mx
m M (2)
where Ljm and L
km (g) are the masses of component j and k, respectively, in phase L; jM and kM (g/mol) are molecular masses of component j and k, respectively; and NC is the number of components in the system.
According to Eq. (1), the liquid–liquid equilibrium constant for acetic acid (KA) in investigated oil-water system is defined as:
γγ
= =w oA A
A o wA A
xK
x (3)
where used superscripts are for water (w) and oil (o) phases.
The experimental value of the liquid-liquid equilib-rium constant for acetic acid can be calculated via Eq. (3) using mole fractions ( L
Ax ). The predicted value of the equilibrium constant for
acetic acid can be obtained also via Eq. (3) using activity coefficients ( γ L
A ). The activity coefficient of component j is the function of phase composition ( L
jx ) and tempe-rature (T). For investigated system, the coefficients are defined as:
( )γ =o o o o o oOO EOO A HP W, , , , ,j f x x x x x T (4)
( )γ =w w w w w wOO EOO A HP W, , , , ,j f x x x x x T (5)
For the calculation of the equilibrium constant, in this work the UNIQUAC and NRTL models for the acti-vity coefficient were used. Their interaction parameters were determined by fitting the experimental data for the liquid-liquid equilibrium.
The UNIQUAC binary interaction parameter (τj,k) is expressed as [10]:
τ−
=,
,
j kuRT
j k e (6)
where uj,k (J/mol) indicates an adjustable binary para-meter for components j and k in the mixture; and R is the universal gas constant.
The NRTL binary interaction parameter (Gj,k) is given as [11]:
α−=
,
,
j kuRT
j kG e (7)
A value of the non-randomness parameter (α) of 0.2, which was used in this work, is recommended for the partially miscible liquids [11].
EXPERIMENTAL
Materials and chemicals Olive oil, product of the Urzante, S.L., Spain, was
purchased in supermarket. Glacial acetic acid (>99.8%) was bought from Sigma-Aldrich, Germany, while 30 wt.% aqueous hydrogen peroxide solution, hydrobro-mic acid and isopropyl alcohol (min 99.5%) were ordered from J.T. Backer, Netherlands. An acid form of sulfonated polystyrene-type cation exchange resin Amberlite IR-120H from Sigma-Aldrich, USA, was used as a catalyst. Alfapanon, Serbia, was a supplier of the aqueous solutions of potassium permanganate (0.1 N), sodium hydroxide (0.1 N) and sodium thiosulfate (0.1 N), while sulfuric acid (p.a.), iodine (p.a.) and bromine (p.a.) were purchased from Centrohem, Serbia. Potas-sium iodide (extra pure), benzene (p.a.) and chloroform (min 98.5%) were purchased from LachNer, Czech Rep-ublic.
Epoxidation procedure The epoxidation of olive oil was carried out in bulk
with peracetic acid formed in situ according to the method reported in the literature [12]. Mole ratio of oil unsaturation:acetic acid:hydrogen peroxide was 1:0.5:1.5. The amount of cationic ion exchange resin Amberlite IR-120H used as catalyst was 20 wt.% of ace-tic acid and hydrogen peroxide solution weight. Olive oil (250 g), glacial acetic acid and catalyst were intro-duced into a 500 mL three-neck round-bottom flask placed in a water bath and equipped with magnetic stirrer, thermometer, reflux condenser and dropping funnel. The 30% aqueous hydrogen peroxide was drop-wise charged into the reaction mixture at temperature of 323±1 K within half an hour. The stirring speed of 1000 rpm was constant. After addition, the tempera-ture of the reaction mixture was increased to 348 K and maintained within ±1 K next 8 h. After removing of the ion exchange resin by filtration, cooled product was centrifuged. Separated oil phase was washed with water (313 K) until pH 7. Water was evaporated at 323 K under the vacuum (about 30 kPa). Stock of epoxidized
M.R. JANKOVIĆ et al.: LIQUID–LIQUID EQUILIBRIUM CONSTANT FOR ACETIC ACID Hem. ind. 70 (2) 165–175 (2016)
167
olive oil was obtained by blending products of 8 epoxi-dation runs.
Equilibration procedure The liquid–liquid equilibrium constant for acetic
acid in the system olive oil–epoxidized olive oil–acetic acid–hydrogen peroxide–water was experimentally determined by equilibrating the system components at four temperatures employing seven compositions. A 500 mL three-neck round-bottom flask with weighed masses of olive oil (mOO), epoxidized olive oil (mEOO), acetic acid (mA), 30% aqueous solution of hydrogen peroxide (maqHP) and water (mW) was equipped with condenser, thermometer and magnetic stirrer. Compo-sitions of investigated mixtures are given in Table 1. The mixtures were equilibrated in a thermostatic water bath at 293, 308, 323 and 338 (±1) K for an hour under the constant stirring of 1000 rpm. Without stopping the stirring, six samples of about 10 mL were withdrawn from the mixture and centrifuged (20 min, 1000 rpm). The samples in centrifugation tubes were again ther-mostated at particular temperature for 20 min. Three samples were used to determine the content of volatile matter in the oil phase. The weighed, in grams, por-tions of the oil (ms,o) and water (ms,w) phase of other
three samples were titrated to determine the mass fractions of acetic acid and hydrogen peroxide. Samp-ling of the phases from latter three centrifuge tubes simulated triple determination of the liquid–liquid equilibrium constant for acetic acid.
Methods To characterize the olive oil and epoxidized olive oil,
a standard gravimetric method for the moisture and volatile matter content [13], the Hanus method for the iodine number and standard HBr–acetic acid method for the epoxy oxygen content [14] were applied. All analyses were done in triplicate.
The mass fraction of hydrogen peroxide in the hydrogen peroxide aqueous solution ( ωaqHP
HP ) was determined by permanganometric titration with 0.1 N KMnO4.
The mass fraction of water, acetic acid and hyd-rogen peroxide in the oil phase (ωo
W,A,HP ) of the equi-librated mixtures was determined in triplicate accord-ing to the standard gravimetric method for the mois-ture and volatile matter content in plant oils [13], assuming that acetic acid and hydrogen peroxide eva-porate together with water.
The mass fractions of acetic acid in the oil ( ωoA ) and
water (ωwA ) phase were determined by the neu-
tralization titration with 0.1 N NaOH, whereas the mass fractions of hydrogen peroxide in the oil ( ωo
HP ) and water ( ωw
HP ) phase were determined by the perman-ganometric titration with 0.1 N KMnO4. The fractions of component j were calculated according to the following expressions:
( )ω
−=
o o,coro
s,o1000t t t j
j
V V N E
m (8)
ω =w
ws,w1000
t t jj
V N E n
m (9)
where otV and w
tV (mL) are the volumes of titration solution t consumed for titration of the samples of the oil and water phase, respectively; Nt (gE/L) indicates the normality of titration solution t; Ej (g/gE) is the mass of component j gram equivalent, which for acetic acid is EA = MA, while for hydrogen peroxide is
=HP HP / 2E M ; and n is the number of aliquots. o,cortV
(mL) is the volume of titration solution t consumed, in the case of NaOH titration, for the neutralization of the free fatty acids and, in the case of KMnO4 titration, for the oxidation of the minor components in the oil phase sample. It was calculated as follows:
where OOth and EOO
th (mL t/g oil) are corrections for the titration of olive oil and epoxidized olive oil, respectively, determined experimentally for both tit-ration solutions as 0.025 mL NaOH/g OO, 0.125 mL NaOH/g EOO, 0.0199 mL KMnO4/g OO and 0.0189 mL KMnO4/g EOO; ωOO
W and ωEOOW indicate the moisture
content in the olive oil and epoxidized olive oil, res-pectively.
Calculation of the liquid-liquid equilibrium constant for acetic acid using the experimental data
The value of the liquid–liquid equilibrium constant for acetic acid was calculated on the basis of Eqs. (2) and (3).
For calculation of the mole fractions of acetic acid in the oil and water phase, Eq. (2), the masses of the system components were calculated using the mass balance equations and the experimental data i.e. the mass fractions of acetic acid and hydrogen peroxide in both phases and the mass fraction of water, acetic acid and hydrogen peroxide in the oil phase. The calculation proceeds as follows.
Experimentally determined mass fractions of acetic acid and hydrogen peroxide were used to calculate the masses of these components in the equilibrated phases:
( ) ( ) ( )( )( ) ( )
ω ω ω
ω ω
− − + −=
− + −
s,o o OO EOOW,A,HP OO OO W EOO EOO Wo
,cor OO EOOOO W EOO W
1 1 1
1 1
t t
t
m h m h mV
m m (10)

M.R. JANKOVIĆ et al.: LIQUID–LIQUID EQUILIBRIUM CONSTANT FOR ACETIC ACID Hem. ind. 70 (2) 165–175 (2016)
168
ω=o o oA Am m (11)
ω=w w wA Am m (12)
ω=o o oHP HPm m (13)
ω=w w wHP HPm m (14)
where mo and mw (g) are the masses of the oil and water phases in equilibrium, respectively. Assuming the insolubility of oils in the water phase and knowing weighed masses of olive oil and epoxidized olive oil, as well as measured content of moisture in both oils, the masses of olive oil ( o
OOm ) and epoxidized olive oil ( o
EOOm ) in the oil phase are:
ω= −o OOOO OO W(1 )m m (15)
ω= −o EOOEOO EOO W(1 )m m (16)
The mass balance of the oil phase is defined as fol-lows:
= + + + +o o o o o oOO EOO A HP Wm m m m m m (17)
When Eqs. (11) and (13) are substituted in (17), the mass of water in the oil phase ( o
Wm ) can be calculated as:
( )ω ω= − − − −o o o o o oW HP A EOO OO1m m m m (18)
The total mass of water in the system, which par-titions between the oil and water phase, is the sum of weighed water and water introduced into the system with hydrogen peroxide solution, olive oil and epox-idized olive oil:
( )ω ω
ω
+ − + +
+ = +
aqHP OOW aqHP HP OO W
EOO o wEOO W W W
1m m m
m m m (19)
where ωaqHPHP is the mass fraction of hydrogen peroxide
in the hydrogen peroxide solution. Therefore, the mass of water in the water phase ( w
Wm ) is:
( )ω ω
ω
= + − + +
+ −
w aqHP OOW W aqHP HP OO W
EOO oEOO W W
1m m m m
m m (20)
The calculation of the mass of each phase in equi-librium was performed as follows. The mass of the oil phase in equilibrium can be calculated as:
ω+
=−
o oo OO EOO
oW,A,HP1
m mm (21)
while following expression for the mass of the water phase in equilibrium:
ω ω=
− −
ww W
w wHP A1m
m (22)
can be derived when Eqs. (12) and (14) are substituted in the equation that describes the mass balance of equilibrated water phase, assuming already accepted insolubility of oils in the water phase:
= + +w w w wA W HPm m m m (23)
In order to check the agreement of weighed and experimentally determined contents of acetic acid and hydrogen peroxide, both partitioned between the sys-tem phases, an average relative error ARE (%) was calculated as follows:
=
+ −=
o,exp w,exp weig, , ,
weig1 ,
100 NEP j p j p j p
p j p
m m mARE
NEP m (24)
where NEP is the number of experimental points for the liquid–liquid equilibrium constant determination;
o,exp,j pm and w,exp
,j pm are the experimentally determined masses of component j in oil (o) and water (w) phase, respectively, for experimental point p; and weig
,j pm is the weighed mass of component j for experimental point p.
RESULTS AND DISCUSSION
The olive oil was characterized with an experiment-ally measured iodine number (INOO) of 80.30 and the moisture content of 0.02 wt.%. For epoxidized olive oil were determined the epoxy oxygen content (EO) of 4.41 wt.%, the residual iodine number (INEOO) of 0.36 and the moisture content of 3.40 wt.%. Therefore, the conversion of olive oil double bonds was 99.5% and the selectivity of epoxidation was 91.9%.
For the following fatty acid composition of olive oil: 9.0% palmitic, 6.1% stearic, 77.9% oleic, 6.3% linoleic and 0.7% linolenic acid, the molecular mass of 878.3 g/mol was calculated according to equation:
== + −OO G W
13 3
NFA
FA FAFA
M M x M M (25)
where NFA is the number of fatty acids in the olive oil triglycerides; xFA is the mole fraction of particular fatty acid in the olive oil triglycerides; and MG (g/mol) indi-cates the molecular mass of glycerol. The accepted fatty acid composition of the olive oil corresponds to the experimentally determined iodine number.
The molecular mass of epoxidized olive oil of 934.0 g/mol was calculated via following mole balance of olive oil’s double bond (D) partial conversion to epoxy group (E) and hydroxyl acetate group (HA), assuming that hydroxyl acetate is generated as the only side pro-duct during the epoxidation of olive oil [15,16]:

M.R. JANKOVIĆ et al.: LIQUID–LIQUID EQUILIBRIUM CONSTANT FOR ACETIC ACID Hem. ind. 70 (2) 165–175 (2016)
169
= + +D,OO D,EOO E,EOO HA,EOON N N N (26)
where ND,OO is the number of moles of double bond per mole of olive oil; ND,EOO, NE,EOO and NHA,EOO are the num-bers of moles of residual double bond, epoxy group and hydroxyl acetate, respectively, per mole of epoxidized olive oil. By expressing ND,OO as a function of iodine number of olive oil, as well as ND,EOO and NE,EOO as func-tions of residual iodine number and epoxy oxygen con-tent in epoxidized olive oil, respectively, the quantity of the hydroxyl acetate group can be written according to Eq. (26) as follows:
= − −OO OO EOO EOO EOOHA,EOO
I I O
200 200 200
IN M IN M EO MN
A A A (27)
where AI and AO are the atomic masses of iodine and oxygen, respectively. Since the molecular mass of epoxidized olive oil can be expressed as enlarged molecular mass of olive oil due to formed epoxy group and hydroxyl acetate group, it can be calculated as:
= + + +EOO OO E,EOO O HA,EOO O A( )M M N A N A M (28)
After expressing NE,EOO as the function of EO and substituting Eq. (27) in Eq. (28), the equation for cal-culation of the molecular mass of epoxidized olive oil used in this work is established:
−
− −
=
+ +=
+ + +
EOO1
OO OO O A I1 1
A O EOO O A I
[1 ( )(200 ) ]1 (100 ) ( )(200 )
M
M IN A M AEO M A IN A M A
(29)
The mass fraction of hydrogen peroxide in the hyd-rogen peroxide aqueous solution ( ωaqHP
HP ) was deter-mined as 0.288.
Experimental values of the liquid-liquid equilibrium constant
The mass fraction of water, acetic acid and hydro-gen peroxide as the volatile matter in the oil phase, as well as the mass fractions of acetic acid and hydrogen peroxide in the oil and water phase, are given in Table 1 as the average values of three experimental deter-minations.
Table 1. Compositions of equilibrated mixtures and experimentally determined mass fraction of water (W), acetic acid (A) and hyd-rogen peroxide (aqHP), ωo
W,A,HP , in the oil phase, mass fractions of acetic acid ( ωoA ) and hydrogen peroxide ( ωo
HP ) in the oil phase, as well as mass fractions of acetic acid ( ωw
A ) and hydrogen peroxide ( ωwHP ) in the water phase; OO: olive oil, EOO: epoxidized olive oil
Mixture T K
Weighed massa (mj), g oW,A,HPω o
Aω oHPω w
Aω wHPω
OO EOO A aqHP W O1 308 0.00 36.78 4.65 5.03 11.86 0.0664 0.0282 0.00303 0.171 0.0671
323 0.00 36.88 4.65 5.03 11.86 0.0777 0.0307 0.00297 0.170 0.0672 338 0.00 36.77 4.66 5.03 11.85 0.0673 0.0300 0.00343 0.171 0.0665
O2 308 0.00 36.80 2.67 10.04 7.56 0.0872 0.0195 0.0105 0.102 0.140 323 0.00 36.78 2.67 10.05 7.55 0.0621 0.0179 0.00763 0.102 0.139 338 0.00 36.80 2.68 10.04 7.55 0.0588 0.0175 0.00743 0.101 0.137
O3 293 8.75 27.58 2.66 5.02 11.87 0.0319 0.0134 0.00137 0.111 0.0722 308 8.76 27.60 2.66 5.02 11.86 0.0443 0.0135 0.00247 0.109 0.0699 323 8.77 27.61 2.66 5.02 11.85 0.0424 0.0144 0.00240 0.109 0.0735 338 8.75 27.58 2.66 5.04 11.87 0.3160 0.0135 0.00200 0.110 0.0721
O4 293 17.52 18.41 2.67 10.04 7.54 0.0518 0.0132 0.00433 0.114 0.140 308 17.55 18.39 2.66 10.05 7.55 0.0510 0.0134 0.00453 0.114 0.145 323 17.50 18.39 2.66 10.06 7.56 0.0484 0.0126 0.00410 0.111 0.142 338 17.57 18.40 2.66 10.04 7.55 0.0307 0.0116 0.00337 0.111 0.142
O5 293 17.55 18.40 6.68 5.12 12.07 0.0360 0.0225 0.00113 0.243 0.0634 308 17.52 18.39 6.67 5.02 11.85 0.0980 0.0409 0.00503 0.249 0.0624 323 17.51 18.40 6.67 5.02 11.91 0.0481 0.0274 0.00173 0.248 0.0637 338 17.50 18.43 6.66 5.02 11.86 0.0314 0.0238 0.000967 0.245 0.0616
O6 293 26.29 9.21 4.65 15.22 3.25 0.0207 0.0139 0.00230 0.180 0.191 308 26.33 9.23 4.66 15.09 3.42 0.0243 0.0141 0.00290 0.183 0.193 323 26.28 9.12 4.66 15.14 3.28 0.0239 0.0148 0.00277 0.178 0.193 338 26.26 9.21 4.65 15.07 3.24 0.0325 0.0142 0.00233 0.179 0.190
O7 293 35.08 0.00 6.66 18.84 0.00 0.0206 0.0152 0.00177 0.242 0.214 308 35.05 0.00 6.65 18.84 0.00 0.0192 0.0155 0.00177 0.243 0.218 323 35.04 0.00 6.66 18.83 0.00 0.0197 0.0152 0.00177 0.243 0.218 338 35.06 0.00 6.65 18.84 0.00 0.0200 0.0154 0.00177 0.243 0.212

M.R. JANKOVIĆ et al.: LIQUID–LIQUID EQUILIBRIUM CONSTANT FOR ACETIC ACID Hem. ind. 70 (2) 165–175 (2016)
170
The total masses of acetic acid and hydrogen per-oxide in the system were determined with an average relative error (Eq. (24)) of 2.15 and 2.12%, respectively. Since these masses were calculated via the mass balance equations using experimental data determined by five analytical methods, namely method for gravi-metric determination of the volatile matter content in the oil phase and four titration methods for determin-ation of acetic acid and hydrogen peroxide contents in both phases, the obtained average relative errors have to be considered as the total error of all analytical mea-surements.
The olive oil–epoxidized olive oil–acetic acid–hydro-gen peroxide-water system was equilibrated at four temperatures for seven compositions. The tempera-tures, as well as mixture compositions, were varied in the range that is significant for the epoxidation of plant oils. The molar ratio of components was selected as to simulate variation of component concentrations in the epoxidation system with reaction time. However, as the oil phase of the mixtures without olive oil, namely mixtures O1 and O2 in Table 1, became solid during the equilibration at 293 K, only 26 values of the liquid-liquid equilibrium constant for acetic acid were deter-mined. For investigated conditions, these values range from 1.52 to 2.73 and they are presented in Table 2. The defined trend of dependency of the liquid-liquid equilibrium constant for acetic acid neither from tem-perature nor from composition of examined mixtures of the olive oil–epoxidized olive oil–acetic acid–hydro-gen peroxide-water system was observed.
Simplified calculation of the liquid-liquid equilibrium constant
A simplified approach for the calculation of the liquid–liquid equilibrium constant for acetic acid is based on the assumptions that only acetic acid is par-titioned between two liquid phases of the epoxidation reaction system and that olive oil and epoxidized olive oil are insoluble in the water. This is described with the following constrains for the masses of components j in phase L:
o oHP W 0m m= = (30)
w wOO EOO 0m m= = (31)
Therefore, the activity coefficients of acetic acid in both phases are expressed as following functions:
( )o o o oA OO EOO A, , ,f x x x Tγ = (32)
( )w w w wA OO EOO A, , ,f x x x Tγ = (33)
As aforementioned, the mass of acetic acid in the system is partitioned between the oil and water phases:
o wA A Am m m= + (34)
By substituting Eqs. (2), (32) and (33) in (1), a non- -linear equation with one unknown variable ( w
Am ) is established:
( )w o o w wA A A A A 0F m x xγ γ= − = (35)
In this work, Eq. (35) is solved by the modified Newton method.
Rigorous calculation of the liquid-liquid equilibrium constant
To check the accuracy of the simplified approach, a rigorous flash calculation of the phase equilibrium was performed. For such calculation it is assumed that all components are partitioned between the system phases. The activity coefficients of all components are expressed via Eqs. (4) and (5). Using the components’ and total mass balance equations, after appropriate substitutions, the mole fraction of the oil phase (φ) in the investigated system has to be determined from the following non-linear equation:
( )1
11 1
NCj
jj
z
Kϕ=
=+ − (36)
where zj indicates the mole fraction of component j in the system; and Kj is the liquid–liquid equilibrium cons-tant for component j in the system. The Newton method was applied to solve Eq. (36).
Modeling of activity coefficients for acetic acid Due to lack of the interaction parameters for epoxy
group with other groups present in the investigated system, none of the models based on the group con-tribution method for direct calculation of the activity coefficient, such as the UNIFAC (uniquac functional-group activity coefficients) and ASOG (analytical sol-ution of groups) models, were applied in this work. Consequently, the UNIQUAC and NRTL models for the activity coefficient were used to correlate the liquid-liquid equilibrium constant for acetic acid with tem-perature and composition.
The UNIQUAC structural parameters rj and qj, which are the van der Waals volume and area of the molecule of component j relative to those of a standard seg-ment, respectively, were calculated using the UNIFAC LLE (liquid–liquid equilibrium) group contribution data [17]:
,1
NG
j g j gg
r Rν=
= (37)

M.R. JANKOVIĆ et al.: LIQUID–LIQUID EQUILIBRIUM CONSTANT FOR ACETIC ACID Hem. ind. 70 (2) 165–175 (2016)
171
,1
NG
j g j gg
q Qν=
= (38)
where NG is the total number of group species in the system; ,g jν is the number of groups of type g in the molecule of component j; and Rg and Qg are the para-
meters related to the volume and area of group g, respectively. In order to calculate the structural para-meters from the literature data, the molecule of hydro-gen peroxide was presented with two hydroxyl groups, whereas the olive oil and epoxidized olive oil, each considered as one pseudo-component, were presented with the following molecular structures, respectively:
Table 2. Comparison of experimentally determined values of the liquid–liquid equilibrium constant for acetic acid (KA) in the system olive oil–epoxidized olive oil–acetic acid–hydrogen peroxide–water and those calculated by simplified and rigorous approach when the UNIQUAC and NRTL models for the activity coefficient were applied
T / K Mixture Experimental Calculated
Simplified Rigorous UNIQUAC NRTL NRTL
293 O1 – – – – O2 – – – – O3 2.637 2.247 2.259 2.311 O4 1.657 1.706 1.729 1.726 O5 1.908 1.907 1.853 1.791 O6 2.031 1.768 1.859 1.808 O7 1.561 1.669 1.714 1.685
308 O1 2.212 2.267 2.195 2.108 O2 1.936 1.982 2.132 2.034 O3 2.115 2.324 2.365 2.322 O4 1.725 1.816 1.772 1.819 O5 1.542 1.866 1.862 1.867 O6 1.836 1.819 1.828 1.837 O7 1.672 1.599 1.629 1.649
323 O1 2.115 2.308 2.249 2.242 O2 2.353 2.154 2.213 2.275 O3 2.346 2.456 2.512 2.534 O4 1.706 1.964 1.872 1.904 O5 1.871 1.865 1.900 1.941 O6 2.034 1.844 1.813 1.848 O7 1.609 1.584 1.590 1.602
338 O1 2.376 2.383 2.322 2.342 O2 2.438 2.369 2.334 2.444 O3 2.731 2.640 2.689 2.629 O4 2.213 2.147 2.008 1.983 O5 2.323 1.895 1.956 1.998 O6 1.515 1.905 1.842 1.855 O7 1.626 1.596 1.571 1.552
Objective function, S 0.9485 0.8566 0.7951
Root mean square deviation, calc exp 2A, A,
=1
( )NE
i ii
RMSD K K= − 0.1910 0.1815 0.1749
Average relative deviation, calc expA, A,
expA,=1
100 (%) =NE
i i
ii
K KARE
NE K
− 7.23 7.30 7.24
Average absolute deviation, calc expA, A,
=1
1 NE
i ii
AAD K KNE
= − 0.1418 0.1438 0.1414

M.R. JANKOVIĆ et al.: LIQUID–LIQUID EQUILIBRIUM CONSTANT FOR ACETIC ACID Hem. ind. 70 (2) 165–175 (2016)
172
(CH2COO)3CH(CH2)b(CH=CH)c(CH3)3, [(CH2COO)3(CH)d(CH2)b(CH=CH)f and (FCH2O)l(OH)y(CH3COO)y(CH3)3. Since the structural parameters for epoxy group are
not available in the literature, an ether group of cyclic ethers, FCH2O, was included into the pseudo-com-ponent molecule of epoxidized olive oil instead. The coefficients in the pseudo-component molecules b, c, d, f, l and y were accepted as 40.904, 2.778, 3.9559, 0.0134, 2.5733 and 0.1913, respectively, on the basis of the iodine numbers, epoxy oxygen content and fatty acid composition of the olive oil and epoxidized olive oil. Although the number of groups in a molecule is usually defined with an integer within UNIFAC model, the decimal numbers have been successfully used for coefficients in the pseudo-component molecules of plant oils when the liquid-liquid equilibrium of the sys-tems similar to the system investigated in this work was studied [7,9]. The calculated values of rOO and qOO parameters are 38.867 and 31.529, respectively, whereas the values of rEOO and qEOO parameters are 40.0194 and 33.1965, respectively.
Binary interaction parameters of both NRTL and UNIQUAC activity coefficient models were determined by minimization of the following objective function S:
( )2
calc expA, A,
1
NE
i ii
S K K=
= − (39)
where NE is the number of experiments; and calcA,iK and
expA,iK are calculated and experimentally determined
values, respectively, of the liquid–liquid equilibrium constant for acetic acid for the experiment i. The Marquardt method was applied to minimize the object-ive function [18]. Therefore, the fitting of interaction parameters was based on the algorithm with two loops. The outer loop is the minimization of the object-ive function, and inner loop is either the simplified or the rigorous calculation of the liquid–liquid equilibrium constant for acetic acid. The determined interaction parameters for simplified and rigorous calculations are given in Tables 3–5.
Table 3. Interaction parameters uj,k (J/mol) of the UNIQUAC model for activity coefficient applied within the simplified calculation of KA
Component Olive oil Epoxidized olive oil Acetic acid Hydrogen peroxide Water
Olive oil 0 –1170.159 6072.516 – – Epoxidized olive oil –2670.553 0 –504.9471 – – Acetic acid –2399.01 5145.97 0 –8082.141 –4950.184 Hydrogen peroxide – – 3865.073 0 –8162.745 Water – – 15163.77 1847.888 0
Table 4. Interaction parameters uj,k (J/mol) of the NRTL model for activity coefficient applied within the simplified calculation of KA
Component Olive oil Epoxidized olive oil Acetic acid Hydrogen peroxide Water
Olive oil 0 23.00308 –6792.634 – – Epoxidized olive oil 5154.96 0 –2190.579 – – Acetic acid 1638.673 –5827.824 0 –18728.77 –11964.42 Hydrogen peroxide – – 35188.14 0 –22226.66 Water – – 24023.41 19073.41 0
Table 5. Interaction parameters uj,k (J/mol) of the NRTL model for activity coefficient applied within the rigorous calculation of KA
Component Olive oil Epoxidized olive oil Acetic acid Hydrogen peroxide Water
Olive oil 0 10764.7 239.1269 –9235.735 –88.59006 Epoxidized olive oil –6781.327 0 1949.265 34458.26 –472.6696 Acetic acid –1795.675 –1056.141 0 4409.27 9341.472 Hydrogen peroxide 16563.09 123.3846 1710.127 0 –3772.03 Water 17447.25 36863.31 –1869.315 7440.163 0
Comparison of activity coefficient models and types of calculation
The values of the liquid-liquid equilibrium constant for acetic acid calculated using determined interaction parameters of UNIQUAC and NRTL models for the
activity coefficient are presented in Table 2 for both types of calculations.
The simplified approach for calculation of the liquid-liquid equilibrium constant for acetic acid shows good agreement with experimental data since the relative
M.R. JANKOVIĆ et al.: LIQUID–LIQUID EQUILIBRIUM CONSTANT FOR ACETIC ACID Hem. ind. 70 (2) 165–175 (2016)
173
mean square deviations (RMSD) for both UNIQUAC and NRTL activity coefficient models are low, namely 0.1910 and 0.1815, respectively. The rigorous calcul-ation was performed applying only NRTL model for activity coefficient as it showed slightly better correl-ation in the case of simplified calculation. Although the number of adjustable parameters is higher for rigorous than for simplified calculation, 20 compared to 12, the predicted values of the equilibrium constant are simi-lar, i.e., the RMSD for rigorous calculation is 3.64% lower than for simplified. This implies that the appli-cation of proposed simplified calculation of the liquid-liquid equilibrium constant for acetic acid is acceptable.
As previously mentioned, the applicability of differ-ent activity coefficient models for describing the liquid-liquid equilibrium in the systems relevant for epoxid-ation of plant oils was reported in the literature. Thus, for the system soybean oil-acetic acid-water, the ori-ginal and three modified UNIFAC models, as well as the UNIQUAC model, were used to correlate the liquid-liquid equilibrium data by assuming the immiscibility of soybean oil and water. For such system, the UNIQUAC model was significantly more accurate than other models [7,8]. The UNIQUAC model was also more ade-quate than modified UNIFAC model for describing the equilibrium of the system soybean oil-formic acid-water [8]. To estimate the liquid-liquid equilibrium constant for acetic acid in the epoxidized soybean oil-acetic acid-water system, the Wilson, NRTL and UNIQUAC models were used to correlate the experi-mental data. In spite of all simplifications, the con-clusion was that all three models are adequate to pre-dict the equilibrium constant for acetic acid. However, according to the analysis of ARE, the most successful prediction of the liquid–liquid equilibrium constant for acetic acid in the investigated system was obtained with UNIQUAC model when partial miscibility of epoxi-dized soybean oil and water was assumed [9]. Under the conditions applied in the present investigation, the adequacy of both NRTL and UNIQUAC models for prediction of the liquid-liquid equilibrium constant for acetic acid in the olive oil-epoxidized olive oil-acetic acid-hydrogen peroxide–water system is confirmed, although the computationally less demanding NRTL model slightly better correlates the experimental equi-librium data.
CONCLUSION
The liquid–liquid equilibrium constant for acetic acid in the system olive oil–epoxidized olive oil–acetic acid–hydrogen peroxide–water was experimentally determined and successfully estimated under condi-tions of temperature and component ratios significant for the process of plant oil epoxidation with peracetic acid generated in situ. The experimentally determined
values of the constant are better correlated when NRTL than when UNIQUAC model for the activity coefficient was applied, under the accepted simplifications regard-ing the partitioning and solubility of particular compo-nents in the system phases. When the NRTL model was used within the rigorous flash calculation of the equi-librium, slightly better fitting was achieved than with simplified calculation. Since the values of the liquid-liquid equilibrium constant for acetic acid predicted by simplified and by rigorous calculation are comparable, the usage of proposed simplified approach can be recommended when establishing the mathematical model that describes the reaction system for epoxid-ation of plant oils.
Acknowledgment This work is part of Project No. III45022 supported
by the Ministry of Education, Science and Technological Development of the Republic of Serbia.
List of symbols A Acetic acid AI,AO Atomic mass of iodine i.e. oxygen, respectively aqHP Hydrogen peroxide aqueous solution b Number of (CH2) groups present in OO and
EOO pseudo-component molecules c Number of (CH=CH) groups present in OO
pseudo-component molecule D Double bond d Number of (CH) groups present in EOO
pseudo-component molecule E Epoxy group Ej Mass of component j gram equivalent (g/gE) EO Epoxy oxygen content (wt%) EOO Epoxidized olive oil f Number of (CH=CH) groups present in EOO
pseudo-component molecule Gj,k NRTL binary interaction parameter for
components j and k in the mixture OOth , EOO
th Correction for titration of OO and EOO, respectively, with titration solution t (mL t/g oil)
HA Hydroxyl acetate group HP Hydrogen peroxide INj Iodine number of component j Kj Liquid–liquid equilibrium constant for compo-
nent j calcA,iK , exp
A,iK Calculated, i.e., experimentally determined value of KA, respectively, for experiment i
l Number of (FCH2O) groups present in EOO pseudo-component molecule
jM , kM Molecular mass of component j, i.e., k, res-pectively (g/mol)
mj Weighed mass of component j (g) mo,mw Mass of the oil, i.e. ,water phase, respectively,
in equilibrium (g)

M.R. JANKOVIĆ et al.: LIQUID–LIQUID EQUILIBRIUM CONSTANT FOR ACETIC ACID Hem. ind. 70 (2) 165–175 (2016)
174
Ljm , L
km Mass of component j i.e. k, respectively, in phase L (g)
s,Lm Mass of the sample of phase L (g) ,exp,
Lj pm Experimentally determined mass of compo-
nent j in phase L for experimental point p (g) weig,j pm Weighed mass of component j for experi-
mental point p (g) n Number of aliquots Nt Normality of titration solution t (gE/L) ND,OO Number of moles of double bond per mole of olive oil ND,EOO, NE,EOO, NHA,EOO
Number of moles of residual double bond,epoxy group i.e., hydroxyl acetate, respect-ively, per mole of epoxidized olive oil
NC Number of components in the system NE Number of experiments NEP Number of experimental points NFA Number of fatty acids in the olive oil trigly-
cerides NG Total number of group species in the system OO Olive oil Qg Area parameter of group g qj Area parameter of molecule of component j R Universal gas constant Rg Volume parameter of group g rj Volume parameter of molecule of component
j S Objective function T Temperature (K) uj,k Adjustable binary parameter for components j
and k in the mixture (J/mol) L
tV Volume of titration solution t consumed for titration of the sample of phase L (mL)
o,cortV Correction volume of titration solution t con-
sumed for titration of the oil phase sample (mL)
W Water xFA Mole fraction of fatty acid FA in the olive oil
triglycerides Ljx Mole fraction of component j in phase L
y Number of (OH) groups, as well as number of (CH3COO) groups present in EOO pseudo-component molecule
zj Mole fraction of component j in the system Greek letters α Non-randomness parameter in the NRTL
model Ljγ Activity coefficient of component j in phase L
νg,j Number of groups of type g in the molecule of component j
,j kτ UNIQUAC binary interaction parameter for components j and k in the mixture
φ Mole fraction of the oil phase Ljω Mass fraction of component j in phase L
aqHPHPω Mass fraction of hydrogen peroxide in the
hydrogen peroxide solution OOWω , EOO
Wω Moisture content in OO, i.e., EOO, res-pectively
oW,A,HPω Mass fraction of water, acetic acid and hyd-
rogen peroxide in the oil phase Superscripts L Phase o Oil phase w Water phase Subscripts A Acetic acid aqHP Hydrogen peroxide aqueous solution D Double bond E Epoxy group EOO Epoxidized olive oil G Glycerol HA Hydroxyl acetate group HP Hydrogen peroxide OO Olive oil W Water
REFERENCES
[1] S.G. Tan, W.S. Chow, Biobased epoxidized vegetable oils and its greener epoxy blends: A review, Polym.-Plast. Technol. Eng. 49 (2010) 1581–1590.
[2] S-C. Chua, X. Xu, Z. Guo, Emerging sustainable tech-nology for epoxidation directed toward plant oil-based plasticizers, Process Biochem. 47 (2012) 1439–1451.
[3] B. Rangarajan, A. Havey, E.A. Grulke, P.D. Culnan, Kinetic parameters of a two-phase model for in situ epoxidation of soybean oil, J. Am. Oil Chem. Soc. 72 (1995) 1161–1169.
[4] R.L. Musante, R.J. Grau, M.A. Baltanás, Kinetics of liquid-phase reactions catalyzed by acidic resins: the formation of peracetic acid for vegetable oil epoxidation, Appl. Catal., A 197 (2000) 165–173.
[5] E. Santacesaria, R. Tesser, M. Di Serio, R. Turco, V. Russo, D. Verde, A biphasic model describing soybean oil epoxidation with H2O2 in a fed-batch reactor, Chem. Eng. J. 173 (2011) 198–209.
[6] E. Santacesaria, A. Renken, V. Russo, R. Turco, R. Tesser, M. Di Serio, Biphasic model describing soybean oil epoxidation with H2O2 in a continuous reactors, Ind. Eng. Chem. Res. 51 (2012) 8760–8767.
[7] S. Sinadinović-Fišer, M. Janković, Prediction of the par-tition coefficient for acetic acid in a two-phase system soybean oil-water, J. Am. Oil Chem. Soc. 84 (2007) 669– –674.
[8] A. Campanella, B.A. Mandagarán, E.A. Campanella, Partitioning of a carboxylic acid between oil and water phases. Experimental, correlation, and prediction, J. Am. Oil Chem. Soc. 86 (2009) 513–519.
[9] M. Janković, S. Sinadinović-Fišer, M. Lamshoeft, Liquid-liquid equilibrium constant for acetic acid in an epox-

M.R. JANKOVIĆ et al.: LIQUID–LIQUID EQUILIBRIUM CONSTANT FOR ACETIC ACID Hem. ind. 70 (2) 165–175 (2016)
175
idized soybean oil-acetic acid-water system, J. Am. Oil Chem. Soc. 87 (2010) 591–600.
[10] D.S. Abrams, J.M. Prausnitz, Statistical thermodynamics of liquid mixtures: a new expression for the excess Gibbs energy of partly or completely miscible systems, AIChE J. 21 (1975) 116–128.
[11] H. Renon, J.M. Prausnitz, Local composition in thermo-dynamic excess functions for liquid mixtures, AIChE J. 14 (1968) 135–144.
[12] S. Sinadinović-Fišer, M. Janković, Z. Petrović, Kinetics of in situ epoxidation of soybean oil in bulk catalyzed by ion exchange resin, J. Am. Oil Chem. Soc. 78 (2001) 725– –731.
[13] Method Ca 2c-25 in Official Methods and Recom-mended Practices, 3rd ed., American Oil Chemists’ Soc-iety, Champaign, IL, 1987.
[14] Standard Methods for the Analysis of Oils, Fats and Derivatives, Blackwell Scientific Publications, London, 1987.
[15] A. Campanella, M.A. Baltanás, Degradation of the oxi-rane ring of epoxidized vegetable oil with solvated acetic acid using cation-exchange resin, Eur. J. Lipid Sci. Technol. 106 (2004) 524–530.
[16] A. Campanella. M.A. Baltanás, Degradation of the oxi-rane ring of epoxidized vegetable oil in a liquid-liquid-solid heterogeneous reaction system, Chem. Eng. Pro-cess 46 (2007) 210–221.
[17] T. Magnussen, P. Rasmussen, A. Fredenslund, UNIFAC parameter table for prediction of liquid-liquid equilibria, Ing. Eng. Chem. Process Des. Dev. 20 (1981) 331–339.
[18] D.W. Marquardt, An algorithm for least-squares esti-mation of nonlinear parameters, J. Soc. Ind. Appl. Math. 11 (1963) 431–441.
IZVOD
KONSTANTA RAVNOTEŽE TEČNO–TEČNO SIRĆETNE KISELINE U SISTEMU MASLINOVO ULJE–EPOKSIDOVANO MASLINOVO ULJE–SIRĆETNA KISELINA–VODONIK-PEROKSID–VODA
Milovan R. Janković, Olga M. Govedarica, Snežana V. Sinadinović-Fišer, Jelena M. Pavličević, Vesna B. Teofilović, Nevena R. Vukić
Tehnološki fakultet, Univerzitet u Novom Sadu, Bul. cara Lazara 1, 21000 Novi Sad, Srbija
(Naučni rad)
Epoksidovanje biljnih ulja se industrijski izvodi perorganskom kiselinom formi-ranom in situ iz odgovarajuće organske kiseline i vodonik peroksida u prisustvu kiselog katalizatora. Kada se kao homogeni katalizator primenjuje neka mineralnakiselina, reakcioni sistem epoksidovanja ulja je dvofazni (ulje–voda), dok pri pri-meni heterogenog katalizatora, kakva je kisela jonoizmenjivačka smola, pomenutisistem je trofazni (ulje–voda–katalizator). Pri postavljanju pouzdanog matema-tičkog modela koji opisuje ovaj višefazni reakcioni sistem, a za potrebe optimi-zovanja procesa epoksidovanja biljnih ulja, neophodno je uzeti u obzir raspodelusirćetne kiseline između uljne i vodene faze. U ovom radu je konstanta fazneravnoteže tečno-tečno sirćetne kiseline u kvinarnom sistemu maslinovo ulje–epo-ksidovano maslinovo ulje–sirćetna kiselina–vodonik peroksid–voda određena eks-perimentalno za temperature u opsegu 293–338 K i za različite odnose kompo-nenata. Odnos komponenata u ispitivanim smešama je odabran tako da odgovarauslovima izvođenja epoksidovanja, ali i da simulira promenu odnosa kompo-nenata u sistemu usled odigravanja reakcija. Za uslove ispitivanja, eksperimen-talno određene vrednosti konstante ravnoteže se kreću u opsegu 1,52–2,73. U cilju izračunavanja konstante ravnoteže sirćetne kiseline, eksperimentalne vred-nosti konstante su korelisane UNIQUAC (universal quasi-chemical) i NRTL (non--random two liquid) modelima za koeficijent aktivnosti. Binarni interakcioni para-metri ovih modela su određeni primenom metode Marquardt-a za fitovanje eks-perimentalnih podataka. Pri uprošćenom proračunu, u kom je usvojeno da semaslinovo ulje i epoksidovano maslinovo ulje ne rastvaraju u vodi, kao i da sevoda i vodonik peroksid ne rastvaraju u maslinovom i epoksidovanom maslinovomulju, standardno odstupanje je 0,1910 za UNIQUAC i 0,1815 za NRTL model. Pririgoroznom flash proračunu, u kojem je pretpostavljeno prisustvo svih kompo-nenata u obe faze, standardno odstupanje za jedino primenjeni NRTL model je0,1749. Kako je ovo odstupanje manje za samo 3,64% od standardnog odstupanjapostignutog pri uprošćenom proračunu, kada se primenjuje isti model za koefi-cijent aktivnosti, upotreba uprošćenog proračuna je prihvatljiva za modelovanjereakcionog sistema epoksidovanja biljnih ulja.
Ključne reči: Ravnoteža tečno–tečno •Sirćetna kiselina • Biljno ulje • Epoksido-vanje


177
Sinteza, struktura i svojstva biološki aktivnih derivata spirohidantoinaAnita M. Lazić, Nataša V. Valentić, Nemanja P. Trišović, Slobodan D. Petrović, Gordana S. Ušćumlić Katedra za organsku hemiju, Tehnološko–metalurški fakultet, Univerzitet u Beogradu, Beograd, Srbija
Izvod Prvu sintezu cikloalkanspiro-5-hidantoina izveli su Bučerer i Lib (Bucherer, Lieb) 1934. godine, reakcijom cikličnog ketona sa kalijum-cijanidom i amonijum-karbonatom u smeši etanola i vode, zagrevanjem uz refluks. U ovom radu su prikazani različiti postupci sinteze derivata spirohidantoina, njihova fizičko–hemijska svojstva i biološka aktivnost. Posebno jeistaknut značaj cikloalkanspiro-5-hidantoina sa antikonvulzivnim, antiproliferativnim, anti-psihotičkim, antimikrobnim, antiinflamatornim i analgetskim svojstvima kao i njihov značajkao potencijalnih lekova u lečenju dijabetesa. Pored osnovnih svojstava molekula koja suznačajna za aktivnost proučavanih spirohidantoina, navedeni su najznačajniji podaci QSAR(eng. Quantitative Structure–Activity Relationship) studija na osnovu kojih se dobija detalj-niji uvid u mehanizam njihovog farmakološkog dejstva.
Ključne reči: Spirohidantoini; sinteza; fizičko–hemijska svojstva; biološka aktivnost.
PREGLEDNI RAD
UDK 547.783.057:615
Hem. Ind. 70 (2) 177–199 (2016)
doi: 10.2298/HEMIND150205025L
Dostupno na Internetu sa adrese časopisa: http://www.ache.org.rs/HI/
Uvođenjem različitih supstituenata u N-3 i N-1 položaje hidantoinskog prstena (u strukturi spirohidan-toina) nastaju farmakološki važni molekuli, interesantni kao potencijalni lekovi u tretmanu raznih bolesti. Spiro-hidantoinska jedinica je gradivni element selektivnih agonista i antagonista serotoninskih 5-HT receptora te su stoga pomenuti derivati spirohidantoina od važnosti kao potencijalni psihoaktivni agensi [1,2]. Spiropiperi-dino-hidantoinski derivati su modulatori aktivnosti hemokinskih receptora podvrste CCR5 i kao takvi su od značaja za prevenciju ili tretman infektivnih oboljenja (npr. infekcija izazvana HIV-om), imunoregulatornih i inflamatornih oboljenja, reakcije organizma na presa-đeni organ [3], itd. Molekuli koji pokaziju aktivnost ka aldoza reduktazi enzimu (ALR2) privlače pažnju kao potencijalni lekovi u prevenciji ili lečenju komplikacija koje su posledica dijabetesa [4,5]. Spirohidantoini su važni kao potencijalni lekovi u lečenju kancera [6,7], epilepsije i drugih konvulzivnih poremećaja [8,9] i čita-vog niza drugih bolesti. Osim navedenih fizioloških aktivnosti, značajni su i kao polazni reaktanti za sintezu različitih aminokiselina [10].
STRUKTURA SPIROHIDANTOINA
Mnogi derivati spirohidantoina su biološki aktivni molekuli različitih svojstava, a strukture nekih aktivnijih jedinjenja kao i odgovarajuća dejstva data su u tabeli 1.
Prepiska: N.V. Valentić, Tehnološko–metalurški fakultet, Univerzitet u Beogradu, Karnegijeva 4, 11120 Beograd, Srbija. E-pošta: [email protected] Rad primljen: 5. februar, 2015 Rad prihvaćen: 14. april, 2015
FIZIČKA SVOJSTVA SPIROHIDANTOINA
Spirohidantoini su bele kristalne supstance, različi-tih temperatura topljenja. Spirohidantoini sa supstitu-entima na atomima azota se tope na nižim tempera-turama od nesupstituisanih analoga što je posledica manje polarnosti molekula i smanjene mogućnosti građenja intermolekulskih vodoničnih veza [12,13]. Usled velike koncentracije heteroatoma i karbonilnih grupa u prstenu, spirohidantoini su hidrofilni molekuli; dobro se rastvaraju u vodi, etanolu i etil-acetatu [13].
HEMIJSKA SVOJSTVA SPIROHIDANTOINA
Kiselost Derivati spirohidantoina sadrže dve NH grupe u
položajima 1 i 3 hidantoinskog prstena. N3-H grupa se nalazi između dve elektrofilne karbonilne grupe što znatno povećava njenu kiselost u odnosu na N1-H gru-pu koja je u susedstvu samo jedne karbonilne grupe. Primenom IR spektroskopije dokazano je da pomenute NH grupe nisu međusobno ekvivalentne, zbog čega derivati spirohidantoina ispoljavaju različita kiselo-baz-na svojstva [14].
Hidroliza Hidroliza hidantoina i spirohidantoina jedan je od
najčešće korišćenih postupaka za sintezu neproteinskih aminokiselina. Najefikasniji metod hidrolize spirohidan-toinskih derivata je bazna hidroliza upotrebom barijum-hidroksida. Primer je reakcija alkalne hidrolize ciklopen-tanspiro-5-hidantoina (1) do 1-aminociklopentankarbo-ksilne kiseline (2, šema 1) [10].
Spirohidantoini su važni intermedijeri za sintezu konformaciono ograničenih α-aminokiselina. Na pri-mer, prva sinteza 1-aminociklopropankarboksilne kise-line izvršena je 1922. godine, alkalnom hidrolizom ciklo-

A.M. LAZIĆ i sar.: BIOLOŠKI AKTIVNI DERIVATi SPIROHIDANTOINA Hem. ind. 70 (2) 177–199 (2016)
178
Tabela 1. Neki fiziološki aktivni derivati spirohidantoina Table 1. Some of physiological active derivatives of spirohydantoins
Redni broj Formula Dejstvo 1
N
O
O N N
NH
m
m = 3, 4n = 1, 2
R
n
R = H, o-OCH3
Antidepresiv, antipsihotik [1,11]
2
N
NH
N
O
ON
R
R = H, o-OCH3, m-Cl, o-F, p-F, m-CF3
Anksiolitičko [1,2]
3
N
N
NO
O
R1R2
R3R4
R5
R1 = OH, OC1-6 alkil, OC6-12 aralkilR5 = C6-12 aralkil
nezavisno R1, R4, R5 = Hnezavisno R1, R2, R3, R4, R5 = C1-10 alkil, C2-10 alkenil ili alkinil nezavisno R1, R3, R4, R5 = C6-12 arilnezavisno R2, R4, R5 = 3-10 člani heterocikl
Antiinflamatorno [3]
4
X
NHNH
O
O
X = CH2, O, S
Antidijabetik [4]
5
SN
NHNH
O
O
RR = H, CH3
Antidijabetik [5]
6
NHNH
O
O
S
O
O
Antikancerogeno [7]

A.M. LAZIĆ i sar.: BIOLOŠKI AKTIVNI DERIVATi SPIROHIDANTOINA Hem. ind. 70 (2) 177–199 (2016)
179
Tabela 1. Nastavak Table 1. Continued
Redni broj Formula Dejstvo 7
NH
N
O
O
R
R = H, CH3, C6H5
Antikonvulziv [8]
8
O
O
NH
NH
OO
Antikonvulziv [9]
NH
NH
O
O NH3
O
O
(1) (2)
Ba(OH)2.8H2O
+
-+ NH3 + CO2
Šema 1. Alkalna hidroliza cikloalkanspiro-5-hidantoina. Scheme 1. Hydrolysis of cycloalkanespiro-5-hydantoins under alkaline conditions.
propanspiro-5-hidantoina (3) [15]. Tretiranjem rezul-tujuće hidantoinske kiseline (4) sa azotastom kiselinom, dobija se karbaminska kiselina (5), koja spontano dekarboksiluje dajući 1-aminociklopropankarboksilnu kiselinu (6, šema 2) [15].
Cikloalkanspiro-5-hidantoini (7) sa voluminoznijim cikloalkil-grupama se prevode u konformaciono ograni-čene aminokiseline preko intermedijarnog N,N’-zaštiće-nog spirohidantoina (8) koji se dobija uvođenjem terc-butiloksikarbonil (Boc) zaštitne grupe tretiranjem ciklo-alkanspiro-5-hidantoina sa di-terc-butil-dikarbonatom. Nastali intermedijer (8) relativno lako podleže baznoj hidrolizi nakon čega sledi zakišeljavanje (šema 3) [15].
N-3 i N-1 supstitucija Piner (Pinner) je ustanovio da je moguće izvršiti
direktno alkilovanje hidantoina u položaju 3, tretira-njem sa alkil-halogenidima u baznom rastvoru. Reak-cijom ciklopentanspiro-5-hidantoina (1) sa benzil-bro-midom u prisustvu kalijum-karbonata, dobija se 3-ben-zilciklopentanspiro-5-hidantoin (10, šema 4) [16].
Primenom istog postupka ne može se izvršiti dir-ektno N-1 alkilovanje hidantoina osim ukoliko u polo-žaju 5, pomenutog molekula, nije prisutna dvostruka veza ili fenil grupa. Prisustvo C-5 dvostruke veze aktivira azot u položaju 1, omogućavajući zamenu vodonikovog atoma odgovarajućom alkil-grupom [16].
Berend (Berend) i Nejmer (Niemeyer) prvi su doka-zali da reakcija spirohidantoina (1) i formaldehida rezul-tira formiranjem 1,1’-metilendispirohidantoina (11) (šema 5), odnosno, N-1 supstitucijom [16].
SINTEZA SPIROHIDANTOINA
Prvu sintezu cikloalkanspiro-5-hidantoina izveli su Bučerer i Lib 1934. godine, reakcijom cikličnog ketona, kalijum-cijanida i amonijum-karbonata, uz refluks, u smeši etanola i vode [15]. Opisana metoda sadrži jedan nedostatak. Naime, tokom reakcije izdvaja se cijanovo-donična kiselina koja je izuzetno toksična. Potencijalno rešenje predstavlja primena mikrotalasnog zračenja koje obezbeđuje visoke prinose i čistije proizvode [15].
NH NH
O
O
NH NH2
O
CO2H
NH OH
O
CO2H
NH2
CO2HNaOHH2O
NaNO2
HCl
(3) (4) (5) (6)
(- CO2)
Šema 2. Sinteza 1-aminociklopropankarboksilne kiseline. Scheme 2. Synthesis of 1-aminocyclopropanecarboxylic acid.
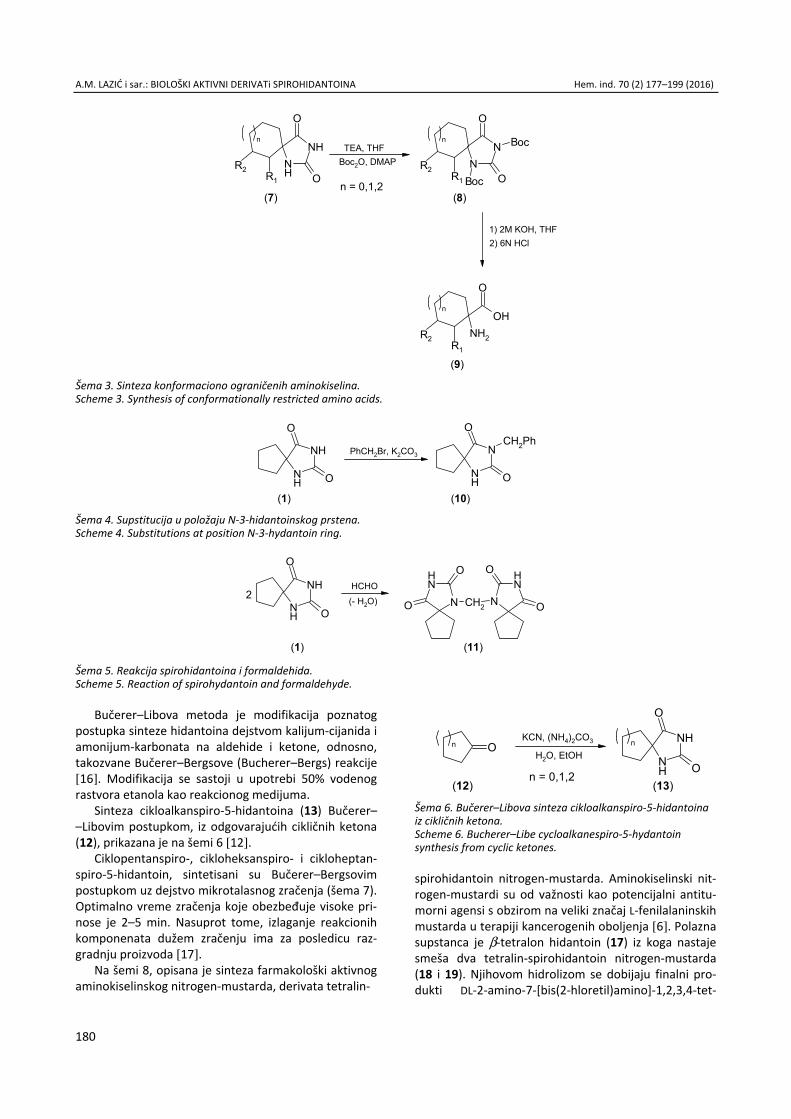
A.M. LAZIĆ i sar.: BIOLOŠKI AKTIVNI DERIVATi SPIROHIDANTOINA Hem. ind. 70 (2) 177–199 (2016)
180
Bučerer–Libova metoda je modifikacija poznatog postupka sinteze hidantoina dejstvom kalijum-cijanida i amonijum-karbonata na aldehide i ketone, odnosno, takozvane Bučerer–Bergsove (Bucherer–Bergs) reakcije [16]. Modifikacija se sastoji u upotrebi 50% vodenog rastvora etanola kao reakcionog medijuma.
Sinteza cikloalkanspiro-5-hidantoina (13) Bučerer– –Libovim postupkom, iz odgovarajućih cikličnih ketona (12), prikazana je na šemi 6 [12].
Ciklopentanspiro-, cikloheksanspiro- i cikloheptan-spiro-5-hidantoin, sintetisani su Bučerer–Bergsovim postupkom uz dejstvo mikrotalasnog zračenja (šema 7). Optimalno vreme zračenja koje obezbeđuje visoke pri-nose je 2–5 min. Nasuprot tome, izlaganje reakcionih komponenata dužem zračenju ima za posledicu raz-gradnju proizvoda [17].
Na šemi 8, opisana je sinteza farmakološki aktivnog aminokiselinskog nitrogen-mustarda, derivata tetralin-
NH
NH
O
O
O
n = 0,1,2
KCN, (NH4)2CO3
H2O, EtOHn n
(12) (13) Šema 6. Bučerer–Libova sinteza cikloalkanspiro-5-hidantoina iz cikličnih ketona. Scheme 6. Bucherer–Libe cycloalkanespiro-5-hydantoin synthesis from cyclic ketones.
spirohidantoin nitrogen-mustarda. Aminokiselinski nit-rogen-mustardi su od važnosti kao potencijalni antitu-morni agensi s obzirom na veliki značaj L-fenilalaninskih mustarda u terapiji kancerogenih oboljenja [6]. Polazna supstanca je β-tetralon hidantoin (17) iz koga nastaje smeša dva tetralin-spirohidantoin nitrogen-mustarda (18 i 19). Njihovom hidrolizom se dobijaju finalni pro-dukti DL-2-amino-7-[bis(2-hloretil)amino]-1,2,3,4-tet-
NH
NH
O
O
NN
O
O
B
B
NH2
OH
O
R1
R2
TEA, THFBoc2O, DMAP
n
n = 0,1,2R1
R2
oc
ocn
1) 2M KOH, THF2) 6N HCl
R1
R2
n
(7) (8)
(9) Šema 3. Sinteza konformaciono ograničenih aminokiselina. Scheme 3. Synthesis of conformationally restricted amino acids.
NH
NH
O
O NH
N
O
O
CH2Ph
(1) (10)
PhCH2Br, K2CO3
Šema 4. Supstitucija u položaju N-3-hidantoinskog prstena. Scheme 4. Substitutions at position N-3-hydantoin ring.
NH
NH
O
O
NH
N
O
OCH2NNH
O
O
(1) (11)
HCHO2 (- H2O)
Šema 5. Reakcija spirohidantoina i formaldehida. Scheme 5. Reaction of spirohydantoin and formaldehyde.

A.M. LAZIĆ i sar.: BIOLOŠKI AKTIVNI DERIVATi SPIROHIDANTOINA Hem. ind. 70 (2) 177–199 (2016)
181
rahidro-2-naftenska kiselina (20) i DL-2-amino-5-[bis(2- -hloretil)amino]-1,2,3,4-tetrahidro-2-naftenska kiselina (21), u protonovanom amonijum-karboksilnom obliku [6].
Postupak dobijanja piperidinspirohidantoina (23), polazeći iz odgovarajućeg piperidona (22), prikazan je na šemi 9 [15].
Analozi sorbinila (25) koji pokazuju aktivnost ka inhibiciji aldoza reduktaze enzima (ALR2) (šema 10), proizvod su reakcije 2,3-dihidrotiopirano-(2,3-b)-piri-din-4(4H)-ona (24), kao i njegovog metil analoga, sa kalijum-cijanidom i amonijum-karbonatom u vodeno– –alkoholnoj sredini [5].
3-Supstituisani ciklopropanspiro-5-hidantoinski derivati koji imaju antikonvulzivnu aktivnost, dobijeni
su prema postupku opisanom na šemi 11. Dietil-2,2- -dimetilciklopropan-1,1-dikarboksilat (26), sintetizovan Majklovom (Michael) reakcijom ciklizacije, preveden je u monoestar (27) pomoću reakcije monosaponifikacije. Kurtiusovom (Curtius) reakcijom, formiran je in situ izocijanat (28) koji je zatim reagovao sa aminom gra-deći α-karboetoksi ureu (29). Ciklizacijom N,N-asimet-ričnih molekula uree (29) dobijen je spirohidantoinski derivat (30) [8].
Štrekerova (Strecker) reakcija predstavlja direktnu metodu za asimetričnu (enantioselektivnu) sintezu deri-vata cikloalkanspiro-5-hidantoina [18]. Tako se, na pri-mer, klasičnom Štrekerovom reakcijom N-supstitui-sanog-4-piperidona (31) sa anilinom i kalijum-cijani-dom, u vodenom rastvoru sirćetne kiseline, formira
NH
NH
O
O O OH
CN
(14) (15) (16)n = 2,3,4
1) Na2S2O5
2) KCN
(NH4)2CO3
MW, 2-5 min nn n
Šema 7. Bučerer–Bergsova sinteza spirohidantoina pod dejstvom mikrotalasnog zračenja. Scheme 7. Bucherer–Bergs spirohydantoin synthesis under microwave irradiation.
NH
NH
O
O
N
Cl
Cl
NH2
CO2H
N
Cl Cl
NH2
CO2H
O
N
Cl
Cl
NH
NH
O
ON
Cl Cl
NH
NH
O
O
(17)
1. HNO3
2. H2/Pd/C
3. , AcOH4. POCl3
HCl
(18) (19)
HCl
(20) (21)
Šema 8. Sinteza L-aminokiselinskog nitrogen-mustarda. Scheme 8. Synthesis of L-amino acid nitrogen mustard.

A.M. LAZIĆ i sar.: BIOLOŠKI AKTIVNI DERIVATi SPIROHIDANTOINA Hem. ind. 70 (2) 177–199 (2016)
182
prekursor (32, šema 12). Modifikovana Štrekerova reakcija se izvodi u anhidrovanim uslovima, u glacijalnoj sirćetnoj kiselini, korišćenjem tetrametilsilil-cijanida (TMSCN) umesto kalijum-cijanida (šema 12). Luisove (Lewis) kiseline katališu modifikovanu Štrekerovu reak-ciju adicije TMSCN na imine. Nakon modifikovane Štre-kerove sinteze, nastali α-aminonitril (32) se kondenzuje sa odabranim izocijanatom, a zatim sledi ciklizacija i nastaje spirohidantoin (34).
Postupak sinteze derivata cikloalkanspiro-5-hidan-toina koji imaju antikonvulzivnu aktivnost (šema 13), započinje Bučerer–Bergsovom reakcijom β-tetralona (35) kojom se formira β-tetralon hidantoin (17). Nje-govom daljom reakcijom sa 4-supstituisanim pipera-zinom i formaldehidom u 96% etanolu, dobijaju se N-[(4-(supstituisani fenil)-piperazin-1-il)-metil]-[7,8- -f]benzo-1,3-diaza-spiro[4.5]dekan-2,4-dioni (36) [19].
Prvi korak u sintezi spiromustina (40) (šema 14) predstavlja alkilovanje cikloheksanspiro-5-hidantoina (37) sa 1-brom-2-hloretanom. Formirani produkt, od-nosno, 3-(2-hloretil)cikloheksanspiro-5-hidantoin (38) kondenzuje se sa dietanolaminom gradeći 3-[2-[bis(2- -hidroksietil)-amino]-etil]cikloheksanspiro-5-hidantoin (39) koji u završnoj fazi reakcije reaguje sa POCl3 [20].
Spirohidantoinski derivat sirćetne kiseline (43), koji pokazuje slabu aktivnost ka inhibiciji aldoza reduktaze (ALR2) i aldehid reduktaze (ALR1), može se sintetizovati alkilovanjem sulfona (41) (šema 15) [5]. Alkilovanje se vrši sa etil-bromacetatom u acetonu, u prisustvu anhid-rovanog kalijum-karbonata, zagrevanjem uz refluks. Alkalnom hidrolizom prekursora (42) dobija se ciljano jedinjenje.
Široka mogućnost primene cikloalkanspiro-5-hidan-toina dovela je, između ostalog, i do proučavanja N-supstituisanih derivata cikloheksanspiro-5-hidan-
N ORNH
NH
O
O
NR
R = H, CH3, CH2Ph(22) (23)
KCN, (NH4)2CO3
H2O, CH3OH s.t. ili MW (100 W, 8 min)
Šema 9. Sinteza piperidin spirohidantoina iz piperidona. Scheme 9. Synthesis of piperidine spirohydantoin from piperidone.
S
O
NR
NH
NH
SNR
O
O
R = H, CH3
(24) (25)
KCN, (NH4)2CO3
Šema 10. Sinteza spirohidantoinskog derivata 2,3-dihidrotiopirano-(2,3-b)-piridin-4-(4H)-ona. Scheme 10. Synthesis of spirohdantoin derivative of 2,3-dihydrotiopyrano-(2,3-b)-pyridin-4-(4H)-one.
CO2C2H5
CO2C2H5 CO2C2H5
CO2H
CO2C2H5
NCO
CO2C2H5
NHCNHR
O
N
NH
RO
O
1N NaOHEtOH
1) EtOCOCl NMM, NaN3
2) toluen, 75 oC
RNH2 Na, EtOHs.t.
(26) (27)
(28) (29) (30)
R = H, CH3, (CH3)2CH, CH3(CH2)2CH2, CH3CH2(CH2OH)CH, PhCH2, Ph, 4-CH3C6H4, 4-CH3OC6H4, 4-FC6H4, 3,5-diClC6H3, 4-NO2C6H4
Šema 11. Sinteza 3-supstituisanog ciklopropanspiro-5-hidantoinskog derivata. Scheme 11. Synthesis of 3-substituted cyclopropanespiro-5-hydantoin derivative.

A.M. LAZIĆ i sar.: BIOLOŠKI AKTIVNI DERIVATi SPIROHIDANTOINA Hem. ind. 70 (2) 177–199 (2016)
183
toina. Cikloheksanspiro-5-hidantoin (37) se može selek-tivno alkilovati u položaju N-3-dejstvom agensa za alki-lovanje (agens za alkilovanje/spirohidantoin, 1:1) u pri-sustvu kalijum-hidroksida u etanolu, zagrevanjem uz refluks (šema 16) [21]. Kada se kao alkilujući agens
koristi 1,3-dibrompropan, on se uzima u višku (agens za alkilovanje/spirohidantoin 2:1) [21].
Do alkilovanja u položaju N-1 dolazi znatno teže, najčešće u prisustvu natrijum-hidrida u dimetilform-amidu. Da bi se izvršilo selektivno alkilovanje u položaju
N
O
NH2
N
NH
CN
N
N CN
NH
O
NN
N
O
O
(31) (32)R1
1)
2) TMSCN
R1
DCE, R2NCO
80 oC, 2h,
R2 = H, CH3
s.t. preko noci
, glac. AcOH
R1 = CH2CH2Ph, CH2Ph, CH3
s.t. 2hHCl, 80 oC, 1h,
R1
R2
R1
R2
(33) (34) Šema 12. Sinteza asimetričnih spirohidantoinskih derivata. Scheme 12. Synthesis of asymmetric spirohydantoin derivative.
NH
N
O
O
NN
R
NRNHO NH
NH
O
OHCHO, 96% EtOH
R = Ph, 2-FC6H4, 4-FC6H4, 3-ClC6H4, 3-CF3C6H4
KCN, (NH4)2CO3
H2O, EtOH
(35) (17)
(36) Šema 13. Sinteza N-[(4-(supstituisanih fenil)-piperazin-1-il)-metil]-[7,8-f]benzo-1,3-diaza-spiro[4.5]dekan-2,4-diona. Scheme 13. Synthesis of N-[(4-(substituted phenyl)-piperazin-1-yl)-methyl]-[7,8-f]benzo-1,3-diaza-spiro[4.5]decane-2,4-diones.
N
Cl
Cl
NH
N
O
O
N
OH
OH
NH
N
O
O
NH
NH
O
ONH
N
O
O
ClBrCH2CH2Cl
KOH, EtOH
NH(CH2CH2OH)2
NaI, DMF
(37) (38)
(39) (40)
POCl3
Šema 14. Sinteza spiromustina. Scheme 14. Synthesis of spiromustine.
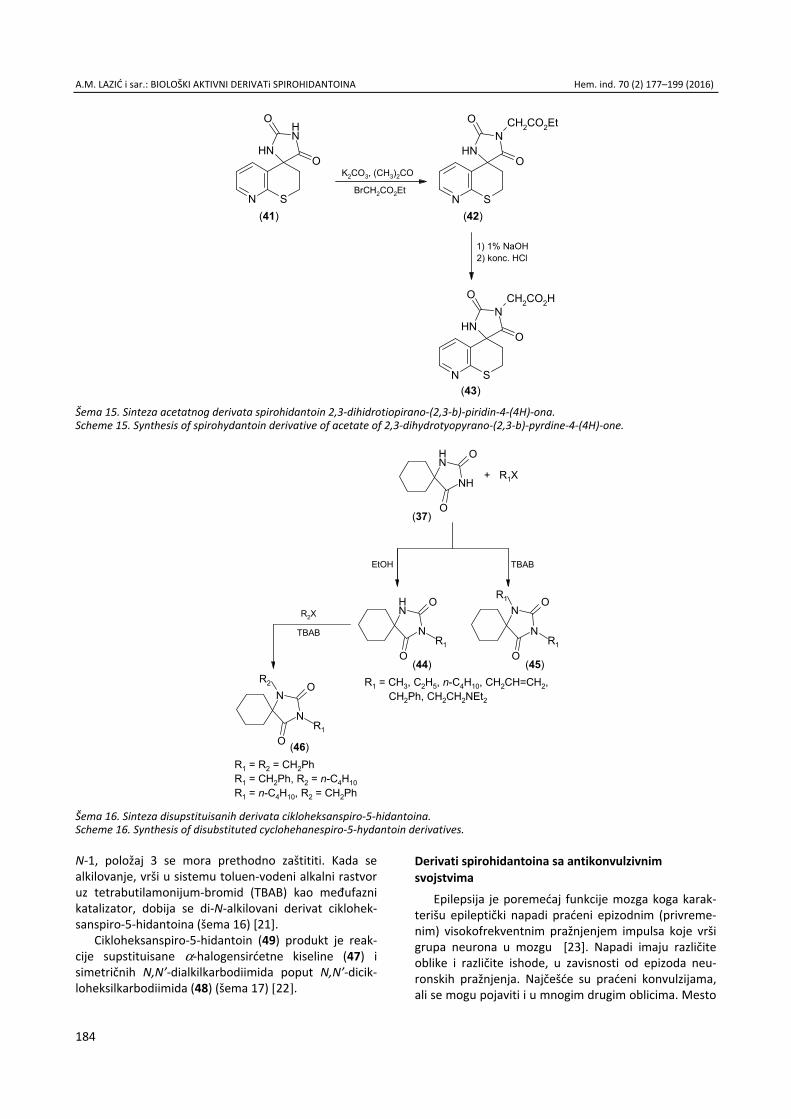
A.M. LAZIĆ i sar.: BIOLOŠKI AKTIVNI DERIVATi SPIROHIDANTOINA Hem. ind. 70 (2) 177–199 (2016)
184
N-1, položaj 3 se mora prethodno zaštititi. Kada se alkilovanje, vrši u sistemu toluen-vodeni alkalni rastvor uz tetrabutilamonijum-bromid (TBAB) kao međufazni katalizator, dobija se di-N-alkilovani derivat ciklohek-sanspiro-5-hidantoina (šema 16) [21].
Cikloheksanspiro-5-hidantoin (49) produkt je reak-cije supstituisane α-halogensirćetne kiseline (47) i simetričnih N,N’-dialkilkarbodiimida poput N,N’-dicik-loheksilkarbodiimida (48) (šema 17) [22].
Derivati spirohidantoina sa antikonvulzivnim svojstvima
Epilepsija je poremećaj funkcije mozga koga karak-terišu epileptički napadi praćeni epizodnim (privreme-nim) visokofrekventnim pražnjenjem impulsa koje vrši grupa neurona u mozgu [23]. Napadi imaju različite oblike i različite ishode, u zavisnosti od epizoda neu-ronskih pražnjenja. Najčešće su praćeni konvulzijama, ali se mogu pojaviti i u mnogim drugim oblicima. Mesto
N S
NHNH
O
O
N S
NHN
CH2CO2Et
O
O
N S
NHN
CH2CO2H
O
O
K2CO3, (CH3)2CO
BrCH2CO2Et
1) 1% NaOH2) konc. HCl
(41) (42)
(43) Šema 15. Sinteza acetatnog derivata spirohidantoin 2,3-dihidrotiopirano-(2,3-b)-piridin-4-(4H)-ona. Scheme 15. Synthesis of spirohydantoin derivative of acetate of 2,3-dihydrotyopyrano-(2,3-b)-pyrdine-4-(4H)-one.
NH
NH
O
O
N
N
O
O
N
NH
O
O
N
N
O
O
(44) (45)
+ R1X
EtOH
R2X
R1
R2
(37)
(46)R1 = R2 = CH2PhR1 = CH2Ph, R2 = n-C4H10R1 = n-C4H10, R2 = CH2Ph
R1 = CH3, C2H5, n-C4H10, CH2CH=CH2, CH2Ph, CH2CH2NEt2
R1 R1
R1
TBAB
TBAB
Šema 16. Sinteza disupstituisanih derivata cikloheksanspiro-5-hidantoina. Scheme 16. Synthesis of disubstituted cyclohehanespiro-5-hydantoin derivatives.
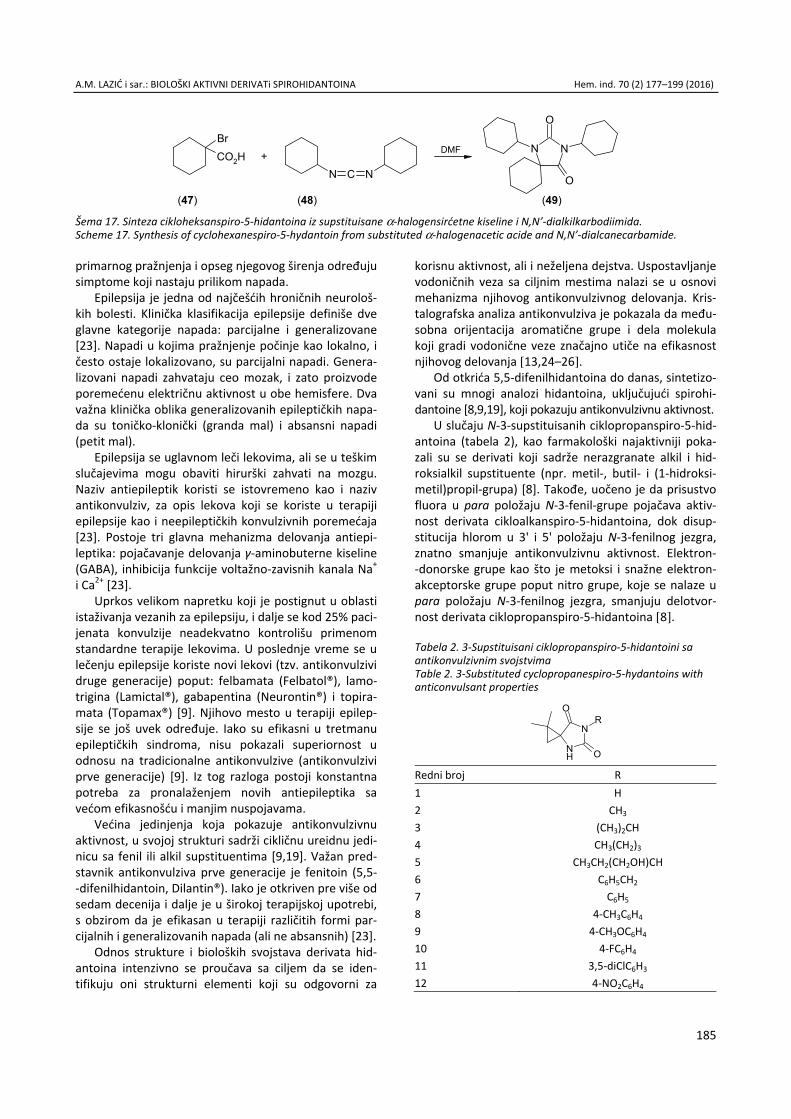
A.M. LAZIĆ i sar.: BIOLOŠKI AKTIVNI DERIVATi SPIROHIDANTOINA Hem. ind. 70 (2) 177–199 (2016)
185
primarnog pražnjenja i opseg njegovog širenja određuju simptome koji nastaju prilikom napada.
Epilepsija je jedna od najčešćih hroničnih neurološ-kih bolesti. Klinička klasifikacija epilepsije definiše dve glavne kategorije napada: parcijalne i generalizovane [23]. Napadi u kojima pražnjenje počinje kao lokalno, i često ostaje lokalizovano, su parcijalni napadi. Genera-lizovani napadi zahvataju ceo mozak, i zato proizvode poremećenu električnu aktivnost u obe hemisfere. Dva važna klinička oblika generalizovanih epileptičkih napa-da su toničko-klonički (granda mal) i absansni napadi (petit mal).
Epilepsija se uglavnom leči lekovima, ali se u teškim slučajevima mogu obaviti hirurški zahvati na mozgu. Naziv antiepileptik koristi se istovremeno kao i naziv antikonvulziv, za opis lekova koji se koriste u terapiji epilepsije kao i neepileptičkih konvulzivnih poremećaja [23]. Postoje tri glavna mehanizma delovanja antiepi-leptika: pojačavanje delovanja γ-aminobuterne kiseline (GABA), inhibicija funkcije voltažno-zavisnih kanala Na+ i Ca2+ [23].
Uprkos velikom napretku koji je postignut u oblasti istaživanja vezanih za epilepsiju, i dalje se kod 25% paci-jenata konvulzije neadekvatno kontrolišu primenom standardne terapije lekovima. U poslednje vreme se u lečenju epilepsije koriste novi lekovi (tzv. antikonvulzivi druge generacije) poput: felbamata (Felbatol®), lamo-trigina (Lamictal®), gabapentina (Neurontin®) i topira-mata (Topamax®) [9]. Njihovo mesto u terapiji epilep-sije se još uvek određuje. Iako su efikasni u tretmanu epileptičkih sindroma, nisu pokazali superiornost u odnosu na tradicionalne antikonvulzive (antikonvulzivi prve generacije) [9]. Iz tog razloga postoji konstantna potreba za pronalaženjem novih antiepileptika sa većom efikasnošću i manjim nuspojavama.
Većina jedinjenja koja pokazuje antikonvulzivnu aktivnost, u svojoj strukturi sadrži cikličnu ureidnu jedi-nicu sa fenil ili alkil supstituentima [9,19]. Važan pred-stavnik antikonvulziva prve generacije je fenitoin (5,5- -difenilhidantoin, Dilantin®). Iako je otkriven pre više od sedam decenija i dalje je u širokoj terapijskoj upotrebi, s obzirom da je efikasan u terapiji različitih formi par-cijalnih i generalizovanih napada (ali ne absansnih) [23].
Odnos strukture i bioloških svojstava derivata hid-antoina intenzivno se proučava sa ciljem da se iden-tifikuju oni strukturni elementi koji su odgovorni za
korisnu aktivnost, ali i neželjena dejstva. Uspostavljanje vodoničnih veza sa ciljnim mestima nalazi se u osnovi mehanizma njihovog antikonvulzivnog delovanja. Kris-talografska analiza antikonvulziva je pokazala da među-sobna orijentacija aromatične grupe i dela molekula koji gradi vodonične veze značajno utiče na efikasnost njihovog delovanja [13,24–26].
Od otkrića 5,5-difenilhidantoina do danas, sintetizo-vani su mnogi analozi hidantoina, uključujući spirohi-dantoine [8,9,19], koji pokazuju antikonvulzivnu aktivnost.
U slučaju N-3-supstituisanih ciklopropanspiro-5-hid-antoina (tabela 2), kao farmakološki najaktivniji poka-zali su se derivati koji sadrže nerazgranate alkil i hid-roksialkil supstituente (npr. metil-, butil- i (1-hidroksi-metil)propil-grupa) [8]. Takođe, uočeno je da prisustvo fluora u para položaju N-3-fenil-grupe pojačava aktiv-nost derivata cikloalkanspiro-5-hidantoina, dok disup-stitucija hlorom u 3' i 5' položaju N-3-fenilnog jezgra, znatno smanjuje antikonvulzivnu aktivnost. Elektron- -donorske grupe kao što je metoksi i snažne elektron-akceptorske grupe poput nitro grupe, koje se nalaze u para položaju N-3-fenilnog jezgra, smanjuju delotvor-nost derivata ciklopropanspiro-5-hidantoina [8].
Tabela 2. 3-Supstituisani ciklopropanspiro-5-hidantoini sa antikonvulzivnim svojstvima Table 2. 3-Substituted cyclopropanespiro-5-hydantoins with anticonvulsant properties
NH
N
O
O
R
Redni broj R 1 H 2 CH3
3 (CH3)2CH 4 CH3(CH2)3
5 CH3CH2(CH2OH)CH 6 C6H5CH2
7 C6H5
8 4-CH3C6H4
9 4-CH3OC6H4
10 4-FC6H4
11 3,5-diClC6H3
12 4-NO2C6H4
BrCO2H
N C N
NN
O
O
(47) (48) (49)
+ DMF
Šema 17. Sinteza cikloheksanspiro-5-hidantoina iz supstituisane α-halogensirćetne kiseline i N,N’-dialkilkarbodiimida. Scheme 17. Synthesis of cyclohexanespiro-5-hydantoin from substituted α-halogenacetic acide and N,N’-dialcanecarbamide.

A.M. LAZIĆ i sar.: BIOLOŠKI AKTIVNI DERIVATi SPIROHIDANTOINA Hem. ind. 70 (2) 177–199 (2016)
186
Proučavanje antikonvulzivne aktivnosti u okviru serije N-1',N-3'-disupstituisanih ftalidil spirohidantoina (tabela 3), ukazalo je da struktura supstituenta na azotu veoma utiče na antikonvulzivnu aktivnost i lipofilnost molekula [9]. Supstituenti na azotu su odabrani tako da pruže uvid u optimalnu dužinu alkil lanca i da povećaju lipofilnost molekula spirohidantoina i tako olakšaju njihov prolaz kroz krvno–moždanu barijeru. Rezultati su pokazali da je u homologoj seriji jedinjenja sa po dve metil-, etil- ili alil-grupe (R1, R2 = metil, etil, alil), farma-kološki najaktivnji dietil derivat, sa srednjom efektiv-nom dozom (ED50) od 190 mg/kg u pentilentetra-zolskom (scPTZ) testu [9].
Tabela 3. N-1',N-3'-disupstituisani ftalidil spirohidantoini sa antikonvulzivnim svojstvima Table 3. N-1',N-3'-disubstituted phthalidyl spirohydantoins with anticonvulsant properties
ON
N
O
X
OR2
R1
3'1'
Redni broj R1 R2 X 1 CH3 CH3 O 2 C2H5 C2H5 O 3 Alil Alil O 4 CH3 C2H5 O 5 n-C3H7 n-C3H7 O 6 n-C4H9 n-C4H9 O 7 i-C3H7 i-C3H7 O 8 Ciklo-C6H11 Ciklo-C6H11 O 9 C6H5 CH3 O 10 C6H5 CH3 S 11 p-F-C6H4 CH3 O 12 p-CF3-C6H4 CH3 O 13 C6H5 C2H5 O 14 p-F-C6H4 C2H5 O 15 p-NO2-C6H4 C2H5 O 16 p-OCH3-C6H4 C2H5 O
N-1',N-3'-dipropil derivat (tabela 3) se pokazao dva i po puta aktivniji (ED50 = 78,5 mg/kg (scPTZ test)) u poređenju sa odgovarajućim dietil analogom. Poveća-njem dužine zasićenog supstituentskog alkil lanca do tri ugljenikova atoma, kod oba supstituenta na azotu, znatno raste antikonvulzivna aktivnost, dok povećanje broja ugljenikovih atoma kod samo jednog supstituenta rezultira smanjenim dejstvom. Uvođenjem razgranatih grupa (npr. izopropil-grupa) u prsten hidantoina znatno se umanjuje antikonvulzivna aktivnost jedinjenja. Polo-žaj N-3' je kritičan za antikonvulzivnu aktivnost i u skladu sa tim može da sadrži supstituent sa najviše tri
ugljenikova atoma, dok N-1' može biti supstituisan i aril grupom [9].
Supstituenti na N-1'-fenilnom jezgru značajno utiču na aktivnost. Naime, mala lipofilna grupa u para polo-žaju (atom fluora) povećava antikonvulzivna svojstva, dok glomaznija CF3 grupa u para položaju smanjuje aktivnost. Elektron-donorske grupe, npr. metoksi u para položaju fenilnog jezgra, uzrokuju blago smanjenje aktivnosti, dok duži lanci u istom položaju dovode do velike toksičnosti. U grupi N-1'-aril-N-3'-alkil disupsti-tuisanih jedinjenja, najaktivniji se pokazao N-1'-p-nitro-fenil-N-3'-etil derivat (ED50 = 41,8 mg/kg (scPTZ test)). Lipofilnost proučavanih spirohidantoina (izražena preko izračunatog particionog koeficijenta log P) sa značaj-nom antikonvulzivnom aktivnošću kreće se u intervalu 2,4–3,0, dok je lipofilnost farmakološki slabije aktivnog dietil derivata znatno manja (log P = 1,457) [9].
Da postoji korelacija između antikonvulzivne aktiv-nosti derivata hidantoina i njihove lipofilnosti, pokazali su i rezultati proučavanja serija 3,5-disupstituisanih-5- -fenilhidantoina [27] i 5-supstituisanih-5-fenilhidantoina [28,29]. U cilju razumevanja antikonvulzivne aktivnosti nekog molekula treba uzeti u obzir fenomen prenosa in vivo i interakciju sa receptorom.
Antiproliferativna aktivnost derivata spirohidantoina Iako je malignitet poznat od nastanka čovečanstva,
postao je vodeći uzročnik smrti tek u dvadesetom veku. Pomenuta bolest, može se pojaviti u bilo kom životnom dobu, mada su mnogo veće šanse za njen razvoj u srednjim godinama. Tako se karcinom debelog creva najčešće registruje kod osoba uzrasta 30–50 godina, dok se karcinom rektuma javlja kod osoba od 50–70 godina. Osim leukemije i limfoma koji se dijagnostikuju kod određenog broja maloletnih pacijenata, ostali oblici maligniteta retko se pojavljaju u ovom životnom peri-odu. Kod dece se takođe, uočavaju tumori na mozgu, nervnom sistemu, kostima, bubrezima, koji se inače retko sreću kod velikog broja odraslih ljudi [30].
Ne postoji univerzalna definicija za sve vrste raka. Karcinom (gr. karkinos – rak) je oboljenje koje karak-teriše nekontrolisana ćelijska proliferacija [30]. Pripada velikoj porodici bolesti čija je najvažnija odlika formi-ranje grupe neoplazmi sa svojstvima maligniteta. Neo-plazma (tumor) predstavlja skup ćelija koje su pretrpele neregulisani rast pa često formiraju čvorić ili se distri-buiraju difuzijom [31].
Tretmani kancera podrazumevaju operacije, radija-cije i hemoterapije [30]. Hiruška intervencija je pri-marni metod lečenja velikog broja čvrstih izolovanih kancera, njena uspešnost u velikoj meri doprinosi pre-življavanju. Cilj je odjednom ukloniti celokupnu malignu masu koja u određenim slučajevima uključuje i limfne čvorove. Ponekad je to sve što je neophodno da bi se u potpunosti eliminisao rak [32].

A.M. LAZIĆ i sar.: BIOLOŠKI AKTIVNI DERIVATi SPIROHIDANTOINA Hem. ind. 70 (2) 177–199 (2016)
187
Hemoterapija je pored hirurgije, od izuzetno velike koristi kod brojnih oblika kancera, kao što je karcinom dojke, kolorektalni karcinom, karcinom pankreasa, osteogeni sarkom, rak testisa, rak jajnika. Efikasnost je često ograničena zbog toksičnosti po preostale organe [32].
Radioterapija podrazumeva primenu jonizujućeg zračenja u pokušaju izlečenja ili poboljšanja simptoma raka. Koristi se kod 50% pacijenata, a najpoznatija je brahiterapija koja se odnosi na primenu inertnih izvora zračenja. Bitan je dodatak operaciji i hemoterapiji, dok se kod lečenja kancera glave i vrata može samostalno primenjivati [32].
Hinonska struktura predstavlja osnovu mnogih anti-tumorskih lekova, kao i antibiotika (doksorubicin (Adriamycin®) i mitoksantron (Mitoxantrone®)) koji se uveliko primenjuju u hemoterapijskoj kontroli brojnih kancera, a takođe su veoma efikasni kod tumora koji se postepeno razvijaju. Klinički značaj opisanih medika-menata, uticao je na razvoj novih antiproliferativnih agenasa kod kojih je zadržano hidantoinsko jezgro. Neoplastična aktivnost hidantoinskih derivata posledica je prisustva planarnog, policikličnog jezgra, sposobnog da se veže za molekul DNA i dva bočna lanca koji sadrže različite supstituente u odnosu na hromoforu [7].
U seriji 3-amino-3-etoksikarbonil-2,3-dihidrotieno- -(2,3-b)-nafto-4,9-dion derivata supstituisanih u polo-žaju 3 različitim aminokiselinama, najaktivnije jedinje-nje je 3-(glicil)-amino-3-etoksikarbonil-2,3-dihidrotieno-(2,3-b)-nafto-4,9-dion sa izuzetnom citotoksičnom aktivnošću u submikromolarnim koncentracijama. Efi-kasan je kod nekoliko tipova leukemije kao i čvrstih tumora [7].
Razvijena je i serija derivata cikloalkanspiro-5-hidan-toina, odnosno, 3-(alkil)(supstituisani alkil)spiro[(dihid-roimidazo-2,4-dion)-5,3'-(2',3'-dihidrotieno[2,3-b]nafto- -4',9'-dion)] derivati, kod kojih je policiklična jedinica, preko hidantoinskog prstena povezana sa bočnim alkil lancem (tabela 4) [7].
Derivat sa metil supstituentom (jedinjenje 1, tabela 4) deluje citotoksično na karcinom dojke (MCF-7) i debelog creva (SW 620) sa vrednostima IC50 (koncen-tracija koja izaziva 50% inhibicije) od 0,023 μM prema ćelijskoj liniji MCF-7 i IC50 = 0,108 μM prema ćelijskoj liniji SW 620, slično kao doksorubicin (IC50 = 0,022 μM (MCF-7); IC50 = 0,178 μM (SW 620)). Ostala jedinjenja poseduju smanjenu aktivnost zbog povećane lipofil-nosti i sternih smetnji na bočnom lancu. Uvođenje krajnje amino ili dialkilamino grupe u ravan alkil bočni lanac, nema uticaja na citotoksičnost prema ćelijskoj liniji MCF-7, dok se citotoksičnost prema ćelijskoj liniji SW 620 povećava (posmatrano u odnosu na dokso-rubicin). Pomenuto ukazuje da dužina bočnog niza određena brojem metilenskih grupa koje razdvajaju
hromoforu i udaljene amino grupe (unutar lanca) ne utiče značajno na citotoksičnost [7].
Tabela 4. 3-(Alkil)(supstituisani alkil)spiro[(dihidroimidazo-2,4- -dion)-5,3'-(2',3'-dihidrotieno[2,3-b]nafto-4',9'-dion)] derivati sa citotoksičnom aktivnošću Table 4. 3-(Alkyl)(alkyl-substituted)spiro[(dihydroimidazo-2,4- -dione)-5,3'-(2',3'-dihydrothieno[2,3-b]naphtho-4',9'-dione)] derivatives with cytotoxic activity
NH N
S
O
R
O
O
O
Redni broj R 1 CH3
2 CH2CH3
3 (CH2)2CH3 4 (CH2)3CH3 5 CH(CH3)CH2CH3
6 C(CH3)3
7 (CH2)2OH 8 (CH2)3OH 9 (CH2)2NH2
10 (CH2)3NH2
11 (CH2)4NH2
12 (CH2)2N(CH3)2
13 (CH2)2N(CH2CH3)2
14 (CH2)3N(CH2CH3)2
Uprkos brojnim otkrićima i napredovanjima u tera-piji, broj raspoloživih lekova, za tretman leukemije rela-tivno je ograničen. Dejstvo većine antiproliferativnih medikamenata zasniva se na apoptozi (oblik programi-rane ćelijske smrti koja se javlja u fiziološkim i patološ-kim procesima u organizmu). Neuspešno odumiranje kancerogenih krvnih ćelija glavni je razlog neizlečenja. Dokazano je da da se primenom ASHD-a (propil-2-(8- -(3,4-difluorbenzil)-2',5'-diokso-8-azaspiro[biciklo-[3.2.1]oktan-3,4'-imidazolidin]-1'-il)-acetat) (slika 1), postiže visoka citotoksičnost kod B-ćelijske hronične limfatične leukemije i hronične mijeloidne leukemije [33].
Posredovanje u replikaciji DNA i ćelijskoj deobi predstavlja jedan od načina indukovanja citotoksičnosti od strane ASHD. Takođe, utiče na translokaciju fosfa-tidilserina iz citoplazme na površinu ćelije, na izmenu potencijala mitohondrijalne membrane, što za posle-dicu ima povećanje koncentracije proteina koji izaziva apoptozu [33].
Analog somatostatina (slika 2) je modulator aktiv-nosti G-proteinskih kuplujućih receptora odgovornih za
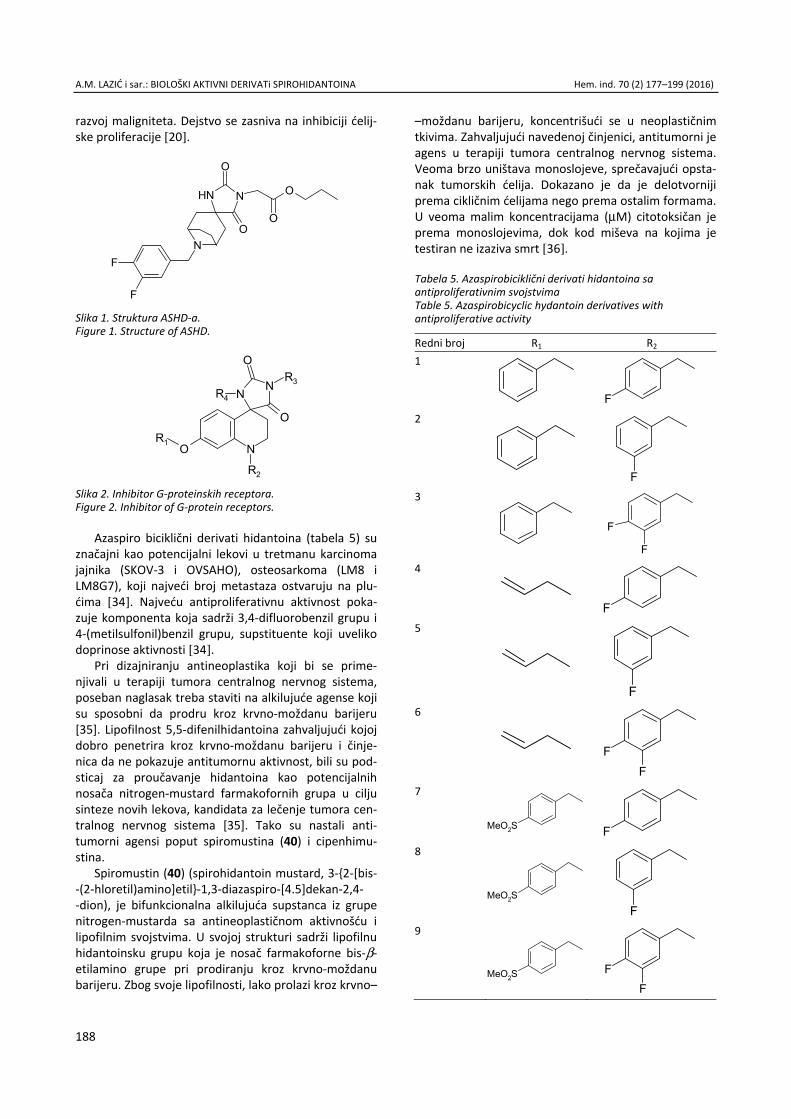
A.M. LAZIĆ i sar.: BIOLOŠKI AKTIVNI DERIVATi SPIROHIDANTOINA Hem. ind. 70 (2) 177–199 (2016)
188
razvoj maligniteta. Dejstvo se zasniva na inhibiciji ćelij-ske proliferacije [20].
NNH
N
F
F
O
O
O
O
Slika 1. Struktura ASHD-a. Figure 1. Structure of ASHD.
N
NN
O
O
OR1
R2
R3
R4
Slika 2. Inhibitor G-proteinskih receptora. Figure 2. Inhibitor of G-protein receptors.
Azaspiro biciklični derivati hidantoina (tabela 5) su značajni kao potencijalni lekovi u tretmanu karcinoma jajnika (SKOV-3 i OVSAHO), osteosarkoma (LM8 i LM8G7), koji najveći broj metastaza ostvaruju na plu-ćima [34]. Najveću antiproliferativnu aktivnost poka-zuje komponenta koja sadrži 3,4-difluorobenzil grupu i 4-(metilsulfonil)benzil grupu, supstituente koji uveliko doprinose aktivnosti [34].
Pri dizajniranju antineoplastika koji bi se prime-njivali u terapiji tumora centralnog nervnog sistema, poseban naglasak treba staviti na alkilujuće agense koji su sposobni da prodru kroz krvno-moždanu barijeru [35]. Lipofilnost 5,5-difenilhidantoina zahvaljujući kojoj dobro penetrira kroz krvno-moždanu barijeru i činje-nica da ne pokazuje antitumornu aktivnost, bili su pod-sticaj za proučavanje hidantoina kao potencijalnih nosača nitrogen-mustard farmakofornih grupa u cilju sinteze novih lekova, kandidata za lečenje tumora cen-tralnog nervnog sistema [35]. Tako su nastali anti-tumorni agensi poput spiromustina (40) i cipenhimu-stina.
Spiromustin (40) (spirohidantoin mustard, 3-{2-[bis- -(2-hloretil)amino]etil}-1,3-diazaspiro-[4.5]dekan-2,4- -dion), je bifunkcionalna alkilujuća supstanca iz grupe nitrogen-mustarda sa antineoplastičnom aktivnošću i lipofilnim svojstvima. U svojoj strukturi sadrži lipofilnu hidantoinsku grupu koja je nosač farmakoforne bis-β-etilamino grupe pri prodiranju kroz krvno-moždanu barijeru. Zbog svoje lipofilnosti, lako prolazi kroz krvno–
–moždanu barijeru, koncentrišući se u neoplastičnim tkivima. Zahvaljujući navedenoj činjenici, antitumorni je agens u terapiji tumora centralnog nervnog sistema. Veoma brzo uništava monoslojeve, sprečavajući opsta-nak tumorskih ćelija. Dokazano je da je delotvorniji prema cikličnim ćelijama nego prema ostalim formama. U veoma malim koncentracijama (μМ) citotoksičan je prema monoslojevima, dok kod miševa na kojima je testiran ne izaziva smrt [36].
Tabela 5. Azaspirobiciklični derivati hidantoina sa antiproliferativnim svojstvima Table 5. Azaspirobicyclic hydantoin derivatives with antiproliferative activity
Redni broj R1 R2
1
F2
F3
F
F
4
F
5
F6
F
F
7
MeO2S F8
MeO2S F
9
MeO2S F
F

A.M. LAZIĆ i sar.: BIOLOŠKI AKTIVNI DERIVATi SPIROHIDANTOINA Hem. ind. 70 (2) 177–199 (2016)
189
Cipenhimustin (3-{2-[bis-(2-hloretil)amino]etil}-1,3- -diazaspiro-[4.4]nonan-2,4-dion), analog je spiromus-tina (40). Modifikacija strukture u odnosu na spiro-mustin (40) sastoji se u zameni spirocikloheksil-grupe spiroalkil-grupom sa jednim C-atomom manje pri čemu je imidazolov prsten molekula hidantoina ostavljen kao nosač N,N-bis-(2-hloretil)amino grupe, odnosno, nitro-gen-mustard grupe koja je poznata po svojoj antitu-mornoj funkcionalnosti. Cipenhimustin poseduje zna-čajnu antitumornu aktivnost prema leukemiji L1210, leukemiji P355, melanomu B16, Luisovom (Lewis) karcinomu pluća i intracerebralnom ependimoblas-tomu [37].
Petočlani prsten kod cipenhimustina je pod naponom u poređenju sa šestočlanim kod spiromustina (40), budući da zauzima konformaciju polustolice, dok šestočlani prsten kod spiromustina (40) ima stabilnu konformaciju stolice. Utvrđeno je da je cipenhimustin delotvorniji kada se primeni u više doza, nego kada se upotrebi odjednom. Prednost u odnosu na druge nitro-gen-mustarde je što prouzrokuje samo blago smanji-vanje gustine koštane srži [37].
Karmi (Carmi) je proučavajući antiproliferativnu aktivnost 5-benziliden derivata hidantoina, prema ćelijskoj liniji humanog epidermalnog karcinoma A431, utvrdio da je egzociklična dvostruka veza u položaju 5 hidantoinskog prstena esencijalna za inhibiciju ćelijskog rasta što ukazuje da je krut planaran sistem neophodan za interakciju na ciljnom mestu [38].
Proučavajući antiproliferativnu aktivnost 3-(4-sup-stituisanih benzil)-5,5-difenilhidantoina i 3-(4-supsti-tuisanih benzil)-5-etil-5-fenilhidantoina, Ušćumlić i sa-radnici su pokazali značajnu aktivnost ovih molekula prema ćelijskoj liniji humanog karcinoma dojke, MDA- -MB-231 i ćelijskoj liniji humanog karcinoma kolona HCT-116. Aktivnost je naročito izražena kada se na fenilnom jezgru kao supstituenti nalaze metil-grupa i halogeni elementi [39–42].
Jedinstvena svojstva fluorovanih molekula dobro su poznata u medicinskoj hemiji [43]. Prisustvo fluora u strukturi biološki aktivnih molekula je od ključne važnosti za njihova farmakološka svojstava. Kod aza-spiro bicikličnih sistema, 8-(3,4-difluorbenzil)- i 8-(3,4- -dihlorobenzil)-1'-(pent-4-enil)-8-azaspiro[biciklo-[3.2.1]-oktan-3,4'-imidazolidin-2,5-diona (DFH (R1 = R2 = = F), DCH (R1 = R2 = Cl); slika 3), utvrđeno je da pose-duju antitumornu aktivnost prema ćelijskim linijama humane leukemije K562, Reh, CEM i 8E5. Pretpostavka je da pomenuti derivati zaustavljaju rast kancerogenih ćelija preko izmena u DNA replikaciji koje se završavaju apoptozom [43].
Derivati spirohidantoina za lečenje dijabetesa Dijabetes pripada grupi metaboličkih bolesti. Prati
ga hiperglikemija koja je posledica defekta u sekreciji insulina, u delovanju insulina ili u oba procesa. Hro-
nična hiperglikemija stvara oštećenja na mnogim orga-nima, a naroćito očima, bubrezima, nervima i srcu. Dugotrajne komplikacije dovode do nastanka retino-patije i mogućnosti gubitka vida, nefropatije koja može završiti otkazivanjem bubrega, periferne nefropatije, gastrointestinalnih i kardiovaskularnih oštećenja. Utvr-đeno je da je dijabetes tipa 1 posledica smanjene insu-linske sekrecije. Dijabetes tipa 2 (insulinski nezavisni) rezultat je rezistencije na dejstvo insulina u β-ćelijama kao i neadekvatnog izlučivanja insulina. Pored dva naj-važnija oblika, razlikuje se i dijabetes koji je posledica genetskog defekta β-ćelija, genetskog defekta u akciji insulina, bolesti pankreasa [44].
NNH
N
O
O
R1 = R2 = FR1 = R2 = Cl
R1
R2
Slika 3. Struktura DFH (R1 = R2 = F) i DCH (R1 = R2 = Cl). Figure 3. Structure of DFH (R1 = R2 = F) and DCH (R1 = R2 = F).
Postoji značajna korelacija između izmenjenog poli-olskog puta odgovornog za metabolizam glukoze i dugotrajnog napredovanja komplikacija kao što su: neuropatije, retinopatije, nefropatije i katarakta. Aldo-za reduktaza enzim (ARL2) iz familije aldo-keto reduk-taza, prvi je enzim na poliolskom putu, koji katalizuje NADPH (nikotinamid adenin dinukleotid fosfat) zavisnu redukciju viška glukoze do sorbitola. Na ovaj način, znatno se povećava koncentracija sorbitola. Njegova akumulacija je spona ka ćelijskom uništenju koje se završava dijabetnim komplikacijama. Inhibitori ALR2 privukli su pažnju kao potencijalni lekovi, obzirom da mogu bezbedno da spreče ili zaustave napredovanje dugotrajnih komplikacija, bez rizika od pojave hipogli-kemije jer ne utiču na promenu koncentracije glukoze u krvnoj plazmi [5].
Poznat je veliki broj strukturno različitih kompo-nenata koje inhibiraju aktivnost ALR2, ali su najdelo-tvorniji derivati spirohidantoina, naročito sorbinil. Dobru inhibitorsku aktivnost poseduju derivati sorbinila kod kojih je atom kiseonika unutar piranskog prstena zamenjen atomom sumpora. Takođe, utvrđeno je da je aktivnost 8-aza analoga sorbinila veća od one koju pokazuje sorbinil [5].
Nesupstituisani i metil supstituisani derivati 2,3-dihidrotiopirano-(2,3-b)-piridin-4(4H)-ona (jedinjenja 1 i 2, tabela 6) izuzetno su aktivni kao inhibitori ALR2 sa

A.M. LAZIĆ i sar.: BIOLOŠKI AKTIVNI DERIVATi SPIROHIDANTOINA Hem. ind. 70 (2) 177–199 (2016)
190
vrednostima IC50 (1, IC50 = 0,96 μM; 2, IC50 = 0,94 μM) slično onoj kod sorbinila (IC50 = 0,65 μM), i za jedan red veličine većoj u odnosu na tolrestat (Tolrestat®) (IC50 = = 0,05 μM) [5]. Uvođenjem karboksimetil supstituenta u hidantoinski prsten (jedinjenje 4, tabela 6) smanjuje se aktivnost odgovarajućeg analoga sorbinila. Nesupsti-tuisani derivat (jedinjenje 1, tabela 6) pokazao je izu-zetnu in vivo aktivnost u sprečavanju nuklearne kata-rakte kod galaktozemijskih pacova, poput tolrestata [5].
Tabela 6. Spirohidantoinski derivati 2,3-dihidrotiopirano-(2,3- -b)-piridin-4-(4H)-ona Table 6. Spirohydantoin derivatives of 2,3-dihydrothiopyrano- -(2,3-b)-piridine-4-(4H)-on
N X
NHN
O
O R2
R1 Redni broj X R1 R2
1 S H H 2 S CH3 H 3 SO2 H H 4 S H CH2COOH
Aktivnost ka inhibiciji aldoza reduktaze pokazali su i derivati spirohidantoina koji su sintetisani iz petočlanih i šestočlanih cikličnih ketona kondenzovanih sa benze-novim prstenom (tabela 7). Nagli pad aktivnosti je uo-čen kod derivata spirohidantoina sa cikloheptanskom jedinicom [4].
Pravi međusobni odnos aromatičnog i spirohidan-toinskog prstena su od ključne važnosti za dobru fizio-lošku aktivnost. Hidrogenizacija ili uklanjanje benzeno-vog prstena kao i pomeranje mesta spiro čvora u odnosu na čvorna mesta u kondenzovanom bicikličnom delu sistema, uzrokuje drastičan pad aktivnosti (tabela 7). Benzenov prsten aktivnog jedinjenja je moguće zameniti nekom drugom aromatičnom jedinicom poput: tiofena, furana, piridina. Zamena pirolom se pokazala kao štetna. Supstitucija halogenom u položaju 6 benzodihidropiranskog (hroman) i benzodihidrotio-piranskog (tiohroman) hidantoinskog derivata izuzetno povećava aktivnost [4].
Snažni inhibitori aldoza reduktaze na bazi spiro-imidazolona (tabela 8) su od važnosti kao potencijalni agensi u lečenju ili prevenciji određenih komplikacija koje su posledica dijabetesa ili galaktozemije [20].
Derivati spirohidantoina sa antipsihotičkim svojstvima Depresija je veoma često psihijatrijsko stanje o
kojem postoji mnogo različitih neurohemijskih teorija, i za koju se u terapiji koristi veliki broj različitih vrsta lekova. Depresija je najčešći afektni poremećaj. Kreće
se od vrlo blagog stanja koje se graniči sa normalnim pa sve do psihotičkih depresija praćenih halucinacijama i deluzijama. Depresija ima dve vrste simptoma: emocio-nalne (ojađenost, apatija i pesimizam, nedostatak samopouzdanja, neodlučnost, gubitak motivacije) i bio-loške (usporenost misli i delovanja, gubitak libida, pore-mećaj sna i gubitak apetita). Postoje dva različita tipa depresivnog sindroma, a to su unipolarna depresija (promene raspoloženja se kreću uvek u istom smeru) i bipolarni afektni poremećaj (depresija se smenjuje sa manijom) [23].
Tabela 7. Derivati spirohidantoina, inhibitori aktivnosti aldoza reduktaze Table 7. Spirohydantoin derivatives aldose reductase inhibitors
Redni broj Struktura 1
NH NH
O
O
R2
X
NHNH
O
O
X = CH2, CH2CH2, O, S, SO2
R
3
NHNH
O
O
O S N
A
A =
4
NHNH
O
O
5
NHNH
O
O
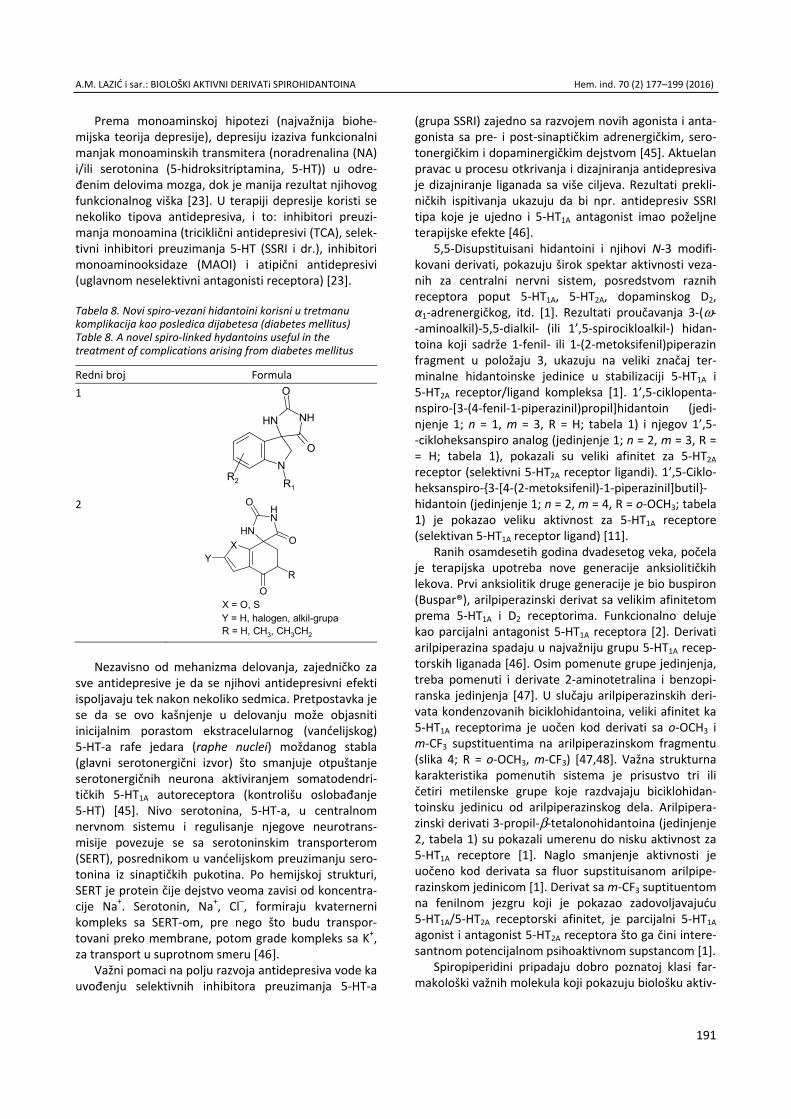
A.M. LAZIĆ i sar.: BIOLOŠKI AKTIVNI DERIVATi SPIROHIDANTOINA Hem. ind. 70 (2) 177–199 (2016)
191
Prema monoaminskoj hipotezi (najvažnija biohe-mijska teorija depresije), depresiju izaziva funkcionalni manjak monoaminskih transmitera (noradrenalina (NA) i/ili serotonina (5-hidroksitriptamina, 5-HT)) u odre-đenim delovima mozga, dok je manija rezultat njihovog funkcionalnog viška [23]. U terapiji depresije koristi se nekoliko tipova antidepresiva, i to: inhibitori preuzi-manja monoamina (triciklični antidepresivi (TCA), selek-tivni inhibitori preuzimanja 5-HT (SSRI i dr.), inhibitori monoaminooksidaze (MAOI) i atipični antidepresivi (uglavnom neselektivni antagonisti receptora) [23].
Tabela 8. Novi spiro-vezani hidantoini korisni u tretmanu komplikacija kao posledica dijabetesa (diabetes mellitus) Table 8. A novel spiro-linked hydantoins useful in the treatment of complications arising from diabetes mellitus
Redni broj Formula 1
NH NH
O
ON
R2 R1 2
NHNH
O
OX
OR
Y
Y = H, halogen, alkil-grupaX = O, S
R = H, CH3, CH3CH2
Nezavisno od mehanizma delovanja, zajedničko za sve antidepresive je da se njihovi antidepresivni efekti ispoljavaju tek nakon nekoliko sedmica. Pretpostavka je se da se ovo kašnjenje u delovanju može objasniti inicijalnim porastom ekstracelularnog (vanćelijskog) 5-HT-a rafe jedara (raphe nuclei) moždanog stabla (glavni serotonergični izvor) što smanjuje otpuštanje serotonergičnih neurona aktiviranjem somatodendri-tičkih 5-HT1A autoreceptora (kontrolišu oslobađanje 5-HT) [45]. Nivo serotonina, 5-HT-a, u centralnom nervnom sistemu i regulisanje njegove neurotrans-misije povezuje se sa serotoninskim transporterom (SERT), posrednikom u vanćelijskom preuzimanju sero-tonina iz sinaptičkih pukotina. Po hemijskoj strukturi, SERT je protein čije dejstvo veoma zavisi od koncentra-cije Na+. Serotonin, Na+, Cl–, formiraju kvaternerni kompleks sa SERT-om, pre nego što budu transpor-tovani preko membrane, potom grade kompleks sa K+, za transport u suprotnom smeru [46].
Važni pomaci na polju razvoja antidepresiva vode ka uvođenju selektivnih inhibitora preuzimanja 5-HT-a
(grupa SSRI) zajedno sa razvojem novih agonista i anta-gonista sa pre- i post-sinaptičkim adrenergičkim, sero-tonergičkim i dopaminergičkim dejstvom [45]. Aktuelan pravac u procesu otkrivanja i dizajniranja antidepresiva je dizajniranje liganada sa više ciljeva. Rezultati prekli-ničkih ispitivanja ukazuju da bi npr. antidepresiv SSRI tipa koje je ujedno i 5-HT1A antagonist imao poželjne terapijske efekte [46].
5,5-Disupstituisani hidantoini i njihovi N-3 modifi-kovani derivati, pokazuju širok spektar aktivnosti veza-nih za centralni nervni sistem, posredstvom raznih receptora poput 5-HT1A, 5-HT2A, dopaminskog D2, α1-adrenergičkog, itd. [1]. Rezultati proučavanja 3-(ω- -aminoalkil)-5,5-dialkil- (ili 1’,5-spirocikloalkil-) hidan-toina koji sadrže 1-fenil- ili 1-(2-metoksifenil)piperazin fragment u položaju 3, ukazuju na veliki značaj ter-minalne hidantoinske jedinice u stabilizaciji 5-HT1A i 5-HT2A receptor/ligand kompleksa [1]. 1’,5-ciklopenta-nspiro-[3-(4-fenil-1-piperazinil)propil]hidantoin (jedi-njenje 1; n = 1, m = 3, R = H; tabela 1) i njegov 1’,5- -cikloheksanspiro analog (jedinjenje 1; n = 2, m = 3, R = = H; tabela 1), pokazali su veliki afinitet za 5-HT2A receptor (selektivni 5-HT2A receptor ligandi). 1’,5-Ciklo-heksanspiro-{3-[4-(2-metoksifenil)-1-piperazinil]butil}-hidantoin (jedinjenje 1; n = 2, m = 4, R = o-OCH3; tabela 1) je pokazao veliku aktivnost za 5-HT1A receptore (selektivan 5-HT1A receptor ligand) [11].
Ranih osamdesetih godina dvadesetog veka, počela je terapijska upotreba nove generacije anksiolitičkih lekova. Prvi anksiolitik druge generacije je bio buspiron (Buspar®), arilpiperazinski derivat sa velikim afinitetom prema 5-HT1A i D2 receptorima. Funkcionalno deluje kao parcijalni antagonist 5-HT1A receptora [2]. Derivati arilpiperazina spadaju u najvažniju grupu 5-HT1A recep-torskih liganada [46]. Osim pomenute grupe jedinjenja, treba pomenuti i derivate 2-aminotetralina i benzopi-ranska jedinjenja [47]. U slučaju arilpiperazinskih deri-vata kondenzovanih biciklohidantoina, veliki afinitet ka 5-HT1A receptorima je uočen kod derivati sa o-OCH3 i m-CF3 supstituentima na arilpiperazinskom fragmentu (slika 4; R = o-OCH3, m-CF3) [47,48]. Važna strukturna karakteristika pomenutih sistema je prisustvo tri ili četiri metilenske grupe koje razdvajaju biciklohidan-toinsku jedinicu od arilpiperazinskog dela. Arilpipera-zinski derivati 3-propil-β-tetalonohidantoina (jedinjenje 2, tabela 1) su pokazali umerenu do nisku aktivnost za 5-HT1A receptore [1]. Naglo smanjenje aktivnosti je uočeno kod derivata sa fluor supstituisanom arilpipe-razinskom jedinicom [1]. Derivat sa m-CF3 suptituentom na fenilnom jezgru koji je pokazao zadovoljavajuću 5-HT1A/5-HT2A receptorski afinitet, je parcijalni 5-HT1A agonist i antagonist 5-HT2A receptora što ga čini intere-santnom potencijalnom psihoaktivnom supstancom [1].
Spiropiperidini pripadaju dobro poznatoj klasi far-makološki važnih molekula koji pokazuju biološku aktiv-

A.M. LAZIĆ i sar.: BIOLOŠKI AKTIVNI DERIVATi SPIROHIDANTOINA Hem. ind. 70 (2) 177–199 (2016)
192
nost prema različitim ciljnim grupama, od inhibitora enzima do blokatora jonskih kanala. Spiropiperidinski molekulski skelet je od posebnog značaja u oblasti G protein-spregnutih receptora (sedam-transmembranski domen receptori) [49]. Zbog toga se ove grupe hemij-skih motiva često nazivaju „privilegovane strukture“. Jedna od reprezentativnih grupa spiropiperidina je spiropiperidino-hidantoin, dobro poznati motiv u oblasti serotoninskih receptora [49]. Među važnim ana-lozima spiropiperidino-hidantoina, svakako, treba po-menuti antipsihotik spiperon (Spiroperidol®) koji se koristi u terapiji shizofrenije.
N
O
O N N
N
m
m = 3, 4
n
n = 1, 2
R
Slika 4. Biciklohidantoin-arilpiperazini sa afinitetom za 5-HT1A receptore. Figure 4. Bicyclohydantoin-arylpiperazines with affinity for 5-HT1A receptors
Neurokininski receptori (NK-1, NK-2 i NK-3), poput serotoninskih, pripadaju ciljanoj grupi G protein-spre-gnutih receptora tako da nije iznenađujuće što neki NK-1 antagonisti sadrže spiropiperidino-hidantoinski fragment kao gradivnu jedinicu [50]. NK-1 receptor je atraktivan cilj za razvoj novih lekova poput analgetika, antidepresiva i antiemetika, koji bi se koristili u terapij-skim područjima u rasponu od bola, povraćanja i pluć-nih bolesti do depresije i anksioznosti [51]. 3,5-Bis(tri-fluormetil)fenil grupa je u funkciji bioizostera pome-nuta u kontekstu nekoliko NK-1 receptorskih liganada. Njena kombinacija sa spiropiperidino-hidantoinskim fragmentom kao središnjim skeletom, bila je osnova za dizajniranje novih potencijalnih neurokininskih-1 recep-torskih liganada (tabela 9) [49].
Melanin-koncentrirajući hormonski receptor 1 (MCH-R1) i melanin-koncentrirajući hormon (MCH) koji ga aktivira, su kod sisara uključeni u regulaciju načina ishrane, raspoloženja i energetskog bilansa [52]. S obzi-rom na to da su oralno aktivni MCH-R1 antagonisti efikasni u kontroli telesne težine kod glodara, za oče-kivanje je da bi selektivni antagonisti MCH-R1 mogli biti uspešni u tretmanu gojaznosti kod ljudi. U cilju pronala-ženja malih molekula koji bi bili pogodni kao selektivni antagonisti MCH-R1, proučavani su i derivati spiro-hidantoina (tabela 10), koji su pokazali visok afinitet vezivanja i funkcionalnu aktivnost za MCH-R1 [52].
Antimikrobna aktivnost derivata spirohidantoina Termin antibiotik (antibakterijski lek) odnosi se na
supstance koje su metaboliti mikroorganizama kao prirodni proizvodi ili su njihovi polusintetski i sintetski analozi. Deluju antimikrobno, inhibiraju rast (bakterio-statsko dejstvo) ili ubijaju mikroorganizme (bakteri-cidno dejstvo) sa tolerantnom toksičnošću prema do-maćinu [53]. Prema mehanizmu dejstva, antibiotike delimo na: antibiotike koji deluju na zid ćelije mikro-organizma, antibiotike koji deluju na membranu cito-plazme i antibiotike koji inhibiraju sintezu proteina i nukleinskih kiselina [53].
Tabela 9. Neurokininski-1 receptorski ligandi sa spiropiperidinil-hidantoinskim skeletom Table 9. Neurokinin-1 receptor ligands with spiropiperidino-hydantoin scaffold
N
NN
CH3
O
O
F3CCF3
O
R Redni broj R 1
2
Cl
Cl
3
F 4
NN
O
MeO
MeO5
N
Veoma značajan i složen problem u antimikrobnoj terapiji predstavlja rezistencija (otpornost) patogenih mikroorganizama na dejstvo široko primenjivanih anti-biotika. Stoga se u hemijskoj strukturi antibiotika vrše
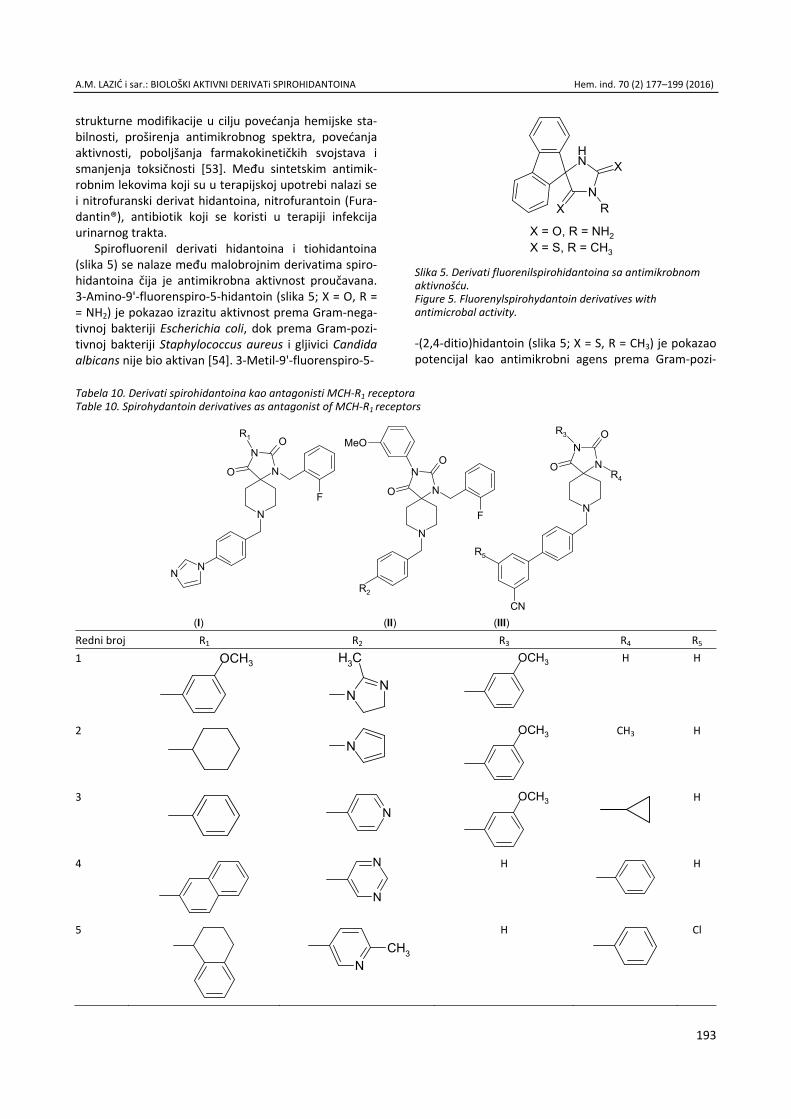
A.M. LAZIĆ i sar.: BIOLOŠKI AKTIVNI DERIVATi SPIROHIDANTOINA Hem. ind. 70 (2) 177–199 (2016)
193
strukturne modifikacije u cilju povećanja hemijske sta-bilnosti, proširenja antimikrobnog spektra, povećanja aktivnosti, poboljšanja farmakokinetičkih svojstava i smanjenja toksičnosti [53]. Među sintetskim antimik-robnim lekovima koji su u terapijskoj upotrebi nalazi se i nitrofuranski derivat hidantoina, nitrofurantoin (Fura-dantin®), antibiotik koji se koristi u terapiji infekcija urinarnog trakta.
Spirofluorenil derivati hidantoina i tiohidantoina (slika 5) se nalaze među malobrojnim derivatima spiro-hidantoina čija je antimikrobna aktivnost proučavana. 3-Amino-9'-fluorenspiro-5-hidantoin (slika 5; X = O, R = = NH2) je pokazao izrazitu aktivnost prema Gram-nega-tivnoj bakteriji Escherichia coli, dok prema Gram-pozi-tivnoj bakteriji Staphylococcus aureus i gljivici Candida albicans nije bio aktivan [54]. 3-Metil-9'-fluorenspiro-5-
N
NH
R
X
X
X = O, R = NH2X = S, R = CH3
Slika 5. Derivati fluorenilspirohidantoina sa antimikrobnom aktivnošću. Figure 5. Fluorenylspirohydantoin derivatives with antimicrobal activity.
-(2,4-ditio)hidantoin (slika 5; X = S, R = CH3) je pokazao potencijal kao antimikrobni agens prema Gram-pozi-
Tabela 10. Derivati spirohidantoina kao antagonisti MCH-R1 receptora Table 10. Spirohydantoin derivatives as antagonist of MCH-R1 receptors
N
N
NN
N
O
O
F N
N
N
O
O
F
MeO
NN
N
O
O
CN
R1
R2
R3
R4
R5
(I) (II) (III) Redni broj R1 R2 R3 R4 R5
1 OCH3
NN
CH3 OCH3
H H
2
N
OCH3 CH3 H
3
N
OCH3
H
4
N
N
H
H
5
NCH3
H
Cl

A.M. LAZIĆ i sar.: BIOLOŠKI AKTIVNI DERIVATi SPIROHIDANTOINA Hem. ind. 70 (2) 177–199 (2016)
194
tivnim bakterijama (Staphylococcus aureus i Bacillus subtilis), umerenu aktivnost prema gljivici Candida albi-cans, a malu ili nikakvu aktivnost prema Gram-nega-tivnim bakterijama (Escherichia coli, Salmonella ente-rica subsp enterica, Pseudomonas aeruginosa) [55].
Derivati spirohidantoina sa antiinflamatornim svojstvima
Suočen sa napadom patogena, odnosno, organi-zama koji prouzrokuju bolest (bakterije, virusi, gljivice, prioni, paraziti), organizam sisara može da angažuje odbrambene odgovore čiji razvoj stvara akutnu zapa-ljensku/imunu reakciju [23]. Kada odbrambene snage nedostaju (na primer u sindromu stečene imunodefici-jencije, AIDS) ili su suzbijene lekovima, organizmi koji normalno nisu patogeni, mogu da prouzrokuju obo-ljenje (oportunističke infekcije) [23]. Osim patogenih agenasa, agensi koji izazivaju zapaljenje mogu biti fizičke (toplota, hladnoća, jonizujuća zračenja i meha-nička oštećenja), hemijske (kiseline, baze, toksične sup-stance) ili traumatske (telesna rana ili povreda) prirode.
Štetni agensi izazivaju direktno oštećenje ćelija, a materije nastale usled poremećenog metabolizma ćelija izazivaju početak procesa zapaljenja [56]. Infla-macija je osnovni i najčešći patološki proces pri kome se lokalno javljaju promene na krvnim sudovima, pore-mećaji u razmeni tečnosti i izlazak belih krvnih ćelija iz krvi [56]. Ćelije tkiva u kome se odigrava proces infla-macije pokazuju promene od lakih degenerativnih do izumiranja. Ove promene su bitne za početak vaskular-nih, eksudativnih (eksudacija – izlazak tečnosti iz ćelija, kapilara i sitnih vena kao i pojava veće količine sluzi na površinama sluznice) i reparativnih procesa koji slede. Oblik, težina i tok zapaljenjskog procesa zavise od vrste i intenziteta štetnog agensa, vrste tkiva i opšteg stanja organizma [56].
U kontekstu NK-1 receptorskih liganada, već je pomenut značaj spiropiperidinskog molekulskog skeleta u oblasti G protein-spregnutih receptora [49]. Hemo-kinski receptori, takođe, spadaju u G protein-spregnute receptore. Uopšteno govoreći, supstance koje su modulatori hemokinskih receptora su od značaja za prevenciju ili tretman inflamatornih oboljenja, imuno-regulatornih oboljenja, reakcije organizma na trans-plantirani organ, infektivnih oboljenja poput infekcije izazvane HIV-om (virus humane imunodesuficijencije) itd. [3]. Spiropiperidino-hidantoinski fragment se pojav-ljuje kao središnja jedinica u strukturi molekula koji su modulatori aktivnost hemokinskih receptora podvrste CCR5 (jedinjenje 3, tabela 1) [3]. Ti spirohidantoinski derivati su od potencijalnog značaja za prevenciju ili tretman oboljenja koja su povezana sa modulacijom aktivnosti CCR5 hemokinskih receptora. CCR5 je glavni HIV-1 koreceptor koji kontroliše osjetljivost prema HIV-1 infekciji i bolesti [57]. Interakcija CCR5 koreceptora i virusa HIV-a može da blokira ulaz HIV-a u ćeliju [3].
Derivati spirohidantoina sa analgetskim svojstvima Bol je subjektivan osećaj koji je teško definisati.
Jedan je od najčešćih simptoma uopšte, i predstavlja veliki zdravstveni problem. Prema Međunarodnoj aso-cijaciji za proučavanje bola (IASP), bol je neprijatno senzorno i emocionalno iskustvo povezano sa stvarnim ili potencijalnim oštećenjem tkiva [58]. Pomenuta defi-nicija uzima u obzir i fizičku i psihičku komponentu bola. Bol je obično direktan odgovor na štetnu pojavu koja prati oštećenje tkiva poput povreda, upala ili kar-cinoma [23]. Takođe, nezavisno od bilo kog predispo-nirajućeg faktora može nastati jak bol (npr. trige-minalna neuralgija) ili može trajati dugo nakon izlečenja povrede (npr. fantomski bol u predelu ekstremiteta koji je amputiran). Bol može nastati i bez direktne povrede tkiva, a usled oštećenja mozga i nerava (npr. nakon šloga ili herpesne infekcije) [23]. Ovakav bol je neuro-patski po prirodi i ima ga veliki procenat bolesnika. Prema IASP, neuropatski bol je izazvan primarnom lezijom ili disfunkcijom u nervnom sistemu [59]. U osnovi, kad se nerv ošteti, promene u nervnim pute-vima mogu rezultirati hroničnim bolom čak i u odsustvu daljih podražaja. U slučaju bola kao poremećaja neuro-loške funkcije malo pomažu standardni analgetici, za razliku od bola čiji je neposredni uzrok poznat [23].
Migrena je čest, hronični, veoma onesposobljavajući neurovaskularni poremećaj, okarakterisan napadima jake, pulsirajuće glavobolje u jednoj polovini glave, disfunkcijom autonomnog nervnog sistema, i (kod nekih pacijenata) pojavom neuroloških simptoma pre ili tokom glavobolje (tzv. aura) [60,61]. Napadi tipično traju od 4 do 72 sata. Ovo neurološko oboljenje pogađa više od 12% odraslih osoba. Kod migrene bez aure, napadi glavobolje su obično praćeni mučninom, povra-ćanjem, ili osetljivošću na svetlo, zvuk ili pokret [60].
Terapijski pristup u lečenju migrene je individualan. Terapija akutnog napada migrene uključuje nespeci-fične i specifične lekove. Od nespecifičnih lekova se koriste aspirin, analgetici, nesteroidni antiinflamatorni lekovi itd. Specifična terapija akutnog napada migrene uključuje triptane (derivati triptamina). To su selektivni serotonin receptor agonisti koji aktiviraju 5-HT1B i 5-HT1D receptore [60].
Mnoga istraživanja ukazuju da je ključni igrač u patologiji migrene peptid srodan kalcitoninu (CGRP) [61]. Klinička istraživanja su pokazala da u tretmanu akutne migrene intavenozno primenjeni CGRP receptor antagonist BIBN4096BS ima uporedivu efikasanost sa triptanima [61]. Dakle, dizajn malih molekula koji su oralno raspoloživi nepeptidni CGRP receptor antago-nisti značio bi veliki napredak u terapiji akutne migrene.
Benzodiazepinon tetralin-spirohidantoin (slika 6) je prepoznat kao slabo aktivan CGRP receptor antagonist sa konstantom inhibicije CGRP Ki = 4800 nM [62]. Ovaj molekul je poslužio kao osnova za dizajniranje nove

A.M. LAZIĆ i sar.: BIOLOŠKI AKTIVNI DERIVATi SPIROHIDANTOINA Hem. ind. 70 (2) 177–199 (2016)
195
grupe oralno raspoloživih nepeptidnih benzimidazo-linon indan-spirohidantoinskih CGRP receptor antago-nista (tabela 11) koji su sintetizovani i ispitivana je njhova aktivnost i oralna bioraspoloživost na eksperi-mentalnim životinjama (pacovi, psi, rezus majmuni) [61]. Osnovna ideja pri dizajniranju ovih molekula je bila da se uz retenciju hidantoinske farmakofore izvrši modifikacija u strukturi benzodiazepinon tetralin-spiro-hidantoina (slika 6), sa ciljem da se dobije moćan bio-raspoloživi CGRP receptor antagonist za lečenje mig-rene [61].
Svi proučavani derivati su pokazali znatno veću aktivnost u odnosu na benzodiazepinon. Posebno treba istaći 2-piridil supstituisani derivat (jedinjenje 3, tabela 11) koji se pokazao kao moćan CGRP receptor anta-gonist (CGRP Ki = 21 nM), jedinjenje sa dobrom kom-binacijom aktivnosti i farmakokinetike [61]. Osim benz-imidazolinon indan-spirohidantoinskih derivata, sinteti-zovani su i neki benzoksazolinon tetralin- i indan-spiro-hidantoini koji su imali znatno manju aktivnost u odnosu na benzimidazolinone [61].
Tabela 11. Komponente benzimidazolinona kao antagonisti CGRP receptora Table 11. Components of benzimidazolinone as antagonists of CGRP receptors
Redni broj R Redni broj R 1 H 7
NOCH3
2
F
F
8
N
NCF3
3 N
9
N
N
4
S
N
10 N
N5
O
H
11
N
N
6
NS
– –
Derivat indolilspirohidantoina (slika 7) kao inhibitor aktivnosti vaniloidnog receptora 1 (VR1 ili TRPV1), inte-rsantan je u domenu lečenja stanja koja su povezana sa pomenutim receptorom (akutan i hroničan bol, akutan i
hroničan neuropatski bol, bol pri akutnoj i hroničnoj upali) [63].
NH
NH
NH
O
NH
N
N O O
O
Slika 6. Struktura benzodiazepinon tetralin-spirohydantoina. Figure 6. Structure of benzodiazepinone tetralin-spiro-hydantoine.
NHNH O
O
N
O
O
ClCl F
FF
Slika 7. Derivat indolilspirohidantoina, inhibitor aktivnosti vaniloidnog receptora 1 (VR1 ili TRPV1). Figure 7. Indolylspirohydantoin derivative, compound with vanilloid receptor 1 (VR1 or TRPV1) inhibitor activity.
Zaključak Spirohidantoin je u osnovi petočlani ciklični ureid
koji je lako moguće funkcionalizovati velikim brojem farmakofornih grupa što doprinosi raznovrsnoj fizio-loškoj aktivnosti derivata spirohidantoina i njegovih analoga. Zadovoljavajuća lipofilnost supstituisanih spi-rohidantoina zahvaljujući kojoj dobro prodiru kroz krvno-moždanu barijeru u ćelijske membrane, podsticaj je za proučavanje ovih molekula kao potencijalnih nosača različitih farmakofornih grupa u cilju sinteze novih, potencijalnih lekova u tretmanu različitih bolesti centralnog nervnog sistema. Spirohidantoini i njihovi analozi su važni kao potencijalni antibiotici, antipsiho-tici, antikonvulzivi, antidijabetici, antiinflamatorni i antikancerogeni lekovi. Od posebnog je značaja postav-ljanje opštih farmakoloških modela koji bi detaljno pri-kazali mehanizme farmakološkog delovanja derivata spirohidantoina. Danas se veoma intenzivno radi na dizajniranju postojećih lekova kao i uvođenju novih farmakološki aktivnih supstanci, postavljanjem QSAR modela, koji omogućuju kvantitativnu procenu fizio-loške aktivnosti spirohidantoina na osnovu njihovih strukturnih karakteristika.
Zahvalnica Autori se zahvaljuju Ministarstvu prosvete, nauke i
tehnološkog razvoja Republike Srbije na finansijskoj pomoći tokom izrade ovog rada (Projekat 172 013).
A.M. LAZIĆ i sar.: BIOLOŠKI AKTIVNI DERIVATi SPIROHIDANTOINA Hem. ind. 70 (2) 177–199 (2016)
196
LITERATURA
[1] H. Byrtus, M. Pawlowski, B. Duszyńska, A. Wesolowska, E. Chojnacka-Wójcik, A.J. Bojarski, Arylpiperazine derivatives of 3-propyl-β-tetralonohydantoin as new 5-HT1A and 5-HT2A receptor ligands, Pol. J. Pharmacol. 53 (2001) 396–401.
[2] Ј. Kossakowski, T. Zawasowski, J. Turbo, J. Kleps, Syn-thesis of N-(4-aril-1-piperazinylbutyl)-substituted 7,8-benzo-1,3-diazaspiro-(4,5)-decane 2,4-dione derivatives with potential anxiolytic activity, Farmaco 53 (1998) 169–171.
[3] L.C.C. Kong, C. Moinet, L. Vaillancourt, M. Bubenik, Spirohydantoin compounds and methods for the modul-ation of chemokine receptor activity, US 2006/0014769 A1 (2006).
[4] R. Sarges, R.C. Schnur, J.L. Belletire, M.J. Peterson, Spirohydantoin aldose reductase inhibitors, J. Med. Chem. 31 (1988) 230–243.
[5] F. Da Settimo, G. Primofiore, C. La Motta, S. Salerno, E. Novellino, G. Greco, A. Lavecchia, S. Laneri, E. Boldrini, Spirohydantoin derivatives of thiopyrano (2,3-b)-pyri-din-4-(4H)-one as potent in vitro and in vivo aldose reductase inhibitors, Bioorg. Med. Chem. 13 (2005) 491–499.
[6] D.R. Haines, R.W. Fuller, S. Ahmad, D.T. Vistica, V.E. Marquez, Selective cytotoxity of a system L specific amino acid nitrogen mustard, J. Med. Chem. 30 (1987) 542–547.
[7] I.G. Monterrey, G. Santelli, P. Campiglia, D. Califano, F. Falasconi, C. Pisano, L. Vesci, T. Lama, P. Grieco, E. Novellino, Synthesis and cytotoxic evaluation of novel spirohydantoin derivatives of the dihydrothieno-(2,3-b)-naphtho-4,9-dione system, J. Med. Chem. 48 (2005) 1152–1157.
[8] Q. Zhu, Y. Pan, Z. Hu, R. Li, G. Qiu, W. Xu, X. Ke, L. Wu, X. Hu, Synthesis and potential anticonvulsant activity of new N-3- substituted 5,5-cyclopropanespirohydantoins, Eur. J. Med. Chem. 44 (2009) 296–302.
[9] H.J. Patel, J. Sarra, F. Caruso, M. Rossi, U. Doshi, R.A. Stephani, Synthesis and anticonvulsant activity of new N-1',N-3'-disubstituted-2'H,3H,5'H-spiro-(2-benzofuran- -1,4'-imidazolidine)-2',3,5'-triones, Bioorg. Med. Chem. Lett. 16 (2006) 4644–4647.
[10] N. Stoyanov, M. Marinov, Two мethods for spirothio-hydantoin synthesis, Аcta Chim. Slov. 59 (2012) 680– –685.
[11] H. Byrtus, M. Pawlowski, S. Charakchieva-Minol, B. Duszynska, M.J. Mokrosz, J.L. Mokrosz, A. Zejc, 3-(ω-Aminoalkyl)-5,5-dialkyl(or spirocycloalkyl-1′,5-)hydan-toins as New 5-HT1A and 5-HT2A Receptor Ligands, Arch. Pharm. (Weinheim) 329 (1996) 283–290.
[12] Е. Naydenova, N. Pencheva, J. Popova, N. Stoyanov, M. Lazarova, B. Aleksiev, Aminoderivatives of cycloalkane-spirohydantoins: synthesis and biological activity, Farmaco 57 (2002) 189–194.
[13] N. Trišović, G. Ušćumlić, S. Petrović, Hydantoins: syn-thesis, properties and anticonvulsant activity, Hem. Ind. 63 (2009) 17–31.
[14] T. Kimura, Y. Nagao, N-H Stretching vibrations of hydan-toin (2,4-imidazolidinedione), its derivatives and related compounds, Bull. Fac. Sci. Tech. Hirosaki Univ. 5 (2003) 11–13.
[15] I. Rivero, E.R. Soto, A.O. Teran, Microwave-assisted syn-thesis of cycloalkanespirohydantoins and piperidine-spirohydantoins as precursors of restricted α-amino acids, ARKIVOC (2011) 260–271.
[16] E. Ware, The chemistry of the hydantoins, Chem. Rev. 46 (1950) 403–470.
[17] K. Faghihi, K. Zamani, A. Mobinikhaledi, Facile synthesis of hydantoin derivatives under microwave irradiation, Turk. J. Chem. 28 (2004) 345–350.
[18] М. Nieto, A. Philip, J. Poupaert, C. McCurdy, Solution-Phase parallel synthesis of spirohydantoins, J. Comb. Chem. 7 (2005) 258–263.
[19] J. Obniska, H. Byrtus, K. Kaminski, M. Pawlowski, M. Szczesio, J.K. Wojciechowska, Design, synthesis, and anticonvulsant activity of new N-Mannich bases derived from spirosuccinimides and spirohydantoins, Bioorg. Med. Chem. 18 (2010) 6134–6142.
[20] L.K. Abdulrahman, M.M. Al-Mously, M.L. Al-Mosuli, K.K. Al-Azzawii, The biological activity of 5,5’-imidazolidine-2,4-dione derivatives, Int. J. Pharm. Pharm. Sci. 5 (2013) 494–504.
[21] C. Pedregal, G.G. Trigo, J. Eiguero, E.-J. Vincent, R. Faure, Etude de quelques derives N-3-substitues et N-l,N-3-disubstitues de la cyclohexanospirohydantoine, J. Het-ero. Chem. 21 (1984) 477–480.
[22] F. Olimpieri, M.C. Bellucci, T. Marcelli, A. Volonterio, Regioselective multicomponent sequential synthesis of hydantoins, Org. Biomol. Chem. 10 (2012) 9538–9555.
[23] H.P. Rang, M.M. Dale, J.M. Ritter, P.K. Moore, Farma-kologija, 5. izdanje (urednik srpskog izdanja Todorović, Z.), Data status, Beograd, 2005.
[24] N. Trišović, N. Valentić, G. Ušćumlić, Solvent effects on the structure-property relationship of anticonvulsant hydantoin derivatives: A solvatochromic analysis, Chem. Cent. J. 5 (2011) 1–11.
[25] N. Trišović, T. Timić, J. Divljaković, J. Rogan, D. Poleti, M. Savić, G. Ušćumlić, Synthesis, structural and biological characterization of 5-phenylhydantoin derivatives as potential anticonvulsant agents, Monatsh. Chem. 143 (2012) 1451–1457.
[26] T. Đaković-Sekulić, A. Mandić, N. Trišović, G. Ušćumlić, Structure-Retention Relationship Strudy of HPLC Data of Antiepileptic Hydantoin Analogs, Curr. Comput. Aided Drug Des. 8 (2012) 3–9.
[27] T. Đaković-Sekulić, A. Smolinski, N. Trišović, G. Ušćumlić, Multivariate evaluation of the correlation between retention data and molecular descriptions of antiepic-leptic hydantoin analogs, J. Chemometr. 26 (2012) 95– –107.
[28] T. Đaković-Sekulić, Z. Lozanov-Cvetković, A. Mandić, G. Ušćumlić, S. Keleman, Quantitative-Structure-Retention Relationship Study of Some 5-Substituted-5-Phenyl Hydantoins, Chromatographia 73 (2011) 51–57.
[29] N. Trišović, N. Valentić, M. Erović, T. Đaković-Sekulić, G. Ušćumlić, I. Juranić, Synthesis, structure and solvato-
A.M. LAZIĆ i sar.: BIOLOŠKI AKTIVNI DERIVATi SPIROHIDANTOINA Hem. ind. 70 (2) 177–199 (2016)
197
chromic properties of pharmacologically active 5-sub-stituted-5-phenylhydantoins, Monatsh. Chem. 142 (2011) 1227–1234.
[30] G.M. Cooper, Elements of human cancer, Jones & Bartlett Learning, Boston, MA, 1992.
[31] Online Cancer Glossary, Amer. Cancer Society, 2015, http://www.cancer.org/cancer/cancerglossary/index (pristupljeno 21/01/2015).
[32] D.W. Kufe, R.E. Pollock, R.R. Weichselbaum R.C. Bast, T.S. Gansle, J.F. Holland, E. Frei (Eds.), Holland-Frei Cancer Medicine, 6th ed., BC Decker, Hamilton, 2003.
[33] C.V. Kavitha, M. Nambiar, P.B. Narayanaswamy, E. Thomas, U. Rathore, C.S.A. Kumar, B. Choudhary, K.S. Rangappa, S.C. Raghavan, Propyl-2-(8-(3,4-difluoro-benzyl)-2’,5’-dioxo-8-azaspiro[bicyclo[3.2.1]octane-3,4’-imidazolidine]-1’-yl) acetate induces apoptosis in human leukemia cells through mitochondrial pathway following cells cycle arrest, PLoS One 8 (2013) 1–8.
[34] Basappa, C.S. Ananda Kumar, S. Nanjunda Swamy, K. Sugahara, K.S. Rangappa, Anti-tumor and anti angio-genic activity of novel hydantoin derivatives: Inhibition of VEGF secretion in liver metastatic osteosarcoma cells, Bioorg. Med. Chem. 17 (2009) 4928–4934.
[35] G.W. Peng, V.E. Marquez, J.S. Driscoll, Potential central nervous system antitumor agents. Hydantoin deriva-tives, J. Med. Chem. 18 (1975) 846–469.
[36] Y. Sano, T. Hoshino, R. Bjerkvig, D. F. Deen, The relative resistance of non-cycling cells in 9L Multicellular sphe-roids to spirohydantoin mustard, Eur. J. Cancer Clin. Oncol. 19 (1983) 1451–1456.
[37] U. Sanyal, S. Bhattacharya, U. Sadhu, S. Dutta, H. Das, M. Ghosh, Evaluation of cypenhymustine, a new anti-cancer compound, in murine tumour models, Cancer Lett. 70 (1993) 1–6.
[38] C. Carmi, A. Cavazzoni, V. Zuliani, A. Lodola, F. Bordi, P.V. Plazzi, 5-Benzylidene hydantoins as new EGFR inhi-bitors with antiproliferative activity, Bioorg. Med. Chem. Lett. 16 (2006) 4021–4025.
[39] S. Hmuda, N. Trišović, J. Rogan, D. Poleti, Ž. Vitnik, V. Vitnik, N. Valentić, B. Božić, G. Ušćumlić, New deri-vatives of hydantoin as potential antiproliferative agents: biological and structural characterization in combination with quantum chemical calculations, Monatsh. Chem. 145 (2014) 821–833.
[40] N. Trišović, B. Božić, A. Obradović, O. Stefanović, S. Marković, Lj. Čomić, B. Božić, G. Ušćumlić, Structure-activity relationship of 3-substituted-5,5-diphenylhydan-toins as potential antiproliferative and antimicrobial agents, J. Serb. Chem. Soc. 76 (2011) 1597–1606.
[41] S. Hmuda, N. Trišović, V. Valentić, G. Ušćumlić, Solvent effects on the Structure-Property Relationship of Some Potentially Pharmacologically Active 3-(4-Substituted Benzyl)-5-Ethyl-5-Phenyl and 3-(4-Substituted Benzyl)-5,5-Dyfenilhydantoins, J. Solution. Chem. 40 (2011) 307–319.
[42] A. Obradović, J. Žižić, N. Trišović, B. Božić, G. Ušćumlić, B. Božić, S. Marković, Evaluation of antioxidative effects twelve 3-substituted-5,5-diphenylhydantoins on human
colon cancer cell line HCT-116, Turk. J. Biol. 37 (2013) 741–747.
[43] C.V. Kavitha, M. Nambiar, C.S. Ananda Kumar, B. Choud-hary, K. Muniyappa, K.S. Rangappa, S.C. Raghavan, Novel derivatives of spirohydantoin induce growth inhi-bition followed by apoptosis in leukemia cells, Biochem. Pharmacol. 77 (2009) 349–350.
[44] Diagnosis and classification of diabetes mellitus, Dia-betes Care 35 (2012) 64–71.
[45] H. Pessoa-Mahana, R. Araya-Maturana, C.B. Saitz, D.C. Pessoa-Mahana, A synthetic overview of molecules with 5-HT1A binding affinities, Mini Rev. Med. Chem. 3 (2003) 77–93.
[46] A. Zagórska, A. Czopek, M. Pawlowski, M. Dybala, A. Siwek, G. Nowak, Serotonin transporter activity of imi-dazolidine-2,4-dione and imidazo[2,1-f]purine-2,4-dione derivatives in aspect of their acid-base properties, Med. Chem. Res. 11 (2012) 3455–3459.
[47] S.J. Oh, H.J. Ha, D.Y. Chi, H.K. Lee, Serotonin receptor and transporter ligands – Current status, Curr. Med. Chem. 8 (2001) 999–1034.
[48] M.L. Lopez-Rodriguez, M.L. Rosado, B. Benhamu, M.J. Morcillo, A.M. Sanz, L. Orensanz, M.E. Eneytez, J.A. Fuentes, J. Manzanares, Synthesis and structure-activity relationships of a new model of arylpiperazines. 1. 2-[[4-(o-Methoxyphenyl)piperazin-1-yl]methyl]-1,3-dioxoper-hydroimidazo[1,5-a]pyridine: A selective 5-HT1A recep-tor agonist, J. Med. Chem. 39 (1996) 4439–4450.
[49] K. Bleicher, Y. Wutrich, M. De Boni, S. Kolczewski, T. Hoffmann, A. Sleihgt, Parallel solution- and solid-phase synthesis of spirohydantoin derivatives as neurokinin-1 receptor ligands, Bioorg. Med. Chem. Lett. 12 (2002) 2519–2522.
[50] G. Galley, T. Godel, A. Goergler, T. Hoffmann, S. Kol-czewski, S. Roever, 1,3,8-Triazaspiro[4.5]decan-4-one derivatives as neurokinin receptor antagonists, WO 0194346 (2001).
[51] J.M. Humphrey, Medicinal Chemistry of Selective Neuro-kinin-1 Antagonists, Curr. Top. Med. Chem. 3 (2003) 1423–1435.
[52] М.W. Rowbottom, T.D. Vickers, J. Tamiya, M. Zhang, B. Dyck, J. Grey, D. Schwarz, C.E. Heise, M. Hederick, J. Wen, H. Tang, H. Wang, A. Fisher, A. Aparicio, J. Saunders, V.S. Goodfellow, Synthesis and structure-activity relationships of spirohydantoin-derived small-molecule antagonists of the melanin-concentrating hormone receptor-1 (MCH-R1), Bioorg. Med. Chem. Lett. 17 (2007) 2171–2178.
[53] S. Velimirov, S. Živanov-Stakić, Farmaceutska hemija 2. deo, Farmaceutski fakultet, Beograd, 2006.
[54] P. Marinova, M. Marinov, Y. Feodorova, M. Kazakova, D. Georgiev, V. Lekova, P. Penchev, N. Stoyanov, Synthesis, cytotoxicity and antibacterial activity of 3-amino-9’-fluorenespiro-5-hydantoin, Compt. Rend. Acad. Bulg. Sci. 67 (2014) 513–518.
[55] P. Marinova, M. Marinov, Y. Feodorova, M. Kazakova, A. Slavchev, D. Blazheva, V. Sarafian, I. Nikolova, N. Sto-yanov, Synthesis, characterization, in vitro antiprolife-rative and antimicrobial study of 3-methyl-(9'-fluorene)-
A.M. LAZIĆ i sar.: BIOLOŠKI AKTIVNI DERIVATi SPIROHIDANTOINA Hem. ind. 70 (2) 177–199 (2016)
198
spiro-5-(2,4 dithiohydantoin), Sci. Technol. 4 (2014) 112–117.
[56] Medicinski leksikon (glavni urednik Kostić, A), 6. doštam-pano izdanje, Medicinska knjiga, Beograd – Zagreb, 1988.
[57] P.M. Murphy, M. Baggiolini, I.F. Charo, C.A. Hébert, R. Horuk, K. Matsushima, L.H. Miller, J.J. Oppenheim, C.A. Power, International Union of Pharmacology. XXII. Nomenclature for Chemokine Receptors 52 (2000) 145– –176.
[58] J. Ivanušić, A. Harangozo, Psihološko-psihijatrijski aspekti lijecenja boli, Medicus 23 (2014) 15–22.
[59] M. Cvijanović, S. Simić, S. Banić-Horvat, Z. Jovin, P. Slankamenac, M. Ilin, Savremeni tretman neuropatskog bola, Med. Pregl. 64 (2011) 443–447.
[60] P.J. Goadsby, R.B. Lipton, M.D. Ferrari, Migraine – Cur-rent understanding and treatment, N. Eng. J. Med. 346 (2002) 257–270.
[61] I.M. Bell, R.A. Bednar, J.F. Fay, S.N. Gallicchio, J.H. Hochman, D.R. McMasters, C. Miller-Stein, E.L. Moore, S.D. Mosser, N.T. Pudvah, A.G. Quigley, C.A. Salvatore, C.A. Stump, C.R. Theberge, B.K. Wong, C.B. Zartman, X.-F. Zhang, S.A. Kane, S.L. Graham, J.P. Vaccaa, T.M. Williams, Identification of novel, orally bioavailable spirohydantoin CGRP receptor antagonists, Bioorg. Med. Chem. Lett. 16 (2006) 6165–6169.
[62] T.M. Williams, C.A. Stump, D.N. Nguyen, A.G. Quigley, I.M. Bell, S.N. Gallicchio, C.B. Zartman, B.-L. Wan, K. Della Penna, P. Kunapuli, S.A. Kane, K.S. Koblan, S.D. Mosser, R.Z. Rutledge, C. Salvatore, J.F. Fay, J.P. Vacca, S.L. Graham, Non-peptide calcitonin gene-related pep-tide receptor antagonists from a benzodiazepinone lead, Bioorg. Med. Chem. Lett. 16 (2006) 2595–2598.
[63] L. Horoszok, C. Leung, M. Tomaszewski, C. Walpole, Use of spiro [imidazolidine-4, 3'-indole] 2, 2', 5' (lH) triones for treatment of conditions associated with vanilloid receptor 1, WO 2007/091946 Al (2007).

A.M. LAZIĆ i sar.: BIOLOŠKI AKTIVNI DERIVATi SPIROHIDANTOINA Hem. ind. 70 (2) 177–199 (2016)
199
SUMMARY SYNTHESIS, STRUCTURE AND PROPERTIES OF BIOLOGICAL ACTIVE SPIROHYDANTOIN DERIVATIVES Anita M. Lazić, Nataša V. Valentić, Nemanja P. Trišović, Slobodan D. Petrović, Gordana S. Ušćumlić
Department of Organic Chemistry, Faculty of Technology and Metallurgy, University of Belgrade, Karnegijeva 4, 11120 Belgrade, Serbia
(Review paper)
Spirohidantoins represent an pharmacologically important class of hetero-cycles since many derivatives have been recognized that display interesting activities against a wide range of biological targets. First synthesis of cycloalka-nespiro-5-hydantoins was performed by Bucherer and Lieb 1934 by the reactionof cycloalkanone, potassium cyanide and ammonium-carbonate at reflux in a mixture of ethanol and water. QSAR (Quantitative Structure–Activity Relationship) studies showed that a wide range of biological activities of spirohydantoin deri-vatives strongly depend upon their structure. This paper describes differentmethods of synthesis of spirohydantoin derivatives, their physico-chemical pro-perties and biological activity. It emphasizes the importance of cycloalkanespiro-5-hydantoins with anticonvulsant, antiproliferative, antipsychotic, antimicrobialand antiinflammatory properties as well as their importance in the treatment ofdiabetes. Numerous spirohydantoin compounds exhibit physiological activity suchas serotonin and fibrinogen antagonist, inhibitors of the glycine binding site of theNMDA receptor also, antagonist of leukocyte cell adhesion, acting as allosteric inhibitors of the protein-protein interactions. Some spirohydantoin derivativeshave been identified as antitumor agents. Their activity depends on the sub-stituent presented at position N-3 of the hydantoin ring and increases in order alkene > ester > ether. Besides that, compounds that contain two electronwithdrawing groups (e.g., fluorine or chlorine) on the third and fourth position ofthe phenyl ring are better antitumor agents than compounds with a single elec-tron withdrawing group.
Keywords: Spirohydantoins • Synthesis •Physicochemical properties • Biological activity

201
Automatski uredjaji za elektohemijsku dezinfekciju vode sa pothlađivanjem elektolita Tomislav Lj. Trišović1, Miroslav D. Spasojević2, Milica M. Gvozdenović3, Branimir Z. Jugović1, Lidija D. Rafailović4 1Institut tehničkih nauka Srpske akademije nauka i umetnosti, Beograd, Srbija 2Agronomski fakultet, Univerzitet u Kragujevcu, Čačak, Srbija 3Tehnološko-metaluruški fakultet, Univerzitet u Beogradu, Beograd, Srbija 4Center of Electrochemical Surface Technology CEST, Wr.Neustadt, Austria
Izvod Dezinfekciona sredstva za tretman voda koja se najčešće primenjuju zasnivaju se na hloru ijedinjenjima hlora. Sva jedinjenja hlora se tokom skladištenja raspadaju i gube punu efikas-nost u procesu dezinfekcije. Osim razgranje, dodatni problemi su transport, skladištenje i rukovanje ovim hemikalijama. U svetu se poslednjih godina dosta radi na razvoju in situuređaja za proizvodnju jedinjenja hlora, posebno uređaja razvijenim da in situ proizvode hlor-dioksid ili natrijum-hipohlorit. Najjednostavniji uređaji za dobijanje hipohlorita se sas-toje od izvora jednosmerne struje, elektolizera, rezervoara razblaženog rastvora natrijum-hlorida i sistema za doziranje rastvora. Projektovanje samog uređaja podrazumeva odre-đivanje i održavanje optimalnih parametara za elektrohemijsku sintezu u samom elektro-lizeru tokom kontinualne proizvodnje. Komercijalni aspekt izrade uređaja podrazumevaoptimizaciju sklopa sa aspekta odnosa cene, kvaliteta i efikasnosti u cilju konkurentnostiuređaja na tržištu. Cilj rada je bio da se dodatno razvije elektohemijski uređaj koji proizvodi hipohlorit na osnovu novog tehnološkog projekta koji podrazumeva i ugradnju novihkomercijalnih komponenti koje su sastavni delovi kompletnog uređaja. Ovakav uređaj jeispitivan u ekstremnim uslovima eksploatacije (temperatura ulazne vode preko 20 °C, sobna temperatura preko 38 °C i vlažnosti vlazduha od 90%), što je uslov za njegovu uspe-šnu komercijalizaciju. Rezultati dobijeni u takvim uslovima pokazuju da je moguće dobitineophodnu koncentraciju hipohlorita u izlaznom rastvoru od 0,85%.
Ključne reči: dezinfekcija, elektohlorinatori, aktivan hlor, elektohemijski tretman vode.
STRUČNI RAD
UDK 628.166:544.6:546.13
Hem. Ind. 70 (2) 201–207 (2016)
doi: 10.2298/HEMIND140822026T
Dostupno na Internetu sa adrese časopisa: http://www.ache.org.rs/HI/
Postupak dezinfekcije pomoću aktivnog hlora (dinamička smeša hipohloraste kiseline i natrijum-hipo-hlorita) proizvedenog elektrolizom 3% rastvora NaCl na mestu upotrebe je pogodniji od ostalih postupaka dezinfekcije vode, ne samo sa aspekta ekonomske isplativosti i efikasnosti, već i sa ekološkog aspekta. Uređaji koji proizvode aktivan hlor procesom elektro-lize su razvijani u poslednjih dvadesetak godina, posebno od 1998. Godine, kada je Evropska zajednica donela zakonsku zabranu transporta gasovitog i tečnog hlora. Iz ovog razloga će sadašnji konvencionalni postupak upotrebe hlora morati da se ukine i u Srbiji. Elektroliza ne zahteva posebne mere zaštite, a efikas-nost nastalog natrijum-hipohlorita je jednaka ili bolja od učinka gasovitog hlora. Prema proračunima, sam postupak je, iako zahteva konstrukciju i izradu elektro-lizera, dugoročno gledano isplativiji, i u smislu početne investicije kao i zbog troškova kontinualne eksploa-
Prepiska: T.Lj. Trišović, Institut tehničkih nauka Srpske akademije nauka i umetnosti, Knez Mihajlova 35/4, 11000 Beograd, Srbija. E-pošta: [email protected] Rad primljen: 22. avgust, 2014 Rad prihvaćen: 5. maj, 2011
tacije, od konvecionalnog postupka hlorisanja koji se trenutno koristi kod nas. Ovi elektrolizeri se, u zavis-nosti od konstrukcionih zahteva, mogu koristiti u jav-nim i privatnim vodovodima, bazenima za rekreaciju i za industrijske potrebe.
Proizvodnja „hlora“ na mestu korišćenja predstavlja najjeftiniju, pouzdanu i sigurnu alternativu postojećim sredstvima za dezinfekciju. Poznato je nekoliko kons-trukcija elektolizera [1–4] za in situ proizvodnju aktiv-nog hlora, kao što su: protočna, šaržna i recirkulaciona. Postoje i rešenja uređaja sa lagerovanjem dobijenog proizvoda – aktivnog hlora, i bez njega. Primena ovih uređaja zavisi od zahteva mesta, kapaciteta i tehno- -ekonomske analize isplativosti svakog uređaja ovog tipa. Generalno se može konstatovati da, ukoliko je potrebno koristiti uređaje manjeg kapaciteta, konstruk-cija zahteva uređaje protočnog tipa sa nižim nivoom automatike i bez lagerovanja dobijenog proizvoda jer su takvi uređaji jeftiniji i mogu se lakše komercijali-zovati.
Cilj rada je da se unapredi uređaj za proizvodnju natrujum-hipohlorita jednostavne konstrukcije sa što manje merno-regulacionih komponenata, ali tako da se ne ugrozi njegova funkcionalnost, pouzdanost i eks-

T.Lj. TRIŠOVIĆ i sar.: AUTOMATSKI UREDJAJI ZA ELEKTOHEMIJSKU DEZINFEKCIJU VODE Hem. ind. 70 (2) 201–207 (2016)
202
ploatacioni vek. U svetu postoje rešenja za proizvodnju natrijum-hipohlorita elektolizom razblaženih rastvora hlorida u standardnom elektolizeru sa visokim nivoom automatike, kao i membranskom elektolizom kao naj-složeniji uređaji. Najjeftinija, i sa aspekta bezbednosti najprihvatljivija za potrošačko tržište, je elektoliza raz-blaženih rastvora hlorida sa standardnim elektolize-rima. Iz ovog razloga je odlučeno da se projektuje nova konstrukcija uređaja sa elektolizom razblaženih ras-tvora hlorida sa standardnim elektolizerom.
Uređaj se sastoji iz nekoliko desetina komponenata (elektodni materijali, releji, programabilni logički kontroleri, strujna napajanja, senzorski elementi, pre-tvarači, rashladni sistemi, izmenjivači toplote, dozirni uređaji, itd.) koje se mogu pronaći na tržištu. Proizvo-đači ovih komponenata stalno unapređuju svoje stare i nude nove proizvode. U tom smislu neophodna je stalno osvežavanje uređaja sa novim komponentama i konstruisanje savremenijih uređaja. Pored izbora kom-ponenti isto tako je važno i konstruktorsko rešenje koje će pored jednostavnosti kostrukcije biti pouzdano i konkurentno na tržištu. S obzirom na to da je cena instalacije izmenjivača toplote uz elektolizer i cena ure-đaja za klimatizaciju prostora visoka, ideja je da se u konstruisanju novog uređaja ova komponenta uređaja zameni sa jednostavnim rashladnim uređajem sa koak-sijalnim izmenjivačem toplote koji ima podhlađuje ras-tvor neposredno na ulasku u sam elektolizer. Ovo kon-stukciono rešenje omogućilo bi da se uređaj instalira u neklimatizovanim prostorijama a da se ne odigrava termohemijska reakcija (temperature iznad 38 °C) pre-vođenja hipohlorita u hlorat.
EKSPERIMENTALNI DEO
Naše konstrukciono rešenje se sastoji od nekoliko celina: elektolizer, podhlađivač, elektoormar sa isprav-ljačkom stanicom i automatikom, dozirni sistem, rezer-voar kuhinjske soli, rezervoar hipohlorita, pomoćna posuda sa omekšanom vodom, ventilacioni sistem i uređaj za hemijsku pripremu vode. Blok shema uređaja je data na slici 1. Omekšana voda i zasićen rastvor NaCl se mešaju u odnosu 10:1 tako da se kontinualno pravi 3% rastvor. Takav rastvor se neposredno pred ulazak u elektolizer podhlađuje u koaksijalnom izmenjivaču do temperature od oko 5 °C. U elektolizeru se kuhinjska so, tj. hloridi, na anodi oksiduju, hidrolizuju u natrijum-hipohlorit, dok se na katodi redukuje vodai izdvaja gasoviti vodonik. Oba proizvoda gravitacionim struja-njem ulaze u rezervoar sa hipohloritom. Na vrhu rezer-voara, u praznoj zoni, nalazi se ejektor koji, uz pomoć ventilatora, pravi podpritisak u rezervoaru sa hipohlo-ritom sa ciljem da se odstrani gasoviti vodonik iz rezer-voara. Razblaženi rastvor aktivnog hlora se pomoću dozirnog sistema dozira iz rezervoara u cevovod u koli-čini neophodnoj da je ostvari proces dezinfekcije vode (najčešće 1 mg aktivnog hlora po litru vode). Ispitivanja uređaja su obuhvatila funkcionalnost pojedinih kompo-nenata kao i funkcionalnost uređaja za in situ dezin-fekciju aktivnim hlorom. Glavni cilj je bio da se ispita rad elektolizera u smislu dobijanja najvećeg iskorišćenja u najekstremnijim uslovima povišene temperature i vlage. U slučaju porasta temperature rastvora preko 38
°C dolazi do neželjene reakcije prelaska natrijum-hipo-hlorita u hlorat. Vlaga nepovoljno utiče na vek svih električnih komponenata. Iz tih razloga, ispitivanja su izvršena u uslovima povišene sobne temperature, 38
Slika 1. Blok shema uređaja za kontinualnu proizvodnju natrijum-hipohlorita sa pothlađivanjem elektolita. Figure 1. Block diagram of the device for the continuous production of active chlorine with cooling of the electrolyte.
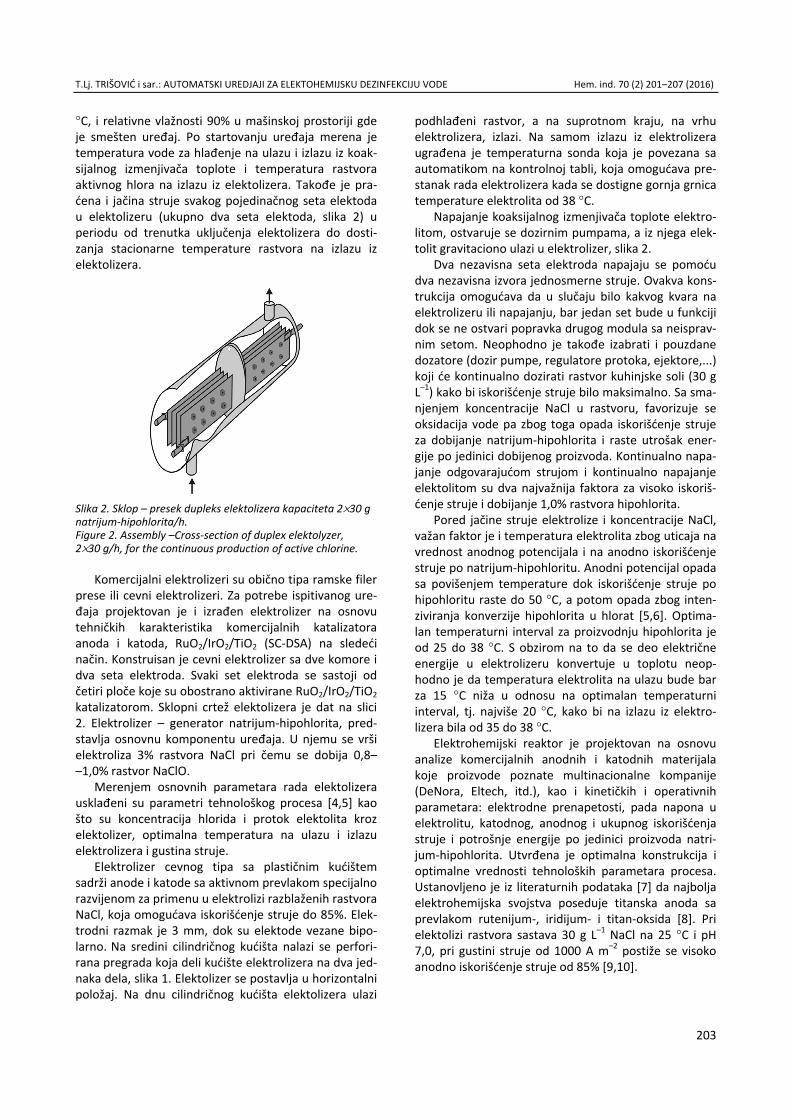
T.Lj. TRIŠOVIĆ i sar.: AUTOMATSKI UREDJAJI ZA ELEKTOHEMIJSKU DEZINFEKCIJU VODE Hem. ind. 70 (2) 201–207 (2016)
203
°C, i relativne vlažnosti 90% u mašinskoj prostoriji gde je smešten uređaj. Po startovanju uređaja merena je temperatura vode za hlađenje na ulazu i izlazu iz koak-sijalnog izmenjivača toplote i temperatura rastvora aktivnog hlora na izlazu iz elektolizera. Takođe je pra-ćena i jačina struje svakog pojedinačnog seta elektoda u elektolizeru (ukupno dva seta elektoda, slika 2) u periodu od trenutka uključenja elektolizera do dosti-zanja stacionarne temperature rastvora na izlazu iz elektolizera.
Slika 2. Sklop – presek dupleks elektolizera kapaciteta 2×30 g natrijum-hipohlorita/h. Figure 2. Assembly –Cross-section of duplex elektolyzer, 2×30 g/h, for the continuous production of active chlorine.
Komercijalni elektrolizeri su obično tipa ramske filer prese ili cevni elektrolizeri. Za potrebe ispitivanog ure-đaja projektovan je i izrađen elektrolizer na osnovu tehničkih karakteristika komercijalnih katalizatora anoda i katoda, RuO2/IrO2/TiO2 (SC-DSA) na sledeći način. Konstruisan je cevni elektrolizer sa dve komore i dva seta elektroda. Svaki set elektroda se sastoji od četiri ploče koje su obostrano aktivirane RuO2/IrO2/TiO2 katalizatorom. Sklopni crtež elektolizera je dat na slici 2. Elektrolizer – generator natrijum-hipohlorita, pred-stavlja osnovnu komponentu uređaja. U njemu se vrši elektroliza 3% rastvora NaCl pri čemu se dobija 0,8– –1,0% rastvor NaClO.
Merenjem osnovnih parametara rada elektolizera usklađeni su parametri tehnološkog procesa [4,5] kao što su koncentracija hlorida i protok elektolita kroz elektolizer, optimalna temperatura na ulazu i izlazu elektrolizera i gustina struje.
Elektrolizer cevnog tipa sa plastičnim kućištem sadrži anode i katode sa aktivnom prevlakom specijalno razvijenom za primenu u elektrolizi razblaženih rastvora NaCl, koja omogućava iskorišćenje struje do 85%. Elek-trodni razmak je 3 mm, dok su elektode vezane bipo-larno. Na sredini cilindričnog kućišta nalazi se perfori-rana pregrada koja deli kućište elektrolizera na dva jed-naka dela, slika 1. Elektolizer se postavlja u horizontalni položaj. Na dnu cilindričnog kućišta elektolizera ulazi
podhlađeni rastvor, a na suprotnom kraju, na vrhu elektrolizera, izlazi. Na samom izlazu iz elektrolizera ugrađena je temperaturna sonda koja je povezana sa automatikom na kontrolnoj tabli, koja omogućava pre-stanak rada elektrolizera kada se dostigne gornja grnica temperature elektrolita od 38 °C.
Napajanje koaksijalnog izmenjivača toplote elektro-litom, ostvaruje se dozirnim pumpama, a iz njega elek-tolit gravitaciono ulazi u elektrolizer, slika 2.
Dva nezavisna seta elektroda napajaju se pomoću dva nezavisna izvora jednosmerne struje. Ovakva kons-trukcija omogućava da u slučaju bilo kakvog kvara na elektrolizeru ili napajanju, bar jedan set bude u funkciji dok se ne ostvari popravka drugog modula sa neisprav-nim setom. Neophodno je takođe izabrati i pouzdane dozatore (dozir pumpe, regulatore protoka, ejektore,...) koji će kontinualno dozirati rastvor kuhinjske soli (30 g L–1) kako bi iskorišćenje struje bilo maksimalno. Sa sma-njenjem koncentracije NaCl u rastvoru, favorizuje se oksidacija vode pa zbog toga opada iskorišćenje struje za dobijanje natrijum-hipohlorita i raste utrošak ener-gije po jedinici dobijenog proizvoda. Kontinualno napa-janje odgovarajućom strujom i kontinualno napajanje elektolitom su dva najvažnija faktora za visoko iskoriš-ćenje struje i dobijanje 1,0% rastvora hipohlorita.
Pored jačine struje elektrolize i koncentracije NaCl, važan faktor je i temperatura elektrolita zbog uticaja na vrednost anodnog potencijala i na anodno iskorišćenje struje po natrijum-hipohloritu. Anodni potencijal opada sa povišenjem temperature dok iskorišćenje struje po hipohloritu raste do 50 °С, a potom opada zbog inten-ziviranja konverzije hipohlorita u hlorat [5,6]. Optima-lan temperaturni interval za proizvodnju hipohlorita je od 25 do 38 °С. S obzirom na to da se deo električne energije u elektrolizeru konvertuje u toplotu neop-hodno je da temperatura elektrolita na ulazu bude bar za 15 °C niža u odnosu na optimalan temperaturni interval, tj. najviše 20 °C, kako bi na izlazu iz elektro-lizera bila od 35 do 38 °C.
Elektrohemijski reaktor je projektovan na osnovu analize komercijalnih anodnih i katodnih materijala koje proizvode poznate multinacionalne kompanije (DeNora, Eltech, itd.), kao i kinetičkih i operativnih parametara: elektrodne prenapetosti, pada napona u elektrolitu, katodnog, anodnog i ukupnog iskorišćenja struje i potrošnje energije po jedinici proizvoda natri-jum-hipohlorita. Utvrđena je optimalna konstrukcija i optimalne vrednosti tehnoloških parametara procesa. Ustanovljeno je iz literaturnih podataka [7] da najbolja elektrohemijska svojstva poseduje titanska anoda sa prevlakom rutenijum-, iridijum- i titan-oksida [8]. Pri elektolizi rastvora sastava 30 g L–1 NaCl na 25 °С i pH 7,0, pri gustini struje od 1000 A m–2 postiže se visoko anodno iskorišćenje struje od 85% [9,10].
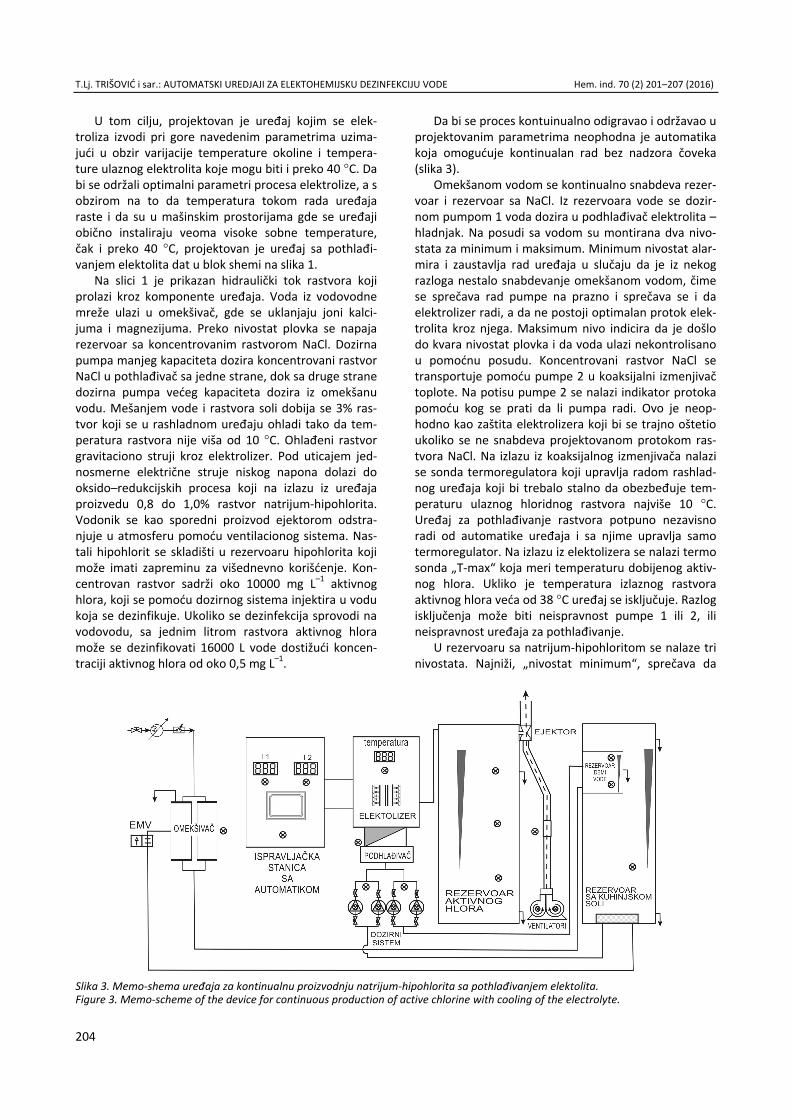
T.Lj. TRIŠOVIĆ i sar.: AUTOMATSKI UREDJAJI ZA ELEKTOHEMIJSKU DEZINFEKCIJU VODE Hem. ind. 70 (2) 201–207 (2016)
204
U tom cilju, projektovan je uređaj kojim se elek-troliza izvodi pri gore navedenim parametrima uzima-jući u obzir varijacije temperature okoline i tempera-ture ulaznog elektrolita koje mogu biti i preko 40 °C. Da bi se održali optimalni parametri procesa elektrolize, a s obzirom na to da temperatura tokom rada uređaja raste i da su u mašinskim prostorijama gde se uređaji obično instaliraju veoma visoke sobne temperature, čak i preko 40 °C, projektovan je uređaj sa pothlađi-vanjem elektolita dat u blok shemi na slika 1.
Na slici 1 je prikazan hidraulički tok rastvora koji prolazi kroz komponente uređaja. Voda iz vodovodne mreže ulazi u omekšivač, gde se uklanjaju joni kalci-juma i magnezijuma. Preko nivostat plovka se napaja rezervoar sa koncentrovanim rastvorom NaCl. Dozirna pumpa manjeg kapaciteta dozira koncentrovani rastvor NaCl u pothlađivač sa jedne strane, dok sa druge strane dozirna pumpa većeg kapaciteta dozira iz omekšanu vodu. Mešanjem vode i rastvora soli dobija se 3% ras-tvor koji se u rashladnom uređaju ohladi tako da tem-peratura rastvora nije viša od 10 °C. Ohlađeni rastvor gravitaciono struji kroz elektrolizer. Pod uticajem jed-nosmerne električne struje niskog napona dolazi do oksido–redukcijskih procesa koji na izlazu iz uređaja proizvedu 0,8 do 1,0% rastvor natrijum-hipohlorita. Vodonik se kao sporedni proizvod ejektorom odstra-njuje u atmosferu pomoću ventilacionog sistema. Nas-tali hipohlorit se skladišti u rezervoaru hipohlorita koji može imati zapreminu za višednevno korišćenje. Kon-centrovan rastvor sadrži oko 10000 mg L–1 aktivnog hlora, koji se pomoću dozirnog sistema injektira u vodu koja se dezinfikuje. Ukoliko se dezinfekcija sprovodi na vodovodu, sa jednim litrom rastvora aktivnog hlora može se dezinfikovati 16000 L vode dostižući koncen-traciji aktivnog hlora od oko 0,5 mg L–1.
Da bi se proces kontuinualno odigravao i održavao u projektovanim parametrima neophodna je automatika koja omogućuje kontinualan rad bez nadzora čoveka (slika 3).
Omekšanom vodom se kontinualno snabdeva rezer-voar i rezervoar sa NaCl. Iz rezervoara vode se dozir-nom pumpom 1 voda dozira u podhlađivač elektrolita – hladnjak. Na posudi sa vodom su montirana dva nivo-stata za minimum i maksimum. Minimum nivostat alar-mira i zaustavlja rad uređaja u slučaju da je iz nekog razloga nestalo snabdevanje omekšanom vodom, čime se sprečava rad pumpe na prazno i sprečava se i da elektrolizer radi, a da ne postoji optimalan protok elek-trolita kroz njega. Maksimum nivo indicira da je došlo do kvara nivostat plovka i da voda ulazi nekontrolisano u pomoćnu posudu. Koncentrovani rastvor NaCl se transportuje pomoću pumpe 2 u koaksijalni izmenjivač toplote. Na potisu pumpe 2 se nalazi indikator protoka pomoću kog se prati da li pumpa radi. Ovo je neop-hodno kao zaštita elektrolizera koji bi se trajno oštetio ukoliko se ne snabdeva projektovanom protokom ras-tvora NaCl. Na izlazu iz koaksijalnog izmenjivača nalazi se sonda termoregulatora koji upravlja radom rashlad-nog uređaja koji bi trebalo stalno da obezbeđuje tem-peraturu ulaznog hloridnog rastvora najviše 10 °C. Uređaj za pothlađivanje rastvora potpuno nezavisno radi od automatike uređaja i sa njime upravlja samo termoregulator. Na izlazu iz elektolizera se nalazi termo sonda „T-max“ koja meri temperaturu dobijenog aktiv-nog hlora. Ukliko je temperatura izlaznog rastvora aktivnog hlora veća od 38 °C uređaj se isključuje. Razlog isključenja može biti neispravnost pumpe 1 ili 2, ili neispravnost uređaja za pothlađivanje.
U rezervoaru sa natrijum-hipohloritom se nalaze tri nivostata. Najniži, „nivostat minimum“, sprečava da
Slika 3. Memo-shema uređaja za kontinualnu proizvodnju natrijum-hipohlorita sa pothlađivanjem elektolita. Figure 3. Memo-scheme of the device for continuous production of active chlorine with cooling of the electrolyte.

T.Lj. TRIŠOVIĆ i sar.: AUTOMATSKI UREDJAJI ZA ELEKTOHEMIJSKU DEZINFEKCIJU VODE Hem. ind. 70 (2) 201–207 (2016)
205
dozirna pumpa 3 koja dozira natrijum-hipohlorit u vodovod radi “na suvo”. Ovo je slučaj ekstremno velike potrošnje kada uređaj ne može da proizvede dovoljno natrijum-hipohlorita. Srednji, „nivostat startni mini-mum“, uključuje uređaj sve dok se nivo natriujum-hipo-hlorita u rezervoaru aktivnog hlora ne podigne do nivoa „zaustavni maksimum“ kada se uređaj isključuje.
Sam elektrolizer i rezervoar natriujum-hipohlorita se održavaju pod blagim podpritiskom zahvaljujući ven-tilacionom sistemu sa ejektorom. Ventilacioni sistem poseduje indikator protoka vazduha. U slučaju da nema protoka vazduha kroz ventilacioni vod, vodonik se ne odstranjuje u dovoljnoj meri pa se u tom slučaju uređaj isključuje i ulazi se u „alarmno stanje 2“ (isključuje se samo proizvodnja natrijum-hipohlorita dok se njegovo doziranje nesmetano obavlja).
Proizvedeni natrijum-hipohlorit se iz rezervoara aktivnog hlora transportuje dozirnom membranskom pumpom 3 i ubrizgava u vodovodnu cev. Kontrola nivoa rezidualnog hlora se obavlja pomoću redoks elektrode i prikazuje na displeju kontrolera koji upravlja radom dozirne pumpe na osnovu podešene gornje i donje vrednosti redoks potencijala.
Dva nezavisna seta elektroda elektrolizera napajaju se iz dva nezavisna izvora struje tipa SPS (prekidački izvor jednosmerne struje) sa strujom od 14 A pri naponu od oko 12 V. Indikacija rada svakog napajanja pa time i elektrolizera se prati na digitalnim ampermet-rima koji pokazuju trenutnu vrednost jačine struje.
Kompletno automatsko vođenje procesa rada ure-đaja koordinira programabilni logički kontroler PLC koji je programiran da održi proces elektrolize i zaštiti rad svake komponente uređaja. Zahvaljujući ovim kon-strukcijama, temperaturni režim rada uređaja je takav da se ne dostiže kritična temperatura elektrolita na izlazu od preko 38 °C.
REZULTATI I DUSKUSIJA
Uređaj za kontinualnu proizvodnju natrijum-hipo-hlorita sa pothlađivanjem elektolita je projektovan i konstruisan sa novim komponentama tako da je nje-gova cena znatno niža od uređaja koji se pojavljuju na našem tržištu. Pomenuti uređaj je testiran u mašinskoj prostoriji gde se nalazi i ostala oprema za održavanje vode u bazenu (toplotne pumpe, izmenjivači toplote, cirkulacione pumpe i filtri). U mašinskoj prostoriji se posle nekoliko dana rada kompletne opreme uspostavila stacionarna temperatura od 38 °C i rela-tivna vlažnost od 86%. U takvim, veoma nepovoljnim uslovima za uređaj za kontinualnu proizvodnju natri-jum-hipohlorita, startovan je sam uređaj sa pothlađi-vanjem elektrolita pod pomenutim eksploatacionim uslovima: i ulaznom temperaturom omekšane vode iz vodovodne mreže od 24 °C. Praćena je temperatura rastvora aktivnog hlora neposredno na izlasku iz elek-
trolizera tokom vremena. Maksimalna temperatura izlaznog rastvora natrijum-hipohlorita bila je 35,3 °C. Dobijeni rezultati su prikazani na slici 4.
Slika 4. Zavisnost temperature izlaznog elektolita od vremena pri konstantnoj temperaturi u mašinskoj prostoriji od 36 °C i temperaturi ulazne vode od 24 °C. Figure 4. Time dependence of outlet electrolyte temperature at constant room temperature of 36 °C and inlet water temperature of 24 °C.
Kao što se sa dijagrama na slici 4 može videti, sta-cionarno stanje temperature se uspostavljanja posle 40 min. Temperatura ne prelazi 36 °C što je u okviru opti-malnih parametara sinteze i lagerovanja aktivnog hlora. Ovo znači da i u najnepovoljnijim uslovima elektro-hemijske sinteze, povećane temperature okoline i ulaznog elektrolita i vlažnosti vazduha, temperatura izlaznog rastvora aktivnog hlora na izlazu iz uređaja ne prelazi kritičnu temperaturu od 38 °C. Ukoliko se u mašinskoj prostoriji uvede bilo kakvo provetravanje i snizi temperatura i vlažnost vazduha, uslovi za rad uređaja za kontinualnu proizvodnju aktivnog hlora sa pothlađivanjem elektolita će biti još bolji.
Na osnovu dosadašnjih istraživanja [7–9] i ovde navedenih, osnovne prednosti korišenja uređaja za in situ dobijanje aktivnog hlora su sledeci: bezbedan rad za ljude i okolinu tokom proizvodnje; smanjeni troškovi proizvodnje i jednostavno održavanje; zadovoljeni su svi uslovi zdravstvenog i sigurnosnog zakonodavstva; poboljšan je kvalitet vode; smanjene su količine spored-nih proizvoda pri dezinfekciji; rad uređaja ne zavisi od nabavke specijalnih hemikalija; najjeftiniji dezinficijens.
ZAKLJUČAK
Ispitivani uređaj za elektrohemijsku dezinfekciju vode najnovije generacije sa pothlađivanjem elektolita u koji su ugrađene najnovije komponente radi u oblasti projektovanih parametara. Novougrađene komponente uređaja (strujna napajanja, programbilni logički kontro-leri, senzorski elementi kao i samo konstruktorsko re-
T.Lj. TRIŠOVIĆ i sar.: AUTOMATSKI UREDJAJI ZA ELEKTOHEMIJSKU DEZINFEKCIJU VODE Hem. ind. 70 (2) 201–207 (2016)
206
šenje) omogućuju, pored pouzdane funkcionalnosti, i nižu cenu uređaja od sličnih dosadašnjih (cena je niža oko 20%). Prema proračunima, dobijeni proizvod je jeftiniji od gasovitog hlora kako u početnoj investiciji tako i u eksploataciji. Dobijeni natrijum-hipohlorit po svojim karakteristikama može biti efikasna alternativa sredstvima za dezinfekciju na bazi hlora ili hlor-diok-sida. Mogućnost proizvodnje natrijum-hipohlorita „in situ” elektrolizom rastvora NaCl, efikasnost u uklanja-nju patogenih mikroorganizama, niski stepen sigurnos-nih mera i niska cena troškova proizvodnje predstav-ljaju glavne prednosti. Elektroliza ne zahteva posebne mere zaštite, a efikasnost nastalog hipohlorita je jed-naka ili bolja od efikasnosti gasovitog hlora. U najeks-tremnijim uslovima eksploatacije (visokih atmosferskih temperatura i/ili visokih temperatura u prostoriji gde je instaliran uređaj, kao i vlažnosti vazduha u mašinskoj prostoriji) dobija se željeni proizvod odgovarajućeg kvaliteta, prvenstveno zahvaljujući novom tehničkom rešenju uređaja sa pothlađivanjem ulaznog elektolita.
ZAHVALNICA Ovaj rad je urađen uz finansijsku pomoć Minis-
tarstva prosvete, nauke i tehnološkog razvoja Republike Srbije, projekat broj 172046.
LITERATURA
[1] D.J. Pickett, Electrochemical Reactor Design, 2nd ed., Elsevier, Amsterdam, 1979.
[2] K. Scott, Electrochemical Reaction Engineering, Acad-emic Press, London, 1991.
[3] M.D. Spasojević, N.V. Krstajić, M.M. Jakšić, Optimization of on anodic electrocatalyst: RuO2/TiO2 on titanium, J. Res. Inst. Catalysis Hokkaido Univ. 31 (1983) 77–94.
[4] N. Krstajić, V. Nakić, M. Spasojević, Hypochlorite pro-duction. I. A model of the cathodic reactions, J. Appl. Electrochem. 17 (1987) 77–81.
[5] Lj. Gajić-Krstajić, T.Lj. Trišović, N.V. Krstajić, Spectro-photometric study of the anodic corrosion of Ti/RuO2 Electrode in acid sulfate solution, Corr. Sci. 46 (2006) 65–74.
[6] M.D. Spasojević, T.Lj. Trišović, L. Ribić-Zelenović, P.M. Spasojević, Development of RuO2/TiO2 titanium anodes and a device for in situ active chlorine generation, Hem. Ind. 67 (2013) 313–321.
[7] A. Kraft, Electrochemical Water Disinfection: A Short Review, Platinum Metals Rev. 52 (2008) 177–185.
[8] N. Trišović, Lj. Gajić-Krstajić, T. Trišović, Aparat za proiz-vodnju aktivnog hlora, patent YU 716 MP (2005).
[9] T. Trišović, B. Jugović, M. Gvozdenović, N. Trišović, Uni-versal Modular Device for Electrochemical Synthesis оf the Disinfectant, J. Trends Dev. Mach. Assoc. Technol. 16 (2012) 187–190.
T.Lj. TRIŠOVIĆ i sar.: AUTOMATSKI UREDJAJI ZA ELEKTOHEMIJSKU DEZINFEKCIJU VODE Hem. ind. 70 (2) 201–207 (2016)
207
SUMMARY AUTOMATIC DEVICES FOR ELECTROCHEMICAL WATER TREATMENT WITH COOLING OF ELECTROLYTE Tomislav Lj. Trišović1, Miroslav D. Spasojević2, Milica M.Gvozdenović3, Branimir Z. Jugović1, Lidija D. Rafailović4
1Institute of Technical Sciences of SASA, Knez-Mihailova 35/IV, 11000 Belgrade, Serbia 2Faculty of agronomy Čačak, University of Kragujevac, Cara Dušana 34, 32000 Čačak, Serbia 3Faculty of Technology and Metallurgy, University of Belgrade, Karnegijeva 4, 11120 Belgrade, Serbia 4Center of Electrochemical Surface Technology CEST, Vitor Kaplan Strasse 2, 2700 Wr.Neustadt, Austria
(Professional paper)
The most common disinfectants for water treatment are based on chlorineand its compounds. Practically, water treatments with chlorine compounds haveno alternative, since they provide, in comparison to other effective processes suchas ozonization or ultraviolet irradiation, high residual disinfection capacity. Unfor-tunately, all of chlorine-based compounds for disinfection tend to degrade duringstorage, thus reducing the concentration of active chlorine. Apart from degrad-ation, additional problems are transportation, storage and handling of such haz-ardous compounds. Nowadays, a lot of attention is paid to the development ofelectrochemical devices for in situ production of chlorine dioxide or sodium hypo-chlorite as efficient disinfectants for water treatment. The most important part ofsuch a device is the electrochemical reactor. Electrochemical reactor uses external source of direct current in order to produce disinfectants in electrochemical reac-tions occurring at the electrodes. Construction of an electrochemical device forwater treatment is based on evaluation of optimal conditions for electrochemical reactions during continues production of disinfectants. The aim of this study wasto develop a low-cost electrochemical device for the production of disinfectant,active chlorine, at the place of its usage, based on newly developed technicalsolutions and newest commercial components. The projected electrochemicaldevice was constructed and mounted, and its operation was investigated. Inves-tigations involved both functionality of individual components and device in gen-eral. The major goal of these investigations was to achieve maximal efficiency inextreme condition of elevated room temperature and humidity with a noveldevice construction involving coaxial heat exchanger at the solution inlet. Roomoperation of the proposed device was investigated when relative humidity wasset to 90% and the ambient temperature of 38 °C. The obtained results in suchextreme operation conditions reveled that it was possible to obtain required con-centration of 0.85% of active chlorine with maximal temperature of outlet electrolyte of 35.3 °C, which is within the limits of optimal temperatures.
Keywords: Disinfection • Electrochlorin-ation • Active chlorine • Electrochemical treatment of water

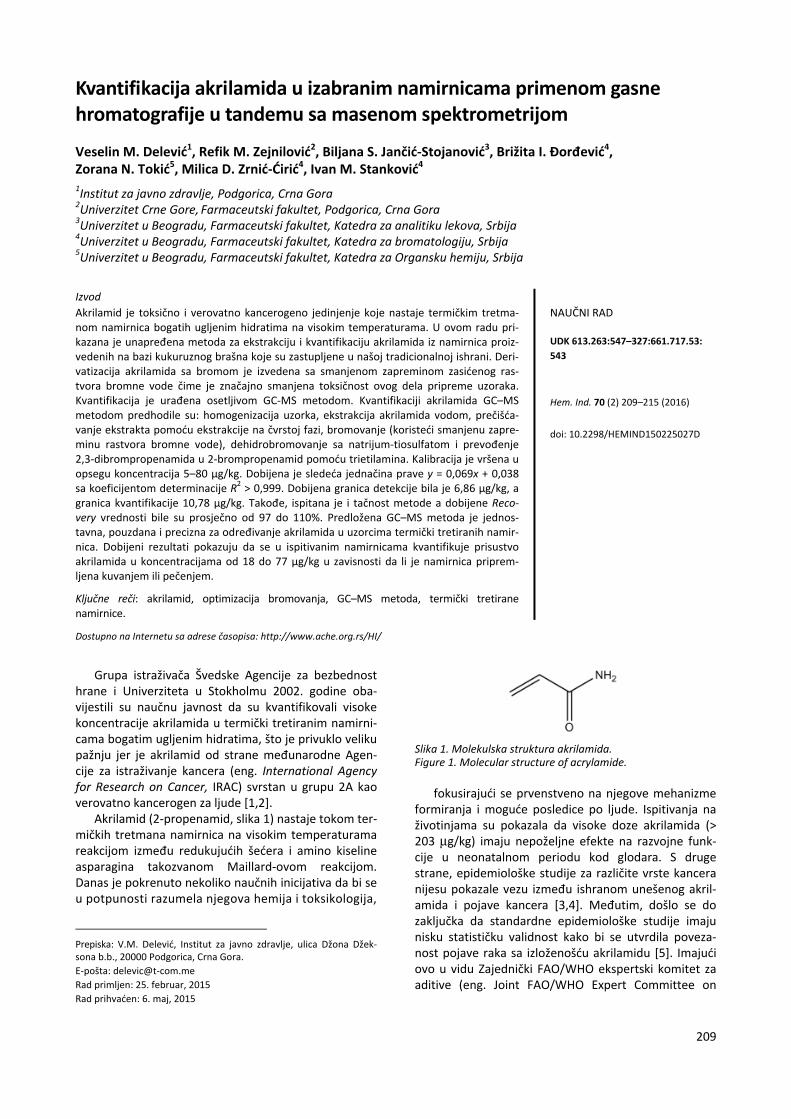
209
Kvantifikacija akrilamida u izabranim namirnicama primenom gasne hromatografije u tandemu sa masenom spektrometrijom Veselin M. Delević1, Refik M. Zejnilović2, Biljana S. Jančić-Stojanović3, Brižita I. Đorđević4, Zorana N. Tokić5, Milica D. Zrnić-Ćirić4, Ivan M. Stanković4 1Institut za javno zdravlje, Podgorica, Crna Gora 2Univerzitet Crne Gore, Farmaceutski fakultet, Podgorica, Crna Gora 3Univerzitet u Beogradu, Farmaceutski fakultet, Katedra za analitiku lekova, Srbija 4Univerzitet u Beogradu, Farmaceutski fakultet, Katedra za bromatologiju, Srbija 5Univerzitet u Beogradu, Farmaceutski fakultet, Katedra za Organsku hemiju, Srbija
Izvod Akrilamid je toksično i verovatno kancerogeno jedinjenje koje nastaje termičkim tretma-nom namirnica bogatih ugljenim hidratima na visokim temperaturama. U ovom radu pri-kazana je unapređena metoda za ekstrakciju i kvantifikaciju akrilamida iz namirnica proiz-vedenih na bazi kukuruznog brašna koje su zastupljene u našoj tradicionalnoj ishrani. Deri-vatizacija akrilamida sa bromom je izvedena sa smanjenom zapreminom zasićenog ras-tvora bromne vode čime je značajno smanjena toksičnost ovog dela pripreme uzoraka.Kvantifikacija je urađena osetljivom GC-MS metodom. Kvantifikaciji akrilamida GC–MS metodom predhodile su: homogenizacija uzorka, ekstrakcija akrilamida vodom, prečišća-vanje ekstrakta pomoću ekstrakcije na čvrstoj fazi, bromovanje (koristeći smanjenu zapre-minu rastvora bromne vode), dehidrobromovanje sa natrijum-tiosulfatom i prevođenje 2,3-dibrompropenamida u 2-brompropenamid pomoću trietilamina. Kalibracija je vršena u opsegu koncentracija 5–80 µg/kg. Dobijena je sledeća jednačina prave y = 0,069x + 0,038 sa koeficijentom determinacije R2 > 0,999. Dobijena granica detekcije bila je 6,86 µg/kg, a granica kvantifikacije 10,78 µg/kg. Takođe, ispitana je i tačnost metode a dobijene Reco-very vrednosti bile su prosječno od 97 do 110%. Predložena GC–MS metoda je jednos-tavna, pouzdana i precizna za određivanje akrilamida u uzorcima termički tretiranih namir-nica. Dobijeni rezultati pokazuju da se u ispitivanim namirnicama kvantifikuje prisustvoakrilamida u koncentracijama od 18 do 77 µg/kg u zavisnosti da li je namirnica priprem-ljena kuvanjem ili pečenjem.
Ključne reči: akrilamid, optimizacija bromovanja, GC–MS metoda, termički tretirane namirnice.
NAUČNI RAD
UDK 613.263:547–327:661.717.53: 543
Hem. Ind. 70 (2) 209–215 (2016)
doi: 10.2298/HEMIND150225027D
Dostupno na Internetu sa adrese časopisa: http://www.ache.org.rs/HI/
Grupa istraživača Švedske Agencije za bezbednost hrane i Univerziteta u Stokholmu 2002. godine oba-vijestili su naučnu javnost da su kvantifikovali visoke koncentracije akrilamida u termički tretiranim namirni-cama bogatim ugljenim hidratima, što je privuklo veliku pažnju jer je akrilamid od strane međunarodne Agen-cije za istraživanje kancera (eng. International Agency for Research on Cancer, IRAC) svrstan u grupu 2A kao verovatno kancerogen za ljude [1,2].
Akrilamid (2-propenamid, slika 1) nastaje tokom ter-mičkih tretmana namirnica na visokim temperaturama reakcijom između redukujućih šećera i amino kiseline asparagina takozvanom Maillard-ovom reakcijom. Danas je pokrenuto nekoliko naučnih inicijativa da bi se u potpunosti razumela njegova hemija i toksikologija,
Prepiska: V.M. Delević, Institut za javno zdravlje, ulica Džona Džek-sona b.b., 20000 Podgorica, Crna Gora. E-pošta: [email protected] Rad primljen: 25. februar, 2015 Rad prihvaćen: 6. maj, 2015
Slika 1. Molekulska struktura akrilamida. Figure 1. Molecular structure of acrylamide.
fokusirajući se prvenstveno na njegove mehanizme formiranja i moguće posledice po ljude. Ispitivanja na životinjama su pokazala da visoke doze akrilamida (> 203 μg/kg) imaju nepoželjne efekte na razvojne funk-cije u neonatalnom periodu kod glodara. S druge strane, epidemiološke studije za različite vrste kancera nijesu pokazale vezu između ishranom unešenog akril-amida i pojave kancera [3,4]. Međutim, došlo se do zaključka da standardne epidemiološke studije imaju nisku statističku validnost kako bi se utvrdila poveza-nost pojave raka sa izloženošću akrilamidu [5]. Imajući ovo u vidu Zajednički FAO/WHO ekspertski komitet za aditive (eng. Joint FAO/WHO Expert Committee on

V.M. DELEVIĆ i sar.: KVANTIFIKACIJA AKRILAMIDA U NAMIRNICAMA Hem. ind. 70 (2) 209–215 (2016)
210
Food Additives, JECFA) istakao je važnost dobijanja što više validnih podataka o sadržaju akrilamida u namirni-cama koje se konzumiraju u zemljama u razvoju kao vredan instrument u obavljanju procene unosa, kako bi se redukovala izloženost ljudi [6].
Akrilamid nastaje u namirnicama tokom termičkih tretmana na visokim temperaturama kao što je pečenje ili prženje u ulju. Na formiranje akrilamida u namirni-cama pored termičkih tretmana utiče i prisustvo amino kiselina (asparagina) i redukujućih šećera. Amino kise-lina asparagin je glavni prekursor za nastajanje akril-amida u prisustvu redukujućih šećera. Međutim, neke studije su pokazale da akrolein, akrilne kiseline i druge amino kiseline kao što su alanin i arginin su takođe mogući prekursori nastanka akrilamida [5].
Poslednjih deset godina u svetu se intenzivno radi na razvoju analitičkih metoda za kvantifikaciju akril-amida u različitim vrstama termički tretiranih namirnica koje su dominantno HPLC ili GC metode [9], kao i u namirnicama koje nisu termički tretirane, vodi za piće i biološkom materijalu [7,8]. Prikaz GC i HPLC metoda, kao i elektroforeckih metoda za određivanje akrilamida u različitim uzorcima dat je u preglednom radu [10]. Pored toga, opisani su i različiti postupci pripreme uzo-raka kao što su ekstrakcija sa n-propanolom [11], eks-trakcija sa n-heksanom i vodenim rastvorom natrijum- -hlorida [12], ekstrakcija na čvrstoj fazi (eng. Solid Phase Exstaction – SPE) [13,14], ekstrakcija sa meta-nolom, prečišćavanje sa rastvorom Carrez I i II [15], itd. Za kvantifikaciju akrilamida pomoću GC–MS (eng. gas chromatography–mass spectrometry) ili LC–MS-MS (eng. Liquid chromatography–tandem mass spectro-metry) metode većina istraživača predlaže pripremu uzoraka u više faza. Sve do sada publikovane GC–MS metode za određivanje akrilamida u namirnicama možemo podeliti u dve kategorije, one koje uključuju derivatizaciju i one bez primene derivatizacije. Metode za određivanje akrilamida bez derivatizacije zahtevaju dugotrajne ekstrakcije koje mogu trajati u nekim slu-čajevima i do deset dana [16]. Metode sa derivatiza-cijom imaju prednosti jer omogućavaju kvantifikaciju akrilamida i do nivoa tragova [17–19]. Međutim, deri-vatizacija bromovanjem podrazumeva upotrebu broma u laboratorijskom radu čije pare ako se udišu mogu biti opasne po analitičara, stoga, čini se da brom treba koristiti što je moguće manje u laboratorijskim ekspe-rimentima. Gasna hromatografija sa masenom spektro-metrijom (GC–MS) je jedna od najosetljivijih metoda korištenih za kvantifikaciju akrilamida u uzorcima život-nih namirnica [20].
Cilj ovog rada bio je da se unapredi GC–MS metoda za određivanje akrilamida iz termički tretiranih namir-nica. U tom cilju urađena je optimizacija postupka bro-movanja čime je potvrđeno da se sa manjim zapre-minama broma mogu dobiti tačni i precizni rezultati.
Postupak pripreme uzoraka podrazumevao je četiri faze nakon šega je primenjena GC–MS metoda. GC–MS metoda je validirana i primenjena za analizu različitih uzoraka.
EKSPERIMENTALNI DEO
Aparatura i reagensi Za određivanje akrilamida korišćen je gasni hroma-
tograf Shimadzu GC–MS model QP2010 plus (Shimadzu Inc., Koyoto, Japan), sa kapilarnom kolonom HP-5 MS (30 m×0,25 mm×0,25 µm, J&W Scientific, Folsom, CA, USA). Obrada podataka i kontrola GC–MS sistema vrše-na je pomoću softvera „Lab solution“ (Shimadzu Inc., Koyoto, Japan). Kao standard korišćen je rastvor akril-amida (čistoće > 99,8%) proizvođača Sigma-Aldrich (St. Louis, MO, USA). Kao interni standard korišćen je ras-tvor izotopa akrilamida – [13C3], koncentracije 1mg/ml u metanolu (H2
13C=13CH13CONH2) proizvođača Sigma– –Aldrich, (St. Louis, MO, USA). Organski rastvarači: n-heksan, metanol, etil-acetat, kao i kalijum-bromid, natrijum-tiosulfat, trietilamin i anhidrovani natrijum- -sulfat takođe su od proizvođača Sigma–Aldrich (St. Louis , MO, USA). Kertriđži za ekstrakciju na čvrstoj fazi (SPE) su OASIS MCX 3cc (60 mg) i tečna faza OASIS HLB 6cc (200 mg) su od proizvođača Waters Corporation (Massachusetts, USA). Kalijum-bromid i natrijum-sulfat su ižareni na 600 °C u trajanju od 6 sati pomoću peći za žarenje (Carbolite Furnaces; Chelmsford/Esser, Eng-land). Ostali reagensi su korišteni bez daljeg prečiš-ćavanja.
Priprema rastvora Osnovni standard akrilamida koncentracije 1 mg/ml
pripremljen je rastvaranjem u etil-acetatu. Radni ras-tvor pripremljen je rastvaranjem osnovnog rastvora standarda u opsegu koncentracija od 5 do 80 μg/dm3 u etil-acetatu.
Interni standard izotopa akrilamida [13C3] koncen-tracije 4 mg/dm3 dodat je ispitivanom uzorku u količini od 10 μl i dobijena je koncentracija internog standarda od 40 μg/dm3.
Postupak optimizacije zapremine bromne vode u postupku derivatizacije akrilamida
U ovoj fazi istraživanja optimizirana je potrebna količina broma za pripremu uzoraka. U cilju određivanja optimalne zapremine broma, vršeno je opterećivanje uzorka kukuruznog hleba koji je sadržao 29,5 µg/kg akrilamida sa 40 µg akrilamida koji je pripremljen sa 5 različitih zapremina bromne vode (1, 2, 5, 10 i 15 ml). Kao odgovor, praćen je prinos ekstrakcije izražen kao Recovery vrednost. Dobijeni rezultati prikazani su u tabeli 1.

A.M. LAZIĆ i sar.: BIOLOŠKI AKTIVNI DERIVATi SPIROHIDANTOINA Hem. ind. 70 (2) 209–215 (2016)
211
Postupak pripreme uzoraka Akrilamid je kvantifikovan kao derivat 2-brom-
propen amida (2-BPA) po metodi Pittet i dr. [20] i Yong i dr. [21] uz određene modifikacije koje su urađene u cilju unapređenja metode.
Prvo unapređenje jeste smanjena zapremina bromne vode u fazi bromovanja. Drugo unapređenje sastoji se u upotrebi SPE ekstrakcije umesto rastvora Carrez I i II kako je to bilo u predhodno publikovanoj metodi [20].
Kompletan postupak se sastoji iz četiri faze koje su u ovom delu detaljno opisane. Uzorci koji su analizirani bili su proizvodi na bazi kukuruznog brašna, prikupljeni od strane službe sanitarne inspekcije u okviru redovnog sanitarnog nadzora nad kuhinjama dečijih vrtića u Pod-gorici.
Faza 1. Homogenizacija i dodavanje internog stan-darda: Izmeri se 20 g dobro homogenizovanog uzorka i ostavi da bubri upijajući 200 ml dejonizovane vode (70±1 °C) u trajanju od najmanje 60 min. Smeša se ponovo dobro izhomogenizuje pomoću homogeniza-tora Ultra-turrax (IKA-T25 Basel, Switzerland). 1 g homogenizovane smeše se prenese u kivetu za centri-fugiranje, doda se 3 ml 2M NaCl i smeša se ponovo homogenizuje. Zapremina od 10 µl internog standard koncentracije 4 mg/dm3 izotopa [13C3] akrilamida doda se u smešu i smeša se homogenizuje na vorteks mik-seru (Stuart Scientific, Manchester, England) u toku 1 min. U smešu se doda 40 µg/kg odnosno 40 ng/g inter-nog standarda.
Faza 2. Prečišćavanje: Smeša koja sadrži interni standard centrifugira se na 10000 obrtaja pomoću centrifuge (Sigma, Gillingham Dorset, UK) u trajanju od 30 min. Dobijeni supernatant se profiltrira kroz stakleni filter pora 0,45µm (Witeg Labortechnik GmbH, Ger-many) kako bi se izdvojila eventualno zaostala mast. Kolone za ekstrakciju na čvrstoj fazi (HLB, MCX) kondicioniraju se najprije sa 3 ml metanola zatim sa 3 ml vode. Nakon kondicioniranja, na kolonu se nanosi uzorak filtrata, a zatim se vrši eluiranje sa 50 ml dejoni-zovane vode. U eluat se zatim doda 7,5 g kalijum-bro-mida čija je pH vrednost podešena na pH 2,0 doda-vanjem oko 15 kapi 47% bromovodonične kiseline.
Faza 3. Bromovanje: Ekstraktima uzoraka se uz mešanje doda po 2 ml zasićenog rastvora bromne vode
(1,6 vol.%). Uzorci se čuvaju na 0 °C u trajanju od 24 h kako bi se završila reakcija bromovanja.
Faza 4. Finalno prečišćavanje za GC–MS određiva-nje: Nakon završetka reakcije bromovanja višak broma ukloni se dodavanjem 5 kapi 1 M natrijum-tiosulfata dok nestane žuta boja. Zatim se doda po 10 g anhidro-vanog natrijum-sulfata i smeša se dobro izmeša. Smeša se prenese u levak za odvajanje zapremine 250 ml, doda se 20 ml smeše etil-acetat/heksan (4:1, V/V) i dobro se izmeša. Organska faza se zatim prenese u kivetu za centrifugiranje u kojoj je odmereno 4 g anhid-rovanog natrijum-sulfata. Ovaj korak se ponovi dva puta sa po 20 ml smeše etil-acetat/heksan (4:1, V/V). Smeša se centrifugira i dekantuje kroz stakleni filter papir i upari do suva pomoću rotacionog vakum upari-vača (Rotavapor R-124; Buchi, Switzerland). Suvi osta-tak se rastvori u 50 µl trietilamina i 450 µl etil-acetata. Pripremljeni ekstrakti se čuvaju u zamrzivaču na –20 °C do GC–MS analize.
Postupak GC–MS analize Nakon stabilizovanja GC–MS sistema uradi se kalib-
racija. Svi potrebni parametri (vremenske funkcije, izbor metode izračunavanja, atenuacije i dr.) unesu se softverskom metodom koja omogućava praćenje raz-dvajanja akrilamida. Hromatografski uslovi su navedeni u tabeli 2.
Tabela 2. Uslovi hromatografskog postupka Table 2. Terms chromatographic procedure
Mobilna faza He, 99,999% (1,6 ml/min) Temperaturni program 50–240 °C (5 °C/min); 8 min Temperatura injektora 200 °C, splitles mod
Statistička analiza Za statističku obradu podataka korišćeni su prog-
rami Microsoft Office Excel i Statistica. Primijenjene su regresiona i korelaciona analiza.
REZULTATI I DISKUSIJA
Za određivanje sadržaja akrilamida u termički treti-ranim uzorcima proizvedenim na bazi kukuruznog brašna primenjena je GC–MS metoda. Kao što je nave-deno u uvodu, cilj je bio da se razvije metoda koja će
Tabela 1. Recovery vrednost za akrilamid u uzorku pripremljenom sa 5 različitih zapremina bromne vode Table 1. Recovery value for acrylamide in a specimen prepared from 5 different brominated flame-volume water
Zapremina bromne vode, mL Opseg Recovery vrijednosti, % Srednja vrijednost za Recovery ± SD, %15 103,8–105,7 105,3±1,42 10 99,1–104,1 101,6±1,70 5 93,1–106,3 98,1±4,90 2 83,5–99,1 89,2±6,19 1 53,1–92,5 70,6±13,7
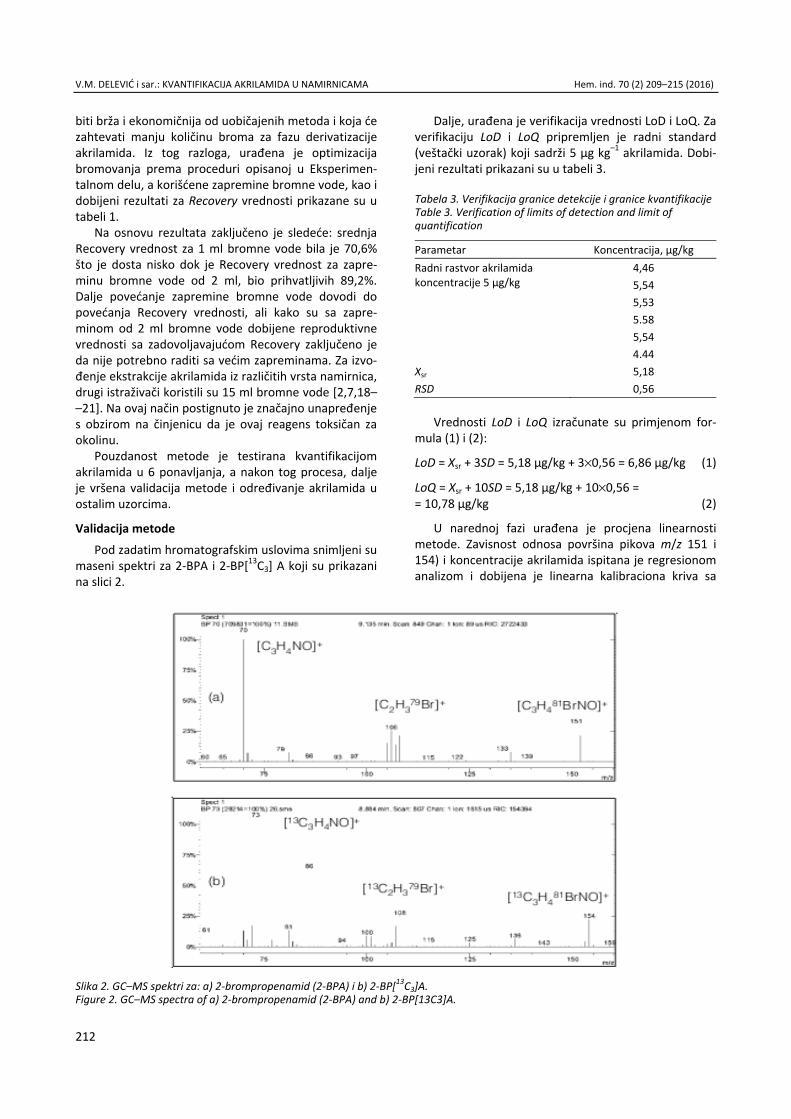
V.M. DELEVIĆ i sar.: KVANTIFIKACIJA AKRILAMIDA U NAMIRNICAMA Hem. ind. 70 (2) 209–215 (2016)
212
biti brža i ekonomičnija od uobičajenih metoda i koja će zahtevati manju količinu broma za fazu derivatizacije akrilamida. Iz tog razloga, urađena je optimizacija bromovanja prema proceduri opisanoj u Eksperimen-talnom delu, a korišćene zapremine bromne vode, kao i dobijeni rezultati za Recovery vrednosti prikazane su u tabeli 1.
Na osnovu rezultata zaključeno je sledeće: srednja Recovery vrednost za 1 ml bromne vode bila je 70,6% što je dosta nisko dok je Recovery vrednost za zapre-minu bromne vode od 2 ml, bio prihvatljivih 89,2%. Dalje povećanje zapremine bromne vode dovodi do povećanja Recovery vrednosti, ali kako su sa zapre-minom od 2 ml bromne vode dobijene reproduktivne vrednosti sa zadovoljavajućom Recovery zaključeno je da nije potrebno raditi sa većim zapreminama. Za izvo-đenje ekstrakcije akrilamida iz različitih vrsta namirnica, drugi istraživači koristili su 15 ml bromne vode [2,7,18– –21]. Na ovaj način postignuto je značajno unapređenje s obzirom na činjenicu da je ovaj reagens toksičan za okolinu.
Pouzdanost metode je testirana kvantifikacijom akrilamida u 6 ponavljanja, a nakon tog procesa, dalje je vršena validacija metode i određivanje akrilamida u ostalim uzorcima.
Validacija metode Pod zadatim hromatografskim uslovima snimljeni su
maseni spektri za 2-BPA i 2-BP[13C3] A koji su prikazani na slici 2.
Dalje, urađena je verifikacija vrednosti LoD i LoQ. Za verifikaciju LoD i LoQ pripremljen je radni standard (veštački uzorak) koji sadrži 5 µg kg–1 akrilamida. Dobi-jeni rezultati prikazani su u tabeli 3.
Tabela 3. Verifikacija granice detekcije i granice kvantifikacije Table 3. Verification of limits of detection and limit of quantification
Parametar Koncentracija, µg/kg Radni rastvor akrilamida koncentracije 5 µg/kg
4,46 5,54 5,53 5.58 5,54 4.44
Xsr 5,18 RSD 0,56
Vrednosti LoD i LoQ izračunate su primjenom for-mula (1) i (2):
LoD = Xsr + 3SD = 5,18 µg/kg + 3×0,56 = 6,86 µg/kg (1)
LoQ = Xsr + 10SD = 5,18 µg/kg + 10×0,56 = = 10,78 µg/kg (2)
U narednoj fazi urađena je procjena linearnosti metode. Zavisnost odnosa površina pikova m/z 151 i 154) i koncentracije akrilamida ispitana je regresionom analizom i dobijena je linearna kalibraciona kriva sa
Slika 2. GC–MS spektri za: a) 2-brompropenamid (2-BPA) i b) 2-BP[13C3]A. Figure 2. GC–MS spectra of a) 2-brompropenamid (2-BPA) and b) 2-BP[13C3]A.

A.M. LAZIĆ i sar.: BIOLOŠKI AKTIVNI DERIVATi SPIROHIDANTOINA Hem. ind. 70 (2) 209–215 (2016)
213
koeficjentom determinacije R2 > 0,999. Kalibracija je vršena u opsegu koncentracija od 5–80 µg/kg (5, 20, 40, 60 i 80 µg/kg) i dobijena je jednačina prave: Y = 0,069x + 0,038.
Tačnost metode procenjena je na taj način što je uzorak kukuruznog hleba koji je sadržao 29,5 µg/kg akrilamida opterećen sa 10, 20 i 40 µg/kg akriamida i dobijene vrijednosti su prikazane u tabeli 4. Vrijednosti dobijene iz šest paralelno urađenih ekstarkcija kvanti-tativno su obrađene GC–MS postupkom.
Vrijednosti za Recovery dobijene za tri nivoa kon-centracija potvrđuju da je metoda tačna. Dobijeni rezultati za ispitivane parametre validacije potvrđuju pouzdanost metode pa je validirana GC–MS metoda primenjena za određivanje sadržaja akrilamida u izabra-nim namirnicama proizvedenim na bazi kukuruznog brašna kao što su kukuruzni hleb, kornfleks, palenta, projice sa sirom i projice sa sirom i spanaćem. U tabeli 5
prikazana je koncentracija akrilamida u ispitivanim namirnicama. Rezultati ispitivanja pokazuju da je akril-amid detektovan u svim uzorcima, minimalna vrednost akrilamida (18,1 µg/kg) je detektovana je kod palente, a maksimana (77,5 µg/kg) kod kornfleksa. Ove vrijednosti su značajno niže nego kod namirnica proizvedenih dominantno od pšeničnog brašna što je posledica sma-njenog sadržaja sirovih proteina u kukuruznom brašnu, pa je i mogućnost sinteze akrilamida manja.
ZAKLJUČAK
U ovom radu prikazana je GC-MS metoda za odre-đivanje sadržaja akrilamida u termički tretiranim namir-nicama. U radu je opisano unapređenje faze bromo-vanja u smislu smanjenja upotrebe reagensa koji se smatra toksičnim. Takođe, primenjena je SPE metoda u fazi pripreme uzorka čime je postupak značajno pojed-
Tabela 4. Recovery vrednost za akrilamid u opterećenim uzorcima kukuruznog hleba Table4. Recovery value for acrylamide in loaded samples cornbread
Početna konc. AA, mg/kg Dodata količna AA, mg/kg Dobijena konc. AA, mg/kg Očekivana konc. AA, mg/kg Tačnost, % 28,9 10,0 43,1 38,9 110,8 29,0 42,8 39,0 109,7 30,8 44,6 40,8 109,3 29,9 44,2 39,9 110,7 28,7 42,4 38,7 109,8 29,5 43,4 39,5 110,0 csr = 29,5 110,0 28,9 20,0 50,2 48,9 102,6 29,0 49,7 49,0 101,5 30,8 51,0 50,8 100,4 29,9 50,4 49,9 101,1 28,7 48,2 48,7 98,9 29,5 49,1 49,5 99,3 csr = 29,5 100,6 28,9 40,0 67,9 68,9 98,5 29,0 67,0 69,0 97,1 30,8 70,3 70,8 99,4 29,9 67,7 69,9 96.9 28,7 65,7 68,7 95,7 29,5 66,1 69,5 95,1 csr = 29,5 97,1
Tabela 5. Koncentracija akrilamida u ispitivanim namirnicama Table 5. The concentration of acrylamide in foods tested
Uzorak Broj uzoraka Opseg konc. akrilamida, µg kg–1 Sradnja vrijednost±SD, , µg kg–1 SD / % Kukuruzni hleb 13 26,7–31,5 27,0±1,7 1,7 Kornfleks 7 69,0–77,5 72,8±4,2 4,2 Palenta 5 18,1–23,8 20,4±1,9 1,9 Projice sa sirom i spanaćem 8 29,0–35,8 31,6±2,3 2,3 Projice sa sirom 9 27,9–35,0 31,1±2,4 2,4

V.M. DELEVIĆ i sar.: KVANTIFIKACIJA AKRILAMIDA U NAMIRNICAMA Hem. ind. 70 (2) 209–215 (2016)
214
nostavljen i veoma je prihvatljiv za praktičnu primenu. GC–MS metoda je validirana sa limitom detekcije 6,86 µg/kg čime je potvrđena i njena osetljivost. Na kraju, metoda je uspešno primenjena za ispitivanje sadržaja akrilamida u različitim uzorcima kao sto su krompir, čips, hleb, itd.
LITERATURA
[1] IARC. Monographs on the evalution of carcinogen risk to humans [serial on the Internet]. 2011. Avaliable from: http:// monographs.iarc.fr/
[2] Swedish National Food Administration (SNFA). Inform-ation about acrylamide in food Uppsala [serial on the Internet]. Avaliable from: http://www.slv.se
[3] H. Mojska, I. Gielecinska, L. Zsponar, M. Oltarzewski, Estimation of the dietary acrylamide exposure of the Polish population, Food. Chem. Toxicol. 48 (2010) 2090– –2096.
[4] Food Standards Agency. Stady of acrylamide in food [serial on the Internet], 2010, Avaliable from: http://www.food.gov.uk
[5] Scientific Committee on food. Opinon of the SCF on new findings regarding the presence of acrylamide in food [serial on the Internet]. 2010. Avaliable from: http://www.europa.eu.int
[6] FAO/WHO (Food and Agricultural Organisation/World HealthOrganization).Summary and conclusions report of the seventy-second meeting of the Joint FAO/WHO Expert Committee on Food Additives (JECFA) 1-16, 2010, Available from http://www.fao.org/ag/agn/agns/jecfa output en.Asp
[7] N. Marchettini, S. Focardi, M. Guarnieri, C. Guerranti, G.Perra, Determination of acrylamide in local and com-mercial cultivar of potatoes from biological farm, Food Chem. 136 (2013) 1426–1428.
[8] C. Laurence, E. Sune, Analytical methods used to mea-sure acrylamide concentrations in Foods, J. AOAC. Int. 88 (2005) 274–284.
[9] Y.Zhang, G. Zhang, Occurrence and analytical methods of acrylamide in heat-treated foods review and recent developments, J. Chromatogr., A 1075 (2005) 1–21.
[10] S.E. Kepekci Tekkeli, C. Onal, A. Onal, A Review of cur-rent methods for the determination of acrylamide in food products, Food. Anal. Methods. 5 (2012) 29–39.
[11] L. Dunovska, T. Cajka, J. Hajslova, K. Holadova, Direct determination of acrylamide in food by gas chroma-
tography-high-resolution time-of-flight mass spectro-metry, Anal. Chim. Acta 578 (2006) 234–240.
[12] Y.Zhang, Y. Dong, Y. Ren, Y. Zhang, Rapid determination of acrylamide contaminant in conventional fried foods by gas chromatography with electron capture detector, J. Chromatogr., A 1116 (2006) 209–216.
[13] C.M. Soares, R.C. Alves, S.Casal, M.B. Oliveira, J.O. Fer-nandes, Development and validation of a matrix solid-phase dispersion method to determine acrylamide in coffee and coffee substitutes, J. Food. Sci. 75 (2010) 57– –63.
[14] E.K. Paleologos, M.G.Kontominas, Determination of acrylamide and methacrylamide by normal phase high performance liquid chromatography and UV detection, J. Chromatogr., A 1077 (2005) 128–135.
[15] V. Gokmen, H.Z. Senyuva, J. Acar, K. Sarioglu, Deter-mination of acrylamide in potato chips and crisps by high-performance liquid chromatography, J. Chroma-togr., A 1088 (2005) 193–199.
[16] J.R. Pedersen, J.O. Olsson, Soxhlet extraction of acryl-amide from potato chips. Analyst 128 (2003) 332–334.
[17] L. Castle, M.J. Campos, J. Gilbert, Determination of acrylamide Monomer in hydroponically grown tomato fruits by capillary gas chromatography-mass spectro-metry. J. Agric. Food Chem. 54 (1991) 549–555.
[18] L. Castle, Determination of acrylamide monomer in mushrooms grown on polyacrylamide gel. J. Agric. Food Chem. 41 (1993) 1261–1263.
[19] J.S. Ahn, L. Castle, D.B. Clarke, A.S. Lloyd, M.R. Philo, D.R. Speck, Verification of findings of acrylamide in heated foods. Food Addit. Contam., A 19 (2002) 1116– –1124.
[20] A. Pittet, A. Périsset, J.M. Oberson, Trace level deter-mination of acrylamide in cereal-based foods by gas chromatography–mass spectrometry, J. Chromatogr., A 1035 (2004) 123–130.
[21] M.S. Young, K.S. Jenkins, C.R. Mallet, Solid–phase extraction and cleanup procedures for determination of acrylamide in fried potato products by liquid chroma-tography/mass spectrometry, J. AOAC Int., B 87 (2004) 961–964.
[22] Scientific Committee on food. Opinion of the SCF on new findings regarding the presence of acrylamide in food [serial on the Internet]. 2010, Avaliable from: http://www.europa.eu
[23] International Conference on Harmonization, Q2B: Valid-ation of Analytical Procedures: Methodology; Avail-ability, Federal Register 62 (1997) 27463–27467.
A.M. LAZIĆ i sar.: BIOLOŠKI AKTIVNI DERIVATi SPIROHIDANTOINA Hem. ind. 70 (2) 209–215 (2016)
215
SUMMARY QUANTIFICATION OF ACRYLAMIDE IN FOODS SELECTED BY USING GAS CHROMATOGRAPHY TANDEM MASS SPECTROMETRY Veselin M. Delević1, Refik M. Zejnilović2, Biljana S. Jančić-Stojanović3, Brižita I. Đorđević4, Zorana N. Tokić5, Milica D. Zrnić-Ćirić4, Ivan M. Stanković4
1Institute of Public Health, Podgorica, Montenegro 2Faculty of Pharmacy, Podgorica, Montenegro 3Department of of Drug Analysis, Faculty of Pharmacy, University of Belgrade, Belgrade, Serbia 4Department of Bromatology, Faculty of Pharmacy, University of Belgrade, Belgrade, Serbia 5Department of Organic Chemistry, Faculty of Pharmacy, University of Belgrade, Belgrade, Serbia
(Scientific paper)
Acrylamide is toxic and probably carcinogenic compound, made as a result of high-temperature thermal treatment of carbohydrate-rich foodstuffs. In this article a method is improved for the extraction and quantitation of acrylamide infoods produced based on corn flour that are represented in our traditional diet. Acrylamide extraction was carried out using reduced volume of saturated solutionof bromine water and the GC–MS method for the quantification was shown.Quantification of acrylamide was preceded by: sample homogenization, acryl-amide extraction using water, extract purification using solid phase extraction,bromination, using a reduced volume of bromine water solution, dehydrobrom-ination with sodium thiosulfate and transformation of dibromopropenamide in 2,3,2-bromopropenamide using triethylamine. Regression and correlation analysiswere applied for the probability level of 0.05. Calibration is performed in theconcentration range 5–80 ug/kg with a detection limit 6.86 mg/kg and the limits of quantification 10.78 ug/kg and the coefficient of determination R2 > 0.999. Calibration curve was obtained: y = 0.069x + 0.038. Recovery values were an average from 97 to 110%. Proposed GC–MS method is simple, precise and reliablefor the determination of acrylamide in the samples of thermal treated foods. Our results show that the tested foods quantify the presence of acrylamide in concen-trations of 18 to 77 mg/kg acrylamide depending on whether the food was pre-pared by cooking or baking.
Keywords: Acrylamide • Foods • GC–MS

217
Immobilization of horseradish peroxidase onto kaolin by glutaraldehyde method and its application in decolorization of anthraquinone dye Nataša Ž. Šekuljica1, Nevena Ž. Prlainović1, Jelena R. Jovanović2, Andrea B. Stefanović2, Sanja Ž. Grbavčić1, Dušan Ž. Mijin2, Zorica D. Knežević-Jugović2 1University of Belgrade, Innovation Center, Faculty of Technology and Metallurgy, Belgrade, Serbia
2University of Belgrade, Faculty of Technology and Metallurgy, Belgrade, Serbia
Abstract The problem of environmental pollution becomes more worrisome day by day, primarilydue to the large amounts of wastewater contaminated with various harmful organic com-pounds, discharged untreated or partially clean into the environment. Feasibility of use ofhorseradish peroxidase (Amoracia rusticana) in the synthetic dyes decolorization wasapproved by many researchers. Among a number of supports used for the immobilization,it was found that natural clay, kaolin, has excellent features which are a precondition forobtaining biocatalysts with the excellent performances. For this reason, a horseradishperoxidase was immobilized onto kaolin using glutaraldehyde as a cross-linking agent. Obtained biocatalyst was applied in the decolorization of anthraquinone dye C.I. acid violet 109. Under determined optimal conditions (pH 4.0, hydrogen peroxide concentration 0.6mM, dye concentration 30 mg L–1, temperature 24 °C) around 76% of dye decolorization was achieved. Reusability study showed that resulting biocatalyst was possible to applyfour times in the desired reaction with relatively high decolorization percentage.
Keywords: horseradish peroxidase, immobilization, wastewater, dyes.
SCIENTIFIC PAPER
UDC 628.3:577.152.1:58:66:54
Hem. Ind. 70 (2) 217–224 (2016)
doi: 10.2298/HEMIND150220028S
Available online at the Journal website: http://www.ache.org.rs/HI/
The global water crisis has become worrisome problem because it is leading worldwide cause of deaths and diseases [1]. The textile industry is the main consumer of water in the production process, and therefore generates a large amount of wastewater. Wastewater from the textile industry is colored, rich in suspended particles, heavy metals, organic matter and other pollutants and often untreated or partially treated discharged into the environment. Complex composition of textile wastewater requires special treatment methods and many of them are high in energy demands and expensive. Around 2–20% of untreated wastewater is directly discharged in to the environment causing direct contamination of ground and surface water [1,2]. Different types of dyes (azo, anthraquinone and reactive) are applied in the textile processing technology and they represent the biggest problem in the textile wastewater. Most of them, like anthraquinone dyes, have steadfast structure based on the fused aromatic rings which make them difficult to remove and wastewater stay colored for a long period. Colored wastewater leads to impaired photosynthesis, inhibition of growth, development and reproduction of aquatic organisms [3,4]. Besides, the presence of dyes and their degradation products cause serious human Correspondence: D.Ž. Mijin, Faculty of Technology and Metallurgy, University of Belgrade, Karnegijeva 4, 11000 Belgrade, Serbia. E-mail: [email protected] Paper received: 20 February, 2015 Paper accepted: 12 May, 2015
health problems such as hemorrhage nausea, repro-ductive system, liver, brain and central nervous system damage [5]. Traditional methods for wastewater treat-ment can be divided into three groups: physical, chem-ical and biological and because of the complexity and variability in the composition of the wastewater they cannot adequately respond to stringent regulations for water purity [6]. Stringent standards for the discharge of wastewater into the environment motivated res-earchers to develop alternative methods for the treat-ment of wastewaters. Usage of oxidoreductive enz-ymes (manganese, lignin, horseradish, turnip and tom-ato peroxidase) is on the first place, because they show merit in converting complex chemical compounds under mild environmental conditions with high effi-ciency [5]. Horseradish peroxidase (EC: 1.11.1.7, HRP) applied in the treatment of wastewater can act on the harmful compounds by converting them into innocuous products or changing the characteristics of a given waste making it more favorable for the treatment [7]. The wastewater is characterized with high tempera-tures, high or low pH, high ionic strength, high reactant concentrations and presence of inhibitors which can all alter the catalytic conformation of the enzyme. Because of this it is necessary to convert enzyme into immobilized form which leads to increased stability, ease of handling, possibility to reuse and a consequent decrease in running cost [8,9].
In this paper in order to develop a sustainable and eco-friendly biocatalyst for the decolorization of col-

N.Ž. ŠEKULJICA et al.: IMMOBILIZATION OF HORSERADISH PEROXIDASE ONTO KAOLIN BY GLUTARALDEHYDE Hem. ind. 70 (2) 217–224 (2016)
218
ored wastewater a simple method for the immobil-ization was applied. HRP was immobilized onto kaolin using glutaraldehyde (GA) as a cross-linking agent. Inf-luence of the initial glutaraldehyde concentration as well as the initial enzyme concentration on the enzyme coupling yield and the activity of resulting biocatalyst was examined. The obtained immobilized biocatalyst was tested in the decolorization of the model dye C.I. acid violet 109 (AV 109).
EXPERIMENTAL
Materials Anthraquinone dye C.I. acid violet 109 was provided
by Lanaset (Lanaset Violet B). Horseradish peroxidase, glutaraldehyde and pyrogallol were obtained from Sigma–Aldrich (USA). Kaolin was supplied from Carlo Erba, and hydrogen peroxide was purchased from Merck (Darmstadt). All other chemicals used in this study were of analytical grade.
Methods Support activation
In order to increase the reactivity of the support, prior to immobilization, kaolin was activated using thermal treatment [10–12]. Thermal activation was accomplished after heating the kaolin paste (50% of moisture) in the oven for 2 h at 550 °C. The effect of the initial glutaraldehyde concentration on the immobilized mass and enzyme activity
100 mg of thermally activated support was sus-pended in 0.5 mL of different glutaraldehyde solution concentrations 0.12–1.0% and gently mixed at room temperature for 1 h [13]. After the reaction was fin-ished excess of glutaraldehyde was washed several times with distilled water. Prepared support was used for the HRP immobilization. Immobilization of HRP
Immobilization of HRP was carried out by immer-sing 100 mg of GA–kaolin into 0.5–5.0 mg mL–1 of HRP solution in phosphate buffer (100 mM, pH 7.0) and suspension was incubated for 4h at room temperature. Biocatalyst was separated from the supernatant and washed with immobilization buffer until no activity was detected in the washings. Immobilized enzyme was stored at 4 °C until use. Measurement of the enzyme activity
Activity of the free and immobilized HRP was mea-sured using standard substrates, hydrogen peroxide and pyrogallol. The reaction mixture for measuring the activity of free enzyme consisted of: 1 mL of 13 mM pyrogallol in the potassium-phosphate buffer pH 7.0, 10 µL of 3% hydrogen peroxide and 10 µL of diluted enzyme solution. The reaction rate was monitored
spectrophotometrically at 420 nm by following the change in absorbance values every 30 s for 3 min. The reaction mixture for measuring the activity of immo-bilized HRP consisted of: 3 mL of 13 mM pyrogallol prepared in the potassium phosphate buffer pH 7.0, where few milligrams of immobilized biocatalyst were suspended. After adding 30 µL of hydrogen peroxide, magnetic stirrer was set on the maximum and reaction rate was recorded each 60 s for 3 min in the samples obtained after centrifugation. One unit of the activity was defined as the amount of peroxidase that will form 1.0 mg of purpurogallin from pyrogallol in 20 s at pH 7.0 and 20 °C [14]. Protein content determination
Immobilization yield was calculated after protein content determination in the initial solution, super-natant and washings. Protein content was determined using modified method of Lowry [15]. The difference between the offered, protein in the supernatant and washings represent the mass of bound protein.
Dye decolorization in batch process Optimal pH was evaluated by incubating the free
and immobilized HRP with equal activity in AV 109 solution (30 mg L–1) at pH 3.0–12.0 under 25 °C. Inf-luence of hydrogen peroxide concentration on the decolorization was examined by varying the hydrogen peroxide concentration in the range 0.05–2.0 mM. In the third set of experiments, dye concentration inf-luence was examined by varying the dye concentration in the range 10–50 mg L–1, on the decolorization. In order to compare the properties, all experiments were performed with both forms of free and immobilized HRP under similar reaction conditions. In defined time intervals aliquots were collected from the reaction mix-tures and residual dye amount was followed using UV– –Vis spectrophotometer (UV Shimadzu 1700, Shimadzu Corporation, Kyoto, Japan) at maximum wavelength for the tested dye (λmax 590 nm, AV 109).
Decolorization percentage was calculated using fol-lowing mathematical expression [16]:
( )0 t
0
100Decolorization
A AA
−= (1)
where A0 is the initial absorbance of the untreated dye solutions (control) and At is the absorbance of the dye solution after enzymatic treatment.
RESULTS AND DISCUSSION
The influence of the initial glutaraldehyde concentration
Support activation using glutaraldehyde was stu-died intensively because the method is simple, inexp-

N.Ž. ŠEKULJICA et al.: IMMOBILIZATION OF HORSERADISH PEROXIDASE ONTO KAOLIN BY GLUTARALDEHYDE Hem. ind. 70 (2) 217–224 (2016)
219
ensive and efficient [17]. Glutaraldehyde used in the activation step has a role of a spacer arm and may prevent direct contact of the enzyme with the support. However, the excess of the glutaraldehyde can ran-domly attach the amino groups of the enzyme resulting in the hindering of the enzyme active center and inact-ivation [18]. Because glutaraldehyde is prone to cross linking and forming dimmers its initial concentration can greatly affect the amount of free aldehyde groups on the activated support at thus the immobilization and the activity yield. Influence of the initial glutaral-dehyde dose on the protein loading and the activity of the immobilized preparation is presented in Figure 1.
Figure 1. Initial glutaraldehyde concentration (GA) influence on mass of bound protein (square) and specific activity of immobilized preparation (circle).
It can be seen from the Figure 1 that, in the tested range, increasing the initial glutaraldehyde concen-tration did not have effect on the protein loading which is almost constant (2.7 mg g–1), while the increase in GA concentration up to 0.24% leads to increase in the activity of the immobilized enzyme (2.4 IU mg–1). Further increase resulted in the reduction of the acti-vity which falls more than double at GA concentration of 1%. The explanation for such behavior lays in the fact that high concentration of aldehyde groups can lead to multi-point covalent attachment that can change the active enzyme conformation and transform it into inactive form [19]. Similar results were given in the literature. Chen et. al immobilized β-galactosidase using GA and obtained the most active biocatalyst at GA concentration of 0.3%. Increase the GA concentra-tion above 0.3% GA significantly reduced the obtained preparation activity, as a consequence of multipoint attachment between enzyme and support [13].
Immobilization of HRP After activation, support was used for the immo-
bilization of HRP. Herein, in order to examine the sup-
port capacity and the activity of immobilized pre-parations, offered enzyme concentration was varied.
Figure 2. Initial enzyme concentration influence on mass of bound protein (circle) and specific activity of immobilized pre-paration (square) (reaction conditions: reaction time 4 h, pH 7.0, glutaraldehyde concentration 0.24%, temperature 24 °C).
It is evident from the Figure 2 that, in the inves-tigated range, increasing the offered mass of protein resulted in almost linear increase of protein loading. This indicates a large number of available aldehyde groups on the support surface. However, the increase in the mass of bound proteins does not necessarily mean the activity increase. From the Figure 2 it can be observed that the increase in the offered enzyme concentration from 0.5–2.0 mg mL–1 leads to activity increase up to 74.2 IU g–1. Further increase in the offered enzyme concentration resulted in a sharp acti-vity decrease and was negligible for the initial concen-tration of 5.0 mg mL–1. Due to increase in the mass of loaded protein enzyme molecules become more den-sely packed which increases the possibility of steric hindrances and limits the mass diffusion as well [17]. Also, at higher protein loading activity of the immo-bilized preparation was significantly impaired mainly due protein-protein interactions. The protein–protein interactions are the consequence of deficiently space between adsorbed proteins which leads to structural rearrangements and activity decrease [20,21].
Dye decolorization in batch process Optimum pH
Obtained immobilized biocatalyst with the specific activity of 2.4 IU mg–1 was used for the optimization of process parameters for the AV 109 decolorization in the batch reactor. As a batch reactor glass vial with magnetic stirrer was used. Because of its intrinsic inf-luence on the acidic-basic behavior of the substrate and protonation state of histidine and arginine involved in the catalytic cycle, pH is one of the most important

N.Ž. ŠEKULJICA et al.: IMMOBILIZATION OF HORSERADISH PEROXIDASE ONTO KAOLIN BY GLUTARALDEHYDE Hem. ind. 70 (2) 217–224 (2016)
220
parameters for the efficient performing of the desired reaction [23]. Optimum pH for the decolorization of AV 109 with the free and immobilized HRP was performed by measuring the decolorization at different pH values using the same amount of the free and immobilized HRP and similar reaction conditions. The experimental pH region from 3.0 to 12.0 is chosen because pH con-ditions of textile effluent are in that range [24]. The activity of the immobilized and free biocatalyst under different pHs is depicted in the Figure 3.
Figure 3. pH influence on the decolorization of AV 109 by free and kaolin-HRP (dye concentration 30 mg L–1, temperature 24 °C, hydrogen peroxide concentration 0.4 mM, enzyme concentration 0.1 U).
From the Figure 3 it can be seen that the optimum pH for the immobilized as well as for the free peroxi-dase corresponds to pH 4. A small degree of decolor-ization below pH 4.0 can be interrelated with the loss of heme group, which occurs much faster in this pH range, and the conversion of HRP into catalytically inactive form [25]. Under defined conditions after 60 min immobilized HRP oxidized 75.9%, meanwhile free oxidized 95% of AV 109 dye. This can be correlated with the steric effect of the support which hides the enzyme active center and the substrate may be difficult to approach. The obtained optimal pH corresponds to the reported value for HRP decolorization of Lanaset Blue 2R, where 59% of dye decolorization was achieved at pH 4.0 [26]. As it can be observed from the Figure 3, an increase in pH above 6.0 significantly decreased the decolorization. Similar results were obtained after applying HRP in the decolorization of Remazol Blue and Red Cibacron, where above pH 6.0 HRP activities were significantly smaller [27]. Performances of the immo-bilized biocatalyst are extremely dependent on the carrier selected for the immobilization. Thus, for example, Mohan et al. showed that HRP optimum pH
for decolorization of Acid Black 10 BX dye was 2.0, but Karim et al. approved that pH 6.0–8.0 was optimal for azo dye removal from textile effluent, when HRP was immobilized in acrylamide gel and β-cyclodextrin-chi-tosan complex, respectively [28,29]. Besides, free HRP exhibited highest activity in acidic pH, meanwhile immobilized biocatalyst showed stability against alka-line conditions unlike free HRP whose activity was neg-ligible under these conditions. Also a sharp decline in the activity under alkaline conditions to pH 12.0 and thereafter abrupt increase can be seen on the Figure 3. This arise from the structural changes in the distal pocket of the heme cavity where movement of distal histidine leads to its binding to the metal ion or from the changes in spin state of iron, from high to low [30,31]. Optimum hydrogen peroxide dose
It is clear from the Figure 4 that catalytic yield is favored by the low hydrogen peroxide concentration. Increase in the H2O2 concentration above 0.6 mM induced a slight decrease in the decolorization effi-ciency. Inhibitory effect of coadjutant was noticed by other researchers too. For example, HRP immobilized in β-cyclodextrin-chitosan matrix showed the highest acti-vity with 0.6 mM hydrogen peroxide concentration; where upon the decolorization percentage of tested azo dye was reduced significantly [32]. This pheno-menon could be explained with the fact that excess of hydrogen peroxide leads to higher generation of inter-mediate species that inhibit the activity of the enzyme [7]. Besides horseradish peroxidase, other peroxidases used in the decolorization reactions also showed inc-reased sensitivity against hydrogen peroxide [16,7,33].
Figure 4. Initial H2O2 dose influence on the AV 109 decolor-ization by free and kaolin-HRP (dye concentration 30 mg L–1, temperature 24 °C, pH 4.0, enzyme concentration 0.1 U).

N.Ž. ŠEKULJICA et al.: IMMOBILIZATION OF HORSERADISH PEROXIDASE ONTO KAOLIN BY GLUTARALDEHYDE Hem. ind. 70 (2) 217–224 (2016)
221
However, Figure 4 also shows a higher sensitivity of free HRP than its immobilized counterpart against sui-cide effect of the peroxide. The optimum dose for per-forming the decolorization of AV109 using immobilized HRP was 0.6 mM, meanwhile free HRP exhibited high-est activity at peroxide concentration of 0.1 mM. This suggests that the immobilization protected active cen-ter and the enzyme is active in a much wider range of hydrogen peroxide concentrations. Optimum dye dose
Figure 5 represents the dependence of decolor-ization percentage of the dye concentration. It is evi-dent that the dye had inhibitory influence on HRP, too. For both, free and immobilized enzyme optimal con-centration for the highest decolorization percentage (92.3% for free HRP and 76.5% for kaolin-HRP) was 30 mg L–1. Decolorization decreased thereafter, but the inhibitory influence of the dye is much more pro-nounced on the free than on the kaolin-HRP. Up to a concentration of 100 mg L–1 immobilized enzyme ret-ained almost constant decolorization potential (around 70%) while steep decreased for the free enzyme can be observed and the decolorization percentage falls to 21.3%. Immobilization had positive influence on the HRP since under determined conditions the free HRP retained 23%, while the kaolin-HRP retained 92% of the activity.
Figure 5. Initial dye concentration influence on the AV 109 decolorization by free and kaolin-HRP (hydrogen peroxide concentration 0.1 mM and 0.6 mM for free and kaolin-HRP, respectively, temperature 24 °C, pH 4.0, enzyme concen-tration 0.1 U).
The negative effect of the high dye concentration was observed in the decolorization reactions by other peroxidases [34,35]. Lower substrate concentrations were very effective in the suppression of the enzyme inactivation. Explanation for this can be found in the HRP catalytic cycle. Namely, in the HRP catalytic cycle
there are tree similar forms of the enzyme HRP E, E-I and E-II so there is the same possibility for dye binding for E-I as well as for E-II and form dead-end complex. With dye concentration increase the possibility for inactivate complex formation also increases [36–38]. When enzyme is immobilized by GA method, this form-ation of inactivate complex is almost absent.
It can be concluded that the optimal conditions are: enzyme concentration 0.1 U, pH 4.0, hydrogen perox-ide and dye concentration 0.6 mM and 30 mg L–1, 1 h of contact time. Under the optimal conditions the immo-bilized biocatalysts decolorized 76.5%, meanwhile free HRP 92.3% of AV 109 dye.
Reusability study In addition, the possibility of application of obtained
biocatalyst at industrial scale was evaluated trough reusability study. Results are presented in the Figure 6.
Figure 6. Reusability study (enzyme concentration 0.1 U, dye concentration 30 mg L–1, pH 4.0, hydrogen peroxide concen-tration 0.6 mM, temperature 24 °C).
Biocatalyst applied under determined optimum conditions after first cycle was separated from the reaction mixture, rinsed with the reaction buffer and assessed for its left over catalytic activity. It was pos-sible to apply the immobilized HRP four times in the reaction; where after each cycle progressive decrease in the decolorization was observed. For example, after fourth cycle immobilized HRP retained 15% of its ori-ginal activity. Jiang et.al found that HRP encapsulated in phospholipid-templated titania retained around 50% of the activity after 6 consecutive cycles, meanwhile mesoporous materials did not show such good pro-perties in terms of reusability and the immobilized enz-yme was possible to apply only twice in the decolor-ization of dye Remazol Brilliant Blue R [39,40]. This behavior was explained by forming the reaction pro-ducts layer across the enzyme active site, which thus became inaccessible for the substrate [40]. Immobil-
N.Ž. ŠEKULJICA et al.: IMMOBILIZATION OF HORSERADISH PEROXIDASE ONTO KAOLIN BY GLUTARALDEHYDE Hem. ind. 70 (2) 217–224 (2016)
222
ization of HRP onto kaolin by GA method approved to be a good immobilization technique because 0.1 IU of immobilized HRP decolorized 55.7 mg L–1, meanwhile free HRP only 27.7 mg L–1.
CONCLUSION
After multiple set of experiments listed above, the kaolin has proven to be a good choice as the support for the immobilization of HRP. Obtained biocatalyst is characterized by good performances in terms of con-tinuous use and the retained activity. The high degree of tested dye decolorization and improved properties in terms of pH, the impact of dye and hydrogen per-oxide, indicated the possibility of this biocatalyst appli-cation as a clean alternative in wastewater treatment. In order to apply the immobilized enzyme in the con-tinuous wastewater treatment plants further experi-ments should be focused on the stability increase.
Acknowledgement The authors acknowledge the financial support of
the Ministry of Education, Science and Technological Development of the Republic of Serbia (project number III-46010 and 172013).
REFERENCES
[1] M. Rizwana, M. Darshan, D. Nilesh, Phytoremediation of textile wastewater using potential wetland plant: Eco sustainable approach, Int. J. Interdiscip. Multidiscip. Stud. 1 (2014) 130–138.
[2] D.H.Y. Yanto, S. Tachibana, K. Itoh, Biodecolorization of textile dyes by immobilized enzymes in a vertical bio-reactor system, Procedia Environ. Sci. Eng. Manage. 20 (2014) 235–244.
[3] M.B. Ibrahim, N. Poonam, S. Datel, M. Roger, Microbial decolorization of textile dye-containing effluents: a review, Bioresour. Technol. 58 (1996) 217–227.
[4] S. Wijetunga, X.F. Li, C. Jian, Effect of organic load on decolourization of textile waste-water containing acid dyes in up flow anaerobic sludge blanket reactor, J. Hazard. Mater. 177 (2010) 792–798.
[5] Q. Husain, Peroxidase mediated decolorization and remediation of wastewater containing industrial dyes: a review, Rev. Env. Sci. Biotechnol. 9 (2010) 117–140.
[6] Md. A. Arafath, M. Hossain, S.S. Alam, R. Sourav, Studies on the adsorption efficiency and kinetics of dye removal from textile effluent using some natural bio-adsorbent, Int. J. Sci. Eng. Technol. 2 (2013) 853–856.
[7] F. Jamal, S. Sinhg, T. Qidwai, D. Singh, P.K. Pandey, G.C. Pandey, M.Y. Khan, Catalytic activity of soluble versus immobilized cauliflower (Brassica oleracea) bud peroxi-dase-concavalin A complex and its application in dye color removal, Biocatal. Agric. Biotechnol. 2 (2013) 311– –321.
[8] K. Poonkuzhal, T. Palvannan, Comparation of biopoly-mers for immobilization of lacasse: Ecotoxicity assess-
ment of azo dye, Indian J. Biotechnol. 12 (2013) 395– –401.
[9] A. Mugdha, M. Usha, Enzymatic treatment of waste-water containing dyestuffs using different delivery sys-tems, Sci. Rev. Chem. Commun. 2 (2012) 31–40.
[10] A.M. Rashad, Metakaolin as cementitious material: His-tory, scours, production and composition – A compre-hensive overview, Constr. Build. Mat. 41 (2013) 303– –318.
[11] G. Kakali, T. Perraki, S. Tsilvis, E. Badogiannis, Thermal treatment of kaolin: the effect on mineralogy on the pozzolanic activity, Appl. Clay Sci. 20 (2001) 73–80.
[12] B. Plešingerova, G. Sučik, M. Fabian, Surface area change of kaolin causing annealing, Acta Metallurg. Slov.17 (2011) 169–176.
[13] H. Chen, Q. Zhang, Y. Dang, G. Shu, The effect of glutaraldehyde cross-linking on the enzyme activity of immobilized β-galactosidase on chitosan bed, Adv. J. Food. Sci. Technol. 5 (2013) 932–935.
[14] T. Cvetić, A. Sabovljević, J. B. Pristov, M. Sabovljević, M, Effects of day length on photosynthetic pigments and antioxidative metabolism of in vitro cultured moss Atrichum undulatum (Hedw.) P. Beauv. (Bryophyta), Bot. Serb. 33 (2009) 83–88.
[15] E.F. Hartree, Determination of protein: A modification of the Lowry method that gives a linear photometric res-ponse, Anal. Biochem. 48 (1972) 422–427.
[16] N. Šekuljica, N. Prlainović, A. Stefanović, M. Žuža, D. Čičkarić, D. Mijin, Z. Knežević-Jugović: Scientiffic World J. (2015), Article ID 371625.
[17] J. Zhu, G. Sun, Lipase immobilization on glutaraldehyde-activated nanofibrous membranes for improved enzyme stabilities and activities, React. Funct. Polym. 72 (2012) 839–845.
[18] H.J. Chae, E.Y. Kim, Man-Jin In, Improved immobilization yields by addition of protecting agents in glutaraledhyde induced immobilization of protease, J. Biosci. Bioeng. 89 (2000) 377–379.
[19] J.L. House, E.M. Anderson, W.K. Ward, Immobilization techniques to avoid enzyme loss from oxidase-based biosensors: A one year study, J. Diab. Sci. Technol. 1 (2007) 18–27.
[20] A. Sethuraman, G. Belfort, Protein structural pertur-bation and aggregation on homogenous surfaces, Bio-phys. J. 88 (2005) 1322–1333.
[21] A. Sethuraman, G. Vendanthan, T. Imoto, T. Przybycien, G. Belfort, Protein unfolding and interfaces: Slow dina-mics of alpha-helix to beta-sheet transition, Proteins 56 (2004) 669–678.
[22] E. Laurenti, E. Ghibaudi, S. Ardissone, R.P. Ferrari, Oxid-ation of 2,4-dichlorophenol catalyzed by horseradish peroxidase: characterization of the reaction mechanism by UV-visible spectroscopy and mass spectrometry, J. Inorg. Biochem. 95 (2003) 171–176.
[23] A. Cordoba, I. Magario, M.L. Ferreira, Evaluation of hematin-catalyzed Orange II degradation as a potential alternative to horseradish peroxidase, Inter. Biodeteor. Biodegr. 73 (2013) 60–72.
N.Ž. ŠEKULJICA et al.: IMMOBILIZATION OF HORSERADISH PEROXIDASE ONTO KAOLIN BY GLUTARALDEHYDE Hem. ind. 70 (2) 217–224 (2016)
223
[24] T. Thongsook, D.M. Barrett, Purification and partial characterization of broccoli (Brassica oleracea Var. Italica) peroxidases, J. Agric. Food. Chem. 53 (2005) 3206–3214.
[25] S.M.A.G.U. de Souza, E. Forgiarini, A.A.U. de Souza, Toxicity of textile dyes and their degradation by the enzyme horseradish peroxidase (HRP), J. Hazard. Mater. 147 (2007) 1073–1078.
[26] K. Knutson, S. Kirzan, A. Ragauskas, Enzymatic bio-bleaching of two recalcitrant paper dyes with horse-radish and soybean peroxidase, Biotechnol. Lett. 27 (2005) 753–758.
[27] S.V. Mohan, K.K. Prasad, N.C. Rao, P.P. Sarma, Acid azo dye degradation by free and immobilized horseradish peroxidase (HRP) catalyzed process, Chemosphere 58 (2005) 1097–1105.
[28] Z. Karim, R. Adnan, Q. Husain, A β-cyclodextrin-chitosan complex as the immobilization matrix for horseradish peroxidase and its application for the removal of azo dyes from textile effluent, Int. Biodeterior. Biodegrad. 72 (2012) 10–17.
[29] T.K. Das, S. Mazumdar, S. Mitra, Heme CD as a probe for monitoring local structural changes in heme-proteins: Alkaline transition in heme proteins, Proc. Indian Acad. Sci. (Chem. Sci.) 107 (1995) 497–503.
[30] A. Mandan, S. Modi, A. Saxena, D.V. Behere, S. Mitra, Nature of distal amino acid residue responsible for acid-alkaline transition in HRP: Circular dichroism studies, Proc. Indian Acad. Sci. (Chem. Sci.) 102 (1990) 431–503.
[31] M. Celebi, M. Altikatoglu, Z.M. Akdeste, H. Yildrim, Determination of decolorization properties of Reactive Blue 19 using horseradish peroxidase enzyme, Turkish J. Biochem. 37 (2012) 200–206.
[32] S. Akhtar, Q. Husain, Potential applications of immo-bilized bitter gourd (Momordica charantia) peroxidase in the removal of phenols from polluted water, Chemo-sphere 65 (2006) 1228–1235.
[33] M.Z. Alam, M.F. Mansor, K.C. Jalal, Optimization of decolorization of methylene blue by lignin peroxidase produced from sewage sludge with Phanerocheate chryosporium, J. Hazard. Mater. 162 (2009) 708–715.
[34] G. Yu, X. Wen, R. Li, Y. Qian, In vitro degradation of a reactive azo dye by crude lignolytic enzymes from nonimmersed culture of Phanerocheate chryosporium, Process Biochem. 41 (2006) 1987–1993.
[35] A.N.P. Hiner, E.L. Raven, R.N.F. Thorneley, F. Garcia-Canovas, J.N. Rodrigez-Lopez, Mechanisms of com-pound I formation in heme peroxidases, J. Inorg. Chem. 91 (2002) 27–34.
[36] F. Deyhimi, F. Nami, Peroxidase-Catalyzed Electrochem-ical Assay of Hydrogen Peroxide: A Ping-Pong Mech-anism, Int. J. Chem. Kinet. 44 (2012) 699–704.
[37] U. Bandyopadhyay, S. Adak, R.K. Banerjee, Role of active site residues in peroxidase catalysis: Studies on horse-radish peroxidase, PINSA B65 (1999) 315–330.
[38] Y. Jang, W. Tang, J. Gao, L. Zhou, Y. He, Immobilization of horseradish peroxidase in phospholipid-templated titania and its application in phenolic compounds and dye removal, Enzyme Microb. Technol. 55 (2014) 1–6.
[39] M. Guo, L. Fuping, L. Minyao, L. Tuoping, P. Jun, N. Wang, P. Liang, C. Zhang, Purification of recombinant lacasse from Trametes Versicolor in Pichia methanolica and its use for the decolorization of anthraquinone dye, Biotechnol. Lett. 30 (2008) 2091–2096.

N.Ž. ŠEKULJICA et al.: IMMOBILIZATION OF HORSERADISH PEROXIDASE ONTO KAOLIN BY GLUTARALDEHYDE Hem. ind. 70 (2) 217–224 (2016)
224
IZVOD
IMOBILIZACIJA PEROKSIDAZE IZ RENA GLUTARALDEHIDOM NA KAOLIN I PRIMENA U DEKOLORIZACIJI ANTRAHINONSKIH BOJA
Nataša Ž. Šekuljica1, Nevena Ž. Prlainović1, Jelena R. Jovanović2, Andrea B. Stefanović2, Sanja Ž. Grbavčić1, Dušan Ž. Mijin2, Zorica D. Knežević-Jugović2 1Inovacioni centar, Tehnološko–metalurški fakultet, Univerzitet u Beogradu, Karnegijeva 4, 11000 Beograd, Srbija 2Tehnološko–metalurški fakultet, Univerzitet u Beogradu, Karnegijeva 4, 11000 Beograd, Srbija
(Naučni rad)
Očuvanje životne sredine, predstavlja jedan od vodećih izazova s obzirom nakoličinu otpadnih voda koje se svakodnevno generišu. Opšte je poznato da je voda jedan od polaznih uzroka mnogih bolesti, te je stoga akcenat stavljen na razvojekološki prihvatljivih, ali i održivih metoda prečišćavanja. Umesto tradicionalnihmetoda prečišćavanja koje ne mogu da se primene na širok spektar jedinjenja,čijom primenom nastaje sekundarni problem zagađenja u obliku aktivnog mulja,koriste se enzimi. U ovom radu pažnja je usmerena na primenu peroksidaze bilj-nog porekla u dekolorizaciji sintetičkih boja. Sintetičke boje se primenjuju u svim granama industrije (kozmetičkoj, prehrambenoj, farmaceutskoj, tekstilnoj) kojezahtevaju velike količine procesne vode, koja napušta proizvodni proces kaootpadna voda bogata bojama, površinski aktivnim materijama, deterdžentima,teškim metalima itd. Otpadna voda sadrži sintetičke boje koje su toksične, kance-rogene i mutagene i u cilju zaštite vodenih sistema i čoveka neophodno je ade-kvatno prečišćavanje pre ispuštanja u vodotokove. U ovom radu je ispitanamogućnost imobilizacije peroksidaze iz rena na prirodnu glinu, kaolin, koja ješiroko rasprostranjena u zemljištu, kako bi se dobio biokatalizator sa potenci-jalnom primenom u dekolorizaciji sintetičkih boja. Pre samog postupka imobili-zacije, kaolin je obrađen termički (2 h, 550 °C) kako bi se izvršila fazna transfor-macija i dobio znatno reaktivniji nosač. Metakaolin, nastao termičkom obradomkaolina je tretiran različitim početnim koncentracijama glutaraldehida, kako bi seispitao uticaj koncentracije glutaraldehida na masu vezanih proteina i aktivnost dobijenog imobilizata. Nakon optimizacije koncentracije glutaraldehida, ispitan jeuticaj koncentracije enzima na masu vezanih proteina i aktivnost. Nakon imobili-zacije, ispitana je potencijalna primena biokatalizatora u dekolorizaciji sintetičke boje AV 109. Dobijeni biokatalizator se pokazao znatno efikasnijim u pogledu sta-bilnosti u sredinamarazličitih pH, naročito alkalnoj; znatno je manje osetljiv nadejstvo inhibirajućih supstrata, vodonik-peroksida i boje. Pored toga, ispitivanjem reciklacije imobilisane peroksidaze, utvrđeno je da je ovaj biokatalizator mogućeprimeniti i u kontinualnom režimu.
Ključne reči: Peroksidaza iz rena • Imo-bilizacija • Otpadna voda • Boje