Embed Size (px)
Citation preview

International Journal for Service Learning in Engineering Vol. 7, No. 1, pp. 69-92, Spring 2012
ISSN 1555-9033
69
Wastewater Treatment for a Coffee Processing Mill in Nicaragua:
A Service-Learning Design Project
Michael D. Marsolek Assistant Professor
Civil and Environmental Engineering
Seattle University
Patrick K. Cummings BS Candidate
Civil and Environmental Engineering
Seattle University
Joshua T. Alcantara BS Candidate
Civil and Environmental Engineering
Seattle University
Michael Wayne BS Candidate
Civil and Environmental Engineering
Seattle University
Luis F. Quintero BS Candidate
Civil and Environmental Engineering
Seattle University
Carlos Vallejos Coordinator of Natural Sciences
Faculty of Science, Technology, and Environment
University of Central America – Managua
Charles F. Jackels Professor
Computing and Software Systems
University of Washington – Bothell
Susan C. Jackels Professor
Department of Chemistry
Seattle University
Abstract - An undergraduate capstone design project team consisting of candidates for the BS degree
in Civil and Environmental Engineering and faculty designed a wastewater treatment facility for a
coffee processing mill in rural Nicaragua. The team visited Nicaragua to interview the client
community, survey the actual site, and hold discussions with local development agencies, agricultural
cooperatives, and potential contractors. Three alternative designs were developed, and the
community chose one involving a settling basin and a series of three infiltration pits. The treatment
system is expected to meet MARENA discharge standards for pH, turbidity, and chemical oxygen
demand (COD) of discharge wastewater. The project team further secured sufficient funding from
Tetra Tech, an environmental consulting firm, to build the coffee mill and the water treatment
facility. On a subsequent visit, the mill and treatment facility were seen to be well constructed and
functional. Several important lessons regarding international service learning design projects were
learned: the need for a large cost overrun buffer; the utility of having contributors on-site during
both important decision making stages and construction; the value of working with local
organizations to facilitate remote work projects; the possibility of private sponsorship and
partnership for charitable projects; and the need to work with the community to design and select
appropriate technologies.
Index Terms: green coffee, coffee processing, wastewater treatment, engineering design, service learning

International Journal for Service Learning in Engineering Vol. 7, No. 1, pp. 69-92, Spring 2012
ISSN 1555-9033
70
INTRODUCTION
Strongly fluctuating world market prices for green coffee have long posed difficulties for small-scale
coffee producers in developing nations. Over the period 1970-2010, for example, world coffee prices varied
greatly, with the annual average ICO Composite Indicator Price fluctuating1,2
between an all-time high of
$2.29/lb in 1977 to less than $0.46/lb in 2001. After languishing well below $0.60/lb during the early
2000s, it only rose to above $2/lb during 2011i. The period during the early 2000s, when coffee prices were
very low, became known as the “Coffee Crisis”.3
One response to the widespread economic displacement and poverty of the Coffee Crisis was to
emphasize production of higher quality coffee that also bore international certifications such as Fair Trade
and Organic. Success in these specialty markets, drawing prices as much as 40% above those of the
commodity markets, required progress in two areas: 1) Adaptation of farms and methods to comply with the
requirements of the desired certifications; and 2) Production of coffee of sufficiently high quality that it will
be purchased. Certification alone does not guarantee sale on the specialty market.
At its best, the traditional Nicaraguan process (described below) is capable of producing truly fine gourmet
coffees.4 To successfully participate in the specialty market, farmers realized that they needed to raise the
level of, and minimize the variation in, the quality of their coffee. Development agencies worked with the
agricultural communities to improve coffee quality as a strategic way to address their poverty; the Quality
Coffee Program of USAID5 represented one of these efforts. There are a number of studies assessing the
overall success of these specialty certification initiatives.6,7,8
The design project described in this paper arose as part of Coffee for Justice, a project initiated at
Seattle University by one of the authors (SCJ) in collaboration with her American and Nicaraguan partners
and their students. In response to the Coffee Crisis, the mission of Coffee for Justice was to place scientific
and technical expertise in service to the small-scale Nicaraguan coffee producer. A discussion of the
establishment of Coffee for Justice as an effective program and a review of the outcomes achieved prior to
those described here has been accepted for publication elsewhere.9 The results of applied chemistry studies
conducted in a field laboratory and by the producers on their farms have also been reported.10,11
In order to engage the coffee farmers through their organizations and listen carefully to the questions and
requests that they might have for us, a process of gradual engagement, as described in Reference 9, was
undertaken that began by working through development organizations and agencies such as USAIDii and
CRS-NIiii
, then progressing on to regional agricultural cooperatives such as ADDACiv
and CECOSEMACv,
and finally to individual communities and farmers. Through this network of trusted contacts we were able
to learn what was wanted by the farmers and their organizations and to gain access to the farms in order to
study their processes.
i These historical prices are not adjusted for inflation. ii United States Agency for International Development iii Catholic Relief Services – Nicaragua iv Asociación para la Diversificación y el Desarrollo Agrícola Comunal (Association for Diversification and Development of the Agricultural Community),
Matagalpa, Nicaragua. v Central de Cooperativas de Servicios Multiples Aroma del Café, a union of agricultural cooperatives in Matagalpa, Nicaragua
International Journal for Service Learning in Engineering Vol. 7, No. 1, pp. 69-92, Spring 2012
ISSN 1555-9033
71
COFFEE PROCESSING IN NICARAGUA
Sorting, depulping, fermentation, and drying
The local practice in coffee production involves hand-picking of ripe coffee cherries, followed
within a few hours by manual selection to eliminate defects and mechanical depulping, all taking place on
the farm. After the exocarp (skin) and mesocarp (pulp) of the ripe coffee cherry are eliminated by
depulping, the coffee beans retain a sticky, firmly attached mucilage layer that must be removed prior to
drying and storage. The mucilage-coated beans are generally placed in an open tank, where natural
fermentation is allowed to proceed for 10-48 hours, depending on weather, altitude, etc. At some point
(termed “completion”) the fermentation process has loosened the mucilage from the bean surface, such that
it can then be washed away with water, a process that halts the fermentation and thoroughly cleans the
beans.
The clean beans are moved to a patio on the farm, where they are sun-dried to approximately 40%
water content. In most cases, they are then sacked and quickly transported to “dry mills” in hotter and drier
locations at lower elevation. After further sun-drying to approximately 12% water content, the beans are
sufficiently stable for storage prior to export as green coffee.
On-farm mill or beneficio
Coffee producers carry out the steps described above on the farm in a “wet mill” facility known as a
beneficiovi. This well ventilated, sheltered space, which contains the depulping machinery, fermentation
tanks, and washing trough requires a plentiful source of clean water, both to convey the cherries and beans
within the mill and to wash them thoroughly. Disposal of a large amount of wastewater, which is heavily
laden with carbohydrates and other nutrients from the depulping and washing must also be provided by the
beneficio.
In small communities, immediate neighbors may share a beneficio by coordinating their picking and
processing schedules. The least advantaged communities sometimes lack even this basic shared processing
facility, often resorting to the use of woven plastic sacks for fermentation and improvised washing methods
in tubs. Without a clean and well ventilated beneficio, producers cannot be expected to produce coffee of
the highest quality.
Wastewater Treatment
The process described above includes discharge of large amounts of wastewater12
resulting from the
various processing steps: sorting of cherries by flotation; pulp removal; and washing of the beans after
fermentation is complete. Overall, this water is acidic, deoxygenated, and laden with suspended solids and
organic material from the pulp and mucilage.13
In many traditional beneficios, the wastewater is simply
discharged into the nearest stream or river, with considering environmental consequence.
vi “Beneficial mill” in Spanish
International Journal for Service Learning in Engineering Vol. 7, No. 1, pp. 69-92, Spring 2012
ISSN 1555-9033
72
Modern, “ecological” designs (beneficio ecologico) both reduce the overall water requirement and
provide treatment of the wastewater before discharge. The reduction in volume is largely achieved by using
pulpers designed to operate with less flowing water and by designing the mill to require less water for
transport of the cherries and beans between stages. The remaining water, largely from the washing stage, is
then usually treated in a set of settling pits before infiltration into the soil or discharge into the surface
waters. On the smaller farms, these pits are often dug without any formal design, and the water usually
receives no pre-treatment before discharge into them. In the most advanced installations, generally found
only on the largest of haciendas, the treatment of the wastewater may include carefully designed anaerobic
digestion with capture of biogas gas for farm fuel.
The stream discharge of polluted wastewater degrades the overall environment of the farm and the
water quality for down-stream neighbors, which affects drinking water, sustenance crops, and livestock.
Also, some desired certifications14, 15
require that waste water receive at least minimal treatment before
discharge. In our conversations, the small-holder farmers were often interested in appropriate treatment of
their wastewater, provided that treatment was neither too expensive nor too difficult to implement and
maintain.
DESIGN PROJECT BACKGROUND
In a spring 2007 meeting with the leadership of the agricultural cooperative CECOSEMAC, we were
informed that a member community at La Suana possessed the potential for excellent coffee, but lacked the
basic beneficio needed for well-controlled, high-quality, on-farm depulping and fermentation. This
community possessed strong leadership, excellent coffee growing conditions, a good water supply, a site
suitable for a beneficio, and a desire to treat their wastewater in an environmentally appropriate manner.
This community need for a beneficio was well suited for a service-learning capstone design project for a
team of environmental engineering majors in collaboration with the Coffee for Justice Project and the
Seattle University Science and Engineering Project Center. The resulting project, Wastewater Treatment
Design for a Coffee Processing Beneficio16
was accomplished as a capstone design project by a team of four
BS in Civil and Environmental Engineering students during the 2007-8 academic year.
PLANNING AND REQUIREMENTS GATHERING
Preliminary Visit
It was decided during a preliminary visit by the faculty leadership in spring 2007 that the student team
would focus only on design of the wastewater treatment facility, with the design of the beneficio building
and construction of the entire facility to be accomplished by a small contractor familiar to CRS and
CECOSEMAC. It became apparent that this project would be different than the ordinary Project Center
capstone in a number of ways:
1. The project client was a poor rural community in Nicaragua that did not have resources to fund it.
Normally, the industrial sponsor funds the project and serves as its client.

International Journal for Service Learning in Engineering Vol. 7, No. 1, pp. 69-92, Spring 2012
ISSN 1555-9033
73
2. The client interviews and site assessment necessary for requirement gathering would require the
team to visit the rural community at La Suana. This would involve international travel, the transport
of field survey and test equipment, and the presence of someone with adequate language skills.
3. The student team would see the project through to implementation and evaluation. Normally
designs resulting from completed student projects are delivered to the sponsor, with subsequent
implementation of the design being the prerogative of the client. By involvement in implementation,
the service-learning project goes beyond the theoretical and offers a greater opportunity for
professional service and development.
Funding available for the project would need to be adequate not just for the design phase, but also for
the construction of the entire beneficio and water treatment facility. And, since significant funding was to
be expended in Nicaragua, the team needed to establish a mechanism for responsible remote project
management and expenditures. This project management was complicated by the fact that none of the team
could be present on-site during the construction phase.
Full Team Visit
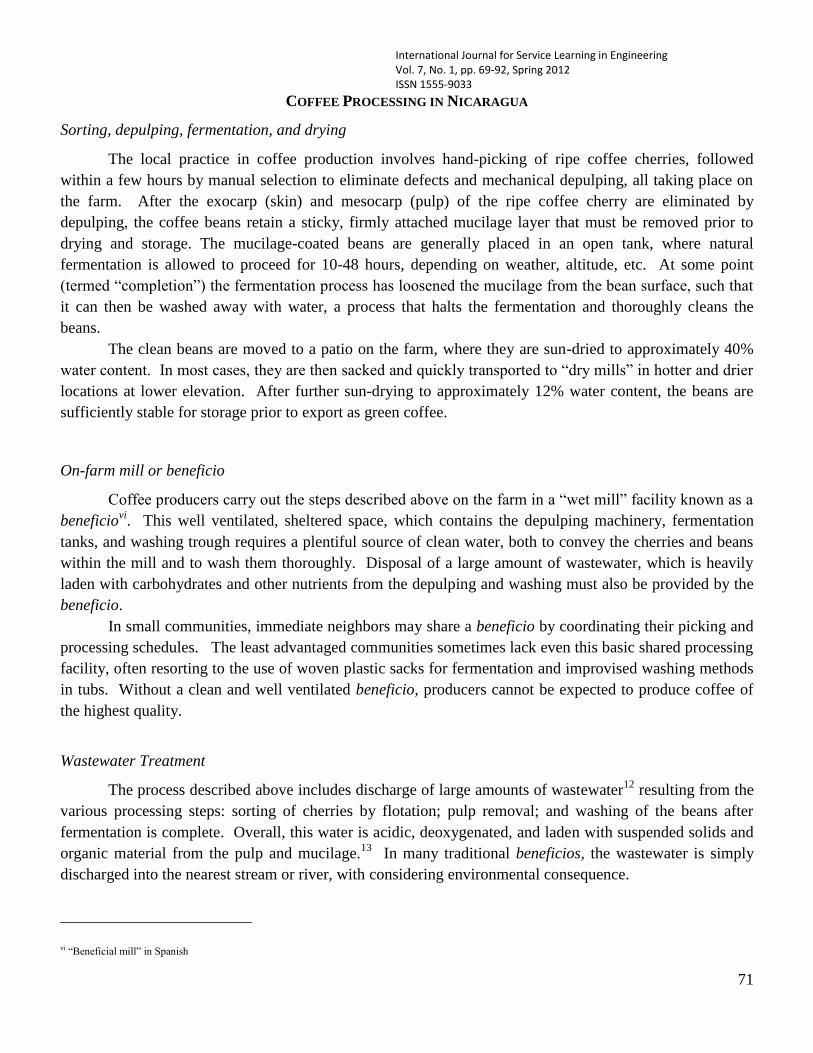
The faculty and the four-member student team visited Matagalpa, Nicaragua in December 2007.
They toured and observed several functioning beneficios, including measurements of the volume and quality
of wastewater (see Figure 1) at the ADDAC model farm La Canavalia.
FIGURE 1
WASTEWATER QUALITY MEASUREMENTS AT LA CANAVALIA

International Journal for Service Learning in Engineering Vol. 7, No. 1, pp. 69-92, Spring 2012
ISSN 1555-9033
74
This beneficio utilized an ad hoc system of three settling pits to provide water improvement through
filtration, neutralization, and microbial decomposition of organic material before infiltration to the nearby
stream.
Subsequently, the student team interviewed the client community at La Suana and went to the
proposed site, carefully surveying it and determining that there was suitable land for both the mill and
adjacent water treatment options (see Figure 2). Working with the staff of CECOSEMAC and CRS-NI, the
team identified a contractor with the necessary expertise to build the water diversion/storage structure, the
wet mill, and the water treatment option that would be selected by the community. The initial construction
time line and cost estimates were established for construction to be completed prior to November 2008, the
start of the next harvest season (see Figure 3).
FIGURE 2
SITE ASSESSMENT AT LA SUANA
FIGURE 3
PROJECT PLANNING WITH
CECOSEMAC
International Journal for Service Learning in Engineering Vol. 7, No. 1, pp. 69-92, Spring 2012
ISSN 1555-9033
75
Project Goals
Upon returning to Seattle in December 2007, the team established a set of goals:
design a set of wastewater treatment options to be presented to the client community in late winter or
early spring of 2008;
work with the community at long range to select an option and finalize the design with the
contractor;
establish a mechanism to both disburse funds to the contractor as he completed phases of the project
and keep the project on track for completion prior to October 2008, and;
construct the beneficio prior to the 2008 harvest season in the dry season when roads are passable.
Trusted Coffee for Justice contacts in Nicaragua (staff and leadership at CRS-NI and CECOSEMAC)
agreed to serve as on-site observers and as our representatives.
Project Constraints
The team identified several project constraints:
1. Capacity: The beneficio and water treatment facility must meet the processing requirements of five
families and meet or exceed regional standards for high quality coffee.
2. Water Conservation: The process steps must be designed to minimize water usage, particularly in
the transport and mechanical pulping of the coffee cherries.
3. Sustainable and Organic Standards: The entire design must be compatible with sustainable and
organic standards as required by the local farmer’s cooperative CECOSEMAC and by the Nicaragua
Fair Trade program. For discharge to surface waters, the wastewater effluent must meet or exceed
standards of the Ministerio Del Ambiente y Los Recursos Naturales de Nicaragua (MARENA).
4. Electrical Power: The location does not have access to electricity.
5. Limited Footprint: The wastewater treatment system adjacent to the beneficio must occupy the space
available between the existing road and hill, currently a drainage route approximately 3 m wide and
70 m long.
6. Geotechnical Considerations: The road leading up to the site is in poor condition and will not permit
large equipment or delivery trucks. Impact on the stability of the existing road was considered in the
alternatives.
7. High Strength Wastewater: The wastewater is high strength with respect to BOD/COD content,
nutrient concentration, and suspended solids. It also has a low dissolved oxygen (DO) concentration.
8. Low pH: The wastewater is very acidic and must be neutralized to avoid ecological and concrete
deterioration.
9. Construction Materials: Materials commonly available in the region include but are not limited to
concrete, plastic liner, gravel, PVC pipe, and wood.

International Journal for Service Learning in Engineering Vol. 7, No. 1, pp. 69-92, Spring 2012
ISSN 1555-9033
76
PRELIMINARY ASSESSMENTS
Site Assessment
La Suana is located in the municipality of San Ramon (12°55’ north latitude and 85°50’ west
longitude). The climate is of sub-tropical rainforest with average temperature between 20° and 26° C and
annual rainfall between 2000 to 2400 mm. The site was surveyed using hand held equipment, and a plan-
view of the area available for wastewater treatment (Figure 4) shows that it is to be located in a ditch on a
hillside adjacent to a road or path. The ditch is approximately 10 feet wide (opposing arrows in Figure 4)
and 220 feet long, for an area 2200 ft2 (200 m
2). The adjacent road is 15-100 meters from the nearby
stream.
In Figure 5 is a picture of the site, looking from top to bottom, an orientation opposite to that of the
plan-view map. In the picture, the stream is down hill to the left, the drainage ditch is to the right of the
path, and the site of the beneficio is in the field to the right.
FIGURE 4
PLAN VIEW OF THE DRAINAGE DITCH ALONG WITH SITE MEASUREMENTS
Beneficio
Site
(on hill top)
Ro
ad/P
ath
Road/P
ath
Str
eam
Str
eam

International Journal for Service Learning in Engineering Vol. 7, No. 1, pp. 69-92, Spring 2012
ISSN 1555-9033
77
Soil Assessment
A grab sample of soil was taken one foot below the surface and qualitatively observed to be a dark
brown silty fat clay soil with a high organic content. Due to time constraints, the design team was unable to
generate reproducible and reasonable soil infiltration rate data via standard percolation tests, and detailed
soil survey data was unavailable for this region. Therefore, Natural Resource Conservation Service17
data
for Puerto Rico was used for representative soil profiles selected based on the five soil forming factors:
parent material, topography, biota, time, and climate. Three representative soil series chosen (Aibonito,
Lirios, and Cortada) are all clay/silt dominated soils derived from volcanic rock parent material and exist on
20-40 percent slopes in mountainous regions receiving approximately 70-90 inches of annual rainfall at an
average annual temperature of 75oF. These soils formerly supported rainforest and are now used to
cultivate shade-grown coffee. The reported permeability (velocity) for each of these soils at depths less than
30 inches is 0.6 to 2 in/hr.18,19
Wastewater Analysis
To characterize the wastewater anticipated at La Suana during its operation, measurements were
done on the effluent from the operating beneficio at La Canavalia, which utilizes a system of three open
infiltration pits in series. Measurements of chemical oxygen demand (COD), pH, turbidity, and dissolved
oxygen (DO) were made at the following locations: the fresh water source; the river above and below the
beneficio; the depulping wastewater; the rinse wastewater; entrance to each of the three infiltration pits, and
the infiltration effluent near the river. The depulping- and rinsing wastewater are produced at different
times, but reside in pit #1 long enough to thoroughly mix. The wastewater overflows from pit #1 in turn
into pits #2 and 3.
Sampling was done at intervals throughout the rinsing process, which can take from 0.5 to 3 hours,
and a representative sample was created by combining the range of interval samples. The samples for COD
measurement were collected in 2 ml vials that were frozen and returned to Seattle University for analysis
(Chemetrics high-range COD vials & HachDRB200 Digital Reactor Block). The pH was determined using
a battery operated colorimetric reader for test strips (ReflectoQuant). The turbidity was determined using a
FIGURE 5
VIEW OF ROAD AND DRAINAGE DITCH FROM TOP TO BOTTOM

International Journal for Service Learning in Engineering Vol. 7, No. 1, pp. 69-92, Spring 2012
ISSN 1555-9033
78
Turbidity meter on site (Hach DR/820 Colorimeter). The DO was determined using a DO Probe (Vernier
Dissolved Oxygen Probe).
The depulping and rinsing processes produce wastewater with different characteristics, with the
depulping waste being higher in dissolved organics but less acidic. Being of an “ecological” design, the
new beneficio at La Suana should produce relatively less depulping wastewater, and a conservative set of
design parameters were determined by taking volume-weighted averages of the rinse (80%) and depulping
(20%) wastewater measurements at La Canavalia (Table 1).
TABLE 1
MEASURED WASTEWATER CHARACTERISTICS
Parameter Rinse
Wastewater
Depulping
Wastewater
Design
Parameters†
Upstream
River
COD (mg/L) 5500 7246 5850 54
pH 4.4 5.1 4.5 5.2
DO (mg/L) < 1 < 1 1 N/A
Turbidity (NTU) 480 760 540 31 †Assuming 80% rinse- and 20% depulping waste.
Based on water volume measured at La Canavalia and conversations with the producers at La Suana,
it was estimated that the new mill would produce a peak wastewater volume of 9 m3/day, for a daily coffee
bean production of 12 quintales (qq).vii
Assuming 2.75 qq of cherries yields 1 qq of processed coffee beans13
, this estimate would be
approximately 6 m3
water per tonne of coffee cherry, which is at the low end of the range cited in Ref. 13
(4-20 m3/t). This estimate was considered reasonable for a modern “ecological” beneficio.
In order to model the removal efficiency of the primary sedimentation pond in subsequent designs,
water quality was measured at La Canavalia in triplicate at four depths in infiltration pit #1 (2”, 7”, 11”,
14.5”). As shown in Figure 6, turbidity increases 6-fold from a depth of 2 to 14 in, and COD increases 2.5-
fold. The DO and pH remain relatively constant (1 mg/L and 4.2, respectively) throughout pit #1.
vii 1 quintal (qq) = 100 lb = 0.0454 tonne.

International Journal for Service Learning in Engineering Vol. 7, No. 1, pp. 69-92, Spring 2012
ISSN 1555-9033
79
To assess the treatment capability of a series of infiltration pits, data was collected at various stages
within the wastewater treatment process. When compared, this data (Table 2) shows that pit #1 is effective
in removing about 55% of the COD and turbidity and that seeping infiltrate (through soil) further
demonstrates a very large improvement in pH. There is little further improvement in COD in pits 2 and 3,
in large part because the pH in pits 2 and 3 remains too low to facilitate the growth of the necessary
anaerobic microorganisms for biodegradation.
TABLE 2
WASTEWATER CHARACTERISTICS AT LA CANAVALIA INFLITRATION PITS
Grab Sample COD (mg/L) pH Turbidity (NTU)
Influent to Pit 1a
5850 4.5 604
Influent to Pit 2b
2660 4.1 233
Influent to Pit 3b
2170 4.1 270
Infiltrate through soilb,c
2350 5.3 N/A
a Design parameter weighted average of rinse (80%) and depulping (20%) wastewater b Measured c Hillside seepage, 15-20 feet from the infiltration pits
FIGURE 6
COD AND TURBIDITY AS A FUNCTION OF DEPTH IN PIT #1 FROM TOP TO BOTTOM
International Journal for Service Learning in Engineering Vol. 7, No. 1, pp. 69-92, Spring 2012
ISSN 1555-9033
80
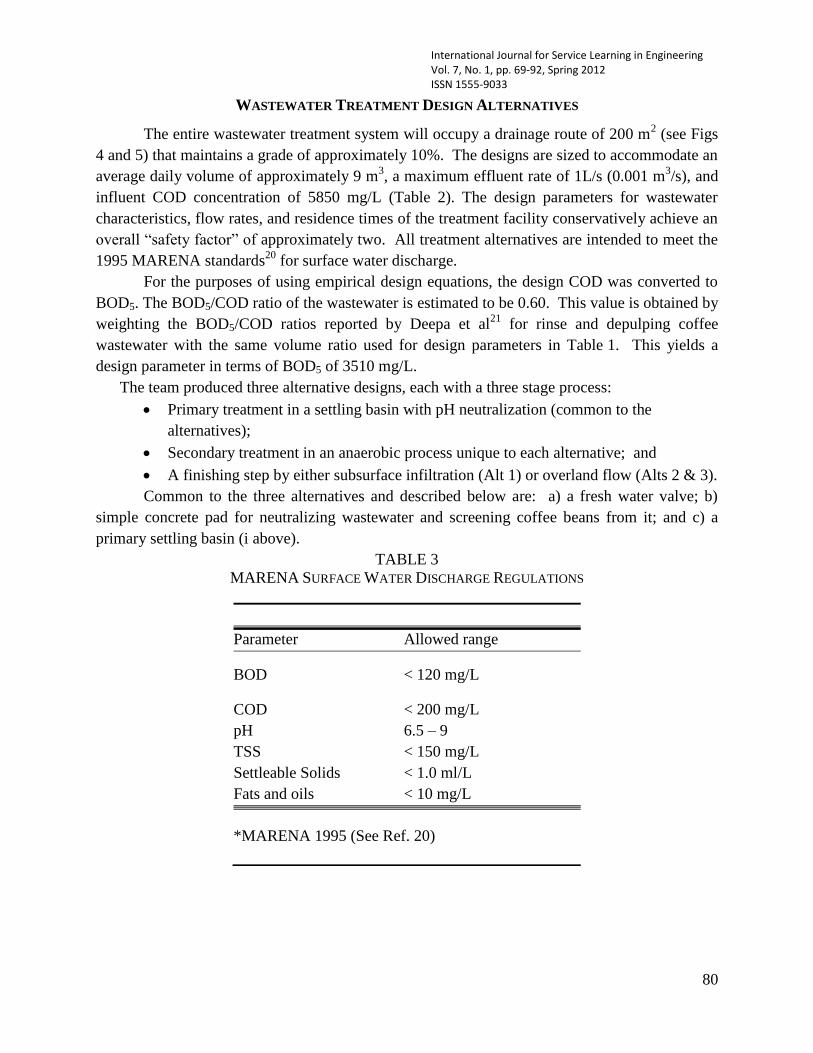
WASTEWATER TREATMENT DESIGN ALTERNATIVES
The entire wastewater treatment system will occupy a drainage route of 200 m2 (see Figs
4 and 5) that maintains a grade of approximately 10%. The designs are sized to accommodate an
average daily volume of approximately 9 m3, a maximum effluent rate of 1L/s (0.001 m
3/s), and
influent COD concentration of 5850 mg/L (Table 2). The design parameters for wastewater
characteristics, flow rates, and residence times of the treatment facility conservatively achieve an
overall “safety factor” of approximately two. All treatment alternatives are intended to meet the
1995 MARENA standards20
for surface water discharge.
For the purposes of using empirical design equations, the design COD was converted to
BOD5. The BOD5/COD ratio of the wastewater is estimated to be 0.60. This value is obtained by
weighting the BOD5/COD ratios reported by Deepa et al21
for rinse and depulping coffee
wastewater with the same volume ratio used for design parameters in Table 1. This yields a
design parameter in terms of BOD5 of 3510 mg/L.
The team produced three alternative designs, each with a three stage process:
Primary treatment in a settling basin with pH neutralization (common to the
alternatives);
Secondary treatment in an anaerobic process unique to each alternative; and
A finishing step by either subsurface infiltration (Alt 1) or overland flow (Alts 2 & 3).
Common to the three alternatives and described below are: a) a fresh water valve; b)
simple concrete pad for neutralizing wastewater and screening coffee beans from it; and c) a
primary settling basin (i above).
TABLE 3
MARENA SURFACE WATER DISCHARGE REGULATIONS
Parameter Allowed range
BOD < 120 mg/L
COD < 200 mg/L
pH 6.5 – 9
TSS < 150 mg/L
Settleable Solids < 1.0 ml/L
Fats and oils < 10 mg/L
*MARENA 1995 (See Ref. 20)
International Journal for Service Learning in Engineering Vol. 7, No. 1, pp. 69-92, Spring 2012
ISSN 1555-9033
81
Freshwater Valve
A 3-inch PVC pipe brings water to the site from a makeshift sandbag dam and pond at a
rate of 1.3 L/sec. Water conservation can be accomplished through installation of a simple ball
valve that regulates flow up to the max requirement of the operating beneficio (1 L/sec).
Neutralization
To provide an optimal pH range (6.5-7.7) 22
for biodegradation of the nutrients by
diverse microbial populations, the wastewater will be neutralized from an initial pH of 4.2 to
approximately pH 7. Neutralization of the wastewater, which is to be used for irrigation
(Alternatives 2 and 3), will also promote healthy soils and robust vegetative growth.23
Beneficio
workers will be asked to throw calcium oxide (locally available as “cal”) onto the concrete slab
where the rinse water is channeled enroute to the treatment system. Assuming the “cal” will
have hydrated to Ca(OH)2 during storage, the stoichiometric amount can be provided using a
container marked to hold approx 34 cm3.
Primary Settling Basin
Common to the three alternatives is a primary treatment settling basin with the following
characteristics:
A volume of approximately 10.8 m3
;
Lining to prevent direct soil infiltration, and;
A hydraulic retention time of approximately three hours, a value based on typical settling
times for agricultural wastewaters of 3-6 hours.24
These parameters are based on the beneficio flow rate (1L/s) and daily operating cycle (< 3h).
In practice, since the mill is used only once each day, the wastewater will have a residence time
of approximately eighteen hours before flowing from the settling basin to an anaerobic
biodegradation stage for further COD/BOD reduction.
For mosquito control, the settling basin should be covered with staggered wire-mesh window
screens. By staggering the typically available 18x16 mesh (1.0x1.2 mm squares), the hole size
can be halved to less than 1mm in both directions (0.5x0.6 mm), preventing passage of even the
smallest mosquitoes. While the hole size in unstaggered 18x16 mesh is deemed acceptable by the
WHO25
, for Anopheles control via bednets, a study by Bidlingmayer26
(1959) found that dengue
vectors, Aedes aegypti and Aedes taeniorhynchus, passed through an 18x14 mesh copper screen
1.5% and 26% of the time respectively, compared to only 0.1% and 0.6% when using a 22x22
mesh fiberglass screen (~0.8 mm diameter holes). Because dengue is a concern in the region, and
the staggering of common window screens is easy, our recommendation is to employ them to
cover the surface of the settling basin. It should be noted that even if the low pH wastewater
during harvest season precludes mosquito larvae growth, accumulation of rainwater at other
times of the year still necessitates covers.

International Journal for Service Learning in Engineering Vol. 7, No. 1, pp. 69-92, Spring 2012
ISSN 1555-9033
82
Building upon the common elements described above, the team developed three alternative
designs for anaerobic secondary treatment and finishing steps.
1. Three infiltration pits with subsurface infiltration.
2. Horizontal-flow anaerobic basin; surface discharge and infiltration.
3. Upflow anaerobic sludge blanket; surface discharge and infiltration.
The first two were considered very practical for the community, and the third one was
provided to illustrate the small-community implementation of a state-of-the-art technology.
Design Alternative 1
A sketch of the overall design is shown in Figure 7. The settling basin in this design is
lined with HDPE plastic and has dimensions of 1.5 m(w) x 1.5 m (d) x 6 m (l), with 2:1 (V:H)
side slopes to provide stability in the absence of concrete. The bottom of the basin has a 1:16
slope to encourage settling near the input pipe.22
FIGURE 7
PRIMARY BASIN & INFLITRATION PITS (ALT #1)
After primary treatment in the settling basin, the wastewater flows out over a V-notch weir
wall and is gravity fed into three parallel rock-media infiltration pits, characterized as follows:
Dimensions: 1.5 m by 1.5 m at a depth of 1 m; Side slopes 3:1 (V:H),
Volume approx 3.4 m3, in accord with the recommendation of the King County Surface
Water Treatment Manual 200527
,
Rocks are 10 mm in diameter, and vertical filling pipes have smaller holes,
Covered with framed and staggered window screens (see Settling Basin above).
International Journal for Service Learning in Engineering Vol. 7, No. 1, pp. 69-92, Spring 2012
ISSN 1555-9033
83
The rock media provides a growth surface for the microorganisms, helps distribute the water
throughout the pit at low flow rates, and reduces the danger from falling into the pits. Organic
material will biodegrade similar to being in a subsurface flow wetland as defined by the EPA.
Based on the measured COD reduction from settling in Tables 1 and 2, the BOD5 of the effluent
from the settling basin to the first pit is modeled to be 45% of the design influent, or 1580 mg/L.
BOD5 biodegradation in the pits is modeled via first order kinetics (k = 1.104 d-1
) 28
and time
weighted average of 12 h, for a further reduction of 42%. The infiltrate from these pits into the
subsurface should have a BOD5 of approximately 910 mg/L, a reduction of 74% before soil
infiltration. In comparison, first-order biodegradation in an anaerobic fixed film process operates
with a rate constant of 10.3 d-1
for wastewater containing carbohydrates and protein,29
making
the present value very conservative.
Physical filtration by soil can remove a broad range of BOD5, reported from 30-40 percent by
Gohil30
(p. 36), to 86-100 percent for a number of rapid infiltration systems.31
It should be noted
that rapid infiltration systems typically have lower BOD loading rates than the infiltration pits,
and these results use domestic wastewater. As a conservative estimate, it is assumed that 30%
of the BOD is removed via soil filtration, yielding a BOD5 concentration of 640 mg/L entering
the subsurface.
To estimate BOD5 reduction due to biodegradation in the subsurface, a first-order constant32
of 0.0127 d-1
is used. This constant applies to biodegradation of aromatic hydrocarbons in
northern Minnesota, and is therefore likely to be conservative. Biodegradation time is estimated
with hydraulic conductivity and soil porosity. Since only feasible on-site analysis was a
qualitative determination that the soil is a silty-clay, an exact hydraulic conductivity and porosity
could not be determined. The range of typical hydraulic conductivities for clay is 1x10⁻⁵
– 1x10⁻⁷
m/s.33
Porosity of clay/silt soils typically range over 50-60%.33,34
Combining these numbers, the
expected residual BOD5 reaching the river approximately 40 m away at the system midpoint
would range from 0 mg/L with K= 1x10⁻⁷
m/s, to 460 mg/L with K = 1x10⁻⁵
m/s. Using the
intermediate hydraulic conductivity, K = 1x10⁻⁶
m/s, results in an estimated residual BOD5
concentration of 25 mg/L. This number is used for future analysis.
Alternative #1, with a total cost for wastewater treatment of $787 US, meets all of the design
constraints and the MARENA standards for surface water discharge.viii
Although similar in its
design to others used in the region, the plastic lined settling basin and the use of “cal” for
neutralization will improve performance dramatically. The operation and maintenance
implications are: daily addition of “cal”; periodic removal of sludge from settling basin; and
renewal of the plastic liner, perhaps annually. The primary “negative” for alternative #1 is that it
does nothing to remove nitrate from infiltrating wastewater. The phosphorous concentrations
will be reduced via soil adhesion, however.
viii Provided that hydraulic conductivity K ≤ 1.9x10⁻⁶m/s.
International Journal for Service Learning in Engineering Vol. 7, No. 1, pp. 69-92, Spring 2012
ISSN 1555-9033
84
Design Alternative 2
In this design, the three infiltration pits of Alternative 1 are replaced by a horizontal-flow
anaerobic basin to provide secondary treatment of the effluent from the primary settling basin.
Effluent from the anaerobic basin flows on the surface into a hand-excavated shallow sinusoidal
channel with a crop such as corn grown between the channel loops. The wastewater will
infiltrate the soil from the channel and will not flow overland into the stream.
Since the anaerobic basin will be formed from concrete, the design specifies that the primary
settling basin should also be of concrete and attached to it, with the following characteristics:
Concrete – no further lining required,
Dimensions: 3.0 m (w) x 3.8 m(l) x 1.0 m(d),
Divided into two sections by concrete wall 1 m from end, with three 10 cm PVC pipes
passing through at 2/3 of full depth.
The concrete settling basin has volume and hydraulic characteristics similar to those of
Alternative #1, but with a different shape. The concrete wall dividing it insures that both the
sediment near the bottom and floating mass of organic material near the surface remain in the
first section and do not pass through the weir into the anaerobic basin.
Water flows through a simple rectangular weir from the second section of the settling basin
into the adjacent anaerobic horizontal-flow attached-growth basin that is filled with sand or
gravel to enhance the interaction area between microbes and wastewater. The anaerobic basin is
characterized as:
Dimensions: 2.8m (w) x 4.2m(l) x 1.2m(h) ; Volume approximately 14 m3,
Hydraulic retention time (HRT) of approximately 36 hours,
Open to atmosphere.
Literature values for up-flow and down-flow anaerobic basins indicate they can accept
organic loadings in the range 3000-9300 mg/L BOD5 and can be expected to reduce it by 75-
90% for HRT’s of 18-30 hours.35
The combination of unstirred horizontal flow and the
extremely low DO of the influent (Table 1
MEASURED WASTEWATER CHARACTERISTICS
) assure that the basin will remain anaerobic except possibly at the surface. In this horizontal
flow case, we are using a conservative estimate of 55% reduction, which in combination with the
55% reduction estimated for the settling basin, allows us to estimate the BOD5 of effluent from
the anaerobic basin as only 20% of its initial value(0.20 x 3510 mg/L) or 710 mg/L.
The maximum influent BOD5 loading rate recommended35
for slow-rate soil infiltration is
0.05 kg BOD5/m2-day, which yields a maximum of 10.0 kg/day if the entire ditch (200 m
2 in
Figure 4) is utilized. This maximum requires that wastewater at peak volume of 9 m3/day, have
its BOD5 loading no more than 1.1 kg/m3 or 1100 mg/L. The conservative estimate above of 710
mg/L for the effluent from the anaerobic reactor is well within this recommendation.
In addition to the reduction of organic components, the phosphorous and nitrogen containing
waste components are also of concern for surface disposal. Phosphorous, with estimated

International Journal for Service Learning in Engineering Vol. 7, No. 1, pp. 69-92, Spring 2012
ISSN 1555-9033
85
concentration of 15.8 mg/L in coffee processing wastewater,13
is expected to bind with organic
and mineral soil components and not leach significantly through the soil profile.36
Nitrogen
removal will also occur in the rhizosphere of the overland soil infiltration step. At the daily
flow rate above for a maximum of 120 days per year, the expected wastewater concentration of
nitrogen (150 mg/L)13
yields an estimated maximum actual rate for nitrogen loading of 0.94
kg/m2-yr. The acceptable nitrogen level for water leaching into the ground water is set
37 at 10
mg/L in Washington State and is used as the design standard here. In conjunction with an
analysis35
for crop uptake, denitrification, and volatilization, this value yields a maximum
allowable loading of 1.00 kg/m2-yr, which is 6% greater than the actual maximum loading rate
estimated above. Harvest of corn, which is commonly grown in this region, would result in
removal of nitrogen and phosphorous from the soil, aiding in the wastewater treatment.
Alternative #2, with a total cost for wastewater treatment of $1,506 US, meets all of the
design constraints and the MARENA standards for surface water discharge. Although initially
more expensive than alternative #1, it offers the farmers a simple method of wastewater
treatment that would also yield irrigated corn and removal of inorganic nutrients that are left
unremediated in alternative #1. The only regular maintenance would involve removal of sludge
from the primary basin and daily addition of “cal” during the coffee harvest period. The
“negatives” of this design include greater cost, farmers’ resistance to re-using wastewater even
for irrigation, and reliance on consistent addition of “cal.”
Design Alternative 3
Alternative #3 is similar to alternative #2, except that it uses an upflow anaerobic sludge
blanket (UASB) instead of the attached growth anaerobic basin for secondary treatment.
Primary treatment would again involve a settling basin as in other designs, and the final disposal
would be through an overland channel as in alternative #2. UASB reactors demonstrate BOD5
reductions of 85-95%,22
and are used in some larger haciendas in the region. Similar to
Alternative #2, this design would meet all performance criteria, including nitrogen and
phosphorous removal. Construction would be simple, but would require purchasing a
prefabricated UASB. The production of biogas to be used as a fuel is not a compelling
attraction at La Suana where the use of the gas in the kitchen would require transporting it some
distance across the farm. Also, many of these farms have adequate supplies of fuel wood that is
grown for that purpose within the shade canopy of the coffee plantation. Since it can be difficult
to restart the UASB reactor, the system must be maintained and supplied biomass year around,
posing a significant operational burden for a small community with no beneficio employees.
For these reasons, alternative #3 was presented, but not recommended, and was not given strong
consideration by the community. Details of the design are available upon request.
EVALUATION AND RECOMMENDATION
International Journal for Service Learning in Engineering Vol. 7, No. 1, pp. 69-92, Spring 2012
ISSN 1555-9033
86
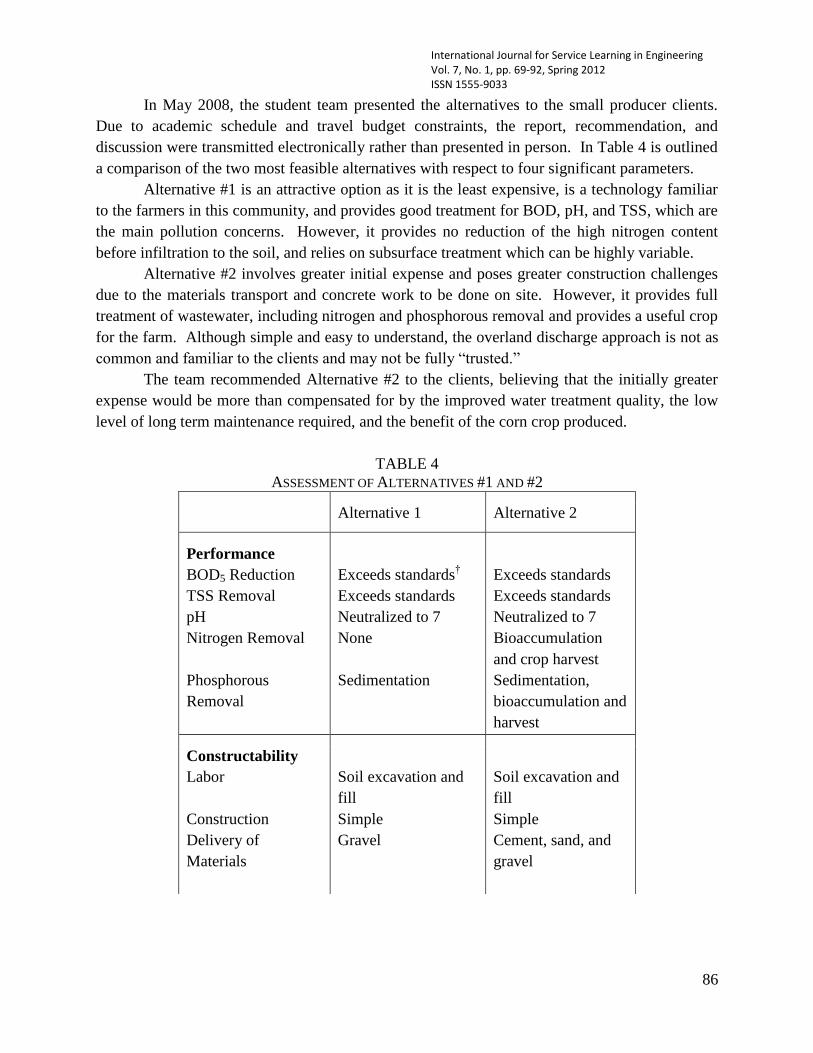
In May 2008, the student team presented the alternatives to the small producer clients.
Due to academic schedule and travel budget constraints, the report, recommendation, and
discussion were transmitted electronically rather than presented in person. In Table 4 is outlined
a comparison of the two most feasible alternatives with respect to four significant parameters.
Alternative #1 is an attractive option as it is the least expensive, is a technology familiar
to the farmers in this community, and provides good treatment for BOD, pH, and TSS, which are
the main pollution concerns. However, it provides no reduction of the high nitrogen content
before infiltration to the soil, and relies on subsurface treatment which can be highly variable.
Alternative #2 involves greater initial expense and poses greater construction challenges
due to the materials transport and concrete work to be done on site. However, it provides full
treatment of wastewater, including nitrogen and phosphorous removal and provides a useful crop
for the farm. Although simple and easy to understand, the overland discharge approach is not as
common and familiar to the clients and may not be fully “trusted.”
The team recommended Alternative #2 to the clients, believing that the initially greater
expense would be more than compensated for by the improved water treatment quality, the low
level of long term maintenance required, and the benefit of the corn crop produced.
TABLE 4
ASSESSMENT OF ALTERNATIVES #1 AND #2
Alternative 1 Alternative 2
Performance
BOD5 Reduction
TSS Removal
pH
Nitrogen Removal
Phosphorous
Removal
Exceeds standards†
Exceeds standards
Neutralized to 7
None
Sedimentation
Exceeds standards
Exceeds standards
Neutralized to 7
Bioaccumulation
and crop harvest
Sedimentation,
bioaccumulation and
harvest
Constructability
Labor
Construction
Delivery of
Materials
Soil excavation and
fill
Simple
Gravel
Soil excavation and
fill
Simple
Cement, sand, and
gravel
International Journal for Service Learning in Engineering Vol. 7, No. 1, pp. 69-92, Spring 2012
ISSN 1555-9033
87
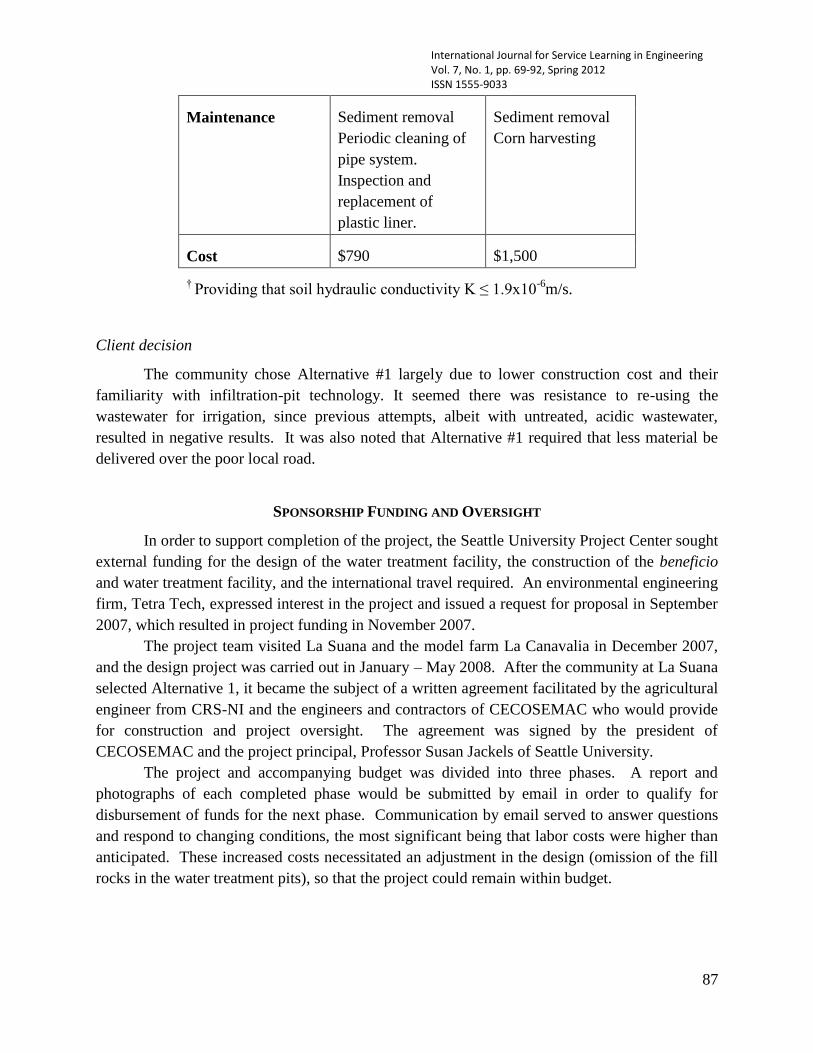
Client decision
The community chose Alternative #1 largely due to lower construction cost and their
familiarity with infiltration-pit technology. It seemed there was resistance to re-using the
wastewater for irrigation, since previous attempts, albeit with untreated, acidic wastewater,
resulted in negative results. It was also noted that Alternative #1 required that less material be
delivered over the poor local road.
SPONSORSHIP FUNDING AND OVERSIGHT
In order to support completion of the project, the Seattle University Project Center sought
external funding for the design of the water treatment facility, the construction of the beneficio
and water treatment facility, and the international travel required. An environmental engineering
firm, Tetra Tech, expressed interest in the project and issued a request for proposal in September
2007, which resulted in project funding in November 2007.
The project team visited La Suana and the model farm La Canavalia in December 2007,
and the design project was carried out in January – May 2008. After the community at La Suana
selected Alternative 1, it became the subject of a written agreement facilitated by the agricultural
engineer from CRS-NI and the engineers and contractors of CECOSEMAC who would provide
for construction and project oversight. The agreement was signed by the president of
CECOSEMAC and the project principal, Professor Susan Jackels of Seattle University.
The project and accompanying budget was divided into three phases. A report and
photographs of each completed phase would be submitted by email in order to qualify for
disbursement of funds for the next phase. Communication by email served to answer questions
and respond to changing conditions, the most significant being that labor costs were higher than
anticipated. These increased costs necessitated an adjustment in the design (omission of the fill
rocks in the water treatment pits), so that the project could remain within budget.
Maintenance
Sediment removal
Periodic cleaning of
pipe system.
Inspection and
replacement of
plastic liner.
Sediment removal
Corn harvesting
Cost $790 $1,500
† Providing that soil hydraulic conductivity K ≤ 1.9x10
-6m/s.
International Journal for Service Learning in Engineering Vol. 7, No. 1, pp. 69-92, Spring 2012
ISSN 1555-9033
88
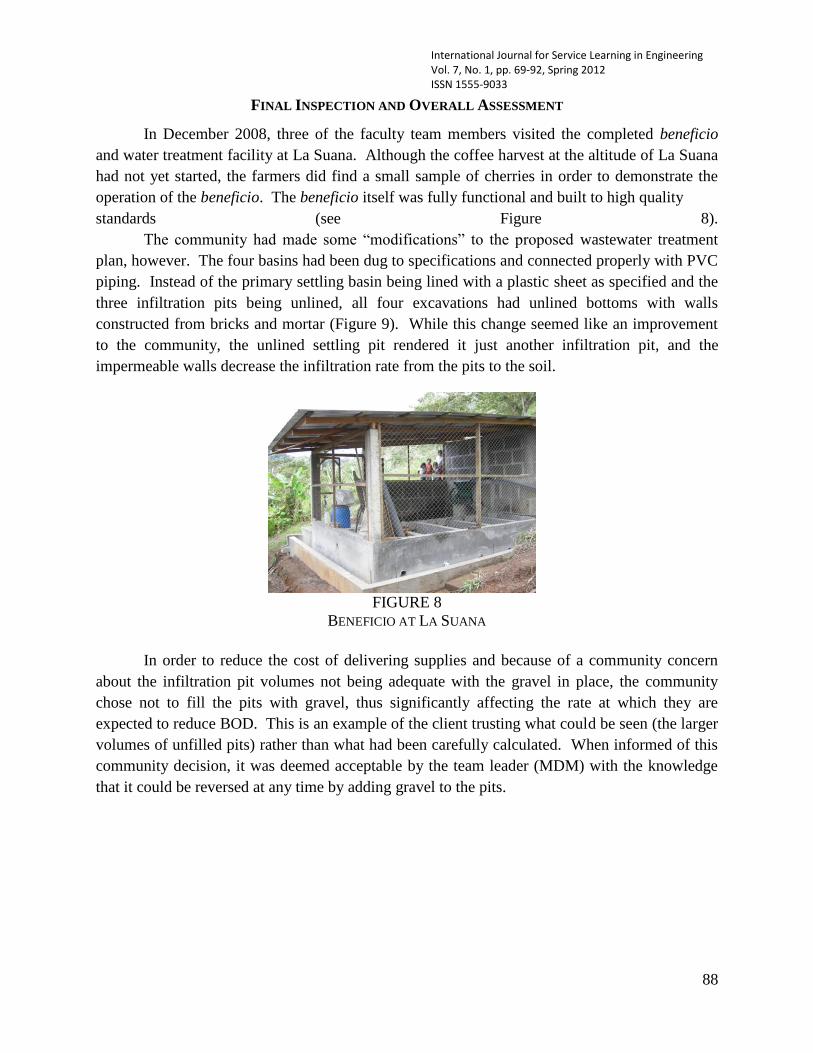
FINAL INSPECTION AND OVERALL ASSESSMENT
In December 2008, three of the faculty team members visited the completed beneficio
and water treatment facility at La Suana. Although the coffee harvest at the altitude of La Suana
had not yet started, the farmers did find a small sample of cherries in order to demonstrate the
operation of the beneficio. The beneficio itself was fully functional and built to high quality
standards (see Figure 8).
The community had made some “modifications” to the proposed wastewater treatment
plan, however. The four basins had been dug to specifications and connected properly with PVC
piping. Instead of the primary settling basin being lined with a plastic sheet as specified and the
three infiltration pits being unlined, all four excavations had unlined bottoms with walls
constructed from bricks and mortar (Figure 9). While this change seemed like an improvement
to the community, the unlined settling pit rendered it just another infiltration pit, and the
impermeable walls decrease the infiltration rate from the pits to the soil.
FIGURE 8
BENEFICIO AT LA SUANA
In order to reduce the cost of delivering supplies and because of a community concern
about the infiltration pit volumes not being adequate with the gravel in place, the community
chose not to fill the pits with gravel, thus significantly affecting the rate at which they are
expected to reduce BOD. This is an example of the client trusting what could be seen (the larger
volumes of unfilled pits) rather than what had been carefully calculated. When informed of this
community decision, it was deemed acceptable by the team leader (MDM) with the knowledge
that it could be reversed at any time by adding gravel to the pits.

International Journal for Service Learning in Engineering Vol. 7, No. 1, pp. 69-92, Spring 2012
ISSN 1555-9033
89
FIGURE 9
SETTLING BASIN (FOREGROUND) AND INFLITRATION PITS AT LA SUANA
One unexpected result of this effort was that, upon hearing of the foreign investment in
the community, the local government decided to improve the road to La Suana in order to
facilitate the beneficio construction. This allowed trucks to get close to the site, greatly
facilitating materials delivery. The community viewed the road improvement as being more
valuable than the beneficio itself, since the improved road served approximately 100 farms year
around.
Additional funding for travel and construction cost overruns would have been most
helpful to the overall project. The presentation of the designs and the recommendation favoring
Alternative #2 might have been more effective if the team leadership had visited La Suana in
April or May 2008. A visit during construction of the wastewater treatment facility might have
led to an implementation in closer compliance with the original design. The costs of
construction of the beneficio itself turned out to be somewhat higher than originally predicted,
and the lack of sufficient funding for cost overruns made the community more conservative
when considering the cost of the wastewater treatment facility.
From a technical and development point of view, the project was quite successful. The
poor community at La Suana obtained a state-of-the-art beneficio and a wastewater treatment
facility that is an improvement upon the general practice in their region.
From a service learning point of view, the project was an unqualified success. A team of
engineering students put their capstone design project into direct service to a poor community in
the developing world. These students traveled to Nicaragua, interviewed the clients, and
designed options for them that were technically sound, of appropriate technology and culturally
acceptable. The students also saw their design actually built and implemented. They learned the
importance of effective communication with clients across language, economic, and cultural
barriers and gained experience working as a multi-disciplinary team of engineers, scientists,
officials of international development organizations, and small community leaders.
International Journal for Service Learning in Engineering Vol. 7, No. 1, pp. 69-92, Spring 2012
ISSN 1555-9033
90
The team leadership has been approached about replicating this project with another
small community in Nicaragua. With lessons learned from our initial project, we are
enthusiastically searching for sponsorship of a second one.
ACKNOWLEDGEMENTS
The team thanks the Tetra Tech liaisons, Grizelda Sarria and John Markus, for their
consistent and excellent help and guidance throughout the project. The team also thanks
Professor Jeff Dragovich of Seattle University and his students, while in Nicaragua for another
project, for providing a preliminary survey of the La Suana site during spring 2007.
International Journal for Service Learning in Engineering Vol. 7, No. 1, pp. 69-92, Spring 2012
ISSN 1555-9033
91
REFERENCES
1 ICO 2011. Composite Indicator Price 2011, International Coffee Organization, London. Available at http://www.ico.org/coffee-prices.asp.
Accessed on August 19, 2011. 2 Mohan S, Russel B, “Modelling thirty five years of coffee prices in Brazil, Guatemala and India.”” Dundee Discussion Papers in Economics,
University of Dundee, Scotland. Number 221, December 2008. 3 Oxfam International 2003. “Mugged: Poverty in your coffee cup.” Oxford, UK: Oxfam Publishing, Nov 2003, 58 p. 4 Cup of Excellence Program 2011. Nicaraguan Programs. Available 25Aug2011:
http://www.cupofexcellence.org/CountryPrograms/Nicaragua/tabid/62/Default.aspx 5 USAID, see for example “Combatting the Coffee Crisis with Quality Products”, a report on the Nicaraguan component of the program. United
States Agency for International Deveopment, Washington DC 2009. Available at:
http://www.usaid.gov/stories/nicaragua/fp_nicaragua_coffee.html. Accessed on August 19, 2011. 6 Bacon CM, Mendez VE, Flores Gomez, ME, Stuart D, Diaz Flores SR, “Are sustainable coffee certifications enough to secure farmer
Livelihoods? The millennium development goals and Nicaragua’s Fair Trade cooperatives.” Globalizations 2008; 5(2): 259-274. 7 Valkila J. “Fair Trade organic coffee production in Nicaragua – Sustainable development or a poverty trap? “ Ecological Economics 2009; 68: 3018-3025. 8 Utting-Chamorro K. “Does Fair Trade make a difference? The case of small coffee producers in Nicaragua.”“ Dev. In Pract 2005; 15 (3&4):
584-599. 9 Author Listing Removed “Coffee for Justice: Chemistry and Engineering in Service to the Jesuit Mission with Small-holder Coffee Farmers of
Nicaragua.”” Revised and accepted for publication in “Justice in Higher Education, Transforming the World and Being Transformed,” to be
published by Fordham University Press, 2012. 10 Author Listing Removed. “Characterization of the Coffee Mucilage Fermenation Process using Chemical Indicators: A Field Study in
Nicaragua”, J. Food Science 2005.70: C321-5, 11 Author Listing Removed. “Control of the Coffee Fermenation Process and Quality of Resulting roasted coffee: Studies in the Field Laboratory and on Small Farms in Nicaragua during the 2005-06 Harvest.”, Proceedings of the 21st ASIC (Association Scientifique Internationale du Café)
Meeting (Montpelier) 2006, pp. 434 – 442. 12 Sas M. “Contamination potential of coffee processing 2006/2007.” Managua (Nicaragua):Ministerio Agropecuario y Forestal (MAGFOR) May 2007. 22p. Available 25August 2011:
http://www.waterharmonica.nl/matagalpa/publicaties/evaluation_document_cp_marco_sas_nunio_2007.pdf 13 Sas MJ. “Eco-engineered treatement of coffee wastewater according to the waterhamonica: A case study in Matagalpa, Nicaragua.” Wageningen (Netherlands): Aqua for All & LEAF May 2006. 53 p. Available 25 August 2011: http://hbo-
kennisbank.uvt.nl/cgi/hz/show.cgi?fid=758 14 USDA. “What does the organic label really mean?” US Department of Agriculture. Available 25 August 2011: http://usda-fda.com/articles/organic.htm 15 FairTrade 2011. “Generic Fair Trade standard for small producer organizations.” Bonn: Fair Trade International August 2011. Available
25August2011: http://www.fairtrade.net/654.0.html 16 Author Listing Removed., “Wastewater Treatment Design for a Coffee Processing Beneficio: Project Report to TetraTech Inc.” Science and
Engineering Project Center, (Removed) University, Report CEE 08.4, 2008. 17 NRCS, “Carribbean Area Online Soil Manuscripts.” Published by Natural Resources Conservation Service, United States Department of Agriculture, Washington DC. Available November at: http://soils.usda.gov/survey/online_surveys/caribbean/. Accessed 27Nov2011. 18 USDA 1975, “Soil Survey of Mayaguez Area of Western Puerto Rico.” Soil Conservation Service, U.S. Department of Agriculture, 1975. See
Table 5, pp 200-201 for Aibonito data. Available: http://soildatamart.nrcs.usda.gov/manuscripts/PR684/0/Mayaguez.pdf. Accessed 27 Nov 2011. 19 USDA 1979, “Soil Survey of Ponce Area of Southern Puerto Rico.” Soil Conservation Service, U.S. Department of Agriculture, 1979. See
Table 7, pp 60-63 for Cortada data and Lirios data. Available: http://soildatamart.nrcs.usda.gov/manuscripts/PR688/0/Ponce.pdf. Accessed 27 Nov 2011. 20 MARENA 1995. Ministerio del Ambiente y los Recursos Naturales de Nicaragua. Publised in: La Gaceta diario official, Decreto No. 33-95,
Arto 38, Gobierno de la Republica de Nicaragua, Managua, Nicragua, 1995. 21 Deepa GB, Chanakya HN, de Alwis AAP, Manjunath GR, and Finutha D. “Overcoming pollution of lakes and water bodies due to coffee
pulping activities with appropriate technology solutions”. Proceedings of Lake 2002: Conservation, Restoration and Management of Aquatic
Ecosystems, December 2002, Bangalore, Session 10, Paper 4. 22 Metcalf and Eddy Inc, Tchobanoglous G, Burton F, Stensel HD. “Wastewater Engineering: Treatment and Reuse”, 4 th ed. McGraw Hill
(Boston, 2003). 1819 p. 23 Brady N and Weil R., “The Nature and Properties of Soils.” 13th Ed, Prentice Hall,( Upper Saddle River, NJ, 1999) 960p. 24 Eckenfelder WW.. “Industrial Water Pollution Control”, 3rd Edition.. McGraw Hill (New York) 1999. 584 p. 25 WHO 2007. ‘Technical Consultation on Specifications and Quality Control of Netting Materials and Mosquito Nets: Updated WHO
specifications for netting materials and mosquito nets. World Health Organization (Geneva) 2007, 28 p. 26 Bidlingmayer, WL. “Mosquito Penetration Tests With Louver Screening”, The Florida Entomologist, 1959:42(2):63-67 27 King County, WA. Flow Control Design. Chapter 5 of Surface Water Design Manual, 2005. King County, Washington(Seattle) 2005. 528 p.
Available from King County: http://your.kingcounty.gov/dnrp/library/archive-documents/wlr/dss/2005SWDM/2005ManualwithErrata.pdf. Accessed on 9 Dec 2011. 28 EPA 1993. “Subsurface flow constructed wetlands for waste water treatment.” Washington: US EPA 832-R-93-008, July 1993. 87 p. Available: www.epa.gov/owow/wetlands/pdf/sub.pdf. 29 Tommaso G, Varesche MB, Zaiat M, Foresti E, Ribeiro R. “Influence of multiple substrates on anaerobic protein degradation in a packed-bed
bioreactor.” Water Science and Tech 2003: 48(6): .21-23. 30 Gohill, MB. Land Treatment of Wastewater, New Age International(New Dehli), 2000, 134p.
International Journal for Service Learning in Engineering Vol. 7, No. 1, pp. 69-92, Spring 2012
ISSN 1555-9033
92
31 EPA 1981, “Process Deisgn Manual for Land Treatment of Municipal Wastewater”, Report No 625/1-81-013, United States Environmental Protection Agency, Washington DC, October 1981, 477p. 32 Cozzarelli I, Bekins B, Eganhouse RP, Warren E, Essaid H. “Measurement of Hydrocarbon Biodegradation Rates Using In Situ Techniques.”
Abstract 213-11, 2005 Salt Lake City Annual Meeting of the Geologic Society of America 2005. Available: http://rock.geosociety.org/meetings/searchabstracts.htm. 33 Davis ML and Cornwell DA, “Introduction to Environmental Engineering:, 4th ed, McGraw-Hill (New York 2006), 1024p. 34 EPA 1984, “Process Deisgn Manual for Land Treatment of Municipal Wastewater: Supplement on Rapid Infiltration and Overland Flow”, Report No 625/1-81-013a, United States Environmental Protection Agency, Washington DC, October 1984, 132p. 35 Crites R and Tchobanoglous G. “Small and Decentralized Wastewater Management Systems. “McGraw Hill (New York), 1998. 1084 p. 36 Havlin JL, Tisdale SL, Nelson WL, and Beaton JD. “Soil Fertility and Fertilizers: An Introduction to Nutrient Management”, 7th ed. Prentice
Hall (Upper Saddle River, NJ), 2004. 528p. 37 Washington State Department of Ecology. Water Quality Standards for Ground Waters for the State of Washington. Chapter 173-200 WAC, Table I. State of Washington, Olympia (1990). Available: http://www.ecy.wa.gov/pubs/wac173200.pdf
.