Embed Size (px)
Citation preview

Friday, June 1, 2018
COMMENTARYTHE MARKET’S PERFORMANCE AMID this week’s volatility shows many municipal investors are in it for the long haul. They need that coupon. . . . . . . . . 3
THE REGIONSTHE PUERTO RICO SENATE REFUSED to give in to an Oversight Board demand on labor regu-lations, the latest episode in a struggle over policy measures intended to pull the territory out of recession and help in the payment of its debt. . . . 5
WEB EXCLUSIVESILLINOIS NEEDS A PLAN TO TACKLE its rising tab for pensions and other fixed costs like retiree healthcare and debt service or its risks a drop into specu-lative grade territory, Moody’s Investors Service warned in a new report published as law-makers were casting final votes on a budget package.
THE NONPROFIT PLAYHOUSE SQUARE Foundation is using some of the proceeds of a tax-exempt, $80 million junk-bond offering to finance a $139 million, 34-story luxury apartment tower in downtown Cleveland’s theater district.
THE OWNERS OF FLORIDA’S PRIVATELY owned Brightline-branded passenger train system have been given more time to issue $1.15 billion of private activity bonds to finance portions of the project.
PENNSYLVANIA’S TREASURER AND A lawmaker have begun a review of the state’s two largest pension funds, the Public School Employees’ Retirement System and the Pennsylvania State Employees’ Retirement System.
FRIDAYwww.bondbuyer.com
Vol. 390 No. F467 N.Y., N.Y. THE DAILY NEWSPAPER OF PUBLIC FINANCE
CORONADO, CALIF. – The 2008 financial crisis wrought radical changes in the municipal market, but those changes may not have prepared the market for its next challenge, analysts said Thurs-day.
The legacy of the calamitous fi-nancial meltdown of ten years ago was the subject of a panel discus-sion at the National Federation of Municipal Analysts’ annual con-ference. The wide-ranging conver-sation touched on the changes in market conditions, the technolog-ical advancements in the industry, and the regulatory changes born from the reaction to the crisis.
“The things that happened ten years ago, it’s hard to even remem-
How the Financial Crisis Altered the Muni MarketBy Kyle Glazier
Turn to Analysts page 3
Muni Sales Show Signs Of Recovery
Municipal bond issuance rose for the third month in a row in May, raising expectations that vol-ume is on a path toward normalcy.
May 2018 volume was still down to $30.92 billion from $38.71 billion a year earlier, according to Thomson Reuters data. Issuers completed 985 transactions, off from 1,203 in May 2017. One month from the halfway point of the year, muni volume is sitting at $125.60 bil-lion, roughly 22% lower than the $161.69 billion of muni sales at this point a year ago.
New-money issuance increased 53.3% to $23.82 billion in 820 deals, up from $15.60 billion in 794 deals a year earlier.
“The main trend is of course not surprising: refundings are down massively compared to last year, as a result of the elimination of advance refundings,” which were banned under the new Fed-eral tax law, said Mikhail Foux, director of municipal research at Barclays Capital. “Meanwhile,
By aaron Weitzman
Turn to Volume page 14
Seven.She founded the firm five years
ago with the aim of using climate change forecasting models to help companies understand the poten-tial physical impacts on their as-sets and how to prepare for natural disasters, Mazzacurati said.
“We had done a lot of work on the risks for equities and real as-sets – and expanded our work af-ter we discovered a large demand from fixed income investors,” Mazzacurati said.
The company’s first clients were large corporations with hun-dreds of facilities.
The firm expanded its offerings two years ago when investment
companies became interested in the potential impact on companies in their portfolios. A few months ago, that expanded again to mod-eling the risk for municipalities.
“Climate risk is increasingly a part of our credit analysis for mu-nicipal issuers across the country,” said Andrew Teras, senior analyst at Breckinridge in a statement. “The climate risk scores devel-oped by Four Twenty Seven pro-vide a comparable way to evaluate climate exposure and will give us another factor for assessing our investment universe.”
Though the bond rating agen-cies are increasingly integrating
Four Twenty Seven, a Berke-ley, California, company that de-veloped software to track climate change risks for private compa-nies, wants to help bond investors evaluate the risks to cities and counties.
Focusing on climate change-based economic risk analysis, the company created a software ap-plication using data to model the risks for cities and counties after it received a request from Breck-inridge Capital Advisors, a fixed income fund manager.
“Many of us think that climate change is the greatest socioeco-nomic danger out there and that there is a need for markets to un-derstand the risks,” said Emilie Mazzacurati, founder and chief executive officer of Four Twenty
“We discovered a large demand from fixed income investors,” said Em-ilie Mazzacurati, founder and CEO of Four Twenty Seven.
Tracking ImpactsOf Climate
Turn to Firm page 4
By Keeley WeBster
Four Twenty Seven
MMA President Tom Doe said the MSRB has effectively joined the vendor data pool with the growing amount of data it collects and disseminates.
THURSDAY’S YIELDS
Complete market coverage appears on page 2
2.8
3.3
3.8
4.3
4.8
5/315/255/225/17
The Bond Buyer 40
2.8
3.0
3.3
3.6
3.9
4.1
4.4
4.7
5.0
JMAMFJDNOSAJ
To Maturity3.94 Down 0.01
To Par Call3.68 Down 0.02
001_BB06011801 1 5/31/2018 5:11:08 PM
The Bond Buyer2 Friday, June 1, 2018
Brainard Says Policy May Become More Restrictive
With gradual tightening continuing, mon-etary policy will become slightly restrictive as the neutral rate remains low, Federal Reserve Board Gov. Lael Brainard said Thursday.
“This outlook suggests a policy path that moves gradually from modestly accommo-dative today to neutral — and, after some time, modestly beyond neutral — against the backdrop of a longer run neutral rate that is likely to remain low by historical standards,” Brainard said in remarks pre-pared for delivery in New York, released by the Fed.
While the neutral rate should rise over the medium term, but her long-term outlook for the neutral rate remains.
“I expect current tailwinds to boost the neutral rate gradually over the medium term but leave little imprint on the long-run neutral rate,” she said.
“I continue to view gradual increases in the federal funds rate as the appropriate path,” Brainard added, “although I will re-main vigilant for the emergence of risks and prepared to adjust if conditions change.”
Discussing the flattening yield curve, Brainard noted, “So while I will keep a close watch on the yield curve as an important signal on how tight financial conditions are becoming, I consider it as just one among several important indicators. Yield curve movements will need to be interpreted within the broader context of financial conditions and the outlook and will be one of many considerations informing my assessment of appropriate policy.”
Brainard also noted the forward-guidance language in the post-meeting statements that the fed funds rate is likely to remain be-low its long-run levels “is growing stale and may no longer serve its original purpose.”
— Gary E. Siegel
Personal Income Data Show Inflation Just Below Target
Nominal personal consumption expendi-tures rose 0.6% in April, a stronger gain that expected, while core PCE prices rose 0.2% to keep the year/year rate at 1.8% after a March revision, both factors that will weigh on the minds of analysts ahead of the June FOMC meeting, data released by the Bureau of Economic Analysis Thursday morning suggested.
The core price index’s 1.8% year/year rise in April was unchanged from March after that month’s year/year pace was revised down after rounding. Either way, it remains well above the 1.5% rate seen in the first two months of the year before a special factor in March 2017 rolled out of the calculation.
The 0.6% gain in current dollar PCE, well ahead of the 0.4% rise expected, followed an upward revised 0.5% gain in March. Spending on durable goods rose 0.3% in the month, while nondurable goods spend-ing jumped 0.9% on a 1.5% gain in energy prices. Services spending was up 0.5%.
Real PCE was up only 0.4% in April, as the overall PCE price index was up 0.2% due to that gain in energy prices. The overall price index was up 2.0% year/year, the same as in March.
— Market News International
U.S. Jobless Claims Decline, Remain Above Recent Lows
Initial claims for U.S. state unemploy-ment benefits fell by 13,000 to 221,000 in the May 26 week, below the 224,000 level expected.
The four-week moving average rose by 2,500 to 222,250.
The level of continuing claims fell by 16,000 to 1.726 million in the May 19 week after rising by 30,000 in the previ-ous week. The four-week average for con-tinuing claims fell 8,500 to 1.744 million, another decades-low level.
— Market News International
INBRIEF
Government Securities Prices 10-year: 10011/32 to yield 2.83%, up 3/32
30-year: 10215/32 to yield 3.00%, up 9/32
Municipal Bond Index 12624/32, up 5/32
The Bond Buyer’s Total: $12.576 billion, up $1.945 billion
30-Day Visible Supply Competitives: $5.503 billion, down $60.7 million
(as of 6/01) Negotiated: $7.073 billion, up $2.006 billion
TheMuniCenter List Offering Total: $19.608 billion, down $436.0 million
Thursday’s Data
Thursday’s Economic Indicators
Indicator Last Report Forecast Actual
Initial Jobless Claims 5/19: 234,000 5/26: 225,000 5/26: 221,000Continuing Claims 5/12: 1.742M 5/19: n/a 5/19: 1.726M
Personal Income March: +0.2% April: +0.3% April: +0.3%
Consumption March: +0.5% April: +0.4% April: +0.6%Core PCE March: +0.2% April: +0.1% April: +0.2%Chicago PMI April: 57.6 May: 58.0 May: 62.7
Pending Home Sales March: +0.6% April: +0.5% April: -1.3% Forecasts represent the median of estimates by economists polled by IFR Markets
$-3B
$-2B
$-1B
$0
$1B
$2B
$3B
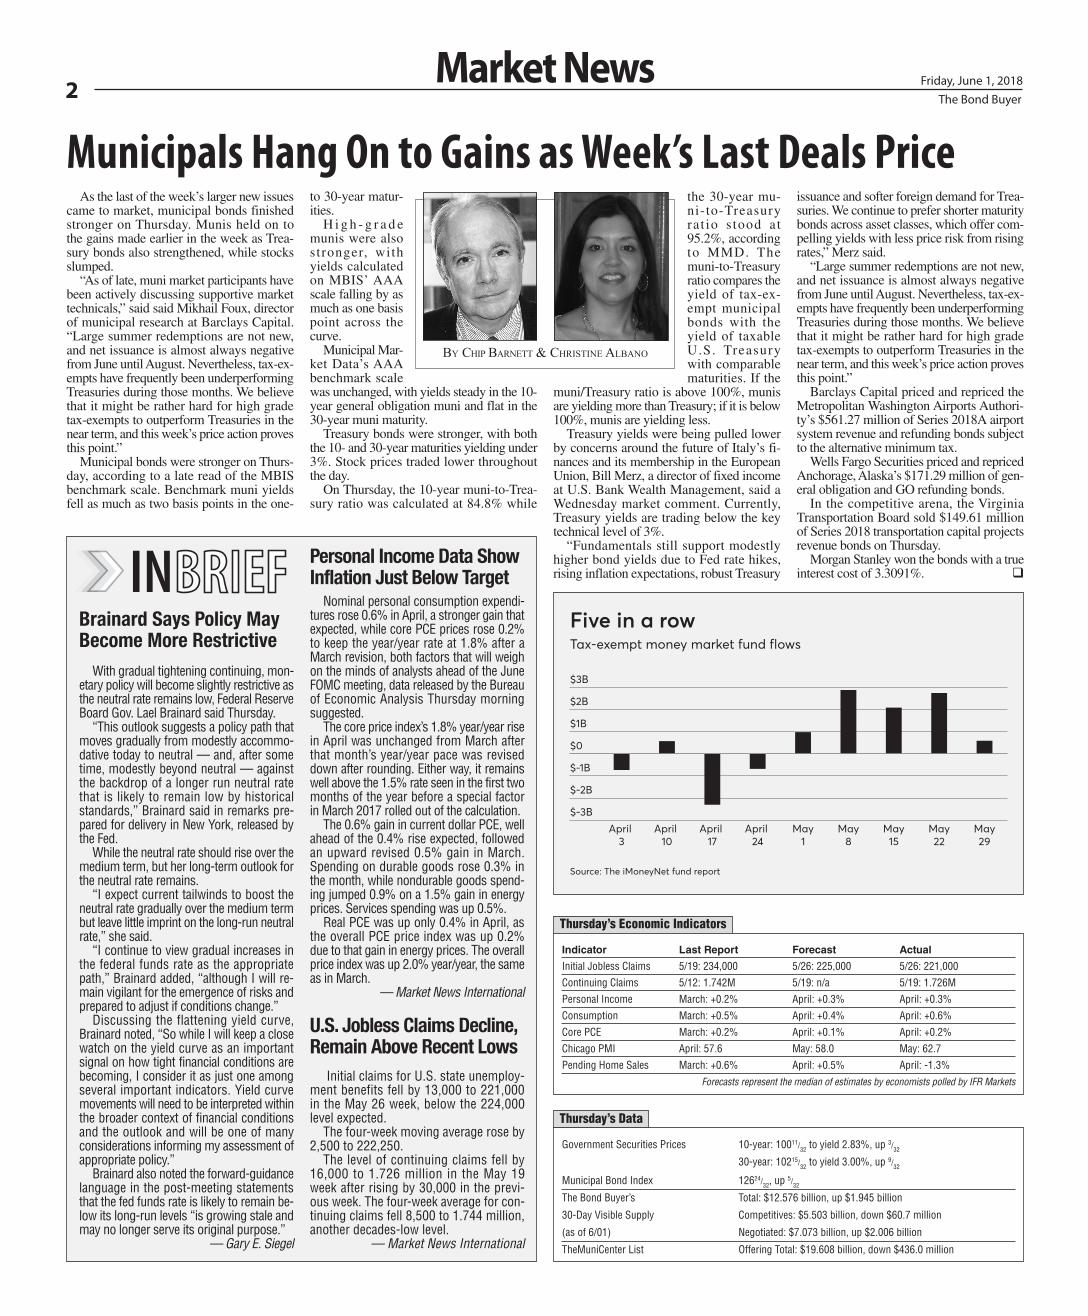
Five in a rowTax-exempt money market fund flows
Source: The iMoneyNet fund report
April 3
April 10
April 17
April 24
May1
May8
May15
May22
May29
As the last of the week’s larger new issues came to market, municipal bonds finished stronger on Thursday. Munis held on to the gains made earlier in the week as Trea-sury bonds also strengthened, while stocks slumped.
“As of late, muni market participants have been actively discussing supportive market technicals,” said said Mikhail Foux, director of municipal research at Barclays Capital. “Large summer redemptions are not new, and net issuance is almost always negative from June until August. Nevertheless, tax-ex-empts have frequently been underperforming Treasuries during those months. We believe that it might be rather hard for high grade tax-exempts to outperform Treasuries in the near term, and this week’s price action proves this point.”
Municipal bonds were stronger on Thurs-day, according to a late read of the MBIS benchmark scale. Benchmark muni yields fell as much as two basis points in the one-
to 30-year matur-ities.
H i g h - g r a d e munis were also stronger, with yields calculated on MBIS’ AAA scale falling by as much as one basis point across the curve.
Municipal Mar-ket Data’s AAA benchmark scale was unchanged, with yields steady in the 10-year general obligation muni and flat in the 30-year muni maturity.
Treasury bonds were stronger, with both the 10- and 30-year maturities yielding under 3%. Stock prices traded lower throughout the day.
On Thursday, the 10-year muni-to-Trea-sury ratio was calculated at 84.8% while
Market News
Municipals Hang On to Gains as Week’s Last Deals Pricethe 30-year mu-ni-to-Treasury rat io s tood at 95.2%, according to MMD. The muni-to-Treasury ratio compares the yield of tax-ex-empt municipal bonds with the yield of taxable U.S. Treasury with comparable maturities. If the
muni/Treasury ratio is above 100%, munis are yielding more than Treasury; if it is below 100%, munis are yielding less.
Treasury yields were being pulled lower by concerns around the future of Italy’s fi-nances and its membership in the European Union, Bill Merz, a director of fixed income at U.S. Bank Wealth Management, said a Wednesday market comment. Currently, Treasury yields are trading below the key technical level of 3%.
“Fundamentals still support modestly higher bond yields due to Fed rate hikes, rising inflation expectations, robust Treasury
issuance and softer foreign demand for Trea-suries. We continue to prefer shorter maturity bonds across asset classes, which offer com-pelling yields with less price risk from rising rates,” Merz said.
“Large summer redemptions are not new, and net issuance is almost always negative from June until August. Nevertheless, tax-ex-empts have frequently been underperforming Treasuries during those months. We believe that it might be rather hard for high grade tax-exempts to outperform Treasuries in the near term, and this week’s price action proves this point.”
Barclays Capital priced and repriced the Metropolitan Washington Airports Authori-ty’s $561.27 million of Series 2018A airport system revenue and refunding bonds subject to the alternative minimum tax.
Wells Fargo Securities priced and repriced Anchorage, Alaska’s $171.29 million of gen-eral obligation and GO refunding bonds.
In the competitive arena, the Virginia Transportation Board sold $149.61 million of Series 2018 transportation capital projects revenue bonds on Thursday.
Morgan Stanley won the bonds with a true interest cost of 3.3091%. q
By Chip Barnett & Christine alBano
002_BB06011801 2 5/31/2018 5:11:11 PM

www.bondbuyer.com 3Friday, June 1, 2018 Commentary
What Italy’s Government Machinations Mean for MunisThe recent government machinations in
Italy and the consequent market reactions in sovereign bonds and currencies are reminis-cent of the fallout earlier this decade from developments in Greece. Although Italy’s GDP is not growing as fast as officials would desire, the finances are not encountering as much difficulty as Greece. What are the im-plications for the municipal market?
The volatility that was on display earlier this week with Italian bonds could easily hap-pen here once again. We have a significant mid-term election that has the possibility of redirecting fiscal and monetary policy until 2020. Although we have a federal budget agreement for a couple of years, factors could change rapidly after that period of bipartisan agreement.
Of course, we are not concerned about any currency change, but we are focused on a stronger or weaker dollar. Though a some-what weaker dollar may serve to support more trade, it is far from clear whether we are going to have a renegotiated NAFTA and whether or not we will have much higher tariffs on foreign goods, including up to a potential 25% on imported vehicles.
Municipals rallied significantly along with Treasury equivalents as Italy has veered. In some aspects, municipals even out-rallied
the taxable markets. We reversed course after the last couple of days as the equity markets recovered from the initial shock.
The initial reactions in the municipal mar-ket could have been even more pronounced. Underlying the bid in the market and the
market tone is the sharp reduction in munic-ipal supply. Supply YTD is running about 22% below last year’s volume. This condition begs the question: what will happen when we have a spike in supply with one of the many percolating event risks taking place simul-taneously? I trust that you already know the answer. Spreads have the tendency to widen holding other factors constant.
The market has not violently overreacted because we know that the economy is in fine shape at the moment. Corporate earnings have been strong, as we have just witnessed through the cycle, and unemployment is at a decade-plus low. We are just ever vigilant about what domestic policies or global forces may upend the balance.
The bid side for municipal paper remains strong, in part due to the continuing positive flows to the mutual funds. In the new tax environment, even though some demand is undoubtedly affected by the reduced corpo-rate rate, many individuals leaving out high net worth individuals are more affected by the cap on SALT deductibility. There are few alternatives to the favorable status of the tax exemption.
The recent volatility has proven that many municipal investors are in the product for the long haul. They need that coupon. It hasn’t caused municipal investors to either pile in or to flee from the paper. The only real com-
ponent of the buyer base that can exhibit this behavior and to take advantage of disloca-tions is the institutional side.
There is no real fear of contagion in our market at present. Despite a cautious ap-proach to acting as principal and taking on more exposure, the broker-dealers have been providing ample liquidity. Bid lists are often posted and have been withdrawn or cancelled at times. The lists that are out there tend to be well bid. We do not see this changing, given the present tone.
Of course, the FED is a stabilizing force when the markets are in flux. The FED has been careful about tightening and slowing the application as the data dictates.
If the Eurozone is to be challenged by a potential exit by Italy, there is no doubt there would be a marked reaction in the markets. We would expect that municipals would re-act in a partially correlated way with the Treasury market. However, given the prob-able supply scenario remaining at a lower level, we would not expect municipals to overcompensate. What is instructive about the situation in Italy is that fiscal policy can be radically changed in swift fashion. We await the mid-terms for clues about the future course for the market.
John Hallacy is contributing editor of The Bond Buyer.
By John hallacy
Congratulations Ginny Housum!
UMB.com | 816.860.7000
UMB Bank congratulates Virginia (Ginny) Housum on her recognition at the NFMA 35th Annual Conference for her contributions to the municipal analyst industry.
Member FDIC
ber,” said Mary Colby, vice president and head of municipal research a Charles Schwab Investment Management. Colby said change has been so dramatic in the muni market from that time, noting for example the sharp decline in bond insurance coverage.
Tom Doe, president of Municipal Market Analytics, said that although the marketplace has access to far more data now than it did ten years ago, some of the fundamental chal-lenges have not gone away.
“Trading really hasn’t changed in terms of the volume,” Doe said. “Liquidity remains an issue. We don’t have more liquidity just because we have more offerings, more bonds available.”
Doe said that the market has not yet per-fected how to use all the data now available. A former Municipal Securities Rulemaking Board member, Doe said that the MSRB has now effectively joined the data vendor pool as the amount of data it collects and dissem-inates has grown over the years. “They are now a player in the vendor space,” Doe said, adding that he and others have speculated that the MSRB should split into rulemaking and data divisions.
Doe said current increases in risky issu-ances as a percentage of the overall market -- a product of the low interest rate environ-ment that has persisted since the crisis -- are somewhat similar to the run-up to the crisis when risky issuance became more common for several quarters.
The panelists also discussed the significant regulatory changes that occurred as a result of the crisis, saying that they were generally
well-intentioned but in some cases were not effective or were misguided.
“I think the concern with systemic risk was well-placed,” said Rick Cosgrove, a partner at the law firm of Chapman and Cut-ler. But despite the efforts of lawmakers to reduce systemic risk through the Dodd-Frank Act, Cosgrove said, some of the banks are larger than they were before the crisis.
Colby and Cosgrove also agreed that ten-der option bonds, or TOBs, were unfairly swept up in regulatory changes. The Volcker Rule, named for former Federal Reserve Board chairman Paul Volcker and part of Dodd-Frank, was aimed at restricting pro-prietary trading by banks. The rule restricted banks and their affiliates from sponsoring a TOB program or owning a residual certifi-cate issued by a TOB trust, forcing bankers to come up with new structures to cover the market. “A lot of us felt TOBs got mistreat-ed,” said Cosgrove.
Moderator Alex Wallace, a managing di-rector at U.S. Bank, said he thinks Dodd-Frank‘s creation of a municipal advisor regulatory regime was responsible for the popularity of bank direct lending over the past decade.
“The municipal advisor rule has been a significant change in our marketplace,” said Wallace. “I do believe that additional burden contributed to an increased interest in the direct purchase market.”
Panelists said they are not convinced the market is prepared for the next potential cri-sis.
“I think the jury is out, Doe said.“I think we have a lot of work to do,” Wal-
lace said. q
Analysts Reflect on Changes in Muni Market Since Financial CrisisContinued from page 1
The bid side for municipal paper remains strong amid international market volatiltiy, Hallacy writes.
003_BB06011801 3 5/31/2018 5:11:12 PM
The Bond Buyer4 Friday, June 1, 2018
TRENDS IN THE REGIONFar West
Firm Pinpoints Governments FacingGreatest Risks From Climate Change
climate risk into their municipal ratings, they lack concrete metrics that compare and assess how cities and counties are exposed to specific hazards, according to a report the company released last week.
Four Twenty Seven provides local cli-mate risk scores that provide comparable, forward-looking data to fill this gap, Maz-zacurati said.
“Each city and county is assigned a score based on how it ranks nationwide, which provides investors with comparable detail to complement the assessments of credit rating agencies,” according to the report.
The firm took global climate change models used by international research in-stitutions and created a set of scores for U.S. cities and counties above a certain population, she said.
The software application created by Four Twenty Seven processes trillions of bytes of data boiling it down to a few characteristics, she said. For instance, the firm can compare flooding problems in various counties and rank them on a risk basis.
The report outlines the firm’s approach to measuring exposure to climate hazards and pinpoints the cities and counties most exposed to the impacts of climate change.
“This new dataset provides a compre-hensive suite of risk scores to better inform ratings and pricing decisions,” Mazzacurati said. “The risk scores will be very helpful for all market participants, including muni bond investors, local governments, and ratings agencies.”
The research targets five major climate categories: cyclones and hurricanes, sea level rise, extreme rainfall, heat stress, and water stress. It covers all 3,143 U.S. coun-ties and 761 cities with populations over 50,000 as of 2015.
“This fits squarely in the realm of in-formation that the market wants to know – including us,” said Kurt Forsgren, an S&P Global Ratings analyst.
Four Twenty Seven appears to be the first to release this sort of data, but there are oth-er companies with similar efforts that are trying to provide such information down to zip codes, Forsgren said.
“As a market participant, we recognize there are credit risks associated with chang-es in the environment,” Forsgren said. “We would be a consumer of this information. Much as we look at long-term forecasts of financials and look at engineering reports to form credit views, we would be very interested in this information.”
S&P and Moody’s Investors Service both released reports in 2017 explaining their methodologies for incorporating climate change into their municipal credit ratings. Fitch Ratings just released a report Tuesday explaining its approach.
“Our earlier piece recognized that the muni market has had risks like this for years. There have always been hurricanes,” Forsgren said. “What is different is that we are getting more, and better information, of what those risks are, and we have begun to see what the exposures are if those risks are not addressed.”
The rating agencies all consider financial management, planning and the economic diversity of the municipalities in their ap-proaches.
But in the absence of forward-looking climate projections, the estimates used by the rating agencies “may grossly underes-timate the magnitude of future risks, or at least fail to characterize the type of climate risks that may eventually make it more dif-ficult for a municipality to meet its financial obligations,” according to the firm’s report.
Moody’s published a report in Novem-ber listing six indicators it uses “to assess the exposure and overall susceptibility of U.S. states to the physical effects of cli-mate change.” For instance, the indicators included the share of economic activity for the states that comes from coastal areas or homes located in a flood plain.
Fitch Ratings analysts wrote that they
consider environmental factors in their credit ratings through the lens of a fun-damental credit risk. Fitch also noted that “the federal government approved $130 billion in aid for natural disasters last year, a considerable 0.7% of the country’s $19.7 trillion economy.”
Fitch analysts said they don’t anticipate such a scenario, but added that if the federal government pulled back on its current level of aid it would be a credit negative for cities and counties.
The federal government’s role in disaster response is critical in mitigating natural disaster risk for ratings on state and local governments,” said Michael Rinaldi, a Fitch senior director.
With the exception of Hurricane Katrina in Louisiana, rating actions directly linked to climate change or natural disasters have historically been limited; but the kind of damage to vital infrastructure and wide-spread depopulation that occurred during Katrina have become more commonplace, most recently with the hurricanes that struck the southeast last year, Fitch said.
In addition to providing information to rating agencies and investors, the compa-ny’s analysis can also help municipalities better prepare for natural disasters, said Nik Steinberg, Four Twenty Seven’s director of analytics.
Every region of the country has unique vulnerabilities to weather-related disasters, according to the report.
The coastal areas with the highest ex-posure to problems from rising sea levels are the San Francisco Bay Area, the Pacific Northwest, New Jersey and Virginia in the mid-Atlantic region and North Carolina and Florida.
The southeast has the greatest exposure to cyclone and hurricane risk, which tend to be less frequent and weaker in the mid-At-lantic and Northeast. The Midwest has the greatest exposure to heightened flood risk due to changing rainfall patterns.
Drought and the potential for wildfires
falls in the “water stress” category – a con-dition expected to worsen in the Southwest, Pacific Northwest and Western Pacific.
Eight major cities in California could face downgrades in the absence of water supply alternatives and sustained cutbacks in use, according to the report.
Key watersheds for agricultural produc-tion such as the Central Valley aquifer sys-tem in California and the Ogallala Aquifer in the Great Plains are highly exposed to water stress.
The agriculturally-dominated areas of Bakersfield, Delano, and Visalia, Califor-nia, along the Central Valley Aquifer are among the ten cities most exposed to water stress. Similarly, municipalities along the Ogallala Aquifer in the Great Plains also rely heavily on agriculture and are among the most exposed to water stress.
The Southeast and the Midwest, concen-trated in Missouri and western Illinois and fanning out to the Great Plains, Mississippi River Basin and Florida, have the greatest exposure to heat stress.
Rising temperatures pose “serious risks to the nation’s energy infrastructure and labor force,” according to the report.
The highest heat stress scores in the re-port tend to be centered in the Southeast and Midwest, concentrated in Missouri and western Illinois and then fanning out to the Great Plains, Mississippi River Basin, and Florida. The desert Southwest and agricul-turally-dominated counties in the Sacra-mento Valley and southeastern Washington State also had high heat scores.
Extreme temperatures grounded flights in Phoenix last July and could drive up en-ergy costs for car manufacturers that have moved to Missouri, the report said. q
For more content about this region, visit the Regional News tab on BondBuyer.com.
Continued from page 1
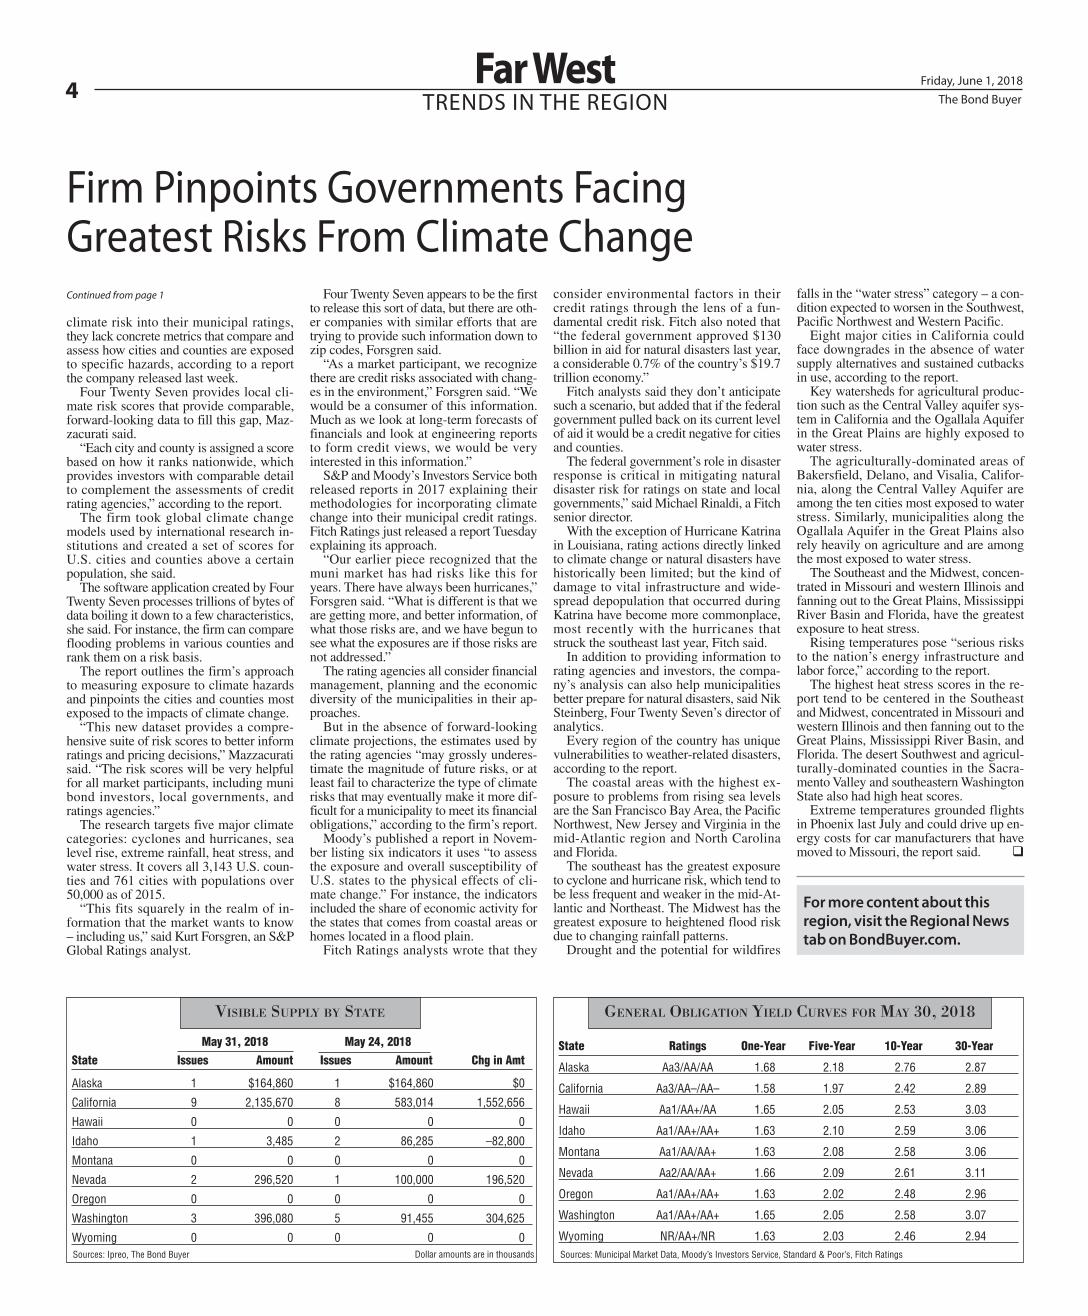
Alaska Aa3/AA/AA 1.68 2.18 2.76 2.87
California Aa3/AA–/AA– 1.58 1.97 2.42 2.89
Hawaii Aa1/AA+/AA 1.65 2.05 2.53 3.03
Idaho Aa1/AA+/AA+ 1.63 2.10 2.59 3.06
Montana Aa1/AA/AA+ 1.63 2.08 2.58 3.06
Nevada Aa2/AA/AA+ 1.66 2.09 2.61 3.11
Oregon Aa1/AA+/AA+ 1.63 2.02 2.48 2.96
Washington Aa1/AA+/AA+ 1.65 2.05 2.58 3.07
Wyoming NR/AA+/NR 1.63 2.03 2.46 2.94
State Ratings One-Year Five-Year 10-Year 30-Year
General ObliGatiOn Yield Curves fOr MaY 30, 2018
Sources: Municipal Market Data, Moody’s Investors Service, Standard & Poor’s, Fitch Ratings
Alaska 1 $164,860 1 $164,860 $0
California 9 2,135,670 8 583,014 1,552,656
Hawaii 0 0 0 0 0
Idaho 1 3,485 2 86,285 –82,800
Montana 0 0 0 0 0
Nevada 2 296,520 1 100,000 196,520
Oregon 0 0 0 0 0
Washington 3 396,080 5 91,455 304,625
Wyoming 0 0 0 0 0Sources: Ipreo, The Bond Buyer
May 31, 2018 May 24, 2018State Issues Amount Issues Amount Chg in Amt
visible supplY bY state
Dollar amounts are in thousands
004_BB06011801 4 5/31/2018 5:11:12 PM
www.bondbuyer.com 5Friday, June 1, 2018 Regions
Settlement is in Sight for Harvey Pension Intercept DisputeCHICAGO – Harvey, Illinois, and its
pension funds are working to finalize a settlement that would free up some state-intercepted revenues for the fis-cally distressed city while satisfying the funds’ demands for overdue contri-butions.
A court hearing scheduled Thursday before Cook County Circuit Court Judge Raymond Mitchell on a preliminary injunction involving the status of $2.3 million intercepted by state Comptroller Susana Mendoza was moved to Tuesday.
“Hopefully, we are there,” said Har-vey’s attorney, Bob Fioretti of Roth Fio-retti LLC. “We are working to satisfy the statutory pension requirements by 2040 and meet the needs of the city.”
Fioretti cautioned that the deal was far from final and the city has seen pre-vious settlements it thought were on firm ground fall apart.
The percentages each would receive from the pot of about $7 million in state collected city revenues also could change.
The police fund has agreed to the lat-est settlement version and the firefight-ers’ fund board was slated to consider it by the end of the week so it could be presented to the judge Tuesday.
Firefighters’ fund attorney Andrew
Schwartz, of Schwartz & Kanyock LLC, confirmed the fund was working on a settlement but declined any further com-ment. The police fund’s lawyer, Michael Moirano, of Moirano Gorman Kenny LLC, did not respond to a request for comment.
The fiscally distressed city had been seeking to keep at least 75% of its funds to cover payroll and critical services but the latest settlement version requires the city to give up more.
“The city is tightening its budget” to address the higher amount it would forgo, Fioretti said.
The Harvey fund diversions are the first to take place under a 2011 public safety pension funding law that allows for “state funds” to be intercepted to pay overdue actuarially based contri-butions to pension funds. The police fund was the first to file to cover a $7 million judgment and firefighters soon after filed requesting payment on a $12 million judgment.
The city challenged the police fund’s certified diversion request.
Mendoza concluded her review last week of the city’s protest, finding that the police fund was eligible to receive the city’s share of state sales taxes and other funds.
The office has concluded it has no discretion under the law to divvy up the
revenue between the pension funds or the city.
The judge granted a temporary re-straining order last week blocking the comptroller’s distribution of the $2.3 million to the police fund. The court did free up the city’s share of home rule sales taxes after the comptroller’s con-cluded they don’t count as “state funds.”
Those funds had previously been go-ing directly to the trustee -- Amalgam-ated Bank of Chicago -- on $6 million of city revenue bonds along with the city’s share of state sales taxes. State sales taxes are now subject to intercep-tion, but the freed-up home rule reve-nue should be sufficient to cover about $600,000 in annual debt service.
The settlement is complicated by con-flicts between the police and firefighter funds. The police fund was the first to submit an official claim and has argued it should receive priority status. The firefighters’ fund argues it should share in the funds. The individual boards are also divided among retiree members and working members who have divergent interests.
Mitchell has made clear during recent hearings of his preference for a settle-ment and the comptroller’s office, which is represented by Attorney General Lisa Madigan, hopes also for a settlement or guidance on how to manage claims.
Market participants are watching closely to see how the Harvey case plays out because it raises short- and long-term questions. Rating agencies have warned a flood of other pension funds could follow the Harvey funds’ lead and there are several hundred that have been shorted by their government sponsors.
The intercept also has sparked wor-ries that bondholders’ legal claims will fall behind pensioners and could lead to impairment as distressed governments look for ways to preserve funding for critical services.
Moody’s Investors Service warned this week in a report that certification of the police fund’s diversion represented a credit negative for all of the state’s lo-cal governments as it further reinforces the idea that holders of Illinois local government bonds fall behind pension funds.
If a settlement is finalized, Harvey’s lawsuit challenging the legality of the diversion of funds will be dropped so questions over the law’s enforcement and priority status won’t be settled un-less there is a challenge in another city.
Harvey’s lawsuit argues that critical services and bondholders have a supe-rior claim to the pension judgments and its revenues can’t be diverted to cover judgments. q
By yvette ShieldS
BB 20-Bond Index BB Revenue Bond IndexBB 11-Bond Index
3.0
3.5
4.0
4.5
5.0
5/315/24
5/175/10
5/34/26
4/194/12
4/53/28
3/223/15
3/82.5
3.0
3.5
4.0
4.5
5/315/24
5/175/10
5/34/26
4/194/12
4/53/28
3/223/15
3/83.7
3.9
4.2
4.4
4.7
5/315/24
5/175/10
5/34/26
4/194/12
4/53/28
3/223/15
3/8
BB Municipal Bond Index Yield to Maturity
4.0
4.3
4.7
5.1
5.5
5/315/24
5/175/10
5/34/26
4/194/12
4/53/28
3/223/15
3/8
Figures are weekly averages for daily yields from the BB40 ending Thursday
3.78%Down 0.12
3.26%Down 0.12
4.27%Down 0.12 3.96%
Down 0.06
The Bond Buyer Indexes
The Puerto Rico Senate refused to give in to an Oversight Board demand on labor regulations, the latest episode in a struggle over policy measures intended to pull the territory out of recession and help in the payment of its debt.
The Senate on Wednesday voted 22-9 for a measure that would introduce at-will employment only for employees entering the workforce in the future. The Oversight Board had demanded a repeal of Law 80 — which since 1976 has allowed Puerto Rico employees to appeal terminations — for all of the island’s workers.
The repeal of the law was part of a May 20 compromise between the board and
Gov. Ricardo Rosselló over the board’s April-approved fiscal plan. The board agreed to drop the plan’s elimination of the Christmas bonus and reductions to mandatory vacation and sick days. In ex-change, the governor agreed to introduce at-will employment on the island.
In the agreement with the board, the governor said that he would approve at-will employment on or before June 27 and that the new status would become effective on Jan. 1, 2019.
Senators from the governor’s New Progressive Party voted in favor of the watered down termination law change. Members of the Popular Democratic Party, one member of the Independence Party, and one unaffiliated Senator cast the op-
position votes.“We said that we were not going to re-
peal Law 80 and we did not repeal it, we said that we were going to protect the workers and we are doing it, this remains clear,” said Senate President Thomas Ri-vera Schatz, a member of the NPP with the governor.
On Thursday the board said that the Senate’s action is “inconsistent with the understanding reached with the govern-ment and with the revised Fiscal Plan.”
It remains to be seen how the conflict over the employment laws plays out.
However, on Thursday, board Chairman José Carrión, said, “The [fiscal plan’s] fiscal and structural reforms, including the changes proposed by the governor which
are contingent on the approval of legisla-tion by the end of this fiscal year to make Puerto Rico an ‘at-will employment’ juris-diction (repeal of Law 80) for current and new employees, will help return growth to our island’s economy.”
On Thursday the board released a re-certified fiscal plan with changes to labor reforms and other sections from the April-approved plan. If Puerto Rico’s gov-ernment were not to repeal Law 80, the board could conceivably try to force the local government’s hand on the matter and also return to the April plan’s stricter approach on other labor policies.
The board said it agreed to the new re-certified fiscal plan by unanimous writ-ten consent. q
Puerto Rico Oversight Board, Senate Clash Over At-Will Labor DemandBy RoBeRt Slavin
005_BB06011801 5 5/31/2018 5:11:14 PM
The Bond Buyer6 Friday, June 1, 2018Legal Notices
NOTICE OF SALE
TOWNSHIP OF MAPLEWOOD, IN THE COUNTY OF ESSEX, NEW JERSEY
$17,130,000* GENERAL IMPROVEMENT BONDS(Book-Entry-Only Bonds)/(Callable)/(Not Bank Qualified)
SUMMARY
Dated: Date of Delivery – On or about June 28, 2018Bid Date and Time: June 12, 2018 at 10:30 a.m. to 10:45 a.m.Type of Sale: Electronic Open Auction Interest: Multiple Interest Rates - multiples of 1/8 or 1/20 of 1% Legal Opinion: McManimon, Scotland & Baumann, LLC, Roseland, NJMaturity Schedule: February 15 as set forth in the following table:
Year Principal Amount Year Principal Amount 2019 $860,000 2025 $1,720,000 2020 $860,000 2026 $1,720,000 2021 $860,000 2027 $1,720,000 2022 $880,000 2028 $1,720,000 2023 $1,675,000 2029 $1,720,000 2024 $1,675,000 2030 $1,720,000
Preliminary Official Statement, Notice of Sale and other details available at www.GrantStreet.com
*Preliminary, subject to change, as described herein.
United StateS diStrict coUrt For the diStrict oF PUerto ricoIn re:The FInancIal OversIghT and ManageMenT BOard FOr PuerTO rIcO, as representative ofThe cOMMOnWealTh OF PuerTO rIcO, et al. debtors.
PrOMesa Title III
case no. 17 BK 3283-lTs(Jointly administered)
notice oF eXtended deadLineS For FiLinG ProoFS oF cLaiM
deadLine eXtenSionto aLL creditorS oF the deBtorS, and to other PartieS in intereSt, PLeaSe taKe notice oF the FoLLoWinG:
The Financial Oversight and Management Board for Puerto rico has filed voluntary petitions under section 304(a) of the Puerto Rico Oversight, Management, and Economic Stability Act (“PrOMesa”),1 initiating Title III cases under PrOMesa (each, a “Title III case” and collectively, the “Title III cases”) for the debtors listed below (each, a “debtor” and collectively, the “debtors”). You may be a creditor of one of the debtors, and you may be required to file a proof of claim (“Proof of claim”).
the deadline to file a proof of claim has been extended to June 29, 2018 at 4:00 p.m. (atlantic time).if you have already filed a Proof of claim, no further action is required unless directed by court order, notice,
or otherwise. a list of the names of the debtors, their case numbers, and the commencement date of the debtors’ Title III cases is as follows:
title iii cases Federal tax id no. case no. commencement datecommonwealth of Puerto rico 3481 17 BK 3283 May 3, 2017Puerto rico sales Tax Financing corporation (“cOFIna”) 8474 17 BK 3284 May 5, 2017employees retirement system of the government of the commonwealth of Puerto rico (“ers”)
9686 17 BK 3566 May 21, 2017
Puerto rico highways and Transportation authority (“hTa”) 3808 17 BK 3567 May 21, 2017Puerto rico electric Power authority (“PrePa”) 3747 17 BK 4780 July 2, 2017
Key Points• InaTitleIIIproceedingunderPROMESA,creditorsmayberequiredtofileclaimformsstatingtheamountofmoneyowedto
them as of the day the Title III proceeding was filed. This notice explains how to file claims.• Many creditors in the title iii cases are not required to file a claim. For more information, please refer to the
claims agent’s website at https://cases.primeclerk.com/puertorico/, call the claims agent at (844) 822-9231 (toll free for u.s. and Puerto rico) or (646) 486-7944 (for international callers), available 10:00 a.m. to 7:00 p.m. (atlantic standard Time) (spanish available), or email at [email protected].
• if you are not required to file a claim, you do not need to complete and return a claim form, and you will still keep your rights to vote on a plan of adjustment and receive payments under the plan. a plan of adjustment is a document that explains how a debtor proposes to pay the amounts it owes to its creditors. Once filed, this plan will be available for creditors to review. Who gets to vote on the plan will be determined at a later date. The amount you may receive under the plan also will be determined later.
• if you are required to file a claim against any of the debtors, the deadline to do so has been extended to June 29, 2018 at 4:00 p.m., atlantic Standard time. To obtain a form that you may use to file your claim, refer to the contact infor-mation below.
• Claims may be filed (a) electronically on the Claims Agent’s website at https://cases.primeclerk.com/puertorico/EPOC-Index, (b) by overnight courier to commonwealth of Puerto rico claims Processing center c/o Prime clerk, llc, 850 Third avenue, suite 412, Brooklyn, nY 11232, (c) by first class mail to commonwealth of Puerto rico, claims Processing center, c/o Prime clerk llc, grand central station, P.O. Box 4708, new York, nY 10163-4708, or (d) by hand delivery at the claim Form drop-Off locations identified in the Information center on the claims agent’s website at https://cases.primeclerk.com/puertorico/ePOc-Index.
Afterreadingthisnotice,ifyourequireadditionalinformation,youmaycontacttheClaimsAgentat(844)822-9231(tollfreefor u.s. and Puerto rico) or (646) 486-7944 (for international callers), available 10:00 a.m. to 7:00 p.m. (atlantic standard Time) (spanish available), or by email at [email protected]. Please note that the people answering the phone number arenotabletoprovidelegaladvice.Ifyouhavequestionsaboutyourlegalrights,includingwhetheryouneedtofileaclaim,youshould talk to an attorney.1 PrOMesa is codified at 48 u.s.c. §§ 2101-2241.
006_BB06011801 6 5/31/2018 2:03:39 PM
www.bondbuyer.com 7Friday, June 1, 2018
For more inFormation, contact:
John hester (212)-849-5125James Kellum (212) 849-5156
• Full service electronic document delivery and tracking system
www.i-dealprospectus.com
I-DEAL PROSPECTUS ELECTRONIC OFFICIAL STATEMENTSNegotiated
Garland (city oF), tX combo taX & rev coo, series 2018massachusetts housinG Finance aGency, ma housinG bonds, series 2018 a&bhouston isd, tX ltd taX schoolhouse bonds, series 2018 houston isd, tX maintenance taX notes, series 2018 northwest isd, tX unltd taX school bldG bonds, series 2018sienna Plantation manaGement district, tX unlimited taX reFundinG bonds, srs 2018 san marcos (city oF), tX Go bonds & combo taX & revenue coo, series 2018 Katy isd, tX unlimited taX school buildinG bonds, series 2018mesa (city oF), aZ General obliGation bonds, series 2018 **Pos suPPlement has been added**houston isd, tX variable rate limited taX reFundinG bonds, series 2012houston isd, tX variable rate limited taX schoolhouse bonds, srs 2013bhouston isd, tX variable rate ltd taX schoolhouse bonds, series 2014a-1bst. martin (Parish oF), la hosPital service dist no. 2, Go bonds, srs 2018**s&P ratinGs rePort has been added**anderson county, tX unlimited taX road bonds, series 2018bucKeye (city oF), aZ roosevelt street imProv dist imProvement bonds, series 2018leander (city oF), tX General obliGation reFundinG bonds, series 2018st. martin (Parish oF), la hosPital service dist no. 2, Go bonds, srs 2018shrevePort (city oF), la water & sewer revenue bonds, Junior lien srs 2018cGarland (city oF), tX water & sewer system revenue reFundinG bonds, new series 2018el Paso isd, tX unlimited taX reFundinG bonds, series 2018FranKlin (county oF), oh various PurPose sales taX revenue bonds, series 2018venus (city oF), tX combination taX & rev coo, series 2018Garland (city oF), tX electric utility system rev reF bonds, new series 2018revenue authority oF Prince GeorGe’s county, md lease rev reF bonds, srs 2018a&bmesa (city oF), aZ General obliGation bonds, series 2018mesa (city oF) aZ, utility systems revenal bonds, srs 2018 Goodyear (city oF), aZ mcdowell road commercial corridor imProv dist reF bonds, srs 2018sPrinG branch isd, tX unlimited taX schoolhouse bonds, series 2018mesquite (city oF), tX ww&ss rev reF & imProv bonds, series 2018 mesquite (city oF), tX Go reF&imPrv bonds & combo taX<d surPlus rev coo, srs 2018 northside isd, tX unlimited taX reFundinG bonds, series 2018 tennessee hda, tn residential Finance ProGram bonds, issue 2018-2 (non-amt)montGomery county, tX unlimited taX road bonds, series 2018Fort bend isd, tX unlimted taX reFundinG bonds, series 2018lewisville isd, tX unlimited taX reFundinG bonds, series 2018Gilbert (town oF), aZ wrmPc senior lien utility sys rev bonds, srs 2018hutto isd, unlimited taX school buildinG bonds, series 2018conroe (city oF), tX limited taX reFundinG bonds, series 2018hutto economic develoPment corP tyPe b, tX sales taX rev bonds, taXable srs 2018temPle isd, tX unltd taX school buildinG bonds, series 2018
I-DEAL PROSPECTUSELECTRONIC OFFICIAL STATEMENTSCompetitive
6/11-harris county mud no. 537, tX unlimited taX road bonds, series 20186/12-arlinGton (city oF), tX municiPal drainaGe utility system rev bonds, series 20186/12- arlinGton (city oF), tX water & wasterwater system revenue bonds, series 2018a5/30-Fort worth (city oF), tX water & sewer system revenue bonds, series 2018 6/5-Fort atKinson (city oF), wi Go corPorate PurPose bonds, 20186/5-harris-waller counties mud no. 2, tX unlimited taX bonds, series 20186/6-berGen county, nJ ban & Go bonds, series 2018a&b6/11-carlisle community school district, ia Go school bonds, series 2018 6/11-east benard isd, tX unlimited taX school buildinG bonds, series 20186/12-south buda wc&id no. 1, tX unltd taX bonds, series 20186/12-cibolo (city oF), tX Genetal obliGation bonds, series 20186/5-Prairie du chien (city oF), Go corP PurP bonds, srs 2018c & nans, srs 2018d6/6-PulasKi community school distrist, wi Go sch bldG & imProv bonds6/6-harris county mud no. 495, tX unlimited taX bonds, series 20186/7-Jersey city (city oF), nJ notes, srs 2018b (taXable) & srs 2018c&d6/7-irvinG (city oF), tX Go bonds & taX notes, series 20186/7-irvinG (city oF), tX ww&ss new lien revenue imProvement bonds, srs 2018 6/7-oranGe usd, ca Go bonds, election oF 2016, series 20186/11-oKoboJi community school district, ia Go school bonds, series 20186/12-cibolo (city oF), tX Genetal obliGation bonds, series 2018**s&P ratinGs rePort has been added6/12-union (county oF), nJ Gen imPrv&county voc-tech school&county colleGe bonds, 2018 srs a&b7/10-GraettinGer-terril csd, ia Go school bonds, series 2018
BiDCOMP®/Parity®
www.newissuehome.i-deal.com
6/4 - City of Elkhorn (WI), WI
6/4 - City of Elkhorn (WI), WI
6/4 - Ankeny Community School District, IA
6/4 - White County (TN), TN
6/4 - Village of Oregon, WI
6/4 - Village of Oregon, WI
6/4 - Independent School District No. 318 (Itasca County), MN
6/4 - City of Manvel, TX
6/4 - City of Dayton (TX), TX
6/4 - Village of Cottage Grove, WI
6/4 - Independent School District No. 277 (Westonka), MN
6/4 - City of Gardner (KS), KS
6/4 - City of Lakefield, MN
6/4 - Town of Credit River Township (MN), MN
6/5 - City of Seattle, WA
6/5 - Town of Grand Chute, WI
6/5 - Town of Grand Chute, WI
6/5 - Brillion Public School District (WI), WI
6/5 - City of Greensboro, NC
6/5 - City of Greensboro, NC
6/5 - State of Ohio (OH), OH
6/5 - Hilton Central School District, NY
6/5 - City of Edina, MN
6/5 - County of Suffolk, NY
6/5 - Town of Clinton (MA), MA
6/5 - County of Brunswick, NC
6/5 - Town of Braintree, MA
6/5 - City School District of the City of Hudson, NY
6/5 - Independent School District No. 33 of Creek County (Sapulpa), OK
6/5 - Cambridge Central School District, NY
6/5 - Linn County (IA), IA
6/5 - Linn County (IA), IA
6/6 - Winterset Community School District, IA
6/6 - City of Emporia, KS
6/6 - City of Portsmouth (NH), NH
6/6 - Wayne County (OH), OH
6/6 - Village of Westbury, NY
6/6 - County of Bergen, NJ
6/6 - City School District of the City of Auburn, NY
6/7 - City of Blaine (MN), MN
6/7 - Town of Henrietta, NY
007_BB06011801 7 5/31/2018 2:03:40 PM

The Bond Buyer8 Friday, June 1, 2018
d36735_BB_Midwest _Keynote Bond Buyer_Print_Ad.indd 2 5/8/18 1:23 PM
008_BB06011801 8 5/31/2018 2:28:56 PM
9www.bondbuyer.comFriday, June 1, 2018
Amount Time of Bank- Latest Issuer St Description ($000s) Sale Financial Adviser Legal Opinion Maturing Insurer Mdy’s S&P Fitch KBRA Qual. Details
Competitive Bond Offerings *Preliminary and subject to change. SHADED LISTINGS ARE NEW.
Compiled by Ipreo
New Issues
A letter “P” signifies that a link to the POS is on the Bond Buyer Online's Competitive Bond Offering Calendar.
This monitor signifies the Notice of Sale is available on www.bondbuyer.comTo Report or Obtain Information
Competitive / Negotiated Offerings
Joycelyn Gumbs 212-849-3870
Priya Khandai 212-849-3871
Competitive / Negotiated Sales Results
Ruth-Ann Medina 212-849-3873
Anthony Andino 212-849-3868A “+” under Insurer in the Negotiated Bond Offerings and Negotiated Note Offerings signifies that insurance is available.
Fax: 212-404-8155; Email: [email protected]
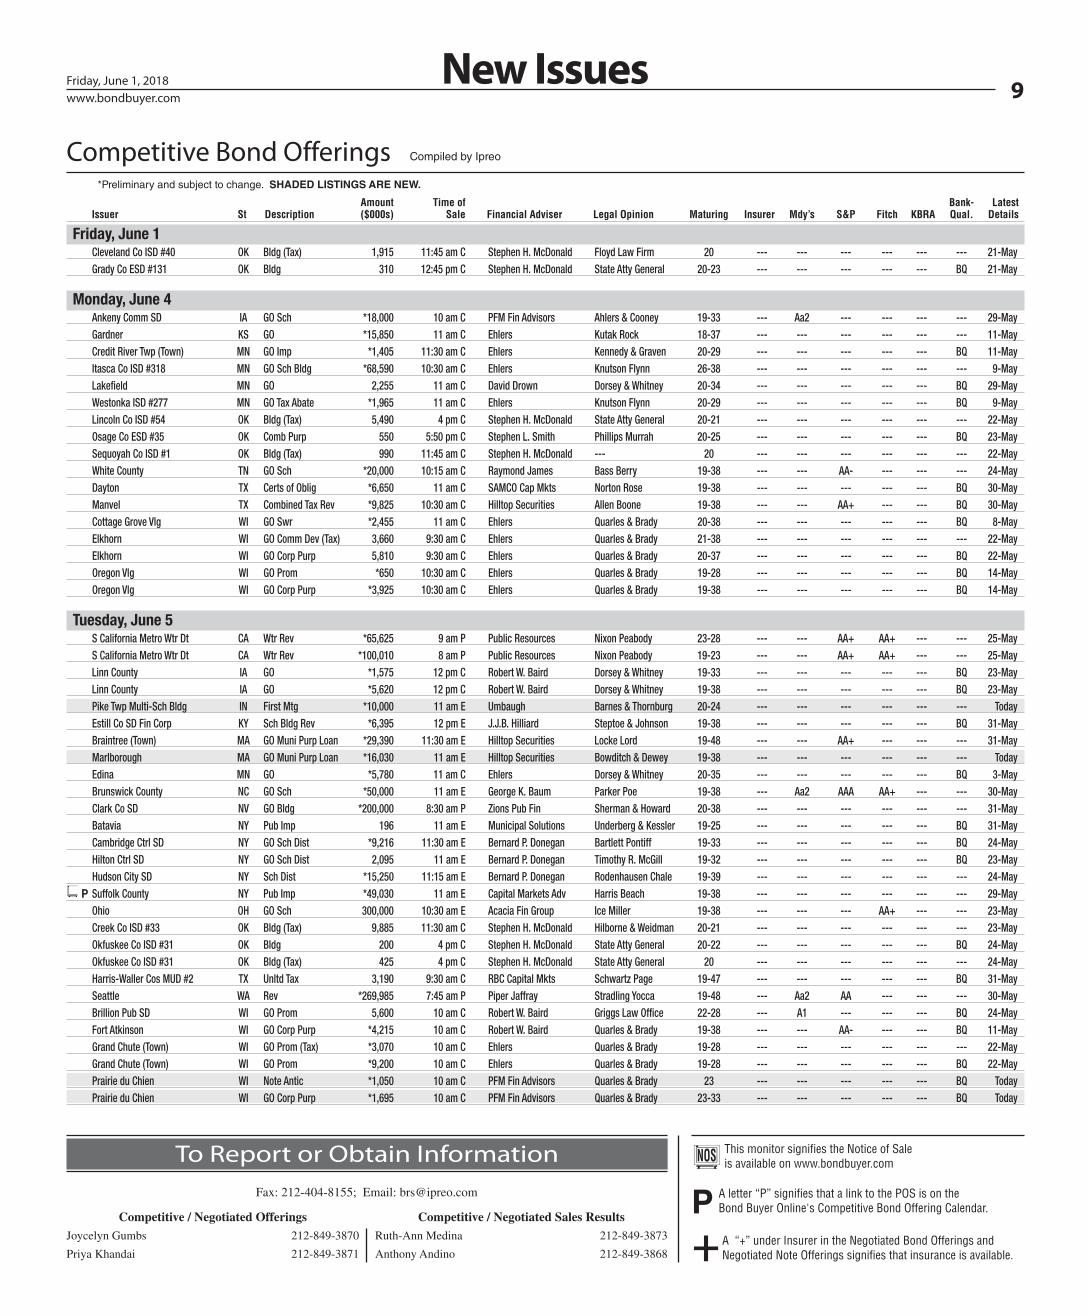
Friday, June 1 Cleveland Co ISD #40 OK Bldg (Tax) 1,915 11:45 am C Stephen H. McDonald Floyd Law Firm 20 --- --- --- --- --- --- 21-May Grady Co ESD #131 OK Bldg 310 12:45 pm C Stephen H. McDonald State Atty General 20-23 --- --- --- --- --- BQ 21-May
Monday, June 4 Ankeny Comm SD IA GO Sch *18,000 10 am C PFM Fin Advisors Ahlers & Cooney 19-33 --- Aa2 --- --- --- --- 29-May Gardner KS GO *15,850 11 am C Ehlers Kutak Rock 18-37 --- --- --- --- --- --- 11-May Credit River Twp (Town) MN GO Imp *1,405 11:30 am C Ehlers Kennedy & Graven 20-29 --- --- --- --- --- BQ 11-May Itasca Co ISD #318 MN GO Sch Bldg *68,590 10:30 am C Ehlers Knutson Flynn 26-38 --- --- --- --- --- --- 9-May Lakefield MN GO 2,255 11 am C David Drown Dorsey & Whitney 20-34 --- --- --- --- --- BQ 29-May Westonka ISD #277 MN GO Tax Abate *1,965 11 am C Ehlers Knutson Flynn 20-29 --- --- --- --- --- BQ 9-May Lincoln Co ISD #54 OK Bldg (Tax) 5,490 4 pm C Stephen H. McDonald State Atty General 20-21 --- --- --- --- --- --- 22-May Osage Co ESD #35 OK Comb Purp 550 5:50 pm C Stephen L. Smith Phillips Murrah 20-25 --- --- --- --- --- BQ 23-May Sequoyah Co ISD #1 OK Bldg (Tax) 990 11:45 am C Stephen H. McDonald --- 20 --- --- --- --- --- --- 22-May White County TN GO Sch *20,000 10:15 am C Raymond James Bass Berry 19-38 --- --- AA- --- --- --- 24-May Dayton TX Certs of Oblig *6,650 11 am C SAMCO Cap Mkts Norton Rose 19-38 --- --- --- --- --- BQ 30-May Manvel TX Combined Tax Rev *9,825 10:30 am C Hilltop Securities Allen Boone 19-38 --- --- AA+ --- --- BQ 30-May Cottage Grove Vlg WI GO Swr *2,455 11 am C Ehlers Quarles & Brady 20-38 --- --- --- --- --- BQ 8-May Elkhorn WI GO Comm Dev (Tax) 3,660 9:30 am C Ehlers Quarles & Brady 21-38 --- --- --- --- --- --- 22-May Elkhorn WI GO Corp Purp 5,810 9:30 am C Ehlers Quarles & Brady 20-37 --- --- --- --- --- BQ 22-May Oregon Vlg WI GO Prom *650 10:30 am C Ehlers Quarles & Brady 19-28 --- --- --- --- --- BQ 14-May Oregon Vlg WI GO Corp Purp *3,925 10:30 am C Ehlers Quarles & Brady 19-38 --- --- --- --- --- BQ 14-May
Tuesday, June 5 S California Metro Wtr Dt CA Wtr Rev *65,625 9 am P Public Resources Nixon Peabody 23-28 --- --- AA+ AA+ --- --- 25-May S California Metro Wtr Dt CA Wtr Rev *100,010 8 am P Public Resources Nixon Peabody 19-23 --- --- AA+ AA+ --- --- 25-May Linn County IA GO *1,575 12 pm C Robert W. Baird Dorsey & Whitney 19-33 --- --- --- --- --- BQ 23-May Linn County IA GO *5,620 12 pm C Robert W. Baird Dorsey & Whitney 19-38 --- --- --- --- --- BQ 23-May Pike Twp Multi-Sch Bldg IN First Mtg *10,000 11 am E Umbaugh Barnes & Thornburg 20-24 --- --- --- --- --- --- Today Estill Co SD Fin Corp KY Sch Bldg Rev *6,395 12 pm E J.J.B. Hilliard Steptoe & Johnson 19-38 --- --- --- --- --- BQ 31-May Braintree (Town) MA GO Muni Purp Loan *29,390 11:30 am E Hilltop Securities Locke Lord 19-48 --- --- AA+ --- --- --- 31-May Marlborough MA GO Muni Purp Loan *16,030 11 am E Hilltop Securities Bowditch & Dewey 19-38 --- --- --- --- --- --- Today Edina MN GO *5,780 11 am C Ehlers Dorsey & Whitney 20-35 --- --- --- --- --- BQ 3-May Brunswick County NC GO Sch *50,000 11 am E George K. Baum Parker Poe 19-38 --- Aa2 AAA AA+ --- --- 30-May Clark Co SD NV GO Bldg *200,000 8:30 am P Zions Pub Fin Sherman & Howard 20-38 --- --- --- --- --- --- 31-May Batavia NY Pub Imp 196 11 am E Municipal Solutions Underberg & Kessler 19-25 --- --- --- --- --- BQ 31-May Cambridge Ctrl SD NY GO Sch Dist *9,216 11:30 am E Bernard P. Donegan Bartlett Pontiff 19-33 --- --- --- --- --- BQ 24-May Hilton Ctrl SD NY GO Sch Dist 2,095 11 am E Bernard P. Donegan Timothy R. McGill 19-32 --- --- --- --- --- BQ 23-May Hudson City SD NY Sch Dist *15,250 11:15 am E Bernard P. Donegan Rodenhausen Chale 19-39 --- --- --- --- --- --- 24-May
P Suffolk County NY Pub Imp *49,030 11 am E Capital Markets Adv Harris Beach 19-38 --- --- --- --- --- --- 29-May Ohio OH GO Sch 300,000 10:30 am E Acacia Fin Group Ice Miller 19-38 --- --- --- AA+ --- --- 23-May Creek Co ISD #33 OK Bldg (Tax) 9,885 11:30 am C Stephen H. McDonald Hilborne & Weidman 20-21 --- --- --- --- --- --- 23-May Okfuskee Co ISD #31 OK Bldg 200 4 pm C Stephen H. McDonald State Atty General 20-22 --- --- --- --- --- BQ 24-May Okfuskee Co ISD #31 OK Bldg (Tax) 425 4 pm C Stephen H. McDonald State Atty General 20 --- --- --- --- --- --- 24-May Harris-Waller Cos MUD #2 TX Unltd Tax 3,190 9:30 am C RBC Capital Mkts Schwartz Page 19-47 --- --- --- --- --- BQ 31-May Seattle WA Rev *269,985 7:45 am P Piper Jaffray Stradling Yocca 19-48 --- Aa2 AA --- --- --- 30-May Brillion Pub SD WI GO Prom 5,600 10 am C Robert W. Baird Griggs Law Office 22-28 --- A1 --- --- --- BQ 24-May Fort Atkinson WI GO Corp Purp *4,215 10 am C Robert W. Baird Quarles & Brady 19-38 --- --- AA- --- --- BQ 11-May Grand Chute (Town) WI GO Prom (Tax) *3,070 10 am C Ehlers Quarles & Brady 19-28 --- --- --- --- --- --- 22-May Grand Chute (Town) WI GO Prom *9,200 10 am C Ehlers Quarles & Brady 19-28 --- --- --- --- --- BQ 22-May Prairie du Chien WI Note Antic *1,050 10 am C PFM Fin Advisors Quarles & Brady 23 --- --- --- --- --- BQ Today Prairie du Chien WI GO Corp Purp *1,695 10 am C PFM Fin Advisors Quarles & Brady 23-33 --- --- --- --- --- BQ Today
009_BB06011801 9 5/31/2018 3:49:52 PM
10 The Bond Buyer
Friday, June 1, 2018
Amount Time of Bank- Latest Issuer St Description ($000s) Sale Financial Adviser Legal Opinion Maturing Insurer Mdy’s S&P Fitch KBRA Qual. Details
Competitive Bond Offerings *Preliminary and subject to change. SHADED LISTINGS ARE NEW.
Compiled by Ipreo
New Issues
Wrightstown Vlg WI GO Prom *1,965 10:30 am C Ehlers Quarles & Brady 19-28 --- --- --- --- --- BQ 30-May
Wednesday, June 6 Iowa BOR IA Hosp Rev *32,665 10 am C Springsted Ahlers & Cooney 19-43 --- --- --- --- --- --- 1-May Winterset Comm SD IA GO Sch *9,995 10 am C Piper Jaffray Ahlers & Cooney 19-38 --- A1 --- --- --- BQ 21-May Regional Transp Auth IL GO *134,025 11 am C Rice Financial Kutak Rock 19-48 --- --- AA --- --- --- 31-May Emporia KS GO *8,735 10 am C Piper Jaffray Triplett Woolf 19-33 --- --- A+ --- --- BQ 23-May Lake Wabaunsee Imp Dist KS GO Ref *850 10 am C Ranson Financial Gilmore & Bell 19-36 --- --- --- --- --- BQ 30-May Concord (Town) MA GO Muni Purp Loan *6,710 11 am E Hilltop Securities Locke Lord 19-28 --- --- --- --- --- --- Today Harwich (Town) MA GO Muni Purp Loan *13,835 11:30 am E Hilltop Securities Locke Lord 19-38 --- --- AA+ --- --- --- Today Cottage Grove MN GO Imp *7,620 10 am C Ehlers Briggs & Morgan 21-35 --- --- --- --- --- BQ 4-May Portsmouth NH GO Cap Imp *19,650 11 am E Hilltop Securities Locke Lord 19-38 --- --- --- --- --- --- 24-May Atlantic County NJ GO 37,818 11 am E Acacia Fin Group Archer & Greiner 19-33 --- --- --- --- --- --- 30-May
P Bergen County NJ County College 4,000 11:15 am E NW Financial Group Waters McPherson 19-28 --- --- --- --- --- --- 29-May Auburn CSD NY Sch Dist 1,745 11:30 am E Bernard P. Donegan Timothy R. McGill 19-33 --- --- --- --- --- BQ 24-May Fort Worth TX Gen Purp *62,220 10 am C Hilltop Securities McCall Parkhurst 19-38 --- --- --- --- --- --- 30-May Harris Co MUD #495 TX Unltd Tax 16,000 9 am C Rathmann & Assoc Allen Boone 20-48 --- --- --- --- --- --- Today Waller County TX GO *30,000 10 am C USCA Municipal Bickerstaff, Heath 19-38 --- --- --- --- --- --- 30-May Williamson Co MUD #19A TX Unltd Tax 3,175 10 am C Specialized Pub Fin McCall Parkhurst 21-48 --- --- --- --- --- BQ 29-May Arlington County VA GO Pub Imp *153,555 11 am E PFM Fin Advisors McGuireWoods 18-37 --- Aaa AAA AAA --- --- 4-May Evergreen SD #114 WA Unltd Tax GO *114,700 8:30 am P Educational Svc 112 Pacifica Law Group 22-36 --- --- --- --- --- --- 29-May Pulaski Comm SD WI GO Sch 2,300 9:30 am C Robert W. Baird Quarles & Brady 19-30 --- --- --- --- --- BQ 23-May
Thursday, June 7 P Orange USD CA GO *188,000 9 am P Fieldman Rolapp Orrick Herrington 19-47 --- --- AA --- --- --- 29-May
Metro Atlanta Rapid Trans Auth GA Sales Tax Ref *168,120 10:30 am E Hilltop Securities Holland & Knight 19-25 --- --- --- --- --- --- Today Bullitt Co SD Fin Corp KY Energy 10,000 11 am E J.J.B. Hilliard --- 19-38 --- --- --- --- --- --- 30-May Delhi Chrt Twp MI Cap Imp 7,500 11 am E Umbaugh Thrun Law Firm 19-37 --- --- --- --- --- BQ 16-May Blaine MN Certs of Indebt *1,145 10 am C Springsted Kennedy & Graven 20-24 --- --- --- --- --- --- 7-May Newport MN GO Imp 2,845 10 am C Ehlers Briggs & Morgan 20-34 --- --- --- --- --- BQ 11-May New Mexico Fin Auth NM Ref Rev *423,745 10 am E PFM Fin Advisors Rodey, Dickason 19-30 --- --- AA --- --- --- 29-May Addison Ctrl SD NY Sch Dist 8,375 11:15 am E Fiscal Adv & Mkt Orrick Herrington 19-31 --- --- --- --- --- BQ 31-May
P Rye Brook Vlg NY Tax (Tax) 1,533 11 am E Capital Markets Adv Norton Rose 19-28 --- --- --- --- --- --- 30-May P Rye Brook Vlg NY Pub Imp 14,250 11 am E Capital Markets Adv Norton Rose 19-48 --- --- --- --- --- --- 30-May
Springville-Griffith Inst CSD NY GO Sch Dist 17,940 11 am E Bernard P. Donegan Hodgson Russ 19-35 --- --- --- --- --- --- 24-May Stillwater (Town) NY GO Pub Imp 3,993 11:30 am E Fiscal Adv & Mkt Walsh & Walsh 19-42 --- --- --- --- --- BQ 31-May
P Valley Stream Ctrl HSD NY Sch Dist *20,000 11 am E Capital Markets Adv Hawkins Delafield 20-33 --- --- --- --- --- --- 25-May Wappinger (Town) NY Pub Imp 860 11 am E Munistat Services Orrick Herrington 19-28 --- --- --- --- --- BQ Today Canadian Co ISD #57 OK Bldg 820 11:45 am C Stephen H. McDonald State Atty General 20-21 --- --- --- --- --- BQ 25-May Okmulgee Co ISD #5 OK Bldg (Tax) 360 12:45 pm C Stephen H. McDonald State Atty General 20-21 --- --- --- --- --- --- 25-May Irving TX Tax *2,850 11 am C Hilltop Securities Bracewell LLP 18-22 --- --- --- --- --- --- Today Irving TX Wtrwks & Swr Sys *16,180 10 am C Hilltop Securities Bracewell LLP 19-38 --- --- --- --- --- --- Today Irving TX GO *42,070 10:30 am C Hilltop Securities Bracewell LLP 19-38 --- --- --- --- --- --- Today Wilbarger Creek MUD #1 TX Unltd Tax 3,030 10 am C Public Fin Group McCall Parkhurst 20-42 --- --- --- --- --- BQ 30-May
Friday, June 8 Cleveland Co ESD #16 OK Bldg (Tax) 415 12:45 pm C Stephen H. McDonald State Atty General 20-21 --- --- --- --- --- --- 29-May McClain Co ISD #29 OK Bldg (Tax) 3,600 11:45 am C Stephen H. McDonald State Atty General 20 --- --- --- --- --- --- 29-May Wagoner Co ISD #17 OK Bldg 1,700 12 pm C Stephen L. Smith Phillips Murrah 20-21 --- --- --- --- --- BQ 29-May
Monday, June 11 Carlisle Comm SD IA GO Sch *15,000 1 pm C Piper Jaffray Dorsey & Whitney 19-38 --- --- --- --- --- --- 31-May Okoboji Comm SD IA GO Sch *25,000 1 pm C Piper Jaffray Ahlers & Cooney 19-38 --- --- --- --- --- --- Today Wheaton-Warrenville CUSD #200 IL GO Sch Ref *23,760 10 am C PMA Securities Ice Miller 19-23 --- --- --- --- --- --- Today Saline Co USD #306 KS GO Sch Bldg *5,840 11 am C George K. Baum Gilmore & Bell 19-30 --- --- --- --- --- BQ 31-May Albert Lea MN GO Imp *2,505 11 am C Ehlers Kennedy & Graven 20-29 --- --- --- --- --- BQ 14-May Brooklyn Center MN GO Imp *8,530 10 am C Springsted --- 20-29 --- --- --- --- --- BQ 21-May Lake City MN GO Street 795 11 am C David Drown Kennedy & Graven 20-29 --- --- --- --- --- BQ 29-May Sartell MN GO Imp Ref 3,525 10 am C Ehlers Briggs & Morgan 19-30 --- --- --- --- --- BQ 3-Apr Sartell MN GO Ref 7,855 10 am C Ehlers Briggs & Morgan 19-29 --- --- --- --- --- BQ 3-Apr West St Paul MN GO 9,550 10:30 am C Ehlers Briggs & Morgan 20-34 --- --- --- --- --- BQ 2-Apr
010_BB06011801 10 5/31/2018 3:49:53 PM
11www.bondbuyer.comFriday, June 1, 2018 New Issues
Amount Time of Bank- Latest Issuer St Description ($000s) Sale Financial Adviser Legal Opinion Maturing Insurer Mdy’s S&P Fitch KBRA Qual. Details
Competitive Bond Offerings *Preliminary and subject to change. SHADED LISTINGS ARE NEW.
Compiled by Ipreo
Grain Valley MO GO Ref *3,520 11 am C Springsted --- 19-28 --- --- --- --- --- BQ 16-Apr Malverne UFSD NY Sch Dist *19,767 11 am E Capital Markets Adv Hawkins Delafield 20-38 --- --- --- --- --- --- Today Caddo Co ISD #167 OK Bldg (Tax) 445 4 pm C Stephen H. McDonald State Atty General 20 --- --- --- --- --- --- 30-May Mcintosh Co ISD #27 OK Bldg 135 7 pm C Stephen L. Smith Phillips Murrah 20 --- --- --- --- --- BQ Today Muskogee Co ISD #6 OK Bldg 165 7 pm C Stephen L. Smith Phillips Murrah 20 --- --- --- --- --- BQ Today Pontotoc Co ISD #30 OK Bldg (Tax) 880 12:45 pm C Stephen H. McDonald State Atty General 20-23 --- --- --- --- --- --- 30-May East Bernard ISD TX Sch Bldg *18,470 11 am C Wells Nelson Norton Rose 19-48 --- --- --- --- --- --- 31-May Harris Co MUD #537 TX Unltd Tax 2,300 10 am C GMS Group Sanford Kuhl 22-45 --- --- --- --- --- BQ 30-May Spring Hill ISD TX Sch Bldg *1,475 11 am C SAMCO Cap Mkts Norton Rose 19-33 --- --- --- --- --- BQ Today Cedarburg WI GO Prom 1,245 11 am C Ehlers Quarles & Brady 19-28 --- --- --- --- --- BQ 9-May Prescott WI GO Corp Purp 1,665 11:30 am C Ehlers Fryberger Buchanan 19-38 --- --- --- --- --- BQ 9-May
Tuesday, June 12 Westport (Town) CT GO Bond Antic 16,135 11:30 am E Phoenix Advisors Pullman & Comley 19-38 --- --- --- --- --- --- Today Gilbert Comm SD IA GO Sch Ref *10,000 1 pm C Piper Jaffray Ahlers & Cooney 19-38 --- --- AA- --- --- BQ 23-May Hinsdale Vlg IL GO *20,000 10:15 am C Speer Financial Chapman and Cutler 19-38 --- --- --- --- --- --- 31-May Falls Pk Bldg Corp IN First Mtg 2,000 11 am E O.W. Krohn Bose McKinney 23-33 --- --- --- --- --- BQ 29-May Blissfield Vlg MI Unltd Tax GO *2,100 2 pm E PFM Fin Advisors Miller Canfield 19-38 --- --- --- --- --- BQ 31-May Ingham Co Bldg Auth MI Bldg Auth *4,850 11:30 am E PFM Fin Advisors Dickinson Wright 19-22 --- --- --- --- --- --- 31-May
P Wayne Charter County MI Tax (Tax) *156,285 11 am E PFM Fin Advisors --- 20 --- --- --- --- --- --- 30-May Dellwood MN GO Street 1,600 10 am C Ehlers Kennedy & Graven 20-24 --- --- --- --- --- BQ 10-May Wilkin County MN GO Drain 865 10 am C David Drown Briggs & Morgan 20-34 --- --- --- --- --- BQ 29-May Maplewood Twp NJ Gen Imp 17,130 10:45 am E --- McManimon Scotland 19-30 --- --- AA NR --- --- Today Passaic County NJ County College *3,200 11 am E --- McManimon Scotland 19-28 --- --- --- --- --- --- 29-May Oshkosh WI Storm Wtr Rev 10,510 9:30 am C Ehlers Chapman and Cutler 19-38 --- --- --- --- --- --- 10-May
Wednesday, June 13 West St Paul ISD #197 MN GO Sch Bldg 116,410 10 am C Ehlers Knutson Flynn 21-41 --- --- --- --- --- --- 17-May Bridgehampton UFSD NY Sch Dist *24,235 11 am E Munistat Services Hawkins Delafield 19-38 --- --- --- --- --- --- Today Mt Morris Ctrl SD NY Sch Dist *990 11:30 am E Bernard P. Donegan Harris Beach 19-31 --- --- --- --- --- BQ Today Latimer Co ISD #1 OK Bldg (Tax) 600 12:45 pm C Stephen H. McDonald State Atty General 20 --- --- --- --- --- --- 31-May Woodward Co ISD #3 OK Bldg (Tax) 800 11:45 am C Stephen H. McDonald State Atty General 20 --- --- --- --- --- --- 31-May
Thursday, June 14 Maine Sch Admin Dt #28 ME GO 25,200 11 am E Moors & Cabot Drummond Woodsum 19-38 --- --- --- --- --- --- 11-May North Branch ISD #138 MN GO *6,520 10 am C Springsted --- 20-29 --- --- --- --- --- BQ 14-May Upper Nyack Vlg NY Pub Imp *2,200 11 am E Capital Markets Adv Hawkins Delafield 19-38 --- --- --- --- --- BQ 25-May Carter Co ISD #43 OK Bldg (Tax) 380 12:45 pm C Stephen H. McDonald State Atty General 20 --- --- --- --- --- --- Today
Monday, June 18 Blue Earth MN GO *4,095 10:30 am C Springsted --- 20-39 --- --- --- --- --- BQ 30-May Hastings MN GO *3,460 11 am C Springsted Briggs & Morgan 20-29 --- --- --- --- --- BQ 29-May Montevideo MN GO 660 10 am C Ehlers Briggs & Morgan 20-29 --- --- --- --- --- BQ 21-May Fargo ND Ref Imp *43,180 10 am C Springsted --- 20-44 --- --- --- --- --- --- 14-May Fall Creek SD WI GO Sch Imp 9,995 10 am C Robert W. Baird Quarles & Brady 19-38 --- --- --- --- --- BQ 25-May River Falls SD WI GO Corp Purp 37,960 10:30 am C Ehlers Quarles & Brady 21-38 --- --- --- --- --- --- 18-May
Tuesday, June 19 Georgia GA GO (Tax) 300,000 11:30 am E Public Resources Gray Pannell --- --- --- --- --- --- --- 5-Mar Georgia GA GO *450,000 10:30 am E Public Resources Gray Pannell --- --- --- --- --- --- --- 5-Mar Georgia GA GO *450,000 11 am E Public Resources Gray Pannell --- --- --- --- --- --- --- 5-Mar Delano MN GO *3,100 10:30 am C Springsted --- 20-39 --- --- --- --- --- BQ 21-May Fridley ISD #14 MN GO Ref (Tax) 2,585 10:30 am C Ehlers Knutson Flynn 19-24 --- --- --- --- --- --- 30-May Gem Lake MN GO Imp 665 10 am C Ehlers Kennedy & Graven 20-34 --- --- --- --- --- BQ 31-May Granite Falls MN GO Imp 1,030 10 am C Ehlers Briggs & Morgan 20-34 --- --- --- --- --- BQ 31-May Owatonna MN GO Street *5,235 10 am C Springsted --- 20-29 --- --- --- --- --- BQ 21-May Wyoming MN GO Imp *2,135 11 am C Springsted --- 20-34 --- --- --- --- --- BQ 21-May
P Orchard Farm SD #5 MO GO 18,400 10 am C WM Fin Strategies Gilmore & Bell 23-38 --- --- AA+ --- --- --- 23-May Greendale Vlg WI GO Comm Dev (Tax) 1,680 9:30 am C Ehlers Quarles & Brady 20-36 --- --- --- --- --- --- Today Lake Mills WI Comb Util Rev *1,805 10 am C Ehlers Quarles & Brady 19-38 --- --- --- --- --- BQ 23-May
For complete listings go to www.bondbuyer.com
011_BB06011801 11 5/31/2018 3:49:53 PM
12 The Bond Buyer
Friday, June 1, 2018
Amount Time of Bank- Latest Issuer St Description ($000s) Sale Financial Adviser Legal Opinion Maturing Insurer Mdy’s S&P Fitch KBRA Qual. Details
Competitive Note Offerings Tentative dates for negotiated sales of $1 million or more. SHADED LISTINGS ARE NEW.
Compiled by Ipreo
New Issues
Friday, June 1 Pembroke (Town) MA St-Aid 236 11 am E Hilltop Securities --- 18 --- --- --- --- --- BQ 31-May
Monday, June 4 Westfield MA GO Bond Antic 4,000 12 pm E Eastern Bk Muni Fin Locke Lord 18 --- --- --- --- --- --- Today Westfield MA GO Bond Antic 4,595 12 pm E Eastern Bk Muni Fin Locke Lord 19 --- --- --- --- --- --- Today Union-Endicott Ctrl SD NY Bond Antic 10,699 11:15 am E Fiscal Adv & Mkt Orrick Herrington 19 --- --- --- --- --- --- 30-May Utica CSD NY Rev Antic 10,000 11:45 am E Fiscal Adv & Mkt Bond Schoeneck 19 --- --- --- --- --- --- 30-May
Tuesday, June 5 Bethel (Town) CT GO Bond Antic 24,450 11:30 am E Phoenix Advisors Pullman & Comley 18 --- --- --- --- --- --- 29-May Braintree (Town) MA GO Bond Antic 8,900 11 am E Hilltop Securities Locke Lord 19 --- --- SP-1+ --- --- BQ 31-May Clinton (Town) MA GO Bond Antic 280 11 am E Hilltop Securities --- 19 --- --- --- --- --- BQ 31-May Cohasset (Town) MA GO Bond Antic 897 11 am E Hilltop Securities --- 19 --- --- --- --- --- BQ 30-May Marlborough MA GO Bond Antic 21,200 11 am E Hilltop Securities Bowditch & Dewey 19 --- --- --- --- --- --- Today Greensboro NC GO Pub Imp (Tax) 5,325 10:30 am E Local Govt Comm Womble Bond 18 --- --- --- --- --- --- 30-May Greensboro NC GO Pub Imp 9,245 10:30 am E Local Govt Comm Womble Bond 18 --- --- --- --- --- --- 30-May Fairfield Twp NJ Bond Antic 8,475 11 am E Municipal Official Gibbons P.C. 19 --- --- --- --- --- BQ 31-May Lawrence Twp NJ Bond Antic 500 11:30 am E Municipal Official McManimon Scotland 19 --- --- --- --- --- BQ 25-May Bethany (Town) NY Bond Antic 785 11:30 am E Municipal Solutions Hodgson Russ 19 --- --- --- --- --- BQ 30-May BOCES - New York NY Rev Antic 7,000 11 am E Capital Markets Adv Bond Schoeneck 19 --- --- --- --- --- BQ 31-May Clarence Fire Dist #1 NY Bond Antic 1,200 11 am E Capital Markets Adv Hodgson Russ 19 --- --- --- --- --- BQ 31-May Lyons Ctrl SD NY Bond Antic 9,795 11:15 am E Fiscal Adv & Mkt Trespasz & Marquardt 19 --- --- --- --- --- --- 29-May Newark Ctrl SD NY Bond Antic 14,000 11:45 am E Bernard P. Donegan Timothy R. McGill 19 --- --- --- --- --- --- 25-May Saranac Lake Ctrl SD NY Bond Antic 9,700 12 pm E Bernard P. Donegan Trespasz & Marquardt 19 --- --- --- --- --- BQ 30-May W Hempstead UFSD NY Bond Antic 16,000 10:30 am E Capital Markets Adv Hawkins Delafield 19 --- --- --- --- --- --- 31-May Willoughby OH GO Bond Antic 6,400 11 am E Sudsina & Assoc Squire Patton 19 --- --- --- --- --- BQ Today
Wednesday, June 6 Concord (Town) MA GO Bond Antic 400 11 am E Hilltop Securities --- 19 --- --- --- --- --- --- Today Harwich (Town) MA GO Bond Antic 7,445 11:30 am E Hilltop Securities Locke Lord 19 --- --- SP-1+ --- --- --- Today Webster (Town) MA GO Bond Antic 524 11 am E Hilltop Securities --- 19 --- --- --- --- --- BQ Today Portsmouth NH GO Bond Antic 22,000 11 am E Hilltop Securities Locke Lord 19 --- --- --- --- --- --- 25-May Atlantic County NJ Bond Antic (Tax) 7,500 11 am E Acacia Fin Group Archer & Greiner 19 --- --- --- --- --- --- Today Bergen County NJ Bond Antic 16,000 11 am E NW Financial Group Waters McPherson 19 --- --- --- --- --- --- 30-May Egg Harbor Twp NJ Bond Antic 3,800 11 am E Municipal Official Fleishman Daniels 19 --- --- --- --- --- BQ 31-May Hazlet Twp NJ Bond Antic 2,985 11 am E Municipal Official Gibbons P.C. 19 --- --- --- --- --- BQ 31-May Hopewell Twp NJ Bond Antic 896 11 am E Municipal Official Archer & Greiner 19 --- --- --- --- --- BQ Today Millburn Twp NJ Bond Antic 7,960 11 am E Municipal Official Rogut McCarthy 19 --- --- --- --- --- BQ 30-May Pennsauken Twp NJ Bond Antic 5,260 11 am E Municipal Official Parker McCay 19 --- --- --- --- --- BQ 31-May Toms River Twp NJ Note 29,145 11 am E Acacia Fin Group GluckWalrath 19 --- --- --- --- --- --- Today Burnt Hills-Ballston NY Bond Antic 29,600 11 am E Fiscal Adv & Mkt Jeffrey E Storch 19 --- --- --- --- --- --- 29-May Cohoes NY GO Bond Antic 1,200 10:15 am E Fiscal Adv & Mkt Hodgson Russ 19 --- --- --- --- --- BQ 30-May Lewiston-Porter Ctrl SD NY Bond Antic 1,300 11:30 am E Municipal Solutions Hodgson Russ 19 --- --- --- --- --- BQ Today New Hartford Ctrl SD NY Bond Antic 9,000 12 pm E Bernard P. Donegan Bond Schoeneck 19 --- --- --- --- --- BQ 25-May Olean NY Bond Antic 6,024 11 am E Municipal Solutions Hodgson Russ 19 --- --- --- --- --- BQ 16-May Port Chester-Rye UFSD NY Bond Antic 5,800 11 am E Capital Markets Adv Hawkins Delafield 19 --- --- --- --- --- --- 30-May Wayne County OH GO Bond Antic 3,000 11 am E Sudsina & Assoc Squire Patton 19 --- --- --- --- --- BQ 29-May Georgetown Co SD SC GO Bond Antic 80,000 11 am E Compass Muni Adv McNair Law Firm 19 --- MIG1 SP-1+ --- --- --- Today
Thursday, June 7 Ventura County CA Tax & Rev Antic *145,000 9 am P Fieldman Rolapp Norton Rose 19 --- MIG1 SP-1+ --- --- --- 30-May Jersey City NJ Bond Antic (Tax) 6,825 11:30 am E NW Financial Group GluckWalrath 19 --- --- --- --- --- --- Today Jersey City NJ Bond Antic 45,972 11 am E NW Financial Group GluckWalrath 19 --- --- --- --- --- --- Today Keansburg Borough NJ Bond Antic 12,761 11 am E Municipal Official GluckWalrath 19 --- --- --- --- --- --- Today Beacon CSD NY Bond Antic 980 12:15 pm E Bernard P. Donegan Orrick Herrington 19 --- --- --- --- --- BQ 30-May Cassadaga Vly Ctrl SD NY Bond Antic 1,000 10:15 am E Fiscal Adv & Mkt Hodgson Russ 18 --- --- --- --- --- --- Today Corning CSD NY Bond Antic 41,545 11 am E Capital Markets Adv Hawkins Delafield 19 --- --- --- --- --- --- 30-May Fort Edward UFSD NY Bond Antic 1,200 11:15 am E Bernard P. Donegan Barclay Damon 19 --- --- --- --- --- BQ 24-May Haverstraw-Stony Ctrl SD NY Bond Antic 7,435 11 am E Capital Markets Adv Hawkins Delafield 19 --- --- --- --- --- --- 31-May Jamestown CSD NY Bond Antic 27,790 11 am E Capital Markets Adv Orrick Herrington 19 --- --- --- --- --- --- 31-May Mechanicville CSD NY Bond Antic 735 11 am E Fiscal Adv & Mkt Barclay Damon 19 --- --- --- --- --- --- 31-May
For complete listings go to www.bondbuyer.com
012_BB06011801 12 5/31/2018 3:49:54 PM
13www.bondbuyer.comFriday, June 1, 2018 New Issues
Amount First Issuer St Description ($000s) Lead Manager Financial Adviser Insurer Mdy’s S&P Fitch KBRA Appeared
Negotiated Bond Offerings Tentative dates for negotiated sales of $1 million or more. A “+” under Insurer signifies that insurance is available. SHADED LISTINGS ARE NEW.
Compiled by Ipreo
Friday, June 1 Ferris ISD TX Sch Bldg & Ref 16,395 UMB Bank George K. Baum PSF --- A+ --- --- 25-May
Week Of June 4 Madison AL GO (Tax) 51,885 Joe Jolly --- --- --- --- --- --- 30-May SE Alabama Gas Dt AL Rev 900,000 Morgan Stanley --- --- --- --- --- --- Today Flagstaff AZ Rev 9,480 Hilltop Securities Stifel Nicolaus --- --- AA- --- --- 29-May Flagstaff AZ COPs 3,925 Piper Jaffray Stifel Nicolaus --- --- AA- --- --- Today Peoria USD #11 AZ Sch Imp 16,200 Stifel Nicolaus --- --- --- --- --- --- Today Prescott USD #1 AZ Sch Imp 4,000 Stifel Nicolaus --- --- --- --- --- --- Today Alvord USD CFD 2006-1 CA Special Tax Ref 8,095 Stifel Nicolaus Dale Scott --- --- --- --- --- Today Beaumont CFD #93-1 CA Special Tax 16,000 Piper Jaffray --- --- --- --- --- --- Today Bellevue Union SD CA GO 6,997 Raymond James --- --- --- --- --- --- Today California Muni Fin Auth CA Rev 1,200,000 BA Merrill Lynch --- AGM --- --- --- --- 30-May Chula Vista Comm Facs Dt #16-1 CA Special Tax *13,200 Stifel Nicolaus Fieldman Rolapp --- --- --- --- --- Today Desert Comm Coll Dt CA GO 50,000 RBC Capital Mkts --- --- --- --- --- --- Today Gustine USD CA GO 4,500 Stifel Nicolaus --- --- --- --- --- --- Today Irvine USD CA Special Tax 39,505 Stifel Nicolaus --- --- --- --- --- --- 18-May Live Oak USD CA COPs 3,500 Raymond James --- --- --- --- --- --- Today Monterey Co Fin Auth CA Rev Ref 24,520 Raymond James KNN Public Finance --- --- --- --- --- Today M-S-R Pub Pwr Agy CA Rev 98,685 RBC Capital Mkts Montague DeRose --- --- --- --- --- Today Napa Vly USD CA GO Ref 5,300 RBC Capital Mkts --- --- --- --- --- --- Today Norwalk-La Mirada USD CA GO 10,500 Wells Fargo Secs --- --- --- --- --- --- Today Sacramento MUD CA Elec Rev Ref 166,000 Citigroup PFM Fin Advisors --- --- --- --- --- Today Blue Lake Metro Dt #3 CO GO 5,495 D.A. Davidson --- --- --- --- --- --- Today Connecticut CT GO Ref 100,000 BA Merrill Lynch Acacia Fin Group --- --- A A+ --- 29-May Connecticut CT GO 400,000 BA Merrill Lynch Acacia Fin Group --- --- A A+ --- 29-May Florida Dev Fin Corp FL Rev & Ref 9,357 Ziegler Cap Mkts Charter School Svcs --- --- --- --- --- Today Cartersville GA Wtr & Swr Rev 58,595 Raymond James --- --- --- --- --- --- 30-May Crystal Lake Comm Cons SD #47 IL Debt Certs 9,500 Raymond James --- --- --- --- --- --- 22-May Monticello CUSD #25 IL GO 27,235 D.A. Davidson --- --- --- --- --- --- Today Waukegan IL GO 37,100 Bernardi Securities Speer Financial AGM A2 --- --- --- Today Ball State Univ BOT IN Rev 82,330 Piper Jaffray --- --- --- --- --- --- Today East Porter Co Sch Bldg Corp IN First Mtg 13,965 George K. Baum --- --- --- --- --- --- Today Indiana Fin Auth IN Ed Facs Rev 9,635 Piper Jaffray Blue Rose Capital --- --- --- --- --- 24-May Jay Schs Bldg Corp IN First Mtg 5,000 Piper Jaffray --- --- --- --- --- --- Today Harvey Co USD #373 KS GO Ref 5,075 George K. Baum --- --- --- --- --- --- Today Kentucky St Prop & Bldg Comm KY Rev Ref 9,650 Citigroup --- --- --- A- --- --- Today Kentucky St Prop & Bldg Comm KY Rev 273,485 Citigroup --- --- --- A- --- --- Today Massachusetts Hsg Fin MA Hsg 28,475 Barclays Capital CSG Advisors --- --- --- --- --- Today Cadillac Area Pub Schs MI Sch Bldg & Ref 20,515 Stifel Nicolaus PFM Fin Advisors --- --- --- --- --- 30-May Jackson MI Cap Imp 16,500 Hutchinson Shockey --- --- --- --- --- --- Today Jackson Pub Schs MI Sch Bldg & Site 77,025 Stifel Nicolaus PFM Fin Advisors --- --- --- --- --- 31-May Roseville Comm Schs MI Sch Bldg & Site 39,830 Stifel Nicolaus --- --- --- --- --- --- Today Warren Cons SD MI Sch Bldg & Site 18,750 Hilltop Securities PFM Fin Advisors --- --- --- --- --- Today Minnesota Hsg Fin Agy MN Rental Hsg 132,500 RBC Capital Mkts --- --- --- --- --- --- 24-May St Paul Park MN Hlth Facs Rev 25,155 Piper Jaffray --- --- --- --- --- --- Today Henderson County NC Limited Oblig 23,365 PNC Capital Markets --- --- --- --- --- --- Today N Carolina Univ at Raleigh NC Gen Rev Ref 87,985 Barclays Capital --- --- --- --- --- --- Today Lincoln NE Elec Sys Rev 120,000 BA Merrill Lynch PFM Fin Advisors --- --- --- --- --- 31-May
Week Of June 4 Los Angeles County CA Tax & Rev Antic 700,000 Goldman Sachs Public Resources --- --- --- --- --- 22-May Riverside County CA Tax & Rev Antic 340,000 Stifel Nicolaus --- --- --- --- --- --- Today Santa Barbara USD CA Tax & Rev Antic 10,000 Citigroup KNN Public Finance --- --- --- --- --- Today
Amount First Issuer St Description ($000s) Lead Manager Financial Adviser Insurer Mdy’s S&P Fitch KBRA Appeared
Negotiated Note Offerings Tentative dates for negotiated sales of $1 million or more. A “+” under Insurer signifies that insurance is available. SHADED LISTINGS ARE NEW.
Compiled by Ipreo
For complete listings go to www.bondbuyer.com
013_BB06011801 13 5/31/2018 3:49:54 PM
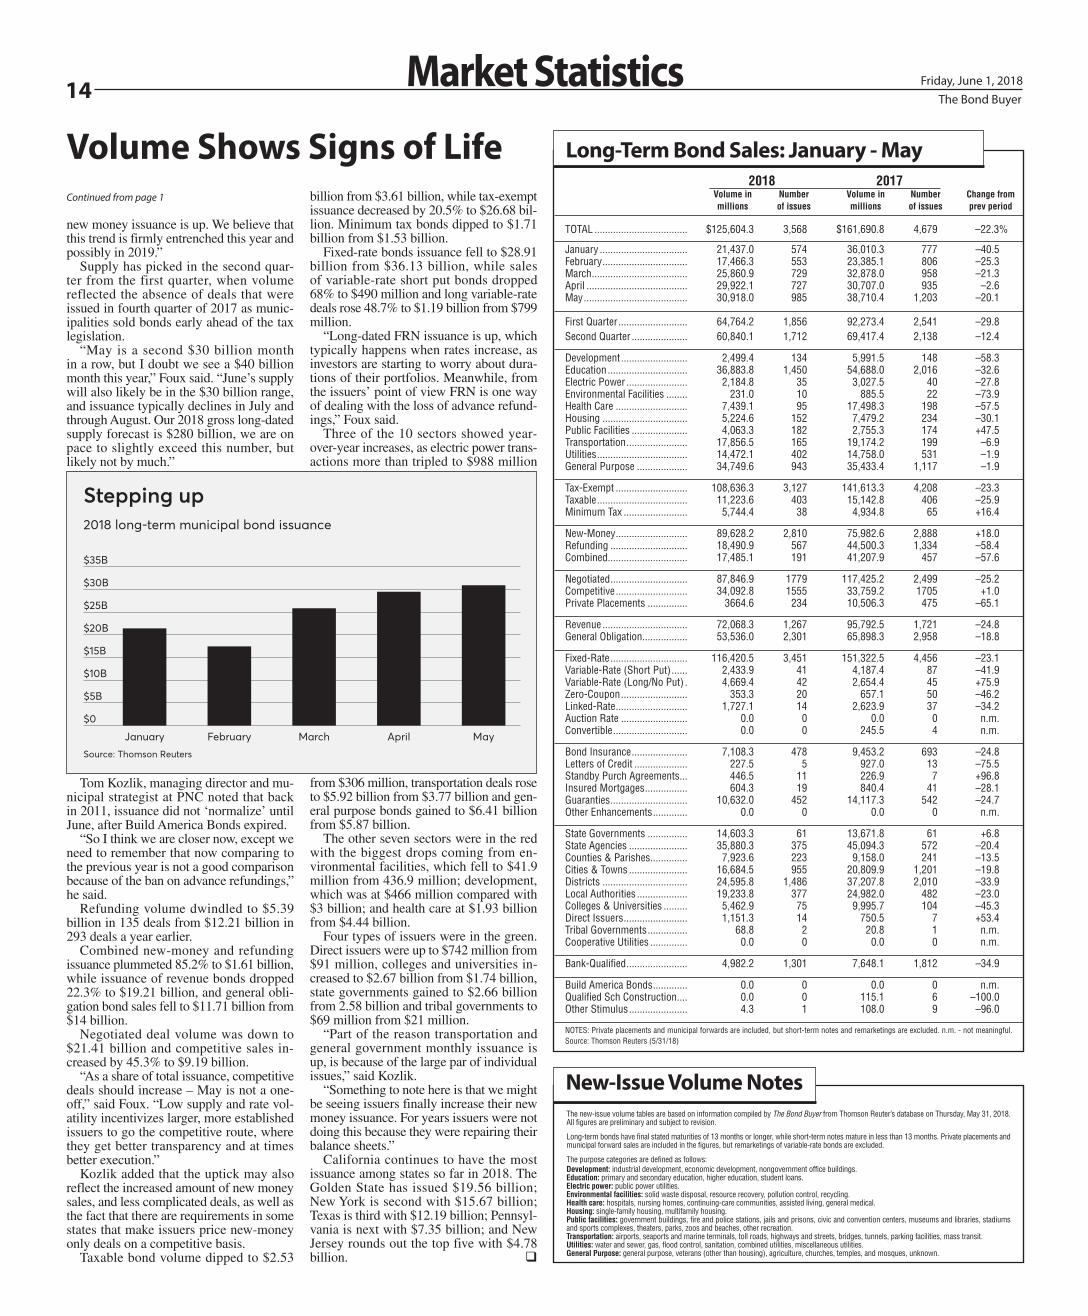
The Bond Buyer14 Friday, June 1, 2018Market Statistics
Volume Shows Signs of Life
new money issuance is up. We believe that this trend is firmly entrenched this year and possibly in 2019.”
Supply has picked in the second quar-ter from the first quarter, when volume reflected the absence of deals that were issued in fourth quarter of 2017 as munic-ipalities sold bonds early ahead of the tax legislation.
“May is a second $30 billion month in a row, but I doubt we see a $40 billion month this year,” Foux said. “June’s supply will also likely be in the $30 billion range, and issuance typically declines in July and through August. Our 2018 gross long-dated supply forecast is $280 billion, we are on pace to slightly exceed this number, but likely not by much.”
Tom Kozlik, managing director and mu-nicipal strategist at PNC noted that back in 2011, issuance did not ‘normalize’ until June, after Build America Bonds expired.
“So I think we are closer now, except we need to remember that now comparing to the previous year is not a good comparison because of the ban on advance refundings,” he said.
Refunding volume dwindled to $5.39 billion in 135 deals from $12.21 billion in 293 deals a year earlier.
Combined new-money and refunding issuance plummeted 85.2% to $1.61 billion, while issuance of revenue bonds dropped 22.3% to $19.21 billion, and general obli-gation bond sales fell to $11.71 billion from $14 billion.
Negotiated deal volume was down to $21.41 billion and competitive sales in-creased by 45.3% to $9.19 billion.
“As a share of total issuance, competitive deals should increase – May is not a one-off,” said Foux. “Low supply and rate vol-atility incentivizes larger, more established issuers to go the competitive route, where they get better transparency and at times better execution.”
Kozlik added that the uptick may also reflect the increased amount of new money sales, and less complicated deals, as well as the fact that there are requirements in some states that make issuers price new-money only deals on a competitive basis.
Taxable bond volume dipped to $2.53
billion from $3.61 billion, while tax-exempt issuance decreased by 20.5% to $26.68 bil-lion. Minimum tax bonds dipped to $1.71 billion from $1.53 billion.
Fixed-rate bonds issuance fell to $28.91 billion from $36.13 billion, while sales of variable-rate short put bonds dropped 68% to $490 million and long variable-rate deals rose 48.7% to $1.19 billion from $799 million.
“Long-dated FRN issuance is up, which typically happens when rates increase, as investors are starting to worry about dura-tions of their portfolios. Meanwhile, from the issuers’ point of view FRN is one way of dealing with the loss of advance refund-ings,” Foux said.
Three of the 10 sectors showed year-over-year increases, as electric power trans-actions more than tripled to $988 million
from $306 million, transportation deals rose to $5.92 billion from $3.77 billion and gen-eral purpose bonds gained to $6.41 billion from $5.87 billion.
The other seven sectors were in the red with the biggest drops coming from en-vironmental facilities, which fell to $41.9 million from 436.9 million; development, which was at $466 million compared with $3 billion; and health care at $1.93 billion from $4.44 billion.
Four types of issuers were in the green. Direct issuers were up to $742 million from $91 million, colleges and universities in-creased to $2.67 billion from $1.74 billion, state governments gained to $2.66 billion from 2.58 billion and tribal governments to $69 million from $21 million.
“Part of the reason transportation and general government monthly issuance is up, is because of the large par of individual issues,” said Kozlik.
“Something to note here is that we might be seeing issuers finally increase their new money issuance. For years issuers were not doing this because they were repairing their balance sheets.”
California continues to have the most issuance among states so far in 2018. The Golden State has issued $19.56 billion; New York is second with $15.67 billion; Texas is third with $12.19 billion; Pennsyl-vania is next with $7.35 billion; and New Jersey rounds out the top five with $4.78 billion. q
$0
$5B
$10B
$15B
$20B
$25B
$30B
$35B
January February March April May
Stepping up2018 long-term municipal bond issuance
Source: Thomson Reuters
Continued from page 1 2018 2017
Volume in Number Volume in Number Change from millions of issues millions of issues prev period
TOTAL ................................... $125,604.3 3,568 $161,690.8 4,679 –22.3%
January ................................. 21,437.0 574 36,010.3 777 –40.5February ................................ 17,466.3 553 23,385.1 806 –25.3March .................................... 25,860.9 729 32,878.0 958 –21.3April ...................................... 29,922.1 727 30,707.0 935 –2.6May ....................................... 30,918.0 985 38,710.4 1,203 –20.1
First Quarter .......................... 64,764.2 1,856 92,273.4 2,541 –29.8Second Quarter ..................... 60,840.1 1,712 69,417.4 2,138 –12.4
Development ......................... 2,499.4 134 5,991.5 148 –58.3Education .............................. 36,883.8 1,450 54,688.0 2,016 –32.6Electric Power ....................... 2,184.8 35 3,027.5 40 –27.8Environmental Facilities ........ 231.0 10 885.5 22 –73.9Health Care ........................... 7,439.1 95 17,498.3 198 –57.5Housing ................................ 5,224.6 152 7,479.2 234 –30.1Public Facilities ..................... 4,063.3 182 2,755.3 174 +47.5Transportation ....................... 17,856.5 165 19,174.2 199 –6.9Utilities .................................. 14,472.1 402 14,758.0 531 –1.9General Purpose ................... 34,749.6 943 35,433.4 1,117 –1.9
Tax-Exempt ........................... 108,636.3 3,127 141,613.3 4,208 –23.3Taxable .................................. 11,223.6 403 15,142.8 406 –25.9Minimum Tax ........................ 5,744.4 38 4,934.8 65 +16.4
New-Money ........................... 89,628.2 2,810 75,982.6 2,888 +18.0Refunding ............................. 18,490.9 567 44,500.3 1,334 –58.4Combined .............................. 17,485.1 191 41,207.9 457 –57.6
Negotiated ............................. 87,846.9 1779 117,425.2 2,499 –25.2Competitive ........................... 34,092.8 1555 33,759.2 1705 +1.0Private Placements ............... 3664.6 234 10,506.3 475 –65.1
Revenue ................................ 72,068.3 1,267 95,792.5 1,721 –24.8General Obligation ................. 53,536.0 2,301 65,898.3 2,958 –18.8
Fixed-Rate ............................. 116,420.5 3,451 151,322.5 4,456 –23.1Variable-Rate (Short Put) ...... 2,433.9 41 4,187.4 87 –41.9Variable-Rate (Long/No Put) . 4,669.4 42 2,654.4 45 +75.9Zero-Coupon ......................... 353.3 20 657.1 50 –46.2Linked-Rate ........................... 1,727.1 14 2,623.9 37 –34.2Auction Rate ......................... 0.0 0 0.0 0 n.m.Convertible ............................ 0.0 0 245.5 4 n.m.
Bond Insurance ..................... 7,108.3 478 9,453.2 693 –24.8Letters of Credit .................... 227.5 5 927.0 13 –75.5Standby Purch Agreements... 446.5 11 226.9 7 +96.8Insured Mortgages ................ 604.3 19 840.4 41 –28.1Guaranties ............................. 10,632.0 452 14,117.3 542 –24.7Other Enhancements ............. 0.0 0 0.0 0 n.m.
State Governments ............... 14,603.3 61 13,671.8 61 +6.8State Agencies ...................... 35,880.3 375 45,094.3 572 –20.4Counties & Parishes .............. 7,923.6 223 9,158.0 241 –13.5Cities & Towns ...................... 16,684.5 955 20,809.9 1,201 –19.8Districts ................................ 24,595.8 1,486 37,207.8 2,010 –33.9Local Authorities ................... 19,233.8 377 24,982.0 482 –23.0Colleges & Universities ......... 5,462.9 75 9,995.7 104 –45.3Direct Issuers ........................ 1,151.3 14 750.5 7 +53.4Tribal Governments ............... 68.8 2 20.8 1 n.m.Cooperative Utilities .............. 0.0 0 0.0 0 n.m.
Bank-Qualified ....................... 4,982.2 1,301 7,648.1 1,812 –34.9
Build America Bonds ............. 0.0 0 0.0 0 n.m.Qualified Sch Construction .... 0.0 0 115.1 6 –100.0Other Stimulus ...................... 4.3 1 108.0 9 –96.0
NOTES: Private placements and municipal forwards are included, but short-term notes and remarketings are excluded. n.m. - not meaningful. Source: Thomson Reuters (5/31/18)
Long-Term Bond Sales: January - May
The new-issue volume tables are based on information compiled by The Bond Buyer from Thomson Reuter’s database on Thursday, May 31, 2018. All figures are preliminary and subject to revision.
Long-term bonds have final stated maturities of 13 months or longer, while short-term notes mature in less than 13 months. Private placements and municipal forward sales are included in the figures, but remarketings of variable-rate bonds are excluded.
The purpose categories are defined as follows:Development: industrial development, economic development, nongovernment office buildings.Education: primary and secondary education, higher education, student loans.Electric power: public power utilities.Environmental facilities: solid waste disposal, resource recovery, pollution control, recycling.Health care: hospitals, nursing homes, continuing-care communities, assisted living, general medical.Housing: single-family housing, multifamily housing.Public facilities: government buildings, fire and police stations, jails and prisons, civic and convention centers, museums and libraries, stadiums and sports complexes, theaters, parks, zoos and beaches, other recreation.Transportation: airports, seaports and marine terminals, toll roads, highways and streets, bridges, tunnels, parking facilities, mass transit.Utilities: water and sewer, gas, flood control, sanitation, combined utilities, miscellaneous utilities.General Purpose: general purpose, veterans (other than housing), agriculture, churches, temples, and mosques, unknown.
New-Issue Volume Notes
014_BB06011801 14 5/31/2018 3:01:09 PM
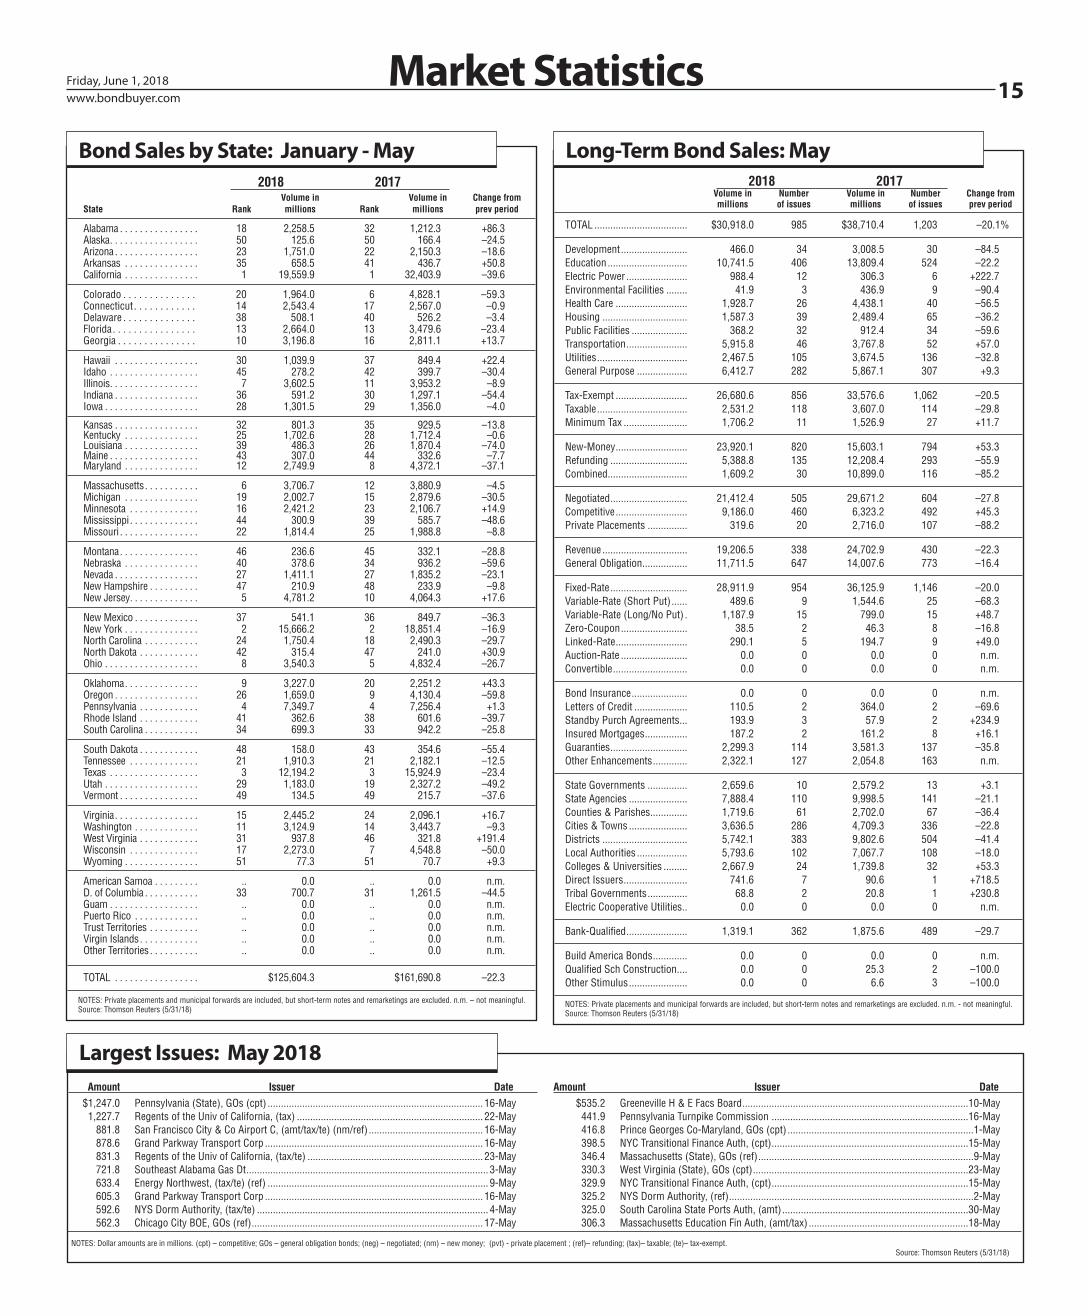
www.bondbuyer.com 15Friday, June 1, 2018
Amount Issuer Date
$1,247.0 Pennsylvania (State), GOs (cpt) ................................................................................. 16-May 1,227.7 Regents of the Univ of California, (tax) ...................................................................... 22-May 881.8 San Francisco City & Co Airport C, (amt/tax/te) (nm/ref) ........................................... 16-May 878.6 Grand Parkway Transport Corp .................................................................................. 16-May 831.3 Regents of the Univ of California, (tax/te) .................................................................. 23-May 721.8 Southeast Alabama Gas Dt ........................................................................................... 3-May 633.4 Energy Northwest, (tax/te) (ref) ................................................................................... 9-May 605.3 Grand Parkway Transport Corp .................................................................................. 16-May 592.6 NYS Dorm Authority, (tax/te) ....................................................................................... 4-May 562.3 Chicago City BOE, GOs (ref) ....................................................................................... 17-May
Amount Issuer Date
$535.2 Greeneville H & E Facs Board .....................................................................................10-May 441.9 Pennsylvania Turnpike Commission ..........................................................................16-May 416.8 Prince Georges Co-Maryland, GOs (cpt) ......................................................................1-May 398.5 NYC Transitional Finance Auth, (cpt) ..........................................................................15-May 346.4 Massachusetts (State), GOs (ref) .................................................................................9-May 330.3 West Virginia (State), GOs (cpt) .................................................................................23-May 329.9 NYC Transitional Finance Auth, (cpt) ..........................................................................15-May 325.2 NYS Dorm Authority, (ref) ............................................................................................2-May 325.0 South Carolina State Ports Auth, (amt) ......................................................................30-May 306.3 Massachusetts Education Fin Auth, (amt/tax) ............................................................18-May
Largest Issues: May 2018
NOTES: Dollar amounts are in millions. (cpt) – competitive; GOs – general obligation bonds; (neg) – negotiated; (nm) – new money; (pvt) - private placement ; (ref)– refunding; (tax)– taxable; (te)– tax-exempt. Source: Thomson Reuters (5/31/18)
2018 2017 Volume in Number Volume in Number Change from millions of issues millions of issues prev period
TOTAL ................................... $30,918.0 985 $38,710.4 1,203 –20.1%
Development ......................... 466.0 34 3,008.5 30 –84.5Education .............................. 10,741.5 406 13,809.4 524 –22.2Electric Power ....................... 988.4 12 306.3 6 +222.7Environmental Facilities ........ 41.9 3 436.9 9 –90.4Health Care ........................... 1,928.7 26 4,438.1 40 –56.5Housing ................................ 1,587.3 39 2,489.4 65 –36.2Public Facilities ..................... 368.2 32 912.4 34 –59.6Transportation ....................... 5,915.8 46 3,767.8 52 +57.0Utilities .................................. 2,467.5 105 3,674.5 136 –32.8General Purpose ................... 6,412.7 282 5,867.1 307 +9.3
Tax-Exempt ........................... 26,680.6 856 33,576.6 1,062 –20.5Taxable .................................. 2,531.2 118 3,607.0 114 –29.8Minimum Tax ........................ 1,706.2 11 1,526.9 27 +11.7
New-Money ........................... 23,920.1 820 15,603.1 794 +53.3Refunding ............................. 5,388.8 135 12,208.4 293 –55.9Combined .............................. 1,609.2 30 10,899.0 116 –85.2
Negotiated ............................. 21,412.4 505 29,671.2 604 –27.8Competitive ........................... 9,186.0 460 6,323.2 492 +45.3Private Placements ............... 319.6 20 2,716.0 107 –88.2
Revenue ................................ 19,206.5 338 24,702.9 430 –22.3General Obligation ................. 11,711.5 647 14,007.6 773 –16.4
Fixed-Rate ............................. 28,911.9 954 36,125.9 1,146 –20.0Variable-Rate (Short Put) ...... 489.6 9 1,544.6 25 –68.3Variable-Rate (Long/No Put) . 1,187.9 15 799.0 15 +48.7Zero-Coupon ......................... 38.5 2 46.3 8 –16.8Linked-Rate ........................... 290.1 5 194.7 9 +49.0Auction-Rate ......................... 0.0 0 0.0 0 n.m.Convertible ............................ 0.0 0 0.0 0 n.m.
Bond Insurance ..................... 0.0 0 0.0 0 n.m.Letters of Credit .................... 110.5 2 364.0 2 –69.6Standby Purch Agreements... 193.9 3 57.9 2 +234.9Insured Mortgages ................ 187.2 2 161.2 8 +16.1Guaranties ............................. 2,299.3 114 3,581.3 137 –35.8Other Enhancements ............. 2,322.1 127 2,054.8 163 n.m.
State Governments ............... 2,659.6 10 2,579.2 13 +3.1State Agencies ...................... 7,888.4 110 9,998.5 141 –21.1Counties & Parishes .............. 1,719.6 61 2,702.0 67 –36.4Cities & Towns ...................... 3,636.5 286 4,709.3 336 –22.8Districts ................................ 5,742.1 383 9,802.6 504 –41.4Local Authorities ................... 5,793.6 102 7,067.7 108 –18.0Colleges & Universities ......... 2,667.9 24 1,739.8 32 +53.3Direct Issuers ........................ 741.6 7 90.6 1 +718.5Tribal Governments ............... 68.8 2 20.8 1 +230.8Electric Cooperative Utilities .. 0.0 0 0.0 0 n.m.
Bank-Qualified ....................... 1,319.1 362 1,875.6 489 –29.7
Build America Bonds ............. 0.0 0 0.0 0 n.m.Qualified Sch Construction .... 0.0 0 25.3 2 –100.0Other Stimulus ...................... 0.0 0 6.6 3 –100.0
NOTES: Private placements and municipal forwards are included, but short-term notes and remarketings are excluded. n.m. - not meaningful. Source: Thomson Reuters (5/31/18)
Long-Term Bond Sales: May
Market Statistics
2018 2017 Volume in Volume in Change fromState Rank millions Rank millions prev period
Alabama . . . . . . . . . . . . . . . . 18 2,258.5 32 1,212.3 +86.3Alaska. . . . . . . . . . . . . . . . . . 50 125.6 50 166.4 –24.5Arizona . . . . . . . . . . . . . . . . . 23 1,751.0 22 2,150.3 –18.6Arkansas . . . . . . . . . . . . . . . 35 658.5 41 436.7 +50.8California . . . . . . . . . . . . . . . 1 19,559.9 1 32,403.9 –39.6
Colorado . . . . . . . . . . . . . . 20 1,964.0 6 4,828.1 –59.3Connecticut. . . . . . . . . . . . 14 2,543.4 17 2,567.0 –0.9Delaware . . . . . . . . . . . . . . 38 508.1 40 526.2 –3.4Florida. . . . . . . . . . . . . . . . 13 2,664.0 13 3,479.6 –23.4Georgia . . . . . . . . . . . . . . . 10 3,196.8 16 2,811.1 +13.7
Hawaii . . . . . . . . . . . . . . . . . 30 1,039.9 37 849.4 +22.4Idaho . . . . . . . . . . . . . . . . . . 45 278.2 42 399.7 –30.4Illinois. . . . . . . . . . . . . . . . . . 7 3,602.5 11 3,953.2 –8.9Indiana . . . . . . . . . . . . . . . . . 36 591.2 30 1,297.1 –54.4Iowa . . . . . . . . . . . . . . . . . . . 28 1,301.5 29 1,356.0 –4.0
Kansas . . . . . . . . . . . . . . . . . 32 801.3 35 929.5 –13.8Kentucky . . . . . . . . . . . . . . . 25 1,702.6 28 1,712.4 –0.6Louisiana . . . . . . . . . . . . . . . 39 486.3 26 1,870.4 –74.0Maine . . . . . . . . . . . . . . . . . . 43 307.0 44 332.6 –7.7Maryland . . . . . . . . . . . . . . . 12 2,749.9 8 4,372.1 –37.1
Massachusetts. . . . . . . . . . . 6 3,706.7 12 3,880.9 –4.5Michigan . . . . . . . . . . . . . . . 19 2,002.7 15 2,879.6 –30.5Minnesota . . . . . . . . . . . . . . 16 2,421.2 23 2,106.7 +14.9Mississippi. . . . . . . . . . . . . . 44 300.9 39 585.7 –48.6Missouri . . . . . . . . . . . . . . . . 22 1,814.4 25 1,988.8 –8.8
Montana. . . . . . . . . . . . . . . . 46 236.6 45 332.1 –28.8Nebraska . . . . . . . . . . . . . . . 40 378.6 34 936.2 –59.6Nevada . . . . . . . . . . . . . . . . . 27 1,411.1 27 1,835.2 –23.1New Hampshire . . . . . . . . . . 47 210.9 48 233.9 –9.8New Jersey. . . . . . . . . . . . . . 5 4,781.2 10 4,064.3 +17.6
New Mexico . . . . . . . . . . . . . 37 541.1 36 849.7 –36.3New York . . . . . . . . . . . . . . . 2 15,666.2 2 18,851.4 –16.9North Carolina . . . . . . . . . . . 24 1,750.4 18 2,490.3 –29.7North Dakota . . . . . . . . . . . . 42 315.4 47 241.0 +30.9Ohio . . . . . . . . . . . . . . . . . . . 8 3,540.3 5 4,832.4 –26.7
Oklahoma. . . . . . . . . . . . . . . 9 3,227.0 20 2,251.2 +43.3Oregon . . . . . . . . . . . . . . . . . 26 1,659.0 9 4,130.4 –59.8Pennsylvania . . . . . . . . . . . . 4 7,349.7 4 7,256.4 +1.3Rhode Island . . . . . . . . . . . . 41 362.6 38 601.6 –39.7South Carolina . . . . . . . . . . . 34 699.3 33 942.2 –25.8
South Dakota . . . . . . . . . . . . 48 158.0 43 354.6 –55.4Tennessee . . . . . . . . . . . . . . 21 1,910.3 21 2,182.1 –12.5Texas . . . . . . . . . . . . . . . . . . 3 12,194.2 3 15,924.9 –23.4Utah . . . . . . . . . . . . . . . . . . . 29 1,183.0 19 2,327.2 –49.2Vermont . . . . . . . . . . . . . . . . 49 134.5 49 215.7 –37.6
Virginia. . . . . . . . . . . . . . . . . 15 2,445.2 24 2,096.1 +16.7Washington . . . . . . . . . . . . . 11 3,124.9 14 3,443.7 –9.3West Virginia . . . . . . . . . . . . 31 937.8 46 321.8 +191.4Wisconsin . . . . . . . . . . . . . . 17 2,273.0 7 4,548.8 –50.0Wyoming . . . . . . . . . . . . . . . 51 77.3 51 70.7 +9.3
American Samoa . . . . . . . . . .. 0.0 .. 0.0 n.m.D. of Columbia . . . . . . . . . . . 33 700.7 31 1,261.5 –44.5Guam . . . . . . . . . . . . . . . . . . .. 0.0 .. 0.0 n.m.Puerto Rico . . . . . . . . . . . . . .. 0.0 .. 0.0 n.m.Trust Territories . . . . . . . . . . .. 0.0 .. 0.0 n.m.Virgin Islands. . . . . . . . . . . . .. 0.0 .. 0.0 n.m.Other Territories . . . . . . . . . . .. 0.0 .. 0.0 n.m.
TOTAL . . . . . . . . . . . . . . . . . $125,604.3 $161,690.8 –22.3
NOTES: Private placements and municipal forwards are included, but short-term notes and remarketings are excluded. n.m. – not meaningful. Source: Thomson Reuters (5/31/18)
Bond Sales by State: January - May
015_BB060118 15 5/31/2018 4:04:30 PM
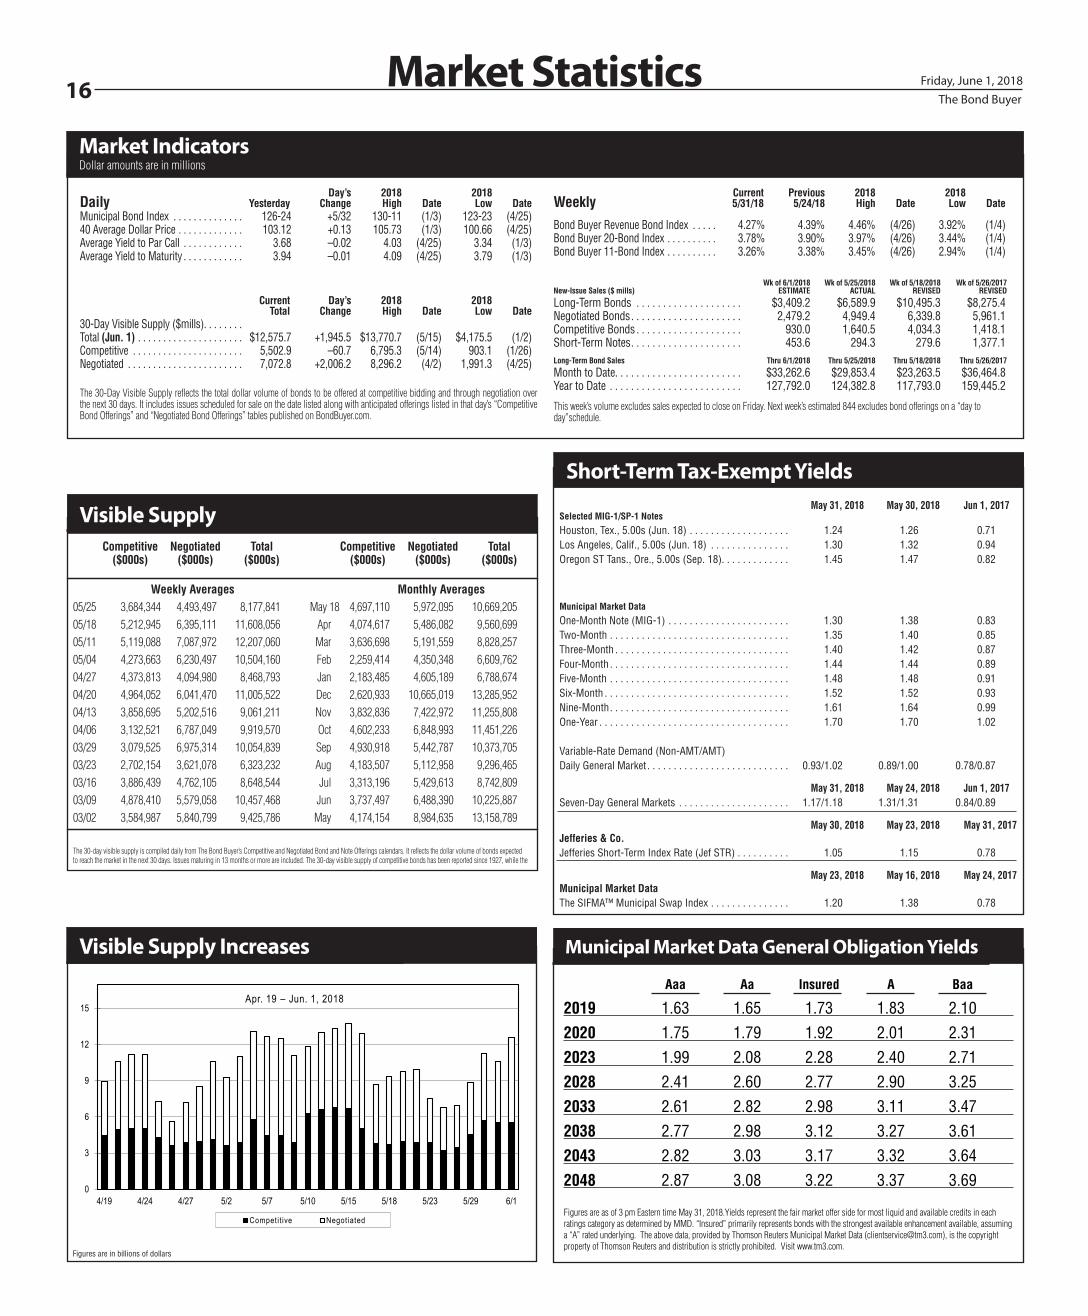
The Bond Buyer16 Friday, June 1, 2018
Day’s 2018 2018 Daily Yesterday Change High Date Low DateMunicipal Bond Index . . . . . . . . . . . . . . 126-24 +5/32 130-11 (1/3) 123-23 (4/25)40 Average Dollar Price . . . . . . . . . . . . . 103 .12 +0 .13 105 .73 (1/3) 100 .66 (4/25)Average Yield to Par Call . . . . . . . . . . . . 3 .68 –0 .02 4 .03 (4/25) 3 .34 (1/3)Average Yield to Maturity . . . . . . . . . . . . 3 .94 –0 .01 4 .09 (4/25) 3 .79 (1/3)
Current Day’s 2018 2018 Total Change High Date Low Date30-Day Visible Supply ($mills) . . . . . . . . Total (Jun. 1) . . . . . . . . . . . . . . . . . . . . . $12,575 .7 +1,945 .5 $13,770 .7 (5/15) $4,175 .5 (1/2)Competitive . . . . . . . . . . . . . . . . . . . . . . 5,502 .9 –60 .7 6,795 .3 (5/14) 903 .1 (1/26)Negotiated . . . . . . . . . . . . . . . . . . . . . . . 7,072 .8 +2,006 .2 8,296 .2 (4/2) 1,991 .3 (4/25)
The 30-Day Visible Supply reflects the total dollar volume of bonds to be offered at competitive bidding and through negotiation over the next 30 days. It includes issues scheduled for sale on the date listed along with anticipated offerings listed in that day’s “Competitive Bond Offerings” and “Negotiated Bond Offerings” tables published on BondBuyer.com.
Current Previous 2018 2018Weekly 5/31/18 5/24/18 High Date Low Date
Bond Buyer Revenue Bond Index . . . . . 4 .27% 4 .39% 4 .46% (4/26) 3 .92% (1/4)Bond Buyer 20-Bond Index . . . . . . . . . . 3 .78% 3 .90% 3 .97% (4/26) 3 .44% (1/4)Bond Buyer 11-Bond Index . . . . . . . . . . 3 .26% 3 .38% 3 .45% (4/26) 2 .94% (1/4)
Wk of 6/1/2018 Wk of 5/25/2018 Wk of 5/18/2018 Wk of 5/26/2017New-Issue Sales ($ mills) ESTIMATE ACTUAL REVISED REVISED
Long-Term Bonds . . . . . . . . . . . . . . . . . . . . $3,409 .2 $6,589 .9 $10,495 .3 $8,275 .4Negotiated Bonds . . . . . . . . . . . . . . . . . . . . . 2,479 .2 4,949 .4 6,339 .8 5,961 .1Competitive Bonds . . . . . . . . . . . . . . . . . . . . 930 .0 1,640 .5 4,034 .3 1,418 .1Short-Term Notes . . . . . . . . . . . . . . . . . . . . . 453 .6 294 .3 279 .6 1,377 .1Long-Term Bond Sales Thru 6/1/2018 Thru 5/25/2018 Thru 5/18/2018 Thru 5/26/2017
Month to Date . . . . . . . . . . . . . . . . . . . . . . . . $33,262 .6 $29,853 .4 $23,263 .5 $36,464 .8Year to Date . . . . . . . . . . . . . . . . . . . . . . . . . 127,792 .0 124,382 .8 117,793 .0 159,445 .2
This week’s volume excludes sales expected to close on Friday. Next week’s estimated 844 excludes bond offerings on a “day to day”schedule.
Market Indicators Dollar amounts are in millions
Market Statistics
Competitive Negotiated Total ($000s) ($000s) ($000s)
Competitive Negotiated Total ($000s) ($000s) ($000s)
Visible Supply
The 30-day visible supply is compiled daily from The Bond Buyer’s Competitive and Negotiated Bond and Note Offerings calendars. It reflects the dollar volume of bonds expected to reach the market in the next 30 days. Issues maturing in 13 months or more are included. The 30-day visible supply of competitive bonds has been reported since 1927, while the
Weekly Averages05/25 3,684,344 4,493,497 8,177,84105/18 5,212,945 6,395,111 11,608,056 05/11 5,119,088 7,087,972 12,207,06005/04 4,273,663 6,230,497 10,504,16004/27 4,373,813 4,094,980 8,468,79304/20 4,964,052 6,041,470 11,005,52204/13 3,858,695 5,202,516 9,061,21104/06 3,132,521 6,787,049 9,919,57003/29 3,079,525 6,975,314 10,054,83903/23 2,702,154 3,621,078 6,323,23203/16 3,886,439 4,762,105 8,648,54403/09 4,878,410 5,579,058 10,457,46803/02 3,584,987 5,840,799 9,425,786
Monthly AveragesMay 18 4,697,110 5,972,095 10,669,205 Apr 4,074,617 5,486,082 9,560,699 Mar 3,636,698 5,191,559 8,828,257 Feb 2,259,414 4,350,348 6,609,762 Jan 2,183,485 4,605,189 6,788,674 Dec 2,620,933 10,665,019 13,285,952 Nov 3,832,836 7,422,972 11,255,808 Oct 4,602,233 6,848,993 11,451,226 Sep 4,930,918 5,442,787 10,373,705 Aug 4,183,507 5,112,958 9,296,465 Jul 3,313,196 5,429,613 8,742,809 Jun 3,737,497 6,488,390 10,225,887 May 4,174,154 8,984,635 13,158,789
May 31, 2018 May 30, 2018 Jun 1, 2017Selected MIG-1/SP-1 Notes
Houston, Tex ., 5 .00s (Jun . 18) . . . . . . . . . . . . . . . . . . . 1 .24 1 .26 0 .71Los Angeles, Calif ., 5 .00s (Jun . 18) . . . . . . . . . . . . . . . 1 .30 1 .32 0 .94Oregon ST Tans ., Ore ., 5 .00s (Sep . 18) . . . . . . . . . . . . . 1 .45 1 .47 0 .82
Municipal Market Data
One-Month Note (MIG-1) . . . . . . . . . . . . . . . . . . . . . . . 1 .30 1 .38 0 .83Two-Month . . . . . . . . . . . . . . . . . . . . . . . . . . . . . . . . . . 1 .35 1 .40 0 .85Three-Month . . . . . . . . . . . . . . . . . . . . . . . . . . . . . . . . . 1 .40 1 .42 0 .87Four-Month . . . . . . . . . . . . . . . . . . . . . . . . . . . . . . . . . . 1 .44 1 .44 0 .89Five-Month . . . . . . . . . . . . . . . . . . . . . . . . . . . . . . . . . . 1 .48 1 .48 0 .91Six-Month . . . . . . . . . . . . . . . . . . . . . . . . . . . . . . . . . . . 1 .52 1 .52 0 .93Nine-Month . . . . . . . . . . . . . . . . . . . . . . . . . . . . . . . . . . 1 .61 1 .64 0 .99One-Year . . . . . . . . . . . . . . . . . . . . . . . . . . . . . . . . . . . . 1 .70 1 .70 1 .02
Variable-Rate Demand (Non-AMT/AMT)Daily General Market . . . . . . . . . . . . . . . . . . . . . . . . . . . 0 .93/1 .02 0 .89/1 .00 0 .78/0 .87
May 31, 2018 May 24, 2018 Jun 1, 2017Seven-Day General Markets . . . . . . . . . . . . . . . . . . . . . 1 .17/1 .18 1 .31/1 .31 0 .84/0 .89
May 30, 2018 May 23, 2018 May 31, 2017Jefferies & Co.Jefferies Short-Term Index Rate (Jef STR) . . . . . . . . . . 1 .05 1 .15 0 .78
May 23, 2018 May 16, 2018 May 24, 2017Municipal Market DataThe SIFMA™ Municipal Swap Index . . . . . . . . . . . . . . . 1 .20 1 .38 0 .78
Short-Term Tax-Exempt Yields
Aaa Aa Insured A Baa
2019 1 .63 1 .65 1 .73 1 .83 2 .102020 1 .75 1 .79 1 .92 2 .01 2 .312023 1 .99 2 .08 2 .28 2 .40 2 .712028 2 .41 2 .60 2 .77 2 .90 3 .252033 2 .61 2 .82 2 .98 3 .11 3 .472038 2 .77 2 .98 3 .12 3 .27 3 .612043 2 .82 3 .03 3 .17 3 .32 3 .642048 2 .87 3 .08 3 .22 3 .37 3 .69
Figures are as of 3 pm Eastern time May 31, 2018.Yields represent the fair market offer side for most liquid and available credits in each ratings category as determined by MMD. “Insured” primarily represents bonds with the strongest available enhancement available, assuming a “A” rated underlying. The above data, provided by Thomson Reuters Municipal Market Data ([email protected]), is the copyright property of Thomson Reuters and distribution is strictly prohibited. Visit www.tm3.com.
Municipal Market Data General Obligation Yields
Figures are in billions of dollars
Visible Supply Increases
0
3
6
9
12
15
4/19 4/24 4/27 5/2 5/7 5/10 5/15 5/18 5/23 5/29 6/1
Apr. 19 – Jun. 1, 2018
Competit ive Negot iated
016_BB060118 16 5/31/2018 4:46:43 PM
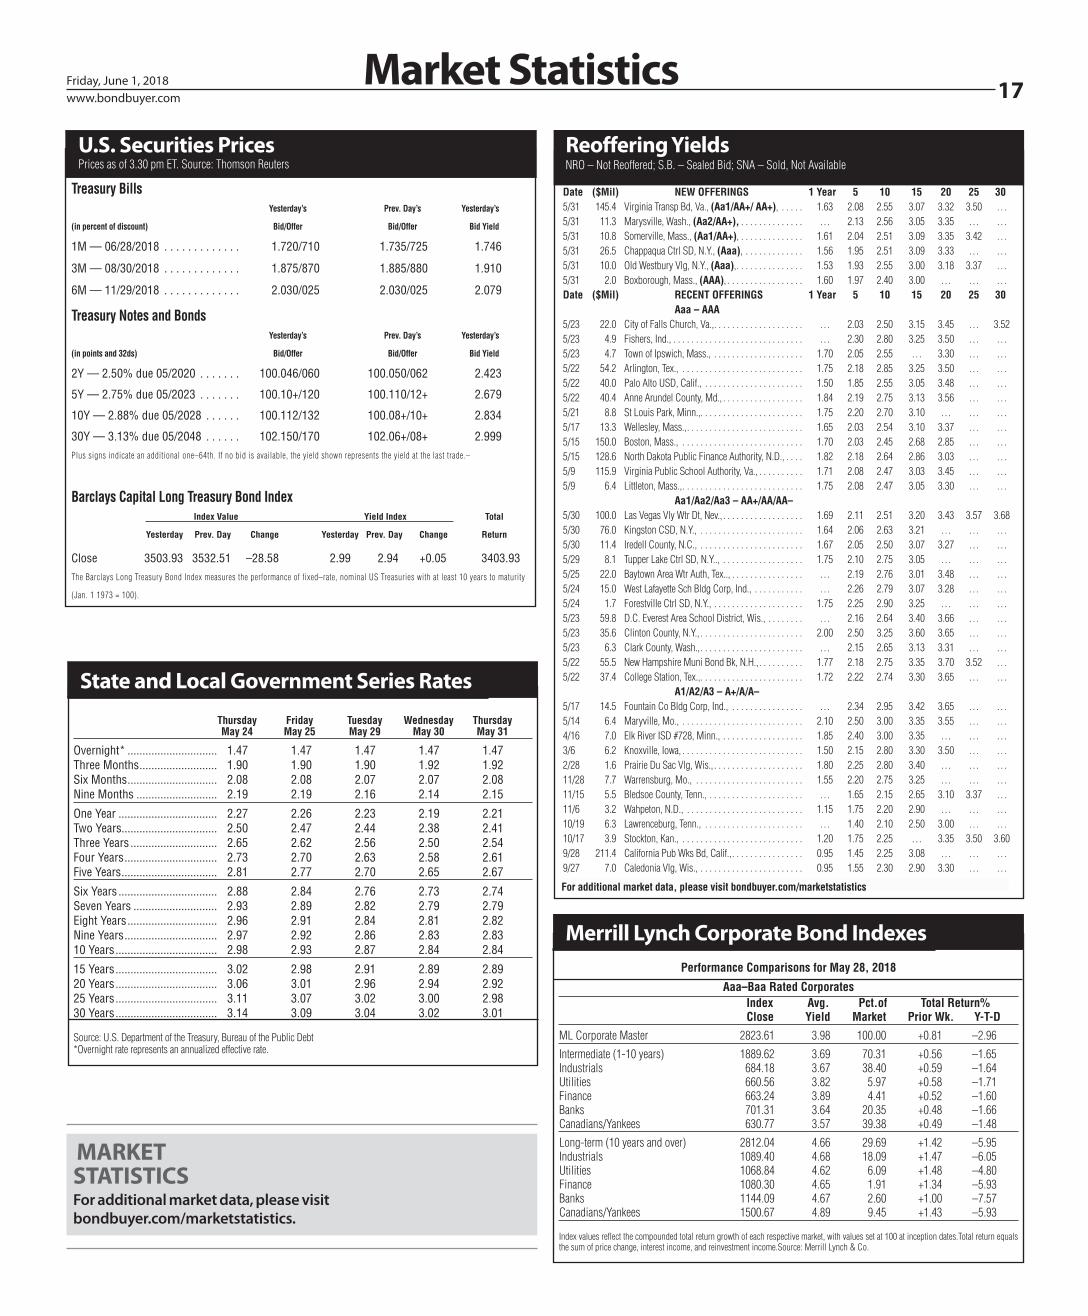
www.bondbuyer.com 17Friday, June 1, 2018 Market Statistics
Treasury Bills Yesterday’s Prev. Day’s Yesterday’s
(in percent of discount) Bid/Offer Bid/Offer Bid Yield
1M — 06/28/2018 . . . . . . . . . . . . . 1 .720/710 1 .735/725 1 .746
3M — 08/30/2018 . . . . . . . . . . . . . 1 .875/870 1 .885/880 1 .910
6M — 11/29/2018 . . . . . . . . . . . . . 2 .030/025 2 .030/025 2 .079
Treasury Notes and Bonds Yesterday’s Prev. Day’s Yesterday’s
(in points and 32ds) Bid/Offer Bid/Offer Bid Yield
2Y — 2 .50% due 05/2020 . . . . . . . 100 .046/060 100 .050/062 2 .423
5Y — 2 .75% due 05/2023 . . . . . . . 100 .10+/120 100 .110/12+ 2 .679
10Y — 2 .88% due 05/2028 . . . . . . 100 .112/132 100 .08+/10+ 2 .834
30Y — 3 .13% due 05/2048 . . . . . . 102 .150/170 102 .06+/08+ 2 .999Plus signs indicate an additional one–64th. If no bid is available, the yield shown represents the yield at the last trade.–
Barclays Capital Long Treasury Bond Index Index Value Yield Index Total
Yesterday Prev. Day Change Yesterday Prev. Day Change Return
Close 3503 .93 3532 .51 –28 .58 2 .99 2 .94 +0 .05 3403 .93
The Barclays Long Treasury Bond Index measures the performance of fixed–rate, nominal US Treasuries with at least 10 years to maturity
(Jan. 1 1973 = 100).
U.S. Securities Prices Prices as of 3.30 pm ET. Source: Thomson Reuters
Thursday Friday Tuesday Wednesday Thursday May 24 May 25 May 29 May 30 May 31
Overnight* . . . . . . . . . . . . . . . . . . . . . . . . . . . . . . 1 .47 1 .47 1 .47 1 .47 1 .47Three Months . . . . . . . . . . . . . . . . . . . . . . . . . . 1 .90 1 .90 1 .90 1 .92 1 .92Six Months . . . . . . . . . . . . . . . . . . . . . . . . . . . . . . 2 .08 2 .08 2 .07 2 .07 2 .08Nine Months . . . . . . . . . . . . . . . . . . . . . . . . . . . 2 .19 2 .19 2 .16 2 .14 2 .15
One Year . . . . . . . . . . . . . . . . . . . . . . . . . . . . . . . . . 2 .27 2 .26 2 .23 2 .19 2 .21Two Years . . . . . . . . . . . . . . . . . . . . . . . . . . . . . . . . 2 .50 2 .47 2 .44 2 .38 2 .41Three Years . . . . . . . . . . . . . . . . . . . . . . . . . . . . . 2 .65 2 .62 2 .56 2 .50 2 .54Four Years . . . . . . . . . . . . . . . . . . . . . . . . . . . . . . . 2 .73 2 .70 2 .63 2 .58 2 .61Five Years . . . . . . . . . . . . . . . . . . . . . . . . . . . . . . . . 2 .81 2 .77 2 .70 2 .65 2 .67
Six Years . . . . . . . . . . . . . . . . . . . . . . . . . . . . . . . . . 2 .88 2 .84 2 .76 2 .73 2 .74Seven Years . . . . . . . . . . . . . . . . . . . . . . . . . . . . 2 .93 2 .89 2 .82 2 .79 2 .79Eight Years . . . . . . . . . . . . . . . . . . . . . . . . . . . . . . 2 .96 2 .91 2 .84 2 .81 2 .82Nine Years . . . . . . . . . . . . . . . . . . . . . . . . . . . . . . . 2 .97 2 .92 2 .86 2 .83 2 .8310 Years . . . . . . . . . . . . . . . . . . . . . . . . . . . . . . . . . . 2 .98 2 .93 2 .87 2 .84 2 .84
15 Years . . . . . . . . . . . . . . . . . . . . . . . . . . . . . . . . . . 3 .02 2 .98 2 .91 2 .89 2 .8920 Years . . . . . . . . . . . . . . . . . . . . . . . . . . . . . . . . . . 3 .06 3 .01 2 .96 2 .94 2 .9225 Years . . . . . . . . . . . . . . . . . . . . . . . . . . . . . . . . . . 3 .11 3 .07 3 .02 3 .00 2 .9830 Years . . . . . . . . . . . . . . . . . . . . . . . . . . . . . . . . . . 3 .14 3 .09 3 .04 3 .02 3 .01
Source: U.S. Department of the Treasury, Bureau of the Public Debt*Overnight rate represents an annualized effective rate.
State and Local Government Series Rates
Date ($Mil) NEW OFFERINGS 1 Year 5 10 15 20 25 305/31 145.4 Virginia Transp Bd, Va., (Aa1/AA+/ AA+), . . . . . 1.63 2.08 2.55 3.07 3.32 3.50 …5/31 11.3 Marysville, Wash., (Aa2/AA+), . . . . . . . . . . . . . . … 2.13 2.56 3.05 3.35 … …5/31 10.8 Somerville, Mass., (Aa1/AA+), . . . . . . . . . . . . . . 1.61 2.04 2.51 3.09 3.35 3.42 …5/31 26.5 Chappaqua Ctrl SD, N.Y., (Aaa), . . . . . . . . . . . . . 1.56 1.95 2.51 3.09 3.33 … …5/31 10.0 Old Westbury Vlg, N.Y., (Aaa),. . . . . . . . . . . . . . . 1.53 1.93 2.55 3.00 3.18 3.37 …5/31 2.0 Boxborough, Mass., (AAA), . . . . . . . . . . . . . . . . . 1.60 1.97 2.40 3.00 … … …Date ($Mil) RECENT OFFERINGS 1 Year 5 10 15 20 25 30 Aaa – AAA 5/23 22.0 City of Falls Church, Va.,. . . . . . . . . . . . . . . . . . . . … 2.03 2.50 3.15 3.45 … 3.525/23 4.9 Fishers, Ind., . . . . . . . . . . . . . . . . . . . . . . . . . . . . . … 2.30 2.80 3.25 3.50 … …5/23 4.7 Town of Ipswich, Mass., . . . . . . . . . . . . . . . . . . . . 1.70 2.05 2.55 … 3.30 … …5/22 54.2 Arlington, Tex., . . . . . . . . . . . . . . . . . . . . . . . . . . . 1.75 2.18 2.85 3.25 3.50 … …5/22 40.0 Palo Alto USD, Calif., . . . . . . . . . . . . . . . . . . . . . . 1.50 1.85 2.55 3.05 3.48 … …5/22 40.4 Anne Arundel County, Md., . . . . . . . . . . . . . . . . . . 1.84 2.19 2.75 3.13 3.56 … …5/21 8.8 St Louis Park, Minn.,. . . . . . . . . . . . . . . . . . . . . . . 1.75 2.20 2.70 3.10 … … …5/17 13.3 Wellesley, Mass.,. . . . . . . . . . . . . . . . . . . . . . . . . . 1.65 2.03 2.54 3.10 3.37 … …5/15 150.0 Boston, Mass., . . . . . . . . . . . . . . . . . . . . . . . . . . . 1.70 2.03 2.45 2.68 2.85 … …5/15 128.6 North Dakota Public Finance Authority, N.D., . . . . 1.82 2.18 2.64 2.86 3.03 … …5/9 115.9 Virginia Public School Authority, Va., . . . . . . . . . . 1.71 2.08 2.47 3.03 3.45 … …5/9 6.4 Littleton, Mass.,. . . . . . . . . . . . . . . . . . . . . . . . . . . 1.75 2.08 2.47 3.05 3.30 … … Aa1/Aa2/Aa3 – AA+/AA/AA–5/30 100.0 Las Vegas Vly Wtr Dt, Nev., . . . . . . . . . . . . . . . . . . 1.69 2.11 2.51 3.20 3.43 3.57 3.685/30 76.0 Kingston CSD, N.Y., . . . . . . . . . . . . . . . . . . . . . . . 1.64 2.06 2.63 3.21 … … …5/30 11.4 Iredell County, N.C., . . . . . . . . . . . . . . . . . . . . . . . 1.67 2.05 2.50 3.07 3.27 … …5/29 8.1 Tupper Lake Ctrl SD, N.Y.., . . . . . . . . . . . . . . . . . . 1.75 2.10 2.75 3.05 … … …5/25 22.0 Baytown Area Wtr Auth, Tex.., . . . . . . . . . . . . . . . . … 2.19 2.76 3.01 3.48 … …5/24 15.0 West Lafayette Sch Bldg Corp, Ind., . . . . . . . . . . . … 2.26 2.79 3.07 3.28 … …5/24 1.7 Forestville Ctrl SD, N.Y., . . . . . . . . . . . . . . . . . . . . 1.75 2.25 2.90 3.25 … … …5/23 59.8 D.C. Everest Area School District, Wis., . . . . . . . . … 2.16 2.64 3.40 3.66 … …5/23 35.6 Clinton County, N.Y., . . . . . . . . . . . . . . . . . . . . . . . 2.00 2.50 3.25 3.60 3.65 … …5/23 6.3 Clark County, Wash.,. . . . . . . . . . . . . . . . . . . . . . . … 2.15 2.65 3.13 3.31 … …5/22 55.5 New Hampshire Muni Bond Bk, N.H.,. . . . . . . . . . 1.77 2.18 2.75 3.35 3.70 3.52 …5/22 37.4 College Station, Tex.,. . . . . . . . . . . . . . . . . . . . . . . 1.72 2.22 2.74 3.30 3.65 … … A1/A2/A3 – A+/A/A–5/17 14.5 Fountain Co Bldg Corp, Ind., . . . . . . . . . . . . . . . . … 2.34 2.95 3.42 3.65 … …5/14 6.4 Maryville, Mo., . . . . . . . . . . . . . . . . . . . . . . . . . . . 2.10 2.50 3.00 3.35 3.55 … …4/16 7.0 Elk River ISD #728, Minn., . . . . . . . . . . . . . . . . . . 1.85 2.40 3.00 3.35 … … …3/6 6.2 Knoxville, Iowa, . . . . . . . . . . . . . . . . . . . . . . . . . . . 1.50 2.15 2.80 3.30 3.50 … …2/28 1.6 Prairie Du Sac Vlg, Wis., . . . . . . . . . . . . . . . . . . . . 1.80 2.25 2.80 3.40 … … …11/28 7.7 Warrensburg, Mo., . . . . . . . . . . . . . . . . . . . . . . . . 1.55 2.20 2.75 3.25 … … …11/15 5.5 Bledsoe County, Tenn., . . . . . . . . . . . . . . . . . . . . . … 1.65 2.15 2.65 3.10 3.37 …11/6 3.2 Wahpeton, N.D., . . . . . . . . . . . . . . . . . . . . . . . . . . 1.15 1.75 2.20 2.90 … … …10/19 6.3 Lawrenceburg, Tenn., . . . . . . . . . . . . . . . . . . . . . . … 1.40 2.10 2.50 3.00 … …10/17 3.9 Stockton, Kan., . . . . . . . . . . . . . . . . . . . . . . . . . . . 1.20 1.75 2.25 … 3.35 3.50 3.609/28 211.4 California Pub Wks Bd, Calif.,. . . . . . . . . . . . . . . . 0.95 1.45 2.25 3.08 … … …9/27 7.0 Caledonia Vlg, Wis., . . . . . . . . . . . . . . . . . . . . . . . 0.95 1.55 2.30 2.90 3.30 … …
Reoffering YieldsNRO – Not Reoffered; S.B. – Sealed Bid; SNA – Sold, Not AvailableOffer Amount
For additional market data, please visit bondbuyer.com/marketstatistics
Performance Comparisons for May 28, 2018
Aaa–Baa Rated Corporates Index Avg. Pct.of Total Return%Close Yield Market Prior Wk. Y-T-D
ML Corporate Master 2823.61 3.98 100.00 +0.81 –2.96
Intermediate (1-10 years) 1889.62 3.69 70.31 +0.56 –1.65Industrials 684.18 3.67 38.40 +0.59 –1.64Utilities 660.56 3.82 5.97 +0.58 –1.71Finance 663.24 3.89 4.41 +0.52 –1.60Banks 701.31 3.64 20.35 +0.48 –1.66Canadians/Yankees 630.77 3.57 39.38 +0.49 –1.48
Long-term (10 years and over) 2812.04 4.66 29.69 +1.42 –5.95Industrials 1089.40 4.68 18.09 +1.47 –6.05Utilities 1068.84 4.62 6.09 +1.48 –4.80Finance 1080.30 4.65 1.91 +1.34 –5.93Banks 1144.09 4.67 2.60 +1.00 –7.57Canadians/Yankees 1500.67 4.89 9.45 +1.43 –5.93
Index values reflect the compounded total return growth of each respective market, with values set at 100 at inception dates.Total return equals the sum of price change, interest income, and reinvestment income.Source: Merrill Lynch & Co.
Merrill Lynch Corporate Bond Indexes
MARKET STATISTICSFor additional market data, please visit bondbuyer.com/marketstatistics.
017_BB060118 17 5/31/2018 4:22:02 PM
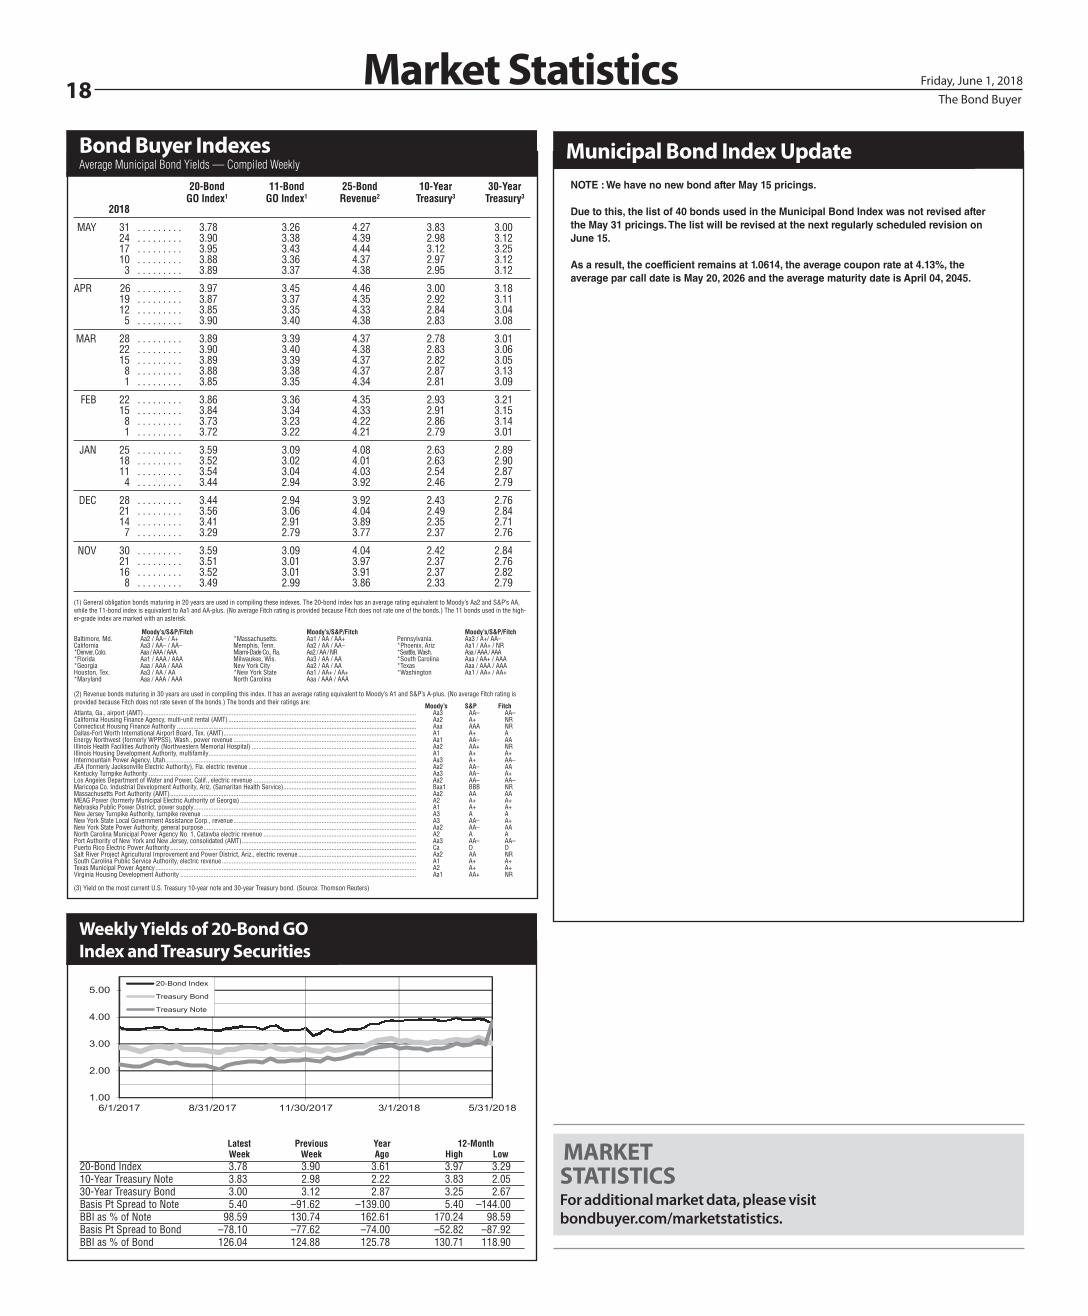
The Bond Buyer18 Friday, June 1, 2018
20-Bond 11-Bond 25-Bond 10-Year 30-Year GO Index1 GO Index1 Revenue2 Treasury3 Treasury3
2018
MAY 31 . . . . . . . . . 3.78 3.26 4.27 3.83 3.00 24 . . . . . . . . . 3.90 3.38 4.39 2.98 3.12 17 . . . . . . . . . 3.95 3.43 4.44 3.12 3.25 10 . . . . . . . . . 3.88 3.36 4.37 2.97 3.12 3 . . . . . . . . . 3.89 3.37 4.38 2.95 3.12
APR 26 . . . . . . . . . 3.97 3.45 4.46 3.00 3.18 19 . . . . . . . . . 3.87 3.37 4.35 2.92 3.11 12 . . . . . . . . . 3.85 3.35 4.33 2.84 3.04 5 . . . . . . . . . 3.90 3.40 4.38 2.83 3.08
MAR 28 . . . . . . . . . 3.89 3.39 4.37 2.78 3.01 22 . . . . . . . . . 3.90 3.40 4.38 2.83 3.06 15 . . . . . . . . . 3.89 3.39 4.37 2.82 3.05 8 . . . . . . . . . 3.88 3.38 4.37 2.87 3.13 1 . . . . . . . . . 3.85 3.35 4.34 2.81 3.09
FEB 22 . . . . . . . . . 3.86 3.36 4.35 2.93 3.21 15 . . . . . . . . . 3.84 3.34 4.33 2.91 3.15 8 . . . . . . . . . 3.73 3.23 4.22 2.86 3.14 1 . . . . . . . . . 3.72 3.22 4.21 2.79 3.01
JAN 25 . . . . . . . . . 3.59 3.09 4.08 2.63 2.89 18 . . . . . . . . . 3.52 3.02 4.01 2.63 2.90 11 . . . . . . . . . 3.54 3.04 4.03 2.54 2.87 4 . . . . . . . . . 3.44 2.94 3.92 2.46 2.79
DEC 28 . . . . . . . . . 3.44 2.94 3.92 2.43 2.76 21 . . . . . . . . . 3.56 3.06 4.04 2.49 2.84 14 . . . . . . . . . 3.41 2.91 3.89 2.35 2.71 7 . . . . . . . . . 3.29 2.79 3.77 2.37 2.76
NOV 30 . . . . . . . . . 3.59 3.09 4.04 2.42 2.84 21 . . . . . . . . . 3.51 3.01 3.97 2.37 2.76 16 . . . . . . . . . 3.52 3.01 3.91 2.37 2.82 8 . . . . . . . . . 3.49 2.99 3.86 2.33 2.79
(1) General obligation bonds maturing in 20 years are used in compiling these indexes. The 20-bond index has an average rating equivalent to Moody’s Aa2 and S&P’s AA, while the 11-bond index is equivalent to Aa1 and AA-plus. (No average Fitch rating is provided because Fitch does not rate one of the bonds.) The 11 bonds used in the high-er-grade index are marked with an asterisk.
Moody’s/S&P/Fitch Moody’s/S&P/Fitch Moody’s/S&P/FitchBaltimore, Md. Aa2 / AA– / A+ *Massachusetts. Aa1 / AA / AA+ Pennsylvania. Aa3 / A+/ AA–California Aa3 / AA– / AA– Memphis, Tenn. Aa2 / AA / AA– *Phoenix, Ariz Aa1 / AA+ / NR*Denver, Colo. Aaa / AAA / AAA Miami-Dade Co., Fla. Aa2 / AA / NR *Seattle, Wash. Aaa / AAA / AAA*Florida Aa1 / AAA / AAA Milwaukee, Wis. Aa3 / AA / AA *South Carolina Aaa / AA+ / AAA*Georgia Aaa / AAA / AAA New York City Aa2 / AA / AA *Texas Aaa / AAA / AAAHouston, Tex. Aa3 / AA / AA *New York State Aa1 / AA+ / AA+ *Washington Aa1 / AA+ / AA+*Maryland Aaa / AAA / AAA North Carolina Aaa / AAA / AAA
(2) Revenue bonds maturing in 30 years are used in compiling this index. It has an average rating equivalent to Moody’s A1 and S&P’s A-plus. (No average Fitch rating is provided because Fitch does not rate seven of the bonds.) The bonds and their ratings are: Moody’s S&P FitchAtlanta, Ga., airport (AMT) .................................................................................................................................................................... Aa3 AA– AA–California Housing Finance Agency, multi-unit rental (AMT) ................................................................................................................. Aa2 A+ NRConnecticut Housing Finance Authority ................................................................................................................................................ Aaa AAA NRDallas-Fort Worth International Airport Board, Tex. (AMT).................................................................................................................... A1 A+ AEnergy Northwest (formerly WPPSS), Wash., power revenue .............................................................................................................. Aa1 AA– AAIllinois Health Facilities Authority (Northwestern Memorial Hospital) ................................................................................................... Aa2 AA+ NRIllinois Housing Development Authority, multifamily ............................................................................................................................. A1 A+ A+Intermountain Power Agency, Utah ....................................................................................................................................................... Aa3 A+ AA–JEA (formerly Jacksonville Electric Authority), Fla. electric revenue ..................................................................................................... Aa2 AA– AAKentucky Turnpike Authority ................................................................................................................................................................. Aa3 AA– A+Los Angeles Department of Water and Power, Calif., electric revenue .................................................................................................. Aa2 AA– AA–Maricopa Co. Industrial Development Authority, Ariz. (Samaritan Health Service) ................................................................................ Baa1 BBB NRMassachusetts Port Authority (AMT) .................................................................................................................................................... Aa2 AA AAMEAG Power (formerly Municipal Electric Authority of Georgia) .......................................................................................................... A2 A+ A+Nebraska Public Power District, power supply ...................................................................................................................................... A1 A+ A+New Jersey Turnpike Authority, turnpike revenue ................................................................................................................................. A3 A ANew York State Local Government Assistance Corp., revenue .............................................................................................................. A3 AA– A+New York State Power Authority, general purpose ................................................................................................................................ Aa2 AA– AANorth Carolina Municipal Power Agency No. 1, Catawba electric revenue ............................................................................................ A2 A APort Authority of New York and New Jersey, consolidated (AMT) ......................................................................................................... Aa3 AA– AA–Puerto Rico Electric Power Authority .................................................................................................................................................... Ca D DSalt River Project Agricultural Improvement and Power District, Ariz., electric revenue ....................................................................... Aa2 AA NRSouth Carolina Public Service Authority, electric revenue ..................................................................................................................... A1 A+ A+Texas Municipal Power Agency ............................................................................................................................................................. A2 A+ A+Virginia Housing Development Authority .............................................................................................................................................. Aa1 AA+ NR
(3) Yield on the most current U.S. Treasury 10-year note and 30-year Treasury bond. (Source: Thomson Reuters)
Bond Buyer IndexesAverage Municipal Bond Yields — Compiled Weekly
Market Statistics
Latest Previous Year 12-Month Week Week Ago High Low20-Bond Index 3.78 3.90 3.61 3.97 3.2910-Year Treasury Note 3.83 2.98 2.22 3.83 2.0530-Year Treasury Bond 3.00 3.12 2.87 3.25 2.67Basis Pt Spread to Note 5.40 –91.62 –139.00 5.40 –144.00BBI as % of Note 98.59 130.74 162.61 170.24 98.59Basis Pt Spread to Bond –78.10 –77.62 –74.00 –52.82 –87.92BBI as % of Bond 126.04 124.88 125.78 130.71 118.90
Weekly Yields of 20-Bond GOIndex and Treasury Securities
1.00
2.00
3.00
4.00
5.00
6/1/2017 8/31/2017 11/30/2017 3/1/2018 5/31/2018
20-Bond Index
Treasury Bond
Treasury Note
NOTE : We have no new bond after May 15 pricings.
Due to this, the list of 40 bonds used in the Municipal Bond Index was not revised after the May 31 pricings. The list will be revised at the next regularly scheduled revision on June 15.
As a result, the coefficient remains at 1.0614, the average coupon rate at 4.13%, the average par call date is May 20, 2026 and the average maturity date is April 04, 2045.
Municipal Bond Index Update
MARKETSTATISTICSFor additional market data, please visit bondbuyer.com/marketstatistics.
018_BB060118 18 5/31/2018 4:01:14 PM
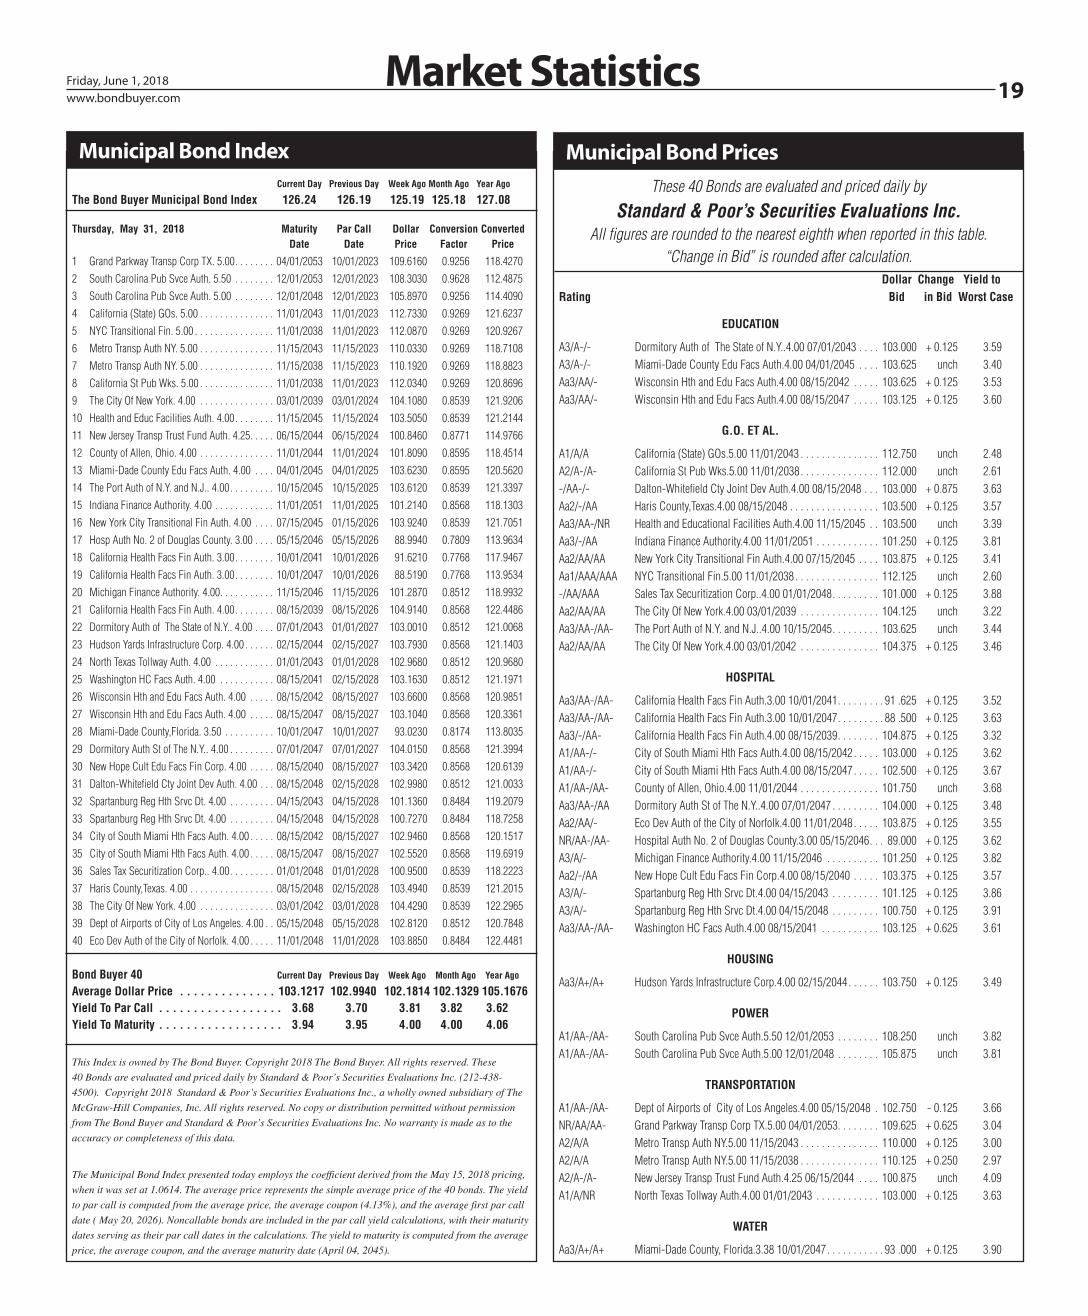
www.bondbuyer.com 19Friday, June 1, 2018
Current Day Previous Day Week Ago Month Ago Year Ago
The Bond Buyer Municipal Bond Index 126.24 126.19 125.19 125.18 127.08
Thursday, May 31, 2018 Maturity Par Call Dollar Conversion Converted Date Date Price Factor Price
1 Grand Parkway Transp Corp TX. 5.00. . . . . . . . 04/01/2053 10/01/2023 109.6160 0.9256 118.4270 2 South Carolina Pub Svce Auth. 5.50 . . . . . . . . 12/01/2053 12/01/2023 108.3030 0.9628 112.4875 3 South Carolina Pub Svce Auth. 5.00 . . . . . . . . 12/01/2048 12/01/2023 105.8970 0.9256 114.4090 4 California (State) GOs. 5.00 . . . . . . . . . . . . . . . 11/01/2043 11/01/2023 112.7330 0.9269 121.6237 5 NYC Transitional Fin. 5.00 . . . . . . . . . . . . . . . . 11/01/2038 11/01/2023 112.0870 0.9269 120.9267 6 Metro Transp Auth NY. 5.00 . . . . . . . . . . . . . . . 11/15/2043 11/15/2023 110.0330 0.9269 118.7108 7 Metro Transp Auth NY. 5.00 . . . . . . . . . . . . . . . 11/15/2038 11/15/2023 110.1920 0.9269 118.8823 8 California St Pub Wks. 5.00 . . . . . . . . . . . . . . . 11/01/2038 11/01/2023 112.0340 0.9269 120.8696 9 The City Of New York. 4.00 . . . . . . . . . . . . . . . 03/01/2039 03/01/2024 104.1080 0.8539 121.9206 10 Health and Educ Facilities Auth. 4.00. . . . . . . . 11/15/2045 11/15/2024 103.5050 0.8539 121.2144 11 New Jersey Transp Trust Fund Auth. 4.25. . . . . 06/15/2044 06/15/2024 100.8460 0.8771 114.9766 12 County of Allen, Ohio. 4.00 . . . . . . . . . . . . . . . 11/01/2044 11/01/2024 101.8090 0.8595 118.4514 13 Miami-Dade County Edu Facs Auth. 4.00 . . . . 04/01/2045 04/01/2025 103.6230 0.8595 120.5620 14 The Port Auth of N.Y. and N.J.. 4.00. . . . . . . . . 10/15/2045 10/15/2025 103.6120 0.8539 121.3397 15 Indiana Finance Authority. 4.00 . . . . . . . . . . . . 11/01/2051 11/01/2025 101.2140 0.8568 118.1303 16 New York City Transitional Fin Auth. 4.00 . . . . 07/15/2045 01/15/2026 103.9240 0.8539 121.7051 17 Hosp Auth No. 2 of Douglas County. 3.00 . . . . 05/15/2046 05/15/2026 88.9940 0.7809 113.9634 18 California Health Facs Fin Auth. 3.00. . . . . . . . 10/01/2041 10/01/2026 91.6210 0.7768 117.9467 19 California Health Facs Fin Auth. 3.00. . . . . . . . 10/01/2047 10/01/2026 88.5190 0.7768 113.9534 20 Michigan Finance Authority. 4.00. . . . . . . . . . . 11/15/2046 11/15/2026 101.2870 0.8512 118.9932 21 California Health Facs Fin Auth. 4.00. . . . . . . . 08/15/2039 08/15/2026 104.9140 0.8568 122.4486 22 Dormitory Auth of The State of N.Y.. 4.00 . . . . 07/01/2043 01/01/2027 103.0010 0.8512 121.0068 23 Hudson Yards Infrastructure Corp. 4.00 . . . . . . 02/15/2044 02/15/2027 103.7930 0.8568 121.1403 24 North Texas Tollway Auth. 4.00 . . . . . . . . . . . . 01/01/2043 01/01/2028 102.9680 0.8512 120.9680 25 Washington HC Facs Auth. 4.00 . . . . . . . . . . . 08/15/2041 02/15/2028 103.1630 0.8512 121.1971 26 Wisconsin Hth and Edu Facs Auth. 4.00 . . . . . 08/15/2042 08/15/2027 103.6600 0.8568 120.9851 27 Wisconsin Hth and Edu Facs Auth. 4.00 . . . . . 08/15/2047 08/15/2027 103.1040 0.8568 120.3361 28 Miami-Dade County,Florida. 3.50 . . . . . . . . . . 10/01/2047 10/01/2027 93.0230 0.8174 113.8035 29 Dormitory Auth St of The N.Y.. 4.00 . . . . . . . . . 07/01/2047 07/01/2027 104.0150 0.8568 121.3994 30 New Hope Cult Edu Facs Fin Corp. 4.00 . . . . . 08/15/2040 08/15/2027 103.3420 0.8568 120.6139 31 Dalton-Whitefield Cty Joint Dev Auth. 4.00 . . . 08/15/2048 02/15/2028 102.9980 0.8512 121.0033 32 Spartanburg Reg Hth Srvc Dt. 4.00 . . . . . . . . . 04/15/2043 04/15/2028 101.1360 0.8484 119.2079 33 Spartanburg Reg Hth Srvc Dt. 4.00 . . . . . . . . . 04/15/2048 04/15/2028 100.7270 0.8484 118.7258 34 City of South Miami Hth Facs Auth. 4.00 . . . . . 08/15/2042 08/15/2027 102.9460 0.8568 120.1517 35 City of South Miami Hth Facs Auth. 4.00 . . . . . 08/15/2047 08/15/2027 102.5520 0.8568 119.6919 36 Sales Tax Securitization Corp.. 4.00. . . . . . . . . 01/01/2048 01/01/2028 100.9500 0.8539 118.2223 37 Haris County,Texas. 4.00 . . . . . . . . . . . . . . . . . 08/15/2048 02/15/2028 103.4940 0.8539 121.2015 38 The City Of New York. 4.00 . . . . . . . . . . . . . . . 03/01/2042 03/01/2028 104.4290 0.8539 122.2965 39 Dept of Airports of City of Los Angeles. 4.00 . . 05/15/2048 05/15/2028 102.8120 0.8512 120.7848 40 Eco Dev Auth of the City of Norfolk. 4.00 . . . . . 11/01/2048 11/01/2028 103.8850 0.8484 122.4481
Bond Buyer 40 Current Day Previous Day Week Ago Month Ago Year Ago
Average Dollar Price . . . . . . . . . . . . . . 103.1217 102.9940 102.1814 102.1329 105.1676Yield To Par Call . . . . . . . . . . . . . . . . . . 3.68 3.70 3.81 3.82 3.62Yield To Maturity . . . . . . . . . . . . . . . . . . 3.94 3.95 4.00 4.00 4.06
This Index is owned by The Bond Buyer. Copyright 2018 The Bond Buyer. All rights reserved. These
40 Bonds are evaluated and priced daily by Standard & Poor’s Securities Evaluations Inc. (212-438-
4500). Copyright 2018 Standard & Poor’s Securities Evaluations Inc., a wholly owned subsidiary of The
McGraw-Hill Companies, Inc. All rights reserved. No copy or distribution permitted without permission
from The Bond Buyer and Standard & Poor’s Securities Evaluations Inc. No warranty is made as to the
accuracy or completeness of this data.
The Municipal Bond Index presented today employs the coefficient derived from the May 15, 2018 pricing,
when it was set at 1.0614. The average price represents the simple average price of the 40 bonds. The yield
to par call is computed from the average price, the average coupon (4.13%), and the average first par call
date ( May 20, 2026). Noncallable bonds are included in the par call yield calculations, with their maturity
dates serving as their par call dates in the calculations. The yield to maturity is computed from the average
price, the average coupon, and the average maturity date (April 04, 2045).
Municipal Bond Index
Market Statistics
These 40 Bonds are evaluated and priced daily by
Standard & Poor’s Securities Evaluations Inc. All figures are rounded to the nearest eighth when reported in this table.
“Change in Bid” is rounded after calculation. Dollar Change Yield toRating Bid in Bid Worst Case
EDUCATION
A3/A-/- Dormitory Auth of The State of N.Y..4.00 07/01/2043 . . . . 103.000 + 0.125 3.59 A3/A-/- Miami-Dade County Edu Facs Auth.4.00 04/01/2045 . . . . 103.625 unch 3.40 Aa3/AA/- Wisconsin Hth and Edu Facs Auth.4.00 08/15/2042 . . . . . 103.625 + 0.125 3.53 Aa3/AA/- Wisconsin Hth and Edu Facs Auth.4.00 08/15/2047 . . . . . 103.125 + 0.125 3.60
G.O. ET AL.
A1/A/A California (State) GOs.5.00 11/01/2043 . . . . . . . . . . . . . . . 112.750 unch 2.48 A2/A-/A- California St Pub Wks.5.00 11/01/2038. . . . . . . . . . . . . . . 112.000 unch 2.61 -/AA-/- Dalton-Whitefield Cty Joint Dev Auth.4.00 08/15/2048 . . . 103.000 + 0.875 3.63 Aa2/-/AA Haris County,Texas.4.00 08/15/2048 . . . . . . . . . . . . . . . . . 103.500 + 0.125 3.57 Aa3/AA-/NR Health and Educational Facilities Auth.4.00 11/15/2045 . . 103.500 unch 3.39 Aa3/-/AA Indiana Finance Authority.4.00 11/01/2051 . . . . . . . . . . . . 101.250 + 0.125 3.81 Aa2/AA/AA New York City Transitional Fin Auth.4.00 07/15/2045 . . . . 103.875 + 0.125 3.41 Aa1/AAA/AAA NYC Transitional Fin.5.00 11/01/2038 . . . . . . . . . . . . . . . . 112.125 unch 2.60 -/AA/AAA Sales Tax Securitization Corp..4.00 01/01/2048. . . . . . . . . 101.000 + 0.125 3.88 Aa2/AA/AA The City Of New York.4.00 03/01/2039 . . . . . . . . . . . . . . . 104.125 unch 3.22 Aa3/AA-/AA- The Port Auth of N.Y. and N.J..4.00 10/15/2045. . . . . . . . . 103.625 unch 3.44 Aa2/AA/AA The City Of New York.4.00 03/01/2042 . . . . . . . . . . . . . . . 104.375 + 0.125 3.46
HOSPITAL
Aa3/AA-/AA- California Health Facs Fin Auth.3.00 10/01/2041. . . . . . . . . 91 .625 + 0.125 3.52 Aa3/AA-/AA- California Health Facs Fin Auth.3.00 10/01/2047. . . . . . . . . 88 .500 + 0.125 3.63 Aa3/-/AA- California Health Facs Fin Auth.4.00 08/15/2039. . . . . . . . 104.875 + 0.125 3.32 A1/AA-/- City of South Miami Hth Facs Auth.4.00 08/15/2042. . . . . 103.000 + 0.125 3.62 A1/AA-/- City of South Miami Hth Facs Auth.4.00 08/15/2047. . . . . 102.500 + 0.125 3.67 A1/AA-/AA- County of Allen, Ohio.4.00 11/01/2044 . . . . . . . . . . . . . . . 101.750 unch 3.68 Aa3/AA-/AA Dormitory Auth St of The N.Y..4.00 07/01/2047 . . . . . . . . . 104.000 + 0.125 3.48 Aa2/AA/- Eco Dev Auth of the City of Norfolk.4.00 11/01/2048. . . . . 103.875 + 0.125 3.55 NR/AA-/AA- Hospital Auth No. 2 of Douglas County.3.00 05/15/2046. . . 89.000 + 0.125 3.62 A3/A/- Michigan Finance Authority.4.00 11/15/2046 . . . . . . . . . . 101.250 + 0.125 3.82 Aa2/-/AA New Hope Cult Edu Facs Fin Corp.4.00 08/15/2040 . . . . . 103.375 + 0.125 3.57 A3/A/- Spartanburg Reg Hth Srvc Dt.4.00 04/15/2043 . . . . . . . . . 101.125 + 0.125 3.86 A3/A/- Spartanburg Reg Hth Srvc Dt.4.00 04/15/2048 . . . . . . . . . 100.750 + 0.125 3.91 Aa3/AA-/AA- Washington HC Facs Auth.4.00 08/15/2041 . . . . . . . . . . . 103.125 + 0.625 3.61
HOUSING
Aa3/A+/A+ Hudson Yards Infrastructure Corp.4.00 02/15/2044. . . . . . 103.750 + 0.125 3.49
POWER
A1/AA-/AA- South Carolina Pub Svce Auth.5.50 12/01/2053 . . . . . . . . 108.250 unch 3.82 A1/AA-/AA- South Carolina Pub Svce Auth.5.00 12/01/2048 . . . . . . . . 105.875 unch 3.81
TRANSPORTATION
A1/AA-/AA- Dept of Airports of City of Los Angeles.4.00 05/15/2048 . 102.750 - 0.125 3.66 NR/AA/AA- Grand Parkway Transp Corp TX.5.00 04/01/2053. . . . . . . . 109.625 + 0.625 3.04 A2/A/A Metro Transp Auth NY.5.00 11/15/2043 . . . . . . . . . . . . . . . 110.000 + 0.125 3.00 A2/A/A Metro Transp Auth NY.5.00 11/15/2038 . . . . . . . . . . . . . . . 110.125 + 0.250 2.97 A2/A-/A- New Jersey Transp Trust Fund Auth.4.25 06/15/2044 . . . . 100.875 unch 4.09 A1/A/NR North Texas Tollway Auth.4.00 01/01/2043 . . . . . . . . . . . . 103.000 + 0.125 3.63
WATER
Aa3/A+/A+ Miami-Dade County, Florida.3.38 10/01/2047. . . . . . . . . . . 93 .000 + 0.125 3.90
Municipal Bond Prices
019_BB060118 19 5/31/2018 4:43:16 PM

The Bond Buyer20 Friday, June 1, 2018
2018June 21 Midwest Municipal Market Swissôtel Chicago Chicago, IL
October 1-3 California Public Finance JW Marriott Los Angeles LA Live Los Angeles, CA
October 24 Mid-Atlantic Municipal Market Union League of Philadelphia Philadelphia, PA
November 29-30 Transportation Finance/P3 Westin Galleria Dallas Dallas, TX
December 6 Deal of the Year 583 Park Avenue New York, NY
www.bondbuyer.com/conferences
TO REGISTER CONTACTVernesa Merdanovic at (212) 803-8393
TO SPONSOR & EXHIBIT CONTACTMike Ballinger at (212) 803-8481 [email protected]
UPCOMING CONFERENCES
020_BB06011801 20 5/31/2018 2:28:57 PM