Embed Size (px)
Citation preview
ISSN 0798 1015
HOME Revista ESPACIOS ! ÍNDICES ! A LOS AUTORES !
Vol. 38 (Nº 47) Year 2017. Page 33
Assessment of impacts of the stateintervention in foreign trade oneconomic growthEvaluación de los impactos de la intervención estatal en elcomercio exterior sobre el crecimiento económicoMayis GULALIYEV 1; Suriya ABASOVA 2; Shahla HUSEYNOVA 3; Reyhan AZIZOVA 4; TabrizYADIGAROV 5;
Received: 03/10/2017 • Approved: 06/10/2017
Content1. Introduction2. Methods3. Data, Analysis, and Results4. Discussion5. ConclusionsReferences
ABSTRACT:With development of globalization and integration ofnational economies the question on the stateintervention in economy became more sharply. Inmodern economic and political conditions allgovernments in the world has intervention in economybut in different levels. Thus, almost nobody challengesthe fact about necessity intervention in economy. Thus,assesment of relationship between somemacroeconomic indicators and intervention levels ineconomy has great scientific and practical value. Keywords index of leftness (rightness) of economy,foreign trade subindex, economic liberalization,government intervention in economy
RESUMEN:Con el desarrollo de la globalización y la integración delas economías nacionales, la pregunta sobre laintervención estatal en la economía se hizo más aguda.En las modernas condiciones económicas y políticas,todos los gobiernos del mundo tienen intervención en laeconomía, pero en diferentes niveles. Así, casi nadiecuestiona el hecho de la intervención de necesidad en laeconomía. Así, la evaluación de la relación entrealgunos indicadores macroeconómicos y los niveles deintervención en la economía tiene un gran valorcientífico y práctico. Palabras clave: índice de izquierda (derecha) de laeconomía, subíndice del comercio exterior, liberalizacióneconómica, intervención del gobierno en la economía
1. IntroductionThe development of science and technology causes an increase in the consumer demand. Asthe demand volume increases, goods and services exchange between two countries expands.

Not a state has the opportunity to meet the demand of its nation in full, that’s why it has toexchange goods and services with other states. However, each country should have necessaryamount of currency in order to acquire necessary goods and services. Export is, therefore,necessary to realize import. Nonetheless, each country imports necessary amount of goods andservices only in two cases. Firstly, these goods and services aren’t produced in the country.Secondly, the production of goods and services of the same quality in the given country is moreexpensive. It means that trade between two countries is not obligatory, it is of voluntary andmutually beneficial nature.However, it is all good only at first sight. It actually happens that seemingly mutually beneficialinternational trade brings a number of problems. Firstly, continuous imports of goods, whicharen’t produced in a country, prevent development of personnel, skills and expertise necessaryfor manufacture of these products in years to come. Secondly, imports of the goods, which areproduced in a country, provoke additional competition for local goods and generally displacethem from the market. This is detrimental to local manufacturers’ incomes and causes furthersocial problems. Generally, the quality of an imported product is much different from the qualityof a local product, and competitive environment on the market, therefore, changes subject tonew criteria.Considering the importance of foreign economic activity of each country, it should be noted thatits limitation to some extent is necessary. For example, the import has to have such limits inorder to 1) protect country’s local manufacturers against economic damage; 2) prevent theimport of poor or low-quality products.Export business is a specific activity, which is maintained by all countries. Nonetheless, thisactivity should have limits too. In other words, export business should fall within the limits toprevent profound effects on domestic prices. On the other hand, the uncontrolled freedom ofgoods export may eventually depress demand for local products within a country and lead to adisbalance between demand and supply. Thus, export business brings additional currency to acountry and its main task is to provide currency supply for import. Export, therefore, should beon such a level to not stimulate import in the future.Over the time as international economic relations, and, particularly, states’ foreign trade,evolve, the issue of its control and regulation has been a major focus of interest. As a result,two opposite points of view regarding foreign trade activities was formed. The first(protectionism) involves protection of domestic market against adverse external influence ofdifferent economic and political factors and protection of local businesses on the domesticmarket; the second (free trade), on the contrary, provides for removal of any constraints ininternational trade (in a broad sense of this word – economic relations between states).There’s no such country in the world that carries out foreign trade activity and doesn’t try toexpand it. At the same time, there’s no such country that doesn’t make efforts to protect itsdomestic market. Protectionism and free trade, therefore, manifest itself to a greater or lesserdegree in all countries. For this reason discussions shouldn’t be focused on which of theseapproaches is “good” and which is “bad”. The major issue is to determine which approach is themost optimal for a certain country. In other words, country’s foreign trade should be “free”(free trade) to the extent necessary to keep its domestic market safe (protectionism).Researchers, who attack protectionism, believe that export of cheaper foreign products ofhigher quality to the country’s domestic market is nothing else but protection of domesticcustomers’ rights. The constitutions of most countries recognize the right of buying a qualityproduct on the market as a basic law. Then why the consumers’ right is being violated bycreating additional privileges for local goods? For example, the import of toys is restricted insome countries, where toys are manufactured. However, all families have a right to buy morebeautiful and interesting toys for their children. So why should these families and their childrenbe divested of that right? Such restrictions to different consumer goods were used extensivelyin the territory of the former USSR. Such restrictions shaped a “black market” and promotedexpanding the illegal economy in the country.
However, there are entirely different cases. For example, the import of cheap and low-qualityoils even of unknown origin with a low purchasing power, and by the means of advertising theproduct becomes more available to population. To buy or not to buy this product – this isconsumer’s right. However, not all consumers can be classified as highly skilled “experts” ofgoods. It means that government should control imports of goods in order to take care of itscitizens’ health. Such control can impose restrictions on the import of substandard goods to thedomestic market. Thus, “protectionism” and “free trade” cannot be considered two viewscompletely contradicting each another. As a matter of fact, there is a different, high or lowdegree of protectionism.Thus, the key issue for the economy of any country is not “the need for restriction” of state’sforeign trade, but “the degree of necessary restrictions”. For every country it is necessary tofind optimum between liberalization and dirigisme on foreign trade. This optimum is notuniversal for any country and depends on many economic or non-economic factors, includingmentality of the society and democratization. Restriction of any aspect, including foreign tradeactivity, to a greater or lesser degree is government intervention in the economy. The level ofgovernment intervention in the economy is measurable and can be evaluated with differentindicators. So to develop any methodology for measuring balance between liberalization offoreign trade rejims and dirigisme is necessary to stimulate sustainable economic growth.Liberalization issues of foreign trade as researching object has been investigating for a longtime. But until now there is not clear methodology to find optimum for liberalization of foreigntrade regime to maintain sustainable development and economic security. Some countrieswhich as usual agitate liberal foreign trade rejimes, e.g. USA and UK and etc. sometimes putvery strong restrictions in foreign trade. It means liberalization is not unique methods fordevelopment. To find balance between liberalization of foreign trade and protectionism is sameto find balance between domestic market interest and integration to world economy. Sostrengthening of liberalization of foreign trade connected with government intervention in thisarea of economy.The relationship problems between food security and liberalization of economy isvestigated bymany researches. Essential sense of ajastment programs that supported by World Bank andIMF to decrease poverty in developing countries is liberalization of economy in generaly andforeign trade in particulaly (Gera, Nina, 2004). Relationship between food security andliberalization of foreign trade investigated by R. Isgenderov and etc. (Iskenderov, Gulaliyev,Nasirova, 2015) According to the their findings the foreign trade liberalization level andeconomic growth play special role for ensuring food security. As well as there is no need tochoose the agrarian sector as a strategic priority for ensuring food security if the country has nocompetitive advantage in this sector in the globalization condition.As well as the investigation by Tweeten (1999), and Dorosh (2001) show that economic growthand trade liberalization are important means for attaining food security.Some researches, e.g. Jenkins and Scanlan (2001) argue that trade liberalization doesn’tdecrease domestic food security, on the contrary trade liberalization increase food supply. Someresearchers, e.g. argue that foreign trade liberalization can increase imports and this can createdangerous situation for domestic agricultural production (Friedmann, 1982).By the analyzing ofmany papers that argue about negative or positive impacts of foreign trade liberalization oneconomic development and food security we can conclude that essential problems connectedwith difficulties to find optimum of the foreign trade liberalization level. When liberalizationpresses is going towards optimum, and then such programs stimulate economic growth. On thecontrary, when liberalization prosess is going far from optimum and then such programs ispreventing economic growth and food security. So the essential question for every country is tofind optimum for liberalization of foreign trade. But it is necessary to take into account that theoptimum level for foreign trade liberalization connected with country’s economic situation anddifferent non-economic characteristics, e.g. ethnical and social mentality.Thus government intervention to economy should take into account countries specification for

the foreign trade liberalization optimum. Some authors, e.g. Edwards (1993), Balassa B.(1965),W. Max Corden (1966) call this “optimum” as effective rate of protection. They try tomeasure this rate as ratio of difference between domestic value added and world value addedon any industry to world value added on this industry.Effective rate of protection methodology is esed by Little, I., etc. (1970) as well as with BalassaB. (1971), for assessment of foreign trade liberalization on the some developing countries’economies. But these studies don’t take into account many aspects of foreign tradeliberalization issues.“Government intervention in the economy” and “economic freedom” are contradictory terms,but in fact there are only acts, rules, regulations and other restrictive or prohibitive limits of thelaw, which realize “government intervention in the economy”. Full or partial absence of suchlimits creates “economic freedom”.It is, therefore, possible to evaluate “economic freedom” in each country by measuringeconomic indicators relating to restrictive or prohibitive limits.Different international organizations, research and development centres conduct suchevaluations. For example, the Fraser Institute, The Heritage Foundation, World Bank, WorldEconomic Forum and other organizations carry out comparative evaluation regardinggovernment intervention in the economy. The Heritage Foundation relates “economic freedom”with 4 main aspects, which can be under government control to a greater or lesser degree andinfluence the economic environment: a) supremacy of law; b) government size; c) regulationeffectiveness; d) degree of market openness.“Doing business” rankings prepared by World Bank is a comparative evaluation, they cover 11aspects: starting a business, dealing with construction permits, getting electricity, registeringproperty, getting credit, protecting minority investors, paying taxes, trading across borders,enforcing contracts, resolving insolvencies, regulation of labour market.Index of leftness (rightness) of economy (Muzaffarli, 2014) developed by the Institute ofEconomics of the Azerbaijan National Academy of Sciences is one of such evaluation methods.The procedure is based on the fundamental principle, i.e. the line of economic activity in eachcountry depends heavily on the legislation of that country. Changes in legal acts more or lessinfluence economic development. Any act is of restrictive and regulatory nature. For this reasonthe degree of restriction and regulation as well as coverage fields of such intervention is a mainfeature that differentiates acts. The same is true for foreign trade, since economical-politic toolsused in foreign trade activity, for example, import taxes and duties, import and export quota,administrative restrictions, direct grants, export incentives are indicators of governmentintervention in foreign trade activity. Based on the main principle of Index of leftness(rightness) of economy (IL(R)E), a decrease in such intervention is attributed to adoption of“right” laws, and an increase – with “left” laws. Reducing or increasing the degree ofintervention, in other words, adopting laws using “rightism” or “leftism” approaches doesn’tproduce the same effect in all countries. It means that adopting laws using “rightism” approachcan lead to economic growth in some countries, while in other countries it can be achievedthrough adoption of laws using “leftism” approaches.Hypothesis:• The main hypothesis is that reducing government intervention in the area of foreign trade isnecessary, but insufficient for economic growth. In other words, reducing governmentintervention in the area of foreign trade doesn’t always lead to economic development.• Another hypothesis is that government intervention in foreign trade is typical even fordeveloped countries, but such intervention is limited.• Freedom of foreign trade for developing countries doesn’t always lead to economicdevelopment.
2. MethodsAccording to the methodology the modelcreated forms of state intervention are main criteria todistinguish different economic systems (models of market economy) and bipolar, e.g. bothobjectives pursued by the regulation of foreign trade that, in fact, mutually exclude one another– the freedom of imports and domestic market protection – have a right to exist. As well as themodelcreated forms of state intervention are subjects for political competition, i.e. for the left-wing political groups (parties, organizations, think tanks) a higher priority is, as a rule, theinternal market protection, while for the right-wing groups – the freedom of foreign trade.According to the methodology the leftness or rightness of economy is measurable and can beassessed by the Index. There is not any overall (universal for all economies) optimal value ofIL(R)E. Moreover, optimum point of Index for a single country also changes over time under theinfluence of a variety of economic and non-economic factors. Nevertheless, the cumulativeeconomic growth for several years in any particular country provides a certain ground to definehow close the IL(R)E of that country is to its optimal level – the methodology called indicative.It can also be useful in evaluation of government regulation changes in separate sectors of theeconomy. If government introduces more liberal (or stricter) regulation in any sector of theeconomy, and as a result, the development pace of that sector becomes higher than that ofother sectors (or higher than overall economic growth rate), then policies are chosen properlyand reforms of same nature should be continued.N. Muzaffarli suggests comparative analysis through identification of public intervention ineconomy as rate of implementation of "leftist" or "rightist" ideas respectively. By "publicintervention in economy" Muzaffarli generally deems activities by "public institutions". Precisepublic institutions do not operate for their own sake but rather have to comply with enforcedlegislation. Hence, ideological persuasions by decision makers around precise economicchallenges resolution are specified in the core essence of the decisions made. For example, ifleftist parties constitute majority at the Parliament of any country, leftist ideas will underliedecision making process. And the other way round, rightist ideology will gain the upper hand indecisions made provided the legislation is adopted by the rightist majority. It happens thatleftist or rightist insight of decision makers shapes the economic system within a given time. Toput it more correctly, it is precisely politics that constrains or expands public intervention ineconomy.Leftness and Rightness are issues of political and economic system. The key aspect thatdistinguishes these two insights lies in different views around evaluation of essential andsatisfactory rate of public intervention in social life and, in particular, in economy: as comparedto the rightists, the leftists promote more extensive and strict intervention. Indeed, bearers ofleftist or rightist ideas contribute to emerging fundamentally new system of economic relationspursuant to their political and economic ideologies. For instance, the Bolshevik coup in Russiaprovoked drastic changes in real economic relations through private property ban, large-scaleexpropriation and collectivization policies.N. Muzaffarli discerns precise forms of public intervention in economy and groundsmeasurability of different forms of intervention. He asserts that a certain set of indicators willenable us to make rather valid conclusions on prevalence of Leftness or Rightness of economybased upon relevant analysis of the above-mentioned set and to provide grounded country-by-country comparison of public intervention rates. The suggested assessment should specifyconcrete political and ideological forms of public intervention in economy. Among them onemight mention the following: 1) public property and public property-based entrepreneurshippercentage; 2) redistribution of income through taxation; 3) social programs implementation;4) price regulation; 5) planning of economy; 6) foreign trade regulation; 7) arrangement offavorable conditions for business activities.Muzaffarli-proposed "index of leftness (rightness) of economy" only encompasses assessmentof intervention of the government in its capacity of regulatory institution in the fields of real

economy. As distinct from similar indices, the suggested indicator enables to evaluatecorrelation between the current economic system and actual political environment. On the otherhand, by keeping track of IL(R)E you can elicit development trends in political and economicoutlook in any given country. This method also provides opportunities for revelation of theoptimum rate of economic development-oriented public intervention.IL(R)E is an integral index that consists of several indexes, including foreign trade subindex. Inturn, foreign trade subindex is made up of three sub-subindices. The first relates to foreigntrade procedures. Favourable rules for carrying out foreign trade activity are vital for anexporter or an importer. World Bank uses three indicators to define favourable foreign tradeprocedures: a) amount of necessary documents for conducting export-import operations; b)time necessary for executing export-import operations; c) export-import operations executioncost. The sub-subindex named the ease of conducting export-import procedures index iscalculated as the simple average value of these three indicators. Certainly, such estimates aremade with some assumptions. For example, it’s assumed that cargo is dry, safe, notammunition, one of main export (import) goods of the country, weights 10 tons, costs $20 000,etc. Foreign trade activity is carried out by a local limited-liability company. That company hasno exclusive privileges and counts 60 employees. Such assumptions in the course of estimationmay cause some inaccuracies, however they allow comparatively evaluating the state’s foreigntrade procedures.The second sub-subindex of foreign trade subindex is the freedom of foreign trade index. Thefreedom of foreign trade index is calculated by the Fraser Institute. To measure this indexsupposedly different indicators are evaluated, including tariffs (relation of foreign trade taxes tooverall volume of foreign trade, average tariff rate, tariff rate deviation from average tariffrate), regulation barriers (non-tariff trade barriers, ease of imports and exports documentationexecution), exchange rate on the black market, free capital flow and population’s freedom ofaction (restriction to foreign property, capital supervision, freedom of the entry and leave offoreigners to a country).The third sub-subindex of foreign trade subindex is the participation in international trade oreconomic value of imports index. World Economic Forum calculates indicators of this sub-subindex using the methodology of The Global Enabling Trade Report once every two years.This index is calculated based on 4 sub-subindices weighting equal 25%: a) import tariffs andduties, taxes paid by exporters to enter the foreign market; b) quality of frontier and customsservices; c) infrastructure; d) working environment.The fourth sub-subindex of foreign trade subindex is the freedom of trade index, which iscalculated using the methodology developed by The Heritage Foundation. For this indexweighted average tariff rate for a country is calculated based on the tariff rate applied to thisproduct and the share of each imported product in the total imports and it is indexed with anopposite sign (i.e. not with trade restriction, but an indicator of free trade), and then “penalty”points (0, 5, 10, 15 or 20 points) in respect to non-tariff barriers are derived from this index.Thus, based on the methodology of international rating agencies, foreign trade subindex, whichis a part of IL(R)E, allows roughly assessing the impact of political struggle attributes (economiclaws, rules, standards) on the economy. This subindex as IL(R)E is designed to assess not allkinds of state intervention, but such an intervention that could create a model for a certainperiod. The use of such assessment makes it possible to determine and forecast the economicresults of fluctuations in any field of government’s economic policy and in the area of foreigntrade. Relations between the performance of foreign trade index and other macroeconomicindicators based on this methodology can, therefore, reflect positive or negative effect ofimplemented economic reforms.
3. Data, Analysis, and ResultsForeign trade subindices, sub-subindices and points by sub-subindices based on the

methodology of IL(R)E for 66 countries as of 2015 are shown in Table 1. GDP per capita in 66countries is also reflected there. It stands to reason that the table includes countries withdifferent geographic location, level of economic development, population and territory size, etc.Comparing states with different economic political geographic and other indicators providessome information what impact foreign trade conditions have on the economic development ofone or another country.Possible maximum and minimum limits of points for each index are taken into account whenmeasuring sub-subindices of IL(R)E foreign trade subindex. The following minimum andmaximum values are taken in the indexation research: freedom of trade sub-subindex (0;10),economic evaluation of import (0;10), free trade (0;100).
Table 1Relation between foreign trade subindex, its sub-subindices and GDP per capita for some states
Freedomof
foreigntrade(The
FraserInstitute,
2014)
Freedomof
foreigntradesub-
subindex
Economicvalue ofimport
(point)World
EconomicForum,2014)
Economicvalue ofimportsub-
subindex
Freedom oftrade
(point) TheHeritage
Foundation,2015)
Freedomof trade
sub-subindex
Foreigntrade
subindex
GDP($/percapita)
United States 7,7 0,77 5,3 0,72 87 0,87 0,21 54629,5
Albania 7 0,7 5,9 0,82 87,8 0,878 0,20 4564,4
Germany 7,8 0,78 4,9 0,65 88 0,88 0,23 47773,9
Australia 7,7 0,77 5,6 0,77 86,4 0,864 0,20 61979,9
Austria 7,8 0,78 4,9 0,65 88 0,88 0,23 51122,4
Azerbaijan 6,8 0,68 4,3 0,55 76 0,76 0,34 7886,5
United ArabEmirates
8,2 0,82 4,9 0,65 82,4 0,824 0,23 43962,7
Bulgaria 7,6 0,76 4,9 0,65 88 0,88 0,24 7851,3
Bosnia-Herzegovina
7,3 0,73 5,3 0,72 87,2 0,872 0,23 4851,7
Great Britain 8,6 0,86 4,9 0,65 88 0,88 0,20 46297
Brazil 7,1 0,71 4 0,5 69,6 0,696 0,36 11726,8
Republic ofSouth Africa
7,2 0,72 5 0,67 76,6 0,766 0,28 6483,9
Czech

Republic 7,9 0,79 4,9 0,65 88 0,88 0,23 19502,4
China 6,7 0,67 4,2 0,53 71,8 0,718 0,36 7590
Denmark 8,2 0,82 4,9 0,65 88 0,88 0,22 60718,4
Armenia 7,3 0,73 5,8 0,8 85,4 0,854 0,21 3873,5
Estonia 8,3 0,83 4,9 0,65 88 0,88 0,21 20147,8
Finland 8,4 0,84 4,9 0,65 88 0,88 0,21 49842,7
France 8 0,8 4,9 0,65 83 0,83 0,24 42725,7
Georgia 8,5 0,85 6 0,83 88,6 0,886 0,14 4435,2
India 6,2 0,62 2,9 0,32 64,6 0,646 0,47 1581,5
Indonesia 6,8 0,68 5,4 0,73 74,8 0,748 0,28 3491,9
Iran 2,6 0,26 2,4 0,23 41,4 0,414 0,70 5442,9
Ireland 8,7 0,87 4,9 0,65 88 0,88 0,20 54339,3
Spain 7,7 0,77 4,9 0,65 88 0,88 0,23 29721,6
Israel 7,9 0,79 5,3 0,72 88,6 0,886 0,20 37206,2
Sweden 7,9 0,79 4,9 0,65 88 0,88 0,23 58898,9
Switzerland 7,2 0,72 4,6 0,6 90 0,9 0,26 85616,6
Italy 7,6 0,76 4,9 0,65 88 0,88 0,24 35222,8
Canada 7,7 0,77 5,7 0,78 88,4 0,884 0,19 50230,8
Cyprus 7,7 0,77 4,9 0,65 88 0,88 0,23 27194,4
Latvia 8,1 0,81 4,9 0,65 88 0,88 0,22 15692,2
Lithuania 7,6 0,76 4,9 0,65 88 0,88 0,24 16489,7
Luxembourg 8,1 0,81 4,9 0,65 88 0,88 0,22 116613
Hungary 7,7 0,77 4,9 0,65 88 0,88 0,23 14026,6
Macedonia 7,7 0,77 5,5 0,75 86,2 0,862 0,21 5455,6

Malaysia 7,6 0,76 4,8 0,63 80 0,8 0,27 11307,1
Malta 8,1 0,81 4,9 0,65 88 0,88 0,22 22776,2
Mexico 7 0,7 5,2 0,7 85,6 0,856 0,25 10325,6
Egypt 6,2 0,62 3,3 0,38 70 0,7 0,43 3365,7
Moldova 6,8 0,68 5 0,67 79,8 0,798 0,28 2238,9
Montenegro 7,7 0,77 5,7 0,78 84,8 0,848 0,20 7378,3
Netherlands 8,5 0,85 4,9 0,65 88 0,88 0,21 52138,7
Norway 7,4 0,74 5 0,67 89,4 0,894 0,23 97299,6
Poland 7,4 0,74 4,9 0,65 88 0,88 0,24 14336,8
Portugal 7,9 0,79 4,9 0,65 88 0,88 0,23 22124,4
Kazakhstan 5,5 0,55 3,8 0,47 79 0,79 0,40 12601,6
Qatar 7,8 0,78 5,9 0,82 81,8 0,818 0,19 96732,4
Kirghizia 6,5 0,65 4,7 0,62 80,2 0,802 0,31 1268,9
Romania 7,8 0,78 4,9 0,65 88 0,88 0,23 10000
Russia 6,1 0,61 3,3 0,38 75 0,75 0,42 12735,9
Source: calculated and compiled by the author
The relations between foreign trade subindex and GDP per capita are shown on Chart 1. It’sshown that countries with a high level of GDP implement more liberal foreign economic policy.Among 66 countries all countries with GDP per capita over $20 thousand have foreign tradesubindex below 0,26. It’s impossible to claim the opposite, since more liberal foreign tradeconditions of a country, for example, foreign trade subindex below 0,26 doesn’t guarantee theabsolute high level of GDP per capita. The above-stated hypothesis is, therefore, correct, i.e.reducing government intervention in foreign trade is necessary, but insufficient for economicgrowth. In other words, reducing government intervention in the area of foreign trade doesn’talways lead to economic development. One of the researched countries, Saudi Arabia, is anexception to the hypothesis. However, it should be noted that oil exports play a leading part inits GDP per capita, and the relation between foreign trade conditions and GDP reflects the levelof country’s economic liberality inadequately. Among the researched countries Iran has thegreatest foreign trade subindex, i.e. it’s the most “left” country, and Singapore, the most “right”country, has the lowest.
Chart 1Relation between foreign trade subindex and GDP level per capita (2015)

All L(R)IE components, including foreign trade subindex and its sub-subindices, are dynamicindices. The dynamism of these indicators depends on the government intervention dynamics.Any measures adopted by the government with regard to different branches of economy,particularly, foreign trade, such as tariff shift, increasing or decreasing non-tariff barriers,reforms in customs policy, etc. are reflected in the values of foreign trade subindex and its sub-subindices. Such reforms usually play a “model-forming” part in the country’s economy. Thesereforms, depending on its nature, either direct the country’s foreign trade activity towardsliberalization (“to the right”) or protectionism (“to the left”). As we have already mentioned, thetrend of the country’s foreign trade activity “to the right” is necessary, but insufficient foreconomic growth, since the country’s economic development depends not only on foreign trade.The direction “to the right” in the foreign trade of developing countries, therefore, createspotential conditions for its future development.
Table 2Foreign trade subindex performance in Azerbaijan
Freedom oftrade (point)The HeritageFoundation,
2015)
Index
Freedom offoreigntrade
(point) TheFraser
Institute,2014) The
FraserInstitute,
2014)
Index
Economicvalue ofimport
(point)
IndexSubindex offoreign trade
2000 55 0,45 5,92 0,408 4,3 0,45 0,436
2001 66,8 0,332 5,92 0,408 4,3 0,45 0,397
2002 74,4 0,256 5,92 0,408 4,3 0,45 0,371
2003 71,6 0,284 5,92 0,408 4,3 0,45 0,381
2004 69,2 0,308 5,92 0,408 4,3 0,45 0,389

2005 69,2 0,308 5,92 0,408 4,3 0,45 0,389
2006 72,6 0,274 5,92 0,408 4,3 0,45 0,377
2007 77,6 0,224 5,92 0,408 4,3 0,45 0,361
2008 78,4 0,216 5,92 0,408 4,3 0,45 0,358
2009 78,4 0,216 5,92 0,408 4,3 0,45 0,358
2010 77,1 0,229 6,48 0,352 4,3 0,45 0,344
2011 77,1 0,229 6,54 0,346 4,3 0,45 0,342
2012 77,2 0,228 6,79 0,321 4,3 0,45 0,333
2013 77,2 0,228 6,79 0,321 4,3 0,45 0,333
2014 77,2 0,228 6,79 0,321 4,3 0,45 0,333
2015 76 0,24 6,79 0,321 4,3 0,45 0,337
2016 75,8 0,242 6,79 0,321 4,3 0,45 0,338
Source: calculated and compiled by the author
The performance of foreign trade subindex and its sub-subindices in Azerbaijan over the last 15years is presented in Table 2. As it seen from the table, indicators of foreign trade subindex andall its sub-subindices represent a steady downward trend. In other words, foreign tradeconditions in Azerbaijan over the last 15 years have had a trend “to the right”. This trend canbe observed on Chart 2. The conditions of foreign trade of Azerbaijan in 2000-2003 wererapidly liberalized. Although the process of liberalization slightly slowed down in the followingyears, it was stable in 2005-2012. As it seen from the chart, since 2013, especially followingdevaluation in 2015, protectionist trends in the foreign trade of Azerbaijan have intensified. Andit makes sense, since countries all over the world practice taking “leftism” decisions, when theyface economic problems. Nonetheless, the need for protecting the domestic market called foradoption of protectionist decisions over the last year due to national currency devaluation inAzerbaijan, however that decisions weren’t sweeping, and “rightism” in foreign trade persists.
Chart 2Foreign trade subindex
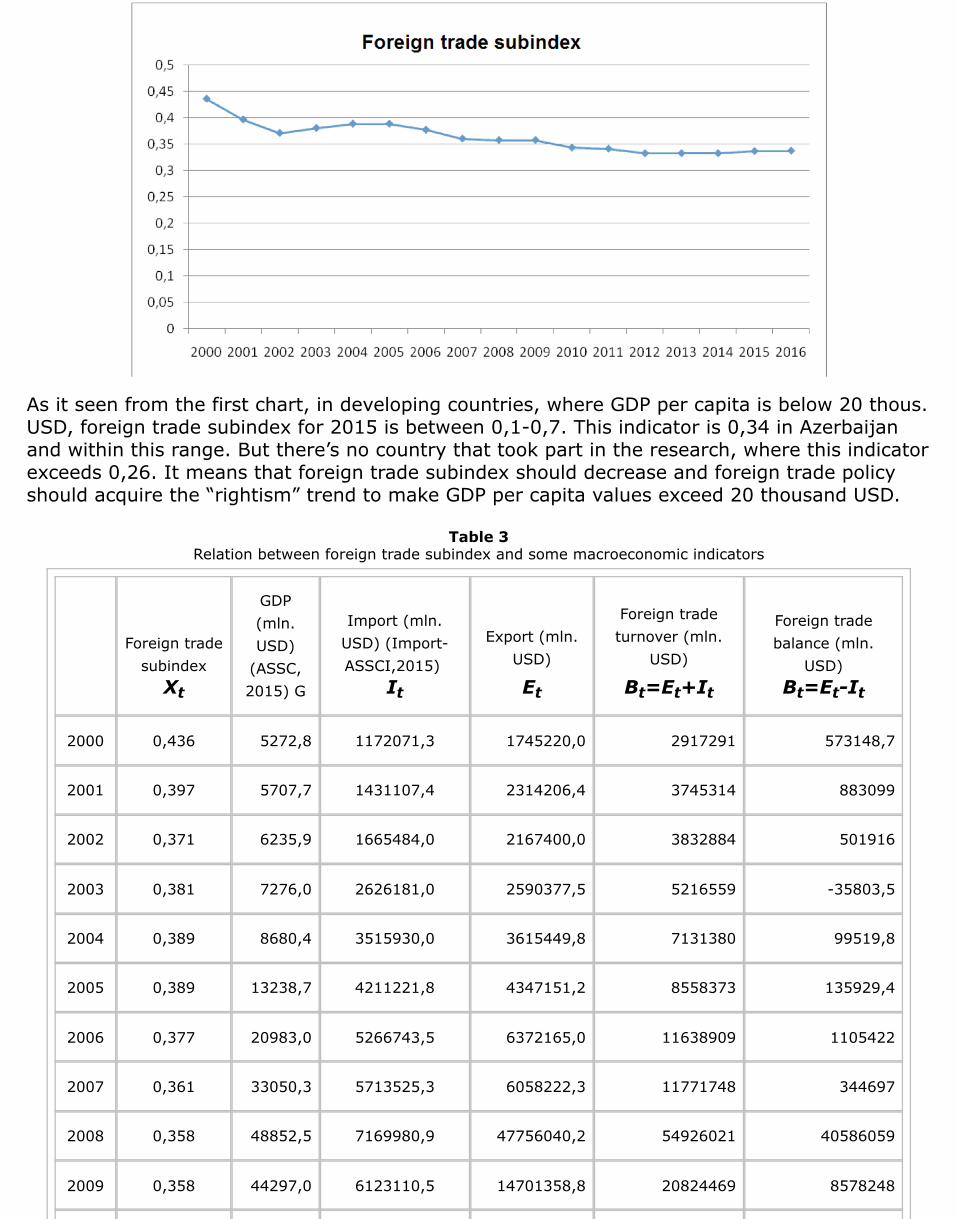
As it seen from the first chart, in developing countries, where GDP per capita is below 20 thous.USD, foreign trade subindex for 2015 is between 0,1-0,7. This indicator is 0,34 in Azerbaijanand within this range. But there’s no country that took part in the research, where this indicatorexceeds 0,26. It means that foreign trade subindex should decrease and foreign trade policyshould acquire the “rightism” trend to make GDP per capita values exceed 20 thousand USD.
Table 3Relation between foreign trade subindex and some macroeconomic indicators
Foreign tradesubindexXt
GDP(mln.USD)
(ASSC,2015) G
Import (mln.USD) (Import-ASSCI,2015)
It
Export (mln.USD)
Et
Foreign tradeturnover (mln.
USD)
Bt=Et+It
Foreign tradebalance (mln.
USD)Bt=Et-It
2000 0,436 5272,8 1172071,3 1745220,0 2917291 573148,7
2001 0,397 5707,7 1431107,4 2314206,4 3745314 883099
2002 0,371 6235,9 1665484,0 2167400,0 3832884 501916
2003 0,381 7276,0 2626181,0 2590377,5 5216559 -35803,5
2004 0,389 8680,4 3515930,0 3615449,8 7131380 99519,8
2005 0,389 13238,7 4211221,8 4347151,2 8558373 135929,4
2006 0,377 20983,0 5266743,5 6372165,0 11638909 1105422
2007 0,361 33050,3 5713525,3 6058222,3 11771748 344697
2008 0,358 48852,5 7169980,9 47756040,2 54926021 40586059
2009 0,358 44297,0 6123110,5 14701358,8 20824469 8578248

2010 0,344 52909,3 6600611,6 21360210,2 27960822 14759599
2011 0,342 65951,6 9755968,7 26570898,3 36326867 16814930
2012 0,333 69683,9 9652870,6 23907983,7 33560854 14255113
2013 0,333 74164,4 10712502,5 23975416,8 34687919 13262914
2014 0,333 75234,7 9187697,6 21828608,9 31016307 12640911
2015 0,337 52969,5 9221402,8 11424477,3 20645880 2203075
2016 0,338 - - - - -
Note: The table is compiled based on authors’ calculations with the use of Azerbaijan National Committee of Statistics data.
4. DiscussionThe relation between foreign trade subindex performance and GDP volume, foreign tradeturnover and foreign balance over the last 15 years in Azerbaijan is shown in Table 3. As itshown in the table, GDP volume increases as foreign trade conditions improve. This fact provesonce again that despite foreign trade subindex is distributed in a wide range in developingcountries, their economic development depends on foreign trade liberalization and reduction ofgovernment interference in foreign trade activity.
Chart 3Interrelation between foreign trade subindex and GDP
Chart 4Statistics and tests for Interrelation between foreign trade subindex and GDP

As it seen from Chart 3 and Chart 4, there’s a strong correlation relationship between foreigntrade subindex and GDP of Azerbaijan (R = 0,8859). If we compare interrelation between GDPvolume and foreign trade subindex in the above-named 66 states and Azerbaijan, we canconclude that liberalization of foreign trade conditions is necessary to increase GDP volume inAzerbaijan. There’s, therefore, no reason to implement protectionism policy in the countrybecause of concerns related to national currency devaluation, and the process of liberalizationshould continue. There’s a probability that foreign trade liberalization will produce a negative,and protectionism policy – a positive effect, however one has to agree with the fact thatsustainable economic development requires a stable trend of “rightnessism” in foreign trade.We can compare these results with the results of Kwan and Cotsomitis (1991) on Chineseeconomic growth and foreign trade. According to their investigation there is positiverelationship between these variables. Tong (1995) also explored the relationship betweeneconomic growth and import. He recognized that import at different times contributed toeconomy differently, but on the whole, there was a positive correlation between import andeconomic growth. According to the results of Summers’ (1997) investigation, who analysed therelationship between external trade and growth in Australia and Canada, imports and exportsplay different roles in economic growth of Canada and Austrialia. Import plays a significant rolein Canada but no evidence was found to support the export-led growth in Australia. Aurangzeb(2006) examined the link between exports, productivity and economic growth in Pakistan.According to these his conclusion there is good relationship between these variables.
5. ConclusionsOur results on relationship between foreign trade liberalization and economic grouthcorresponds with results of many researchers, including Marie Daumal and Selin Özyurt Thereare many investigations that have results on positive relationship between foreign trade andGDP. Yaya Keho (2017), Feder (1983), Akeem (2011), Ezike et al. (2012), Ahmed et al.; (2008)and many other researchers concluded that there is positive relationship between tradeopenness and economic growth. By our investigation we have concluded, that:1. Rreducing government intervention in the area of foreign trade is necessary, but insufficientfor economic growth. In other words, reducing government intervention in the area of foreigntrade doesn’t always lead to economic development.2. There’s government intervention in foreign trade in developed countries, but suchintervention is limited.3. Freedom of foreign trade in developing countries doesn’t always lead to economicdevelopment.

4. Over the last 15 years foreign trade subindex in Azerbaijan has represented a steadydownward trend.5. There’s no reason to take protectionist measures because of concerns related to devaluationof the national currency of Azerbaijan.
ReferencesAhmed, A.D., Cheng, E., Messinis, G. (2008). The Role of Exports, FDI and Imports inDevelopment: New Evidence from Sub-Saharan African Countries. Melbourne: Center forStrategic Economic Studies, Victoria University. Working Paper No. 39.Akeem, U.O. (2011). Performance Evaluation of Foreign Trade and Economic Growth in Nigeria.Research Journal of Finance and Accounting, vol. 2, n. 2.Aurangzeb, A. (2006). Export, Productivity and Economic Growth in Pakistan: A Time SeriesAnalysis. The Lahore Journal of Economics, vol. 11, n. 1, pp. 1 – 18.Azerbaijan State Statistical Commitee- Export-ASSCE. (2015). Retrieved from:http://www.azstat.org/MESearch/details?lang=az&type=2&id=277&departament=4Azerbaijan State Statistical Committee - Import-ASSCI. (2015). Retrieved from:http://www.azstat.org/MESearch/details?lang=az&type=2&id=276&departament=4Azerbaijan State Statistical Commitee-ASSC. (2015). Retrieved from:http://www.stat.gov.az/source/system_nat_accounts/Balassa, B. (1965). Tariff protection in industrialized countries: An evaluation. Journal ofpolitical economics, n.76, pp. 573-94.Balassa, B. (1971). The structure of protection in developing countries. Baltimore: JohonsHopkins University press.Corden, W.M. (1966). The structure of tariff system and the effective protection rate. Journal ofpolitical economics, no. 74, pp. 221-37.Daumal, M., Özyurt, S. (2011). The Impact of International Trade Flows on Economic Growth inBrazilian States. Review of Economics and Institutions, vol. 2, n. 1, Article 1. Winter. Retrievedfrom: www.rei.unipg.it ISSN 2038-1379 DOI 10.5202/rei.v2i1.5Dorosh, P.A. (2001). Trade Liberalization and National Food Security: Rice Trade betweenBangladesh and India. World Development, vol. 29, n. 4, pp. 673-689.Edwards, S. (1993). Openness, Trade Liberalisation and Growth in Developing Countries.Journal of Economic Literature, vol. 31, n. 3, pp. 1358–1393.Ezike, J.E., Ikpesu, F., Amah, P. (2012). Macroeconomic Impact of Trade on Nigerian Growth: AnEmpirical Evaluation. Research Journal of Business Management and Accounting, vol. 1, n. 4,pp. 079 - 083.Feder, G. (1982). On Export and Economic Growth. Journal of Development Economics, 12, pp.59 – 73.Friedmann, H. (1982). The political economy of food: the rise and fall of the postwarinternational food order. American Journal of Sociology, vol. 88, pp. S248–S286.Gera, N. (2004). Food Security under Structural Adjustment in Pakistan. Asian Survey, vol. 44,n. 3, pp. 353-368.Iskenderov, R., Gulaliyev, M., Nasirova, O. (2015), Assessment of major factors of food security.Russian Journal of Agricultural and Socio-Economic Sciences, vol. 10, n. 58, (October 2016),pp. 128-138.Jenkins, J. Craig and SCANLAN, Stephen J. (2001). Food Security in Less Developed Countries,1970 to 1990. American Sociological Review, vol. 66, n. 5, pp. 718-744.Keho, Y. (2017). The impact of trade openness on economic growth: The case of Cote d’Ivoire.
Cogent Economics & Finance, vol. 5, pp. 1332820. Retrieved from:https://doi.org/10.1080/23322039.2017.1332820Kwan, A.C.C., Kwok, J.A. (1996). Economic Growth and Exogeneity: Taiwan 1953-88. TheAmerican Economist, vol. 28, n. 4, pp. 467-471(5).Little, I., Scitovsky, T., Scott, M. (1970). Industry and Trade in Some Developing Countries.London and New York: Oxford University Press for OECD.Summers, P.M. (1997). Trade and Growth in Settler Economies: Australian and CanadianComparisons. Melbourne: Melbourne Institute Working Paper 9/97/.The Fraser Institute. (2014). Retrieved from: http://www.freetheworld.com/2014/EFW2014-POST.pdfThe Heritage Foundation. (2015). Retrieved from: http://www.heritage.org/index/explore?view=by-region-country-yearThe Heritage Foundation. (2015). Retrieved from:http://www.heritage.org/index/pdf/2015/book/index_2015.pdfTong, J. (1995). Growth and Causality in China. Journal of Development Economics, vol. 18, pp.1 – 12.Tweeten, L. (1999). The Economics of Global Food Security. Review of Agricultural Economics,vol. 21, n. 2, pp. 473-488.World Economic Forum. (2014). Retrieved from:http://www3.weforum.org/docs/WEF_GlobalEnablingTrade_Report_2014.pdf
1. Ph.D. Head of Department of Methodology and Econometric Issues of State Regulation of Economy. Institute ofEconomics of the Azerbaijan National Academy of Sciences. Baku, Azerbaijan. [email protected]. Ph.D. Candidate of Department of Globalization and Foreign Economic Relations. Institute of Economics of theAzerbaijan National Academy of Sciences. Baku, Azerbaijan. [email protected]. Ph.D. Docent of Department of Theoretical and Applied Economics. Azerbaijan State University of Economics (UNEC).Baku, Azerbaijan. [email protected]. Ph.D. Candidate. Azerbaijan State University of Economics (UNEC). Baku, Azerbaijan. [email protected]. Ph.D. Candidate of Department of Globalization and Foreign Economic Relations. Institute of Economics of theAzerbaijan National Academy of Sciences. Baku, Azerbaijan. [email protected]
Revista ESPACIOS. ISSN 0798 1015Vol. 38 (Nº 47) Year 2017
Indexed em Scopus, Google Schollar
[Index]
[In case you find any errors on this site, please send e-mail to webmaster]
©2017. revistaESPACIOS.com • ®Rights Reserved