Embed Size (px)
Citation preview
Vol 129 | No 1428 | 8 January 2016Journal of the New Zealand Medical Association
Changing causes of heart valve disease mortality in New Zealand from 1988 to 2007
Management of non ST-elevation acute coronary syndrome patients in New Zealand: a longitudinal analysis
Nurse-led school-based clinics for rheumatic fever prevention and skin infection management
Early outcome of patients undergoing transcatheter aortic valve implantation (TAVI)
Echocardiography service provision in New Zealand

NZMJ 8 January 2016, Vol 129 No 1428ISSN 1175-8716 © NZMA
www.nzma.org.nz/journal2
NZMA ChairmanDr Stephen Child
NZMJ EditorProfessor Frank Frizelle
NZMA Communications ManagerSharon Cuzens
NZMJ ProductionJeremiah Boniface
To contribute to the NZMJ, first read: www.nzma.org.nz/journal/contribute
Other enquiries to:NZMAPO Box 156The TerraceWellington 6140Phone: (04) 472 4741
© NZMA 2016
Subscription to the New Zealand Medical Journal is free and automatic to NZMA members.Private subscription is available to institutions, to people who are not medical practitioners,
and to medical practitioners who live outside New Zealand. Subscription rates are below.All access to the NZMJ is by login and password, but IP access is available to some subscribers.
Read our Conditions of access for subscribers for further information www.nzma.org.nz/journal/subscribe/conditions-of-access
If you are a member or a subscriber and have not yet received your login and password, or wish to receive email alerts, please email: [email protected]
The NZMA also publishes the NZMJ Digest. This online magazine is sent out to members and subscribers 10 times a year and contains selected material from the NZMJ, along with all
obituaries, summaries of all articles, and other NZMA and health sector news and information.
Subscription rates for 2016New Zealand subscription rates Overseas subscription ratesIndividuals* $298 Individual $415Individual article $25 Institutions $557 Individual article $25
*NZ individual subscribers must not be doctors (access is via NZMA Membership)New Zealand rates include GST. No GST is included in international rates.
Note, subscription for part of a year is available at pro rata rates. Please email [email protected] for more information.
Individual articles are available for purchase by emailing [email protected]
Publication Informationpublished by the New Zealand Medical Association
To subscribe to the NZMJ, [email protected]

3 NZMJ 8 January 2016, Vol 129 No 1428ISSN 1175-8716 © NZMA
www.nzma.org.nz/journal
CONTENTS
EDITORIAL
7Early angiography and revascularisation for
acute coronary syndromes in New ZealandMark Webster
ARTICLES
10Management of non ST-elevation
acute coronary syndrome patients in New Zealand: a
longitudinal analysis. Results from the New Zealand Acute Coronary Syndrome national audits of 2002, 2007 and 2012
Gerry Devlin, Michael Williams, John Elliott, Harvey White, John French,
Greg Gamble, Philip Matsis, Richard Troughton, Mark Richards, Chris Ellis
17Echocardiography service provision in New Zealand:
The implications of capacity modelling for the cardiac sonographer workforce
Belinda Buckley, Mark J Farnworth, Gillian Whalley
26Cardiopulmonary resuscitation knowledge and opinions on end of life decision making of older
adults admitted to an acute medical service
Rupali Sharma, Sisira Jayathissa, Mark Weatherall
37Nurse-led school-based clinics for rheumatic fever prevention
and skin infection management: evaluation of Mana Kidz programme in Counties
ManukauPhilippa Anderson, Julian King,
Michelle Moss, Phil Light, Tracy McKee, Elizabeth Farrell, Joanna Stewart,
Diana Lennon
47Early outcome of patients
undergoing transcatheter aortic valve implantation (TAVI):
The Auckland City Hospital experience 2011–2015
S Y Sylvia Wu, Tom Kai Ming Wang, Parma Nand, Tharumenthiran Ramanathan, Mark Webster,
Jim Stewart
56Changing causes of heart valve
disease mortality in New Zealand from 1988 to 2007
Sean Coffey, Brian Cox, Michael JA Williams
66National variation in coronary angiography rates and timing
after an acute coronary syndrome in New Zealand
(ANZACS-QI 6)Michael J A Williams, Scott A Harding,
Gerard Devlin, Chris Nunn, Seif El-Jack, Tony Scott, Mildred Lee, Andrew
J Kerr on behalf of the ANZACS-QI investigators

DRAFT
4 NZMJ 8 January 2016, Vol 129 No 1428ISSN 1175-8716 © NZMA
www.nzma.org.nz/journal
CONTENTS
CLINICAL CORRESPONDENCE
79Guillain-Barré Syndrome
presenting as facial diplegiaRajnish Singh, Ulka Kamble, Brijesh Sharma, Palden w Bhutia, Saurabh
Shishir, Antony Wilson
LETTERS
82Association between reported levels of physical activity and depressive
symptoms: data from a population-based survey of New Zealand young
peopleSarah Hudson, Joanna White, Karen
McBride-Henry
85Lessons in courage from the past:
lest we forgetFrank Houghton
87Responses towards additional
tobacco control measures: data from a population-based survey of
New Zealand adultsJudy Li, Rhiannon Newcombe, Darren
Walton
93Is the NZ Government responding
adequately to the Māori Affairs Select Committee’s 2010
recommendations on tobacco control? A brief review
Jude Ball, Richard Edwards, Andrew Waa, Shane Kawenata Bradbrook, Heather
Gifford, Chris Cunningham, Janet Hoek, Tony Blakely, Nick Wilson, George
Thomson, Sue Taylor
METHUSELAH
98100 YEARS AGO
99Foreign bodies and X-rays
5 NZMJ 8 January 2016, Vol 129 No 1428ISSN 1175-8716 © NZMA
www.nzma.org.nz/journal
SUMMARIES
Management of non ST-elevation acute coronary syndrome patients in New Zealand: a longitudinal analysis.
Results from the New Zealand Acute Coronary Syndrome national audits of 2002, 2007 and 2012
Gerry Devlin, Michael Williams, John Elliott, Harvey White, John French, Greg Gamble, Philip Matsis, Richard Troughton, Mark Richards, Chris Ellis
This study looked at care of heart attacks over a 10-year period in New Zealand and shows that whilst care has gotten better considerable room remains for further improvements. This includes identifying high risk patients early and transferring them to hospitals for coronary angiography (“dye test”). It is also hoped that ministry of health initiatives such as ANZACSQI, a registry of all heart attack admissions in New Zealand will help us with further quality improvement.
Cardiopulmonary resuscitation knowledge and opinions on end of life decision making of older adults admitted to an
acute medical serviceRupali Sharma, Sisira Jayathissa, Mark Weatherall
This paper looks at patients understanding of cardio pulmonary resuscitation. Authors studied 100 adults who had a medical illness requiring hospitalisation and waiting to be discharged. Patients had high expectations about success of resuscitation and they appear to be more knowledgeable than before. Patients are keen on having an open discussion on resuscitation and involvement of family in this discussion.
Echocardiography service provision in New Zealand: The implications of capacity modelling for the cardiac
sonographer workforce Belinda Buckley, Mark J Farnworth, Gillian Whalley
There is regional disparity in the capacity of the cardiac sonographer workforce which appears strongly related to scan duration. The population-based workforce size in New Zealand is 43-60% smaller than in the United Kingdom (based on need). Workforce capacity modelling should be used with need and demand modelling to plan adequate levels of service provision.
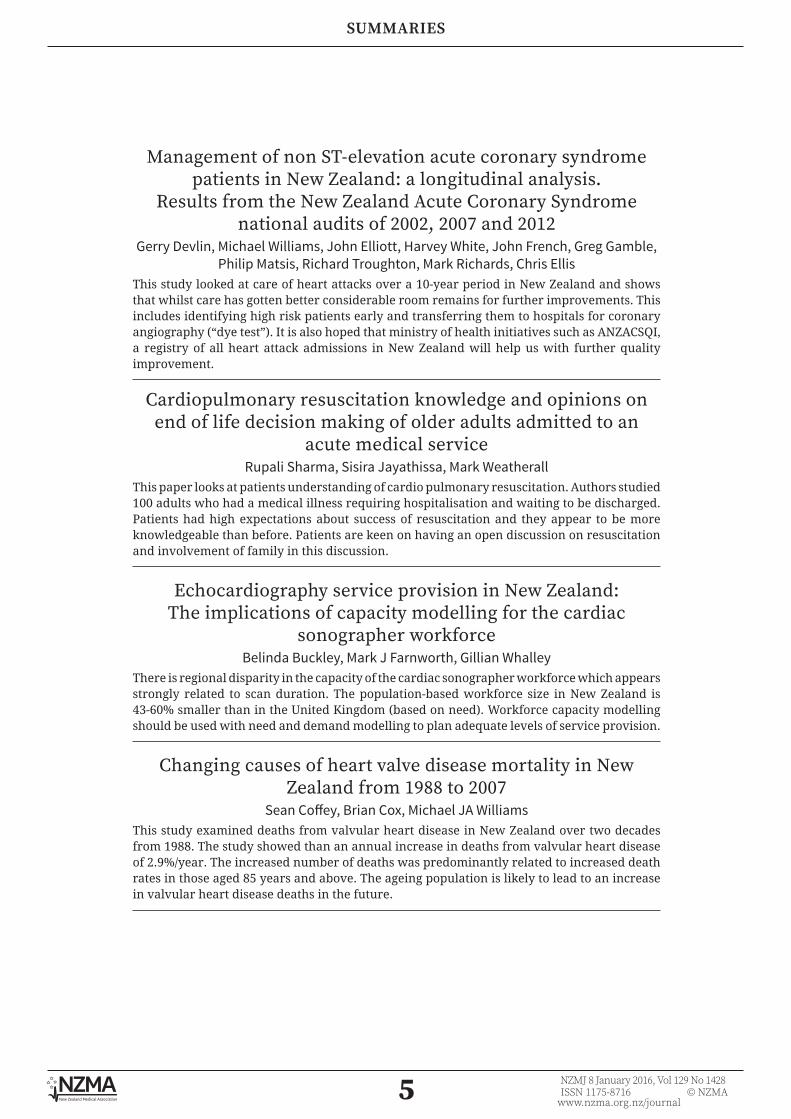
Changing causes of heart valve disease mortality in New Zealand from 1988 to 2007
Sean Coffey, Brian Cox, Michael JA WilliamsThis study examined deaths from valvular heart disease in New Zealand over two decades from 1988. The study showed than an annual increase in deaths from valvular heart disease of 2.9%/year. The increased number of deaths was predominantly related to increased death rates in those aged 85 years and above. The ageing population is likely to lead to an increase in valvular heart disease deaths in the future.

6 NZMJ 8 January 2016, Vol 129 No 1428ISSN 1175-8716 © NZMA
www.nzma.org.nz/journal
SUMMARIES
National variation in coronary angiography rates and timing after an acute coronary syndrome in New Zealand
(ANZACS-QI 6)Michael J A Williams, Scott A Harding, Gerard Devlin, Chris Nunn, Seif El-Jack, Tony
Scott, Mildred Lee, Andrew J Kerr on behalf of the ANZACS-QI investigatorsPersons admitted to hospital with suspected heart attack are recommended to have imaging of their heart arteries within 3 days of hospital admission. This study included all patients admitted with suspected heart attack to New Zealand hospitals over a one year period. There was a two fold variation in the rates of imaging the heart arteries across New Zealand Hospitals. Patients admitted to hospitals with on site heart artery stenting services had higher rates of heart artery imaging tests and shorter hospital stay compared to those admitted to hospitals without these facilities. New policies to correct this difference are proposed.
Nurse-led school-based clinics for rheumatic fever prevention and skin infection management: Evaluation of Mana Kidz
programme in Counties ManukauPhilippa Anderson, Julian King, Michelle Moss, Phil Light, Tracy McKee, Elizabeth
Farrell, Joanna Stewart, Diana LennonMana Kidz is an important and effective school-based health programme that is making a substantial contribution to healthcare for more than 24,000 children across 61 schools in South Auckland. The service includes identification and treatment of sore throats to prevent rheumatic fever, identification and management of skin infections, identification of other health needs such as hearing, vision or child protection concerns. An evaluation was under-taken that demonstrated that the service a) increased health literacy, b) reduced prevalence of Group A Streptococcus and severe skin infections, c) likely to have significantly reduced hospitalisations for acute rheumatic fever, d) increased children and whānau engagement with health services, and e) has a workforce that is culturally competent with positive, trusting relationships with children, families and schools. The evaluators concluded that Mana Kidz makes a significant difference to children’s health and that it is an important and effective programme that is making a substantial contribution to healthcare for vulnerable children
Early outcome of patients undergoing transcatheter aortic valve implantation (TAVI): The Auckland City Hospital
experience 2011–2015S Y Sylvia Wu, Tom Kai Ming Wang, Parma Nand, Tharumenthiran Ramanathan, Mark
Webster, Jim StewartTranscatheter aortic valve implantation (TAVI) is an alternative to traditional surgical aortic valve replacement (AVR). It is particularly suited to elderly patients who are at higher than average risk of open heart surgery, resulting in excellent relief of symptoms and shortened hospital stay compared to AVR, with a low risk of serious complications. Early data suggest that TAVI may be more cost-effective than AVR in high risk, elderly patients.

7 NZMJ 8 January 2016, Vol 129 No 1428ISSN 1175-8716 © NZMA
www.nzma.org.nz/journal
EDITORIAL
Early angiography and revascularisation for
acute coronary syndromes in New Zealand
Mark Webster
In the late 1990s, a series of randomised trials demonstrated that, in patients with troponin-positive
acute coronary syndromes (ACS), a strategy of early coronary angiography and revascularisation was associated with better clinical outcomes than an initial conservative approach. By 2002, international guidelines advocated—with a Class A recommendation—an invasive approach for most patients presenting with a non-ST elevation myocardial infarction.1 That year, Ellis et al undertook a 2 week ‘snapshot’ audit of what was happening in New Zealand.2 Coronary angiography was undertaken in 21% of 930 patients presenting with a suspected ACS. Of those subsequently diagnosed with non-ST elevation or ST elevation myocardial infarction, revascularisation was performed in only 11% and 17%, respectively. Few were prescribed dual antiplatelet therapy; while 82% were given aspirin, a mere 8% were also discharged on clopidogrel. Only 55% were given a statin. This audit clearly showed that, in many New Zealand hospitals, patients with an acute coronary syndrome were managed with a highly conservative approach.
In this issue of the Journal, Devlin and colleagues assessed whether the use of evidence-based treatments had improved over the next decade, comparing the 2002 data with subsequent audits from 2007 and 2012.3 The findings are largely reassuring. Angiography rates had increased from 21 to 46%. By 2012, revascularisation rates had also increased to 29%, and approxi-mately 75% of patients were given dual antiplatelet therapy. Although these audits usefully assess changes in practice over
time, they have limitations. Investigations and treatment undertaken after the initial hospitalisation were not included, and data collection relied on local investigators, with no mechanism for checking its accuracy.
In another paper in this issue, Williams et al looked further at whether differences in practice persist around New Zealand.4 Coronary angiography rates and time to angiography were compared by district health board, using data from the All New Zealand Acute Coronary Syndrome Quality Improvement (ANZACS-QI) registry. As might be expected, patients presenting to an intervention-capable hospital had a shorter time-to-angiography than in those without such facilities. Angiography rates were also 30% higher in angiogra-phy-capable units. While it is difficult to be certain regarding an optimal angiog-raphy rate, the percentage of patients with severe coronary disease suggests that New Zealand rates in general, and at non-inter-ventional centres in particular, may be too low. Approximately 24% of patients had left main or 3-vessel disease, which is a considerably higher proportion than that found in a recent North American study (7% of patients in New York, US and 13% in Ontario, Canada).5
There are likely multiple reasons for the up to two-fold difference in angiog-raphy rates between regions. In smaller provincial centres patients with ACS are cared for by general physicians rather than cardiologists. The need to transfer patients to another centre may act as a barrier to referral. Some lower-risk patients with suspected ACS may have CT rather than invasive angiography to initially evaluate their coronary anatomy.

8 NZMJ 8 January 2016, Vol 129 No 1428ISSN 1175-8716 © NZMA
www.nzma.org.nz/journal
EDITORIAL
Reducing time to angiography in non-STEMI patients is of greatest clinical benefit in those at highest risk, who may have an adverse clinical event and develop more extensive myonecrosis while awaiting angiography and revascularisation. All patients, including those at lower risk, benefit from avoiding hospital-acquired problems, such as intravenous line infec-tions. However, the major advantage to the health service is financial. The imple-mentation of a 3-day door-to-angiography target as a district health board key perfor-mance indicator (KPI) has reduced average time-to-angiography by approximately 1 day. Coronary care and monitored cardi-ology beds are expensive ($1000–2000 per day), so across 8,000 patients each year the savings to the health service are substantial.
ANZACS-QI is a rigorous, prospective and comprehensive database on all patients with ACS undergoing angiography. The initial momentum for its development came from Andrew Kerr at Middlemore Hospital, with support from clinical and university colleagues. However, it would not have succeeded without government enthusiasm and funding, which was forthcoming from the Minister and Ministry of Health. The 3-day target time for angiography in ACS patients was an excellent choice as a KPI: clinically relevant, achievable and with the potential to save money. This has proven to be the case.
ANZACS-QI is now providing a wealth of information about the management of coronary disease in New Zealand. Merging data from other sources, particularly the national mortality, hospital discharge diagnosis codes and pharmacy registries, creates a powerful tool for predicting longer-term outcomes. Examples of other recent studies from this database include an assessment of statin medication compliance 3 years after an acute coronary syndrome,6 the impact of patient ethnicity on rates of
angiography and revascularisation,7 and a comparison of radial versus femoral access for angiography.8 Although New Zealand radial access rates are amongst the highest in the world, there are considerable differ-ences between units. Outcomes were better with radial than femoral access, which is consistent with randomised trial data.9 While there are potential confounders—femoral access may have been used in higher-risk patients, and predominantly radial units and operators were mostly higher volume—real-world all-comers data are an important adjunct to that from a selected trial population.
The potential for ANZACS-QI extends well beyond short-term audit and quality control of local practice. Research can be under-taken by adding database fields for the duration of a study, and national registries used to collect relevant endpoints. This type of research was pioneered in Scandinavia, where a series of landmark trials have been undertaken at far lower cost than similar studies from the US or elsewhere in Europe. New Zealand is now well placed for such research; being small and somewhat isolated is, for once, to our advantage. Beyond the usual randomised trials with individual patient consent, there is also the potential to undertake systems research, comparing ‘routine’ practices applied to large groups of patients.
In summary, ANZACS-QI is an example of money well spent in a public health service looking to achieve both optimal clinical outcomes and efficient health service delivery. Without good data, it is easy to repeat the mistakes of the past. As Lord Kelvin said “to measure is to know”. It is vital that we evaluate our practice in an ongoing and rigorous manner, while keeping in mind another Lord Kelvin quote: “Xrays will prove to be a hoax”; it is also important to maintain a healthy scepticism regarding our currently-held beliefs.

DRAFT
9 NZMJ 8 January 2016, Vol 129 No 1428ISSN 1175-8716 © NZMA
www.nzma.org.nz/journal
Competing interests: NilAuthor information:
Mark Webster, Consultant Cardiologist, Director, Cardiac Catheterisation LaboratoriesAuckland City Hospital, Hon Associate Professor of Medicine, University of Auckland and
Green Lane Cardiovascular Service, Auckland City Hospital, Auckland, New Zealand.Corresponding author:
Mark Webster, Consultant Cardiologist, Director, Cardiac Catheterisation LaboratoriesAuckland City Hospital, Hon Associate Professor of Medicine, University of Auckland and
Green Lane Cardiovascular Service, Auckland City Hospital, Auckland, New [email protected]
URL:www.nzma.org.nz/journal/read-the-journal/all-issues/2010-2019/2016/vol-129-no-1428-8-
january-2016/6778
1. Braunwald E, Antman EA, Beasley JW et al. ACC/AHA guideline update for the management of patients with unstable angina and non-ST segment elevation myocardial infarction-2002: summary article: a report of the American College of Cardiology/American Heart Association Task Force on Practice Guidelines (Committee on the Management of Patients with Unstable Angina). Circu-lation2002;106:1893-1900
2. Ellis C, Gamble G, French J et al. Management of patients admitted with an acute coronary syndrome in New Zealand: results of a comprehensive nationwide audit. NZ Med J 2004; 117:1-14
3. Devlin G, Williams M, Elliott J et al. Management of non ST-elevation acute
coronary syndrome patients in New Zealand: a longitudinal analysis. Results from the New Zealand Acute Coronary Syndrome national audits of 2002, 2007 and 2012. NZ Med J 2016: 129;1428
4. Williams MJA, Harding SA, Devlin G et al. National variation in coronary angiography rates and timing after an acute coro-nary syndrome in New Zealand (ANZACS-QI 6). NZ Med J 2016: 129;1428
5. Ko DT, Tu JV, Austin PC et al. Prevalence and extent of obstructive coronary artery disease among patients under-going elective coronary catheterization in New York State and Ontario. JAMA. 2013;310:163-169
6. Grey C, Jackson R, Wells S et al. Maintenance of statin use over 3 years following acute coronary
syndromes: a national data linkage study (ANZACS-QI-2). Heart 2014;100:770-774
7. Kerr A, Mustafa A, Lee M et al. Ethnicity and revascularisation following acute coronary syndromes: a 5-year cohort study (ANZACS-QI-3) NZ Med J 2014:127;38
8. Barr P, Smyth D, Harding SA et al. Variation in arterial access for invasive coronary procedures in New Zealand: a national analysis (ANZACS-QI 5). Heart Lung Circ (in press)
9. Valgimigli M, Gagnor A, Calabró P et al. Radial versus femoral access in patients with acute coronary syndromes undergoing invasive management: a randomised multi-centre trial. Lancet 2015;385:2465–76.
REFERENCES:
10 NZMJ 8 January 2016, Vol 129 No 1428ISSN 1175-8716 © NZMA
www.nzma.org.nz/journal
ARTICLE
Management of non ST-elevation acute coronary syndrome patients in New Zealand: a
longitudinal analysis. Results from the New Zealand Acute Coronary Syndrome national audits of 2002, 2007 and 2012
Gerry Devlin, Michael Williams, John Elliott, Harvey White, John French, Greg Gamble, Philip Matsis, Richard Troughton, Mark Richards, Chris Ellis
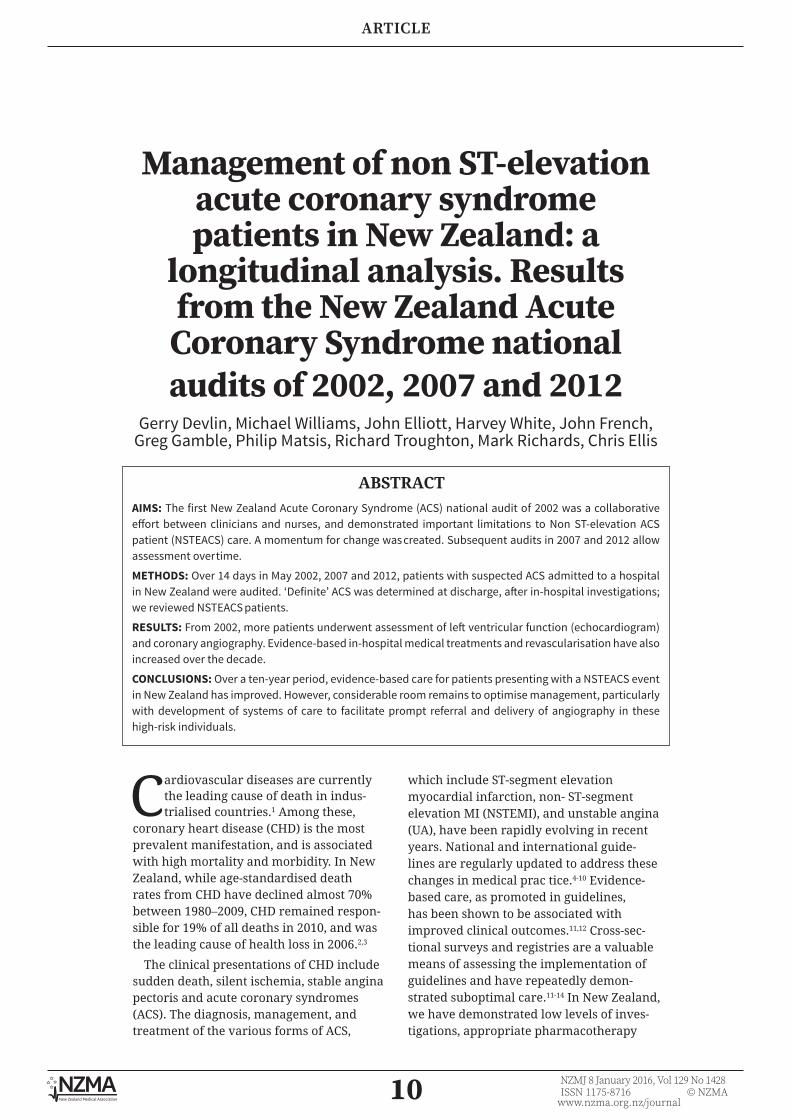
ABSTRACTAIMS: The first New Zealand Acute Coronary Syndrome (ACS) national audit of 2002 was a collaborative effort between clinicians and nurses, and demonstrated important limitations to Non ST-elevation ACS patient (NSTEACS) care. A momentum for change was created. Subsequent audits in 2007 and 2012 allow assessment over time.
METHODS: Over 14 days in May 2002, 2007 and 2012, patients with suspected ACS admitted to a hospital in New Zealand were audited. ‘Definite’ ACS was determined at discharge, after in-hospital investigations; we reviewed NSTEACS patients.
RESULTS: From 2002, more patients underwent assessment of left ventricular function (echocardiogram) and coronary angiography. Evidence-based in-hospital medical treatments and revascularisation have also increased over the decade.
CONCLUSIONS: Over a ten-year period, evidence-based care for patients presenting with a NSTEACS event in New Zealand has improved. However, considerable room remains to optimise management, particularly with development of systems of care to facilitate prompt referral and delivery of angiography in these high-risk individuals.
Cardiovascular diseases are currently the leading cause of death in indus-trialised countries.1 Among these,
coronary heart disease (CHD) is the most prevalent manifestation, and is associated with high mortality and morbidity. In New Zealand, while age-standardised death rates from CHD have declined almost 70% between 1980–2009, CHD remained respon-sible for 19% of all deaths in 2010, and was the leading cause of health loss in 2006.2,3
The clinical presentations of CHD include sudden death, silent ischemia, stable angina pectoris and acute coronary syndromes (ACS). The diagnosis, management, and treatment of the various forms of ACS,
which include ST-segment elevation myocardial infarction, non- ST-segment elevation MI (NSTEMI), and unstable angina (UA), have been rapidly evolving in recent years. National and international guide-lines are regularly updated to address these changes in medical prac tice.4-10 Evidence-based care, as promoted in guidelines, has been shown to be associated with improved clinical outcomes.11,12 Cross-sec-tional surveys and registries are a valuable means of assessing the implementation of guidelines and have repeatedly demon-strated suboptimal care.11-14 In New Zealand, we have demonstrated low levels of inves-tigations, appropriate pharmacotherapy

11 NZMJ 8 January 2016, Vol 129 No 1428ISSN 1175-8716 © NZMA
www.nzma.org.nz/journal
ARTICLE
treatments, and revascularisation proce-dures in previous audits of ACS care in 2002 and 2007.15,16 In 2012, a bi-national Australia and New Zealand ‘snapshot’ ACS audit was performed. This provided the opportunity to perform a longitudinal analysis of care of patients presenting with ACS in New Zealand over a 10-year period. In this paper we report on the management of Non-ST segment elevation ACS (NSTEACS).
MethodsStudy group
The established New Zealand ACS Audit Group network from 2002 and 2007 was updated for the 2012 snapshot and consisted of one or more physicians for every hospital in New Zealand that admitted ACS patients. A 2-week audit period, in mid-May, for each of the 3 audits was accepted as a compromise between the need to collect sufficient patient numbers to obtain an accurate representative cohort versus the ability to collect the consecutive patient data.
HospitalsSince 2007, the number of hospitals
‘planning to admit’ ACS patients had not changed (n=39 centers), but several hospitals now had more local access to invasive cardiac angiography or percuta-neous coronary intervention (PCI). North Shore Hospital, in Auckland, had acquired a cardiac angiography suite in November 2007, with a second laboratory in 2011, which is operational with three PCI oper-ators, during working hours on weekdays. North Shore Hospital is now included in the interventional center group. Both Nelson Hospital and Tauranga Hospital had acquired a limited PCI service, mostly during weekdays and working hours, although with just one PCI operator, and were still included among the non-inter-vention centers. Therefore, in 2012 there were 39 hospitals admitting ACS patients, 10 of whom were deemed ‘interventional’ and 29 ‘non-interventional’ centers.
Data collectionWritten study protocols were supplied
to all participating sites, along with defi-nitions of the various data being collected for each of the 3 audits. The data collection form recorded patient demographics, initial
and discharge diagnosis, medication use in hospital and at discharge, as well as investi-gations undertaken and invasive treatments received by patients. Data from patients subsequently transferred to another insti-tution are ‘attributed’ to their original admitting hospital. Ethnicity was self-re-ported at hospital admission.
Patient eligibility and diagnosisThe inclusion criterion for the audits
was ‘a patient admitted overnight with a suspected or definite ACS’. Patients were tracked for the duration of the acute care episode, including all transfers between hospitals. The study population for this analysis was a discharge diagnosis of NSTEACS. This comprised NSTEMI and UA patients only. NSTEMI required evidence of biomarker elevation with or without ECG changes consistent with ischaemia. UAP reflected local clinical determination.
Ethics Committee application Following input from all 39 centres, the
National Multicentre Ethics Committee concluded that this was an audit of health service delivery, and a consent waiver was applied.17 The Ethics Committee permitted the collection of patient names and National Health Index (NHI) numbers to assist with accurate data collection.
StatisticsData are presented as mean (standard
deviation) or median (interquartile range) as indicated. Comparisons between groups for categorical variables were made using Fisher’s exact test, or the chi-square test as appropriate. Between groups comparisons of non- normally distributed data was made using Wilcoxon/Kruskall-Wallis test. Confi-dence intervals for rates were calculated using a mid P method (www.openepi.com).
P<0.05 was considered significant and no adjustment for multiple comparisons were made. All analyses were performed using SAS (v9.2, SAS Institute Inc).
ResultsThe demography of NSTEACS admis-
sions over the 3 audits is shown in Table 1. Patients were older on presentation in 2012. In addition, a significantly higher proportion of patients were older than 75 in the most recent audit. The majority of patients admitted at each audit were males

12 NZMJ 8 January 2016, Vol 129 No 1428ISSN 1175-8716 © NZMA
www.nzma.org.nz/journal
ARTICLE
Table 1: Demographics of NSTEACS admissions in 2002, 2007 and 2012 ACS audits.
2002N=620
2007N=742
2012N=432
P value
Median age [years] (range) Age >75
70 (58–78)199 (32%)
68 (56–78)221 (30%)
73 (62–82)193 (45%)
<0.0001<0,0001
Sex (male) 358 (58%) 424 (57%) 256 (60%) 0.78
Ethnicity
Caucasian 506 (82%) 576 (78%) 351 (81%) 0.14
Māori 36 (5.8%) 67 (9.0%) 33 (7.6%) 0.082
Pacifica 6 (1.0%) 21 (2.8%) 20 (4.6%) 0.0011
Indian 7 (1.1%) 20 (2.7%) 11 (2.6%) 0.11
Asian 0 16 (2.2%) 8 (1.9%) 0.0015
Smoking
Current 109 (18%) 119 (16%) 64 (15%) 0.48
Previous 264 (43%) 300 (40%) 192 (44%) 0.39
Never 230 (37%) 289 (39%) 176 (41%) 0.48
Hypertension 312 (50%) 396 (53%) 304 (70%) <0.0001
Diabetes mellitus 117(19%) 140 (19%) 127 (29%) <0.0001
Dyslipidaemia 236 (38%) 370 (50%) 260 (60%) <0.0001
Prior MI 232 (37%) 248 (33%) 165 (38%) 0.17
Prior angiogram 186 (30%) 234 (32%) NC 0.57
Prior PCI 81 (13%) 115 (16%) 107 (25%) <0.0001
Prior CABG 69 (11%) 77 (10%) 63 (15%) 0.085
Prior PVD 72 (12%) 62 (8.4%) 47 (11%) 0.11
Prior TIA/Stroke 80 (13%) 89 (12%) 73 (17%) 0.052
Prior AF 15 (2.4%) 100 (13%) 81 (19%) <0.0001
and of Caucasian descent. Admissions of patients with Pacific Island ethnicity increased with successive audits. No change was noted in the prevalence of smoking. An increase in the number of patients with diabetes mellitus was noted in 2012, occurring in close to 1 in 3 individuals. Hypertension, dyslipidemia and atrial fibril-lation were also more frequent in 2012. Patients admitted in 2012 were more likely to have undergone previous pecutaneous intervention than in previous audits.
In hospital management is shown in Table 2. Evidence-based medical therapy improved with time. Non-invasive assessment of left ventricular function also increased with 1 in 3 NSTEACS admissions undergoing echocar-diography in the 2012 audit. The proportion of patients undergoing a treadmill test did not change with time. Invasive risk strat-
ification post ACS presentation increased with each audit. However, 43% of NSTEACS admissions in the 2012 audit underwent no further risk stratification post admission. Revascularisation was more likely to be performed in 2012 than in previous audit periods. Delays in accessing angiography were less in 2012, with significantly more patients undergoing angiography within both 1 and 3 days (p<0.001) (Figure 1). Hospital stay and in-hospital mortality was unchanged with time.
Significant improvements in the prescription of evidence base secondary prevention medication on discharge was noted with time (p<0.001) (Figure2).
DiscussionThe 3 ACS audits allow us to compare
evolving practice with time in New Zealand.

13 NZMJ 8 January 2016, Vol 129 No 1428ISSN 1175-8716 © NZMA
www.nzma.org.nz/journal
ARTICLE
Table 2: In-hospital management of NSTEACS in 2002, 2007 and 2012 ACS audits.
2002 2007 2012 P
N (%*) 620 (86%) 742 (90%) 432 (81%)
Hospital investigations
Chest X-ray 534 (86%) 650 (88%) 399 (92%) 0.0067
Echocardiogram 115 (19%) 116 (16%) 139 (32%) <0.0001
Exercise test (ETT) 138 (22%) 182 (25%) 85 (20%) 0.15
Angiogram 128 (21%) 241 (32%) 197 (46%) <0.0001
No ETT/Angiogram 383 (62%) 362 (49%) 187 (43%) <0.0001
Hospital treatments
Aspirin 496 (80%) 531 (72%) 405 (94%) <0.0001
Other anti-platelet 56 (9%) 248 (33%) 318 (73%) <0.0001
Any heparin 369 (60%) 403 (54%) 312 (72%) <0.0001
PCI** 37 (6%) 118 (16%) 99 (23%) <0.0001
CABG*** surgery 21 (3%) 19 (3%) 24 (6%) 0.027
Times/Outcomes
Time to angiogram (hr) 72 (48, 120) 100 (62, 151) 65 (32, 96) <0.0001
Length of Stay (days) 3 (2, 6) 4.2 (2.6, 6.3) 3.5 (1.8, 6.0) 0.78
In-hospital deaths 12 (2%) 8 (1%) 10 (2.3%) 0.23
Figure 1: Percent angiography undertaken within 1 and 3 days from admission.

14 NZMJ 8 January 2016, Vol 129 No 1428ISSN 1175-8716 © NZMA
www.nzma.org.nz/journal
ARTICLE
Overall, the patient demographics differ-ences noted were small, although the ethnic mix showed a small, but signif-icant, increase in NSTEACS presentations in Pacific Island patients which may simply reflect changing population demo-graphics. The median age at presentation had increased in 2012 to 73 years, with just under half of patients greater than 75 years of age, compared with a third in preceding audits. This almost certainly simply reflects our aging population. The increase in the incidence of diabetes as a comorbidity to 29% in 2012, compared to 19% in 2002 and 2007, is a concern and may, in part, reflect the emerging obesity epidemic in New Zealand.18 Importantly, it highlights the need for cardiologists involved in the care of ACS patients to be familiar with current management of diabetes, particularly in this setting.
For patients with a confirmed NSTEACS, optimal management is defined in guide-lines.6,8,10 This includes investigations not only to establish the diagnosis, but to aid in further risk stratification. Assessment of left ventricular function is strongly recom-mended in current guidelines in this patient population. Echocardiography rates did not alter between the first two audits, but had increased in 2012 to 32%, which perhaps
suggests increased access to this technology in New Zealand.
Medical management of NSTEACS improved both on admission and discharge with successive audits. The 2012 audit showed high use of anti-platelet agents, statins and beta blockers which is compa-rable with international experience.13 One of the more positive findings in this longi-tudinal analysis is the significant increased access to angiography with each audit. By 2012, just under half (46%) of all NSTEACS underwent invasive angiography to identify patients likely to benefit from early revas-cularisation. It should not surprise us to therefore see a similar increase in revascu-larisation procedures, be it percutaneous coronary intervention (PCI) or coronary artery bypass graft (CABG) surgery. Also noteworthy was a reduction in time to access angiography. While angiography should be performed as soon as possible, the challenges of this in non-metropolitan New Zealand with transfer required to cardiology units are real. As such, a 3-day target for access to angiography for ACS admissions has been agreed as a real-istic performance indicator and this was achieved in the 2012 cohort in 55% of patients, with a mean access time of 65 hours (Figure 1). The use of treadmill testing
Figure 2: Medications on discharge of NSTEACS in 2002, 2007 and 2012 ACS audits.
15 NZMJ 8 January 2016, Vol 129 No 1428ISSN 1175-8716 © NZMA
www.nzma.org.nz/journal
ARTICLE
to risk stratify was similar in each audit, occurring in 1 in 5 admissions. However, no further risk stratification, either by treadmill testing or angiography, was undertaken in 43% of NSTEACS admissions in New Zealand in the 2012 audit. Although this rate has improved from previous audits, and accepting that invasive investi-gations are not appropriate in all NSTEACS admissions, it is likely that patients who may benefit from revascularisation are still not been identified with current practice.
The development of local clinical networks and Ministry of Health perfor-mance indicators is likely to greatly facilitate improvements in ACS care. The All New Zealand ACS Quality Improvement Programme (ANZACS-QI), funded by the Ministry of Health, is a collaboration between cardiologists from each District Health Board, the National Cardiac Network and the Cardiac Society of Australia and New Zealand, and was implemented in 2013. It provides data collection on all ACS admissions (ACS registry) and invasive coronary angiography procedures (Cath PCI registry) as part of routine clinical workflow, real-time reporting of key perfor-mance indicators, and enables long-term tracking of individual patient outcome and pharmaceutical dispensing via anonymised linkage to national databases. The objective is to further investigate the extent, variation and trends in ACS in-patient cardiac investi-gation, management, revascularisation, and post-discharge rehabilitation and care and
to assess whether this is equitable across age, gender, location and ethnicity after adjustment for absolute risk and comor-bidity. Real-time access to key performance indicators is available to regional networks and District Health Boards, with the aim of improving quality of ACS care for all New Zealanders.
Study LimitationsThere are several limitations to our
study, including the fact that we did not collect data for investigations and treatment following hospitalisation and have no longer-term follow-up. We were also reliant on local investigators to check the accuracy of patient data and were unable to verify whether we had collected all relevant admissions. The strength of this paper, we believe, is that it highlights care of NSTEACS in a real world setting over a 10-year period.
ConclusionsOver a 10-year period, evidence-based
care for patients presenting with a NSTEACS event in New Zealand has improved. However, considerable room remains to optimise management, particularly with the development of systems of care, to facilitate prompt referral and delivery of angiog-raphy in these high-risk pts. It is hoped that Ministry of Health initiatives, such as ANZACSQI, will see further improvements in ACS care for all New Zealanders.
Competing interests: NilAuthor information:
Gerry Devlin, Department of Cardiology, Waikato Hospital, Hamilton; Michael Williams, Cardiology, Dunedin Hospital, Dunedin; John Elliott, Cardiology Department, Christchurch Hospital, Christchurch; Harvey Douglas White, Green Lane Cardiovascular Service, Auck-
land City Hospital, Auckland; John French, Cardiology Department, Liverpool Hospital, Sydney, Australia; Greg Gamble, Cardiology, Auckland Hospital, Auckland; Philip Matsis, Cardiology Department, Wellington Hospital, Wellington; Richard Troughton, Consultant
Cardiologist, Christchurch Hospital, Christchurch; Mark Richards, Cardiology, Christchurch Heart Institute; Chris Ellis, Greenlane CVS service, Cardiology Department, Auckland City
Hospital, Auckland.Corresponding author:
Gerry Devlin, Department of Cardiology, Waikato Hospital, Hamilton [email protected]
URL:www.nzma.org.nz/journal/read-the-journal/all-issues/2010-2019/2016/vol-129-no-1428-8-
january-2016/6779

16 NZMJ 8 January 2016, Vol 129 No 1428ISSN 1175-8716 © NZMA
www.nzma.org.nz/journal
ARTICLE
REFERENCES:1. Murray CJ, Lopez AD.
Alternative projections of mortality and disabil-ity by cause 1990–2020: Global Burden of Disease Study. Lancet 1997; 349:1498–1504.
2. Ministry of Health. Mortality and Demo-graphic Data 2010. Wellington, New Zealand: Ministry of Health; 2013.
3. Ministry of Health. Health Loss in New Zealand: A report from the New Zealand Burden of Diseases, Injuries and Risk Factors Study, 2006-2016. Wellington: Ministry of Health; 2013.
4. Chew DP, Aroney CN, Aylward PE, et al. 2011 Addendum to the National Heart Foundation of Australia/Cardiac Society of Australia and New Zealand Guidelines for the management of acute coronary syndromes (ACS) 2006. Heart Lung Circ 2011. 20: 487-502.
5. ST-elevation myocardial infarction: New Zealand Management Guidelines, 2013. ST- Elevation Myocardial Infarction Guidelines Group; New Zealand Branch of Cardiac Society of Australia and New Zealand. N Z Med J. 2013 Dec 13;126(1387):127-64.PMID: 24362740
6. Non ST-Elevation Acute Coronary Syndrome Guidelines Group and the New Zealand Branch of the Cardiac society of Australia and New Zealand. New Zealand 2012 guidelines for the management of non ST-el-evation acute coronary syndromes. NZ Med J. 2012; 125 (1357). URL: http://www.nzma.org.nz/journal/125-1357/5245/
7. Steg PG, James SK, Atar D, et al. ESC Guidelines for the management of acute myocardial infarction in patients presenting with
ST-segment elevation: The Task Force on the management of ST-seg-ment elevation acute myocardial infarction of the European Society of Cardiology (ESC). European Heart Journal 2012; 33: 2569–2619.
8. Hamm CW, Bassand J-P, Agewall S, et al. ESC Guidelines for the management of acute coronary syndromes in patients presenting with-out persistent ST-segment elevation: The Task Force for the management of acute coronary syndromes (ACS) in patients present-ing without persistent ST-segment elevation of the European Society of Cardiology (ESC). European Heart Journal 2011; 32: 2999–3054.
9. O’Gara PT, Kushner FG, Ascheim DD, et al. 2013 ACCF/AHA Guideline for the Management of ST-Elevation Myocardial Infarction: A Report of the American College of cardiology Foundation/American Heart Asso-ciation Task Force on Practice Guidelines. J Am Coll Cardiol. 2013; 61 (4): e78-e140.
10. Anderson JL, Adams CD, Antman EM, et al. 2012 ACCF/AHA Focused Update Incorporated into the ACCF/AHA 2007 Guidelines for the Management of Patients with Unstable Angina/Non-ST-Elevation Myocardial Infarction: A report of the American College of Cardiology Foundation/American Heart Association Task Force on Practice Guide-lines. J Am Coll Cardiol. 2013; 61 (23): e179-e347.
11. Carruthers KF, Dabbous OH, Flather MD, Starkey I, Jacob A, MacLeod D, Fox KAA, on behalf of the GRACE Investi-gators. Contemporary management of acute
coronary syndromes: does the practice match the evidence? The global registry of acute coronary events (GRACE). Heart 2005;91:290–298.
12. Bassand JP, Priori S, Tende-ra M. Evidence-based versus ‘impressionist’ medicine: how best to implement guidelines. Eur Heart J2005;26:1155–1158.
13. Mandelzweig L, Battler A, Boyko V, et al. The second Euro Heart Survey on acute coronary syndromes: character-istics, treatment, and outcome of patients with ACS in Europe and the Mediterranean Basin in 2004. Eur Heart J 2006;27:2285–93.
14. Chew DP, Amerena JV, Coverdale SG, et al. Invasive management and late clinical outcomes in contemporary Australian management of acute coronary syndromes: observations from the ACACIA registry. Med J Aust 2008;188:691–7.
15. Ellis C, Devlin G, Matsis P, et al. Acute coronary syndrome patients in New Zealand receive less inva-sive management when admitted to hospitals without invasive facilities. N Z Med J 2004;117:U954.
16. Ellis C, Gamble G, Hamer A, et al. Patients admitted with an acute coronary syndrome (ACS) in New Zealand in 2007: results of a second comprehensive nationwide audit and a comparison with the first audit from 2002. NZ Med J 2010;123:25–43.
17. Health and Disabilities Ethics Committees Operating Procedures. Available at: http://ethics.health.govt.nz/operating-procedures (accessed 30May 2013).
18. WHO: Global status on diseases , Non communi-cable diseases report 2014

17 NZMJ 8 January 2016, Vol 129 No 1428ISSN 1175-8716 © NZMA
www.nzma.org.nz/journal
ARTICLE
Echocardiography service provision in New Zealand:
The implications of capacity modelling for the cardiac sonographer workforce
Belinda Buckley, Mark J Farnworth, Gillian Whalley
ABSTRACTAIM: Regional disparity in both utilisation and the cardiac sonographer workforce has previously been identified. We sought to model the capacity of the cardiac sonographer workforce at a national and District Health Board level to better understand these regional differences.
METHOD: In 2013, surveys were distributed to 18 hospitals who employ cardiac sonographers (return rate 100%). Questions related to cardiac sonographer demographics, echo utilisation and workflow. Actual clinical capacity was calculated from scan duration and annual scan volumes. New Zealand national actual capacity was compared to predicted capacity from three international models. Potential clinical capacity was calculated from the workforce size in fulltime equivalent (FTE) and clinical availability.
RESULTS: In New Zealand, scan duration and population-based clinical capacity varies between centres. The New Zealand capacity is similar to the UK 30:70 model, and consistently less than the US model for all scan types. There are marked regional differences in potential versus actual capacity, with 10/16 DHBs demonstrating excess potential capacity.
CONCLUSION: There is regional disparity in the capacity of the cardiac sonographer workforce, which appears to be strongly related to scan duration. Workforce capacity modelling should be used with need and demand modelling to plan adequate levels of service provision.
Echocardiography is the most common non-invasive imaging technique used for the diagnosis and prognosis of
cardiovascular diseases. In New Zealand, like Australia, the UK and the US, echocar-diography is mostly performed by cardiac sonographers, who are highly skilled and specialised healthcare professionals.1
Internationally, echocardiography services are under pressure due to a steady increase in echocardiography utilisation2-4 and a shortage of cardiac sonographers.4-6 This lack of additional workforce capacity has led to increasing waitlists,7 reduced access and regional inequalities in the provision of echocardio-grams.5 Furthermore, a significant growth in echocardiography is predicted due to an increase in the prevalence of cardiovascular
disease as a result of an aging population, burgeoning risk factors, and reduced mortality with improving treatments.8
There is similar pressure on echocardiog-raphy services within New Zealand, with a 17% increase in echo volumes from 2008 to 20129 and large differences between District Health Boards (DHBs) for both wait times and regional echo utilisation.9,10 Overseas research has shown that the number of echocardiograms performed is correlated with the availability of fulltime equivalent (FTE) cardiac sonographers.11 Our group has also previously identified regional disparity in the size and population-based distribution of the cardiac sonographer workforce in New Zealand.10 The impact of this regional workforce disparity is of concern, and a better understanding of
18 NZMJ 8 January 2016, Vol 129 No 1428ISSN 1175-8716 © NZMA
www.nzma.org.nz/journal
ARTICLE
the capacity of the cardiac sonographer workforce is essential to forecast adequate staffing and training levels to ensure high quality healthcare is provided.12
The aim of this paper is to model the capacity of the cardiac sonographer work-force at a national and DHB level using two models; the actual clinical capacity (total clinical hours performed) based on echo utilisation and scan duration, and potential capacity (available clinical hours) based on workforce size and clinical availability. Additionally, the New Zealand capacity will be compared to international models.
MethodsData sources
In March 2013, surveys were distributed by e-mail to charge sonographers at 18 public hospitals. Survey participants were identified through networks and included all providers of echocardiography using a sonographer-led service. Survey questions were answered by a single respondent and related to the cardiac sonographer workforce characteristics, echocardiogram volumes for all scan types, the proportion of scan volumes not performed by sonogra-phers and estimated usual scan durations for all scan types.
Data analysisSurveys were returned between March
and July 2013. Return rate was 100%, 15 centres responded by e-mail or post and 3 centres by telephone interview using a single interviewer. The survey responses were entered and separated by centre type (either surgical as tertiary providers of cardiac surgery, or regional). Information on DHB population was obtained from the Statistics New Zealand and Ministry of Health public access websites.13,14 Utilisation for each scan type was the annual (2012) echocardiogram volumes (actual number of echocardio-grams performed per centre) adjusted for the estimated proportion of scans performed solely by sonographers at each centre. Scan duration was the estimated usual scan duration for each scan type, including sonog-rapher reporting time. Mean and median scan durations for each scan type were calculated at each centre and adjusted by the estimated proportion of scans which were longer and shorter than the usual duration.
The actual clinical capacity is the total clinical scan hours performed as echo-cardiograms by cardiac sonographers (in hours per year). Total scan hours for each procedure were calculated as scan duration for each procedure (converted from minutes to hours) multiplied by the procedural scan volume in 2012. Total scan hours were summations of both the usual scan volume and scan duration, as well as estimated volume and adjusted scan dura-tions for the proportions of scans longer or shorter than the usual scan duration. Total scan hours were calculated for the following procedures: adult and paediatric transthoracic (TTE) scans (including trainee performed and portable bedside scans); exercise stress echo (ESE); dobutamine stress echo (DSE); and transoesophageal echoes (TOE).
Predicted clinical scan hours were calcu-lated from 2012 procedure scan volumes (national and DHB) using procedure-spe-cific time weightings from two international models; the UK workforce planning model15 (with different inpatient and outpatient scan time weights to make two different models) and the US accreditation guidelines.16 The DHB population-based actual capacity was calculated as the actual clinical hours per 100,000 population and compared to the clinical hours predicted using UK and US scan time weighting models.15,16
The potential clinical capacity is the clinical hours available for performing echocardiograms (in hours per year) and was calculated for each centre from the following 2012 information: the number of clinical sessions per working week based on the UK workforce planning model;15 clinical workforce size (measured as the clinical FTE for performing echocardiograms only) of both trainees and qualified sonographers based on a 40-hour working week; calcula-tions of available working days in 2012;17 and leave provision information provided for both qualified and trainee sonogra-phers. The total time was adjusted 20% for workflow inefficiencies described in the UK workforce planning model.15
To compare the actual versus potential clinical capacity of each DHB, the time difference (in clinical hours) between the actual and potential capacity was calcu-lated and expressed as a percentage excess.

19 NZMJ 8 January 2016, Vol 129 No 1428ISSN 1175-8716 © NZMA
www.nzma.org.nz/journal
ARTICLE
A positive excess demonstrated calcula-tions of actual capacity to exceed potential capacity (more echocardiograms produced than clinical time available), a negative excess demonstrated potential capacity to exceed calculations of actual capacity (more clinical time available than the echocardio-grams produced).
ResultsProcedure scan duration: New Zealand surgical and regional centres, UK and US models
There are scan duration differences between centres for adult TTE scans, but no difference between centre types. Of the centres that perform paediatric echo-cardiograms, 4/16 (25%) increase the scan duration compared to adult scans, with duration increased an additional 25% to 33% of usual duration. At one regional centre, paediatric scans were 33% shorter than adult TTEs. Of the centres that have trainee sonographers, 9/18 (50%) of centres increased scan duration (from an addi-tional 25% to 100% of usual duration). Other differences were noted: 5/18 (28%) of centres increased scan duration for portable scans by 25% to 66%; 9/12 (75%) of centres increased duration by 20% to 100% for DSEs; 9/13 (69%) centres increased duration from 20% to 33% for ESEs, whilst one centre shortened scan duration by
25% for ESEs. Finally, 4/16 (25%) of centres increased duration for TOEs, however two regional centres reduced duration for TOEs compared to standard scans.
New Zealand median scan durations (all centres) are shorter than the UK model for all procedures except TTE and paed TTE and shorter than the US model for all proce-dures except portable scans. Scan duration differences between New Zealand and the UK model vary widely from -14 minutes (New Zealand in excess) for paed TTE to +49 minutes (UK in excess) for ESE. Scan dura-tions in New Zealand for portable scans, ESE, DSE and TOE are significantly shorter than the UK model. Scan duration differ-ences between New Zealand and the US model vary from -3 minutes (New Zealand in excess) for portable scans to +29 minutes (US in excess) for DSE.
New Zealand echocardiogram actual capacity versus international models
For both adult TTE and all procedures, the UK 30:70 model predicts similar total combined hours compared to New Zealand. For the New Zealand, UK and US models, the largest proportion of clinical hours were spent performing adult TTE. There is a 23% difference in total scan hours (17,364 scan hours) between the New Zealand actual and US model. New Zealand paedi-atric clinical hours exceed both UK models,
Table 1: Procedure scan duration: New Zealand surgical and regional centres, UK and US models.
Scan duration (minutes)
TTE TTE IP TTE training
TTE portable
DSE ESE TOE TTE paed
New Zealand surgical centres (n=5)
Range 30–60 30–60 45–75 45–75 45–90 45–90 45–60 30–75
Mean 45 45 60 60 64 58 56 49
Median 45 45 45 45 52 45 60 45
New Zealand regional centres (n=13)
Range 30–60 30–60 50–90 50–90 45–60 40–90 30–60 30–60
Mean 47 47 46 66 58 54 48 48
Median 45 45 60 45 60 45 52 45
UK model15 35 53 53 88 105 105 70 35
US model16 60 60 60 60 90 60 60 60
DSE: dobutamine stress echo; ESE: exercise stress echo; TOE: transoesophageal echo; TTE: transthoracic echo; TTE paed: transthoracic scan performed on a paediatric patient; TTE portable: transthoracic scan performed at the patient’s bedside; TTE training: transthoracic scan performed by a trainee sonographer

20 NZMJ 8 January 2016, Vol 129 No 1428ISSN 1175-8716 © NZMA
www.nzma.org.nz/journal
ARTICLE
but are less than the US model. Both UK and US models report increased clinical hours for performing DSE, ESE and TOE scans compared to the New Zealand actual clinical hours for these scan types.
Population-based DHB echocardiogram actual capacity versus international models
There are marked differences in New Zealand actual total echocardiogram clinical scan hours between DHBs (923 to 2623 hours). 9/16 (56%) of DHBs produce less actual clinical hours than those predicted from both the UK and US models. The US model predicts higher clinical hours than New Zealand or the UK for all DHBs.
Actual versus potential clinical capacity
6/16 DHBs (37%) demonstrate a positive excess time difference in actual capacity—these DHBs produce more scans (calculated from scan volume and duration) than is predicted (calculated from workforce size and clinical availability). There is wide variability between DHBs—from 29% positive excess (more scans—actual greater than potential) to 72% negative excess (less scans—potential greater than actual). There is no difference between surgical and regional DHBs: surgical 7% positive excess to 34% negative excess; regional 29% positive excess to 72% negative excess.
Figure 1a and 1b: New Zealand actual clinical hours (by procedure) based on 2012 national echocardio-gram volumes, compared to clinical hours predicted using UK and USA scan time weighting models.15,16
DSE: dobutamine stress echo; ESE: exercise stress echo; TOE: transoesophageal echo; Adult TTE: adult transthoracic echo; paed TTE: paediatric transthoracic echo; UK 30:70: 30% inpatient, 70% outpatient; UK 50:50: 50% inpatient, 50% outpatient.
Figure 2: New Zealand annual clinical hours per 100,000 population for New Zealand DHB’s compared to clinical hours predicted using UK and USA scan time weighting models15,16
NZ: New Zealand; UK 30:70: 30% inpatient, 70% outpatient; USA: United States of America

21 NZMJ 8 January 2016, Vol 129 No 1428ISSN 1175-8716 © NZMA
www.nzma.org.nz/journal
ARTICLE
Discussion This study demonstrates marked regional
differences in the population-based capacity of cardiac sonographers. One possible explanation for this variation may be the differences in procedure scan duration for each DHB, since scan duration has been associated with echo utilisation previously.10 All echocardiographic procedure types showed wide differences in scan duration between centres with a scan duration in some centres double the duration of others and no relationship to centre type.
The international models also show marked differences in capacity, with the US capacity16 and scan duration signifi-cantly higher than the UK,15 although they showed similar trends. The US model uses scan durations that are recommended best practice18 and are based on national accreditation standards.16 The 60-minute TTE duration reflects the minimum of 45 minutes for image acquisition and an addi-tional 15 minutes reporting time, with a single scan duration for all TTE scan types. This is comparable with US workforce surveys, which show an average daily scan number of nine.19,20 The UK model scan durations15 are based on national averages of 35 minutes for a standard TTE (including reporting), which is comparable to a survey of practice in the UK which found that on average 13 scans were performed per day.3 However, UK scan durations are markedly different for TTE inpatients and outpatients, and since New Zealand utilisation propor-
tions are unknown, we developed two UK models to allow comparison to New Zealand capacity. The 30:70 model reflects capacity with fewer inpatients to outpatients—anec-dotally a similar workload distribution of New Zealand smaller regional centres. The 50:50 model reflects capacity with an even split of inpatients to outpatients—most likely similar to New Zealand larger centres. The capacity predicted by the UK 30:70 model aligns closely with the New Zealand capacity for both adult TTE and total all scan types, whereas the UK 50:50 model predicts capacity between the New Zealand actual and US model. Overall, it appears that it is the duration of TTE scans rather than other scan types that is driving the capacity differ-ences, which is not unexpected since adult TTEs are the most common type of scan performed in New Zealand.10
Another likely factor in the regional capacity differences is the proportion of sonography trainees, with our groups previous study demonstrating that training affects echo utilisation.10 This is supported by the data, which shows 50% of centres increasing training scan duration compared to standard TTE scans. Although the calcu-lation of actual capacity takes into account the differences in scan time for trainees, it does not reflect the reduced clinical capacity of the trainer. Since training of cardiac sonographers is time intensive and requires one-on-one supervision10 it is expected that training centres will have reduced actual clinical capacity, not only
Figure 3: Comparison of actual versus potential clinical capacity by DHB expressed as a % excess time difference (in clinical hours).

22 NZMJ 8 January 2016, Vol 129 No 1428ISSN 1175-8716 © NZMA
www.nzma.org.nz/journal
ARTICLE
from the increased trainee scan time, but also from the direct supervision required.
Other possible causes for the regional differences in clinical capacity relate to differences in service provision and centre size.10 Clinical capacity may be reduced in centres with little or no clerical support if sonographers spend clinical time performing these duties, whereas in centres which operate as outreach, or on more than one site, clinical capacity may be reduced by travel time. Additionally regional differences may relate to indi-vidual centre adherence to health and safety best practice guidelines.21 Since musculoskeletal injury risk increases with scan duration and volume,22 capacity may be limited by processes to reduce the risk of injury to sonographers. It is likely that there are other unidentified differences in echocardiography service provision which will also affect clinical capacity; future work should aim to identify all differences at an individual centre level.
There are also marked regional differ-ences in the potential versus actual capacity between DHBs which are not related to centre type. Aside from differences in actual capacity already described, another possible explanation for this variation may relate to the assumptions made in the calcu-lation of the potential capacity of each DHB. Potential capacity is dependent on clinical availability, with a UK workforce model used for the number of clinical sessions available per sonographer FTE per week,15 however it may be that clinical availability differs between DHBs. Potential capacity is also dependent on leave provision, with calculations assuming an average four weeks annual leave per year per sonog-rapher FTE. Since annual leave provision often relates to length of service, DHBs with more senior sonographers and greater leave provision may have the calculation of potential clinical time overestimated.
In New Zealand, capacity modelling for the cardiac sonographer workforce is difficult due to a lack of accessible infor-mation. There is no national collection of cardiac sonographer workforce infor-mation since cardiac sonographers have no formal requirement for licensing.1 In addition the utilisation of echocardiograms as a measurement of the workforce activity,
is also difficult to obtain since echocardio-grams are not separately identified within funding coding.6 In the future, demand in echocardiography services is likely to increase23 and accommodating an increase in demand without a change in the size of the cardiac sonographer workforce would only be possible if echocardiography services were provided differently than current practice. This could involve new training models with training provided externally and trainees as supernumerary rather than employed, an increase in clinical hours by extension to a 7-day working week23 and also additional support roles established to increase efficiency of time able to be spent on performing clinical work.23
Although this study models the capacity of the cardiac sonographer workforce it does not measure the need for echocardiography services. Measuring the disease-specific population need for echocardiograms is difficult since echocardiography is widely used for the diagnosis and prognosis of many different types of heart disease and conditions.1 In the UK, the national need for echocardiography was calculated as the number of studies per million population per year required from eight main indi-cations, and this has been modelled as an estimated need for 28–40 cardiac sonog-raphers per million population.15 In New Zealand, there are 16 cardiac sonographers per million population10—43% to 60% less than the estimated UK need. Although the same disease population data is not readily available in New Zealand, disease preva-lence is unlikely to be markedly different indicating that there is likely a significant need versus capacity mismatch for the cardiac sonographer workforce in New Zealand. This study also does not measure or model the demand for echocardio-grams. Demand reflects both utilisation and waitlist volumes24 as well as differences in referral practices including the appro-priateness of the referral.25 To accurately understand the need and demand for echocardiogram provision at a national and regional level, future work should include need modelling based on all clinical indi-cations for echocardiograms, as well as the development of national appropriateness guidelines. The focus should be on planning for a required level of service provision and
23 NZMJ 8 January 2016, Vol 129 No 1428ISSN 1175-8716 © NZMA
www.nzma.org.nz/journal
ARTICLE
how this might be best supplied econom-ically rather than planning for the ‘right’ number required of a profession.26
LimitationsThis study has collected a complete
national sample of sonographer performed echocardiography within public healthcare, however since private institutions have been excluded, it does not represent all echocardiography provision in New Zealand. Additionally, the study represents a snapshot of New Zealand echocardiog-raphy services over a 3-month period, and as such is an accurate representation of this single point in time only. Data from some centres included a range of clinical times to perform procedures, where a range was given the median number scan duration was used. Since TTE inpatient and outpatient volumes were not iden-tified separately, a 50:50 IP/OP split was assumed for calculating the proportion of scans over and under the standard time for inpatient and outpatients. This assumption would have made a minimal difference to the calculation of actual clinical hours in a few centres only. Finally, this study iden-tifies the cardiac sonographer workforce capacity only and does not measure the capacity of echocardiogram services which would include all the resources available to provide the service, including the physical resources such as equipment and rooms.
ConclusionThis study explored the contribution of
workforce size to the regional differences in echocardiography provision within New Zealand and adds to previously described persistent differences. Modelling the capacity of echocardiography services based on the cardiac sonographer work-force shows marked population based differences between DHBs in terms of actual clinical hours and predicted clinical hours available (based on sonographer FTE) and different and lower service provision when compared to international models.
Although this study is unable to calculate the ‘right number’ of echo volumes or cardiac sonographers required for each region, comparison to a UK need-based model suggests that there is a need versus capacity mismatch in the cardiac sonog-rapher workforce in New Zealand. The reasons for this are likely multi-factorial but appear closely related to scan duration. This study has not considered indication-specific population need, referral appropriateness or capacity unrelated to the workforce. Future planning of echocardiogram services will require ongoing data collection of the workforce and utilisation to allow for trending over time and to predict future service requirements.

24 NZMJ 8 January 2016, Vol 129 No 1428ISSN 1175-8716 © NZMA
www.nzma.org.nz/journal
ARTICLE
Competing interests: Gillian Whalley reports consulting honorarium from Samsung Medison outside the
submitted work. Acknowledgements:
The authors would like to acknowledge the following individuals and DHBs as contribu-tors to this survey: Michael Mooten, Whangarei Hospital (Northland DHB); Helen Walsh,
Northshore/Waitakere Hospitals (Waitemata DHB); Renelle French, Auckland City Hospital (Auckland DHB); Fiona Lean, Starship Hospital (Auckland DHB); Margaret Oldfield, Middle-
more Hospital (Counties Manukau DHB); Bruce Atkins, Waikato Hospital (Waikato DHB); Leigh Lamont, Tauranga Hospital (Bay of Plenty DHB); Mark Reyes, Rotorua Hospital (Lakes DHB); Gary Zealand, Hawkes Bay Hospital (Hawkes Bay DHB); Jill Eastham, Gisborne Hospi-tal (Tairawhiti DHB); Jenny Hardiman, Taranaki Base Hospital (Taranaki DHB); Hazel Bell,
Palmerston North (Mid central DHB); Angela Geary, Hutt Hospital (Hutt Valley DHB); Angela Morgan, Wellington Hospital (Capital and Coast DHB); Steve White, Nelson Hospital (Nelson
Marlborough DHB); Una Flynn, Christchurch Hospital (Canterbury DHB); David Yeoman, Dunedin Hospital (Southern DHB); Lisa Wilson, Invercargill Hospital (Southern DHB).
Author information:Belinda A Buckley, Cardiac sonographer, Cardiac Investigation Unit, Counties Manukau
Health, Otahuhu, Auckland; Mark J Farnworth, Associate Professor, School of Biological Sci-ences, Plymouth University, Plymouth, UK; Gillian Whalley, Professor/Associate Dean, Social
and Health Sciences Research, Unitec Institute of Technology, AucklandCorresponding author:
Belinda Buckley, Cardiac Investigation Unit, Middlemore Hospital, Private Bag 93311, Ota-huhu, Auckland 1640
[email protected] URL:
www.nzma.org.nz/journal/read-the-journal/all-issues/2010-2019/2016/vol-129-no-1428-8-january-2016/6780
1. Buckley B, White S, Poppe K, Whalley G. The cardiac sonographer workforce in New Zealand. J Ultrasound Med 2013;16 (2):77-85
2. Pearlman S, Ryan T, Picard M, Douglas P. Evolving trends in the use of echocardiography. J. Am. Coll. Cardiol. 2007; 49(23):2283-91
3. Macdonald M, Hawkins N, Balmain S et al. Transthoracic echocar-diography: a survey of current practice in the UK. QJ Med 2008;101:345-349
4. ASA: The future of sonographer education in Australia. ASA website. April 2011. Available at http://www.a-s-a.com.au/file_rep/ceo-discussion-
paper-sonographeredu-cationfinal-110420.pdf. Last accessed 27 Feb 2015
5. Munt B, O’Neill BJ, Koilipillai C et al for the Canadian Cardiovascular Society Access to Care Working Group. Treating the right patient at the right time: Access to echocardiography in Canada. Can J Cardiol. 2006 October; 22(12):1029-1034. Available at http://www.ncbi.nlm.nih.gov/pmc/articles/PMC2568963/. Last accessed 27 Feb 2015
6. Workforce risks and opportunities – the health-care science workforce. Centre for workforce intelligence. Nov 2012. Available at http://www.
cfwi.org.uk/publications/healthcare-science-work-force-risks-and-opportuni-ties-2013-education-com-missioning-risks-sum-mary-from-2012. Last accessed 25 Feb 2015
7. The Cardiac Physiology workforce in the UK – a comprehensive review. Sept 2006. Available at http://www.cfwi.org.uk/documents/the-car-diac-physiology-work-force-in-the-uk-a-compre-hensive-review/view. Last accessed 24 Feb 2015
8. Odden M, Coxson P, Moran A et al. The impact of the aging population on coronary heart disease in the US. Am J Med. 2011;124(9):827-833 e5
REFERENCES:

25 NZMJ 8 January 2016, Vol 129 No 1428ISSN 1175-8716 © NZMA
www.nzma.org.nz/journal
ARTICLE
9. White S, Hamer A, Buckley B, Whalley G. Review of echocardiography services within New Zealand Public Hospitals. Heart, Lung and Circu-lation. 2013;22:548-593
10. Buckley B, Poppe K, Farnworth M, Whalley G. Regional differences in echocar-diography provision in New Zealand—results from the 2013 SCANZ Workforce Survey. N Z Med J. 2015;128(1408)
11. Boon N, Norell M, Hall J et al. National variations in the provision of cardiac services in the United Kingdom; second report of the British Cardiac Society working Group 2005, Heart.2006; 92(7):873-78
12. Forecasting GP workforce capacity. The Royal New Zealand College of General Physicians. Available at https://www.rnzcgp.org.nz/assets/documents/Publications/Occassional-Papers/Occasional-Paper-8-Work-force-Capacity.pdf. Last accessed 17 Feb 2015
13. Statistics New Zealand website. District Health Board Area summary tables. Available at http://www.stats.govt.nz/census/about-2006-census/district-health-board-area-summary-tables.aspx. Last accessed 27 Feb 2015
14. Ministry of Health website. My DHB. Available at http://www.health.govt.nz/new-zealand-health-sys-tem/my-dhb. Last accessed 27 Feb 2015
15. Cardiac workforce requirements in the UK.
British Cardiac Society. June 2005. Available at http://www.bcs.com/documents/BCS_Cardi-ac_Workforce_2005_final_draft_June_2005.pdf. Last accessed 17 Feb 2015
16. The complete 2010 ICAEL standards for accreditation in adult echocardiography testing. Adult and paedi-atric echocardiography. Available at http://www.intersocietal.org/echo/main/echo_standards.htm . Last accessed 20 Feb 2015
17. Business days calculator in New Zealand. Available at http://newzealand.workingdays.org/. Last accessed 25 Nov 2014
18. Picard M, Adams D, Bierig M et al. American Society of Echocardiography Recommendations for Quality Echocardiography Laboratory Operations. J. Am. Soc. Echocar-diogr. 2010;24(1):1-10
19. ASE Sonographer FAQ’s. Available at http://asecho.org/sonographer-faqs/. Last accessed 25 Feb 2015
20. Essential ergonomics blog. June 3 2008. Ultrasound exams per day. Available at http://essentialergonomics.com/blog/?tag=sonography. Last accessed 6 March 2015
21. ASUM Policies and Statements C6. ASA and ASUM joint guidelines for reducing injuries to sonographers/sonologists. Available at http://www.asum.com.au/newsite/files/documents/policies/PS/C6_policy.pdf. Last accessed 27 Feb 2015
22. McCulloch M, Xie T,
Adams D. Cardiovascular sonography: the painful art of scanning. Cardiac ultrasound today. 2002, 8(5):69-96. Available at https://www.sound-ergonomics.com/pdf/McCulloch4.pdf_copy.pdf. Last accessed 25 Nov 2014
23. Cardiac Physiology: Innovation in service delivery workshop. 20 March 2014. Available at http://www.cardiacphysi-ologyreview.org.uk/page/Documents.aspx. Last accessed 6 March 2015
24. Segal L, Dalziel K, Bolton, T. A work force model to support the adoption of best practice care in chronic diseases – a missing piece in clinical guideline implementation. Implementation Science. 2008, 3(35). Available at http://www.imple-mentationscience.com/content/3/1/35. Last accessed 6 March 2015
25. Alter D, Stukel T, Newman A. The relationship between physician supply, cardiovascular health service use and cardiac disease burden in Ontario: supply-need mismatch. Can J Cardiol Mar 2008; 24 (30:187-193
26. Verhulst L, Forrest C, McFadden M. To count heads or to count services? Comparing popula-tion-to-physician methods with utilisation-based methods for physician workforce planning: a case study in a remote rural administrative region of British Colum-bia. Healthc Policy May 2007;2(4):178-192
26 NZMJ 8 January 2016, Vol 129 No 1428ISSN 1175-8716 © NZMA
www.nzma.org.nz/journal
ARTICLE
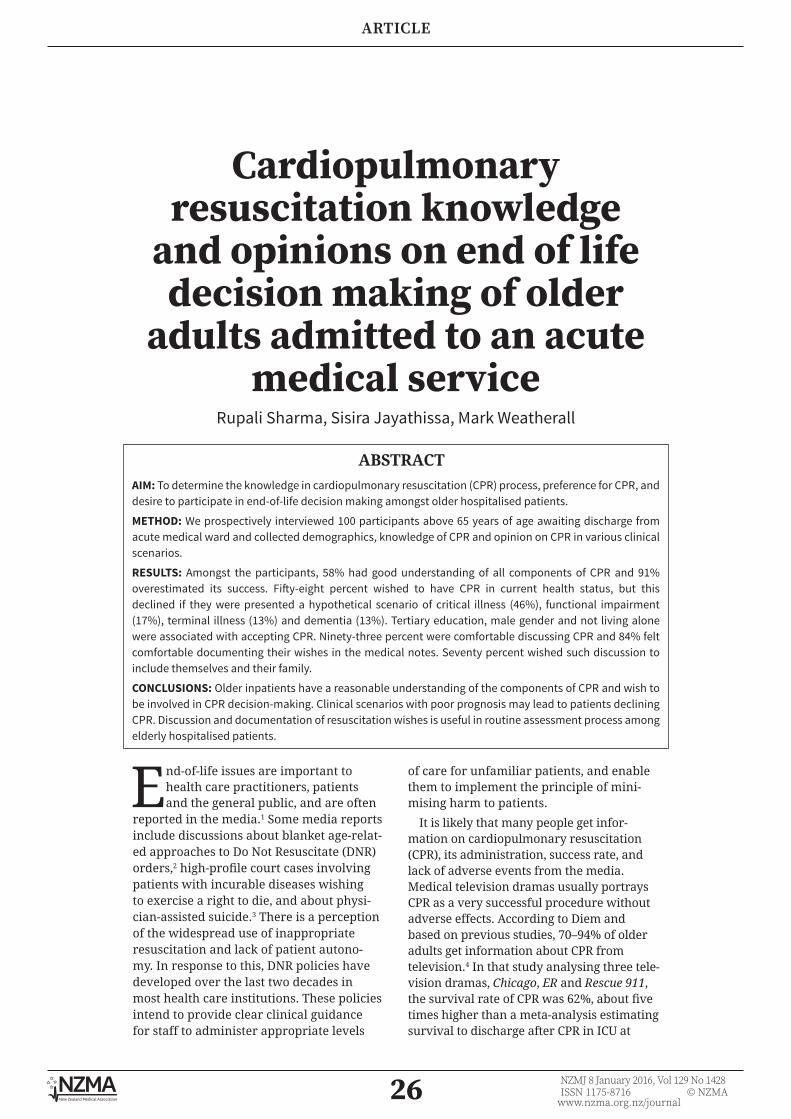
Cardiopulmonary resuscitation knowledge
and opinions on end of life decision making of older
adults admitted to an acute medical service
Rupali Sharma, Sisira Jayathissa, Mark Weatherall
ABSTRACTAIM: To determine the knowledge in cardiopulmonary resuscitation (CPR) process, preference for CPR, and desire to participate in end-of-life decision making amongst older hospitalised patients.
METHOD: We prospectively interviewed 100 participants above 65 years of age awaiting discharge from acute medical ward and collected demographics, knowledge of CPR and opinion on CPR in various clinical scenarios.
RESULTS: Amongst the participants, 58% had good understanding of all components of CPR and 91% overestimated its success. Fifty-eight percent wished to have CPR in current health status, but this declined if they were presented a hypothetical scenario of critical illness (46%), functional impairment (17%), terminal illness (13%) and dementia (13%). Tertiary education, male gender and not living alone were associated with accepting CPR. Ninety-three percent were comfortable discussing CPR and 84% felt comfortable documenting their wishes in the medical notes. Seventy percent wished such discussion to include themselves and their family.
CONCLUSIONS: Older inpatients have a reasonable understanding of the components of CPR and wish to be involved in CPR decision-making. Clinical scenarios with poor prognosis may lead to patients declining CPR. Discussion and documentation of resuscitation wishes is useful in routine assessment process among elderly hospitalised patients.
End-of-life issues are important to health care practitioners, patients and the general public, and are often
reported in the media.1 Some media reports include discussions about blanket age-relat-ed approaches to Do Not Resuscitate (DNR) orders,2 high-profile court cases involving patients with incurable diseases wishing to exercise a right to die, and about physi-cian-assisted suicide.3 There is a perception of the widespread use of inappropriate resuscitation and lack of patient autono-my. In response to this, DNR policies have developed over the last two decades in most health care institutions. These policies intend to provide clear clinical guidance for staff to administer appropriate levels
of care for unfamiliar patients, and enable them to implement the principle of mini-mising harm to patients.
It is likely that many people get infor-mation on cardiopulmonary resuscitation (CPR), its administration, success rate, and lack of adverse events from the media. Medical television dramas usually portrays CPR as a very successful procedure without adverse effects. According to Diem and based on previous studies, 70–94% of older adults get information about CPR from television.4 In that study analysing three tele-vision dramas, Chicago, ER and Rescue 911, the survival rate of CPR was 62%, about five times higher than a meta-analysis estimating survival to discharge after CPR in ICU at

27 NZMJ 8 January 2016, Vol 129 No 1428ISSN 1175-8716 © NZMA
www.nzma.org.nz/journal
ARTICLE
13%.5 The general public may not know that in some groups of patients CPR is completely ineffective. In a prospective cohort study of 294 patients who were resuscitated in a teaching hospital after cardiac arrest, a number of factors predicted increased mortality after CPR.6 These included pneu-monia, hypotension, renal failure, cancer, and a homebound life style before hospital-isation. None of 58 patients with pneumonia, or 179 patients for whom resuscitation took longer than 30 minutes, survived to be discharged from hospital.7
Patient and community attitudes and knowledge about CPR may change over time. O’Keeffe and colleagues conducted a study in 1992 in an Irish hospital and observed that 39% of patients felt it was a good idea for doctors to discuss CPR.8 However, in their current health, 76% would refuse CPR. Subsequently, Cotter and colleagues reported a 15-year follow-up study in 2007, which found that most hospi-talised patients (94%) felt it was a good idea for doctors to discuss CPR routinely with patients.9 In their current health, 6% of the 2007 cohort would refuse CPR.
The ability to gain informed consent from older, unwell adults can be challenging for health professionals. This poses an ethical dilemma between autonomy and the principles of ‘do no harm’. Russell and colleagues report about provision of infor-mation of CPR amongst older inpatients and assessing their ability to make a decision.10 One hundred consecutive patients admitted to an assessment and rehabilitation unit for the elderly in Dunedin, New Zealand, were randomly allocated to receive a detailed discussion on CPR, or to act as controls. Subsequently knowledge about CPR was tested in both groups. After the interview, knowledge about CPR was significantly improved in the study group compared to the controls, indicating that careful explana-tions assist in making an informed decision. In another New Zealand study published in 1997, Watson and others studied the effect of hospital admission on decision making about CPR.11 According to this study, older adults who were admitted to hospital had the capacity to give informed consent, and with no terminal illness would like CPR performed if necessary. Patients wanted any decision to the contrary to be discussed
with them. By discharge, fewer patients wanted CPR, but more patients wanted to make decision on CPR. In a 2004 audit conducted at Hutt Hospital, Lower Hutt, New Zealand, the vast majority of DNR orders were completed several days after hospital admission, at which time only 40% of patients had capacity to be fully involved in the decision making process. On admission, 70% had capacity to be involved with the decision. Only 30% of decisions about CPR were discussed with patients, and in 80% of the time, it was discussed with families. We could not identify other New Zealand publications looking at atti-tudes towards CPR in elderly patients.
Advance care planning is gaining momentum throughout developed world. It is promoted as a way to help patients think about, talk about, and share their thoughts and wishes about their future health care and encourages documenting them. With active promotion of advance care panning, it is likely that health professionals have to get actively involved in discussing many aspects of advance care planning, including CPR. However, there is relatively insufficient information about patient attitudes towards advance care planning, especially CPR.
It is likely that attitudes to CPR in New Zealand have changed over time. The aim of this study was to determine contemporary knowledge in an older New Zealand hospi-talised patients about preferences for CPR and their wish to participate in end-of-life decision making.
MethodsWe conducted a prospective study
between April 2011 and May 2012 in the medical and cardiology wards of Hutt Hospital, a secondary-care hospital with a catchment population of around 150,000. Eligible participants were older than 65 years of age, medically stable, and waiting to be discharged after their acute admission. We excluded patients with significant cognitive impairment, delirium, severe depression, were unable to complete the survey in English, had other severe communication problems, or terminal illness receiving palliative care. We iden-tified potential participants by discussions with the admitting medical team, and an initial verbal consent was sought. Every
28 NZMJ 8 January 2016, Vol 129 No 1428ISSN 1175-8716 © NZMA
www.nzma.org.nz/journal
ARTICLE
patient underwent Folstein’s mini-mental score and we excluded patients with score below 24. The status of delirium, severe depression, communication problems and terminal illness were determined by the medical team and review of the notes.
A study questionnaire was prepared based on a literature search for published articles on CPR studies and the ques-tions used in those studies. A pilot study was conducted on 10 participants, which included 5 patients and 5 health profes-sionals, to test the adequacy of the questionnaire. The feedback from the participants was incorporated in finalising the questionnaire.
We provided an information sheet outlining the study objectives to the willing participants. After obtaining written informed consent, one of the investigators (RS) administered the study questionnaire about CPR to each patient. This ensured there was no variation in information presented to participants. Family members were encouraged to be present during the interview. The first part of the ques-tionnaire contained questions about CPR issues, which included: whether anyone has discussed cardiopulmonary resus-citation with them—if yes, who had the discussion; their preferences to receive CPR; and its success rate, as they perceived it. The success rate of survival after CPR in the hospital had 6 predetermined options: less than 1%; 1–5%; 5–10%; 10–25%; 25–50%; and 50–100%. The participants’ knowledge about CPR procedures included questions about the components of CPR, such as chest compression, placing a tube in the throat to help breathing, electrical shocks to start the heart, and giving fluids via an intravenous line. The first part of the questionnaire was followed by the provision of written information on CPR process and verbal explanation including its success rate in general (Appendix 1). The second part of the questionnaire included questions to evaluate the patient’s wishes to receive CPR in their current state of health, and their preference in four hypothetical situations: critical illness; terminal illness; severe disability; or severe dementia. Participants could have four response choices for each situation: to have CPR; not to have CPR; to allow the doctors to decide; or to allow their
relatives decide. We also asked questions about DNR orders and who should make these. The questionnaire is included in Appendix 2.
We collected data, including basic demographic information about age, sex, ethnicity, educational status, religion, and living situation. We obtained information about the presence and types of chronic diseases and participants’ functional status from the medical records.
Simple summary statistics were used to describe the participants. The proportion of participants who reported they would like CPR under the various scenarios is shown, together with exact binomial confi-dence limits. Logistic regression was used to evaluate the strength of association between participant characteristics and whether they wished CPR to be performed in their current state of health. SAS version 9.3 was used. A sample size of 100 was chosen to provide a margin of error (95% confidence interval) for a proportion of plus or minus 10%.
The study was approved by the Hutt Hospital Research Committee, including the Maori Health Unit at Hutt Hospital, as well as the Central Regional Ethics Committee; Ethics Reference CEN/11/03/009.
ResultsThe characteristics of the 100 study partic-
ipants are shown in Table 1. The mean age of participants was 81.5 years, with a range from 65 to 98 years. There were 50 men and 50 women. The majority (78%) were Christian, and 92% were New Zealand European. Forty-five percent lived alone. The median Charlson Comorbidity index score was 5.Twenty-three percent of partici-pants had tertiary education.
Resuscitation preferences in participants’ current state of health, and the four hypo-thetical situations following provision of information on CPR, are shown in Table 2. Fifty-eight percent wanted resuscitation at current state of health. This proportion declined progressively with critical illness (48%), functional impairment (17%), to terminal illness and cognitive impairment (13% each).
Thirty-two participants reported that they had previous discussions on resuscitation;

29 NZMJ 8 January 2016, Vol 129 No 1428ISSN 1175-8716 © NZMA
www.nzma.org.nz/journal
ARTICLE
Table 1: Description of participants.
Descriptor N/100 (%)
Age (years)
65–74 44 (44)
75–84 35 (35)
85+ 21 (21)
Female Sex 50 (50)
Religion
Christian 78 (78)
Other 4 (4)
No belief 18 (18)
Education level
Primary 10 (10)
Secondary 67 (67)
Tertiary 23 (23)
Ethnicity
New Zealand European 92 (92)
New Zealand Māori 6 (6)
Living arrangement
Alone 45 (45)
With a partner 39 (39)
With family 11 (11)
Rest home 5 (5)
Other continuous variables Median (Range)
Charlson Score 5 (4–10)
Number of Chronic conditions 4 (2–9)
Table 2: Proportion of participants who would request cardiopul-monary resuscitation by different scenarios, after provision of information on CPR.
Scenario Number seeking CPR
Percentage(95% CI)
Current Health 58/100 58 (47.7–67.8)
Critical Illness 46/100 46 (36.0–56.3)
Terminal Illness 13/100 13 (7.1–21.2)
Functional Impairment 17/100 17 (10.2–25.8)
Cognitive Impairment 13/100 13 (7.1–21.1)

30 NZMJ 8 January 2016, Vol 129 No 1428ISSN 1175-8716 © NZMA
www.nzma.org.nz/journal
ARTICLE
12 with a doctor, 11 with a family member and 9 with a nurse outside hospital. The majority of participants, (86/100) reported they understood at least part of the process of CPR. Of those who felt they understood the process, 52% were aware of all four components of the process, 6% knew about three major components, and 15% knew about chest compression. Forty-four partic-ipants estimated the success rate of CPR between 50 and 100%, 24% between 25 and 50%, 23% between 10 and 25%, and 7% between 5 and 10%. None of them scored below 5%.
Seventy-four percent of participants wanted the doctor to make the decision regarding CPR with consultation with them and their family, of which 48% preferred
the hospital doctor over their GP (26%). Nineteen percent felt that a decision on CPR should be made only by their family. Seventy percent wanted that doctor to make the decision after discussing with the family if the prognosis was poor.
Sixteen percent of participants did not want any kind of documentation about CPR, 49% wanted documentation of their CPR preferences in their medical notes, 16% in their discharge summary, 18% wanted docu-mentation in advance care plan and 22% wanted documentation in medical notes, as well as in advance care plan. Altogether, 40% considered an advance care plan.
About 62% felt that it was a good idea to discuss CPR with any patient. 7% of
Table 3: Predictors of the wish to have Cardiopulmonary Resuscitation in participant’s current state of health.
N/N (%) Odds Ratio(95% CI)
Desires CPR versusNot or Unsure
Univariate Multivariate
Age 65–74 75–84 85+ Per decade older
26/44(59)
20/35(57)
12/21(57)
0.96(0.57–1.60)P=0.86
1.34(0.71–2.53)P=0.37
Education Primary Secondary Tertiary Per level of education higher
3/10(30)
35/67(52)
20/23(87)
4.22(1.73–10.3)P=0.002
4.03(1.57–10.3)P=0.004
Ethnicity New Zealand European
Other New Zealand European versus Other
52/92(57)
6/8(75)
0.43(0.08–2.26)P=0.32
0.20(0.03–1.28)P=0.09
Living situation Alone Other Living alone versus other
23/45(51)
35/55(63)
0.60(0.27–1.33)P=0.21
0.66(0.26–1.66)P=0.37
Religious belief Christian or other None Christian/other belief versus None
47/82(57)
11/18(61)
0.85(0.30–2.43)P=0.77
0.72(0.22–1.36)P=0.59
Sex Male Female Male versus Female
34/50(68)
24/50(48)
2.30(1.02–5.18)P=0.044
1.87(0.75–4.65)P=0.18

31 NZMJ 8 January 2016, Vol 129 No 1428ISSN 1175-8716 © NZMA
www.nzma.org.nz/journal
ARTICLE
the patients felt uncomfortable with the interview and reported feeling distressed with the discussion of CPR. Associations with preference for CPR in the participants’ current state of health are shown in Table 3. In univariate analysis, a higher level of education and being of male sex predicted the wish to have CPR. Age, ethnicity, living alone or religious beliefs were not associated with the wish for CPR. On multi-variate regression, only a higher level of education was associated with the wish to receive CPR.
Discussion The knowledge regarding CPR process has
improved in general amongst the elderly population (86% in this study) compared to that in a 1997 New Zealand-based study (53%).11 Over recent years, there has been an increase in openness about the discussion of resuscitation issues by doctors with their patients. Despite this, our study shows that CPR was discussed with them by medical or nursing staff in 21% of the patients, while 11% of patients had discussions of CPR with a family member. This is in spite of nearly three-quarter of patients keen to make some form of decision regarding their CPR status. Sensi-tivities around dying and unavailability of time may have been a contributing factor preventing such discussions. However, we did not specifically focus on this issue in our study, and this theme could be explored in further studies.
Overestimation of the success rate of CPR prevailed amongst the elderly patients, as shown in other studies. The majority of the participants in the 1997 New Zealand study11
estimated success rate as over 50%, whereas in this study 91% estimated the success rate as ranging between 10%–100%, which is unrealistic in our population. Only half of the patients understood all 4 components of CPR. It is possible that patients may have a simplistic attitude, that CPR could ‘start the system again’, as seen on television. Even though our classification of 4 components of CPR is arbitrary, we feel it is important for patients to be fully informed by clinicians about the whole process of CPR in making CPR decisions and in advance care planning.
The preference for CPR was generally high in all age groups considering their current
state of health. However, once they were educated about the CPR, their likelihood of wishing resuscitation declined from critical illness through terminal illness or severe physical disability to dementia. The pref-erence for CPR in current status of health was low (58%) compared to the previous 1997 New Zealand study11 (79%) and an Irish study9 (81%) in 2007. In all four clinical scenarios, New Zealand participants had a lower preference rate compared to Irish participants—critical illness (46% vs 55%), terminal illness (13% vs 37%), functional impairment (17% vs 35%), dementia (13% vs 25%). The reasons behind these differences are unclear, but could be due to cultural, spiritual, educational and/or religious factors. This finding also suggest informed elderly New Zealand patients make rational decisions about their options on CPR.
Our study showed that the majority of older people desire themselves or their family to be involved in decision making in relation to CPR. In the event that they were not in a state to make a decision, they wanted the doctor to make the decision in consultation with their family. In New Zealand, the decision to resuscitate is treated as a medical responsibility like any other treatments, but shared decision making could always reduce potential conflicts. Older patients appeared to appre-ciate the importance of documenting their wishes in any form, either in their medical notes, discharge summary, or in an advance care plan. This reflects an increasing awareness of CPR issues and understanding the value in documenting their wishes, especially with advance care planning in the community.
Older adults in general were very open about discussing CPR and felt very comfortable with the discussion. This corre-sponds with the findings of other studies. However, there was a small minority of patients who felt very distressed by the discussion. Clinicians should be mindful about these patient’s sensitivities when entering into such discussions.
We found no association between older age, religion, or comorbid illnesses, and preference for CPR. However, those who are less likely to refuse CPR are male, educated and not living alone. This is in contrast to the Irish study, where those with disability,
32 NZMJ 8 January 2016, Vol 129 No 1428ISSN 1175-8716 © NZMA
www.nzma.org.nz/journal
ARTICLE
or those with religion (other than Cathol-icism) wished not to have CPR.9 Although in our study there was trend for more educated subjects to be less likely to refuse CPR, we were not able to explain the reason behind higher education having a positive influence on the patient’s desire for CPR. It is possible that as education provides a positive outlook, people are ready to take on the small chance of success. Interestingly in the 1997 New Zealand study, those who did not want CPR tended to be single, older, living alone or in care, and be female.11 This difference could not be explained rationally.
There were several limitations to our study. Different ethnic groups were poorly represented, and as a result comparisons could not be made between ethnic groups in terms of CPR preferences. This is partly because very few adults above the age of 65 years were Māori or Pacific Islanders or from other ethnic communities and met the inclusion criteria for the study. This study was also conducted in a group of relatively well inpatients and may not accurately reflect the opinion of patients in their sick-dependent state. The study topic is sensitive and recruitment was unexpectedly difficult for the study, and patients who volunteered may have been more comfortable in discussing the CPR.
We obtained perceived success rates of CPR only before providing information on CPR and repeating the success rate may have influenced the patient’s knowledge of success. The same interviewer interviewed all the participants, thus reducing incon-sistency around the interview process. It would be useful to repeat this study in a wider range of ethnic and cultural groups.
In spite of the limitations, our study provides useful information on contem-porary thinking of CPR among older New Zealand adults and gives some useful guidance to health professional about the expectations on shared decision making.
ConclusionIn summary, this study shows that a
substantial number of older adult patients would like CPR. However, this declines with the severity of the illness in our hypothetical scenarios. A more systematic approach to the provision of information and discussion of CPR, and advance care planning in the wider community as well as in hospital settings, is likely to promote better decision making for patients and health professionals. Further research in this area may help in the development of sound advance care planning strategies.
Appendix 1Information on Cardio Pulmonary Resuscitation (CPR) to patients
We have compiled the following information to give you some background knowledge on Cardio Pulmonary Resuscitation.
Cardio Pulmonary Resuscitation (CPR) is performed when a person’s heart or lungs stop working suddenly. The circulation is kept going by pressing up and down on the chest. In order to get air into the lungs, mouth to mouth breathing or a tube is inserted into the throat. Electrical shocks are often used to restart the heart. Some patients come around immediately, but others may need to spend some time on a ventilator - a machine to help keep the person breathing. Most patients will need a drip to give fluids into the veins and most will spend some time in the intensive care or coronary care unit.
Some of the patients who initially are kept alive by resuscitation efforts may die before they can be discharged. Chances of death are higher if the patient has significant medical problems such as heart failure, kidney failure, chronic lung disease, or terminal illness. Some may develop brain damage which could be permanent. Few could recover and go home if resuscitation was successful.
Various studies on survival after in-hospital CPR have showed overall likelihood of surviving discharge as 1 in 8 (13%) for patients who undergo CPR and 1 in 3 (33%) for patients who survive CPR. However in patients with multiple medical problems, survival may be close to zero.
In one study of 294 patients who underwent CPR, none of the 58 patients with pneumonia and none of the 179 patients in whom resuscitation took longer than 30 minutes survived to be discharged.

33 NZMJ 8 January 2016, Vol 129 No 1428ISSN 1175-8716 © NZMA
www.nzma.org.nz/journal
ARTICLE
Appendix 2Date: 29 March 2011, version 2.
QuestionnairePatients’ understanding of resuscitation process and views on end of life decision makingThank you very much for answering the questionnaire. You may discuss with your friends / family members / whanau before answering any question. Please feel free to discuss with the Study doctor if you have any questions to clarify or if you have any concerns.
Part A: General informationPlease tick the boxes that apply to you.1. Which age group do you belong to?o 65–74 yearso 75–84 yearso 84 years and above2. What is your gender?o Maleo Female3. Which ethnic group(s) do you identify yourself with?oNZ MaorioNZ EuropeanoPacific Islands (Fijian, Nieuean, Tongan, Cook Islands, Tokelauan, Samoan, other)o ChineseoSoutheast AsianoIndianoMiddle Easterno Africano Others (specify your ethnicity)4. What is your religious belief?o Christianity (you could define branch of Christianity you follow if you wish)………………..o Islamo Jewisho Hinduismo BuddhismoNo religious beliefo Others (please specify)5. What is your highest educational qualification?o Primary schoolo Secondary Schoolo Tertiary Technical College or University
6. What is your living situation?o With Partnero Aloneo With other family member(s)o Other arrangements (Rest Home, Hospital level care)7. Has anyone discussed Cardio Pulmonary Resuscitation (CPR) status with you before?o Yeso No8. If you had previous discussions on Cardio-Pulmonary Resuscitation (CPR), with whom did you discuss it?o Medical doctor at Hutt Hospitalo Your own General Practitioner (GP)o Nurse or another health professional at Hutt Hospitalo Nurse or another health professional outside Hutt Hospitalo Member of your familyo Not applicable9. Do you understand what is meant by Cardio-Pulmonary Resuscitation (CPR)?o Yeso No10. In your opinion, which of the following may be carried out during Cardio Pulmonary Resuscitation (CPR)?o Chest compression to pump bloodo Placing a tube in the throat to help breathingo Giving electrical shocks to start the hearto Giving fluids by a drip to the veins to maintain circulationo All of the above

34 NZMJ 8 January 2016, Vol 129 No 1428ISSN 1175-8716 © NZMA
www.nzma.org.nz/journal
ARTICLE
11. In your opinion what is the chance of surviving after Cardio-Pulmonary Resus-citation (CPR) performed in Hospital?o Less than 1%o 1–5%o 5–10%o 10–25%o 25–50%o 50–100%
Part B: Information on CPR provided 12. Given your current health status what is your preference on Cardio Pulmonary Resuscitation (CPR)?o I would wish to receive CPR.o I would wish not to receive CPR.o I am not sure.13. Please consider the scenarios outlined below and for each scenario please choose any one of the 4 options listed below?Scenario 1: If you had a critical illness (ie, requiring hospital admission and treatment with drips where the outcome may be unclear) Options:o I wish to have Cardio-Pulmonary Resuscitation.o I do not wish to have Cardio- Pulmonary Resuscitation.o I wish my doctor to decide on Cardio-Pulmonary Resuscitation.o I wish my relatives to decide on Cardio-Pulmonary Resuscitation.Scenario 2: If you had a terminal illness (eg, Cancer, where you are likely to die within 6 months regardless of any treatment) Options:o I wish to have Cardio-Pulmonary Resuscitation.o I do not wish to have Cardio- Pulmonary Resuscitation.o I wish my doctor to decide on Cardio-Pulmonary Resuscitation.o I wish my relatives to decide on Cardio-Pulmonary Resuscitation.Scenario 3: If you had a severe physical disability like a stroke (ie, requiring assis-tance with mobility, feeding, transfers, toileting etc…)
Options:o I wish to have Cardio-Pulmonary Resuscitation.o I do not wish to have Cardio- Pulmonary Resuscitation.o I wish my doctor to decide on Cardio-Pulmonary Resuscitation.o I wish my relatives to decide on Cardio-Pulmonary Resuscitation.Scenario 4: If you had severe dementia but were otherwise in good physical health (i.e. severe, irreversible confusion and memory loss, but otherwise in good health) Options:o I wish to have Cardio-Pulmonary Resuscitation.o I do not wish to have Cardio- Pulmonary Resuscitation.o I wish my doctor to decide on Cardio-Pulmonary Resuscitation.o I wish my relatives to decide on Cardio-Pulmonary Resuscitation.14. What are your thoughts on doctor making Do Not Resuscitate (DNR) deci-sions in consultation with your family/partner?o Resuscitation decisions should be done by my family doctor when I am in good health, considering all aspects of my health.o Resuscitation decisions should be done by the hospital doctor as they know my health status best if I am very unwell.o My family would make a better decision than my doctor because they are better informed about my health and life.o It is a sensitive topic and I feel uncomfortable discussing it with my family or doctors.15. Do you think your doctor should be able to make a decision regarding Cardio Pulmonary Resuscitation (CPR) without consulting you or your family if they thought the outcome was likely to be very poor? o I think my doctor should make the decision without consulting me or my family.o I think my doctor should make the decision in consultation with me or my family.

35 NZMJ 8 January 2016, Vol 129 No 1428ISSN 1175-8716 © NZMA
www.nzma.org.nz/journal
ARTICLE
o I think my family should make the decision.o I am not sure.o Any other comments.16. When a decision to Do Not Resuscitate (DNR) is made, it is routinely docu-mented in your medical notes. What are your thoughts on this?o I would like my DNR status documented in the medical notes. o I do not feel comfortable about my DNR status documented in clinical notes.o I would like my DNR status documented in my discharge summary, so my General Practitioner (GP) is aware of the decision.o I would like to have a documented advanced care plan, so my medical details and expectations are well documented for anyone looking after me.o Any other comments
17. What are your thoughts about doctors discussing Cardio–Pulmonary Resusci-tation (CPR) with every patient admitted to the hospital?o I think discussing CPR with every patient on admission is a good idea.o I think discussing CPR with every patient on admission is a waste of time.o I think this is a sensitive area and could cause distress to the patient. o Discussing CPR could negatively affect patient’s health.18. Have you found this discussion upsetting or distressing?o Yeso Noo Any other comments19. What are your thoughts on Cardio Pulmonary Resuscitation (CPR) in general?
Competing interests: NilAuthor information:
Rupali Sharma, Internal Medicine, Wellington Hospital; Sisira Jayathissa, Medicine, Hutt Valley DHB; Mark Weatherall, Medicine, University of Otago Wellington
Corresponding author: Rupali Sharma, Internal Medicine, Wellington Hospital
www.nzma.org.nz/journal/read-the-journal/all-issues/2010-2019/2016/vol-129-no-1428-8-january-2016/6781

36 NZMJ 8 January 2016, Vol 129 No 1428ISSN 1175-8716 © NZMA
www.nzma.org.nz/journal
ARTICLE
REFERENCES:1. English V, Mussell R,
Sheather J, Sommerville A. Ethics briefings. Journal of Medical Ethics 2004;30:605-606.
2. Ebrahim S. Do not resuscitate decisions: flogging dead horses or a dignified death? Resuscitation should not be withheld from elderly people without discussion. British Medical Journal 2000;320:1155-1156.
3. Steinbock B. The case for physician assisted suicide: not (yet) proven; Journal of Medical Ethics 2005;31:235-241.
4. Diem SJ, Lantos JD, Tulsky JA. Cardiopulmonary resuscitation on television. Miracles and misinforma-tion. The New England Journal of Medicine 1996;334:1578-82.
5. Myrianthefs P, Kalafati M, Lemonidou C, et al. Efficacy of CPR in a General Adult ICU. Resuscitation 2003;57:43-8.
6. Ebell MH, Becker LA, Barry HC, Hagen M. Survival after in – hospital cardiopulmonary resus-citation: A meta- analysis. Journal of General Internal Medicine 1998;13:805-16.
7. Susanna E, Bedell M, Delbanco TL, Cook F, Franklin H, Epstein FH. Survival after Cardiopul-monary Resuscitation in the Hospital. The New England Journal of Medi-cine 1983;309:569-576.
8. O’Keeffe ST, Noel J, Lavan JN. Cardiopul-monary resuscitation preferences in the elderly. European Journal of Medicine 1993;2:33-5.
9. Cotter PE, Simon M, Quinn C, O’Keeffe ST. Changing attitudes to cardiopul-monary resuscitation in older people: a 15 - year follow-up study. Age and Ageing 2009;38:200-205.
10. Russell RJ, Campbell AJ, Allison GM, Cara-doc-Davies TH, Busby WJ. Informed consent for cardiopulmonary resuscitation in elderly patients. The New Zealand Journal of Medicine 1991;104:312-3.
11. Watson DR, Wilkinson TJ, Sainsbury R, Kidd JE. The effect of hospital admission on the opin-ions and knowledge of elderly patients regard-ing cardiopulmonary resuscitation: Age and Ageing 1997;26:429-34.
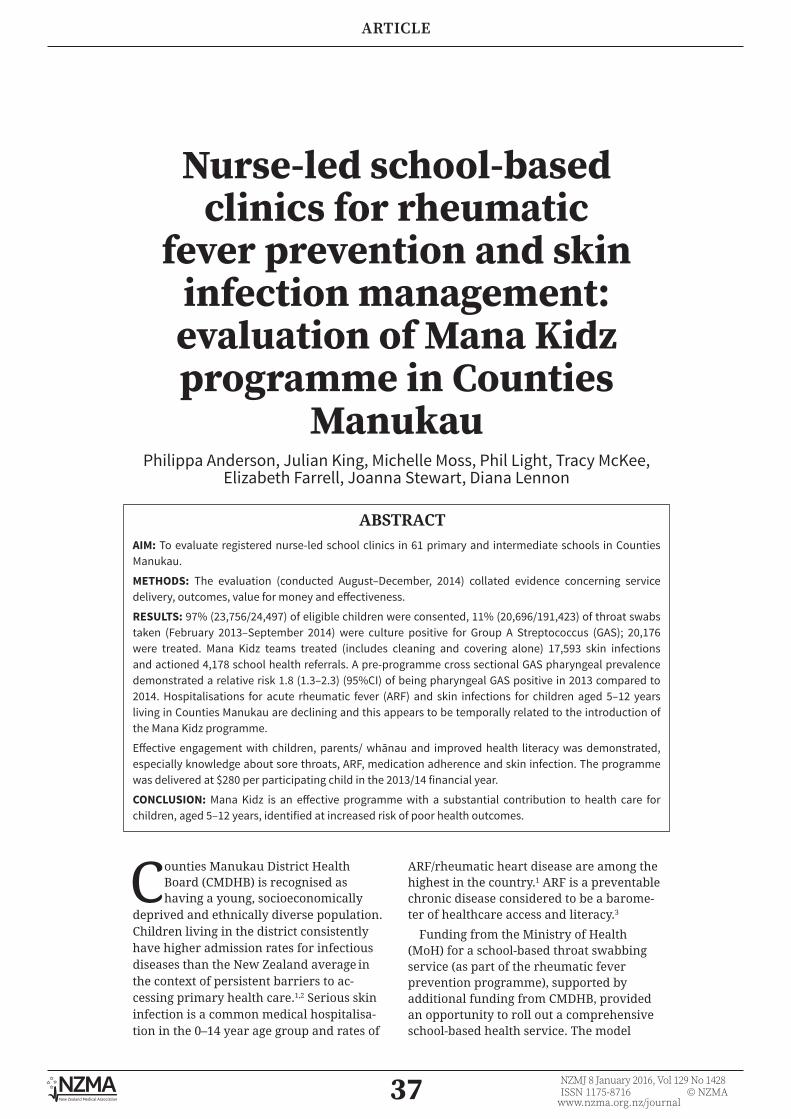
37 NZMJ 8 January 2016, Vol 129 No 1428ISSN 1175-8716 © NZMA
www.nzma.org.nz/journal
ARTICLE
Nurse-led school-based clinics for rheumatic
fever prevention and skin infection management: evaluation of Mana Kidz programme in Counties
ManukauPhilippa Anderson, Julian King, Michelle Moss, Phil Light, Tracy McKee,
Elizabeth Farrell, Joanna Stewart, Diana Lennon
ABSTRACTAIM: To evaluate registered nurse-led school clinics in 61 primary and intermediate schools in Counties Manukau.
METHODS: The evaluation (conducted August–December, 2014) collated evidence concerning service delivery, outcomes, value for money and effectiveness.
RESULTS: 97% (23,756/24,497) of eligible children were consented, 11% (20,696/191,423) of throat swabs taken (February 2013–September 2014) were culture positive for Group A Streptococcus (GAS); 20,176 were treated. Mana Kidz teams treated (includes cleaning and covering alone) 17,593 skin infections and actioned 4,178 school health referrals. A pre-programme cross sectional GAS pharyngeal prevalence demonstrated a relative risk 1.8 (1.3–2.3) (95%CI) of being pharyngeal GAS positive in 2013 compared to 2014. Hospitalisations for acute rheumatic fever (ARF) and skin infections for children aged 5–12 years living in Counties Manukau are declining and this appears to be temporally related to the introduction of the Mana Kidz programme.
Effective engagement with children, parents/ whānau and improved health literacy was demonstrated, especially knowledge about sore throats, ARF, medication adherence and skin infection. The programme was delivered at $280 per participating child in the 2013/14 financial year.
CONCLUSION: Mana Kidz is an effective programme with a substantial contribution to health care for children, aged 5–12 years, identified at increased risk of poor health outcomes.
Counties Manukau District Health Board (CMDHB) is recognised as having a young, socioeconomically
deprived and ethnically diverse population. Children living in the district consistently have higher admission rates for infectious diseases than the New Zealand average in the context of persistent barriers to ac-cessing primary health care.1,2 Serious skin infection is a common medical hospitalisa-tion in the 0–14 year age group and rates of
ARF/rheumatic heart disease are among the highest in the country.1 ARF is a preventable chronic disease considered to be a barome-ter of healthcare access and literacy.3
Funding from the Ministry of Health (MoH) for a school-based throat swabbing service (as part of the rheumatic fever prevention programme), supported by additional funding from CMDHB, provided an opportunity to roll out a comprehensive school-based health service. The model

38 NZMJ 8 January 2016, Vol 129 No 1428ISSN 1175-8716 © NZMA
www.nzma.org.nz/journal
ARTICLE
built on the lessons learnt from a previous randomised control trial4 and a pilot study was undertaken in a decile 1 South Auckland school in 2011.5
The programme, named “Mana Kidz”, is an example of a multi-provider collabo-rative approach to service delivery being delivered by a network of 12 providers, including Public Health Nurses (PHN), Primary Health Organisations (PHOs) and Non-Government Organisations (NGOs).
The Mana Kidz model was implemented over 6 months from September 2012. Priority schools were identified through the devel-opment of a school scoring system using four risk factors for ARF.6 Mana Kidz is now oper-ating in 61 schools (including 89% of decile 1 primary and intermediate schools in Counties Manukau), reaching approximately 24,000 children, of whom approximately 50% are Pacific and 39% Māori.7
Mana Kidz provides a team of one registered nurse and a whānau support worker (WSW), who are based in school during term time. The service includes daily assessment and treatment of sore throats and skin infections. In addition, other health care needs can be addressed effectively, eg, hearing and vision and child protection issues. The model also provides the opportunity for wider family/whānau to be assessed. A manual of operations is used by all providers and standing orders are in place for the registered nurses for treatment of defined conditions by a dele-gated authority.
The programme evaluation in 2014 was led by the Kinnect Group with CMDHB, National Hauora Coalition, and University of Auckland providing support to the external evaluation team.
MethodsAn evaluation framework was developed
with explicit evaluative criteria. The eval-uative criteria were addressed through the collection of evidence from a range of sources, including quantitative indicators such as performance monitoring data, research study data, hospitalisation data as well as qualitative data from surveys and focus groups.
Cross-sectional studies of pharyngeal GAS and a skin infection census, as part
of studies funded by the HRC Partnership Programme, have been performed annually in a subset of the school programme. For pharyngeal GAS burden, a multi-variable analysis of changes from (pre-programme) May 2013 (n=1,299) to May 2014 (n=1,751) in Counties Manukau was performed.8
Hospitalisation data were extracted from the encrypted National Minimum Dataset for people domiciled in Counties Manukau. The definition used to identify incident ARF cases was consistent with the Ministry of Health’s algorithm and included ICD 10 code I00–I02, primary diagnosis only and excludes any admissions where that person has been admitted with any acute rheu-matic fever or chronic rheumatic heart disease diagnosis from July 1989.9 The codes used to define skin infections (primary diag-nosis only) were as defined by O’Sullivan.10
To gauge their understanding of key health concepts, students and parents of students were surveyed across three schools in Manurewa at two time points; prior to the programme starting in May 2013 and then again in May 2014. There were 439 parents who responded to the May 2013 parent survey. In 2014, a total of 235 parents responded.
Students were asked to complete a 10-item questionnaire. In 2013, the 457 student questionnaires were completed by students aged between 7–13 years and in 2014, 608 students completed the same questionnaire. In order to make the age distribution of the sample comparable, the results from the students aged 8–12 years were compared.
Six family/whānau focus groups were undertaken across six schools. In total, 34 mothers and grandmothers took part. Fifty-three percent identified as Pasifika, 35% as Māori, and 12% as New Zealand Pākehā, English or European. Participating schools were selected to ensure a range of clinic performance were included: three where the programme is working well; two where the programme was facing challenges; and one somewhere in the middle.
In addition, stakeholder interviews were undertaken. Stakeholders identified included: provider management represen-tatives (‘provider’); nurses and WSW (‘Mana Kidz staff’); and staff from six partici-

39 NZMJ 8 January 2016, Vol 129 No 1428ISSN 1175-8716 © NZMA
www.nzma.org.nz/journal
ARTICLE
pating schools (‘school staff’). In total, 36 stakeholders took part (18 school staff, 11 providers, and 7 Mana Kidz staff).
ResultsAt the time of the evaluation, Mana
Kidz was operating in 61 schools in CMDHB. As at September 2014, 97% of all eligible children were consented into the programme (23,756 children).
Between February 2013 and September 2014, the programme completed 191,423 throat swabs, of which 20,696 (10.8%) tested
positive for Group A Streptococcus (GAS) and 20,176 were treated. Over time the number of GAS positive swabs remained similar (Figure 1), but the percentage of GAS positive swabs decreased (Figure 2).
In 2013, 23,318 possible skin infection presentations were assessed. Of these, 6,774 skin infections were treated (the vast majority with topical cleaning and covering; if antibiotics were needed, fusidic acid (Foban) or, more rarely, cephalexin or flucloxicillin were used). In 2014, for the first 9 months to 30 September, a total of 10,823 skin infections were treated.
Figure 1: Number of throat swabs returning positive result for GAS—Feb 2013 to September 2014 (school children only).
Figure 2: Percentage of throat swabs GAS+ by month.

40 NZMJ 8 January 2016, Vol 129 No 1428ISSN 1175-8716 © NZMA
www.nzma.org.nz/journal
ARTICLE
Figure 3: ARF Hospitalisation rate, by financial year, for CMDHB residents, by age.
Source: NMDS extracted CMDHB. ARF ICD code I00–I02. Primary diagnosis of ARF. Excludes any admissions where that person has been admitted with any ARF or chronic RHD diagnosis from July 1989. Denominators: Statistics New Zealand projected population updated 2013 (based on 2006 census).
Figure 4: ARF Hospitalisation rate for CMDHB residents, 5–12 years, by ethnicity.
Source: Numerator: NMDS extracted CM Health. ARF ICD code I00–I02. Primary diagnosis of ARF. Excludes any admissions where that person has been admitted with any ARF or chronic RHD diagnosis from July 1989. Denominators: Statistics New Zealand projected population updated 2013 (based on 2006 census).
In 2013, the teams received 2,700 child health referrals for conditions or issues other than skin infections and sore throats, and actioned ~1,500 of them. In 2014, for the first 9 months to 30 September, a total of 2,651 referrals were received and 2,130 actioned.
Analysis of the first two years’ data from the ongoing cross-sectional prevalence study was performed to account for school
clustering, and for age and gender differ-ences. There was evidence of a difference in the rates of pharyngeal GAS between 2013 and 2014 (p=0.01) with the adjusted estimates of rates of 26% (95%CI 20–34%) and 14% (11–18%) for 2013 and 2014 respectively.
The cross-sectional skin prevalence study did not show any difference in rates of skin

41 NZMJ 8 January 2016, Vol 129 No 1428ISSN 1175-8716 © NZMA
www.nzma.org.nz/journal
ARTICLE
Figure 5: Hospitalisation rate for skin infection 5–12 years, CMDHB residents, by ethnicity.
Source: National Minimum Data Set. Denominator: Statistics NZ population projections 2013 (based on 2006 census.) O’Sullivan and Baker ICD codes used to define skin infection. Primary diagnosis only.
infection between 2013 and 2014 (p=0.4).11 Although there was a raw 28% reduction, the effect was not consistent across the three schools and when the school effect was incorporated, a difference could not be demonstrated. The adjusted estimates of rates were 19% (95%CI 10%–39%) and 14% (7%–29%) for 2013 and 2014 respectively. The relative risk (95%CI) of having a skin infection in 2013 compared to 2014 was 1.4 (0.7–2.7).
Hospital admission rates for ARF, by age, are shown in Figure 3, and by ethnicity for the 5–12-year-old age group in Figure 4. Hospital admission rates for skin infections, by ethnicity for the 5–12 year old age group are shown in Figure 5. These data are for all children living in Counties Manukau, regardless of where they were diagnosed and treated for ARF or skin infection, or attending a Mana Kidz school.
Qualitative findingsBased on survey and focus group findings,
families knew about the school clinics, how to access services, and saw the services as worthwhile and valuable. Teams were reported to be culturally competent, have positive, trusting relationships with children, families and schools, and effective in engaging with children, parents/whānau.
Key health information was delivered to parents/whānau and children in a range of ways, and schools reported collabo-rating with Mana Kidz teams to promote knowledge and awareness. However, oppor-
tunities were identified to better integrate Mana Kidz within existing whole-school approaches to health promotion. Almost all Mana Kidz staff indicated a desire to undertake more health promotion, but indi-cated resource constraints as key barrier.
Health literacy of children and parents/whānau was found to be improving in Mana Kidz schools on the basis of repeated survey results. The percentage of parents who had heard of ARF or RHD increased from 71% in 2013 to 89% in 2014. In 2014, 56% of parents indicated that they had learned anything new about sore throats or skin infections in the past year. Free-text responses predomi-nantly mentioned learning that sore throats can lead to ARF and the seriousness of this (55% of those who indicated they had learned anything new).
Mana Kidz providers were reported by key stakeholders to be working in partnership with school staff, special education needs coordinators and/or social workers in schools. Focus group feedback also suggested that the programme had increased access to social support services, as nurses refer family/whānau for further assistance (eg, home insulation, nutrition, immunisation, mental health and other needs). Cases of children disclosing abuse to Mana Kidz staff have reportedly been high (numbers were not available). Feedback suggests that the daily presence of Mana Kidz staff in the schools, and the regular contact that children have with them, means that strong and trusting relation-ships develop.
42 NZMJ 8 January 2016, Vol 129 No 1428ISSN 1175-8716 © NZMA
www.nzma.org.nz/journal
ARTICLE
Focus groups also indicated that parents are now more likely to present to a GP or school health team, where appropriate, for sore throats and skin infections. Key stakeholders reported that there was an increase in unmet needs being identified in school clinics (eg, cellulitis, scabies, noti-fications of abuse, oral health, head lice, housing needs, nutrition, mental health and other needs). All stakeholders noted that access to primary care is challenging for families. Focus groups and key stakeholder interviews found that Mana Kidz provided an opportunity for children to engage with primary health care during school hours, which they may not otherwise have had. Overall feedback suggests there is scope for Mana Kidz teams to be increasing referrals to primary care to address unmet needs.
Sometimes we overlook that children can’t access primary care... it has to be with an adult. This way we are accessing the children that aren’t accessing healthcare. (Provider)
It’s all about removing the barriers, they [Mana Kidz staff] don’t say they can’t do things. They are very flexible – will make the situation work for our Pasifika and Māori families. (School staff)
The vast majority of school staff, as well as Mana Kidz staff, reported that chil-dren’s skin conditions have improved vastly since the start of the programme. Key stakeholders reported skin abrasions and infections are dealt with early, and that children look healthier. Impetigo and scabies, which were commonplace in most of the schools prior to the programme, are reported by school staff members to have vastly reduced.
You can see difference in children’s health. Skin infections used to get so bad that kids were not able to walk. That way it was obvious. We do not see this anymore. (School staff)
FundingThe Mana Kidz programme is funded from
a variety of sources, including Ministry of Health, CMDHB and the Middlemore Foun-dation for Health Innovation. The overall total cost of the programme was approxi-mately $6.7 million for the 2013/14 financial
year, which equates to $280 per participating child, per year.
Investment in the programme has been at 58% of the rate initially estimated to implement the service model originally piloted at Wiri Central School, resulting in a lower staffing ratio.5 Further, Mana Kidz has a wider scope of responsibilities and expe-rienced higher than expected incidence of GAS throat infection and skin infections.
DiscussionThis evaluation was undertaken to
inform decision makers about the value (or otherwise) of delivering targeted primary care services in a school-based setting for primary and intermediate-aged children. The programme’s level of participation and uptake of treatment is exceptionally high, reflecting the lack of access to adequate health care for this group, and the unmet need for earlier, more accessible care.
The output of the school teams, in terms of volume of assessments, is high. Unfor-tunately, the ability to assess the impact of the school-based programme on key health outcomes was limited by the timing of the evaluation. It is early in the programme to be assessing changes in the prevalence of Group A streptococcal pharyngitis and skin infections, and too soon to expect a statisti-cally supportable reduction in ARF and skin infection hospitalisations for the schools where the programme has been imple-mented though trends to date are suggestive of success.
Early indications from an on-going, cross-sectional study showed a marked statistically significant reduction in pharyngeal GAS burden.8 While there is no published literature paralleling pharyngeal GAS prevalence reduction with an ARF drop, it is expected that as the prevalence of pharyngeal GAS infection decreases, a reduction in hospitalisations for ARF should eventually be achieved.12,13
A parallel reduction in the percentage of positive GAS throat swabs taken in the Mana Kidz programme lends some support to a possible interpretation that Mana Kidz contributed to a reduction in the GAS load within its target population from 2013 to 2014. However, this is not certain given the total positive swab numbers have remained
43 NZMJ 8 January 2016, Vol 129 No 1428ISSN 1175-8716 © NZMA
www.nzma.org.nz/journal
ARTICLE
the same, while the total number of swabs has increased. The number of throat swabs taken is dependent on many factors, such as presentation of sore throats for swabbing, circulating strains, school factors and season.
ARF, in the 5–14-year-old age group, was increasing before the start of school programmes.14 The district-level data presented provides some ecological evidence that rates of ARF have fallen in recent years, but due to the small numbers, it is too soon to know whether this represents a real decrease or a small number variation. While the data is limited by small numbers, it appears the decrease in the 5–12 year olds is driven by a reduction in cases for Māori children, while the rates for Pacific children remain similar to preceding years in the data available to inform the evaluation. However, the latest data point, for the financial year 2014/15, shows the rate of ARF for Pacific children is lower than the preceding years (Appendix). An HRC-funded study will assess the impact of Mana Kidz on ARF rates in the school programme using Auckland Regional Rheumatic Fever Register Data15 with 88,880 person years pre the school clinic intervention, and 79,200 post intervention, allowing 80% power to detect a 50% difference at the 5% level of significance in mid-2016.
Recent data provided by Auckland Regional Public Health Service (ARPHS) shows a 29% reduction in probable or confirmed cases of ARF notified to ARPHS for children living in Counties Manukau aged 5–12 years, between 2013/14 and 2014/15 financial years.16 This adds support to the reduction suggested by our data.
Skin infections were found to be a signif-icant component of the daily operation of Mana Kidz clinics, with the number and complexity of cases being greater than anticipated. Unfortunately, the detail about the type of treatment received was not readily available to inform the eval-uation, although staff were clear that the majority of children were treated with the cleaning and covering of lesions. There have been concerns raised about antibiotic stewardship17 and the proportion of skin infections treated with antibiotics is being quantified more precisely. Preliminary results from a recent audit suggest that only
4% of assessed skin infections were treated with antibiotics.18
Qualitative feedback from the broader programme is that there was an improvement seen in children’s skin conditions that temporally relates to the commencement of this programme. Although the cross-sectional prevalence study undertaken in three schools found a raw 28% reduction in skin infections, it did not show a significant reduction once the school effect was incorporated, suggesting significant school-to-school variation in the implementation of the programme.
The schools included in the cross-sec-tional study may not be representative of the other schools in the programme. A repeat cross-sectional prevalence study in May 2015 will provide useful insights into the impact on skin infections now skin infections are being identified and treated more systematically in these schools. Hospitalisations should reduce due to early detection and treatment of skin infections under the Mana Kidz programme.
The data presented shows fewer hospital-isations for Māori and Pacific children with skin infections at a district level, although it is too soon to determine if this reflects a real decrease. Again, while this apparent decrease is temporally associated with the introduction of the programme (and there were no other major primary care or health promotion initiatives underway in the district to address skin infections), attribution is always problematic. There is ongoing work being undertaken to look at the impact of Mana Kidz on skin infections hospitalisations for children in Mana Kidz schools using a pre and post-intervention design.
Feedback from parents/whānau, school staff and Mana Kidz teams consistently indicates that Mana Kidz is an important and effective programme that is making a substantial contribution to health outcomes for vulnerable children. For many low income families, who are unable to afford the costs and/or time off work to visit a GP or pick up medicines, access to primary health care at school makes a difference to their children’s health. Mana Kidz is improving awareness, knowledge and healthy behaviours in relation to sore throats and skin infections. It should be

44 NZMJ 8 January 2016, Vol 129 No 1428ISSN 1175-8716 © NZMA
www.nzma.org.nz/journal
ARTICLE
noted that the Ministry of Health launched an awareness campaign during the time this programme was being evaluated, and may have contributed to increased awareness of sore throats and rheumatic fever.
Mana Kidz teams were found to be engaging effectively with school commu-nities, including children, parents/whānau and school staff, and there are emergent indications that this is beneficial not only in terms of direct access to primary health care for immediate health issues, but also increasing children’s and families’ future propensity to access primary care services. There are high levels of stakeholder satis-faction with the programme from parents/whānau, children, teachers, provider staff and management.
It is too soon to quantify the long-term reduction in health service utilisation that might be attributable to the Mana Kidz programme. However, results from the programme to date indicate a credible
prospect that resources invested in the programme could contribute to a reduction in the long-term burden associated with preventable hospitalisations and reduced necessary health expenditure downstream. There is an opportunity for school clinic data to be collected, coded and compiled for the programme overall in order to better demonstrate the nature and extent of needs identified.
ConclusionsMana Kidz is an innovative way of deliv-
ering high-quality primary health care for targeted conditions, within high-needs communities, to overcome barriers to access for at-risk populations. Mana Kidz demon-strably contributes to reducing health disparities and improving the wellbeing of families/whānau, particularly in Māori and Pasifika communities. These children are those most likely to get ARF as well as suffer from other preventable illnesses.
Appendix Figure 6, Figure 7 and Figure 8 include data for the latest financial year (2014/2015). In
addition the denominator has been updated to reflect the estimated resident counts from the 2013 census which includes correcting the preceding years to be in line with the 2013 results.Figure 6: ARF Hospitalisation rate for CM residents, by age.
Source: NMDS extracted CMDHB. ARF ICD code I00–I02. Primary diagnosis of ARF. Excludes any admissions where that person has been admitted with any ARF or chronic RHD diagnosis from July 1989. Denominator: Statistics NZ Population Projections 2014.

45 NZMJ 8 January 2016, Vol 129 No 1428ISSN 1175-8716 © NZMA
www.nzma.org.nz/journal
ARTICLE
Figure 7: ARF Hospitalisation rate for CM residents, 5–12 years, by ethnicity.
Source: NMDS extracted CMDHB. ARF ICD code I00–I02. Primary diagnosis of ARF. Excludes any admissions where that person has been admitted with any ARF or chronic RHD diagnosis from July 1989. Denominator: Statistics NZ Population Projections 2014.
Figure 8: Hospitalisation rate for skin infection 5–12 years, CM residents, by ethnicity.
Source: National Minimum Data Set. Denominator: O’Sullivan and Baker ICD codes used to define skin infection. Primary diagnosis only. Denominator: Statistics NZ Population Projections 2014.
46 NZMJ 8 January 2016, Vol 129 No 1428ISSN 1175-8716 © NZMA
www.nzma.org.nz/journal
ARTICLE
1. Craig E, Adams J, Oben G, Reddington A et al. The Health Status of Children and Young People in the Northern District Health Boards. 2011. New Zealand Child and Youth Epidemiology Service.
2. Van Gessel, S. CMDHB: Changes in Primary Health Care between 2001 and 2009. Auckland 2010, CMDHB. Available: http://www.cmdhb.org.nz/about_cmdhb/planning/health-status/PrimaryCare/PHCchanges2001-2009.pdf
3. Brown A, McDonald MI, Calma T. Rheumatic Fever and social justice. Med J Aust. 2007;186(11):557-8.
4. Lennon D, Stewart J, Farrell E, Palmer A et al. School-based prevention of acute rheumatic fever : a group randomized trial in New Zealand. Pediatr Infect Dis J. 2009;28(9):787-94.
5. Gray S, Lennon D, Anderson P, Farrell E. Nurse-led school-based clinics for skin infections and rheumatic fever prevention: Results from a pilot study in South Auckland. NZ Med J.. 2013;126 (1373):53-6.
6. Jackson C. Auckland Regional Public Health Service. Personal
Communication.
7. Ministry of Education data on the first 51 Mana Kidz schools, July 2013.
8. Lennon D on behalf of : Ball S,Malcolm J, Farrell E, Anderson P, Percival T, Crengle S, Leversha A, Carter P, Stewart J. First Case Acute Rheu-matic Fever (ARF) is Preventable:The Accuring New Zealand Evidence. Australasian Society of Infectious diseases. Abstract. March 2015
9. Stefanogiannis N, Personal Communication.
10. O’Sullivan CE, Baker MG, Zang J. Increasing hospitalisations for serious skin infections in New Zealand Children, 1990-2007. Epidemiol Infect. 2011;139(11):1794-804.
11. Stewart, J. Personal Communication. July, 2015.
12. Lin, S, Kaplan E, Rao, X, Johnson, D et al. A School-Based Program for Control of Group A Streptococcal Upper Respiratory Tract Infections: A Controlled Trial in Southern China. Pediatr Infect Dis J. 2008;27(8):753-755.
13. Zimmerman, R. A, Biggs BA, Bolin RA, Wilson, E et al. An effective program
for reducing group A streptococcal prevalence, Pediatrics.1971;48 (4): 566-572.
14. Milne RJ, Lennon DR, Stewart JM, Vander Hoorn S et al.Incidence of acute rheumatic fever in New Zealand children and youth. J.Paediatr Child Health. 2012;48(8):685-91.
15. Lennon D, Stewart J, Farrell E, Palmer A et al. School-based prevention of acute rheumatic fever : a group randomized trial in New Zealand. Pediatr Infect Dis J. 2009;28(9):787-94.
16. Jackson C. Auckland Regional Public Health. Episurv data. Personal Communication.
17. Williamson DA, Ritchie SR, Fraser JD, Zhang J et al. Staphylococcus aureus infections in New Zealand, 2000-2011. Emerg Infect Dis. 2014;20(7):1156-61.
18. Tsai C, Anderson P, Broome L, McKee T, Lennon D. Antibiotic Stewardship for the Nurse-led School-Based Clinics for Rheumatic Fever and Skin Infections Prevention: Summary of the Antibiotic Dispensing Pattern using Pharmacy Data (Forthcoming 2015).
Competing interests: NilAcknowledgements
The evaluation was funded by CM Health. Author information:
Philippa Anderson, Public Health Physician, Population Health Team, CM Health, Auckland; Phil Light, Manager, National Hauora Coalition, Auckland; Julian C King, Director, Julian
King & Associates Limited—a member of the Kinnect Group, Auckland; Michelle Moss, Mimo Consulting Limited, Nelson; Tracy McKee, Nurse Specialist, National Hauora Coalition, Auck-land; Elizabeth Farrell, Clinical Nurse Manager, Kidz First PHN, Auckland; Joanna Stewart,
Biostatistician, University of Auckland, Auckland; Diana Lennon, Professor of Child and Youth Population Health, Department of Paediatrics, University of Auckland, Auckland.
Corresponding author: Philippa Anderson, Public Health Physician, Population Health Team, CM Health, Auckland
www.nzma.org.nz/journal/read-the-journal/all-issues/2010-2019/2016/vol-129-no-1428-8-january-2016/6782
REFERENCES:

47 NZMJ 8 January 2016, Vol 129 No 1428ISSN 1175-8716 © NZMA
www.nzma.org.nz/journal
ARTICLE
Early outcome of patients undergoing transcatheter aortic valve implantation (TAVI): The Auckland City
Hospital experience 2011–2015S Y Sylvia Wu, Tom Kai Ming Wang, Parma Nand, Tharumenthiran
Ramanathan, Mark Webster, Jim Stewart
ABSTRACTAIMS: Transcatheter aortic valve implantation (TAVI) is an alternative to surgical aortic valve replacement (AVR) in high-risk patients. We report the initial TAVI experience at Auckland City Hospital.
METHODS: The records of patients undergoing TAVI between 2011 and 2015 at Auckland City Hospital were reviewed. We report the procedural success and outcome, including major adverse events (death, stroke, myocardial infarction, bleeding, vascular complications and rehospitalisations), degree of aortic regurgitation and symptom status up to 1-year follow-up.
RESULTS: Mean age was 80.7 years and mean Euroscore II and Society of Thoracic Surgeons’ scores were 8.2% and 6.3% respectively; 50% had undergone previous cardiac surgery. Successful deployment of the valve was achieved in all patients. The cumulative mortality rates at 30 days, 6 months and 1 year were 2.4%, 6.1% and 12.2% and cumulative stroke rates 1.2%, 3% and 8.2% respectively. Severe aortic regurgitation occurred in 2.3%
CONCLUSION: TAVI is available in the New Zealand public hospital system for patients who are high-risk candidates for AVR. Early results are excellent and indicate that the technology is being used appropriately, according to current access criteria. If the early cost effectiveness data are confirmed, the indications for TAVI may widen.
BackgroundCalcific aortic stenosis is the most common
acquired heart valve disease in developed countries, affecting 2–4% of adults over 65 years of age.1 The mortality is high after the appearance of symptoms.2 Surgical aortic valve replacement (AVR) has been shown to reduce symptoms and improve survival in patients with severe aortic stenosis.3 However, up to a third of patients are declined surgery due to advanced age and coexisting comorbid conditions.4
Transcatheter aortic valve implantation (TAVI) is a recently introduced alternative to AVR in these high-risk patients. The Placement of Aortic Transcatheter Valves (PARTNER) trial demonstrated absolute mortality reduction of about 20% at 1 and
5 years in the inoperable candidates when TAVI was compared with standard therapy.5 In the high-risk, but operable, cohort, TAVI was non-inferior to AVR, with similar rates of survival up to 5 years.6 FRANCE 2, a prospective registry study of TAVI, recently published the results of ‘real life’ experience in a large number of patients in France.7 The authors concluded that TAVI was a reasonable treatment option in high-risk elderly patients with severe, symptomatic aortic stenosis. More recently, the CORE-VALVE study showed a significantly lower 1-year mortality with TAVI than with AVR (14.2% vs 19.1%) in patients at increased surgical risk using a different, self-ex-panding bioprosthesis.8 Such studies may lead to wider indications for, and greater use of, TAVI in the future.
48 NZMJ 8 January 2016, Vol 129 No 1428ISSN 1175-8716 © NZMA
www.nzma.org.nz/journal
ARTICLE
TAVI is currently performed at three public hospitals in New Zealand (Auckland, Hamilton and Christchurch) where the procedure is funded for patients who are considered operable, but at higher than average risk for AVR. Patients who are thought to be inoperable by virtue of comorbid conditions have a very poor life expectancy, even if TAVI were success-fully performed. These patients cannot be offered TAVI in the public sector in New Zealand. A patient who is inoperable due to a specific surgical contraindication, such as a porcelain aorta, but otherwise has an acceptable life expectancy and limited comorbidities, can be considered for TAVI.
It is important to monitor clinical outcome and cost effectiveness with any new technology to ensure health service funds are being used appropriately and effectively. In this study, we report our experience of high-risk patients who underwent TAVI at Auckland City Hospital between 2011 and 2015 with the aim of assessing the reliability of the patient selection process, and to audit the proce-dural outcome of TAVI in Auckland comparing local data with international standards.
MethodsPatient selection
To be eligible for TAVI in the New Zealand public hospital system, all patients with aortic stenosis must first be discussed at a regional cardio-surgical conference. If a patient is accepted for surgery and placed on the waiting list for AVR, the responsible cardiologist can present the patient’s case to the ‘Heart Team’ for consideration of TAVI, if the conference consensus agrees that the operative risk of the individual is higher than average. The Heart Team meeting is chaired by a cardiologist who is not involved in the TAVI programme, and is attended by TAVI cardiologists, imaging cardiologists, cardiothoracic surgeons, anaesthetists and intensivists. Input is sought from geria-tricians where there are concerns about functional or cognitive impairment, or where there is a subjective impression of frailty. All patients included in this study underwent this selection process, with the exception of two who were referred referred from, and funded by, French Polynesia as
part of a contract, after assessment in Tahiti. New Zealand patients domiciled outside the northern region health board catchment areas were assessed by their local Heart Team prior to referral to the Auckland City Hospital TAVI service. A total of 86 patients underwent TAVI at Auckland City Hospital between July 2011 and February 2015, and form the study population. A further 20 patients who were discussed by the Heart Team underwent surgical AVR during this period, and 21 patients were treated conser-vatively (neither TAVI nor AVR) after Heart Team discussion.
Severe aortic stenosis was defined as an aortic valve area of 1cm2 or less, a mean aortic-valve gradient of more than 40mmHg, or a peak aortic-jet velocity of more than 4.0 m per second. The Logistic EuroSCORE II and Society of Thoracic Surgeon’s (STS) scores were tools included in the surgical risk assessment.9,10 Patient eligibility and suitability for TAVI was decided by the Heart Team based on systematic clinical eval-uation, angiographic, echocardiographic and multi-slice computed tomographic (CT) characteristics. The workup included consideration of appropriate route for tran-scatheter valve implantation (transfemoral, transaortic or transapical), with assessment of the calibre, degree of calcification and tortuosity of the iliac and femoral vessels, aortic calcification, size of the aortic annulus, and distance of the coronary ostia from the annulus. All the valves used for TAVI during the period reported were Sapien and Sapien XT (Edwards Lifesciences Ltd). Initially, only two sizes (23mm and 26mm) were available, with the 29mm prosthesis becoming available in New Zealand from September 2012. Patients were not considered for TAVI if the annulus was too small for a 23mm valve or too large for a 29mm valve. TAVI was performed via transfemoral, transaortic (through a mini-sternotomy or mini-thora-cotomy) and transapical routes.
Study design and definitionsThis study was a single-centre obser-
vational audit of the procedural outcome and short-term results of TAVI at Auckland City Hospital. The majority of patients were from the four district health boards within the northern region. A small number were from the Southern DHB (assessed in Dunedin) and from French Polynesia
49 NZMJ 8 January 2016, Vol 129 No 1428ISSN 1175-8716 © NZMA
www.nzma.org.nz/journal
ARTICLE
(assessed in Tahiti). The main data sources were patient clinical files accessible via the Auckland regional computer database; and some follow-up data were requested through the respective general practitioners and hospitals for patients domiciled outside the Auckland DHB catchment.
Clinical data collected included patient demographics, comorbidities, surgical risk assessment scores, echocardio-graphic features, and procedural outcome, including echocardiographic assessment of perivalvular aortic regurgitation.
Outcomes in-hospital and at follow-up of 1, 6 and 12 months, including symptom status, mortality and complications, were obtained. All clinical endpoints were defined according to the updated Valve Academic Research Consortium-2 consensus document published by the European Heart Journal in 201211. For acute kidney injury, an increase in serum creatinine peri-pro-cedurally to between 1.5–2 times, 2–3 times or more than 3 times corresponds to stage 1, 2 and 3 respectively. Life-threatening bleeding is defined as bleeding in a critical organ (intracranial, intraspinal, intra-ocular, or pericardial or intramuscular with compartment syndrome). Major bleeding is defined as overt bleeding requiring trans-fusion of at least two units of red blood cell. Major vascular complication is defined as access site, or access-related, vascular injury including dissection, stenosis, perfo-ration, rupture, arterio-venous fistula, pseudoaneurysm, haematoma, irreversible nerve injury, compartment syndrome, or percutaneous closure device failure leading to death, as well as life-threatening or major bleeding, visceral ischaemia, or neuro-logical impairment or distal embolisation from a vascular source. Cerebrovascular events, defined as an acute episode of a focal or global neurological deficit with at least one of the following: change in the level of consciousness; hemiplegia; hemiparesis; numbness or sensory loss affecting one side of the body; dysphasia or aphasia; hemianopia; amaurosis fugax; or other neurological symptoms or signs persisting for more than 24 hours consistent with stroke. Peri-procedural myocardial infarction was defined as a troponin rise with at least one value above the 99th percentile of the upper limit of normal (as
per the universal definition), within 72 hours of the index procedure.12
Quantitative and qualitative variables were presented as mean ± standard deviation and frequency (percentage) respectively. Kaplan-Meier survival curves were used to present longitudinal outcomes and comparisons made using the log-rank test to calculate hazards ratio (HR) and its 95% confidence interval (95%CI). SPSS (Version 17.0, SPSS Inc., Chicago, IL, USA) and Prism (Version 5, GraphPad Software, San Diego, CA, USA) were used for statistical analyses.
ResultsClinical characteristics
From July 2011 to February 2015, 86 patients underwent TAVI. Follow-up data were complete for 83 (96.5%) at 30 days, 66 (76.7%) at 6 months and 49 (57.0%) at 1 year. Baseline characteristics of the cohort are shown in Table 1, and echocardio-graphic parameters in Table 2. The mean age was 80.7 ± 8.8 years and 49 (57.0%) of patients were male. Class III–IV symptoms were present in 62 (72.1%), while 43 (50.0%) had undergone previous cardiac surgery. Mean EuroSCORE II was 8.2 ± 5.0% and STS score was 6.3 ± 5.6%. Severe aortic stenosis was present in all patients and 35 (40.7%) had impaired ejection fraction <50%.
Procedural characteristicsTable 3 lists the characteristics of the
TAVI procedure. None of the patients required conversion to open surgery, and the trans-catheter valve was successfully deployed in all. Two patients required the implantation of a second prosthesis at the time of the procedure: one due to severe paravalvular aortic regurgitation detected on trans-oesophageal echocardiography, and the other because transient loss of capture of the ventricular pacing resulted in the deployment of the first valve in a suboptimal position. A second valve was implanted to ensure the best possible result for that individual.
Peri-prosthetic aortic regurgitation, assessed by angiography and transoesoph-ageal echocardiography, was moderate in 10 (11.6%) and severe in 2 (2.3%).
In-hospital outcomesIn-hospital outcomes are indicated in
Table 4. In-hospital mortality occurred in 3

50 NZMJ 8 January 2016, Vol 129 No 1428ISSN 1175-8716 © NZMA
www.nzma.org.nz/journal
ARTICLE
Table 1: Patient characteristics at baseline.
N = 86
Age (years) 80.7 ± 8.8
Male 49 (57.0%)
Body mass index (kg/m^2) 27.7 ± 5.7
Cardiac history
New York Heart Association Class III–IV 62 (72.1%)
Surgical aortic valve replacement 6 (7.0%)
Balloon aortic valvuloplasty 3 (3.5%)
Myocardial infarction 41 (47.7%)
Coronary artery bypass grafting 42 (48.8%)
Percutaneous coronary intervention 24 (27.9%)
Pacemaker implantation 6 (7.0%)
Atrial fibrillation 26 (30.2%)
Co-morbidities
Hypertension 54 (62.8%)
Diabetes 21 (24.4%)
Cerebrovascular disease 14 (16.3%)
Chronic respiratory disease 28 (32.6%)
Estimated glomerular filtration rate (mL/min) 103 ± 3
Risk scores
EuroSCORE II 8.2 ± 5.0%
STS Score 6.3 ± 5.6%
All figures are mean ± standard deviation or percentage (frequency)
Table 2: Echocardiographic parameters.
Aortic valve
Aortic valve area (cm2) 0.8 ± 0.2
Mean gradient (mmHg) 43 ± 14
Peak systolic velocity (m/s) 4.2 ± 0.7
Aortic regurgitation 5 (5.8%)
Mitral regurgitation 3 (3.5%)
Tricuspid regurgitation 0 (0.0%)
Ejection fraction (%)normal (>50%)mild impairment (40–50%)moderate to severe impairment (<40%)
50 ± 14%51 (59.3%)12 (14.0%)23 (26.7%)

51 NZMJ 8 January 2016, Vol 129 No 1428ISSN 1175-8716 © NZMA
www.nzma.org.nz/journal
ARTICLE
patients (3.5%); 2 within 30 days. Of these, one patient sustained a tear of the aortic root close to the left coronary ostium during valve deployment, leading to cardiac tamponade. Despite prompt pericardiocentesis, the patient died from progressive hypotension and myocardial hypoperfusion. The second death was of a patient who developed pulmonary oedema just prior to her TAVI, and had a protracted recovery complicated by myocardial infarction and sepsis, before dying from severe pulmonary hypertension and respiratory failure. The third death was a patient with multiple comorbidities, including two previous mitral valve replace-ments, who died of multi-organ failure.
Acute kidney injury occurred in 7 (8.1%); transient minor increase in creatinine or no change from baseline was seen in the rest. Major vascular complications were seen in 3 patients (3.5%). One patient required embolectomy and a patch graft for relief of lower limb ischaemia, and another had embolectomy alone. A third patient sustained a false aneurysm of the femoral artery on the contralateral side to the one used for valve deployment, after an unsuc-cessful attempt to insert an intra-aortic balloon pump (following resuscitation from cardiac arrest several days after successful valve deployment). Treatment was by surgical drainage and repair, but extensive
peripheral vascular disease, in addition to the acute vascular injury, eventually led to above knee amputation. Other compli-cations in hospital included pacemaker implantation in 5 patients (5.8%) and stroke and myocardial infarction in 1 patient (1.2%) each.
Outcomes after hospitalisationBetween the index hospitalisation and
1 year, there were three further deaths. One patient had persistent dyspnoea post procedure due to a combination of right heart failure and airways disease, and died at 6 months. The other two patients died of bacterial endocarditis. Cumulative all-cause mortality at 6 months and 1 year were 6.1% and 12.2% respectively (Table 4). Survival curves for the overall cohort and by the procedural approach are shown in Figure 1. Transfemoral approach appeared to have a non-significantly greater survival than tran-sapical or transaortic approaches.
With respect to other complications at 1 year, stroke occurred in 4 (8.2%). One patient developed cortical blindness secondary to an acute occipital infarct at 6 months. Another died soon after the clinical diagnosis of a brainstem stroke at 1 year. A third patient, on warfarin for chronic atrial fibrillation, sustained a haemorrhagic stroke in the context of a prolonged INR. Two patients
Table 3: Procedural characteristics.
N= 86
Access route
TransfemoralTransaorticTransapical
61 (70.9%)14 (16.3%)11 (12.8%)
Conversion to open surgery 0 (0.0%)
Successful deployment 86 (100.0%)
Deployment of second valve 2 (2.3%)
Procedure time (minutes) 111 ± 74
Periprosthetic aortic regurgitation:
NoneTrivial to MildModerateSevere
26 (30.2%)42 (48.8%)10 (11.6%)2 (2.3%)
All figures are mean ± standard deviation or percentage (frequency).
Table 4: In-hospital outcomes.
Acute kidney injury• Stage 1• Stage 2• Stage 3
4 (4.7%)2 (2.3%)1 (1.2%)
Bleeding• Life-threatening• Major• Minor
1 (1.2%)3 (3.5%)5 (5.8%)
Vascular complications• Major• Minor
3 (3.5%)1 (1.2%)
Pacemaker implantation 5 (5.8%)
Cerebrovascular event 1 (1.2%)
Myocardial infarction 1 (1.2%)
Arrhythmia 7 (8.1%)
Death 3 (3.5%)
Length of intensive care stay (hours) 31 ± 49
Length of hospital stay (days) 8 ± 10
All figures are percentage (frequency).

52 NZMJ 8 January 2016, Vol 129 No 1428ISSN 1175-8716 © NZMA
www.nzma.org.nz/journal
ARTICLE
(4.1%) sustained myocardial infarction and new arrhythmias were seen in 10 (20.4%), predominantly new-onset atrial fibrillation. One patient developed ventricular tachycardia and cardiac arrest in the context of sepsis, and another patient, who sustained mitral valve chordal damage during trans-apical TAVI, developed acute heart failure, heart block requiring pacing and ventricular tachyar-rhythmias. Infective endocarditis occurred in 3 (6.1%) of whom 2 died; the organisms in the fatal cases were Staphylococcus aureas and Enterococcus faecalis. The earliest onset was seven months after the valve implantation. Readmission at 1 year occurred in 13 patients
(26.5%) for cardiac causes and 24 patients (49%) for non-cardiac causes.
Symptoms following hospitalisation
Prior to TAVI, 62 (72.1%) of the patients had class III–IV symptoms, but only 20% remained so at 30 days and 1 year. Three patients remained short of breath due to cardiac causes, including atrial fibrillation with poorly-controlled ventricular rate, symptomatic coronary artery disease, and paravalvular regurgitation in combination with lung disease. The remaining patients had significant persistent breathlessness due to co-existing pulmonary disease.
Table 5: Outcomes at follow-up.
Outcome 30 days N=83 6 months N= 66 1 year N= 49
Death 2 (2.4%) 4 (6.1%) 6 (12.2%)
Cerebrovascular event 1 (1.2%) 2 (3.0%) 4 (8.2%)
Myocardial infarction 1 (1.2%) 2 (3.0%) 2 (4.1%)
Arrhythmia 7 (8.1%) 10 (15.2%) 10 (20.4%)
Endocarditis 0 (0.0%) 2 (3.0%) 3 (6.1%)
Hospitalisation
Cardiac 7 (8.4%) 13 (19.7%) 13 (26.5%)
Non cardiac 15 (18.1%) 21 (31.8%) 24 (49.0%)
NYHA Pre-procedure N=86
30 daysN=78
1 yearN=44
I–II 24 (27.9%) 80.8% (63) 35 (79.5%)
III–IV 62 (72.1%) 15 (19.2%) 9 (20.5%)
All figures are percentage (frequency)
Figure 1: Kaplan-Meier survival curves for all-cause mortality for the A) entire cohort, and B) by procedural approach.

53 NZMJ 8 January 2016, Vol 129 No 1428ISSN 1175-8716 © NZMA
www.nzma.org.nz/journal
ARTICLE
DiscussionIn this study we have analysed the
outcome of 86 patients undergoing TAVI between 2011 and 2015. Successful deployment of the valve was achieved in all patients and the peri-procedural complica-tions rates were low. Two patients (2.4%) died within 30 days. The death rate from any cause was 6.1% at 6 months and 12.2% at 1 year, and the stroke rate was 1.2% at 30 days, and 8.2% at 1 year. These compli-cation rates are comparable to the France 2 Registry, which reported mortality of 9.7%, 18.6% and 24% at 30 days, 6 months and 1 year respectively, but a rate of major stroke of only 2.3% at 1 year.7 Compar-isons with international registries must be made cautiously given the small number of patients in our study, but initial results are encouraging.
Our data indicate that the local TAVI selection criteria have been applied appro-priately, according to the tools that we currently have available, as few patients in whom treatment might be considered futile underwent TAVI. The majority of such patients were treated medically. Nevertheless, the rate of hospital read-mission was high in our group, particularly for non-cardiac causes. This reflects the extent of the co-morbid disease burden in this population. The high early success rate reflects favourably on the selection process for TAVI candidates. Although a formal frailty score was not part of that process, each patient’s frailty was assessed informally as part of the overall clinical assessment. The number of patients in whom AVR was recommended rather than TAVI also indicates that the Heart Team considered each individual case carefully.
Beyond the well-documented mortality benefit of TAVI compared to medical therapy,5 and more recently to AVR,5 improvements in symptoms and quality of life for patients with severe symptomatic aortic stenosis are also attractive reasons for performing TAVI. In our study, symptom class improved significantly; pre-opera-tively 72% of patients had NYHA class III–IV compared with 20% at 30 days and 1 year. In the PARTNER trial, TAVI resulted in lower rates of NYHA III–IV symptoms at 1 year when compared to medical therapy (23.7%
vs 50.0%, P<0.001)5 and similar NYHA class and to AVR at 1 and 5 years.6 These figures of TAVI’s medium-term durability are encouraging, and longer trial and registry follow-up are awaited.
The continued or expanded use of TAVI locally will be contingent on the demon-stration of acceptable cost-effectiveness data. A recent New Zealand study found that the index admission cost of TAVI was significantly less than AVR, predominantly driven by lower non-device costs and reduced hospital resource requirements.13 Systematic reviews have otherwise found TAVI to be justified on economic grounds when compared to medical therapy, but not necessarily more cost-effective than AVR, and that the transfemoral approach was more favourable to other approaches.14,15
Currently, TAVI is funded in New Zealand for high-risk operable patients, and ques-tions remain whether indications may be widened locally. The COREVALVE trial outcomes in moderate- to high-risk patients are promising, but further studies of lower-risk patients are required before wider use of TAVI can be advocated confi-dently.8 Whether to intervene on inoperable patients is a more difficult question. Mortality and symptomatic benefits have certainly been demonstrated in the PARTNER trial when compared to medical therapy.5 However, the absolute benefit in such co-morbid patients is small, and the increased costs in the management of these patients are in direct competition with other medical treatments for the limited public healthcare budget. Another chal-lenge for the health service is the equitable delivery of TAVI across the entire country, and widening the indications will not help to meet the demand for this.
There are some limitations to our study. Firstly, the number of patients is small and several patients have not yet reached the end of the first year of follow-up. The small denominator at 1 year probably skews the complication rate adversely. Secondly, follow-up information is incomplete for those patients not living locally. A national database is needed to monitor the progress of TAVI in New Zealand, and to be sure that the health budget is being spent appro-priately and responsibly. Such a database is now in operation for percutaneous

54 NZMJ 8 January 2016, Vol 129 No 1428ISSN 1175-8716 © NZMA
www.nzma.org.nz/journal
ARTICLE
coronary intervention, and a national TAVI database would ensure that follow up inves-tigations and reporting were standardised.
In conclusion, our study shows that TAVI can be performed effectively and safely in
appropriately selected patients. Further information from a national database will be required to monitor the appropriate use of this technology in the New Zealand public hospital setting.
1. Otto et al. Association with aortic-valve sclerosis with cardiovascular mortality and morbidity in the elderly. N Eng J Med 1999;341:142-7
2. Ross J Jr, Braunwald E. Aortic stenosis. Circulation 1968; 38:Suppl:61-7.
3. Schwarz F, Baumann P, Manthey J, et al. The effect of aortic valve replacement on survival. Circulation 1982;66:1105-10.
4. Iung B, Cachier A, Baron G, et al. Decision-making in elderly patients with severe aortic stenosis: why are so many denied surgery? Eur Heart J 2005;26:2714-20.
5. Kapadia SR, Leon MB, Makkar RR et al.; PARTNER trial investigators. 5-year outcomes of transcatheter aortic valve replacement compared with standard
treatment for patients with inoperable aortic stenosis (PARTNER 1): a randomised controlled trial. Lancet 2015;385:2485-91.
6. Mack MJ, Leon MB, Smith CR, et al.; PARTNER 1 trial investigators. 5-year outcomes of transcatheter aortic valve replacement or surgical aortic valve replacement for high surgical risk patients with aortic stenosis (PART-NER 1): a randomised controlled trial. Lancet 2015;385:2477-84.
7. Gilard M, Eltchaninoff H, Iung B, et al. Registry of transcatheter aortic-valve implantation in high-risk patients. N Engl J Med 2012;366:1705-15.
8. Adams DH, Popma JJ, Reardon MJ, et al. Transcatheter Aortic-Valve Replacement
with a Self-Expanding Prosthesis. N Engl J Med 2014;370:1790-1798.
9. Nashef SA, Roques F, Shar-ples LD, et al. EuroSCORE II. Eur J Cardiothorac Surg. 2012;41:734-44.
10. O’Brien SM, Shahian DM, Filardo G, et al.; Society of Thoracic Surgeons Quality Measurement Task Force. The Society of Thoracic Surgeons 2008 cardiac surgery risk models: part 2--isolated valve surgery. Ann Thorac Surg 2009;88:S23-42.
11. Kappetein AP, Head SJ, Genereux P, et al. Updated standardised endpoint definitions for transcatheter aortic valve implantation: the Valve Academic Research Consortium-2 consensus document. J Am Coll Cardi-ol. 2012;60(15):1438-1454.
12. Thygesen K, Alpert JS,
Competing interests: NilAcknowledgements:
We thank all our colleagues affiliated with the Green Lane Cardiovascular Service (both the cardiology and cardiothoracic surgery departments) for their contributions and support.
Author information:Sylvia SY Wu, Registrar, Green Lane Cardiovascular Service (Cardiology), Auckland City
Hospital; Tom Kai Ming Wang, Registrar, Green Lane Cardiovascular Service (Cardiology), Auckland City Hospital; Parma Nand, Cardiothoracic Surgeon, Green Lane Cardiovascular Service (Cardiothoracic Surgery), Auckland City Hospital; Tharumenthiran Ramanathan,
Cardiothoracic Surgeon, Green Lane Cardiovascular Service (Cardiothoracic Surgery), Auck-land City Hospital; Mark Webster, Interventional Cardiologist, Green Lane Cardiovascular
Service (Cardiology), Auckland City Hospital; Jim Stewart, Interventional Cardiologist, Green Lane Cardiovascular Service (Cardiology), Auckland City Hospital.
Corresponding author: Jim Stewart, Green Lane Cardiovascular Service, Auckland City Hospital, Private Bag 92024,
Victoria St West, Auckland 1142, New Zealand. [email protected]
URL:www.nzma.org.nz/journal/read-the-journal/all-issues/2010-2019/2016/vol-129-no-1428-8-
january-2016/6783
REFERENCES:

55 NZMJ 8 January 2016, Vol 129 No 1428ISSN 1175-8716 © NZMA
www.nzma.org.nz/journal
ARTICLE
Jaffe AS, et al. for the Writing Group on behalf of the Joint ESC/ACCF/AHA/WHF Task Force for the Universal Definition of Myocardial Infarc-tion. Third Universal Definition of Myocardial Infarction. Eur Heart J. 2012;33(20):2551-2567.
13. Bhattacharyya S, Roskruge M, Pasupati S et al.
National Cost Comparison of Trans Catheter Aortic Valve Replacement With Surgical Aortic Valve Replacement in Moderate to High Risk Patients With Severe Symptomatic Aortic Stenosis in New Zealand. Circulation 2014;130: A19924.
14. Indraratna P, Ang SC, Gada H et al. Systematic review
of the cost-effectiveness of transcatheter aortic valve implantation. J Thorac Cardiovasc Surg 2014;148:509-14.
15. Osnabrugge RL, Kappetein AP, Reynolds MR, Cohen DJ. Cost-effectiveness of transcatheter valvular interventions: economic challenges. EuroInterven-tion 2013;9 Suppl:S48-54.

56 NZMJ 8 January 2016, Vol 129 No 1428ISSN 1175-8716 © NZMA
www.nzma.org.nz/journal
ARTICLE
Changing causes of heart valve disease mortality in New
Zealand from 1988 to 2007Sean Coffey, Brian Cox, Michael JA Williams
ABSTRACTAIM: We wished to determine the mortality burden of valvular heart disease (VHD) in New Zealand, and how it changed prior to the introduction of transcatheter aortic valve replacement.
METHOD: Patient-level cause of death data from 1988 to 2007 were used to examine trends in VHD mortality rates over time. Our outcome measure was death, where the primary cause of death was valvular heart disease.
RESULTS: The annual number of VHD deaths increased 2.9% in New Zealand each year (p<0.001). The total VHD mortality rate increased with older age and male sex.
There was little, if any, overall change in age- and sex-adjusted total VHD mortality rate over time (annual mortality rate ratio 0.998, p=0.21). The oldest age group, aged 85 years and above, which now contribute most to total VHD mortality, had an increase in mortality rate through the 1990s, which plateaued after the year 2000. The adjusted mortality rate for non-rheumatic aortic valve disease increased (p<0.001), while that for rheumatic heart disease and endocarditis decreased (p<0.001). Assuming VHD mortality rates remain stable, deaths due to VHD are projected to double over the next 25 years.
CONCLUSION: Adjusted VHD mortality rates showed no change over the two decades examined. Without a substantial reduction in mortality rates, the ageing population is likely to lead to an increase in VHD deaths in the future.
Valvular heart disease (VHD) is a common form of heart disease, and without treatment, end-stage VHD
leads to heart failure and death. No medical therapy has proven successful in altering the progression of any form of VHD,1,2 so the mainstay of treatment is surgical valve repair or replacement.
VHD is strongly associated with older age.3 The ageing of the population in New Zealand, and other countries worldwide, suggests that VHD will become an increasing burden on healthcare systems. The development of transcatheter aortic valve replacement (TAVR) for use in patients with end-stage aortic stenosis (AS) at high or prohibiitive surgical risk indicates an unmet need for treatment, especially in high-risk elderly patients. To estimate the burden of VHD in New Zealand and how it has changed over time, we examined mortality due to VHD prior to the introduction of TAVR.
MethodClassification of cause of death
This study focused on adult deaths where the primary cause of death was recorded as valvular heart disease. We confined our analysis to those aged 15 years or older to allow standard 5-year age groups to be constructed. To allow comparison of cause of death across two different International Classification of Diseases (ICD) coding eras, six disease groups were chosen, namely, non-rheumatic aortic valve disorders, non-rheumatic mitral valve disorders, endo-carditis, mixed valve disease, rheumatic heart disease, and non-rheumatic right-sided valve disease. The corresponding ICD9 and ICD10 codes are listed in Table 1.
As the mixed valve disease code (396 in ICD9, I08 in ICD10) included both rheumatic and unspecified valve disease, this code was included for the analysis of total VHD, but excluded for analysis of rheumatic VHD. The

57 NZMJ 8 January 2016, Vol 129 No 1428ISSN 1175-8716 © NZMA
www.nzma.org.nz/journal
ARTICLE
rheumatic heart disease analysis is therefore a conservative figure, but has been used to examine changes in RHD over time.
The first use of TAVR in New Zealand was in 2008, with heterogenous uptake of the new technology around the country.4 Given the uncertain impact that this would have on trends in mortality, we focused on data prior to this time point. Patient-level data was obtained from the New Zealand Ministry of Health Mortality Collection from 1 January 1988 to 21 December 2007, a total of 20 years.5 The cause of death was recorded using the 9th revision of the Inter-national Classification of Diseases (ICD9) until 1999, and the 10th revision of the Inter-national Statistical Classification of Diseases and Related Health Problems (ICD10) from the year 2000 onwards. To calculate age-specific mortality, historical population estimates from Statistics New Zealand were used.6 For mortality projections, given the minimal change in age-adjusted mortality rates over time and the uncertainties regarding changes in this rate due to new therapies, we applied the 2006 age-specific mortality rates to population projec-tions, assuming medium fertility, medium mortality and medium net migration.
Statistical analysisLinear regression was used to analyse
changes in unadjusted mortality rates over time and one-way ANOVA to test differences between age-specific mortality rates. Poisson regression was used to analyse trends over time for mortality rates. Mortality rates were modelled by year, with age group and sex as indicator variables. Poisson regression for each age
group and separately for each cause group was conducted, excluding right-sided VHD and those aged less than 20 years, due to infrequent deaths in this age group. The average percentage change in mortality rate was calculated by (mortality rate ratio – 1)x100%. Statistical tests were performed using Stata version 12.1 (Statacorp, College Station, Texas). We performed nonlinear least-squares estimation (Stata’s “nl” command) to detect changes in trends of age-specific mortality rates over time. If a knot was detected, we then constructed linear splines and performed piecewise negative binomial regression to determine both the trend in mortality rate ratio before and after the knot, and to test the statistical significance of the change in trend. As several analyses were conducted, p<0.01 was taken to represent statistically significant trends.
ResultsUnadjusted mortality
There were 8,876 adults whose primary cause of death was coded as being due to valvular heart disease in New Zealand over the 20-year period from 1988 to 2007. The most common cause of VHD-related mortality was non-rheumatic aortic valve disease (AVD), which was responsible for 48.9% of all VHD deaths (Table 2 and Figure 1).
The mean age at death was 74.8 years (standard deviation 16.9). The age-specific mortality rate for total VHD increased with older age (one-way ANOVA p<0.001), from a mean over the 20-year period of 2.6 per 100,000 in the 15–59 year old group, to 303.3
Table 1: Cause of death by group, with corresponding ICD9 and ICD10 codes.
ICD9 codes ICD10 codes
Nonrheumatic aortic valve disorders, including bicuspid aortic valve
424.1, 746.4 I35, Q23.0, Q23.1
Nonrheumatic mitral valve disorders 424.0 I34, Q23.3
Endocarditis 421, 424.9 I33, I38, I39
Mixed valve disease, rheumatic or unspecified
396 I08
Rheumatic heart disease 391, 392, 393, 394, 395, 397, 398
I01, I02.0, I05, I06, I07, I09
Nonrheumatic right sided disease 424.2, 424.3, 746.0, 746.1, 746.2
Q22, I36, I37
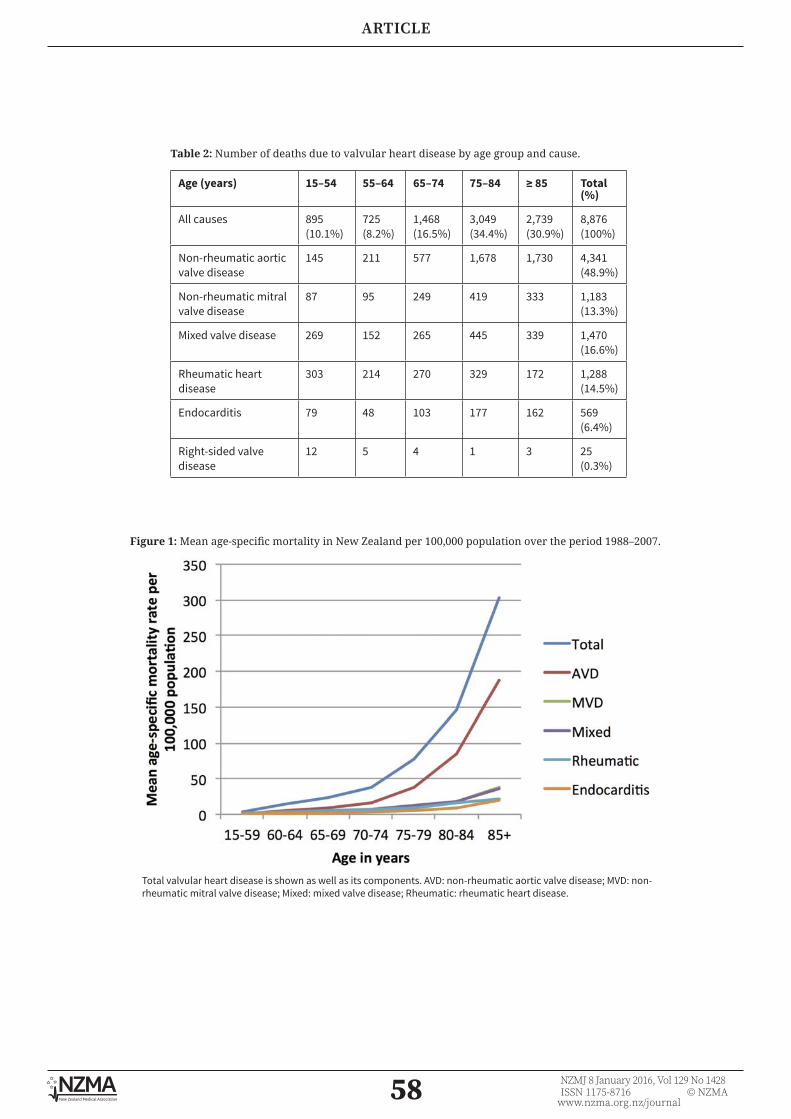
58 NZMJ 8 January 2016, Vol 129 No 1428ISSN 1175-8716 © NZMA
www.nzma.org.nz/journal
ARTICLE
Table 2: Number of deaths due to valvular heart disease by age group and cause.
Age (years) 15–54 55–64 65–74 75–84 ≥ 85 Total (%)
All causes 895(10.1%)
725(8.2%)
1,468(16.5%)
3,049(34.4%)
2,739(30.9%)
8,876 (100%)
Non-rheumatic aortic valve disease
145 211 577 1,678 1,730 4,341 (48.9%)
Non-rheumatic mitral valve disease
87 95 249 419 333 1,183 (13.3%)
Mixed valve disease 269 152 265 445 339 1,470 (16.6%)
Rheumatic heart disease
303 214 270 329 172 1,288 (14.5%)
Endocarditis 79 48 103 177 162 569 (6.4%)
Right-sided valve disease
12 5 4 1 3 25 (0.3%)
Figure 1: Mean age-specific mortality in New Zealand per 100,000 population over the period 1988–2007.
Total valvular heart disease is shown as well as its components. AVD: non-rheumatic aortic valve disease; MVD: non-rheumatic mitral valve disease; Mixed: mixed valve disease; Rheumatic: rheumatic heart disease.
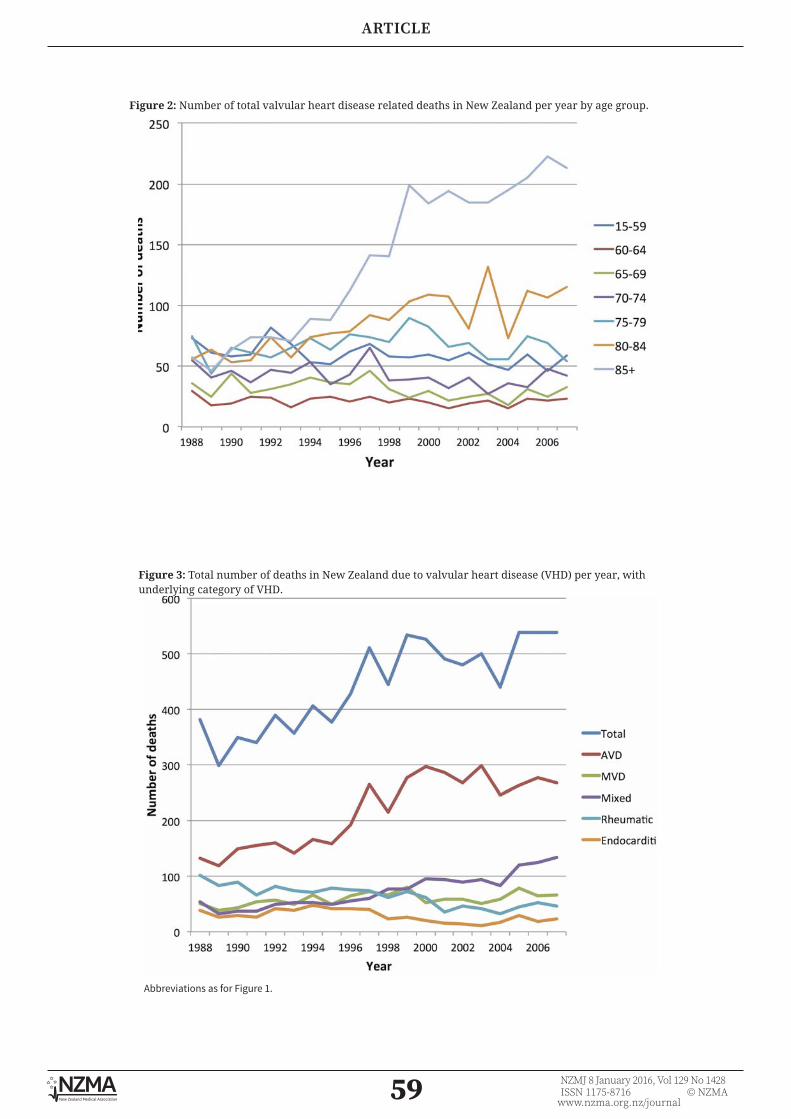
59 NZMJ 8 January 2016, Vol 129 No 1428ISSN 1175-8716 © NZMA
www.nzma.org.nz/journal
ARTICLE
Figure 2: Number of total valvular heart disease related deaths in New Zealand per year by age group.
Figure 3: Total number of deaths in New Zealand due to valvular heart disease (VHD) per year, with underlying category of VHD.
Abbreviations as for Figure 1.
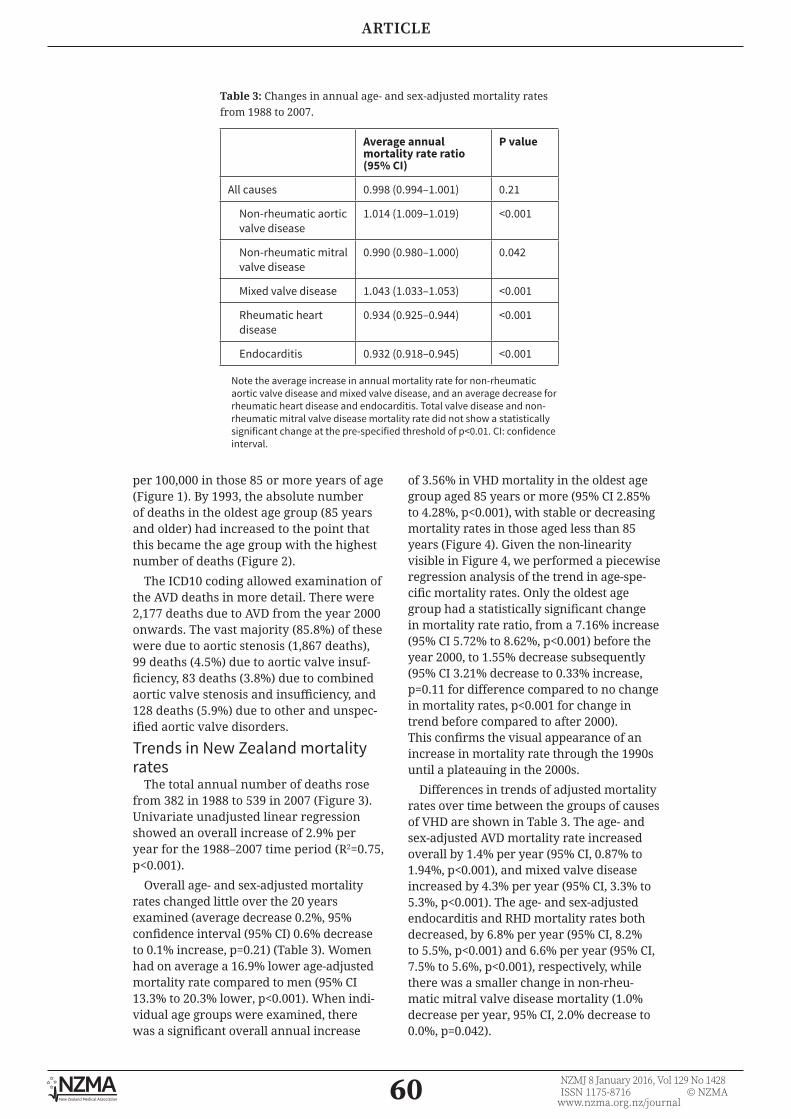
60 NZMJ 8 January 2016, Vol 129 No 1428ISSN 1175-8716 © NZMA
www.nzma.org.nz/journal
ARTICLE
per 100,000 in those 85 or more years of age (Figure 1). By 1993, the absolute number of deaths in the oldest age group (85 years and older) had increased to the point that this became the age group with the highest number of deaths (Figure 2).
The ICD10 coding allowed examination of the AVD deaths in more detail. There were 2,177 deaths due to AVD from the year 2000 onwards. The vast majority (85.8%) of these were due to aortic stenosis (1,867 deaths), 99 deaths (4.5%) due to aortic valve insuf-ficiency, 83 deaths (3.8%) due to combined aortic valve stenosis and insufficiency, and 128 deaths (5.9%) due to other and unspec-ified aortic valve disorders.
Trends in New Zealand mortality rates
The total annual number of deaths rose from 382 in 1988 to 539 in 2007 (Figure 3). Univariate unadjusted linear regression showed an overall increase of 2.9% per year for the 1988–2007 time period (R2=0.75, p<0.001).
Overall age- and sex-adjusted mortality rates changed little over the 20 years examined (average decrease 0.2%, 95% confidence interval (95% CI) 0.6% decrease to 0.1% increase, p=0.21) (Table 3). Women had on average a 16.9% lower age-adjusted mortality rate compared to men (95% CI 13.3% to 20.3% lower, p<0.001). When indi-vidual age groups were examined, there was a significant overall annual increase
of 3.56% in VHD mortality in the oldest age group aged 85 years or more (95% CI 2.85% to 4.28%, p<0.001), with stable or decreasing mortality rates in those aged less than 85 years (Figure 4). Given the non-linearity visible in Figure 4, we performed a piecewise regression analysis of the trend in age-spe-cific mortality rates. Only the oldest age group had a statistically significant change in mortality rate ratio, from a 7.16% increase (95% CI 5.72% to 8.62%, p<0.001) before the year 2000, to 1.55% decrease subsequently (95% CI 3.21% decrease to 0.33% increase, p=0.11 for difference compared to no change in mortality rates, p<0.001 for change in trend before compared to after 2000). This confirms the visual appearance of an increase in mortality rate through the 1990s until a plateauing in the 2000s.
Differences in trends of adjusted mortality rates over time between the groups of causes of VHD are shown in Table 3. The age- and sex-adjusted AVD mortality rate increased overall by 1.4% per year (95% CI, 0.87% to 1.94%, p<0.001), and mixed valve disease increased by 4.3% per year (95% CI, 3.3% to 5.3%, p<0.001). The age- and sex-adjusted endocarditis and RHD mortality rates both decreased, by 6.8% per year (95% CI, 8.2% to 5.5%, p<0.001) and 6.6% per year (95% CI, 7.5% to 5.6%, p<0.001), respectively, while there was a smaller change in non-rheu-matic mitral valve disease mortality (1.0% decrease per year, 95% CI, 2.0% decrease to 0.0%, p=0.042).
Table 3: Changes in annual age- and sex-adjusted mortality rates from 1988 to 2007.
Average annual mortality rate ratio (95% CI)
P value
All causes 0.998 (0.994–1.001) 0.21
Non-rheumatic aortic valve disease
1.014 (1.009–1.019) <0.001
Non-rheumatic mitral valve disease
0.990 (0.980–1.000) 0.042
Mixed valve disease 1.043 (1.033–1.053) <0.001
Rheumatic heart disease
0.934 (0.925–0.944) <0.001
Endocarditis 0.932 (0.918–0.945) <0.001
Note the average increase in annual mortality rate for non-rheumatic aortic valve disease and mixed valve disease, and an average decrease for rheumatic heart disease and endocarditis. Total valve disease and non-rheumatic mitral valve disease mortality rate did not show a statistically significant change at the pre-specified threshold of p<0.01. CI: confidence interval.

61 NZMJ 8 January 2016, Vol 129 No 1428ISSN 1175-8716 © NZMA
www.nzma.org.nz/journal
ARTICLE
Figure 4: Annual age-specific mortality rate due to valvular heart disease from 1988 to 2007.
Figure 5: Projected absolute mortality due to all valvular heart disease in New Zealand from 2006 until 2041.

62 NZMJ 8 January 2016, Vol 129 No 1428ISSN 1175-8716 © NZMA
www.nzma.org.nz/journal
ARTICLE
ProjectionsThe increasing number of elderly people
in the population leads to a large projected increase in the number of deaths due to VHD in New Zealand, with deaths per year due to approximately double by 2031 compared to 2006 figures (Figure 5).
DiscussionIn this study, we have shown that there
was minimal, if any, change in mortality rates due to VHD prior to the introduction of TAVR. The numbers of people dying due to VHD is largely driven by those dying of AVD, and AVD deaths have increased over the 20-year time period examined. Although there was a relatively even mix of VHD deaths in each age-category examined in 1988, more recently the highest number of deaths were in the very elderly (aged 85 years and over). Finally, we have also shown a lower age-adjusted VHD mortality rate in women compared to men. Overall, our findings are similar to those of another high-income country, the US.7
The Multi-Ethnic Study of Atheroscle-rosis (MESA) showed that older age and male sex increase the risk of both new aortic valve calcification and progression of existing calcification.8 Previous studies have shown that the prevalence of VHD markedly increases with increasing age, and that the majority of new diagnoses of moderate to severe VHD are in those aged over 74 years.3 The present study findings support these observations, and highlight that VHD is usually a disease of old age. In addition, age- and sex-adjusted total VHD mortality rates have been shown to change little over time, indicating that the changing population structure is primarily respon-sible for the increase in deaths due to VHD. The average life expectancy of men and women aged 80 in New Zealand is a further 8.5 and 8.8 years of life, respectively.9 The development of TAVR and, potentially, future treatments for VHD may improve the quality-of-life of some patients, even of relatively advanced age. How mortality due to calcific AVD will change due to TAVR or the improving mortality of coronary artery disease remains unclear.
We saw a decline in endocarditis-related mortality (Figure 3), which is contrary to
the pattern seen in the US, where increasing endocarditis-related deaths and mortality rates have increased to the point that it is now the second leading cause of VHD death.7 A number of differences between the countries may explain this finding. The International Collaboration on Endocar-ditis Prospective Cohort Study (ICE-PCS) recruited patients with endocarditis from 2000 to 2005,10 and found that Staphylo-coccus aureus, which is independently associated with higher mortality, was the causative organism in 24% of the New Zealand cohort. The vast majority (94%) of this was methicillin-sensitive. By contrast, S. aureus was the causative organism in 43% of the North American cohort,11 and 44% of the S. aureus isolates in the US were methicillin-resistant in an earlier report from ICE-PCS.12 There were also differing rates of endocarditis due to cardiac devices, accounting for 8% of cases in the North American cohort of ICE-PCS, but none in the New Zealand cohort.11 Finally, the reduction in endocarditis deaths closely follows the reduction seen in RHD deaths. Only 4% of the New Zealand cohort of ICE-PCS had underlying RHD, which, while direct comparisons are not available, is much lower than New Zealand figures reported prior to the study period examined.10 It is possible that the reduction in the burden of RHD, unaccompanied by an increase in high-risk endocarditis related to methicil-lin-resistant S. aureus, has combined to lead to the reduction in endocarditis mortality.
Overall, the reduction in annual RHD deaths and mortality rate mirrors findings worldwide, with a global survey showing a decline in both absolute numbers and age-standardised mortality due to RHD from 1990 to 2013.13 This global picture likely reflects a number of improvements over the preceding decades, such as the dramatic reduction in the incidence of acute rheu-matic fever (ARF), which preceded the use of penicillin, as well as improved access to medical care.14-16 However Māori and Pacific groups in New Zealand are disproportion-ately burdened by acute rheumatic fever, and had an increasing incidence of ARF until very recently, despite decreasing incidence in the New Zealand European population.17 It is possible that this will translate into a higher RHD mortality burden in the future,
63 NZMJ 8 January 2016, Vol 129 No 1428ISSN 1175-8716 © NZMA
www.nzma.org.nz/journal
ARTICLE
although the widespread use of secondary prophylaxis in New Zealand may reduce the degree of chronic valvulopathy, and therefore RHD mortality.18
Although we wished to examine the mortality rates in different ethnic groups, ethnicity was not provided for mortality data prior to 1996. There are also other well described issues with coding of this infor-mation.19 However, the most important VHD associated with ethnicity is RHD, and this has been analysed recently,20 showing, as expected, higher mortality rates in Māori and Pacific people, with little change from 2000 to 2007. There was also a much lower mean age at death for Māori and Pacific groups, of less than 60 years, compared to 80 years for non-Māori/non-Pacific people. Our analysis similarly shows a more even distribution of deaths across the age-groups compared to other forms of VHD (Table 2 and Figure 1). The focus on mortality, which is relatively easy to quantify, therefore underestimates the disease burden of RHD, compared to measures such as loss of disability-adjusted life-years or economic productivity. Clearly, much work still remains in the control of RHD, especially in these high risk groups.
There are a number of limitations to the present study, especially the use of cause of death data. However, New Zealand is one of only 23 countries that have been classified by the World Health Organi-zation as providing ‘high-quality’ cause of
death data,21 and New Zealand has among the lowest rates of ‘garbage’ coding in the world.22 In addition, autopsy-based studies have shown that death certificates estimate relatively accurately or underestimate the number of deaths due to VHD.23-25 We examined only those deaths where the primary cause of death was recorded as VHD—the numbers with VHD as a contrib-utory cause of death would be higher. The mortality rates described here are therefore likely to be conservative estimates.
The comparability of ICD9 and ICD10 codes is also an issue. In particular, the estimated comparability ratio for RHD is relatively low at 82%.26 However, both the decline in RHD deaths and the increase in AVD deaths (Figure 3) occurred in the 1990s before the introduction of the ICD10 coding. Finally, the dataset did not allow investigation of the contribution of confounders, such as concomitant coronary artery disease in patients with valvular heart disease.
In conclusion, the results of this study show VHD mortality has increased substan-tially over the two decades from 1988 to 2007. Due to the ageing of the population, the burden of VHD can be expected to increase for the foreseeable future. In addition to support from clinical trials of agents to modify the disease process, a sustainable health service response will be needed to deal with the expected increased demand on New Zealand’s healthcare system.

64 NZMJ 8 January 2016, Vol 129 No 1428ISSN 1175-8716 © NZMA
www.nzma.org.nz/journal
ARTICLE
REFERENCES:1. Rossebø AB, Pedersen
TR, Boman K, Brudi P, Chambers JB, Egstrup K, et al. Intensive lipid lowering with simvastatin and ezetimibe in aortic stenosis. N Engl J Med. 2008;359:1343–56.
2. Chan KL, Teo K, Dumesnil JG, Ni A, Tam J. Effect of Lipid lowering with rosu-vastatin on progression of aortic stenosis: results of the aortic stenosis progression observation: measuring effects of rosuvastatin (ASTRONO-MER) trial. Circulation. 2010;121:306–14.
3. Nkomo VT, Gardin JM, Skelton TN, Gottdiener JS, Scott CG, Enriquez-Sarano M. Burden of valvular heart diseases: a popula-tion-based study. Lancet. 2006;368:1005–11.
4. National Health Commit-tee. Briefing Report: Transcatheter Aortic Valve Implantation (TAVI). Wellington: National Health Committee; 2012.
5. New Zealand Ministry of Health. Mortality
Collection [Internet]. 2013 [cited 16 Sep 2015]. Available from: http://www.health.govt.nz/nz-health-statistics/nation-al-collections-and-surveys/collections/mortality-collection
6. Statistics New Zealand. Historical population estimates tables [Inter-net]. 2014 [cited 16 Sep 2015]. Available from: http://www.stats.govt.nz/browse_for_stats/population/esti-mates_and_projections/historical-population-ta-bles.aspx
7. Coffey S, Cox B, Williams MJA. Lack of progress in valvular heart disease in the pre-transcatheter aortic valve replacement era: increasing deaths and minimal change in mortality rate over the past three decades. Am Heart J. 2014;167:562–7.e2.
8. Owens DS, Katz R, Takasu J, Kronmal R, Budoff MJ, O’Brien KD. Incidence and progression of aortic valve calcium in the Multi-ethnic
Study of Atherosclerosis (MESA). Am J Cardiol. 2010;105:701–8.
9. Statistics New Zealand. New Zealand Period Life Tables: 2010–12 [Inter-net]. 2013 [cited 16 Sep 2015]. Available from: http://www.stats.govt.nz/browse_for_stats/health/life_expectancy/NZLife-Tables_HOTP10-12.aspx
10. Walls G, McBride S, Raymond N, Read K, Coomarasamy C, Morris AJ, et al. Infective endo-carditis in New Zealand: data from the Interna-tional Collaboration on Endocarditis Prospective Cohort Study. N Z Med J. 2014;127:38–51.
11. Murdoch DR, Corey GR, Hoen B, Miró JM, Fowler VG, Bayer AS, et al. Clinical presentation, etiology, and outcome of infective endocarditis in the 21st century: the Interna-tional Collaboration on Endocarditis-Prospective Cohort Study. Arch Intern Med. 2009;169:463–73.
12. Fowler VG, Miro JM,
Competing interests: NilAcknowledgements:
Dr Coffey was supported by the Tony Hocken Scholarship from the Department of Medicine, Dunedin School of Medicine, University of Otago, New Zealand and by the National Institute
of Health Research (NIHR) Oxford Biomedical Research Centre Programme, UK. Associate Professor Cox is supported by the Director’s Cancer Research Trust.
Author information:Sean Coffey, Clinical Research Fellow, NIHR Oxford Biomedical Research Centre, Oxford,
UK; Brian Cox, Director, Hugh Adam Cancer Epidemiology Unit, Department of Preventive and Social Medicine, Dunedin School of Medicine, University of Otago, Dunedin; Michael
JA Williams, Clinical Professor, Department of Medicine, Dunedin School of Medicine, University of Otago, Dunedin.
Corresponding author: Professor Michael Williams, Department of Cardiology, Dunedin Hospital, 201 Great King
Street, Dunedin 9016, New [email protected]
URL:www.nzma.org.nz/journal/read-the-journal/all-issues/2010-2019/2016/vol-129-no-1428-8-
january-2016/6784

65 NZMJ 8 January 2016, Vol 129 No 1428ISSN 1175-8716 © NZMA
www.nzma.org.nz/journal
ARTICLE
Hoen B, Cabell CH, Abrutyn E, Rubinstein E, et al. Staphylococcus aureus endocarditis: a consequence of medi-cal progress. JAMA. 2005;293:3012–21.
13. GBD 2013 Mortality and Causes of Death Collaborators. Global , regional and national levels of age-specific mortality and 240 causes of death, 1990-2013 : A systematic analysis for the Global Burden of Disease Study 2013. Lancet. 2015;385:117–71.
14. Gordis L. The virtual disappearance of rheu-matic fever in the United States: lessons in the rise and fall of disease. Circu-lation. 1985;72:1155–62.
15. Shulman ST, Stollerman G, Beall B, Dale JB, Tanz RR. Temporal changes in streptococcal M protein types and the near-disappearance of acute rheumatic fever in the United States. Clin Infect Dis. 2006;42:441–7.
16. Seckeler MD, Hoke TR. The worldwide epidemiology of acute rheumatic fever and rheumatic heart disease. Clin Epidemiol.
2011 Jan;3(434):67–84.
17. Milne RJ, Lennon DR, Stewart JM, Vander Hoorn S, Scuffham PA. Incidence of acute rheumatic fever in New Zealand children and youth. J Paediatr Child Health. 2012;48:685–91.
18. Thornley C, McNicholas A, Baker F, Lennon D. Rheumatic fever regis-ters in New Zealand. New Zeal Public Heal Rep. 2001;8:41–4.
19. Cormack D, Harris R. Issues in monitoring Mãori health and ethnic disparities: an update. Wellington: Te Rōpū Rangahau Hauora a Eru Pōmare; 2009.
20. Milne RJ, Lennon D, Stewart JM, Vander Hoorn S, Scuffham PA. Mortality and hospitalisation costs of rheumatic fever and rheu-matic heart disease in New Zealand. J Paediatr Child Health. 2012;48:692–7.
21. Mathers CD, Fat DM, Inoue M, Rao C, Lopez AD. Counting the dead and what they died from: an assessment of the global status of cause of death data. Bull World Health Organ. 2005;83:171–7.
22. Naghavi M, Makela S, Foreman K, O’Brien J, Pourmalek F, Lozano R. Algorithms for enhancing public health utility of national caus-es-of-death data. Popul Health Metr. 2010;8:9.
23. Saad R, Yamada AT, Pereira da Rosa FHF, Gutierrez PS, Mansur AJ. Comparison between clin-ical and autopsy diagnoses in a cardiology hospital. Heart. 2007;93:1414–9.
24. Anderson RE, Hill RB, Key CR. The sensitivity and specificity of clini-cal diagnostics during five decades. Toward an understanding of necessary fallibility. JAMA. 1989;261:1610–7.
25. Sington JD, Cottrell BJ. Analysis of the sensitivity of death certificates in 440 hospital deaths: a comparison with necropsy findings. J Clin Pathol. 2002;55:499–502.
26. 26. Anderson RN, Miniño AM, Hoyert DL, Rosenberg HM. Comparability of cause of death between ICD-9 and ICD-10: prelim-inary estimates. Natl Vital Stat Rep. 2001;49:1–32.

66 NZMJ 8 January 2016, Vol 129 No 1428ISSN 1175-8716 © NZMA
www.nzma.org.nz/journal
ARTICLE
National variation in coronary angiography rates
and timing after an acute coronary syndrome in New
Zealand (ANZACS-QI 6)Michael J A Williams, Scott A Harding, Gerard Devlin, Chris Nunn, Seif El-Jack, Tony Scott, Mildred Lee, Andrew J Kerr on behalf of the ANZACS-QI
investigators
ABSTRACTAIM: The New Zealand Cardiac Clinical Network and the Ministry of Health recommend a “3-day door-to-catheter target” for acute coronary syndromes (ACS) admissions, requiring that at least 70% of ACS patients referred for invasive coronary angiography (ICA) undergo this within 3 days of hospital admission. We assessed the variability in use of ICA, timing of ICA, and duration of hospital admission across New Zealand District Health Boards (DHBs).
METHODS: All patients admitted to all New Zealand public hospitals with suspected ACS undergoing ICA over 1 year ending November 2014 had demographic, risk factor, and diagnostic data collected prospectively using the All New Zealand Acute Coronary Syndrome Quality Improvement (ANZACS-QI) registry. Complete datasets were available in 7,988 (98.4%) patients. DHBs were categorised as those able to perform percutaneous coronary intervention on-site (intervention-capable) or not.
RESULTS: There was a near two-fold variation between DHBs in the age standardised rate (ASR) of ICA ranging from 16.8 per 10,000 to 34.1 per 10,000 population (New Zealand rate; 27.9 per 10,000). Patients in intervention-capable DHBs had a 30% higher ASR of ICA. The proportion of ACS patients meeting the 3-day target ranged from 56.7% to 92.9% (New Zealand; 76.4%). Those in intervention-capable DHBs were more likely to meet the target (78.7% vs 68.0%, p<0.0001) and spent 0.84 days (p<.0001) less in hospital.
CONCLUSIONS: There is a considerable variation in the rate and timing of ICA in New Zealand. Patients with ACS admitted to DHBs without interventional-capability are disadvantaged. New initiatives to correct this discrepancy are needed.
Invasive coronary angiography (ICA) to assess for the presence of obstructive coronary artery disease (CAD) is a high
volume, relatively expensive investiga-tion which, along with revascularisation, reduces mortality in acute coronary syn-drome (ACS).1 ICA is recommended, after appropriate risk stratification, for patients presenting with an ACS.1-3 There is the potential for both under- and over-utilisa-tion of ICA. Furthermore, the timeliness of investigation is also important. Specifically for those with ACS, New Zealand and inter-national guidelines recommend ICA within at least 3 days of admission, and earlier for some high-risk subgroups.1,4
A prior audit of three New Zealand hospitals reported that between 2007 and 2010 only about half of ACS patients received ICA in this timeframe.5 A 2012 nationwide New Zealand acute coronary syndrome (NZ ACS) audit reported that delays were greatest for patients presenting to non-intervention capable hospitals.6 Subsequently, the New Zealand Cardiac Clinical Network, supported by the Ministry of Health, proposed a “3-day door-to-catheter target” for ACS, requiring that at least 70% of ACS patients referred for ICA undergo this within 3 days of hospital admission. The 70% level was set, based on preliminary work reporting that a delay
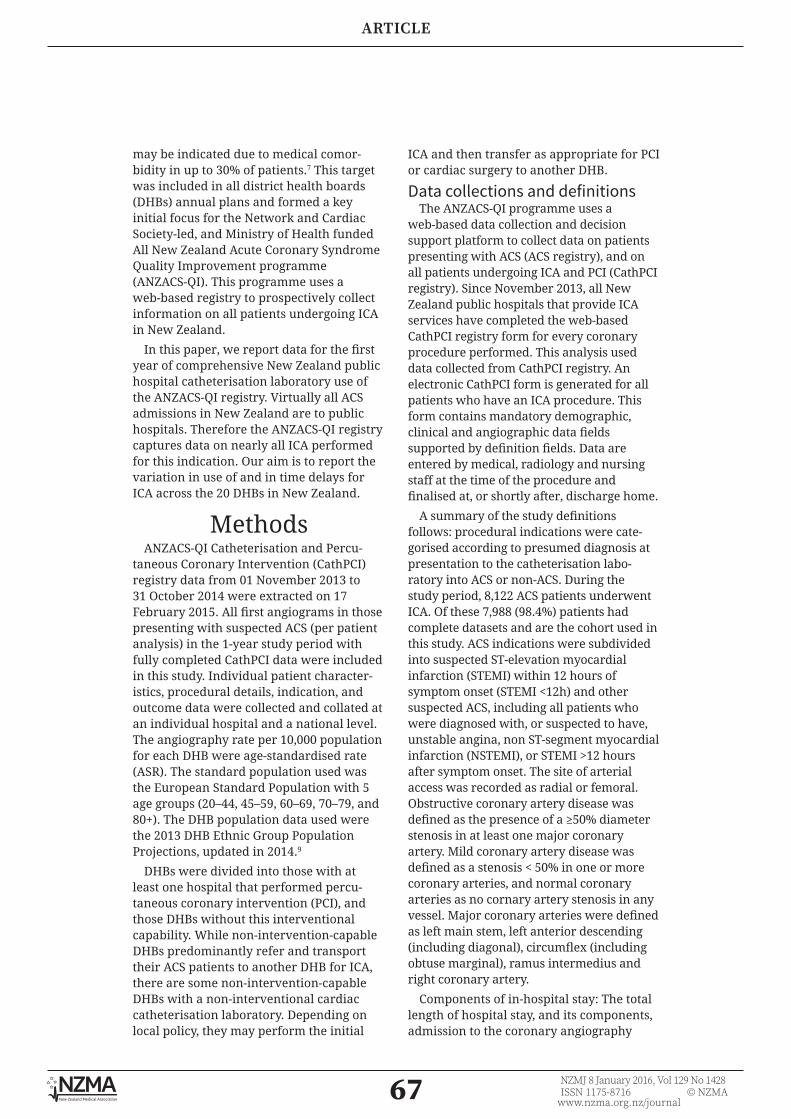
67 NZMJ 8 January 2016, Vol 129 No 1428ISSN 1175-8716 © NZMA
www.nzma.org.nz/journal
ARTICLE
may be indicated due to medical comor-bidity in up to 30% of patients.7 This target was included in all district health boards (DHBs) annual plans and formed a key initial focus for the Network and Cardiac Society-led, and Ministry of Health funded All New Zealand Acute Coronary Syndrome Quality Improvement programme (ANZACS-QI). This programme uses a web-based registry to prospectively collect information on all patients undergoing ICA in New Zealand.
In this paper, we report data for the first year of comprehensive New Zealand public hospital catheterisation laboratory use of the ANZACS-QI registry. Virtually all ACS admissions in New Zealand are to public hospitals. Therefore the ANZACS-QI registry captures data on nearly all ICA performed for this indication. Our aim is to report the variation in use of and in time delays for ICA across the 20 DHBs in New Zealand.
MethodsANZACS-QI Catheterisation and Percu-
taneous Coronary Intervention (CathPCI) registry data from 01 November 2013 to 31 October 2014 were extracted on 17 February 2015. All first angiograms in those presenting with suspected ACS (per patient analysis) in the 1-year study period with fully completed CathPCI data were included in this study. Individual patient character-istics, procedural details, indication, and outcome data were collected and collated at an individual hospital and a national level. The angiography rate per 10,000 population for each DHB were age-standardised rate (ASR). The standard population used was the European Standard Population with 5 age groups (20–44, 45–59, 60–69, 70–79, and 80+). The DHB population data used were the 2013 DHB Ethnic Group Population Projections, updated in 2014.9
DHBs were divided into those with at least one hospital that performed percu-taneous coronary intervention (PCI), and those DHBs without this interventional capability. While non-intervention-capable DHBs predominantly refer and transport their ACS patients to another DHB for ICA, there are some non-intervention-capable DHBs with a non-interventional cardiac catheterisation laboratory. Depending on local policy, they may perform the initial
ICA and then transfer as appropriate for PCI or cardiac surgery to another DHB.
Data collections and definitionsThe ANZACS-QI programme uses a
web-based data collection and decision support platform to collect data on patients presenting with ACS (ACS registry), and on all patients undergoing ICA and PCI (CathPCI registry). Since November 2013, all New Zealand public hospitals that provide ICA services have completed the web-based CathPCI registry form for every coronary procedure performed. This analysis used data collected from CathPCI registry. An electronic CathPCI form is generated for all patients who have an ICA procedure. This form contains mandatory demographic, clinical and angiographic data fields supported by definition fields. Data are entered by medical, radiology and nursing staff at the time of the procedure and finalised at, or shortly after, discharge home.
A summary of the study definitions follows: procedural indications were cate-gorised according to presumed diagnosis at presentation to the catheterisation labo-ratory into ACS or non-ACS. During the study period, 8,122 ACS patients underwent ICA. Of these 7,988 (98.4%) patients had complete datasets and are the cohort used in this study. ACS indications were subdivided into suspected ST-elevation myocardial infarction (STEMI) within 12 hours of symptom onset (STEMI <12h) and other suspected ACS, including all patients who were diagnosed with, or suspected to have, unstable angina, non ST-segment myocardial infarction (NSTEMI), or STEMI >12 hours after symptom onset. The site of arterial access was recorded as radial or femoral. Obstructive coronary artery disease was defined as the presence of a ≥50% diameter stenosis in at least one major coronary artery. Mild coronary artery disease was defined as a stenosis < 50% in one or more coronary arteries, and normal coronary arteries as no cornary artery stenosis in any vessel. Major coronary arteries were defined as left main stem, left anterior descending (including diagonal), circumflex (including obtuse marginal), ramus intermedius and right coronary artery.
Components of in-hospital stay: The total length of hospital stay, and its components, admission to the coronary angiography
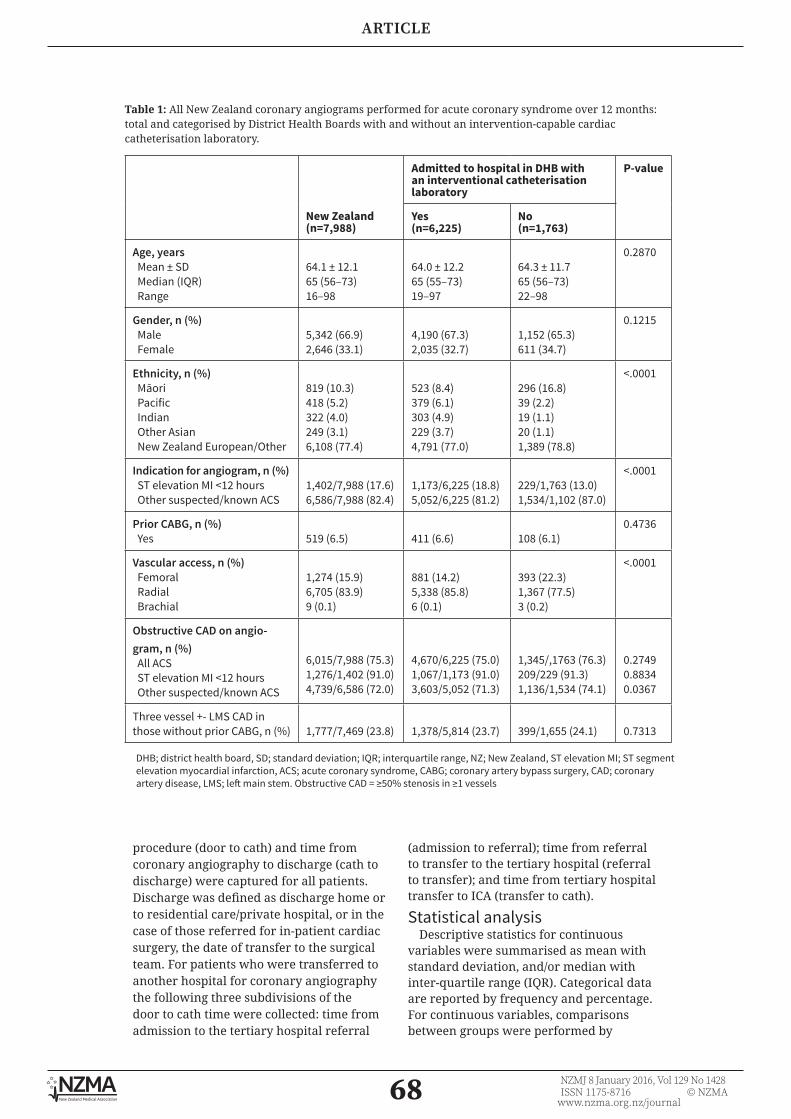
68 NZMJ 8 January 2016, Vol 129 No 1428ISSN 1175-8716 © NZMA
www.nzma.org.nz/journal
ARTICLE
Table 1: All New Zealand coronary angiograms performed for acute coronary syndrome over 12 months: total and categorised by District Health Boards with and without an intervention-capable cardiac catheterisation laboratory.
New Zealand(n=7,988)
Admitted to hospital in DHB with an interventional catheterisation laboratory
P-value
Yes(n=6,225)
No(n=1,763)
Age, years Mean ± SD Median (IQR) Range
64.1 ± 12.165 (56–73)16–98
64.0 ± 12.265 (55–73)19–97
64.3 ± 11.765 (56–73)22–98
0.2870
Gender, n (%) Male Female
5,342 (66.9)2,646 (33.1)
4,190 (67.3)2,035 (32.7)
1,152 (65.3)611 (34.7)
0.1215
Ethnicity, n (%) Māori Pacific Indian Other Asian New Zealand European/Other
819 (10.3)418 (5.2)322 (4.0)249 (3.1)6,108 (77.4)
523 (8.4)379 (6.1)303 (4.9)229 (3.7)4,791 (77.0)
296 (16.8)39 (2.2)19 (1.1)20 (1.1)1,389 (78.8)
<.0001
Indication for angiogram, n (%) ST elevation MI <12 hours Other suspected/known ACS
1,402/7,988 (17.6)6,586/7,988 (82.4)
1,173/6,225 (18.8)5,052/6,225 (81.2)
229/1,763 (13.0)1,534/1,102 (87.0)
<.0001
Prior CABG, n (%) Yes 519 (6.5) 411 (6.6) 108 (6.1)
0.4736
Vascular access, n (%) Femoral Radial Brachial
1,274 (15.9)6,705 (83.9)9 (0.1)
881 (14.2)5,338 (85.8)6 (0.1)
393 (22.3)1,367 (77.5)3 (0.2)
<.0001
Obstructive CAD on angio-gram, n (%) All ACS ST elevation MI <12 hours Other suspected/known ACS
6,015/7,988 (75.3)1,276/1,402 (91.0)4,739/6,586 (72.0)
4,670/6,225 (75.0)1,067/1,173 (91.0)3,603/5,052 (71.3)
1,345/,1763 (76.3)209/229 (91.3)1,136/1,534 (74.1)
0.27490.88340.0367
Three vessel +- LMS CAD in those without prior CABG, n (%) 1,777/7,469 (23.8) 1,378/5,814 (23.7) 399/1,655 (24.1) 0.7313
DHB; district health board, SD; standard deviation; IQR; interquartile range, NZ; New Zealand, ST elevation MI; ST segment elevation myocardial infarction, ACS; acute coronary syndrome, CABG; coronary artery bypass surgery, CAD; coronary artery disease, LMS; left main stem. Obstructive CAD = ≥50% stenosis in ≥1 vessels
procedure (door to cath) and time from coronary angiography to discharge (cath to discharge) were captured for all patients. Discharge was defined as discharge home or to residential care/private hospital, or in the case of those referred for in-patient cardiac surgery, the date of transfer to the surgical team. For patients who were transferred to another hospital for coronary angiography the following three subdivisions of the door to cath time were collected: time from admission to the tertiary hospital referral
(admission to referral); time from referral to transfer to the tertiary hospital (referral to transfer); and time from tertiary hospital transfer to ICA (transfer to cath).
Statistical analysisDescriptive statistics for continuous
variables were summarised as mean with standard deviation, and/or median with inter-quartile range (IQR). Categorical data are reported by frequency and percentage. For continuous variables, comparisons between groups were performed by
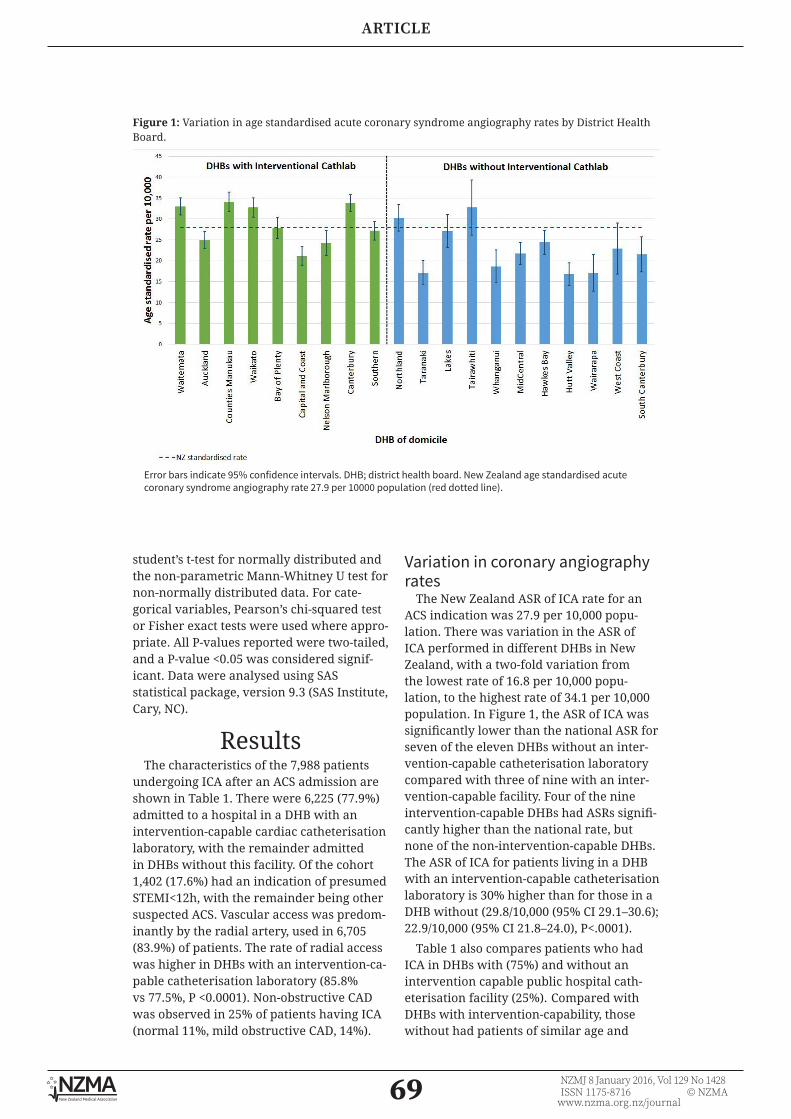
69 NZMJ 8 January 2016, Vol 129 No 1428ISSN 1175-8716 © NZMA
www.nzma.org.nz/journal
ARTICLE
student’s t-test for normally distributed and the non-parametric Mann-Whitney U test for non-normally distributed data. For cate-gorical variables, Pearson’s chi-squared test or Fisher exact tests were used where appro-priate. All P-values reported were two-tailed, and a P-value <0.05 was considered signif-icant. Data were analysed using SAS statistical package, version 9.3 (SAS Institute, Cary, NC).
ResultsThe characteristics of the 7,988 patients
undergoing ICA after an ACS admission are shown in Table 1. There were 6,225 (77.9%) admitted to a hospital in a DHB with an intervention-capable cardiac catheterisation laboratory, with the remainder admitted in DHBs without this facility. Of the cohort 1,402 (17.6%) had an indication of presumed STEMI<12h, with the remainder being other suspected ACS. Vascular access was predom-inantly by the radial artery, used in 6,705 (83.9%) of patients. The rate of radial access was higher in DHBs with an intervention-ca-pable catheterisation laboratory (85.8% vs 77.5%, P <0.0001). Non-obstructive CAD was observed in 25% of patients having ICA (normal 11%, mild obstructive CAD, 14%).
Variation in coronary angiography rates
The New Zealand ASR of ICA rate for an ACS indication was 27.9 per 10,000 popu-lation. There was variation in the ASR of ICA performed in different DHBs in New Zealand, with a two-fold variation from the lowest rate of 16.8 per 10,000 popu-lation, to the highest rate of 34.1 per 10,000 population. In Figure 1, the ASR of ICA was significantly lower than the national ASR for seven of the eleven DHBs without an inter-vention-capable catheterisation laboratory compared with three of nine with an inter-vention-capable facility. Four of the nine intervention-capable DHBs had ASRs signifi-cantly higher than the national rate, but none of the non-intervention-capable DHBs. The ASR of ICA for patients living in a DHB with an intervention-capable catheterisation laboratory is 30% higher than for those in a DHB without (29.8/10,000 (95% CI 29.1–30.6); 22.9/10,000 (95% CI 21.8–24.0), P<.0001).
Table 1 also compares patients who had ICA in DHBs with (75%) and without an intervention capable public hospital cath-eterisation facility (25%). Compared with DHBs with intervention-capability, those without had patients of similar age and
Figure 1: Variation in age standardised acute coronary syndrome angiography rates by District Health Board.
Error bars indicate 95% confidence intervals. DHB; district health board. New Zealand age standardised acute coronary syndrome angiography rate 27.9 per 10000 population (red dotted line).

70 NZMJ 8 January 2016, Vol 129 No 1428ISSN 1175-8716 © NZMA
www.nzma.org.nz/journal
ARTICLE
Figure 2: Proportion of acute coronary syndrome patients with obstructive coronary artery disease.
Error bars indicate 95% confidence intervals. DHB; district health board, CathLab; catheterisation laboratory. New Zealand proportion with obstructive coronary artery disease 75.3% (red dotted line).
Table 2: Delays in coronary angiography after acute coronary syndrome in District Health Boards with and without an interventional catheterisation laboratory.
DHBs with interventionalcatheterisation lab.
DHBs without interventional catheterisation lab.
P-value
Meeting the ACS 3-day target, n (%) STEMI <12 hrs Other suspected/known ACS
4,902/6,225 (78.7%)1,158/1,173 (98.7%)3,744/5,052 (74.1%)
1,198/1,763 (68.0%)217/229 (94.8%)981/1,534 (64.0%)
<.00010.0005<.0001
Admission to coronary angiography N Mean ± SD Median (IQR)
6,2222.26 ± 2.792 (0–3)
1,7612.87 ± 2.492 (1–4)
<.0001
Coronary angiography to discharge N Mean ± SD Median (IQR)
6,2252.98 ± 4.171 (1–3)
1,7633.22 ± 6.331 (1–3)
0.0709
Length of stay N Mean ± SD Median (IQR)
6,2235.24 ± 5.054 (2–6)
1,7636.08 ± 6.964 (3–7)
<.0001
DHB; district health board, SD; standard deviation; IQR; interquartile range.

71 NZMJ 8 January 2016, Vol 129 No 1428ISSN 1175-8716 © NZMA
www.nzma.org.nz/journal
ARTICLE
gender, but a higher proportion of Māori, and lower proportions of Pacific, Indian and other Asian ethnicities.
These results are based on whether the patient lives in a DHB with or without an intervention-capable catheterisation laboratory. However, several DHBs have a catheterisation laboratory which is not intervention-capable, and some DHBs have more than one hospital, only one of which has a catheterisation laboratory. When the analysis was repeated to compare acute patients initially admitted to a hospital with or without a cardiac catheterisation laboratory, the findings were similar (data not shown).
The proportion of all ACS patients with obstructive coronary disease was 75.3%, and was 91.0% in the sub-group presenting with suspected ST-elevation MI within 12 hours of symptom onset. There was relatively little variability across DHBs in the proportion of patients found to have obstructive CAD, ranging from a low of 68.9% to a high of 83.3% (Figure 2).
Patients from DHBs without interven-tion-capability were slightly more likely to have obstructive coronary artery disease when studied for a suspected non ST-segment elevation ACS, although there was no
difference in the proportion of patients with more severe coronary disease, three vessel and/or left main stem coronary disease.
Timing of coronary angiographyIn all patients with ACS, the median (IQR)
time from admission to ICA was 2 (1–3) days. Overall, 6,100 (76.4%) patients had ICA performed within 3 days of admission and the median (IQR) length of stay was 4 (3–6) days. When we compared the admission to ICA times across DHBs, the proportion of patients having ICA within 3 days of admission varied from 56.7% to 92.9% (Figure 3). In DHBs without intervention capability, fewer patients with ACS had ICA within 3 days of admission (68.0% vs 78.7%, p<0.0001) and time from admission to angiography was 0.61 days longer (Table 2). Nearly all patients with STEMI <12 hours had angiography within 3 days (Table 2, Figure A1). For other suspected/known ACS, all but one of the intervention-capable DHBs met the national 3-day target of at least 70% of patients, but only four of eleven non-intervention-capable DHBs achieved this target (Figure A2). The longer time from admission to angiography was the major contributor to the 0.84 days longer length-of-stay observed in DHBs without interventional capability.
Figure 3: Proportion of patients meeting the 3-day target; coronary angiography within 3 days of admission for those referred after acute coronary syndrome in District Health Boards with and without an interventional catheterisation laboratory.
Error bars indicate 95% confidence intervals. DHB; district health board. CathLab; catheterisation laboratory. New Zealand target of 70% having angiography ≤ 3 days of admission (red dotted line).
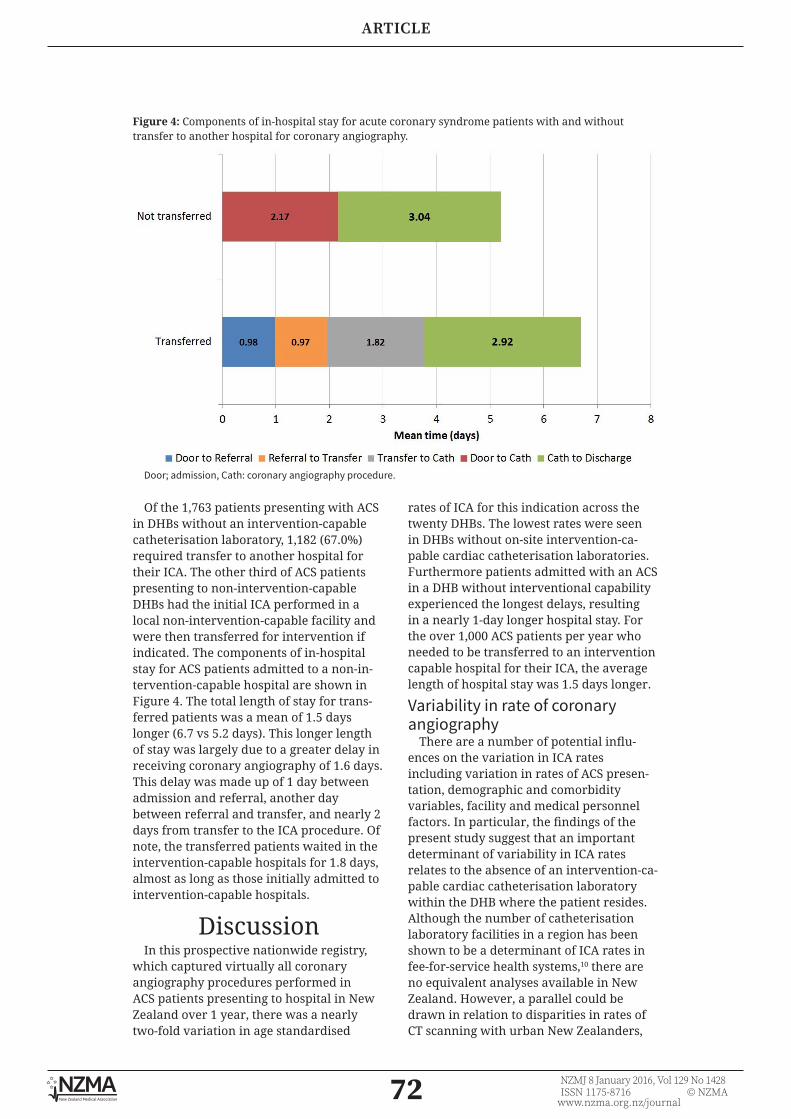
72 NZMJ 8 January 2016, Vol 129 No 1428ISSN 1175-8716 © NZMA
www.nzma.org.nz/journal
ARTICLE
Figure 4: Components of in-hospital stay for acute coronary syndrome patients with and without transfer to another hospital for coronary angiography.
Door; admission, Cath: coronary angiography procedure.
Of the 1,763 patients presenting with ACS in DHBs without an intervention-capable catheterisation laboratory, 1,182 (67.0%) required transfer to another hospital for their ICA. The other third of ACS patients presenting to non-intervention-capable DHBs had the initial ICA performed in a local non-intervention-capable facility and were then transferred for intervention if indicated. The components of in-hospital stay for ACS patients admitted to a non-in-tervention-capable hospital are shown in Figure 4. The total length of stay for trans-ferred patients was a mean of 1.5 days longer (6.7 vs 5.2 days). This longer length of stay was largely due to a greater delay in receiving coronary angiography of 1.6 days. This delay was made up of 1 day between admission and referral, another day between referral and transfer, and nearly 2 days from transfer to the ICA procedure. Of note, the transferred patients waited in the intervention-capable hospitals for 1.8 days, almost as long as those initially admitted to intervention-capable hospitals.
DiscussionIn this prospective nationwide registry,
which captured virtually all coronary angiography procedures performed in ACS patients presenting to hospital in New Zealand over 1 year, there was a nearly two-fold variation in age standardised
rates of ICA for this indication across the twenty DHBs. The lowest rates were seen in DHBs without on-site intervention-ca-pable cardiac catheterisation laboratories. Furthermore patients admitted with an ACS in a DHB without interventional capability experienced the longest delays, resulting in a nearly 1-day longer hospital stay. For the over 1,000 ACS patients per year who needed to be transferred to an intervention capable hospital for their ICA, the average length of hospital stay was 1.5 days longer.
Variability in rate of coronary angiography
There are a number of potential influ-ences on the variation in ICA rates including variation in rates of ACS presen-tation, demographic and comorbidity variables, facility and medical personnel factors. In particular, the findings of the present study suggest that an important determinant of variability in ICA rates relates to the absence of an intervention-ca-pable cardiac catheterisation laboratory within the DHB where the patient resides. Although the number of catheterisation laboratory facilities in a region has been shown to be a determinant of ICA rates in fee-for-service health systems,10 there are no equivalent analyses available in New Zealand. However, a parallel could be drawn in relation to disparities in rates of CT scanning with urban New Zealanders,

73 NZMJ 8 January 2016, Vol 129 No 1428ISSN 1175-8716 © NZMA
www.nzma.org.nz/journal
ARTICLE
shown to be 1.6 time more likely to have CT scans than rural New Zealanders without on-site CT scanning at their local hospital.11 This disparity was eliminated when on-site CT scanning facilities were introduced at one rural hospital.12
A further possible factor influencing the rate of ICA in ACS is the role of the medical decision maker. In New Zealand, patients are referred for coronary angiography by either cardiologists or general physicians/medical officers, depending on the size and location of the referring hospital, with smaller DHBs more often having general physicians caring for ACS patients. Although a difference by subspecialty training in referral pattern is a likely contributor to the variation between DHBs, it is interesting to note that there is important variation even across the intervention capable DHBs.
Logistically, it will not be possible to introduce intervention-capable cardiac catheterisation laboratories and employ cardiologists in all New Zealand hospitals. Therefore, in order to reduce the vari-ability in rates of ICA, the national and regional cardiac networks need to develop comprehensive clinical pathways aimed at eliminating barriers to timely patient trans-portation and ensuring equitable access to coronary angiography, regardless of geographic location.
Timeliness of coronary angiography in ACS patients
A previous study, including admissions between 2007 and 2010, reported a median admission to coronary angiography time of 3 (IQR 2–5) days, with only just over half having angiography within 3 days of admission.5 Similarly, the 2007 NZ ACS audit,13 found that only 59% of patients had ICA in under 5 days, with ACS patients presenting to a non-interventional centre waiting longer for angiography compared to those in interventional centres (median 5.1 vs 2.5 days). Subsequently, the NZ ACS audit group reported that in 2012 the median door-to-catheter time for ACS patients was 2.7 days. Again, patients with NSTEMI/unstable angina in non-intervention centres waited longer for angiography compared to those in interven-tional centres (median 3.8 vs 2.1 days).6
The findings in the present study indicate that, compared with the historical data,
there has been a substantial reduction in median time from admission to angi-ography to 2 (IQR 1–3) days for patients with ACS. This has occurred since national implementation of the ANZACS-QI “3-day door-to-catheter target” by the NZ Cardiac Clinical Network and Ministry of Health in 2013. Although a formal economic analysis has not yet been performed, the observed reduction in door-to-catheter times of approximately 1 day, relative to historical controls, of around 8,000 patients per year, represents an important ongoing saving for the DHBs. Patients admitted to DHBs without interventional-capable cardiac catheterisation laboratories still wait longer for coronary angiography, although the difference has reduced to 0.61 days. There has been a significant improvement in the proportion of patients having coronary angiography in a timely manner, with 76.4% having ICA within 3 days of admission. Of concern, there remains substantial variation according to DHB, with a range from 56.7% to 92.9% meeting the 3-day target. The variability is influ-enced by centres without interventional cardiac catheterisation laboratories having additional delays to ICA.
Delays to ICA in patients with NSTEMI presenting to hospitals without cardiac catheterisation laboratories has also been highlighted in the UK National Health Service in terms of both wasted bed days and delays in obtaining the prognostic benefit from early revascularisation.14 Our data suggest that for patients requiring transfer, there are important delays in referral, transfer and performance of ICA once the patient has been transferred. Attention to processes in each of these pre-ICA phases will help to reduce length-of-stay for patients admitted to hospitals without interventional cardiac catheter-isation laboratories. A recent UK study evaluated a protocol-driven early transfer process with a decision on transfer made within 1 hour of diagnosis, resulting in a substantial reduction in admission to ICA time to a median 1 (IQR 0.7–2.0) day.15
We propose a modification of this approach appropriate to New Zealand, which is characterised by a geographi-cally-dispersed population and smaller regional centres. It is recommended that

74 NZMJ 8 January 2016, Vol 129 No 1428ISSN 1175-8716 © NZMA
www.nzma.org.nz/journal
ARTICLE
the national and regional cardiac networks develop protocols requiring referral of patients with ACS admitted to hospitals without cardiac catheterisation labora-tories at the time of first diagnosis to the regional PCI capable hospital. This would facilitate early triage of patients, with immediate transfer of high-risk STEMI and NSTEMI patients who will obtain the greatest clinical benefit from early angi-ography. The remaining ACS patients suitable for coronary angiography would have immediate formulation of transfer plans, with transfer for angiography generally occurring the morning after the day of admission. This approach would have patients transferred to a PCI-capable hospital no later than 1 day after their admission, and is likely to largely elim-inate the current delay to angiography for patients admitted to a hospital without an interventional cardiac catheterisation laboratory. Consultation with the ambu-lance service to plan for timely transfer of patients, and dedicated beds at the referral PCI-capable hospital, are an important part of developing such a protocol.16 ANZACS-QI has just begun to report the components of the “door-to-catheterisation” delay for each hospital. These components include the time from admission to referral, transfer delay, and time from arrival at the PCI-ca-pable hospital to angiography. This should facilitate the identification of where in the overall system the delays are occurring, and guide development of the specific process improvements required.
What are the consequences of lower rates of and delayed coronary angiography?
Previous NZ ACS audits have shown lower rates of coronary angiography in non-in-terventional centres for patients admitted with definite ACS (58% vs 49%), trans-lating into lower rates of revascularisation (41% vs 32%).6 Meta-analysis in patients
with NSTEMI has shown higher rates of ICA and revascularisation are associated with reductions in: mortality; recurrent myocardial infarction; and rehospitalisation for unstable angina.17 Delays in timing of ICA are associated with increased rates of recurrent ischaemia and an increase in hospital stay.18 These results indicate the potential for adverse events faced by patients admitted to New Zealand hospitals without interventional cardiac catheteri-sation laboratories.
Rate of non-obstructive CAD at angiography
The overall rate of non-obstructive coronary artery disease was 25% in New Zealand hospitals, with relatively little variation across DHBs, implying consistent patient selection across the country. Previous angiographic studies of patients presenting with ACS have reported rates from 10% to 25% of non-obstructive coronary artery disease.19-22 The important clinical finding identified in these studies is that patients presenting with ACS and non-obstructive coronary artery disease have an increased risk of long-term recurrent ischaemic events and require similar aggressive medical therapy to those with obstructive coronary artery disease.20,22
ConclusionsThere is significant variability between
DHBs in the overall rates of coronary angi-ography performed, and in the timing of coronary angiography amongst those with ACS. Compared with prior data, the delay from admission to angiography for these patients has improved. However, patients admitted in DHBs without interventional cardiac catheterisation laboratories still experience a longer delay from admission to ICA, resulting in a longer length of hospital stay. Structural changes to regional cardiac pathways are required to address these discrepancies.
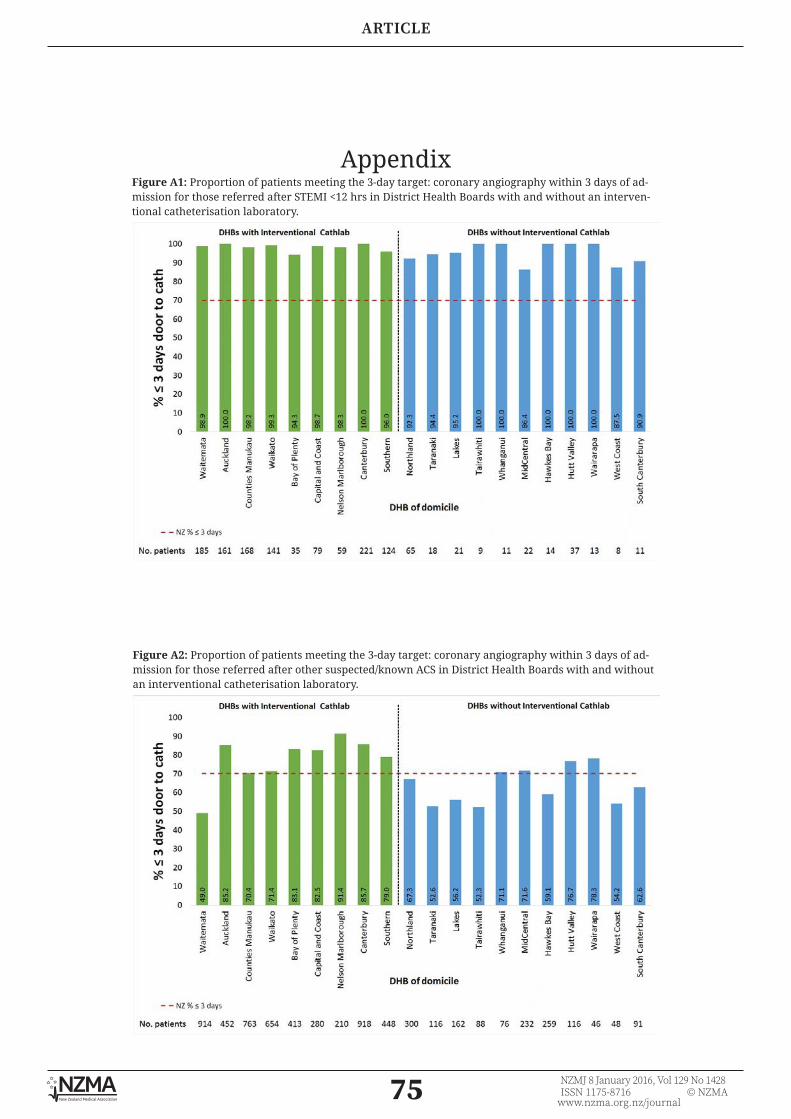
75 NZMJ 8 January 2016, Vol 129 No 1428ISSN 1175-8716 © NZMA
www.nzma.org.nz/journal
ARTICLE
AppendixFigure A1: Proportion of patients meeting the 3-day target: coronary angiography within 3 days of ad-mission for those referred after STEMI <12 hrs in District Health Boards with and without an interven-tional catheterisation laboratory.
Figure A2: Proportion of patients meeting the 3-day target: coronary angiography within 3 days of ad-mission for those referred after other suspected/known ACS in District Health Boards with and without an interventional catheterisation laboratory.
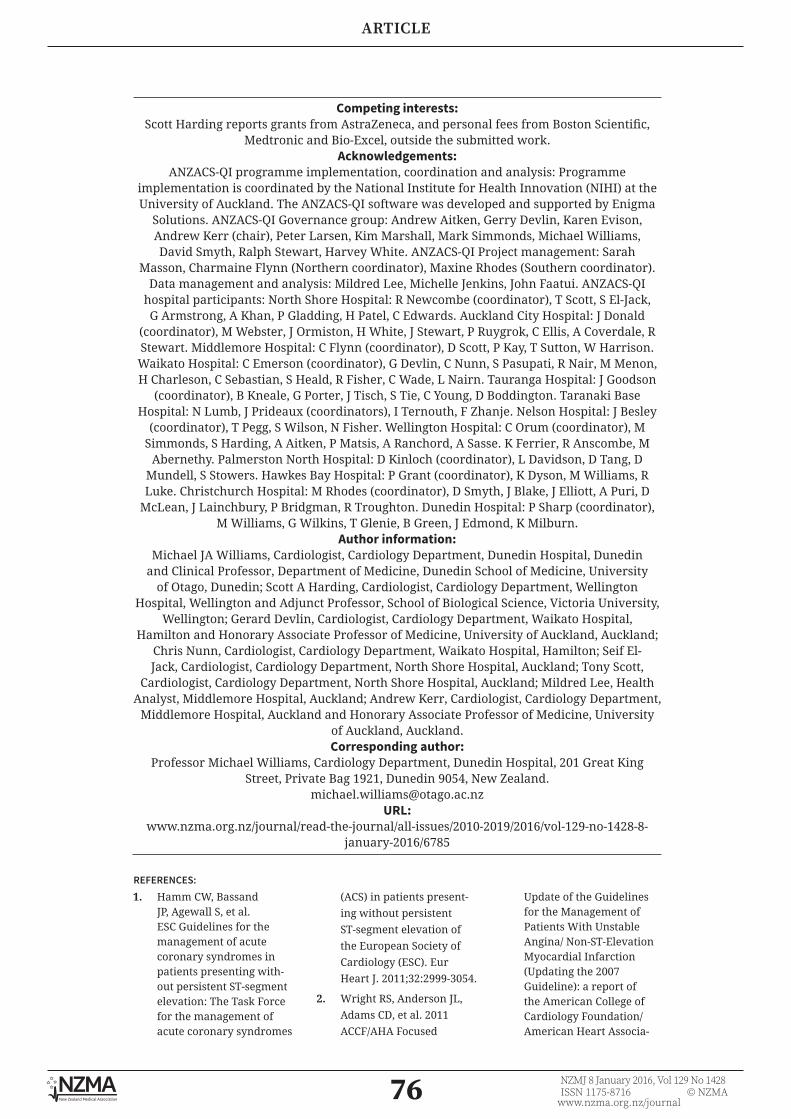
76 NZMJ 8 January 2016, Vol 129 No 1428ISSN 1175-8716 © NZMA
www.nzma.org.nz/journal
ARTICLE
REFERENCES:
Competing interests: Scott Harding reports grants from AstraZeneca, and personal fees from Boston Scientific,
Medtronic and Bio-Excel, outside the submitted work.Acknowledgements:
ANZACS-QI programme implementation, coordination and analysis: Programme implementation is coordinated by the National Institute for Health Innovation (NIHI) at the University of Auckland. The ANZACS-QI software was developed and supported by Enigma
Solutions. ANZACS-QI Governance group: Andrew Aitken, Gerry Devlin, Karen Evison, Andrew Kerr (chair), Peter Larsen, Kim Marshall, Mark Simmonds, Michael Williams, David Smyth, Ralph Stewart, Harvey White. ANZACS-QI Project management: Sarah
Masson, Charmaine Flynn (Northern coordinator), Maxine Rhodes (Southern coordinator). Data management and analysis: Mildred Lee, Michelle Jenkins, John Faatui. ANZACS-QI
hospital participants: North Shore Hospital: R Newcombe (coordinator), T Scott, S El-Jack, G Armstrong, A Khan, P Gladding, H Patel, C Edwards. Auckland City Hospital: J Donald
(coordinator), M Webster, J Ormiston, H White, J Stewart, P Ruygrok, C Ellis, A Coverdale, R Stewart. Middlemore Hospital: C Flynn (coordinator), D Scott, P Kay, T Sutton, W Harrison. Waikato Hospital: C Emerson (coordinator), G Devlin, C Nunn, S Pasupati, R Nair, M Menon, H Charleson, C Sebastian, S Heald, R Fisher, C Wade, L Nairn. Tauranga Hospital: J Goodson
(coordinator), B Kneale, G Porter, J Tisch, S Tie, C Young, D Boddington. Taranaki Base Hospital: N Lumb, J Prideaux (coordinators), I Ternouth, F Zhanje. Nelson Hospital: J Besley
(coordinator), T Pegg, S Wilson, N Fisher. Wellington Hospital: C Orum (coordinator), M Simmonds, S Harding, A Aitken, P Matsis, A Ranchord, A Sasse. K Ferrier, R Anscombe, M
Abernethy. Palmerston North Hospital: D Kinloch (coordinator), L Davidson, D Tang, D Mundell, S Stowers. Hawkes Bay Hospital: P Grant (coordinator), K Dyson, M Williams, R Luke. Christchurch Hospital: M Rhodes (coordinator), D Smyth, J Blake, J Elliott, A Puri, D
McLean, J Lainchbury, P Bridgman, R Troughton. Dunedin Hospital: P Sharp (coordinator), M Williams, G Wilkins, T Glenie, B Green, J Edmond, K Milburn.
Author information:Michael JA Williams, Cardiologist, Cardiology Department, Dunedin Hospital, Dunedin
and Clinical Professor, Department of Medicine, Dunedin School of Medicine, University of Otago, Dunedin; Scott A Harding, Cardiologist, Cardiology Department, Wellington
Hospital, Wellington and Adjunct Professor, School of Biological Science, Victoria University, Wellington; Gerard Devlin, Cardiologist, Cardiology Department, Waikato Hospital,
Hamilton and Honorary Associate Professor of Medicine, University of Auckland, Auckland; Chris Nunn, Cardiologist, Cardiology Department, Waikato Hospital, Hamilton; Seif El-Jack, Cardiologist, Cardiology Department, North Shore Hospital, Auckland; Tony Scott,
Cardiologist, Cardiology Department, North Shore Hospital, Auckland; Mildred Lee, Health Analyst, Middlemore Hospital, Auckland; Andrew Kerr, Cardiologist, Cardiology Department,
Middlemore Hospital, Auckland and Honorary Associate Professor of Medicine, University of Auckland, Auckland.Corresponding author:
Professor Michael Williams, Cardiology Department, Dunedin Hospital, 201 Great King Street, Private Bag 1921, Dunedin 9054, New Zealand.
www.nzma.org.nz/journal/read-the-journal/all-issues/2010-2019/2016/vol-129-no-1428-8-january-2016/6785
1. Hamm CW, Bassand JP, Agewall S, et al. ESC Guidelines for the management of acute coronary syndromes in patients presenting with-out persistent ST-segment elevation: The Task Force for the management of acute coronary syndromes
(ACS) in patients present-ing without persistent ST-segment elevation of the European Society of Cardiology (ESC). Eur Heart J. 2011;32:2999-3054.
2. Wright RS, Anderson JL, Adams CD, et al. 2011 ACCF/AHA Focused
Update of the Guidelines for the Management of Patients With Unstable Angina/ Non-ST-Elevation Myocardial Infarction (Updating the 2007 Guideline): a report of the American College of Cardiology Foundation/American Heart Associa-

77 NZMJ 8 January 2016, Vol 129 No 1428ISSN 1175-8716 © NZMA
www.nzma.org.nz/journal
ARTICLE
tion Task Force on Practice Guidelines. Circulation. 2011;123:2022-60.
3. Patel MR, Bailey SR, Bonow RO, et al. ACCF/SCAI/AATS/AHA/ASE/ASNC/HFSA/HRS/SCCM/SCCT/SCMR/STS 2012 appro-priate use criteria for diagnostic catheterization: a report of the American College of Cardiology Foundation Appropriate Use Criteria Task Force, Society for Cardiovas-cular Angiography and Interventions, American Association for Thoracic Surgery, American Heart Association, American Society of Echocardiog-raphy, American Society of Nuclear Cardiology, Heart Failure Society of America, Heart Rhythm Society, Society of Critical Care Medicine, Society of Cardiovascular Computed Tomography, Society for Cardiovascular Magnetic Resonance, and Society of Thoracic Surgeons. J Am Coll Cardiol. 2012;59:1995-2027.
4. Non ST-Elevation Acute Coronary Syndrome Guidelines Group and the New Zealand Branch of the Cardiac Society of Australia and New Zealand. New Zealand 2012 guidelines for the management of non ST-elevation acute coronary syndromes. N Z Med J. 2012;125:122-47.
5. Kerr AJ, Lin A, Lee M, et al. Risk stratification and timing of coronary angiography in acute coronary syndromes: are we targeting the right patients in a timely manner? (ANZACS-QI 1). N Z Med J. 2013;126:69-80.
6. Ellis C, Gamble G, Devlin G, et al. The management of acute coronary syndrome patients across New
Zealand in 2012: results of a third comprehensive nationwide audit and observations of current interventional care. N Z Med J. 2013;126:36-68.
7. Voss J, Martin A, Caldwell I, et al. How long do acute coronary syndrome patients wait for reperfu-sion, diagnostic coronary angiography and surgical revascularisation? N Z Med J. 2013;126:38-48.
8. Eurostat European Commission. Revision of the European Standard Population: Report of Eurostat’s task force. Luxembourg: Publi-cations Office of the European Union, 2013.
9. Statistics New Zealand. Projections produced by Statistics New Zealand according to assump-tions specified by the Ministry of Health. Wellington, 2014.
10. Wennberg D, Dickens J, Jr., Soule D, et al. The relationship between the supply of cardiac cathe-terization laboratories, cardiologists and the use of invasive cardiac proce-dures in northern New England. J Health Serv Res Policy. 1997;2:75-80.
11. Nixon G, Samaranayaka A, de Graaf B, et al. Geographic disparities in the utilisation of computed tomography scanning services in southern New Zealand. Health Policy. 2014;118:222-8.
12. Nixon G, Samaranayaka A, de Graaf B, et al. The impact of a rural scanner in overcoming urban versus rural disparities in the utilisation of computed tomography. Aust J Rural Health. 2015;23:150-4.
13. Ellis C, Devlin G, Elliott J, et al. ACS patients in New Zealand experience significant delays to access
cardiac investigations and revascularisation treatment especially when admitted to non-in-terventional centres: results of the second comprehensive national audit of ACS patients. N Z Med J. 2010;123:44-60.
14. Bellenger NG, Eichhofer J, Crone D, Curzen N. Hospi-tal stay in patients with non-ST-elevation acute coronary syndromes. Lancet. 2004;363:1399-400.
15. Gallagher SM, Lovell MJ, Jones DA, et al. Does a ‘direct’ transfer protocol reduce time to coronary angiography for patients with non-ST-el-evation acute coronary syndromes? A prospective observational study. BMJ Open. 2014;4:e005525.
16. Bellenger NG, Wells T, Hitchcock R, et al. Reducing transfer times for coronary angiography in patients with acute coronary syndromes: one solution to a national problem. Postgrad Med J. 2006;82:411-3.
17. Bavry AA, Kumbhani DJ, Rassi AN, et al. Benefit of early invasive ther-apy in acute coronary syndromes: a meta-anal-ysis of contemporary randomized clinical trials. J Am Coll Cardiol. 2006;48:1319-25.
18. Katritsis DG, Siontis GC, Kastrati A, et al. Optimal timing of coronary angiography and poten-tial intervention in non-ST-elevation acute coronary syndromes. Eur Heart J. 2011;32:32-40.
19. De Ferrari GM, Fox KA, White JA, et al. Outcomes among non-ST-segment elevation acute coronary syndromes patients with no angiographically obstructive coronary artery disease: observa-

78 NZMJ 8 January 2016, Vol 129 No 1428ISSN 1175-8716 © NZMA
www.nzma.org.nz/journal
ARTICLE
tions from 37,101 patients. Eur Heart J Acute Cardio-vasc Care. 2014;3:37-45.
20. Rossini R, Capodanno D, Lettieri C, et al. Long-term outcomes of patients with acute coronary syndrome and nonobstructive coro-nary artery disease. Am J
Cardiol. 2013;112:150-5.
21. Chokshi NP, Iqbal SN, Berger RL, et al. Sex and race are associated with the absence of epicar-dial coronary artery obstructive disease at angiography in patients with acute coronary
syndromes. Clin Cardiol. 2010;33:495-501.
22. Bugiardini R, Bairey Merz CN. Angina with “normal” coronary arteries: a changing philosophy. JAMA. 2005;293:477-84.

79 NZMJ 8 January 2016, Vol 129 No 1428ISSN 1175-8716 © NZMA
www.nzma.org.nz/journal
CLINICAL CORRESPONDENCE
Guillain-Barré Syndrome presenting as facial diplegiaRajnish Singh, Ulka Kamble, Brijesh Sharma, Palden w Bhutia, Saurabh
Shishir, Antony Wilson
Guillain-Barré Syndrome (GBS) typi-cally presents as ascending paralysis. GBS presenting as simultaneous
bilateral facial palsy is very uncommon. We report a case of GBS presenting as facial diplegia without any limb weakness.
Case reportA 48-year-old housewife presented with
complaints of loose motions for 5 days, followed by sudden onset difficulty in chewing along with dribbling of saliva for 3 days. She was not able to smile or blow and close her eyes. There was no history of limb weakness, numbness, bowel or bladder symptoms, earache or discharge, headache, fever, skin lesions, joint pain, vertigo, visual disturbances or altered sensorium.
She had a known case of hypertension on irregular treatment, and had been suffering from impaired hearing for the last 5 years.
On examination, the patient was conscious with a regular pulse of 104/min, BP of 100/70 mm of Hg and respi-ratory rate of 16/min. CNS examination revealed bilateral infra-nuclear palsy of seventh cranial nerves (Figures 1 & 2a ). Rinne test was negative bilaterally, with Weber test lateralised to left ear. Other cranial nerves were found normal on examination. Planters were flexor, while all the deep tendon reflexes were absent. Power was normal in all four limbs, but vibration and joint position sensations were impaired below the knees. Romberg’s test was positive. There were no cerebellar or meningeal signs. Fundus was normal.
Figure 1: Inability to close eyes.
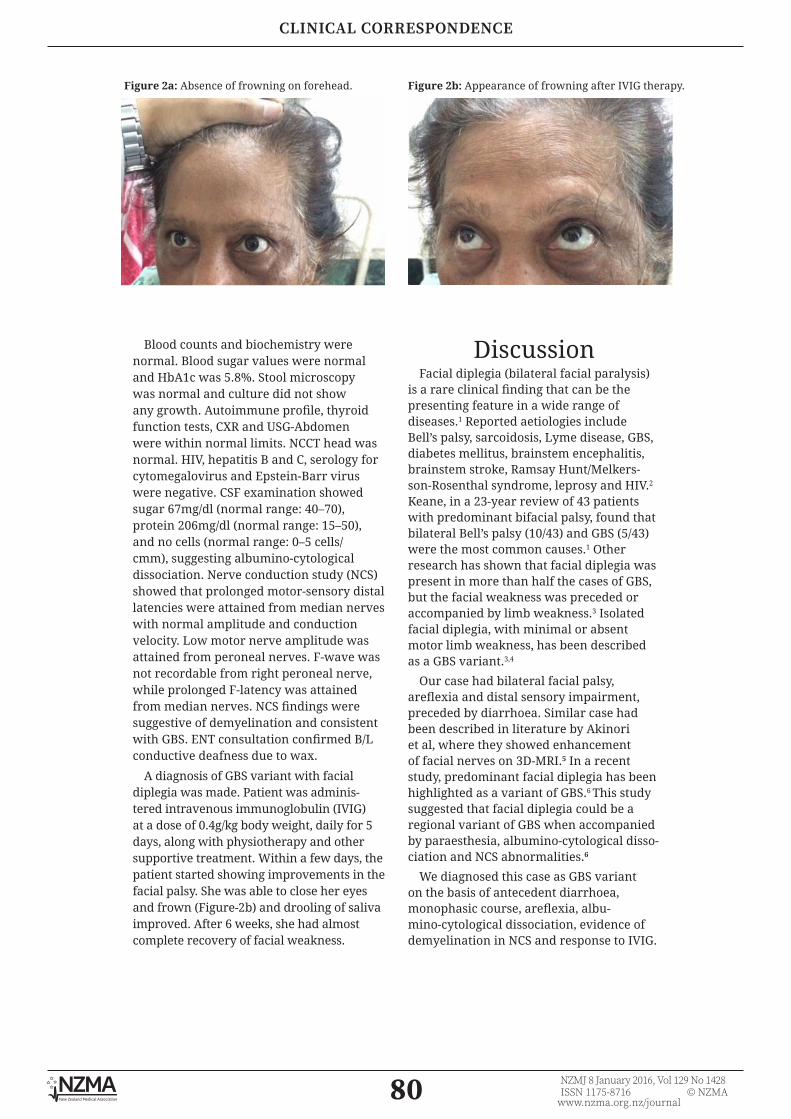
80 NZMJ 8 January 2016, Vol 129 No 1428ISSN 1175-8716 © NZMA
www.nzma.org.nz/journal
CLINICAL CORRESPONDENCE
Blood counts and biochemistry were normal. Blood sugar values were normal and HbA1c was 5.8%. Stool microscopy was normal and culture did not show any growth. Autoimmune profile, thyroid function tests, CXR and USG-Abdomen were within normal limits. NCCT head was normal. HIV, hepatitis B and C, serology for cytomegalovirus and Epstein-Barr virus were negative. CSF examination showed sugar 67mg/dl (normal range: 40–70), protein 206mg/dl (normal range: 15–50), and no cells (normal range: 0–5 cells/cmm), suggesting albumino-cytological dissociation. Nerve conduction study (NCS) showed that prolonged motor-sensory distal latencies were attained from median nerves with normal amplitude and conduction velocity. Low motor nerve amplitude was attained from peroneal nerves. F-wave was not recordable from right peroneal nerve, while prolonged F-latency was attained from median nerves. NCS findings were suggestive of demyelination and consistent with GBS. ENT consultation confirmed B/L conductive deafness due to wax.
A diagnosis of GBS variant with facial diplegia was made. Patient was adminis-tered intravenous immunoglobulin (IVIG) at a dose of 0.4g/kg body weight, daily for 5 days, along with physiotherapy and other supportive treatment. Within a few days, the patient started showing improvements in the facial palsy. She was able to close her eyes and frown (Figure-2b) and drooling of saliva improved. After 6 weeks, she had almost complete recovery of facial weakness.
Discussion Facial diplegia (bilateral facial paralysis)
is a rare clinical finding that can be the presenting feature in a wide range of diseases.1 Reported aetiologies include Bell’s palsy, sarcoidosis, Lyme disease, GBS, diabetes mellitus, brainstem encephalitis, brainstem stroke, Ramsay Hunt/Melkers-son-Rosenthal syndrome, leprosy and HIV.2 Keane, in a 23-year review of 43 patients with predominant bifacial palsy, found that bilateral Bell’s palsy (10/43) and GBS (5/43) were the most common causes.1 Other research has shown that facial diplegia was present in more than half the cases of GBS, but the facial weakness was preceded or accompanied by limb weakness.3 Isolated facial diplegia, with minimal or absent motor limb weakness, has been described as a GBS variant.3,4
Our case had bilateral facial palsy, areflexia and distal sensory impairment, preceded by diarrhoea. Similar case had been described in literature by Akinori et al, where they showed enhancement of facial nerves on 3D-MRI.5 In a recent study, predominant facial diplegia has been highlighted as a variant of GBS.6 This study suggested that facial diplegia could be a regional variant of GBS when accompanied by paraesthesia, albumino-cytological disso-ciation and NCS abnormalities.6
We diagnosed this case as GBS variant on the basis of antecedent diarrhoea, monophasic course, areflexia, albu-mino-cytological dissociation, evidence of demyelination in NCS and response to IVIG.
Figure 2a: Absence of frowning on forehead. Figure 2b: Appearance of frowning after IVIG therapy.

81 NZMJ 8 January 2016, Vol 129 No 1428ISSN 1175-8716 © NZMA
www.nzma.org.nz/journal
CLINICAL CORRESPONDENCE
1. Keane JR. Bilateral seventh nerve palsy: Analysis of 43 cases and review of the literature. Neurology 1994; 44:1198-202.
2. Ramakrishnan TCR, Ramesh S, Senthil V. Facial diplegia: a misleading GBS variant. JCR 2013; 3:267-71.
3. Ropper AH. Unusual clinical variants and signs in Guillain-Barre’
syndrome. Arch Neurol 1986; 43:1 1 50-2.
4. Tan EK, Lim SH, Wong MC, Chan LL. Facial diplegia: cranial variant of GB syndrome?J R Soc Med 1999;92(1):26-27.
5. Akinori H, Yuki N, Kaoru Y, K Hirata. Facial diplegia with paresthesiaas: facial nerve enhancement in three dimensional MRI.
J Neurol Neurosurg Psych 1999; 688-697
6. Kim JK, Oh SY, Sohn EH, Hong YH, Jun SM, Bae JS. When is facial diplegia regarded as a variant of Guillain-Barre’ syndrome? Journal of the Peripheral Nervous System 2015; 20: 32–36. doi: 10.1111/jns.12115
REFERENCES:
Competing interests: NilAuthor information:
Rajnish Singh, Department of Medicine, Ram Manohar Lohia Hospital, New Delhi, India; Ulka Kamble, Medicine, Ram Manohar Lohia Hospital, New Delhi, India; Brijesh Shar-
ma, Internal Medicine, Ram Manohar Lohia Hospital, New Delhi, India; Palden W Bhutia, Medicine, Ram Manohar Lohia Hospital, New Delhi, India; Saurabh Shishir, Medicine, Ram Manohar Lohia Hospital, New Delhi, India; Antony Wilson, Medicine, Ram Manohar Lohia
Hospital, New Delhi, India.Corresponding author:
Rajnish Singh, Department of Medicine, Ram Manohar Lohia Hospital, New Delhi, [email protected]
URL:www.nzma.org.nz/journal/read-the-journal/all-issues/2010-2019/2016/vol-129-no-1428-8-
january-2016/6786
DRAFT
82 NZMJ 8 January 2016, Vol 129 No 1428ISSN 1175-8716 © NZMA
www.nzma.org.nz/journal
LETTERS
Association between reported levels of physical
activity and depressive symptoms: data from a
population-based survey of New Zealand young people
Sarah Hudson, Joanna White, Karen McBride-Henry
DDepression prevalence is growing, and the disorder is a leading cause of disability worldwide.1,2 Depressive
disorders typically start in adolescence, are recurrent, and are linked with suicide, poorer health, education and social out-comes for young people.3 It is important to identify factors that mitigate or decrease the risk of developing depression for young people. Internationally, research shows that physical activity (PA) is a behaviour associated with favourable mental health outcomes for young people.4,5 The current study set out to investigate the relationship between PA and depression among young people in New Zealand. In New Zealand, the Ministry of Health recommends that at least 30 minutes of moderate physical activity (ie, brisk walking) is required for health benefits on most days of the week for those aged over 18 years, and at least 60 minutes of moderate exercise on most days of the week for those aged 5-18 years.7 This study assessed the association between adherence to these guidelines and the level of depres-sive symptoms reported.
MethodsOur data were collected from the Health
and Lifestyles Survey (HLS), a nationally representative biennial survey where indi-viduals aged 15 years-and-over provide information on their health behaviours and attitudes. The sampling and fieldwork procedure of the HLS is discussed else-where.8 This study analysed the responses from 293 young people (15-24 years). The sample was weighted to ensure that the results were nationally representative.
Depressive symptoms were measured using the PHQ-9 depression scale.9 Scores on the PHQ-9 range from 0-27, with a lower score indicating fewer depressive symptoms. A score of 0-4 indicates none or minimal depression, 5-9 mild depression, and 10 or greater moderate to severe depression. Physical activity was measured using the New Zealand Physical Activity Questionnaire Short Form (NZPAQ-SF), which asked participants how much time they had spent brisk walking, in moderate activity and in vigorous activity in the previous seven days. Physical activity was calculated as: brisk walking + moderate + (vigorous x 2); that is, one minute of vigorous activity was equated with two minutes of moderate intensity activity. Respondents were classified as meeting
LETTERS

DRAFT
83 NZMJ 8 January 2016, Vol 129 No 1428ISSN 1175-8716 © NZMA
www.nzma.org.nz/journal
the physical activity guidelines if they had done at least 30 minutes of physical activity per day on five or more days during the previous week.
There were no significant associations between PHQ-9 score and either gender, ethnicity or socio-economic deprivation among this age group, so we did not adjust for these factors in the analyses.
ResultsOverall, 66.3% (95% confidence interval,
54.8-77.8) of young people had none or minimal depression. Some 20.8% (9.3-32.4%) had mild depression, and 12.9% (5.6-20.1) had moderate to severe depression. Around one-half (49.0%, 38.1-59.8) were classified as meeting the physical activity guidelines.
An analysis of variance showed that the effect of physical activity on PHQ-9 score among young people was significant, F(1,345)=5.01, p=0.026. Post hoc analysis using the Bonferroni correction indicated that the mean PHQ-9 score was significantly lower among young people who met the physical activity guidelines (M=3.4, 95% CI=2.3-4.4) compared with those do did not (M=6.1, 95% CI=3.7-8.4), F(1,345)=4.72, p=0.030.
The rate of moderate to severe depression among young people who did not meet the physical activity guidelines was more than 10 times greater than among those who did meet the guidelines (25.1% compared with 2.4%, respectively) (see Table 1).
Table 1. Proportion of young people who were categorised as having none or minimal, mild, or moderate depression, by whether or not they met the physical activity guidelines
Depressive symptoms Met the physical activity guidelines
Did not meet the physical activity
guidelines% (95% CI)
None or minimal 71.5 (52.1-91.0) 58.6 (44.1-73.1)
Mild 26.1 (5.3-46.9) 16.3 (7.4-25.3)
Moderate to severe 2.4 (-.07-5.5) 25.1 (11.4-38.7)
DiscussionTaken together, the results suggest that
young New Zealanders who undertake suffi-cient physical activity have fewer depressive symptoms; however, causality cannot be inferred from our results, and limited evidence is available on the mechanism that explains the association between physical activity and depression in young people.3 It may be that physical activity reduces the risk of depression because exercise stimu-lates chemicals such as endorphins, which lead to elevated mood, a link that has also been explored in the adult population.10 It is also possible that negative symptoms of depression lead to less physical activity as a result of fatigue and lethargy characteristic of the disorder. For example, a key feature of depression is anhedonia, or an inability to experience pleasure, which may cause individuals to avoid physical activities that they formerly enjoyed.11 Further, the asso-
ciation between physical and depression among young people may well be bidirec-tional. Longitudinal research is needed to determine the direction of the relationship and clarify the underlying mechanisms, a call that has also been made by other researchers.3
The New Zealand National Depression Initiative (NDI) is a national campaign aimed to reduce the impact of depression by raising awareness and supporting early recognition and treatment.7 Therefore, it is particularly important to understand the mechanisms that underlie the association between physical activity and depression to inform recommendations to public health programmes and strategies. If the present results provide an accurate reflection of the physical activity levels of young New Zealanders, then this research may indicate the need to support physical activity oppor-tunities for this group.
LETTERS

DRAFT
84 NZMJ 8 January 2016, Vol 129 No 1428ISSN 1175-8716 © NZMA
www.nzma.org.nz/journal
Competing interests: NilAuthor information:
Sarah Hudson, Intermediate Researcher, Research and Evaluation Unit, Health Promotion Agency, Wellington. Joanna White, Intermediate Researcher, Research and Evaluation Unit,
Health Promotion Agency, Wellington. Karen McBride-Henry, Principal Researcher, Re-search and Evaluation Unit, Health Promotion Agency, Wellington
.Corresponding author:
Sarah Hudson, Intermediate Researcher, Research and Evaluation Unit, Health Promotion Agency, Wellington. 04 912 0314. [email protected]
URL:www.nzma.org.nz/journal/read-the-journal/all-issues/2010-2019/2016/vol-129-no-1428-8-
january-2016/6791
REFERENCES:
1. Kessler, RC, Berglund P, Demler O, Jin R, Koretz D, Merikangas KR, Wang PS. The epidemiology of major depressive disorder: Results from the National Comorbidity Survey Replication (NCS-R). JAMA: Journal of the American Medical Association, 2003; 289(23), 3095-3105.
2. Kessler R, Bromet E. The epidemiology of depres-sion across cultures. Annual Review of Public Health, 2014; 34, 119-138.
3. Thapar A, Collishaw S, Pine D, Tharpar A. Depression in adoles-cence. Lancet, 2012; 17(379), 1056-1067.
4. Kirkcaldy BD, Shephard RJ, Siefen RG. The relation-ship between physical activity and self-image and problem behaviour among adolescents. Social Psychiatry and Psychiatric Epidemiology, 2002; 37(11), 544-50. doi:http://dx.doi.org.helicon.vuw.ac.nz/10.1007/s00127-002-0554-7
5. Ussher MH, Owen CG, Cook DG, Whincup PH. The relationship between physical activity, sedentary behaviour and psychological wellbeing among adolescents. Social Psychiatry and Psychiatric Epidemiol-ogy, 2007; 42(10):851-6. Epub 2007 Jul 17.
6. Wiles NJ, Haase AM, Lawlor DA, Ness A, Lewis G. Physical activity and depression in adolescents: Cross-sectional findings from the ALSPAC cohort. Social Psychiatry and Psychiatric Epidemiology, 2012; 47(7), 1023-33. doi: http://dx.doi.org.helicon.vuw.ac.nz/10.1007/s00127-011-0422-4
7. Ministry of Health. Questions and Answers - National Depression Initiative. 2006. Retrieved December 15, 2015, from http://www.health.govt.nz/our-work/mental-health-and-addictions/national-depression-initiative/questions-and-answers-
national-depres-sion-initiative
8. Health Promotion Agency. 2014 Health and Lifestyles Survey: Methodology report. Wellington: Health Promotion Agency Research and Evaluation Unit. 2015.
9. Kroenke K, Spitzer RL, Williams JB. The PHQ-9: Validity of a brief depres-sion severity measure. Journal of General Internal Medicine, 2001;16, 606-13.
10. Craft L, Perna F. The benefits of exercise for the clinically depressed. Primary Care Companion Journal of Clinical Psychi-atry, 2014;6(3), 104-111.
11. American Psychiatric Association. Diagnostic and Statistical Manual of Mental Disorders (Fifth ed.). Arlington, VA: American Psychiatric Association. 2013
LETTERSLETTERS

DRAFT
85 NZMJ 8 January 2016, Vol 129 No 1428ISSN 1175-8716 © NZMA
www.nzma.org.nz/journal
Lessons in courage from the past: lest we forget
Frank Houghton
LETTERS
New Zealand, Aotearoa or ‘Land of the long white cloud’: Attention on the nomenclature of this country has
tended to focus in recent years on moves towards inclusion of Māori terminology. Originally called Staten Landt by Dutch Seaman Abel Tasman in 1642, this was subsequently changed over time to the Latin Nova Zeelandia, the Dutch Nieuw Zeeland and finally the English New Zealand. However, more attention to its European namesake origins as a Dutch province provides an often overlooked link to the Netherlands that may be of interest to physicians and health sector employees.
Perhaps one of the most important lessons that can be learned from this link to the Netherlands is the inspiring example of an almost united front presented by Dutch physicians to Nazi occupation in World War II. Although revisionist historians have challenged the depth of Dutch resis-tance to Nazi occupation,1 the response of Dutch physicians remains both emotive and instructive.2
Although the timeline from German invasion (10 May 1940) until the surrender of the Netherlands (14 May 1940) was a mere five days, resistance in the medical profession continued to grow throughout the war.3-4 Alexander5 provides a concise summary of their resistance:6
There is no doubt that in Germany itself, the first and foremost effective step… was the propaganda barrage…It is to the everlasting honor of the medical profession of Holland that they recognized the earliest and most subtle phases of this attempt and rejected it. When Seiss-Inquart,
Reich Commissar… wanted to draw the Dutch physicians into the orbit of the medical profession…he couched his order in the most careful and superficially acceptable terms…The physicians of Holland rejected this order unanimously because they saw what it actually meant…Although on the surface, the order appeared not too grossly unacceptable, the Dutch physicians decided that it was the first, although slight, step away from principle that is the most important one. The Dutch physicians declared that they would not obey this order. When Seiss-Inquart threatened them with revocation of their licenses, they returned their licenses, removed their shingles, and while seeing their own patients secretly, no longer wrote birth or death certificates. Seiss-Inquart retraced his steps and tried to cajole them – still to no effect. Then he arrested 100 Dutch physicians and sent them to concentration camps. The medical profession remained adamant and quietly took care of their widows and orphans, but would not give in. Thus, it came about that not a single euthanasia or non-therapeutic sterilization was recommended or participated in by any Dutch physician. They had the foresight to resist before the first step was taken, and they acted unanimously and won out in the end.
In examining the future of Public Health over 80 years ago, Emerson remarked on the ‘the necessity for courage as well as
DRAFT
86 NZMJ 8 January 2016, Vol 129 No 1428ISSN 1175-8716 © NZMA
www.nzma.org.nz/journal
knowledge, for the will-to-do’.7 The example presented by Dutch physicians must not be forgotten. It is all too easy to fall into a habit of self-surveillance and self-censorship.8 The professional9 and personal10 costs of speaking out are significant,11 and can result in repercussions.12-13 However, despite the challenges that face us14 we
are not powerless.15 Evidence suggests an alarmingly widespread retreat from activism in various branches of the health sector.16-18 Therefore we must emulate the Dutch physicians and strive for courage and solidarity in combatting injustice and health and social inequalities.19
1. Hirschfeld G. Nazi Rule and Dutch Collaboration: The Netherlands under German Occupation, 1940-45. London: Blooms-bury Academic; 1992.
2. Romein JM. The Spirit of the Dutch People During the Occupation. The Annals of the American Academy of Political and Social Science. 1946;245:169-80.
3. Warmbrunn W. The Dutch under German Occupation 1940-1945. Stanford, California: Stanford University Press; 1963.
4. Noordhoek Hegt WF. The Resistance of the Medical Profession. The Annals of the American Academy of Political and Social Science. 1946;245:162-8.
5. Alexander L. Medi-cal Science under dictatorship. N Eng J Med. 1949;241:39-47.
6. Cranford RE. The Contemporary Euthanasia Movement and the Nazi Euthanasia Program, in A Caplan (Ed.) When
Medicine Went Mad: 201-210. Totowa, NJ: The Humana Press Inc; 1992.
7. Emerson H. Public Health Awaits Social Courage. Am J Public Health. 1934;24(10):1005-22.
8. Foucault M. Discipline and Punish. New York: Vintage Books; 1979.
9. Eubanks SY. Prologue. Bad Acts: The Racketeering Case Against the Tobacco Industry. Washington DC: American Public Health Association; 2013.
10. Greaves R, McGlone JK. The Health Consequences of Speaking Out. Social Medicine. 2012;6(4):259-63.
11. Martin B, Saint Martin FP. Mobbing and Suppression: Footprints of Their Rela-tionships. Social Medicine. 2012;6(4):217-26.
12. Lear WJ. U.S. Health Professionals Oppose War. Social Medicine. 2007;2(3):131-5.
13. Lennane J. What Happens to Whistleblowers, and Why. Social Medicine.
2012;6(4):249-58.
14. Houghton F. Ethics, Courage and Public Health: Watchdog or Lapdog? Washington State Journal of Public Health Practice. 2015;8(1).
15. Martin B. Suppression of Dissent: What It Is and What to Do About It. Social Medicine. 2012;6(4):246-8.
16. Cooper CE. Political knowledge and participation of health education students. Health Educ.1986;17(5):10-13.
17. Hiltrop JS, Price JH, Boardley DJ. Public policy involvement by health educators. American Journal of Health Behav-ior. 2000;24(2):132-43.
18. Fairchild AL, Rosner D, Colgrove J, et al. The Exodus of Public Health- what History Can Tell Us About the Future. Am J Public Health. 2010;100(1):54-63.
19. Keck CW. 1991 Presiden-tial Address- Creating a Healthy Public’, Am J Public Health.
REFERENCES:
Competing interests: NilAuthor information:
Frank Houghton, Program Director MPH & HSAD, Eastern Washington University, Rm 232, Phase 1 Building, 668 N. Riverpoint Blvd., Spokane, Wa, 99202, USA
Corresponding author: Dr Frank Houghton|[email protected]
URL:www.nzma.org.nz/journal/read-the-journal/all-issues/2010-2019/2016/vol-129-no-1428-8-
january-2016/6792
LETTERS

DRAFT
87 NZMJ 8 January 2016, Vol 129 No 1428ISSN 1175-8716 © NZMA
www.nzma.org.nz/journal
LETTERS
Responses towards additional tobacco control
measures: data from a population-based survey of
New Zealand adultsJudy Li, Rhiannon Newcombe, Darren Walton
The New Zealand Government agreed to consider options to strengthen to-bacco control measures as a response
to the report for the Māori Affairs Select Committee on its Inquiry into the tobacco industry in Aotearoa and the consequences of tobacco use for Māori.1 These options included reducing tobacco supply, reducing harmful constituents in tobacco products, extending smokefree restrictions (such as cars and playgrounds), increasing tobacco tax and excise, and introducing plain pack-aging.2
As part of 2014 Health and Lifestyles Survey (HLS), data were collected to assess New Zealanders’ agreement with introducing various new tobacco control measures. The HLS is a biennial survey of adults aged 15+ years on their health behaviours and attitudes relating to tobacco and other health topics. Face-to-face interviews were computer-assisted and took place at the respondents’ homes.
A total of 2,594 respondents completed the survey, with a response rate of 73.2%. To provide nationally representative statistics, the data were weighted according to the 2013 Census of Population and Dwellings. The methodology and weighting procedures are described in detail in a separate report,3 and sample characteristics
are summarised in Table 1.The questionnaire contained 12 questions
that assessed responses towards new tobacco control measures, including those on extending smokefree areas, reducing access to tobacco products, reducing harmful constituents in tobacco products, and plain packaging (see Table 2). For each question, the respondents indicated whether they ‘strongly agree’, ‘agree’, ‘neither agree nor disagree’, ‘disagree’, or ‘strongly disagree’ with the measure. The weighted proportions of respondents who ‘strongly agreed’ or ‘agreed’ with the measure are presented in Table 2.
Overall, respondents showed higher levels of agreement with measures concerning extension of smokefree areas (68-97%), with the highest level of support found for banning smoking in cars when children were in them. In contrast, measures that restricted access to tobacco products had relatively lower level of agreement; nevertheless, these types of interventions were still supported by at least one-half of respondents (50-68%). The other two potential intervention types were reducing harmful constituents and plain packaging, and the proportion of respondents who supported these measures was 81% and 71% respectively.
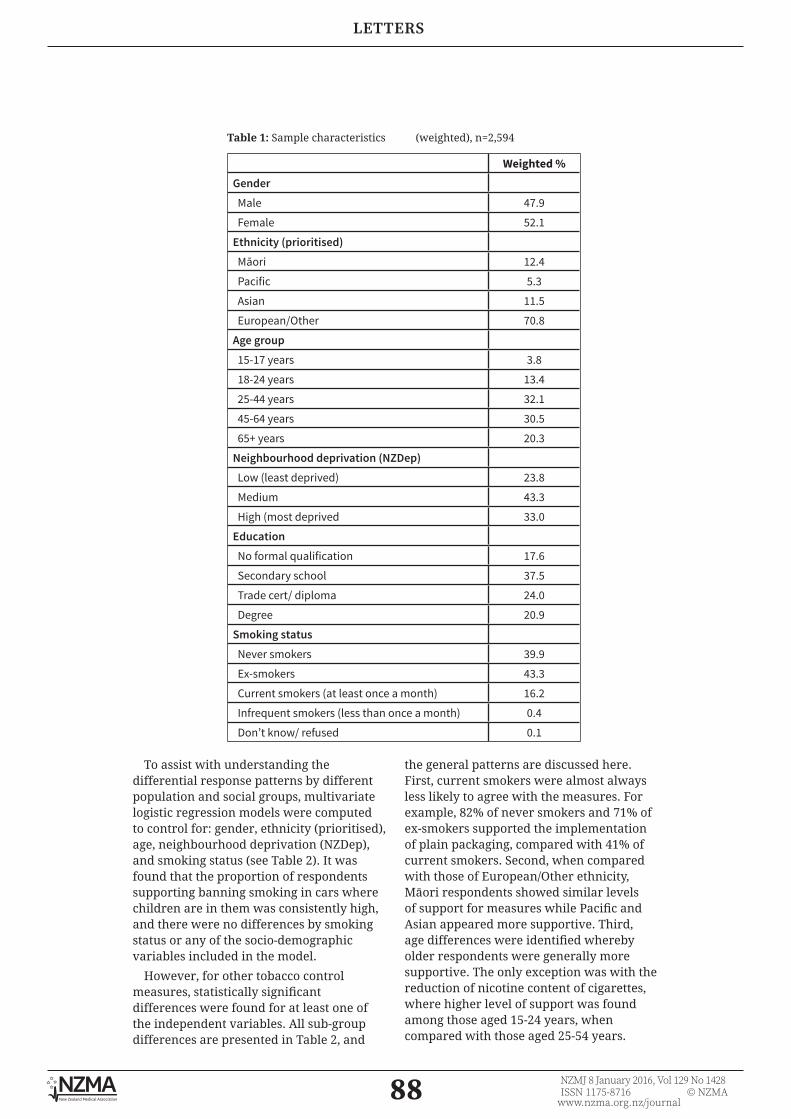
DRAFT
88 NZMJ 8 January 2016, Vol 129 No 1428ISSN 1175-8716 © NZMA
www.nzma.org.nz/journal
LETTERSLETTERS
To assist with understanding the differential response patterns by different population and social groups, multivariate logistic regression models were computed to control for: gender, ethnicity (prioritised), age, neighbourhood deprivation (NZDep), and smoking status (see Table 2). It was found that the proportion of respondents supporting banning smoking in cars where children are in them was consistently high, and there were no differences by smoking status or any of the socio-demographic variables included in the model.
However, for other tobacco control measures, statistically significant differences were found for at least one of the independent variables. All sub-group differences are presented in Table 2, and
the general patterns are discussed here. First, current smokers were almost always less likely to agree with the measures. For example, 82% of never smokers and 71% of ex-smokers supported the implementation of plain packaging, compared with 41% of current smokers. Second, when compared with those of European/Other ethnicity, Māori respondents showed similar levels of support for measures while Pacific and Asian appeared more supportive. Third, age differences were identified whereby older respondents were generally more supportive. The only exception was with the reduction of nicotine content of cigarettes, where higher level of support was found among those aged 15-24 years, when compared with those aged 25-54 years.
Weighted %Gender Male 47.9
Female 52.1
Ethnicity (prioritised) Māori 12.4
Pacific 5.3
Asian 11.5
European/Other 70.8
Age group 15-17 years 3.8
18-24 years 13.4
25-44 years 32.1
45-64 years 30.5
65+ years 20.3
Neighbourhood deprivation (NZDep) Low (least deprived) 23.8
Medium 43.3
High (most deprived 33.0
Education No formal qualification 17.6
Secondary school 37.5
Trade cert/ diploma 24.0
Degree 20.9
Smoking status Never smokers 39.9
Ex-smokers 43.3
Current smokers (at least once a month) 16.2
Infrequent smokers (less than once a month) 0.4
Don’t know/ refused 0.1
Table 1: Sample characteristics (weighted), n=2,594

DRAFT
89 NZMJ 8 January 2016, Vol 129 No 1428ISSN 1175-8716 © NZMA
www.nzma.org.nz/journal
LETTERS
Table 2: Proportion (weighted) of respondents who were ‘agreed’ or ‘strongly agreed’ with the statement (from highest to lowest level of support) and adjusted odds ratio from multivariate logistic regress model, n=2,594
Smoking in cars should be banned
when children are in them
Smoking should be banned in all outdoor public places where
children are likely to go
The nicotine content of cigarettes should be reduced to very
low levels so that they are less addictive
Smoking should be banned within 5
metres of the entrance of all
buildings used by the public
Smoking should be banned in all public
outodoor dining areas
Smoking should be baned in all outdoor
transport waiting areas
% AOR (95% CI) % AOR (95% CI) % AOR (95% CI) % AOR (95% CI) % AOR (95% CI) % AOR (95% CI)
Overall 97.3 - 83.7 - 80.7 80.4 - 75.9 - 74.6 -
Gender
Male 96.7 Ref 79.8 Ref 76.7 Ref 78.5 Ref 72.3 Ref 70.9 Ref
Female 97.9 1.06 (.987-1.16) 87.2 1.07 (1.03-1.12)
84.4 1.07 (1.03-1.11)
82.1 1.02 (.97-1.06) 79.2 1.04 (.99-1.09) 78.1 1.04 (1.00-1.09)
Ethnicity (prioritised)
Māori 95.7 .53 (.25-1.09) 84.1 1.58 (.97-2.57) 72.7 .76 (.51-1.14) 70.2 .66 (.44-1.01) 62.3 .81 (.53-1.23) 59.9 .74 (.51-1.09)
Pacific 97.5 .93 (.38-2.28) 92.5 3.41 (1.87-6.21)
86.5 1.76 (.99-3.12) 86.6 1.66 (.95-2.89) 79.2 1.80 (1.11-2.93)
79.0 1.84 (1.15-2.97)
Asian 98.3 1.49 (.32-6.88) 95.8 4.57 (1.95-10.70)
89.5 1.89 (1.04-3.43)
87.3 1.32 (.66-2.64) 85.8 1.94 (.88-4.26) 89.3 3.10 (1.46-6.57)
European/ Other
97.5 Ref 80.9 Ref 80.3 Ref 80.5 Ref 76.4 Ref 74.5 Ref
Age group
15-24 years 98.4 Ref 85.0 Ref 88.3 Ref 81.7 Ref 60.3 Ref 65.7 Ref
25-34 years 99.0 1.55 (.29-8.36) 86.9 1.32 (.62-2.80) 75.7 .41 (.20-.83) 76.9 .79 (.39-1.58) 75.9 2.62 (1.34-5.13)
71.7 1.43 (.80-2.55)
35-54 years 96.6 .39 (.09-1.75) 85.4 1.13 (.57-2.24) 78.3 .46 (.23-.92) 84.6 1.26 (.72-2.19) 79.8 3.09 (1.82-5.24)
78.9 2.12 (1.29-3.48)
55+ years 96.8 .39 (.08-1.77) 79.5 .70 (.35-1.42) 81.6 .52 (.26-1.06) 76.7 .63 (.37-1.09) 80.0 2.64 (1.48-4.69)
76.1 1.51 (.92-2.48)
Depreviation (NZDep)
Low 98.3 Ref 87.1 Ref 83.5 Ref 83.9 Ref 81.4 Ref 78.8 Ref
Med 96.6 .45 (.18-1.16) 81.3 .62 (.41-.93) 79.7 .83 (.53-1.28) 78.2 .75 (.50-1.15) 74.6 .74 (.51-1.08) 74.7 .87 (.58-1.30)
High 97.5 .71 (.26-1.95) 83.2 .72 (.46-1.13) 79.1 .94 (.59-1.50) 79.3 1.02 (.65-1.58) 71.0 .82 (.53-1.26) 68.9 .86 (.53-1.31)
Smoking status
Never smokers
97.4 Ref 89.9 Ref 87.3 Ref 87.8 Ref 85.4 Ref 83.4 Ref
Ex-smokers 97.9 1.63 (.81-3.29) 83.5 .25 (.16-.39) 81.3 .76 (.52-1.11) 81.0 .65 (.43-1.00) 79.2 .61 (.39-.95) 78.3 .77 (.53-1.10)
Current smokers
95.8 .74 (.32-1.72) 68.5 .67 (.45-1.00) 62.9 .30 (.20-.43) 60.3 .21 (.14-.33) 44.1 .14 (.09-.22) 43.8 .18 (.12-.27)
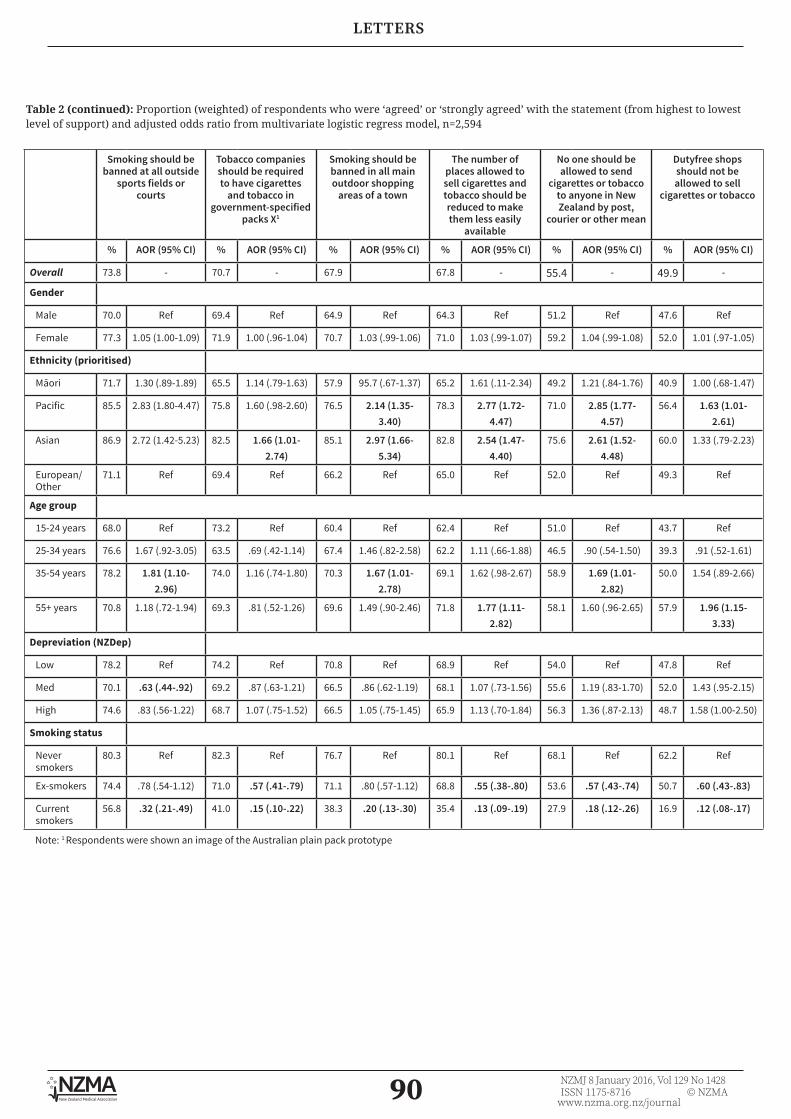
DRAFT
90 NZMJ 8 January 2016, Vol 129 No 1428ISSN 1175-8716 © NZMA
www.nzma.org.nz/journal
LETTERS
Table 2 (continued): Proportion (weighted) of respondents who were ‘agreed’ or ‘strongly agreed’ with the statement (from highest to lowest level of support) and adjusted odds ratio from multivariate logistic regress model, n=2,594
Smoking should be banned at all outside
sports fields or courts
Tobacco companies should be required to have cigarettes
and tobacco in government-specified
packs X1
Smoking should be banned in all main outdoor shopping
areas of a town
The number of places allowed to sell cigarettes and tobacco should be reduced to make them less easily
available
No one should be allowed to send
cigarettes or tobacco to anyone in New Zealand by post,
courier or other mean
Dutyfree shops should not be allowed to sell
cigarettes or tobacco
% AOR (95% CI) % AOR (95% CI) % AOR (95% CI) % AOR (95% CI) % AOR (95% CI) % AOR (95% CI)
Overall 73.8 - 70.7 - 67.9 67.8 - 55.4 - 49.9 -
Gender
Male 70.0 Ref 69.4 Ref 64.9 Ref 64.3 Ref 51.2 Ref 47.6 Ref
Female 77.3 1.05 (1.00-1.09) 71.9 1.00 (.96-1.04) 70.7 1.03 (.99-1.06) 71.0 1.03 (.99-1.07) 59.2 1.04 (.99-1.08) 52.0 1.01 (.97-1.05)
Ethnicity (prioritised)
Māori 71.7 1.30 (.89-1.89) 65.5 1.14 (.79-1.63) 57.9 95.7 (.67-1.37) 65.2 1.61 (.11-2.34) 49.2 1.21 (.84-1.76) 40.9 1.00 (.68-1.47)
Pacific 85.5 2.83 (1.80-4.47) 75.8 1.60 (.98-2.60) 76.5 2.14 (1.35-3.40)
78.3 2.77 (1.72-4.47)
71.0 2.85 (1.77-4.57)
56.4 1.63 (1.01-2.61)
Asian 86.9 2.72 (1.42-5.23) 82.5 1.66 (1.01-2.74)
85.1 2.97 (1.66-5.34)
82.8 2.54 (1.47-4.40)
75.6 2.61 (1.52-4.48)
60.0 1.33 (.79-2.23)
European/ Other
71.1 Ref 69.4 Ref 66.2 Ref 65.0 Ref 52.0 Ref 49.3 Ref
Age group
15-24 years 68.0 Ref 73.2 Ref 60.4 Ref 62.4 Ref 51.0 Ref 43.7 Ref
25-34 years 76.6 1.67 (.92-3.05) 63.5 .69 (.42-1.14) 67.4 1.46 (.82-2.58) 62.2 1.11 (.66-1.88) 46.5 .90 (.54-1.50) 39.3 .91 (.52-1.61)
35-54 years 78.2 1.81 (1.10-2.96)
74.0 1.16 (.74-1.80) 70.3 1.67 (1.01-2.78)
69.1 1.62 (.98-2.67) 58.9 1.69 (1.01-2.82)
50.0 1.54 (.89-2.66)
55+ years 70.8 1.18 (.72-1.94) 69.3 .81 (.52-1.26) 69.6 1.49 (.90-2.46) 71.8 1.77 (1.11-2.82)
58.1 1.60 (.96-2.65) 57.9 1.96 (1.15-3.33)
Depreviation (NZDep)
Low 78.2 Ref 74.2 Ref 70.8 Ref 68.9 Ref 54.0 Ref 47.8 Ref
Med 70.1 .63 (.44-.92) 69.2 .87 (.63-1.21) 66.5 .86 (.62-1.19) 68.1 1.07 (.73-1.56) 55.6 1.19 (.83-1.70) 52.0 1.43 (.95-2.15)
High 74.6 .83 (.56-1.22) 68.7 1.07 (.75-1.52) 66.5 1.05 (.75-1.45) 65.9 1.13 (.70-1.84) 56.3 1.36 (.87-2.13) 48.7 1.58 (1.00-2.50)
Smoking status
Never smokers
80.3 Ref 82.3 Ref 76.7 Ref 80.1 Ref 68.1 Ref 62.2 Ref
Ex-smokers 74.4 .78 (.54-1.12) 71.0 .57 (.41-.79) 71.1 .80 (.57-1.12) 68.8 .55 (.38-.80) 53.6 .57 (.43-.74) 50.7 .60 (.43-.83)
Current smokers
56.8 .32 (.21-.49) 41.0 .15 (.10-.22) 38.3 .20 (.13-.30) 35.4 .13 (.09-.19) 27.9 .18 (.12-.26) 16.9 .12 (.08-.17)
Note: 1 Respondents were shown an image of the Australian plain pack prototype

DRAFT
91 NZMJ 8 January 2016, Vol 129 No 1428ISSN 1175-8716 © NZMA
www.nzma.org.nz/journal
LETTERS
The data reported in this letter suggest that the majority of New Zealand adults support the implementation of addi-tional tobacco control measures. People are particularly supportive of measures concerning the extensions of smokefree areas in both public and private settings, which is consistent with other national data.4 It is also important to highlight the universal support for banning smoking in cars when children are in them, with 97% of people supporting it. The only prod-uct-related measure included in the survey concerned a reduction in nicotine content in tobacco products. Despite the novelty of the concept, this policy option was supported by the majority of the overall population and current smokers (81% and 69% respectively).
In 2013, the New Zealand Government has agreed in principle to introduce a plain packaging regime in alignment with Australia. Recent data from Australia suggest that this intervention is effective.5-7 The data reported in this letter indicated high level of support from New Zealand adults, and the level of support has maintained at a similar level since 2012 (72%).8
With the ‘Smokefree 2025’ goal being only a decade away, it is particularly important to understand public support for additional tobacco control measures. The HLS provides an adequate mechanism to collect this infor-mation from a nationally representative sample, and track responses over time.
Competing interests: Nil. The survey was funded by the Ministry of Health, New Zealand
Acknowledgements: We thank the participants of the 2014 Health and lifestyles Survey. We also thank Kate Hol-land and Danny Tu from the Health Promotion Agency for project managing the survey and
undergoing data checking and cleaning, and CBG Research for conducting the fieldwork. Author information:
Judy Li, Senior Researcher, Research and Evaluation Unit, Health Promotion Agency, Wellington; Rhiannon Newcombe, Principal Researcher, Research and Evaluation Unit,
Health Promotion Agency, Wellington; Darren Walton, Adjunct Associate Professor, Department of Psychology, University of Canterbury, Christchurch.
Corresponding author: Dr Judy Li, Senior Researcher, Research and Evaluation Unit, Health Promotion Agency,
Wellington. [email protected]
URL:www.nzma.org.nz/journal/read-the-journal/all-issues/2010-2019/2016/vol-129-no-1428-8-
january-2016/6790
DRAFT
92 NZMJ 8 January 2016, Vol 129 No 1428ISSN 1175-8716 © NZMA
www.nzma.org.nz/journal
1. New Zealand Parliament. Inquiry into the tobacco industry in Aotearoa and the consequences of tobacco use for Māori. Report of the Māori Affairs Select Committee. (New Zealand Parliament, 2010).
2. New Zealand House of Representatives,. Govern-ment Response to the Report of the Maori Affairs Committee on its Inquiry into the tobacco industry in Aotearoa and the consequences of tobacco use for Maori (Final Response). (New Zealand House of Representatives, 2011). http://smokefree.org.nz/sites/default/files/2.%20Govt%20Final%20Response%20to%20Maori%20Afairs%20Select%20Committee%20report%20-%20Mar%202011.pdf
3. Health Promotion Agency. 2014 Health and Lifestyles Survey Meth-odology Report. (Health Promotion Agency, 2015) http://www.hpa.org.nz/research-library/research-pub-lications/2014-health-and-life-styles-survey-meth-odology-report
4. Gendall P, Hoek J, Maubach N, Edwards R. Public support for more action on smok-ing. N. Z. Med. J. 126, 31 May 2013 (2013).
5. Zacher M. et al. Personal pack display and active smoking at outdoor cafe strips: assessing the impact of plain packaging 1 year postimplementation. Tob. Control 24, ii94–ii97 (2015).
6. White V, Williams T, Wakefield M. Has the introduction of plain packaging with larger
graphic health warnings changed adolescents’ perceptions of cigarette packs and brands? Tob. Control 24, ii42–ii49 (2015).
7. Wakefield M, et al. Australian adult smok-ers’ responses to plain packaging with larger graphic health warnings 1 year after implementation: results from a national cross-sectional tracking survey. Tob. Control 24, ii17–ii25 (2015).
8. Li J, Newcombe R. Public opinion about tobacco plain packaging. (Health Promotion Agency Research and Evaluation Unit, 2013). http://www.hpa.org.nz/sites/default/files/Public%20Opinon%20about%20Tobacco%20Plain%20Packagin%20May%202013%20FA.pdf
LETTERS
REFERENCES:

DRAFT
93 NZMJ 8 January 2016, Vol 129 No 1428ISSN 1175-8716 © NZMA
www.nzma.org.nz/journal
LETTERS
Is the NZ Government responding adequately
to the Māori Affairs Select Committee’s 2010
recommendations on tobacco control? A brief
reviewJude Ball, Richard Edwards, Andrew Waa, Shane Kawenata Bradbrook,
Heather Gifford, Chris Cunningham, Janet Hoek, Tony Blakely, Nick Wilson, George Thomson, Sue Taylor
In October 2010, the Māori Affairs Select Committee (MASC) reported on its Inquiry into the tobacco industry in
Aotearoa and the consequences of tobacco use for Māori in 2010.1 The Inquiry was prompted by Māori, over concerns about the shocking toll of tobacco use, and drew on input from multiple stakeholders including communities, Iwi, researchers and clinicians. The Committee’s report made 42 recommendations to the Govenment; the first of these called for a goal of making New Zealand a smokefree nation by 2025. The Government endorsed this recommendation, making New Zealand the first country in the world to set a national goal of achieving minimal levels of tobacco use.2
Five years on, in July 2015, the Ministry of Health (MoH) gave a ‘report back’ on progress to the MASC.3 The MoH update provided a welcome opportunity to review the Government’s and Ministry’s actions for each of the Committee’s recommen-dations, and assess those that have been completed, are underway but incomplete,
or where progress has been inadequate. We analysed progress on the Committee’s recommendations, using the Government’s 2011 response,2 a previous commentary on the MASC report,4 recommendations from a MoH commissioned review of tobacco control services,5 national non-government tobacco control strategy documents6-8 and the Ministry’s 2015 report to the MASC.3
According to the MoH 2015 report,3 eight of the 42 MASC recommendations have been completed or are largely complete; 18 are in progress or ongoing; 11 are low priority; and six have not been progressed as they are not Government policy. (Note that the total number of recommendations is 43 because recommendation 32—“that the Government legislate for further incre-mental tax increases over and above the annual adjustment for inflation”—was listed as both completed and ongoing.)
Our analysis supports the MoH’s classi-fication as ‘completed’ (or largely so) for recommendations including:
• adoption by the Government of the

DRAFT
94 NZMJ 8 January 2016, Vol 129 No 1428ISSN 1175-8716 © NZMA
www.nzma.org.nz/journal
LETTERS
smokefree nation goal, and clear mid-term targets (recommendation 1)
• introduction of a point-of-sale display ban (11)
• increased penalties for tobacco sales to minors (13) (although evidence suggests inadequate enforcement5)
• annual above-inflation tobacco taxation increases (32) (at least to January 2016 when the current series of annual increases finishes)
• marked reductions in duty-free tobacco allowances (42).
However, we believe failure to complete or adequately advance the remaining 34 recommendations is hindering progress towards the Smokefree 2025 goal, particu-larly for Māori. Key missed opportunities include a lack of progress on the following measures after five years (MoH designation of status in parentheses for each):
• implementation of a comprehensive Government strategy and action plan to achieve SF2025 (recommendation 33—designated ‘in progress’ by MoH )
• reduced availability and supply of tobacco (5 and 6—‘low priority’)
• introduction of standardised pack-aging for tobacco products (7—‘in progress’)
• further disclosure of product addi-tives, and the regulation of nicotine and additives (8 and 9—‘low priority’)
• comprehensive and effective use of mass media (4, 19-22—mix of ‘low priority’ and ‘in progress’) including targeted mass media campaigns, in particular for Māori and pregnant women (21—‘in progress)
• extension of smokefree environments, in particular smokefree cars carrying children (24—‘low priority’).
A key MASC recommendation was for the Government to establish a tobacco control strategy and action plan with a strong emphasis on Māori-focused outcomes. This recommendation has since been reit-erated by others on numerous occasions,4,9 including by the Te Ara Hā Ora (TAHO) Advisory Group,6 the National Smokefree Working Group (NSFWG)7,8 and in the
SHORE Report5 on tobacco control services commissioned by the MoH. Such a plan should include a rigorous appraisal and prioritisation process to develop a compre-hensive set of interventions, interim targets and timelines for implementation. This would set out a clear, logical, and credible roadmap for achieving Smokefree 2025; create a monitoring and accountability framework; provide clear evidence of the Government’s commitment; and provide focus and direction for the wider sector. This recommendation was initially rejected by the Government, but in August 2015, Associate Minister of Health Peter Dunne announced that the Government was devel-oping a separate tobacco control plan which will sit alongside the National Drug Policy. Ministry of Health officials have confirmed that this plan is underway and will be released for consultation before it is finalised.
The MASC recommendations included measures to reduce the availability and supply of tobacco. In its response to the MASC recommendations, the Government adopted the goal of “reducing smoking prevalence and tobacco availability to minimal levels” by 2025, and in its response to recommendation 5 committed to inves-tigate further options for measures to reduce tobacco supply. The non-govern-mental tobacco control sector has prioritised supply-side measures, notably retailer registration or licensing as an important first step to introducing restrictions on the currently ubiquitous10 supply of tobacco.7,8 However, the Ministry in its report to the MASC described these recommendations as ‘low priority’ and we can find no evidence of any investigation or implementation of supply-side measures, other than the restriction on duty-free sales introduced in 2014. This is despite innovative regional and local initiatives—such as the ‘Tobacco-free Retailers Toolkit’ developed in Northland—that could be supported for national implementation.
There has been some progress on the introduction of standardised packaging of tobacco products, with the completion of the first reading and Health Select Committee report of the Smoke-free Environments (Tobacco Plain Packaging) Amendment

DRAFT
95 NZMJ 8 January 2016, Vol 129 No 1428ISSN 1175-8716 © NZMA
www.nzma.org.nz/journal
Bill by August 2014. However, despite this being identified by the sector as a priority for immediate action,8 there is currently no proposed date for a second reading, and the Bill is on hold while the Government awaits the outcome of Investor Dispute and WTO cases pending for Australian plain packaging legislation.11 In the meantime other countries (eg, UK, Ireland, Norway and France), undeterred by the threat of litigation, have taken robust steps toward immediate implementation.
The MASC recommended requiring tobacco companies to publicly report the constituents of their tobacco products and emissions by class of product, brand, and brand variant (rather than reporting in aggregate, as currently occurs), and regulating to reduce the additives and nicotine content of tobacco products. Despite very clear statements in the Government’s response to the Committee about reviewing the current information disclosure regime and investigating imple-menting more robust regulations to control additives and constituents in tobacco products (and the tobacco control sector’s consistent support for such an approach)8, there appears to have been no progress, and the MoH report back to the MASC described these measures as low priorities.
Similarly, the lack of progress and MoH’s low prioritisation of the recommendation to extend smokefree environments (particu-larly smokefree cars for children) contrasts with NSFWG8 and SHORE Report recom-mendations,5 and strong public support for such measures.12 Local Government New Zealand passed a remit on 19 July at its AGM requesting that central government develop and implement legislation that would prohibit smoking outside cafés, restaurants and bars. This provides further support for Government action to extend smokefree environments.
Finally, the MASC report included several recommendations for the maximisation of smokefree campaigns and use of mass media. The NSFWG and SHORE Report have since reiterated calls for additional resources to be allocated to this inter-vention.5,8 In response to the MASC report, the Government committed to determining
and implementing the best ongoing mix of smokefree public information, education, community initiatives and marketing campaigns.2 The MoH reported to the MASC that progress on these measures was ‘ongoing’; however, we can find no evidence that an overall social marketing and mass media strategy for tobacco control has been developed in response to the MASC recom-mendation, as has been recommended.4 Indeed, a 2014 review found mass media expenditure reduced after the Government adopted the Smokefree 2025 goal and its use did not align with best practice.13 More recently, spending on national smokefree campaigns has reduced even further with the change in the national Quitline provider from The Quit Group Trust to Homecare Medical on 1 November 2015. As a result, since approximately June 2015, cessation advertising by Quitline (which was about half of the total national tobacco control mass media expenditure up to 2010/11 and about 80% of the total from 2011/12 to 2012/1313) has been significantly reduced. Ministry of Health officials state that mass media campaigns to promote the Quitline service provided by Homecare Medical are planned to start in January 2016.
The aim of the MASC recommendations was to reduce the unacceptable health disparities and harm suffered by Māori as a result of tobacco use. In its recent report back,3 the MoH acknowledged the reality that Māori daily smoking prevalence, at 37.1% (95%CI: 34.8 – 39.6), remains almost three times that of the European/other population (13.6%, 95%CI: 12.7 – 14.6) in 2013/14.14 Regrettably, however, the MoH did not explain how this gap between Māori and non-Māori is being (or will be) addressed, an omission that was noted at the hearing by the MASC Chair. The apparent absence of a coherent, evidence-based approach to improving Māori outcomes (relative to non-Māori) suggests a disconnect between the aims and vision of the MASC, and the approach taken by the Government and MoH since 2011.
Adoption of the Smokefree 2025 goal put New Zealand at the forefront of tobacco control internationally. With a robust evidence-based and comprehensive approach it can and should be achieved.
LETTERS

DRAFT
96 NZMJ 8 January 2016, Vol 129 No 1428ISSN 1175-8716 © NZMA
www.nzma.org.nz/journal
Competing interests: NilAuthor information:
Jude Ball, Research Fellow, ASPIRE2025, Department of Public Health, University of Otago Wellington, Wellington, New Zealand; Richard Edwards, Professor of Public Health,
ASPIRE 2025, Department of Public Health, University of Otago Wellington, Wellington, New Zealand; Andrew Waa, Research Fellow, ASPIRE2025, Department of Public Health, University of Otago Wellington, Wellington, New Zealand; Shane Kawenata Bradbrook,
Director of Te Ao Hurihuri, Wellington, New Zealand; Heather Gifford, Director Whakauae Research, ASPIRE2025, Whakauae Research, Whanganui, New Zealand; Chris Cunningham, Professor, Research Centre for Māori Health & Development, Massey University Wellington,
Wellington, New Zealand; Janet Hoek, Professor of Marketing, ASPIRE2025, Department of Marketing, University of Otago, Dunedin, New Zealand; Tony Blakely, Professor of Public Health, BODE3, Department of Public Health, University of Otago Wellington,
Wellington, New Zealand; Nick Wilson, Professor of Public Health, BODE3, University of Otago Wellington, Wellington, New Zealand; George Thomson, Associate Professor of Public Health, ASPIRE2025, University of Otago Wellington, Wellington, New Zealand; Sue Taylor,
Director T&T Consulting, Levin, New ZealandCorresponding author:
Jude Ball, Research Fellow, ASPIRE2025, Department of Public Health, University of Otago Wellington, Wellington, New Zealand
URL:www.nzma.org.nz/journal/read-the-journal/all-issues/2010-2019/2016/vol-129-no-1428-8-
january-2016/6790
However, there is now clear evidence that the current ‘business as usual’ approach is insufficient to achieve the 2025 goal, partic-ularly for Māori. Modelling studies suggest that, unless radical steps are taken, the interim target of halving Māori and Pacific daily smoking prevalence to 19% and 12% respectively by 2018 will be missed by a substantial margin, as will the 2025 goal (commonly interpreted as daily smoking prevalence of under 5%).15,16
In conclusion, five years after the MASC report and with only 10 years until the 2025 deadline, it is apparent that progress towards Smokefree 2025 is inadequate and key interventions have not been imple-mented sufficiently as recommended by the MASC. There are a variety of means to try and accelerate progress and hold the Government to account. These include greater efforts to promote evidence-based
interventions by the tobacco control sector, building on the energy and innovation to achieve Smokefree 2025 that is being shown by local coalitions across New Zealand, and through research which documents progress, the impact of current approaches and generates new evidence to inform future interventions and strategies. In addition, we suggest that the MASC should consult widely, particularly with Māori groups and stakeholders, on the current status of the Smokefree 2025 goal and should hold the Government to account on its original response to the Committee’s recommendations and demand that its action plan to achieve the Smokefree 2025 goal includes credible strategies to reduce disparities and protect Māori from tobac-co-related harm, and ensure full Māori participation in that process.
LETTERS

DRAFT
97 NZMJ 8 January 2016, Vol 129 No 1428ISSN 1175-8716 © NZMA
www.nzma.org.nz/journal
1. New Zealand Parliament. Inquiry into the tobacco industry in Aotearoa and the consequences of tobacco use for Māori. Report of the Māori Affairs Select Committee. Wellington: New Zealand Parliament; 2010.
2. New Zealand Parliament. Government Response to the Report of the Māori Affairs Committee on its Inquiry into the tobacco industry in Aotearoa and the consequences of tobacco use for Māori (Final Response). Wellington: New Zealand Parliament; 2011.
3. Ministry of Health. Smokefree New Zealand 2025: presentation to Māori Affairs Committee. Wellington: Ministry of Health; 2015.
4. Blakely T, Thomson G, Wilson N, et al. The Māori Affairs Select Committee Inquiry and the road to a smokefree Aotearoa. N Z Med J. 2010;123(1326):7-18.
5. Casswell S, Wall M, Lin J, Adams J. Review of Tobacco Control Services. Wellington: Ministry of Health; 2014.
6. Hāpai Te Hauora. Te Ara Hā Ora. Auckland: Hāpai Te Hauora; 2014.
7. National Smokefree Working Group. Smoke-free Aotearoa/New Zealand by 2025. Next Steps 2011-2015. Welling-ton: National Smokefree Working Group; 2012.
8. National Smokefree Working Group. Smoke-free Aotearoa 2025: Action Plan 2015-2018. Welling-ton: National Smokefreel Working Group; 2015.
9. Edwards R, Hoek J, Beaglehole R, et al. Realignment of tobacco control services—will it be sufficient to achieve the nation’s Smokefree 2025 Goal? N Z Med J. 2015;128(1413), 84-87
10. Marsh L, Doscher C, Robertson LA. Character-istics of tobacco retailers in New Zealand. Health Place 2013;23:165-170.
11. Hoek J, Edwards R, Daube AM. Standardised (plain) packaging: the time for implementation has come. N Z Med J. 2014;128(1417):47-51.
12. Gendall P, Hoek J, Maubach N, Edwards R.
Public support for more action on smoking N Z Med J. 2013;126:85-94.
13. Edwards R, Hoek J, van der Deen F. Smokefree 2025–use of mass media in New Zealand lacks align-ment with evidence and needs. Aust N Z J Public Health 2014;38(4):395-396.
14. Ministry of Health. Annual Update of Key Results 2013/14: New Zealand Health Survey. 2014; http://www.health.govt.nz/publication/annual-update-key-re-sults-2013-14-new-zea-land-health-survey.
15. Cobiac LJ, Ikeda T, Nghiem N, et al. Modelling the implications of regular increases in tobacco taxation in the tobacco endgame. Tob Control. 2015;24(2):139-145.
16. van der Deen FS, Ikeda T, Cobiac L, et al. Projecting future smoking prevalence to 2025 and beyond in New Zealand using smok-ing prevalence data from the 2013 Census. N Z Med J. 2013;127(1406):71-79.
REFERENCES:
LETTERS

98 NZMJ 8 January 2016, Vol 129 No 1428ISSN 1175-8716 © NZMA
www.nzma.org.nz/journal
METHUSELAH
Aromatase inhibitors versus tamoxifen in early breast cancer
The optimal ways of using aromatase inhibitors or tamoxifen as endocrine treatment for early breast cancer remains uncertain. It is known that both tamoxifen (a selective oestrogen receptor modulator) and aromatase inhibitors are very useful in the management of oestrogen receptor positive early breast cancer in postmenopausal women.
This meta-analysis of data from over 30,000 such patients seeks to elucidate optimal treatment. The findings of the meta-analysis were that in the comparison of 5 years of aromatase inhibitor versus 5 years of tamoxifen, recurrence RRs favoured aromatase inhibitors significantly during years 0–1 (RR 0.64) and 2–4 (RR 0.80), and non-significantly thereafter. 10-year breast cancer mortality was lower with aromatase inhibitors than tamoxifen.Lancet 2015;386:1341-52
Effectiveness of warfarin among ischaemic stroke patients with atrial fibrillation
Warfarin is recommended for the prevention of thromboembolism in atrial fibrillation patients. This report concerns a study involving patients with atrial fibrillation discharged from hospital after an ischaemic stroke.
The researchers reviewed data from 12,552 patients with atrial fibrillation who had never taken warfarin previously and were admitted to hospital for ischaemic stroke and treated with warfarin versus no oral anticoagulant at discharge.
Follow-up demonstrated considerable benefit to the warfarin treatment patients. They were shown to have a lower risk of major adverse cardiovascular events, all-cause mortality and readmission for ischaemic stroke, as well as institution-free home time. The benefits were noted in both men and women, and in those aged over 80 years.BMJ 2015;351:h3786
Cardiometabolic risks and severity of obesity in children and young adults
The prevalence of severe obesity among children and young adults has increased over the past decade. A recent report from the US showed an incidence of 6% in these age groups. The authors of this study speculate that those with the more severe forms of obesity may be at greater risk.
Data obtained from over 8,000 children and young adults in the National Health Study was correlated with various metabolic risk factors—total cholesterol, high-density lipoprotein (HDL), cholesterol, low-density lipoprotein cholesterol, triglycerides, blood pressure, glycated haemoglobin, and fasting glucose.
The researchers concluded that severe obesity in children and young adults was asso-ciated with an increased prevalence of cardiometabolic risk factors, particularly among boys and young men. More than academic interest, as New Zealand and Australian children have recently been reported as being second or third in the world in the world obesity rating.N Engl J Med 2015;373:1307-17
URL:www.nzma.org.nz/journal/read-the-journal/all-issues/2010-2019/2016/vol-129-no-1428-8-
january-2016/6787
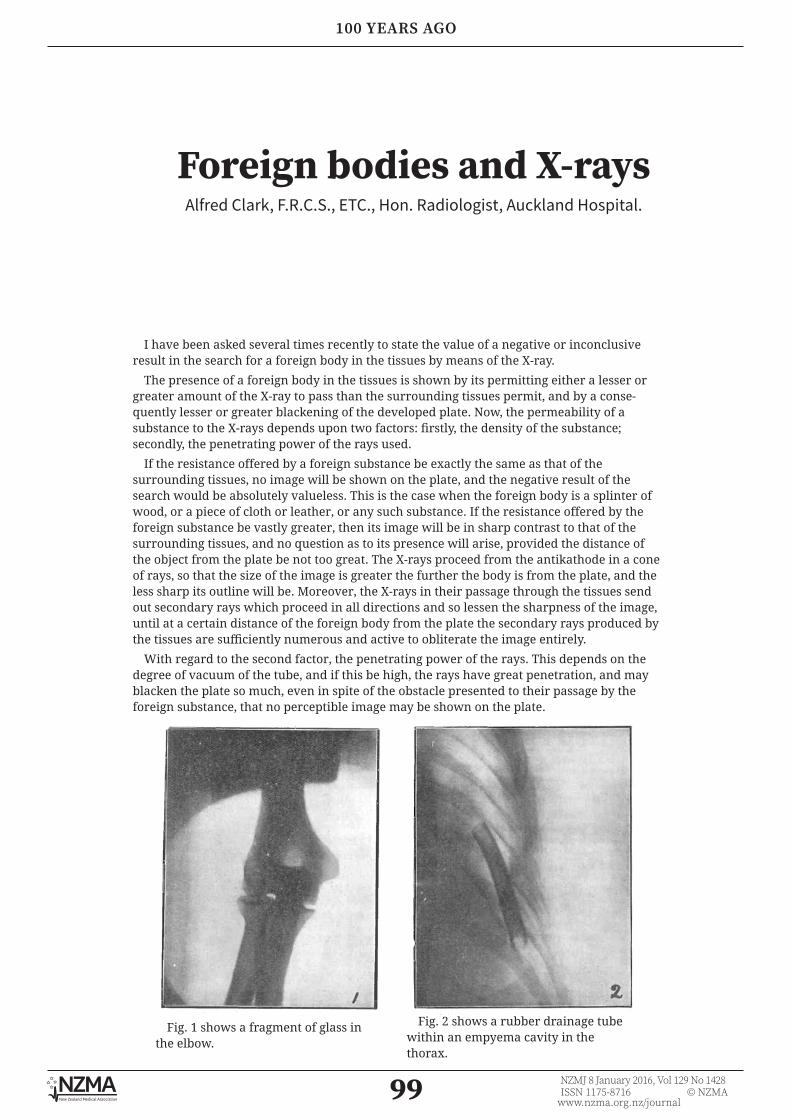
99 NZMJ 8 January 2016, Vol 129 No 1428ISSN 1175-8716 © NZMA
www.nzma.org.nz/journal
100 YEARS AGO
Foreign bodies and X-raysAlfred Clark, F.R.C.S., ETC., Hon. Radiologist, Auckland Hospital.
I have been asked several times recently to state the value of a negative or inconclusive result in the search for a foreign body in the tissues by means of the X-ray.
The presence of a foreign body in the tissues is shown by its permitting either a lesser or greater amount of the X-ray to pass than the surrounding tissues permit, and by a conse-quently lesser or greater blackening of the developed plate. Now, the permeability of a substance to the X-rays depends upon two factors: firstly, the density of the substance; secondly, the penetrating power of the rays used.
If the resistance offered by a foreign substance be exactly the same as that of the surrounding tissues, no image will be shown on the plate, and the negative result of the search would be absolutely valueless. This is the case when the foreign body is a splinter of wood, or a piece of cloth or leather, or any such substance. If the resistance offered by the foreign substance be vastly greater, then its image will be in sharp contrast to that of the surrounding tissues, and no question as to its presence will arise, provided the distance of the object from the plate be not too great. The X-rays proceed from the antikathode in a cone of rays, so that the size of the image is greater the further the body is from the plate, and the less sharp its outline will be. Moreover, the X-rays in their passage through the tissues send out secondary rays which proceed in all directions and so lessen the sharpness of the image, until at a certain distance of the foreign body from the plate the secondary rays produced by the tissues are sufficiently numerous and active to obliterate the image entirely.
With regard to the second factor, the penetrating power of the rays. This depends on the degree of vacuum of the tube, and if this be high, the rays have great penetration, and may blacken the plate so much, even in spite of the obstacle presented to their passage by the foreign substance, that no perceptible image may be shown on the plate.
Fig. 1 shows a fragment of glass in the elbow.
Fig. 2 shows a rubber drainage tube within an empyema cavity in the thorax.

100 NZMJ 8 January 2016, Vol 129 No 1428ISSN 1175-8716 © NZMA
www.nzma.org.nz/journal
100 YEARS AGO
Fig. 3 shows various substances lying on the photographic plate, taken with a tube having a penetration of 6 Wehnelt:-
a. Rubber tubing;b. Safety match;c. End of a fountain pen, with metal clip;d. Lens;e. A threepenny piece.
Fig. 4 shows a piece of lead (a) at a distance of 4.5 centimetres from the plate lying on a knuckle, and a piece of lead (b) lying on the plate : penetration, 7 Wehnelt
URL:www.nzma.org.nz/journal/read-the-journal/all-issues/2010-2019/2016/vol-129-no-1428-8-
january-2016/6788