Embed Size (px)
Citation preview

Voices. Votes.Leadership.


“At present, our country needs women's idealism and determination, perhaps more in politics than anywhere else.”
Congresswoman Shirley Chisholm

About Higher Heights
Higher Heights is the only organization dedicated solely to harnessing Black women’s political power and leadership potential to overcome barriers to political participation and increase Black women’s participation in civic processes. Higher Heights Leadership Fund, a 501(c)(3), is investing in a long-term strategy to expand and support Black women’s leadership pipeline at all levels and strengthen their civic participation beyond just Election Day. Learn more atwww.HigherHeightsLeadershipFund.org
About The Center for American Women and Politics (CAWP)
The Center for American Women and Politics (CAWP), a unit of the Eagleton Institute of Politics at Rutgers, The State University of New Jersey, is nationally recognized as the leading source of scholarly research and current data about American women’s political participation. Its mission is to promote greater knowledge and understanding about women's participation in politics and government and to enhance women's influence and leadership in public life. CAWP’s education and outreach programs translate research findings into action, addressing women’s under-rep-resentation in political leadership with effective, imaginative programs serving a variety of audiences. As the world has watched Americans considering female candidates for the nation's highest offices, CAWP’s over four decades of analyzing and interpreting women’s participation in American politics have provided a foundation and context for the discussion. Learn more at www.cawp.rutgers.edu
This report was made possible by the generous support of Political Parity.Political Parity educates and engages actors and allies to increase women’s political representation nationally. Proudly nonpar-tisan, we pursue innovative research that makes the case for women’s leadership; convene communities of experts to advance actionable ideas; and build partnerships across the political spectrum, mobilizing momentum for a more reflective democracy. Learn more at www.politicalparity.org

Executive Summary i-ii
Introduction 1-3
Black Women Running And Winning 3-4
Congress 5-11
Statewide Elected Executive Office 12-16
State Legislatures 17-22
Mayors 23-24
Black Women In The Electorate 24-26
2015 Elections 27
Looking Ahead: Black Women in 2016 27-28
Conclusion 29
Sources 30-33
Appendices 34-36
Table Of Contents
Report authored by Kelly Dittmar, Ph.D., Assistant Professor of Political Science at Rutgers - Camden and Scholar at the Center for American Women and Politics, Eagleton Institute of Politics, Rutgers University

i
EXECUTIVE SUMMARY
VOICES Throughout the country, Black women are leading efforts to promote positive social change, preserve and improve their communities, and prevent the perpetuation of violence and inequality. Black women’s influence extends to educational, business, and economic spheres, where they have expanded both their presence and power. Despite these efforts and advancements, new research finds that Black women’s voices are the most likely to be overlooked in governmental policy-making. But Black women are not only protesting outside of political institutions, they are leading the fight for fair treatment from the inside. Black women continue to increase their political representation, using their formal power to bring diverse perspectives, priorities, and experiences to policy debates, including giving necessary attention to the voices that may otherwise be left out of political dialogue. Prioritizing the political empowerment of Black women requires identifying and taking advantage of electoral opportunities to advance Black women’s political leadership, as well as harnessing the power of Black women’s votes. Increasing Black women’s representation is not only a matter of democratic fairness, but essential to engaging new constituencies, elevating policy dialogue, and promoting policy priorities, perspectives, and solutions that may be lost if Black women’s votes, voices, and leadership are absent from American politics. VOTES Black women have registered and voted at higher rates than their male counterparts in every election since 1998. Moreover, they surpassed all other race and gender subgroups in voter turnout in 2008 and 2012. Black women also turned out to vote at a rate seven percentage points higher than their Black male counterparts in the 2014 midterm elections, outnumbering Black men at the polls by over two million and turning out at the highest rate among any non-white group. As the most reliable Democratic voters in the past two presidential elections, Black women are an essential part of the winning coalition that any Democratic candidate will need to win in 2016. Harnessing that power by turning out the vote and tying those votes to policy demands and priorities can ensure that Black women’s voices will not only be heard from outside of government, but can move further to the center of political debates and decision-making that are so influential in the lived experiences of Black women throughout the United States.
Black women have been a part of every great movement in American history even if they weren’t always given a voice. When women of color aren’t given the opportunity to live up to their God-given potential, we all lose out on their talents; we’re not as good a country as we can be. We might miss out on the next Mae Jemison or Ursula Burns or Serena Williams or Michelle Obama. We want everybody to be on the field. We can’t afford to leave some folks off the field.
- President Barack Obama, September 21, 2015

ii
POLITICAL LEADERSHIP Put simply, the perspectives and priorities of Black women cannot be fully expressed without the representation of Black women in office. Once in office, Black women champion the interests of Black citizens and underrepresented populations, supporting progressive agendas around education, health care, and economic development. There is additional evidence that Black women politicians better engage and inspire Black citizens to participate in politics. Moreover, they typically represent more diverse communities than their non-Black counterparts. Black women made some notable gains in the 2014 elections, representing one-fifth of new Democrats, nearly one-third of new women, and five of six new Black members – including delegates – elected to the 114th Congress in November 2014. However, despite being 7.4% of the U.S. population, Black women are just 3.4% of Congress, less than 1% of statewide elected executive officials, 3.5% of state legislators, and 1.9% of mayors in cities with populations over 30,000. Four Black women serve as mayors in the 100 largest cities in the United States. Historically, only 35 Black women from 15 states have ever served in the U.S. Congress, only 10 Black women from 9 states have ever served in statewide elected executive offices, and three states have still never elected a Black woman to their state legislature. Black women’s representational growth has occurred primarily in the past two decades. Of the 35 Black women who have served in Congress, 28 (80%) have entered since 1993. Of the 10 Black women who have served in statewide elected executive office, all but one has entered since 1993. Since 1994, the growth in Black state legislators can be wholly attributed to Black women, who have increased their numbers by nearly 50%. Two Black women have served as Speakers of State Houses since 2008. The first big-city Black woman mayor was not elected until 1987 and at least eight more Black women have led big cities in the past thirteen years. This trend will only continue upward as more Black women run and the sites for recruitment and candidacy expand. Black women’s legislative representational growth to date has been primarily in majority-minority districts, leaving much opportunity for growth outside of those districts, which are limited in number and vulnerable to legal challenges. Taking advantage of such opportunities will require Black women to confront distinct hurdles to political participation. Black women are less likely to be encouraged to run for office, and are more likely to be discouraged from running, than Black men and white women. Black women also navigate race and gender stereotypes, and the intersections therein, while running for and serving in office. Finally, Black women represent less affluent districts and are less likely to be part of moneyed networks, posing hurdles to fundraising. Black women have proven their capacity to overcome these hurdles and, even more, capitalize upon the distinct advantages that they bring to candidacy and officeholding. Black women’s confidence and political experiences in community work and activism have contributed to their political ambition and success. As candidates and officeholders, Black women engage and draw from multiple communities of voters and constituents. Finally, the recent history of Black women’s political progress means that there is much progress left to make; Black women face great opportunities for growth in political voice and representation, especially if the infrastructure to support that growth is further put into place.

1 INTRODUCTION: VOICES, VOTES, AND LEADERSHIP Black women have been a part of every great movement in American history even if they weren’t always given a voice. When women of color aren’t given the opportunity to live up to their God-given potential, we all lose out on their talents; we’re not as good a country as we can be. We might miss out on the next Mae Jemison or Ursula Burns or Serena Williams or Michelle Obama. We want everybody to be on the field. We can’t afford to leave some folks off the field.
- President Barack Obama, September 21, 2015 In his speech to the Congressional Black Caucus in September 2015, President Barack Obama focused on the centrality of Black women to the major fights for equal rights in the 20th century, telling the audience that “all of us are beneficiaries of a long line of strong Black women who helped carry this country forward.” One of those women – Congresswoman Shirley Chisholm (D-NY) – stated decades earlier, “At present, our country needs women's idealism and determination, perhaps more in politics than anywhere else.” This statement rings true today, as Black women remain on the front lines for social progress in the 21st century. Black women – both in and out of elected office – have advocated and agitated for social change that addresses the disempowerment of the Black community and the invisibility of women there. #BlackLivesMatter, a movement launched by three Black women in 2012, has become a mantra for change, mobilizing citizens across the United States to fight for a new reality.1 In illuminating and contending police brutality against the Black community, Black women have also emphasized the importance of giving voice to Black women’s experiences, evident in the 2015 report and campaign to #SayHerName.2 But Black women are not only protesting outside of political institutions; they are leading the fight for fair treatment from the inside. When the city of Ferguson, Missouri held its first election since Michael Brown’s death, Ella Jones was one of two Black members elected to a six-member council that had – until then – had only one Black member, despite the city’s population being over 67% Black. And when the city of Baltimore confronted the reality of and outrage over Freddie Gray’s death while in police custody, it was District Attorney Marilyn Mosby – among the one percent of all elected prosecutors in the U.S. who are women of color3 – who stood at the podium to tell both residents and police, “I heard your calls for ‘no justice, no peace.’” Unlike lead prosecutors in similar cases nationwide, she swiftly filed charges against the six police officers involved in Gray’s arrest. Black women also stood up for equal rights both inside and outside of South Carolina’s legislature in the fight to take down the confederate flag after the murders of nine people at the Emanuel African Methodist Episcopal Church, including State Senator Clementa Pinckney. While Black women like State Representative Mia McLeod fought to garner votes in the legislature, Black women led protests on capitol grounds, including Bree Newsome’s scaling of the Capitol flagpole to take the flag down herself. These women are not alone. Throughout the country, Black women are leading efforts to promote positive social change, preserve and improve their communities, and prevent the perpetuation of violence and inequality. Despite these efforts, new research from Zoltan L. Hajnal, John Griffin, Brian Newman, and David 1 Alicia Garza, with Patrisse Cullors and Opal Tometi, launched #BlackLivesMatter as a call to action after Travon Martin’s death in 2012. 2 Kimberlé Williams Crenshaw and Andrea J. Ritchie authored the #SayHerName report with Rachel Anspach and Rachel Gilmer. Crenshaw’s Center for Instersectionality and Social Policy Studies at Columbia University was a major collaborator in the effort. 3 Women Donor’s Network. 2015. Justice for All? Available: http://wholeads.us/justice/

2 Searle (2015) finds that Black women’s voices are the most likely to be overlooked in governmental policy-making. In their conclusion, the authors ask whether the solution to unequal policy responsiveness to the Black community more broadly requires electing more Blacks to office. This report illuminates the underrepresentation of Black women in elective office as perpetuating the marginalization of Black women’s voices. Black women’s political empowerment and advancement require identifying and taking advantage of electoral opportunities to raise Black women’s voices in politics and policymaking, including harnessing the power of Black women’s votes and advancing Black women’s political leadership. The 2016 election represents one of those key opportunities, requiring attention, organization, and strategy to maximize Black women’s influence and electoral success. Power in Numbers Despite the growing electoral and economic imprint of America’s 23 million Black women, they have struggled to harness the political power necessary to overcome gaps in elected leadership and make sure their voices are heard on important policy debates like those around civil rights, economic justice, and reproductive justice. Political representation – from the voting booth to elected office – is critical to changing policies that negatively impact Black women, their families, and their communities. Black women represent one-fifth of new Democrats, nearly one-third of new women, and five of six new Black members – including delegates – elected to the 114th Congress in November 2014. Alma Adams (D-NC) became the 100th woman in Congress upon her special election to fill a vacant seat for the remainder of the 113th Congress. Bonnie Watson Coleman (D-NJ) and Mia Love (R-UT) both became the first Black women to represent their states in Congress in January 2015. Love also made history as the first Black Republican woman to serve in Congress, winning her seat in the same year that Utah elected its first Black woman – Representative Sandra Hollins (D) - to the state legislature. Love and Coleman were both elected outside of majority-minority districts, debunking skepticism of Black women’s viability among majority-White constituencies and opening the door to new sites for candidate recruitment. According to the U.S. Census, Black women also turned out to vote at a rate seven percentage points higher than their Black male counterparts in the 2014 midterm elections, outnumbering Black men at the polls by over two million and turning out at the highest rate among any non-White group. Black women’s empowerment is not only evident, nor only important, in the political sphere. Recent statistics on educational attainment from the U.S. Census show that Black women under forty are outpacing their Black male counterparts in earning bachelor’s and advanced degrees. In business, Black women are the fastest growing group of entrepreneurs in the United States; according to a 2015 report from American Express Open, the number of businesses owned by Black women grew by 322% from 1997 to 2015, a rate more than four times greater than the rate of increase among all women during the same period (74%). The same report finds that firms owned by African-American women employ close to 300,000 workers nationally and generate $52.6 billion in revenue (AEO 2015). Black women also have significant influence over the spending decisions of Black consumers, whose current buying power is greater than ever at $1 trillion (Nielsen 2015).
This advancement in educational, business, economic, and political leadership comes in the face of continued disparities in Black women’s experiences and access to power in U.S. society relative to men and White women. According to a poll conducted for the Ms. Foundation in May 2015, 46% of Americans disagree with the statement that “women of color have equal opportunities in work, life, and politics as White women” (14). Seventy percent of Black women disagree with the same statement, indicating that first-hand experiences conflict with outside assessments of a level playing field. Those distinct experiences are detailed in the latest

3 report from the Black Women’s Roundtable, which finds Black women in 2015 continue to face significant disparities in health, safety, and economic well-being. Black women are more likely to suffer from maternal mortality,4 are more than three times as likely to be murdered,5 and are twice as likely to be poor as White women.6 Even in the recovery, Black women’s unemployment rate is greatest among all women in 2015,7 and the gender gap in wages remains larger for Black women, who earn 63 cents for every dollar earned by a White man (AAUW 2015). Moreover, according to the latest data from the U.S. Census Bureau’s Current Population Survey, Black women college graduates earn, on average, just over half of what White male college graduates earn. While Black women have progressed in business ownership, they occupy just 5.3 percent of managerial and professional positions in corporations (Warner 2014). Finally, despite Black women’s political successes at the congressional level in 2014, the proportion of Black women in statewide executive and state legislative offices remained nearly level after Election Day.
BLACK WOMEN RUNNING AND WINNING While not extensive, the literature on Black women’s political representation provides important insights into Black women’s paths to office, challenges and opportunities on the campaign trail, and experiences and impact as legislators. Numerous studies demonstrate that the pathways women of color take to public office are somewhat different from those of non-Hispanic White women. In their survey of state legislators, Carroll and Sanbonmatsu (2013) find that women of color confront additional obstacles beyond those faced by White women running for political office.8 They are less likely to be encouraged to run and more likely to be discouraged from running. More specifically, women of color are less likely to be recruited to run, and recruitment matters more for women than for men (Carroll and Sanbonmatsu 2013). Party leaders’ doubts about candidate electability present an additional challenge to women of color in recruitment and securing campaign resources from the political establishment to help launch a candidacy, especially outside of majority-minority districts (Sanbonmatsu 2006). Shames’ (2014) research further highlights the potential deterrents to candidacy for women of color well-situated to run, finding them among the most likely to perceive running for office as having high costs and low rewards. Once candidates, women of color are more likely than White women to face primary competition and report fundraising as a hurdle on their paths to elected office (Carroll and Sanbonmatsu 2013). Previous research has also found that Black candidates often raise less money, rely more often on small donations, and are more likely to need to seek campaign donations from outside of their districts, which are less affluent – on average – than those of White candidates (Singh 1998; Theilmann and Wilhite 1989). Despite winning at comparable rates to men, women are also evaluated differently than male candidates by voters and treated differently than men by media, forcing women candidates to navigate gender in different ways in campaign strategy. Those challenges on the campaign trail are often exacerbated for women of color, who face gender and race-based stereotypes as well as unique, intersectional stereotypes related to their multiple politically-salient identities.9 Some scholars have emphasized that Black women are “doubly 4 Centers for Disease Control and Prevention (CDC), Pregnancy Mortality Surveillance System 5 Violence Policy Center. 2015. Black Homicide and Victimization in the United States 6 U.S. Census Bureau, Current Population Survey (2012) 7 U.S. Bureau of Labor Statistics, Household Survey (October 2015) 8 For the remainder of this analysis, the use of “White women” will refer to non-Hispanic White women. 9 Those challenges continue once in office, as Nadia Brown details in her 2014 book on Black women in state legislators, as well as in her recent article on the politics of appearance for Black women legislators (Brown 2014).

4 disadvantaged” by these expectations, noting negative stereotypes about personality traits, competence, and leadership ability rooted in both racism and sexism (Clayton and Stallings 2000; Gamble 2010; Gay and Tate 2001; Githens and Prestage 1977; Harris-Perry 2011; Hill Collins 2000; McConnaughy and White 2011). However, Smooth (2014) describes how Black women have fared better than expected as candidates, based on these perceived disadvantages and compounding sociodemographic indicators of political integration. In fact, Black women have outpaced Black men and White women in increasing political representation over the past two decades (Hardy-Fanta et al. 2006; Orey et al, 2006; Smooth 2014). Smooth (2014) credits greater levels of political confidence and ambition for this “paradox of participation” among Black women, drawing upon research demonstrating how Black women’s historical roles in movement politics, a longer tradition of simultaneous public and private sphere work, community leadership, and religious networks have provided foundations for and routes toward political success (Darcy and Hadley 1988; Frederick 2013; Kaba and Ward 2009; Tate 2003). The factors predicting electoral success for Black women have been different from those for White women and Black men. First, Black women are advantaged by their ability to engage, empathize with, and draw support from multiple communities of voters (Smooth 2014; Philpot and Walton 2007). Like their male counterparts, they have also found particular success in majority-minority districts (Scola 2006). On the other hand, multi-member districts have benefited Black and White women, but men of color appear to fare better in smaller, single-district systems (Darcy, Hadley, and Kirksey 1997; Trounstein and Valdini 2008). Thus, increasing Black women’s representation means navigating a political opportunity structure – including potential advantages and disadvantages – that differs from the opportunity structure faced by other candidates of color and women candidates. Increasing the numbers of women of color in office is not just a matter of democratic fairness and descriptive representation, but also has substantive effects on legislative policy and citizens’ political engagement. Once in office, women of color may continue to face challenges within the institutional power structure at the intersections of race and gender, as well as feeling a sense of responsibility to multiple constituencies (Brown 2014; Carroll 2003; Hawkesworth 2003; Smooth 2001). However, Black women overcome these challenges to champion the interests of both African Americans and women, supporting progressive agendas around education, health care, and economic development that differ somewhat from Black male and White female colleagues (Barrett 2001; Bratton, Haynie, and Reingold 2008; Brown 2014; Orey et al. 2006). In her study of Black women legislators, Brown (2014) finds that Black women’s personal backgrounds and multiple identities influence their legislative policy preferences in ways that demonstrate both intragroup variation and commonalities rooted, at least in part, in their experiences at the intersection of race and gender. Put simply, the perspectives and priorities of Black women cannot be fully expressed without the representation of Black women in office. Finally, there is some evidence that Black women politicians better engage and inspire Black citizens to participate in politics (Gay 2001; Pinderhughes 1987; Tate 1991; 2003). Stokes-Brown and Dolan (2010) found that Black female candidates for Congress increased Black women’s likelihood of political proselytizing and voting, as well as increasing the non-monetary forms of participation among all women. This “role model effect” can have significant impact in engaging and encouraging more Black women to run for office, as well strengthening a political community of Black women to support them.

CONGR
Current O Eighteen Bthe 114th CBlack femaD.C. and thSeventeencurrent coRepresentthe U.S. Sepopulationof CongresHowever, Black memwomen arare 40.9% White womrepresentarepresentaserve in thBlack womrepresentaDemocraticaucus in H Table 1. C
House
Senate
Total
Black congmembers oBernice JoHolmes NoTransporta 10 These coun11 According included in t12 Together, 6188 Democra
ESS
Officeholder
Black women fCongress (2015ale non-votinghe U.S. Virgin In of eighteen Bngress are Deatives. No Blac
enate. Despite n, Black womess and 4.1% ofBlack women
mbers of Congre 21.4% of all fof Black repre
men are only 1atives and Latiatives. Of the 1e U.S. House, 5
men make up 9atives and oveic female repreHouse history,
Current Congre
Democra
33
13
46
gresswomen seon three full cohnson; Veteraorton (D-DC) isation and Infra nts do not includeto the Congressio
totals for each gro62 women (includatic representative
rs
from thirteen s5-2017), in add
g delegates froslands (see Fig
Black female mmocrats in theck women currmaking up 7.4
en are only 3.4%f members of tare well represress. As Table female represesentatives. In c5.7% of Whitenas are 20.6%
12 Asian/Pacifi5 – or 41.7% - a
9% of Democrar a quarter (27esentatives. Th, where wome
esswomen, by
White
ats Republican
19
6
25
erve on 16 of tommittees (Fins Affairs – Cos the ranking mastructure Com e delegates. Populonal Research Servoup here. ding 29 women ofes.
states serve in dition to two om Washingtongure 1).
members in thee House of rently serve in4% of the U.S. % of membersthe U.S. Housesented among1 shows, Blackentatives. Theycomparison, e
of Latino/a c Islanders whare women.11 atic 7.4%) of all heir presence hn and minority
Race, Party, an
Bla
s Democrats
17
0
17
the House’s 21nancial Service
orinne Brown) member on thmmittee. Of the
lation numbers bavice, Representati
f color) and 44 min
n,
e
s e.10 g k y
ho
has contributey members are
nd Chamber
ack
Republicans D
1
0
1
1 standing comes - Maxine Waand ten subcoe Highways ane House’s “pow
ased on U.S. Censve Bobby Scott (D
nority men serve i
Figure 1.
ed to creating e the majority
Latina
Democrats Rep
7
0
7
Sour
mmittees and aaters; Science,
ommittees. In and Transit subcwer committee
us Bureau July 20D-VA) identifies as
in the House Dem
. Current Cong
So
the most diveof Democratic
Asia
publicans Demo
2 5
0 1
2 6
rce: Center for Ameri
are the ranking, Space, and Teaddition, Delecommittee of es,” Black wom
013 estimate. s both Black and A
mocratic Caucus, re
gresswomen, b
ource: Center for Am
rse Democratic representativ
an/Pacific Island
ocrats Republic
5 0
1 0
6 0
ican Women and Po
g Democratic echnology – Ed
egate Eleanor the House’s
men are absen
Asian American. H
epresenting 56%
by State
merican Women and
5
ic ves.12
der
cans
olitics
ddie
t from
e is
of the
Politics

6 two: Rules and Ways and Means. Black women’s influence within the House is strongly tied to the Democratic Party’s fortunes. Because all Black women members but one, who is in her first term, are in the House minority, no Black women chair any congressional committees.13 Ten women serve in Democratic and Republican Party leadership positions in the House, including two black women. Terri Sewell (D-AL) is a Democratic Chief Deputy Whip and Donna Edwards (D-MD) serves as a co-chair of the Democratic Steering and Policy Committee. Sewell and Edwards are the only women of color in party leadership positions in the House or Senate. Seven women have chaired the Congressional Black Caucus (CBC), with the last woman - Representative Marcia Fudge (D-OH) – holding the post in the 113th Congress.
Black congresswomen represent more diverse districts than non-Black women (see Table 2).14 Most significantly, 14 of the 18 Black female representatives in the 114th Congress represent majority-minority districts, consistent with historical trends of electoral success and minority representation in Congress (see below). Nearly half – 8 of 18 - of the Black women serving represent majority-Black districts and only four women – Joyce Beatty (D-OH), Bonnie Watson Coleman (D-NJ), Mia Love (R-UT), Gwen Moore (D-WI) – represent majority-White congressional districts. In all, 25 majority-minority congressional districts are represented by female members, with four districts represented by White women (Janice Hahn, CA-44; Zoe Lofgren, CA-19; Nancy Pelosi, CA-12; Jackie Speier, CA-14).15 Due in part to the strong presence of minority voters, Black women represent districts that, on average, voted strongly for Barack Obama in 2012 (see Table 3). They also received, on average, higher vote totals than other women members in their last elections; Black women representatives received an average 76% of the vote in their districts, compared to 65% for all non-Black women representatives. 13 Only one woman, Candice Miller (R-MI) chairs a House committee (House Administration), who is White, and one White woman, Lisa Murkowski (R-AK), chairs the Senate Committee on Energy and Natural Resources. 14 Black men and women represent similar types of districts that share similar demographic characteristics. However, an analysis in 2010 found that Black women’s congressional districts have a slightly lower proportion of Black citizens and a slightly higher proportion of Latinos than Black men’s districts. The average income in Black women’s districts is also slightly lower than the average income in Black men’s districts (Palmer and Simon 2012). 15 Three Asian/Pacific Islander and four Latinas represent majority-minority congressional districts.
Table 2. Congressional District Characteristics, Current Congresswomen
Black Women Non-Black Women
Race Black 40.3% 7.3%
White 44.4% 71.8%
Education
Not High School Graduate 16.6% 13.4%
High School Graduate or Higher 83.4% 86.1%
Bachelor's Degree or Higher 27.7% 32.7%
2014 Vote 76.1% 65%
2012 Vote for Barack Obama 75.7% 56%
Median Household Income $46,968 $60,507
Sources: U.S. Census Bureau; Congressional Quarterly NOTE: Numbers reflect average values for each group of members of Congress,
not including delegates.
16
2
Have not held previous elected office
Held previous elected office
Figure 2. Previous Elected Office, Current Black Congresswomen
Source: Center for American Women and Politics

7 The average tenure of the sitting Black women members of Congress is about nine years.16 Representative Maxine Waters (D-CA) and Delegate Eleanor Holmes Norton (D-DC) are the longest-serving Black women serving in the 114th Congress, each in her 24th year of service. They are also the longest-serving Black congresswomen ever. Even before coming to Congress, 16 of the 18 current Black congresswomen held some previous elected office, including eleven who served in their states’ legislatures (see Figure 2). The personal characteristics of today’s Black congresswoman do not differ significantly from non-Black women members in regard to age or motherhood (see Table 3). The youngest Black woman in the 114th Congress is Representative Mia Love (R-UT), who is 39 years old. Representative Eddie Bernice Johnson (D-TX) is the oldest Black woman at 78 years old.17 Sixteen congresswomen have no children, including three Black women members, but the average number of children among all congresswomen is two.18 In her 2003 book Black Faces in the Mirror, Katherine Tate notes that marital status is the most striking demographic difference of Black women in Congress compared with non-Black women members; she found that only a third of Black women serving in the 106th Congress were married when they were elected to office, compared to majorities of White women, Asian/Pacific Islander women, and Latinas. The same significant difference persists in the 114th Congress, where just under 40% of Black women members are married, compared to 73.1% of White women, 60% of Asian/Pacific Islander women, and 77.8% of Latinas in Congress. This difference is reflective, in part, of the lower percentage of Black women in the population who are married.19 Moreover, it demonstrates that Black women members bring more diverse familial experiences to both campaigning and governing, challenging traditional norms of familial structure and gender roles. This is true not only of the current class of Black congresswomen, but also of the Black women who have served in Congress over the past 47 years.
Historical Officeholders Thirty-five Black women from 15 states have served in the U.S. Congress, in addition to one Black female non-voting delegate from Washington, D.C. and two Black female non-voting delegates from the U.S. Virgin Islands (see Figure 3). Only one Black woman, Carol Moseley Braun (D-IL), has ever served in the U.S. Senate, and all but one Black congresswomen (including all three delegates) have been Democrats. Black women make up 11.4% of all 307 women who have ever served in Congress, 64.8% of all 54 congresswomen of color, and 25% of all 140 Black members of Congress (see Figure 5).20 Of the six female delegates who have also served in the House, three are Black women. 16 The average tenure of Black women members is 9.5 years when delegates are included and 9.2 years when delegates are excluded. 17 Representative Eddie Bernice Johnson (D-TX) will turn 79 years old on December 3, 2015. 18 The average number of children is consistent at 2 children per member when delegates are included. 19 According to the U.S. Census 2014 estimates, 33% of Black women are married compared to 51% of all women in the United States. 20 Mazie Hirono, the only woman of color to serve in both House and Senate, is only counted once in these calculations. In total, 54 women of color have served in the House and 2 women of color have served in the Senate. Calculations include elected and appointed members. Finally, Tim Scott, the first Black men to serve in both House and Senate, is also counted only once among Black congressmen.
Table 3. Personal Characteristics, Current Congresswomen
Black Women Non-Black Women
Average Age 63 59
Marital Status
Married 38.9% 72.7%
Unmarried 61.1% 27.3%
Average Number of Children
2 2
Sources: Center for American Women and Politics; Congressional Quarterly; The Almanac of American Politics, National Journal
NOTE: Numbers reflect average values for each group of members of Congress, not including delegates.

The first BlChisholm (Mink (D-HCongress aMT) becam1917. The nearly oneseat.21 Of tfounded thone (Chishmore BlackVoting Rigdistricts haFigure 4 shdid not incelections, wdistricts inof the Hou(Clayton aincrease inattributed 2014). Thewomen ofrespective While threwoman towoman of had a BlacBlack menCongress oelected a BPA, SC, TNthat have eCongress. Jordan (D-– have betheir stateVI) and Elecongressw 21 Three BlackRhodes Reve22 The total ncongressionadiscriminationot prove dis23 This does n24 Data on Bla
lack woman el(D-NY) in 1968I) became the and a half cent
me the first wofirst Black men
e hundred yeahe 13 Black mhe Congressio
holm) was a wok women were
ghts Act and thave been critichows, the numcrease significawhen the crea the South res
use, including fnd Stallings 20
n Black membeto Black wom
e greatest numf color serving ely, both achiev
ee states (DE, M Congress, 32
f color to Congk woman in th, however, havover time, inclBlack woman: , VA.24 Utah anelected a BlackFour women –
-TX), Mia Love en the first Blas, but only Del
eanor Holmes Nwomen to repr
k men entered Coels (MS).
umber of majorityal amendments toon, and to the Supscriminatory intennot include delegaack members of C
lected to Cong8, elected four first woman otury after Jean
oman elected tn entered Conrs before Chishembers of Con
onal Black Caucoman. Two yeae elected to thhe creation of mcal to Black wo
mber of Black wantly until afte
ation of 12 newulted in 12 nefive new Black000).22 Since thers of Congresen’s electoral
mbers of Black wsimultaneousved in the 114
MS, VT) have ststates have ne
gress and 35 stheir congressiove representeduding 12 stateCT, LA, MA, MN
nd Wisconsin ak woman, but – Katie Hall (D-(R-UT) and Gw
ack members olegates DonnaNorton (D-DC)esent their con
ongress in 1870: Re
y-minority districto Section 2 the Vopreme Court’s decnt (Keele and Whitates.
Congress (current a
gress was Shirlyears after Pat
of color electednnette Rankin (to Congress in gress in 1870, holm took herngress who cus in 1971, onars later, threee House. The
majority-minoomen’s gains. Awomen in officer the 1992 w majority-Blacw Black memb
k congresswomhen, much of tss can be success (Smoowomen and ally are 18 and 3
4th Congress.23
till never sent aever elected a ates have nev
onal delegatiod 25 states in es that have neN, MS, MO, NV
are the only stano Black men,-IN), Barbara
wen Moore (D-of Congress froa Christensen () are the first nstituencies. O
epresentative Jeff
ts doubled from 2ting Rights Act toision in Thornburgte 2011).
and historic) is fro
Figureby Stat
ey tsy
d to (D-
nly e
ority As ce
ck bers men he
oth l
32 -
a
er n.
ever V, OK, ates , to
-WI) om (D-
One
ferson Long (GA),
26 to 52 in post-19 remove intent to
g v. Gingles (1986)
om the Office of th
1970
1974
1978
1982
1986
1990
1994
1998
2002
2006
2010
2014
Figure
e 3. Black Congte
Representative Jo
990 redistricting. To discriminate as a
to bar vote dilutio
he Historian at the
11
444
23
2111
3
0 5
4. Black Wom
gresswomen 1
oseph H. Rainey (S
This jump is credita criterion for provon under redistric
e U.S. House of Re
Source: Center for A
910
11
11
10
10
men in Congres
Source: Center for A
1968-Present,
SC), and Senator H
ted in part to ving vote-related cting even if one c
epresentatives.
American Women a
1111
121111
1213
15
15
ss, 1970-Presen
American Women a
8
Hiram
could
nd Politics
18
20
nt
nd Politics

9
Source: Center for American Women and Politics
delegate (Eleanor Holmes Norton, D-DC) and six of the 18 current Black Representatives – Corinne Brown (D-FL), Bonnie Watson Coleman (D-NJ), Donna Edwards (D-MD), Mia Love (D-UT), Gwen Moore (D-WI), and Terri Sewell (D-AL) – are the first Black women to represent their states and constituencies.25 Finally, of the 35 Black women who have served in the House, six have been the second Black women representing their congressional districts; in five of those cases, a Black woman directly succeeded another Black woman member.26 One current delegate, Stacey Plaskett (D-VI), succeeded another Black woman.
Congressional Candidates In order to increase their representation in Congress, Black women must run and win. In congressional elections between 2000 and 2014, 168 nominees for House and Senate seats and 15 nominees for Delegate were Black women (see Figure 6). Black women’s nominations represent 14.6% of all female House nominations and just over 55% of nominations of all women of color in the House in this period.27 Only four, or 4.3%, of female Senate nominations between 2000 and 2014 were of Black women. Sadly, those four nominations still represent two-thirds of all Senate nominations of all women of color (6) in the same period, and no Black female nominee was elected. Accounting for incumbent women and multiple-time nominees, 79 individual Black women – 53 Democrats and 26 Republicans – have reached general election House and Senate ballots in the past eight congressional election cycles; three more Black female Democrats have been Delegate nominees, and two of them have been multiple-time nominees. Representative Denise Majette (D-GA) is the only Black woman since 2000 to be both a House and Senate nominee.28 Black women were more likely to run as incumbents than challengers in House races between 2000 and 2014. In those years, Black women were 10% of female House nominees who challenged incumbent members and 18.1%
25 Representatives Corrine Brown and Carrie Meek were elected to the Florida congressional delegation in 1993, sharing the title of first Black women elected from their state. 26 These pairs include Diane Watson to Karen Bass (CA-33), Juanita Millender to Laura Richardson (CA-37), Cynthia McKinney to Denise Majette (GA-4), and Barbara-Rose Collins to Carolyn Kilpatrick (MI-15, MI-13). Two Black women – Carrie Meek and Frederica Wilson - have also served in Florida’s 17th District, but not sequentially. 27 Delegates not included unless noted. 28 Majette’s candidacies for the House and the Senate are counted separately in the total number of Black women nominees (80).
Figure 5. Historical Members of Congress, by Gender and Race
11,870Men
253 White Women
35 Black Women
10 Latinas
9 Asian/Pacific
Islander Women
307 Women
Sources: Center for American Women and Politics; U.S. House of Representatives, Office of the Historian

of female Hhave been
Across all thigher thawomen’s wDemocratifemale Desuccess wa(43.4%) anAmong allattributed nominees nominees Republicanand formeseat conte Finally, as above, Blanominees benefittedrunning inminority dthese distrthe Democnominatiomost signi 29 One Black wa challenger,
0
200
400
600
800
1000
1200
A
Figure 6.
House incumbn Black women
types of Housean the win ratewin rate over tic nominees, wmocratic nomas significantly
nd White fema female Demomainly to thefrom 2000-20(see Table 4). n women ever
er mayor of Sarest for Utah’s 4
mentioned ck women have also
d from n majority-districts. In ricts, winning cratic
on is often the ificant hurdle woman incumben in these measure
759
364
All Women All
CongressionalHouse of Rep
bent nomineesn.
e races in this pe for White wo
his period risewith 79.5% of B
inees for Repry higher than tle Democratic
ocratic House nir higher win r14 won open sBlack women r winning a searatoga Springsth congression
nt candidate who es.
Table 4. El2000-2014
Challengers
Incumbents
Open Seat Ca
227
68
Women ofColor
Blac
Re
De
l Nominees 20presentatives
s.29 In open sea
period, Black wmen nominee
es to 67.6% amBlack female Dresentative andthat of White f House nomin
nominees for Rrates in open sseat contests, have fared poat in Congresss –became thenal district.
challenged an inc
lection Win Ra4
andidates
13232
ck Women
publicans
emocrats
000-2014, by Gs
at contests, 17
women nomins (46.5%). Whe
mong House noDemocratic nomd Delegate cofemale Democnees for RepresRepresentativeeat contests; 7compared to 3orly as Repub. In 2014, Mia L
e first Black Rep
cumbent male aft
tes for House
Black Women
0
97.8%
76.2%
Sou
0
20
40
60
80
100
A
Gender and Rac
Source: Cente
7.7% of female
nees had a winen the Delegatominees. Blackminees for Repmbined) winn
cratic House nosentative and e, Black wome76.2% of Black31.9% of Whitlican candidatLove – a Blackpublican wom
ter redistricting is
Democratic W
White Women
5.5%
93.3%
31.9%
urce: Center for Ame
65
28
All Women Al
ce
r for American Wom
S
House nomin
n rate of 64.6%te nominees a
k women faredpresentative (8
ning their racesominees for ReDelegate com
en’s greater ratk female Demoe female Dem
tes, with only ok female Repub
man in Congres
counted as an inc
Women, by Rac
n Latinas
0
100%
83.3%
erican Women and P
6
ll Women ofColor
Bla
R
D
men and Politics, dele
Senate
nees since 2000
%, significantly are included, Bd much better 81.6% of Blacks. This rate of epresentative
mbined (44.1%)te of success caocratic House
mocratic Houseone Black blican from Utss, winning an
cumbent candida
ce and Seat Sta
Asian-PaIslander W
66.7%
100%
83.3%
Politics, delegates no
4
ack Women
Republicans
Democrats
egates not included
10
0
Black as
k
). an be
e
ah open
ate, not
atus,
acific Women
%
%
%
ot included

for candid2000 and 2only 18.7%majority-mwere succetheir highetheir targeHolder (20majority-ma wider ran Party Lea Only two Bcampaign is a Vice Chthe DCCC Tthe DCCC’committeecongressiocandidate In 2015, twVice Chair Stephanie Voting RigRepublican
ALMA AD On Novefill a vacaCongresshistory pthe first tU.S. Congwomen hrepresen
ates. Once no2014, about 75
% were Republminority districessful. The coner rates of elecet sites for winn13), which inv
minority districnge of districts
adership
Black women, committees g
hair of the DCCTribal Engages Finance Come or the Nationonal campaignrecruitment, p
wo Black womeof Voter RegisRawlings-Blak
ghts Institute. Nn National Com
DAMS BECOME
mber 4, 2014ant seat to bes. Adams, a forofessor, was
time that 100gress. When theld office, retation.
minees, Demo5% of House nicans who lost
cts won and 76ncentration of ctoral success, ning congressalidated a key
cts, increases ths.
both Democragoing into the CC Business Coment and Acti
mmittee. No Blanal Republicann committee, aparty messagin
en hold leaderstration and Pake is DNC SecrNo Black womemmittees.
ES THE 100TH
4, Alma Adamecome the 10ormer state les sworn in on0 women hadthe 114th Coneaching a new
ocratic candidaominations oft on Election D6.5% of Black w
Black women but also highlional nominatprovision of t
he importance
ats, hold top le2016 cycle (DSouncil, and Reive Members pack women ho
n Congressionaa position throng, and allocat
rship positionsarticipation at etary. Prior to en have ever s
WOMAN IN TH
ms (D-NC) wo00th woman eegislator, city November 1
d ever served ngress openew milestone f
ates have a higf Black women
Day. Ninety-fouwomen nomin
candidates inights the pote
tions and seatshe Voting Righe of encouragi
eadership posiSCC, NRSC, DCpresentative G
program; bothold leadership al Committee.ugh which eletion of suppor
s at a party’s nathe Democratholding her cu
served as Chai
HE 113TH CON
n a special ellected to the
y councilmem12, 2014. Thissimultaneou
ed in January for women’s
gh likelihood on were in majour percent of t
nees for open s majority-mino
ential opportus. The Supremhts Act and thng and suppo
itions at the mCCC, NRCC). ReGwen Moore (Dh positions are
positions at e No Black wom
ected leaders crt to candidate
ational commtic National Courrent post, Brrwoman to eit
NGRESS
lection to e 113th mber, and art s marked usly in the
2015, 104 congressiona
of electoral sucority-minority dthe Democratiseats in majoriority districts hnity for Black w
me Court decisireatens the pr
orting Black wo
major party conepresentative TD-WI) serves apart of the ou
either party’s Sman has ever ccan significantes in congressi
ittee. Donna Bommittee (DNCrazile was Chaither the Demo
al
ccess. Betweendistricts. Of thoc nominees inty-minority dihelps to explaiwomen to expon, Shelby Cou
rotection of omen candida
ngressional Terri Sewell (Ds a Vice Chair o
utreach councienate campaig
chaired a tly influence ional elections
Brazile serves aC) and Mayor ir of the DNC’s
ocratic or
11
n ose, stricts in
pand unty v.
tes in
D-AL) on il on gn
s.
as the
s
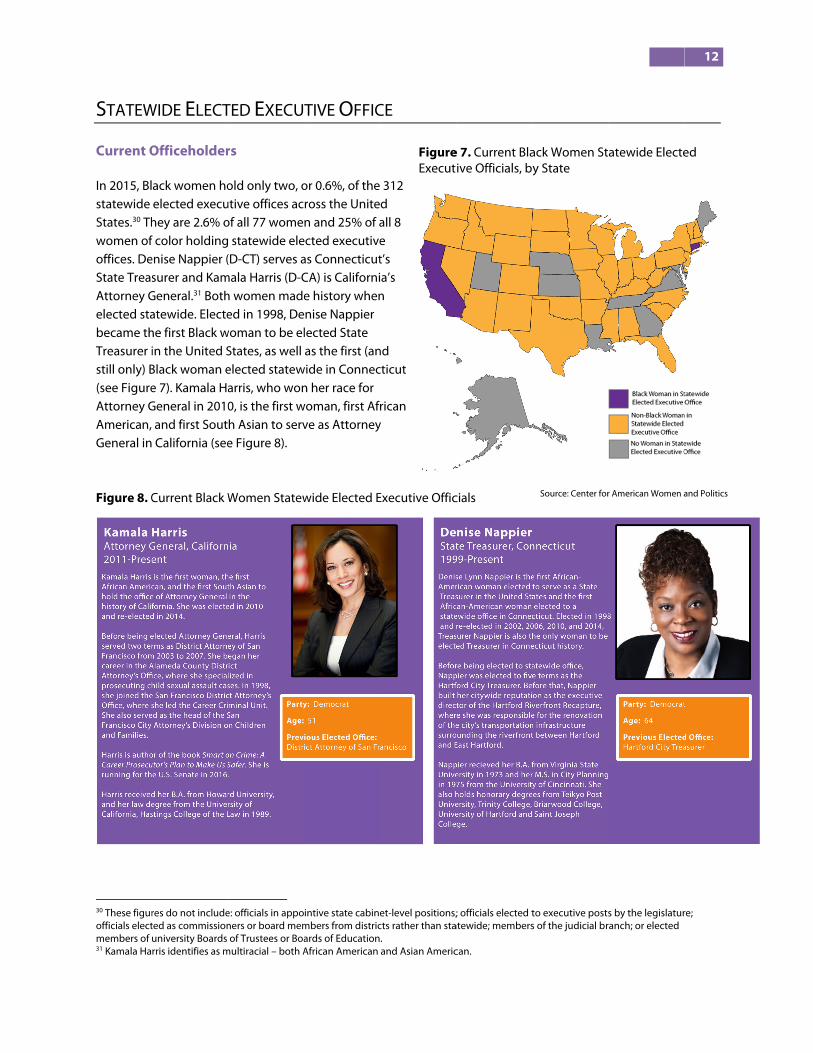
STATEW Current O In 2015, Blstatewide States.30 Thwomen ofoffices. DeState TreasAttorney Gelected stabecame thTreasurer istill only) B(see FigureAttorney GAmerican, General in
30 These figurofficials electmembers of 31 Kamala Ha
Figure 8. C
WIDE ELECT
Officeholder
ack women hoelected execu
hey are 2.6% of color holdingenise Nappier (surer and Kam
General.31 Bothatewide. Electehe first Black win the United SBlack woman ee 7). Kamala HaGeneral in 2010
and first Sout California (see
res do not includeted as commissionuniversity Boards rris identifies as m
Current Black W
TED EXECU
rs
old only two, outive offices acof all 77 wome
statewide ele(D-CT) serves a
mala Harris (D-Ch women madeed in 1998, De
woman to be elStates, as well elected statewarris, who won0, is the first wh Asian to serve Figure 8).
e: officials in apponers or board memof Trustees or Boa
multiracial – both A
Women Statew
TIVE OFFIC
or 0.6%, of theross the Uniten and 25% of a
ected executiveas ConnecticutCA) is Californie history whennise Nappier lected State as the first (an
wide in Connecn her race for
woman, first Afrve as Attorney
intive state cabinembers from districards of EducationAfrican American
wide Elected E
CE
312 d all 8 e t’s a’s
n
nd cticut
rican y
et-level positions;cts rather than sta. and Asian Americ
FigureExecut
Executive Offic
; officials elected tatewide; members
can.
e 7. Current Blaive Officials, by
cials Source: Center for
to executive postss of the judicial br
ack Women Sty State
r American Women a
s by the legislaturranch; or elected
atewide Electe
12
and Politics
re;
ed

13 Historical Officeholders The first Black woman elected to a statewide elected executive office was Secretary of State Vel Phillips (D-WI) in 1979. Since then, nine more Black women – six Democrats and three Republicans - have served in statewide elected executive office (see Table 5). Jennette Bradley (R-OH) is the only Black woman to hold two different statewide elected executive offices – Lieutenant Governor and State Treasurer. Black women have held 1.9% of the 576 statewide elected executive positions held by women and 29.7% of the 37 positions held by women of color since 1893. Accounting for women who have held multiple offices, Black women represent 2% of the 506 women who have ever held at least one statewide elected executive post. Unlike the Black women in Congress, the partisan diversity among Black women in statewide elected executive posts has resulted in relatively even, albeit very low, representation by party over time; Black women have held 1.5% of all statewide elected executive positions held by Republican women and 2.3% of all positions held by Democratic women since 1893. Black women have served in statewide elected executive offices in nine states. Wisconsin was the first state to elect a Black woman to statewide executive office and Indiana is the only state that has had more than one Black women in a statewide executive post (see Table 5). In comparison, women of color have served in statewide elective executive office in 19 states, and at least one woman has held a statewide elected executive post in 49 states. (Maine, with only one executive position elected statewide, is the only state that has not yet elected any women to statewide executive office.) As Table 5 shows, there have been no Black women governors. The first women of color to become governors were Nikki Haley (R-SC) and Susana Martinez (R-NM) in 2011. The dearth of Black women in lower statewide executive offices may affect the likelihood of electing a Black woman governor. Of the 37 women governors to date, 25 – or 67.6% - previously held another statewide executive office. And just as statewide executive posts are a potential pipeline to gubernatorial office, governors are frequently included in the pool of potential recruits for presidential runs.32
32 Twenty of the 44 U.S. Presidents have been governors.
Table 5. Black Women in Statewide Elected Executive Office
Name State Office Years of Service
Vel R. Phillips (D) WI Secretary of State 1979-1982
Pamela Carter (D) IN Attorney General 1993-1997
Vikki Buckley (R) CO Secretary of State 1995-1999
Denise Nappier (D) CT State Treasurer 1999-Present
Karen Freeman-Wilson (D) IN Attorney General 2000-2001
Jennette Bradley (R) OH Lieutenant Governor 2003-2005
State Treasurer 2005-2007
Sandra Kennedy (D) AZ Corporation Commissioner 2009-2013
Velda Jones-Potter (D) DE State Treasurer 2009-2011
Jennifer Carroll (R) FL Lieutenant Governor 2011-2013
Kamala Harris (D) CA Attorney General 2011-Present
Source: Center for American Women and Politics

A BLACK To date, made mChisholnominatand the the presfrequentfirst,” ful3). Thirtywoman herself anominatand U.S. race thatStill, shebefore csuccessfand genevolutioelected 2008). Thattentioindicate of the Wthe numand gubpotentia
BLACK W PatriciaShe servwhen shhave beO’LearyHermanCondol2009), hObama served awas theNationathe nati
K WOMAN PR
only two Blaajor-party bidm became thtion at a natiofirst Black peidency at a Dtly cited for nly aware of th
y years later, Cto launch a m
as a serious cation. As a formAmbassador
t matched or struggled toompeting in
ful and both fder, compari
on in the percpresident behe election on to the poteeven greate
White men whmber of Black bernatorial – ial Black wome
WOMEN IN PR
a Roberts Haved as Secrethe became Seeen appointey served as Sen was Secretaleezza Rice whaving served
took office inas Administra
e U.S. Ambassal Security Adion’s Attorne
ESIDENT?
ack women – ds for the U.S
he first Black wonal party co
erson to haveDemocratic Nnoting that shhe improbabCarol Mosele
major party bandidate withmer Senator, r, Moseley-Brr exceeded tho gain momen
any state prifaced similar ing both cand
ceptions of a tween 1972 a
of Barack Obaential for the fr readiness fo
ho have held women electis one route ten candidate
RESIDENTIAL C
arris became tary of Housinecretary of H
ed to cabinet ecretary of Enary of Labor d
was Secretaryd previously an 2009, he apator of the Ensador to the Udvisor. In 2015y General.
both membeS. presidencywoman to ha
onvention, as her name plational Conv
he ran becausbility of succe
ey- Braun beid for the preh her sights smember of t
raun broughthose of manyntum and droimaries. Whilechallenges ddidacies reveBlack womanand 2003 (Mcma in 2008 afirst female p
or candidatesthe office forted to statewtoward increaes for the pres
CABINETS
the first Blacng and Urbanealth, Educator cabinet-lenergy duringduring Presidy of State for as his Nationappointed twonvironmentalUnited Nation5, Loretta Ly
ers of Congrey. In 1972, Shiave her namewell as the fiaced in nom
vention. Chishse “someoneeding (Chishecame the seesidency, desset on the Dethe Illinois Stat credentials ty of her male opped out ofe neither wo
due to both theals at least son’s probabilitcClain, Carterand the signifpresident in 2s who do not r 219 years. In
wide offices –asing the poosidency.
ck woman apn Developmetion, and We
evel positions President Bi
dent Clinton’sPresident Geal Security Ad
o Black womel Protection Ans until July 2
ynch was con
ess - have irley e placed into irst woman ination for
holm is e had to do it
olm 1973, econd Black scribing emocratic ate House, to the 2004 opponents. f the race man was heir race ome ty of being r, and Brady ficant
2016 may fit the mold
ncreasing both senate
ol of
pointed to a ent under Prelfare. Since th
s in presidentll Clinton’s firs second term
eorge W. Bushdvisor (2001-en to cabinet Agency until 2013, when snfirmed as the
presidential esident Jimmhen, only six tial administrrst term (199
m (1997-2001h’s second te-2005). Whenlevel positioFebruary 201
she became Pe first Black w
cabinet in 19my Carter unti
more Black wrations. Haze3-1997); Alex
1); and erm in office (n President Ba
ns: Lisa Jack13, and SusaPresident Obawoman to ser
14
977. l 1979,
women el xis
(2005-arack
kson n Rice ama’s rve as

Statewid
nominees all womenbetween 26% of all fe9). In this pof the first Unlike in Cexecutive than fiftee2000 and 2through th50.8% of aoffice. Howoffice sinceJennette Belected exevident amwomen ca 33 Karen Free2009. Denise1998. 34 These calcutotal count o
0
100
200
300
400
500
600
700
800
900
1000
Figure 9. W
de Executive
since 2000 han statewide exe2000 and 2014emale nomineperiod, no Blac Black woman
Congress, the roffices are low
en percent (13.2014, compareheir primaries, ll women nom
wever, while ne 2000 have b
Bradley (R-OH) xecutive office mong challengandidates fare
man-Wilson (D-IN Nappier (D-CT) is
ulations count all f women candida
894
12767
Candidates
All Women
Women in Stat
Source: Ce
Office Cand
ve been Blackecutive candid
4.34 Black womeees and 47.3% ck woman won governor as h
rates of electorwer than the w.4%) of Black wed to 33% of aonly 25.7% of
minees. This treearly all Black een Democrat– represent juin this period.
gers, incumbenbest as incum
N) was appointed As included among
candidacies, not iates.
581
74
Nomine
Women of Col
te Executive O
enter for American W
didates
k women. Blackdates and 52.8en’s presence of all women o
n her party’s nhistory still to b
ral success of Bin rates for Wh
women candidll women cand
f Black womenend persists amwomen candits, two of the nust under one-. Finally, Black nts, and open bents and in o
Attorney general winners since 200
individual women
295
35
es W
or Black W
Office Elections
Women and Politics
k women state% of all womedeclines slightof color nominomination for
be made.
Black women chite women an
dates for statewdidates. While
n nominees wemong Democrdates (86.6%)
nine Republica-third of the nuwomen’s loweseat candidate
open seat race
in 2000 and Velda00, but as an incu
n candidates. Also
29 9
inners
Women
s, 2000-2014 Sanbonmatschallenge oexecutive othat they apposts. This fwomen’s unstatewide ecandidates.statewide eonly rarely, of the ten Bstatewide eoffice since women havelected exeBlack womefive womenoffice.33 Sommultiple-timwhether as
different stastatewide ex
ewide executiven of color stattly among prim
nees for statewthe gubernato
candidates annd women ovewide executive over half of B
ere successful oratic women caand nominees
an candidates umber of Blacker win rates at es, though – co
es (see Table 6)
a Jones Potter (D-mbent winner wh
o, 20 candidates w
su (2013) idenof achieving staoffice for womeppear to be ovfinding is evidnderrepresent
executive office. The election o
executive officeand in recent
Black women welected execut
2000. In that tve been candidecutive offices en have becomn have won stame of these Blame candidates
incumbents otewide execut
xecutive candive candidates tewide executmary winners,
wide executiveorial ballot, lea
d nominees foerall for statewe offices were lack women caon Election Daandidates for ss (94.3%) for st– Jennifer Car
k women to hothe statewide
onsistent with).
-DE) was appointeho was first electe
without race identi
ntifies the partiatewide electeen of color, noverlooked for tent in Black tation among eholders and of Black womees has occurrehistory. In fact
who have serveive posts entetime, 57 Black dates for statenationwide, 2
me nominees, atewide execuack women ares and nomineeor candidates ftive offices. Thidates and 35 represent 7.5%ive candidatesrepresenting
e office (see Figaving the elect
or statewide wide posts. Les
winners betweandidates maday, compared tstatewide exectatewide execroll (R-FL) andold statewide e executive levh all women – B
ed State Treasurered State Treasurer
ification are includ
15
icular ed
oting these
en to ed t, six ed in red
wide 7 and tive e
es, for hus, 67
% of s only
gure tion
ss een de it to cutive utive
vel are Black
r in in
ded in

16 Interestingly, there was a significant rise in the number of Black women candidates for statewide elected executive offices in 2014. Twenty-six Black women ran for these offices in 2014, double the previous high of 13 Black women candidates in 2010. Only half of those 2014 candidates made it through their primaries, and just two – the only incumbent Black women running – won on Election Day: Attorney General Kamala Harris (D-CA) and State Treasurer Denise Nappier (D-CT). In 2010, when 13 Black women ran for statewide elected executive office, nine Black women became nominees and three won their elections, including one incumbent and two non-incumbents. These data make evident the need to support and encourage Black women to enter statewide contests, but also to position more Black women in winnable races. Increasing the numbers of competitive Black women candidates for statewide elected executive offices is critical to the advancement of Black women in politics.
Table 6. Election Win Rates for Women Statewide Executive Candidates 2000-2014, by Race and Seat Status
All Women All Women of Color
Black Women
Challengers 7.0% 2.8% 0.0%
Incumbents 84.4% 73.7% 55.6%
Open Seat Candidates 26.0% 19.4% 10.0%
Source: Center for American Women and Politics
BLACK WOMEN DOMINATE GEORGIA’S DEMOCRATIC BALLOT FOR STATEWIDE OFFICE IN 2014 In 2014, Black women were nominees for five of the eight statewide elected executive positions on Georgia’s ballot. Black women were Democratic challengers in four races for lieutenant governor (Connie Stokes), secretary of state (Doreen Carter), insurance commissioner (Liz Johnson), and labor commissioner (Robbin Shipp). Valarie Wilson was the Democratic nominee in the open seat contest for state school superintendent. None of these women was successful in her statewide bid, but their dominance on the Democratic ticket was historic. Georgia’s Black women nominees also represented nearly 40% of all Black women nominees for statewide elected executive office in 2014, contributing significantly to the rise in overall numbers of Black women on statewide ballots.

Figure 10
STATE L Current O As of Nove256 are De192 serve legislatorsin state senand 3.5% oGeorgia an7). In GeorMaryland, largest prerepresentaMississipp Black wom2015. Mos4.7% (7 of Michigan H
There are nKentucky, are no BlacTable 7). Inthe states Louisiana’s15.3% of th 35 All calculat36 Both Arizo
0%
20%
40%
60%
80%
100%
. Black Women
LEGISLATU
Officeholder
ember 2015,35 emocrats, threin their states’, and 65.2% ofnates than in sof all state repnd Maryland, wgia, where BlaBlack women
esence of Blackation (8.6%). Bi.
men nearly dout of that increa150) to 10% (1
House of Repr
no Black womMaine, Montack women servn reflecting thethat fare worss resident pophe resident po tions of current st
ona and Wyoming
All Legislators
3.5%
n State Legisla
RES
rs
260 Black wome are Republic lower chambef all women of state houses aresentatives n
with Black womack women are
are 17% of thek women in itslack women a
ubled their numase occurred in15 of 150) of seesentatives fro
en state legislana, North Dakving in 21 stateir presence int in their repre
pulation, they hopulation, but tate legislators we went from havin
FemaleLegislators
14.4%
ators 2015
men serve in 4cans, and one sers. Black wom
f color state legmong womenationwide. Tab
men holding me 17.4% of the e population as population (2re at least half
mbers – from n the New Yoreats. The numom 2014 to 20
ators in 10 statkota, South Dake senates and
n the state popesentation of Bhold only 6.3%hold just 4.1%
ere updated as of g one to zero Blac
Women of ColoLegislators
65.2%
So
40 state legislatserves in a non
men are 3.5% ogislators (see Fn and women oble 7 lists the r
more than 10%population, th
and 10.1% of s20.2%), but ranf of all women
10 to 19 – in thrk State Assember of Black w15, though the
tes as of Novekota, Washing12 state hous
pulation, LouisBlack women. W
% of state legis% of state legisl
November 10, 20ck women legislat
or DemocraticLegislators
8.1%
ources: Center for A
tures across thn-partisan legiof all state legiFigure 10). Theof color, but rerepresentation
% of the seats, lhey hold 11.9%state legislatornks fourth in Blegislators in A
he New York smbly, where Blawomen also do
eir representa
mber 2015, ington, and Wyo
es or assemblisiana and SoutWhile Black wlative seats. Inlative seats. Th
15. tors from 2014 to
c RepublicaLegislator
0.1%
American Women an
he United Stateislature; 68 areslators, 14.4%
ey are slightly bepresent 3.4% n of Black womlead the other
% of state legisrs. Mississippi iBlack women’s Alabama, Geo
tate legislaturack women weubled – from t
ation there is st
cluding Alaskaming.36 More sies throughouth Carolina joinomen are 17.5
n South Carolinhis underrepre
2015.
nrs
State Sena
3.5%
nd Politics; National C
es. Of those 26e state senator
of all women better represeof all state sen
men by state; r states (see Taslative seats. Inis the state wit state legislativrgia, Louisiana
re from 2014 toent from holditwo to five – intill just 4.5%.
a, Arizona, Hawspecifically, th
ut the country n Mississippi a5% of the na, Black womesentation is
ators StateRepresent
3.6%
Conference of State
17
60, rs and state
ented nators
able n th the ve a, and
o ng
n the
waii, ere (see mong
en are
etatives
Legislatures

18
Table 7. Black Women State Legislators 2015, by State and Chamber
State Black Women
Representatives Black Women
Senators
Total Black Women
Legislators
Percent of All
Legislators
Percent of State
Resident Population
Georgia 22 6 28 11.86 17.37 Maryland 13 6 19 10.11 16.97 New York 15 4 19 8.92 10.18 Mississippi 14 1 15 8.62 20.19 Alabama 9 3 12 8.57 14.63 Illinois 9 5 14 7.91 8.27 Virginia 7 3 10 7.14 10.99 North Carolina 7 5 12 7.06 12.36 New Jersey 5 3 8 6.67 8.41 Florida 7 3 10 6.25 9.28 Louisiana 6 3 9 6.25 17.47 Ohio 5 3 8 6.06 7.26 Tennessee 6 1 7 5.30 9.48 Missouri 7 3 10 5.08 6.70 Texas 8 0 8 4.42 6.85 South Carolina 6 1 7 4.12 15.27 Indiana 4 2 6 4.00 5.52 Michigan 5 0 5 3.38 8.08 California 3 1 4 3.33 3.87 Delaware 1 1 2 3.23 12.64 Nevada 1 1 2 3.17 5.30 Pennsylvania 7 1 8 3.16 6.63 Colorado 3 0 3 3.00 2.62 Arkansas 1 3 4 2.96 8.58 Iowa 4 0 4 2.67 2.07 Kansas 3 1 4 2.42 3.71 Wisconsin 1 2 3 2.27 3.81 Connecticut 3 1 4 2.14 6.69 Nebraska N/A 1 1 2.04 2.90 New Mexico 2 0 2 1.79 1.52 Oklahoma 1 1 2 1.34 4.64 Oregon 0 1 1 1.11 1.38 Massachusetts 1 1 2 1.00 4.90 Utah 1 0 1 0.96 0.88 Idaho 0 1 1 0.95 0.59 Rhode Island 1 0 1 0.88 4.72 West Virginia 1 0 1 0.75 2.10 Vermont 1 0 1 0.56 0.85 Minnesota 1 0 1 0.50 3.46 New Hampshire 1 0 1 0.24 0.94 Arizona 0 0 0 0.00 2.79 Washington 0 0 0 0.00 2.57 Montana 0 0 0 0.00 0.46 Maine 0 0 0 0.00 0.89 Hawaii 0 0 0 0.00 1.56 Alaska 0 0 0 0.00 2.39 South Dakota 0 0 0 0.00 1.05 North Dakota 0 0 0 0.00 1.12 Kentucky 0 0 0 0.00 4.66 Wyoming 0 0 0 0.00 0.91
Sources: Center for American Women and Politics; National Conference of State Legislatures; U.S. Census Bureau
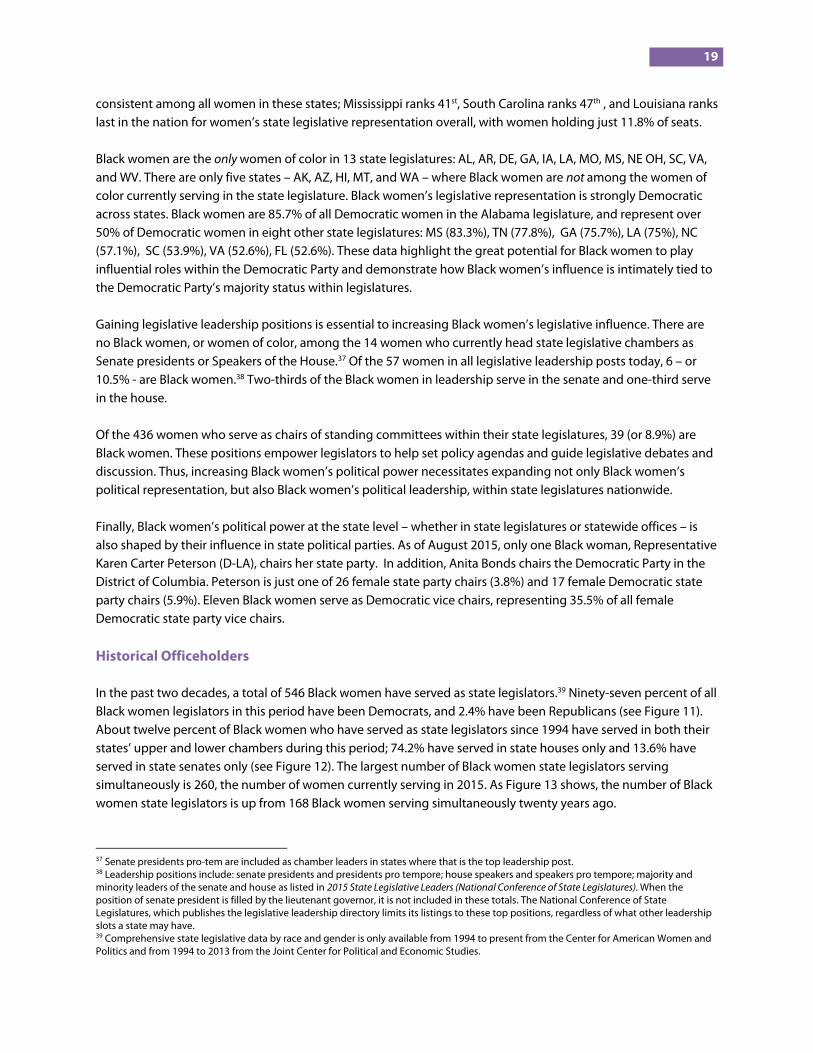
19 consistent among all women in these states; Mississippi ranks 41st, South Carolina ranks 47th , and Louisiana ranks last in the nation for women’s state legislative representation overall, with women holding just 11.8% of seats. Black women are the only women of color in 13 state legislatures: AL, AR, DE, GA, IA, LA, MO, MS, NE OH, SC, VA, and WV. There are only five states – AK, AZ, HI, MT, and WA – where Black women are not among the women of color currently serving in the state legislature. Black women’s legislative representation is strongly Democratic across states. Black women are 85.7% of all Democratic women in the Alabama legislature, and represent over 50% of Democratic women in eight other state legislatures: MS (83.3%), TN (77.8%), GA (75.7%), LA (75%), NC (57.1%), SC (53.9%), VA (52.6%), FL (52.6%). These data highlight the great potential for Black women to play influential roles within the Democratic Party and demonstrate how Black women’s influence is intimately tied to the Democratic Party’s majority status within legislatures. Gaining legislative leadership positions is essential to increasing Black women’s legislative influence. There are no Black women, or women of color, among the 14 women who currently head state legislative chambers as Senate presidents or Speakers of the House.37 Of the 57 women in all legislative leadership posts today, 6 – or 10.5% - are Black women.38 Two-thirds of the Black women in leadership serve in the senate and one-third serve in the house. Of the 436 women who serve as chairs of standing committees within their state legislatures, 39 (or 8.9%) are Black women. These positions empower legislators to help set policy agendas and guide legislative debates and discussion. Thus, increasing Black women’s political power necessitates expanding not only Black women’s political representation, but also Black women’s political leadership, within state legislatures nationwide. Finally, Black women’s political power at the state level – whether in state legislatures or statewide offices – is also shaped by their influence in state political parties. As of August 2015, only one Black woman, Representative Karen Carter Peterson (D-LA), chairs her state party. In addition, Anita Bonds chairs the Democratic Party in the District of Columbia. Peterson is just one of 26 female state party chairs (3.8%) and 17 female Democratic state party chairs (5.9%). Eleven Black women serve as Democratic vice chairs, representing 35.5% of all female Democratic state party vice chairs. Historical Officeholders In the past two decades, a total of 546 Black women have served as state legislators.39 Ninety-seven percent of all Black women legislators in this period have been Democrats, and 2.4% have been Republicans (see Figure 11). About twelve percent of Black women who have served as state legislators since 1994 have served in both their states’ upper and lower chambers during this period; 74.2% have served in state houses only and 13.6% have served in state senates only (see Figure 12). The largest number of Black women state legislators serving simultaneously is 260, the number of women currently serving in 2015. As Figure 13 shows, the number of Black women state legislators is up from 168 Black women serving simultaneously twenty years ago. 37 Senate presidents pro-tem are included as chamber leaders in states where that is the top leadership post. 38 Leadership positions include: senate presidents and presidents pro tempore; house speakers and speakers pro tempore; majority and minority leaders of the senate and house as listed in 2015 State Legislative Leaders (National Conference of State Legislatures). When the position of senate president is filled by the lieutenant governor, it is not included in these totals. The National Conference of State Legislatures, which publishes the legislative leadership directory limits its listings to these top positions, regardless of what other leadership slots a state may have. 39 Comprehensive state legislative data by race and gender is only available from 1994 to present from the Center for American Women and Politics and from 1994 to 2013 from the Joint Center for Political and Economic Studies.

Over the plegislators2013, wheand 37.9%As Smoothlegislative and senateAs a propoBlack womlegislatorsheld stead
Five of theBlack womWY – in thlegislaturethe state wTogether, nationwid Black womstate chamAssembly.Speaker ofwomen in RepresentMinority Lhigher offi
Figure 112015, by P
past two decad. In 1995, Blackn the last avai
% of all Black stah (2014) and olevel over the
es. In fact, whiortion of all sta
men’s represen dipped in 201
dy amidst those
e ten states thamen legislators
e past two dece over the pastwith the next hthese 94 wome since 1994.
men have earnember was Karen
In 2010, Sheilf the New JerseCongress heldative Karen Baeader from 20ice.
. Black Womenarty
13 Republicans
D
des, Black womk women werelable data on aate legislators thers have em
e past two decale 403 Black m
ate legislators, ntation has gro10 due to Repue electoral hits
at have no Blacs since 1994. Ocades. Finally, t two decades,highest numbe
men from two s
ed top leadersn Bass (D-CA) ia Oliver (D-NJ)ey Assembly. d leadership pass (D-CA) and 007 to 2009. Th
n State Legisla
2 Non-part
531 Democrats
men have steade 11% of all woall Black legislanationwide. T
mphasized, mucades can be at
men served in sBlack men’s re
own (see Figurublican success to Democrat
ck women statOnly one Black
Georgia has e with 54 wome
er of Black womstates represen
ship posts at thin 2008, who b) became the sNo Black womosts in their stRepresentativ
hese women d
atures 1994-
tisan
dily increased omen and 29.4ators was repo
Today, Black wch of the growttributed to Blastate legislaturepresentation e 13). State leg
sses nationwids.
te legislators inwoman has selected the green serving in tmen legislatornt just over 17
he state legislabecame the firsecond Black w
man has ever letate legislatureve Joyce Beattyemonstrate th
Figure 12015, by
S
as a proportio4% of all Black orted, Black wo
women are 14.4wth in Black repack women’s gres in 1995, on
has remainedgislative repre
de. Black wome
n 2015 – HI, Merved in each oeatest number the Georgia legrs – 40 – servin% of all Black w
ative level. Therst Black womawoman to leaded a state senaes before runny (D-OH), who
he value of lea
2. Black WomChamber
Se
67Served i
74erved in Upper
Chamber
Source: Ce
on of all womek state legislatoomen were 134% of all womepresentation agrowing prese
nly 397 Black md flat in the pas
sentation of wen’s represent
ME, MT, ND, andof five states –of Black wom
gislature sinceng between 19women state l
e first Black woan Speaker of td a state legislaate. Two of thening for the U.So was the Ohio
dership positio
en State Legis
405 erved in Lower
Chamber
in Both Chambe
enter for American W
en and all Blackors. By the end3.7% of all women state legislaat the state ence in state ho
men served in 2st 20 years, wh
women and Blatation, howeve
d SD - have ha– AK, ID, KY, UT
en to its state e 1994. Maryla994 and 2015. legislators serv
oman to lead hthe California ative chamber
e current BlackS. House;
o State House ons as pathwa
slatures 1994-
ers
Women and Politics
20
k d of men ators.
ouses 2013. hile ack er,
d no T, and
nd is
ving
her
r as k
ays to

21
18.0%
19.0%
20.0%
21.0%
22.0%
23.0%
24.0%
25.0%
7.0%
7.3%
7.5%
7.8%
8.0%
8.3%
8.5%
8.8%
9.0%
1995 1996 1997 1998 1999 2000 2001 2002 2003 2004 2005 2006 2007 2008 2009 2010 2011 2012 2013
Figure 13. Trends in State Legislative Representation 1994-2015, by Race and Gender
0.0%
0.5%
1.0%
1.5%
2.0%
2.5%
3.0%
3.5%
4.0%
Black Women Legislators
Women Legislators
Black Legislators
Sources: Center for American Women and Politics; Joint Center for Political and Economic Studies

22 Finally, while the first Black woman did not enter Congress until 1969, the first Black woman to ever serve in a state legislature, Minnie Buckingham Harper, was appointed to the West Virginia State House in 1929. Nearly ten years later, Crystal Dreda Bird Faust (D-PA) became the first Black woman elected to a state legislature. Table 8 lists the first Black women legislators elected in each state, demonstrating that Black women’s legislative representation is a relatively recent historical phenomenon in many states. In fact, five of the Black women currently serving in state legislatures are the first to be elected in their states. Based on available public records, there are three states that have yet to elect their first Black women legislators: Maine, North Dakota, and South Dakota. While Black women’s state legislative representation is trending upward, these data indicate that opportunities vary by state.
Table 8. First Black Women State Legislators, by State
State Name Year Entered Office
AK Bettye Davis 1990 State House AL Louphenia Thomas 1977 State House AZ Ethel Maynard 1966 State House AR Irma Hunter Brown 1981 State House CA Yvonne Brathwaite Burke 1967 State House CO Arie Taylor 1973 State House CT Margaret E. Morton 1973 State House DE Henrietta Johnson 1970 State House FL Gwen Sawyer Cherry 1971 State House GA Grace Towns Hamilton 1966 State House HI Helene (Hilyer) Hale 2001 State House ID Cherie Buckner-Webb* 2010 State House IL Floy Clements 1959 State House IN Julia Carson 1973 State House IA Willie Stevenson Glanton 1965 State House KS Barbara Ballard* 1993 State House KY Amelia Tucker Moore 1962 State House LA Dorothy Mae Taylor 1972 State House ME No Black woman legislator to date MD Verda F. Welcome and Irma George Dixon 1959 State House MA Doris Bunte 1973 State House MI Charline Rainey White 1951 State House
MN Neva Walker 2001 State House MO DeVerne Lee Calloway 1963 State House MS Alyce Clark* 1986 State House MT Geraldine W. Travis 1974 State House NE JoAnn Maxey 1977 Unicameral NV Bernice Mathews 1995 State Senate NH Diane Long 1987 State House NJ Madaline A. Williams 1958 State House
NM Sheryl Williams Stapleton* 1996 State House NY Bessie A. Buchanan 1954 State House NC Annie Brown Kennedy 1979 State House ND No Black woman legislator to date OH Helen Rankin 1978 State House OK Hannah Diggs Atkins 1969 State House OR Margaret Carter 1985 State House PA Crystal Dreda Bird Fauset 1939 State House RI Maria Lopes 1989 State House SC Juanita Willmon-Goggins 1975 State House SD No Black woman legislator to date TN Dorothy Lavinia Brown 1967 State House TX Barbara Jordan 1967 State Senate UT Sandra Hollins* 2015 State House VT Louvenia Dorsey Bright 1992 State House VA Yvonne B. Miller 1984 State House WA Peggy Joan Maxie 1971 State House WI Marcia P. Coggs 1977 State House WV Elizabeth Simpson Drewry 1951 State House WY Harriett Elizabeth Byrd Papers 1981 State House
Information is as comprehensive as possible via data collected by the Center for American Women and Politics from state public records and legislative archives or histories in each state. *Currently serving

MAYOR Current O The data adata for otdue to themunicipalimayors exEllen Walkever electeoffice in 19mayoral regauged bymunicipali27 Black wpopulationstates and1.9% of all62.8% of asize. Four Bmunicipal Taylor has the 8th largone womaAntonio intook officeFebruary 2U.S. - sincebecomingincluding sBlack wom Eight Blacklargest sinin 2002, Shmajor sout2002, Lottipopulous in cities wimayors in these numrepresenta 40 Mayors aretenure as ma41 These num
RS
Officeholder
available on U.ther electoral oe nation’s vast ities. No compists, but Smith
ker Craig-Jonesed mayor in a 971 in Urbancrepresentation y their presencities nationwid
women are mayns over 30,000 the District of mayors, 10.5%ll women of coBlack women cposts in Amerserved as may
gest city in thean mayor headn 2015: Mayor Ae in January 202015. Stephanie 2010. Rawling the first Blacksix women of c
men represent j
k women, incluce 2002.40 In fa
hirley Franklin thern city, oneie Shackelfordcities, becominith populationcities with pop
mbers indicate ation in munic e included in this cayor.
mbers include may
rs
S. mayors is moffices presentnumber and v
prehensive list h (2013) does rs was the first BU.S. municipalrest, Ohio. Blasince then can
ce in some of tde. As of Noveyors in cities w
0, serving in 17f Columbia. Th% of all femaleolor mayors incurrently holdrica’s 100 largeyor of San Ant U.S. – since Ju
ds a city larger Annise Parker
015, and Paula ie Rawlings-Blgs-Blake was a
k woman to evcolor. Still, wojust under 2%
uding the fouract, Sheila Dixowas the first w
e that ranked in was the first Bng Mayor of Li
ns over 30,000,pulations overthat there is m
cipal leadership count if their cities
yors sworn in durin
more limited thted above,
variety of of all women
report that Black woman lity, taking ck women’s
n be roughly the largest mber 2015,
with 7 different hey represent e mayors, and n cities of this
top est cities. Ivy onio, Texas –
uly 2014. Only than San (Houston, TX)Hicks-Hudsonake has served
also named theer hold that pomen are only 1
% of those post
r current Blackon preceded M
woman mayor n the top ten iBlack woman tittle Rock, AR i representing
r 30,000 in the much opportunp throughout t
s were ranked am
ng November 201
Figure 14populatio
an
. Washington,n became mayd as mayor of Be President of osition. In all, 118.3% of all mas.
k women listedMayor Rawling
of Atlanta, GAn terms of pop
to be elected mn 1987. Since 6.8% of all wopast 13 years.
nity for advancthe United Sta
ong the top 100 l
15, but not mayor
Sources: CenteNOTE: Fu
4. Black Womaons over 30,00
, DC (ranked 23yor of Toledo, OBaltimore, Marthe U.S. Confe
18 women maajor city (popu
d above, have gs-Blake as theA and the first Bpulation durinmayor of one o 2002, 66 Blac
omen mayors a.41 With over 14cing women’s,ates. And, as th
argest cities in th
s elected in 2015
er for American Womull list of current Blac
an Mayors 20100)
3rd in size) MayOhio (ranked 7ryland – the 25erence of Mayoayors make theulation >30,00
led cities amoe mayor of BaltBlack woman e
ng her decade-of the nation’sk women haveand 41.5% of a400 cities of th, and Black wo
he next section
e United States at
to be sworn in aft
men and Politics; U.Sck women mayors an
updated as
15 (cities with
yor Muriel Bow70th in size) in 5th largest city ors in June 20e top 100 list, 00) mayors, and
ng the nation’timore. Takingelected mayor-long tenure. Bs 100 most e served as maall women of chis size nationwomen’s, n will show, th
t any point during
ter November 201
. Conference of Maynd cities in Appendixs of November 10, 20
23
wser
in the 15,
d
’s 100 office r of a Before
ayors color wide,
here
g their
15.
yorsx C,015

Figure 15
are importcommunit
BLACK W Measuringelected offdefined. Stparticipatigiving to cpolitical mparticipatisubgroup However, gap is morwith relativbetween mthe traditiothe politicwork in loc2015). Exprecognizeshelping toFinally, Blauntil the pnational pJunn 1997
On at leastBlack male
0.0%
10.0%
20.0%
30.0%
40.0%
50.0%
60.0%
70.0%
80.0%
. Black Voter T
tant questionsties into politic
WOMEN IN
g Black womenfice depends otandard modeon – including
candidates, womeeting – have
on among me(ANES 2014; Bmore recent sure isolated to tvely few gend
men and womonal indicatorsal activities thacal communiti
panding definits the extra-inst
o identify a broack women’s inpresent has pro
olitics as voter7).
t one measuree peers and me
60.7%
54.1%
1984
Turnout 1984-2
s about how tocal officeholdin
N THE ELEC
n’s political paron how politicels and measurg traditional morking for a pa historically sh
en than womenBurns, Schlozmurveys demonthe non-Hispaner differences en of color (Cos of participatiat women of cies, churches, ations of what ititutional polit
oader swath ofnvolvement anovided the polrs and elected
e of formal – oren and women
55.9% 59
50.5% 53
1988 1
2012
o translate Blacng.
TORATE
rticipation outal participatiores of political
measures like prty, or attendin
hown greater n in each racia
man and Verba nstrate that thinic White popin political act
onway 2008). Mion are often ecolor undertakand through las “political” totical contributf potential cannd leadership iticization andofficials (Brow
r traditional – pn of all other ra
9.2% 56.1
3.9%49.1
992 199
So
ck women’s de
tside of n is
olitical ng a
al 2001). s gender ulation tivity Moreover, exclusive of ke through abor organizin include activiions of womendidates (Beckwin social move
d drive to partiwn 1992; Cole a
political particaces. Black wo
1%59.7%
1%53.0%
96 2000
ource: U.S. Census Bu
emonstrated c
ng (Cohen 200sm and commn of color, espwith 1986; Harement politics cipate more foand Stewart 19
cipation, Black omen have reg
%63.4%
% 55.8%
0 2004
Table 9. Blac
2014
2012
2010
2008
2006
2004
2002
2000
1998
Source
ureau, Current Popu
commitment to
03, 2005; Junn munity engage
ecially Black wrdy-Fanta 1995from slavery t
ormally in loca996; Davis 197
women have gistered and v
68.1%
60.5%
2008
Black Women
Black Men Vot
ck Voter Regist
Black Men
59.7%
69.4%
59.0%
66.2%
56.7%
64.7%
57.6%
63.9%
60.4%
e: U.S. Census Bureau
ulation Survey, uses
o their local
1997; Sanbonement better women, while a5; Junn 1997). through civil rial, state, and 71; Giddings 19
surpassed theoted at higher
70.1%
61.4%
2012
Voter Turnout
ter Turnout
tration 1998-20
Black Wo
66.4%
76.2%
65.9%
72.4%
64.3%
71.9%
66.2%
70.3%
66.1%
u, Current Populationuses “Black alone”
“Black alone” catego
24
matsu
also
ights
984;
eir r rates
014
omen
%
%
%
%
%
%
%
%
%
n Survey, category
ory

25 than their male counterparts in every election since 1998 (see Table 9 and Figure 15).42 Since then, the highest percentage of eligible Black women voters registered for any one election was in 2012, when 76.2% of Black women were registered (see Table 9). In the same year, 69.4% of Black men were registered to vote. The difference in Black men and women’s registration rate has been between 5.8 and 8.6 points, with Black women registering at a higher rate in each of the past nine election cycles. Table 11 displays the gender gap in voter turnout by race in each presidential election since 1984, revealing that Black women have outvoted Black men in every cycle. In the 2014 midterm elections, Black women outvoted their Black male counterparts by 7.4 percentage points; 43% of Black women and 35.6% of Black men turned out to vote. Unlike the previous two presidential cycles, Black women did not vote at higher rates than non-Hispanic White men (45.2%) or women (46.3%) in 2014, but still remained the most reliable voters among people of color (see Table 10). In 2008 and 2012, Black women’s rate of voting exceeded all other race/gender subgroups for the first time in U.S. history. Just over 70% of eligible Black women voters – or 10.44 million - reported voting in 2012, compared to 61.4% (7.4 million) of eligible Black men voters and 65.6% (51.8 million) of non-Hispanic White women (see Table 11). The 2012 election was also the first since 1996 in which Black voters, men and women combined, voted at a higher rate than non-Hispanic White voters.
Table 11. Voter Turnout 1984-2012, by Race and Gender
Black Women
Black Men
White, non-Hispanic Women
White, non-Hispanic Men
Latinas Latinos Asian/Pacific Islander Women
Asian/Pacific Islander Men
2012 70.1% 61.4% 65.6% 62.6% 49.8% 46.0% 48.5% 46.0%
2008 68.1% 60.5% 67.9% 64.2% 51.8% 47.9% 47.5% 47.6%
2004 63.4% 55.8% 68.4% 65.9% 49.4% 44.8% 46.2% 42.0%
2000 59.7% 53.0% 63.0% 60.6% 46.1% 43.9% 42.5% 44.3%
1996 56.1% 49.1% 60.6% 58.5% 46.4% 41.3%
1992 59.2% 53.9% 67.8% 66.4% 49.4% 47.0%
1988 55.9% 50.5% 62.5% 61.2% 46.3% 45.5%
1984 60.7% 54.1% 64.2% 62.8% 48.6% 47.2%
Source: U.S. Census Bureau, Current Population Survey, uses “alone” categories for each racial subgroupNOTE: Because of changes in the Current Population Survey race categories starting in 2003, data from 2004-2012 is not directly comparable with data from
previous years. No data for the Asian/Pacific Islander population is available prior to 2000. See more detail on race categories at www.census.gov.
Not only did Black women turn out at the highest numbers in 2008 and 2012, but they voted overwhelmingly for President Barack Obama, causing many to credit Black women for his success and for the persistence of a presidential voting gender gap in which women are more likely than men to favor the Democratic candidate (e.g. Smooth 2014).43 In both years, 96% of Black women voted for President Obama, while the majority of non- 42 Census Data on voting is only available for the eligible voting population (citizens) by race/ethnic categories since 1984. 43 The gender gap in voting is the difference in the percentage of women and men who support a given candidate, generally the leading or winning candidate. A gender gap in voting for presidential nominees, whereby women are more likely than men to vote for the Democratic candidate, has been evident since 1980. For more details, see http://cawp.rutgers.edu/facts/voters.
Table 10. Voter Turnout 2014, by Race and Gender
Women Men
Black 43.0% 35.6%
White, non-Hispanic 46.3% 45.2%
Latino/a 28.7% 25.2%
Asian/Pacific Islander 28.1% 26.0%
Source: U.S. Census Bureau, Current Population Survey, uses “Black alone” category
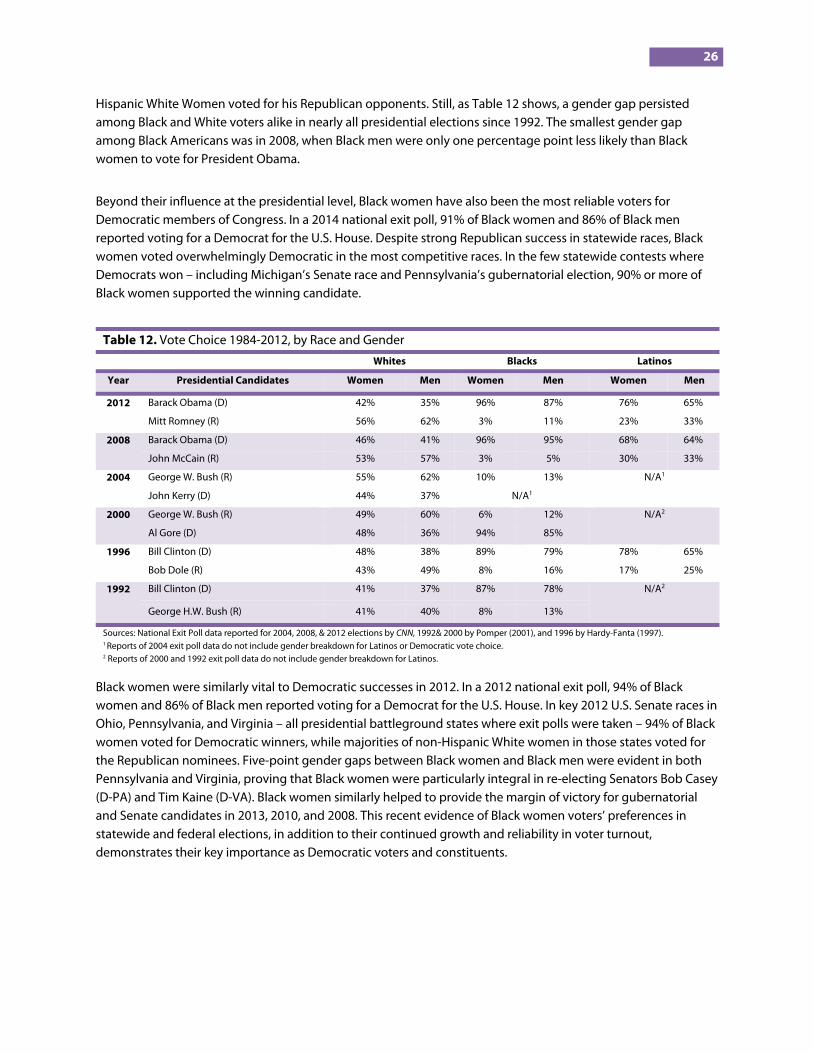
26 Hispanic White Women voted for his Republican opponents. Still, as Table 12 shows, a gender gap persisted among Black and White voters alike in nearly all presidential elections since 1992. The smallest gender gap among Black Americans was in 2008, when Black men were only one percentage point less likely than Black women to vote for President Obama.
Beyond their influence at the presidential level, Black women have also been the most reliable voters for Democratic members of Congress. In a 2014 national exit poll, 91% of Black women and 86% of Black men reported voting for a Democrat for the U.S. House. Despite strong Republican success in statewide races, Black women voted overwhelmingly Democratic in the most competitive races. In the few statewide contests where Democrats won – including Michigan’s Senate race and Pennsylvania’s gubernatorial election, 90% or more of Black women supported the winning candidate.
Black women were similarly vital to Democratic successes in 2012. In a 2012 national exit poll, 94% of Black women and 86% of Black men reported voting for a Democrat for the U.S. House. In key 2012 U.S. Senate races in Ohio, Pennsylvania, and Virginia – all presidential battleground states where exit polls were taken – 94% of Black women voted for Democratic winners, while majorities of non-Hispanic White women in those states voted for the Republican nominees. Five-point gender gaps between Black women and Black men were evident in both Pennsylvania and Virginia, proving that Black women were particularly integral in re-electing Senators Bob Casey (D-PA) and Tim Kaine (D-VA). Black women similarly helped to provide the margin of victory for gubernatorial and Senate candidates in 2013, 2010, and 2008. This recent evidence of Black women voters’ preferences in statewide and federal elections, in addition to their continued growth and reliability in voter turnout, demonstrates their key importance as Democratic voters and constituents.
Table 12. Vote Choice 1984-2012, by Race and Gender
Whites Blacks Latinos
Year Presidential Candidates Women Men Women Men Women Men
2012 Barack Obama (D) 42% 35% 96% 87% 76% 65%
Mitt Romney (R) 56% 62% 3% 11% 23% 33%
2008 Barack Obama (D) 46% 41% 96% 95% 68% 64%
John McCain (R) 53% 57% 3% 5% 30% 33%
2004 George W. Bush (R) 55% 62% 10% 13% N/A1
John Kerry (D) 44% 37% N/A1
2000 George W. Bush (R) 49% 60% 6% 12% N/A2
Al Gore (D) 48% 36% 94% 85%
1996 Bill Clinton (D) 48% 38% 89% 79% 78% 65%
Bob Dole (R) 43% 49% 8% 16% 17% 25%
1992 Bill Clinton (D) 41% 37% 87% 78% N/A2
George H.W. Bush (R) 41% 40% 8% 13%
Sources: National Exit Poll data reported for 2004, 2008, & 2012 elections by CNN, 1992& 2000 by Pomper (2001), and 1996 by Hardy-Fanta (1997). 1 Reports of 2004 exit poll data do not include gender breakdown for Latinos or Democratic vote choice. 2 Reports of 2000 and 1992 exit poll data do not include gender breakdown for Latinos.

27 2015 ELECTIONS State legislative elections were held in three states – MS, NJ, and VA – on November 3, 2015.44 Initial results show little change in the numbers of Black women legislators in these states. New Jersey will gain one new Black woman legislator in their next session. Three new Black women will serve in Mississippi in 2015, representing the majority of new women elected in a year when the total number of women in the legislature is slated to decline. In Virginia, Black women are two of five new women who will take office in January 2015, when the overall representation of women will increase slightly from 24 to 27 members of 140 across both chambers. Elections for statewide elected executive offices were held in two states – KY and MS – on November 3, 2015. Addie Green (D), a Black woman, was defeated as a challenger to incumbent Cindy Hyde-Smith in Mississippi’s election for Commissioner of Agriculture. In Kentucky, however, Republican Jenean Hampton was elected Lieutenant Governor, becoming the first Black statewide officeholder in Kentucky and the first Republican woman elected to statewide elected executive office in the state. Hampton, who will take office in January 2016, will be Kentucky’s fourth female Lieutenant Governor and one of three Black women holding statewide elected executive office nationwide.
LOOKING AHEAD: BLACK WOMEN IN 2016 Black women voters will necessarily play an important role in the 2016 elections, from the presidential level down. Because Black women have topped all other race and gender groups in turnout in the past two presidential cycles, Democratic candidates and campaigns will rely on their votes to secure their base. Likewise, Republican candidates and campaigns may seek to chip away at the Democratic stronghold among Black women voters, creating potential opportunities for Black women to inform the dialogue among conservatives. Most significantly, Democrats will seek to maintain the levels of engagement evident in the Black community in 2008 and 2012, when the historic election and re-election of a Black president motivated many Black voters – male and female – to participate. Seeking positive trends in both their share of the Black vote and overall turnout among Black voters, candidates will need to make direct appeals on the issues most important to the Black community. Black women’s voices are vital in the conversation and among those making demands on candidates. Black women also represent a significant portion of the Rising American Electorate (RAE), an estimated 125 million eligible voters – composed of unmarried women, people of color, and people under 30 years old. Black women sit at the intersection of these groups, representing just over half of the 27.9 million eligible Black voters and 19% of all eligible unmarried women voters (Lake and Harville 2015).45 They also represent the most active and dependable contingent of the RAE, contributing to its growing influence and playing an essential role in building coalitions across RAE groups to influence electoral outcomes in future races.
A recent survey of likely Black women voters from Essence and the Black Women’s Roundtable found that Black women are taking an active interest in the upcoming 2016 Presidential election and seek a candidate that will address issues that can improve their quality of life. According to the survey, the top three most important issues for Black women are affordable healthcare, living wage jobs, and college affordability (Essence 2015). Candidates’ 44 Louisiana holds statewide and state legislative elections on November 21, 2015. 45 These calculations are drawn from U.S. Census Bureau data reported in November 2014. For the latest data on the Rising American Electorate, see the latest research from the Voter Participation Center: http://www.voterparticipation.org/.

28 strategies to address these economic issues will influence Black women’s engagement and vote choice.
Not only will Black women cast ballots on Election Day 2016, but many will be on the ballot. The 2016 election is shaping up to be a year of significant opportunity for Black women candidates, some of whom have already thrown their hats in the ring in some of the most competitive races of the cycle. As of November 10, 2015, five Black women are candidates for the U.S. Senate, 36 Black women are running for U.S. House seats, and four Black women have announced that they are running for statewide elected executive posts nationwide.46 Seventeen of these women are incumbents who are likely to win re-election to their congressional and statewide seats.
Among the twelve challengers, some have the potential to take advantage of vulnerable incumbents. For example, two Black women are vying for the Democratic nomination in Florida’s 10th congressional district, one that is viewed as a likely Democratic pick-up. Val Demings, vying for the nomination this year, lost to incumbent Daniel Webster by less than four percent in 2012.
Open seat contests provide the greatest opportunity for Black women running in 2016. As of November 2015, five U.S. Senate seats will be open in the 2016 cycle and 24 House members have decided they will not run for re-election next November. Eleven Black women have announced their intentions to run for those open seats, including four Black women running for the U.S. Senate and seven running for open House seats. Democrats Donna Edwards (MD) and Kamala Harris (CA) are both poised to be strong nominees for open U.S. Senate seats in their states. In Florida, Pam Keith is vying for the Democratic nomination for an open U.S. Senate seat, joining a crowded field of Democrats including Congressmen Patrick Murphy and Alan Grayson. If successful, these women will make history on multiple fronts. All three would be the first women of color elected to the U.S. Senate from their respective states, in addition to joining the very small number of women of color ever to serve in the nation’s upper chamber. In fact, if two of these women are successful in 2016, they would double the number of women of color who have ever served in the U.S. Senate. Andrea Zopp, a Democrat seeking the U.S. Senate nomination to challenge Senator Mark Kirk (R-IL), is also in a highly competitive race in which she could, if elected, make history as the second Black woman that Illinois has sent to the U.S. Senate.47 Joyce Dickerson is also running as a Democratic challenger to Republican Senator Tim Scott in South Carolina. If any of these Black women candidates are elected to the U.S. Senate, it would be the first time since 1999 that a Black woman served in the Senate.
At the statewide elected executive level, two Black women – one Republican and one Democrat – have put their names forward as candidates for open seats, both in Missouri. Republican Bev Randles, if elected Lieutenant Governor, and Democrat Robin Smith, if elected Secretary of State, could become the first Black person or people elected statewide in Missouri.
While it is too early in the election season to provide a complete picture of Black women’s candidacies and their potential for electoral success, the candidacies announced to date have the potential to make history and advance Black women’s leadership across multiple levels of office.
46 Before official filing deadlines, the Center for American Women and Politics lists candidates as “potential” based on information from at least two of the following sources: Campaigns and Elections; House Race Hotline; CQ Politics Daily; Politics1.com; The Hill; Roll Call; Politico; Real Clear Politics; and local newspapers in many states. 47 Zopp is competing for the Democratic nomination against another woman of color, Representative Tammy Duckworth.

29 CONCLUSION
Since our first report on the Status of Black Women in American Politics in June 2014, Black women have increased their presence in political leadership roles, raised their voices amidst essential policy debates, and used their votes to influence outcomes in the 2014 elections. Black women hold significant – and expanding – economic and political influence today. But how do they harness that power at the ballot box and on the ballot? What are the steps necessary to advancing Black women’s political representation to reflect their presence in the population? Focusing on recruitment and support will maximize opportunities for Black women to win, in addition to expanding the sites for these opportunities beyond majority-minority districts at the state and federal level. Even when not elected, how do Black women leverage the power of their votes to make sure that their voices do not go unheard in policy debates and decision-making?
A first step in harnessing the power of Black women’s votes is ensuring that they recognize that power. As the most reliable Democratic voters in the past two presidential elections, Black women are an essential part to the winning coalition that any Democratic candidate will need to win in 2016. Tying those votes to policy demands and priorities can ensure that Black women’s voices will not only be heard from outside of government, but can move further to the center of political debates and decision-making. Prioritizing the political empowerment of Black women as citizens, candidates, and elected officials is not only a matter of democratic fairness, but essential to engaging new constituencies, elevating policy dialogue, and promoting policy priorities, perspectives, and solutions that may be lost if Black women’s voices, votes, and leadership are absent from American politics.

30 SOURCES
American Association of University Women (AAUW). 2015. The Simple Truth About the Gender Pay Gap. Available: http://www.aauw.org/resource/the-simple-truth-about-the-gender-pay-gap/.
American Express Open (AEO). 2015. The 2015 State of Women-Owned Businesses Report. Available: http://www.womenable.com/content/userfiles/Amex_OPEN_State_of_WOBs_2015_Executive_Report_finalsm.pdf.
American National Election Surveys (ANES). 2014. “Guide to Public Opinion and Electoral Behavior.” Available: http://www.electionstudies.org/nesguide/gd-index.htm.
Barrett, Edith J. 2001. "Black Women in State Legislatures: The Relationship of Race and Gender to the Legislative Experience.” In The Impact of Women in Public Office, ed. Susan J. Carroll. Bloomington, IN: Indiana University Press, 185-204.
Beckwith, Karen. 1986. American Women and Political Participation. New York, NY: Greenwood Press.
Black Women’s Roundtable. 2015. Black Women in the United States. Available: http://ncbcp.org/news/releases/BWRReport.BlackWomeninU.S.2015.3.26.15FINAL.pdf.
Bratton, Kathleen A., Kerry Haynie, and Beth Reingold. 2008. "Gender, Race, Ethnicity and Representation: The Changing Landscape of Legislative Diversity." In Book of the States. Lexington, KY: Council of State Governments, 73-79.
Brown, Nadia. 2014. Sisters in the Statehouse: Black Women and Legislative Decision-Making. New York, NY: Oxford University Press.
Brown, Elaine. 1992. A Taste of Power: A Black Woman's Story. New York, NY: Anchor Books.
Burns, Nancy, Kay Lehman Schlozman, and Sidney Verba. 2001. The Private Roots of Public Action: Gender, Equality, and Political Participation. Cambridge, UK: Harvard University Press.
Carroll, Susan J. 2003. Women and American Politics: New Questions, New Directions. New York, NY: Oxford University Press.
Carroll, Susan J. and Kira Sanbonmatsu. 2013. More Women Can Run. New York, NY: Oxford University Press.
Chisholm, Shirley. 1973. The Good Fight. Harper Collins.
Clayton, Dewey M., and Angela M. Stallings. 2000. “Black Women in Congress: Striking the Balance.” Journal of Black Studies 30: 574-603.
Cohen, Cathy. 2003. "A Portrait of Continuing Marginality: The Study of Women of Color in American Politics." In Women and American Politics: New Questions, New Directions, ed. Susan J. Carroll. Oxford, UK: Oxford University Press, PGS.
Cohen, Cathy. 2005. “Health Activism and the Black Church.” In The Public Influences of African American Churches: Policy Studies, ed. D. Smith. Durham, NC: Duke University Press.
Cole, ER and AJ Stewart. 1996. “Meanings of political participation among Black and White women: political identity and social responsibility.” Journal of Personal Social Psycholy 71(1):130–40.
Conway, M. Margaret. 2008. “The Gender Gap: A Comparison across Racial and Ethnic Groups.” In Voting the Gender Gap, ed. Lois Duke Whitaker. Champaign, IL: University of Illinois Press, 170-184.

31 Crenshaw, Kimberle, and Andrea J. Ritchie. 2015. #SayHerName: Resisting Police Brutality Against Black Women. The African American Policy Forum, Center for Intersectionality and Social Policy Studies, Columbia Law School. Available: http://www.aapf.org/sayhernamereport/.
Darcy, Robert, and Charles Hadley. 1988. “Black Women in Politics: The Puzzle of Success.” Social Science Quarterly 77(4): 888-98.
Darcy, R., Charles D. Hadley, and Jason F. Kirksey. 1997. "Election Systems and the Representation of Black Women in American State Legislatures." In Women Transforming Politics: An Alternative Reader. New York, NY: New York University Press, PGS.
Davis, Angela. 1971. If They Come in the Morning: Voices of Resistance. Third Press.
Essence and Black Women’s Roundtable. 2015. “Power of the Sister Vote Poll Results.” Available: http://ncbcp.org/news/releases/Essence.BWR.Power_of_the_Sister_Vote_Poll_Results.9.15.15.FINAL.pdf.
Frederick, Angela. 2013. “Bridging Narrative In: Race-Gender Storytelling, Political Ambiton, and Women’s Paths to Public Office.” Journal of Women, Politics, and Policy 34(2): 113-137.
Gamble, Katrina. 2010. “Young, Gifted, Black, and Female: Why Aren’t There More Yvette Clarkes in Congress?” In Whose Black Politics? Cases in Post-Racial Black Leadership, ed. Andra Gillespie. New York, NY: Routledge Press, 293-308.
Gay, Claudine. 2001. “The effect of black congressional representation on political participation.” American Political Science Review 95: 589-602.
Gay, Claudine, and Katherine Tate. 1998. “Doubly bound: The impact of gender and race on the politics of Black women.” Political Psychology 19(1): 169–84.
Giddings, Paula. 1984. When and Where I Enter: The Impact of Black Women on Race and Sex in America. New York, NY: Harper Collins.
Githens, Marianne, and Jewel L. Prestage. 1977. A Portrait of Marginality: The Political Behavior of the American Woman. New York, NY: McKay.
Hajnal, Zoltan, John Griffin, Brian Newman, and David Searle. 2015. “Political Inequality in America:�Who Loses and What Can Be Done About It?” Under Review. Available: http://pages.ucsd.edu/~zhajnal/page5/documents/politicalinequality-anon.pdf.
Hardy-Fanta, Carol. 1995. "Latina Women and Political Leadership: Implications for Latino Community Development." New England Journal of Public Policy 11(1): 221-235.
Hardy-Fanta, Carol, Pei-te Lien, Dianne M. Pinderhughes, and Christine M. Sierra. 2006. "Gender, Race, and Descriptive Representation in the United States: Findings from the Gender and Multicultural Leadership Project." Journal of Women Politics & Policy 28 (3-4): 7-41.
Harris-Perry, Melissa V. Sister Citizen: Shame, Stereotypes, and Black Women in America. New Haven, CT: Yale University Press.
Hawkesworth, Mary. 2003. "Congressional Enactments of Race–Gender: Toward a Theory of Raced– Gendered Institutions." American Political Science Review 97(4): 529-550
Hill Collins, Patricia . 2000. Black Feminist Thought: Knowledge, Consciousness, and the Politics of Empowerment. New York, NY: Routledge.

32 Junn, Jane. 1997. “Assimilating or Coloring Participation? Gender, Race, and Democratic Political Participation.” In Women Transforming Politics: An Alternative Reader, eds. Cathy J. Cohen, Kathleen B. Jones, and Joan C. Tronto. New York, NY: New York University Press, 387-397.
Kaba, Amadu Jacky, and Deborah E. Ward. 2009. “African Americans and U.S. Politics: The Gradual Progress of Black Women in Political Representation.” Review of Black Political Economy 36: 29-50.
Keele, Luke, and Ishmail K. White .2011. “African American Turnout in Majority-Minority Districts.” Presented at the Annual Meeting of the American Political Science Association.
Lake, Celinda and Luke Harville. 2015. “Gearing Up for 2016: How Population and Electoral Trends Among the RAE Inform the 2016 Cycle.” Lake Research Partners. Report for the Voter Participation Center. Available: http://data.voterparticipation.org/wp-content/uploads/2015/09/Gearing-Up-for-2016-Webinar-Deck.pdf.
McClain, Paula, Niambi M. Carter, and Michael C. Brady. 2005. "Gender and Black Presidential Politics: From Chisholm to Moseley Braun." The Journal of Women, Politics and Policy 27(1): 51-68.
McConnaughy, Corrine M., and Ishmail K. White. 2011. “Racial Politics Complicated:The Work of Gendered Race Cues in American Politics.” Presented at the New Research on Gender in Political Psychology Conference, Rutgers University, March 4-5, 2011.
Ms. Foundation. 2015. “A Fresh Look at the Public’s View toward Issues and Solutions.” Available: http://forwomen.org/wp-content/uploads/2015/10/Ms-National-Survey-Executive-Summary.pdf.
Nielsen. 2015. Increasingly Affluent, Educated, and Diverse: African-American Consumers, the Untold Story. Available: http://www.nielsen.com/content/dam/corporate/us/en/reports-downloads/2015-reports/african-american-consumer-untold-story-sept-2015.pdf.
Orey, Byron D'Andra, Wendy Smooth, Kimberly S. Adams, and Kisha Harris-Clark. 2006. "Race and Gender Matter: Refining Models of Legislative Policy Making in State Legislatures." Journal of Women Politics & Policy 28 (3/4): 97-119.
Palmer, Barbara, and Dennis Simon. 2012. Women and Congressional Elections: A Century of Change. Lynne Reiner.
Philpot, Tasha S. and Hanes Walton. 2007. "One of Our Own: Black Female Candidates and the Voters who Support Them." American Journal of Political Science 51(1): 49-62
Pinderhughes, Dianne. 1987. Race and Ethnicity in Chicago Politics: A Reexamination of Pluralist Theory. Champaign, IL: University of Illinois Press.
Sanbonmatsu, Kira. 2015. “Women of Color in American Politics.” Political Parity Research Inventory. Available: https://www.politicalparity.org/wp-content/uploads/2015/08/Parity-Research-Women-Of-Color.pdf.
Sanbonmatsu, Kira. 2013. “The Candidacies of U.S. Women of Color for Statewide Executive Office.” Paper presented at the Annual Meeting of the American Political Science Association, Chicago, IL.
Sanbonmatsu, Kira. 2006. Where Women Run: Gender and Party in the American States. Ann Arbor, MI: University of Michigan Press.
Scola, Becki. 2006. "Women of Color in State Legislatures: Gender, Race, Ethnicity and Legislative Office Holding." Journal of Women Politics & Policy 28(3/4): 43-70.
Shames, Shauna. 2014. The Rational Non-Candidate: A Theory of (Uneven) Candidate Deterrence. Dissertation. Harvard University.
Singh, Robert. 1998. The Congressional Black Caucus. Sage Publications.

33 Smith, Adrienne R. 2013. The Election, Incorporation, and Policy Impact of Women in City Government. Dissertation. Emory University.
Smooth, Wendy. 2014. “African American Women and Electoral Politics: Translating Voting Power into Officeholding.” In Gender and Elections: Shaping the Future of American Politics (3rd Edition), eds. Susan J. Carroll and Richard L. Fox. New York, NY: Cambridge University Press, 167-189.
Smooth, Wendy. 2001. African American Women State Legislators: The Impact of Gender and Race on Legislative Influence. Ph.D. Dissertation, University of Maryland at College Park.
Stokes-Brown, Atiya and Kathleen Dolan. 2010. “Race, Gender, and Symbolic Representation: African American Female Candidates as Mobilizing Agents.” Journal of Elections, Public Opinion, and Parties 20: 473-494.
Tate, Katherine. 2003. Black Faces in the Mirror: African Americans and Their Representatives in the U.S. Congress. Princeton, NJ: Princeton University Press.
Tate, Katherine. 1991. “Black Political Participation in the 1984 and 1988 Presidential Elections.” American Political Science Review 85: 1159-76.
Theilmann, John, and Al Wilhite. 1989. "The Determinants of Individuals' Campaign Contributions to Congressional Campaigns." American Politics Quarterly 17(3): 312-331.
Trounstein, Jessica, and Melody Valdini. 2008. "The Context Matters: The Effects of Single-Member versus At-Large Districts on City Council Diversity." American Journal of Political Science 52(3): 554-569.
Violence Policy Center. 2015. Black Homicide and Victimization in the United States. Available: http://www.vpc.org/studies/blackhomicide15.pdf.
Warner, Judith. 2014. The Women’s Leadership Gap: Women’s Leadership by the Numbers. Fact Sheet. Center for American Progress. Available: https://www.americanprogress.org/issues/women/report/2014/03/07/85457/fact-sheet-the-womens-leadership-gap/.
Women Donors Network. Justice for All? Available: http://wholeads.us/justice/.

34 APPENDICES
Appendix A: All Black Congresswomen
State Name Chamber Party Years Served
AL Terri Sewell House D 2011-Present
CA Maxine Waters House D 1991-Present
CA Barbara Lee House D 1998-Present
CA Karen Bass House D 2011-Present
CA Yvonne Brathwaite Burke House D 1973-1978
CA Juanita Millender-McDonald House D 1996-2007
CA Diane Watson House D 2001-2010
CA Laura Richardson House D 2007-2012
FL Corrine Brown House D 1993-Present
FL Frederica Wilson House D 2011-Present
FL Carrie P. Meek House D 1993-2002
GA Cynthia McKinney House D 1993-2006
GA Denise Majette House D 2003-2004
IL Robin Kelly House D 2013-Present
IL Cardiss Collins House D 1973-1996
IL Carol Moseley Braun Senate D 1993-1998
IN Katie Hall House D 1982-1984
IN Julia Carson House D 1997-2007
MD Donna Edwards House D 2009-Present
MI Brenda Lawrence House D 2015-Present
MI Barbara-Rose Collins House D 1991-1996
MI Carolyn Cheeks Kilpatrick House D 1997-2010
NC Alma Adams House D 2014-Present
NC Eva M. Clayton House D 1993-2002
NJ Bonnie Watson Coleman House D 2015-Present
NY Yvette Clarke House D 2007-Present
NY Shirley Chisholm House D 1969-1982
OH Marcia Fudge House D 2009-Present
OH Joyce Beatty House D 2013 - Present
OH Stephanie Tubbs Jones House D 1999-2008
TX Eddie Bernice Johnson House D 1993-Present
TX Sheila Jackson Lee House D 2009-Present
TX Barbara C. Jordan House D 1973-1978
UT Mia Love House R 2015-Present
WI Gwen Moore House D 2005-Present
Non-Voting Members
DC Eleanor Holmes Norton Delegate D 1991-Present
VI Stacey Plaskett Delegate D 2015-Present
VI Donna Christensen Delegate D 1997-2015
Source: Center for American Women and Politics

Appendix
050
100150200250300
050
100150200250300
050
100150200250300
1200125013001350140014501500
x B: Trends oof Women’s S
Asian
State Legislati
Black W
Lati
n/Pacific Is
White W
ive Represen
Women
inas
slander W
Women
ntation 1994-2
Women
2015, by Racee
35
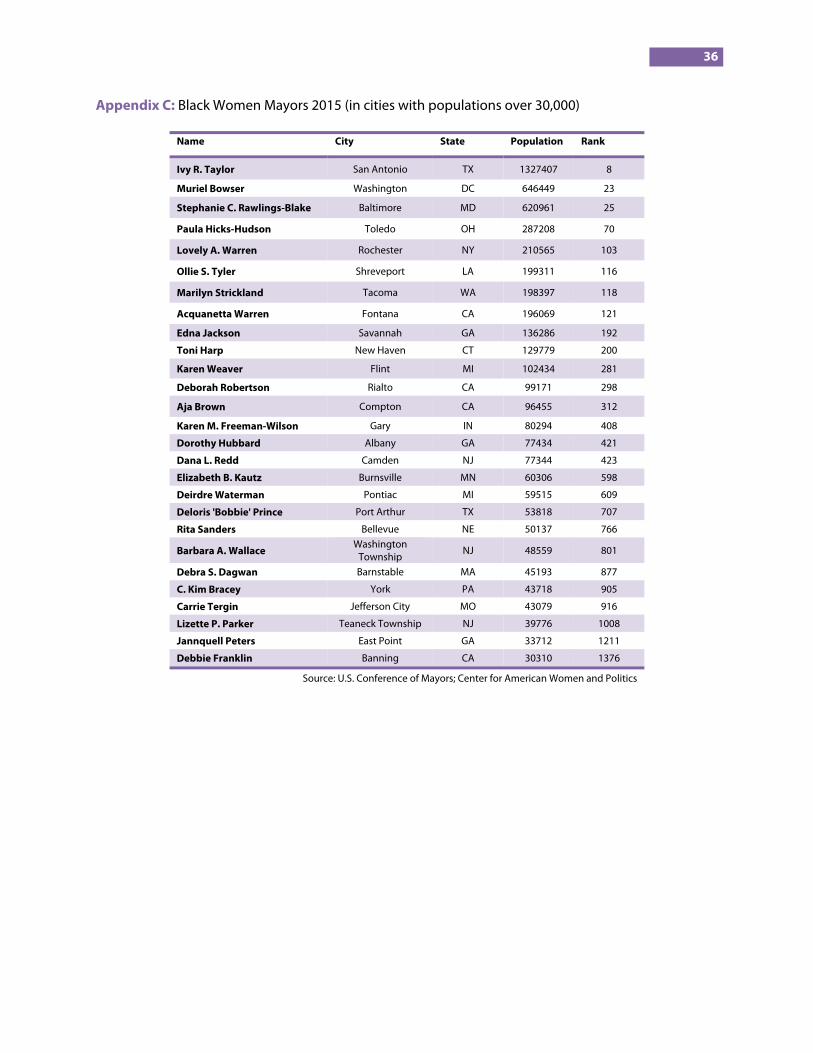
36 Appendix C: Black Women Mayors 2015 (in cities with populations over 30,000)
Name City State Population Rank
Ivy R. Taylor San Antonio TX 1327407 8
Muriel Bowser Washington DC 646449 23
Stephanie C. Rawlings-Blake Baltimore MD 620961 25
Paula Hicks-Hudson Toledo OH 287208 70
Lovely A. Warren Rochester NY 210565 103
Ollie S. Tyler Shreveport LA 199311 116
Marilyn Strickland Tacoma WA 198397 118
Acquanetta Warren Fontana CA 196069 121
Edna Jackson Savannah GA 136286 192
Toni Harp New Haven CT 129779 200
Karen Weaver Flint MI 102434 281
Deborah Robertson Rialto CA 99171 298
Aja Brown Compton CA 96455 312
Karen M. Freeman-Wilson Gary IN 80294 408
Dorothy Hubbard Albany GA 77434 421
Dana L. Redd Camden NJ 77344 423
Elizabeth B. Kautz Burnsville MN 60306 598
Deirdre Waterman Pontiac MI 59515 609
Deloris 'Bobbie' Prince Port Arthur TX 53818 707
Rita Sanders Bellevue NE 50137 766
Barbara A. Wallace Washington
Township NJ 48559 801
Debra S. Dagwan Barnstable MA 45193 877
C. Kim Bracey York PA 43718 905
Carrie Tergin Jefferson City MO 43079 916
Lizette P. Parker Teaneck Township NJ 39776 1008
Jannquell Peters East Point GA 33712 1211
Debbie Franklin Banning CA 30310 1376
Source: U.S. Conference of Mayors; Center for American Women and Politics

147 Prince Street, Suite 1Brooklyn, NY 11201Tel: 646.494.9620 www.HigherHeightsforAmerica.orgTwitter: @HigherHeights4