Embed Size (px)
Citation preview
Voices in Japanese Animation: A Phonetic Study of Vocal Stereotypes of Heroes and Villains in Japanese Culture
Mihoko Teshigawara B.A., Nagoya University, Japan, 1996 M.A., Nagoya University, Japan, 1998
A Dissertation Submitted in Partial Fulfillment of the Requirements for the Degree of
DOCTOR OF PHILOSOPHY
in the Department of Linguistics
0 Mihoko Teshigawara, 2003 University of Victoria
All rights reserved. This dissertation may not be reproduced in whole or in part, by photocopying or other means, without the permission of the author.
Supervisor: Dr. John H. Esling
ABSTRACT
The voices of heroes and villains in Japanese animation (anime) are thought to
represent the vocal stereotypes of good and bad characters in Japanese culture. In this
study, phonetic properties of the voices of heroes and villains in anime were examined.
Previous studies on vocal stereotypes reveal that people infer similar personality traits
fi-om voices. A few studies have investigated the acoustic correlates of personality in
speech, and a few have examined auditory correlates identified by phoneticians; however,
no study has investigated the correspondence among auditory correlates, acoustic
correlates, and laypersons' perceptions. This research attempts to fill these gaps in our
knowledge by investigating the phonetic correlates of vocal stereotypes.
In Chapter 1, four hypotheses about the auditory, acoustic, and perceptual
characteristics of the voices of heroes and villains were formulated based on previous
research on vocal stereotypes and vocal cues to personality and emotion. After a
preliminary study using the voices of heroes and villains from four TV series, 20 anime
series and movies were selected for the main analysis (Chapter 2). In Chapter 3, the
auditory analysis of the voices of 88 anime characters was performed, using a modified
version of Laver's descriptive fiamework for voice quality (Laver, 1994,2000). Based on
this analysis, in which epilaryngeal settings (i.e., laryngeal sphinctering vs. pharyngeal
expansion) played a significant role, four voice types were identified to categorize the
voices of heroes and villains. Following the auditory analysis, a series of acoustic
analyses, namely pitch, vowel formant, and spectrographic analyses, were performed, and
the relationship between these acoustic measures and the character roles and voice types
was examined (Chapter 4). In Chapter 5, in order to investigate whether the identified
auditory characteristics contribute to people's perception of good and bad characters,
Japanese laypersons' perceptions of selected speech samples were examined in an
experimental setting where 32 participants listened to content-masked speech excerpts of
the 27 selected target speakers and rated their impressions of age, gender, physical
characteristics, personality traits, emotional states, and vocal characteristics. Quantitative
and qualitative analyses were performed in order to examine the relationship between
auditory correlates and the participants' trait attributions. Lastly, the results &om the three
aforementioned components of the present study (i.e., the auditory and acoustic analyses
and the perceptual experiment) were compared statistically by calculating correlations
among the three, using correlation analyses, factor analysis, and cluster analysis (Chapter
6).
The findings of this study are as follows (see Chapter 7). The present study was
able to identify the auditorily critical vocal components that differentiate good and bad
characters, namely epilaryngeal states. Whereas the majority of the heroes' voices
exhibited an absence of pharyngeal constriction and the presence of breathy voice, the
majority of villains' voices exhibited non-neutral epilaryngeal states (i.e., moderate to
extreme laryngeal sphinctering or pharyngeal expansion). The perceptual experiment that
contrasted epilaryngeal states in anime voices was successful in confirming the effects of
these settings on laypersons' perceptions. Participants attributed unfavorable physical
traits, personality traits, emotional states, and vocal characteristics to speakers who
exhibited non-neutral epilaryngeal states regardless of the roles they played in the
original cartoons. The acoustic analysis results were less clear-cut in differentiating
voices of heroes from those of villains. Mean FO and FO range did not differ very much
between the two roles; as for vowel formants, only F2 was found to be consistently lower
in villains than in heroes, which was attributed to pharyngeal expansion and, in the case
of females, pharyngeal constriction as well. The results of the correlation analyses
suggest that the auditory analysis results accounted for more of the variance found in the
perceptual experiment than the acoustic measures.

Contents
.......................................................................................................................... Title Page i . . ........................................................................................................................... Abstract 11
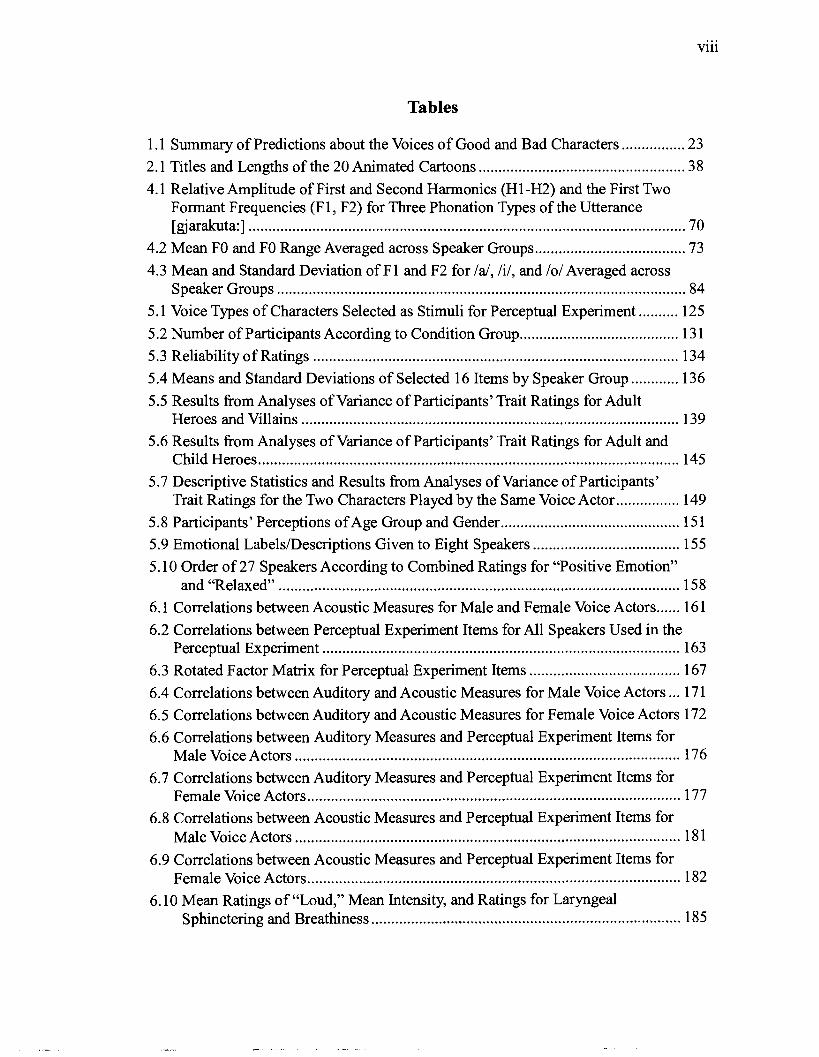
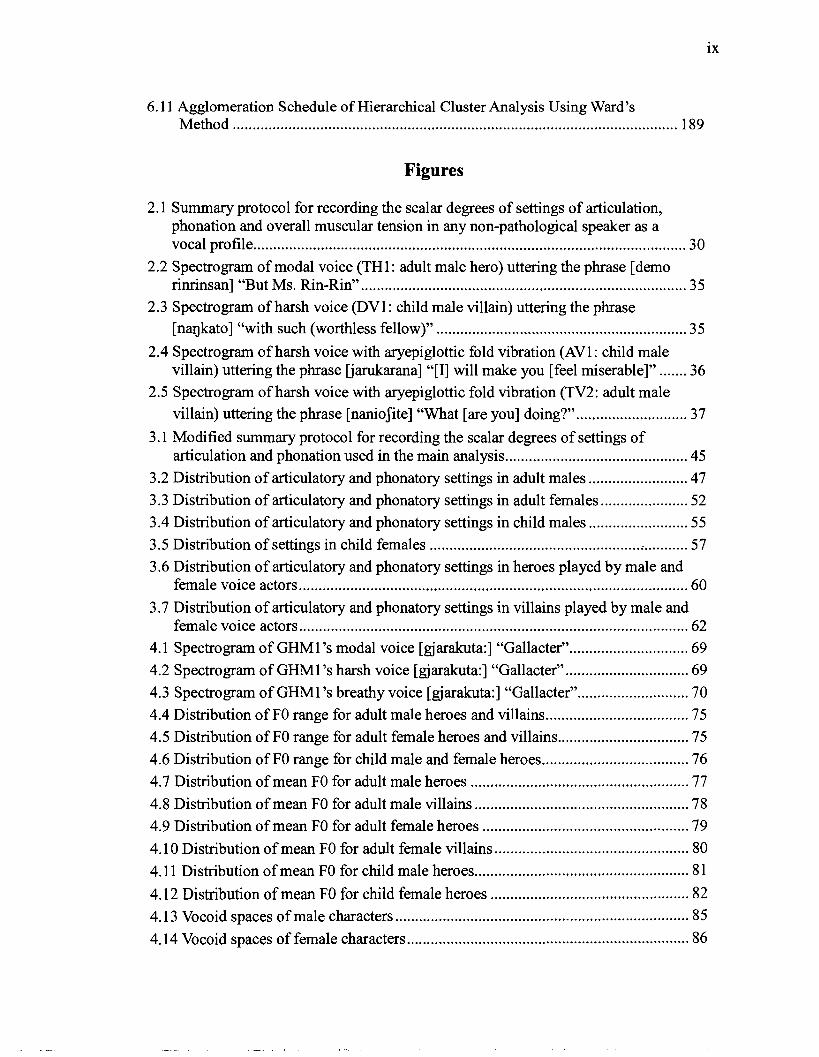
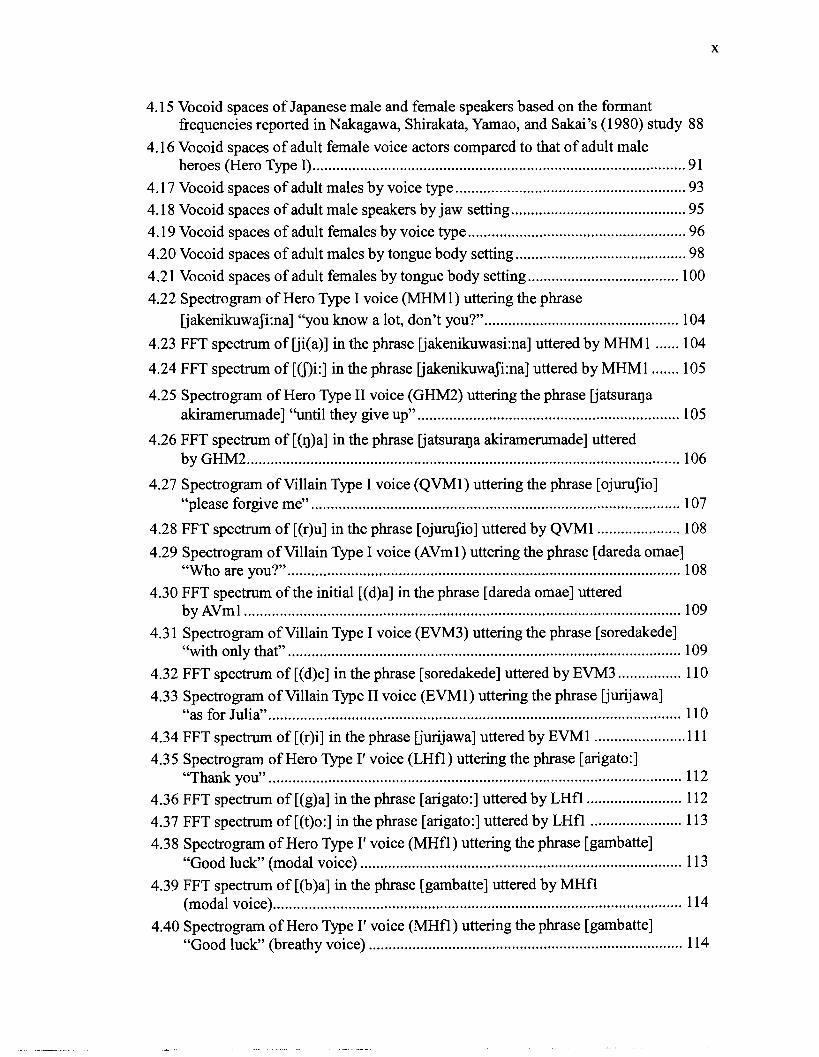
Table of Contents ............................................................................................................ v ... ................................................................................................................ List of Tables vin
List of Figures ................................................................................................................ ix . . ......................................................................................................... Acknowledgments xi1
Chapter 1 Background ................................................................................................. 1 1.1 Introduction ................................................................................................... 1 1.2 Psychological Markers in Voice ................................................................... 2
........................................................... 1.2.1 Literature on Voice Quality 2 1.2.2 Literature on Vocal Cues of Personality and Emotion ................... 5
......................................... 1.2.2.1 Personality markers in speech 5 .............................. 1.2.2.2 Literature on vocal cues to emotion 15
...................................................................................... 1.3 Research on Anime 20 .................................................... 1.3.1 Literature on Anime Characters 21
....................................................... 1.3.2 Literature on Cartoon Voices 22 1.4 Hypothesis ................................................................................................... 22
Chapter 2 Methodology and Data Collection ........................................................... 26 . . ....................................................................................... 2.1 Preliminary Study 2 6 2.1.1 Purposes and Procedure ............................................................... 26 2.1.2 Materials ....................................................................................... 26
................................................... 2.1.3 Preliminary Analysis of Setting 28 .......................................................................... 2.1.3.1 Method 28 ........................................................................... 2.1.3.2 Results 32
2.1.4 Preliminary Spectrographic Analysis ........................................... 34 2.1.5 Distribution of Voice Quality Features of Good versus Bad
Characters in the Preliminary Study ............................................. 37 2.2 Materials ...................................................................................................... 38
.... Chapter 3 The Auditory Description of Voice Quality in Japanese Animation 40
..................................................................................... 3.1 Method of Analysis 40 ..................... 3.2 Voice Quality Feature Distributions: Heroes versus Villains 46
3.2.1 Adult Males .................................................................................. 47 .............................................................................. 3.2.2 Adult Females 52
.................................................................................. 3.2.3 Child Males 54

3.2.4 Child Females ............................................................................... 57
3.2.5 Summary ...................................................................................... 58 ... 3.3 Voice Quality Feature Distributions: Male versus Female Voice Actors 59
3.4 Prediction about Acoustic Analysis Results ................................................ 62
Chapter 4 The Acoustic Description of Voice Quality in Japanese Animation ..... 65 4.1 Method of Analysis ..................................................................................... 65 4.2 Pitch Analysis .............................................................................................. 72 4.3 Vowel Formant Analysis ............................................................................. 83
............................................................................ 4.4 Spectrographic Analysis 101
........................................................................... Chapter 5 Perceptual Experiment 121 ...................................................................................................... 5.1 Method 121
...................................................... 5.1.1 Content-Masking Technique 122 5.1.2 Stimuli ........................................................................................ 123
............................................................................. 5.1.3 Questionnaire 128 ................................................................................. 5.1.4 Participants 130
.................................................................................... 5.1.5 Procedure 131 5.2 Results ....................................................................................................... 132
................................................................................... 5.2.1 Reliability 133 .................................................................. 5.2.2 Descriptive Statistics 135
5.2.3 Analyses of Variance: Heroes versus Villains ........................... 138 ..................... 5.2.4 Analyses of Variance: Adult versus Child Heroes 144
5.2.5 Analyses of Variance: Two Characters Played by the Same ................................................................................. Voice Actor 148
...................................... 5.2.6 Results of Age and Gender Perception 150 ................................. 5.2.7 Qualitative Analysis of Emotional Labels 154
......................... 5.2.8 Discussion of the Random-Splicing Technique 156
Chapter 6 Correlations among Auditory and Acoustic Analyses and ........................................................................... Perceptual Experiment 160
.................................................................... 6.1 Correlations within Analyses 160 ..................................... 6.1.1 Correlations among Acoustic Measures 160
6.1.2 Correlations among Perceptual Experiment Items ..................... 162 ................................................................. 6.2 Correlations between Analyses 169
6.2.1 Correlations between Auditory Measures and Acoustic ..................................................................................... Measures 169
6.2.2 Correlations between Auditory Measures and Perceptual ....................................................................... Experiment Items 175

vii
6.2.3 Correlations between Acoustic Measures and Perceptual Experiment Items ....................................................................... 180
6.2.4 Discussion .................................................................................. 186 6.3 Cluster Analysis ........................................................................................ 188
Chapter 7 Conclusions .............................................................................................. 194 7.1 Summary ................................................................................................... 194
7.2 Future Research ......................................................................................... 200
References .................................................................................................................. 203 Appendixes ................................................................................................................. 216
Appendix A .................................................................................................... 2 1 6 Appendix B ..................................................................................................... 217
Appendix C ................................................................................................. 2 19 ..................................................................................................... Appendix D 224
... Vlll
Tables
................ 1.1 Summary of Predictions about the Voices of Good and Bad Characters 23 2.1 Titles and Lengths of the 20 Animated Cartoons .................................................... 38 4.1 Relative Amplitude of First and Second Harmonics (HI -H2) and the First Two
Formant Frequencies (F 1. F2) for Three Phonation Types of the Utterance [gjarakuta:] .............................................................................................................. 70
4.2 Mean FO and FO Range Averaged across Speaker Groups .................................. 73 4.3 Mean and Standard Deviation of Fl and F2 for /a/. /i/. and 101 Averaged across
....................................................................................................... Speaker Groups 84 5.1 Voice Types of Characters Selected as Stimuli for Perceptual Experiment .......... 125 5.2 Number of Participants According to Condition Group ................................... 131 5.3 Reliability of Ratings ............................................................................................ 134 5.4 Means and Standard Deviations of Selected 16 Items by Speaker Group ............ 136 5.5 Results from Analyses of Variance of Participants' Trait Ratings for Adult
Heroes and Villains ............................................................................................... 139 5.6 Results from Analyses of Variance of Participants' Trait Ratings for Adult and
Child Heroes .......................................................................................................... 145 5.7 Descriptive Statistics and Results from Analyses of Variance of Participants'
Trait Ratings for the Two Characters Played by the Same Voice Actor ................ 149 5.8 Participants' Perceptions of Age Group and Gender ............................................. 151 5.9 Emotional Labels/Descriptions Given to Eight Speakers ..................................... 155 5.10 Order of 27 Speakers According to Combined Ratings for "Positive Emotion"
and "Relaxed" ..................................................................................................... 158 ...... 6.1 Correlations between Acoustic Measures for Male and Female Voice Actors 161
6.2 Correlations between Perceptual Experiment Items for All Speakers Used in the .......................................................................................... Perceptual Experiment 163
6.3 Rotated Factor Matrix for Perceptual Experiment Items ...................................... 167 6.4 Correlations between Auditory and Acoustic Measures for Male Voice Actors ... 17 1 6.5 Correlations between Auditory and Acoustic Measures for Female Voice Actors 172 6.6 Correlations between Auditory Measures and Perceptual Experiment Items for
................................................................................................. Male Voice Actors 176 6.7 Correlations between Auditory Measures and Perceptual Experiment Items for
.............................................................................................. Female Voice Actors 177 6.8 Correlations between Acoustic Measures and Perceptual Experiment Items for
................................................................................................. Male Voice Actors 181 6.9 Correlations between Acoustic Measures and Perceptual Experiment Items for
.............................................................................................. Female Voice Actors 182 6.10 Mean Ratings of "Loud. " Mean Intensity. and Ratings for Laryngeal
.............................................................................. Sphinctering and Breathiness 185
6.11 Agglomeration Schedule of Hierarchical Cluster Analysis Using Ward's Method ................................................................................................................ 189
Figures
2.1 Summary protocol for recording the scalar degrees of settings of articulation. phonation and overall muscular tension in any non-pathological speaker as a vocal profile ............................................................................................................. 30
2.2 Spectrogram of modal voice (TH1: adult male hero) uttering the phrase [demo . ................................................................................. rinrinsan] "But Ms Rin-Rin" 3 5
2.3 Spectrogram of harsh voice (DVl : child male villain) uttering the phrase .............................................................. [nar~kato] "with such (worthless fellow)" 3 5
2.4 Spectrogram of harsh voice with aryepiglottic fold vibration (AV1: child male ....... villain) uttering the phrase Ljarukarana] "[I] will make you [feel miserable]" 36
2.5 Spectrogram of harsh voice with aryepiglottic fold vibration (TV2: adult male villain) uttering the phrase [naniosite] "What [are you] doing?" ............................ 37
3.1 Modified summary protocol for recording the scalar degrees of settings of articulation and phonation used in the main analysis .............................................. 45
3.2 Distribution of articulatory and phonatory settings in adult males ......................... 47 3.3 Distribution of articulatory and phonatory settings in adult females ...................... 52 3.4 Distribution of articulatory and phonatory settings in child males ......................... 55 3.5 Distribution of settings in child females ..................................................... .......... 57 3.6 Distribution of articulatory and phonatory settings in heroes played by male and
female voice actors .................................................................................................. 60 3.7 Distribution of articulatory and phonatory settings in villains played by male and
female voice actors .................................................................................................. 62 4.1 Spectrogram of GHMl 's modal voice [gjarakuta:] "Gallacter" .............................. 69 4.2 Spectrogram of GHMl 's harsh voice [gjarakuta:] "Gallacter" ............................... 69 4.3 Spectrogram of GHM1 's breathy voice [gjarakuta:] "Gallacter" ............................ 70 4.4 Distribution of FO range for adult male heroes and villains ................................ 75 4.5 Distribution of FO range for adult female heroes and villains ................................. 75 4.6 Distribution of FO range for child male and female heroes ..................................... 76 4.7 Distribution of mean FO for adult male heroes ....................................................... 77 4.8 Distribution of mean FO for adult male villains ...................................................... 78 4.9 Distribution of mean FO for adult female heroes .................................................... 79
................................................. 4.10 Distribution of mean FO for adult female villains 80 ...................................................... 4.1 1 Distribution of mean FO for child male heroes 81
.................................................. 4.12 Distribution of mean FO for child female heroes 82 .......................................................................... 4.13 Vocoid spaces of male characters 85
....................................................................... 4.14 Vocoid spaces of female characters 86
4.15 Vocoid spaces of Japanese male and female speakers based on the formant frequencies reported in Nakagawa. Shirakata. Yamao. and Sakai's (1980) study 88
4.16 Vocoid spaces of adult female voice actors compared to that of adult male heroes (Hero Type I) .............................................................................................. 91
.......................................................... 4.17 Vocoid spaces of adult males by voice type 93 4.18 Vocoid spaces of adult male speakers by jaw setting ........................................ 95
....................................................... 4.19 Vocoid spaces of adult females by voice type 96 4.20 Vocoid spaces of adult males by tongue body setting ........................................ 98 4.2 1 Vocoid spaces of adult females by tongue body setting ................................. 100 4.22 Spectrogram of Hero Type I voice (MHMl) uttering the phrase
IjakenikuwaJi:na] "you know a lot. don't you?".. ............................................... 104
4.23 FFT spectrum of Iji(a)] in the phrase Ijakenikuwasi:na] uttered by MHMl ...... 104
4.24 FFT spectrum of [mi:] in the phrase IjakenikuwaJi:na] uttered by MHMl ....... 105
4.25 Spectrogram of Hero Type I1 voice (GHM2) uttering the phrase uatsuraqa akiramerwnade] "until they give up" .................................................................. 105
4.26 FFT spectrum of [(IJ)~] in the phrase Ijatsurqa akiramerumade] uttered by GHM2 ............................................................................................................. 106
4.27 Spectrogram of Villain Type I voice (QVMl) uttering the phrase [ojmSio] ............................................................................................. "please forgive me" 107
4.28 FFT spectrum of [(r)u] in the phrase [ojuruJio] uttered by QVMl ..................... 108
4.29 Spectrogram of Villain Type I voice (AVml) uttering the phrase [dareda omae] ................................................................................................... "Who are you?" 108
4.30 FFT spectrum of the initial [(d)a] in the phrase [dareda omae] uttered by AVml .............................................................................................................. 109
4.3 1 Spectrogram of Villain Type I voice (EVM3) uttering the phrase [soredakede] ................................................................................................... "with only that" 109
4.32 FFT spectrum of [(d)e] in the phrase [soredakede] uttered by EVM3 ................ 110 4.33 Spectrogram of Villain Type I1 voice (EVMl) uttering the phrase burijawa]
........................................................................................................ "as for Julia" 110 4.34 FFT spectrum of [(r)i] in the phrase uurijawa] uttered by EVMl ....................... 111 4.35 Spectrogram of Hero Type I' voice (LHfl) uttering the phrase [arigato:]
........................................................................................................ "Thank you" 112 ........................ 4.36 FFT spectrum of [(g)a] in the phrase [arigato:] uttered by LHfl 112 ....................... 4.37 FFT spectrum of [(t)o:] in the phrase [arigato:] uttered by LHfl 113
4.38 Spectrogram of Hero Type I' voice (MHfl) uttering the phrase [gambatte] ................................................................................. "Good luck" (modal voice) 113
4.39 FFT spectrum of [(b)a] in the phrase [gambatte] uttered by MHfl ....................................................................................................... (modal voice) 114
4.40 Spectrogram of Hero Type I' voice (MHfl) uttering the phrase [gambatte] ............................................................................... "Good luck" (breathy voice) 114

4.41 FFT spectrum of [(b)a] in the phrase [gambatte] uttered by MHfl (breathy voice) ..................................................................................................... 1 15
4.42 Spectrogram of Hero Type I' voice (GHF1) uttering the phrase [gjarakuta:ga do:Jitano] "What did Gallacter do?" ................................................................... 11 5
4.43 FFT spectrum of [(r)a] in the phrase [gjarakuta:ga do:Jitano] uttered by GHF 1 1 16
4.44 FFT spectrum of the second [(t)a] in the phrase [gjarakuta:ga do:Jitano] uttered by GHF 1 .................................................................................................. 1 16
4.45 Spectrogram of Villain Type I voice (DVF2) uttering the phrase [bakana] 66 stupid". . 1 1 7 ...............................................................................................................
4.46 FFT spectrum of [@)a] in the phrase [bakana] uttered by DVF2 ....................... 11 7
4.47 Spectrogram of Villain Type I voice (ASml) uttering the phrase [rakugakiJita] "(I) scribble d"... ................................................................................................... 1 18
................ 4.48 FFT spectrum of [(r)a] in the phrase [rakugakisita] uttered by ASml 11 8
4.49 Spectrogram of Villain Type I1 voice (HVF 1) uttering the phrase [sa:] "Come on" ........................................................................................................... 1 19
4.50 FFT spectrum of [(s)a:] in the phrase [sa:] uttered by HVF 1 .............................. 1 19
........................... 6.1 Scree plot for a factor analysis of perceptual experiment items 166 ..................... 6.2 Dendrogram for hierarchical cluster analysis using Ward's method 190
6.3 Graphic profiles of the four-cluster solution of the hierarchical cluster analysis . 19 1
xii
Acknowledgments
This work would not have been possible without the support of many people. First
and foremost, I would like to thank Dr. John Esling for the supervision of this dissertation
and for his insightful discussion of auditory description and other research procedures. It
has been a pleasure to work with him. I would also like to thank my other committee
members, Dr. Joseph Kess, Dr. Tadao Miyamoto, and Dr. Hiroko Noro (and Dr. Suzanne
Urbanczyk, who was a member of my committee until August 2003) for the positive
feedback they gave me throughout the preparation of this dissertation. I owe special
thanks to Dr. Murray Munro for helpful suggestions for improving the dissertation. I am
also grateful to Dr. Nick Campbell at Advanced Telecommunications Research Institute
International (ATR) for reading and providing positive comments on my draft. I wish to
extend my gratitude to Professor Katsufumi Narita and Dr. Tanomu Kashima, who
introduced me to phonetics during my undergraduate and master's program at Nagoya
University in Japan. I would not have taken this path had they not shown me how
interesting phonetics could be.
I wish to thank Rotary International and my sponsor club in Japan, Ogaki West
Rotary Club, for their financial support. Without the three-year scholarship they provided,
I would not have been able to pursue my doctorate at the University of Victoria. Gratitude
is also due to the Rotary Club of Saanich and Dr. and Mrs. Young for making me feel at
home, especially in my first year here in Canada.
I owe special thanks to Ryosuke Nomura for recruiting the experiment
participants and conducting the perceptual experiment responsibly in a short period of
time. I am grateful to all the experiment participants for volunteering at a busy time of the
year. I would like to extend my gratitude to the professors at the Department of
Linguistics, Nagoya University, for allowing me to use the Phonetics Laboratory to run
the experimental sessions. Special thanks are due to the two devoted anime fans who are
friends of my sister's, for consultation on the selection of anime series and movies used
in this study. I would also like to thank all the anime fan subscribers who responded to
my newsgroup advertisements about suggestions on animation titles.
I would like to express my special thanks to a very good friend of mine, Monika
Brandstatter, for helping me get started on the statistical analysis and for introducing me

. . . Xl l l
to Dr. Mike Hunter, who also kindly helped me with the statistics. I also wish to thank
Barbara Lacy at the Statistical Consulting Centre for helping me with the remaining
statistical procedures. I would also like to thank Greg Newton for his technical support in
the Phonetics Laboratory.
Finally, I would like to express my special thanks to those from Victoria, Japan
and elsewhere who have provided emotional support throughout my Ph.D. program.
Though I cannot possibly name everyone, I offer my sincere thanks for their support,
whether through face-to-face meetings, telephone calls, e-mail or letters. Among all, I
would like to thank one of my best fi-iends in Victoria, Allison Benner, for her continuous
friendship since my first year here in Canada, for editing my English patiently and
responsibly, and for sharing numerous ideas about research and other matters. I am
grateful to Dr. Leslie Saxon, the department's graduate advisor for the first four years of
my program, for her guidance in pursuing the Ph.D. program. To my landlady, Dr.
Charlotte Girard, I would like to express my thanks for making me feel at home and
sharing experiences with me. Finally, I would like to thank my family in Japan for
encouraging me to pursue this program. I would like to express particular thanks to my
sister Yurniko for helping me obtain research materials from Japan, assisting in data entry,
and providing continuous emotional support. Last but by no means least, I would like to
thank my mother Yukiko for thinking of me always.
Chapter 1 Background
1.1 Introduction
Vocal stereotyping plays an important role in our daily lives. For example, upon
hearing a voice on the telephone, we can attribute certain age, gender, personality, and
physical characteristics to a speaker we have never met. Such judgments do not
necessarily coincide with the true attributes of the speaker. However, the judgments are
surprisingly consistent among speakers of the same language because they share the same
vocal stereotypes. ' Previous studies on vocal stereotypes (Hecht & LaFrance, 1996;
Yarmey, 1993; Zuckerman & Miyake, 1993), in which voices are played to listeners as a
basis for rating personality and vocal characteristics, reveal that people infer similar
personality traits from voices. A few studies have investigated the acoustic correlates of
personality in speech and the correspondence between acoustic correlates and laypersons'
perceptions (Aronovitch, 1976; Zuckerman & Miyake, 1993). A few have also
investigated the auditory correlates identified by phoneticians and the correspondence
between auditory correlates and laypersons' perceptions (Biemans, 1998; van Bezooijen,
1988). However, to my knowledge, no study has investigated the correspondence among
auditory correlates, acoustic correlates, and lay people's perceptions. This study attempts
to fill these gaps in our knowledge by investigating the phonetic correlates of vocal
stereotypes.
This study examines the voices of heroes and villains in Japanese anime, an
animation medium that has come to be wildly popular in Japan and other parts of the
world. In anime, voices need to reflect the physical attributes and personality traits of
characters and the vocal stereotypes that consumers, filmmakers, and voice actors share.
In other words, vocal stereotypes play an important role in this medium. Therefore, a
phonetic analysis of voices in anime is a good starting point for the investigation of the
phonetic correlates of vocal stereotypes in Japanese culture.
' In addition to mono-cultural studies reviewed in the following discussion, to my knowledge, there have been a few cross-cultural studies on vocal stereotyping. While van Bezooijen (1988) found evidence for cross-cultural agreements in attribution of some personality traits, Lee and Boster (1992) found a disagreement between two cultures examined (American and Korean) regarding perceptions of credibility. Due to the paucity of literature with results interpretable using phonetic terminology, however, hypotheses will be formulated based on studies of other cultures as well as of Japanese.

The rest of this chapter summarizes the literature on related subjects (Sections 1.2
and 1.3), as a basis for the formulation of hypotheses about the auditory and acoustic
characteristics of the voices of heroes and villains (Section 1.4).
1.2 Psychological Markers in Voice
In Section 1.2.1 some basic frameworks for the analysis of voice quality are
introduced, citing Laver (1980, 1994), Esling (1978, 1994), and others. Section 1.2.2
provides an overview of previous studies on vocal cues of personality and emotion, most
of which have been done in psychology. Therefore, where possible, the results are
rephrased in phonetic terminology in order to make them comparable to the present study.
1.2.1 Literature on Voice Quality
Voice quality researchers such as Laver (1980, 1994) and Esling (1 978, 1994)
quote the following passage by Abercrombie as a basic concept of voice quality:
The term 'voice quality' refers to those characteristics which are present more or less all the time that a person is tallung: it is a quasi-permanent quality running through all the sound that issues from his mouth. (Abercrombie, 1967, p. 91)
In other words, upon hearing a stretch of speech, we are able to extract some consistent
characteristics fiom the voice spoken in a certain voice quality. For example, many
Japanese female TV reporters speak with a smile. From this way of speaking, we are able
to extract the auditory cues associated with constant lip spreading. Any tendency of the
vocal tract to maintain a given configuration over a stretch of segments, such as spread
lips in this example, constitutes a setting (see below for more details about setting).
Voice quality, segmental features and voice dynamics (such as pitch, loudness and
speaking rate) are distinguished in terms of how they fluctuate in time (Abercrombie,
1967). Of the three, segmental features fluctuate the fastest, reflecting the rapid
succession of the movements of articulators. Voice dynamic features fluctuate
considerably more slowly than segmental features; and, as will be seen in Section 1.2.2,
they also contribute to vocal cues to personality and emotion. Lastly, voice quality
features fluctuate the least, having quasi-permanent characteristics that remain constant

over long stretches of time. As noted earlier, they are the features that are the primary
focus of this study.
In dealing with voice quality, a distinction is made between intrinsic and
extrinsic: the former arises from the speaker's anatomical features and is not under the
speaker's volitional control; the latter is the product of the way speakers habitually set
their vocal tract and larynx and, therefore, is controlled ~olitionally.~ A speaker's
habitual setting is a constellation of acquired traits characteristic of a particular
community, as is further elaborated below. A voice is the product of these two kinds of
quality, which convey not only the linguistic meaning of the message itself, but also
information about the speaker's regional origin, age, sex, and psychological
characteristics. This function of voice quality, which conveys some information about the
speaker, is called indexical (Laver & Trudgill, 1979). Indexical markers may be grouped
into three categories: social, physical, and psychological. Examples of characteristics that
fall into each of these three categories are:
(a) those that mark social characteristics, such as regional affiliation, social status, educational status, occupation and social role;
(b) those that mark physical characteristics, such as age, sex, physique and state of health;
(c) those that mark psychological characteristics of personality and affective state. (Laver & Trudgill, 1979, p. 3)
Each of the three types of marker is discussed below in more detail.
Listening to a voice, one can judge the speaker's age, sex, and physique quite
accurately. This is because people with similar physical attributes, for instance females,
have common anatomical feat~res,~ even though each speaker's organs are unique and,
based on these features, one is able to judge the speaker's attributes. Therefore aspects of
voice quality arising from anatomical features are physical, rather than social or
psychological, because a speaker cannot control them volitionally. There are other
components of voice quality that are outside the speaker's control, including permanent
2 In Laver (2000), "intrinsic" and "extrinsic" are called "organic" and "phonetic" respectively. For instance, the vocal folds of males are longer than those of females, which leads to the difference
in pitch range between males and females - the male range is lower than the female range (Laver & Trudgill, 1979). However, not all sex differences are attributable to anatomical differences, possibly because of culturally acquired settings (Henton & Bladon 1985; Klatt & Klatt 1990; Perry, Ohde, & Ashmead, 2001 ; Sachs, Lieberman, & Erickson, 1973; Whiteside, 2001).

(e.g., cleft palate) or temporary (e.g., a cold) medical conditions (Abercrombie, 1967, p.
92; Laver & Trudgill, 1979).
The remaining components of voice quality are those brought about by the
speaker's volitional control, that is, setting. According to Laver (1994, p. 396), a phonetic
setting can be defined as "any co-ordinatory tendency underlying the production of the
chain of segments in speech towards maintaining a particular configuration or state of the
vocal apparatus." (Henceforth, the term setting is used based on this definition.)
Another function of voice quality is social. The setting of a given language or
dialect corresponds to the kinds of sounds occurring in the languageldialect and their
frequencies of occurrence (Honikman, 1964). In other words, the vocal tract tends to take
on a posture that is suitable for articulating segments that often occur in a given
language/dialect. Therefore, one can often tell where a speaker is from based on the
shared voice quality settings peculiar to a given speech community. Most studies that
have been done using Laver's voice quality framework describe voice qualities in this
context (Trudgill, 1974; Esling, 1978; Knowles, 1978; Esling, 1987; Stuart-Smith, 1999).
To my knowledge, there have been at least three studies that refer to Japanese voice
quality settings to some extent (Someda, 1966; Edasawa, 1984; Todaka, 1993). However,
none of them systematically used the developed version of Laver's descriptive framework
(Laver, 1980, 1994, 2000; see 2.1.3): Inspired by Honikman (1964), Someda (1966)
compared the articulatory settings of Japanese, English, and French, referring to the
frequencies of occurrences of phonemes; however, neither articulatory nor acoustic data
are included in order to support his observations. Edasawa asked non-trained college
students and teachers to describe the articulatory settings of Japanese using Kelz's (1 978)
framework, which was developed independently of Laver's to describe activity of the
articulators. Although Todaka (1993) reviews Laver's work, he does not examine voice
quality settings auditorily or articulatorily. Therefore, this study is the first Japanese study
to describe voice quality in a select group of people (voice actors playing cartoon
characters) using Laver's descriptive framework.
Lastly, psychological markers of voice quality, which are again brought about by
settings, involve speaker affect (e.g., happiness, anger, etc.) within a relatively short time
span ("tone of voice") or attributions of long-term personality characteristics of a speaker.
This function of voice quality is most relevant to this study. There have been at least two
studies that correlated experts' ratings of voice quality using Laver's framework and
laypersons' attributions of personality and other characteristics (van Bezooijen, 1988;
Biemans, 1998). Other studies examined correlations among attributions of personality
and vocal characteristics by laypersons or those between attributions of personality
characteristics and acoustic parameters such as mean fundamental frequency (henceforth,
FO). The details of these types of study will be discussed in the next subsection.
As seen in Laver and Trudgill(1979), which reviewed research according to these
three functions of voice quality, the same acoustic correlate may appear as more than one
physical or psychological or social attribute. For example, average FO can be an acoustic
correlate of sex, age, and certain personality types and emotions. The present study
analyzes the voices of heroes and villains in animation, where a voice should reflect the
physical attributes and personality traits of the character and the shared vocal stereotypes
of consumers, filmmakers, and voice actors. The present analysis involves mainly the
psychological function of voice quality; however, other physical and social attributes
could confound the results if not taken into consideration. Therefore, heroes and villains
are analyzed separately according to sex and age group. (There was no instance where the
social status of characters seemed to affect voice production.)
1.2.2 Literature on Vocal Cues of Personality and Emotion
There have been numerous reviews of studies of personality markers in speech
and vocal indicators of emotion. Reviews of earlier studies in this area were published in
the early 1960s (Diehl, 1960; Kramer, 1963; Mahl & Schultze, 1964). At the end of the
next decade, Scherer (1 979a, 1979b) published two research papers that provided
comprehensive overviews of these subjects. Scherer has continued to study vocal cues to
emotion and compiled his and other researchers' work in Scherer (1986, 2003) - two of
the most exhaustive reviews of vocal emotion to date. Other overviews on psychological
markers in speech include Brown and Bradshaw (1985), Frick (1985), Murray and Arnott
(1993), and Pittam (1994). Rather than duplicate other reviews that have provided
comprehensive overviews of these earlier studies, the following two subsections focus on
introducing the main issues and findings in this area and reviewing some recent studies

that are relevant to the present study.
1.2.2.1 Personality markers in speech.
Studies on personality and voice can be divided into three paradigms: accuracy
studies; externalization studies; and attribution (or inference) studies (Brown & Bradshaw,
1985; Pittam, 1994; Scherer, 1979b). As noted in Brown and Bradshaw (1985), accuracy
studies were conducted mostly in the early period of the 1930s and 1940s. This vein of
research was concerned with how accurately judges could identify personality types from
voice, comparing subjective judgments of personality from voice with standardized
personality measures. However, such research efforts often failed to find any meaningful
correlation between the two; instead, the existence of vocal stereotypes, that is, the
consensual agreement of judges on personality attributions that are often not accurate in
the sense that they do not correlate with external criteria of personality, was a common
finding in those studies, as noted in Brown and Bradshaw (1985) and Scherer (1979b).
Since those initial efforts, most research in this area has concentrated either on
so-called externalization or attribution (inference) studies (Brown & Bradshaw, 1985;
Pittam, 1994). Externalization studies investigate the correspondence between the
personal disposition of speakers as obtained from standardized personality tests and
objectively measured speech cues based on expert ratings, systematic coding, or acoustic
analyses. However, as noted in Brown and Bradshaw (1985), Pittam (1994) and Scherer
(1979b), this type of research has not been very successful because of the lack of control
and precision of the acoustic measurements andlor inadequate personality measurement.
The other type of study, the attribution (inference) study, involves lay judges' personality
attributions from voice without reference to accuracy. This type of research often asks lay
judges to rate speakers' vocal characteristics and personality traits, with a view to
showing statistical correlations between the two. Most of the recent studies conducted
from the late 1980s to the present are of this type. This research includes studies on
stereotypes of vocal attractiveness, such as Berry (1990, 1991, 1992), Miyake and
Zuckerman (1993), Zuckerman and Driver (1989), Zuckerman, Hodgins, and Miyake
(1 990, 1993), and Zuckerman and Miyake (1 993).
A vocal attractiveness stereotype represents the influence of the auditory

component of appearance, which is the person's voice (Zuckerman, Hodgins, & Miyake,
1993). The aforementioned series of studies by Berry and Zuckerman and his colleagues
revealed that people can agree on judgments of attractiveness in human voices, which
affects their interpersonal impressions. These studies found that speakers with attractive
voices are rated as having attractive personalities, an association mediated by vocal
stereotypes. In fact, Berry (1990) reports that self and friend ratings of the stimulus
persons' personalities had no correlation with listeners' personality judgments with regard
to attractiveness. A similar relation holds in the case of "babyish voice" as well; that is,
speakers with babyish voices are rated as being weaker but warmer, as reported in Berry
(1 990, 1992) and Montepare and Zebrowitz-McArthur (1987).
In the rest of this subsection, attribution studies conducted from the 1980s to the
present are reviewed. Attribution studies can be classified according to the trait categories
listeners were asked to rate, the kinds of speech stimuli used (with or without
manipulation), and whether the results were compared with an externalization study. Of
the many existing studies, those with phonetic implications on which the hypotheses of
the present study may be based, are discussed in detail. Studies that used speakers' voices
without manipulation are reviewed first, followed by those that used voices with
manipulation using computer programs or systematic control by speakers.
Most of the aforementioned studies of vocal attractiveness stereotypes (Berry,
1990, 199 1, 1992; Miyake & Zuckerman, 1993; Zuckerman & Driver, 1989; Zuckerman,
Hodgins, & Miyake, 1990, 1993) asked listeners to rate both personality impressions and
vocal attractiveness (and babyishness in Berry's studies). These studies show statistical
correlations between vocal attractivenesshabyishness and personality impressions.
However, since the phonetic components of attractivehabyish voices are not clear from
these studies, the details are not discussed further herein. The same applies to the study
by Cox and Cooper (1 98 1) on selecting a voice for telephone announcements. While the
researchers obtained ratings of preference and personality attributes for the stimulus
voices and showed statistical correlations between preferred voices and personality
attributes, the phonetic properties of the preferred voices are not clear from the study.
Therefore, this study is not discussed any further.
The next subgroup of attribution studies includes those that asked listeners to rate
both personality and vocal characteristics from voices. Hecht and LaFrance (1995)
investigated whether personality impressions and vocal characteristics of telephone
operators have any correlations with how quickly they are able to serve customers. Hecht
and LaFrance asked judges to listen to selected operators' utterances and rate their
personality traits and vocal characteristics based on their impressions of the voices.
Although both male and female operators were included in the study, speaker sex was not
considered. Because of the high correlation obtained among five given personality traits
(enthusiastic, sympathetic, confident, professional, and fr-iendly), these traits were
grouped into a single factor called positive attitude; correlations were then calculated
between vocal characteristics and positive attitude as well as the five personality traits.
The vocal characteristics that had significant correlations with positive attitude were
"changing" and "clear," and to a lesser extent, "high." (Higher-pitched voices were rated
as significantly more enthusiastic and sympathetic.) The auditory correlate of the
"changing" quality may be a wide range of pitch and loudness with temporal fluctuations;
however, of the three, only the acoustic properties of pitch range are discussed, and none
are auditorily analyzed in the present study. (See Section 2.1.3.1 for an explanation of the
exclusion of prosodic settings.) The "clear" quality may reflect a wide range of
articulatory movements, which can be analyzed auditorily within Laver's (1 980, 1994,
2000) voice quality descriptive framework as well as acoustically by means of vowel
formant analysis. Because the components of positive attitude seem relevant to the
attributes of heroes, for the present study, it can be hypothesized that heroes have
changing and clear voices, and possibly, high pitch.
Yarmey (1993) investigated vocal as well as facial cues of good versus bad
characters, using 30 men as stimuli and three different presentation conditions, that is,
face only, voice only, and both face and voice. Subjects were asked to rate the vocal
characteristics of 15 stimulus persons (in the face-only condition, subjects imagined vocal
characteristics of the stimuli) and to select exemplars for three non-criminal occupations
(clergyman, medical doctor, and engineer) and three criminal occupations (mass murderer,
sexual assault felon, and armed robber) out of a set of stimuli; later, they were tested for
their memory of the target persons they rated and judged via a presentation of 30 stimuli,
including 15 foils. In all three presentation conditions, it was easier for subjects to select
exemplars for non-criminals than for criminals, and there was higher inter-subject
consensus for non-criminals than for criminals. Collapsing across presentation conditions,
the following significant correlations were found between vocal attributes and
impressions for "bad guys" but not for "good guys". Nine personality traits are
represented by the following three categories that are common to Montepare and
Zebrowitz-McArthur (1987): weakness - soft, monotone; incompetence - soft, not clear,
slow; lack of warmth - monotone, tight. In contrast, the following correlations between
vocal attributes and trait impressions were significant for good guys but not for bad guys:
strength - deep, loud, relaxed, and changeable; competence - deep, relaxed, clear,
changeable, slow (for "serious-minded"), fast (for "worldly"), and tight (for
"industrious"); warmth - changeable. However, in the voice-only condition, there was a
tendency for subjects to make fewer occupation-based discriminations among prototypes
of good and bad characters than in the other two conditions. Yarmey suggests that
schemata for non-criminals are more typical and more likeable while those for criminals
are more unique and less enjoyable. These results have some implications for the
phonetic properties of vocal stereotypes of good and bad characters: picking out the vocal
characteristics that correlated with two or more personality categories, it can be
hypothesized that, in the present study, good characters (i.e., heroes) will have deep,
relaxed, and changeable voices, while bad characters (i.e., villains) will have soft and
monotone voices. The auditory correlate of a deep voice would be low pitch. The
auditory correlate of a relaxed voice may be, within Laver's (1980, 1994, 2000)
framework, lax voice and breathy voice; the former involves low supralaryngeal tension,
while the latter involves low laryngeal tension. The changeable voice may be considered
comparable to "changing" quality in Hecht and LaFrance (1 995). In addition, the auditory
and acoustic characteristics of heroes' voices will be more salient and easier to generalize
than those of villains, which are presumed to have a wider range of deviation and to
exhibit greater variety.
Other studies that showed correlations between laypersons' ratings of personality
and vocal trait impressions include Yamada, Hakoda, Yuda, and Kusuhara (2000),
Biemans and van Bezooijen (1 999), Montepare and Zebrowitz-McArthur (1 987), and
Peng, Zebrowitz, and Lee (1993). Among these, Yamada et a1.k (2000) study is most

relevant to the present study in terms of theme and context. Yamada et al. examined vocal
stereotypes associated with various occupations in Japan. They used speech samples of
25 men uttering the phrase "Hello. Hello" ("Moshi-moshi" in Japanese). These utterances
were often as brief as 3 s; nonetheless, surprisingly, the researchers obtained statistically
significant correlations among factors from all three categories, that is, personality
characteristics, vocal characteristics and occupational categories. However, it is not easy
to interpret their impressionistic labels auditorily or acoustically. For the vocal
characteristics rating using scalar degrees, they used 11 items, nine of which constituted
three factors extracted by a factor analysis. The three factors and their constituent items
were: (i) "penetrativeness" consisting of "not trembling," "not blurred," "not stuttering,"
and "clear";(ii) "clarity" consisting of "very high," "not stiff," and "not monotonous";
and (iii) "mildness" consisting of "relaxed" and "very soft". (The original Japanese
translations are essential to understand the relationship between each factor and its
constituent^.^) As mentioned in footnote 3, because some terms seem to be redundant and
some are inconsistent, it is not appropriate to make any further speculations based on
their results. Using a sufficient number of terms that are clear and distinct from one
another is essential to gain useful results for a phonetic analysis. The results of Biemans
and van Bezooijen (1999), Montepare and Zebrowitz-McArthur (1987), and Peng,
Zebrowitz, and Lee (1993) include some information that is easier to interpret
phonetically. However, because their research themes are less relevant to the present
study (gender identity, vocal babyishness, and competence and power impressions
respectively, with the latter two being cross-cultural), they are not discussed any further
herein.
Some studies have compared lay listeners' trait ratings of voices with acoustic
measurements; in other words, these studies combine attribution and externalization
(Aronovitch, 1976; Collins, 2000; Oguchi & Kikuchi, 1997; Zuckerman & Miyake,
1993). However, with the exception of Collins (2000), the findings of these studies are
hard to interpret. Oguchi and Kikuchi (1997) investigated vocal attractiveness in a
Japanese context. Following up on their finding that vocal and physical attractiveness are
4 In addition, the English terms are not consistent in the paper; three terms that are present in Table 1 on p. 1254 - "very loud," "definite," and "rapid" - are missing from Table 4 on p. 1257, which shows the factor analysis results, presumably replaced by "clear," "very soft" and "loud".
independent, they conducted a second experiment in which 62 participants rated the vocal
and physical attractiveness and vocal characteristics of 16 stimulus persons (eight for
each sex). The speech material was a passage lasting less than 30 s. Ten impressionistic
terms including "high," "bright," and "clear" were used for scalar degrees to rate the
vocal characteristics of stimulus persons; and three acoustic measures (speech rate, mean
and standard deviation of ~ 0 ~ ) were obtained. While Oguchi and Kikuchi did not obtain
personality trait ratings fi-om participants, it is reasonable to assume, based on studies of
vocal attractiveness such as Beny (1990, 1992), that speakers with attractive voices
would have been rated as being attractive in personality as well. Therefore, the following
vocal characteristics, which were rated as being attractive, may be thought to represent
those of attractive people in Japanese vocal stereotypes. Of the ten vocal attributes,
"bright," "sweet." "tasty," "generous," and "articulate" were statistically significant in
distinguishing attractive and unattractive voices for males, while "bright," "generous,"
and "affectionate" were statistically significant for females. (The original Japanese labels
are not included in the paper.) The three acoustic measurements were statistically not
significant in males at all, whereas the two FO-related measures (mean and standard
deviation) were for females: attractive voices were lower in pitch with smaller
fluctuations. (Note the discrepancy between the results of this study and those of van
Bezooijen's, 1995, as noted below.) Although it is possible that these results were
peculiar to the group of speakers andlor listeners in this study, it seems that the
components of vocal attractiveness differ by sex. However, it is not easy to infer auditory
and acoustic properties from impressionistic labels such as "bright" and "generous";
therefore, the results of this study are not used in formulating hypotheses for the present
study.
Collins (2000) investigated male vocal attractiveness as evaluated by female
participants in a Dutch context; the study included body measurements of the stimulus
persons as well as acoustic measurements of the stimulus voices. Collins found strong
evidence of vocal stereotypes of body type and age; while their impressions were not
necessarily accurate, listeners strongly agreed on estimations of weight and age of
speakers as well as attractiveness. The listeners rated lower-pitched voices as belonging
FO was calculated every 0.144 s, which may have been inadequate to obtain accurate results.

to men who were more attractive, older, heavier, more likely to have chest hair, and more
muscular. However, it is not clear whether these results are applicable to Japanese
audiences. Moreover, animation - the context of the present study - tends to be directed
at younger audiences, further compounding the effects of cultural difference. The other
two studies included in this subgroup (Aronovitch, 1976; Zuckerman & Miyake, 1993)
may have taken inadequate acoustic measurements. Aronovitch (1976) asked 100 raters
to infer personality traits from 57 stimulus voices that he had analyzed acoustically.
Amonovitch's acoustic measurements were averages and variances of intensity, speech
rate, and FO, and a "sound-silence ratio" (the ratio of speech [or vocalized] time to pause
[or non-speech] time). He calculated correlation coefficients of personality judgments and
acoustic parameters, and concluded that the acoustic parameters with significant
correlations with personality traits differ between the two sexes. For males, intensity, FO
variance and speech rate significantly correlated with some personality traits, while for
females, average intensity, FO and the sound-silence ratio produced significant
correlations, along with (as was seen with males) speech rate. While Aronovitch suggests
that personality judgments were made on the basis of different acoustic cues for the two
sexes, these results may have stemmed from the quality of his acoustic analysis -
intensity measures were read off the graph papers (Aronovitch, 1976, p. 2 13).
In Zuckerman and Miyake (1993), three groups of judges rated the vocal
attractiveness, personality traits and vocal characteristics of 110 subjects. For objective
measures of voice quality, acoustic measures such as FO, amplitude, and duration of
speech versus pause were taken, and the mean, variance, and maximum of each
parameter were calculated. According to Zuckerman and Miyake (1 993, p. 1 23), however,
the FO and amplitude were calculated every 230 to 270 ms, which is too long a period to
measure these parameters. A series of statistical analyses were performed on both
objective and subjective measures of voice quality; no objective measure played a role in
predicting vocal attractiveness in the statistical results. Therefore, Zuckerman and
Miyake concluded that the subjective measures predicted vocal attractiveness better than
the objective measures; however, their conclusion is unconvincing because of flaws in
their acoustic measurement methodology.
In addition to acoustic measurements, externalization studies may involve experts'
auditory ratings of voices. At least two studies have used a combination of expert
(externalization) and layperson (attribution) ratings, that is, Biemans (1998) and van
Bezooijen (1988). Although the results of these studies are not directly relevant to the
present study due to the cultural context (Dutch), it should be noted that (a) both these
studies used Laver's (1980, 1994) voice quality description fi-amework with some
modifications in their expert ratings; and (b) the rating results had statistically significant
correlations with the laypersons' attributions of personality traits (and in the case of
Biemans, 1998, the gender identity of speakers). Therefore, in the present study, it seems
feasible to correlate expert ratings of heroes' and villains' voices using Laver's
framework with laypersons' attributions of personality, vocal, and physical characteristics
of the same voices.
The last subgroup of studies reviewed in this subsection includes those that used
voices with manipulation using computer programs or systematic control by speakers
(Addington, 1968; Lee & Boster, 1992; Nass & Lee, 2001; Ray, 1986; Uchida, 2000; van
Bezooijen, 1995). This technique enables researchers to systematically manipulate vocal
parameters to determine the relative effect of the changes on listener judgments. Of these
studies, van Bezooijen's (1995) study seems most relevant to the present study because it
is a cross-cultural study in two countries, that is, the Netherlands and Japan. The study
consists of two parts: the first examined the effects of pitch differences in female speech,
and the second investigated images of the ideal man and the ideal woman with a pencil
test. For the first part, eight Dutch and eight Japanese women read a uniform passage in
their first language at a comfortable pitch; the read speech was recorded as versions of
their original pitch. For each speaker, a higher- and a lower-pitched version were
generated from the original using a computerized pitch manipulation technique. Fifteen
male and 15 female students from each country listened to the 48 speech samples (8
speakers x 2 cultures x 3 pitch versions), and rated them on scales for the following
traits: short-tall; weak-strong; dependent-independent; modest-arrogant; and
attractiveunattractive. With regard to the four scales representing physical and
psychological power, the ratings for the low-pitched versions were significantly higher
than for the high-pitch versions in both cultures. In the case of attractiveness, the original
pitch evoked the most positive ratings; however, the attractiveness ratings of the original

versions relative to the manipulated versions differed between the two cultures. While
Dutch listeners rated the high- and low-pitched versions as equally (un)attractive,
Japanese listeners provided unfavorable ratings only for the low-pitched versions. In
other words, Japanese listeners considered high pitch more attractive than Dutch listeners.
In the second part of the study, subjects were asked to provide ratings for an ideal man
and woman, using the aforementioned four scales representing physical and
psychological power (i.e., tall, strong, independent, arrogant). Japanese subjects rated the
ideal man and woman significantly differently, rating the man significantly higher on all
four scales, while Dutch subjects rated the ideal man and woman almost equally except
for height. (The ratings for the ideal woman in the two cultures did not differ significantly
except for one scale.) Therefore, the author suggests that to convey an impression of
masculinity within their culture, Japanese men may wish to lower pitch. The implication
of these findings for the present study is that the voices of male heroes may be
significantly lower pitched than what would be observed among males in real life,
whereas the voices of female heroes are likely to be somewhat higher pitched than what
would be observed among females in real life, and the difference between the two
genders maybe larger than that observed in other cultures.
Addington (1968) used two male and two female trained speakers to simulate a
number of different voice qualities (e.g., breathy, flat, nasal), pitch patterns, and speaking
rates, generating a total of 252 voice samples; a large number of judges were then asked
to rate their impressions of the personalities of the speakers. According to Brown and
Bradshaw (1985), of the attributions studies conducted up to the time of writing, this
study provided by far the richest information; however, there were some technical
problems in Addington's statistical analyses. (For more details, see Brown & Bradshaw,
1985; they provide a reanalysis of this work.) Therefore, this study is not further
discussed.
Of the remaining studies, Lee and Boster (1992) and Uchida (2000) were
concerned only with the effect of speech rate on personality judgment, an issue which is
not considered in the present study. Ray (1986) used a male speaker to generate two
speech rates, pitch variations and loudness levels, yielding eight different combinations;
listeners made personality judgments on competence and benevolence for each variation.

Of some relevance here is the fact that pitch appeared to be the most influential factor in
benevolence ratings, with high pitch being considered more benevolent. Lastly, Nass and
Lee (2001) used unambiguously computer-generated speech to examine whether people
exhibit similarity-attraction and consistency-attraction toward such speech. The
personality traits investigated were extrovert (dominant) and introvert (submission),
qualities that are not very relevant to the present study; therefore, it is not discussed any
further.
To sum up, fiom the subgroup of attribution studies that asked listeners to rate
both personality and vocal characteristics from voices, Hecht and LaFrance (1995) and
Yanney (1993) have some implications for the present study. In addition, based on
Yarmey's claim, it can be predicted that the auditory and acoustic characteristics of
heroes' voices will be more salient and easier to generalize than those of villains, which
are presumed to have a wider range of deviation and to exhibit greater variety. Following
van Bezooijen (1995), it may be surmised that compared to what is observed in real life,
the voices of male heroes may be significantly lower pitched than female heroes, which
are likely to be medium to high pitched. As suggested in Aronovitch (1976), van
Bezooijen (1995), and Oguchi and Kikuchi (1997), listeners seem to have different vocal
stereotypes (including those of attractiveness) for the two sexes; therefore, the phonetic
properties of the vocal stereotypes associated with good and bad characters may be
different for the two sexes in the present study as well.
As for research techniques, it is important to employ appropriate measures for
acoustic analysis and appropriate vocal characteristic labels for laypersons' judgments.
The studies by Biemans (1998) and van Bezooijen (1988) show that in the present study,
it is feasible to correlate expert ratings of heroes' and villains' voices using Laver's (1980,
1994, 2000) framework with laypersons' attributions of personality, vocal, and physical
characteristics of the same voices.
1.2.2.2 Literature on vocal cues to emotion.
The interest in research on speech and emotion appears to be ever-increasing; for
instance, the entire April 2003 issue of Speech Communication (Vol. 40, Issue 1-2) is
dedicated to papers on this topic by psychologists, speech scientists and researchers in
related areas. The tendency seems to pervade in Japan as well - new papers on this theme
are constantly being published, especially by speech engineers ( e g , Iida, Campbell,
Higuchi, & Yasumura, 2003; Iida, Campbell, & Yasurnura, 1999; Mekada, Mukasa,
Hasegawa, Kasuga, Matsumoto, & Koike, 1999; Mokhtari, Iida, & Campbell, 2001;
Moriyama, Saito, & Ozawa, 1999; Sato & Akamatsu, 2001; Shigenaga, 2001 ; Takeda,
Nishizawa, & Ohyama, 2001). The main findings on the acoustic correlates of vocal
emotion can be found in such reviews as Frick (1985), Murray and Arnott (1993), and
Scherer (1986,2003).
In the present study, since anime characters' voices are expected to portray
emotions appropriate to the scenes, vocal cues to emotion should also be considered.
Informal listening to the voices of heroes and villains in the materials used in this study
revealed that, in contrast to the wide variety of positive and negative emotions expressed
by heroes, villains primarily expressed negative emotions such as anger, disgust,
frustration, hatred, etc. Therefore, it is predicted that villains' voices will be colored by
the phonetic properties of negative emotions in general; in the present study, it seems
especially relevant to review the phonetic properties of negative emotions such as anger
and disgust. This prediction has some relevance to a study on facial expressions of
emotion by Knutson (1996). Based on Secord's (1958) temporal extension hypothesis,
which states that perceivers interpret the momentary facial characteristics of people as if
they reflected enduring attributes, Knutson (1996) conducted two experiments to test the
hypothesis that facial expressions of emotion (e.g., anger, disgust, and happiness) affect
subjects' interpersonal trait inferences (i.e., dominance and affiliation). The hypothesis
was proved correct - subjects inferred a target's dispositional dominance and affiliation
based on facial expressions of the target person. The same kind of relationship seems to
hold in vocal expressions of emotion as well. In the remainder of this subsection,
Scherer's (1986) theoretical model will be introduced. Since this model draws on Laver's
(1980) voice quality descriptive framework and since there is evidence that similar
inference rules of vocal expression exist across different cultures (Scherer, Banse, &
Wallbott, 2001), this model is useful in generating hypotheses about the expected
auditory and acoustic correlates of villains' voices, despite the fact that it is not grounded
in a Japanese context. Following the introduction of Scherer's (1986) model, a few

Japanese studies will be reviewed. As mentioned above, there have been numerous
Japanese studies on vocal expressions of emotion; however, most of them are concerned
with voice dynamics (e.g., pitch, loudness and speaking rate; Abercrombie, 1967); to my
knowledge, only a few have dealt with spectral correlates (e.g., vowel formant
frequencies) and only one (Fujimoto & Maekawa, 2003) has investigated voice quality
per se, which is the focus of the present study. Therefore, this review will focus on studies
that discuss the spectral correlates of vocal cues to emotion and voice quality (Fujimoto
& Maekawa, 2003; Iida, Campbell, Higuchi, & Yasumura, 2003; Maekawa, 1998;
Maekawa & Kagomiya, 2000).
Scherer (1 986) investigated methodological problems in this area, highlighting the
paucity of research on voice quality as well as two conceptual problems. In the
theoretical model of vocal affect expressions proposed in this study, emotion is viewed as
a process consisting of a series of stimulus evaluation checks (SECs) performed by
information processing subsystems, rather than as a steady state of the organism. For
each SEC, the associated respiratory, phonatory, and articulatory processes are outlined
using Laver's (1980) voice quality framework; then, the acoustic effects of the relevant
phonatory and articulatory settings are described. In order to explain five sequential SECs,
three major voice types (i.e., wide-narrow; tense-lax; full-thin) are proposed. (Note that
Scherer's tense and lax voices do not directly correspond to Laver's terminology.)
Combining these voice types in varying degrees, voice type predictions are made for each
of the 12 selected emotions. For instance, enjoymenthappiness is a combination of wide
voice, relaxed voice, and slightly full voice, whereas ragehot anger is composed of
narrow voice, very tense voice, and extremely full voice (Scherer, 1986, Table 5). These
predictions are translated into selected acoustic parameters such as means of first and
second formants (henceforth F1 and F2, respectively) and high-frequency energy in
addition to well-studied parameters such as FO mean and range and intensity (Scherer,
1986, Table 6). In addition, the predictions are compared with empirical findings in
previous literature; a high degree of convergence is reported with regard to the tense-lax
voice type, which is the only voice type that has been systematically investigated across
studies. Among the 12 emotions Scherer distinguishes, four seem to appear often in the
voices of villains in the present study: displeasure/disgust; contempt/scom; irritationlcold
anger; and ragelhot anger. These emotions are predicted to have a combination of (i)
narrow voice; (ii) tense voice; and (iii) full voice. Scherer's articulatory definition of (i)
narrow voice is based on Laver7spharyngeaMed voice and raised larynx voice6; (ii) tense
voice is a composite of Laver's harsh voice and tense voice; (iii) full voice does not have
any particular counterpart in Laver. A summary of each voice is given in Scherer (1 986,
Table 4) as follows.
(i) Narrow voice: faucal and pharyngeal constriction, tensing of tract walls; vocal tract shortened by mouth, comers retracted downward; more high-frequency energy, F1 rising, F2 and F3 falling, narrow F 1 bandwidth, laryngopharyngeal nasality; resonances raised. (ii) Tense voice: overall tensing of vocal apparatus and respiratory system, decreased salivation; FO and amplitude increase, jitter and shimmer, increase in high-frequency energy, narrow F1 bandwidth, pronounced formant frequency differences. (iii) Full voice: deep, forceful respiration; chest register phonation; low FO, high-amplitude, strong energy in entire frequency range (adapted from Scherer, Table 4).
Removing physiologically antagonistic movements from the above predictions, the
expected articulatory characteristics of villains' voices would be pharyngeal constriction
and overall tensing of the vocal tract. In addition, since pharyngeal constriction tends to
accompany raised larynx (Esling, 1999; Esling, Heap, Snell, & Dickson, 1994), resulting
in vocal tract shortening, raised larynx may also be observed in villains' voices.
Acoustically, to sum up the above-cited predictions by Scherer and the ones in Scherer
(1986, Table 6), villains' voices would have the following characteristics: either an
increase or decrease of mean FO, rising F1, falling F2 and F3, narrow Fl bandwidth, and
increased high-fi-equency energy. (Amplitudes will not be discussed in the present study
since it is difficult to make assumptions about them in the original recordings of cartoon
voices.) Among these, according to Scherer (2003), both an increase and decrease of
mean FO in irritationlcold anger, and high-frequency energy in ragehot anger have been
confirmed in Banse and Scherer (1996). Juslin and Laukka (2001) also found an increase
However, in the following discussion including the prediction of Table 4 in Scherer (1986, p. 156), articulatory and acoustic correlates of raised larynx voice are not mentioned presumably because of the conflicting acoustic findings reported in Laver (1980, p. 27), on which Scherer's predictions are based.

of mean F1 in hot anger and disgust, which conforms to Scherer 's (1986) predictions;
however, other findings did not confirm Scherer's predictions, such as a mean FO
increase in hot anger.
As for Japanese studies on vocal cues to emotion, Maekawa (1998) investigated
the acoustic properties of six paralinguistic information types (i.e., admiration,
disappointment, suspicion, indifference, focused, and neutral), as expressed in three
sentences uttered by three native Japanese speakers. For the six information types, he
analyzed pitch contours, lengths of the segments in the sentences, formant frequencies of
the sentence-final vowel [a] in Sentence 1, "Soodesuka" ("Is that so?"). He also mentions
voice quality, and compares the waveforms of two different voice qualities. Because of
the relevance to the present study, only the results of vowel formant and voice quality
analyses are discussed here. Although the measurements were taken from only one
sentence-final vowel uttered by a single speaker, the Fl and F2 of this vowel in
admiration and disappointment were statistically significantly lower than their
counterparts in suspicion and indifference. Later, using an electromagnetic articulograph,
Maekawa and Kagomiya (2000) confirmed articulatorily that the tongue was more
fronted for suspicion than for admiration. Their vowel formant measurement results also
coincided with the articulatory data, that is, the F2 for suspicion was higher than that for
admiration. Although this study does not focus on F1 in particular, the authors mention
that the lip distance measured by the coils placed on the upper and lower lips was greater
for suspicion than admiration, suggesting that the jaw was more open for suspicion than
for admiration, which coincides with the finding in Maekawa (1998). If one considers
admiration as a positive and suspicion as a negative emotion, the low F1 and F2 in
admiration might be attributed to pharyngeal expansion, which is associated with wide
voice as opposed to narrow voice in Scherer (1986). By contrast, the high F1 in suspicion
may be associated with pharyngeal constriction, which is predicted to raise F1, and as
suggested above, with an open jaw setting, which also raises F 1.
Maekawa (1998) also notes that laryngealization was observed in the initial
syllable of utterances expressing suspicion and in some utterances conveying admiration
and disappointment. It is shown that the waveform of the laryngealized vowel is irregular
and smaller in amplitude compared to a non-laryngealized counterpart. Maekawa also
highlights the need to analyze voice quality differences in different paralinguistic types.
In a later work, Maekawa and Kagomiya (2000) report electromagnetic articulographic
results showing that the whole sentence sequence (i.e., vowels and consonants) for
suspicion was consistently pronounced with a fronted tongue and a greater distance
between the lips (i.e., an open jaw) compared to that for admiration. It seems that the
speaker adopted separate articulatory settings for these two paralinguistic types. In order
to follow up on the observation of phonation types in Maekawa (1998), Fujimoto and
Maekawa (2003) used a fiberscope to compare the states of the glottal and aryepiglottic
areas in: (a) three paralinguistic types (neutral, suspicion, and disappointment); and (b)
three phonation types (modal, breathy and creaky voices). They found adduction of the
false vocal folds and constriction of pharyngeal cavity in suspicion, which was
comparable to the phonation of creaky voice. This observation also conforms to Scherer's
(1 986) prediction about pharyngeal constriction in narrow voice.
In an analysis of the acoustic characteristics of emotional speech corpora, Iida,
Campbell, Higuchi, and Yasumura (2003) discuss vowel formant fi-equencies for three
emotions: joy, anger, and sadness. Unlike Maekawa (1998) and Maekawa and Kagomiya
(2000), however, they seem to attribute the formant frequency differences among the
three emotions to pitch (i.e., FO) and speech rate; they mention that emotional speech
uttered at a higher pitch and faster rate has a reduced F1-F2 vocoid space, which raises
frequency values (Iida et al., 2003, p. 174).
1.3 Research on Anime
While comic strips, on which numerous existing animated cartoons are based,
have a long history of scholarly studies (example), few studies have been conducted on
animated cartoons, and those that exist are still in the development stage (Lent, 2001). A
review of comic strip studies is beyond the scope of the present study; however, one study,
Hayashi (1978) is relevant to the methodology of the present study and is discussed here.
Based on psychological theories of personality and stereotyping, Hayashi hypothesized
that manga (comic strip) characters would be useful for investigating how people
associate social stereotypes with personality impressions, since characters' faces would
likely reflect the authors' and possibly consumers' stereotypes. He examined female
university students' ratings of the personality and facial traits of the stimulus Japanese
manga characters. Based on this analysis, he extracted four factors fi-om facial traits and
three from personality traits that were comparable to those extracted from the earlier
studies by Ohashi and his colleagues using facial photographs of real people in 1976 and
1977 (as cited in Hayashi, 1978). While, as Hayashi himself suggests, the results of his
study would need to be followed up in real-life conditions, his results provide support for
the approach taken in the present study, in which anime characters' voices are used to
identify the phonetic properties of vocal stereotypes shared among Japanese people. In
the next two subsections, studies on aspects of anime relevant to the present study, that is,
those on Japanese anime heroes and villains (Allison, 2000; Levi, 1996, 1998) and those
on cartoon voices, are discussed.
1.3.1 Literature on Anime Characters
Levi (1996), a devoted anime fan herself, describes the characteristics of Japanese
anime heroes in depth, classifying them into several subtypes. Here, only those qualities
essential to the present study are discussed. According to Levi (1998), Japanese anime
and manga heroes are quite different from their American counterparts. While American
heroes are overwhelmingly male and tend to be overly simplified into a "good guy"
stereotype, Japanese anime heroes exhibit more variety in type and gender. She attributes
this to the fact that most manga and anime are intended for a highly literate, adult
audience, and to the ability of those working in this media to feature multifaceted
characters. Levi describes the Japanese hero as follows:
The Japanese hero is defined by motivation. The ideal Japanese hero is not only brave and self-sacrificing, but selfless and unconcerned with personal gain or survival. The cause is not important. The hero's willingness to give his or her all to it is what counts. Winning doesn't matter either.. .. Losing and therefore gaining nothing confirms the hero's altruism and renders his or her sacrifice all the more tragic (Levi, 1996, p. 68).
Levi also mentions that anime contains few pure heroes; actually many have
shortcomings:
Heroism in most manga and anime is internal: heroes must be sincere and
they must be selfless, at least at the moment of heroism. It is not necessary for a manga or anime hero to be an [sic] saint, to fight for the right side, or even to be successful. Anyone who sincerely gives his or her best efforts to almost any task can be a hero (Levi, 1998, p. 72).
To sum up, the Japanese anime heroes whose voices are analyzed in this study are selfless,
sincere and devoted, as well as brave and self-sacrificing. They may also be flawed.
Japanese anime villains would be the opposite of the above: ".. . villains are
motivated by self-interest and will sacrifice anyone else, including often their own loyal
supporters, to get what they want" (Levi, 1996, p. 69). They are often nonhumans.
Allison (2000, p. 263) also notes that villains are often "armies of kaijii (monsters),
fashioned to be highly unrealistic and fantastically beastlike" in other forms of media
such as superhero comics, TV shows, and movies.
In this study, due to the paucity of human villains, nonhuman villains will also be
included as objects of analysis. However, because heroes are often human or humanoid in
Japanese anime, non-humanoid heroes will not be considered.
1.3.2 Literature on Cartoon Voices
To my knowledge, there has not been any study on Japanese anime voices, and
the existing studies on cartoon voices in works broadcast in North America have different
foci than the present study: the deviant phonology of certain cartoon characters (Brody,
2001; Cutts, 1992); and the use of dialects and foreign accents of English in cartoons
(Dobrow & Gidney, 1998; Lippi-Green, 1997). The deviant phonology discussed in
Brody (2001) and Cutts (1992) was from such characters as Bugs Bunny and Tweety Bird
- non-humanoid principal characters that are not discussed in the present study. Both
Dobrow and Gidney (1 998) and Lippi-Green (1 997) examined the relationship between
roles and dialectslforeign accents of English in a range of sample cartoons. They found
that while heroic roles had standard American English, villainous roles used foreign
accents such as Russian and German. While this finding is interesting, because the focus
of this study is the voice quality rather than the phonology of characters, further details of
these studies are not be discussed here. However, one remark by Dobrow and Gidney
(1 998, p. 11 7) deserves attention in relation to the concern of the present study: "Male
voices, especially those of heroes and major villains, tend to be gruff and may be

electronically altered to sound lower than average." While none of the voices of the
Japanese heroes in the present corpus possess these characteristics, some villains' voices
do (see 3.3.1).
1.4 Hypothesis
Table 1.1 summarizes the predictions that have been made about vocal
characteristics of good versus bad characters based on the findings in the relevant
research discussed so far.
Table 1.1
Summary of Predictions about the Voices of Good and Bad Characters
Source Good characters Bad characters
Hecht & LaFrance (1995) Changing and clear
Scherer (1 986) Pharyngeal constriction and overall tensing of vocal tract; raised larynx; increase or decrease of mean FO, rising F 1, falling F2 and F3, narrow F1 bandwidth, and increased high-frequency energy
van Bezooijen (1 995) Men - significantly lower pitched than the expected norms; women - higher pitched than the norm
Yarmey (1 993) Deep, relaxed, and Soft and monotone (only changeable (only about about men) men)
In order to formulate hypotheses about the phonetic properties of the voices of
good versus bad characters, some impressionistic terms should be translated phonetically.
The interpretations of the impressionistic terms are repeated from Section 1.2.2.1. Both
Hecht and LaFrance (1 995) and Yarmey (1 993) mention the changinglchangeable quality
of good characters (or in the case of the former, people with a positive attitude). The
auditory correlate of the changing quality may be a wide range of pitch and loudness with
temporal fluctuations; however, as mentioned earlier, of the three, only the acoustic
properties of pitch range will be discussed in the present study. The clear quality
mentioned in Hecht and LaFrance (1995) may translate as a wide range of articulatory
movements. Therefore, it can be hypothesized that heroes of both genders will have a
wide pitch range and a wide range of articulatory movements (Hypothesis 1 a).
As for pitch, based on van Bezooijen's (1995) study, it can be hypothesized that
the voices of male heroes may be significantly lower pitched than what would be
observed among males in real life, whereas the voices of female heroes are likely to be
somewhat higher pitched than what would be observed among females in real life. This
does not conflict with the prediction about good characters' pitch: "deep," based on
Yarmey's (1993) study. Therefore, this will be a second part of Hypothesis 1 (Hypothesis
1 b).
Lastly, based on Yarmey's (1993) study using male voices, it may be predicted
that male heroes' voices are relaxed. As already mentioned, the auditory correlate of
relaxed voice may be lax voice and breathy voice in Laver (1980, 1994,2000). Since lax
voice may have a narrow range of articulatory movements (Laver, 1994, p. 418), which
conflicts with Hypothesis la, in the present study, only the laryngeal component is taken
into account; therefore, a breathy voice is expected to be found in male heroes' voices in
addition to the above characteristics (Hypothesis 1 c).
As for villains' voices, there are two bases for making a hypothesis, that is,
Scherer (1 986) and Yarmey (1 993). However, as shown in Table 1, the predictions based
on these two studies conflict, possibly because Yarmey's (1993) results were drawn from
the voices of ordinary people who were not actually bad characters and whose voices
may not have exhibited much variety. On the other hand, Scherer's (1986) study is
theoretical and some of the predictions have been confirmed empirically (see 1.2.2.2).
Thus, the hypothesis of the present study is based on Scherer's predictions for negative
emotions. The following articulatory characteristics are expected to emerge in the
auditory analysis of villains' voices: pharyngeal constriction and overall tensing of the
vocal tract; and raised larynx. In addition, the following acoustic correlates are expected
to be found: an increase or decrease of mean FO, rising F 1, falling F2 and F3, narrow F1
bandwidth, and increased high-frequency energy (Hypothesis 2). Of these acoustic cues,
FO, F 1 and F2 are examined in the present study.
Drawing on Yarmey (1993), who suggests that the schemata for good characters
are more typical and likeable while those for bad characters are more unique and less
enjoyable, it is hypothesized that the auditory and acoustic characteristics of heroes'
voices will be more salient and easier to generalize than those of villains, which are
presumed to have a wider range of deviation and to exhibit greater variety (Hypothesis
3)-
Lastly, as mentioned in 1.2.2.2, vocal attractiveness stereotype studies have
revealed that there is a relationship between vocal attractiveness and the inference of
personality traits based on vocal stimuli. Therefore, it may be hypothesized that heroes
have attractive voices (Hypothesis 4). This hypothesis will be tested in a perceptual
experiment (see Chapter 5).

Chapter 2 Methodology and Data Collection
2.1 Preliminary Study
2.1.1 Purposes and Procedure
There were two main purposes in conducting the preliminary study. The first
purpose was to determine whether it was necessary to limit the main investigation to any
particular subgroup of the available Japanese animated cartoon titles (e.g., types of stories
depicted, and personality or physical traits of heroic/villainous characters). The second
purpose was to investigate whether, following auditory and acoustic analysis, the voice
qualities of heroes and villains would exhibit within-category similarities.
For these purposes, five anime titles (four TV series and one movie) containing
both heroes and villains were chosen, without placing any limitations on the personality
and physical traits of characters or the types of stories depicted. Following digitization of
speech portions used for the analyses, an auditory analysis was performed using Laver's
(1 980, 1994, 2000) voice quality descriptive fi-amework, and a spectrographic analysis
was performed.
2.1.2 Materials
The official English titles of the aforementioned five anime titles originally
chosen for this preliminary study are, in alphabetical order: Anpanman; Doraemon;
Princess Mononoke; Sailor Moon; and 3x3 Eyes (Three Eyes). (See Appendix A for
reference information on each title.) Of the five titles, Princess Mononoke, the only
movie among the five, was removed from the following analysis following repeated
observation, because there was no consistent villain in the story and the female villainous
character who would have been examined sounded like a female hero most of the time.
Of the remaining four series, Anpanman and Doraemon are for young children and
feature child characters as principal roles, while the others are for older children and
feature principal characters of at least junior high school age. With the exception of
Doraemon, of the four remaining titles, all have obvious heroes and villains, each of
whom represents good or evil; in Doraemon, two bullies that are elementary school
students were regarded as villains, while the principal robot cat character (Doraemon)

who helps the bullied student was regarded as a hero.
The lengths of the chosen portions fiom the four series are: Anpanman - 35 min;
Doraemon - 40 min; Sailor Moon - 90 min; 3x3 Eyes - 30 min. It was noted at which
point each hero or villain appeared in the series and, for the purposes of acoustic analysis,
which portions of their speech were free fiom sound effects or background music.
Characters with noise-free speech samples longer than 5 sec were included in this study.
The latter speech samples were digitized onto a personal computer (PI11 450 MHz,
Windows 2000) at 22,050 samples per second, 16-bit, using Cool Edit Pro LE
(Syntrillium Software Corporation). These digitized segments were stored for acoustic
analysis. For characters whose digitized samples were less than 45 s, additional speech
portions with sound effects andor background noise were recorded to mini disc to ensure
an adequate sample for auditory analysis; according to Laver (2000, p. 43), repeated
listening of 45-s speech samples is necessary to conduct auditory analysis using his vocal
profile analysis protocol.
In the following analyses, for the sake of convenience, each character was
assigned a combination of two letters and a number: the first letter represents the title
initial of the series (A for Anpanman; D for Doraemon; S for Sailor Moon [two films
together]; and T for 3x3 Eyes), and the second (H or V) designated either a heroheroine
or a villain; these two letters were followed by a number to complete the character coding
system. (Note that a different character coding system is used in the main analysis in
order to increase the amount of information encoded.) The age ranges of the characters
were estimated by the author; two age ranges, that is, children and adults, were treated
separately in the analyses. In total, the voices of 17 male and female heroes and villains
were analyzed in this study, broken down as follows: four male heroes (two children
[AHI, DHI]; two adults [SH3, THI]); five female heroes (one child [SH2]; four adults
[SVl, SV2, SV3, TV21); seven male villains (three children [AVl, DV1, DV21; four
adults [SVl, SV2, SV3, TV21); and one adult female villain (TVl). In this preliminary
analysis and the following main analysis, where more than one heroic character appears
as a member of a group and is treated equally importantly in the story, those on the
sidekick side were also included in the analysis.

2.1.3 Prelirnina y Analysis of Setting
2.1.3.1 Method.
Laver's vocal profile analysis protocol (see Laver, 1980, 1994,2000) was used for
this analysis. As already mentioned in Section 1.2.1, Laver distinguishes two sources that
contribute to the characteristic sound of a speaker's voice or voice quality: intrinsic and
extrinsic. Of these two, only extrinsic sources, which are under the speaker's volitional
control, are the subject of description; intrinsic sources, which reflect the speaker's
anatomical features and cannot be controlled, are excluded from analysis. The phonetic
quality of a voice is created by a combination of settings. The definition of settings is
repeated here from Laver (1994, p. 396): "any co-ordinatory tendency underlying the
production of the chain of segments in speech towards maintaining a particular
configuration or state of the vocal apparatus."
In Laver (1994), constellations of settings are represented by the following four
groups: articulatory settings (supralaryngeal settings); phonatory settings (laryngeal
settings); settings of overall muscular tension; and prosodic settings. However, prosodic
settings were removed from the ongoing analysis; in Laver's framework, neutral prosodic
settings, from which deviations are measured in describing each setting (see below), are
taken as "organically based values specific to the individual speaker" (Laver, 1994, p.
507), that is, values expected from a speaker of particular age, sex, height, and physique,
rather than "values defined as standard for whole population of speakers" (Laver, ibid.).
However, since voice actors often play characters that have different physical
characteristics from their own, and since part of the concern of this study is to determine
whether a character's pitch/loudness are high or low compared to other characters' or in
the population at large, it would not be useful to describe prosodic settings in Laver's
framework in this study. Therefore, the remaining three categories are considered in the
present study. These three settings are sub-divided into smaller groups, which also consist
of multiple settings, most of which represent the activity of individual articulators, such
as the jaw or tongue body.
Description of each setting is performed in reference to a neutral setting, from
which deviation is measured. The neutral reference setting is the neutral disposition of the
vocal tract. For articulatory settings, the neutral reference setting is the one by which the
central unrounded [a] would be produced:
the vocal tract is as nearly as anatomy allows in a posture giving equal cross-section to the vocal tract along its full length; the tongue is in a regularly curved convex shape; the velum is in a position of closure with the back wall of the pharynx, except for phonemically nasal segments; the lower jaw is held slightly open; the lips are held slightly open, without rounding or spreading (Laver, 1994, p. 402-403).
For phonatory settings, the neutral reference setting is one where voicing shows modal
phonation:
only the true vocal folds must be in vibration; the vibration of the folds must be regularly periodic, without audible roughness arising from dysperiodicity; the vibration of the folds must be efficient in air use, without audible friction; the degree of muscle tension in all phonatory muscle systems must be moderate (Laver, 1994, p. 404).
Lastly, for settings of overall muscular tension, the neutral requirement is a moderate
degree of tension that characterizes the long-term articulatory adjustment of the vocal
apparatus :
the length of the vocal tract must not be muscularly distorted, in that the lips must not be protruded, and the larynx must be neither muscularly raised nor lowered; the vocal tract must not be muscularly distorted at any point, by the action of the lips, the jaw, the tongue or the pharynx, and thereby prevented from approaching an optimally equal-cross-section configuration along its full length (Laver, 1994, p. 404).
Deviations from the neutral reference setting are accorded a value in terms of
three scalar degrees: 1 represents a slight degree of deviation from neutral; 2 a moderate
degree; and 3 an extreme degree. In order to identify the settings of a speaker's voice, one
needs to listen to a fair amount of speech (45 s or longer), given that individual segments
differ in their susceptibility to the effect of particular settings. The segmental
susceptibility to the influence of a given setting depends on the physiological dependence
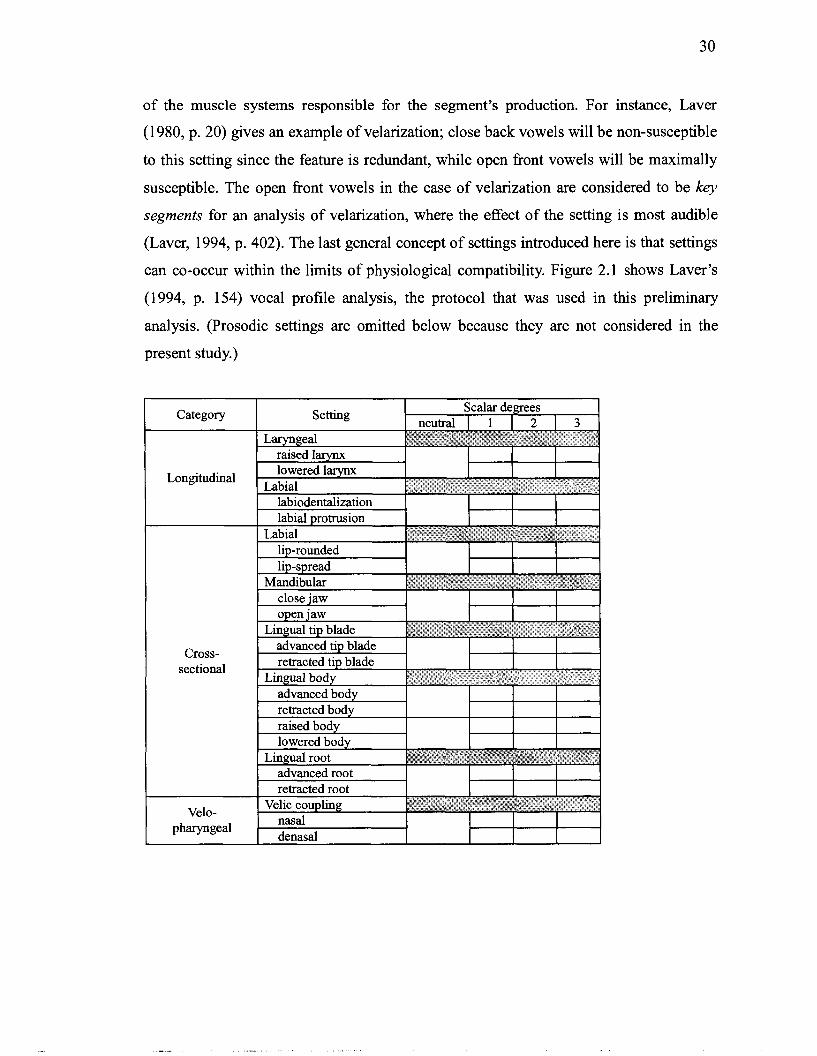
of the muscle systems responsible for the segment's production. For instance, Laver
(1 980, p. 20) gives an example of velarization; close back vowels will be non-susceptible
to this setting since the feature is redundant, while open fiont vowels will be maximally
susceptible. The open front vowels in the case of velarization are considered to be key
segments for an analysis of velarization, where the effect of the setting is most audible
(Laver, 1994, p. 402). The last general concept of settings introduced here is that settings
can co-occur within the limits of physiological compatibility. Figure 2.1 shows Laver's
(1994, p. 154) vocal profile analysis, the protocol that was used in this preliminary
analysis. (Prosodic settings are omitted below because they are not considered in the
present study.)
( raised larynx 1 Longitudinal
lowered larynx I I , , , I z , , ,
Labial
( lip-rounded u
I labiodentalization
1 close jaw I
u
advanced body retracted body
, raised body
Cross- sectional
advanced root
advanced tip blade retracted tip blade
Lingual body
I 1 &,,,
l 'i)
i'i i*"' 4
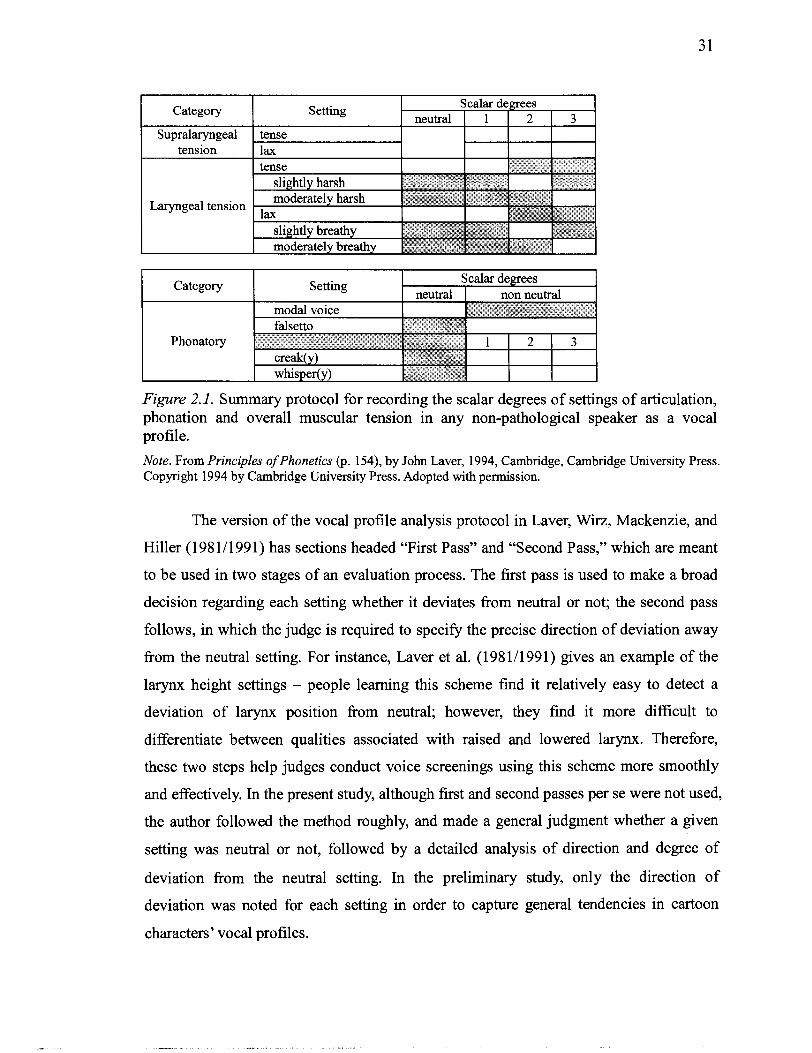
tension l lax I I I I I
Category
Supralaryngeal
Laryngeal
Figure 2.1. phonation profile.
Setting
tense
. Summary protocol for recording the scalar degrees of settings of articulation, and overall muscular tension in any non-pathological speaker as a vocal
Note. From Principles of Phonetics (p. 154), by John Laver, 1994, Cambridge, Cambridge University Press. Copyright 1994 by Cambridge University Press. Adopted with permission.
Scalar degrees
The version of the vocal profile analysis protocol in Laver, Wirz, Mackenzie, and
Hiller (198111991) has sections headed "First Pass" and "Second Pass," which are meant
to be used in two stages of an evaluation process. The first pass is used to make a broad
decision regarding each setting whether it deviates from neutral or not; the second pass
follows, in which the judge is required to specify the precise direction of deviation away
from the neutral setting. For instance, Laver et al. (1 98 111 991) gives an example of the
larynx height settings - people learning this scheme find it relatively easy to detect a
deviation of larynx position fkom neutral; however, they find it more difficult to
differentiate between qualities associated with raised and lowered larynx. Therefore,
these two steps help judges conduct voice screenings using this scheme more smoothly
and effectively. In the present study, although first and second passes per se were not used,
the author followed the method roughly, and made a general judgment whether a given
setting was neutral or not, followed by a detailed analysis of direction and degree of
deviation from the neutral setting. In the preliminary study, only the direction of
deviation was noted for each setting in order to capture general tendencies in cartoon
characters' vocal profiles.
neutral 1 1 2 1 3
1 1
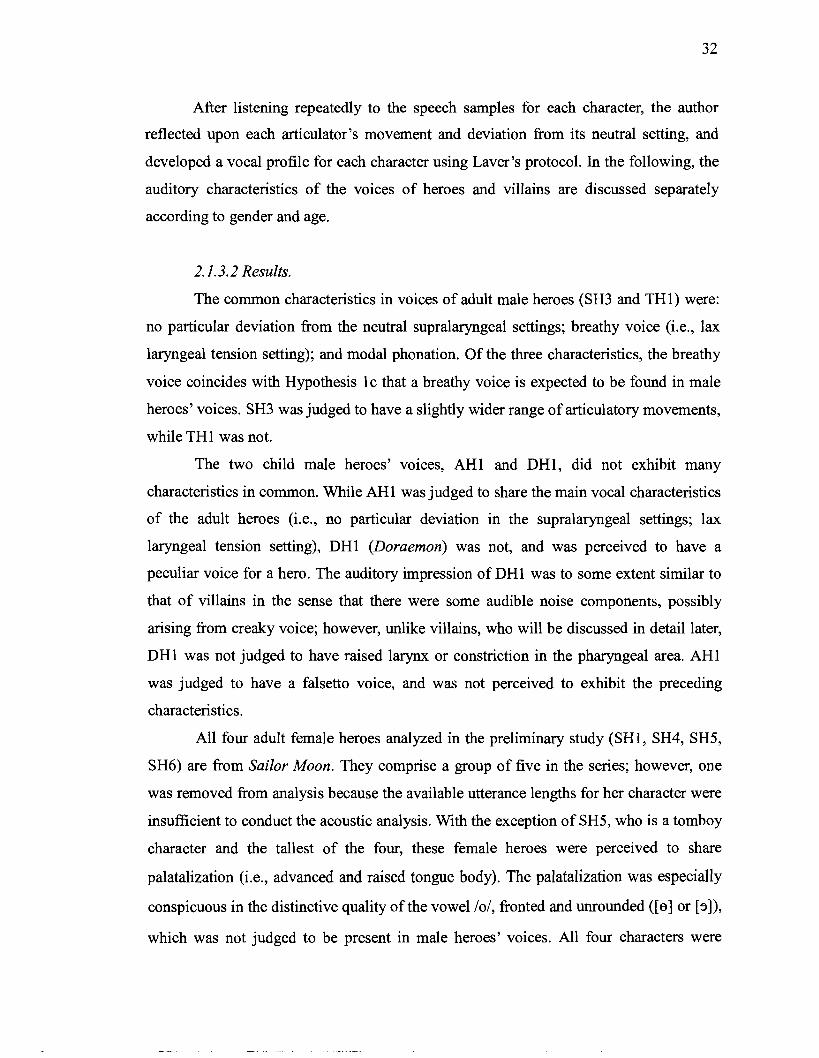
After listening repeatedly to the speech samples for each character, the author
reflected upon each articulator's movement and deviation from its neutral setting, and
developed a vocal profile for each character using Laver's protocol. In the following, the
auditory characteristics of the voices of heroes and villains are discussed separately
according to gender and age.
2.1.3.2 Results.
The common characteristics in voices of adult male heroes (SH3 and TH1) were:
no particular deviation from the neutral supralaryngeal settings; breathy voice (i.e., lax
laryngeal tension setting); and modal phonation. Of the three characteristics, the breathy
voice coincides with Hypothesis l c that a breathy voice is expected to be found in male
heroes' voices. SH3 was judged to have a slightly wider range of articulatory movements,
while TH1 was not.
The two child male heroes' voices, AH1 and DHI, did not exhibit many
characteristics in common. While AH1 was judged to share the main vocal characteristics
of the adult heroes (i.e., no particular deviation in the supralaryngeal settings; lax
laryngeal tension setting), DHl (Doraemon) was not, and was perceived to have a
peculiar voice for a hero. The auditory impression of DH1 was to some extent similar to
that of villains in the sense that there were some audible noise components, possibly
arising from creaky voice; however, unlike villains, who will be discussed in detail later,
DH1 was not judged to have raised larynx or constriction in the pharyngeal area. AH1
was judged to have a falsetto voice, and was not perceived to exhibit the preceding
characteristics.
All four adult female heroes analyzed in the preliminary study (SHl, SH4, SH5,
SH6) are from Sailor Moon. They comprise a group of five in the series; however, one
was removed from analysis because the available utterance lengths for her character were
insufficient to conduct the acoustic analysis. With the exception of SH5, who is a tomboy
character and the tallest of the four, these female heroes were perceived to share
palatalization (i.e., advanced and raised tongue body). The palatalization was especially
conspicuous in the distinctive quality of the vowel lo/, fronted and unrounded ([el or [3]),
which was not judged to be present in male heroes' voices. All four characters were

judged to have breathy voice.
The only child female hero in the present samples was SH2, who was judged to
share the two characteristics mentioned above with the adult counterparts from the same
series, that is, palatalization and breathy voice.
Of the four adult male villains, three were from Sailor Moon (SV1, SV2, SV3),
and the other was from 3x3 Eyes (TV2). Since the three Sailor Moon villains were
judged to exhibit quite different characteristics from TV2, they are discussed separately
here. Although they make up the majority of characters in this category, the Sailor Moon
villains appear to be peculiar in that they are good-looking and effeminate. Their
femininity is pragmatically expressed in SV2 and SV3 - they use female ending particles.
SV1 does not explicitly use feminine pragmatics; however, except when showing anger,
SV1 somehow gives a feminine impression as well. SVl and SV3 were judged to have
palatalized voice. SV2 and SV3 were perceived to have slight lowered larynx, while SV1
was judged to exhibit intermittent pharyngeal constriction (i.e., retracted tongue root) and
harsh phonation. SV1 and SV2 were perceived to exhibit intermittent nasality. SV3 was
also judged to exhibit a possibly wider range of articulatory movements. Except for
SVl's intermittent slight harshness, unlike the other male villains including children,
tension around the laryngo-pharyngeal area was not noted.
In contrast, TV2, the other adult male villain, was judged to have considerable
raised larynx, pharyngeal constriction, tense supralaryngeal and laryngeal tension settings
(extremely harsh voice), and whispery rather than breathy voice. These auditory
characteristics fit in well with Hypothesis 2 about villains' voices. In this voice,
intermittent vibration caused by the aryepiglottic folds was also noted. Aryepiglottic fold
vibration is a secondary "growling" at about half the frequency of glottal vibration
(Esling & Edmondson, 2002), which will be illustrated acoustically in 2.1.4.
The child male villains were judged more or less to share common characteristics
with TV2: raised larynx, pharyngeal constriction, and harsh voice. DVl and DV2 were
perceived to have palatalized voice. AV1 and DV 1 were noted for slightly close jaw. AV 1
was also judged to exhibit intermittent aryepiglottic fold vibration.
The only female villain analyzed in this preliminary study was TV1, who first
appears in disguise as an innocent landlady in front of the hero and his fellows, but later

in the episode shows her true character as a monster. While in disguise, TV1 was higher
pitched, moderately breathy, and palatalized; however, in her true character, she was
considerably lower pitched and slightly breathy, and was judged to have a lowered larynx,
which gave the impression of an expanded pharynx. In addition, there was a female
elderly villain in one of the Sailor Moon episodes whose speech portions all contain
background noise and are therefore not included in the sample. Her voice was judged to
share common characteristics with typical male villains: raised larynx, constricted
pharynx, and extremely harsh voice, with possibly intermittent aryepiglottic fold
vibration.
To sum up, the auditory characteristics of the voices of heroes are the absence of
pharyngeal constriction and the presence of breathy voice. The part of Hypothesis 1 a that
is relevant to auditory analysis was a wide range of articulatory movements expected in
heroes' voices; however, only one adult male speaker (SH3) was judged to exhibit this
tendency. Breathy voice was widely observed among male and female heroes' voices,
which supports Hypothesis lc. Auditory characteristics of a majority of villains' voices
are also consistent with Hypothesis 2; except for the female and effeminate villains,
raised larynx, pharyngeal constriction and harsh voice were prominent characteristics in
villains. The female villain TV1 and effeminate villains SV2 and SV3 were judged to
have pharyngeal expansion. As illustrated in the foregoing discussion, villains' voices
seem to exhibit a wider range of deviation and greater variety than those of heroes - an
observation that is consistent with Hypothesis 3. In the next subsection, possible acoustic
correlates of these auditory characteristics are examined in the speech samples.
2.1.4 Preliminary Spectrographic Analysis
In order to illustrate the acoustic correlates of selected phonatory settings
common to villains, spectrographic images were obtained for two voices that are harsh
with intermittent aryepiglottic fold vibration, using the WaveSurfer program version 1.4.6
(Sjolander & Beskow, 2002). (Throughout the present study, WaveSurfer version 1.4.6
was used for the acoustic analysis.) A window length of 172 Hz was used.
First, an example of modal voice (TH1) is shown in Figure 2.2. As can be seen
from the color of the spectrogram, the energy decreases naturally as frequency increases.

Vertical striations corresponding to vocal fold vibration periods can be clearly seen, due
to the regularity of the glottal waveform.
Figure 2.2. Spectrogram of modal voice (THI: adult male hero) uttering the phrase [demo rinrinsan] ' "But Ms. Rin-Rin."
In contrast, in a spectrogram of harsh voice (DV1) in Figure 2.3, strong energy
continues throughout the high frequency region, and vertical striations are not clear due to
the aperiodicity of the fundamental fi-equency (Laver, 1980). The strong high frequency
energy corresponds to acoustic correlates of villains' voices in Hypothesis 2.
1 Throughout this study, the transcription of Japanese phrases follows the PA-based broad phonetic transcription used in Kazama, Uwano, Matsumura, and Machida (1993, p. 22 1).
" , -"".. ~. . 1 1 1 1 1 1 , , 1 1 1 1 1 1 1 1 1 1 1 , I J I I I I I I I , I I I I , I I I 1 1 1 1 1 1 1 1 1 , 1 ( I I I I I I I I / I I I I J I I I I I ~ ~ l
t 0.05 0.10 0.15 0.20 0.25 0.30 0.35 0.40 0.45 0.50 0.55 0.60 0.65 0.70
Figure 2.3. Spectrogram of harsh voice (DV1: child male villain) uttering the phrase [naqkato] "with such (worthless fellow)."
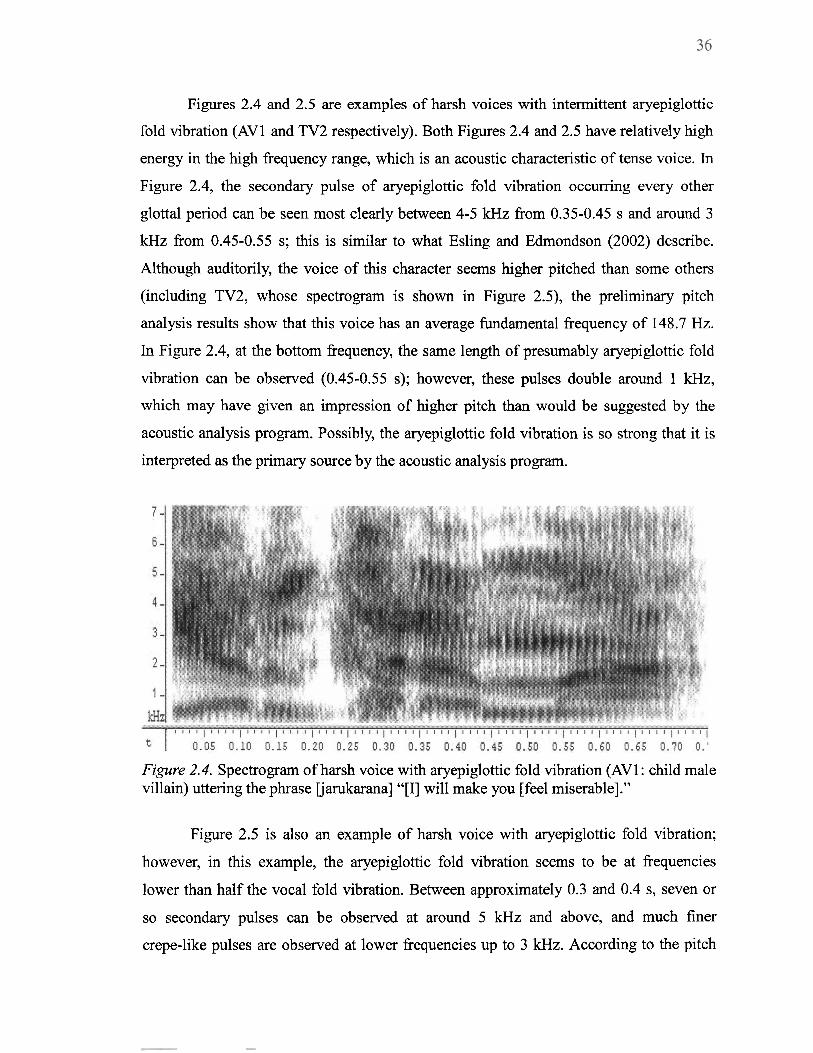
Figures 2.4 and 2.5 are examples of harsh voices with intermittent aryepiglottic
fold vibration (AVl and TV2 respectively). Both Figures 2.4 and 2.5 have relatively high
energy in the high frequency range, which is an acoustic characteristic of tense voice. In
Figure 2.4, the secondary pulse of aryepiglottic fold vibration occurring every other
glottal period can be seen most clearly between 4-5 kHz fi-om 0.35-0.45 s and around 3
kHz from 0.45-0.55 s; this is similar to what Esling and Edmondson (2002) describe.
Although auditorily, the voice of this character seems higher pitched than some others
(including TV2, whose spectrogram is shown in Figure 2.5), the preliminary pitch
analysis results show that this voice has an average fundamental frequency of 148.7 Hz.
In Figure 2.4, at the bottom frequency, the same length of presumably aryepiglottic fold
vibration can be observed (0.45-0.55 s); however, these pulses double around 1 kHz,
which may have given an impression of higher pitch than would be suggested by the
acoustic analysis program. Possibly, the aryepiglottic fold vibration is so strong that it is
interpreted as the primary source by the acoustic analysis program.
Figure 2.4. Spectrogram of harsh voice with aryepiglottic fold vibration (AV1: child male villain) uttering the phrase Ijarukarana] "[I] will make you [feel miserable]."
Figure 2.5 is also an example of harsh voice with aryepiglottic fold vibration;
however, in this example, the aryepiglottic fold vibration seems to be at frequencies
lower than half the vocal fold vibration. Between approximately 0.3 and 0.4 s, seven or
so secondary pulses can be observed at around 5 kHz and above, and much finer
crepe-like pulses are observed at lower frequencies up to 3 kHz. According to the pitch
analysis results, the primary pulses are around 200 Hz, while the secondary pulses seem
to be around 50-70 Hz by estimation (one cycle is 14 to 17 ms long).
7 - 6 -
5 -
4 - 3 -
2 -
1 - kHz
1 0.05 0.10 0.15 0.20 0.25 0.30 0.35 0.40 0.45 0.50 0.55 0.60 0.65 0.70 0 . 7 5 0.80 0.
Figure 2.5. Spectrogram of harsh voice with aryepiglottic fold vibration (TV2: adult male villain) uttering the phrase [naniosite] "What [are you] doing?"
2.1.5 Distribution of Voice Quality Features of Good versus Bad Characters in the Preliminary Study
In this preliminary investigation using four TV animation series, an auditory
analysis using Laver's (1 980, 1994,2000) framework was performed on the voices of 17
characters (nine heroes and eight villains). The auditory characteristics of the voices of
heroes' were an absence of pharyngeal constriction and breathy voice. In contrast, the
main auditory characteristics of villains' voices were pharyngeal constriction, raised
larynx and harsh voice; however, in the only female villain and in the three effeminate
villains in Sailor Moon, slight pharyngeal expansion was observed. These auditory
characteristics conform to parts of Hypotheses 1 and 2, and Hypothesis 3. Following the
auditory analysis, a spectrographic analysis was performed, and examples of harsh voice
with aryepiglottic fold vibration were shown.
The voice quality features of heroes and villains were identified auditorily and
acoustically to have similarities in each character category to some extent, without
limiting their personality and physical traits or the types of stories depicted; however, in
order to extract prototypical voice quality characteristics of each category, it seems
necessary to limit the attributes of heroes and villains. The next section talks about the
procedure for collecting material and the materials selected for the main analysis.

2.2 Materials
Titles of Japanese animated cartoons were collected as candidates for the main
analysis, using two Japanese animation newsgroups on the Internet. The following are
English translations of the conditions stated in the advertisement soliciting suggestions on
animation titles from the fans subscribing to the two newsgroups: (i) there is an obvious
contrast between heroes and villains; (ii) heroes must not get involved in criminal
activities such as theft; (iii) it is desirable that heroes be good-looking and villains not. In
addition, contributors were encouraged to recommend well-known titles from the 1960s
to the present. The author also asked Japanese animation fans both in Japan and in North
America, with whom she is personally acquainted, to recommend appropriate titles
stating the conditions above. Among the more than 60 titles thus obtained, 20 were
chosen as materials for this study following consultation with two avid animation fans.
Table 2.1 lists the 20 titles along with the lengths of the analyzed portions.
Table 2.1
Titles and Lengths of the 20 Animated Cartoons
No. Title Title Length min (min)
A Anpanman 100 K Princess Knight 2 5
B Astro Boy 7 5 L Castle in the Sky 120
C Conan the Boy Detective 80 M Sailor Moon 150
D Devilman 75 N The Secret of Blue Water 100
E Fist of the North Star 60 0 Time Bokan Series 75
F Future Boy Conan 125 P Star Blazers 7 5
G Battle of the Planet 150 Q Mazinger Z 45
H Cutey Honey 150 R Rayearth 45
I Steam Detectives 5 0 S Saint Seiya 150
J Super Doll Licca-chan 100 T Saber Marionettes 75
Note. Alphabet letters were assigned to each title for convenience (see the explanation in the text).
The lengths of the chosen portions range from 25 to 150 min (average 91.3 min),
depending on availability. Following the procedure used in the preliminary study,
characters with noise-fiee speech samples longer than 5 s were included in this study. The
noise-fiee speech samples were digitized onto a personal computer at 22,050 samples per
second, 16-bit, using Cool Edit Pro LE (Syntrillium Software Corporation) for acoustic
analysis. For characters whose digitized samples were less than 45 s, additional speech
portions with sound effects and/or background noise were also digitized onto a personal
computer to ensure an adequate sample for auditory analysis.
In the following analyses, for the sake of convenience, each character was
assigned a combination of three letters and a number: the first letter represented the
unique letter assigned to each cartoon; the second (H or V or S) designated either a hero
or a villain or a supporting role; the third (M or F) indicated gende?; the case of the latter
(upper or lower) represented either adult or child respectively; these three letters were
followed by a serial number in each sex and age category of cartoon to complete the
character coding system. The age ranges of the characters were estimated by the author;
two age ranges, that is, children (up to grade six of elementary school, i.e., 12 years old)
and adults (junior high school-age or older), were treated separately in the analyses. (The
ages of the characters that would be used in the perceptual experiment, Chapter 5, were
investigated using online resources and the help of avid anime fans.) For example, AHml
stands for Anpanman male child hero No. 1. In total, the voices of 88 heroes, villains, and
supporting roles were analyzed in this study, broken down as follows: 25 male heroes (10
children; 15 adults); 19 female heroes (six children; 13 adults); 30 male villains (one
child; 29 adults); 12 female villains (all adults); and two villainous-sounding supporting
roles (one child male; one adult female).
Hereafter, the term gender is used when referring to the distinction between male and female anime characters, while the term sex is used for the distinction between male and female voice actors.

Chapter 3 The Auditory Description of Voice Quality in Japanese Animation
3.1 Method of Analysis
The method of the present auditory analysis follows the procedure described in
Section 2.1.3.1: the author repeatedly listened to the speech samples of heroes and
villains (see Section 2.2 for the sampling procedure); reflected upon each articulator's
movement and deviation fiom the neutral setting; and developed a vocal profile for each
character using the Vocal Profile Analysis Protocol developed by Laver (1980, 1994,
2000). A repetition of this analysis was performed by the author after an interval of four
months, during which Laver's protocol was revised in order to promote efficiency of
description in the present study, based on the patterns of voice quality settings that
emerged in the first analysis.
The revision proposed here involves lingual body and root settings and settings of
overall muscular tension. There are also modifications with labial settings, both in
longitudinal and cross-sectional settings. In Laver (1980, 1994, 2000), there are four
settings under the lingual body category to describe radial movements of the location of
the center of the tongue, namely advanced body, retracted body, raised body, and
lowered body settings. In this analysis, however, the following three settings will replace
these four: fronting, raising, and retracting. Fronting replaces Laver's advanced body;
raising captures the upward and backward movement of the tongue body towards the
velum or uvula region; and retracting is used as in Laver. The motivations are as follows.
First, Laver (1980, p. 46) provides examples of how to use these settings in combination
or in isolation to create the following settings: a combination of varying degrees of
advancing and raising produces palatalized voice, palato-alveolarized voice, and
alveolarized voice; advancing yields dentalized voice; a combination of varying degrees
of retraction and raising produces velarized voice and uvularized voice; and finally,
retraction generates pharyngealized voice. Laver (1994, p. 41 1) states that a combination
of lowered and retracted tongue body settings produces pharyngealized voice. However,
as can be seen, lowered body setting is redundant, as it can combine only with retracted
body setting in non-pathological voices; therefore, it can be omitted. Second, the three
settings proposed here correspond to the three extrinsic tongue muscles that are
responsible for each of the three movements, that is, fronting, raising, and retraction. The
genioglossus (GG) fronts the tongue; the styloglossus (SG) pulls the tongue up and back;
and the hyoglossus (HG) pulls the tongue body down and back. In studies such as Harris,
Vatikiotis-Bateson, and Alfonso (1992) and Honda (1996), which examined tongue
muscle activities using electromyography (EMG), the anterior and posterior portions of
the genioglossus are distinguished as GGA and GGP respectively. However, GGA curls
the tip of the tongue into the mouth and depresses it, which itself does not seem to play a
principal role in articulating front vowels, while GGP is the muscle responsible for
drawing the posterior portion of the tongue forward (Palmer, 1993). Therefore, GG in the
present proposal may be considered to correspond to GGP in Harris et al. (1992) and
Honda (1996). In phonology, it has been conventional to distinguish high versus low
vowels, a practice that is misleading in the sense that it suggests tongue lowering in open
vowels. However, as in the case of the three front vowels /e, I, E/ in Harris et al. (1992),
quality differences among certain vowels seem to be brought about by jaw opening rather
than tongue muscle activities.
Next, in order to facilitate the description of laryngeal sphincter activities (i.e.,
pharyngealization), which seem to play an important role in differentiating the voices of
heroes and villains (as shown in Chapter 2), layngeal sphincter setting replaces tongue
root setting in Laver's (1980, 1994, 2000) framework. Settings of overall muscular
tension are also removed with the introduction of this new setting. (These tension settings
are not explicitly mentioned in Laver, 2000.) The laryngeal sphincter mechanism has
been extensively investigated by Esling and his colleagues (e.g., Esling, 1996, 1999;
Esling & Edmondson, 2002; Esling and Harris, 2003). The laryngeal sphincter is
involved in a range of articulations such as glottal stop, pharyngeal fricatives, and
pharyngeal stops (Esling, 1996, 1999). It can also contribute to the "ringing" quality of
such singing styles as opera, twang, and belting (Honda, Hirai, Estill, & Tohkura, 1995;
Yanagisawa, Estill, Krnucha, & Leder, 1989). Recently, Esling and Edmondson (2002)
found that the laryngeal sphincter plays a role in distinguishing tense and lax vowels in
the Tibeto-Burman language, Yi and the Sino-Tibetan language, Bai. The tense versus lax
segment contrasts have been treated under the supralaryngeal tension setting in Laver
(1980, 1994). The phonation types that were found to interplay with the tense versus lax
segment contrasts include harsh and breathy voices (Esling & Edmondson, 2002), which
are treated under the laryngeal tension setting in Laver (1994). Gao (2002) also found
that the laryngeal sphincter was activated during the production of whisper. Lastly, as
mentioned in Section 1.2.2.2, Fujimoto and Maekawa (2003) observed laryngeal
sphinctering (as well as creaky voice) during the production of "suspicious" speech.
Considering the wide range of articulatory activities where the laryngeal sphincter
mechanism plays a role - at the segmental level, in phonation types and singing styles,
and in paralinguistic and extralinguistic voice quality as seen in the present study - it
seems necessary to develop a descriptive system that incorporates the activity of this
mechanism.
According to Esling (personal communication), when the laryngeal sphincter is
engaged, the following three major components are likely to be involved to some degree:
aryepiglottic sphinctering, tongue retraction, and larynx raising. These three components
are presumably ordered in a hierarchy in which aryepiglottic sphinctering occurs first,
followed by tongue retraction and larynx raising. The interdependency between
pharyngealization and raised larynx has been noted in Esling (1996) and Esling, Heap,
Snell, and Dickson (1 994). However, based on laryngoscopic observations of the pharynx
and larynx during pharyngeal articulations with systematically varied larynx heights,
Esling (1999) suggests that raised larynx entails pharyngealization but the converse does
not necessarily apply; when pharyngeal constriction is present, the larynx may be either
raised or lowered. In the present proposal, the laryngeal sphincter setting will cover the
whole range of sphincteric activities from the slightest degree that can be observed during
a normal glottal stop with a neutral larynx height to the most extreme degree involving a
complete closure of the laryngeal sphincter accompanied by raised larynx.
There are hrther motivations for the introduction of the laryngeal sphincter
setting. Laver, Wirz, Mackenzie, and Hiller (1 98 111 99 1) report the effectiveness of the
two training programs using Laver's (1980) vocal profile analysis protocol. According to
them, judges' performances on the following four of 21 settings tend to be unacceptable,
suggesting the need for further training before judges may reliably use these settings in
clinical situations: larynx position, supralaryngeal tension, fronted-backed tongue body,
and raised-lowered tongue body. Tongue root setting was not included in their training
assessment. In addition, Laver (2000) reduces the scalar degrees of tongue root setting
from three to one (i.e., neutral or non-neutral) because it is hard to discern subtly
increasing degrees of pharyngeal constriction and expansion. Of the problematic settings
mentioned above, larynx position, supralaryngeal tension and tongue root descriptions
may be accounted for by the laryngeal sphincter mechanism. Thus, the introduction of the
laryngeal sphincter setting would promote greater understanding of the related
articulatory activities and would possibly promote more accurate auditory analysis when
using a vocal profile analysis protocol.
Another motivation for the laryngeal sphincter setting comes from the results of
the perceptual experiment in the present study. As mentioned in Chapter 5, speech
excerpts of cartoon characters selected based on pharyngeal states (i.e., pharyngeal
constriction or expansion) were successfully perceived by experiment participants as
being villainous when the pharyngeal states were non-neutral, that is, either constricted or
expanded. In addition, as shown in Chapter 6, laryngeal sphinctering had significant
correlations with negative physical, personality, and vocal traits and emotional states.
Thus, it seems reasonable to assume that laryngeal sphinctering is an important
perceptual unit in determining the auditory impressions of voices. Therefore, the voice
quality descriptive framework should include a separate entry for this setting.
In order to describe an active movement that is opposite to that observed in
laryngeal sphinctering, a pharyngeal expansion setting is also introduced. Pharyngeal
expansion is achieved by lowering the larynx andlor advancing the tongue root. Therefore,
the pharyngeal expansion setting is expected to cover a similar range of articulations to
that of larynx lowering; however, as mentioned earlier, the lowered larynx position does
not entail pharyngeal expansion - although physiologically more marked, it can be
accompanied by pharyngeal constriction as well, which was also found in the present
cartoon voice samples. In addition, the laryngeal sphinctering-pharyngeal expansion pair
may be better able to account for phonological patterns such as advanced versus retracted
tongue root and tense versus lax segments; thus an independent entry of pharyngeal
expansion is added in this revision. With these two settings, it is possible that a neutral
setting exists for any given speaker, as is the case with any other setting in Laver's (1980,
1994, 2000) protocol; in other words, the neutral laryngeal sphincter setting does not

require pharyngeal expansion, and vice versa. However, according to John Esling
(personal communication), laryngeal sphinctering and pharyngeal expansion are not
mutually exclusive either. In laryngoscopic observations of "hollow voice,"' one of the
four registers in Dinka, a Nilotic language of the Sudan, Edmondson, Esling, Harris,
Martin, Weisberger, and Blackhurst (2003) observed that this voice quality was achieved
by lowering the larynx, with a higher than low-range pitch, and constricting the
aryepiglottic sphincter slightly. Therefore, it can be said that in hollow voice, pharyngeal
expansion (achieved by lowering the larynx) and slight laryngeal sphinctering occur
simultaneously. In the present sample, similar cases were auditorily identified (see
Section 3.2). Laryngeal sphincter and pharyngeal expansion will be called epilaryngeal
settings together in the present revision.
With the removal of settings of overall muscular tension, harsh voice and breathy
voice will be incorporated into the phonatory settings. This placement coincides with
Laver (2000).
Lastly, there are two modifications to the labial settings. First, jaw protrusion is
added to the labial protrusion setting under the longitudinal category. Second, lip
constriction is added to the cross-sectional labial settings. These modifications are made
especially for the present study where it is presumed that sample voices are somewhat
exaggerated relative to naturalistic situations. Jaw protrusion and labial constriction were
commonly observed among a majority of villains, especially among those who had
laryngeal sphinctering, although some characters with pharyngeal expansion also had
these features. Nonetheless, evidence to support the addition of labial constriction in
linguistic work is provided by Esling and Edmondson (2002). They found increased
constriction at the lips concomitant with laryngeal sphinctering in tense syllables. They
suggest the possible muscular connection between the force required to contract the
supraglottic sphincter and that required to produce a more constricted articulation at the
oral sphincter.
The revised version of the vocal profile analysis protocol, complete with all
proposed modifications, is shown in Figure 3.1.
1 Dinka has four registers, namely modal voice, breathy voice, tense voice, and hollow voice, which are phonologically contrastive.

Figure 3.1. Modified summary protocol for recording the scalar degrees of settings of articulation and phonation used in the main analysis.
In the following analysis, the difficulty of auditorily determining the subtly
increasing degrees of larynx raisingilowering, labialljaw protrusion, labial constriction,
and laryngeal sphincteringipharyngeal expansion, combined with the fact that most of
these settings are being used for the first time, has motivated the reduction of scalar
degrees from three to two: 1 for a slight degree of the movement/quality, and 2 for
moderate to extreme degrees. Intermittent occurrences of epilaryngeal settings and creaky
and harsh voices, which were found mainly among villains' voices, were noted with "in
as suggested in Laver (2000). Lingual tiphlade settings are omitted fiom the following
discussion since the distribution of these settings seems to reflect the general articulatory
tendencies of the Japanese population (Joo, 1992, p. 72). The distribution of these
settings does not seem to play a significant role in differentiating the voices of heroes and
villains; rather, variations in these settings seem to reflect personal idiosyncrasies.
According to Joo, Japanese speakers realize the alveolar sounds [t, dl in one of two ways:
the majority of Tokyo dialect speakers pronounce them with the tongue tip touching the
back of the upper teeth and the tongue body contacting the alveolar ridge at the same
time; in the minority population, the front tongue body contacts the alveolar ridge and the
tongue tip contacts the lower incisors. In the present sample, there are four examples of
the latter articulation, distributed among one hero and three villains of a total of 88
characters. While the distribution does not seem to be systematic between roles, it may be
necessary to examine a larger sample in order to determine the role of tongue tiphlade
articulation in making stereotypical judgments of the voice.
3.2 Voice Quality Feature Distribution: Heroes versus Wllains
The results reported below are based on the author's second auditory analysis.
Over the period of analysis, the author consulted John Esling on the auditory impressions
of selected voices; overall, the author's impressions corresponded to Esling's. The
following settings were absent fi-om the entire sample of the present study:
labiodentalization, @-rounding, denasal, and falsetto. The phonatory setting was modal
voice throughout the sample. Thus, it does not seem that these settings have significance
in any attribute distribution and therefore, they are not included in the ongoing discussion.
In the case of intermittent occurrences of epilaryngeal and phonatory settings, precedence
is given to the settings that were predominant. Therefore, although there were three
characters (one male villain, one female villain, and one supporting role) who had
intermittent creaky voice, since their predominant phonatory settings were harsh or modal
voice, they were categorized as the latter; consequently, the label creaky voice is also
omitted from the following figures (Figures 3.2 to 3.7). In the following subsections, the

auditorily identified differences between heroes and villains in voice quality feature
distribution are discussed separately according to gender and age. Two
villainous-sounding supporting roles are also included in the appropriate group. In the
figures, for each category (e.g., male adult hero), the percentage of characters with
non-neutral settings for each of the 16 remaining settings is shown.
3.2.1 Adult Males
Figure 3.2 compares the distribution of articulatory and phonatory settings in
adult male heroes (left panel) and villains (right panel).
Laryngeal
Raised
Lowered
LabiaVJaw
Protrusion
Labial
Spreading
Constriction
Mandibular
Close
Open
Lingual body
Fronting
Raising
Retracting
Epilaryngeal
Sphinctering
Phar. expansion
Velic coupling
Nasal Phonatory
Whispery
Harsh
Breathy
Villains (n = 29) I
I I I
I I
Figure 3.2. Distribution of articulatory and phonatory settings in adult males.

With regard to the overall distribution of articulatory and phonatory settings, while
heroes' settings appear to converge on selected settings and the incidence of neutral
settings is also high, villains' settings are more widely distributed over the entire range of
settings and the incidence of neutral settings is low. In the following, types of
combinations of settings are identified, with epilaryngeal settings as keys to distinguish
one from another.
There are two combinations of settings judged to occur in heroes: Hero Type I:
intermittent, slight or moderate pharyngeal expansion and fronted or neutral tongue body
witWwithout breathy voice; and Hero Type 11: slight or intermittent laryngeal
sphinctering, and neutral or fronted tongue body. Larynx lowering judgments were
associated with two speakers in Type I, while larynx raising judgments were associated
with two speakers in Type 11; it should be noted that the two speakers (PHM2 and
QHM2) who had more constant pharyngeal constriction accompanied by raised larynx
are not principal characters in the stories; harsh voice judgments were also associated
with these two characters. (The remaining articulatory characteristics of QHM2 - labial
constriction, close jaw - fit in with the Villain Type I voice introduced below.) The
auditory impression of the other characters in Type I1 included the presence of more
"ringing" quality and of somewhat louder speech, which conforms to the findings about
aryepiglottic constriction and its auditory impressions in Yanagisawa, Estill, Krnucha, &
Leder (1989). Open jaw settings were distributed equally in Types I and 11. It should also
be noted that all the speakers categorized in Type I1 are from cartoons of the 1970s and
that five out of the six characters categorized in Type I are from cartoons of the 1980s and
1990s. In other words, the heroes in older cartoons exhibited more constricted
epilaryngeal settings than those in more recent cartoon^.^ Each of the two heroic voice
types account for 40% of the heroes.
Of the remaining 20%, two of three characters had alternating laryngeal
sphinctering and pharyngeal expansion, and the other character had a neutral epilaryngeal
This is also the case with adult female heroes and child heroes. The characters used in the perceptual experiment because of their slight intermittent laryngeal sphinctering (GHFI, KHfl, OHfl, OHml and QHF1) are all from cartoons of the 1960s and 1970s. In addition, a majority of villains that were categorized in heroic voice types are from more recent cartoons.
setting. Of the former with alternating epilaryngeal settings, one was the only character
played by an adult female voice actor in the present sample (THM1); however, this
character's voice was judged to have different characteristics than those of adult female
heroes: neutral tongue body setting and intermittent whispery voice as well as open jaw.
(Because of the atypicality, this character was selected as a stimulus; see Chapter 5.) The
character that had a neutral epilaryngeal setting (GHM3) was judged to have lip
protrusion instead of jaw protrusion and close jaw setting. As will be shown later, while
these characteristics may be associated with villains, this particular character was not
perceived to have constriction; rather, it appeared that these characteristics were
attributable to the appearance of the character: this character's face appeared to have
quasi-permanent lip puckering; lip protrusion and close jaw setting are thought to make
auditory impression of lip puckering. This character was not a principal character either.
Although the same percentages of heroes are assigned to Types I and I1 (i.e., 40% each),
if the two aforementioned characters on the sidekick side who had more constant
laryngeal sphinctering are subtracted, Type I, exhibiting pharyngeal expansion, appears to
be the more prevalent mode of heroes. This observation generally conforms to
Hypothesis lc: a breathy voice is expected to be found in male heroes' voices.
By contrast, the following combinations of settings were judged to be common in
villains: Villain Type I: moderate or extreme laryngeal sphinctering, raised larynx, jaw
protrusion, labial constriction, close jaw, harsh voice and any tongue body setting (i.e.,
fronting, raising, retraction, or neutral), with retraction the most common of the four; and
Villain Type 11: pharyngeal expansion, lowered larynx, withlwithout slight jaw protrusion,
slight labial constriction, and neutral or fronted tongue body. Type I fits in with the
articulatory characteristics expected for villains' voices in Hypothesis 2: pharyngeal
constriction, overall tensing of vocal tract, and raised larynx. In Type I, a combination of
raised tongue body and retracted tongue body was judged to be present in four characters
that had quite extreme laryngeal and oral sphinctering. In addition, eight characters in
Type I, representing two-thirds of the group, showed intermittent aryepiglottic fold
vibration concomitant with vocal fold vibration, which enhanced the auditory impression
of a low-pitched voice. Jaw protrusion and labial constriction were noted across these two
types. These features gave an auditory impression of tightening the lips and jaw, limiting
the capacity of the jaw to open more than a certain degree. Therefore, it can be expected
that vowels in villains' speech may not be differentiated as much as those in heroes'
speech. While a wide range of articulatory movements was not particularly noted among
heroes, restricted articulatory movements caused by the close jaw and lip constriction
were observed in villains' voices. Thus, it can be said that, compared to villains, heroes
had a wider range of articulatory movements (Hypothesis 1 a).
The combination patterns observed in heroes were also noted in villains, although
breathy voice was not noted except for one speaker. Villain Type I accounts for 41% of
the villains and Villain Type I1 for 17%. The remaining characters had smaller degrees of
laryngeal sphinctering or pharyngeal expansion and are broken down as follows: Hero
Type I (i.e., pharyngeal expansion) represents 14%, and Hero Type I1 (i.e., laryngeal
sphinctering) comprises 28%. The majority of these two hero types were good-looking
villains from Sailor Moon. Also, an enemy hero in Star Blazers (PVM1) is included in
Hero Type I. These characters are considered to possess certain characteristics of heroes,
whether they are physical or personality traits, which may contribute to the similarity of
vocal characteristics among heroes. As illustrated in the foregoing discussion, villains'
voices exhibited a wider range of deviation and greater variety than those of heroes - an
observation that is consistent with Hypothesis 3.
To sum up, nearly 70% of the villains exhibited laryngeal sphinctering to varying
degrees, and 60% of that group (i.e., 40% of the total corpus of villains) had moderate to
extreme laryngeal sphinctering with other settings of moderate to extreme degrees such
as raised larynx, tongue body retraction, and labial constriction. Villain Type I1 is a
unique group with characteristics not found among heroes, in the sense that the members
were judged to have jaw protrusion, labial constriction, and close jaw as well as larynx
lowering. Two of the five characters in this type (EVM1 and LVM2) were judged to have
intermittent laryngeal sphinctering as well; since laryngeal sphinctering is expected to go
together with oral sphinctering (Esling & Edmondson, 2002), the alternating laryngeal
sphinctering actions may have increased the judgments of oral sphincter constriction.
Alternatively, it is also possible that pharyngeal expansion and laryngeal sphinctering
occurred simultaneously in these voices as is the case with bbhollow voice" (see Section
3.1). In order to examine whether such voices are accompanied by pharyngeal expansion

andlor laryngeal sphinctering, it would be necessary to conduct a physiological
observation.
The patterns of laryngeal sphinctering that emerged among heroes and villains in
the adult male sample conform to findings in Esling (1996, 1999) and Esling and
Edmondson (2002) and are in agreement with the results of the preliminary study.
Laryngeal sphinctering tends to be accompanied by tongue body retraction and raised
larynx as well as harsh voice in its moderate to extreme degrees. The oral sphincter was
judged to be present in this moderate to extreme laryngeal sphinctering. In heroes and
villains where laryngeal sphinctering was slight or intermittent, the tongue body setting
varied from neutral to fronting and larynx raising was not observed in most cases. These
observations coincide with Esling's (personal communication) assumption about the
hierarchy of the three components of laryngeal sphinctering as outlined in Section 3.1:
aryepiglottic sphinctering occurs first, followed by tongue retraction and larynx raising;
slight or intermittent laryngeal sphinctering does not involve tongue body retraction and
larynx raising, while moderate to extreme laryngeal sphinctering does.
Nasalization was not observed in heroes at all, while it was judged to be present in
17% of villains. Unlike in English where some regional dialects have quasi-permanent
nasalization - for instance, Laver assigns scalar degrees 2 and 3 to RP accents of British
English and accents spoken in Australia and New Zealand respectively (1 994, p. 41 3) - to
my knowledge, no such systematic nasalization has been reported for Japanese. Therefore,
it seems that the nasalization found in one-fifth of the villains is unusual, providing more
variety to villains' voices and contributing evidence to support Hypothesis 3. In addition,
some villains in the present sample (e.g., Devilman, Mazinger Z and Sailor Moon) had
electronically altered voices, in which echoes were used andlor the amplitude of certain
frequencies was (possibly) increased. This tendency was also found in female villains in
Cutey Honey; however, no heroes were found to have electronically altered voice unlike
in Dobrow and Gidney (1998, p. 117). This type of electronic alteration gives more
variety to the villains' voices as well.
To summarize, in adult males, two types of heroic voices (i.e., Hero Types I and
11) and four types of villainous voices, of which two are similar to heroic voice types (i.e.,
Villain Types I and I1 and Hero Types I and 11), were identified using combinations of
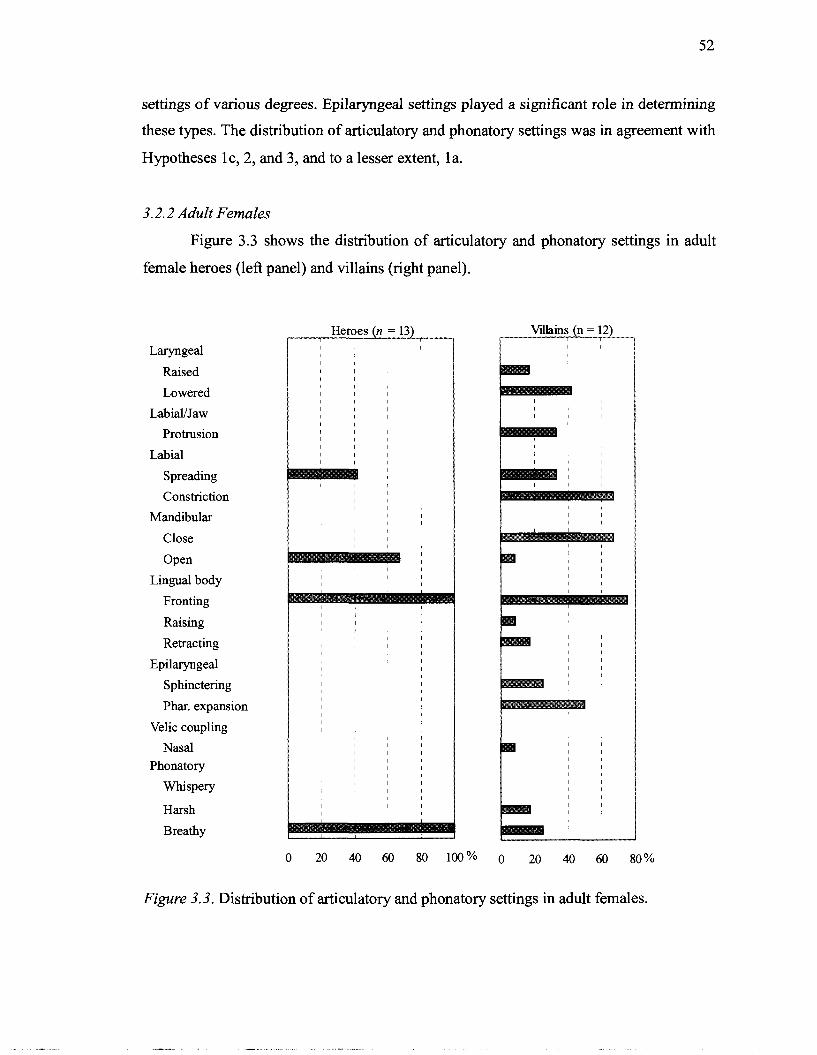
settings of various degrees. Epilaryngeal settings played a significant role in determining
these types. The distribution of articulatory and phonatory settings was in agreement with
Hypotheses 1 c, 2, and 3, and to a lesser extent, 1 a.
3.2.2 Adult Females
Figure 3.3 shows the distribution of articulatory and phonatory settings in adult
female heroes (left panel) and villains (right panel).
Laryngeal
Raised
Lowered
LabiaUJaw
Protrusion
Labial
Spreading
Constriction
Mandibular
Close
Open
Lingual body
Fronting
Raising
Retracting
Epilaryngeal
Sphinctering
Phar. expansion
Velic coupling
Nasal Phonatory
Whispery
Harsh
Breathy
Figure 3.3. Distribution of articulatory and phonatory settings in adult females.
Even at first glance, the distributional differences between heroes and villains are
remarkable. The tendency noted in adult males regarding the overall distribution of
articulatory and phonatory settings appears to be more pronounced in adult females:
while heroes' settings converge on selected settings and the incidence of neutral setting is
also high, villains' settings are more widely distributed over the entire range of settings
and the incidence of neutral settings is low. For heroes, it was noted that all members had
some degree of tongue body fronting and breathy voice; a majority also had open jaw
setting; and lip spreading was present in about 40% of heroes. These settings are thought
to have contributed to the distinctive quality of 101 in this speaker group, fronted and
unrounded [el or [s] - an observation that is consistent with the preliminary results (see
Section 2.1.3.2). The average ratings of tongue body fronting and breathy voice were 1.3
and 2.1 respectively (out of a maximum rating of 3); therefore, on average, heroes had
slight tongue body fronting and moderate breathy voice. The breathy voice again
conforms well to Hypothesis lc. As will be discussed in 3.2.4, a similar tendency - the
high incidence of lip spreading, jaw opening, tongue body fronting and breathy voice - is
observed in the voices of child female heroes as well, which may suggest the existence of
an ideal voice for female heroes in anime. These features are somewhat comparable to
Hero Type I in adult males, except that pharyngeal expansion was not noted in adult
female heroes and breathy voice was not necessarily observed in Type I male heroes.
Therefore, this category is called Hero Type I' from this point on. In addition to this Hero
Type I' voice, two characters gave the impression of tension, possibly caused by
intermittent aryepiglottic sphinctering to a smaller degree than scalar degree 1; therefore,
results on laryngeal sphinctering do not reflect the observed tendencies for these
characters. As will be mentioned in Chapter 5, these characters were chosen as
non-representative adult female voices, in the sense that they exhibited discernible
laryngeal sphinctering.
In villains, three types of setting combinations emerged. For the majority of
female villains, the combination of settings is comparable to that observed in Villain Type
I1 among adult males: pharyngeal expansion, lowered larynx, slight labial constriction,
slight jaw protrusion, and fronted tongue body. In adult females, all members in this type
had a slight degree of fronted tongue body. Two-thirds were perceived to alternate

between pharyngeal expansion and laryngeal sphinctering, or possibly exhibit pharyngeal
expansion and slight aryepiglottic constriction at the same time, as was the case with
adult male villains. This type accounts for 42% of the villains. The next-largest group,
accounting for 33% of the female villains, resembles Hero Type If, in the sense that labial
constriction and jaw protrusion were absent. However, lip spreading was judged to be
present in only one of the four characters in this group; and only two of them had breathy
voice. These two villains exhibited physical characteristics comparable to those of heroes.
One character had pharyngeal expansion alternating with laryngeal sphinctering
accompanied by intermittent harsh voice; however, this character shared the absence of
oral constriction and the presence of tongue body fionting and open jaw. The last group
of female villains is similar to the Villain Type I category for adult males: slight to
extreme degrees of laryngeal sphinctering, withlwithout raised larynx, with/without jaw
protrusion, labial constriction, harsh voice and raising, retraction, or neutral tongue body
setting, with retraction the most common of the four. The combination of raising and
retraction in tongue body settings was also noted for one character of this type. This type
accounted for 25% of the villains. Although the incidence of lip spreading and tongue
body fronting is more or less comparable to that observed for heroes, the incidence of
open jaw and breathy voice is considerably lower than in heroes. Nasalization was also
noted for one character, but no female hero was found to exhibit nasalization, which is
consistent with the findings for adult male heroes. Hypotheses 2 and 3 again proved to
hold in adult females as well.
One adult female supporting role who sounds villainous (LSF1) is categorized
into Villain Type I: laryngeal sphinctering, raised larynx, slight labial constriction, lip
spreading, open jaw, and extremely harsh voice. This character's voice was also used in
the perceptual experiment (see Chapter 5).
To sum up, one type of heroic voice (i.e., Hero Type If) that shares some features
with its male hero counterpart and three types of villainous voices (i.e., Villain Types I
and I1 and Hero Type 1') were identified in adult females.
3.2.3 Child Males
Among the ten child male heroes, one character (IHml) was played by a
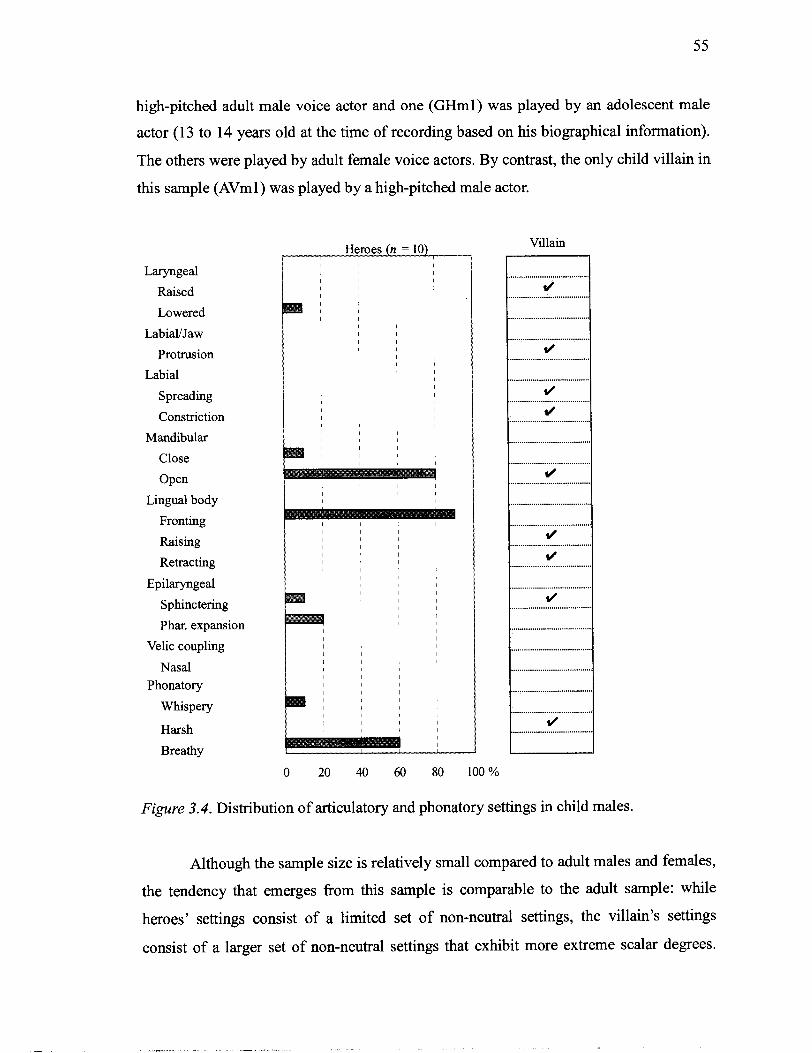
high-pitched adult male voice actor and one (GHml) was played by an adolescent male
actor (13 to 14 years old at the time of recording based on his biographical information).
The others were played by adult female voice actors. By contrast, the only child villain in
this sample (AVml) was played by a high-pitched male actor.
Laryngeal
Raised
Lowered
LabiaVJaw
Protrusion
Labial
Spreading
Constriction
Mandibular
Close
Open
Lingual body
Fronting
Raising
Retracting
Epilaryngeal
Sphinctering
Phar. expansion
Velic coupling
Nasal Phonatory
Whispery
Harsh
Breathy
Heroes (n = 10) I
Villain
Figure 3.4. Distribution of articulatory and phonatory settings in child males.
Although the sample size is relatively small compared to adult males and females,
the tendency that emerges from this sample is comparable to the adult sample: while
heroes' settings consist of a limited set of non-neutral settings, the villain's settings
consist of a larger set of non-neutral settings that exhibit more extreme scalar degrees.
The incidence of tongue fronting and open jaw settings was very high: 90% of heroes
were judged to have tongue body fronting; and 80% of heroes were judged to have open
jaw. Breathy voice was also noted in 60% of heroes, which corresponds to Hypothesis lc.
These distributions are very similar to the adult female sample except that lip spreading
was not noted at all for children, while 40% of adult female heroes had lip spreading.
Therefore, it can be said that Hero Type I' is the closest approximation to represent the
majority of child male heroes as well. Pharyngeal expansion was judged to be present in
two heroes; one of them was also noted for lowered larynx (IHml). Thus, especially for
the latter speaker, Hero Type I appears to be the closest approximation rather than Hero
Type 1'. The only character noted for close jaw was GHml, which may have been an
idiosyncrasy of the actor, or part of the actor's efforts to give the character more vocal
originality. (This was not a principal character either, as was the case with the two male
heroes who exhibited consistent laryngeal sphinctering as mentioned in Section 3.2.1.)
The only character with whispery voice (OHml) was perceived to have slight laryngeal
sphinctering; therefore, this character may be considered as equivalent to Hero Type I1 in
adult males, and was also chosen as a non-representative child male hero in the
perceptual experiment (see Chapter 5).
By contrast, the settings of the single child male villain are comparable to those in
the Villain Type I for adult males and females: extreme laryngeal sphinctering, raised
larynx, jaw protrusion, lip spreading, labial constriction, open jaw, tongue body raising
and retraction and extremely harsh voice. This set of settings also provides support for
Hypothesis 2.
The child male supporting role whose voice sounds villainous also exhibits a
combination of settings similar to Villain Type I: moderate laryngeal sphinctering, raised
larynx, lip spreading, labial constriction, open jaw and tongue body fronting. Unlike the
child male villain, this character was played by an adult female voice actor.
To sum up, the settings for the majority of child male heroes can be captured by
the Hero Type I' category with a slight modification (i.e., the removal of lip spreading),
and both the child male villain and the villainous-sounding supporting role are
categorized as having Villain Type I settings. The majority of child male heroes had
breathy voice, which confirms Hypothesis 1 c; and the combination of settings observed

for the two villainous voices, which are captured by the category Villain Type I, supports
Hypothesis 2.
3.2.4 Child Females
Since the present sample does not include any child female villains, this
subsection discusses only child female heroes.
Lwngeal Raised
Lowered
LabiaVJaw
Protrusion
Labial
Spreading
Constriction
Mandibular
Close
Open
Lingual body
Fronting
Raising
Retracting
Epilaryngeal
Sphinctering
Phar. expansion
Velic coupling
Nasal Phonatory
Whispery
Harsh
Breathy
Figure 3.5. Distribution of settings in child females.
As briefly mentioned in Section 3.2.2, this group shares the Hero Type I' settings with
adult female heroes: all members had tongue body fronting to varying degrees (average
rating 1.5); nearly 70% of the members were judged to have lip spreading and breathy
voice; and 50% of the members had an open jaw setting. The incidence of breathy voice
decreased from 100% of adult females to less than 70%. However, the high incidence of
breathy voice still conforms well to Hypothesis lc. Two characters were perceived to
have intermittent laryngeal sphinctering of a smaller degrees than scalar degree 1;
therefore, the data do not reflect the presence of laryngeal sphinctering in these two
characters. (These characters were also included as non-representative child female
voices in the perceptual experiment, as will be mentioned in Chapter 5.) One of them
(KHfl) was a princess pretending to be a boy in the story and was rated as not having lip
spreading, which is the feature shared by numerous female heroes, and presumably, along
with the lack of breathiness, this feature would contribute to the general auditory
impression of boyishness for this character. (See Section 5.2.6 for the gender perception
results of this character in the perceptual experiment.) There was one more speaker who
was not judged to exhibit breathiness (MHfl). Although this character was not noted for
laryngeal sphinctering, and was chosen as one of the representative child female heroes,
this character's projected voice may have been brought about by slight laryngeal
sphinctering. (See Sections 4.4 and 6.2.3 for relevant discussions of this speaker.)
3.2.5 Summary
This chapter discussed the distribution of articulatory and phonatory settings
observed in the sample according to the gender, age and role (villain vs. hero) of the
characters. Combinations of settings that represented the most common types of voices
observed for each group were examined; epilaryngeal settings played a significant role in
categorizing voice types. In adult males, two types of heroic voice (i.e., Hero Types I and
11) and four types of villainous voice (i.e., Villain Types I and I1 and Hero Types I and 11)
were identified. For adult females, child males and females, only one type of heroic voice,
Hero Type If, was consistently identified, while for adult females, three villainous voice
types, Villain Types I and I1 and Hero Type I' were identified. The single child male
villain and two supporting roles were judged to have Villain Type I settings. The
distribution of articulatory and phonatory settings observed in the identified voice types
provided confirmed Hypotheses lc, 2, and 3. Heroes that are more on the sidekick side
(i.e., GHM3, GHml, PHM2, QHM2) were judged to have either more constricted
settings or some characteristics that were not found in principal characters such as close
jaw and/or lip protrusion. By contrast, villains considered to possess some of the physical
or personality characteristics of heroes (e.g., Sailor Moon villains and the enemy hero in
Star Blazers) were perceived to have heroic voices rather than villainous voices.
The difference in the distribution of articulatory and phonatory settings between
adult males and the rest of the characters in the total sample, is that Hero Type 11, a voice
type that includes slight or intermittent laryngeal sphinctering, and neutral or fronted
tongue body, is present for the adult males, but not for other characters. As a result, the
incidence of breathy voice, which conflicts with laryngeal sphinctering, was much lower
for adult males than for other speakers: less than 30% of adult male heroes and 3% of
adult male villains exhibited breathy voice; in contrast, less than 30% of adult female
villains and 100% of adult female heroes had breathy voice, and the presence of breathy
voice among child hero groups (male and female) ranged between 60% and nearly 70%.
Since the majority of adult female, child male, and child female roles were played by
adult female voice actors, this difference may be attributable to the sex of the voice actors.
In the next section, voice quality feature distribution differences are discussed according
to the sex of voice actors.
3.3 Voice Quality Feature Distribution: Male versus Female Voice Actors
Since vocal maneuvers differ significantly between heroes and villains, as shown
in Section 3.2, heroes and villains are considered separately. Figure 3.6 contrasts the
distribution of articulatory and phonatory settings in heroes played by male actors (left
panel) with that of female actors (right panel).

Laryngeal
Raised
Lowered
LabialIJaw
Protrusion
Labial
Spreading
Constriction
Mandibular
Close
Open
Lingual body
Fronting
Raising
Retracting
Epilaryngeal
Sphinctering
Phar. expansion
Velic coupling
Nasal Phonatory
Whispery
Harsh
Breathy
Fernale Actors (n = 28)
Figure 3.6. Distribution of articulatory and phonatory settings in heroes played by male and female voice actors.
It is apparent that heroes played by male actors exhibit a wider range of settings than
female actors, which helps account for the fact that two types of setting combinations
were identified for adult male heroes (Hero Types I and 11), while only one setting
combination was developed for adult female and child heroes (Hero Type 1'). The
incidence of lip spreading is very low in heroes played by males, while it is more than
30% for heroes played by females. The figure of 30% is significantly smaller than the
incidence of lip spreading in child female heroes (higher than 60%), which is due to the
fact that there was no occurrence of this setting in child male heroes. Thus, it may be

surmised that female voice actors consciously produce female heroes' voices with lip
spreading in order to conform to the voice of the ideal female hero. (An alternative
explanation is provided in Section 4.3.) The incidence of open jaw, tongue body fronting,
and breathy voice doubles in females. The finding that women have breathier voices than
men is in agreement with previous studies of phonation types (Henton & Bladon, 1985;
Klatt & Klatt, 1990). In contrast, while the occurrence of non-neutral settings in
epilaryngeal and larynx height settings was noted in heroes played by males, no such
incidence was noted in heroes played by females except for one character who exhibited
pharyngeal expansion. (For a discussion of the incidence of jaw protrusion, which also
differs between the two sexes, see Section 3.2.1 .)
In Figure 3.7, where the distribution of articulatory and phonatory settings in
villains played by male actors (left panel) and female actors (right panel) is compared,
distribution patterns appear to be more complex than in Figure 3.6, due to the larger
number of setting combination types identified for villains: four for adult male villains
and three for adult female villains. The overall distributional differences between villains
played by male versus female actors are summarized as follows: in male actors, the
incidence of laryngeal sphinctering, raised larynx, tongue retraction, and harsh voice is
pronounced, a combination of settings represented by the category Villain Type I; in
contrast, in female actors, pharyngeal expansion, lowered larynx, tongue body fronting
and modal voice are the predominant characteristics, a voice type captured in the
category Villain Type 11. However, a smaller population represented the other villainous
voice type in both sexes; Villain Type I1 was noted in males, and Villain Type I was noted
in females. The incidence of jaw protrusion, labial constriction and close jaw setting
differs somewhat in the two sexes; however, the overall tendency is similar. As for the
fact that different voice types were predominant in the two sexes - the incidence of voice
types involving laryngeal sphinctering (i.e., Hero Type I1 and Villain Type I) was higher
in males than in females - it would be interesting to investigate whether this tendency
holds in other sample populations and whether there are any physiological reasons or
motivations for the observed sex differences. Observing the supraglottic activities in
American subjects with normal laryngeal structure and function, Stager, Neubert, Miller,
Regnell, and Bielamowicz (2003) found significantly higher incidence of "static"

62
(long-term) supraglottic activity (i.e., a setting comparable to laryngeal sphinctering in
the present context) in males than in females.
Lwngeal Raised
Lowered
LabiaVJaw
Protrusion
Labial
Spreading
Constriction
Mandibular
Close
open Lingual body
Fronting
Raising
Retracting
Epilaryngeal
Sphinctering
Phar. expansion
Velic coupling
Nasal Phonatory
Whispery
Harsh
Breathy
Figure 3.7. Distribution of articulatory and phonatory settings in villains played by male and female voice actors.
3.4 Predictions about Acoustic Analysis Results
The auditory observations made using the modified version of Laver's (1980,
1994, 2000) descriptive framework for voice quality in this chapter provide a basis for
some predictions about the results of the acoustic analysis relative to the hypotheses
about the acoustic properties of the voices of good versus bad characters, as formulated in
Chapter 1. These predictions pertain to the voice types identified in the foregoing
discussion. For vowel formant frequencies, the following predictions are made according
to voice type, based on acoustic findings from previous studies summarized in Laver
(1980, Chapter 2). The slight pharyngeal expansion in Hero Type I may contribute to a
lowering of F1 and F2. On the other hand, Hero Type 11, characterized by laryngeal
sphinctering (i.e., pharyngeal constriction), may show an approximation of Fl and F2.
However, the raising of F1 may be confounded by the tongue body fronting that was
judged to be present in this group of speakers, which would tend to lower F1 and raise F2.
In order for an increase in distance between F1 and F2 to be clearly discernible, the
segment under examination would need to have a normally low F1. This may also be
decided by which of the two settings is predominant.
Hero Type I' may be expected to have a high F1 caused by lip spreading and an
open jaw, and possibly a high F2 caused by tongue body fronting, since in order to
discernibly increase the distance between Fl and F2 in a segment with a high F1, F2
would also need to be high. However, again, it can also be expected that the effect on F1
may be reduced if tongue fronting is more predominant than lip spreading and/or open
jaw.
For Villain Type I, a voice type characterized by more extreme laryngeal
sphinctering than Hero Type 11, an approximation of Fl and F2 is also expected. However,
raised larynx, which was judged to be present in many of the speakers, causes formant
raising, including raising of F2; therefore, F2 may increase for this speaker group. The
incompatibility of the lowering and raising of F2 have confounded findings on the
acoustic properties of these related settings for a variety of researchers (Laver, 1980;
Nolan, 1983), as noted in Esling, Heap, Snell, and Dickson (1994). In the present model,
it may also be expected that a raised F2 will be observed when both raised larynx and
laryngeal sphinctering are identified, while a decreased F2 will be observed when only
aryepiglottic sphinctering is identified, based on the hierarchical relationship between the
two settings - larynx raising entails aryepiglottic sphinctering (see Section 3.1). However,
it should also be noted that, as opposed to the open jaw setting judged to be prevalent in
heroes, a close jaw setting was judged to be prevalent in this type (over 75%), which will

decrease Fl and F1 variability. In other words, even the increase in Fl , which is expected
to occur due to pharyngeal constriction (and raised larynx) may be confounded in this
voice type. Lastly, for Villain Type 11, a lowering of Fl and F2 will be observed because
of the pharyngeal expansion.
Chapter 4 The Acoustic Description of Voice Quality Features in Japanese Animation
4.1 Method of Analysis
This chapter describes the results of the acoustic analysis of voice quality features
in Japanese anime. Three methods of acoustic analysis were used in order to capture the
vocal characteristics of heroes and villains: pitch analysis, vowel formant analysis, and
spectrographic analysis. Prosodic settings including those pertinent to pitch were
excluded from the auditory analysis (see Section 2.1.3.1). However, pitch height and
pitch range can convey a considerable amount of information about the speaker.
Accordingly, two hypotheses were formulated about pitch height and range in Chapter 1 :
that the heroes of both genders would have a wide pitch range and a wide range of
articulatory movements (Hypothesis la); and the voices of male heroes may be
significantly lower pitched than what would be observed among males in real life,
whereas the voices of female heroes are likely to be somewhat higher pitched than what
would be observed among females in real life (Hypothesis lb). Since it is likely that the
original FOs of the characters were retained in the course of recording and production
without distortion, it was decided to test these hypotheses by calculating the FO mean and
standard deviation for each speaker.
A number of studies have measured vowel formant frequencies to investigate the
acoustic properties of supralaryngeal settings of voice quality (Laver, 1980; Nolan, 1983;
Esling, 1987; Esling, Heap, Snell, & Dickson, 1994). Considering that vowels have
highest amplitudes and longest durations among segments, it makes sense to examine
vowel formant frequencies in order to capture long-term quality arising from
supralaryngeal settings. In such studies, the first two or three formant frequencies were
measured from vowel tokens uttered with selected voice quality settings, and means were
calculated for each vowel; these results were then compared with values calculated from
other speaker groups with different voice quality settings (Esling, 1987); or related to
acoustic predictions based on previous studies (Laver, 1980; Nolan, 1983) and/or values
calculated from other articulatorily controlled supralaryngeal settings (Esling et al., 1994;
Nolan, 1983). In the present analysis, three of the five Japanese vowels (/a, i, 00 will be
examined, comparing across different speaker groups. The latter part of Hypothesis la,
which concerned the issue of heroes having a wide range of articulatory movements, and
predictions made about each of the heroic and villainous voice types identified in Chapter
3 (see Section 3.4) will be tested.
The Long-Term Average Spectrum (LTAS) has also been used in previous studies
on the acoustic properties of voice quality (e.g., Esling, 1987; Nolan, 1983; for review
see Bruyninckx, Harmegnies, Llisterri, & Poch-OlivC, 1994; Pittam, 1987, 1994). To
obtain the LTAS, a series of frequency-by-amplitude short-term spectra are continuously
averaged over the duration of an utterance. Unlike a single short-term spectrum, which
represents the frequency and amplitude content of just one moment of a single consonant
or vowel, the LTAS neutralizes short-term segmental characteristics through an averaging
process. For an utterance of sufficient length, the LTAS extracts phoneme-independent
speaker-dependant information, and appears to be a reasonable tool in the study of voice
quality, given its definition as a quasi-permanent quality running through all the sound
that issues from a speaker's mouth (Bruyninckx et al., 1994). However, because the
length of the noise-free speech portions in the present study ranges from 7.7 s up to
longer than 60 s, and because the LTAS depends on the content of the text (Harmegnies
& Landercy, 1988), it would be inappropriate to examine the present corpus using the
LTAS analysis. In addition, in a separate study (Teshigawara, 2000), the author found that
the shape of the lower frequencies in the LTAS is sensitive to FO range, which varies
widely among speakers in the present corpus. Therefore, it was decided that the LTAS
would not be used in the present analysis.
Lastly, as a means of investigating the phonatory settings of heroes and villains
acoustically and examining whether auditorily identified features accord with acoustic
results, spectrographic images of selected speakers will be examined visually. A number
of acoustic measures have been proposed as a means to identify and differentiate
phonatory settings (see Buder, 2000 for an extensive review of numerous techniques).
For instance, as measures of breathiness, the following have been proposed and have
been used in a number of studies (e.g., Hillenbrand, Cleveland, & Erickson, 1994; Klatt
& Klatt, 1990): the relative strengths of the first and second harmonics (henceforth H1
and H2, respectively) or the first formant or third formants; aspiration noise replacing the
third and higher formants; the introduction of extra poles (formants) and zeros (energy
gaps) in the vowel spectrum; spectral tilt; the increased bandwidth of Fl; and Cepstral
Peak Prominence (CPP), a measure of cepstral peak amplitude normalized for overall
amplitude.' However, as Shrivastav (in press) and Shrivastav and Sapienza (2003) note,
results using one or more of the above acoustic measures have not been consistent and
have failed to yield a high correlation with perceptual ratings of breathiness (see
Hillenbrand et al., 1994, and Klatt & Klatt, 1990 for reviews of previous studies). Klatt
and Klatt (1990) also suggest that a single cue may not be sufficient for the perception of
breathiness. Shrivastav (in press) and Shrivastav and Sapienza (2003) claim that, in
addition to the factors cited above, acoustic cues to breathiness fail because they do not
take into account the non-linear processes that occur in the peripheral auditory system
during the auditory perceptual process. Shrivastav (in press) and Shrivastav and Sapienza
(2003) analyzed breathy voices using both acoustic measures and an auditory model
proposed by Moore, Glasberg and Baer (as cited in Shvastav, in press, and Shrivastav &
Sapienza, 2003), and correlated the measures with perceptual ratings. It was found that
the auditory model performed better than the acoustic measures in accounting for a high
amount of variance in the perceptual ratings of breathiness, although with the addition of
CPP to the acoustic measures in comparison with the auditory model in Shrivastav and
Sapienza (2003), the difference between the two was not great. (The auditory model
accounted for 85.2% of the variance in the listeners' ratings of breathiness, whereas the
acoustic measures, i.e., the best predictor CPP in combination with two other variables,
accounted for 80.9%.) While this auditory model seems attractive, it accounts only for
breathy voices and is not an analysis package available to the general public at the
moment of writing. Turning to the acoustic measures commonly used in the previous
studies, CPP would be the best, according to Hillenbrand et al.3 (1994) and Shvastav
and Sapienza's (2003) results. However, the speech material in this study, that is, running
speech, does not appear to be suitable for cepstral analysis; Snell (1993, p. 8)
recommends that this technique be limited to "pitch extraction during the production of
steady state vowels where the fundamental frequency remains relatively constant over a
1 A cepstral peak corresponds to the fundamental period, FO. CPP is based on the idea that "a highly periodic signal should show a well defined harmonic structure and, consequently, a more prominent cepstral peak than a less periodic signal." (Hillenbrand, Cleveland, & Erickson, 1994, p. 772)
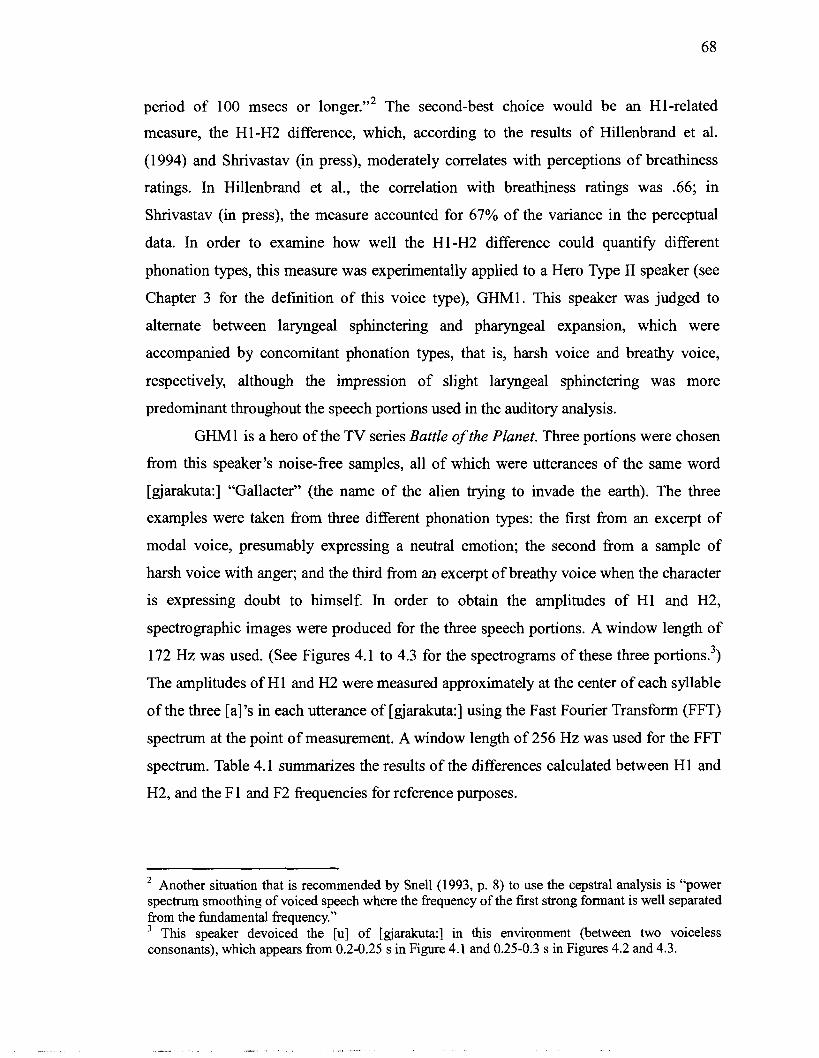
period of 100 msecs or longer."* The second-best choice would be an HI-related
measure, the HI-H2 difference, which, according to the results of Hillenbrand et al.
(1994) and Shrivastav (in press), moderately correlates with perceptions of breathiness
ratings. In Hillenbrand et al., the correlation with breathiness ratings was .66; in
Shrivastav (in press), the measure accounted for 67% of the variance in the perceptual
data. In order to examine how well the HI-H2 difference could quantify different
phonation types, this measure was experimentally applied to a Hero Type I1 speaker (see
Chapter 3 for the definition of this voice type), GHM1. This speaker was judged to
alternate between laryngeal sphinctering and pharyngeal expansion, which were
accompanied by concomitant phonation types, that is, harsh voice and breathy voice,
respectively, although the impression of slight laryngeal sphinctering was more
predominant throughout the speech portions used in the auditory analysis.
GHMl is a hero of the TV series Battle of the Planet. Three portions were chosen
from this speaker's noise-free samples, all of which were utterances of the same word
[gjarakuta:] "Gallacter" (the name of the alien trying to invade the earth). The three
examples were taken from three different phonation types: the first from an excerpt of
modal voice, presumably expressing a neutral emotion; the second from a sample of
harsh voice with anger; and the third from an excerpt of breathy voice when the character
is expressing doubt to himself. In order to obtain the amplitudes of H1 and H2,
spectrographic images were produced for the three speech portions. A window length of
172 Hz was used. (See Figures 4.1 to 4.3 for the spectrograms of these three portions.3)
The amplitudes of H1 and H2 were measured approximately at the center of each syllable
of the three [a]% in each utterance of [gjarakuta:] using the Fast Fourier Transform (FFT)
spectrum at the point of measurement. A window length of 256 Hz was used for the FFT
spectrum. Table 4.1 summarizes the results of the differences calculated between H1 and
H2, and the F 1 and F2 frequencies for reference purposes.
Another situation that is recommended by Snell (1993, p. 8) to use the cepstral analysis is "power spectrum smoothing of voiced speech where the frequency of the first strong formant is well separated from the fundamental frequency."
This speaker devoiced the [u] of [giarakuta:] in this environment (between two voiceless consonants), which appears from 0.2-0.25 s in Figure 4.1 and 0.25-0.3 s in Figures 4.2 and 4.3.
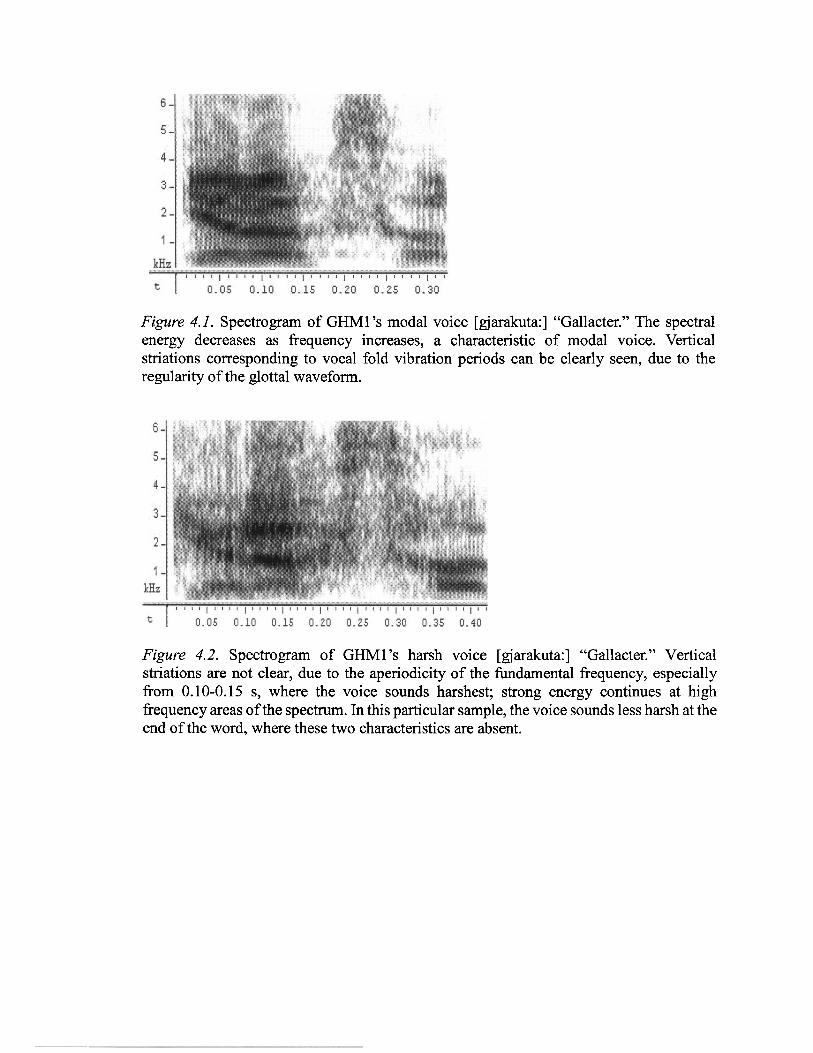
Figure 4.1. Spectrogram of GHMl 's modal voice [gjarakuta:] "Gallacter." The spectral energy decreases as frequency increases, a characteristic of modal voice. Vertical striations corresponding to vocal fold vibration periods can be clearly seen, due to the regularity of the glottal waveform.
Figure 4.2. Spectrogram of GHMl's harsh voice [gjarakuta:] "Gallacter." Vertical striations are not clear, due to the aperiodicity of the fundamental frequency, especially from 0.10-0.15 s, where the voice sounds harshest; strong energy continues at high frequency areas of the spectrum. In this particular sample, the voice sounds less harsh at the end of the word, where these two characteristics are absent.

Figure 4.3. Spectrogram of GHMl's breathy voice [gjarakuta:] "Gallacter." The formants are not as pronounced as in Figure 4.1 (modal voice), and a general energy loss is observed in the high frequency region. In this particular utterance, the voice becomes breathier toward the end.
Table 4.1
Relative Amplitude of First and Second Harmonics (HI-H2) and the First Two Formant Frequencies (Fl, F2) for Three Phonation Types of the Utterance [aarakuta:]
Modal Harsh Breathy /gj a/ H 1 -H2 (dB) -9.1 a - 2.2
F1 (Hz) 506 506 587 F2 (Hz) 1417 1660 1458
Ira/ H 1 -H2 (dB) -6.2 -7.0 8.1 . .
F1 (Hz) 567 587 627 F2 (Hz) 1275 1437 1316
/ td HI-H2 (dB) 1.8 -1 .O 3.4 Fl (Hz) 506 567 607 F2 (Hz) 1154 1296 1296
Average H 1 -H2 (dB) -4.5 -2.7 4.6 F1 (Hz) 526 553 607 F2 (Hz) 1282 1464 1357
Note. Figures are based on the measurements fiom GHM1. a Although the first two harmonics were observed in the FFT spectrum, their frequencies (283 Hz and 526 Hz, respectively) did not correspond to the auditory impression of this vowel. In addition, the pitch tracker was unable to calculate the FO for this portion.
While formant frequencies appear to be more or less stable throughout each utterance
(the exceptions are the high F1 and F2 for the vowel in [gja] caused by the glide), H1-H2
varies drastically within an utterance. Even if the figures for harsh voice are discounted
(this measure may not be suitable for harsh voice - HI-H2 has been used for comparisons
of breathy, modal, and creakyllaryngealized voices; see Hillenbrand et al., 1994, and
Klatt & Klatt, 1990), the general tendency is the same. Besides, for the breathy voice,
even though the syllable [ta] sounds much breathier than the first two syllables [gjara], an
observation that is supported by the spectrogram of this utterance (Figure 4.3), the HI-H2
values do not reflect this fact. Thus, it can be said that HI-H2 values vary greatly
according to the position in the utterance where the measurement is taken; and it may not
reflect phonatory setting variability very well. In addition, although each speaker was
observed to exhibit a quasi-permanent phonatory setting and/or to alternate between a
small group of settings, depending on the emotion exhibited (as in the examples fiom the
speaker GHMI) or other factors, phonatory settings (and epilaryngeal settings) can vary
widely; to achieve reliable results, one would need to take great care in choosing where to
measure HI-H2 for each speaker. However, spectrograms appear to better reflect the
auditorily observable changes in phonatory settings. Therefore, for the present analysis, it
was decided that spectrograms of selected speakers would be described based on visual
inspection.
Before applying the three acoustic analysis methods (i.e., pitch, vowel formant,
and spectrographic analyses), noise-free speech samples of the 88 speakers' voices, which
had been stored on a personal computer at 22,050 samples per second, 16-bit for auditory
and acoustic analyses, were carefully examined. In order to analyze speech portions
representative of each speaker, those produced with a voice quality setting deviating from
the speaker's normal setting were removed, with the exception of characters who were
consistently angry or shouting. Then, for the pitch analysis, the length of the noise-free
speech portions was standardized across speakers at a maximum of around 30 s; for
speakers with speech samples shorter than 30 s, the full utterances were retained, while
for speakers whose speech samples were longer than 30 s, the first 30 s was kept for
ongoing analyses. The resulting length of the speech samples for the 88 speakers ranged
from 7.4 to 33.3 s. These samples were used in vowel formant and spectrographic
analyses as well, with the exception of (a) samples that did not contain the vowels being
analyzed in this study within the first 30-s portion; or (b) cases in which a spectrographic
image better exhibiting the phonation type of the speaker could be obtained fiom the
portion after the first 30 s.
4.2 Pitch Analysis
For each speaker, FO was calculated for the noise-free speech portions. As a first
approximation, the analysis ranges were determined according to the sex of the voice
actors rather than the sex of the characters played, in order to match the ranges exploited
by voice actors. The ranges were 70 to 450 Hz for male speakers and 100 to 600 Hz for
female speakers. A frame length of 10 ms was used. Paying attention to occurrences of
pitch halving and doubling, the analysis ranges were adjusted more finely for each
speaker. FFT spectra of portions where pitch halving or doubling occurred were
examined in order to determine the frequencies of the first harmonics. When it was not
possible to produce a pitch contour that would conform to the estimated FO from the FFT
spectrum without pitch halving or doubling, the pitch contour was manually adjusted
using the function of Wavesurfer version 1.4.6. One speaker (AVml), whose utterances
were consistently diplophonic, presumably because of ongoing aryepiglottic fold
vibration, was eliminated from this analysis because of the difficulty of obtaining
accurate FO measurements. In an extreme case like this, it was not possible to determine
which of the two sources (i.e., the vocal fold or the aryepiglottic fold vibration)
contributed to pitch perception. Numerical results for a total of 87 speakers were stored
on a personal computer for the purposes of statistical analysis.
First, the FO mean and standard deviation were calculated for each speaker.
Standard deviation of FO is considered to roughly correspond to FO range. (In order to
avoid confusion with the standard deviation of mean FO within speaker groups, this
measure will henceforth be referred to as FO range.) Due to the wide range of mean FOs
among and within speaker groups, FO ranges were converted from Hz to sernitones,
which served to minimize differences across speakers attributable to different mean FOs
(Traunmuller & Eriksson, 1993). However, since the standard deviations of FO is
dependent on the length of the speech portion (i.e., the number of data points), it was
decided that only speakers with speech portions of 20 s or longer would be included in
the calculation of FO range for each group. Then, for each speaker group, the mean and
standard deviation of mean FO in Hz and the FO range in semitones were calculated. The
results are summarized in Table 4.2.
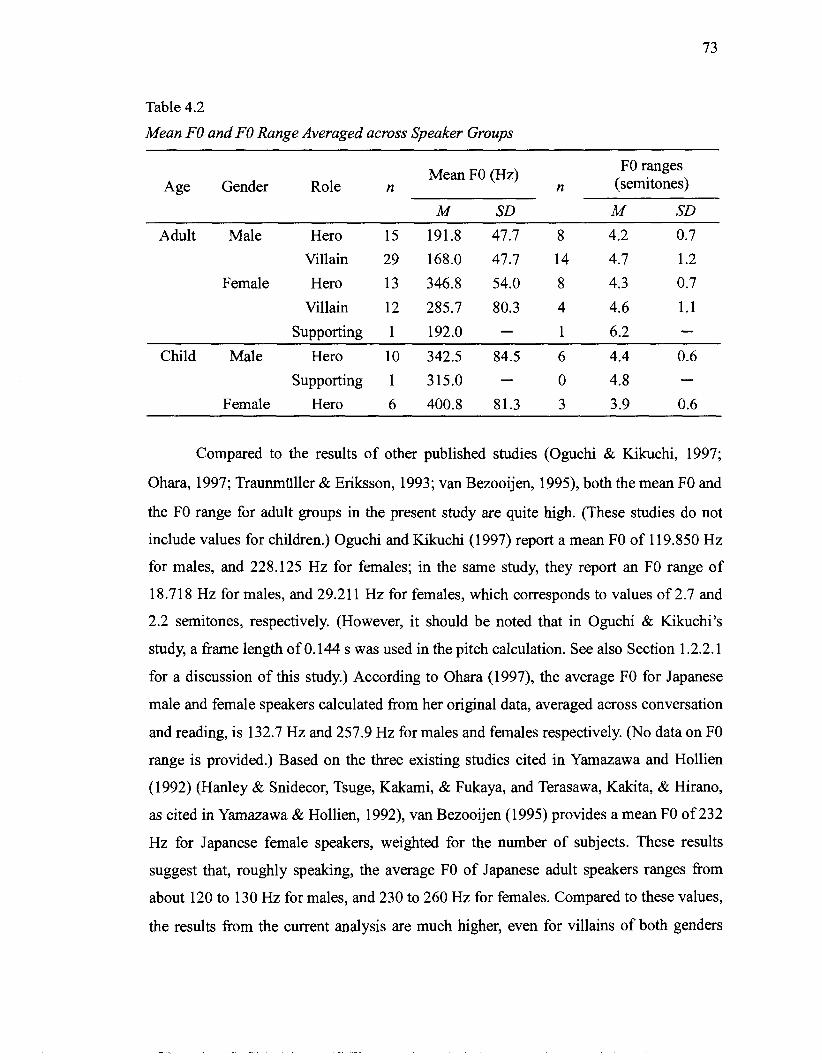
Table 4.2
Mean FO and FO Range Averaged across Speaker Groups
Mean FO (Hz) FO ranges Age Gender Role n n (semitones)
Adult Male Hero
Villain
Female Hero
Villain
Supporting
Child Male Hero
Supporting
Female Hero
Compared to the results of other published studies (Oguchi & Kikuchi, 1997;
Ohara, 1997; TraunmHller & Eriksson, 1993; van Bezooijen, 1999, both the mean FO and
the FO range for adult groups in the present study are quite high. (These studies do not
include values for children.) Oguchi and Kikuchi (1 997) report a mean FO of 11 9.850 Hz
for males, and 228.125 Hz for females; in the same study, they report an FO range of
18.7 1 8 Hz for males, and 29.2 1 1 Hz for females, which corresponds to values of 2.7 and
2.2 semitones, respectively. (However, it should be noted that in Oguchi & Kikuchi's
study, a frame length of 0.144 s was used in the pitch calculation. See also Section 1.2.2.1
for a discussion of this study.) According to Ohara (1997), the average FO for Japanese
male and female speakers calculated from her original data, averaged across conversation
and reading, is 1 32.7 Hz and 257.9 Hz for males and females respectively. (No data on FO
range is provided.) Based on the three existing studies cited in Yarnazawa and Hollien
(1992) (Hanley & Snidecor, Tsuge, Kakami, & Fukaya, and Terasawa, Kakita, & Hirano,
as cited in Yarnazawa & Hollien, 1992), van Bezooijen (1995) provides a mean FO of 232
Hz for Japanese female speakers, weighted for the number of subjects. These results
suggest that, roughly speaking, the average FO of Japanese adult speakers ranges from
about 120 to 130 Hz for males, and 230 to 260 Hz for females. Compared to these values,
the results fiom the current analysis are much higher, even for villains of both genders
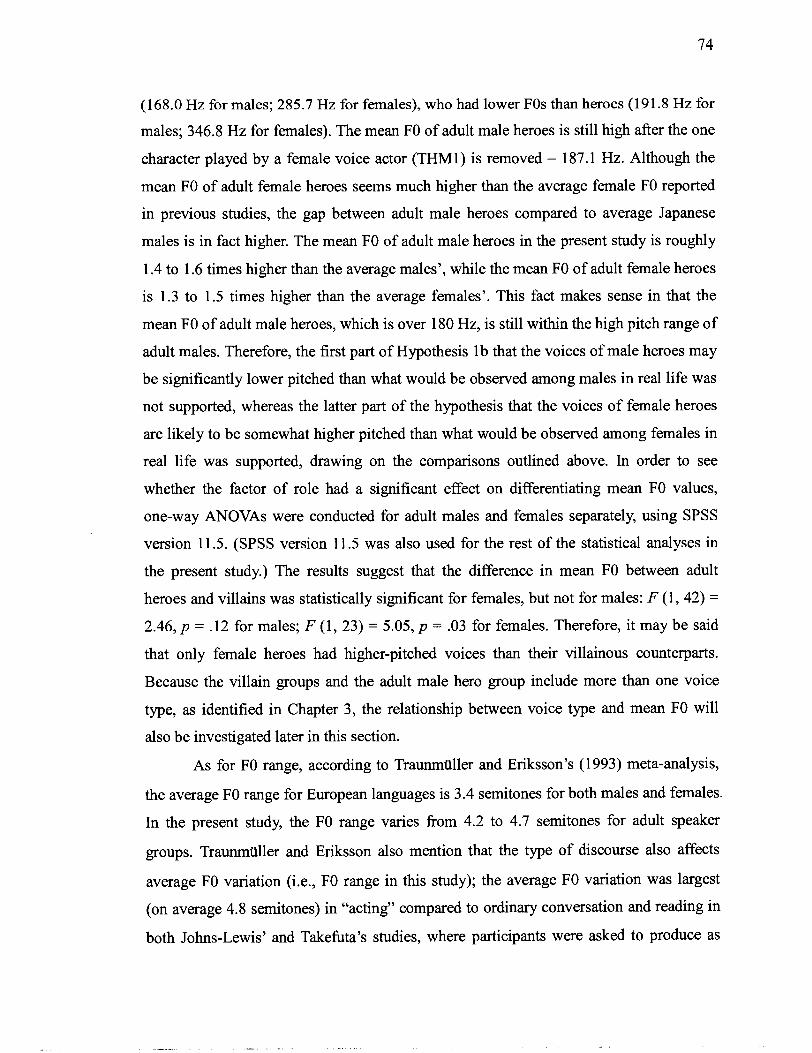
(168.0 Hz for males; 285.7 Hz for females), who had lower FOs than heroes (191.8 Hz for
males; 346.8 Hz for females). The mean FO of adult male heroes is still high after the one
character played by a female voice actor (THMI) is removed - 187.1 Hz. Although the
mean FO of adult female heroes seems much higher than the average female FO reported
in previous studies, the gap between adult male heroes compared to average Japanese
males is in fact higher. The mean FO of adult male heroes in the present study is roughly
1.4 to 1.6 times higher than the average males', while the mean FO of adult female heroes
is 1.3 to 1.5 times higher than the average females'. This fact makes sense in that the
mean FO of adult male heroes, which is over 180 Hz, is still within the high pitch range of
adult males. Therefore, the first part of Hypothesis lb that the voices of male heroes may
be significantly lower pitched than what would be observed among males in real life was
not supported, whereas the latter part of the hypothesis that the voices of female heroes
are likely to be somewhat higher pitched than what would be observed among females in
real life was supported, drawing on the comparisons outlined above. In order to see
whether the factor of role had a significant effect on differentiating mean FO values,
one-way ANOVAs were conducted for adult males and females separately, using SPSS
version 11.5. (SPSS version 11.5 was also used for the rest of the statistical analyses in
the present study.) The results suggest that the difference in mean FO between adult
heroes and villains was statistically significant for females, but not for males: F (1, 42) =
2.46, p = .12 for males; F (1, 23) = 5.05, p = .03 for females. Therefore, it may be said
that only female heroes had higher-pitched voices than their villainous counterparts.
Because the villain groups and the adult male hero group include more than one voice
type, as identified in Chapter 3, the relationship between voice type and mean FO will
also be investigated later in this section.
As for FO range, according to TraunrnUller and Eriksson's (1993) meta-analysis,
the average FO range for European languages is 3.4 semitones for both males and females.
In the present study, the FO range varies from 4.2 to 4.7 semitones for adult speaker
groups. Traunmiiller and Eriksson also mention that the type of discourse also affects
average FO variation (i.e., FO range in this study); the average FO variation was largest
(on average 4.8 semitones) in "acting" compared to ordinary conversation and reading in
both Johns-Lewis' and Takefbta's studies, where participants were asked to produce as
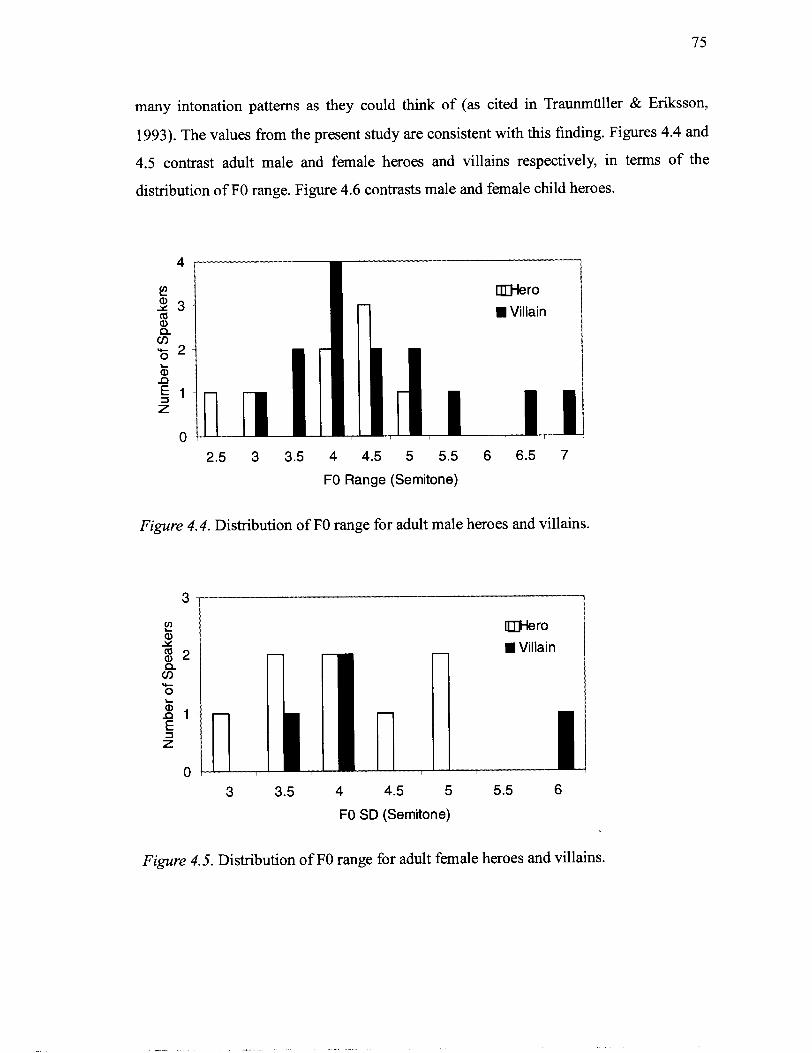
many intonation patterns as they could think of (as cited in Traunrnliller & Eriksson,
1993). The values from the present study are consistent with this finding. Figures 4.4 and
4.5 contrast adult male and female heroes and villains respectively, in terms of the
distribution of FO range. Figure 4.6 contrasts male and female child heroes.
4
C Hero 5 3 a W Villain a, Q cn + 2 0
b a 5' z
0 2.5 3 3.5 4 4.5 5 5.5 6 6.5 7
FO Range (Semitone)
Figure 4.4. Distribution of FO range for adult male heroes and villains.
Hero
W Villain
4.5 5 5.5 6
FO SD (Semitone)
Figure 4.5. Distribution of FO range for adult female heroes and villains.

3 3.5 4 4.5 5
FO SD (Semitone)
r Q) Y
g 2 - </) .c 0 L
Figure 4.6. Distribution of FO range for child male and female heroes.
Male Female
While the FO range for heroes of both age groups fall between the values of 2.5
and 5 semitones, there are three male villains and one female villain who fall outside this
range. Among the four, values for the two males with the widest FO ranges were 6.5 and
7.4 sernitones respectively, while the value for the female villain with the widest range
was 6.1 sernitones. That the distribution of FO range was wider for villains than for
heroes again confirms the hypothesis that the auditory and acoustic characteristics of
heroes' voices would be more salient and easier to generalize than those of villains, which
were presumed to have a wider range of deviation and to exhibit greater variety
(Hypothesis 3). One-way ANOVAs were carried out for adult males and females
separately and the results suggest that the factor of role did not have a significant effect
for either gender: F (1,20) = 1.40, p = .25 for males; F (1, 10) = 0.26, p = .62 for females.
Therefore, it can be said that part of Hypothesis la "heroes of both genders will have a
wide range of pitch and a wide range of articulatory movements" was not supported.
In the following, the mean FO according to voice type will be discussed. First,
Figure 4.7 shows the distribution of mean FO for adult male heroes, which includes three
voice types, Hero Types I and I1 and "other."
2 I - 1 E 3
O !
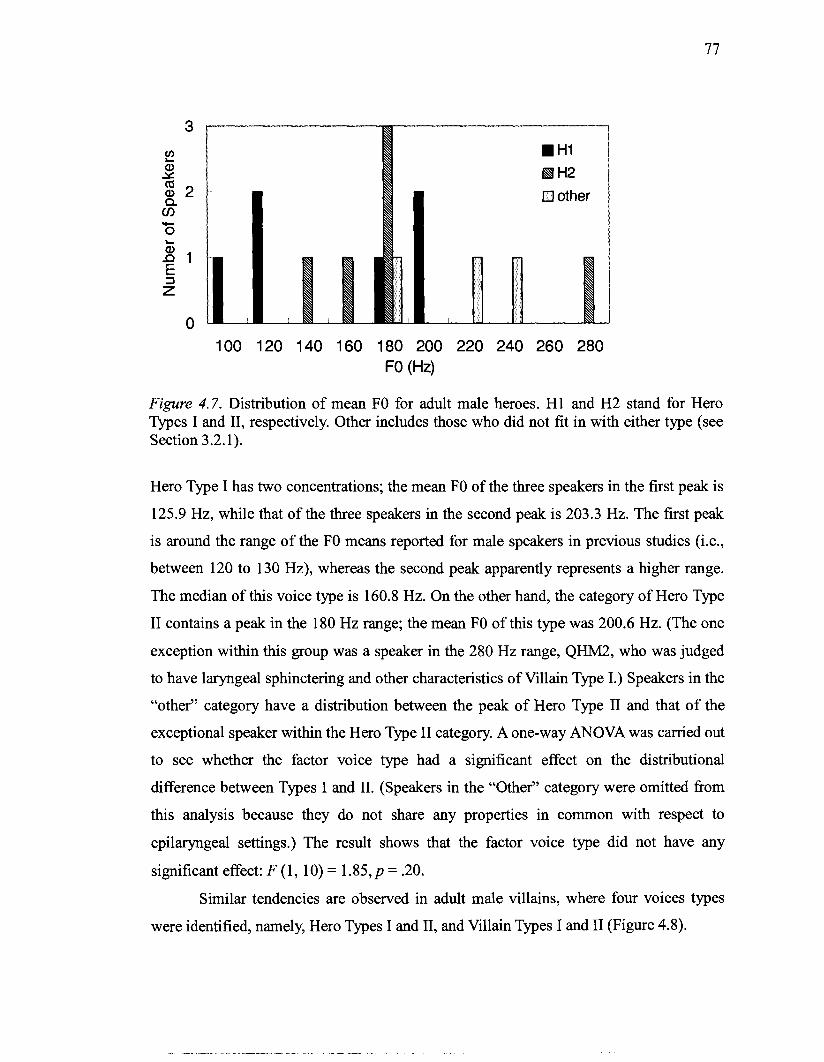
3
2 HI a Y a
N H2 cu 2 Q 0 other cn * 0
& 0 1 E s z
0 100 120 140 160 180 200 220 240 260 280
FO (Hz)
Figure 4.7. Distribution of mean FO for adult male heroes. H1 and H2 stand for Hero Types I and 11, respectively. Other includes those who did not fit in with either type (see Section 3.2.1).
Hero Type I has two concentrations; the mean FO of the three speakers in the first peak is
125.9 Hz, while that of the three speakers in the second peak is 203.3 Hz. The first peak
is around the range of the FO means reported for male speakers in previous studies (i.e.,
between 120 to 130 Hz), whereas the second peak apparently represents a higher range.
The median of this voice type is 160.8 Hz. On the other hand, the category of Hero Type
I1 contains a peak in the 180 Hz range; the mean FO of this type was 200.6 Hz. (The one
exception within this group was a speaker in the 280 Hz range, QHM2, who was judged
to have laryngeal sphinctering and other characteristics of Villain Type I.) Speakers in the
"other" category have a distribution between the peak of Hero Type I1 and that of the
exceptional speaker within the Hero Type I1 category. A one-way ANOVA was carried out
to see whether the factor voice type had a significant effect on the distributional
difference between Types I and 11. (Speakers in the "Other" category were omitted from
this analysis because they do not share any properties in common with respect to
epilaryngeal settings.) The result shows that the factor voice type did not have any
significant effect: F (1, 10) = 1.85, p = .20.
Similar tendencies are observed in adult male villains, where four voices types
were identified, namely, Hero Types I and 11, and Villain Types I and I1 (Figure 4.8).

80 100 120 140 160 180 200 220 240 260 280 FO (Hz)
Figure 4.8. Distribution of mean FO for adult male villains. HI, H2, V1, and V2 stand for Hero Types I and 11, and Villain Types I and 11, respectively.
It can be seen that voices within the category Hero Type I are concentrated in two peaks,
although the first peak (the 80 Hz range) contains only one speaker. In this speaker group,
Hero Type I1 seems to have two concentrations, namely the 140 Hz range and the 260 to
280 Hz range. Parallel tendencies are observed in villainous voice types as well: Villain
Type I, which is an extreme version of Hero Type 11, has a large peak in the 140 to 160
range and one speaker in the 260 Hz range, while for Villain Type 11, which represents an
extreme version of the Hero Type 11 category in terms of epilaryngeal states (not
necessarily in terms of supralaryngeal settings, however), the concentrations are in the
lower ranges - with the exception of one speaker, the members of this group fall within
the range of 100 to 120 Hz. When a one-way ANOVA was carried out with the four voice
types as a factor, the differences among these four types were not significant: F (3, 25) =
1.93, p = .15. However, when the two similar types across roles, namely Hero Type I and
Villain Type 11, and Hero Type I1 and Villain Type I, were combined, the difference
between the group with pharyngeal expansion (former) and the one with laryngeal
sphinctering (latter) was significant: F (1,27) = 5 . 6 2 , ~ = .03 (M for the former 139.0 Hz;
the latter 181.0 Hz). Thus, it can be said that the association between epilaryngeal states
and pitch seem to exist - higher pitch is associated with laryngeal sphinctering, lower
pitch with pharyngeal expansion. This is in agreement with the general tendency that
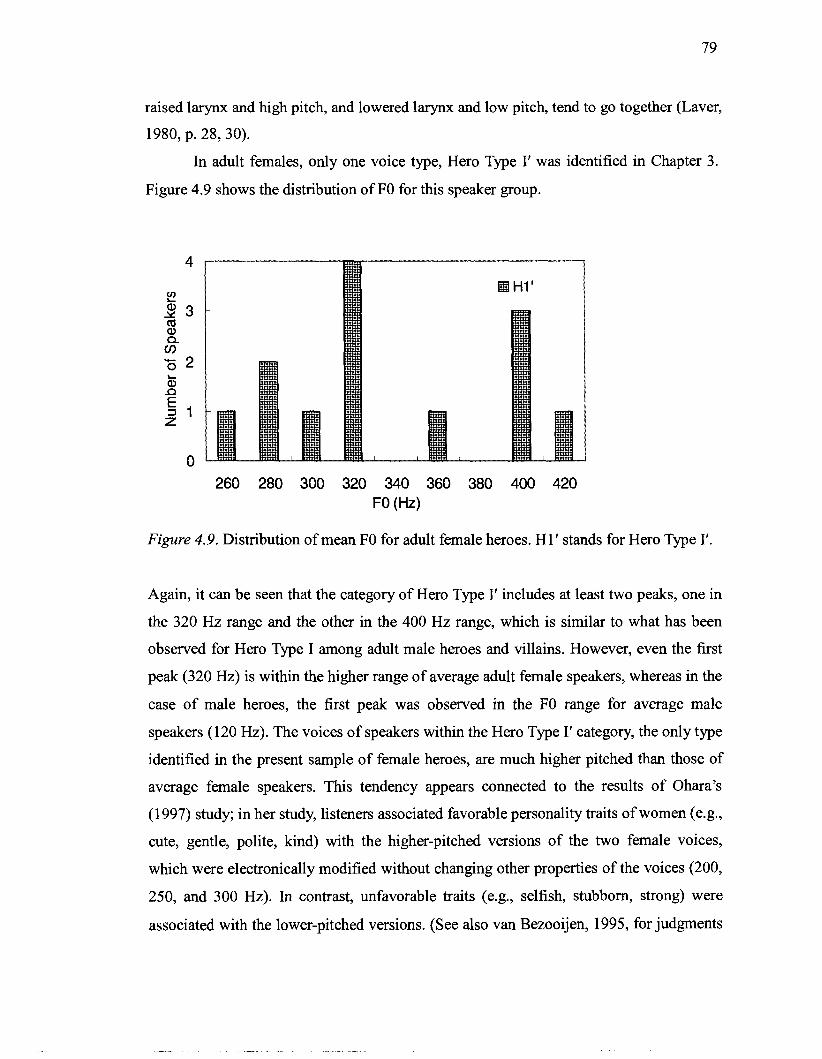
raised larynx and high pitch, and lowered larynx and low pitch, tend to go together (Laver,
1980, p. 28,30).
In adult females, only one voice type, Hero Type I' was identified in Chapter 3.
Figure 4.9 shows the distribution of FO for this speaker group.
260 280 300 320 340 360 380 400 420 FO (Hz)
Figure 4.9. Distribution of mean FO for adult female heroes. H1' stands for Hero Type I'
Again, it can be seen that the category of Hero Type I' includes at least two peaks, one in
the 320 Hz range and the other in the 400 Hz range, which is similar to what has been
observed for Hero Type I among adult male heroes and villains. However, even the first
peak (320 Hz) is within the higher range of average adult female speakers, whereas in the
case of male heroes, the first peak was observed in the FO range for average male
speakers (120 Hz). The voices of speakers within the Hero Type I' category, the only type
identified in the present sample of female heroes, are much higher pitched than those of
average female speakers. This tendency appears connected to the results of Ohara's
(1 997) study; in her study, listeners associated favorable personality traits of women (e.g.,
cute, gentle, polite, kind) with the higher-pitched versions of the two female voices,
which were electronically modified without changing other properties of the voices (200,
250, and 300 Hz). In contrast, unfavorable traits (e.g., selfish, stubborn, strong) were
associated with the lower-pitched versions. (See also van Bezooijen, 1 995, for judgments

of vocal attractiveness in Japanese and Dutch cultures.) This claim becomes more
convincing when the results for adult female heroes are compared with those for adult
female villains (Figure 4.10).
200 220 240 260 280 300 320 340 360 ' '
460
FO (Hz)
Figure 4.10. Distribution of mean FO for adult female villains. H 1 ', V 1, and V2 stand for Hero Type If, Villain Types I and 11, respectively.
In Figure 4.10, it is clear that Hero Type I' manifested only in a higher range (above 320
Hz). In this speaker group, it appears that Villain Type I, whose characteristic is laryngeal
sphinctering, had lower pitch than Villain Type 11, whose characteristic is pharyngeal
expansion. The range of Villain Type I is considered to be within the lower range of
Japanese female speakers. The mean FO of the adult female supporting role (LSF1) is also
close to this range (192.0 Hz). On the other hand, the range of Villain Type I1 is
considered to be within the average range of Japanese female speakers (220 to 260 Hz).
The result of a one-way ANOVA with the factor voice type revealed that the differences
in mean FO among the three voice types were statistically significant: F (2, 9) = 15.10,
p = .001. That Villain Type I had a lower range than Villain Type I1 is the reverse of what
was observed in male villains. Therefore, it can be said that for female speakers, the
relationships between high pitch and laryngeal sphinctering, and low pitch and
pharyngeal expansion respectively, do not seem to hold. It may be speculated that the fact
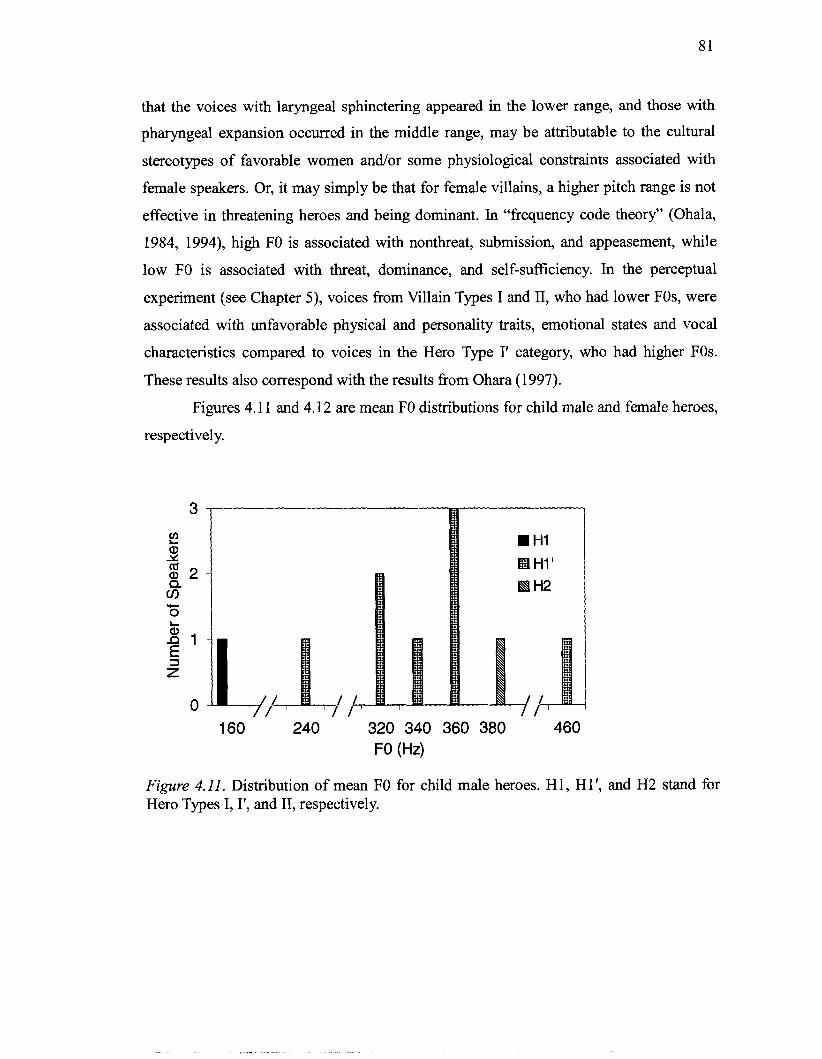
that the voices with laryngeal sphinctering appeared in the lower range, and those with
pharyngeal expansion occurred in the middle range, may be attributable to the cultural
stereotypes of favorable women andlor some physiological constraints associated with
female speakers. Or, it may simply be that for female villains, a higher pitch range is not
effective in threatening heroes and being dominant. In "frequency code theory" (Ohala,
1984, 1994), high FO is associated with nonthreat, submission, and appeasement, while
low FO is associated with threat, dominance, and self-sufficiency. In the perceptual
experiment (see Chapter 5) , voices from Villain Types I and 11, who had lower FOs, were
associated with unfavorable physical and personality traits, emotional states and vocal
characteristics compared to voices in the Hero Type I' category, who had higher FOs.
These results also correspond with the results from Ohara (1 997).
Figures 4.11 and 4.12 are mean FO distributions for child male and female heroes,
respectively.
160 240 320 340 360 380 460 FO (Hz)
Figure 4.11. Distribution of mean FO for child male heroes. H 1, H 1 ', and H2 stand for Hero Types I, If, and 11, respectively.

. . 300 320 340 360 480 500
FO (Hz)
Figure 4.12. Distribution of mean FO for child female heroes. HIf stands for Hero Type If.
In child male heroes, Hero Type I is the only character played by an adult male voice
actor (IHml). This character has a mean FO (165.3 Hz) comparable to those of adult male
heroes. The one character in the 240 Hz range is played by an adolescent male voice actor
(GHml). It can be said that the remaining characters, including the one categorized in
Hero Type I1 (OHml) and child female characters, had a comparable range of mean FO to
that observed for adult female heroes: there is one peak around 320 to 360 Hz and one
above 400 Hz - in these two speaker groups, 460 Hz in the case of males and 480 Hz and
500 Hz in the case of females. The one child supporting role (ASml) also had a mean FO
close to the first range (315.0 Hz). Although the second concentration is considerably
higher than the second for adult female heroes, roughly speaking, the FO ranges seen for
child heroes are comparable to those of adult female heroes. The result of a one-way
ANOVA with speaker group as a factor, excluding the two characters played by male
actors, revealed that these three groups did not differ significantly: F (2, 24) = 3.40,
p = .19.
In the foregoing section, the distribution of mean FO and FO range was considered
according to speaker group. It was revealed that the mean FO range did not differ between
heroes and villains, a finding which falsified part of Hypothesis la. However, the FO
range distribution was wider for villains than heroes, which can again be considered to
contribute a piece of evidence to Hypothesis 3 about villains having a wider range of
deviation and exhibiting greater variety. With regard to mean FO, it was found that both
adult male and female heroes were much higher pitched than real-life speakers. Therefore,
the first half of Hypothesis lb that the voices of male heroes may be significantly lower
pitched than what would be observed among males in real life was not supported,
whereas the latter part of the hypothesis that the voices of female heroes are likely to be
somewhat higher pitched than what would be observed among females in real life was
partially supported. It was also suggested that in male villains, the expected relationship
between pitch and epilaryngeal states was observed - those with laryngeal sphinctering
had higher FOs than those with pharyngeal expansion. However, among female villains,
this relationship did not hold; rather, female villains with laryngeal sphinctering had
lower-pitched voices than those with pharyngeal expansion. In order to further investigate
the relationship between pitch and epilaryngeal states, it would be necessary to gather
data from female and male informants.
4.3 Vowel Formant Analysis
In order to measure vowel formant frequencies, the formant plot function of
Wavesurfer, which is based on the linear predictive coding (LPC) analysis, was used. The
pre-emphasis factor was 0.7, and the analysis window length was 0.049 s. In this analysis,
three of the five Japanese vowels /a, i, u, e, o/ were selected for analysis, namely /a/ , /i/,
and 101. The vowel /a/ was thought to show the widest variety among different speaker
groups because it is the only low vowel in Japanese, and therefore, a wide range of
formant values for this phoneme would be unlikely to cause confusion with other
phonemes (i.e., decrease intelligibility). The vowel ti/ was selected to represent front
vowels. In the auditory analysis, lo/ in female heroes was noted to have a distinctive
quality compared to male heroes, and was therefore considered to be worth examining
acoustically. Due to the nature of the present corpus, which consists of 20 different
animated cartoons, it was not possible to measure the formant frequencies of vowels in
identical contexts in terms of neighboring consonants and vowels for each speaker.
However, measurements were consistently taken from approximately the centre of
vowels that lasted 50 ms or longer, where formant plots seemed to be stable. The first two

formants (F1 and F2) were measured for tokens that satisfied this condition. In the
formant plot function of Wavesurfer version 1.4.6, the first four formants were
represented as lines superimposed on the spectrogram, and the center of the vowel
portion was determined visually. Where possible, utterance-initial and utterance-final
vowels were avoided in order to ensure that measurements would be taken from the
portion most representative of the speaker. The same noise-free speech portions as used
for the pitch analysis were used for each speaker. One speaker's (SVMl's) speech
samples lacked an /i/ that satisfied the aforementioned conditions, and thus no value was
reported for this vowel of this speaker; otherwise, formant frequencies were measured
from one to five tokens for each vowel, depending on availability, and the mean was
taken for each vowel for each speaker. (For AVml, for the vowel /i/, the measurements
were taken &om the remaining noise-fiee portions outside the 30 s due to an undesirable
context for this vowel in the 30-s portion.)
Table 4.3
Mean and Standard Deviation of Fl and F2 for /a/, /i/, and /o/ Averaged across Speaker Groups
/a/ /if 101 Age Gender Role n
F1 F2 F1 F2 F1 F2
Adult Male Hero 15 M
SD
Villain 29 M
SD
Female Hero 13 M
SD
Villain 12 M
SD
Supporting 1 M
Child Male Hero 10 M 887.4 1684.9 392.8 2942.7 605.6 1213.5
SD 96.5 146.0 75.1 189.6 95.6 141.5
Villain 1 M 942.4 1822.4 313.1 2681.9 1353.2 606.5
Supporting 1 M 921.4 1766.9 378.6 2902.4 557.4 1218.6
Female Hero 6 M 941.6 2006.4 408.0 3036.2 684.1 1334.6
SD 63.6 123.9 78.6 215.1 95.4 130.2
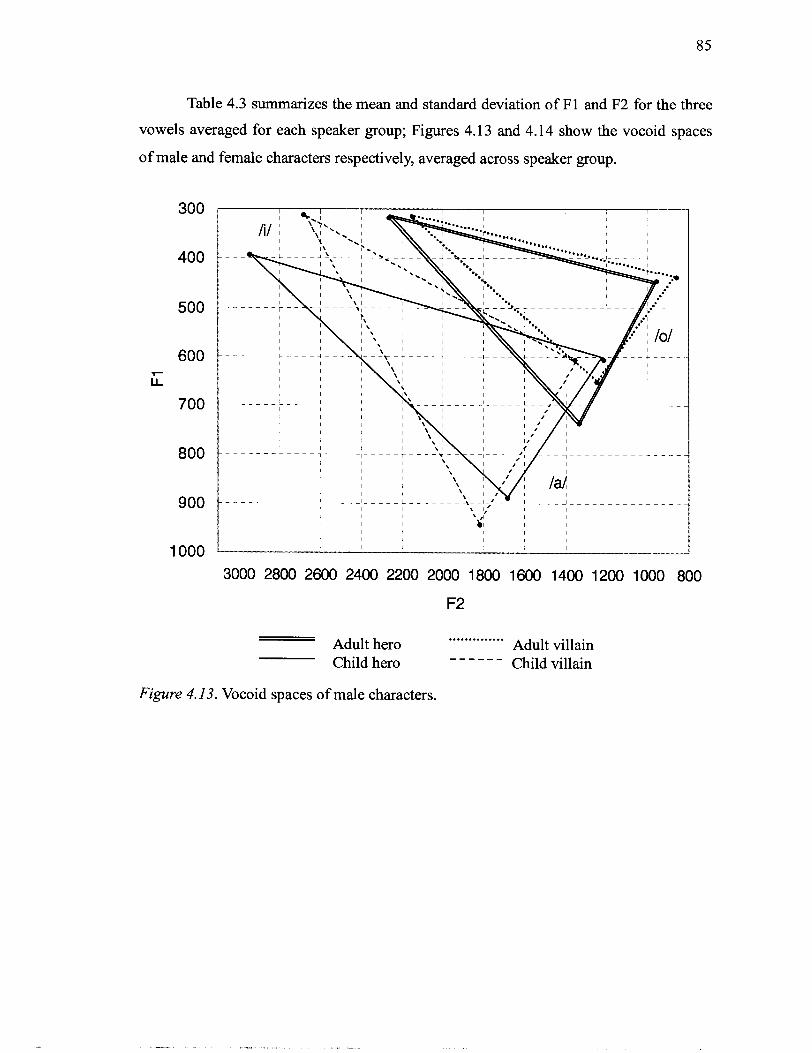
Table 4.3 summarizes the mean and standard deviation of Fl and F2 for the three
vowels averaged for each speaker group; Figures 4.13 and 4.14 show the vocoid spaces
of male and female characters respectively, averaged across speaker group.
Adult hero ........*.*... Adult villain
Child hero - - - - - - , Child villain
Figure 4.13. Vocoid spaces of male characters.

3100 2900 2700 2500 2300 2100 1900 1700 1500 1300 1100 900
F2 (Hz) Adult hero .......................... Adult villain
Child hero
Figure 4.14. Vocoid spaces of female characters.
Figure 4.15 represents the vocoid spaces of child and adult male and female
speakers in real life, based on values in reported in Nakagawa, Shirakata, Yamao, and
Sakai's (1980) study.
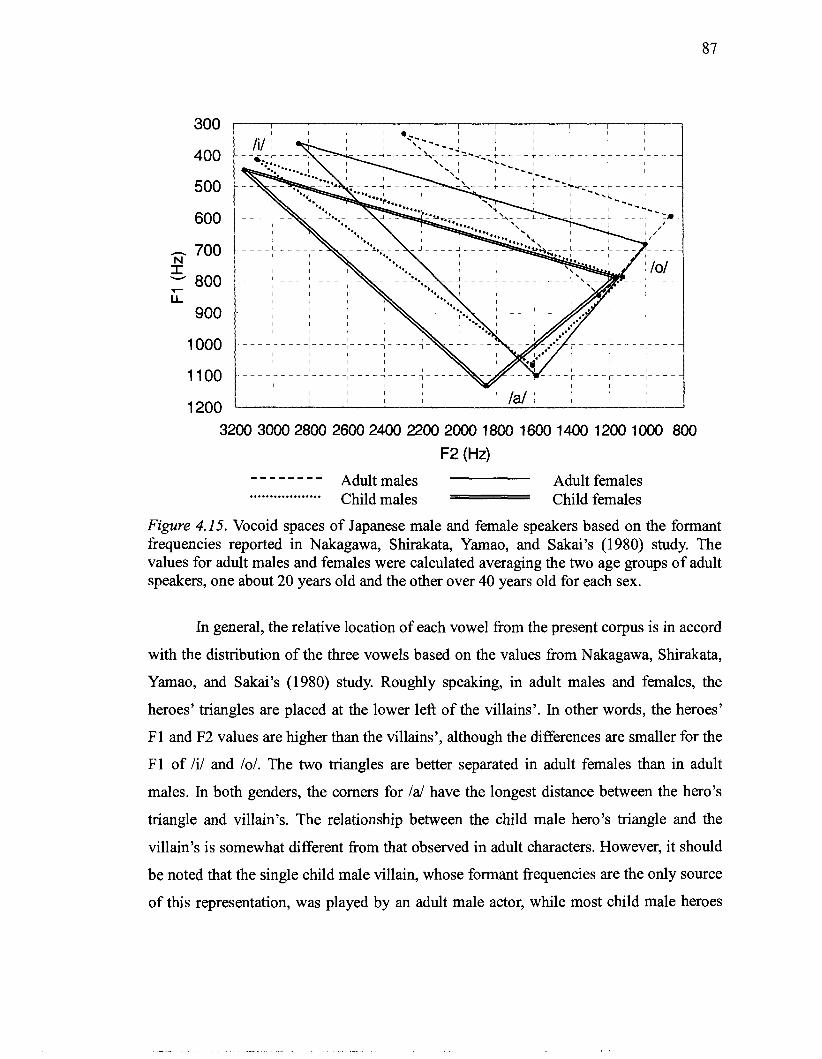
3200 3000 2800 2600 2400 2200 2000 1800 1600 1400 1200 1000 800
F2 (Hz) - - - - - - - - Adult males Adult females .................. Child males Child females
Figure 4.15. Vocoid spaces of Japanese male and female speakers based on the formant frequencies reported in Nakagawa, Shirakata, Yamao, and Sakai's (1980) study. The values for adult males and females were calculated averaging the two age groups of adult speakers, one about 20 years old and the other over 40 years old for each sex.
In general, the relative location of each vowel from the present corpus is in accord
with the distribution of the three vowels based on the values from Nakagawa, Shirakata,
Yamao, and Sakai's (1980) study. Roughly speaking, in adult males and females, the
heroes' triangles are placed at the lower lee of the villains'. In other words, the heroes'
F1 and F2 values are higher than the villains', although the differences are smaller for the
F1 of Iil and lo/. The two triangles are better separated in adult females than in adult
males. In both genders, the corners for /a/ have the longest distance between the hero's
triangle and villain's. The relationship between the child male hero's triangle and the
villain's is somewhat different from that observed in adult characters. However, it should
be noted that the single child male villain, whose formant frequencies are the only source
of this representation, was played by an adult male actor, while most child male heroes
were played by adult female actor^.^ The low F1 and F2 in the villain's /i/ may be
attributable to physiological constraints on the voice actor, as well as to personal
idiosyncrasy. It would be necessary to have many more speakers in the child male villain
group in order to be able to determine the source of the differences between child male
heroes and villains.
For adult females, the triangles of the hero and villain are almost parallel, with a
very slight difference in size. This may be because most female villains were judged to
share a fronted tongue body setting with female heroes. However, in males, greater
variety in the tongue body settings was observed, both for heroes and villains, and the
two triangles do not appear to be very similar. While the F1 of /i/ and /o/ are very close
for adult male heroes and villains, the Id's for the two groups are differentiated by both
Fl and F2; and therefore, the triangle for heroes seems larger than that for villains in the
direction of the y-axis. In other words, villains had a narrower F1 range than heroes: the
F1 difference between /a/ and Iil for heroes was 416.6 Hz while that for villains was
335.9 Hz - almost a 20% drop from heroes. This fact may be attributable to the close jaw
setting that was judged to be prevalent in villains (over 40%). According to the study by
Lindblom and Sundberg (as cited in Laver, 1980, p. 67), for a close jaw setting, a
markedly reduced F1 range was observed as well as a frequency drop in F1. However,
since male heroes' and villains' voices include different voice types, as identified in
Chapter 3, it is necessary to examine each voice type separately in order to determine the
source of the reduced F1 range. Except for the reduced Fl range in male villains, it is not
clear from Figures 4.13 and 4.14 that the hero has a larger vocoid space compared to the
villain, which would be the case if the hero had a wider range of articulatory movements.
Therefore, the latter part of Hypothesis l a that heroes of both genders would have a wide
range of articulatory movements was not supported, which results in rejecting this entire
hypothesis (see Section 4.2 for the former part). A series of one-way ANOVAs with role
as a factor were carried out separately for the two genders to see whether the differences
between heroes and villains were statistically significant. In adult males, the frequency
differences in F1 for /a/ and F2 for /o/ were significant: F (1, 42) = 6.37, p = .02 for F1
4 In addition, the fact that the FO of this speaker (AVml) was too irregular to measure due to the extreme harshness and accompanying constant aryepiglottic trilling (see Section 4.2) may be considered to have had some influence on the detection of vowel formant frequencies.
for /a/; F (l,42) = 7.09, p = .O1 for F2 for 101. F2 for /i/ was marginally insignificant (F (1,
42) = 3.79, p = .06). In adult females, the frequency differences in F2 for all three vowels
were significant: F (l,23) = 44.13, p < .001 for F2 for /a / ; F (l,23) = 6.5 1, p = .02 for F2
for /i/; F (l,23) = 11.63, p = .002 for F2 for 101. It can be said that except for F1 for /a/ in
adult males, the significant differences between heroes and villains lie in F2. The low F2
for villains is in agreement with a part of Hypothesis 2 about the acoustic properties of
villains' voices (i.e., a rising F1 and falling F2); however, an increase in F1 was not
confirmed. This can be attributable to the fact that more than one voice type was
identified for heroes and villains, and that combining different voice types existing in
each role would not show clear-cut differences between the two roles.
In male heroes, the child triangle appears similar to that of the adults', with the
latter being smaller and closer to the upper right comer, while in female heroes, this is not
the case: /i/'s are very close for these two groups; lo/ is differentiated mostly in F1, the
child's being higher than the adult's; and in /a/, the child's F1 and F2 are both higher than
the adult's. The difference in /a/ for these two groups may be attributable to the larger
population of the spread-lip setting in child female heroes (around 60% for the child
compared to around 40% of the adult); however, again, a closer examination is necessary
to determine the source of this difference. The difference between the adult and the child
is larger for males than for females probably because in males, the sexes of voice actors
differ between the two - except for a few characters, adults are played by males and
children are played by females - while in females, the sex of voice actors is the same.
The three speaker groups played by adult female voice actors were plotted together with
the adult male hero of Hero Type I for comparison (Figure 4.16).

3100 2900 2700 2500 2300 2100 1900 1700 1500 1300 1100 900
F2 (Hz)
- - - - - - - Adult males Adult females ................ Child males Child females
Figure 4.16. Vocoid spaces of adult female voice actors compared to that of adult male heroes (Hero Type I). The child male hero excludes the two characters played by male voice actors (GHml and IHml), and the female hero excludes the character pretending to be a boy in the story (KHfl), who was perceived by 94% of the participants as a child or adolescent male in the perceptual experiment (see Section 5.2.6 for details).
Although the absolute values are different between the two, roughly speaking,
Figures 4.15 and 4.16 are comparable despite the speech material difference - the former
fiom utterances of vowels in isolation (Nakagawa, Shirakata, Yamao, & Sakai, 1980) and
the latter fiom running speech. The generally lower Fls and higher F2s for cartoon
characters are considered to be common features of vowel formants in running speech.
For example, compared to Nakagawa et al.3 data, formant frequencies measured fiom
running speech of an adult female Japanese speaker exhibiting three different emotions
reported in Iida, Campbell, Higuchi, and Yasumura (2003) are also lower in F1 and
higher in F2 except F2 for 101 (about 70 Hz higher for Nakagawa et al.3 than for Iida et
al.3). However, even compared to Iida et al.'s data, the F2s for adult females in the

present corpus are higher, especially for lo/. The mean F2 for lo1 for adult females in the
present study is 375.7 Hz higher than that in Nakagawa et al.3 study. The auditory
impression of this vowel is in agreement with this value; adult female heroes had a
distinctive quality for lo/, which can be described as [el or [a]. It can be thought that this
quality was brought about by tongue fronting, which was judged to be present in all
speakers of this group. A similar quality was noted for child females as well; however,
presumably because of the higher F1 for this group, the impression of centralization was
less conspicuous. The high F2 for adult females makes the vocoid space of the adult
female very close to that of the child male. It can be said that the differences among the
three speaker groups played by adult female voice actors are most pronounced between
the child male and the child female. The high F1 for /a/ in the child male may be because
of the open jaw setting, which was judged to be shared by all speakers in this group. (The
two speakers excluded from this group for Figure 4.16 were the only speakers who were
not judged to have an open jaw setting.) The high F1 and F2 for /a/ in the child female
may be attributable to the open jaw setting and lip spreading shared by the majority of
speakers in this group - According to Fant, lip spreading also has the effect of raising
formant frequencies (as cited in Laver, 1980, p. 41).
Although the Fls for /a/ are comparable in the two genders of the child, the F2s
are considerably different between the two. It is interesting to note that the difference
between real-life male and female children in Figure 4.15 also appears to lie in the F2s of
/a/ and, to a lesser extent, in the Fls of the same vowel. Because of the F2, the space
between F1 and F2 also differs between two sexes both in real-life and cartoon speakers:
in Nakagawa, Shirakata, Yamao, and Sakai's study (1980), the reported difference was
541 Hz for boys and 727 Hz for girls; in the present study, the difference was 783.4 Hz
for child males (excluding the two characters played by male actors) and 1104.6 Hz for
child females (excluding the character who was perceived by 94% of the participants as a
child or adolescent male5). In other words, the boys' /a/ exhibits more a pharyngeal
quality than the girls'; alternatively, it may be said that the girls' /a/ is more palatalized
5 Including the characters eliminated from this calculation, the difference between F1 and F2 for child males and females is 797.5 Hz and 1060.9 Hz, respectively. The Fl-F2 difference for KHfl, the one eliminated from the female child group for this comparison is 866.3 Hz, closer to the child male.
than the boys'. It is possible that the voice actors used this difference intuitively, which
would make boy characters sound like boys and gr l characters sound like girls. Sachs,
Lieberman, and Erickson's (1973) study examining formant frequencies in child speech
in America, however, dismissed the possibility that the space between Fl and F2 for /a/
may be an important cue for sex identification of children. However, when Sachs et al.3
data of best and least identified voices are considered, it may be said that the difference
between the two sexes are in the same direction as in the present study. According to their
data, the difference between F1 and F2 for /a/ of best-identified boys and girls, calculated
from the mean F1 and F2 reported, are 426 Hz for boys and 61 1 Hz for girls.6
A series of one-way ANOVAs were carried out in order to examine whether the
observed differences among the three speaker groups played by adult female speakers
were statistically significant. Only the differences in F2 for /a/ were proved to be
significant: F (2, 23) = 10.20, p = .001. According to the result of Fisher's least
significant difference, the difference between adult and child females was not significant,
but the remaining differences (i.e., the difference between child males and females and
between child males and adult females) were significant.
Next, vowel formant frequencies will be examined according to voice type.
Figure 4.17 shows the vocoid space of adult males by voice type.
However, the difference between F1 and F2 in least identified boys and girls calculated based on Sachs, Lieberman, and Erickson's (1973) is 648 Hz for both sexes, which is higher than the value for best identified girls. While the least identified boys' value is understandable-being closer to the girls' value - there is still a question regarding the least identified girls' value.

F2 (Hz) Hero Type I - - - - - - - - - Hero Type I1
...................... Villain Type 1 Villain Type I1
Figure 4.1 7. Vocoid spaces of adult males by voice type. The heroes exclude the three speakers who were judged to belong to neither of the two heroic voice types.
First, Villain Type I1 is well differentiated from the rest for all three vowels, which is
thought to reflect the expanded pharynx adopted by speakers in this group; expanded
pharynx decreases formant frequencies. This result corresponds to the prediction about
Villain Type I1 voices stated in Section 3.4. The remaining three are not very well
differentiated except /a/ for Hero Type 11, which is higher both in F1 and F2 than the
other two. However, compared to Hero Type 11, Hero Type I has a low F1 and F2 for /a/
and a slightly low F1 for 101, which can again be considered to reflect pharyngeal
expansion within this speaker group and is in agreement with the prediction made in
Section 3.4. The decrease in F2 for 101 for Villain Type I compared to the other two may
be attributable to pharyngeal constriction, which would result in the approximation of F1
and F2. Since categorizing both speakers with pharyngeal constriction and those with
raised larynx may have confounded the trend in F2 of this voice type - pharyngeal
constriction would lower F2 while raised larynx would raise F2 - the 12 speakers in
Villain Type I were divided into two groups according to the scalar degrees assigned for
raised larynx, one with slight or intermittent raised larynx, the other one with moderate to
extreme raised larynx. The mean of F2 was calculated for each vowel in order to examine
whether F2 for the latter group was higher than the former. However, the formant
frequency differences between the two were negligible (between 6.7 and 17.7 Hz). Hero
Type I1 had only one speaker out of six who was judged to have consistent raised larynx,
and thus, it can be said that the majority of speakers in this group had pharyngealized
rather than raised larynx voice; however, it is Hero Type I1 that has the highest F2 for /a/.
Therefore, it may be thought that the lack of separation among the three voice types can
be attributed to factors other than epilaryngeal settings (the primary basis of voice type
classification in this study), possibly the effect of jaw settings. It is possible that the close
jaw setting prevalent in Villain Type I (observed in more than 75% of the speakers of this
group) suppressed the expected increase of F 1 in pharyngealized voice. Among the noted
differences among the four voice types, the following two were statistically significant
according to the results of a series of one-way ANOVAs with voice type as a factor: F1
for /a/ - F (3, 37) = 4.06, p = .01; F2 for lo/ - F (3, 37) = 3.36, p = .03. The results of
Fisher's least significant difference revealed that for both vowels, the differences between
Hero Type I and Villain Type 11, Hero Type I1 and Villain Type I, and Hero Type I1 and
Villain Type I1 were significant.
The same set of speakers were divided into three groups across two roles
according to the scalar degrees assigned for the openklose jaw settings - close jaw,
neutral, and open jaw groups. Figure 4.18 illustrates the vocoid spaces of the three groups
differing in degrees of jaw opening.
-
2300 2100 1900 1700 1500 1300 1100 900 700
F2 (Hz) ........................ Close jaw setting Neutral - - - - - - - - - - - Openjaw setting
Figure 4.18. Vocoid spaces of adult male speakers by jaw setting.
Not only are the differences between the three groups visibly clear in Figure 4.1 8, the
results of a series of one-way ANOVAs suggest that the three groups are significantly
different from each other in formant frequencies with the exception of Fl for /i/: F1 for
la1 - F (2, 38) = 14 .74 ,~ < .001; F2 for la1 - F (2, 38) = 5 . 8 6 , ~ = .006; F1 for lil- F (2,
37) = 2.65, p = .08; F2 for /i/ - F (2, 37) = 7.72, p = .002; Fl for lo/ - F (2, 38) = 7.52,
p = .002; F2 for lo/ - F (2, 38) = 6.64, p = .003. It would be somewhat strange if it were
the jaw settings alone that affected F2 frequencies, because it is known that jaw settings
affect F1 frequencies (Laver, 1980, p. 67). However, considering other supralaryngeal
settings that were often judged to be concomitant with the close jaw setting, such as
labialljaw protrusion and labial constriction, the low F2s of the close jaw group also
makes sense. These settings could have an acoustic effect similar to that of lip rounding -
a lowering of formant frequencies (Laver, 1980, p. 41). Similarly, with the open jaw
group, given that one of the concomitant supralaryngeal settings was tongue fronting, it

would be natural for the F2 of this group to increase.
Next, adult female speakers are examined by voice type, namely, Hero Type If,
Villain Types I and I1 (Figure 4.19).
F2 (Hz) Hero Type If ................ "...... Villain Type I Villain Type I1
Figure 4.19. Vocoid spaces of adult females by voice type. Villain Type I includes the adult female supporting role who was judged to have Villain Type I voice.
As was the case with males, Villain Type I1 has lower Fls and F2s than Hero Type 1',
which is what is expected from pharyngeal expansion in Villain Type 11, confirming the
prediction about Villain Type I1 voices in Section 3.4. The two triangles appear to be
similar in size and angle, which may be attributable to the shared tongue body setting,
tongue fronting. (Villain Type I does not have any speaker with fronted tongue body.)
However, Villain Type I, which is characterized by pharyngeal constriction, has slightly
lower Fl s than Villain Type I1 for /i/ and 101, and as for /a/, a markedly higher F1 and a
somewhat higher F2 compared to Villain Type 11. Since the F2s for all vowels for Villain
Type I are higher than those of Hero Type If, this may be accounted for by the pharyngeal
constriction, which lowers F2. The low Fls for /il and lo/ are not consistent with

predictions about the acoustic properties of this voice; it was expected that this voice type
would exhibit a high F1 caused by pharyngeal constriction. However, considering the
positive correlation between FO and lower formants observed in such studies are Iida,
Campbell, Higuchi, and Yasurnura (2003) and Maurer, Cook, Landis, and D'heureuse
(1991), the high Fl s for /i/ and lo/ for Hero Type 1', which had the highest mean FO of the
three (354.5 Hz as opposed to 212.5 Hz and 250.5 Hz for Villain Types I and 11,
respectively) can be explained. Thus, the genuine difference brought about by voice type
may be reflected only in /a/ as far as F1 is concerned. If that is the case, the highest F1 for
/a/ in Villain Type I can be explained by pharyngeal constriction as well. The results of a
series of one-way ANOVAs suggest that the differences in formant frequencies among
these groups are statistically significant for all except Fl for /i/: F1 for /a/ - F (2, 23) =
3.45,p=.05;F2forla/-F(2,23)=11.18,p<.001;F1 forlil-F(2,23)=.50,p=.61;
F2 for /i/ - F (2,23) = 8 . 9 5 , ~ = .001; Fl for lo/ - F (2,23) = 4 . 3 7 , ~ = .03; F2 for lo/ F (2,
23) = 5 . 7 9 , ~ = .009.
Comparing the two genders, it may be said that females were better differentiated
than males according to voice type. This may explain the fact that there were fewer
statistically significant differences between adult male heroes and villains than between
adult female heroes and villains. It is not only the fact that one more voice type was
identified for males, making the F1-F2 space for males more crowded, but also the fact
that Hero Type I and Villain Type I were not well differentiated by means of formant
frequencies, that seems to contribute to the less defined distinctions among the four voice
types.
So far, it has been shown that the heroic and villainous voice types identified in
the auditory analysis may be able to partially differentiate the voice types of cartoon
characters acoustically, especially between Villain Type I1 and the other voice types for
both genders. However, possibly because of the nature of the voice types, which consist
of a combination of settings other than epilaryngeal states, differentiation based on solely
voice type was not very successful. Next, vowel formant frequencies will be examined
according to tongue body setting, which can be thought to contribute to the overall
impression of voices most constantly among supralaryngeal settings.
The following are the figures representing vocoid spaces of adult male speakers

and female speakers, respectively, grouped by tongue body settings, separately for the
two roles (Figures 4.20 and 4.21). Speakers were divided into three groups according to
the rating for tongue body settings. Those who were rated as having f?onted tongue body
were categorized into the fronted group; those who were rated as having retracted tongue
body were placed in the retracted group; and those who were rated as having neutral
tongue body were classified as belonging to the neutral group. Tongue body raising was
disregarded since it occurred only with retraction in the current data. The two roles were
kept separate because it was thought that putting those with different epilaryngeal settings
together would obscure the difference between the three tongue body settings. It was
expected that the fronted group would be closer to the upper left (i.e., widely spaced
Fl-F2), the retracted group to the lower right (i.e., close Fl-F2), and the neutral group
between the two. However, this was not the case.
2300 2100 1900 1700 1500 1300 1100 900 700 F2 (Hz)
Hero fronted Hero neutral - - - - - - - - - - Villain fronted . . . . . .. . . . . . . . . . . . . . . . Villain neutral , , , - Villain retracted
Figure 4.20. Vocoid spaces of adult males by tongue body setting.

320030002800260024002200200018001600140012001000 800
F2 (Hz)
Hero fronted - - - - - - - - - - - Villain fronted .......................... Villain neutral - - - - Villain retracted
Figure 4.21. Vocoid spaces of adult females by tongue body setting.
In males, as far as F2 is concerned, while the relative locations of the heroes' vocoid
spaces may reflect the tongue body setting - the fronted group being higher than the
neutral group - this is not the case with villains: the neutral group is the rightmost in
males. However, this result may make sense when the superimposed supralaryngeal
settings are considered. The retracted group consists of mostly Villain Type I, which
entails pharyngeal constriction with possible raising of the larynx, whereas the neutral
group consists of different voice types. Of the ten speakers in the neutral group, six
speakers belong to groups that have pharyngeal constriction (i.e., Hero Type I1 and
Villain Type I) and four belong to groups with pharyngeal expansion (i.e., Hero Type I
and Villain Type 11). Therefore, the latter subgroup of four speakers with pharyngeal
expansion in the villain neutral tongue body group may have contributed to the lowering
the F2 seen in this group. Among the three villain groups, the fronted group has the
highest F2 for /a/ and lo/, which is expected for palatalization. A series of one-way
ANOVAs were carried out in order to see whether the noted differences among the five

groups by tongue body setting were significant, and the following were significant: F1 for
/a/ - F (4, 38) = 4.42, p = .005; F2 for /a/ - F (4, 38) = 3.29, p = .02; F2 for /il - F (4,
37) = 2 . 8 9 , ~ = .04; F2 for lo/ - F (4,38) = 4 . 9 7 , ~ = .003.
As for females, differences in F2 are not as obvious as in the case of males except
for the contrast between heroes and villains; among the three villain groups, the
differences are negligible. Rather, these three groups differ in F1. However, again, since
F1 is also influenced by FO, it may therefore be appropriate to compare the values only
for /a/. As for /a/ , the neutral and retracted groups, which consist of Villain Type I
exclusively, have the highest F1 possibly because of the pharyngeal constriction. That the
fionted villain group is lower in F2 than the hero counterpart group probably reflects the
difference in epilaryngeal states; the villain group (nine speakers) consists of five Villain
Type I1 speakers and four Hero Type I' speakers. Examining the data for both genders, it
may be concluded that tongue body settings may account for differences in vowel
formant frequencies when the epilaryngeal settings are neutral or engaged to a minor
degree; however, they are not powerful when epilaryngeal settings are fully engaged
(moderate to extreme). A series of one-way ANOVAs with tongue body settings as a
factor was carried out to see whether the noted differences in formant frequencies were
statistically significant. It was revealed that the differences were significant only in the
following two values: F2 for /a/ - F (3,22) = 1 2 . 0 6 , ~ < .001; F2 for lo/ - F (3,22) = 3.89,
p = .02
In the foregoing section, vowel formant frequencies of heroes and villains were
examined by role, voice type, jaw setting, and tongue body setting. It was found that the
significant differences between heroes and villains lie mostly in F2; villains had lower
F2s than heroes, which partially supports Hypothesis 2 that villains would have increased
F1 and decreased F2. However, one aspect of Hypothesis la - that heroes would have a
wide range of articulatory movements - was not supported based on the visual
examination of the vocoid spaces of heroes and villains; they were not very different
from each other. The examination of formant frequencies by voice type revealed that the
low F2s among villains could be attributable to pharyngeal expansion and, in the case of
females, also to pharyngeal constriction. The better distinction among voice types for
females was thought to have contributed to the better distinction between roles for

females. In the case of males, it was suggested that the close jaw setting accompanied by
labialljaw protrusion and labial constriction in villains might account for the small F1
range across vowels and the low F2s. Lastly, it was also suggested that tongue body
settings could account for variability in vowel formants when epilaryngeal states are
(close to) neutral, but that they might be overridden when epilaryngeal settings are
engaged more vigorously.
4.4 Spectrographic Analysis
The purpose of this section is to investigate the acoustic correlates of epilaryngeal
settings, examining the phonatory settings that interact with (or are predetermined by)
them. One of the acoustic effects that might be found among speakers exhibiting
laryngeal sphinctering is the resonance similar to the singer b formant, which appears at
around 3000 Hz (Sundberg, 1974). The speaker b formant has also been identified in
male actors' voices, however, at a slightly higher range of between 3 150 and 3700 Hz in
the study done by Nawka, Anders, Cebulla, and Zurakowski (1997). A similar
observation was done by Kuwabara and Ohgushi (1984) for Japanese male announcers'
voices; they found relatively high spectral energy between 3 and 4 kHz in the mean
spectral envelopes for announcers compared to non-professionals. Although the last two
studies were investigations of acoustic properties of resonant speaking voice, studies on
the singer's formant have been extensive and are based on acoustical modeling (Sundberg,
1974; Titze, 2001; Titze & Story, 1997). According to Titze (2001), the singer's formant
is created by the narrowing of the epilarynx tube (the laryngeal vestibule), which is
approximately 2-3 cm at the glottal end of the vocal tract. When narrowed, the epilarynx
tube acts as a separate resonator independent of the rest of the vocal tract, which also
results in shortening the entire vocal tract and raising the first two formants slightly. The
frequency of the quarter-wave resonance created by the epilarynx tube in isolation is
approximately 3000 Hz, which is close to the third and fourth formants of the remaining
vocal tract, and enhances the entire resonance by attracting those nearby formants. Based
on his findings, Titze (2001) encourages vocalists to narrow the epilarynx tube in order to
produce a more resonant and stronger sound, and in doing so, he gives the following
explanation:
Vocal hyperfunction is sometimes expressed as a squeezing together the tissues above the vocal folds, in particular the ventricular folds and, in some cases, the aryepiglottic folds.. . . But for the epilarynx tube to become narrow, the ventricular folds should not be approximated. On the contrary, they should be retracted laterally and flattened out (vertically) to create a wall (Titze, 2001, p. 528).
Titze and Story (1997) also suggest that the narrowed epilarynx tube would be used in
resonant speaking voice as well as in high-pitched operatic singing, belting, and twang
quality. While the present study is limited by a lack of physiological observation data to
support the auditory analysis results, it can nonetheless be assumed that the situations
similar to vocal hyperfunction described above would be the case with the speakers
categorized as having laryngeal sphinctering in the auditory analysis. However, it is not
expected that the spectrogram of every speaker who was judged to have laryngeal
sphinctering would have such a resonance. According to Titze (2001), when both the
pharynx and epilarynx tube are narrowed, as is the case with such singing styles as twang
and belting, because the area expansion from the epilarynx tube to the pharynx is less
abrupt, the singer's formant is less likely to occur. In this case, because of the coupling of
the epilarynx tube to the entire vocal tract, the epilarynx tube now mixes with all the
formants of the vocal tract, which results in more complicated source-tract interactions
(Titze & Story, 1997). Titze and Story predict that the narrowed pharynx will produce
some roughness in the waveform. It is expected that this would be the case with speakers
who exhibited moderate to extreme laryngeal sphinctering (i.e., Villain Type I of the
present study). As is suggested in Titze (2001) and Titze and Story (1997), it is also
possible to have an expanded pharynx and a narrowed epilarynx tube. Therefore, in the
present data, it would be predicted that some speakers who were judged to have expanded
pharynx may have had a narrowed epilarynx tube, and as a result, the spectrograms of
these speakers may exhibit a resonance at around 3000 Hz. This would be the case with
some speakers categorized in Hero Types I and I' and Villain Type 11.
However, testing the Sundberg model (1974) in vivo on three classically trained
singers using magnetic resonance imaging, strobolaryngoscopy, and acoustic analysis,
Detweiler (1994) obtained results that were inconsistent with the model: the pharynx to
epilarynx tube area ratio did not reach 6:l although the singer's formant was observed;
and the singer's formant remained robust in pulse register phonation, which caused the
ventricular space to extinguish and become non-functional. Therefore, Detweiler
concluded that the Sundberg model could not account for the singer's formant in the three
subjects of her study. However, according to Titze and Story (1997), the most efficient
area of the epilarynx tube is 0.5 cm2 to the pharynx area which varies around 2 cm2 (i.e.,
the ratio of 4:1), and the threshold for the epilarynx tube to be a separate resonator is 1
cm2. In Detweiler's (1997) study, the ratios observed for the two subjects were 2.9: 1 and
3.7: 1. Therefore, the values obtained for her subjects would still meet the threshold of the
Titze and Story model.
Another acoustic effect that might be found among speakers exhibiting laryngeal
sphinctering is strong upper harmonics, which may be observed in tense voice (Laver,
1980, p. 142; Van Dusen, 1941 ; Wirz, Subtelny, & Whitehead, 198 1).
In the following, spectrograms of male and female voice actors will be examined.
Additional FFT spectra will also be presented. For the FFT spectra, the Hamming
window was used; the pre-emphasis factor was 0.9. The speakers were chosen from each
of the heroic and villainous voice types, with precedence given to the characters used in
the perceptual experiment (Chapter 5). In this analysis, the speakers will be discussed
according to the sex of the voice actors instead of the characters, given that different
tendencies were observed for male and female voice actors (see Section 3.3). A window
length of 172 Hz was used for the spectrographic analysis. With this window length, the
spectrograms obtained for high-pitched female speakers were narrow-band, showing
harmonic structures more clearly. However, rather than widening the window length,
which would have obscured the spectrograms, the window length was kept constant
because the purpose of this analysis was not to observe formant structures in particular.
Figure 4.22. Spectrogram of Hero Type I voice (MHMl) uttering the phrase IjakenikuwaJi:na] "you know a lot, don't you?"
Figure 4.22 is a spectrogram of a Hero Type I voice (MHMl). In this phrase, the
voice sounded most resonant in the first syllable Gal, and it became breathier toward the
end of the utterance. This speaker was judged to exhibit slight breathiness (scalar degree
1). A closer examination of this voice in a playback of short phrases revealed that the
breathy utterance endings could have contributed to the judgment of breathy voice. The
breathy utterance ending was not peculiar to this speaker but was also prevalent among
other heroes of both genders in the present corpus. Figures 4.23 and 4.24 present FFT
spectra at the left and right cursors (approximately 0.05 s and 0.75 s), respectively.
Figure 4.23. FFT spectrum of fii(a)] in the phrase fiakenikuwasi:na] uttered by MHM1. The first glide was elongated and was pronounced as Lji].
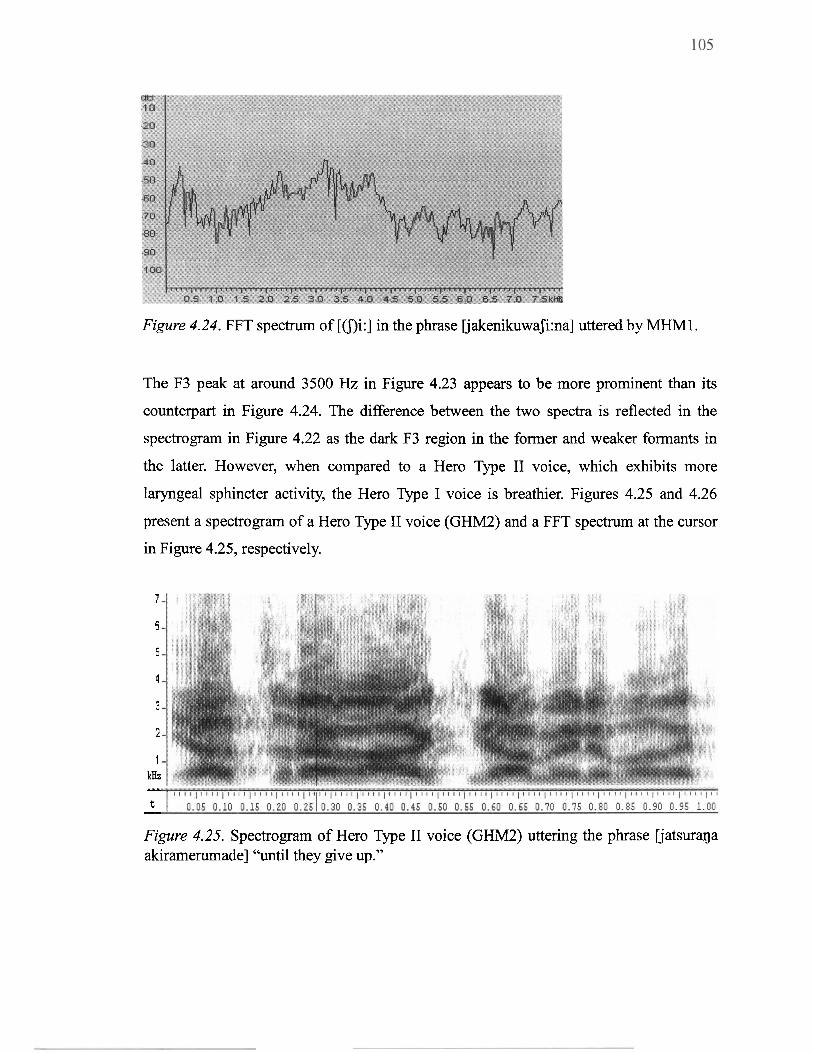
Figure 4.24. FFT spectrum of [mi:] in the phrase IjakenikuwaJi:na] uttered by MHM1.
The F3 peak at around 3500 Hz in Figure 4.23 appears to be more prominent than its
counterpart in Figure 4.24. The difference between the two spectra is reflected in the
spectrogram in Figure 4.22 as the dark F3 region in the former and weaker formants in
the latter. However, when compared to a Hero Type I1 voice, which exhibits more
laryngeal sphincter activity, the Hero Type I voice is breathier. Figures 4.25 and 4.26
present a spectrogram of a Hero Type I1 voice (GHM2) and a FFT spectrum at the cursor
in Figure 4.25, respectively.
7
6
5
4
3
2
1 kHz
t - Figure 4.25. Spectrogram of Hero Type I1 voice (GHM2) uttering the phrase Ijatsuraga akiramerumade] "until they give up."

Figure 4.26. FFT spectrum of [(g)a] in the phrase Ljatsuraga akiramerumade] uttered by GHM2.
It is clear from both the spectrogram and the spectrum that the vocal fold vibration was
periodic; vertical striations are observed throughout the frequency range in the
spectrogram (Figure 4.25) and strong harmonics are present up to high frequencies in the
spectrum (Figure 4.26). The energy decay in the high frequency range is much less in
GHM2 than in the FFT spectra of MHMl (Figures 4.23 and 4.24). (See also Figure 4.1 in
Section 4.1 for a spectrogram of another Hero Type I1 voice.) This observation
corresponds well to the acoustic correlates of tense voice. It may be possible to compare
the F4 peak (around 3300 Hz) and the F3 peak (3500 Hz) in MHMl (Figure 4.22) and
call them the speaker's formant; however, in the case of MHMl, the peak seems
prominent only when he projects his voice, therefore, it is not consistent. The next
spectrogram is a Villain Type I voice, which was judged to have extreme laryngeal
sphinctering accompanied by (presumably) aryepiglottic trilling.

t 1 0.05 0.10 0.15 0.20 0.25 0.3010.35 0.40 0.45 0.50 0.55 0.60 0.65
Figure 4.27. Spectrogram of Villain Type I voice (QVMI) uttering the phrase [ojuruJio] "please forgive me."
In this particular phrase, this speaker is asking his boss for forgiveness using a
high pitch; the vocal fold vibration was between approximately 250 and 350 Hz
according to the pitch analysis results. However, the secondary pulses can also be seen
between around 0.22 and 0.37 s. The secondary pulses seem to be around 90-1 00 Hz by
estimation (one cycle is 10 to 11 ms long). The two sources can be seen in the FFT
spectrum of this voice as well (Figure 4.28); the larger peaks appear to correspond to the
vocal fold vibration and its harmonics (around a 300-Hz interval) and small notches
generated by the secondary source are superimposed on the former. The vowel formants
do not appear to be prominent because of the aperiodic noise at the middle to high
frequency ranges. This observation is confirmed in the FFT spectrum as well; the
spectrum above 2.5 kHz is filled with noise instead of periodic harmonics.
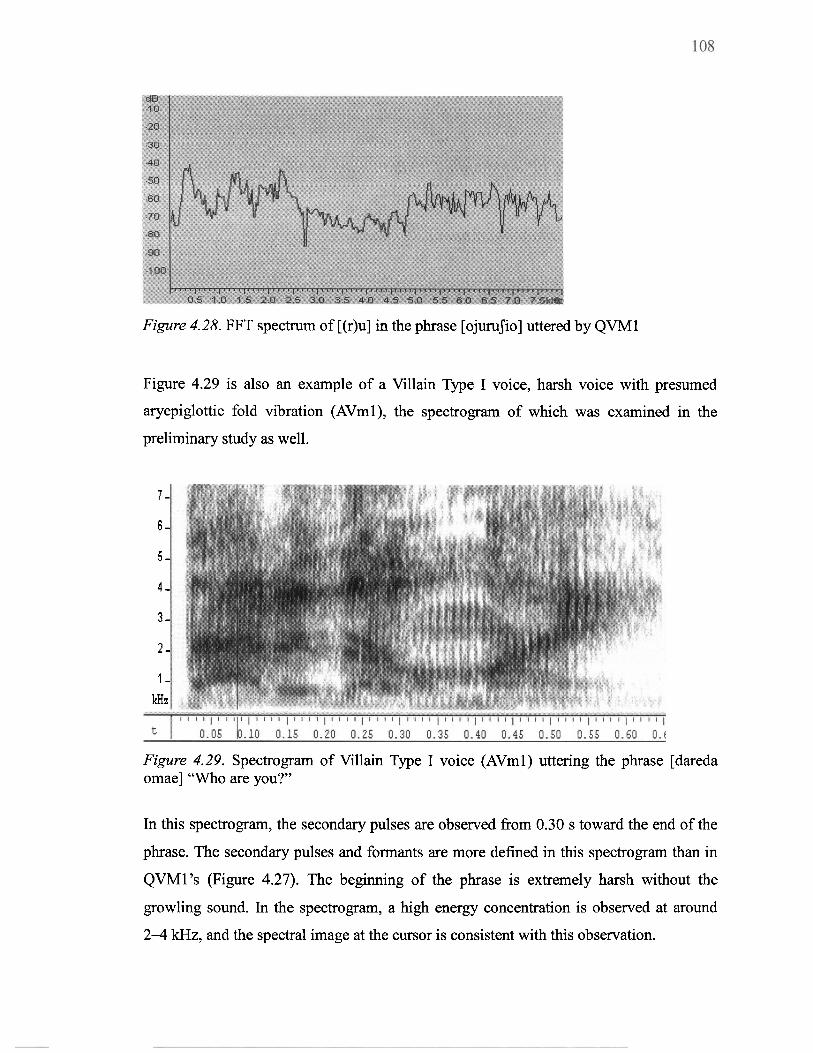
Figure 4.28. FFT spectrum of [(r)u] in the phrase [ojuruJio] uttered by QVMl
Figure 4.29 is also an example of a Villain Type I voice, harsh voice with presumed
aryepiglottic fold vibration (AVml), the spectrogram of which was examined in the
preliminary study as well.
7 -
6 -
5 -
4 -
3 -
2 -
1 - kHz
Figure 4.29. Spectrogram of Villain Type I voice (AVml) uttering the phrase [dareda omae] "Who are you?"
In this spectrogram, the secondary pulses are observed from 0.30 s toward the end of the
phrase. The secondary pulses and formants are more defined in this spectrogram than in
QVMl's (Figure 4.27). The beginning of the phrase is extremely harsh without the
growling sound. In the spectrogram, a high energy concentration is observed at around
2-4 kHz, and the spectral image at the cursor is consistent with this observation.
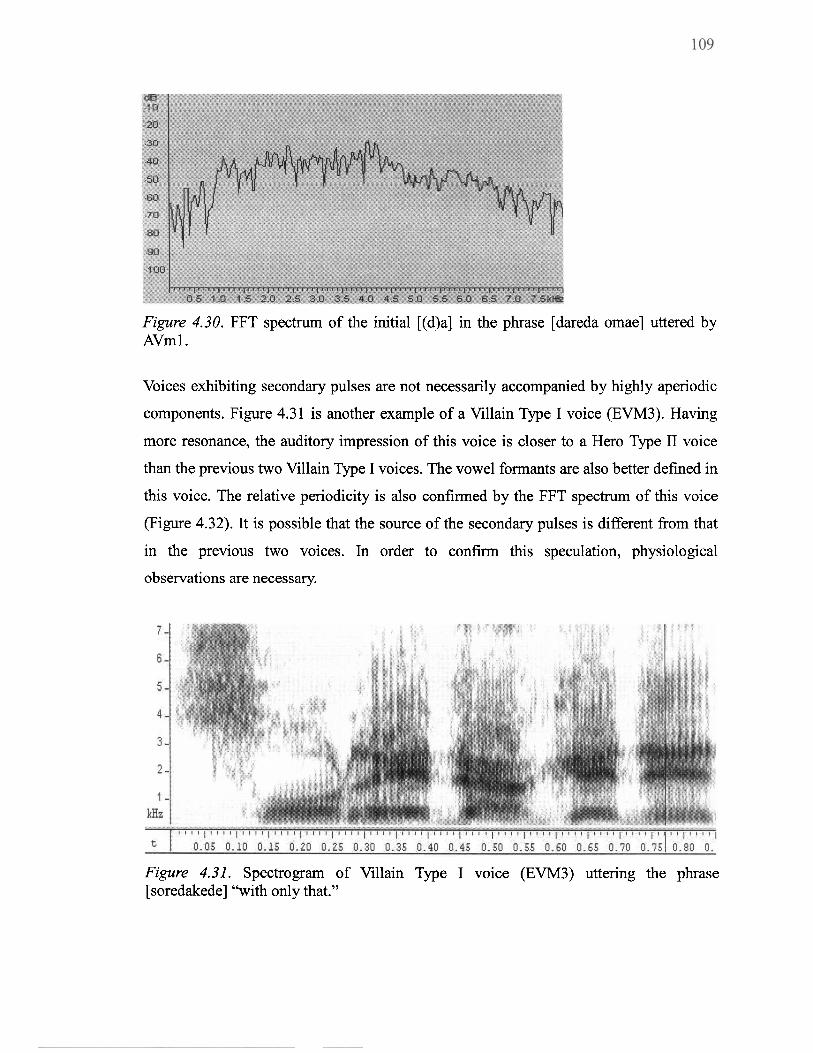
Figure 4.30. FFT spectrum of the initial [(d)a] in the phrase [dareda omae] uttered by AVm1.
Voices exhibiting secondary pulses are not necessarily accompanied by highly aperiodic
components. Figure 4.31 is another example of a Villain Type I voice (EVM3). Having
more resonance, the auditory impression of this voice is closer to a Hero Type I1 voice
than the previous two Villain Type I voices. The vowel formants are also better defined in
this voice. The relative periodicity is also confirmed by the FFT spectrum of this voice
(Figure 4.32). It is possible that the source of the secondary pulses is different from that
in the previous two voices. In order to confirm this speculation, physiological
observations are necessary.
Figure 4.31. Spectrogram of Villain Type I voice (EVM3) uttering the phrase [soredakede] "with only that."

Figure 4.32. FFT spectrum of [(d)e] in the phrase [soredakede] uttered by EVM3.
The last male voice actor's voice examined is a Villain Type I1 voice with
pharyngeal expansion accompanied by lowering of the larynx (Figure 4.33).
Figure 4.33. Spectrogram of Villain Type I1 voice (EVM1) uttering the phrase Gwijawa] "as for Julia."
The auditory judgment of this voice is that, in addition to the qualities mentioned above,
it is also accompanied by pharyngeal constriction, an articulatory configuration which is
similar to what Edmondson, Esling, Harris, Martin, Weisberger, and Blackhurst (2003)
found for hollow voice in Dinka (see Section 3.2.1). The FO of this phrase ranges
between 130 and 170 Hz, which is mid to high. This spectrogram resembles that of
GHM2 (Figure 4.25) in terms of formant definition. However, the energy loss at higher
frequencies seems greater than in GHM2; in that sense, this spectrogram also resembles

that of MHMl (Figure 4.22). The auditory impression of this voice is more resonant
compared to the last three villains' voices. The FFT spectrum at the cursor is also
presented in Figure 4.34, which is more periodic than the last three villains', resembling
GHM2 (Figure 4.26).
Figure 4.34. FFT spectrum of [(r)i] in the phrase burijawa] uttered by EVMI.
So far, the spectrograms and spectra of the four voice types identified in the auditory
analysis of male voices have been examined. Similarities and differences among the four
voice types were noted, referring to the epilaryngeal states of the speakers. It was
suggested that the slight laryngeal sphinctering appeared to better define the formants at
around 3000 to 3500 Hz, whereas the extreme sphinctering appeared to flatten the
spectral envelopes, filling the gaps between formants with spectral noise. In Chapter 1, as
part of Hypothesis 2, it was speculated that villains would exhibit increased
high-frequency energy. It was suggested that laryngeal sphinctering accounts for the
energy in the high frequency region. However, it can also be generally stated that for
Hero Type I1 (and I to a lesser extent) and Villain Type I1 voices, the high-frequency
energy would be comprised of periodic components from harmonics, whereas for Villain
Type I voices, the high-frequency components are more likely to be aperiodic noise.
Therefore, as for the prediction about increased high-fi-equency energy in villains' voices,
it should be noted that in the case of villains, it is likely to be aperiodic noise. The same
generalization can be made based on the female voice actors' voices later in this section.
Next, spectrograms and spectra of female voice actors' voices are examined.
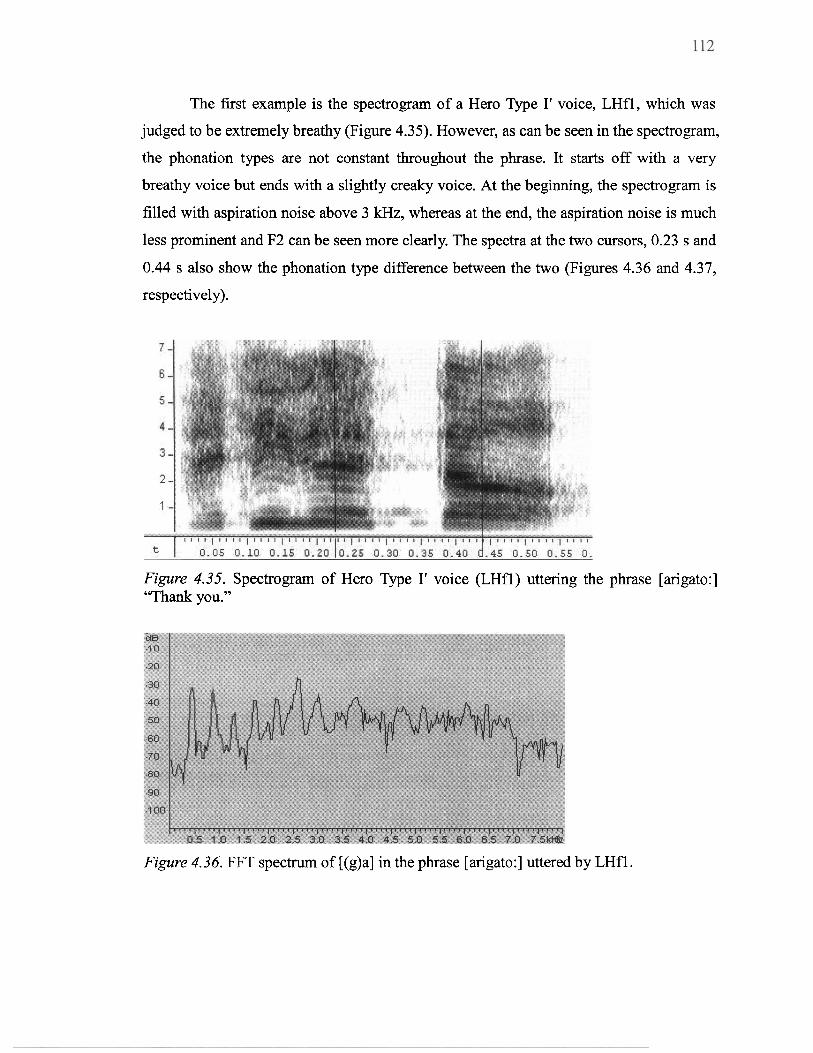
The first example is the spectrogram of a Hero Type I' voice, LHfl, which was
judged to be extremely breathy (Figure 4.35). However, as can be seen in the spectrogram,
the phonation types are not constant throughout the phrase. It starts off with a very
breathy voice but ends with a slightly creaky voice. At the beginning, the spectrogram is
filled with aspiration noise above 3 kHz, whereas at the end, the aspiration noise is much
less prominent and F2 can be seen more clearly. The spectra at the two cursors, 0.23 s and
0.44 s also show the phonation type difference between the two (Figures 4.36 and 4.37,
respectively).
Figure 4.35. Spectrogram of Hero Type I' voice (LHfl) uttering the phrase [arigato:] "Thank you."
Figure 4.36. FFT spectrum of [(g)a] in the phrase [arigato:] uttered by LHfl.

Figure 4.3 7. FFT spectrum of [(t)o:] in the phrase [arigato:] uttered by LHfl .
The next example is also a Hero Type I' voice (Figure 4.38); however, unlike
LHfl, this speaker was not judged to exhibit breathiness, and the auditory impression of
this voice was resonant. (This utterance again becomes very breathy at the end as was the
case with the utterance by MHM1.)
7 -
6.
5 -
4 .
3.
2 .
1.
kHz - t
Figure 4.38. Spectrogram of Hero Type I' voice (MHfl) uttering the phrase [gambatte] "Good luck" (modal voice).
The harmonic structures can be seen very clearly throughout the frequency range, which
is also confirmed by the spectrum at the cursor in the spectrogram. The prominent peak at
around 4300 Hz may correspond to the peaks observed between 3000 and 3500 Hz for
the male resonant voices (MHM 1, GHM2).

Figure 4.39. FFT spectrum of [(b)a] in the phrase [gambatte] uttered by MHfl (modal voice).
Compared to the last utterance, which was produced in an interaction with another hero,
the next utterance, which is exactly the same phrase by the same speaker, but this time,
saying it to herself praying for her friend's success, is much breathier, deviating from her
normal phonatory setting (Figure 4.40). The first formant is still prominent; however, the
upper formants do not show clearly and are replaced by aspiration noise. The spectrum
taken at the cursor (Figure 4.41) also illustrates the difference (see Figure 4.39). The
higher harmonics are now replaced by aspiration noise.
Figure 4.40. Spectrogram of Hero Type I' voice (MHfl) uttering the phrase [gambatte] "Good luck" (breathy voice).
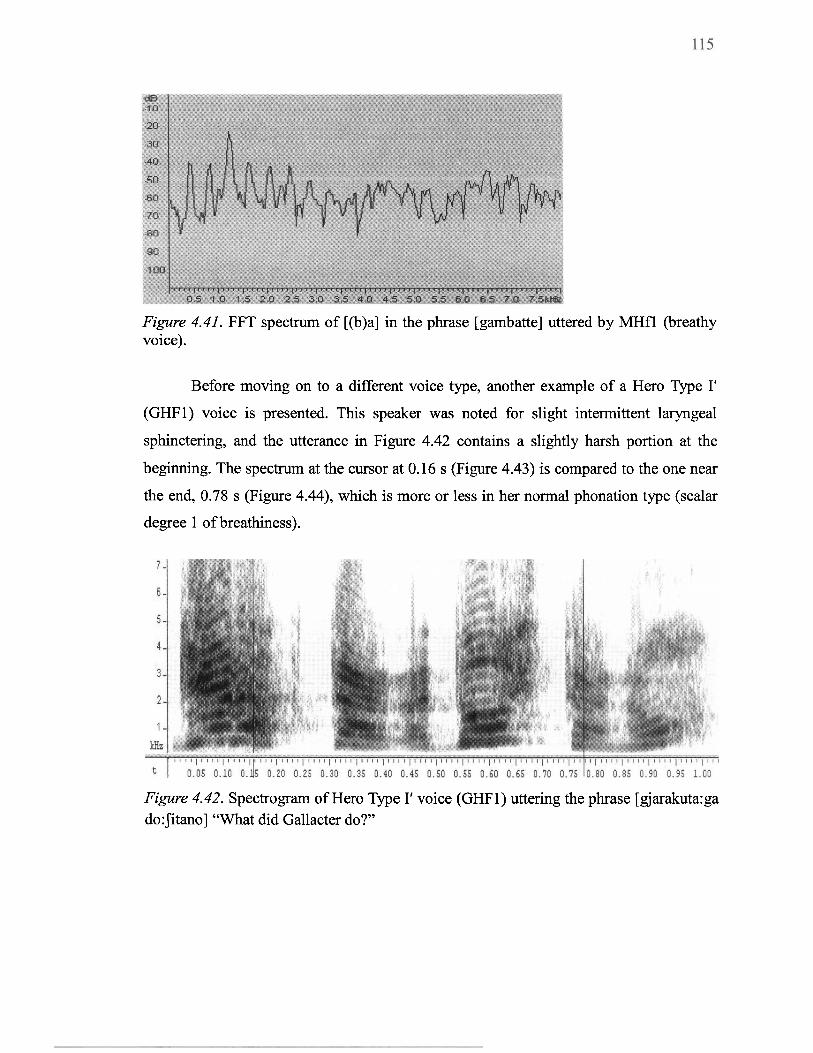
Figure 4.41. FFT spectrum of [(b)a] in the phrase [gambatte] uttered by MHfl (breathy voice).
Before moving on to a different voice type, another example of a Hero Type I'
(GHF1) voice is presented. This speaker was noted for slight intermittent laryngeal
sphinctering, and the utterance in Figure 4.42 contains a slightly harsh portion at the
beginning. The spectrum at the cursor at 0.16 s (Figure 4.43) is compared to the one near
the end, 0.78 s (Figure 4.44), which is more or less in her normal phonation type (scalar
degree 1 of breathiness).
Figure 4.42. Spectrogram of Hero Type I' voice (GHF1) uttering the phrase [gjarakuta:ga do:Jitano] "What did Gallacter do?"
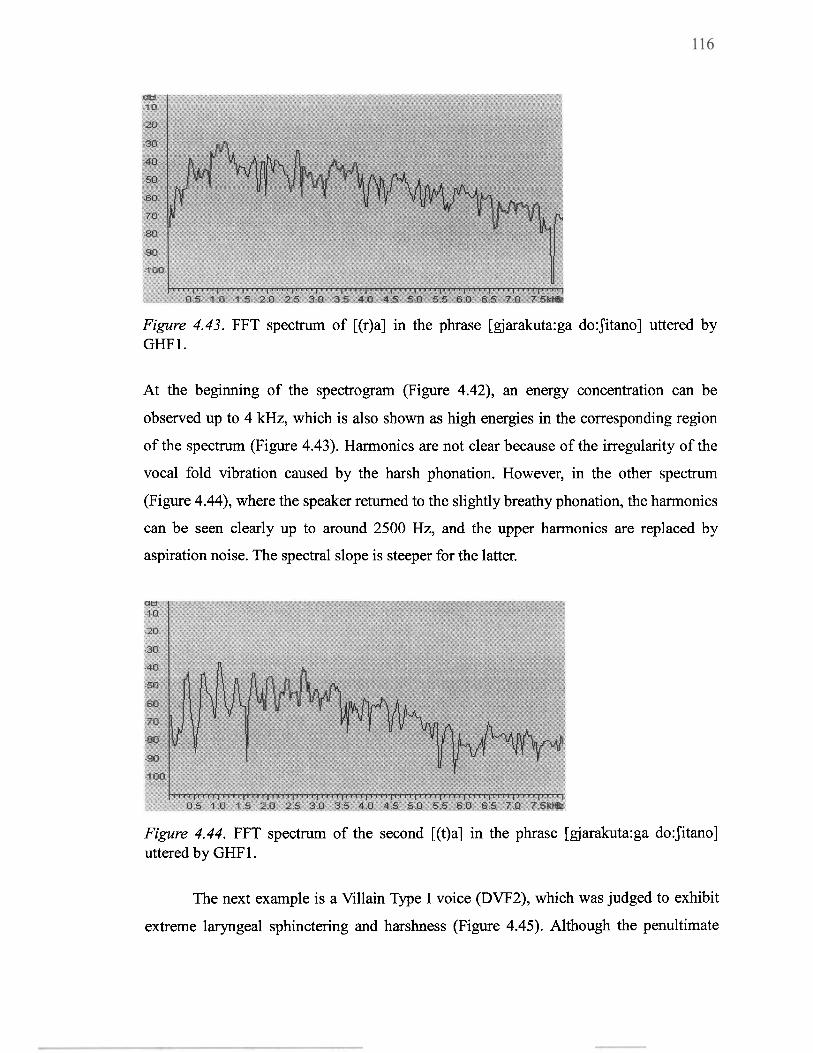
Figure 4.43. FFT spectrum of [(r)a] in the phrase [gjarakuta:ga do:Jitano] uttered by GHF 1.
At the beginning of the spectrogram (Figure 4.42), an energy concentration can be
observed up to 4 kHz, which is also shown as high energies in the corresponding region
of the spectrum (Figure 4.43). Harmonics are not clear because of the irregularity of the
vocal fold vibration caused by the harsh phonation. However, in the other spectrum
(Figure 4.44), where the speaker returned to the slightly breathy phonation, the harmonics
can be seen clearly up to around 2500 Hz, and the upper harmonics are replaced by
aspiration noise. The spectral slope is steeper for the latter.
Figure 4.44. FFT spectrum of the second [(t)a] in the phrase [gjarakuta:ga do:Jitano] uttered by GHF 1.
The next example is a Villain Type I voice (DVF2), which was judged to exhibit
extreme laryngeal sphinctering and harshness (Figure 4.45). Although the penultimate
spectrum was from a harsh portion of a Hero Type I' voice (GHFl), there is still a big gap
between the two voides auditorily and acoustically. The spectrogram of DVF2 (Figure
4.45) resembles the spectrograms of the two male Villain Type I voices exhibiting the
same auditory characteristics (i.e., extreme laryngeal sphinctering accompanied by
extreme harsh voice) in that it is filled with noise caused by the harshness (Figures 4.27
and 4.29). The formants are not prominent because the noise fills in the space between
them. Due to the extreme harshness, it is no longer possible to identi@ the harmonics
(Figure 4.46).
, , , I , I , I I , I I I I ^ " I X I X -
I " " I " " I " " I " " I " ' ' I " " I " " I t 8 , , I
t 0.05 0 . 1 0 0.151 0.20 0.25 0.30 0.35 0 . 4 0 0.45 0 . 5 0 0. .
Figure 4.45. Spectrogram of Villain Type I voice (DVF2) uttering the phrase [bakana] "stupid."
Figure 4.46. FFT spectrum of [(b)a] in the phrase [bakana] uttered by DVF2.
The next example is also a Villain Type I voice (ASml), who is a child male

supporting role; however, the auditory judgment and acoustic characteristics of this voice
are very different from the last one. This voice was judged to present moderate laryngeal
sphinctering without harshness. The spectrogram and spectrum of this voice (Figures
4.47 and 4.48, respectively) reveal that there are harmonics throughout the frequency
range, and there is no apparent noise. Therefore, this voice may be comparable to EVM3,
another Villain Type I voice discussed earlier that had prominent harmonic and formant
structures comparable to those of heroes (Figures 4.3 1 and 4.32).
Figure 4.47. Spectrogram of Villain Type I voice (ASml) uttering the phrase [rakugakisita] "(I) scribbled."
Figure 4.48. FFT spectrum of [(r)a] in the phrase [rakugawita] uttered by ASml.
Despite the regular harmonics, the participants in the perceptual experiment rated this
voice as negatively as real villains of the same voice type (see Table 5.4 in Section 5.2.2).
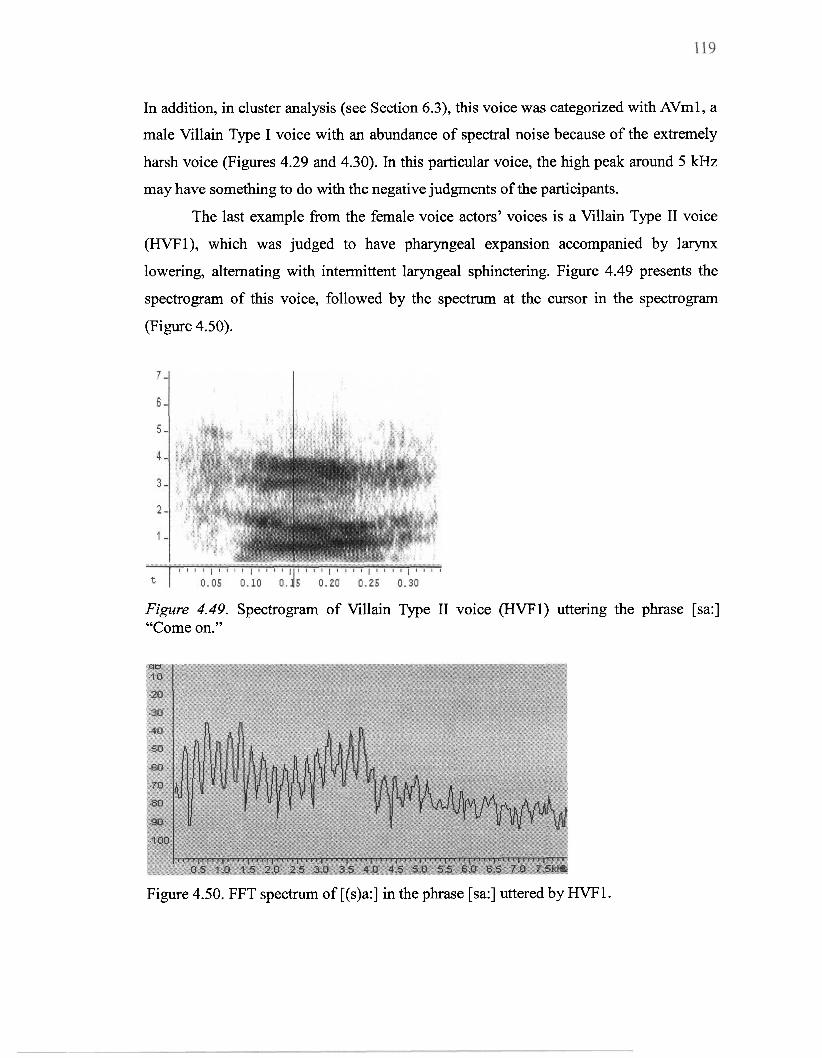
In addition, in cluster analysis (see Section 6.3), this voice was categorized with AVml, a
male Villain Type I voice with an abundance of spectral noise because of the extremely
harsh voice (Figures 4.29 and 4.30). In this particular voice, the high peak around 5 kHz
may have something to do with the negative judgments of the participants.
The last example from the female voice actors' voices is a Villain Type I1 voice
(HVFI), which was judged to have pharyngeal expansion accompanied by larynx
lowering, alternating with intermittent laryngeal sphinctering. Figure 4.49 presents the
spectrogram of this voice, followed by the spectrum at the cursor in the spectrogram
(Figure 4.50).
Figure 4.49. Spectrogram of Villain Type I1 voice (HVFI) uttering the phrase [sa:] "Come on."
Figure 4.50. FFT spectrum of [(s)a:] in the phrase [sa:] uttered by HVF1.

As was the case with EVM1, a male Villain Type I1 voice, this voice also exhibits fairly
strong harmonics up to around 4 kHz. It is also possible that this voice may be also
accompanied by a slight constriction at the aryepiglottic sphincter as well as lowering of
the larynx. The first four formants also appear very clearly in this voice. It should also be
noted that the female voices that contain strong harmonics (MHfl, ASml, and HVF1)
were ranked the highest in terms of loudness in the perceptual experiment (see Section
6.2.3).
In this section, spectrograms and spectra of the heroic and villainous voice types
were examined. Although strong F3 and F4 in heroes' voices and Villain Type I1 voices
were observed, there was no clear evidence about the speaker P formant. As for the voices
exhibiting laryngeal sphinctering, increased energy at higher frequencies was observed,
which was in agreement with the acoustic correlates of tense voice (Laver, 1980, p. 142;
Van Dusen, 1941 ; Wirz, Subtelny, & Whitehead, 198 1) and part of Hypothesis 2. It was
suggested that Villain Type I voices may be subcategorized according to the definition of
harmonics and formants and the amount of spectral noise. The possibility that slight
aryepiglottic sphinctering may be involved in Villain Type I1 voices with pharyngeal
expansion was mentioned, suggesting that this particular articulatory combination may be
responsible for why they were similar to the spectrograms of the Hero Type I and I1
voices.
Chapter 5 Perceptual Experiment
5.1 Method
As discussed in Section 1.2.2, people can infer the personality traits, physical
traits, vocal traits and emotional states of speakers upon listening to a voice. Numerous
studies have examined the acoustic properties of attractive voices (Aronovitch, 1976;
Collins, 2000; Oguchi & Kikuchi, 1997; Zuckerman & Miyake, 1993), while others have
correlated expert ratings of the auditory characteristics of voices with impressions of the
gender identities and/or personality traits of speakers (Biemans, 1998; van Bezooijen,
1988). A number of other studies have been conducted using voices that have been
manipulated by computer programs or the systematic control of speakers (Addington,
1968; Lee & Boster, 1992; Nass & Lee, 2001; Ray, 1986; Uchida, 2000; van Bezooijen,
1995). However, to my knowledge, no study has attempted to control vocal stimuli by
presenting voices to listeners that have been classified by experts as reflecting meaningful
phonetic units, based on auditory analysis. The auditory analysis results, as described in
Chapter 3, revealed that epilaryngeal settings play an important role in defining types of
heroic and villainous voices. Thus, it is of interest to investigate whether epilaryngeal
settings contribute to laypersons' perceptions of good and bad characters. In order to do
so, Japanese laypersons' perceptions of selected speech samples were examined in an
experimental setting.
In Chapter 3, it was suggested that the distribution of epilaryngeal and phonatory
settings (i.e., laryngeal sphinctering, pharyngeal expansion, breathy voice, and harsh
voice) differed according to the sex of voice actors. At the same time, however, voices
played by female actors were judged to have different articulatory settings depending on
the gender of the characters: lip spreading and breathiness ratings differed between the
two genders. Therefore, while the sex of voice actors appears to control the range of
voices they produce, female voice actors also seem to compensate for the differences in
vocal characteristics attributable to sex (and possibly age) using certain vocal maneuvers.
Thus, in this perceptual experiment, laypersons were asked to judge what types of roles
voice actors were attempting to portray, based on their impressions of the gender, age,
physical traits, personality traits, emotional states, and vocal characteristics associated
with the perceptual stimuli.' The following subsections describe the method of stimuli
preparation, the experiment participants, and the experimental procedure.
5.1.1 Content-Masking Technique
In order to elicit listeners' responses to the voices independent of verbal content, it
was necessary to mask the contents of the speech samples. The following
content-masking techniques, along with their effects on expert ratings and laypersons'
perceptions have been proposed and studied: low-pass filtering, random splicing,
backward speech, pitch inversion, tone-silence sequences, and reiterant speech (Friend &
Farrar, 1994; Scherer, Feldstein, Bond, & Rosenthal, 1985; van Bezooijen & Beves,
1986). According to Scherer et al. (1985) and van Bezooijen and Beves (1986), of these
techniques (with the exception of reiterant speech, which was investigated by Friend and
Farrar, 1994), random splicing is the only one that retains voice quality information:
which is the focus of the present study. In random splicing, speech samples are divided
into small segments (250 ms is conventional) and rearranged in an order different fiom
the original. (See Section 5.1.2 for details.) In van Bezooijen and Beves' (1986) study,
where the effects of random splicing and low-pass filtering on expert ratings of voice
quality and prosodic settings were investigated, random splicing was found to retain
information pertaining not only to voice quality features such as harshness, creak,
whisper, denasality, and pharyngeal constriction, but also to prosodic features such as
pitch level and loudness. Although Friend and Farrar (1994) do not discuss the effects of
reiterant speech, this technique, which involves replacing the syllables of the original
speech with three meaningless syllables ([ba], [ma], or [sa]), appears to reduce a
1 Throughout this study, the term item is used to refer to personality and other attributional traits used in the questionnaire, whereas the use of the term stimulus is restricted to the stimulus tokens used in the perceptual experiment. 2 Intuitively, backward speech seems to retain voice quality information as well. In their experiment using backward speech, Munro, Derwing, and Burgess (2003) suggest that listeners may have used voice quality to detect foreign accent. However, Scherer Feldstein, Bond, and Rosenthal (1985) speculate that this technique may distort voice quality information, based on their experimental results. They found that of the two personality trait factors they investigated (dishonest vs. honest), dishonest speech was rated consistently more favorably than honest speech in the backward speech condition - a finding that was opposite to that in the forward speech condition. Since the majority of trait items used in the present study were of personality traits, it was decided that the random-splicing technique would be used. It would be interesting to see whether comparable results would be obtained using backward speech stimuli.
significant amount of voice quality information. Therefore, to investigate the effects of
voice quality produced with various epilaryngeal states, random splicing appears to be
the best technique. As shown in Section 5.1.2, the perceptual stimuli used in this
experiment were prepared using this technique.
It should be noted, however, that three studies have suggested that the random
splicing technique may introduce systematic biases to perception. Comparing the effects
of the three conditions, original, low-pass filtering and random splicing on expert ratings
of voice quality and prosody, van Bezooijen and Beves (1986) found that along with an
overall tendency towards higher ratings for most of the voice quality and prosodic items
rated, pitch level was rated significantly higher in the random splicing condition than in
the original condition. Scherer, Feldstein, Bond, and Rosenthal (1985) examined the
effects of random splicing and four other masking techniques on deception detection.
They found that impressions of "relaxed" were rated higher in the dishonest condition
than in the honest condition, while other personality traits were rated comparably with the
original forward playing mode - that is, in the latter mode, the honest condition was rated
higher than the dishonest condition. Scherer et al. speculate that the perception of
"relaxed" may depend on factors such as pausing and tempo, which are lost in random
splicing. Lastly, Friend and Farm (1994) studied the effects of low-pass filtering, random
splicing, and reiterant speech on judgments of the speaker's affective states; they found
that random splicing increased ratings of anger and excitement. Thus, it is necessary to
interpret the results of the present study with caution, especially personality, emotion, and
vocal trait items related to those mentioned above.
5.1.2 Stimuli
By the time the stimuli were selected for this experiment, the author had
completed the first auditory analysis; therefore, the selection was made on the basis of the
first analysis results. In the first analysis, the types of heroic and villainous voices had not
yet been defined, but certain general tendencies across categories had been noted:
1. Heroes' voices exhibited an absence of pharyngeal constriction and the presence of breathy voice.
2. The majority of villains' voices exhibited pharyngeal constriction and harsh voice caused by tense laryngeal tension settings; however, pharyngeal expansion accompanied by lowered larynx was observed in a majority of female and some male villains (Teshigawara, 2003).
In light of the auditory characteristics summarized above, the 88 character voices
were divided into two groups, representative and non-representative: representative
meaning characters exhibited auditory characteristics appropriate to their role, and
non-representative meaning that characters exhibited auditory characteristics opposite or
simply atypical of their role. Within these two groups, characters were examined
according to role, gender and age (adult versus child). For example, villains showing
either pharyngeal constriction or expansion were categorized into the representative
villain group, while those showing neither trait fell into the non-representative villain
group. There were 16 possible groups: hero or villain (2) x gender (2) x age (2) x
representativeness (2). However, since there was only one child villain (male) in the
corpus, this classification system yielded only 13 groups. Two speakers were chosen for
each of 12 groups, with the exception of the child male villain group, which had only one
speaker. In addition, the two supporting roles categorized as Villain Type I were added in
order to see whether they would be rated similarly to heroes or villains. Therefore, the
voices of 27 speakers in total were chosen as the basis for experimental stimuli. It was
hypothesized that participants would attribute less favorable physical traits, personality
traits, emotional states, and vocal characteristics to speakers who exhibited non-neutral
epilaryngeal states (i.e., laryngeal sphinctering or more than a slight degree of pharyngeal
expansion), no matter which roles they played in the original cartoons.
Although the types of heroic and villainous voices had not been identified at the
moment of selection, generally speaking, the types fit in with the voice selection
procedure. Table 5.1 shows the types of voices of the selected characters according to the
results of the second analysis, reported in Chapter 3. (See Appendix B for the full vocal
protocols of these characters based on the second auditory analysis.)

Table 5.1 Voice Types of Characters Selected as Stimuli for Perceptual Experiment
Role Gender Age Representativeness Voice Type
Hero Male Adult Representative H1 (2)
Non-representative H2 (1), othera (1)
Child Representative H 1 ' (2)
Non-representative H1 (I), H2 (1)
Female Adult Representative HI' (2)
Non-representative H 1 ' (2)
Child Representative H 1 ' (2)
Non-representative H 1 ' (2)
Villain Male Adult Representative V1 (I), V2 (1)
Child Representative V 1 (1)
Female Adult Representative V1 (I), V2 (1)
Non-representative H 1 ' (2)
Supporting Male Child vl (1)
Female Adult v l (1)
Note. The numbers in parentheses are the numbers of characters within each voice type. H1 = Hero Type I; H2 = Hero Type 11; H1' = Hero Type 1'; V1 = Villain Type I; V2 = Villain Type 11. a "Other" refers to the character who was not categorized as any particular type in Chapter 3 (THM1). The characters in this group are those who were perceived to have slight intermittent laryngeal sphinctering. See the text for more details.
In the representative condition, with the exception of adult male heroes,
characters who were judged to have more than one voice type were assigned one
character for each voice type (male and female villains); among adult male heroes, Hero
Type I characters were considered representative and Hero Type I1 were categorized as
non-representative. Non-representative adult and child female heroes and one child male
hero (labeled as "other") were those characters who were perceived to have very slight
laryngeal sphinctering that was not reflected in the ratings in Chapter 3. The
non-representative adult male character categorized as "other" was not only perceived as
alternating between laryngeal sphinctering and pharyngeal expansion, but was also
played by an adult female voice actor (and therefore as having higher pitch than other
characters). Thus, with this character, it was considered of interest to examine listeners'
perceptions of age and gender. The non-representative child male hero categorized as
Hero Type I was chosen for a similar reason: this character was played by an adult male
voice actor. In a similar vein, it was thought to be of interest to see whether one of the
non-representative child female heroes (KHfl) who pretended to be a prince would be
rated as male or female; this character was auditorily similar to the child male heroes.
Lastly, one of the two representative child male heroes (FHml) was played by the same
adult female voice actor who played one of the non-representative adult female villains
(OVF1); it was also of interest to examine whether these two characters would be
perceived as similar or not.
Noise-free speech samples of these 27 selected speakers had been stored on a
personal computer for the acoustic analysis; these samples were used to create perceptual
stimuli using the random splicing technique (see Section 4.1 for more details). Although
portions with slight echoes were used in the acoustic analysis if the acoustic analysis
package could compute reliable results, these were eliminated fi-om the perceptual
experiment to avoid the introduction of confounding factors (the one exception was with
one speaker whose noise-free portion had slight echoes throughout). Intensities were
standardized across speakers, with the maximum intensity between 70 and 72 dB.
Following previous research using the random splicing technique (Friend & Farrar, 1994;
Scherer, Feldstein, Bond, & Rosenthal, 1985; van Bezooijen & Beves, 1986), following
the removal of pauses, the digitized speech samples were divided into 250-ms segments.
The first and last 3 ms of each segment were linearly attenuated to zero amplitude in
order to avoid the introduction of transients (Friend & Farrar, 1994).3 The length of each
stimulus was set at 5 s, based on Ambady and Rosenthal's (1992) meta-analysis, which
found that predictions based on behavioral observations under 30 s in length, including
the shortest observed length of 3.5 s, did not differ significantly from predictions based
on 4- and 5-minute observations. Yamada, Hakoda, Yuda, and Kusuhara (2000) also
successfully elicited stereotypical judgments from listeners using vocal stimuli of 3 s in
length; so did Uchida (2000) using vocal stimuli shorter than 3 s. In order to create a 5-s
3 In Friend and Farm (1994), the first and last 1.5 ms of each segment was linearly attenuated to zero amplitude instead of 3 ms; however, the author found that 3 ms of attenuation might improve the transient noise reduction, listening to a resulted concatenated 5-sec stimulus using 1.5, 2 and 3 ms. Therefore, 3 ms was selected instead of 1.5 ms.

stimulus for each speaker, 20 250-ms segments were prepared and rearranged so that
segments could not occur in the same relative order in the spliced stimulus as in the
original.
In order to counterbalance the effects of ordering, two stimulus orders (A and B)
were used: in A, the 27 speakers were randomly ordered disregarding the speaker groups,
while B was the reverse of A. Except the stimulus orders themselves, the two were
otherwise identical. The following describes the procedure for determining the length of
the silence after the stimulus presentation and the durations of the stimulus presentations,
which was based on two preliminary experiments.
For each speaker, one presentation of the stimulus might have been sufficient for
most listeners to make judgments of personality traits and other attributes. However, in
the first preliminary experiment, which involved three native Japanese speakers from the
University of Victoria, a second presentation of the same stimulus was experimentally
added following 1 s of silence. Relatively few studies have presented the same stimuli
multiple times; however, Kido and Kasuya (2001) presented each stimulus six times.
Since Scherer (1971) reports that listeners did not comprehend the content of
random-spliced stimuli even after 25 exposures, it was expected that one more
presentation of the stimulus would not increase participants' comprehension. A 1-min
silence following the two presentations of each stimulus served as a rating period;
according to Naniwa (as cited in Kido & Kasuya, 2001), it is appropriate to ask listeners
to rate 20 items per minute. The initial 11 s of the stimulus presentation (two 5-s
presentations with 1 s of silence between them) and the following 1 min of silence were
considered sufficient for participants to rate 23 items. (Note that there were three
adjectives describing emotional states in the first preliminary experiment; see Section
5.1.3 for details.) However, while two of the participants expressed no preference, one
participant wanted to hear the stimuli a second time towards the end of the silence
(during which the rating occurred), in order to have a fresh impression of the voices. In
addition, all three participants agreed that the time allotted for each stimulus was not long
enough and they felt rushed, especially while rating the first few speakers, as they
attempted to adjust their rating pace to the allotted time. Therefore, in the second
preliminary experiment, for which one other native Japanese speaker volunteered, two
modifications were made: the second presentation was inserted after a 50-s period of
silence, and the following period of silence was 20 s, resulting in a total period of silence
10 s longer than in the first preliminary experiment. However, this participant suggested
that the second presentation in the middle of the silence might be distracting, but that two
presentations of the stimulus at the beginning of each speaker's samples might not be
distracting. In addition, for this particular participant, the initial presentation followed by
the 50-s silence was long enough to rate all 21 items. Considering that only one
participant from the first preliminary experiment suggested a change in the timing of the
second presentation, it was decided to give a second presentation after the 1 s of silence
following the initial presentation. The silence after the two presentations was kept
unchanged, that is, 70 s in total, in order to accommodate slower raters. Therefore, the
whole sequence of stimulus presentation was decided as follows: for each speaker, the
speaker number was announced, followed by the 5-s stimulus; after 1 s of silence, the
same segment was repeated, followed by 70 s of silence. This gave participants a total of
81 seconds to rate each speaker, which, according to previous studies (Kido & Kasuya,
2001 ; van Bezooijen, 1995), is considered sufficient to rate the 21 trait items selected in
this experiment. Participants were given a practice session in which they rated an
additional three speakers before rating the 27 target speakers.
5.1.3 Questionnaire
Since the experimental design called for all participants to rate the same set of
trait items (rather than have participants divided into groups that would rate subsets of
items), to prevent fatigue, it was necessary to reduce the number of items, while at the
same time keeping as many trait items of concern as possible. In total, 21 trait items were
selected for use in the questionnaire for the rating session. (See Appendix C for a sample
questionnaire in English and in the original language, Japanese.) English translations of
the trait items are described below. In addition to the gender (female or male) and age
group (0-10; 11-18; 19-35; 36-60; over 61) portrayed in the voice (items which were
presented in a multiple choice format), 19 adjectives describing physical characteristics,
personality traits, emotional states, and vocal characteristics were included as
questionnaire items. Rather than use bipolar scales with antonyms at each end - an option
which could distort participants' responses if the adjectives on each end were not strictly
opposite - a single adjective was used to represent one trait; and participants were asked
to rate characters according to these 19 adjectives on 7-point unipolar scales ranging from
1 (not at all true) to 7 (extremely true). (See Cacioppo & Berntson, 1994 for theoretical
perspectives on the insufficiency of bipolar scales.) The items relating to physical
characteristic included "big" and "good-looking." A total of 11 items were chosen for
personality traits. Of the 11 items, six were thought to be characteristic of heroes: three
were chosen for their pertinence to heroes of Japanese anime in particular, namely,
"selfless," "loyal," and "devoted" (see Section 1.3.1 and Levi, 1996); and three were
thought to be universal characteristics of heroes ("brave," "intelligent," and "strong"). In
order to elicit listeners' personality impressions and promote further differentiation
between the voices of good and bad characters, the use of personality trait items from the
NEO Personality Inventory (McCrae & Costa, 1987) was considered. The NEO
Personality Inventory consists of five factors comprising a comprehensive trait taxonomy
of personality: Neuroticism, Extraversion, Openness, Agreeableness, and
Conscientiousness. Many studies as Miyake and Zuckerman (1993), Uchida (2000),
Zuckerman, Hodgins, and Miyake (1990, 1993) have successfully obtained listeners'
vocal stereotypic responses using personality trait items from the NEO Personality
Inventory. While Uchida (2000) and Zuckerman et al. (1990, 1993) used more than one
item per factor (the former used four items for each factor; the latter used two for each),
Miyake and Zuckerman (1993) used one item per factor and obtained results comparable
to those of their other studies. Therefore, in order to reduce participant fatigue in this
study one item for each factor was chosen. These items were "calm," "sociable,"
"curious," "sympathetic," and "conscientious." There was one adjective to represent
emotional states, namely "positive emotion"; the decision to limit emotional states to a
single item was based on feedback from the first preliminary experiment, in which three
items (happiness, anger, and disgust) were used. The participants agreed that it was hard
to form impressions about discrete emotions based on random-spliced speech segments,
in which verbal content is absent. However, in order to give participants more options, a
space was provided following the label for those participants who wished to freely
describe the emotion they felt was expressed in the speech sample. In the second
preliminary experiment, where the single adjective "positive" was used, the participant
had no difficulty in rating this item for each stimulus. Finally, the vocal characteristics
consisted of five items, "high-pitched," "loud," "relaxed," "pleasant," and "attractive."
Pitch level and loudness have been reliably judged in expert ratings using random-spliced
stimuli (van Bezooijen & Boves, 1986). "Relaxed" was experimentally added in the
preliminary experiments; participants reported no difficulty in rating this item. The intent
in adding this item was to elicit from listeners perceptions of vocal characteristics
comparable to expert ratings of epilaryngeal states. Vocal pleasantness has also been rated
by laypersons (Deal & Oyer, 1991). As discussed in Section 1.2.2.1, vocal attractiveness
stereotypes have been studied by numerous researchers (Berry, 1990, 199 1, 1992; Miyake
& Zuckerman, 1993; Oguchi & Kikuchi, 1997; Zuckerman & Driver, 1989; Zuckerman,
Hodgins, & Miyake 1990,1993; Zuckerman & Miyake, 1993).
In the questionnaire, all 19 adjective items were grouped according to category
and were never mixed without respect to category: physical characteristics, personality
traits, emotional states, and vocal characteristics followed the labels physical
characteristics, personality, emotion expressed by the speaker; and vocal characteristics,
respectively. The remaining two multiple-choice items, gender and age, were considered
to be categories on their own, yielding six categories all together.
In order to counterbalance ordering effects of trait categories and items within
categories, two orders of the six trait categories (category orders henceforth) were
prepared: (I) gender, age, physical characteristics, personality, emotion, vocal
characteristics; (11) age, gender, vocal characteristics, emotion, personality, physical
characteristics. Where applicable, two item orders within trait categories (a, b) were
prepared. These were systematically combined yielding four questionnaire types (i.e., Ia,
Ib, IIa, IIb).
5.1.4 Participants
Participants were 32 native Japanese speakers (15 males; 17 females; average age
22.8 years) from Nagoya University, Japan and the vicinity. They were recruited by the
experimenter who was also an undergraduate student at Nagoya University at the time of
the experiment. They were not paid for their participation. Of the 32 participants, 28 were
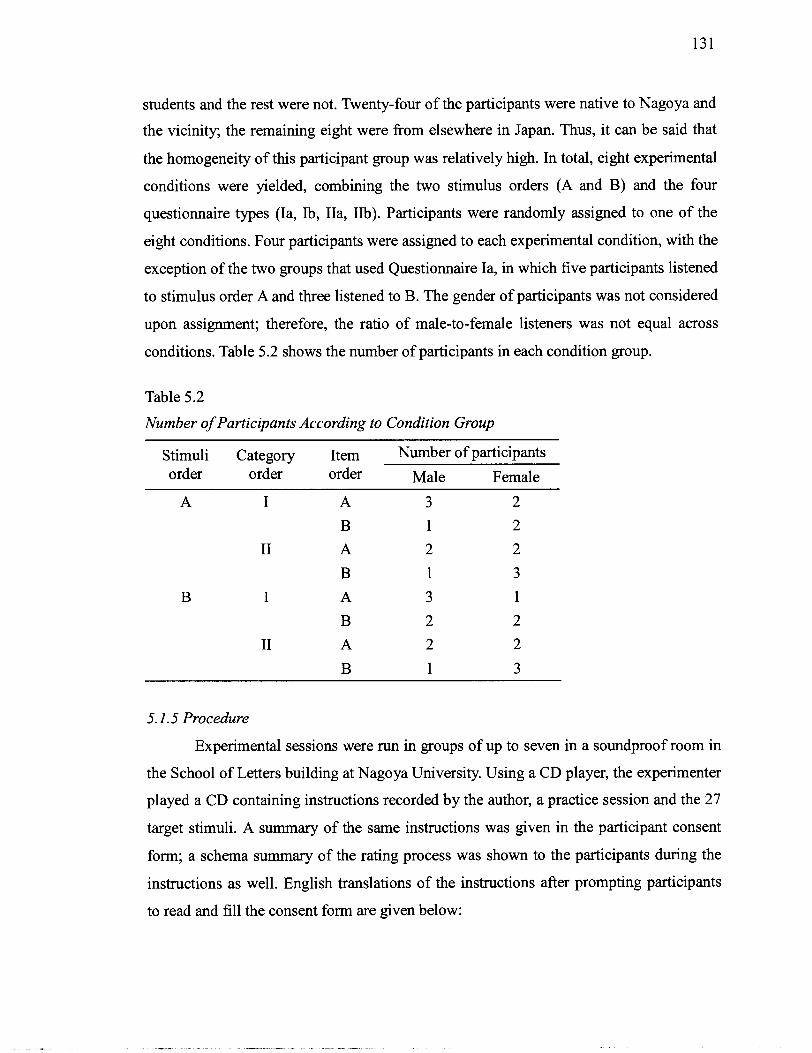
students and the rest were not. Twenty-four of the participants were native to Nagoya and
the vicinity; the remaining eight were from elsewhere in Japan. Thus, it can be said that
the homogeneity of this participant group was relatively high. In total, eight experimental
conditions were yielded, combining the two stimulus orders (A and B) and the four
questionnaire types (Ia, Ib, IIa, 1%). Participants were randomly assigned to one of the
eight conditions. Four participants were assigned to each experimental condition, with the
exception of the two groups that used Questionnaire Ia, in which five participants listened
to stimulus order A and three listened to B. The gender of participants was not considered
upon assignment; therefore, the ratio of male-to-female listeners was not equal across
conditions. Table 5.2 shows the number of participants in each condition group.
Table 5.2
Number of Participants According to Condition Group
Stimuli Category Item I%JII - I~~~ of participants order order order Male Female
5.1.5 Procedure
Experimental sessions were run in groups of up to seven in a soundproof room in
the School of Letters building at Nagoya University. Using a CD player, the experimenter
played a CD containing instructions recorded by the author, a practice session and the 27
target stimuli. A summary of the same instructions was given in the participant consent
form; a schema summary of the rating process was shown to the participants during the
instructions as well. English translations of the instructions after prompting participants
to read and fill the consent form are given below:

In this experiment, you will be hearing 30 speakers' speech excerpts including three practice speakers'. The speakers are all animation characters. You will be asked to fill in the questionnaire regarding impressions of each speaker using 21 trait items therein. One page of the questionnaire is allotted for one speaker. For each speaker, to start with, there will be two 5-s speech excerpts in a sequence. The time between speakers is 70 s; during the 70 s, you will be required to rate each item and turn to the next page. Because the time between speakers is not very long, please do not think too much but try to answer intuitively. The speech excerpts used in this experiment have been edited using an acoustic program so that you will not understand the content of the speech. This process was done in order to let you focus on the tone of voice of each speaker rather than the content of speech. You may find them unnatural until you get used to hearing them, but please try to concentrate on the tone of voice you are hearing.
This portion of the instructions was followed by a practice session consisting of three
speakers, followed by a question period and the main session.
After the experiment, participants completed a questionnaire with demographic
information about themselves and their exposure to anime. Each session lasted less than
one hour and there was no interruption during the session. A few earlier participants
reported fatigue after the entire experimental session; therefore, the experimenter was
encouraged to provide a more comfortable environment for participants in following
sessions.
5.2 Results
The results are divided into several sections in the rest of this chapter. Section
5.2.1 examines whether participants agreed with each other in their ratings, followed by
the mean and standard deviation of participants' ratings (Section 5.2.2). The next three
subsections discuss ANOVA results for three contrasts, that is, adult heroes versus adult
villains (Section 5.2.3), adult heroes versus child heroes (Section 5.2.4), and two
characters played by the same voice actor (Section 5.2.5). From the series of ANOVAs,
the ratings for adjective items excluding "big'' from physical traits, and "high-pitched"
and "loud" from vocal characteristics are discussed. The ratings for these three adjectives
are excluded from discussion here, but will be analyzed in the correlation analyses
(Chapter 6) because it appeared that factors other than epilaryngeal states were decisive

in influencing participants' impressions of these factors. The results of gender and age
perceptions will also be discussed in Section 5.2.6. Lastly, the emotional labels specified
by several participants will be analyzed qualitatively (Section 5.2.7), followed by
discussions about the random splicing technique in Section 5.2.8.
5.2.1 Reliability
In order to examine the consistency of participants' trait ratings, Cronbach's alpha
was calculated for each of the 21 trait items across participants. As shown in Table 5.3,
the Cronbach's alphas were very high, ranging between .90 and .99 for all but two items
(.87 for "sociable" and .80 for "positive emotion"). Intraclass correlation, which
measures the reliability between any two pairs of judges (participants in the case of the
present study) as opposed to the aggregate reliability of all the judges measured by
Cronbach's alpha (Rosenthal & Rosnow, as cited in Hecht & LaFrance, 1995), was also
calculated for each item across participants. As was the case with Hecht and LaFrance
(1995), the intraclass reliabilities were lower (r = .I1 to .82) than Cronbach's alphas,
which indicates that there was considerably more variability in the judgments of trait
items at the individual level.

Table 5.3
Reliability of Ratings
Trait item Cronbach's alpha Intraclass correlation
Gender 0.99 0.82
Age 0.98 0.63 Physical characteristics
Big
Good-looking 0.98 0.56
Personality traits
Brave 0.90 0.22
Selfless
Loyal Devoted 0.93 0.30
Intelligent
Strong
Sociable
Calm
Curious
Conscientious
Sympathetic
Positive emotion 0.80 0.11
Vocal characteristics High-pitched
Loud
Relaxed
Pleasant
Attractive
Note. Figures are based on all 32 participants.
In addition to the reliabilities across participants, since it was revealed that the
three condition factors (stimulus order, category order and item order) had significant
main and interaction effects for some trait items (see Sections 5.2.3 and 5.2.4 for more
details), Cronbach's alpha and intraclass correlations were calculated for each item,
separately for each of the eight condition groups (see Appendix D). The Cronbach's
alphas were generally smaller for each group than those for all participants because of the
small sample size (N = 3 to 5). In addition, it was revealed that the items whose alpha and
intraclass correlations were relatively small for all participants (e.g., "strong," "sociable,"
and "positive emotion") contain one or more condition groups that had very low alphas
and intraclass correlations. In addition, since an anomaly was found in a close inspection
of the raw data, bivariate correlations were calculated for each pair of participants and for
each participant relative to the average ratings of all participants, separately for each item.
It was found that ratings of one of the participants in the condition group that had
stimulus order A and questionnaire Ia had significant correlations with the average ratings
for only six out of 21 items ( p < . 0 5 ) ~ . This particular participant complained of fatigue
and boredom after the experimental session; therefore, it was decided that results for this
participant would be removed fiom the rest of the analysis.
5.2.2 Descriptive statistics
Means and standard deviations were calculated for each of the 16 items for each
speaker and then for each of the groups that contained two speakers across participants.
Table 5.4 presents means and standard deviations by item for each of the 13 groups and
the two supporting roles. It can be seen that in general, heroes have higher average scores
than villains. Whereas within heroes, representative heroes have higher scores than
non-representative heroes, within villains, the tendency is reversed; that is, representative
villains have lower scores than non-representative villains. However, for males, it appears
that villains have ratings comparable to heroes for some items. In addition, for females, it
appears that for some items, non-representative heroes have higher ratings than
representative heroes. The average scores for supporting roles appear to resemble
villains' scores. The issue of whether heroes and villains, and representatives and
non-representatives within categories, differ in a statistically significant fashion is
examined in the following subsections.
The next fewest numbers of correlations with the average ratings were 13 and 14 out of 21 items, which were for two of the participants in the group that had stimuli order A and questionnaire IIa. In addition to the fact that these numbers are larger than the half of 21, the experimenter did not note anything particular about these participants' attitudes. Thus, it was decided that data for these participants would be included in the ongoing analyses.
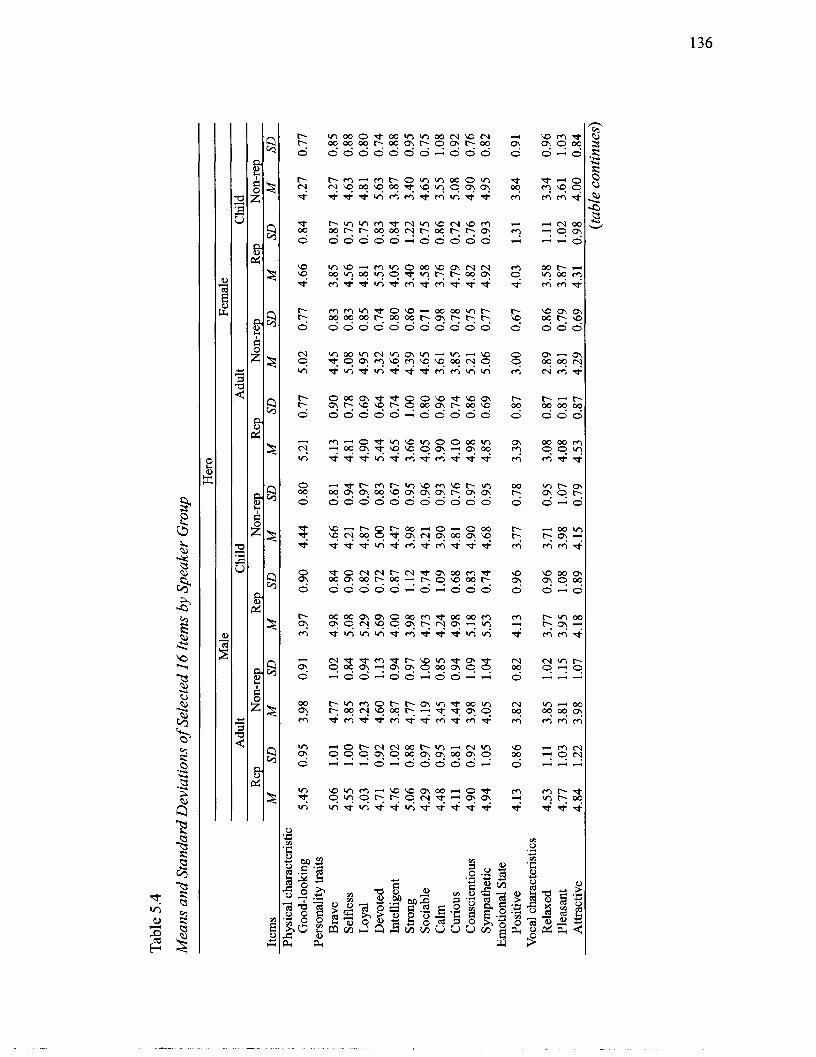
I T
able
5.4
Mea
ns a
nd S
tand
ard
Dev
iatio
ns o
f Sel
ecte
d 16
Item
s by
Spe
aker
Gro
up
Her
o M
ale
Fem
ale
Adu
lt C
hild
A
dult
Chi
ld
I R
ep
Non
-rep
R
ep
Non
-rep
R
ep
Non
-rep
R
ep
Non
-rep
Item
s M
SD
M
SD
M
SD
M
SD
M
SD
M
SD
M
SD
M
SD
Ph
ysic
al c
hara
cter
istic
G
ood-
look
ing
5.45
0.
95
3.98
0.
91
3.97
0.
90
4.44
0.
80
5.21
0.
77
5.02
0.
77
4.66
0.
84
4.27
0.
77
Pers
onal
ity tr
aits
B
rave
5.
06
1.01
4.
77
1.02
4.
98
0.84
4.
66
0.81
4.
13
0.90
4.
45
0.83
3.
85
0.87
4.
27
0.85
Se
lfle
ss
4.55
1.
00
3.85
0.
84
5.08
0.
90
4.21
0.
94
4.81
0.
78
5.08
0.
83
4.56
0.
75
4.63
0.
88
, L
oyal
5.
03
1.07
4.
23
0.94
5.
29
0.82
4.
87
0.97
4.
90
0.69
4.
95
0.85
4.
81
0.75
4.
81
0.80
D
evot
ed
4.71
0.
92
4.60
1.
13
5.69
0.
72
5.00
0.
83
5.44
0.
64
5.32
0.
74
5.53
0.
83
5.63
0.
74
Inte
llige
nt
4.76
1.
02
3.87
0.
94
4.00
0.
87
4.47
0.
67
4.65
0.
74
4.65
0.
80
4.05
0.
84
3.87
0.
88
Stro
ng
5.06
0.
88
4.77
0.
97
3.98
1.
12
3.98
0.
95
3.66
1.
00
4.39
0.
86
3.40
1.
22
3.40
0.
95
Soci
able
4.
29
0.97
4.
19
1.06
4.
73
0.74
4.
21
0.96
4.
05
0.80
4.
65
0.71
4.
58
0.75
4.
65
0.75
C
alm
4.
48
0.95
3.
45
0.85
4.
24
1.09
3.
90
0.93
3.
90
0.96
3.
61
0.98
3.
76
0.86
3.
55
1.08
C
urio
us
4.11
0.
81
4.44
0.
94
4.98
0.
68
4.81
0.
76
4.10
0.
74
3.85
0.
78
4.79
0.
72
5.08
0.
92
Con
scie
ntio
us
4.90
0.
92
3.98
1.
09
5.18
0.
83
4.90
0.
97
4.98
0.
86
5.21
0.
75
4.82
0.
76
4.90
0.
76
Sym
path
etic
4.
94
1.05
4.
05
1.04
5.
53
0.74
4.
68
0.95
4.
85
0.69
5.
06
0.77
4.
92
0.93
4.
95
0.82
E
mot
iona
l Sta
te
Posi
tive
4.13
0.
86
3.82
0.
82
4.13
0.
96
3.77
0.
78
3.39
0.
87
3.00
0.
67
4.03
1.
31
3.84
0.
91
Voc
al c
hara
cter
istic
s R
elax
ed
4.53
1.
11
3.85
1.
02
3.77
0.
96
3.71
0.
95
3.08
0.
87
2.89
0.
86
3.58
1.
11
3.34
0.
96
Plea
sant
4.
77
1.03
3.
81
1.15
3.
95
1.08
3.
98
1.07
4.
08
0.81
3.
81
0.79
3.
87
1.02
3.
61
1.03
A
ttrac
tive
4.84
1.
22
3.98
1.
07
4.18
0.
89
4.15
0.
79
4.53
0.
87
4.29
0.
69
4.31
0.
98
4.00
0.
84
(tab
le co
ntin
ues)
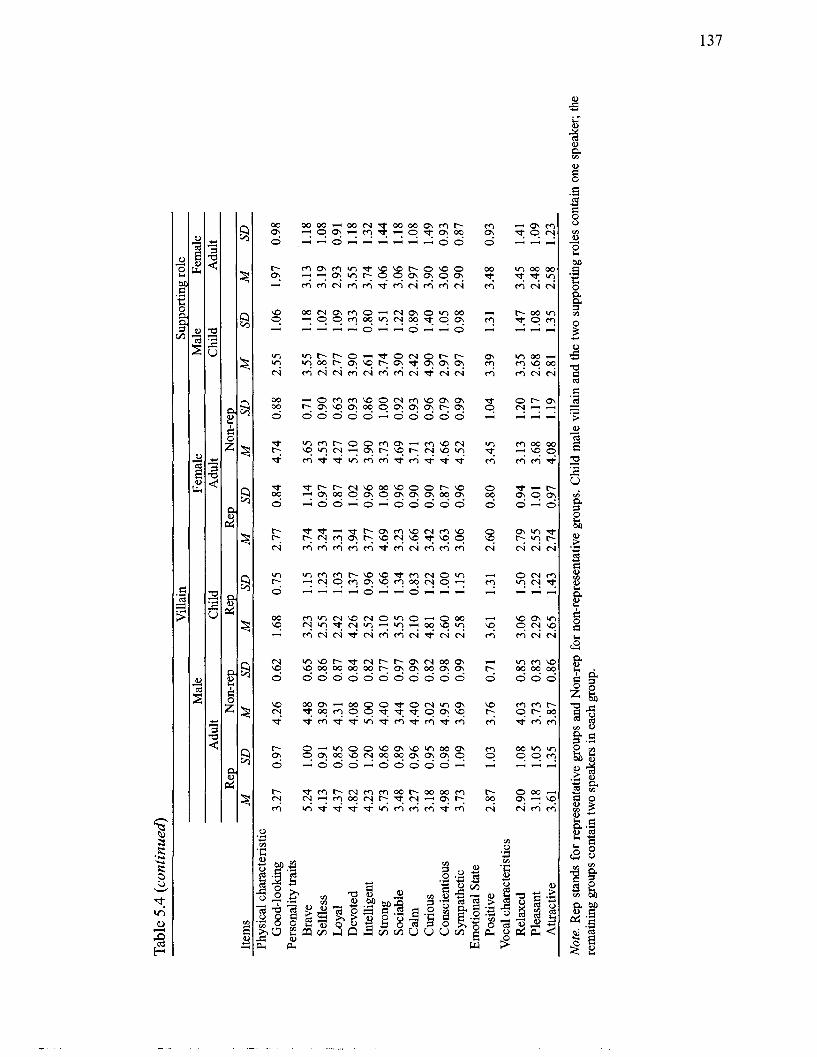
Tab
le 5
.4 (
cont
inue
d)
Vill
ain
Supp
ortin
g ro
le
Mal
e Fe
mal
e M
ale
Fem
ale
Adu
lt C
hild
A
dult
Chi
ld
Adu
lt R
ep
Non
-rep
R
ep
Rep
N
on-r
ep
Item
s M
SD
M
SD
M
SD
M
SD
M
SD
M
SD
M
SD
Phys
ical
cha
ract
eris
tic
Goo
d-lo
okm
g Pe
rson
ality
trai
ts
Bra
ve
Self
less
L
oyal
D
evot
ed
Inte
llige
nt
Stro
ng
Soci
able
C
alm
C
urio
us
Con
scie
ntio
us
Sym
path
etic
E
mot
iona
l Sta
te
Posi
tive
Voc
al c
hara
cter
istic
s R
elax
ed
Plea
sant
A
ttrac
tive
3.61
1.
35
3.87
0.
86
2.65
1.
43
2.74
0.
97
4.08
1.
19
2.81
1.
35
2.58
1.
23
Not
e. R
ep s
tand
s fo
r re
pres
enta
tive
grou
ps a
nd N
on-r
ep f
or n
on-r
epre
sent
ativ
e gr
oups
. Chi
ld m
ale
villa
in a
nd th
e tw
o su
ppor
ting
role
s co
ntai
n on
e sp
eake
r; th
e re
mai
ning
gro
ups
cont
ain
two
spea
kers
in e
ach
grou
p.
Comparing ratings for each item, it appears that those for "positive emotion" and
"(vocally) relaxed" are relatively low even for heroes. It can be surmised that the random
splicing technique had some effects on the participants' ratings. (However, see Section
5.2.8 for a counterargument.)
5.2.3 Analyses of Variance: Heroes versus F7llains
Due to the asymmetry of the stimuli in child villain groups, in this subsection, the
analyses will be confined to the adult hero and villain groups, which have full contrasts in
gender and representativeness: 16 speakers, two from each of the eight groups, that is,
hero or villain (2) x gender (2) x representativeness (2).
In order to examine whether participants responded to stimuli according to the
auditory characteristics of the voices, that is, in reference to differences in epilaryngeal
states, a series of three-factor repeated measures ANOVAs with three between-subjects
factors for control purposes, was carried out for each item. The three within-subjects
factors were role (hero or villain), gender (male or female), and representativeness
(representative or non-representative). The three between-subjects factors were the two
stimulus orders and the two category and item orders in the questionnaire. For the
purpose of Type I error protection, the Bonferroni correction was used; therefore, an
alpha level .003 (i.e., .05 divided by 16) was adopted instead of the standard .05 level.
Table 5.5 summarizes the significant main and interaction effects that emerged in the
analyses. It also includes partial eta squared ( 9 2, as an estimated effect size for each
main and interaction effect.

Table 5.5
Results porn Analyses of Variance of Participants' Trait Ratings for Adult Heroes and fillains
Trait items Personality
Source Good- Brave Selfless Loyal Devoted Intelligent Strong df looking
Role (HN) 1 F v MSE
Gender (G) F v MSE
Representativeness (R) F 17 MSE
W * G F 17 MSE
W * R F v MSE
G*R F 17 MSE
H/V*G*R F v MSE
Othersa
F v
(table continues)
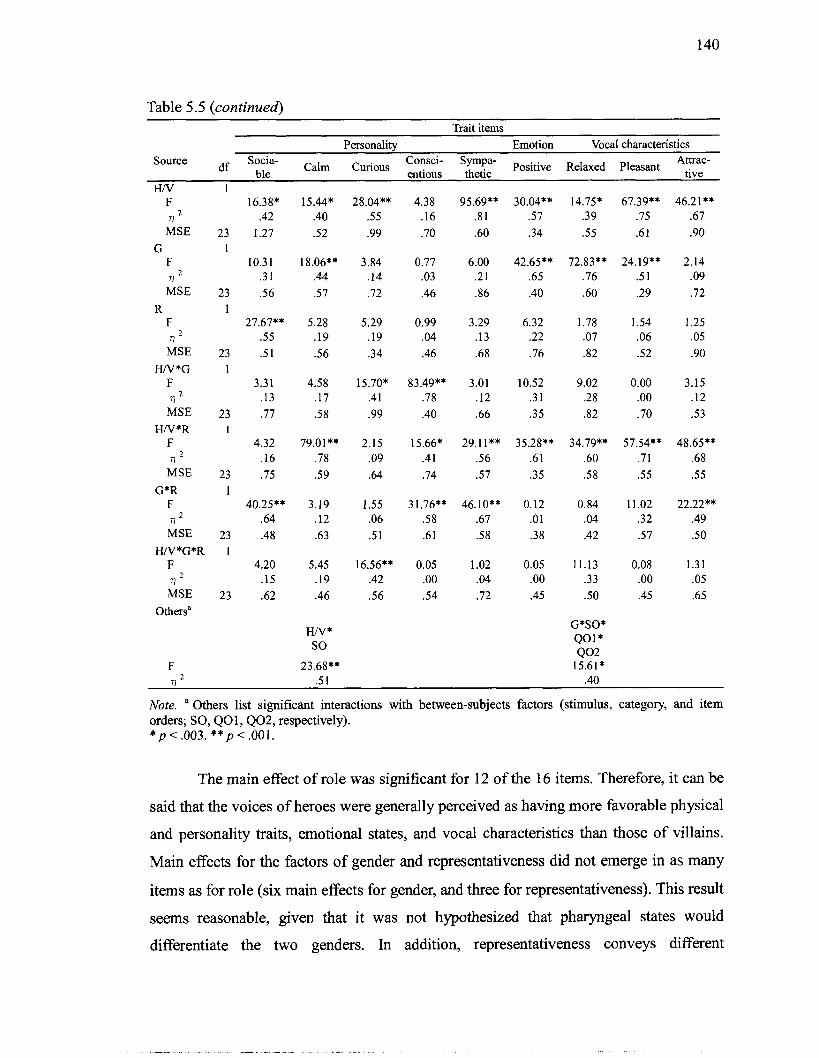
Table 5.5 (continued) Trait items
Personality Emotion Vocal characteristics Source df Socia- Consci-
Sympa- Positive Relaxed Pleasant Attrac-
ble Calm Curious entious thetic tive WV 1
F v MSE
G F u MSE
R F v
MSE
WV*G F u MSE
HN*R F v MSE
G*R F v MSE
KN*G*R F u MSE
Othersa
F
15.44* .40 .52
18.06** .44
.57
5.28 .19 .56
4.58 .17 .58
79.01** .78 .59
3.19 .12 .63
5.45 .19 .46
HN* SO
23.68**
Note. a Others list significant interactions with between-subjects factors (stimulus, category, and item orders; SO, Q01,Q02, respectively). * p < .003. * * p < .001.
The main effect of role was significant for 12 of the 16 items. Therefore, it can be
said that the voices of heroes were generally perceived as having more favorable physical
and personality traits, emotional states, and vocal characteristics than those of villains.
Main effects for the factors of gender and representativeness did not emerge in as many
items as for role (six main effects for gender, and three for representativeness). This result
seems reasonable, given that it was not hypothesized that pharyngeal states would
differentiate the two genders. In addition, representativeness conveys different

pharyngeal states depending on role; for instance, non-representative characters include
both heroes exhibiting laryngeal sphinctering and villains exhibiting an open airway. In
other words, representativeness is meaningful only in relation to role.
A number of interactions were found between any combination of two of the three
factors and among the three. Except for "strong" and "curious," the same patterns were
observed in the direction of interactions across items. In the interaction between role and
gender, females were rated significantly higher when they were heroes than villains,
which was the expected tendency; however, males' ratings were generally consistent
across roles or significantly higher for villains than heroes. Six items showed this
tendency and they are all personality trait items: "selfless," "loyal," "devoted,"
"intelligent," and "conscientious." (For "curious," the direction of the interaction was
reversed; male heroes were rated significantly higher than male villains, while female
heroes were rated significantly lower than female villains.) This tendency was not
predicted; rather, it was expected that both male and female villains would receive low
scores.
In the interaction between role and representativeness, heroes were rated
significantly higher when they were representative than non-representative, while villains
were rated significantly lower when they were representative than non-representative.
This trend was observed in 12 of the 16 items, which include "good-looking," "selfless,"
"loyal," "intelligent," "calm," "positive emotion," "relaxed," and so forth. (The direction
of the interaction in "strong" was reversed; therefore, speakers with laryngeal
sphincteringlpharyngeal expansion were rated as significantly stronger than those
without.) Thus, participants attributed less favorable physical traits, personality traits,
emotional states, and vocal characteristics to speakers who exhibited non-neutral
pharyngeal states (i.e., laryngeal sphinctering or more than a slight degree of pharyngeal
expansion) regardless of the roles they played in the original cartoons. This pattern
corresponds with the hypothesis set out in Section 5.1.2, and reveals that the
classification of auditory characteristics into representative and non-representative based
on the pharyngeal states identified in Chapter 3 was valid.
The interaction between gender and representativeness emerged in ten items. In
this pattern, males were rated significantly higher when they were representative than
non-representative, while females were rated significantly lower when they were
representative than non-representative. The items where this pattern emerged included
"good-looking," "selfless," "sociable," and "sympathetic." This pattern was not predicted.
These two kinds of interaction involving gender appear to have been caused by the
relatively high scores of representative male villains. Relative to average ratings,
representative male villains are much closer to heroes or non-representative villains than
representative female villains are to the other groups, except for the item "strong." It
would be interesting to see if gender would play such a significant role in a study using
more naturalistic samples as perceptual stimuli.
Three-way interactions were found for three items: "devoted," "intelligent," and
"curious." Of the three, "devoted" and "curious" share the same direction of interaction:
male representative villains were rated higher than non-representative villains for these
items, while for females, the same interaction direction was found as in the regular
two-way interaction between role and representativeness. For the item "intelligent," the
regular role-representativeness interaction was seen for males, whereas for females, a
clear difference between representative and non-representative emerged for villains, but
not for heroes.
In addition, three significant but unexpected interactions between one of the three
factors and one or more control factors (i.e., stimulus order, category order, and item
order) emerged: an interaction between representativeness and item order for "devoted"
(p = .001); an interaction between role and stimulus order for "calm" (p < .001); and a
four-way interaction among gender and all three control factors for "relaxed" (p = .001).
The main effect of item order nearly reached significance for "devoted" (p = .004). There
were other marginally non-significant interactions: an interaction between
representativeness and stimulus order for "strong" (p = .005); a four-way interaction
among role, gender, stimulus order and category order for "strong" (p = .004); an
interaction between role and item order for "calm" (p = .003); a four-way interaction
among gender and all three control factors for "positive emotion" (p = .004); and another
four-way interaction among gender and all three control factors for "pleasant" (p = .003).
It is not easy to interpret these results. For instance, the item "devoted" appeared in the
following two orders in the questionnaire: (a) loyal, devoted, intelligent; (b) curious,
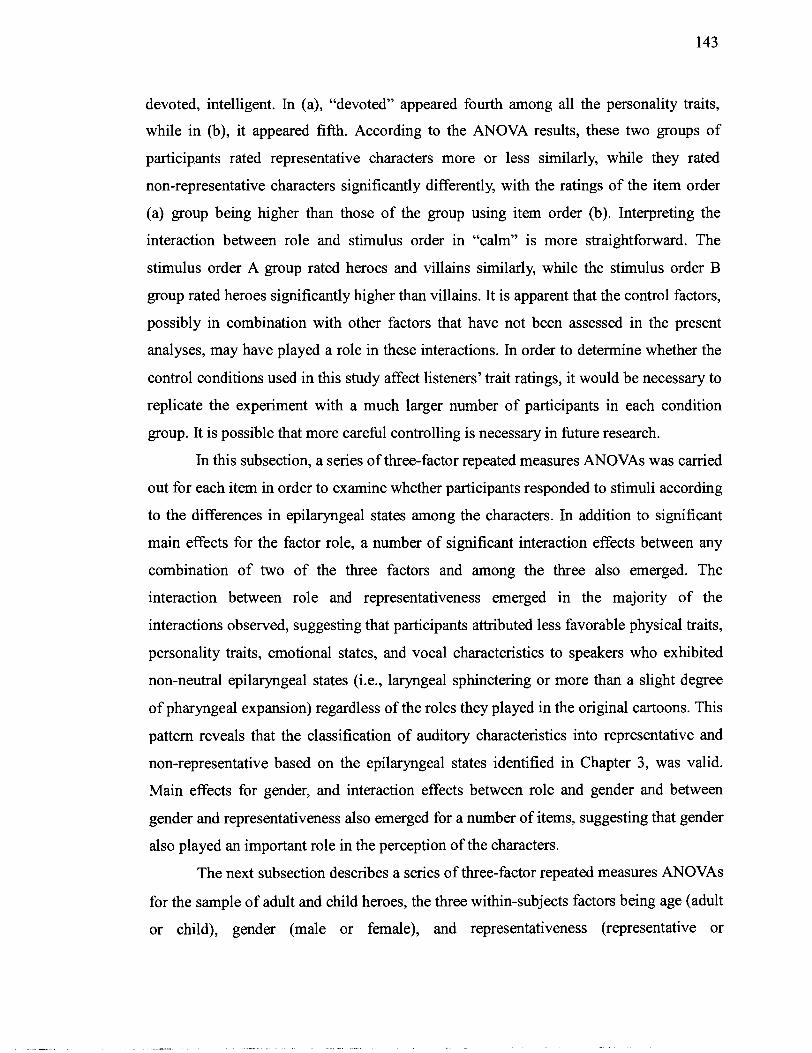
devoted, intelligent. In (a), "devoted" appeared fourth among all the personality traits,
while in (b), it appeared fifth. According to the ANOVA results, these two groups of
participants rated representative characters more or less similarly, while they rated
non-representative characters significantly differently, with the ratings of the item order
(a) group being higher than those of the group using item order (b). Interpreting the
interaction between role and stimulus order in "calm" is more straightforward. The
stimulus order A group rated heroes and villains similarly, while the stimulus order B
group rated heroes significantly higher than villains. It is apparent that the control factors,
possibly in combination with other factors that have not been assessed in the present
analyses, may have played a role in these interactions. In order to determine whether the
control conditions used in this study affect listeners' trait ratings, it would be necessary to
replicate the experiment with a much larger number of participants in each condition
group. It is possible that more careful controlling is necessary in future research.
In this subsection, a series of three-factor repeated measures ANOVAs was carried
out for each item in order to examine whether participants responded to stimuli according
to the differences in epilaryngeal states among the characters. In addition to significant
main effects for the factor role, a number of significant interaction effects between any
combination of two of the three factors and among the three also emerged. The
interaction between role and representativeness emerged in the majority of the
interactions observed, suggesting that participants attributed less favorable physical traits,
personality traits, emotional states, and vocal characteristics to speakers who exhibited
non-neutral epilaryngeal states (i.e., laryngeal sphinctering or more than a slight degree
of pharyngeal expansion) regardless of the roles they played in the original cartoons. This
pattern reveals that the classification of auditory characteristics into representative and
non-representative based on the epilaryngeal states identified in Chapter 3, was valid.
Main effects for gender, and interaction effects between role and gender and between
gender and representativeness also emerged for a number of items, suggesting that gender
also played an important role in the perception of the characters.
The next subsection describes a series of three-factor repeated measures ANOVAs
for the sample of adult and child heroes, the three within-subjects factors being age (adult
or child), gender (male or female), and representativeness (representative or

non-representative). Since these two groups share the same contrast in epilaryngeal
setting - representatives having a more open airway and non-representatives a more
constricted epilaryngeal setting - an interaction between age and representativeness was
not expected. However, representativeness itself may have larger main effects. In addition,
an inspection of Table 5.4 reveals that there may be some personality items that differ
between the two age groups, such as "devoted" and "curious."
5.2.4 Analyses of Variance: Adult Heroes versus Child Heroes
Table 5.6 summarizes the results of a series of three-factor repeated measures
ANOVAs for adult and child heroes. The main effect of age was significant in six items,
including "good-looking," "devoted," and "curious." While for "good-looking,"
"intelligent," and "strong," adult heroes were rated higher than child heroes, the trend
was reversed for "devoted," "curious," and "sympathetic." The main effects of gender
and representativeness were also significant in six items respectively. "Brave" and
"strong" were among the items with significant main effects of gender, and "calm" and
"sympathetic" were among those of representativeness. Four of the six items that had
significant main effects for gender (i.e., "brave," "strong," "positive emotion," and
"relaxed") also showed significant effects for gender in the ANOVAs for heroes and
villains. However, in the case of representativeness, only "good-looking" was common in
the two series of ANOVAs as an item with significant effects. As expected, in the
ANOVAs for adult and child heroes, representativeness had three more items with
significant main effects than was the case in the analyses of heroes and villains.
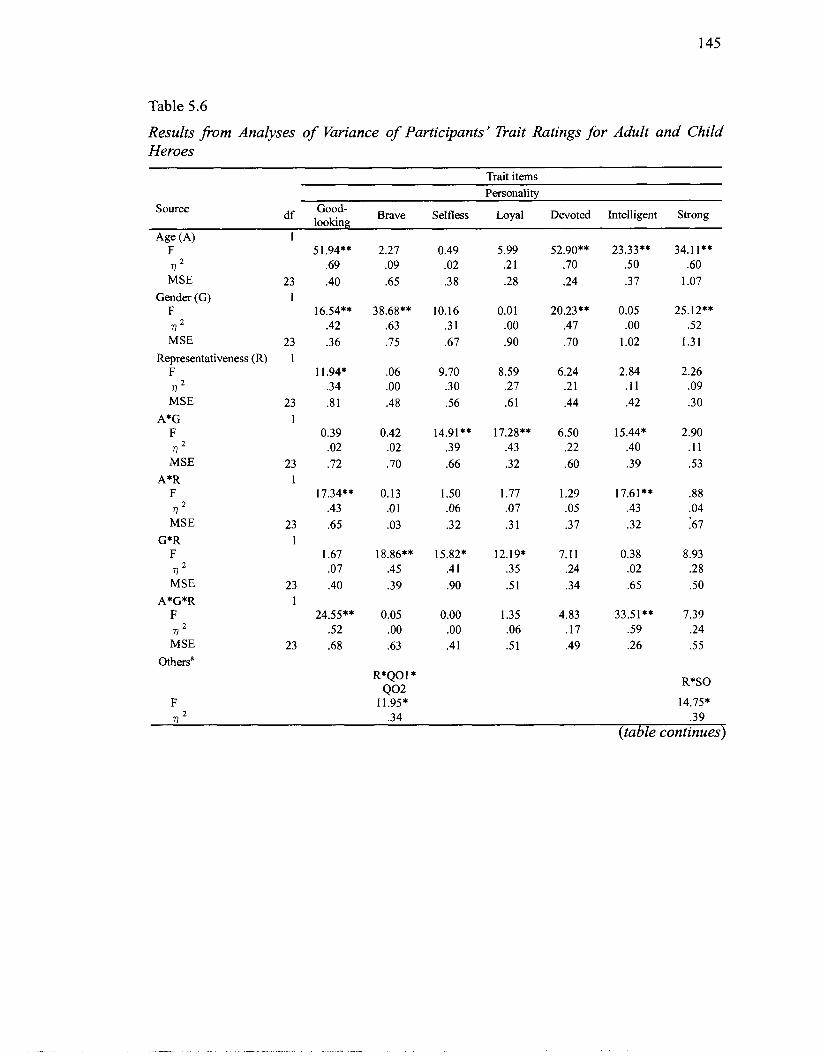
Table 5.6
Results JFom Analyses of hriance of Participants' Trait Ratings for Adult and Child Heroes
Trait items
Source Good- Brave Selfless Loyal Devoted Intelligent Strong df looking
Age (A) 1
17 .69 MSE 23 .40
Gender (G) 1 F 16.54** v .42 MSE 23 .36
Representativeness (R) 1 F 11.94* 17 .34 MSE 23 3 1
A*G 1 F 0.39 17 .02
MSE 23 .72 A*R 1
F 17.34** 17 .43 MSE 23 .65
G*R 1 F 1.67 17 .07 MSE 23 .40
A*G*R 1 F 24.55** 17 .52 MSE 23 .68
Othersa
.39 (table continues)
Table 5.6 (continued) Trait items
Personalitv Emotion Vocal characteristics Source df Socia- Consci- Attsac-
ble Calm Curious entious Sgi?- Positive Relaxed Pleasant
A F 17 MSE
G F 17 MSE
R F 17 MSE
A*G F 17 MSE
A*R F 17 MSE
G*R F v
MSE A*G*R
F 17 MSE
Othersa
Note. a Others list significant interactions with between-subjects factors (stimulus, category, and item orders; SO, Q01,Q02, respectively). * p < .OOX * * p < .001.
There were also some significant interactions between any combination of two of
the three factors and among the three, but the number is fewer than in the ANOVAs for
heroes and villains. Except "positive emotion" and "relaxed," the same patterns were
observed in the direction of interactions across items. In the interaction between age and
gender, females were rated significantly higher than males when they were adult, but the
pattern was reversed or balanced between genders when they were children. Of the six
items that had significant interactions between age and gender, four (i.e., "selfless,"
"loyal," "intelligent," and "conscientious") showed this pattern. For the two remaining

items (i.e., "positive emotion" and "relaxed"), males had higher ratings when they were
adult, while the gender difference was minimal for children. However, it is important to
interpret these results with caution, given that, with one exception, the child characters
were all played by adult female voice actors. It is also important to keep in mind that one
of the non-representative female heroes (KHfl) was judged as being male by 29 out of 3 1
participants. Therefore, the inclusion of this character in the analysis of
non-representative females may have skewed the average ratings for this speaker group,
bringing the scores closer to those obtained for male heroes.
In the interaction between age and representativeness, representatives were rated
significantly higher than non-representatives when they were adult, while they were rated
similarly to representatives, and slightly lower than non-representatives, when they were
children. This pattern was observed in the two items that had significant interactions
between age and representativeness, that is, "good-looking" and "intelligent." As
expected, the number of interactions between age and representativeness was not at all
comparable to that of that between role and representativeness in the ANOVAs for heroes
and villains.
There were also six items that showed significant interactions between gender and
role; they are included in the ten items where this pattern of interaction emerged in the
results for heroes and villains as well. In this pattern, males were rated significantly
higher when they were representative than non-representative, while females were rated
(only slightly for a few items) lower when they were representative than
non-representative.
A three-way interaction also emerged in two items, "good-looking" and
"intelligent." The pattern of interactions was the same in the two items: in males, the
same pattern seen in the interaction between gender and representativeness emerged (i.e.,
representatives were rated higher than non-representatives when they were adult, a
pattern opposite to that found when they were children), while in females, representatives
were rated higher in both age groups, with the difference between the two slightly larger
among children.
There were two significant interactions between one of the three factors and one
or more control factors (i.e., stimulus order, category order, and item order) which were
not expected to emerge: an interaction among representativeness and the two
questionnaire orders (category and item orders) for "brave"; and an interaction between
representativeness and stimulus order for "strong." The main effect of stimulus order for
"calm" was marginally non-significant (p = .005). There were also two marginally
non-significant interactions between one of the three factors and one or more control
factors: an interaction between gender and stimulus order for "good-looking" (p = .004);
and an interaction among gender, category and item orders for "relaxed" (p = .007). The
items "strong," "calm," and "relaxed" are repeated from the results of ANOVAs for
heroes and villains, which may again suggest that the control factors produced genuine
effects.
In this subsection, a series of three-factor repeated measures ANOVAs was carried
out for the sample of adult and child heroes, the three within-subjects factors being age,
gender, and representativeness. A number of main and interaction effects emerged;
however, the number was fewer than in the ANOVAs for the sample of heroes and
villains. The factor representativeness did not appear to play a significant role in the
interaction between age and representativeness, but it did in the main effect of
representativeness itself. This relationship was expected, because the two age groups
shared the same contrast in epilaryngeal settings, with representatives showing little or no
constriction and non-representatives exhibiting a more constricted epilaryngeal setting.
The present results may have some implications for laypersons' attributions of physical
and personality traits and vocal characteristics to the voices of adults and children, or
those considered in real life to have babyish voices. However, since it is not clear whether
these trends are peculiar to this set of speech samples, in order to generalize from the
present results, it would be necessary to replicate the same experiment using the voices of
actual children or individuals with babyish voices, rather than the simulated child voices
in the present study.
5.2.5 Analyses of Variance: Two Characters Played by the Same Actor
A series of one-factor repeated measures ANOVAs with three between-subjects
factors for control purposes was carried out for the sample of two characters played by
the same female voice actor. The within-subjects factor was character. FHml was a
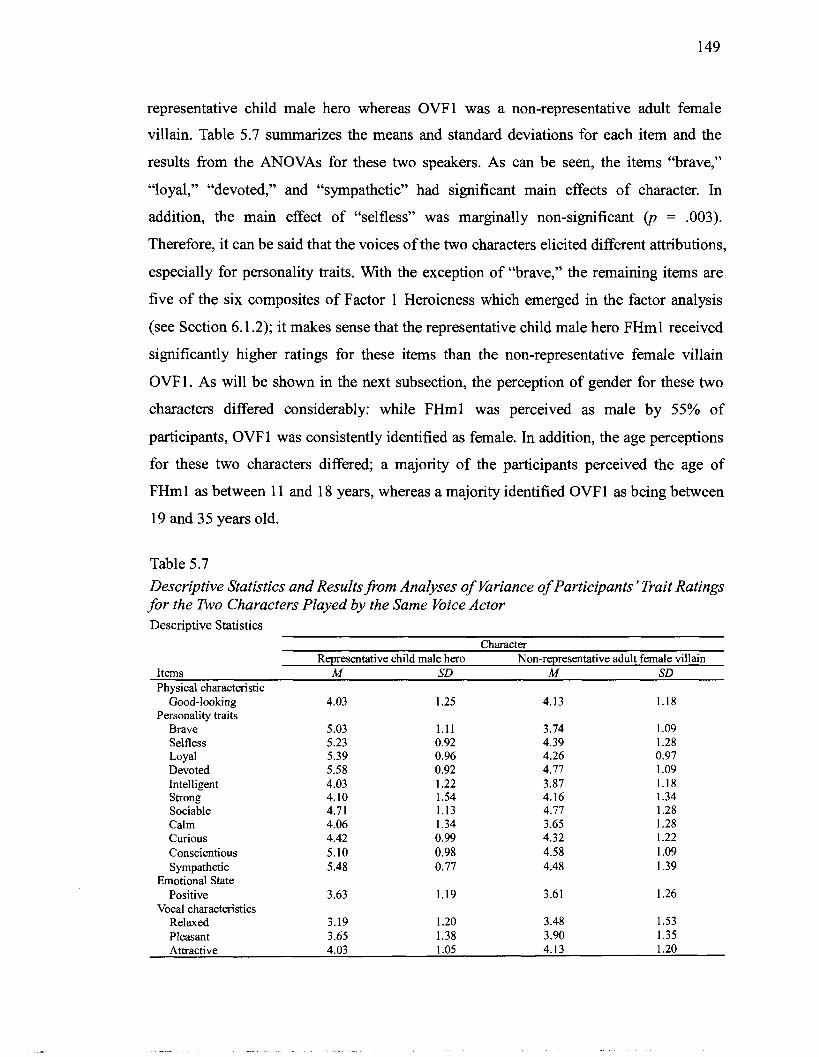
representative child male hero whereas OVFl was a non-representative adult female
villain. Table 5.7 summarizes the means and standard deviations for each item and the
results from the ANOVAs for these two speakers. As can be seen, the items "brave,"
"loyal," "devoted," and "sympathetic" had significant main effects of character. In
addition, the main effect of "selfless" was marginally non-significant ( p = .003).
Therefore, it can be said that the voices of the two characters elicited different attributions,
especially for personality traits. With the exception of "brave," the remaining items are
five of the six composites of Factor 1 Heroicness which emerged in the factor analysis
(see Section 6.1.2); it makes sense that the representative child male hero FHml received
significantly higher ratings for these items than the non-representative female villain
OVF1. As will be shown in the next subsection, the perception of gender for these two
characters differed considerably: while FHml was perceived as male by 55% of
participants, OVF 1 was consistently identified as female. In addition, the age perceptions
for these two characters differed; a majority of the participants perceived the age of
FHml as between 1 1 and 18 years, whereas a majority identified OVFl as being between
19 and 35 years old.
Table 5.7 Descriptive Statistics and Results from Analyses of Variance of Participants' Trait Ratings for the Two Characters Played by the Same Voice Actor Descriptive Statistics
Character Representative child male hero Non-representative adult female villain
Items M SD M SD Physical characteristic
Good-looking 4.03 1.25 4.13 1.18 Personality traits
Brave 5.03 1.11 3.74 1.09 Selfless 5.23 0.92 4.39 1.28 Loyal 5.39 0.96 4.26 0.97 Devoted 5.58 0.92 4.77 1 .09 Intelligent 4.03 1.22 3.87 1.18 Strong 4.10 1.54 4.16 1.34 Sociable 4.71 1.13 4.77 1.28 Calm 4.06 1.34 3.65 1.28 Curious 4.42 0.99 4.32 1.22 Conscientious 5.10 0.98 4.58 1 .09 Sympathetic 5.48 0.77 4.48 1.39
Emotional State Positive 3.63 1.19 3.61 1.26
Vocal characteristics Relaxed 3.19 1.20 3.48 1.53 Pleasant 3.65 1.38 3.90 1.35 Attractive 4.03 1.05 4.13 1.20

ANOVA Results
Trait items Personality
Source Good- Brave Selfless Loyal Devoted Intelligent Strong df looking
Character (C) 1 F 77
MSE Othersa
(table continues) ANOVA Results (continued)
Trait items Personalitv Emotion Vocal characteristics
Source df Socia- Consci- Attrac- ble
Calm Curious entious
- Positive Relaxed Pleasant
Note. a Others list a significant main effect of a between-subjects factor and a significant interaction with a between-subjects factor (stimulus order, SO). * p < .OO3. * * p < ,001.
5.2.6 Results of age and gender perceptions
Table 5.8 compares participants' ratings of age and gender with the actual values
of these variables in the anime settings. Since some characters were non-human, within
the actual mime story, it was revealed that some of these characters did not age. In those
cases, reasonable age ranges were determined by the author. Ratings for age range and
gender were categorized separately in the questionnaire; however, since there were
interactions between the two in the participants' answers, they are treated together in the
table. In order to determine what percentage of participants perceived the gender of a
certain character, say AHml, as male, the reader may simply add up the columns of the
male character (in this case, 1M and 2M).
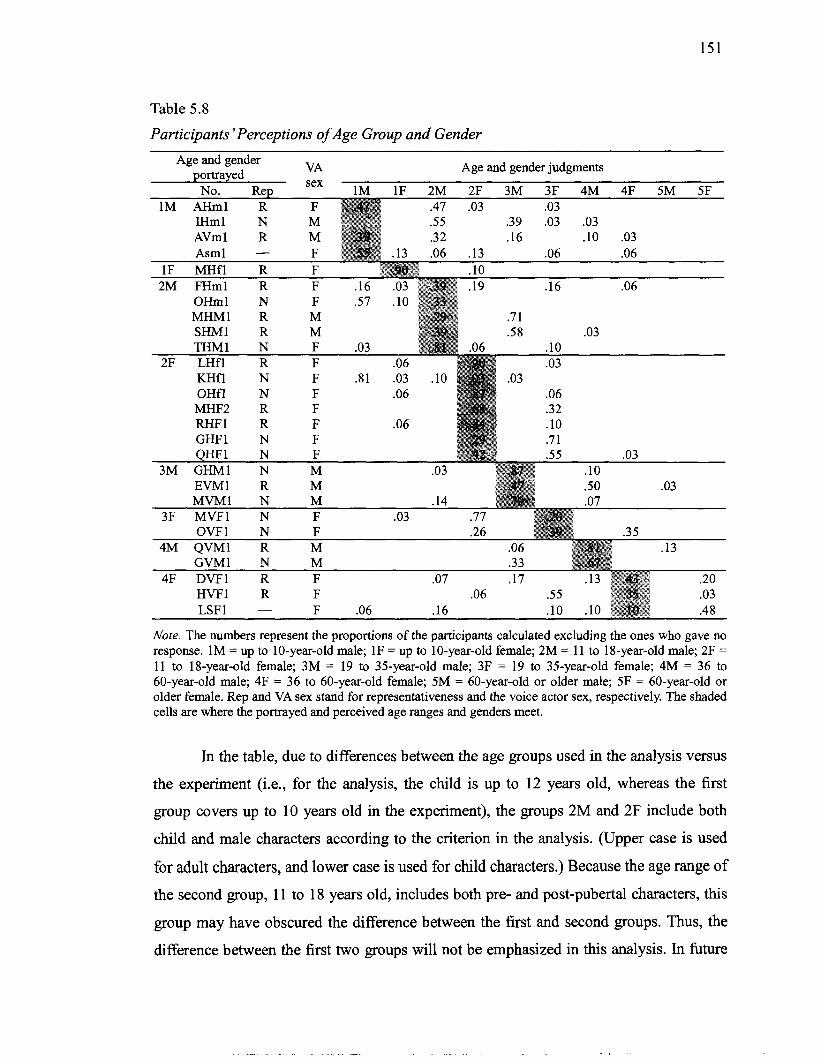
Table 5.8
Participants 'Perceptions of Age Group and Gender
Note. The numbers represent the proportions of the participants calculated excluding the ones who gave no response. 1M = up to 10-year-old male; 1F = up to 10-year-old female; 2M = 11 to 18-year-old male; 2F =
11 to 18-year-old female; 3M = 19 to 35-year-old male; 3F = 19 to 35-year-old female; 4M = 36 to 60-year-old male; 4F = 36 to 60-year-old female; 5M = 60-year-old or older male; SF = 60-year-old or older female. Rep and VA sex stand for representativeness and the voice actor sex, respectively. The shaded cells are where the portrayed and perceived age ranges and genders meet.
In the table, due to differences between the age groups used in the analysis versus
the experiment (i.e., for the analysis, the child is up to 12 years old, whereas the first
group covers up to 10 years old in the experiment), the groups 2M and 2F include both
child and male characters according to the criterion in the analysis. (Upper case is used
for adult characters, and lower case is used for child characters.) Because the age range of
the second group, 11 to 18 years old, includes both pre- and post-pubertal characters, this
group may have obscured the difference between the first and second groups. Thus, the
difference between the first two groups will not be emphasized in this analysis. In future

research, the boundary between the two may be moved up to 12 years old to clarify the
distinction for experiment participants.
In general, the perceptions are distributed over two or three consecutive age
ranges, skipping the column immediately next to it - that is, the column for the opposite
gender. However, in the case of the child characters, the perceptions are distributed over
the two genders as well. Among the characters for which age group and gender were
perceived correctly by the majority of the participants, it would be of interest to note the
possible relationship between the perceptions and the acoustic properties of the voices.
As for MHfl, who was considered by 90% of participants to be a child female, the F1
and F2 were higher than the mean of the child female group, with the exception of the F1
for /a/. FO was also higher than the mean by about 100 Hz. However, for LHfl, who was
judged to be a female between 11 and 18 years old, the situation is not so clear: perhaps
the fact that this character's FO was closer to the mean of the adult female group, and the
fact that the formant frequencies were closer to the mean of the child female group, may
account for participants' judgments. It should be also noted that this speaker was judged
to have an extremely breathy voice, the most breathy of all speakers within her group,
while in the adult female group, four out of 13 speakers were noted as being extremely
breathy. Although the perception agreement was not as high as in the case of the latter
two speakers, THMl should also be noted. In this speaker's case, it appears that a low F1
and F2 for /il and 101 relative to the child male group may have contributed to the
judgment of his being a male of between 1 1 and 18 years old. Also, his mean FO was
much lower than that of the child male group (257.3 Hz as opposed to 342.5 Hz).
By contrast, there are two speakers whose portrayed age and gender were not
identified correctly at all or identified accurately by only one participant (IHml and
KHfl). As for IHml, who was played by an adult male voice actor, more than half of the
participants identified him as being a male of between 11 and 18 years old. His vowel
formants and FO were on the whole lower than the mean values of the child male group,
but much higher than the means of the adult male group especially his F2. Since it is rare
for a 10-year-old boy, which is the age of his character in the story, to have gone through
the voice change characteristic of male puberty, the next age group would be the most
logical choice. As for KHfl, as expected, fully 94% of participants identified her as male.
In addition to the difference between F1 and F2 for /a/, which is closer to the mean value
of the child male group than that of the female (see Footnote 5 in Section 4.3), the
relatively low F1 and F2 for /i/ and 101 may have contributed to the perception that she
was a boy.
Another general tendency to note is that the perceptions may have been affected
by the real ages of the voice actors in some characters, possibly those who did not need
vigorous modifications from their original voice quality settings, unlike in the case of
child characters (e.g., MHMI, SHM1, GHF1, QHF 1).
As for the villains, listeners tended to perceive them as older than their portrayed
ages (i.e., EVM1, QVMI, DVF2, HVFl). A villainous hero's voice, LSFl was also
perceived as being older. Among these characters, it appears that those judged to have
more vigorous laryngeal sphinctering in the auditory analysis (i.e., QVM1, DVF2, LSF1)
- or in phonatory terms, extremely harsh voice - were perceived as being older than those
who exhibited pharyngeal expansion (i.e., EVMl and HVFl). As for the female speakers
with sphinctering, many were judged as being male. While for DVF2, a low F1 and F2
for /il and 101 seem to be the contributing factors in participants' perception of her as male,
for LSF 1, the relevant factor may have been intermittent creaky voice.
Lastly, according to the post-experiment questionnaire results, the single child
villain, AVml was correctly identified by 10 of the 3 1 participants as Germ-man in the
anime series Anpanman, which is thought to have had some influence on the perception
of the age group and gender for this character. However, as noted in Section 4.3, the
vowel formant frequencies of this character matched the mean range of the values for the
child male hero, which could have been the source of the agreement of this character
being younger than the adult male villains used in this experiment.
In this section, the results of age and gender perceptions in the perceptual
experiment were discussed. Generally, participants' perceptions were distributed over two
or three age groups of the same (and generally the correct) gender. The source of the high
agreement among perceptions was investigated, comparing the results from the auditory
and acoustic analyses. It was suggested that higher vowel formant frequencies and FOs
contribute to ratings of younger age groups. Some auditory cues, such as breathiness and
harshness, were considered to be the source of age and gender judgments. However, the

cues most relevant to judgment differ from character to character, possibly suggesting
that judgments are made holistically, rather than on the basis of one or two auditory or
acoustic cues.
5.2.7 Qualitative analysis of emotional labels
More than two-thirds of participants left the allotted space under the item
"positive emotion" blank. In total, ten participants gave 41 labels for 19 of the speakers.
Four male participants gave a total of 18 answers, while six female participants provided
the remaining 23. The maximum number of labels provided by a single participant was
eight; this (male) participant provided labels for almost one-third of the 27 speakers. A
female participant provided seven labels; and the remaining eight participants provided
labels for between one and five speakers. Among the 19 speakers who inspired emotional
labels, two received four labels, six received three, four received two, and seven received
one.
The labels/descriptions provided by the participants were not confined to the
emotional domain. For instance, the participant who answered the most often gave
detailed descriptions for more than half of the eight speakers he described. Translated
examples of some of his answers are: disclosing a secret; a superior giving an order to an
inferior; trying to stop somebody from doing something. However, more than half of the
labels provided by participants were emotional labels such as anger, anxiety, and surprise.
The following discussion will be confined to the speakers who received consistent labels
from two or more participants; or, for speakers who received more than one label, to
instances where at least half of the relevant participants agreed on one label or similar if
not identical labels. According to these criteria, seven speakers who received one label
were eliminated and four speakers who received two labels were also eliminated due to
the lack of agreement on the labels. The remaining eight speakers are the subject of the
following analysis. Table 5.9 summarizes the labels received by the eight speakers.

Table 5.9
Emotional Labels/Descriptions Given to Eight Speakers
Speaker No. Labelldescription
EVM1 anger (2); a superior giving an order to an inferior (1)
GVM1 suppressing emotions a (3)
HVF 1 anger (4) IHml doubt (2); trying to stop somebody from doing something (1)
LHfl anxiety (2); calm (1); disclosing secret (1)
MVF 1 anxiety (2); sadness (1)
QHF 1 persuading (2); anxiety (1) RHF 1 anxiety (3)
Note. Numbers in the parentheses "The individual answers were as emotions.
are the numbers of participants who gave the labels. follows: answering to an order; sounds like reading a news; suppressing
In the following, the relationship between the emotional labels and voice quality
judgments for each speaker is considered. The two speakers who elicited impressions of
anger, EVMl and HVF1, were judged to have expanded pharynx (lowered larynx),
alternating with intermittent laryngeal sphinctering accompanied by harsh voice.
According to Gobl and Ni Chasaide (2003), who asked judges to listen to synthesized
voices representing seven selected phonation types and judge emotions using eight
bipolar scales, tense voice and harsh voice were rated as conveying anger, along with a
variety of other emotions, including positive ones (e.g., interested, happy, confident). The
intermittent harsh voice in the above-noted speakers is thought to have contributed to the
judgments of anger. The "giving order" impression assigned to EVMl seems to be
relevant to hostile and confident judgments about tense and harsh voices in the Gobl and
Ni Chasaide study. GVMl was judged to have slight laryngeal sphinctering and had the
third-narrowest FO range among the 46 adult males (3 semitones; however, for the 5-s
stimulus, it was 2.3 semitones). Auditorily, this speaker's pitch range also conveyed an
impression of narrowness. To my knowledge, no study has investigated the speech
qualities associated with suppressed emotions; however, in this case, the narrow pitch
range seems to contribute to the impression of suppressed emotions.
The remaining five speakers were judged to have breathy voice, ranging fiom 1 to
3 on the scalar degree (average 2.2), and with the exception of QHF1, no speaker was
judged to have laryngeal sphinctering. (QHFI was judged to have slight intermittent
laryngeal sphinctering and was chosen as a non-representative hero.) In Gobl and N i
Chasaide's (2003) study, breathy voice was rated as sounding sad, timid, and afiaid as
well as relaxed, content, and so forth. The impressions of anxiety in four of the five
speakers may reflect this relationship between breathy voice and emotions such as
sadness, timidity, and fear. However, it is not easy to connect one participant's impression
of doubt and "trying to stop" for IHml, with the Gobl and N l Chasaide study results. The
impression of persuasion in QHF1, more confident than the other four speakers, may
have something to do with the slight intermittent laryngeal sphinctering that was
observed in this speaker. Considering that more than half of the hero groups received
barely above 4 (neutral) out of 7 or lower in "positive emotion," it is conceivable that the
relationship between breathy voice and negative emotions may have contributed to the
low scores. In addition, it is also possible that unusually high-pitched voices in female
and child characters may have contributed impressions of negative emotions. The
possibility of the latter is also suggested in Section 5.2.8, where the validity of the
random splicing technique is discussed in reference to the ratings of two related items,
"positive emotion" and "(vocally) relaxed."
Lastly, participants' judgments on emotions were compared with the verbal
contents of the speech excerpts of these eight speakers discussed above. It was seen that
EVMl and HVFl also expressed anger verbally, while the verbal content of MVFl 's
speech sample was identified as whining. However, for the remaining six speakers, verbal
content did not seem to correlate with participants' emotional labels.
In this subsection, fi-ee-answer emotional labels were analyzed and it was
suggested that the relationships between laryngeal sphinctering and anger and between
breathy voice and such negative emotions as sad, timid, afraid are thought to have
contributed to the assignments of anger and anxiety, respectively.
5.2.8 Discussion of the random splicing technique
In this section, the results of the perceptual experiment were analyzed both
quantitatively and qualitatively. The present study used the random splicing technique in
order to mask the content of the speech excerpts; however, this procedure was expected
to inevitably remove temporal and prosodic cues such as the relative lengths of segments
and pitch contours, which were reported to convey important paralinguistic information
in Maekawa (1998). In addition, as mentioned in Section 5.1.1, using this technique,
Scherer, Feldstein, Bond, and Rosenthal (1985) found that impressions of "relaxed" were
skewed, and they speculated that the perception of "relaxed" might be connected with
features such as pausing and tempo which are lost in random splicing. Despite this
drawback, the present experiment showed high consistency of trait ratings among
participants; Cronbach's alphas ranged between .90 and .99 for all but two items (.87 for
"sociable" and 3 0 for "positive emotion"). The effects of the epilaryngeal settings on the
participants' ratings were proved to be large. According to the ANOVA analysis results
for the data of the adult characters, a number of significant interactions emerged between
the factors of role and representativeness, directly reflecting the epilaryngeal states of the
speakers. However, in terms of the ratings for "positive emotion" and "relaxed," the
mean ratings were lower than those for the other items in general. The possibility that
these results are an artifact of the random splicing technique was discussed; in other
words, the effects of the epilaryngeal states may not have been genuine. Because of the
high correlation between these two items (see Section 6.1.2), the mean ratings for these
items were combined and reexamined. Table 5.10 orders the 27 speakers according to the
combined ratings for the items concerned and compares them with the voice types and
mean FOs.
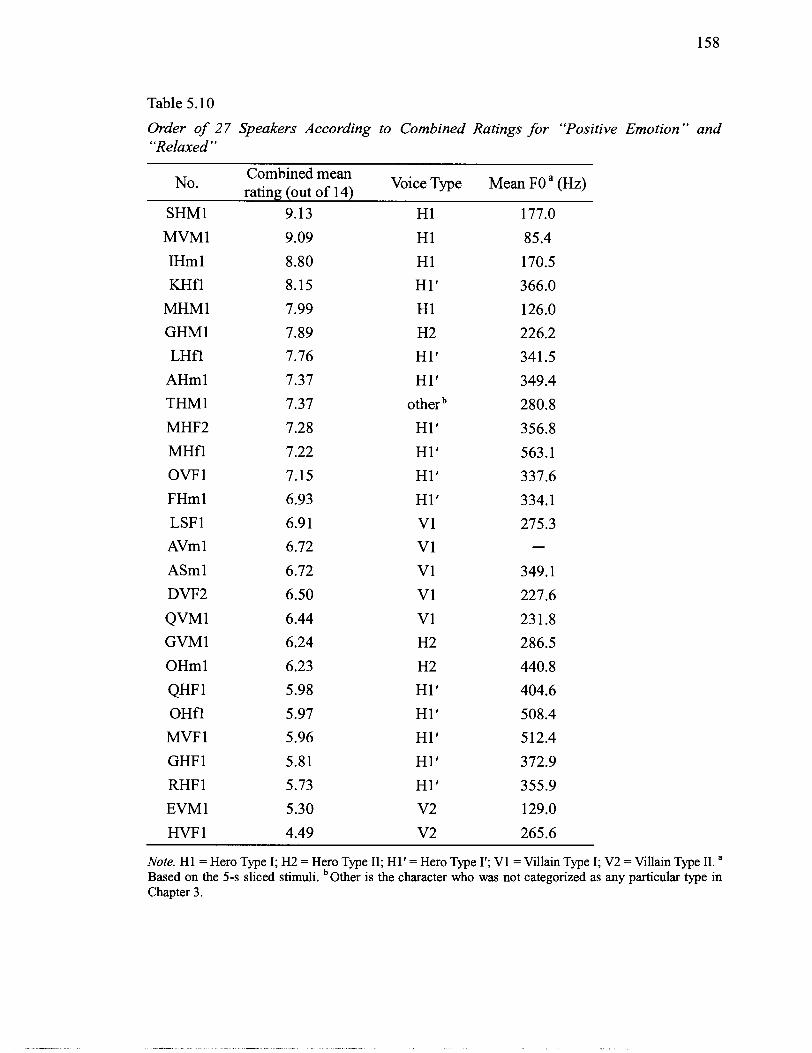
Table 5.10
Order of 27 Speakers According to Combined Ratings for "Positive Emotion" and "Relaxed"
No.
SHM1
MVM1
IHm 1
KHfl
MHM1
GHMI
LHfl
AHml
THM1
MHF2
MHfl
OVF 1
FHml
LSF 1
AVml
ASml
DVF2
QVM1
GVM1
OHml
QHF 1
OHfl
MVF 1
GHF 1
RHF 1
EVM1
HVF 1
Combined mean rating (out of 14) Voice Type Mean FO a (Hz)
7.37 H1' 349.4
7.37 other 280.8
7.28 HI' 356.8
7.22 HI' 563.1
7.15 HI' 337.6
Note. H1 = Hero Type I; H2 = Hero Type 11; H1 ' = Hero Type 1'; V1 = Villain Type I; V2 = Villain Type 11. a
Based on the 5-s sliced stimuli. is the character who was not categorized as any particular type in Chapter 3.
Table 5.10 clearly shows that voice type had effects on the ratings for these items.
The rough descending order that emerged from the combined ratings for the items
"positive emotion" and "relaxed" was heroic voices (Hero Types I, I' and 11), Villain Type
I, other heroic voices (with high pitch as mentioned later), and Villain Type 11. The top 13
speakers in this ranking are all heroic voices and of these, the males were rated higher
than the females in general. It should also be noted that only fow of 27 speakers received
higher than the midpoint (4 was the middle of each scale; see Section 5.1.3). This group
is followed by the five Villain Type I voices. Considering that this group of speakers,
among all the voice types (see Section 6.3, where the speakers except QVMl were
clustered together), received the lowest ratings for other positive items (e.g.,
"good-looking," "intelligent," "(vocally) attractive"), it is interesting that these speakers
did not receive the lowest ratings for these two items. This Villain Type I group is
followed by a mixture of heroic voice types and the two Villain Type I1 voices at the very
bottom. It should be noted that most of the heroic voices included in this group were also
very high-pitched. (Note that GVMl is an adult male played by an adult male.) These
facts may suggest that the voices with deviant characteristics in voice quality and/or pitch
could have contributed to the negative ratings for these items. It can also be seen that the
speakers who received negative emotional labels such as anger and anxiety in Section
5.2.7 (excluding LHfl) can be found in this bottom group. It is interesting to note that the
two villainous voice types were not rated equally negative; Villain Type I1 voices were
rated much more negatively than Villain Type I voices. This fact may contribute some
clues to ow understanding of the vocal communication of emotion. Lastly, as noted for
the first 13 heroic voices, males were generally rated higher than females for these items,
which can be observed in other voice types except Villain Type I, where QVMl was rated
lower than the females. However, in order to determine the true source of these
differences, that is, which effects can be attributed to voice type, pitch height, and
speaker sex, it would be necessary to compare the present results with those from
experiments using stimuli that are not random-spliced.

Chapter 6 Correlations among Auditory and Acoustic Analyses and the Perceptual Experiment
6.1 Correlations within Analyses
In this chapter, correlations among the three components of this study, namely, the
auditory analysis, the acoustic analysis, and the perceptual experiment will be examined
statistically using bivariate correlations between each pair of measures in the analyses,
and, in the case of the perceptual experiment, between items. With the exception of the
correlations between trait items in the perceptual experiment, correlations were calculated
for male and female voice actors separately because it was revealed that articulatory
behaviors differed considerably depending on the sex of the voice actors (see Section 3.3).
Before examining correlations between two different analyses, in the following
subsections, correlations among measures in each analysis will be discussed to support
the later discussion of the correlations between the three components of the study. For the
auditory analysis results, correlations were not calculated since the analysis was
performed so that combinations of settings would be consistent with physiological
constraints and the tendencies of certain settings to occur with certain other settings (e.g.,
raised larynx is accompanied by laryngeal sphinctering). Therefore, it is very likely that
components within the same voice type, for example, Villain Type I, would be
statistically related to one another.
6.1.1 Correlations among Acoustic Measures
Table 6.1 presents the correlations among the eight acoustic measures analyzed in
this study, namely, mean FO, FO range, and mean F1 and F2 for the three vowels, /a/, /i/,
and 101, for the two sexes. The raw values of these measures for each speaker as obtained
in the acoustic analysis (see Sections 4.2 and 4.3 for details) were used without
standardization. The sample sizes were n = 46 for the males and n = 42 for the females.
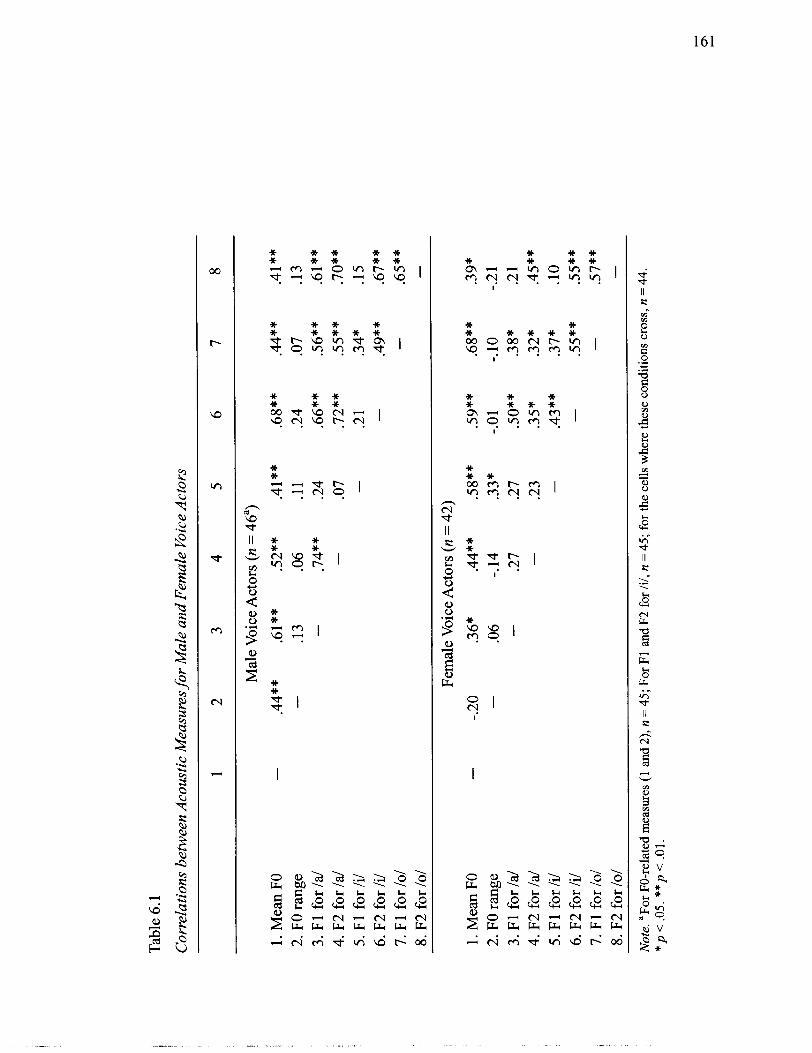
i T
able
6.1
C
orre
latio
ns b
etw
een
Aco
ustic
Mea
sure
s for
Mal
e an
d F
emal
e V
oice
Act
ors
1 2
3 4
5 6
7 8
I
1. M
ean
FO
2. FO
ran
ge
3. F
1 fo
r /a/
,
4. F
2 fo
r /a/
5. F
1 fo
r /i/
6.
F2
for /
il
7. F
1 fo
r 101
8.
F2
for 1
01
Mal
e V
oice
Act
ors
(n =
46"
) -
.44*
* .6
1**
.52*
* .4
1**
.68*
* .4
4**
.41*
* -
.13
.06
.I1
.2
4 .0
7 .1
3 -
.74*
* .2
4 .6
6**
.56*
* .6
1 **
-
.07
.72*
* .5
5**
.70*
* -
.2 1
.34*
.1
5 -
.49*
* .6
7**
-
.65*
* -
Fem
ale
Voi
ce A
ctor
s (n
= 4
2)
1. M
ean
FO
-
-.20
.36*
.4
4**
.58*
* .5
9**
.68*
* .3
9*
2. F
O ra
nge
-
.06
-. 14
.3
3*
-.01
-. 1
0 -.
2 1
3. F
1 fo
r /a/
-
.27
.27
SO**
.3
8*
.2 1
4. F
2 fo
r /a/
-
.23
.35*
.3
2*
.45*
* 5.
F1
for /
i/
-
.43 *
* .3
7*
.10
6. F
2 fo
r /i/
-
.55*
* .5
5**
7. F
1 fo
r101
-
.57*
* 8.
F2
for l
o/
-
Not
e. a
For
FO
-rel
ated
mea
sure
s (1
and
2),
n =
45;
For
Fl
and
F2 f
or /i
/, n
= 4
5; f
or th
e ce
lls w
here
thes
e co
ndit
ions
cro
ss, n
= 4
4.
*p
< .O
5. *
*p
< .0
1.
It can be said that in general, with the exception of FO range, all the acoustic
measures have weak to moderate positive correlations with one another, with mean FO
having the largest number of significant correlations. This result is reasonable, given that
FO and vowel formant frequencies are usually positively correlated (Iida, Campbell,
Higuchi, & Yasumura, 2003; Maurer, Cook, Landis, & D'heureuse, 1991). In addition, it
can be said that the correlations between FO range and the other measures are almost
negligible, except for the two significant correlations (i.e., with mean FO for males, and
F1 for /i/ for females). However, as for the correlation between mean FO and FO range,
the direction is opposite between the two sexes: positive for males, and negative for
females. It can be seen that the correlations are generally lower for the females.
6.1.2 Correlations among Perceptual Experiment Items
Next, correlations were calculated for the 21 perceptual items for all 27 speakers
used in the experiment. As for the gender identification, when encoding participants'
responses, numbers were assigned to the two genders, 1 for male and 2 for female, and
the mean was calculated for each speaker. As for the age group identification, the five age
groups used in the questionnaire (i.e., 1. 0-1 0; 2. 1 1-1 8; 3. 19-35; 4. 36-60; 5. over 6 1)
were used in the encoding, and the mean was calculated for each speaker. For the rest of
the items that had 7-point scales, the points selected by the participants were averaged for
each speaker. Table 6.2 summarizes the results.

Tab
le 6
.2
Cor
rela
tions
bet
wee
n P
erce
ptua
l Exp
erim
ent I
tem
s for
All
Spea
kers
Use
d in
the
Per
cept
ual E
xper
imen
t 1
7 7
4
5 6
7 8
9 10
-
- -
1. G
ende
r -
-.lo
-.3
8 .2
3 -.5
1*
.30
.05
.28
-.OO
-.3
6 2.
Age
-
.72*
* -.2
6 .0
4 -. 16
-.
24
-.58
**
.23
.60*
* P
hysi
cal c
hara
cter
istic
s 3.
Big
-
.16
.60*
* .0
6 .1
4 -.
34
.50*
* .8
9**
4. G
ood-
look
ing
-
.45 *
.6
9**
.76*
* .3
9*
.79*
* .1
7 P
erso
nali
ty tr
aits
5.
Bra
ve
-
.43*
.6
5**
.26
.56*
* .6
7**
6. S
elfl
ess
-
.91*
* .7
1**
.54*
* -.0
3
7. L
oyal
-
.69*
* .6
5**
.ll
8. D
evot
ed
-
.01
-.37
9. I
ntel
ligen
t -
.50*
*
10. S
tron
g 1 1
. Soc
iabl
e 12
. Cal
m
1 3. C
urio
us
14. C
onsc
ient
ious
1 5
. Sym
path
etic
16
. Pos
itive
Em
otio
n V
ocal
cha
ract
eris
tics
1 7. H
igh-
pitc
hed
1 8. L
oud
1 9. R
elax
ed
20. P
leas
ant
2 1 .
Attr
activ
e (t
able
cont
inue
s)
Y

Tab
le 6
.2 (
cont
inue
d)
11
12
13
14
15
16
17
18
19
20
2 1
1. G
ende
r .2
3 -.
I4
-.03
.0
7 .2
0 -.
41*
.62*
* .OO
-.
48*
-.I1
.0
5 2.
Age
-.
67**
-.
02
-.83
**
-.02
-.
45*
-.43
* -.7
2**
.02
-.09
-.2
6 -.2
7 P
hysi
cal c
hara
cter
istic
s 3.
Big
-.4
0*
.27
-.74*
* .2
8 -. 1
1 -.
25
-.81*
* -.0
6 .1
5 .1
9 .2
0 4.
Goo
d-lo
okin
g .4
6*
.77*
* -.
I2
.70*
* .7
8**
.18
.24
-.60*
* .3
6 .8
7**
.94*
* P
erso
nali
ty tr
aits
5.
Bra
ve
.18
.52*
* -.
lo
.59*
* .4
8*
.2 1
-.4
4*
-.I6
.3
6 .6
1**
.57*
* 6.
Sel
fles
s .6
4**
.66*
* -.0
7 .9
0**
.91*
* .1
5 .3
1 -.
44*
.06
.61*
* .6
8**
7. L
oyal
.6
2**
.75*
* .0
2 .9
3**
.93*
* .3
1 .1
9 -.4
8*
.25
.76*
* .7
8**
8. D
evot
ed
.80*
* .1
5 .4
8*
.60*
* .7
4**
.14
.63*
* .0
3 -.2
7 .2
8 .3
5 9.
Int
elli
gent
-.
04
.85*
* -.
54**
.6
9**
.52*
* .0
9 -.2
6 -.6
6**
.46*
.7
7**
.go*
* 10
. Str
ong
-.37
.23
-.56*
* .1
6 -.0
7 -.
22
-.81*
* -.0
4 .2
4 .2
7 .2
5 1 1
. Soc
iabl
e -
.23
.61*
* .4
5*
.77*
* .3
8*
.68*
* -.
05
.04
.42*
.4
5*
12. C
alm
-
-.27
.73*
* .7
1**
.47*
-.
09
-.83*
* .6
9**
.88*
* .8
5**
1 3. C
urio
us
-
-.23
.2
2 .4
9*
.59*
* .2
6 .0
5 -.O
O -.0
6 14
. Con
scie
ntio
us
-
.go*
* .1
5 .0
9 -.
45*
.12
.63*
* .6
8**
15. S
ympa
thet
ic
-
.38
.40*
-.5
0**
.28
.78*
* .8
1**
16. P
osit
ive
Em
otio
n -
.ll
-.32
.7
8**
.48*
.3
6 V
ocal
cha
ract
eris
tics
1 7. H
igh-
pitc
hed
-
.O 1
-.
29
.03
.10
18. L
oud
-
-.57
**
-.71
**
-.63*
*
19. R
elax
ed
-
.68*
* .5
5**
20. P
leas
ant
2 1.
Att
ract
ive
pp
-- - -
Not
e. n
= 2
7. *
p < .0
5. *
*p
< .0
1.
The significant correlations that emerged between gender or age and other items
roughly correspond to the significant main effects of gender and age in the series of
ANOVAs performed for the adult heroes and villains (Section 5.2.3) and for the adult and
child heroes (Section 5.2.4). Gender had a significant positive correlation with
"high-pitched," and significant negative correlations with "brave," "positive emotion,"
and "relaxed." This finding suggests that female characters were perceived to be
higher-pitched, and rated as less brave, more negative emotionally, and less relaxed. (See
Section 5.2.8 for factors other than gender that may have been involved in the
correlations between gender and "positive emotion" and "relaxed.") On the other hand,
age had significant positive correlations with "big" and "strong," and negative
correlations with "devoted," "sociable," "curious," "sympathetic," "positive emotion,"
and "high-pitched." Therefore, it can be said that the characters were perceived to be
bigger and stronger as the perceived age increased, while they were perceived to possess
lesser degrees of the other qualities. Among the eight significant correlations, "sociable"
and "positive emotion" did not show any significant main effect for the factor age in the
ANOVAs for the adult and child heroes. The results for the two traits that were not
discussed in Chapter 5 (i.e., "big" and "high-pitched") are intuitively easy to understand -
older characters tend to be bigger and have lower-pitched voices.
Turning to the correlations among the 19 adjective trait items, there were 95
significant correlations of 17 1 possible combinations of traits (55.6% of possible
combinations). In order to better understand relationships among the adjective items, a
factor analysis was performed using the mean ratings for the 19 items for each speaker.'
Principal components analysis with iteration was used, followed by varimax rotation.
When four factors were extracted with eigenvalues greater than 1, the item "curious" had
loadings on two factors in close proximity (0.08). Alternatively, when five factors were
extracted, the item "curious" became the fifth factor on its own, which seems reasonable
considering that "curious" was chosen to represent one of the five factor dimensions (i.e.,
Openness) in the NEO Personality Inventory (McCrae & Costa, 1987). The five factors
1 Hair, Anderson, Tatham, and Black (1998, p. 98-99) recommend 50 observations as a minimum sample size for a factor analysis. Due to the relatively small sample size (n = 27), the results reported here should be interpreted with caution. In future research, it would be necessary to increase the number of voices and employ a more parsimonious set of variables based on the present results.
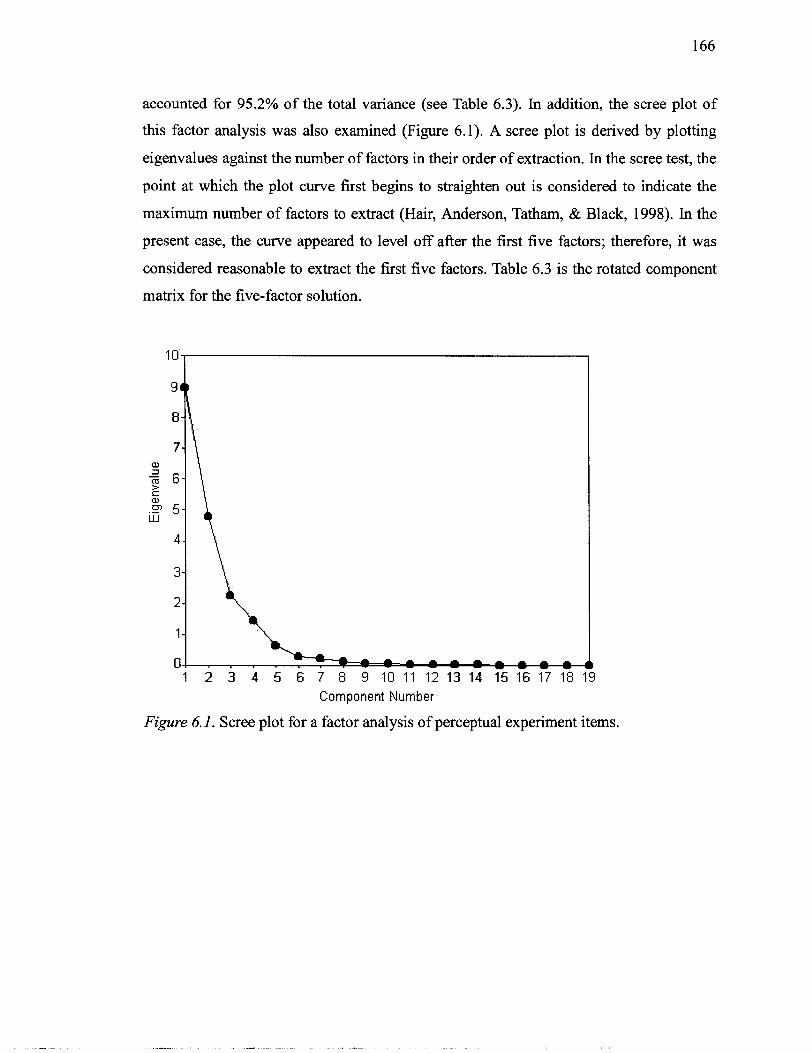
accounted for 95.2% of the total variance (see Table 6.3). In addition, the scree plot of
this factor analysis was also examined (Figure 6.1). A scree plot is derived by plotting
eigenvalues against the number of factors in their order of extraction. In the scree test, the
point at which the plot curve first begins to straighten out is considered to indicate the
maximum number of factors to extract (Hair, Anderson, Tatham, & Black, 1998). In the
present case, the curve appeared to level off after the first five factors; therefore, it was
considered reasonable to extract the first five factors. Table 6.3 is the rotated component
matrix for the five-factor solution.
Component Number
Figure 6.1. Scree plot for a factor analysis of perceptual experiment items.
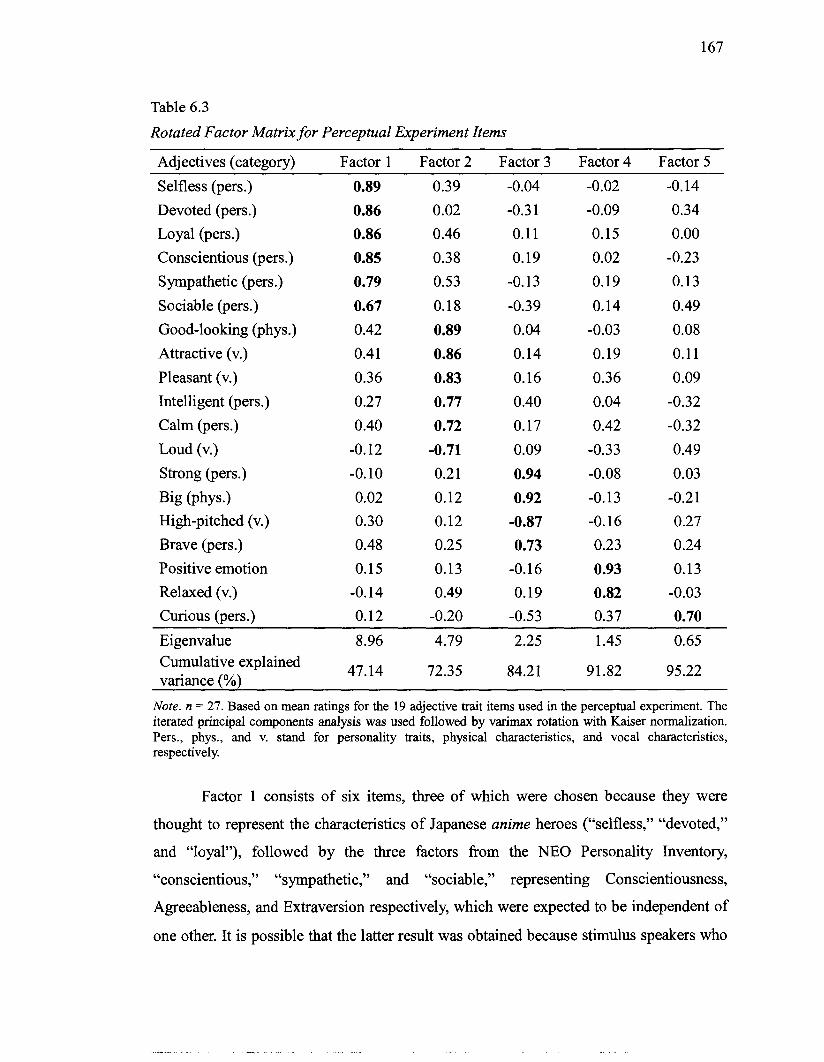
Table 6.3
Rotated Factor Matrix for Perceptual Experiment Items
Adjectives (category) Factor 1 Factor 2 Factor 3 Factor 4 Factor 5
Selfless (pers.) 0.89 0.39 -0.04 -0.02 -0.14
Devoted (pers.) 0.86 0.02 -0.3 1 -0.09 0.34
Loyal (pers.) 0.86 0.46 0.11 0.15 0.00
Conscientious (pers.) 0.85 0.38 0.19 0.02 -0.23
Sympathetic (pers.) 0.79 0.53 -0.13 0.19 0.13
Sociable (pers.) 0.67 0.18 -0.39 0.14 0.49
Good-looking (phys.) 0.42 0.89 0.04 -0.03 0.08
Attractive (v.) 0.41 0.86 0.14 0.19 0.11
Pleasant (v.) 0.36 0.83 0.16 0.36 0.09
Intelligent (pers.) 0.27 0.77 0.40 0.04 -0.32
Calm (pers.) 0.40 0.72 0.17 0.42 -0.32
Loud (v.) -0.12 -0.71 0.09 -0.33 0.49
Strong (pers.) -0.10 0.2 1 0.94 -0.08 0.03
Big (P~YS.) 0.02 0.12 0.92 -0.13 -0.2 1 High-pitched (v.) 0.30 0.12 -0.87 -0.16 0.27
Brave (pers.) 0.48 0.25 0.73 0.23 0.24
Positive emotion 0.15 0.13 -0.16 0.93 0.13
Relaxed (v.) -0.14 0.49 0.19 0.82 -0.03
Curious (pers.) 0.12 -0.20 -0.53 0.37 0.70
Eigenvalue 8.96 4.79 2.25 1.45 0.65 Cumulative explained variance (%)
47.14 72.35 84.2 1 91.82 95.22
Note. n = 27. Based on mean ratings for the 19 adjective trait items used in the perceptual experiment. The iterated principal components analysis was used followed by varimax rotation with Kaiser normalization. Pers., phys., and v. stand for personality traits, physical characteristics, and vocal characteristics, respectively.
Factor 1 consists of six items, three of which were chosen because they were
thought to represent the characteristics of Japanese anime heroes ("selfless," "devoted,"
and "loyal"), followed by the three factors from the NEO Personality Inventory,
"conscientious," "sympathetic," and "sociable," representing Conscientiousness,
Agreeableness, and Extraversion respectively, which were expected to be independent of
one other. It is possible that the latter result was obtained because stimulus speakers who
represented good versus bad characters lacked sufficient variety to represent the five
independent dimensions of the NEO Personality Inventory. Note that "sympathetic" and
"sociable" also have relatively high loadings on Factors 2 and 5 respectively. Because the
first three traits were particularly relevant to Japanese anime heroes, this factor was
named Heroicness.
Factor 2 consists of six items: one physical characteristic, "good-looking"; three
vocal characteristics, "attractive," "pleasant," and "loud," with the last item reversed; and
two personality traits, "intelligent" and "calm." As will be shown in Section 6.2.2, for
male voice actors, "loud" had a significant positive correlation (.90) with degrees of
laryngeal sphinctering, which in turn had strong negative correlations with the positive
trait items included in this factor for both sexes. (As for females, the correlation between
"loud" and laryngeal sphinctering is not significant, .20; see Section 6.2.2 for more
details.) In other words, it can be said that Factor 2 appeared to have a strong correlation
with degrees of laryngeal sphinctering in the voice. However, in the naming of this factor,
the term Desirability was adopted rather than laryngeal sphinctering, in recognition of the
desirable qualities these items share. A factor Social Desirability was extracted in Yamada,
Hakoda, Yuda, and Kusuhara's (2000) study using 3-s vocal stimuli; however, the
composites of this factor (e.g., "conscientious," "sincere," "unselfish") more closely
resemble the composites of Heroicness in the present study.
Factor 3 again consists of items from three different categories: "strong" and
"brave" from personality traits, "big" from physical characteristics, and "high-pitched"
from vocal characteristics, which is reversed. While attributes such as "strong" and
"brave" were included among the personality trait items, it is likely that participants
associated them with physical strength (however, see Section 6.2.3 for a discussion of the
possibility that these qualities did not share the same association in the case of female
voice actors). As can be seen in Table 6.2, "high-pitched" had a strong negative
correlation with "big" as well as the two other items comprising Factor 3. Therefore, this
factor was named Strength.
Factor 4 consists of two items: one is "positive emotion" and the other is
"relaxed" from the vocal characteristics. As pointed out earlier and in Section 5.2.2,
although it is possible that the random splicing technique may have affected the ratings of

these items, a relationship between positive emotion and a relaxed voice is also
reasonable. This factor was named Emotional Stability. It would be of interest to
investigate listeners' impressions of voices using vocal stimuli without random splicing
and see whether any factor comparable to Emotional Stability would emerge.
Factor 5 consists of only one item, "curious"; because of the origin of this item
(i.e., Openness from the NEO Personality Inventory), it was named Openness. From its
strong correlations with age and "big," this item may have represented youth. In cluster
analysis, where summated ratings for each of the five factors were used to classify voices
according to the participants' ratings, Cluster 2, which is characterized by the high ratings
for this factor (item "curious"), emerged, and it consisted of younger characters (see
Section 6.3 for more details).
In this subsection, the relationships among trait items used in the perceptual
experiment were investigated using bivariate correlations and a factor analysis. As for the
items gender and age group, which were not on 7-point scales, correlations were
examined from the correlation matrix. The remaining 19 items were analyzed in the
factor analysis in addition to the bivariate correlations, and five factors were extracted:
Heroicness, Desirability, Strength, Emotional Stability, and Openness. It would be of
interest to replicate the perceptual experiment with a larger number of speakers and
compare the results of the factor analysis.
6.2 Correlations between Analyses
6.2.1 Correlations between Auditory and Acoustic Measures
For the calculation of correlations between auditory and acoustic measures, the
scalar degree of each setting from the auditory analysis was used for each speaker. The
intermittent presence of a setting was assigned 0.5 scalar degrees. Others followed the
scalar degrees 0 to 3 or 0 to 2 depending on the setting, with 0 meaning absence of a
particular setting and 3 meaning an extreme degree (or 2 meaning a moderate to extreme
degree in the case of a 0 to 2 scale, such as laryngeal sphinctering). (See Section 3.1 for
more details.) As for the two pairs of settings where one setting was the opposite of
another, namely raised and lowered larynx, and open and close jaw, the scales were
combined to create raised larynx and open jaw settings respectively; within this system,
lowered larynx and close jaw were assigned a negative value. There were some settings
that were used by no more than 10% of the entire sample, that is, creaky and whispery
voices for both sexes, and nasal voice for females. Thus, these settings were eliminated
from the analysis along with other settings that did not play any role in the present
samples (see Section 3.2), which yielded 12 auditory measures for males and 11 for
females. Tables 6.4 and 6.5 present the correlations between measures fkom the auditory
and acoustic analyses for male and female voice actors respectively.

Tab
le 6
.4
Cor
rela
tions
bet
wee
n A
udito
ry a
nd A
cous
tic M
easu
res f
or M
ale
Voi
ce A
ctor
s
Aud
itory
Mea
sure
s A
cous
tic M
easu
res
Mea
n FO
FO
ran
ge
Fl
for /
a/
F2 f
or /a
/ F1
for
/i/
F2 f
or /i
l F
1 fo
r /o/
F2
for
lo/
Lon
gitu
dina
l R
aise
d la
rynx
a .4
2**
.3 1
* .3
1 *
.32*
.2
6 .2
4 .3
2*
.19
Lab
iallj
aw p
rotr
usio
n -.0
5 .1
7 -.
I9
-.I7
-.
04
-.03
.0
1 -.
20
Cro
ss-s
ectio
nal
Lip
-spr
eadi
ng
-.08
.0
8 .1
6 .4
2* *
-.09
.2 1
.40*
* .5
3**
Lip
con
stri
ctio
n -.
I3
.25
-.29
* -.
I9
.04
-.I0
-. 1
7 -.
28
Jaw
set
ting
.46*
* -.0
1 .6
6**
.47*
* .3
1 *
.35*
.4
9**
.45*
* Fr
onte
d to
ngue
bod
y .3
1*
-.07
.4
1**
.51*
* .1
6 .3
6*
.26
.46*
* R
etra
cted
tong
ue b
ody
.04
.OO
.09
.13
.06
.17
.16
.04
Lar
ynge
al s
phin
cter
.3
0*
.29
.12
.15
.18
.I1
.26
.01
Phar
ynge
al e
xpan
sion
-.
39**
-.
28
-.39
**
-.39
**
-.I3
-.
36*
-.39
**
-.26
Vel
opha
ryng
eal
Nas
al
.19
.10
.05
.07
.19
-.OO
.35*
.0
6 P
hona
tory
H
arsh
.3
5*
.37*
.1
5 .0
6 .1
8 .l
l .0
8 .O
O B
reat
hy
-.05
-.I1
.2
3 .1
7 .1
6 .1
4 -.
I1
.13
Not
e. n
= 4
6 ex
cept
mea
n FO
rel
ated
mea
sure
s (M
ean
FO
and
FO r
an e
) and
Fl
and
F2 f
or /i
/ (n
= 4
5). "
Rai
sed l
aryn
x co
mbi
nes r
aise
d la
rynx
and lo
wer
ed la
rynx
%
sett
ings
; rat
ings
of
low
ered
lary
nx w
ere
assi
gned
a n
egat
ive
valu
e.
Ope
n ja
w c
ombi
nes
open
jaw
and
clo
se ja
w s
ettin
gs; r
atin
gs o
f cl
ose
jaw
wer
e as
sign
ed a
ne
gati
ve v
alue
. *
p < .0
5. *
*p
< .0
1.
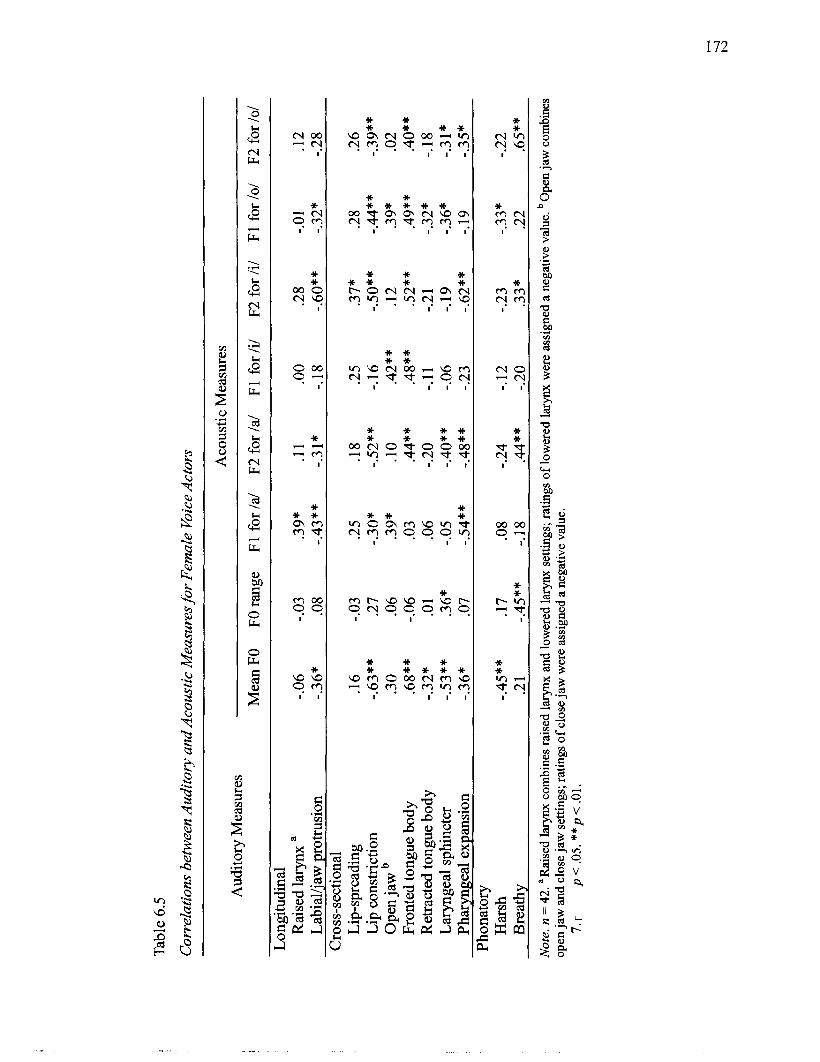
I T
able
6.5
Cor
rela
tion
s bet
wee
n A
udit
ory
and
Aco
usti
c M
easu
res f
or F
emal
e V
oice
Act
ors
Aco
ustic
Mea
sure
s A
udito
ry M
easu
res
i M
ean
FO
FO r
ange
F1
for
/a/
F2 f
or /a/
F1 f
or /i
/ F2
for
/i/
Fl
for 1
01
F2 f
or 1
01
Lon
gitu
dina
l R
aise
d la
rynx
a -.
06
-.03
.39*
.I
1 .O
O .2
8 -.0
1 .1
2 L
abia
lljaw
pro
trus
ion
-.36
* .0
8 -.
43**
-.
3 1 *
-. 1
8 -.
60**
-.3
2*
-.28
C
ross
-sec
tiona
l L
ip-s
prea
ding
.1
6 -.
03
.25
.18
.25
.37*
.2
8 .2
6 L
ip c
onst
rict
ion
-.63
**
.27
-.30
* -.
52**
-.
I6
-.50
**
-.44*
* -.3
9**
Ope
n ja
w
.30
.06
.39*
.1
0 .4
2**
.12
.39*
.0
2 Fr
onte
d to
ngue
bod
y .6
8**
-.06
.0
3 .4
4* *
.48*
* .5
2**
.49*
* .4
0**
Ret
ract
ed to
ngue
bod
y -.
32*
.01
.06
-.20
-.
I1
-.2
1 -.3
2*
-. 18
Lar
ynge
al s
phin
cter
-.
53**
.3
6*
-.05
-.
40**
-.
06
-. 19
-.36*
-.3
1 *
Phar
ynge
al e
xpan
sion
-.
36*
.07
-.54
**
-.48
**
-.23
-.
62**
-.
I9
-.35
* Ph
onat
ory
Har
sh
-.45
**
.17
.08
-.24
-.I2
-.2
3 -.3
3*
-.22
Bre
athy
.2
1
-.45
**
-.I8
.4
4**
-.20
.3
3*
-22
.65*
*
Not
e. n
= 4
2. a
Rai
sed l
aryn
x co
mbi
nes r
aise
d la
rynx
and
low
ered
lary
nx s
ettin
gs; r
atin
gs o
f low
ered
lary
nx w
ere
assi
gned
a n
egat
ive
valu
e.
Ope
n ja
w c
ombi
nes
open
jaw
and
clo
se ja
w s
ettin
gs; r
atin
gs o
f clo
se ja
w w
ere
assi
gned
a n
egat
ive
valu
e.
7.r
p<
.05
.**
p<
.01
.

In general, the correlations were weak to moderate, which may reflect the fact that
pitch and vowel formant analyses did not show any clear-cut patterns with respect to role
or voice type (see Sections 4.2 and 4.3). The number of significant correlations was fewer
for males than females (30 of 96 for males, and 40 of 88 for females). This result may be
attributable to the fact that the number of voice types identified for male and female voice
actors differed: two heroic voice types were identified for male voice actors (Hero Types
I and 11), while only one was identified for female voice actors (i.e., Hero Type If;
however, two male heroes played by female actors were assigned different voice types;
see Section 3.2). Similarly, there is one less villainous voice type for females than for
males. In addition, among females, villains who were judged to exhibit laryngeal
sphinctering or pharyngeal expansion were generally older than the majority of heroes,
who were children or adolescents (Note also that no child villain was played by a female
voice actor.) It can be surmised that a smaller number of voice types and more clear-cut
demographic differences between heroes and villains may have simplified the correlation
patterns obtained for females.
The settings comprising the heroic voice type (i.e., fionted tongue body and
breathy voice) were overall positively correlated with mean FO, F1 and F2. By contrast,
the correlations between the settings comprising villainous voice types (i.e., labial/jaw
protrusion, lip constriction, retracted tongue body, laryngeal sphinctering, pharyngeal
expansion, and harsh voice) and acoustic measures (i.e., mean FO, F1, and F2) were
negative overall. In other words, these correlation patterns suggest that in general, heroic
voice types have higher, and villainous voice types lower, values for FO, F1, and F2.
However, it is also possible that spurious correlations were brought about by other
concomitant settings within the same voice type (e.g., phonatory settings were not
expected to interact with formant frequencies; however, there were four significant
correlations between phonatory settings and formant frequencies for females.) In order to
maintain a reasonable sample size, female voice actors were not divided into subgroups
according to the age and gender of the characters, even though these variables may affect
FO and formant frequencies. (See Section 5.2.6 for possible sources of listeners'
agreement in judgment for these items.) However, in future research it would be
necessary to take these factors into account by increasing the number of characters in

each subgroup.
The correlations between laryngeal sphinctering and acoustic measures were not
consistent between the two sexes, except for the weak positive correlation with FO range.
For the remaining acoustic measures, the correlations were positive for males and
negative for females, with the latter showing a few more significant correlations. It was
expected that laryngeal sphinctering would raise Fl and, depending on the degree of
sphinctering, either raise F2 (in the case of raised larynx) or lower F2 (pharyngeal
constriction). However, the correlations for both sexes failed to reflect the expected
changes. Extensive acoustic examinations of voices with differing degrees of laryngeal
sphinctering would be necessary in future research. With respect to correlations between
pharyngeal expansion and acoustic measures, there were generally negative correlations
for both sexes. These results were expected; Villain Type I1 was most differentiated
among all the voice types in the vowel formant analysis (see Section 4.3). In addition to
pharyngeal expansion, the direction of correlations between acoustic measures and
lip-spreading, open jaw and fronted tongue body was generally consistent for the two
sexes. However, note that for tongue fronting, an increased Fl-F2 difference was
expected. The fact that, for males, the correlations between tongue fronting and F2 were
slightly stronger than those between tongue fronting and F1, may be attributable to the
increased F1 -F2 difference caused by tongue fronting. However, in females, the patterns
were not consistent for all vowels. It is possible that accompanying settings such as open
jaw setting and lip-spreading, both of which are known to raise F1, may have confounded
the correlations between tongue fronting and vowel formants. In order to identify the
effects of tongue fronting alone, it would be necessary to control other settings.
The settings that exhibited patterns of correlations with acoustic measures that
were inconsistent between the two sexes include raised larynx, labialljaw protrusion, lip
constriction, and the two phonatory settings. As for raised larynx, while the overall
pattern of positive (albeit weak) correlations with acoustic measures was expected to
emerge for males, for females, the correlations were almost nonexistent. As for the
remaining settings, as pointed out earlier in the discussion of the distribution of female
voice types and characters, the inflated significant correlations could have arisen because
of a set of accompanying settings within the same voice type. However, among these

settings, labialljaw protrusion and lip constriction were expected to lower formants - an
effect that was confirmed by the significant negative correlations observed in females.
For males, the correlations for these settings were almost nonexistent. Lastly, the
correlations between nasalization and acoustic measures were also very weak.
In this subsection, correlations between voice quality settings and acoustic
measures were calculated. Correlation patterns between acoustic measures and
pharyngeal expansion, lip spreading, jaw opening, and tongue body fronting were
consistent between the two sexes. However, the direction of correlations between
laryngeal sphinctering (the setting identified as playing an important role in
differentiating heroic and villainous voices) and acoustic measures was not consistent
between the two sexes. Further investigations employing voices differing in degrees of
laryngeal sphinctering would be necessary in order to determine the relationship between
the auditory and acoustic correlates of this setting. In addition, it would be ideal to collect
a number of female speakers playing a variety of roles differing in age and gender, and
analyze them according to subgroups reflecting the age and gender of the characters.
6.2.2 Correlations between Auditory Measures and Perceptual Experiment Items
For the correlation analysis between auditory measures and the perceptual
experiment items, only the 27 speakers used in the perceptual experiment were included,
comprising nine male and 18 female speakers. Because the sample sizes were small,
more careful interpretation of the following results is necessary. Correlations were
calculated between the 21 perceptual experiment items and the 11 auditory measures for
the two sexes. In addition to the settings excluded from Section 6.2.1, nasalization, which
was included only for males, was removed from males because there was only one
speaker exhibiting nasalization among the nine speakers used in the perceptual
experiment. Tables 6.6 and 6.7 present the results of the analysis.

Tab
le 6
.6
Cor
rela
tions
bet
wee
n A
udito
ry M
easu
res
and
Per
cept
ual E
xper
imen
t Ite
ms f
or M
ale
Voi
ce A
ctor
s
Aud
itory
Mea
sure
s
Lat
itudi
nal
Cro
ss-s
ectio
nal
Phon
ator
y
Rai
sed
Prot
ru-
Lip
L
ip
Phar
. T
rait
Item
s O
pen
Fron
ted
Ret
ract
ed
Sphi
ncte
r E
npan
s.
Har
sh
Bre
athy
la
rynx
a si
on
spre
ad
cons
tr.
jaw
G
ende
r .1
4 .1
9 .5
4 .1
9 .2
9 -.
04
.35
.19
-.06
.32
.43
Age
.0
2 .2
2 -.
57
.22
-.25
-.36
.0
6 .2
4 -.
28
.06
-.46
Phys
ical
cha
ract
eris
tics
Big
-.2
5 .1
3 -.
60
.13
-.59
.04
-.35
-.
I8
.25
-.I5
-.2
4 G
ood-
look
ing
-.69
* -.
67*
-.37
-.
67*
-.64
.8
3**
-.89
**
-.95*
* .8
7**
-.78
* .5
8 Pe
rson
ality
trai
ts
Bra
ve
-SO
-.
I7
-.70
* -.
17
-.75
* .3
2 -.
68*
-.54
.58
-.42
.2
1 Se
lfle
ss
-.35
-.4
9 -.
91**
-.4
9 -.2
9 .1
6 -.
69*
-.41
.25
-.44
.4
8 L
oyal
-.6
6 -.6
1 -.
88**
-.6
1 -.5
5 .3
7 -.
83**
-.
71*
.55
-.70
* .6
1 D
evot
ed
.15
.24
-.58
.2
4 .0
6 -.
64
.15
.3 1
-.29
.2
2 .0
9 In
telli
gent
-.
71*
-.58
-.
38
-.58
-.
75*
.8 1
**
-.8 1
**
-.86*
* .7
9*
-.74
* .4
4 St
rong
-.3
6 .0
8 -.
52
.08
-.73*
.2
7 -.
49
-.4 1
.5
5 -.2
4 .O
1 So
ciab
le
-.05
-.49
-.
43
-.49
.30
.04
-.48
-.25
.0
8 -.2
3 .5
6 C
alm
-.
62
-.77
* -.
39
-.77
* -.5
2 .8
7**
-.9
1 **
-.88
**
.73*
-.
78*
.52
Cur
ious
.3
3 .0
3 .4
1 .0
3 .6
0 -. 11
.1
6 .1
7 -.
I1
.29
.36
Con
scie
ntio
us
-.57
-.45
-.9
0**
-.45
-.5
7 .2
3 -.6
3 -.
51
.36
-.59
.3
7 Sy
mpa
thet
ic
-SO
-.
63
-.61
-.
63
-.4 1
.6
0 -.
91**
-.
76*
.67*
-.
60
.71*
Po
sitiv
e E
mot
ion
-.03
-.
70*
.03
-.70
* .3
8 .5
4 -.5
9 -.
35
.14
-.29
.5
2 V
ocal
cha
ract
eris
tics
Hig
h-pi
tche
d .0
2 -.
44
.3 1
-.44
.5
2 -.
04
.12
-.03
-.
22
-.I9
.1
9 L
oud
.58
.80*
.2
6 .8
0*
.42
-.88
**
.81*
* .9
0**
-.76
* .7
8*
-.66
Rel
axed
-.3
5 -.
71*
-.03
-.
71*
-.20
.92*
* -.
8 1 *
* -.7
5*
.65
-.55
.5
5 Pl
easa
nt
-.63
-.
65
-.32
-.
65
-.56
.8
5**
-.89
**
-.92
**
.85*
* -.
73*
.56
Attr
activ
e -.
58
-.54
-.27
-.
54
-.61
.83*
* -.
85**
-.
87**
.8
6**
-.63
.5
8
Not
e. N =
9. "
Rai
sed
lary
nx c
ombi
nes
rais
ed la
rynx
and
low
ered
lary
nx s
ettin
gs; l
ower
ed l
aryn
x ra
tings
wer
e as
sign
ed a
neg
ativ
e va
lue.
bo
pen
jaw
com
bine
s op
en ja
w a
nd c
lose
jaw
set
tings
; clo
se ja
w r
atin
gs w
ere
assi
gned
a n
egat
ive
valu
e.
7.r
p
< .0
5. *
*p
< .0
1.
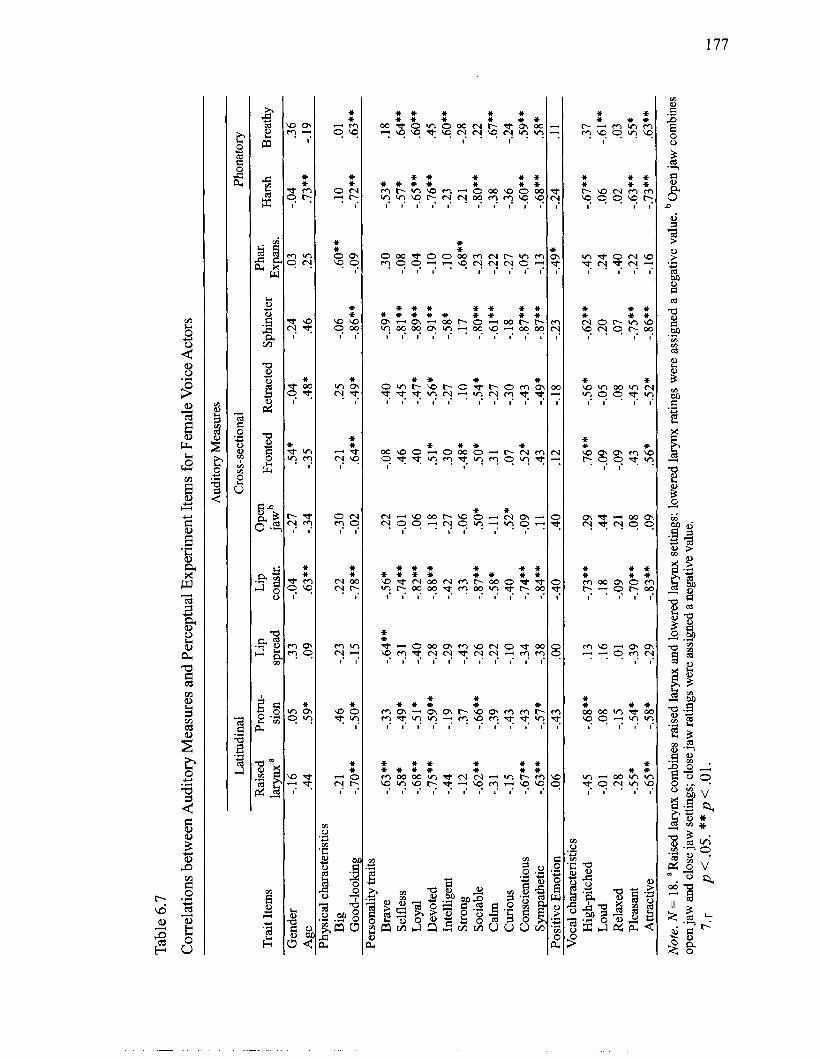
Tab
le 6
.7
Cor
rela
tions
bet
wee
n A
udito
ry M
easu
res a
nd P
erce
ptua
l Exp
erim
ent I
tem
s fo
r Fem
ale
Voi
ce A
ctor
s
Aud
itory
Mea
sure
s
Lat
itudi
nal
Cro
ss-s
ectio
nal
Pho
nato
ry
Rai
sed
Prot
ru-
Lip
L
ip
Ope
n T
rait
Item
s Fr
onte
d R
etra
cted
Sp
hinc
ter
Enp
ans.
H
arsh
B
reat
hy
lary
nx a
sion
sp
read
co
nstr
. ja
w
Gen
der
-.I6
.0
5 .3
3 -.
04
-.27
.5
4*
-.04
-.24
.03
-.04
.36
Age
.4
4 .5
9*
.09
.63*
* -.
34
-.35
.4
8*
.46
.25
.73*
* -.
I9
Phy
sica
l cha
ract
eris
tics
Big
-.
2 1
.46
-.23
.2
2 -.
30
-.21
.2
5 -.
06
.60*
* .1
0 .0
1 ~
oid
-lo
ok
ing
-.
70**
-.
50*
-.I5
-.
78**
-.0
2 .6
4**
-.49
* -.
86**
-.
09
-.72
**
.63*
* P
erso
nali
ty tr
aits
B
rave
S
elfl
ess
Loy
al
Dev
oted
In
telli
gent
S
tron
g S
ocia
ble
Cal
m
Cur
ious
C
onsc
ient
ious
Sy
mpa
thet
ic
-.63*
* -.5
7*
-.38
-.
84**
.l
l .4
3 -.
49*
-.87
**
-.I3
-.
68**
.5
8*
Pos
itiv
e E
mot
ion
.06
-.43
.OO
-.4
0 .4
0 .1
2 -.
I8
-.23
-.
49*
-.24
.ll
Voc
al c
hara
cter
istic
s H
igh-
pitc
hed
-.45
-.
68**
.1
3 -.
73**
.2
9 .7
6**
-.56
* -.
62**
-.
45
-.67
**
.37
Lou
d -.
01
.08
.16
.18
.44
-.09
-.
05
.20
.24
.06
-.61*
* R
elax
ed
.28
-.15
.O
1
-.09
.2 1
-.09
.0
8 .0
7 -.4
0 .0
2 .0
3 Pl
easa
nt
-.55
* -.
54*
-.39
-.
70**
.0
8 .4
3 -.
45
-.75
**
-.22
-.
63**
.5
5*
Attr
activ
e -.6
5**
-.58
* -.
29
-.83*
* .0
9 .5
6*
-.52
* -.
86**
-.
I6
-.73
**
.63*
*
Not
e. N
= 1
8. a
Rai
sed
lary
nx c
ombi
nes
rais
ed l
aryn
x an
d lo
wer
ed la
rynx
set
tings
; low
ered
lary
nx r
atin
gs w
ere
assi
gned
a n
egat
ive
valu
e. b
op
en ja
w c
ombi
nes
open
jaw
and
clo
se ja
w s
ettin
gs; c
lose
jaw
rat
ings
wer
e as
sign
ed a
neg
ativ
e va
lue.
7. r
p <
.O5.
**
p < .0
1.
In general, significant correlations between auditory measures and perceptual
experiment items seemed to appear for personality traits and vocal characteristics rather
than for gender, age or physical size ("big"). (However, it should also be noted that the
male voice actor group did not vary as widely as the female voice actor group with regard
to age and gender portrayed.) Another general tendency was that while the components of
heroic voice types (i.e., tongue body fronting for males; pharyngeal expansion for
females; breathy voice for both sexes) correlated positively with favorable physical traits,
personality traits and vocal characteristics, the components of villainous voice types (e.g.,
raised larynx, laryngeal sphinctering, tongue body retracting, and harsh voice) had
negative correlations with the same set of items. Although the strength of the correlations
between the villainous voice components and trait items differed according to setting and
the sex of the speaker group, because the correlation direction was consistent among
these settings, the present discussion will focus on laryngeal sphinctering.
Although laryngeal sphinctering did not have many significant correlations with
acoustic measures, it had a number of moderate to strong significant correlations with
many more trait items in the perceptual experiment. The direction of correlations was
negative, that is, an increased degree of laryngeal sphinctering elicited lower ratings of
favorable traits. The number of significant correlations that emerged in the analysis was
larger for females than for males. Whereas in males, retracted tongue body (judged to be
present in the speakers with laryngeal sphinctering) had two more significant correlations
with trait items (i.e., 11 significant correlations out of 21 items), for females, the number
of significant correlations with trait items was the largest for laryngeal sphinctering and
lip constriction (13 items), followed by harsh (12 items). This difference between the
sexes can be attributed to the following two facts. Firstly, the female speakers exhibiting
laryngeal sphinctering were more or less homogenous (see also Section 6.2. I), whereas
the male speakers were not. In cluster analysis, the female speakers exhibiting moderate
to extreme laryngeal sphinctering (Asml, DVF2, and LSFI) were classified together,
while the male speakers exhibiting the same degree of sphinctering (Avml and QVM1)
were not. While Avml was classified with the female speakers with laryngeal
sphinctering, QVMl was classified with EVMI, a Villain Type I1 voice exhibiting
pharyngeal expansion (and intermittent laryngeal sphinctering) (see Section 6.3 for more
details). Secondly, intermittent laryngeal sphinctering in Hero Type I1 voices was
reflected in the ratings for males, while the slight intermittent laryngeal sphinctering
noted for non-representative Hero Type I' was not reflected in the females' ratings
because the degree of sphinctering for the females was judged to be very small. However,
because the auditory correlate of the laryngeal sphinctering judged to be present in Hero
Type I1 voices was mainly that of a projected voice rather than strong pharyngealization
(see Section 3.2. I), these characters' voices may have triggered more positive responses
from participants as compared to those with more vigorous laryngeal sphinctering. These
factors may have obscured the correlations between laryngeal sphinctering and negative
traits. The fact that tongue retraction, which was not noted for Hero Type I1 voices but
was an attribute of Villain Type I, had a couple more negative correlations with positive
attributes could also support the latter claim. As mentioned in Section 3.1, the laryngeal
sphincter is involved in a range of articulations, contributes to the ringing of the voice,
and is also used in various singing styles. Thus, it is possible that the auditory/perceptual
correlates of this activity are non-linear and that a slight degree of laryngeal sphinctering
may not trigger the same negative impressions as a more extreme degree of laryngeal
sphinctering. However, in order to test this hypothesis, it would be necessary to have
listeners listen to perceptual stimuli differing only in degrees of laryngeal sphinctering
and have them rate their impressions of the voices.
Pharyngeal expansion did not have many significant correlations with trait items:
seven for males, and three for females. Besides, the items that had significant correlations
with pharyngeal expansion differed between the two sexes. For males, "good-looking,"
"intelligent," "calm," "sympathetic," "pleasant," and "attractive" were positively, and
"loud" negatively, correlated with pharyngeal expansion. In females, "big" and "strong"
were positively and "high-pitched" negatively correlated. In other words, for males, the
items correlated with pharyngeal expansion were all composites of Factor 2, Desirability,
whereas for female, the items were the composites of Factor 3, Strength. In females, the
voice quality setting that was more correlated with the composites of Desirability was
breathy voice. This sex difference makes sense, given the composites of the heroic voice
types for the two sexes; whereas pharyngeal expansion was an essential component of
Hero Type I voices, breathy voice was essential to Hero Type I' voices. However, it
should be noted that only three of the 17 female speakers used in the experiment
exhibited pharyngeal expansion; therefore, in the perceptual experiment, it would be
necessary to use more speakers exhibiting different degrees of pharyngeal expansion in
order to examine the relationship between this setting and trait items in females. As
mentioned earlier, in the case of males, pharyngeal expansion, tongue fronting, and to a
lesser extent, breathy voice shared the direction of correlations with trait items, whereas
in the case of females, only breathy voice and tongue fronting shared the same direction
of correlation, not pharyngeal expansion.
As for the remaining settings, one significant correlation was shared by the two
sexes: a negative correlation between lip spreading and "brave." As for the other
significant correlations, it would be necessary to be cautious in their interpretation
because of the small sample sizes.
In this subsection, it was shown that there were moderate to strong negative
correlations between laryngeal sphinctering and positive traits, and between other related
settings that interact with laryngeal sphinctering (e.g., tongue retraction, harsh voice) and
positive traits. The significant correlations between pharyngeal expansion and trait items
were fewer. Further investigations would be necessary to determine the relationship
between each voice quality setting and the attribution of traits in the perceptual
experiment.
6.2.3 Correlations between Acoustic Measures and Perceptual Experiment Items
In order to compare acoustic measures and perceptual experiment items, the
acoustic correlates of pitch and loudness, that is, FO and intensity, were also measured for
the 5-s random-spliced stimuli. A frame length of 10 ms was used for both analyses. The
mean FO and FO range for the 5-s stimuli replaced those obtained from the entire
noise-free speech samples. Correlations were calculated between 10 acoustic measures
and the 2 1 perceptual experiment items for the two sexes (Tables 6.8 and 6.9).
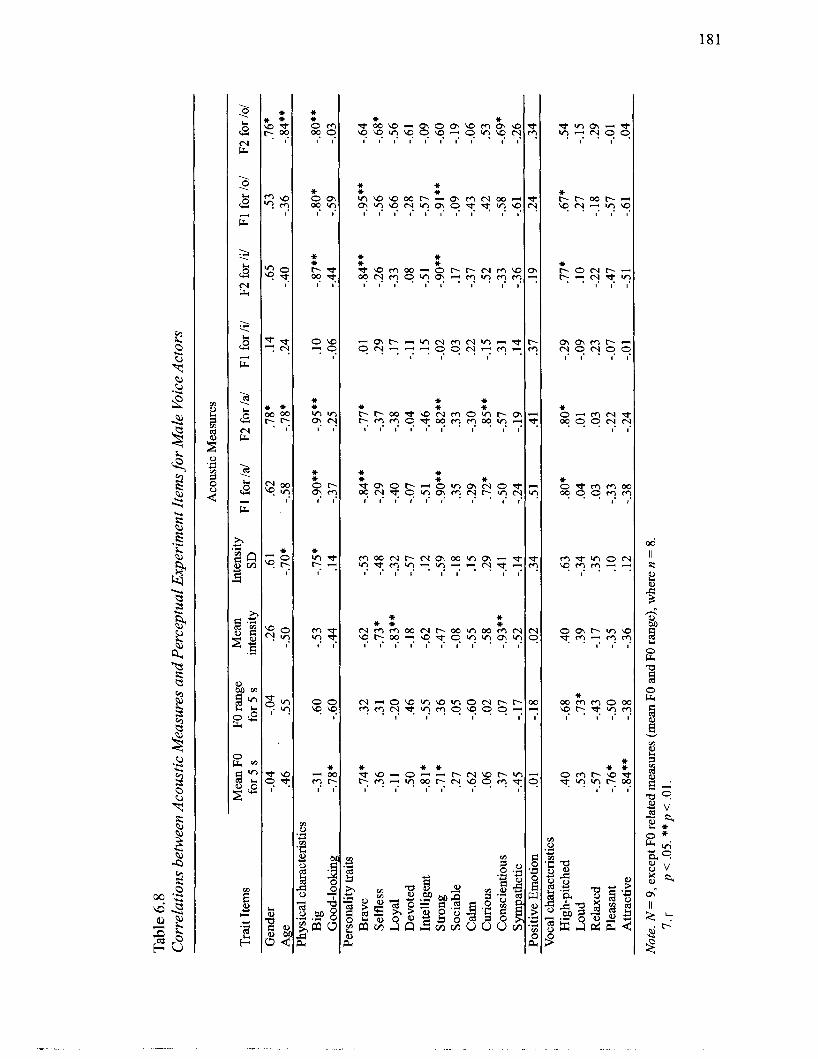
Tab
le 6
.8
Cor
rela
tions
bet
wee
n A
cous
tic M
easu
res
and
Per
cept
ual E
xper
imen
t Ite
ms f
or M
ale
Voi
ce A
ctor
s
Aco
ustic
Mea
sure
s
Mea
n FO
FO
ran
ge
Mea
n In
tens
ity
Tra
it It
ems
for
5 s
inte
nsity
SD
F
1 fo
r /a
/ F2
for
/a/
F 1
for /i
/ F2
for
/il
F 1
for
lo1
F2 f
or 10
1 fo
r 5
s G
ende
r -.
04
-.04
.2
6 .6
1 .6
2 .7
8*
.14
.65
.53
.76*
A
ge
.46
.55
-.50
-.
70*
-.58
-.
78*
.24
-.40
-.3
6 -.
84**
P
hysi
cal c
hara
cter
istic
s B
ig
-.3 1
.6
0 -.
53
-.75
* -.
90**
-.
95**
.1
0 -.
87**
-.
go*
-.80*
* G
ood-
look
ing
-.78
* -.
60
-.44
.1
4 -.
37
-.25
-.06
-.4
4 -.
59
-.03
P
erso
nalit
y tr
aits
B
rave
-.
74*
.32
-.62
-.53
-.8
4**
-.77*
.0
1 -.
84**
-.
95**
-.
64
Self
less
.3
6 .3
1 -.7
3*
-.48
-.
29
-.37
.2
9 -.
26
-.56
-.
68*
Loy
al
-.I1
-.
20
-.83
**
-.32
-.40
-.38
.1
7 -.
33
-.66
-.56
D
evot
ed
.50
.46
-.I8
-.5
7 -.
07
-.04
-. 11
.0
8 -.2
8 -.
61
Inte
llige
nt
-.8 1
* -.
55
-.62
.1
2 -.5
1
-.46
.1
5 -.5
1
-.57
-.
09
Stro
ng
-.71
* .3
6 -.
47
-.59
-.90
**
-.82
**
-.02
-.9
0**
-.91
**
-.60
So
ciab
le
.27
.05
-.08
-.I8
.3
5 .3
3 .0
3 .1
7 -.
09
-. 19
Cal
m
-.62
-.
60
-.55
.15
-.29
-.3
0 .2
2 -.
37
-.43
-.0
6 C
urio
us
.06
.02
.58
.29
.72*
.8
5**
-.I5
.5
2 .4
2 .5
3 C
onsc
ient
ious
.3
7 .0
7 -.
93**
-.
4 1
-SO
-.
57
.3 1
-.
33
-.58
-.69
* Sy
mpa
thet
ic
-.45
-.
I7
-.52
-.
I4
-.24
-.I9
.1
4 -.
36
-.61
-.26
P
osit
ive
Em
otio
n .0
1 -.
I8
.02
.34
.5 1
.4 1
.37
.19
.24
.34
Voc
al c
hara
cter
istic
s H
igh-
pitc
hed
.40
-.68
.4
0 .6
3 .8
0*
.80*
-.
29
.77*
.6
7*
.54
Lou
d .5
3 .7
3*
.39
-.34
.0
4 .O
1 -.0
9 .1
0 .2
7 -.
I5
Rel
axed
-.
57
-.43
-.
I7
.35
.03
.03
.23
-.22
-.I8
.2
9 P
leas
ant
-.76
* -.
50
-.35
.10
-.33
-.
22
-.07
-.
47
-.57
-.
01
Att
ract
ive
-.84
**
-.38
-.
36
.12
-.38
-.
24
-.01
-.5
1
-.61
.04
Not
e. N
= 9
, exc
ept F
O re
late
d m
easu
res
(mea
n FO
and
FO r
ange
), w
here
n =
8.
7. r
p <
.05.
**
p <
.01.
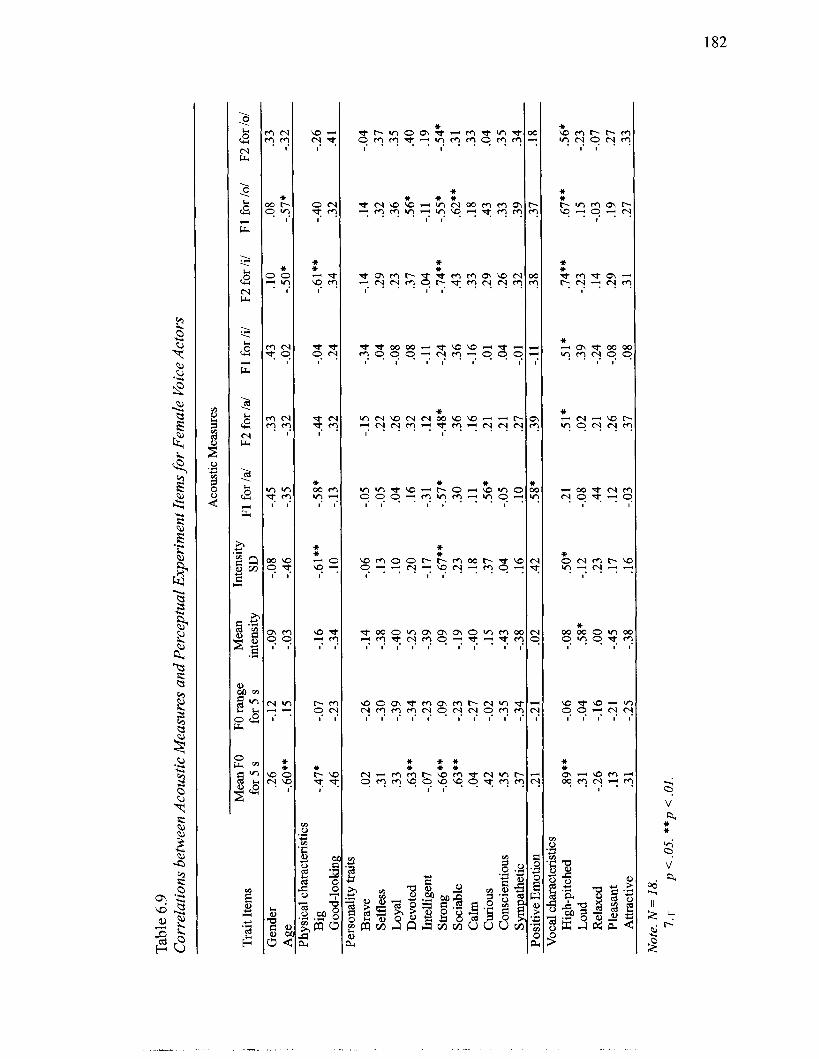
Tab
le 6
.9
Cor
rela
tions
bet
wee
n A
cous
tic M
easu
res
and
Per
cept
ual E
xper
imen
t Ite
ms f
or F
emal
e V
oice
Act
ors
Aco
ustic
Mea
sure
s
Mea
nFO
FO
ran
ge
Mea
n In
tens
ity
Tra
it It
ems
for
5 s
inte
nsity
SD
F
1 fo
r /a/
F2
for
la/
F1 f
or /i
/ F2
for
/i/
F 1
for 1
01
F2 f
or lo
/ fo
r 5 s
G
ende
r .2
6 -.
I2
-.09
-.
08
-.45
.3
3 .4
3 .1
0 .0
8 .3
3 A
ge
-.60*
* .1
5 -.
03
-.46
-.
35
-.32
-.
02
-.50
* -.
57*
-.32
Ph
ysic
al c
hara
cter
istic
s B
ig
-.47
* -.
07
-.I6
-.
61**
-.
58*
-.44
-.
04
-.61*
* -.4
0 -.
26
Goo
d-lo
okin
g .4
6 -.
23
-.34
.1
0 -.
I3
.32
.24
.34
.32
.4 1
Pers
onal
ity tr
aits
B
rave
.0
2 -.
26
-.I4
-.
06
-.05
-.
I5
-.34
-. 14
.1
4 -.
04
Self
less
.3
1 -.3
0 -.
38
.13
-.05
.2
2 .0
4 .2
9 .3
2 .3
7 L
oyal
.3
3 -.
39
-.40
.1
0 .0
4 .2
6 -.0
8 .2
3 .3
6 .3
5 D
evot
ed
.63*
* -.
34
-.25
.2
0 .1
6 .3
2 .0
8 .3
7 .5
6*
.40
Inte
llige
nt
-.07
-.
23
-.39
-.I7
-.
3 1
.12
-. 11
-.04
-.
I1
.19
Stro
ng
-.66*
* .0
9 .0
9 -.6
7**
-.57
* -.
48*
-.24
-.
74**
-.
55*
-.54
* So
ciab
le
.63*
* -.
23
-.I9
.2
3 .3
0 .3
6 .3
6 .4
3 .6
2**
.3 1
Cal
m
.04
-.27
-.
40
.18
.ll
.16
-.I6
.3
3 .1
8 .3
3 C
urio
us
.42
-.02
.1
5 .3
7 .5
6*
.2 1
.O 1
.29
.43
.04
Con
scie
ntio
us
.35
-.35
-.
43
.04
-.05
.2 1
.04
.26
.33
.35
Sym
path
etic
.3
7 -.
34
-.38
.16
.10
.27
-.01
.3
2 .3
9 .3
4 Po
sitiv
e E
mot
ion
.21
-.2 1
.0
2 .4
2 .5
8*
.39
-. 11
.38
.37
.18
Voc
al c
hara
cter
istic
s H
igh-
pitc
hed
.89*
* -.0
6 -.
08
.50*
.2
1 .5
1*
.5 1 *
.7
4**
.67*
* .5
6*
Lou
d .3
1 -.
04
.58*
-.
I2
-.08
.02
.39
-.23
.1
5 -.
23
Rel
axed
-.
26
-. 16
.O
O .2
3 .4
4 .2
1 -.
24
.14
-.03
-.
07
Plea
sant
.1
3 -.
21
-.45
.1
7 .1
2 .2
6 -.
08
.29
.19
.27
Attr
activ
e .3
1 -.
25
-.38
.16
-.03
.3
7 .0
8 .3
1 .2
7 .3
3
Not
e. N
= 1
8.
7. r
p <
.05.
**p
< .O
I.

The number of significant correlations between acoustic measures and perceptual
items was much smaller than that seen in the comparison of auditory measures and
perceptual experiment items, as outlined in the previous subsection. However, a common
pattern of correlations emerged for several items in both sexes: with the trait items
categorized in Factor 3, Strength, in the factor analysis, namely "big," "brave," "strong,"
and "high-pitched"; gender; the single composite of Factor 5, Openness, "curious"; and to
a lesser extent, "positive emotion," which is a component of Factor 4, Emotional Stability
(see Section 6.1.2 for each factor). The direction of correlations was positive for
"curious," "positive emotion," and "high-pitched," and negative for the remaining items.
First of all, "big" had strong significant negative correlations with five of the six
vowel formant frequencies for males and moderate significant negative correlations with
two formant frequencies for females. This result replicated Fitch's (1994) finding that
vowel formant frequencies as well as FO provide information on body size. (As for mean
FO, the correlation with "big" was not significant for males but weak for females; see,
however, the discussion of males' mean FO below.) Parallel tendencies were observed for
the items "brave" and "strong" among the males, but only for "strong" for females. The
difference in the strength of the correlations may be attributable to the fact that they
represented different characteristics for the participants when judging female actors'
voices, but were synonymous when judging male actors' voices. According to the results
of an exploratory correlation analysis using perceptual experiment items for female voice
actors' voices alone, the item "brave" had higher correlations with the items classified in
Factor 1, Heroicness. Although the standard deviation for intensity had significant
negative correlations with "big" for both sexes, the results should be interpreted with
some caution, because it is doubtful whether the standard deviations for intensity
influenced participants' perceptions. The same cautionary note would apply to FO range.
As for the perception of pitch, mean FO had a significant positive correlation with
"high-pitched" in the case of females, but not in the case of males. The raw data were
examined, and it was revealed that QVMl, who exhibited consistent aryepiglottic trilling,
was perceived to have the lowest-pitched of the nine male voice actors' voices (mean
rating 1.74 out of 7), whereas the mean FO for the 5-s stimuli was 211.6 Hz, the
third-highest of the nine. Presumably, participants' judgments of pitch height were
based on the subharmonic of this voice, whereas the measurement of FO was based on the
vocal fold vibration (e.g., mean FO, 211.6 Hz). Bergan and Titze (2001) reported that
listeners were sensitive to even a small percentage of the frequency modulation of a
subharmonic and tended to perceive the pitch of the voice as being lower than the actual
fundamental. In the present sample, when QVMl was removed, the correlation between
mean FO and "high-pitched" improved, although it was not significant (r = .72, p = .07).
It is interesting to note that formant frequencies had stronger correlations with
"high-pitched" for males than for females.
As for the perception of loudness, whereas a moderate correlation between "loud"
and mean intensity was found for females (r = .58), the correlation was not significant for
males (r = .39). Instead, laryngeal sphinctering had a strong correlation with "loud" (r
= .90) for males, but not for females (r = .20). Table 6.10 compares the mean ratings for
"loud" with mean intensities, and ratings for laryngeal sphinctering and breathiness from
the auditory analysis for female voice actors. The speakers are ranked in descending
order of loudness ratings.

Table 6.10
Mean Ratings of "Loud," Mean Intensity, and Ratings for Laryngeal Sphinctering and Breathiness.
Mean Rating for "Loud" Mean No. Breathiness Sphinctering
tensit it^ (dB) (out of 2) (out of 3) (out of 7)
MHfl
HVF 1
Ohfl
Asml
QHF 1
THM1
LSF 1
Ohm1
KHfl
GHF 1
DVF2
FHml
MVF 1
Ahml
MHF2
OVF 1
RHF 1
LHfl
The highest ten ratings were occupied mostly by those who either received ratings for
laryngeal sphinctering or who were judged to exhibit sphinctering even though the ratings
did not reflect it (Ohfl , QHF 1, KHfl , and GHF 1). MHfl 's mean intensity was the highest
of the 17 female speakers, which by itself supports the positive correlation between mean
intensity; however, more importantly, although it was not noted at the time of the
stimulus selection, this speaker seemed to project her voice, possibly with laryngeal
sphinctering (see Section 4.4 for a spectrogram of this voice). The moderate negative
correlation between breathy voice and "loud" is also thought to support the relationship
between laryngeal sphinctering and loudness; the speakers who received the ten-highest
ratings were judged to be less breathy or not breathy, and the ones who received higher
breathiness ratings were lower-ranked, as seen in Table 6.10. However, when a scalar
degree of 0.5 (intermittent) was added to these speakers' laryngeal sphinctering ratings,
the moderate to strong negative correlation coefficients between laryngeal sphinctering
and positive traits generally dropped by .02, except for a few items where the coefficients
dropped off by larger points (.08 to .09) or increased slightly. As mentioned in the
previous subsection, the possibility of a non-linear correlation between degrees of
laryngeal sphinctering and negative impressions should be examined in an experimental
setting using perceptual stimuli differing only in degrees of laryngeal sphinctering. In
addition, more careful standardization of intensities should be considered in future
research.
As noted at the beginning of this subsection, a few significant positive
correlations and trends of positive correlations were found between vowel formants, and
ratings for "curious" and "positive emotion." Several negative correlations were found
between vowel formants, and gender and age. It is interesting to note that the correlations
for these items were stronger for males than for females, although in the previous
subsection, voice quality settings had a larger number of correlations with these items for
females than for males. Lastly, although the point is sex-specific, it should also be noted
that mean FO had negative correlations with "pleasant" and "attractive" for males,
suggesting that at least in the present sample, voices with lower pitch were rated more
favorably for these traits. (This result may appear to lend some support to the first part of
Hypothesis lb, which predicts that the voices of male heroes may be significantly lower
pitched than what would be observed among males in real life, although this hypothesis
was not supported by the acoustic analysis results.)
In this subsection, significant negative correlations were found between vowel
formant frequencies and "big," "strong," and "brave," while positive correlations were
found between formant frequencies and "high-pitched." It was also suggested that while
FO had a positive correlation with "high-pitched," laryngeal sphinctering had a positive
correlation with "loud." Other items that had significant correlations or trends of
correlations (i.e., gender, age, "curious" and "positive emotion") were also discussed.
6.2.4 Discussion
In this section, correlations among the three parts of this study, the auditory
analysis, the acoustic analysis and the perceptual experiment were examined. In Section
6.2.1, it was suggested that the pattern of correlations between acoustic measures and
pharyngeal expansion was consistent between the two sexes, whereas the direction of
correlations between laryngeal sphinctering and acoustic measures was not consistent.
However, in Section 6.2.2, laryngeal sphinctering was found to negatively correlate with
a number of trait items in the perceptual experiment, including positive personality traits
and vocal characteristics. The items that had significant correlations with laryngeal
sphinctering and other settings were those that composed Factors 1 and 2, Heroicness and
Desirability, that is, "good-looking," "loyal," "intelligent," "sympathetic," "(vocally)
attractive" and so forth. By contrast, in examining the relationship between acoustic
measures and perceptual experiment items, the items pertaining to physical size and
strength, that is, the composites of Factor 3, Strength, "big," "brave," "strong," and
"high-pitched," were the ones that had significant correlations with vowel formant
frequencies and, to a lesser extent, mean FO. In the present study, it appears that voice
quality settings (i.e., auditory measures) better correlated with favorable traits (those
composing Factors 1 and 2), whereas mean FO, F1 and F2 (i.e., acoustic measures) better
correlated with the remaining trait items (mainly those composing Factor 3 and more
weakly, Factors 4 and 5). Therefore, it can be said that the acoustic measures and the
perceptual experiment items seemed to complement one another. The number of
significant correlations that emerged between auditory measures and perceptual
experiment items was larger than that between acoustic measures and perceptual
experiment items. Thus, it may be said that in this study, auditory measures accounted for
more variance in the perceptual experiment than acoustic measures; however, it should
also be noted that in the present experiment, the number of trait items belonging to
Factors 1 and 2 was greater than that of the latter. In the present study, no acoustic
measures were taken in order to specifically quantify phonatory settings and laryngeal
sphinctering. It would be necessary to investigate acoustic correlates of these settings,
quantify them systematically, and correlate them with the perceptual experiment items in
order to improve correlations between acoustic measures and perceptual trait items.
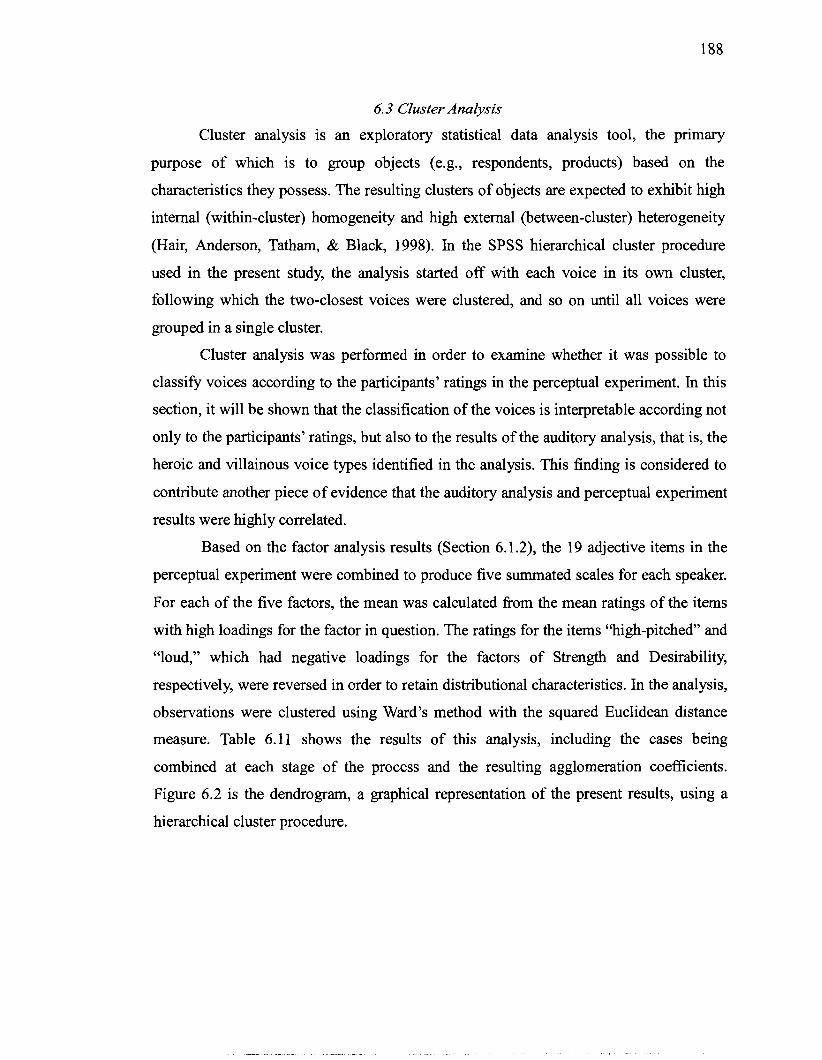
6.3 Cluster Analysis
Cluster analysis is an exploratory statistical data analysis tool, the primary
purpose of which is to group objects (e.g., respondents, products) based on the
characteristics they possess. The resulting clusters of objects are expected to exhibit high
internal (within-cluster) homogeneity and high external (between-cluster) heterogeneity
(Hair, Anderson, Tatham, & Black, 1998). In the SPSS hierarchical cluster procedure
used in the present study, the analysis started off with each voice in its own cluster,
following which the two-closest voices were clustered, and so on until all voices were
grouped in a single cluster.
Cluster analysis was performed in order to examine whether it was possible to
classify voices according to the participants' ratings in the perceptual experiment. In this
section, it will be shown that the classification of the voices is interpretable according not
only to the participants' ratings, but also to the results of the auditory analysis, that is, the
heroic and villainous voice types identified in the analysis. This finding is considered to
contribute another piece of evidence that the auditory analysis and perceptual experiment
results were highly correlated.
Based on the factor analysis results (Section 6.1.2), the 19 adjective items in the
perceptual experiment were combined to produce five summated scales for each speaker.
For each of the five factors, the mean was calculated from the mean ratings of the items
with high loadings for the factor in question. The ratings for the items "high-pitched" and
"loud," which had negative loadings for the factors of Strength and Desirability,
respectively, were reversed in order to retain distributional characteristics. In the analysis,
observations were clustered using Ward's method with the squared Euclidean distance
measure. Table 6.1 1 shows the results of this analysis, including the cases being
combined at each stage of the process and the resulting agglomeration coefficients.
Figure 6.2 is the dendrogram, a graphical representation of the present results, using a
hierarchical cluster procedure.
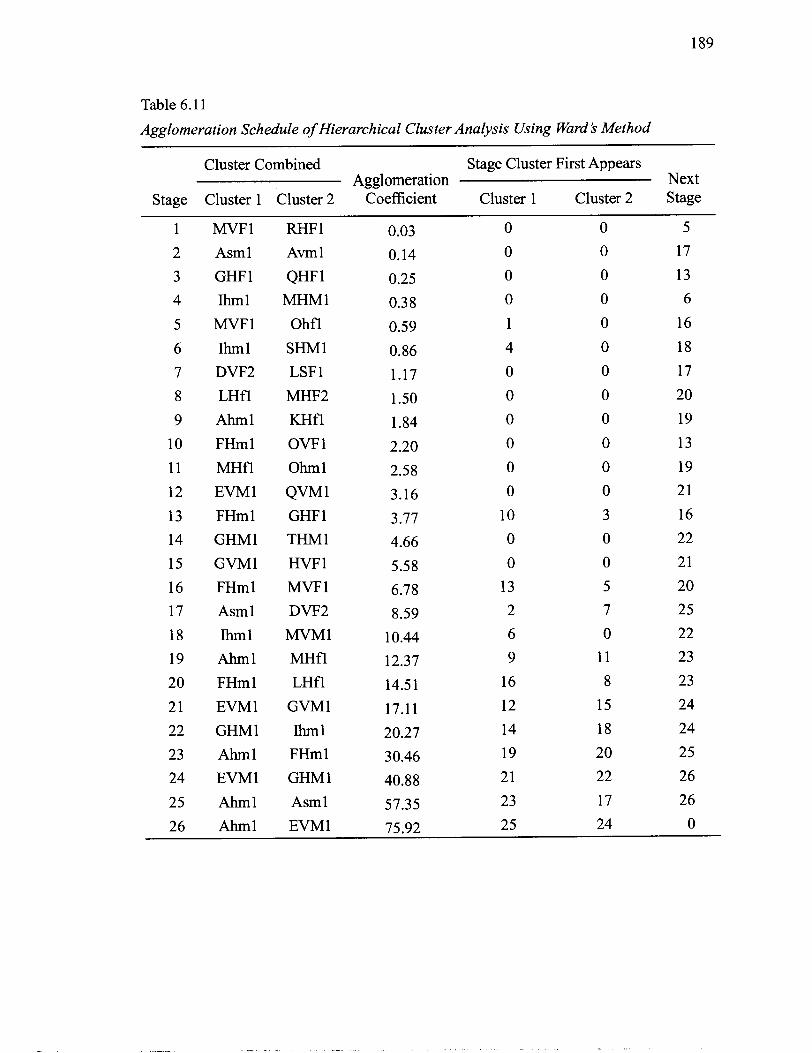
Table 6.1 1
Agglomeration Schedule of Hierarchical Cluster Analysis Using Ward k Method
Cluster Combined Stage Cluster First Appears Agglomeration Next
Stage Cluster 1 Cluster 2 Coefficient Cluster 1 Cluster 2 Stage
MVF 1
Asml
GHF 1
Ihml
MVF 1
Ihml
DVF2
LHfl
Ahml
FHml
MHfl
EVMl
FHml
GHMl
GVMl
FHml
Asml
Ihml
Ahml
FHml
EVMl
GHMl
Ahml
EVMl
Ahml
Ahml
RHF 1
A m 1
QHF 1
MHM1
Ohfl
SHM1
LSF 1
MHF2
KHfl
OVF 1
Ohm1
QVMI
GHF 1
THM1
HVF 1
MVF 1
DVF2
MVM1
MHfl
LHfl
GVMl
Ihml
FHml
GHMl
Asml
EVM 1
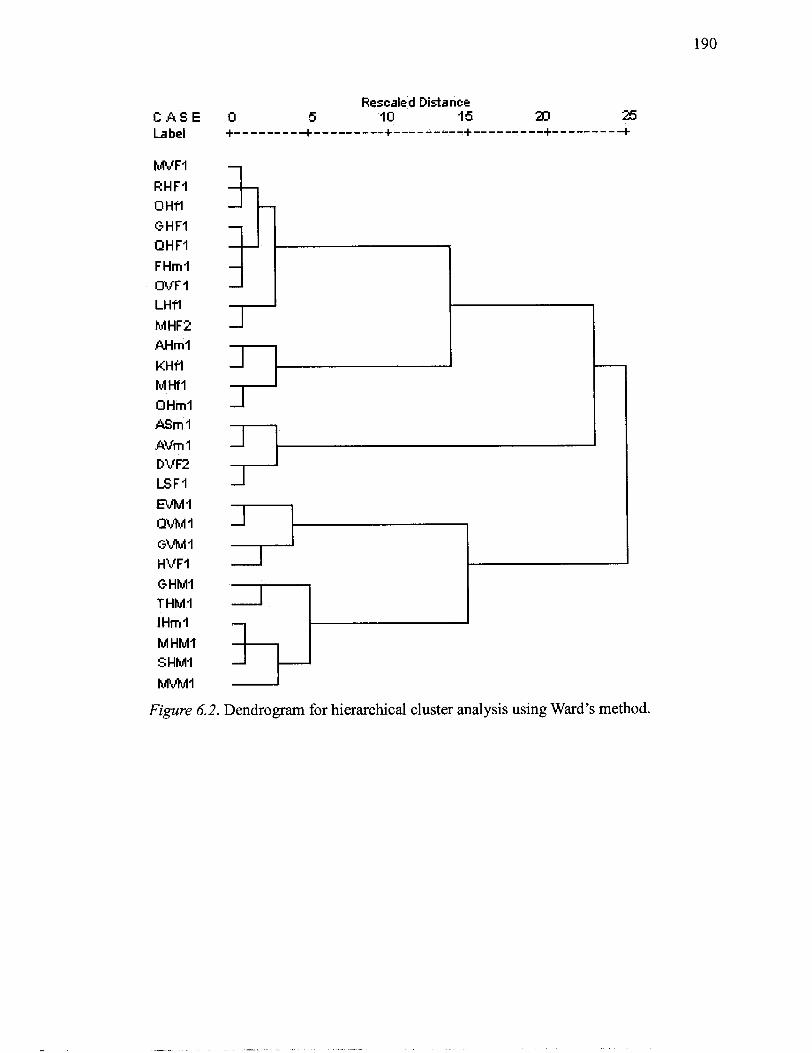
GHMI THMI IHmI - M HMI S HMI
MVFI -
Figure 6.2. Dendrogram for hierarchical cluster analysis using Ward's method.
RHFI -- OHfl - GHFI -
- QHFI
FHml - --
W F I - LHfl
M HF2 AHml
KHfl - MHfl OHmI ASm I
AVm I DVF2 LSFI
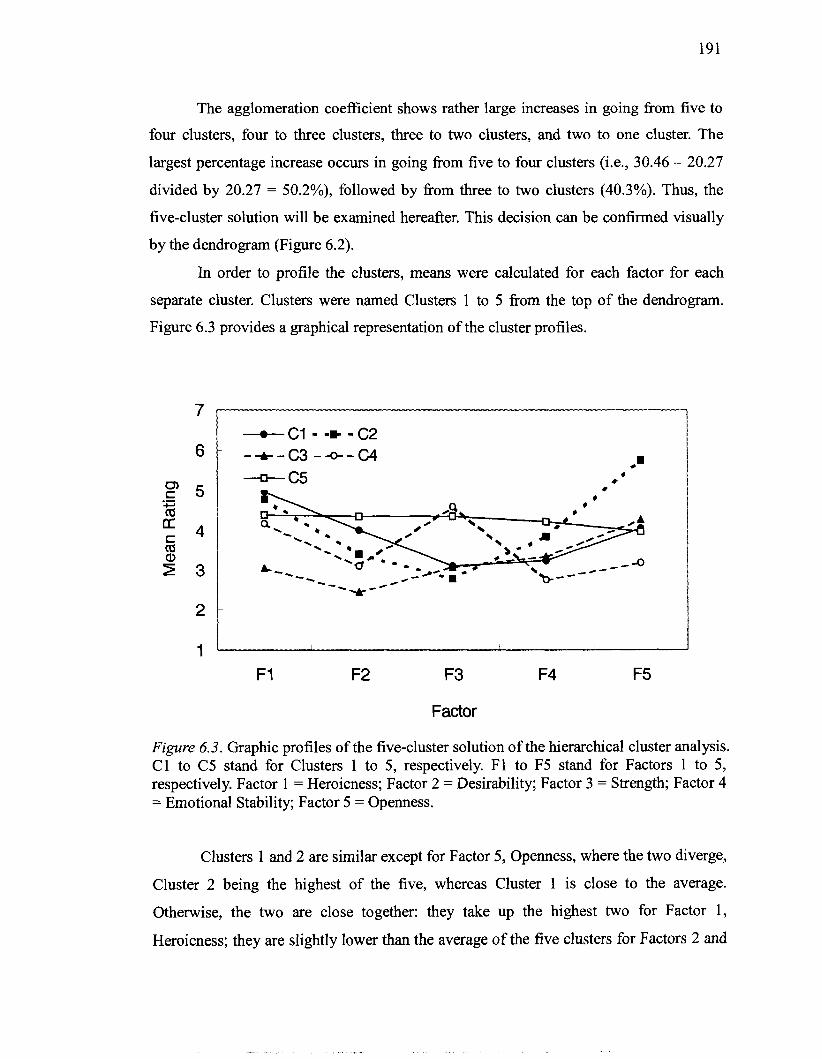
The agglomeration coefficient shows rather large increases in going from five to
four clusters, four to three clusters, three to two clusters, and two to one cluster. The
largest percentage increase occurs in going from five to four clusters (i.e., 30.46 - 20.27
divided by 20.27 = 50.2%), followed by fiom three to two clusters (40.3%). Thus, the
five-cluster solution will be examined hereafter. This decision can be confirmed visually
by the dendrogram (Figure 6.2).
In order to profile the clusters, means were calculated for each factor for each
separate cluster. Clusters were named Clusters 1 to 5 fiom the top of the dendrogram.
Figure 6.3 provides a graphical representation of the cluster profiles.
Factor
Figure 6.3. Graphic profiles of the five-cluster solution of the hierarchical cluster analysis. C1 to C5 stand for Clusters 1 to 5, respectively. F1 to F5 stand for Factors 1 to 5, respectively. Factor 1 = Heroicness; Factor 2 = Desirability; Factor 3 = Strength; Factor 4 = Emotional Stability; Factor 5 = Openness.
Clusters 1 and 2 are similar except for Factor 5, Openness, where the two diverge,
Cluster 2 being the highest of the five, whereas Cluster 1 is close to the average.
Otherwise, the two are close together: they take up the highest two for Factor 1,
Heroicness; they are slightly lower than the average of the five clusters for Factors 2 and

4 (Desirability and Emotional Stability); and they are the lowest two for Factor 3,
Strength. While it is similar to Cluster 1 for Factors 3,4, and 5, Cluster 3 is the lowest for
Factors 1 and 2. The rather low Factors 4 and 5 appear to characterize Cluster 4 as well as
the highest Factor 3. The relative stability of the ratings across factors can be thought to
characterize Cluster 5.
These five clusters are also interpretable by means of the voice types identified in
the auditory analysis. Cluster 1 consists of nine Hero Type I' voices, and except FHml
and LHfl, the members of this cluster were adult females. Note that 41% of the
participants perceived FHml as being a female of age groups 2 to 4 (i.e., older than 11
and younger than 60 years old) and 90% of the participants perceived LHfl as being a
female of age group 2 (between 11 and 18 years old) (see Section 5.2.6). These
perceptions were not very different from those for the other members of this cluster. The
majority of the voices, including those of the two child characters, were judged to exhibit
moderate to extreme breathiness. Therefore, roughly speaking, those voices grouped in
Cluster 1 can be considered as being adult female Hero Type If voices. By contrast,
Cluster 2 consists of those that possessed child male voice characteristics, except for
MHfl, a child female voice. (Note that KHfl was rated by 94 of the participants as being
a male of groups 1 to 3.) The voice types of the characters classified in this cluster are
Hero Types If and 11. (Ohrnl was judged to exhibit Hero Type I1 characteristics because
of the intermittent laryngeal sphinctering.). Considering that MHfl was not noted for
breathiness, it may also be thought that this group is a less breathy counterpart of Hero
Type If. The fact that the voice actors for the characters in Clusters 1 and 2 are all adult
females may account for the fact that these clusters are not very different from each other
except Factor 5. Turning to Cluster 3, all the voices classified in this cluster belong to
Villain Type I. All the four voices in this cluster were judged to exhibit extreme laryngeal
sphinctering accompanied by extreme harsh voice, with the exception of Asml, who was
judged to exhibit moderate laryngeal sphinctering without harshness. The next cluster,
Cluster 4 is the least homogeneous group so far. Of the four voices, two are Villain Type
I1 voices with slight laryngeal sphinctering as well as more consistent pharyngeal
expansion, one is a Hero Type I1 voice with slight laryngeal sphinctering, and the other
voice, QVMl is a Villain Type I voice with extreme laryngeal sphinctering accompanied
by aryepiglottic trilling. It may be said that although QVMl was judged to have an
extremely harsh voice, with the low-frequency subharmonic clearly discernible, the
auditory impression of this voice was not as harsh as for the four voices in Cluster 3.
Thus, it can be said that the four voices in Cluster 4 are those that exhibited less
harshness, as compared to those in Cluster 3. Lastly, Cluster 5 consists of two adult male
heroic voice types: Hero Types I and 11. (Note that Ihml was played by an adult male
voice actor and was rated by 97% of the participants as being a male of age groups 2 to 4.)
It is interesting to note that the two non-representative hero voices, GHMl and THM1,
were merged before being incorporated into the Hero Type I branch, which was the last
merger that took place in this five-cluster solution. In other words, although they were
ultimately incorporated into the same cluster, Hero Types I and I1 were not as similar to
each other as the voices within each type were to one another.
The identification of voice types also helps clarify the significance of the mean
ratings for each of the five factors. For Factors 1 and 2 (i.e., Heroicness and Desirability),
which constitute desirable qualities possessed by heroes, Clusters 1, 2, and 5 are those
that had higher ratings. For Factor 3, Strength, the voices of adult males were rated higher
than those of females and/or children. As for Factor 4, Emotional Stability, it was
suggested that not only voice type but also pitch appeared to play a role in this factor (see
Section 5.2.8). Lastly for Factor 5, Openness, Cluster 2 is the highest of the five clusters
and Cluster 4 is the lowest, suggesting that the age perceptions may have had a close
relationship with the ratings of this factor (i.e., the item "curious").
In this section, it was demonstrated that participants were able to classify voices
based on the perceptual item ratings. It was also suggested that the clusters that emerged
fiom the hierarchical cluster analysis might be interpretable based on the auditory
characteristics identified for each voice, namely, the heroic and villainous voice types, as
well as the five factors derived from the perceptual experiment items. However, in order
to confirm the findings of the present analysis, it would be necessary to obtain perceptual
ratings for many more adult male voices that would be likely to be classified in Clusters 3,
4, and 5 (especially Hero Type 11, and Villain Types I and 11), child male voices (i.e.,
Cluster 2), and female Villain Type I1 voices.

Chapter 7 Conclusions
7.1 Summary
The voices of heroes and villains in Japanese anime are thought to represent the
vocal stereotypes of good and bad characters in Japanese culture. In the present study,
phonetic properties of the voices of heroes and villains in anime were examined in the
following four ways: (i) by auditory analysis: describing auditory characteristics of the
voices of heroes and villains, using a modified version of Laver's descriptive framework
for voice quality (Laver, 1994, 2000); (ii) by acoustic analysis: describing acoustic
characteristics of the same voice samples, using pitch, vowel formant, and spectrographic
analysis techniques; (iii) by perceptual experiment: investigating how Japanese
laypersons perceive the voices in an experimental setting; and (iv) by statistical analysis:
calculating correlations among the three aforementioned components of the present study,
that is, the auditory analysis, the acoustic analysis, and the perceptual experiment, using
bivariate correlation analyses, factor analysis, and cluster analysis.
In Chapter 1, the following four hypotheses were formulated based on previous
research on vocal stereotypes and vocal cues to personality and emotion:
Hypothesis la: heroes of both genders will have a wide pitch range and a wide range of articulatory movements.
Hypothesis lb: the voices of male heroes may be significantly lower-pitched than what would be observed among males in real life, whereas the voices of female heroes are likely to be somewhat higher-pitched than what would be observed among females in real life
Hypothesis lc: in addition to the above characteristics, male heroes are expected to have breathy voices.
Hypothesis 2: the following articulatory characteristics are expected to emerge in the auditory analysis of villains' voices: pharyngeal constriction and overall tensing of the vocal tract; and raised larynx. In addition, it is expected that the following acoustic correlates will be found: an increase or decrease of mean FO, a rising Fl, a falling F2, and increased high-frequency energy.
Hypothesis 3: the auditory and acoustic characteristics of heroes' voices will be more salient and easier to generalize than those of villains, which

are presumed to have a wider range of deviation and to exhibit greater variety.
Hypothesis 4: heroes have attractive voices.
These hypotheses were examined in the auditory and acoustic analyses and the perceptual
experiment. A preliminary study was conducted in which the voices of heroes and villains
from four TV series were analyzed, without placing any limitations on their personality
and physical traits or the types of stories depicted. The voices of heroes and villains were
analyzed auditorily using Laver's (1994, 2000) descriptive framework for voice quality
and acoustically using spectrographic analysis. The voice quality features of heroes and
villains were identified auditorily and acoustically as generally having similar
characteristics within in each category of character. However, in order to extract
prototypical voice quality characteristics for each category, the attributes of heroes and
villains were controlled in the main analysis. The criteria for inclusion for the present
analyses were: an obvious contrast between heroes and villains in the anime story; no
involvement in criminal activities on the part of heroes; and physical attractiveness of
heroes, versus physically unattractiveness of villains. More than 60 anime titles were
obtained from anime fans, of which 20 were selected for this study.
Prior to the second auditory analysis, Laver's (1 994,2000) descriptive framework
for voice quality was revised, based on the results of the preliminary auditory analysis.
The revision involved tongue body and root settings, and settings of overall muscular
tension. The four lingual body settings in Laver were replaced by three tongue body
settings, namely fronting, raising, and retraction in the present framework. The tongue
root settings and the overall muscular tension settings were replaced by epilaryngeal
settings, namely laryngeal sphinctering and pharyngeal expansion, in order to reflect the
important roles played by these settings in linguistics and beyond. In addition, jaw
protrusion was incorporated into labial protrusion and lip constriction was added to the
cross-sectional settings, in order to more precisely describe the supralaryngeal settings of
villains. Using this modified version of Laver's framework, the voices of 88 characters
were analyzed. Based on this analysis, in which epilaryngeal and supralaryngeal settings
played a significant role, four voice types were identified to categorize the voices of
heroes, villains, and supporting roles. Two voice types were identified for male heroes:
Hero Type I: intermittent, slight or moderate pharyngeal expansion and fronted or neutral tongue body withlwithout breathy voice.
Hero Type 11: slight or intermittent laryngeal sphinctering, and neutral or fronted tongue body.
In addition to these two heroic voice types, two villainous voices were also identified
among the male villains.
Villain Type I: moderate or extreme laryngeal sphinctering, raised larynx, jaw protrusion, labial constriction, close jaw, harsh voice and any tongue body setting (i.e., fronting, raising, retraction, or neutral), with retraction the most common of the four.
Villain Type 11: pharyngeal expansion, lowered larynx, withlwithout slight jaw protrusion, slight labial constriction, and neutral or fronted tongue body.
For the female heroes, a modified version of Hero Type I, namely Hero Type 1', was
identified:
Hero Type 1': fronted tongue body and open jaw, with moderately breathy voice.
Among female villains, the two villainous voice types identified for male villains were
also observed, as well as a Hero Type I' voice. Because most child heroes were also
played by adult female voice actors, child heroes were also judged to share Hero Type I'
characteristics. These findings were in accordance with Hypotheses lc, 2, and 3: breathy
voices were noted for heroes (Hypothesis lc); Villain Type I voices, which were
prevalent among male villains but less so than Villain Type I1 voices among female
villains, confirmed Hypothesis 2; and for both genders, two more voice types were
identified for villains than for heroes, suggesting that villains' voices exhibited more
variety (Hypothesis 3).
Following the auditory analysis, a series of acoustic analyses, namely pitch, vowel
formant, and spectrographic analyses, were performed. In the pitch analysis, mean FO and
FO range (i.e., standard deviation of FO) were calculated for each speaker, and the
relationship between these measures and the roles and voice types was examined. It was
found that mean FO and mean FO range did not differ between heroes and villains.
Therefore, neither the part of Hypotheses l a stating that heroes would have a wide pitch
range, nor the part of Hypothesis 2 predicting that villains would have a decreased or
increased FO relative to heroes, were supported. However, the distribution of FO ranges
was wider for villains than for heroes, which may be considered to support Hypothesis 3
that villains have a wider range of deviation and exhibit greater variety. With regard to
mean FO, it was found that both adult male and female heroes were much higher pitched
than real-life speakers. Therefore, the first half of Hypothesis l b that the voices of male
heroes may be significantly lower pitched than what would be observed among males in
real life was not supported, whereas the latter part of the hypothesis that the voices of
female heroes are likely to be somewhat higher pitched than what would be observed
among females in real life was partially supported. It was also suggested that male
villains who employed laryngeal sphinctering had a higher FO than those exhibiting
pharyngeal expansion. However, for female villains, this relationship did not hold; on the
contrary, female villains with laryngeal sphinctering had lower pitch than those with
pharyngeal expansion.
In the vowel formant analysis, the formant frequencies of heroes and villains were
examined according to role, voice type, jaw setting, and tongue body setting. It was found
that villains had a lower F2 than heroes, confirming one part of Hypothesis 2; however,
the range of articulation did not appear to differ according to role, a finding which did not
support the latter part of Hypothesis la. Following the examination of formant
frequencies relative to voice type, it was suggested that the source of the low F2 among
villains was pharyngeal expansion, and, in the case of females, pharyngeal constriction as
well. The possible relationship between tongue body settings and epilaryngeal settings
was also discussed: tongue body settings could account for variability in vowel formants
when epilaryngeal states were neutral, but they seemed to be overridden when
epilaryngeal settings were engaged more vigorously.
In the spectrographic analysis, the spectrograms and spectra of the voices of
selected heroes and villains were produced and visually inspected. It was suggested that
Hero Type I1 and Villain Type I1 voices, which involve slight laryngeal sphinctering,
contained strong harmonics in the higher frequencies, whereas Villain Type I voices had
strong noise in the same region. These observations were in agreement with Hypothesis 2
that villains' voices would exhibit increased high-frequency energy.
In order to investigate whether the identified auditory characteristics contribute to
people's perception of good and bad characters, Japanese laypersons' perceptions of
selected speech samples were examined in an experimental setting. Based on the results
of the auditory analysis, which highlighted the importance of perceived epilaryngeal
states and phonatory settings, the voices of 15 heroes, nine villains, and two
(villainous-sounding) supporting roles identified as Villain Type I voices were selected as
experimental stimuli. In addition to prototypical heroes and villains, the selection
included (i) heroes that exhibited slighthntmittent laryngeal sphinctering and harsh
voice, and (ii) villains without moderate to extreme laryngeal sphincteringlpharyngeal
expansion as non-representative heroes/villains in order to specifically examine the roles
of these auditory characteristics in vocal stereotyping. The random splicing technique
was used in order to mask the content of the speech excerpts. Thirty-two participants
were asked to rate their impressions of anime characters using trait items in the following
six categories: age, gender, physical characteristics, personality traits, emotional states,
and vocal characteristics. It was hypothesized that participants would attribute less
favorable physical characteristics, personality traits, emotional states, and vocal
characteristics to speakers who exhibited laryngeal sphinctering or pharyngeal expansion
of greater than a slight degree, no matter which roles they played in the original cartoons.
First, in order to examine whether participants responded to stimuli according to the
differences in epilaryngeal states among characters, a series of three-factor repeated
measures ANOVAs was carried out for each of the 16 selected items for adult heroes and
villains. The three between-subjects factors were role (hero vs. villain), stimulus gender
(male vs. female), and representativeness (representative vs. non-representative). In
addition to significant main effects of the factor role, a number of significant interaction
effects between any combination of two of the three factors and among the three emerged.
The interaction between role and representativeness constituted the majority of the
interactions that emerged, which suggests that participants attributed unfavorable
physical traits, personality traits, emotional states, and vocal characteristics to speakers
who exhibited non-neutral epilaryngeal states regardless of the roles they played in the
origmal cartoons. The item "(vocally) attractive" was one of them, suggesting that
Hypothesis 4 that heroes have attractive voices was confirmed. It was also suggested that
the classification of auditory characteristics into representative and non-representative
based on the epilaryngeal states identified in the auditory analysis, was valid. In addition
to an analysis of the effects of epilaryngeal states on the participants' responses, the
effects of the age of the characters and the voice actor were examined. The results of the
age and gender perceptions, and the emotional labels provided in the free answer were
also analyzed. The validity of the present experiment using the random splicing technique
was also discussed, with regard to the two trait items that were systematically rated lower
than the other items across speakers.
Lastly, the results from the preceding three components of the study were
compared statistically. According to the correlation results between the auditory and
acoustic analyses, it was suggested that whereas the pattern of correlations between
acoustic measures and pharyngeal expansion was consistent between the two sexes, the
direction of correlations between laryngeal sphinctering and acoustic measures was not.
(Note that the correlations were calculated according to the voice actor's sex rather than
the gender of the character.) However, in the following analysis, comparing the results
from the auditory analysis and the perceptual experiment, it was also found that laryngeal
sphinctering systematically negatively correlated with a number of trait items in the
perceptual experiment, including positive personality traits and vocal characteristics for
both sexes. The items that had significant correlations with laryngeal sphinctering and
other related settings were those that composed Factors 1 and 2 from the factor analysis
of the perceptual experiment items, that is, Heroicness and Desirability. These factors
consisted of such traits as "good-looking," "loyal," "intelligent," "sympathetic," and
"(vocally) attractive." By contrast, in comparing the acoustic measures and perceptual
experiment items, the items that composed Factor 3, Strength, that is, "big," "brave,"
"strong," and "high-pitched," had significant correlations with vowel formant frequencies
and, to a lesser extent, mean FO. The number of correlations that emerged between
auditory measures and perceptual experiment items was larger than for that between
acoustic measures and perceptual experiment items, suggesting that, in this study,
auditory measures accounted for more variance in the perceptual experiment than
acoustic measures. Cluster analysis was also conducted using the participants' ratings of

the voices in the perceptual experiment. It was demonstrated that the resulting clusters
were reasonable based not only on the participants' ratings by themselves, but also
relative to the heroic and villainous voice types identified in the auditory analysis. The
latter finding suggests that the results of the auditory analysis and the perceptual
experiment were highly correlated.
Anime voices are distinctive. The participants in the preliminary experiment could
unequivocally identify the voices as originating fiom cartoons, even though the author
did not reveal their source. In this sense, studying anime voices may be comparable to
studying singing voices of various styles (e.g., Honda, Hirai, Estill, & Tohkura, 1995;
Yanagisawa, Estill, Krnucha, & Leder, 1989); both anime and singing voices involve
wider ranges of vocal maneuvers than that exploited in ordinary speech. In the present
auditory analysis using a modified version of Laver's framework, virtually all articulatory
and phonatory settings were found. In other words, the present study was able to explore
all possible auditory qualities produced by the voice quality model based on the findings
in Esling and his colleagues (Esling, 1996, 1999; Esling & Edmondson, 2002; Esling and
Harris, 2003). The components of the four heroic and villainous voice types identified in
the present study were in agreement with the articulatory possibilities deduced fiom the
current mode. The epilaryngeal settings, which played a major role in distinguishing
these four voice types were identified as the auditorily critical vocal components that
differentiate good and bad characters. The perceptual experiment that contrasted
epilaryngeal states in anime voices was successful in confirming the effects of these
settings on laypersons' perceptions. The attributional traits included in this study were not
meant to be exhaustive. However, this study was able to identify the negative correlation
between positive personality traits and vocal characteristics and laryngeal sphinctering,
and a negative correlation between physical and personality strength and vowel formant
and fundamental frequencies, which would be a good starting point for future research of
phonetic properties of vocal stereotypes.
7.2 Future Research
In future research, the present study can be extended in a variety of directions.
The present modifications to the voice quality descriptive framework proposed by Laver
(1994, 2000) should be evaluated using other sets of data and also by other phoneticians.
Adding components from other auditory descriptive frameworks such as Estill, Fujimura,
Sawada, and Beechler (1996) might improve the present framework. Physiological
observations of the epilaryngeal and laryngeal area should also be conducted in order to
confirm the auditory descriptions in the present study. Although the epilaryngeal states
appear to correlate well with laypersons' perceptions, in the present study, it was not
possible to acoustically quantify the wide range of articulatory activities in which the
laryngeal sphincter is involved. Therefore, the acoustic correlates of laryngeal
sphinctering and pharyngeal expansion should also be investigated in detail. One
approach to developing better acoustic correlates of phonatory and epilaryngeal settings
might be to incorporate an auditory model as in Shrivastav (in press) and Shrivastav and
Sapienza (2003). Articulatory models based on mathematical algorithms that take
long-term articulatory settings into account (Mokhtari, Clermont, & Tanaka, 2000;
Mokhtari, Iida, & Campbell, 2001; Story & Titze, 2002; Story, Titze, & Hoffinan, 2001)
may also be able to provide acoustic correlates of phonatory and epilaryngeal settings
that correlate well with laypersons' perceptions. Making the auditory, physiological, and
acoustic bases more firm would lead to a better understanding of the correlations among
them and between these and laypersons' perceptions. Because of the more extreme vocal
maneuvers observed in cartoon voices, it would be beneficial to continue to work with
these as well as voices used in more naturalistic settings, in order to determine the
auditory/acoustic/perceptual properties of peripheral articulatory behaviors.
In order to investigate the universality and cultural specificity of the present
findings, it would be necessary to replicate the present study in other cultures. A
cross-cultural project with other language speakers (German, Hebrew) using the
perceptual experiment stimuli in the present study is underway. The same research
procedure may be applied to another sample set from more naturalistic corpora in order to
determine the range of voice quality settings that occur in real life and to investigate
whether any similarities arise in a perceptual experiment using less extreme stimuli. In
the present study, it was implicitly assumed that the experiment participants would agree
on trait ratings. However, Buller and Burgoon (1986) found that participants differing in
decoding ability preferred different vocal stimuli. It would also be of interest to replicate
the present study with a larger number of participants in order to examine the variance of
the participants' responses and the source of the variance. In order to help understand the
vocal communication of emotions, which is also closely related to the present study, it
would be beneficial to compare the results from the present study with those from studies
on the vocalizations of infants (Bachorowski & Owen, as cited in Russell, Bachorowski,
& Femhdez-Dols, 2003; Papaeliou, Minadakis, & Cavowas, 2002; Scheiner,
Hammerschmidt, Jiirgens, & Zwimer, 2002) and animals (Rendall, 2003; Seyfarth &
Cheney, 2003). In order to examine the validity of the use of the random splicing
technique in perceptual experiments, the present experiment should be replicated in at
least two ways: by using other content-masking techniques such as those reviewed in
Friend and Farrar (1994) and Scherer, Feldstein, Bond, and Rosenthal (1985); and by
using listeners who do not understand the language of stimuli that are not content-masked.
It would also be beneficial to be able to correlate the findings from the present study with
lay descriptive terms for voices used in everyday life, as investigated by Kido and
Kasuya (2001). In this way, the investigation of the relationships among auditory cues
identified by experts, acoustic cues, and laypersons' perceptions would be facilitated,
enhancing our understanding of speech communication as a whole.
References
Abercrombie, D. (1967) Elements of general phonetics, Edinburgh University Press.
Addington, D. W. (1968). The relationship of selected vocal characteristics to personality perception. Speech Monographs, 35,492-503.
Allison, A. (2000). Sailor moon: Japanese superheroes for global girls. In T. J. Craig (Ed.), Japan pop! : Inside the world of Japanese popular culture (pp. 259-278). New York: M. E. Sharpe.
Ambady, N., & Rosenthal, R. (1992). Thin slices of expressive behavior as predictors of interpersonal consequences: A meta-analysis. Psychological Bulletin, 111, 256-274.
Aronovitch, C. D. (1976). The voice of personality: Stereotyped judgments and their relation to voice quality and sex of speaker. The Journal of Social Psychology, 99, 207-220.
Banse, R., & Scherer, K. R. (1996). Acoustic profiles in vocal emotion expression. Journal of Personality and Social Psychology, 70,6 14-636.
Bergan, C.C., & Titze, I. R. (2001). Perception of pitch and roughness in vocal signals with subharmonics. Journal of Voice, 15, 165-175.
Berry, D. S. (1990). Vocal attractiveness and vocal babyishness: Effects on stranger, self, and friend impressions. Journal of Nonverbal Behavior, 14, 14 1-1 53.
Berry, D. S. (1991). Accuracy in social perception: Contributions of facial and vocal information. Journal of Personality and Social Psychology, 61,298-307.
Berry, D. S. (1992). Vocal types and stereotypes: Joint effects of vocal attractiveness and vocal maturity on person perception. Journal of Nonverbal Behavior, 16,4 1-54.
Biemans, M. (1998). Production and perception of gendered voice quality. Symposium 'Perceiving and Performing Gender', Zentrum f ir interdisziplinare Frauenforschung, Kiel - Germany, 1998,63-72.
Biemans, M., & van Bezooijen, R. (1 999). Biological gender and social gender in relation to voice quality. Proceedings of the XIVth International Congress of Phonetic Sciences: ICPhS 99; San Francisco, 1-7 August 1999, 1249-1252.
Brody, M. (2001). Invoking the ancestors: Edward Sapir, Bugs Bunny, and the Pop01 Vuh. Texas Linguistic Forum 44, 21 6-226. Proceedings JFom the Ninth Annual Symposium about Language and Society, Austin, April 20-2 1,200 1.
Brown, B. L., & Bradshaw, 3. M. (1985). Towards a social psychology of voice variations. In H. Giles & R. N. St. Clair (Eds.), Recent advances in language, communication,
and social psychology (pp. 144-1 8 1). London: Lawrence Erlbaum.
Bruyninckx, M., Harrnegnies, B., Llisterri, J., & Poch-Olivk, D. (1994). Language-induced voice quality variability in bilinguals. Journal ofPhonetics 22, 19-31.
Buder, E. H. (2000). Acoustic analysis of voice quality: A tabulation of algorithms 1902-1990. In R. D. Kent & M. J. Ball (Eds.), Voice quality measurement (pp. 11 9-244). San Diego, CA: Singular.
Buller, D. B., & Burgoon, J. K. (1986). The effects of vocalics and nonverbal sensitivity on complicance: A replication and extension. Human Communication Research, 13,126-144.
Cacioppo, J. T., & Berntson, G G (1994). Relationship between attitudes and evaluative space: A critical review, with emphasis on the separability of positive and negative substrates. Psychological Bulletin, 11 5,40 1-423.
Clements, J., & McCarthy, H. (2001). The anime encyclopedia: A guide to Japanese animation since 191 7. Berkeley, CA: Stone Bridge Press.
Collins, S. A. (2000). Men's voices and women's choices. Animal Behaviour, 60, 773-780.
Cox, A., & Cooper, M. B. (1981). Selecting a voice for a specified task: The example of telephone announcements. Language and Speech, 24,233-243.
Cutts, S. P. (1992). The deviant phonology of several Warner Bros. Cartoon characters. California Linguistic Notes, 23,37-38.
Deal, L. V., & Oyer, H. J. (1991). Ratings of vocal pleasantness and the aging process. Folia Phoniatrica, 43,4448.
Detweiler, R. F. (1994). An investigation of the laryngeal system as the resonance source of the singer's formant. Journal of Voice, 8,303-3 13.
Diehl, C. F. (1960). Voice and personality: An evaluation. In D. A. Barbara (Ed.), Psychological and psychiatric aspects of speech and hearing (pp. 17 1-203). Springfield, Illinois: C. Thomas.
Dobrow, J. R., & Gidney, C. L. (1998). The good, the bad, and the foreign: The use of dialect in children's animated television. The ANNALS of the American Academy of Political and Social Science, 557, 105-1 19.
Edasawa, Y. (1 984). Articulatory setting and teaching pronunciation. Asphode, 18, 289-308.
Edmondson, J. A., Esling, J. H., Harris, G J., Martin, D., Weisberger, E. C., & Blackhurst,
L. (2003). The role of the glottic and epiglottic planes in the phonetic qualities of voice in the Bor Dinka language of Sudan and other phonetic features: A laryngoscopic study. Unpublished manuscript.
Esling, J. H. (1978). Voice quality in Edinburgh: A sociolinguistic and phonetic study. Unpublished doctoral dissertation, University of Edinburgh, UK.
Esling, J. H. (1987). Vowel shift and long-term average spectra in the survey of Vancouver English. Proceedings of the Xith International Congress of Phonetic Sciences, Vol. 4,243-246.
Esling, J. H. (1994). Voice quality. In The encyclopedia of language and linguistics (Vol. 9, pp. 49504953). Oxford, UK: Pergamon Press.
Esling, J. H. (1996). Pharyngeal consonants and the aryepiglottic sphincter. Journal of the International Phonetic Association, 26,65-88.
Esling, J. H. (1999). The IPA categories "pharyngeal" and "epiglottal": Laryngoscopic observations of pharyngeal articulations and larynx height. Language and Speech, 42,349-372.
Esling, J. H., & Edmondson, J. A. (2002). The laryngeal sphincter as an articulator: Tenseness, tongue root and phonation in Yi and Bai. In A. Braun & H. R. Masthoff (Eds.), Phonetics and its applications: Festschrift for Jens-Peter Koster on the occasion of his 60'h birthday (pp. 38-51). Stuttgart, Germany: Franz Steiner Verlag.
Esling, J. H., & Harris, J. G. (2003). An expanded taxonomy of states of the glottis. In M. J. Sole, D. Recasens & J. Romero (Eds.), Proceedings of the 1.5'~ International Congress of Phonetic Sciences, Barcelona, 3-9 August 2003 (pp. 1049-1052). Barcelona, Spain: Universitat Autbnoma de Barcelona.
Esling, J. H., Heap, L. M., Snell, R. C., & Dickson, B. C. (1994). Analysis of pitch dependence of pharyngeal, faucal, and larynx-height voice quality settings. ICSLP 94: 1994 International Conference on Spoken Language Processing, September 18-22, 1994, Yokohama, Japan, 1475-1478. Tokyo: The Acoustical Society of Japan.
Estill, J., Fujimura, O., Sawada, M., & Beechler, K. (1996). Temporal perturbation and voice qualities. In P.J. Davis & N. H. Fletcher (Eds.), Vocal fold physiology: Controlling complexity and chaos (pp. 237-252). San Diego, CA: Singular.
Fitch, W. T. (1 994). Vocal tract length perception and the evolution of language (Doctoral dissertation, Brown University, 1994). Dissertation Abstracts International, 55, 2996B-2997B.
Frick, R. W. (1985). Communicating emotion: The role of prosodic features. Psychological Bulletin, 97,4 12-429.

Friend, M., & Farrar, M. J. (1994). A comparison of content-masking procedures for obtaining judgments of discrete affective states. Journal of the Acoustical Society ofAmerica, 96, 1283-1290.
Fujimoto, M., & Maekawa, K. (2003). Variation in phonation types due to paralinguistic information: An analysis of high-speed video images. In M. J. Sole, D. Recasens & J. Romero (Eds.), Proceedings of the 151h International Congress of Phonetic Sciences, Barcelona, 3-9 August 2003 (pp. 2401-2404). Barcelona, Spain: Universitat Authnoma de Barcelona.
Gao, M. (2002). Tones in whispered Chinese: Articulatory features and perceptual cues. Unpublished master's thesis, University of Victoria, Victoria, British Columbia, Canada.
Gobl, C., & Ni Chasaide, A. (2003). The role of voice quality in communicating emotion, mood and attitude. Speech Communication, 40, 189-2 12.
Hair, J. F., Jr., Anderson, R. E., Tatham, R. L., & Black W. C . (1998). Multivariate data analysis (5th ed.). Upper Saddle River, NJ: Prentice Hall.
Harmegnies, B., & Landercy, A. (1988). Intra-speaker variability of the long term speech spectrum. Speech Communication 7,89 1-86.
Harris, K. S., Vatikiotis-Bateson, E., & Alfonso, P. J. (1992). Muscle forces in vowel vocal tract formation. Proceedings ICSLP 92: 1992 International Conference on Spoken Language Processing, Vol. 2,879-88 1.
Hayashi, F. (1978). Sobo to seikaku no kateisareta kanrensei 3: Manga no tojo jinbutsu o shigeki zairyo to shite [Assumed relationship between physical and personality traits 3: Utilizing comic strip characters as stimuli]. Nagoya Daigaku Kyoikugakubu &yo. Kyoiku-shinrigaku-ka [Bulleting of the Faculty of Education. The Department of Educational Psychology], 25,41-55.
Hecht, M. A., & LaFrance, M. (1995). How (fast) can I help you? Tone of voice and telephone operator efficiency in interactions. Journal of Applied Social Psychology, 25,2086-2098.
Henton, C. G, & Bladon, R. A. W. (1985). Breathiness in normal female speech: Inefficiency versus desirability. Language & Communication, 5,22 1-227.
Hillenbrand, J., Cleveland, R. A., & Erickson, R. L. (1994). Acoustic correlates of breathy voice quality. Journal of Speech and hearing Research, 37,769-778.
Honda, K. (1 996). Organization of tongue articulation for vowels. Journal of Phonetics, 24,39-52.
Honda, K., Hirai, H., Estill, J., & Tohkura, Y. (1995). Contributions of vocal tract shape to voice quality: MRI data and articulatory modeling. In 0. Fujimura & M.
Hirano (Eds.), Vocal fold physiology: Voice quality control (pp. 23-38). San Diego, CA: Singular Publishing Group.
Honikman, B. (1964). Articulatory settings. In D. Abercrombie, D. B. Fry, P. A. D. MacCarthy, N. C. Scott & J. L. M. Trim (Eds.) In Honour of Daniel Jones (pp.73 - 84). London: Longrnan.
Iida, A., Campbell, N., & Yasumura, M. (1999). Kanjo hyogen ga kanouna onsei gousei no sakusei to hyoka [Design and evaluation of synthesized speech with emotion]. Joho Shori Gakkai ronbun shi [Transactions of Information Processing Society of Japan], 40,479-486.
Iida, A., Campbell, N., Higuchi, F., & Yasumura, M. (2003). A corpus-based speech synthesis system with emotion. Speech Communication, 40, 161-1 87.
Joo, H. (1992). Onseigaku [Phonetics] (enlarged and revised 3rd ed.). Tokyo: Aporon.
Juslin, P. N., & Laukka, P. (2001). Impact of intended emotion intensity on cue utilization and decoding accuracy in vocal expression of emotion. Emotion, 1,38 1 4 1 2.
Kazarna, K., Uwano, Z., Matsumura, K., Machida, K. (1993). Gengogaku [Linguistics: An introduction]. Tokyo: University of Tokyo Press.
Kelz, H. P. (1978). Binary features for the description of the basis of articulation. Onsei no kenkyu [The Study of Sound], 18,139-143.
Kido, H., & Kasuya, H. (2001). Tsujo hatsuwa no seishitsu ni kanrenshita nichijo hyogengo: Chosyu hyoka ni yoru chushutsu [Everyday expressions associated with voice quality of normal utterance: Extraction by perceptual evaluation]. Nippon Onkyo Gakkai shi [Journal of the Acoustical Society of Japan], 57, 337-344.
Klatt, D. H., & Klatt, L. C. (1990). Analysis, synthesis, and perception of voice quality variations among female and male talkers. Journal of the Acoustical Society of America, 87, 820-857.
Knowles, G (1978). The nature of phonological variables in Scouse. In P. Trudgill (Ed.), Sociolinguisticpatterns in British English (pp. 80-90). London: Edward Arnold.
Knutson, B. (1996). Facial expressions of emotion influence interpersonal trait inferences. Journal of Nonverbal Behavior, 20, 165-1 82.
Kramer, E. (1963). Judgment of personal characteristics and emotions from nonverbal properties of speech. Psychological Bulletin, 60,408420.
Kuwabara, H., & Ohgushi, K. (1984). Acoustic characteristics of professional male announcers' speech sounds. Acustica, 55,233-240.

Laver, J. (1980). The phonetic description of voice quality. Cambridge, UK: Cambridge University Press.
Laver, J. (1994). Principles ofphonetics. Cambridge, UK: Cambridge University Press.
Laver, J. (2000). Phonetic evaluation of voice quality. In R. D. Kent & M. J. Ball (Eds.), Voice quality measurement (pp. 3748). San Diego, CA: Singular.
Laver, J., & Trudgill, P. (1979). Phonetic and linguistic markers in speech. In K. R. Scherer & H. Giles (Eds.), Social markers in speech (pp. 1-32). Cambridge, UK: Cambridge University Press, Cambridge, and Editions de la Maison des Sciences de l'Homme, Paris.
Laver, J., Wirz, S., Mackenzie, J., & Hiller, S. M. (1991). A perceptual protocol for the analysis of vocal profiles. In J. Laver, Gift of speech: Papers in the analysis of speech and voice (pp. 264-280). Edinburgh, UK: Edinburgh University Press. (Reprinted from Edinburgh University Department of Linguistics Work in Progress, 14, 139-155, 1981.)
Lee, H. O., & Boster, F. J. (1992). Collectivism-individualism in perceptions of speech rate: A cross-cultural comparison. Journal of Cross-Cultural Psychology, 23, 377-388.
Lent, J. A. (Ed.) (2001). Animation in Asia and PaciJic. Bloomington, IN: Indiana University Press.
Levi, A. (1996). Samurai @om outer space: Understanding Japanese animation. Chicago: Open Court.
Levi, A. (1998). The new American hero: Made in Japan. In M. L. Kittelson (Ed.), The soul of popular culture: Looking at contemporary heroes, myths, and monsters (pp. 68-83). Chicago: Open Court.
Lippi-Green, R. (1997). English with an accent: Language, ideology, and discrimination in the United States. London: Routledge.
Maekawa, K. (1998). Phonetic and phonological characteristics of paralinguistic information in Japanese. ICSLP 98: 1998 International Conference on Spoken Language Processing, 3oth ~ovember-4th December 1998, Sydney, Australia, 635-638.
Maekawa, K., & Kagomiya, T. (2000). Influence of paralinguistic information on segmental articulation. 6th International Conference on Spoken Language Processing: ICSLP 2000, the proceedings of the conference, Oct. 16-Oct. 20, 2000, Beijing International Convention Center; Beijing, China, Vol. 2,349-352.
Mahl, G F., & Schultze, G (1964). Psychological research in the extralinguistic area. In T. A. Sebeok, A. S. Hayes, & M. C. Bateson (Eds.), Approaches to Semiotics (pp.

5 1-1 24). The Hague.
Maurer, D., Cook, N., Landis, T., & D'heureuse, C. (1991). Are measured differences between the formants of men, women and children due to FO differences? Journal of the International Phonetic Association, 21,6679.
McCrae, R. R., & Costa, P. T., Jr., (1987). Validation of the five-factor model of personality across instruments and observers. Journal of Personality and Social Psychology, 52,81-90.
Mekada, Y., Mukasa, M., Hasegawa, H., Kasuga, M., Matsumoto, S., & Koike, A. (1999). Onsei shingo ni fukumareru kanjo hyogen no bunseki [Acoustic analysis of emotional expressions present in speech signals]. Eizo Joho Media Gakkaishi [Journal of the Institute of Image Information and Television Engineers], 53, 769-772.
Miyake, K., & Zuckerrnan, M. (1993). Beyond personality impressions: Effects of physical and vocal attractiveness on false consensus, social comparison, affiliation, and assumed and perceived similarity. Journal of Personality, 63,411437.
Mokhtari, P., Clermont, F., & Tanaka, K. (2000). Toward and acoustic-articulatory model of inter-speaker variability. 6th International Conference on Spoken Language Processing: ICSLP 2000, the proceedings of the conference, Oct. 16-Oct. 20, 2000, Beijing International Convention Center, Beijing, China, Vol. 11, 158-1 6 1.
Mokhtari, P., Iida, A., & Campbell, N. (2001). Some articulatory correlates of emotion variability in speech: A preliminary study on spoken Japanese vowels. Proceedings of the International Conference on Speech Processing (ICSP), Korea, August 2001,43 1436.
Montepare, J. M., & Zebrowitz-McArthur, L. (1987). Perceptions of adults with childlike voices in two cultures. Journal of Experimental Social Psychology, 23,33 1-349.
Moriyarna, T., Saito, H., & Ozawa, S. (1999). Onsei ni okeru kanjo hyogengo to kanjo parameta no taiouzuke [Evaluation of the relation between emotional concepts and emotional parameters in speech]. Denshi Joho Tsushin Gakkai ronbunshi [The transactions of the Institute of Electronics, Information, and Communication Engineers] D-II, J82-D-II, 703-7 1 1.
Munro, M. J., Derwing, T. M, & Burgess, C. S. (2003). The detection of foreign accent in backwards speech. In M. J. Sole, D. Recasens & J. Romero (Eds.), Proceedings of the 1.5'~ International Congress of Phonetic Sciences, Barcelona, 3-9 August 2003 (pp. 535-538). Barcelona, Spain: Universitat Autdnoma de Barcelona.
Murray, I. R., & Arnott, J. L. (1993). Toward the simulation of emotion in synthetic speech: A review of the literature on human vocal emotion. Journal of the Acoustical Society of America, 93, 1097-1 108.

Nakagawa, S., Shirakata, H., Yarnao, M., & Sakai, T. (1980). Differences in feature parameters of Japanese vowels with sex and age. Studia Phonologica, 14,33-52.
Nass, C., & Lee, K. M. (2001). Does computer-synthesized speech manifest personality? Experimental tests of recognition, similarity-attraction, and consistency-attraction. Journal of Experimental Psychology: Applied, 7 , 17 1-1 8 1.
Nawka, T., Anders, L. C., Cebulla, M., & Zurakowski, D. (1997). The speaker's formant in male voices. Journal of Voice, 11,422428.
Nolan, F. (1983). The phonetic bases of speaker recognition. Cambridge: Cambridge University Press.
Oguchi, T., & Kikuchi, H. (1997). Voice and interpersonal attraction. Japanese Psychological Research, 39, 56-6 1.
Ohala, J. J. (1984). An ethological perspective on common cross-language utilization of Fo of voice. Phonetica, 41, 1-1 6.
Ohala, J. J. (1994). The frequency code underlies the sound-symbolic use of voice pitch. In L. Hinton, J. Nichols & J. Ohala (Eds.), Sound symbolism (pp. 325-347). Cambridge, UK: Cambridge University Press.
Ohara, Y. (1997). Shakai onseigaku no kanten kara mita nihonjin no koe no koutei [Japanese speakers' pitch levels from the perspective of sociolinguistics]. In S. Ide (Ed.), Joseigo no sekai [The world of women's language] (pp. 42-58). Tokyo: Meiji Shoin.
Palmer, J. M. (1993). Anatomy for speech and hearing (4th ed.). Baltimore: Williams & Wilkins.
Papaeliou, C., Minadakis, G, & Cavouras, (2002). Acoustic patterns of infant vocalizations expressing emotions and communicative functions. Journal of Speech, Language, and Hearing Research, 45,3 1 1-3 17.
Peng, Y., Zebrowitz, L. A., & Lee, H. K. (1993). The impact of cultural background and cross-cultural experience on impressions of American and Korean male speakers. Journal of Cross-Cultural Psychology, 24,203-220.
Perry, T. L., Ohde, R. N., & Ashmead, D. H. (2001). The acoustic bases for gender identification from children's voices. Journal of the Acoustical Society of America, 109,2988-2998.
Pittam, J. (1987). The long-term spectral measurement of voice quality as a social and personality marker: A review. Language and Speech 30, 1 - 12.
Pittam, J. (1 994). Voice in social interaction: An interdisciplinary approach. Thousand Oaks, CA: Sage.
Ray, G B. (1986). Vocally cued personality prototypes: An implicit personality theory approach. Communication Monographs, 53,266-276.
Rendall, D. (2003). Acoustic correlates of caller identity and affect intensity in the vowel-like grunt vocalizations of baboons. Journal of the Acoustical Society of America, 113,3390-3402.
Russell, J. A., Bachorowski, J.-A., & Fernhdez-Dols, J.-M. (2003). Facial and vocal expressions of emotion. Annual Review of Psychology, 54, 329-349.
Sachs, J., Lieberman, P., & Erickson, D. (1973). Anatomical and cultural determinants of male and female speech. In R. W. Shuy & R. W. Fasold (Eds.), Language attitudes: Current trends and prospects (pp. 74-84). Washington, D.C.: Georgetown University Press.
Sato, H., & Akamatsu, N. (2001). Nyuraru nettowaku ni yoru kanjo onsei no bunrui [Classification of emotional speech by using neural networks]. Denshi Joho Tsushin Gakkui gijutsu kenkyu hokoku [IEICE tech. rep.], N 2OOl-34,85-90.
Scheiner, E., Hammerschrnidt, K., Jiirgens, U., & Zwirner, P. (2002). Acoustic analyses of developmental changes and emotional expression in the preverbal vocalizations of infants. Journal of Voice, 16,509-529.
Scherer, K. R. (1 97 1). Randomized splicing: A note on a simple technique for masking speech content. Journal of Experimental Research in Personality, 5, 155-1 59.
Scherer, K. R. (1979a). Nonlinguistic vocal indicators of emotion and psychopathology. In C. E. Izard (Ed.), Emotions in Personality and Psychopathology (pp. 493-529). New York: Plenum Press.
Scherer, K. R. (1979b). Personality markers in speech. In K. R. Scherer & H. Giles (Eds.), Social markers in speech (pp. 147-209). Cambridge University Press, Cambridge, and Editions de la Maison des Sciences de l'Homme, Paris.
Scherer, K. R. (1986). Vocal affect expression: A review and a model for future research. Psychological Bulletin, 99, 143-1 65.
Scherer, K. R. (2003). Vocal communication of emotion: A review of research paradigms. Speech Communication, 40,227-256.
Scherer, K.R., Banse, R., & Wallbott, H. G (2001). Emotion inferences from vocal expression correlate across languages and cultures. Journal of Cross-Cultural Psychology, 32,7692.
Scherer, K. R., Feldstein, S., Bond, R. N., & Rosenthal, R. (1985). Vocal cues to deception: A comparative channel approach. Journal of Psycholinguistic Research, 14,409425.
Secord, P. F. (1958). Facial features and inference processes in interpersonal perception. In R. Tagiuri & L. Petrullo (Eds.), Person perception and interpersonal behavior (pp. 300-3 1 5). CA: Stanford University Press.
Seyfarth, R. M., & Cheney, D. L. (2003). Signalers and receivers in animal communication. Annual Review of Psychology, 54, 145-1 73.
Shigenaga, M. (2001). Kanjo no hanbetsu bunseki kara mita kanjo onsei no tokucho VIII: nyuraru nettowaku ni yoru hanbetsu [Characteristic features of emotionally uttered speech revealed by discriminant analysis VIII: Use of neural networks]. Denshi Joho Eushin Gakkai gijutsu kenkyu hokoku [IEICE tech. rep.], SP 2000-19,29-34.
Shrivastav, R. (in press). The use of an auditory model in predicting perceptual ratings of breathy voice quality. Journal of Voice
Shrivastav, R., & Sapienza, C. M. (2003). Objective measures of breathy voice quality obtained using an auditory model. Journal of the Acoustical Society of America, 144,22 17-2224.
Sjolander, K., & Beskow, J. (2002). Wavesurfer (Version 1.4.6) [Computer software]. Stockholm: Centre for Speech Technology, Kungliga Tekniska Hogskolan. Retrieved from http://www.speech.kth.se/wavesurfer/
Snell, R. C. (1993). CSL cepstral tutorial [Computer s o h a r e manual]. Speech Technology Research, Victoria, British Columbia, Canada.
Someda, T. (1966). Ei, fbtsugo to no hikaku ni okeru nihongo no chouon no ippanteki haikei ni tsuite [The articulatory setting of the Japanese language compared with those of English and French]. Onsei no kenkyu [The Study of Sound], 12, 327-336.
Stager, S. V., Neubert, R., Miller, S., Regnell, J. R., Bielamowicz, S. A. (2003). Incidence of supraglottic activity in males and females: A preliminary report. Journal of Voice, 1 7, 395402.
Story, B. H., & Titze, I. R. (2002). A preliminary study of voice quality transformation based on modifications to the neutral vocal tract area function. Journal of Phonetics, 30,485-509.
Story, B. H., Titze, I. R., & Hoffman, E. A. (2001). The relationship of vocal tract shape to three voice qualities. Journal of the Acoustical Society of America, 109, 1651-1667.
Stuart-Smith, J. (1999). Glasgow: Accent and voice quality. In P. Foulkes & G Docherty (Eds.), Urban voices: Accent studies in the British Isles (pp. 203-222). London: Arnold.
Sundberg, J. (1974). Articulatory interpretation of the 'singing formant.' Journal of the Acoustical Society of America, 55, 838-844.
Takeda, S., Nishizawa, Y., & Ohyama, G (2001). "Ikari" no onsei no tokucho bunseki ni kansuru ichi kousatsu [Some considerations of prosodic features of "anger" expressions]. Denshi Joho Bushin Gakkai gijutsu kenkyu hokoku [IEICE tech. rep.], SP 2000-1 64,3340.
Teshigawara, M. (2000). A comparison of voice quality in Japanese and Thai using LTAS analysis. Unpublished manuscript, University of Victoria, Victoria, British Columbia, Canada.
Teshigawara, M. (2003). Voices in Japanese animation: How people perceive voices of good guys and bad guys. In M. J. SolC, D. Recasens & J. Romero (Eds.), Proceedings of the ljth International Congress of Phonetic Sciences, Barcelona, 3-9 August 2003 (pp. 241 3-241 6). Barcelona, Spain: Universitat Autonoma de Barcelona.
Titze, I. R. (2001). Acoustic interpretation of resonant voice. Journal of Voice, 15, 5 19-528.
Titze, I. R., & Story, B. H. (1997). Acoustic interactions of the voice source with the lower vocal tract. Journal of the Acoustical Society of America, 101,2234-2243.
Todaka, Y. (1993). A cross-language study of voice quality: Bilingual Japanese and American English speakers (Doctoral dissertation, University of California at Los Angeles, 1993). Dissertation Abstracts International, 54,30 15A.
Traunmiiller, H., & Eriksson, A. (1993). The frequency range of the voice fundamental in the speech of male and female adults. Unpublished manuscript, Stockholm University. Retrieved from http://www.ling.su.se/staff/hartmut~aktupub.htrn
Trudgill, P. (1974). The social dzferentiation of English in Nonuich. London: Cambridge University Press.
Uchida, T. (2000). Onsei no hatsuwa sokudono seigyo ga pitch-kan oyobi washa no seikaku insho ni ataeru eikyo [Effects of the speech rate conversion on the impressions of pitch and the images of the speakers' personality]. Nippon Onkyo Gakkai shi, 56,396-405.
Van Bezooijen, R. (1988). The relative importance of pronunciation, prosody, and voice quality for the attribution of social status and personality characteristics. In R. van Hout & U. Knops (Eds.), Language attitudes in the Dutch language area (pp. 85-1 03). Dordrecht: Foris.
Van Bezooijen, R. (1995). Sociocultural aspects of pitch differences between Japanese and Dutch women. Language and Speech, 38,253-265.
Van Bezooijen, R., & Boves, L. (1986). The effects of low-pass filtering and random splicing on the perception of speech. Journal of Psycholinguistic Research, 15, 403-417.
Van Dusen, C. R. (1941). A laboratory study of the metallic voice. Journal of Speech Disorders, 6, 137-140.
Wirz, S. L., Subtelny, J. D., Whitehead, R. L. (1981). Perceptual and spectrographic study of tense voice in normal hearing and deaf subjects. Folia Phinatrica, 33,23-36.
Whiteside, S. P. (2001). Sex-specific fundamental and formant frequency patterns in a cross-sectional study. Journal of the Acoustical Society of America, 11 0,464478.
Yamada, N., Hakoda, Y., Yuda, E., & Kusuhara, A. (2000). Verification of impression of voice in relation to occupational categories. Psychological Reports, 86, 1249-1 263.
Yamazawa, H., & Hollien, H. (1992). Speaking fundamental frequency patterns of Japanese women. Phonetica, 49, 128-1 40.
Yanagsawa, E., Estill, J., Krnucha, S. T., & Leder, S. B. (1989). The contribution of aryepiglottic constriction to "ringing" voice quality: A videolaryngoscopic study with acoustic analysis. Journal of Voice, 3, 342-350.
Yarmey, A. D. (1993). Stereotypes and recognition memory for faces and voices of good guys and bad guys. Applied Cognitive Psychology, 7,4 19-43 1.
Zuckerman, M., & Driver, R. E. (1989). What sounds beautiful is good: The vocal attractiveness stereotype. Journal of Nonverbal Behavior; 13,67-82.
Zuckerman, M., Hodgins, H. S., & Miyake, K. (1990). The vocal attractiveness stereotype: Replication and elaboration. Journal of Nonverbal Behavior; 14, 97-1 12.
Zuckerman, M., Hodgins, H. S., & Miyake, K. (1993). Precursors of interpersonal expectations: The vocal and physical attractiveness stereotypes. In P. D. Blanck (Ed.), Interpersonal expectations: Theory, research, and applications (pp. 194-2 17). Cambridge, UK: Cambridge University Press.
Zuckerman, M., & Miyake, K. (1993). The attractive voice: What makes it so? Journal of Nonverbal Behavior; 17, 1 19-1 35.
Appendixes
Appendix A: Materials analyzed in this study1
(Producers). (1974). Mazinger 2: (Mazinger 2: The general of darkness) [Motion
picture].
(Producers). (1 997). Rayearth (Rayearth) [Video series].
(Producers). (1998). Meitantei Conan: Juyonbanme no hyoteki (Conan the boy detective:
The 1 4th victim) [Motion picture].
*Studio Take, Studio Joke, NTV Animation, Shinei, & Nippon TV (Producers). (1973).
Doraemon (Doraemon) [Television series].
*Tabac, & Toei (Producers). (1991). Sazan Eyes (3x3 Eyes) [Video series].
Dynamic, Oh Pro, & NET (1972). Devilman (Devilman) [Television series].
Gainax, Group Tac, & NHK (Producers). (1990). Fushigi nu umi no Nadia (The Secret of
Blue Water) [Television series].
Madhouse, TV Tokyo, & GENCO (Producers). (1998). Super doll Licca-chan (Super doll
Licca-chan) [Television series].
Nibariki, Tokuma, & Studio Ghibli (Producers). (1986). Tenku no shiro Laputa (Castle in
the sky) [Motion picture].
Nippon Animation, & NHK (Producers). (1978). Mirai shonen Conan (Future boy
Conan) [Television series].
Studio Juno, & TV Tokyo (Producers). (1 995). Saber marionettes (Saber marionettes)
[Television series].
TMS, & Nippon TV (Producers), (1988). Sore ike! Anpanman (Anpanman) [Television
series].
Tatsunoko, & Fuji TV (Producers). (1972). Kagaku ninjatai gatchaman (Battle of the
planets) [Television series].
Tatsunoko, Fuji TV (Producers). (1975). Eme bokan (Time Bokan) [Television series].
Tatsunoko, Fuji TV (Producers). (1 977). Yattaman (Yattaman) [Television series].
Tezuka Pro, & Fuji TV (Producers). (1967). Ribbon no kishi (Princess Knight)
The information is based on Clements and McCarthy (2001). The titles with * were used only for the preliminary study.

[Television series].
Tezuka Pro, & Fuji TV (Producers). (1980). Tetsuwan atom (New adventures of astro
boy) [Television series].
Toei, & Fuji TV (Producers). (1984). Hokuto no Ken (Fist of the north star) [Television
series].
Toei, Aoi, & TV Asahi (Producers). (1 986). Seinto seiya (Saint Seiya) [Television series].
Toei, Aoi, & TV Asahi (Producers). (1993). Bishojo senshi Sailor Moon R (Sailor Moon
R) [Motion picture].
Toei, Aoi, & TV Asahi (Producers). (1995). Bishojo senshi Sailor Moon Super S (Sailor
Moon super S) [Television series].
Toei, Aoi, & TV Asahi (Producers). (199?). Bishojo senshi Sailor Moon R (Sailor Moon
R) [Television series].
Toei, Dynamic, & NET (Producers). (1973). Cutey Honey (Cutey Honey) [Television
series].
Westcape, Studio Take Off, & Yomiuri TV (Producers). (1974). Uchu senkan Yamato
(Star Blazers) [Television series].
Xebec, & TV Tokyo (Producers). (1998). Kaiketsu joki tanteidan (Steam detectives)
[Television series].

App
endi
x B
: V
ocal
Pro
Jile
of 2
7 S
timul
us C
hara
cter
s
Setti
ngs
Spea
kers
A
hml
Asm
l A
vml
DV
F2
EV
M1
FHm
l G
HFl
G
HM
l G
VM
l H
VF
l Ih
ml
KH
fl
LH
fl
LSF
l L
aryn
geal
ra
ised
lary
nx
n 1
2 2
n n
n n
n n
n n
n 2
low
ered
lary
nx
n n
n n
1 n
n n
n 1
1 n
n n
Lab
iaY
iaw
~
ab
klj
aw
pr
otru
sion
n
n 2
2 2
n n
n n
1 n
n n
n L
abia
l lip
-spr
ead
n 1
2 2
n n
n n
n n
n n
1 2
lip c
onst
rict
ion
n 1
1 2
2 n
n n
n 1
n n
n 1
Man
dibu
lar
clos
e jaw
n
n n
1 1
n n
n n
n n
n n
n op
en ja
w
1 2
2 n
n 2
1 1
1 n
n 2
n 2
Lin
gual
bod
y fr
onte
d bo
dy
1 1
n n
n n
1 n
n 1
1 1
2 n
rais
ed b
ody
n n
2 2
n n
n n
n n
n n
n n
retr
acte
d bo
dy
n n
2 2
1 n
n n
1 n
n n
n n
Epi
lary
ngea
l la
ryng
eal s
ph
in~
ter
n 2
2 n
1 n
n 1
1 i
n n
n 2
phar
ynge
al e
xpan
sion
n
n n
n 1
1 n
n n
2 1
n n
n V
elic
cou
plin
g na
sal
n n
n 1
n n
n n
n n
n n
n 1
Phon
ator
y cr
eak(
$)
n n
n n
n n
n n
n n
n n
n i
whi
sper
(y)
n n
n n
n n
n n
n n
n n
n n
hars
h n
n 3
3 1
n 1
1 n
i n
n n
3 br
eath
y 1
n n
n n
3 1
n n
n 2
1 3
n (t
able
cont
inue
s)

(con
tinue
d)
Setti
ngs
Spe
aker
s M
HF
l M
Hfl
M
HM
l M
VF
l M
VM
1 O
Hfl
O
Hm
l O
VF
l Q
HF
l Q
VM
l R
HF1
S
HM
l T
HM
l L
aryn
geal
ra
ised
lary
nx
n n
n n
n n
n n
n 1
n n
n lo
wer
ed la
rynx
n
n n
n n
n n
n n
n n
n n
Lab
iaV
jaw
L
abia
Vja
w p
rotr
usio
n n
n n
n n
n n
n n
2 n
n n
Lab
ial
lip-s
prea
d 1
2 n
2 1
1 n
n n
n n
n n
lip c
onst
rict
ion
n n
n n
n n
n n
n 2
n n
n M
andi
bula
r cl
ose j
aw
n n
n n
n n
n n
n n
n n
n op
en ja
w
1 2
n 1
n 1
1 2
2 1
n 1
2 L
ingu
al b
ody
fron
ted
bddy
2
2 1
2 2
2 1
2 1
n 1
1 n
rais
ed b
ody
n n
n n
n n
n n
n n
n n
n re
trac
ted
body
n
n n
n n
n n
n n
1 n
n n
Epi
lary
ngea
l la
ryng
eal s
phin
cter
n
n n
n n
n 1
n n
2 n
n i
phar
ynge
al e
xpan
sion
n
n 1
n 1
n n
n n
n n
1 1
Vel
ic c
oupl
ing
nasa
l n
n n
n n
n n
n n
n n
n n
Phon
ator
y c
reak
(^)
n n
n n
n n
n n
n n
n n
n w
hisp
er(y
) n
n n
n n
n 1
n n
n n
n 1
hars
h n
n n
n n
n i
n n
3 n
n n
brea
thy
3 n
1 2
n n
n n
1 n
3 1
n
Not
e. T
he f
ollo
win
g se
ttin
gs a
re e
xclu
ded
from
this
tabl
e fo
r the
reas
ons
stat
ed in
3.1
and
3.2
: la
biod
enta
lizat
ion,
lip-
roun
ded,
ling
ual t
ip b
lade
set
tings
, den
asal
, m
odal
voi
ce, f
alse
tto
voic
e. T
he f
igur
es re
pres
ent t
he s
cala
r de
gree
s as
sign
ed, f
rom
1 to
3, e
xcep
t for
the
follo
win
g se
tting
s: ra
ised
and
low
ered
lar
ynx
setti
ngs,
la
biaV
jaw
pro
trus
ion,
lip
cons
tric
tion,
and
epi
lary
ngea
l set
tings
. The
se h
ave
only
1 a
nd 2
. "i
" st
ands
for
inte
rmitt
ent o
ccur
renc
es o
f th
e se
tting
in q
uest
ion.
"n"
st
ands
for
abse
nce
of th
e se
ttin
g.
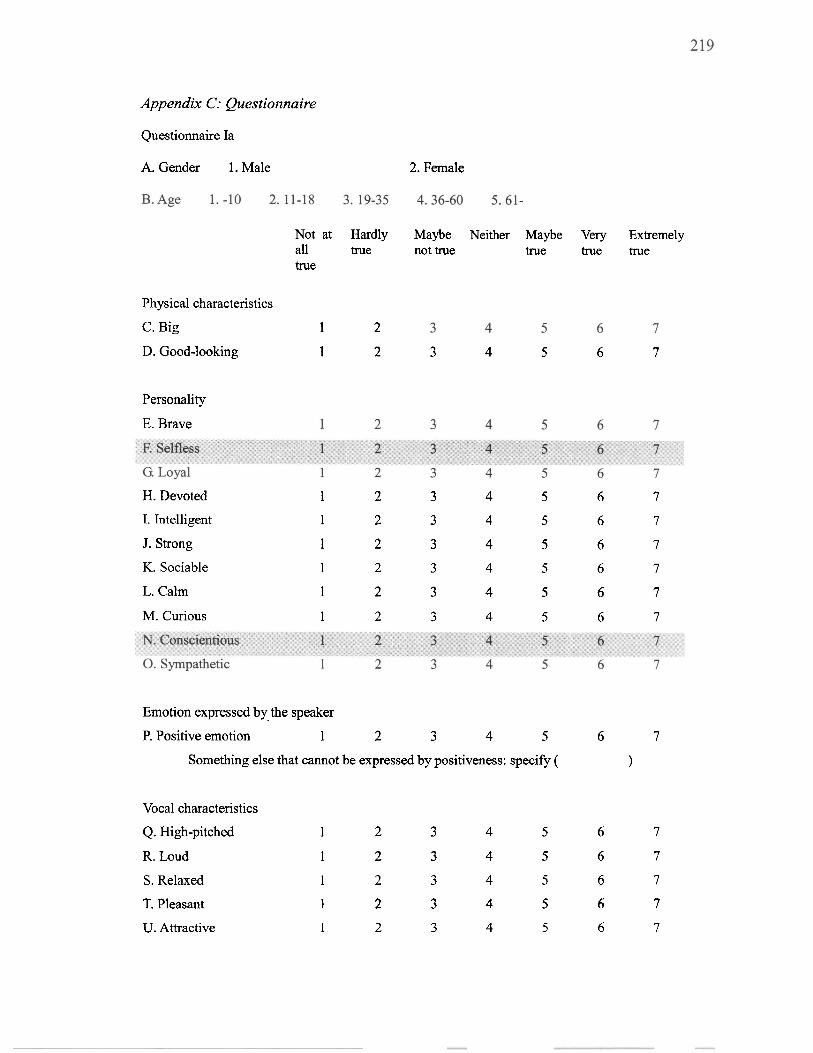
Appendix C: Questionnaire
Questionnaire Ia
A. Gender 1. Male
Not at Hardly all true true
Physical characteristics
C. Big 1 2
2. Female
Maybe Neither Maybe Very Extremely not true true true true
D. Good-looking 1 2 3 4 5 6 7
Personality
E. Brave
H. Devoted 1 2 3 4 5 6 7
I. Intelligent 1 2 3 4 5 6 7
J. Strong I 2 3 4 5 6 7
IC Sociable 1 2 3 4 5 6 7
L. Calm 1 2 3 4 5 6 7
M. Curious 1 2 3 4 5 6 7
Emotion expressed by the speaker
P. Positive emotion 1 2 3 4 5 6 7
Something else that cannot be expressed by positiveness: specify ( )
Vocal characteristics
Q. High-pitched 1 2 3 4 5 6 7
R. Loud 1 2 3 4 5 6 7
S. Relaxed 1 2 3 4 5 6 7
T. Pleasant 1 2 3 4 5 6 7
U. Attractive 1 2 3 4 5 6 7
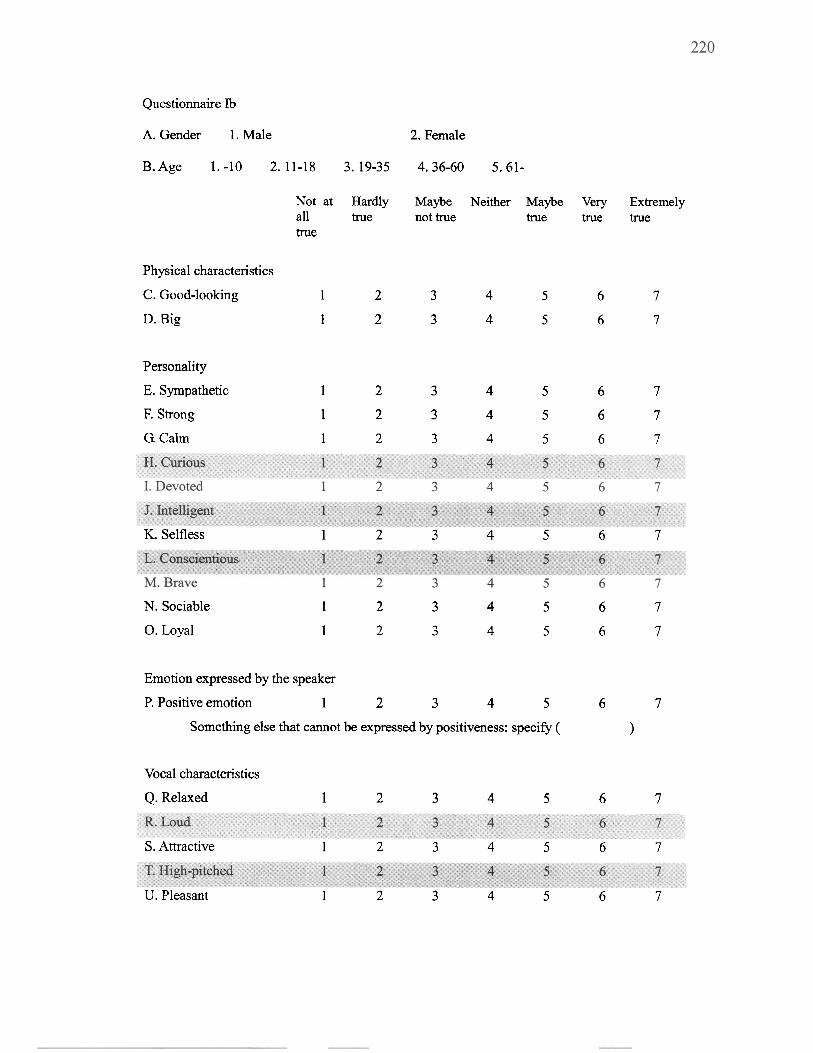
Questionnaire Ib
A. Gender 1. Male 2. Female
B. Age 1. -10 2. 11-18 3. 19-35 4.36-60 5.61-
Not at Hardly Maybe Neither Maybe Very Extremely all true not true true true true true
Physical characteristics
C. Good-looking 1 2 3 4 5 6 7
D. Rig 1 2 3 4 5 6 7
Personality
E. Sympathetic 1 2 3 4 5 6 7
F, Strong 1 2 3 4 5 6 7
G. Calm 1 2 3 4 5 6 7
K. Selfless 1 2 3 4 5 6 7
N. Sociable 1 2 3 4 5 6 7
0. Loyal 1 2 3 4 5 6 7
Emotion expressed by the speaker
P. Positive emotion 1 2 3 4 5 6 7
Something else that cannot be expressed by positiveness: specify ( 1
Vocal characteristics
Q. Relaxed 1 2 3 4 5 6 7
S. Attractive 1 2 3 4 5 6 7
U. Pleasant 1 2 3 4 5 6 7
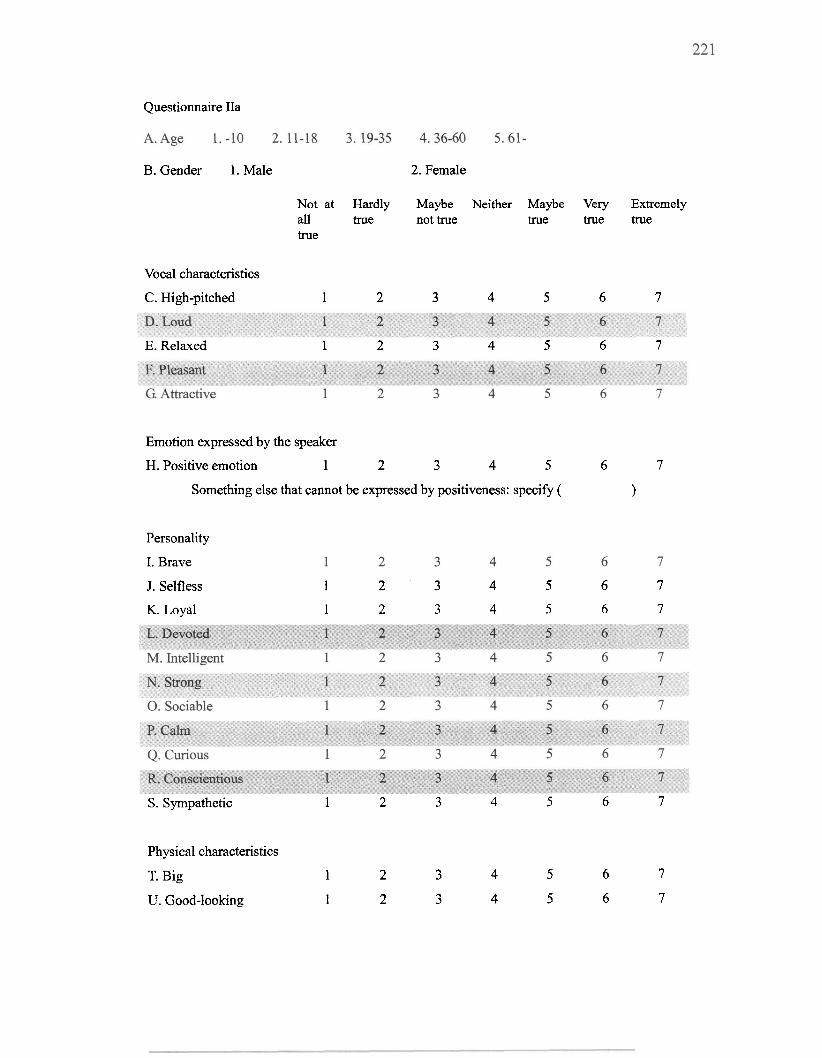
Questionnaire IIa
B . Gender 1. Male 2. Female
Not at Hardly Maybe Neither Maybe Very Extremely all true not true true true true true
Vocal characteristics
C. High-pitched 1 2 3 4 5 6 7
E. Relaxed 1 2 3 4 5 6 7
Emotion expressed by the speaker
H. Positive emotion 1 2 3 4 5 6 7
Something else that cannot be expressed by positiveness: specify ( 1
Personality
I. Brave
J. Selfless 1 2 3 4 5 6 7
K. Loyal 1 2 3 4 5 6 7
S. Sympathetic 1 2 3 4 5 6 7
Physical characteristics
T. Big 1 2 3 4 5 6 7
U. Good-looking 1 2 3 4 5 6 7
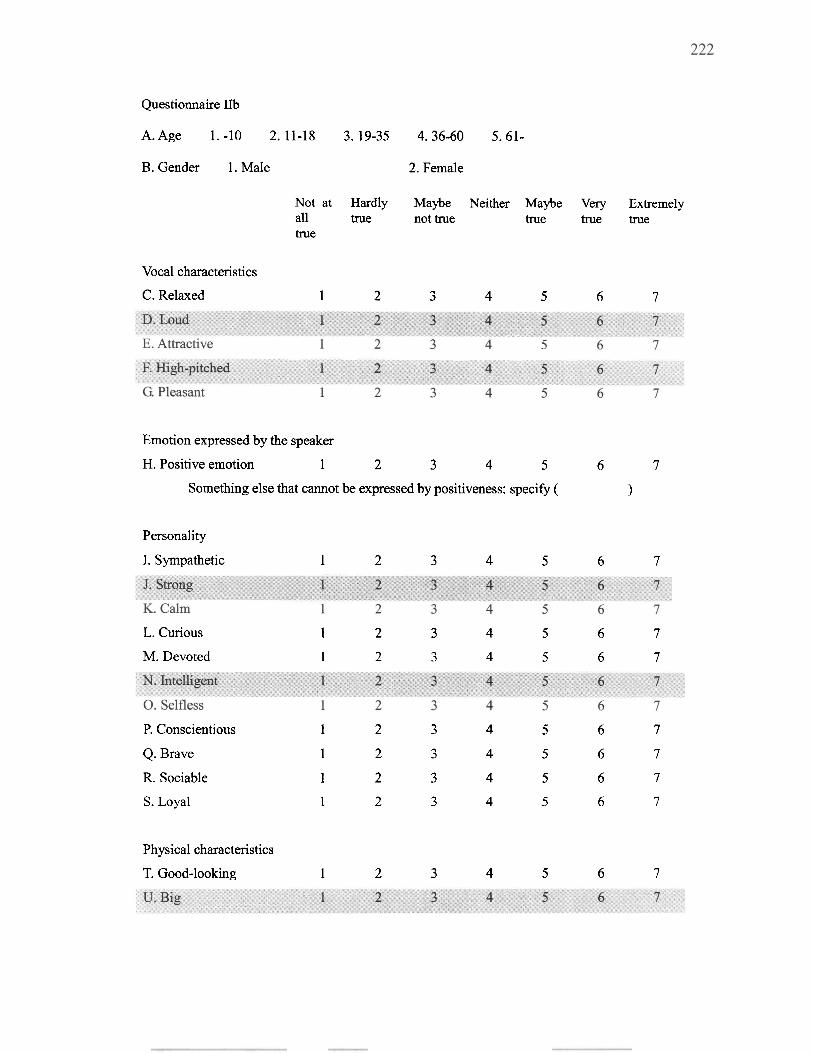
Questionnaire IIb
A. Age 1. -10 2. 11-18 3. 19-35 4.36-60 5.61-
B. Gender 1. Male 2. Female
Not at Hardly Maybe Neither Maybe Very Extremely all true not true true true true true
Vocal characteristics
C. Relaxed 1 2 3 4 5 6 7
Emotion expressed by the speaker
H. Positive emotion 1 2 3 4 5 6 7
Something else that cannot be expressed by positiveness: specify ( 1
Personality
I. Sympathetic 1 2 3 4 5 6 7
L. Curious 1 2 3 4 5 6 7
M. Devoted 1 2 3 4 5 6 7
P. Conscientious 1 2 3 4 5 6 7
Q. Brave 1 2 3 4 5 6 7
R. Sociable 1 2 3 4 5 6 7
S. Loyal 1 2 3 4 5 6 7
Physical characteristics
T. Good-looking 1 2 3 4 5 6 7

Questionnaire Ia in Japanese

App
endi
x D
R
elia
bilit
y o
f Rat
ings
by
Con
ditio
n G
roup
s -
- -
-
AIa
(n =
5)
AIb
(n =
4)
AII
a (n
= 4
) A
IIb (n
= 4
) B
ia (n =
3)
Bib
(n =
4)
BII
a (n
= 4
) B
IIb (n
= 4
) a
Intr
a.
a In
tra.
a
Intr
a.
a In
tra.
a
Intr
a.
a In
tra.
a
Intr
a.
a In
tra.
G
ende
r 0.
95
0.80
0.
94
0.81
0.
91
0.70
0.
96
0.87
0.
96
0.90
0.
91
0.73
0.
95
0.84
0.
93
0.78
A
ge
0.91
Ph
ysic
al c
hara
cter
istic
s B
ig
0.78
G
ood-
look
ing
0.80
Pe
rson
ality
traits
Bra
ve
0.49
Se
lfle
ss
0.61
L
oyal
0.
71
Dev
oted
0.
57
Inte
llige
nt
0.48
St
rong
0.
58
Soci
able
0.
33
Cal
m
0.48
C
urio
us
0.71
C
onsc
ient
ious
0.
6 1
Sym
path
etic
0.
64
Posi
tive
emot
ion
0.04
V
ocal
cha
ract
eris
tics
Hig
h-pi
tche
d 0.
87
Lou
d 0.
24
Rel
axed
0.
56
Plea
sant
0.
71
Attr
activ
e 0.
79
0.43
0.
62
0.29
,0
.40
0.
14
0.63
0.
30
0.29
0.
12
0.79
0.
49
0.76
0.
45
0.89
0.
66
Not
e. F
igur
es a
re b
ased
on
all 3
2 pa
rtic
ipan
ts. a
= C
ronb
ach'
s a;
Intr
a =
Intr
acla
ss co
rrel
atio
n.


![[ON PHONICITY] PHONETIC ANALYTICS GUSLARI ON-LINE · Techno-Trauma: From Analog to Digital "Prayers of a Phonographic Doll" (Anderson Blanton) VOICES AS PHONOGRAPHIC EVENT Phonographic](https://img.pdfslide.us/doc/110x75/5e3a8f1f467152476431f91b/on-phonicity-phonetic-analytics-guslari-on-line-techno-trauma-from-analog-to.jpg)