Embed Size (px)
Citation preview
Full Terms & Conditions of access and use can be found athttps://www.tandfonline.com/action/journalInformation?journalCode=rvsr20
Voice and Speech Review
ISSN: (Print) (Online) Journal homepage: https://www.tandfonline.com/loi/rvsr20
Voice Dosimetry in an Elementary Music StudentTeacher
Bryan E. Nichols , Kay Piña & Scott-Lee Atchison
To cite this article: Bryan E. Nichols , Kay Piña & Scott-Lee Atchison (2021): VoiceDosimetry in an Elementary Music Student Teacher, Voice and Speech Review, DOI:10.1080/23268263.2021.1872866
To link to this article: https://doi.org/10.1080/23268263.2021.1872866
View supplementary material
Published online: 25 Jan 2021.
Submit your article to this journal
View related articles
View Crossmark data

ARTICLE
Voice Dosimetry in an Elementary Music Student TeacherBryan E. Nichols, Kay Piña and Scott-Lee Atchison
Pennsylvania State University, State College, PA, USA
ABSTRACTThis study pilots a new voice dosimeter device applied to a music student teacher across five consecutive school days. The aim of this study was to measure voice use during instructional periods in the music teacher classroom, and the participant wore the dosimeter during the school day in two elementary school buildings with chil-dren aged 5–11. The device was successfully deployed, and the results indicated that measures of fundamental frequency (F0) and volume (dB) and ambient sounds (dB) varied across the school day and according to student teacher activities. Significant differences were found between voice use when teaching full time for 1 day versus partial instruction and class participation. Phonation percentage time varied by day (M = 28.12%), including 27.08% on Day 1, 24.41% on Day 2, 43.49% on Day 3, 27.24% on Day 4, and 18.40% on Day 5.
KEYWORDS Vocal health; classroom music teacher; voice dosimetry; dosimeter; voice use; vocal health
Introduction
Music teachers experience increased vocal load,1 when compared to classroom teachers (Morrow and Connor 2011), and the development of teachers’ classroom voice use can be presumed to begin during the student teaching period that comes near the end of teacher-training programs in the United States. Vocal load is commonly measured through dosimeter devices,2 and the measurements have historically included total phonation time3, fundamental frequency,4 and volume (Manternach 2015; Morrow and Connor 2011; Remacle, Morsomme, and Finck 2014; Schiller, Morsomme, and Remacle 2018). Surveys such as the Singing Voice Handicap Index (Cohen et al. 2007), Vocal Fatigue Index (Jacobson et al. 1997), and daily voice health logs can also be used to gather data about vocal load and vocal health. Further, laryngeal examinations as well as vocal recordings have also been employed to identify voice function (Brunkan 2018; Schiller et al. 2018). Music teachers may experience increased vocal load when compared to classroom teachers, yet little is known about the effects of vocal load on pre-service music teachers. Research in this area has been further limited by the lack of commercially available dosimeters used to collect data on this preservice music teacher group.
Previous research has examined the relationship between perceived stress, anxiety, and depression for patients with voice disorders found to be common (Dietrich et al. 2008). The Perceived Stress Scale questionnaire (Cohen, Kamarck, and Mermelstein 1983) and the Hospital Anxiety and Depression Scale questionnaire (Zigmond and Snaith 1983) were
CONTACT Bryan E. Nichols [email protected] data for this article can be accessed here.
VOICE AND SPEECH REVIEW https://doi.org/10.1080/23268263.2021.1872866
© 2021 Voice and Speech Trainers Association
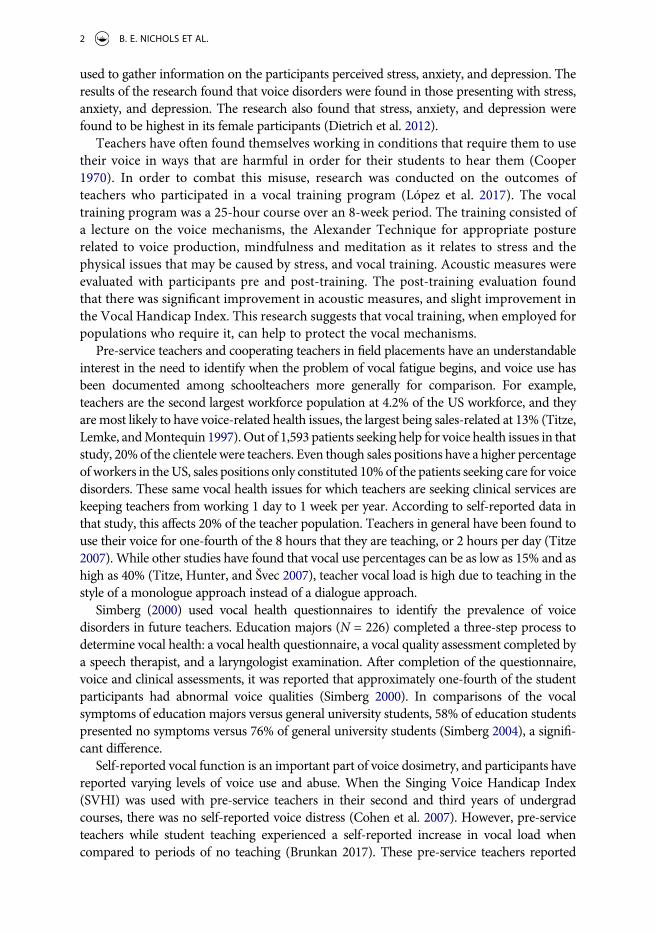
used to gather information on the participants perceived stress, anxiety, and depression. The results of the research found that voice disorders were found in those presenting with stress, anxiety, and depression. The research also found that stress, anxiety, and depression were found to be highest in its female participants (Dietrich et al. 2012).
Teachers have often found themselves working in conditions that require them to use their voice in ways that are harmful in order for their students to hear them (Cooper 1970). In order to combat this misuse, research was conducted on the outcomes of teachers who participated in a vocal training program (López et al. 2017). The vocal training program was a 25-hour course over an 8-week period. The training consisted of a lecture on the voice mechanisms, the Alexander Technique for appropriate posture related to voice production, mindfulness and meditation as it relates to stress and the physical issues that may be caused by stress, and vocal training. Acoustic measures were evaluated with participants pre and post-training. The post-training evaluation found that there was significant improvement in acoustic measures, and slight improvement in the Vocal Handicap Index. This research suggests that vocal training, when employed for populations who require it, can help to protect the vocal mechanisms.
Pre-service teachers and cooperating teachers in field placements have an understandable interest in the need to identify when the problem of vocal fatigue begins, and voice use has been documented among schoolteachers more generally for comparison. For example, teachers are the second largest workforce population at 4.2% of the US workforce, and they are most likely to have voice-related health issues, the largest being sales-related at 13% (Titze, Lemke, and Montequin 1997). Out of 1,593 patients seeking help for voice health issues in that study, 20% of the clientele were teachers. Even though sales positions have a higher percentage of workers in the US, sales positions only constituted 10% of the patients seeking care for voice disorders. These same vocal health issues for which teachers are seeking clinical services are keeping teachers from working 1 day to 1 week per year. According to self-reported data in that study, this affects 20% of the teacher population. Teachers in general have been found to use their voice for one-fourth of the 8 hours that they are teaching, or 2 hours per day (Titze 2007). While other studies have found that vocal use percentages can be as low as 15% and as high as 40% (Titze, Hunter, and Švec 2007), teacher vocal load is high due to teaching in the style of a monologue approach instead of a dialogue approach.
Simberg (2000) used vocal health questionnaires to identify the prevalence of voice disorders in future teachers. Education majors (N = 226) completed a three-step process to determine vocal health: a vocal health questionnaire, a vocal quality assessment completed by a speech therapist, and a laryngologist examination. After completion of the questionnaire, voice and clinical assessments, it was reported that approximately one-fourth of the student participants had abnormal voice qualities (Simberg 2000). In comparisons of the vocal symptoms of education majors versus general university students, 58% of education students presented no symptoms versus 76% of general university students (Simberg 2004), a signifi-cant difference.
Self-reported vocal function is an important part of voice dosimetry, and participants have reported varying levels of voice use and abuse. When the Singing Voice Handicap Index (SVHI) was used with pre-service teachers in their second and third years of undergrad courses, there was no self-reported voice distress (Cohen et al. 2007). However, pre-service teachers while student teaching experienced a self-reported increase in vocal load when compared to periods of no teaching (Brunkan 2017). These pre-service teachers reported
2 B. E. NICHOLS ET AL.
that the increase in vocal load resulted in vocal fatigue. Still, these tools cannot indicate precise relationships between vocal, vocal fatigue, and vocal dysfunction. The Vocal Fatigue Index (VFI) allows some insight for the symptoms of vocal fatigue and dysfunction. Previously reported symptoms have been pain, tiredness, and physical discomfort among other symp-toms (Nanjundeswaran, van Mersbergen, and Morgan 2019). Unfortunately, teachers are not always aware of their vocal dysfunction and are not as good at identifying their personal voice dysfunction in the same way that a clinical physician is able to provide a diagnosis (Selevan 2016).
Vocal health problems tend to be associated with activities that are more vocally demanding, and teachers indicate increased voice clinic visitation rates when compared to other populations in the workforce (Titze, Lemke, and Montequin 1997). “Vocal music” teachers may have a documented tendency to sing at the same time as their students, as much as 16.76% to 38.84% of class time (Daugherty, Manternach, and Price 2011, as cited in Manternach 2015). When compared to general classroom teachers, music teachers are more likely to use their voice more often and consequently have a higher phonation rate: Three vocal music teachers spoke or sang during 60.34% to 72.58% of classroom time in vocal music teachers, compared to 45.39% for a math teacher (Daugherty, Manternach, and Price 2011).
Research studies in vocal health often focus on vocal load as a predictor for vocal fatigue (e.g., Brunkan 2018). Manternach (2015) examined preservice music education majors who were in their sophomore (n = 2) and junior (n = 6) years as music education majors. Participants completed the SVHI, and no voice distress was reported by the students. While wearing the dosimeter for 7 days to document phonation time, students also kept daily reports on sleep habits, vocal health, vocal capabilities, and voice quality. In addition, Students kept daily logs on their activities throughout the day, and the time spent on each activity. The total phonation time averaged 10.10%. This is lower than what is found in phonation time of educators at 21–23%, and lower than phonation time found in those who do not teach at 12–13%. The voice students in this study were found to have a higher phonation time than instrumental students during school-related activities. While higher sleep hours and “care of voice and high notes” seemed to be related to positive “singing voice quality,” voice pain was associated with “moderate-negative relationships,” and tiredness was related to “low-negative 115 relationships” (Manternach 2015).
The vocal health of pre-service teachers while student teaching has been explored by using self-reports of vocal health in student teachers, including increased reports of voice use and fatigue (Brunkan 2017). Music teachers vocal load is greater when compared to elementary classroom teachers (Morrow and Connor 2011), but it is unclear how variables such as phonation time and fundamental frequency develop or change in student teachers of music. Therefore, our aim was to explore how vocal load, and consequently vocal health issues, may affect a student teacher in music. The research questions were: (1) Can student teacher voice use be documented with a new, commercially available dosimeter, and (2) What patterns emerge in daily and/or weekly voice use of student teachers in music?
Method
The phenomenon investigated was the effect of environment and time on vocal phonation. The variables of interest were phonation volume, fundamental frequency, ambient noise,
VOICE AND SPEECH REVIEW 3
school setting location, and time. The design of this experiment was a quantitative case study (Mills, Durepos, and Wiebe 2010), consisting of one participant in a convenience sample during the final semester of undergraduate study, which culminates in a full-time semester- long student teaching experience.
Participant
The participant was a traditional college-age female, undergraduate dual major in vocal music education and communications. This participant had over 5 years of vocal singing lessons and identified as a soprano who studied at a large university in the Northeast. Data collection occurred during the school day only in the sixth week of the field placement, thus the beginning of the middle third of the semester. The data were collected during each of the 5 days the participant taught that week.
Questionnaire
There are a variety of questionnaires that are used in voice dosimetry research to provide background on voice use and voice distress. The Voice Handicap Index provides insight into self-perceived vocal distress and is used in vocal research by Manternach (2015), Remacle, Morsomme, and Finck (2014), and Cohen et al. (2007). The Perceived Stress scale, Hospital Anxiety and Depression scale is used by in Dietrich et al. (2008) to investigate relationships found in stress, anxiety, and depression with those who also present with vocal health concerns (Dietrich et al. 2008). These questionnaires were used in our present research to see if there is a relationship between perceived voice use and voice disorder when compared to voice phonation time tracked by the dosimeter. The questionnaire Personal Report of Confidence as a Speaker is used to help researchers identify a person’s stress while speaking in public (Dietrich et al. 2019). For our research, a self-reflection was created (see Figure S1, online supplementary materials), inspired by the questions found in the Personal Report of Confidence as a Speaker.
School Environment
Student teaching for the participant took place in two different schools throughout the semester. The schedule consisted of six class periods each day. The two schools were approximately 10 miles apart, and the participant only visited both schools on the same day one time; other days were spent entirely at one school location. General music classes were each approximately 50 minutes long, ranging from kindergarten to fifth grade levels (children ages 5–11) with a lunch period and a planning period each day. Teaching took place in average sized music classrooms that had been repurposed for music classes with minimal acoustical treatments.
Procedure
Prior to data collection, the participant was trained on how to use the device and was provided with a daily protocol for data collection. Prior to each day of data collection, the participant was responsible for activating the device and calibrating it for the microphone placement.
4 B. E. NICHOLS ET AL.
After the device was activated and calibrated, the participant would begin the data collection prior to the first class of the day until the teaching day concluded. At the end of each school day, a research assistant met the participant to download, store, and backup all data. The week of data collection took place in an elementary general music setting. Grade levels taught throughout the day and location of each class period were recorded in a daily log by the participant. Additional information regarding special circumstances, such as a fire drill, an increased teaching load, or vocal fatigue of the participant were recorded in the log.
Equipment
Data collection for each day was administered by the participant using a voice dosimeter (Vocal Holter Med, Model VHM1, Torino, Italy) for data collection. The contact microphone recorded the participant’s phonation behaviors throughout the day by measuring the sympa-thetic vibrations of the skin of the neck caused by the vibratory collisions of the vocal folds similar to a device used in previous research (e.g., Manternach 2015). The device itself consists of a collar with a contact microphone that is worn around the neck, contacting the skin above her larynx, as well as lapel microphone attached to the collar. The headset connects to a recorder unit, worn on the waist, which also measures background noise level, temperature, and relative. The recorder unit, headset, and microphone were unobtrusive enough to allow the participant to engage in normal teaching activities throughout the day.
Results
Self-Reported Data
On the Voice Handicap Index (Jacobson et al. 1997), the preservice teacher scored a 22 out of possible 30 points. This score falls in the mild severity category, suggesting a “minimal amount of handicap.” The perceived stress scale (Cohen, Kamarck, and Mermelstein 1983) was returned by the preservice teacher indicating a score of 19; this score range is within the moderate range of 14–26. The final questionnaire used was the hospital anxiety and depression scale (Zigmond and Snaith 1983). The preservice teacher scores were both within the normal range of 0–7; the depression score was 1 and anxiety was 7.
Our participant described herself as a confident speaker, especially when time is provided to prepare beforehand. The participant reported sometimes feeling “nervous” before a speaking event but reports afterward generally feeling confident and relieved. The partici-pant also attempts to have better standing posture for voice projection when speaking in a formal setting, versus the posture they carry in more informal settings. The participant noted that the only time they experience fear or anxiety when speaking in public is when they have to speak to a large group without notice. This fear and anxiety are milder in nature if the topic is familiar.
In contrast, the participant describes themselves as a much less confident singer than speaker. Singing tends to lead to high levels of anxiety before performances. They note that this anxiety can affect their breath, projection, and voice placement. They also found that while their thoughts are clear while practicing, they are not clear when singing for performance. The participant also finds that their confidence is low before and after performances. They combat this by working toward high levels of confidence during pre-performances. The participant
VOICE AND SPEECH REVIEW 5
also works toward a “connected breath” and toward feeling “confident and grounded.” When the participant is able to do this, they find that their voice almost doubles in projection and volume. The participant also notes that this anxiety is not found while singing with a choir or demonstrating an excerpt of a particular piece for the choir.
Device Measurements
The research design included an adult female double-majoring in music and communica-tions who was student teaching in elementary general music. The data described below indicate the voice use of a single case which may or may not be similar to other student teachers in similar or different school types. General variables of interest included grade level taught and class period; environmental variables included time of day and background noise level; and personal characteristics were recorded such as phonation percentage time, funda-mental frequency, and volume. This report represents the first use of this commercially available contact microphone and recording apparatus, and we believe these data to accu-rately reflect the variables represented herein based on comparison of the device’s own time intervals to the teacher’s schedule and end-of-day reports of classroom activities.
The recording device, including a neck collar contact microphone and a recording device worn at the waist, and the participant operated and worn it successfully across five con-secutive teaching days from Monday to Friday. The battery time allowed for continuous recording during the regular school day; no measurements were taken before or after the regular school day, which began and ended at typical schooling times at each school site. We successfully recorded the participant for 1 week in an elementary school placement in the middle third of the semester (Week 6 of 15). We made a similar attempt in a second week but were limited to 3 days due to a field trip 1 day and an interview travel day on the second, and these data are not reported due to the unusual schedule. Measurements were produced and recorded by the device every 75 milliseconds (ms), and the following analyses were con-ducted on mean or median values indicated by the device at these intervals. The device recorded 934 data points across 5 consecutive teaching days.
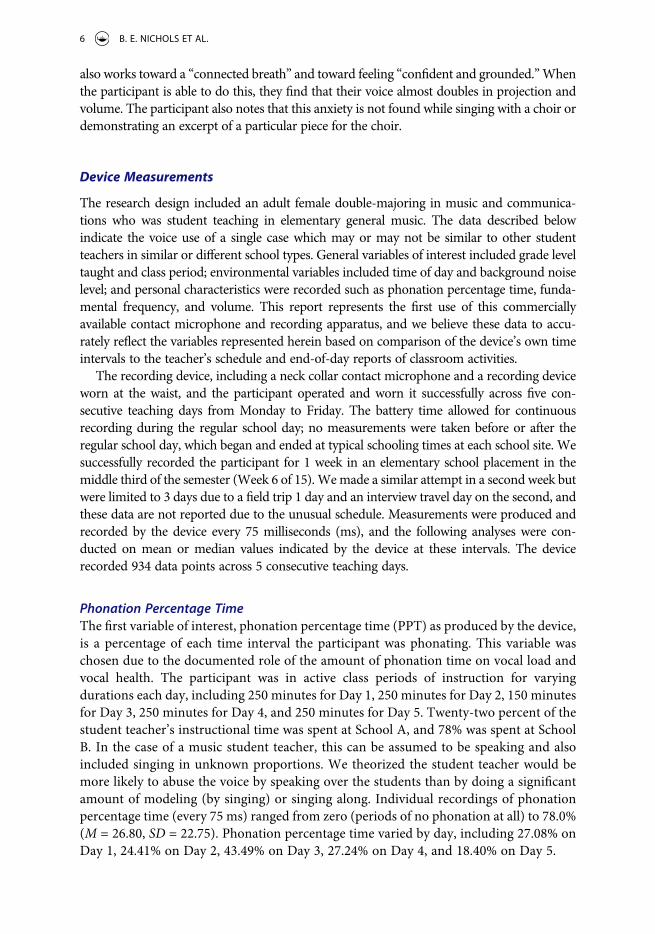
Phonation Percentage TimeThe first variable of interest, phonation percentage time (PPT) as produced by the device, is a percentage of each time interval the participant was phonating. This variable was chosen due to the documented role of the amount of phonation time on vocal load and vocal health. The participant was in active class periods of instruction for varying durations each day, including 250 minutes for Day 1, 250 minutes for Day 2, 150 minutes for Day 3, 250 minutes for Day 4, and 250 minutes for Day 5. Twenty-two percent of the student teacher’s instructional time was spent at School A, and 78% was spent at School B. In the case of a music student teacher, this can be assumed to be speaking and also included singing in unknown proportions. We theorized the student teacher would be more likely to abuse the voice by speaking over the students than by doing a significant amount of modeling (by singing) or singing along. Individual recordings of phonation percentage time (every 75 ms) ranged from zero (periods of no phonation at all) to 78.0% (M = 26.80, SD = 22.75). Phonation percentage time varied by day, including 27.08% on Day 1, 24.41% on Day 2, 43.49% on Day 3, 27.24% on Day 4, and 18.40% on Day 5.
6 B. E. NICHOLS ET AL.

Phonation Volume
Referred to here as Sound Pressure Level5 (SPL) measured in decibels (dB), the device calculated a mean dB data point and a median data point every 75 ms. Phonation volume was chosen as a variable of interest to measure the amplitude of voice use to better understand its role on vocal load and vocal health. We examined these values in all instructional time, excluding non-teaching events such as passing time, lunch period, and planning periods. The mean SPL recordings ranged 44 to 83.5 (M = 74.86, SD = 5.86), and the median values ranged 44 to 84.5 (M = 75.40, SD = 6.21). Phonation volume was significantly higher at School A (M = 78.99, SD = 5.31) than School B (M = 74.38, SD = 6.07), p < .001, ηp
2 = .095.Period-by-period phonation volume across the week are indicated by the following
means for Periods 1 to 6, respectively: 73.08 (SD = 6.41), 74.62 (6.09), 74.38 (6.14), 75.58 (6.97), 76.12 (6.22), and 77.61 (6.22). As indicated in a one-way ANOVA,6 phonation volume was significantly different by period (p < .001, ηp
2 = .050), and Bonferroni- adjusted comparisons showed each of Periods 1–3 were each significantly lower from Period 6 in the school day (p < .05). We compared this data to the participant’s self-report of daily activities; the participant reported teaching full time during the instructional time on Day 3 and only part of the instructional time for days 1, 2, 4, and 5. We chose to take the mean of the shared-teaching days phonation levels and compared it to the Day 3 full- time teaching levels in one-way ANOVA. Phonation volume while serving as the “lead” teacher (Day 3) is significantly higher than the Days 1, 2, 4, 5, p < .001, ηp
2 = .183 (See Figure 1). For a plot of phonation volume by day, see Figure 2.
Background Noise LevelBackground Noise Level7 (BNL) was selected as a variable of interest to gain a greater understanding of the acoustical environment of the participant. These environmental conditions may presumably have an effect on the vocal behaviors of the participant. The
Figure 1. Comparison of Phonation Volume observations for time spent as main teacher versus assisting teacher (Brackets represent 95% CI).
VOICE AND SPEECH REVIEW 7

BNL mean, also measured in dB, ranged 49.2 to 84.5 (M = 68.19, SD = 6.86), again for non-teaching events only. We calculated a Pearson correlation to assess the relationship between the participant’s SPL means and the BNL means, r = .47, p < .001, which we interpret as a moderate positive correlation (See Figure S2, online supplementary mate-rials). BNL was significantly higher at School A (M = 70.21, SD = 6.15) than School B (M = 67.61, SD = 6.95), p < .001, ηp
2 = .025.
Fundamental FrequencyThis variable of interest was chosen to gain an understanding of the vocal behaviors of the participant and the role of musical pitch on vocal load and vocal health. The fundamental frequency (F0) median was distributed variably between the two school sites and the overall range was 84 to 500 (M = 257.76, SD = 67.59). It is not possible to separate speaking from singing time, and this data represents both modes of phonation (non-teaching was excluded from all analyses). We interpret a small, negatively corre-lated relationship between F0 median values and participant Background Noise Level (r = −.14, p < .001), and a moderately strong, negatively correlated relationship between F0 medians and Sound Pressure Level medians (r = −.53, p < .001). F0 was significantly lower at School A (M = 249.02, SD = 47.63) than at School B (M = 260.25, SD = 71.11, p < .05, ηp
2 = .005). Again, we chose to take the mean of the shared-teaching days phonation levels and compared it to the Day 3 full-time teaching levels in one-way ANOVA. The mean F0 level was not significantly different on the main teaching day (Day 3) compared to the other days, p > .05 (See Figure 3).
Figure 2. Dosage across each day (with trendlines).
8 B. E. NICHOLS ET AL.

Discussion
The purpose of this study was to explore the voice use characteristics of a student teacher in an elementary music setting. The participant was a traditionally aged female college student completing a final semester field experience with one cooperating teacher in two elementary school buildings for children aged 5–11. During 1 week of measurement, the student teacher reported vocal fatigue, which reinforces the primacy of vocal health among student teachers, and has previously been reported as a concern among in-service teachers. Thus, student teachers—who are defined as pre-service teachers—may be more like in-service teachers than college students in terms of voice use and abuse, and further study of this population may be warranted.
The student teacher demonstrated higher levels of phonation volume on a day serving as the main teacher. Although there was less instructional time on this day (150 minutes) compared to the other days (250), these data may suggest that by the mid-point of the semester the participant was using high or possibly higher-than-necessary phonation volume for instruction. A self-report of vocal fatigue the following day reinforces this suggestion, and future research is warranted to investigate the development of vocal load of student teachers. These findings suggest that the participant’s experience as the primary instructor had an effect on both vocal health and phonation volume.
Participant F0 and ambient noise levels varied between the two school buildings, a finding we rely on to suggest the limits of this research: this student teacher taught in a specific setting of general music at the elementary level in music-specific classrooms that varied in terms of size and presumed acoustical properties, instruments available, class size, and individual variability among unique classes of students. The teacher’s voice use would be expected to change based on these variables; thus, the data reported here are not generalizable to the
Figure 3. Comparison of F0 observations of time spent as Main Teacher (Day 3) versus Assisting Teacher (Days 1, 2, 4, 5; Brackets represent 95% CI).
VOICE AND SPEECH REVIEW 9
greater student teacher population. Further, the data were collected at a mid-point in the semester and do not represent the continuum of teaching responsibility across a typical student teaching semester. Presumably, a student teacher would do little teaching at the beginning of the term with increasing teaching load across the semester.
The purpose of this study was to explore phonation during instructional time only which was documented to vary according to the day, location, and teaching load. This student teacher was observed singing along with the classes when not teaching; thus, these results may be applicable to student teacher situations where a student teacher’s voice use is documented while teaching or singing along when the cooperating teacher is providing instruction. The participant phonated 26.80% of class time, which would be expected to vary widely among student teachers depending on the expectations of the cooperating teacher. This research varies from designs in previous research where participants’ voice use is monitored during all waking hours.
Implications
After 1 day of full-time teaching responsibility, results indicated the participant volume was high relative to the partial-time teaching days, and the participant reported significant vocal fatigue, congruent with previous reports of increased vocal load among student teachers (Brunkan 2018). After the full-time teaching day, the student teacher returned to “normal” part-time teaching responsibility but still reported major vocal fatigue the following day, which could be moderated by stress levels (Dietrich et al. 2008). Our date indicated less phonation time in the student teacher, 28.12% on average, than one previous report of vocal music teachers, which was 60.34 to 72.58% (Daugherty, Manternach, and Price 2011). A student teacher sharing instructional time would be expected to indicate less phonation time, though the phonation percentage was higher on the day of serving as the main teacher (43.49%). The participated indicated awareness of her voice use, which may be a result of participating in the research by wearing a dosimeter and also self-reports of vocal health. Future research could explore vocal load at the beginning or end portions of the semester as well as how voice use varies during periods of relative vocal health. Lastly, this participant sometimes was tasked with participating in class alongside students and may have shown higher incidence of phonation than a student teacher who observes but does not participate while the cooperating teacher is providing instruction.
Conclusion
This study represents a five-day analysis of a single case with a new device suitable for voice dosimetry in classrooms. Use of this device for the first time was deemed as acceptable with adequate battery capacity for a normal school day. Voice use on a day the student teacher served as the main teacher was higher than the other days, but notable voice use on the other days suggests the voice use of student teachers during non- teaching times may be important for future research. Nevertheless, the student teacher reported vocal fatigue after the day serving as the main teacher, and more work must be done to determine the effect of vocal fatigue as well as vocal fatigue interventions on student teachers.
10 B. E. NICHOLS ET AL.

Notes
1. Vocal Load is stress inflicted on the speech organs when phonation (i.e., speaking or singing) over a period of time.
2. Voice Dosimeter is a sound level monitor intended to measure the sound production and noise exposure of a person over a period of time.
3. Phonation is the process by which the vocal folds produce sound through vibration within the larynx.
4. Fundamental Frequency (F0) is the lowest frequency of a periodic waveform, which translates to the pitch that is perceived in music as the lowest partial present.
5. Sound Pressure Level (SPL) is the acoustical pressure deviation from the local the ambient atmospheric pressure caused by a sound wave. Within the context of this study, SPL can be most easily interpreted as volume.
6. One-Way ANOVA is an analysis of variance between one continues variable and three or more categorical variables.
7. Background Noise Level (BNL) is the sound pressure level, measured in decibels (dB), of ambient sounds in a given location. Voice Dosimetry in an Elementary Music Student Teacher
Acknowledgments
This project was made possible in part by a Faculty Research Grant from the Penn State College of Arts & Architecture.
Disclosure Statement
No potential conflict of interest was reported by the authors.
Notes on contributors
Bryan E. Nichols, PhD, is a teacher and conductor at Pennsylvania State University, where he leads the University Choir and teaches conducting and choral methods. He is a life member of the American Choral Directors Association (ACDA) and serves in leadership positions in the National Association for Music Education (NAfME) and ACDA.
Kay Piña is currently a PhD student at Pennsylvania State University. Before moving to State College, Kay was teaching general music to fifth and sixth graders, and sixth grade choir at Laura Ingalls Wilder Intermediate in Schertz- Cibolo-Universal City ISD, a school district outside of San Antonio, TX. Kay also spent time teaching elementary music grades K-6 at David Crockett Elementary, now David Crockett Academy, in San Antonio ISD. Kay completed her Bachelor of Arts in music at Texas State University in San Marcos and received her Master of Music degree while studying at the University of Texas at San Antonio.
VOICE AND SPEECH REVIEW 11
Scott-Lee Atchison is currently a PhD candidate in music education at Pennsylvania State University. Before his enrollment at Penn State, Mr. Atchison served as the Director of Athletic Bands at the University of Kentucky and Associate Director of Bands at Texas A&M University-Commerce, where he directed the athletic bands, conducted the symphonic band and concert band, and taught classes in music technology, music literature, and marching band techni-ques. Mr. Atchison is a Yamaha Performing Artist and is a contributing author for the book series A Composer’s Insight: Thoughts, Analysis and Commentary on Contemporary Masterpieces for Wind Band (Volume IV).
References
Brunkan, M. C. 2018. “Preservice Music Teacher Voice Use, Vocal Health, and Voice Function before and during Student Teaching.” Journal of Music Teacher Education 27 (3): 80–93. doi:10.1177/1057083717741216.
Cohen, Seth M., Barbara H. Jacobson, C. Gaelyn Garrett, J. Pieter Noordzij, Michael G. Stewart, Albert Attia, Robert H. Ossoff, and Thomas F. Cleveland. 2007. “Creation and Validation of the Singing Voice Handicap Index.” Annals of Otology, Rhinology & Laryngology 116 (6): 402–406. doi:10.1177/000348940711600602.
Cohen, Sheldon, Tom Kamarck, and Robin Mermelstein. 1983. “A Global Measure of Perceived Stress.” Journal of Health and Social Behavior 24 (4): 385–396. doi:10.2307/2136404.
Cooper, Morton. 1970. “Vocal Suicide in Teachers.” Peabody Journal of Education 47 (6): 334–337. doi:10.1080/01619567009537748.
Daugherty, James F., Jeremy N. Manternach, and Kathy K. Price. 2011. “Student Voice Use and Vocal Health during an all-State Chorus Event.” Journal of Research in Music Education 58 (4): 346–367. doi:10.1177/0022429410387145.
Dietrich, Maria, Katherine Verdolini Abbott, Jackie Gartner-Schmidt, and Clark A. Rosen. 2008. “The Frequency of Perceived Stress, Anxiety, and Depression in Patients with Common Pathologies Affecting Voice.” Journal of Voice 22 (4): 472–488. doi:10.1016/j.jvoice.2006.08.007.
Dietrich, Maria, Richard D. Andreatta, Yang Jiang, Ashwini Joshi, and Joseph C. Stemple. 2012. “Preliminary Findings on the Relation between the Personality Trait of Stress Reaction and the Central Neural Control of Human Vocalization.” International Journal of Speech Language Pathology 14 (4): 377–389. doi:10.3109/17549507.2012.688865.
Dietrich, Maria, Richard D. Andreatta, Yang Jiang, and Joseph C. Stemple. 2019. “Limbic and Cortical Control of Phonation for Speech in Response to a Public Speech Preparation Stressor.” Brain Imaging and Behavior 14 (5): 1–18. doi:10.1007/s11682-019-00102-x.
Ellie Selevan, Esther Schorr, Rachel Pekarsky, Sheila Mitta, Sara Diamont, Elisheva Stept, and Gisele Oliveira. 2016. “Teachers' Perception of Vocal Quality Compared With Professional Perception.” Journal of Voice 30 (6): 763.e17-763.e21. doi:10.1016/j. jvoice.2015.10.008.
Jacobson, B., A. Johnson, C. Grywalski, A. Silbergleit, G. Jacobson, M. Benninger, and C. Newman. 1997. “The Voice Handicap Index (VHI).” American Journal of Speech-Language Pathology 6 (3): 66–70. doi:10.1044/1058-0360.0603.66.
López, Juana Muñoz, Andrés Catena, Alicia Montes, and Maria Elena Castillo. 2017. “Effectiveness of A Short Voice Training Program for Teachers: A Preliminary Study.” Journal of Voice 31 (6): 697–706. doi:10.1016/j.jvoice.2017.01.017.
Manternach, Jeremy N. 2015. “Voice Use and Self-Reported Voice Health of Preservice Music Educators.” Journal of Music Teacher Education 24 (3): 53–66. doi:10.1177/1057083714525176.
Mills, Albert J., Gabrielle Durepos, and Elden Wiebe. 2010. Encyclopedia of Case Study Research. Los Angeles: SAGE Publications.
Morrow, Sharon L., and Nadine P. Connor. 2011. “Comparison of Voice-use Profiles between Elementary Classroom and Music Teachers.” Journal of Voice 25 (3): 367–372. doi:10.1016/j. jvoice.2009.11.006.
12 B. E. NICHOLS ET AL.
Nanjundeswaran, Chayadevie, Miriam van Mersbergen, and Kelli Morgan. 2019. “Restructuring the Vocal Fatigue Index Using Mokken Scaling: Insights into the Complex Nature of Vocal Fatigue.” Journal of Voice 33 (1): 110–114. doi:10.1016/j.jvoice.2017.09.008.
Remacle, Angélique, Dominique Morsomme, and Camille Finck. 2014. “Comparison of Vocal Loading Parameters in Kindergarten and Elementary School Teachers.” Journal of Speech, Language, and Hearing Research 57 (2): 406–415. doi:10.1044/2013_JSLHR-S-12-0351.
Schiller, Isabel S., Dominique Morsomme, and Angélique Remacle. 2018. “Voice Use among Music Theory Teachers: A Voice Dosimetry and Self-Assessment Study.” Journal of Voice 32 (5): 578–584. doi:10.1016/j.jvoice.2017.06.020.
Simberg, Susanna. 2000. “Prevalence of Voice Disorders among Future Teachers.” Journal of Voice 14 (2): 231–235. doi:10.1016/S0892-1997(00)80030-2.
Simberg, Susanna. 2004. “A Comparison of the Prevalence of Vocal Symptoms among Teacher Students and Other University Students.” Journal of Voice 18 (3): 363–368. doi:10.1016/j. jvoice.2003.12.005.
Titze, Ingo R. 2007. “Vocal Demands on Teachers.” Journal of Singing 64 (1): 67.Titze, Ingo R., Eric J. Hunter, and Jan G. Švec. 2007. “Voicing and Silence Periods in Daily and
Weekly Vocalizations of Teachers.” The Journal of the Acoustical Society of America 121 (1): 469–478. doi:10.1121/1.2390676.
Titze, Ingo R., Julie Lemke, and Doug Montequin. 1997. “Populations in the U.S. Workforce Who Rely on Voice as A Primary Tool of Trade: A Preliminary Report.” Journal of Voice 11 (3): 254–259. doi:10.1016/s0892-1997(97)80002-1.
Zigmond, A., and R. Snaith. 1983. “The Hospital Anxiety and Depression Scale.” Acta Psychiatrica Scandinavica 67 (6): 361–370. doi:10.1111/j.1600-0447.1983.tb09716.x.
VOICE AND SPEECH REVIEW 13