Embed Size (px)
Citation preview

Q3 Financial Results - 31 December 20111
Vodafone Qatar Q.S.CFinancial Results
Press Presentation
For the 9 months ended 31 December 2011
19 January 2012
Q3 Financial Results - 31 December 20112
2
Disclaimer
• The following presentation is made only to, and is directed only at, persons to whom such a presentation may lawfully be communicated (“relevant persons”). Any person who is not a relevant person should not act or rely on this presentation or any of its contents.
• This presentation contains forward-looking statements that are subject to risks and uncertainties, including statements about Vodafone Qatar’s beliefs and expectations.
• These forward-looking statements are based on assumptions that Vodafone Qatar has made in light of its experience in the industry in which it operates, as well as its perceptions of historical trends, current conditions, expected future developments and other factors which Vodafone Qatar believes are appropriate under the circumstances. Prospective investors should understand that these statements are not guarantees of future performance or results.
• Due to these factors, Vodafone Qatar cautions that prospective investors should not place undue reliance on any forward-looking statements. Further, any forward-looking statement speaks only as of the date on which it is made. New risks and uncertainties arise from time-to-time, and it is impossible to predict these events or how they may affect Vodafone Qatar.
• Vodafone and the Vodafone logo are trademarks of the Vodafone Group.
Q3 Financial Results - 31 December 20113
3
Agenda
• Key highlights
• Q3 FY12 financial review
• Commercial and strategic progress
• Q&A

Q3 Financial Results - 31 December 20114
For the 9 Months ended 31 December 2011Key Highlights
797,000Mobile Customers12% growth
QR 906mTotal Revenue39% growth
QR 102mEBITDA11% EBITDA margin
Distributable Profits63% improvement
QR (57)m

Q3 Financial Results - 31 December 20115
October November
Stop the clock 3/30
BlackBerry on Red
New mobile internet rate
MI Rack rate@55
Double Top-up offer
BlackBerry on Red
5
Main Activities for the Quarter
December
Stop the clock 3/30
National Day Activities iPhone 4S Launch
Al SaddSponsorship
SMS campaign
only
Q3 Financial Results - 31 December 20116
Q3 FY12 Financial Review
Steve Walters
Follow this code to view our Investor Relations web page

Q3 Financial Results - 31 December 20117
Mobile Customer Growth
Year-on-Year Growth in Mobile Customers and Mobile Customer Market Share
354
797
711
25.3%
14.3%
Dec-09 Dec-10 Dec-11
Total Mobile Customers Mobile Customer Market Share
• 12% growth in Customer Numbers year-on-year
* Customer numbers reflect an adjustment of 46,000 to remove pre-activated SIM cards from the base following a technical systems upgrade. On the same basis, September 2011 customer base would have been 782,000
*
Q3 Financial Results - 31 December 20118
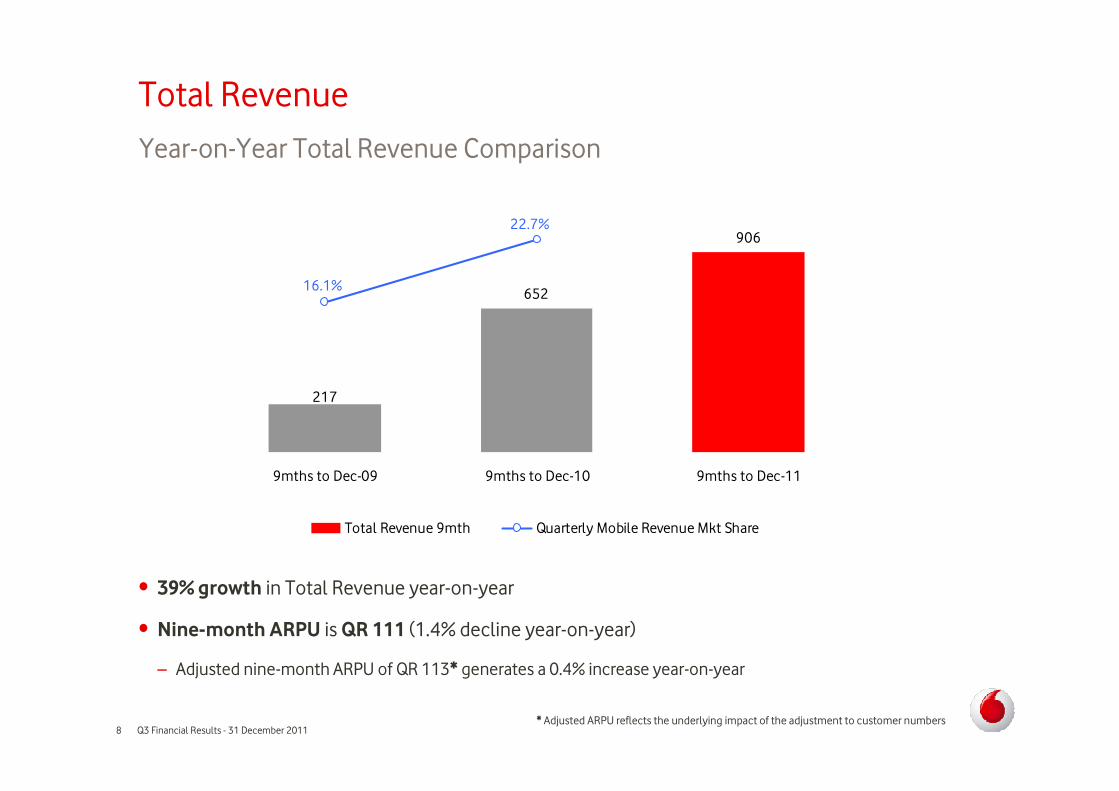
Total Revenue
Year-on-Year Total Revenue Comparison
906
217
652
22.7%
16.1%
9mths to Dec-09 9mths to Dec-10 9mths to Dec-11
Total Revenue 9mth Quarterly Mobile Revenue Mkt Share
• 39% growth in Total Revenue year-on-year
• Nine-month ARPU is QR 111 (1.4% decline year-on-year)
– Adjusted nine-month ARPU of QR 113* generates a 0.4% increase year-on-year
* Adjusted ARPU reflects the underlying impact of the adjustment to customer numbers
Q3 Financial Results - 31 December 20119
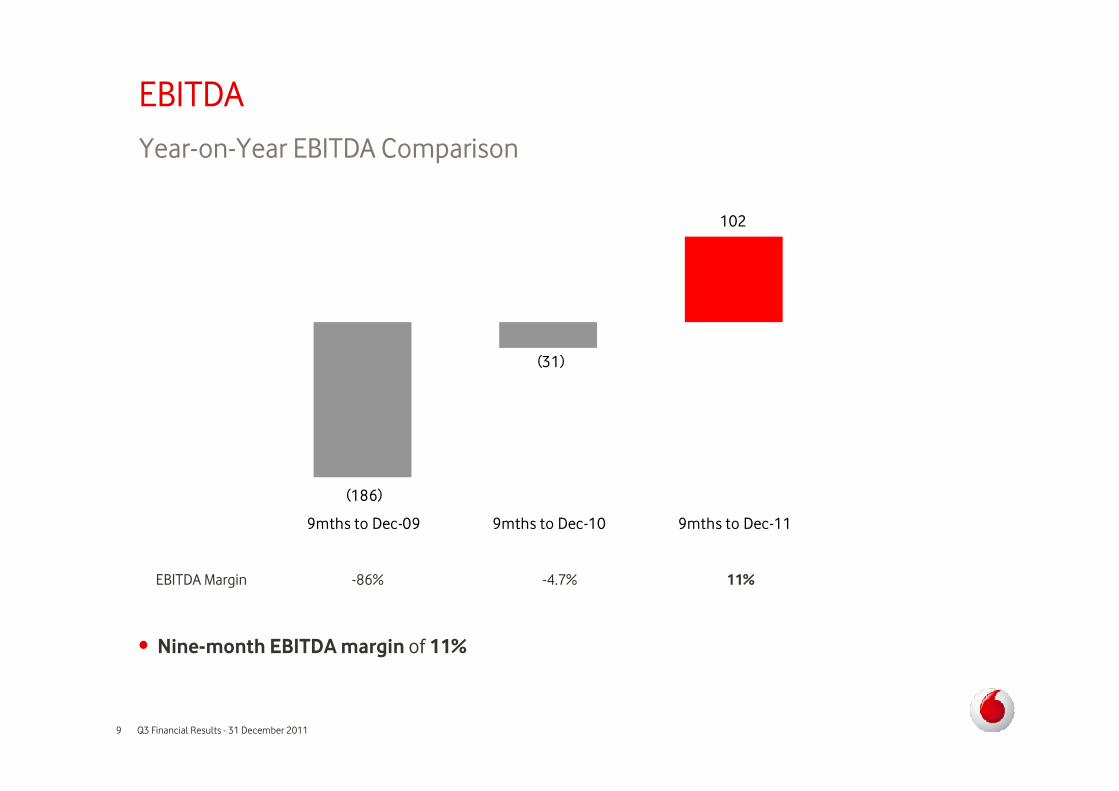
EBITDA
Year-on-Year EBITDA Comparison
• Nine-month EBITDA margin of 11%
102
(31)
(186)
9mths to Dec-09 9mths to Dec-10 9mths to Dec-11
EBITDA Margin -86% -4.7% 11%
Q3 Financial Results - 31 December 201110
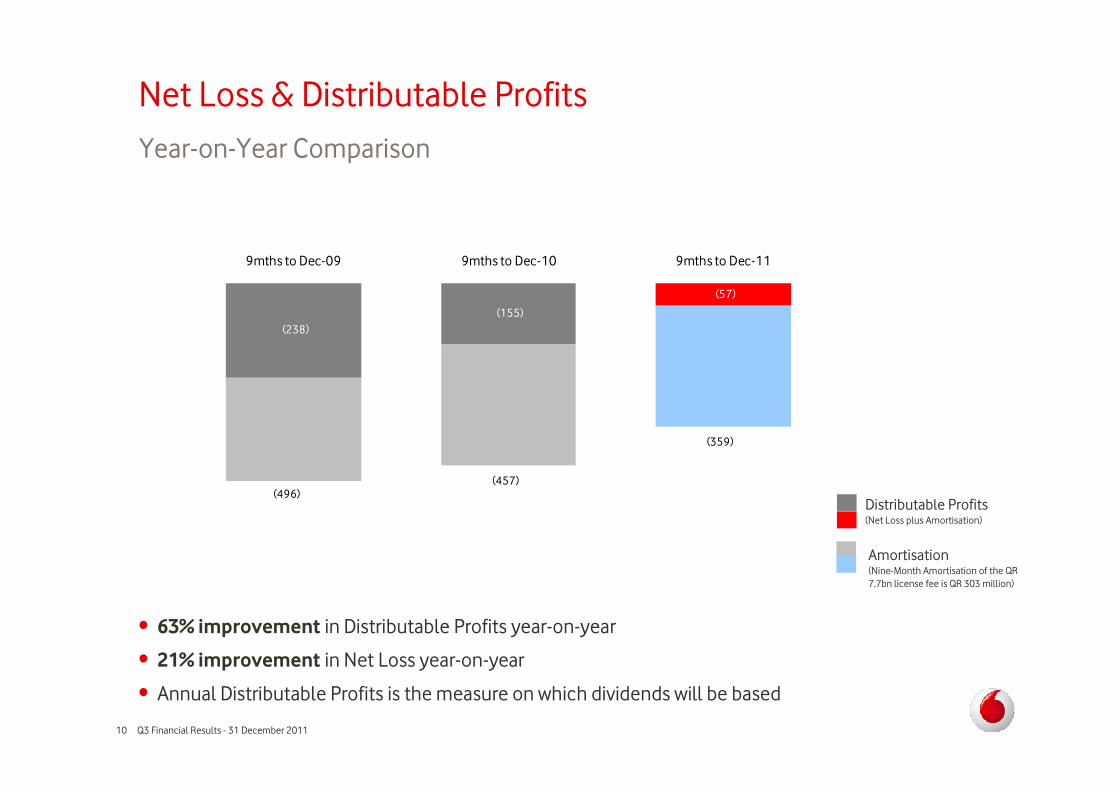
(238)
(155)
(57)
(496)(457)
(359)
9mths to Dec-09 9mths to Dec-10 9mths to Dec-11
Net Loss & Distributable Profits
Year-on-Year Comparison
• 63% improvement in Distributable Profits year-on-year
• 21% improvement in Net Loss year-on-year
• Annual Distributable Profits is the measure on which dividends will be based
Amortisation (Nine-Month Amortisation of the QR 7.7bn license fee is QR 303 million)
Distributable Profits (Net Loss plus Amortisation)

Q3 Financial Results - 31 December 201111
138
60
48
389
524
475
253
143
FY 09 FY 10 FY 11 9mths to Dec-
11
Q4 FY12
Management forecast for Q4 FY12
Fixed Line
QR 396m
Capitalised Fixed Asset Additions
• Long-term total capital intensity expected to stabilise at 10% of revenue from FY15 onwards.
Mobile
Capital Intensity n/a 145% 51% 28% 50%
32%
Q3 Financial Results - 31 December 201112
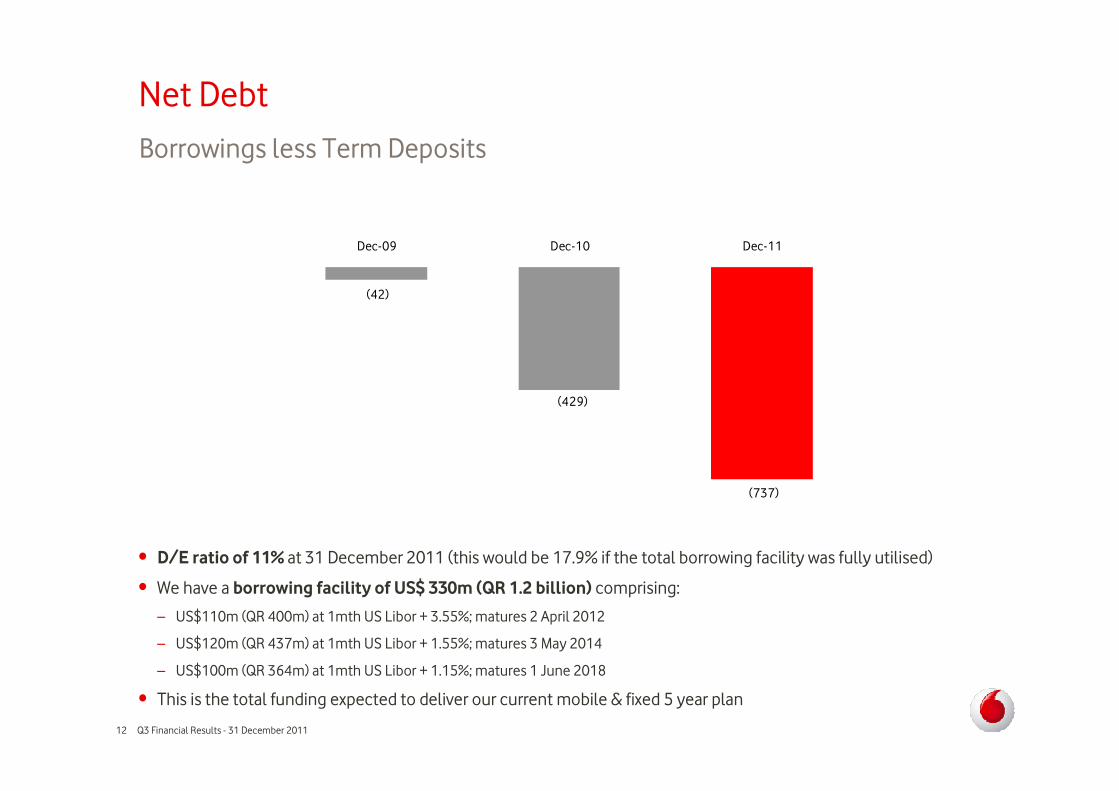
Net Debt
Borrowings less Term Deposits
(737)
(429)
(42)
Dec-09 Dec-10 Dec-11
• D/E ratio of 11% at 31 December 2011 (this would be 17.9% if the total borrowing facility was fully utilised)
• We have a borrowing facility of US$ 330m (QR 1.2 billion) comprising:
– US$110m (QR 400m) at 1mth US Libor + 3.55%; matures 2 April 2012
– US$120m (QR 437m) at 1mth US Libor + 1.55%; matures 3 May 2014
– US$100m (QR 364m) at 1mth US Libor + 1.15%; matures 1 June 2018
• This is the total funding expected to deliver our current mobile & fixed 5 year plan
Q3 Financial Results - 31 December 201113
Commercial and Strategic Progress
Richard Daly
Q3 Financial Results - 31 December 201114
Short Term Business Priorities
• Full network coverage and quality improvements
• Postpaid launch
• Roaming customer experience
• Business segment launch
• Fixed line broadband in partnership with QNBN
• Qatarisation

Q3 Financial Results - 31 December 201115
Network Improvements
• 497 outdoor & 123 indoor cell sites
• Coverage:
– 100% 2G and 99% 3G population coverage
• Drive Test
– Independent test by P3 Communications
– 4,500 KMs covered / 3,040 calls made
– Call set-up success rate: 98.9%
– Dropped call rate: 0.2% : data download 2.38 Mbps
• Next Steps
– 50 additional cell sites by 31 March
– Improved network stability and data speeds
Q3 Financial Results - 31 December 201116
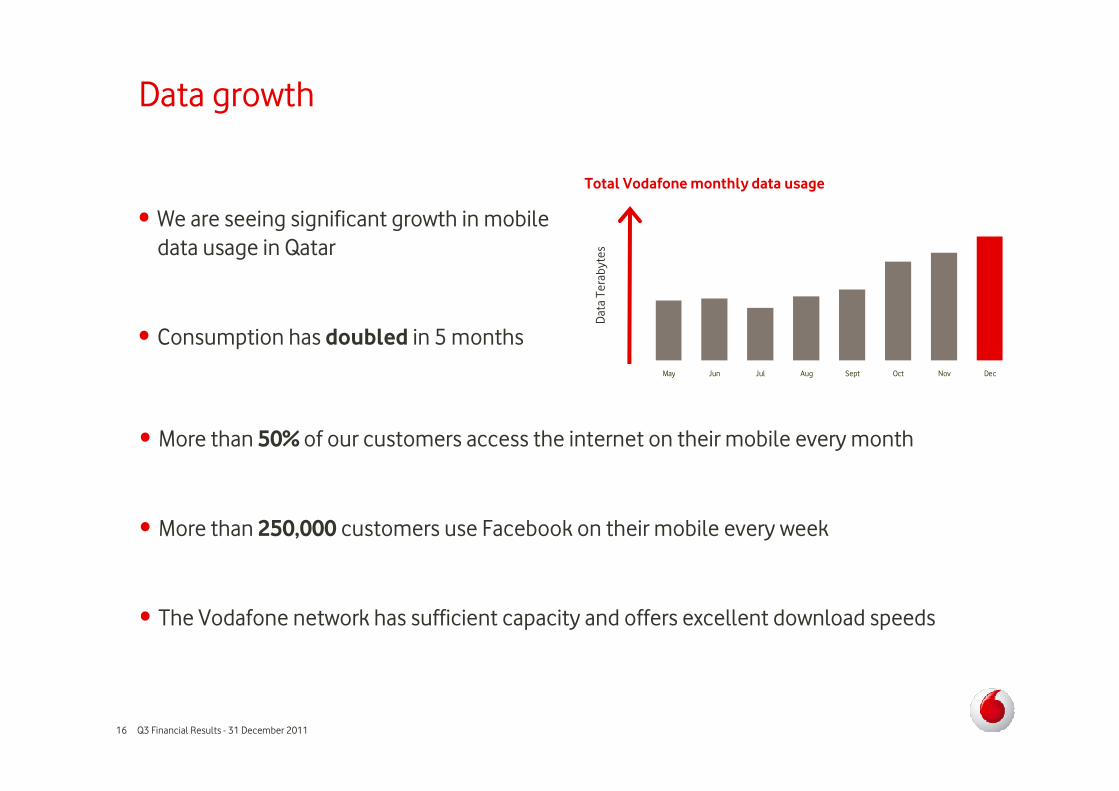
Data growth
• We are seeing significant growth in mobile data usage in Qatar
• Consumption has doubled in 5 months
May Jun Jul Aug Sept Oct Nov Dec
Dat
a Te
raby
tes
Total Vodafone monthly data usage
• More than 50% of our customers access the internet on their mobile every month
• More than 250,000 customers use Facebook on their mobile every week
• The Vodafone network has sufficient capacity and offers excellent download speeds
Q3 Financial Results - 31 December 201117
Fixed Line Services
• Qatar’s Fixed Line market is worth QR 1.9 billion annually
• Vodafone core network fixed/mobile convergence is now complete
• This week we have completed the fibre connection between our two data centres at Meeza and QDC
• Next step is to connect to our International Landing Station (ILS) and provide international capacity in partnership with GBI
• By the summer our fibre ring backbone will be complete
• We currently offer fixed line services at The Pearl
• This will be followed in 2012 by Barwa City, West Bay CBD and then a nationwide roll-out as QNBN delivers last mile connectivity
• Project is on track and within our licence obligations

Q3 Financial Results - 31 December 201118
Opening of Qatar Call Centre in Doha
• 14 Qatari nationals recruited in our Doha call centre
• Will handle queries from local Qatari customers following full opening
• Full opening in February
19
Questions
20
Appendices
Q3 Financial Results - 31 December 201121
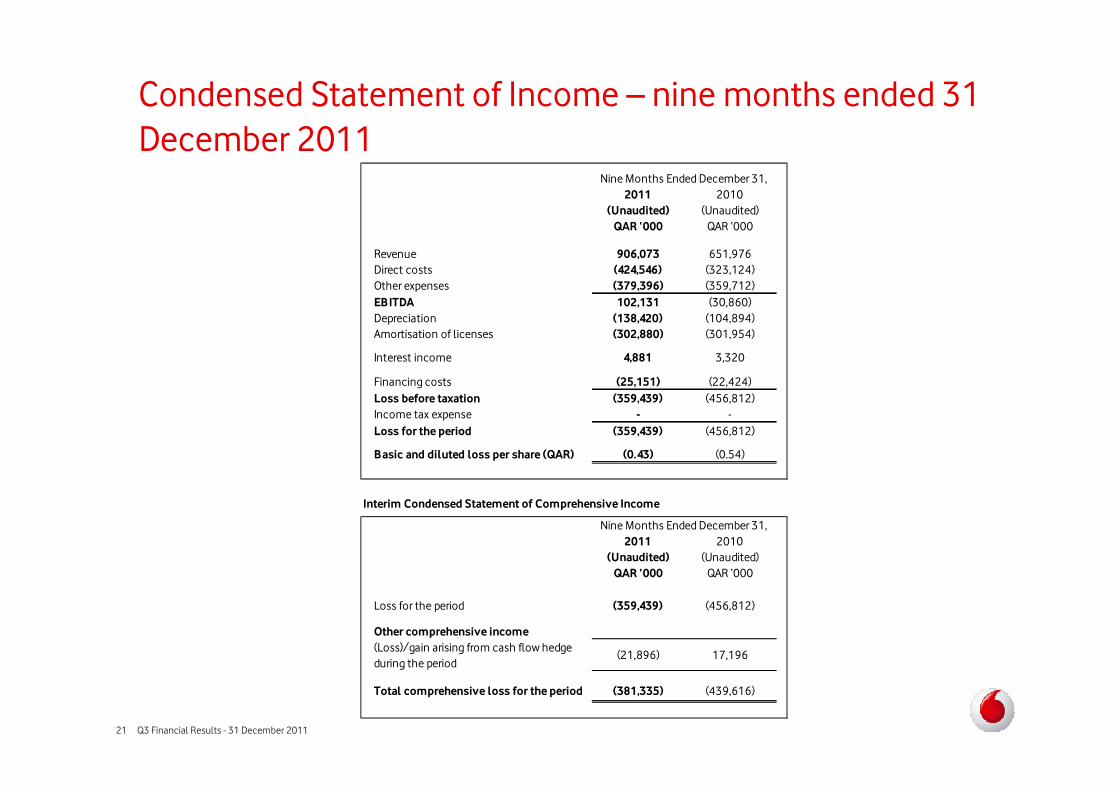
Condensed Statement of Income – nine months ended 31 December 2011
2011 2010(Unaudited) (Unaudited)
QAR ‘000 QAR ‘000
Revenue 906,073 651,976Direct costs (424,546) (323,124)
Other expenses (379,396) (359,712)
EBITDA 102,131 (30,860)
Depreciation (138,420) (104,894)Amortisation of licenses (302,880) (301,954)
Interest income 4,881 3,320
Financing costs (25,151) (22,424)
Loss before taxation (359,439) (456,812)
Income tax expense - -
Loss for the period (359,439) (456,812)
Basic and diluted loss per share (QAR) (0.43) (0.54)
Interim Condensed Statement of Comprehensive Income
2011 2010(Unaudited) (Unaudited)
QAR ‘000 QAR ‘000
Loss for the period (359,439) (456,812)
Other comprehensive income(Loss)/gain arising from cash flow hedge during the period
(21,896) 17,196
Total comprehensive loss for the period (381,335) (439,616)
Nine Months Ended December 31,
Nine Months Ended December 31,
Q3 Financial Results - 31 December 201122
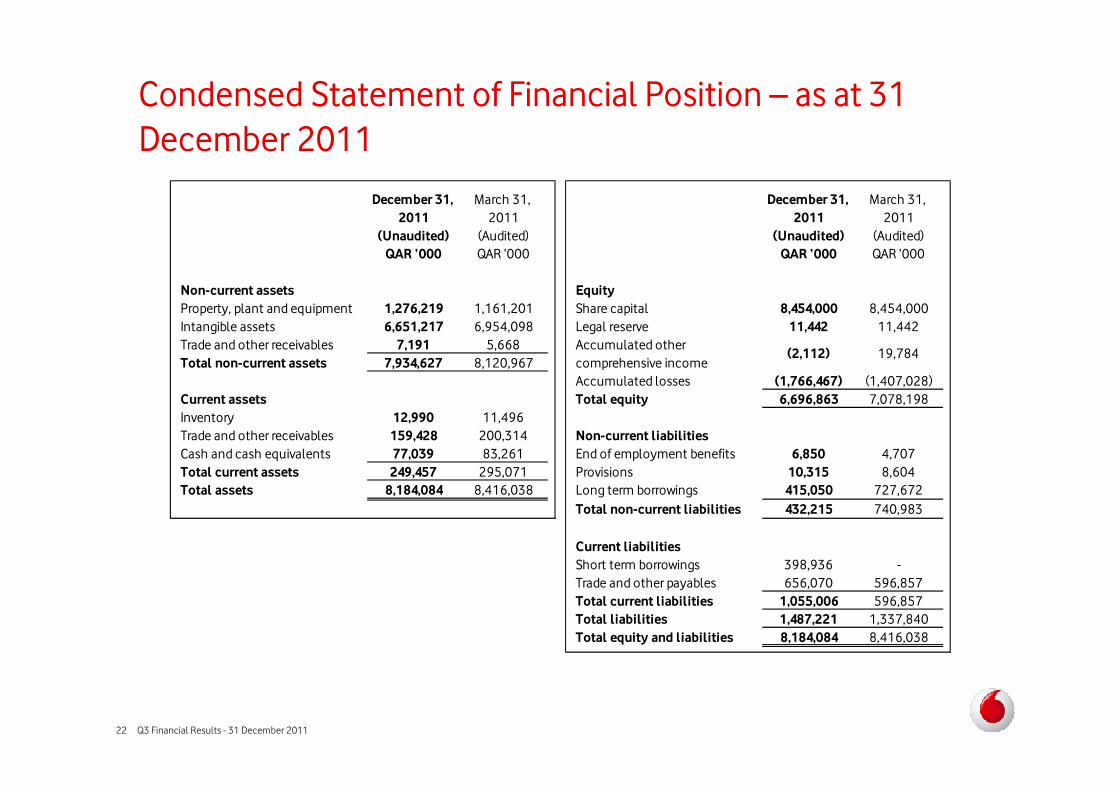
Condensed Statement of Financial Position – as at 31 December 2011
December 31, 2011
March 31,
2011
December 31, 2011
March 31,
2011
(Unaudited) (Audited) (Unaudited) (Audited)QAR ‘000 QAR ‘000 QAR ‘000 QAR ‘000
Non-current assets EquityProperty, plant and equipment 1,276,219 1,161,201 Share capital 8,454,000 8,454,000
Intangible assets 6,651,217 6,954,098 Legal reserve 11,442 11,442
Trade and other receivables 7,191 5,668
Total non-current assets 7,934,627 8,120,967Accumulated losses (1,766,467) (1,407,028)
Current assets Total equity 6,696,863 7,078,198
Inventory 12,990 11,496
Trade and other receivables 159,428 200,314 Non-current liabilitiesCash and cash equivalents 77,039 83,261 End of employment benefits 6,850 4,707
Total current assets 249,457 295,071 Provisions 10,315 8,604Total assets 8,184,084 8,416,038 Long term borrowings 415,050 727,672
Total non-current liabilities 432,215 740,983
Current liabilitiesShort term borrowings 398,936 -
Trade and other payables 656,070 596,857
Total current liabilities 1,055,006 596,857Total liabilities 1,487,221 1,337,840
Total equity and liabilities 8,184,084 8,416,038
Accumulated other
comprehensive income(2,112) 19,784
Q3 Financial Results - 31 December 201123
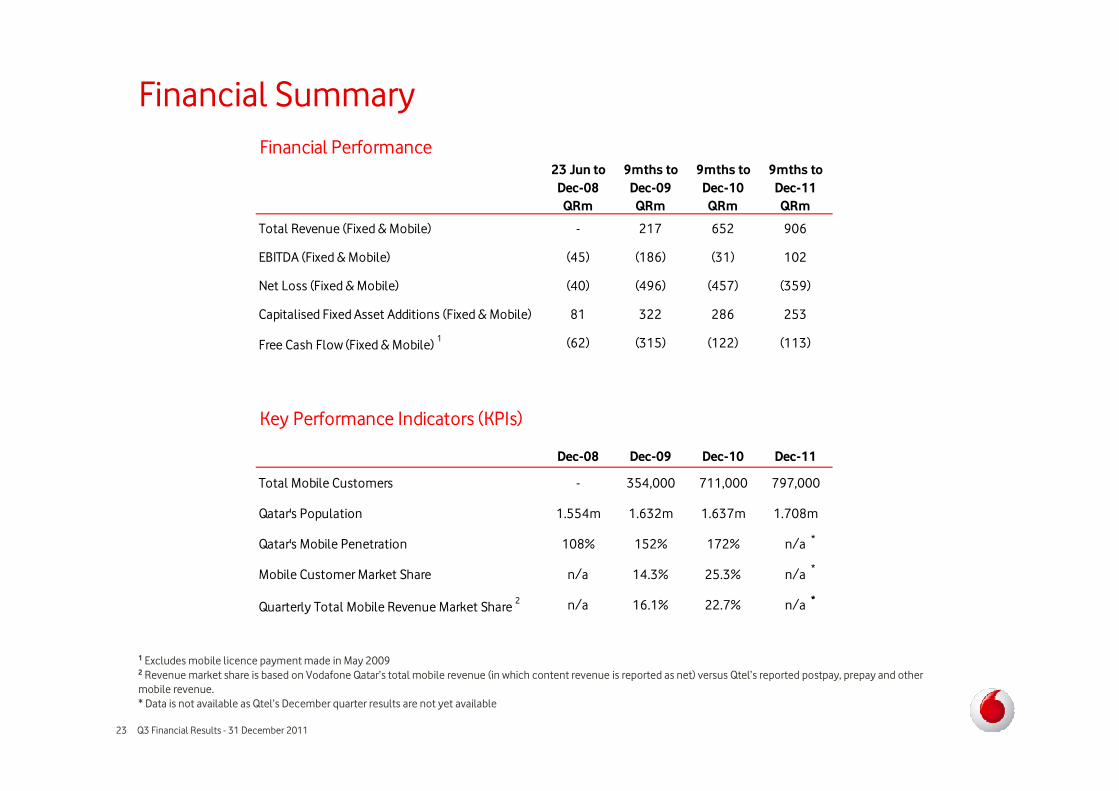
Financial Summary
1 Excludes mobile licence payment made in May 20092 Revenue market share is based on Vodafone Qatar’s total mobile revenue (in which content revenue is reported as net) versus Qtel’s reported postpay, prepay and other mobile revenue. * Data is not available as Qtel’s December quarter results are not yet available
23 Jun to 9mths to 9mths to 9mths toDec-08 Dec-09 Dec-10 Dec-11
QRm QRm QRm QRm
Total Revenue (Fixed & Mobile) - 217 652 906
EBITDA (Fixed & Mobile) (45) (186) (31) 102
Net Loss (Fixed & Mobile) (40) (496) (457) (359)
Capitalised Fixed Asset Additions (Fixed & Mobile) 81 322 286 253
Free Cash Flow (Fixed & Mobile) 1 (62) (315) (122) (113)
Dec-08 Dec-09 Dec-10 Dec-11
Total Mobile Customers - 354,000 711,000 797,000
Qatar's Population 1.554m 1.632m 1.637m 1.708m
Qatar's Mobile Penetration 108% 152% 172% n/a
Mobile Customer Market Share n/a 14.3% 25.3% n/a
Quarterly Total Mobile Revenue Market Share 2 n/a 16.1% 22.7% n/a
Financial Performance
Key Performance Indicators (KPIs)
*
*
*
*

Q3 Financial Results - 31 December 201124
24
GlobalTelecommunications
leader
Private institution of publicUtility founded by
HH Sheikh Hamad Bin KhalifaAl-Thani
Vodafone Qatar Shareholder Structure
49% 51%
Vodafone and Qatar Foundation
LLC
Free float on Qatar Exchange
55%
45%
Vodafone Qatar QSC• Authorized Share Capital: 845,400,000 (Shares)
• Paid Up Capital: QAR 8,454,000,000
• Number of Free Float shares: 464,970,000
• No foreign ownership restrictions
Free Float ownership split at 31 December:
• Institutional Investors: 62%
• Individual Investors: 38%
Q3 Financial Results - 31 December 201125
25
Steve Walters
Chief Financial Officer
M +974 7777 5464
Address: Vodafone Qatar
PO BOX 27727
Doha, Qatar
Website: www.vodafone.com.qa
Rachael Mayo-Smith
Head of Investor Relations
M +974 7777 5642
Khalid Barzak
Investor Relations Manager
M +974 7777 5413
Contact Details