Embed Size (px)
Citation preview

1
Vocational Training and Capacity Building through CSR:
A Case Study of SAIL
Dr. Ranjit Singh Ghuman1 and Dr. Rajeev Sharma2 1 Nehru SAIL Chair Professor, CRRID, Chandigarh, India
([email protected]) 2 Assistant Professor, Nehru SAIL Chair, CRRID, Chandigarh, India
1. Introduction
The opening lines of the first Human Development Report of UNDP (1990) read as, “The
real wealth of a nation is its people. And the purpose of development is to create an enabling
environment for people to enjoy long, healthy and creative lives. The simple but powerful
truth is too often forgotten in the pursuit of material and financial wealth”.
The modern growth theorists (Schultz, 1961; Romer, 1986; Lucas, 1993; Benhabib &
Spiegel, 1994; Barro & Sala-i- Martin; Barro, 2001; Krueger & Lindahl, 2001) have clearly
established that it is impossible to attain an optimum and self-sustenance growth and
development without empowering human resources with skill, education and health. All
those countries, who had adhered to this simple, but powerful truth, have achieved high
growth trajectory in their national income and per capita income (OECD/UNESCO, 2002;
Oshima; 1988). This, in turn, has helped them to improve the physical quality of life of their
people (Lockheed, 1980). The experience of Japan, South-East Asian economies, China and
now India is a living testimony to such evidence.
As a matter of fact, education and skill have been the key growth drivers of socio-economic,
political and cultural development ever since the advent of human civilization. Nevertheless,
their role and relevance has undergone tremendous change and it has enormously increased in
the emerging knowledge economy. An educated and skilled work force is nation’s assets well
as an essential pre-requisite to meet the labour supply requirements for faster and inclusive
growth. Educated, skilled and healthy workforce can turn sand into gold. Though the nature’s
production laws are subject to diminishing returns, yet, human’s skills and knowledge have
the capacity to turn them into increasing returns (Marshall, 1920).
The translation of economic growth into quality of life is measured by the human
development index (HDI). Out of the three components (real GDP per capita, health and
education), education carries one-third weight.

2
It is in this context that education and skill development carries enormous relevance and
importance. Acquisition of appropriate skills will definitely be transforming the lives of the
whole population by making them employable. It is more the so in developing countries like
India where rural population still accounts for 68.85 per cent of the total population. The
literacy level in the rural population, particularly female literacy rate, is also quite low.
The long term dynamics of growth and development have amply established that as the
economy grows and diversify the share of agriculture in GDP and that of its employment in
total employment of the country declines (Kaldor, 1967; Kuznets, 1965). Indian economy,
too, has experienced a similar situation. In the wake of a sharp decline in agriculture sector’s
share in India’s gross domestic product from 52 percent in 1951 to 14 percent in 2012-13 a
relatively moderate decline in its share in employment, from 72 percent to 55 percent during
the same period, the per capita income of agricultural workforce has suffered a relative
deterioration. This, along with a fast shrinking employment opportunities in agriculture in
particular and rural economy in general, provides a strong rationale for shifting workforce
from agriculture to non- agriculture sectors (Gill, 2002). In fact agriculture sector in India is
pushing out workers and non agriculture sectors do not have the corresponding capacity to
absorb them (Ghuman, 2005). The only solution seems to be the development of non-farm
sectors, particularly the rural –non- form sector and generating employment there in. The
problem of non employability of the surplus agricultural workforce is another serious
problem and, hence, a significant limitation in this process. Their non employability is mainly
because of their low level of education and skill. Thus, empowering them with education and
relevant skill is sine qua non to enhance their employability and improve their socio-
economic condition. Acquisition of skill also needs a minimum level of education, say, 10th
class pass. The majority of the Indian rural households in general, and labourer households in
particular, however, do not have even one of their members have with 10th pass ( Ghuman, et
al, 2007). There is thus an urgent need to impart the rural youth with a minimum level of
education and then equip them with relevant and appropriate level of skill. It is here that
education for rural transformation is relevant. Socio-economic transformation of rural
people is only possible through education and skill. However, in view of their poverty and
dismally low level of income access to and affordability are the other serious limitations in
the way of rural transformation. The mobilisation of resources through corporate social
responsibility (CSR) has the strong potential for financing the education and skill of the
rural people.

3
This is important to note that the four states under study account for 15.84 per cent of Indian
population and 13.97 per cent of total geographical area. The literacy rate in these states
ranges between 66.4 per cent and 76.3 per cent and the poverty ratio varies between 19.98 per
cent and 39.93 per cent. The proportion of rural population is quite high, which ranges from
68.13 per cent to 83.31 per cent.
The rural literacy rate in the above-mentioned Indian states varies from 72.9 per cent to 79.6
per cent among males and from 48.9 per cent to 65.5 per cent among females. The male and
female literacy rates in rural area are quite low.
The proportion of tribal population in these states is also quite high. According to Census
2011, around two-third of the workers in these states were engaged in agricultural sector for
their earnings as compared to non-agricultural sector. The exception in this regard is West
Bengal, where 44.0 per cent of the workers are engaged in agricultural sector.
The paper1 is aimed at studying SAIL’s CSR activities pertaining to vocational training and
skill development of the under-privileged and un-employed youth in four Indian states. The
beneficiaries, along with their parents, are either living in the periphery of steel townships
(established by SAIL) or are coming to townships from the surrounding rural areas in search
of their livelihood. These townships are located at Bhilai (Chhattisgarh), Rourkela (Odisha),
Durgapur and Burnpur (West Bengal) and Bokaro (Jharkhand).
The study is based on both the primary and secondary data pertaining to the vocational
training centres covered by CSR activities of SAIL. The secondary data has been collected
from official record of SAIL and the primary data through field survey. The primary data
pertains to 162 respondents across five integrated steel plants of SAIL. Out of 162 sampled
respondents, 110 respondents were pursuing training at five vocational training centres
established under CSR at the time of survey. The remaining 52 sampled respondents had
already completed vocational training from the respective training centres. The main
objectives of the study are:
1. To analyse and discuss the role of SAIL’s CSR activities in providing vocational
training to the under-privileged sections of population.
2. To document and analyse the socio-economic status of the respondents’ family.
3. To evaluate the impact on the stakeholders, i.e., beneficiaries, society and SAIL.

4
2. Genesis of Corporate Social responsibility (CSR)
The corporate social responsibility (CSR) is a philosophy that looks at the social interest and
the enlightened self interest of business over long run as compared to the old, narrow and
unrestrained short run self interest (Steiner,1971). It aims at integrating the business interest
with that of the community in which it operates. The actions of business and industry impact
the lives of citizens, both directly and indirectly. Hence the business and industry is expected
to assure reasonable level of responsibilities towards society in addition to their economic
and legal obligations (Mc Guire, 1963). The corporations have, thus, an obligation to various
groups of society and are expected to be ethical and a good corporate citizen. The CSR, thus,
goes beyond the narrow economic, technical and legal requirements of the firm (Davis,
1973).
Though the rudiments of CSR can be traced to the beginning of human civilisation yet the
concept has been ever evolving. The worth noting references to the CSR appeared during
1930s and 1940s (Barnard 1938; Clark, 1939; and Kreps, 1940). The Fortune magazine in
1946, on the basis of opinion poll of the business executives, reminded the business people
about their social responsibilities. The modern era of social responsibility, however, began in
1950s. During 1950s, the CSR basically concerned with the social consciousness of managers
beyond profit and loss statement. No universally accepted definition of CSR exists. Some
suggests that it’s about what business puts back — and can show it has put back — in return
for the benefits it receives from society. Others say that CSR is about a company’s interaction
with the legal and social obligations of the societies in which it operates and about how it
accounts for those obligations. As per World Business Council for Sustainable Development
(WBCSD), in World Summit on Sustainable Development in Johannesburg 2002, CSR
should be based on integrity, sound values, and a long-term approach. It clearly offers
business benefits to companies and a positive contribution to the well-being of society. In
other words, the businessmen have certain responsibilities towards society beyond economic
and legal obligations of the corporation. The businessmen are expected to look beyond their
firm’s narrow economic and technical interest and legal requirements.
It is significant to note that the predecessor of the concept of CSR was social responsibility
(SR). Perhaps it was mainly because of the fact that the corporate sector did not have the kind
of prominence and dominance over business and industry in the past as it has today. As we
have already mentioned that CSR is a philosophy that looks at the social interest and the
enlightened self-interest of business over long run as compared with the old, narrow,
5
unrestrained short-run self interest. It means, in other words, the rationale of CSR lies in the
fact that the actions of business and industry, particularly corporate sector, directly and
indirectly touch and impact the lives of the people, especially the marginalized/under-
privileged. Moreover, the growing awareness that CSR is good for business has also aided its
development. Now-a-days, it is widely accepted view that corporate responsibility can
provide a competitive advantage to companies.
Today, more and more companies are realizing that in order to stay productive, competitive,
and relevant in a rapidly changing business world, they have to become socially responsible.
The ever increasing pace of globalization has blurred the national borders and technology has
accelerated time and masked distance. Given this sea change in the corporate environment,
companies want to increase their ability to manage their profits and risks, and to protect the
reputation of their brands. Because of globalization, there is also a fierce competition for
skilled employees, investors, and consumer loyalty. How a company relates with its workers,
its host communities, and the marketplace can greatly contribute to the sustainability of its
business success.
It has been widely recognised the world over that integrating social, environmental and
ethical responsibilities into the governance of business ensures their long term success,
competitiveness and sustainability. Such an approach also reaffirms the view that businesses
are an integral part of society and have a critical and active role to play in the sustenance and
improvement of healthy ecosystems. It also helps in fostering social inclusiveness and equity
and in upholding the essentials of ethical practices and good governance. Companies with
effective CSR have the image of socially responsible companies, achieve sustainable growth
in their operations in the long run and their products and services are preferred by the
customers.
Hence, the business and industry is expected to assure reasonable level of responsibilities
towards society. But the term reasonable level of responsibilities needs a serious debate so as
to make the business and industry responsible towards society. Mere provision of goods and
services to those who have the purchasing power may not be enough. The State, business and
industry also owe responsibility towards those who have either no purchasing power or who
do not have adequate purchasing power for making both ends meet not to talk of a decent
living. The role of State and Government is, thus, imperative, rather sine qua non, for making
provision of minimum level of goods and services for each and every citizen.

6
Nevertheless, the question: ‘how to make this provision’, is a trillion dollar question. Should
the State subsidies or give the purchasing power (by giving money) to those who do not have
purchasing power. Or such people are empowered through education and skill. In other
words, the trade-off is: ‘to catch the fish and give it to such people’ or ‘to teach them how to
catch the fish’. The first path may not be sustainable in the long run and has been supported
by history. Only the second path has sustained over the period of time. Moreover, the first
path hits the self-respect whereas the second path inculcates a sense of self-respect and a
feeling of participation.
3. CSR in India
Prior to The Companies Act, 2013, the both public and private companies were voluntarily
doing certain philanthropic activities on voluntary basis. Their philanthropic programmes
were mainly focussed on religious and educational activities. Up till 2009 Govt. of India,
2009), there were no guidelines for CSR. It was only in 2009 that the Ministry of Corporate
Affairs, Government of India issued CSR voluntary guidelines for the companies to
undertake CSR activities. As is evident these were voluntary in nature and some companies,
mainly in the public sector, started CSR activities. The ministry, however, issued fresh
guidelines for the central public sector enterprises (CPSEs) in 2013 according to which the
budgetary allocation to CSR was linked to their profit after tax (PAT) of the previous year.
More specifically, a company with PAT up to Rs. 1000 million shall invest from 3 % to 5%
of PAT; a company with PAT between Rs. 1000 million and 5000 million shall allocate from
2% to 3% of PAT; and any company with PAT more than Rs. 5000 million shall allocate
from 1% to 2% of its PAT in the previous year. Most of the CPSEs complied with these
guidelines.
With the enactment of The Companies Act, 2013, the public as well as private sector
companies covered under the clause135 The Act, are under obligation to allocate and invest
at least 2% of their PAT (average of previous three years) to the CSR activities. The ACT has
come into force with effect from April 1, 2014. It is significant to mention that The
Companies Act, 2013 is much more specific than the earlier guidelines on CSR.
7
The clause 135 (1) of The Act reads as under:
“Every company having net worth of rupees five hundred crore or more, or
turnover of rupees one thousand crore or more or a net profit of rupees five
crore or more during any financial year shall constitute a Corporate Social
Responsibility Committee of the Board consisting of three or more directors,
out of which at least one director shall be an independent director.”
The composition of the CSR committee shall be disclosed in the Board’s report. The CSR
committee shall formulate CSR policy of the company, recommend the amount of
expenditure to be incurred on the CSR activities and monitor the CSR policy of the company.
The recommendations of the CSR Committee would form the basis of CSR policy of the
company which shall be disclosed in its report and also be uploaded in company’s website.
The board of every company shall ensure that the company spends, in every financial year, at
least two per cent of the average net profit of the company made during the three immediately
preceding financial years, in pursuance of its CSR Policy. If the company fails to spend such
an amount, the Board shall specify the reasons for not spending the amount in its report. It is
also mentioned in The Act that the company shall give preference to the local area and areas
around it where it operates, for spending the amount earmarked for CSR activities.
The amended version of Schedule VII of The Act lists the activities where the Companies
are supposed to undertake CSR programmes. These activities relate to eradicating extreme
hunger and poverty; promotion of education; promoting gender equality and empowering
women; ensuring environmental sustainability; employment enhancing vocational skills;
contribution to the Prime Minister’s National Relief Fund or any other fund set up by the
Central Government or the State Governments for socio-economic development and relief
and funds for the welfare of the Scheduled Castes, the Scheduled Tribes, other backward
classes, minorities and women; and such other matters as may be prescribed 2.
4. CSR by Steel Authority of India Limited (SAIL)
Steel Authority of India Limited (SAIL) is Country’s largest and among the leading steel
producers in the world. In India, SAIL has been recognised as one of the Maharatna
Company. The company owns and operates eight manufacturing plants. Five integrated steel
plants at Bhilai, Durgapur, Rourkela, Bokaro & Burnpur producing carbon steels. Three
plants at Durgapur (Alloy Steel Plant), Salem and Bhadravati are making alloy steels,
stainless and special steel. It is worthwhile to mention that SAIL’s turnover has crossed Rs.

8
493500 million in 2012-13 despite the fact that global economy is passing through a
recessionary phase. This has established company’s success at global level in terms of
competition, especially in the context of globalisation.
Though SAIL has been doing CSR activities since long, yet, it has been specifically focuses
on CSR since 2009. In compliance with the Union Government’s policy guidelines (2013) on
CSR for Central Public Enterprises, the SAIL has broadened its CSR programme. The main
focus of its CSR activities has been on education, vocational training and skill development,
health, rural infrastructure and hunger. With effect from April 2014, the SAIL shall be
spending 2 % of its PAT on CSR activities given in clause 135 (1) and schedule VII
(amended) of The Companies Act, 2013.
SAIL’s expenditure on CSR programme is shown in table 1. It is clear from the table that the
SAIL is spending between 1 per cent and 1.5 per cent of its profit on CSR during 2009-13.
5. SAIL’s Efforts to provide Vocational Training to the Under-Privileged
Youth represents the future hope of every country. The high returns on resources invested in
youth today have both immediate and long term benefits. Skilled manpower is usually
considered a sine qua non for industrialization. The SAIL accordingly views skill formation
and its up-gradation and development as its core agenda. This is aimed at empowering the
youth with skill and thereby improving the living standards of the under-privileged sections.
In addition to this it has the potential to reap the demographic dividends and thereby leading
to inclusive growth.
The main focus of this study is on the five vocational training centres set up by SAIL under
its CSR projects. Vocational training centres are as under:
1. Bhilai Ispat Kaushal Kutir (Bhilai, Chhattisgarh)
2. Handloom Weaving Centre (Rourkela, Odisha)
3. Bokaro Private Industrial Training Institute (Bokaro, Jharkhand)
4. DSP Mahila Samaj Premises (Durgapur, West Bengal)
5. Asansol Ramakrishna Mission Vocational Training Centre (Burnpur, West Bengal)
The details of the expenditure on vocational training for the period of five years (2008-09 to
2012-13) in absolute terms are given in Table 2. It is evident that the total expenditure
incurred on vocational training has increased to Rs. 30.6 million in 2012-13 from Rs. 11.2
million in (2008-09). Out of total expenditure, Rourkela Steel Plant has incurred maximum

9
expenditure on vocational training (Rs. 14.1million) and remaining plants have spent less
than Rs. 10 million on vocational training during the year 2012-13. Thus, no uniform pattern
of expenditure is observed across the plants. The possible reason could be the variation in the
profit of individual steel plant of SAIL over the years.
The expenditure on vocational training in terms of percentage to total CSR expenditure of
five integrated steel plants has also been calculated and is presented in Table 3. The overall
expenditure on vocational training rose to13.30 per cent in 2012-13 as compared to 2.89 per
cent in 2008-09. It is clear from the table that expenditure increased across all the plants in
2012-13 as compared to 2008-09. The only exception in this regard was Bokaro Steel Plant: it
remained around 0.22 per cent.
6. Socio- Economic Status of the Sampled Beneficiaries
The gender-wise distribution according to trade for those who were pursuing training as well
as for those who had completed training has been presented in tables 4 and 5, respectively.
Some of the trades, such as, welding, electrician, fitter, dress making, and hair and skin care,
are more popular than others.
The level of education of the trainees reveals the generic and foundational skills residing in
them. In our sample, the share of trainees who were illiterate comprised of only 4.5 per cent,
as is clear from Figure 1. Majority of the trainees had completed higher secondary (40.9 per
cent) and is closely followed by those completed secondary education (31.8 per cent).
However, 10 per cent of the trainees had graduation and 3.6 per cent of them had post
graduation degree before joining the vocational training (Figure 1).
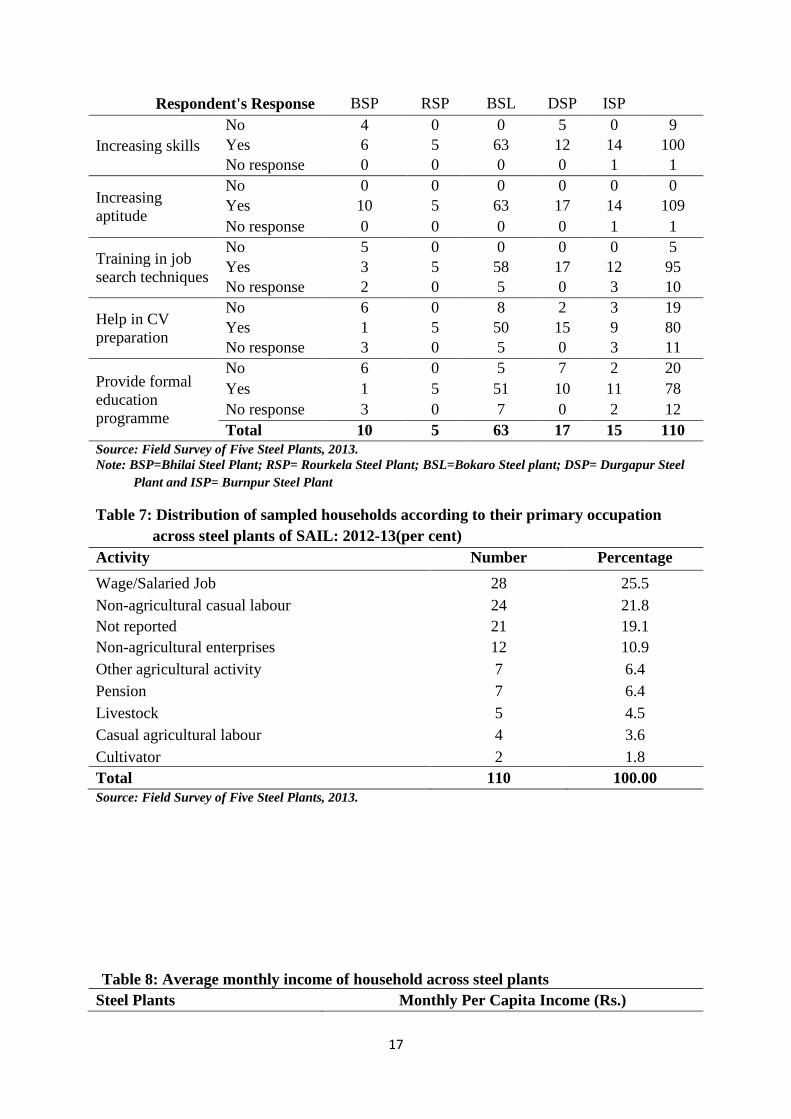
An attempt has also been made in this paper to show the usefulness of vocational training
among the respondents. The information is presented in table 6. It is clear from the
information provided by the respondents that they were aware that vocational training
programme would increase their skills and enhance their employability in the job market.
This is true for sampled respondents across all the steel plants.
The distribution of the sampled households according to their primary occupation reveals that
most of them were engaged as wage earners, non-agricultural casual labourers and non-
agricultural activities (Table 7).

10
Table 8 presents the per capita monthly income of the households. The average per capita
income came out to be Rs. 921 per month. Across the steel plants, the households under
study have highest per capita monthly income of Rs. 1872 at Durgapur. This is followed by
the households at Bokaro Steel Plant (Rs. 917) and at Burnpur Steel Plant (Rs 590). On the
contrary, the residents staying near the periphery of Rourkela Steel plant have lowest monthly
per capita income of Rs. 447 on an average.
The urban poverty line worked out by the Planning Commission of India for the selected
states, for the year 2009-10, is given in Table 9 (column 4). Going by the updated urban
poverty lines for the survey year, we find that the families of the respondents pursuing
training in the centre of Durgapur steel plant have relatively better economic status in terms
of average earnings on monthly basis.
7. Outcome and Impact Analysis
The outcome and impact has been studied at three levels: i) on the basis of quantitative data;
ii) on the basis of perceptions and views of the beneficiaries; and iii) on the basis of field
observations.
i) Quantitative data
The SAIL has provided vocational training to 1007 trainees during 2012-13 in their
respective training centres established at five townships under its CSR programme. This
study also collected qualitative information to understand the impact of vocational training.
Majority of the respondents who have completed vocational training reported significant
improvement in their skill levels, increase in their ability to take daily activities, enhance their
chances for employment, of both wage and self-employment. This has also improved their
earnings and resulted in improvement in health and well being (Figure 2).
A large number of respondents were engaged in self-employment after successfully
completing vocational training as is clear from table 10. At the time if survey some of the
respondents were either in search of employment or were thinking of venturing into self
employment. Most of the respondents who have completed training from respective training
centres of steel plants of SAIL were highly satisfied with the training. The level of
satisfaction is shown in table 11. It is worth mentioning that the average earning of the
individuals engaged in their respective employment was Rs.5252 per month across the steel
plants.

11
ii) Views and perceptions of the beneficiaries
Though we came across a large number of beneficiaries (those who got skill training at
SAIL’s skill development centres) who either got wage employment or have started self
employment, yet, the perceptions of some of beneficiaries have been given below. An
effort was made to include at least one beneficiary from each steel plant.
These are given in the following quotes.
1. “We live in the slums outside Steel Township. We had no income earlier. Now we
work daily to make soaps, cotton duster and gunny bags which are sold to local
factories here. We are 16 women having formed Self-Help Group. Durgapur Steel
Plant has helped us in providing training, building and machines to produce the
items. We used to earn Rs. 800 per month when we started work in 2009. Now each
of us earns Rs. 1400 to Rs. 1800 per month. We will remain grateful to Durgapur
Steel Plant (DSP) for making us to stand on our feet and supporting our families”.
Kavita Sarkar, Lakhi Bag, Saraswati Das (Members of SHG-Swayamsiddha,
Vivekanada Service Centre under a CSR scheme of DSP)
2 “I am a resident of Bhilai township, 166-A. I got training from Bhiali Kaushal Kutir
in electrical trade. I am a resident of Bhilai township, 166-A. The training was
useful in acquiring skills. At present, I earn Rs. 1000-1500 per month by fitting
electricity in the houses in and around Bhilai. I am extremely thankful to Bhilai
Steel Plant (BSP) for giving me an opportunity to upgrade my skill level free of cost.
-Rohit Kumar, Resident of Bhilai Township
3 “The quality teaching and training at Bokaro Pvt. ITI, an ITI established under CSR
of Bokaro Steel plant has fulfilled my dream in getting a job in IISCO Steel Plant,
Burnpur, SAIL”.
-Amarjeet Paswan, studied from ITI, BSL
4 “A machine was installed by Rourkela Steel Plant (RSP) in January, 2013 in Liang
Colony, for preparing puffed rice. From one kg of rice, trainee group (16 members)
was able to produce six boxes of puffed rice which we used to sell in nearby village.
We now use 20 kg of rice per day and are able to prepare 120 boxes in a day. As a
result, we are able to earn a profit of Rs. 120-150 per day. We need some support
from RSP in the form of technology to dry their rice in large amount in order to
enhance the scale of production (9-10 boxes from 1 kg of rice approximately)”.
-Rajni Naik, Member WRC, Liang Colony Model Steel Village (MSV), RSP
5 “As a result/impact of project Kishori of RSP, women in a group are able to earn on
an average Rs. 1000-1200 per month per head from different activities. There is

12
significant improvement in their economic status after the initiation of WRC in the
MSVs”.
-Rita Lakra, Trainer under Kishori Project of RSP, Resident of Chikatmati
Village (MSV)
6 “Our SRI SAI SHG (12 members) in Jabaghat is able to produce 2-3 quintals of
noodles, market it at RSP township and earn a profit of Rs. 10,000 per month. We
wanted to increase its scale of production to meet out the huge demand of its
product, which at present they are not able to fulfil. In order to achieve this, we
require some more technological input from RSP through SRI SAI NGO”.
-Urmila Rana, A trainer and member of SRI SAI SHG, Resident of Jabaghat
(MSV), Rourkeal Steel Plant (RSP)
7 “I belong to a poor family. My family is earning only Rs 3500 per month. Bokaro
Steel Plant (BSL) has given me an opportunity to upgrade my skill in its training centre,
which was otherwise not possible for me. Thanks are due to BSL. I am in the final
stages of my training. I found that ITI training provided by BSL was very useful and
productive in shaping my future. However, I wanted to highlight that BSL might include
some more trades in view of emerging market demand”.
-Naresh Kumar, Resident Bokaro Township
iii) Field observations
In view of the poor socio-economic status of the parents of the beneficiaries and lack of skill,
the respondent beneficiaries could never dream of acquiring skill in the absence of SAIL’s
CSR programme. Prior to CSR intervention, majority of the trainees were without any skill
and were grappling with unemployment and poverty. As a result, most of them could not
provide any kind of support to their vulnerable and poor families. The officials reported that
majority of the individuals were unskilled. A large number of young trainees have developed
their skills by learning from others and very few have acquired it through formal training.
Interaction with some of the trainees highlighted that most of them were interested in
receiving some kind of formal training to acquire or to enhance their skill levels so as to earn
decent livelihood.
It has been observed that the skill development centres of SAIL have enhanced the
employability and earning capacities of the poor women also. Such an exercise is being
performed by all the plants. It has enhanced the social status of those women .Now, the
women are not only empowered their livelihood but are supplementing the household
income. With their earnings they have been able to support the education of their children. In
other words, skill development, through vocational training, has not only enhanced the

13
employability and earning capacity of the beneficiaries but also their family income made
them self-reliant. The beneficiaries are now supplementing and are participating in the
decision making. Not only they, but also their family members are living with dignity.
Summing up
This study has examined and evaluated the role of SAIL’s CSR activities in providing
vocational training to the members of underprivileged sections of the society. The main focus
of this study was on the vocational training centres set up by SAIL under its CSR projects at
its five townships at Bhilai, Rourkela, Bokaro, Durgapur and Burnpur. The study also sought
out to evaluate the impact of vocational training on the beneficiaries. Impact has been studied
in three ways: on the basis of number of beneficiaries, on the basis of the perceptions of the
beneficiaries, and finally on the basis of our own observations during the field visit. In order
to realize the objectives of the report, this study has tried to integrate quantitative data with
the perceptions and real life experiences of the households themselves, on the basis of
random sample of162 beneficiaries. It is worth highlighting that out of 162 sampled
respondents, 110respondents were pursuing training in five vocational training centres
established and covered under CSR. The remaining 52 sampled respondents had already
completed vocational training from the respective training centres of SAIL. The information
collected from the field is generated specifically for this purpose.
A good number of the trainees who have completed their training have already started
earning and hence supplementing their family income. In view of the higher unemployment
among the youth the vocational training is quite relevant for getting into self-employment and
earning their livelihood. Thus, SAIL is helping the youth to acquire skill and is thereby
contributing to the overall development of the beneficiaries and their families. In other words,
SAIL is trying to promote equity and inclusive development by empowering the under-
privileged people, especially the unskilled youth. Eventually, SAIL would reap rich benefits
in terms of good will and social capital and contribute towards substantial amount of
demographic dividends.

14
References
Analysis of the World Education Indicators, (Available at www.unesco.org/publications).
Barnard, C.I. (1938). The Functions of the Executive, Cambridge, MA: Harvard University
Press.
Barro, R.J. (2001). Human Capital and Growth, American Economic Review, Vol. 91 (2),
pp. 12-17, papers and proceedings.
Barro, R.J. and Sala-i-Martin, X. (1995). Economic Growth, McGraw-Hill, New York.
Benihabib, J. and Spiegel, M.M. (1994). The Role of Human Capital in Economic
Development: Evidence from Aggregate Cross-country and Regional U.S. Data,
Journal of Monetary Economics, Vol. 34(2), pp. 143-174.
Clark, J.M. (1939). Social Control of Business, New York: McGraw-Hill.
Davis, K. (1973). The Case for and against Business Assumption of Social Responsibilities,
Academy of Management Journal, 16: 312-322.
Ghuman, R S (2005). Rural Non-farm Employment Scenario: Reflections from Recent Data
in Punjab, Economic and Political Weekly, 40(41):4473-80.
Ghuman, R.S., Inderjeet Singh and Lakhwinder Singh (2007). Status of Local Agricultural
Labour in Punjab, The Punjab Framers Commission, Mohali.
Ghuman, R.S. and Rajeev Sharma (2013). Evaluation Report of Corporate Social
Responsibility of SAIL for the year 2012-2013, Centre for Research in Rural and
Industrial Development (CRRID), Chandigarh.
Ghuman, R.S. and Rajeev Sharma (2014). Vocational Training and Capacity Building
through CSR: A Case Study of SAIL, Centre for Research in Rural and Industrial
Development (CRRID), Chandigarh.
Gill, S.S. (2002). Agricultural Crop Technology and Employment Generation in Punjab, in
S.S. Johl and S.K. Ray (eds.), Future of Agriculture in Punjab, CRRID, Chandigarh.
Kaldor, N (1967). Strategic Factors in Economic Development (New York: Cornell
University Press).
Kreps, T.J. (1940). Measurement of the Social Performance of Business, In an Investigation
of Concentration of Economic Power for the Temporary National Economic National
Committee (Monograph No.7), Washington, DC: U.S. Government Printing Office.
Krueger, A.B. and Lindahl, M. (2001). Education for Growth: Why and For Whom? Journal
of Economic Literature, Vol. 39 (4), pp. 1101-1136.
Kuznets, S (1965). Economic Growth and Structure (New Delhi: Oxford and IBH Publishing
Company).
Lockheed, M. et.al, (1980). Farmer Education and Farm Efficiency: A Survey, Economic
Development and Cultural Change, Vol. 29, No. 1, pp.37-76.
Lucas, R.E. Jr. (1993). Making a Miracle, Econometrica, Vol. 61 (2), March, pp.251-272.
Marshall, A. (1920). Principles of Economics, Eighth edition, Macmillan Publishers, London.
McGuire, J.W. (1963). Business and Society, New York: McGraw-Hill.
OECD/UNESCO (2002). Financing Education – investment and Returns: An
Oshima, H.T. (1988). Human Resources in East Asia's Secular Growth, Economic
Development and Cultural Change, Vol. 36, No. 3, pp.S103-S122.
Romer, P.M. (1986). Increasing Returns and Long-Run Growth, Journal of Political
Economy, Vol. 94 (5), pp. 1002-36.
Schultz, T.W. (1961). Investment in Human Capital, American Economic Review, Vol. 51,
January.
Steiner, G.A. (1971). Business and Society, New York: Random House.
TABLES

15
Table 1: Expenditure on CSR activities of SAIL during 2009-10 to 2012-13(Rs. millions)
Year
Budget
Allocated
(Col. 2)
Budget
Utilised
(Col.3)
Profit After
Tax
(PAT)
Col. 2 as a
% of PAT
(previous year)
Col. 3 as a
% of PAT
(previous year)
2009-10 800 788 67540 1.30 1.28
2010-11 940 690 49050 1.39 1.02
2011-12 640 612 35430 130 1.25
2012-13 420 533 21700 1.19 1.50
Source: Sustainable Development Performance Report, 2011-12; Annual Report 2011-12 and finance data of
2012-13 of SAIL.
Table 2: Plant-wise expenditure on vocational training: 2008-09 to 2012-13(Rs millions)
Steel Plants 2008-09 2009-10 2010-11 2011-12 2012-13
Bhilai Steel Plant (BSP) 0. 5 2.5 1.6 1.6 1.7
Rourkela Steel Plant (RSP) 9.0 8.7 7.4 7.7 14.1
Bokaro Steel Plant (BSL) Nil 10.0 5.0 3.9 7.5
Durgapur Steel Plant (DSP) 0. 9 3.5 0.1 0.4 0.5
Burnpur Steel Plant (ISP) 0. 8 0.1 0.6 0.9 6.8
Total 11.2 24.8 14.7 14.5 30.6
Source: CSR Office, Respective Steel Plant, 2013.
Table 3: Expenditure on vocational training as a percentage of total CSR expenditure
(Rs. Million)
Steel Plants 2008-09 2009-10 2010-11 2011-12 2012-13
Bhilai Steel Plant 1.3 6.4 4.3 5.9 7.4
Rourkela Steel Plant 0.0 25.5 13.6 14.4 32.6
Bokaro Steel Plant 2.3 8.9 0.3 1.5 2.2
Durgapur Steel Plant 23.2 22.2 20.1 28.4 61.3
Burnpur Steel Plant 2.1 0.3 1.6 3.3 29.6
Total 28.9 (388.1) 63.4 (391.4) 39.9 (368.7) 53.4 (271.6) 133.0 (230.0)
Source: Own computations from data provided by CSR office of respective steel plant, 2013.
Note: Figures in parenthesis denote total CSR expenditure of five integrated steel plants in Rs. million.
Table 4: Trade-wise and gender-wise distribution of trainees during 2012-13
Name of Trade Total Male Female

16
No. % No. % No. %
Fitter 23 100 23 100 0 0
Electrician 28 100 27 96 1 4
Welder 16 100 16 100 0 0
Hair and skin care 10 100 0 0 10 100
Dress making 7 100 0 0 7 100
Handloom 5 100 0 0 5 100
Computer hardware 5 100 4 80 1 20
Stitching/tailoring 3 100 0 0 3 100
Basic computer 2 100 2 100 0 0
Sweets box making 2 100 0 0 2 100
Mobile repair 2 100 2 100 0 0
AC and Refrigerator 2 100 2 100 0 0
Weaving 1 100 0 0 1 100
Candle and Papad making 1 100 0 0 1 100
Mushroom cultivation 1 100 0 0 1 100
Mobile repair 1 100 1 100 0 0
Two-wheeler repair 1 100 1 100 0 0
Total 110 100 78 70.9 32 29.1
Source: Field Survey of Five Steel Plants, 2013.
Table 5: Gender-wise distribution of sampled beneficiaries who have completed
training in respective trades at centres setup by SAIL under CSR
Name of Trade Total Male Female
No. % No. % No. %
Electrician 26 100 22 84.6 4 15.3
Mobile repairing 13 100 8 61.5 5 38.4
Hair and skin care 5 100 0 0 5 100
Welder 5 100 2 40 3 60
Dress making 2 100 0 0 2 100
Software training course 1 100 0 0 1 100
Total 52 100 32 61.5 20 38.5
Source: Field Survey of Five Steel Plants, 2013.
Table 6: Trainees response to vocational training programmes
Steel Plants Total
17
Respondent's Response BSP RSP BSL DSP ISP
Increasing skills
No 4 0 0 5 0 9
Yes 6 5 63 12 14 100
No response 0 0 0 0 1 1
Increasing
aptitude
No 0 0 0 0 0 0
Yes 10 5 63 17 14 109
No response 0 0 0 0 1 1
Training in job
search techniques
No 5 0 0 0 0 5
Yes 3 5 58 17 12 95
No response 2 0 5 0 3 10
Help in CV
preparation
No 6 0 8 2 3 19
Yes 1 5 50 15 9 80
No response 3 0 5 0 3 11
Provide formal
education
programme
No 6 0 5 7 2 20
Yes 1 5 51 10 11 78
No response 3 0 7 0 2 12
Total 10 5 63 17 15 110
Source: Field Survey of Five Steel Plants, 2013.
Note: BSP=Bhilai Steel Plant; RSP= Rourkela Steel Plant; BSL=Bokaro Steel plant; DSP= Durgapur Steel
Plant and ISP= Burnpur Steel Plant
Table 7: Distribution of sampled households according to their primary occupation
across steel plants of SAIL: 2012-13(per cent)
Activity Number Percentage
Wage/Salaried Job 28 25.5
Non-agricultural casual labour 24 21.8
Not reported 21 19.1
Non-agricultural enterprises 12 10.9
Other agricultural activity 7 6.4
Pension 7 6.4
Livestock 5 4.5
Casual agricultural labour 4 3.6
Cultivator 2 1.8
Total 110 100.00
Source: Field Survey of Five Steel Plants, 2013.
Table 8: Average monthly income of household across steel plants
Steel Plants Monthly Per Capita Income (Rs.)

18
Bhilai Steel Plant 561
Rourkela Steel Plant 447
Bokaro Steel Plant 917
Durgapur Steel Plant 1872
Burnpur Steel Plant 590
All Steel Plants 921
Source: Field Survey of Five Steel Plants, 2013.
Table 9: Average monthly income and urban poverty line across study area (Rs.) State Name of the Plant Monthly Per
Capita
Income
(Survey Data)
State Specific
Urban Poverty
Line for 2009-10*
(Planning
Commission)
Updated
Urban Poverty
Lines for
Survey Year
(2012-13)
1 2 3 4 5
Chhattisgarh Bhilai Steel Plant 561 807 982
Jharkhand Bokaro Steel Plant 917 831 1011
Odisha Rourkela Steel Plant 447 736 896
West Bengal Durgapur Steel Plant 1872 831 1011
Burnpur Steel Plant 590
Source: Field Survey, 2012-13.
*Planning Commission, Government of India, March, 2012.
(Also available at: http://planningcommission.nic.in/news/press_pov1903.pdf, accessed on 19th July, 2013)
Table 10: Occupational structure of sampled beneficiaries after completing vocational
training (at the time of survey)
Type of Employment
Total
BSP BSL DSP ISP
No. %
Self-employed 26 50.0 6 0 6 14
Similar to previous job, but with different employer 5 9.6 0 0 1 4
Old job with previous employer 1 1.9 1 0 0 0
Different job with different employer 1 1.9 1 0 0 0
In search employment 19 36.5 2 14 0 3
Total 52 100.0 10 14 7 21
Source: Field Survey of Five Steel Plants, 2013.
Note: BSP=Bhilai Steel Plant; BSL=Bokaro Steel plant; DSP= Durgapur Steel Plant and ISP= Burnpur
Steel Plant
Table 11: Satisfaction level of the respondents who had completed vocational training
Overall Satisfaction Total BSP BSL DSP ISP

19
No. %
Highly satisfied 28 53.8 5 13 6 4
Moderately satisfied 19 36.5 4 1 1 13
Not satisfied 5 9.6 1 0 0 4
Total 52 100.0 10 14 7 21
Source: Field Survey of Five Steel Plants, 2013.
Note: BSP=Bhilai Steel Plant; BSL=Bokaro Steel plant; DSP= Durgapur Steel Plant and ISP= Burnpur
Steel Plant
FIGURES
Figure 1: Educational qualification of trainees’ pursuing vocational training in the
training centres set up by SAIL at respective steel plants
Source: Field Survey of Five Steel Plants, 2013
0.0
5.0
10.0
15.0
20.0
25.0
30.0
35.0
40.0
45.0
Illiterate Middle Secondary Higher
secondary
Diploma Graduate Post
Graduate
Per
cen
t
Educational Qualification

20
Figure 2: Respondents’ response who successfully completed vocational training from
SAIL’s respective training centres
Source: Field Survey of Five Steel Plants, 2013.
End Notes
1 This paper is based on two large studies “Evaluation Report of Corporate Social Responsibility of SAIL for the
Year 2012-13” and “Vocational Training and Capacity Building through CSR: A Case Study of SAIL”,
conducted by the authors. The Views expressed are personal. The usual disclaimer applies. 2 For detail see the Companies Act, 2013 (No 18 of 2013), Ministry of Law and Justice, Government of India,
New Delhi. Also see amended schedule VII.