Embed Size (px)
Citation preview
Vocational Education in Kenya: Evidence from A Randomized Evaluation Among Youth
Joan Hamory Hicks, Michael Kremer, Isaac Mbiti, and Edward Miguel*
August 2013
PRELIMINARY AND INCOMPLETE DO NOT CITE
Abstract This paper describes the Technical and Vocational Vouchers Program (TVVP) in Kenya and provides early results from the intervention. Implementation began in 2008 with the recruitment of approximately 2,160 out-of-school youths (ranging in age from roughly 18 to 30). Of the 2,160 youths that applied to the TVVP, a random half were awarded a voucher for vocational training, while the other half served as the control group. Of the voucher winners, a random half were awarded a voucher that could only be used in public (government) institutions, while the other half received a voucher that could be used in either private or public institutions. The program also included a cross-cutting information intervention, which exposed a randomly selected half of all treatment and control individuals to information about the actual returns to vocational education. We find that voucher winners were significantly more likely to enroll in vocational education institutions and were able to acquire an additional 0.6 years of education. However, the information treatment did not affect educational attainment. We find limited evidence that the program increased earnings, although we found the program led to a significant increase in wage earnings among wage earners. *Hicks: University of California, Berkeley CEGA; Kremer: Harvard University and NBER; Mbiti: Southern Methodist University; Miguel: University of California, Berkeley and NBER. We gratefully acknowledge financial support from the Berkeley Population Center, the International Growth Centre (IGC), the International Initiative for Impact Evaluation (3IE) / Global Development Network, the National Institutes of Health, the National Science Foundation, and the World Bank Bank-Netherlands Partnership Program (BNPP), Spanish Impact Evaluation Fund (SIEF) and Gender Action Plan (GAP). We are grateful to Shobhana Sosale for her encouragement, support, and useful comments and suggestions throughout this project. We are also grateful to David Evans, Markus Goldstein, Arianna Legovini and Michael Mills for their support. Kevin Audi, Pierre Bachas, Lisa Chen, Lauren Falcao, Jonas Hjort, Gerald Ipapa, Maryam Janani, Andrew Fischer Lees, Anne Karing, Jamie McCasland, Owen Ozier, Adina Rom, Sebastian Stumpner, Paula Vinchery and Michael Walker provided exceptional research, managerial, organizational, and implementation assistance. The project was implemented and managed in collaboration with Innovations for Poverty Action-Kenya (IPAK). We are grateful for the superb effort of the field staff led by Blastus Bwire, Benard Onyango and Esther Yusto, and the management and support staff at IPAK.
2
1. Introduction Youth unemployment is one of the most pressing social and economic problems facing less
developed countries today (World Bank, 2007). Kenya, like many African countries, suffers
from high youth unemployment. According to the 2005 Kenya Integrated Household Budget
Survey, approximately 21% of youths aged 15-29 are unemployed, and a further 25% are neither
in school nor working. This is a critical problem given that individuals in this age group compose
30% of the country’s population. Furthermore, high unemployment can have adverse social and
economic consequences: a recent report suggested that the majority of violent acts during the
2007 post-election crisis in Kenya were perpetrated by underemployed youth (World Bank,
2008).
Despite the importance of youth unemployment, little is known about how best to smooth
the school-to-work transition in less developed countries or how to boost human capital for those
not on the academic schooling track. Vocational education is one promising avenue for
addressing the problem. The 2007 World Development Report emphasizes that “second-chance”
schooling programs are crucial for countries like Kenya, given high drop-out rates from primary
school and limited primary to secondary school transition rates. Proponents of vocational
education argue that such training can deliver more readily-marketable skills to these youth, and
therefore offer an attractive alternative to traditional schooling that could smooth the school-to-
work transition for those leaving the traditional schooling track. However, there is limited
rigorous empirical evidence on the effectiveness of vocational training in developing countries.
This paper describes the Technical and Vocational Vouchers Program (TVVP) in Kenya
and provides early results of the intervention. This program – the first of its kind in Africa, to our
knowledge – aims to understand the mechanisms through which vocational education can
address the widespread problem of youth underemployment in Kenya, using a multi-faceted
randomized evaluation design together with an innovative panel dataset. In particular, through
randomized provision of vocational training vouchers to program applicants, the TVVP permits
an evaluation of the effects of vocational education on formal sector employment and labor
market earnings, participation in the informal and agricultural sectors, entrepreneurship
decisions, migration (both within Kenya and to neighboring countries), remittances, fertility
decisions and other major life outcomes in a sample of over 2,100 Kenyan youth. The design of
3
the program further allows for an estimation of how these effects vary by type (e.g., public
versus private) and quality of institution attended, as well as across individuals with different
baseline characteristics. In addition, the use of a novel randomized information intervention
permits estimation of the role that information on labor market returns to vocational training
plays in the demand for vocational education in Kenya.
While there is some existing evidence of the benefits of vocational education (e.g.,
Nishimura and Orodho, 1999), there is great need for additional rigorous studies on its economic
returns and how best to deliver such programs in Africa. The few existing rigorous studies of
vocational training in developing countries primarily evaluate Latin American programs. In a
pair of papers, Angrist et al. (2002, 2006) examine Colombia’s program of providing vouchers to
allow students to attend private secondary schools and find that it was very cost effective. A
paper by Bettinger, Kremer, and Saavedra (2007) finds that the greatest impact of this program
was in the private vocational sector. Although this evidence is intriguing and Bettinger et al.
argue that it may be due to private vocational schools being more successful at producing
employable graduates than public schools, especially for jobs in Colombia’s rapidly growing
service sector, it is not possible to attribute the effect of the program solely to private versus
public vocational education since different sets of people apply to (or are accepted to) different
types of programs. In our project, we explicitly evaluate the impact of public and private
vocational education courses using randomized evaluation methods.
Card et al. (2011) show that a Dominican Republic job-training program had a significant
positive impact on individuals’ hourly wages and on the probability of health insurance coverage
(conditional on employment), although overall effects were moderate. The authors uncover
heterogeneous returns to vocational training for those with different levels of educational
achievement, across urban and rural areas, and age. Attanasio et al. (2012) evaluate the returns to
vocational training in Colombia through a randomized intervention. They find returns to
vocational education on the order of 8–18% in earnings, with especially high returns for girls. A
recent paper by Maitra and Mani (2013) finds significant improvements in the labor market
outcomes for women who participated in a NGO implemented tailoring course in the slums of
New Delhi in India.
Few rigorous impact evaluation studies of vocational education have been conducted in
Africa, the world’s poorest region and one where the youth unemployment problem is
4
particularly severe. In fact, we are aware of only two other vocational training RCTs conducted
in Africa – one focusing on providing training for Ugandan women to run small businesses
(Bandiera et al., 2012), and one to provide apprenticeships to youth in Malawi (Cho et al, 2013).
A recent RCT by Blattman et al (2013) finds that a program that provides cash grants to youth
groups to fund businesses and/or training had large economic returns. However, it is difficult to
isolate the returns of training from the returns to capital in their program. A key difference with
these related papers is that the training is generally provided by specially sourced trainers who
are often specifically trained by the implementing organization to deliver a particular curriculum.
In contrast, our program works with existing formalized vocational training schools that follow
standard national vocational curriculum.
Additional evidence on what works in vocational education delivery will be critical for
good public policy in the education sector, and will inform the decisions of governments and
NGOs throughout the region, including in our study country of Kenya, as they consider
expanding programs to improve youth labor market skills. This project seeks to illuminate the
factors that drive the demand for (public and private) vocational education in Kenya using an
innovative randomized voucher delivery mechanism and information campaign. With several
less developed countries currently expanding and investing in their vocational education sectors,
the results of this intervention will provide timely and comprehensive evidence to policymakers
seeking to increase the demand for vocational education.
The present analysis focuses on program take up, the demand for vocational education
and the impact of the information intervention; voucher recipient institution and course selection,
participant attendance, and training center characteristics, in addition to the short-term labor
market impacts for approximately half of program participants. Subsequent research will
examine the longer-term labor market returns of vocational education in the full sample (and for
individuals with different baseline characteristics), as well as the relative effectiveness of public
versus private institutions and institutions of varying quality more broadly. Together, the results
of these studies will enable the Government of Kenya, the World Bank and other policymakers
in the region to more effectively design youth skills training and employment programs in order
to promote economic development via human capital formation.
5
2. Vocational Education in Kenya
There are many vocational training institutions in existence in Kenya. A formal youth
polytechnic system was established in the 1960s, and continues to be subsidized under the
purview of the Ministry of Youth and Sports (MOYAS; King and Martin, 2002). These training
institutions range from relatively basic village polytechnics offering traditional trades such as
skilled construction (e.g., masonry, carpentry, plumbing), automotive mechanics and tailoring, to
larger polytechnics in towns offering a wider array of courses and complementary skills training
in entrepreneurship education (e.g., accounting). Parallel to the youth polytechnic system, the
Ministry of Education (MOE) also operates a system of technical training institutes, prestigious
institutions offering both industrial education and commercial courses in business, computers
and secretarial skills. These public institutions typically provide two-year training courses, with
total course tuition ranging from US$300-500 (with a mean of approximately US$350 among
institutions in our primary study area in rural western Kenya).
An alternative to the public model is present in the dynamic but understudied private
vocational training sector, which could also play an important role in building youth skills in
Kenya (as well as in other low income countries). Kenya’s private vocational education sector
has grown markedly in recent years. Ministry of Education statistics show that the number of
private institutions grew by 16% between 2004 and 2007 (while public institutions grew by 6%).
Under the umbrella of private institutions are a wide variety of institutional structures, including
private technical colleges, small centers specializing in a single skill (e.g. hairdressing), and
small businesses in which training resembles apprenticeships. Within the primary region of focus
for the present research (western Kenya), private institutions offer courses ranging from a few
months to two years. Course offerings at these institutions are usually narrower in scope than
their public-sector counterparts, but allow students to specialize in specific skills – for example, a
particular computer software package. The price of a course varies significantly, but typically is
between US$150-500 (with a mean of less than US$300 among institutions in our study area).
Thus, private institutions offer a substantially different training experience than public training
centers. Allowing individuals the opportunity to select the course that best fits their needs,
whether public or private, may further boost the effectiveness of vocational training by leading to
more efficient student-course matches – a possibility we will continue to study in future research.
6
3. Description of the Intervention
3.1 Intervention Design The TVVP is a randomized evaluation of a youth vocational education intervention in (primarily
western) Kenya. Approximately 2,160 out-of-school Kenyan youths (18 to 30 years old) applied
for vocational education tuition vouchers, and a randomly selected half were awarded vouchers.
The vouchers were worth approximately US$460, an amount sufficient to fully (or almost fully)
cover the tuition costs for most private vocational education programs and government-run rural
village polytechnics or technical training institutes.
These youth were drawn from a pool of individuals participating in a unique and high-
quality longitudinal (panel) dataset the authors have been collecting in this region since 1998,
known as the Kenyan Life Panel Survey (KLPS). The KLPS sample was chosen as a
representative subset of individuals who attended primary school in the former Busia District, a
region of rural western Kenya. Primary schools in this district participated in one of two
development programs – either a deworming program launched in 1998 (the Primary School
Deworming Program or PSDP; Miguel and Kremer, 2004), or a girls’ merit scholarship program
that began in 2001 (the Girls’ Scholarship Program or GSP; Kremer et al., 2009). The KLPS data
contains detailed educational, health, nutritional, labor market, demographic and cognitive
information for thousands of Kenyan adolescents from 1998 to 2009. The existence of detailed
information on these and other life outcomes (such as cognitive ability and orphan status) in the
KLPS data will strengthen the ultimate evaluation of the TVVP and enhance the external value
of the evidence generated by allowing us to estimate heterogeneous program impacts for
different types of individuals and training centers.
The entire KLPS sample of 10,767 individuals was invited to an informational session on
the TVVP in late 2008.1 Participants were recruited from the KLPS sample through local leaders.
A total of 2,705 individuals attended one of the 70 preliminary information meetings held in sub-
locations where the original deworming and scholarship programs took place as well as in the
cities of Nairobi, Mombasa and Kisumu where many of them had since moved.2 During this first
1 In many cases we cannot confirm whether an individual received our invitation, but an attempt was made to invite the entire KLPS sample. 2 Sub-locations are local administrative units that vary in size, but generally contain a handful of primary schools and can usually be traversed on foot in a few hours (thus, meetings were within walking distance of most participants).
7
informational meeting, short surveys were administered to all applicants to collect information
on their beliefs about expected earnings with and without vocational education, for both the
respondent individually and for “other people in his/her community”. Students were then given a
detailed list (compiled by TVVP staff) of local vocational training centers and selected
participating vocational training centers in urban areas outside of western Kenya, including in
large cities such as Nairobi, Mombasa and Kisumu.3 Each training center description detailed the
location, contact information of the manager or principal, courses offered, academic
requirements (if any), and course duration. Meeting participants were also informed that they
could apply to a training center not found on this list, as long as the center met program
participation requirements.
Students were instructed to return to a second program meeting at the same location two
weeks later with a valid letter of support from a local authority (e.g., chief) or training center,
and be prepared to state their preferred schools and courses should they be awarded an
unrestricted (public or private institution) voucher or a public-only voucher (these interventions
are described below). Students who attended the second meeting, brought a letter of support and
had valid preferences for both unrestricted and public-only voucher types were included in the
final sample of 2,163 individuals.4 This application procedure was designed to ensure a genuine
interest in vocational education among applicants, making them a highly policy relevant sample:
those Kenyan youths likely to enroll in vocational education should further training subsidies
become available.
Voucher winners were then randomly selected from this final pool of applicants using a
computer random number generator (in the STATA statistical program). Among the voucher
winners, a random half received vouchers that can be used only in government supported public
vocational training institutes, while the other half received unrestricted vouchers that could be
3 This list was compiled in two parts. First, names of public institutions were sought from local government offices. We included all public institutions (affiliated with either the MOYAS or the MOE) located in the heart of our study area (the current districts of Busia, Bunyala and Samia). In addition, we included many public institutions in the nearby districts of Bungoma East, Bungoma South, Kakamega North, Mumias, and Siaya, as well as a handful of institutions in the cities of Kisumu, Mombasa and Nairobi. Second, we utilized data from the (then) most recent round of the KLPS in addition to surveys at local market centers to identify a range of private vocational training institutions. This process is described in further detail in section 3.3. 4 Individuals who missed the first informational meeting but wanted to participate in the program were allowed to do so by attending the second meeting in another sub-location or in Nairobi or Mombasa, or by visiting the implementing agency’s offices in Busia Town. Project staff attempted to retain the information intervention (described below) treatment assignment of individuals by giving a short individual information presentation to those individuals who were originally assigned to a treatment sub-location.
8
used in either public centers or in the growing private training sector. Of the final sample of
2,163, 526 individuals were assigned unrestricted vouchers and 529 were randomly assigned
vouchers only for use at government institutions. The remaining 1,108 serve as the control
group.
The voucher winners were informed which type of voucher they were eligible for and
were subsequently provided the opportunity to apply to the vocational education institution of
their choosing. The allocation of vouchers was made among those preferring to apply to the same
institution; in other words, if 20 sample individuals preferred to apply to a certain vocational
training center, five were randomly chosen to receive the public voucher, five were randomly
chosen to receive the unrestricted voucher, and the remaining ten were allocated to the control
group. This stratification was made to ensure balance across the treatment and control groups in
important applicant characteristics, and to improve the precision of treatment effect estimates. In
principle, this research design will also help us study which precise institutional characteristics
have the greatest impact on future labor market returns. Randomization for the voucher treatment
assignment was also stratified by gender, assignment to the information intervention (described
below), participation in one of the two original NGO primary school programs from which the
sample is drawn, and preferred course (which was aggregated into broad occupation groups by
course type), thereby ensuring balance across the treatment and control groups along those
categories as well. The randomization process is summarized in Figure 1, while Figure 2
summarizes the voucher design.
Further, the project included an information intervention, implemented with a cross-
cutting factorial design, such that a random subset of both the voucher and control groups
received the intervention. This intervention allows us to estimate the role that information on
labor market returns plays in demand for vocational schooling in Kenya. During the first
meeting, a randomly selected half of all program enrollment meetings held at the sub-location
level were exposed to information about the estimated Mincerian returns to vocational education,
using (cross-sectional) information from existing KLPS data.5 The information was presented
5 For program enrollment meetings in the original KLPS sub-locations of Busia and surrounding districts, information treatment group assignment was performed at the sub-location level after first stratifying by division (an administrative unit containing 5-15 sub-locations). Out of 70 meetings, 35 were randomly selected to receive the information treatment. This information was most economically presented at a meeting-level (as opposed to thousands of one-on-one explanations of the information); so, the sub-location meeting was the relevant unit in our randomization. For the meetings held in Nairobi and Mombasa, randomization into information treatment and
9
and explained in detail by project staff. Figure 3 presents the handouts and posters used in these
information sessions.6 One noteworthy component of the intervention highlighted the large
discrepancy between expected earnings for graduates of traditionally male-dominated trades
(e.g., mechanic) versus traditionally female-dominated trades (e.g., seamstress) and used this
information, as well as more subjective methods – including presentation of a video about
successful female car mechanics in Kenya – to encourage young women to enroll in more
lucrative male-dominated trades. Analysis of how this intervention affected individual decisions
is presented below.
The randomized design in both voucher allocation and the information intervention
addresses leading concerns about selection bias in estimating the demand for, and the returns to,
schooling. For instance, the classic concern in estimating returns to schooling is that higher
ability individuals are more likely to obtain additional schooling, leading researchers to overstate
returns to schooling. Randomizing voucher offers across individuals, and randomizing
information across TVVP recruitment meetings, eliminates most relevant selection bias
concerns. We can thus more confidently attribute statistically significant differences in demand
for education and labor market gains to the project interventions.
3.2 Training Center Eligibility One remarkable facet of this project is the variety of course and institution types available to
program participants. The TVVP targeted all the major government Village Polytechnics and
Technical Training Institutes in the home study area of Busia District, as well as a large cross-
section of available private institutions in the area. In general private institutions were eligible to
be included in our sample if they had one or more trainees at the time of program recruitment or
had offered courses in the prior year, and if their fee structure feel within our voucher limits. Due
to the large number and wide range of institutional types in the private vocational schooling
sector, the list of potential participating vocational training centers was necessarily far from
exhaustive. The most comprehensive list of potential participating institutions was in the primary control groups was done at the individual level (and no information intervention was performed for the meetings held in Kisumu). Accordingly the analysis presented below clusters regression disturbance terms at the sub-location level. 6 Presenters also attempted to describe the issue of possible selection bias in this cross-section analysis with the following phrase: “You should be aware that the information displayed is from people who were able to pay for their own vocational schooling. In that sense these people may be different from you and they may have benefitted more (or less) from their training program than you would.”
10
target area and original home of all of our participants (Busia, Bunyala and Samia Districts). In
these areas all formalized private vocational training centers were included. These include for-
profit computer training schools and church or NGO-run training centers. Further a variety of
privately run for-profit businesses that regularly take students for six month to two year
“apprentice-style” training programs were included. These were vetted for legitimacy and
formality – shops where space, tools, work and theoretical training were clearly available and
where students had been taken many times before were included while those perhaps less
equipped to handle a semi-formal training program were excluded. In the rest of western Kenya
as well as the cities of Kisumu, Nairobi and Mombasa where some of our sample resided, the
program focused primarily on institutions of relatively greater sophistication that more closely
resembled public institutions.
Finally, all private institutions were vetted for fit with the TVVP. Institutions with costs,
program lengths and course types that were largely outside the program plans or far different
from similar public options were excluded. In some cases students inquired about the possibility
of enrolling in a particular institution. If the institution met our criteria then we included it in
program. In a few cases, institutions were not willing to work with us so we couldn’t include
them in the program.
Government training institutions under the purview of the MOYAS range from relatively
basic village polytechnics, offering traditional self-employment focused industrial trades in
skilled construction (masonry, carpentry, plumbing, etc.), automotive mechanics and tailoring, to
larger polytechnics in town offering a wider array of courses and complementary skills training
in entrepreneurship education (e.g., accounting) and even mathematics. Also included in the
partner government institutions are Technical Training Institutes under the Ministry of
Education, which offer both industrial education and certain commercial courses in business,
computers and secretarial skills.
As evidence of the diversity and versatility of the private vocational training sector in
Kenya, the type, length and structure of the private institutions and courses in our sample also
vary widely. Some institutions run by private entrepreneurs, NGOs or church groups mirror the
industrial training structure of the government-run polytechnic system. Others offer short
training courses in a particular skill-set like computers or driving. Still others function as
businesses and training centers in one, teaching hairdressing, tailoring or some other trade
11
through something akin to an apprenticeship. The private vocational training sector is arguably
more adept at accommodating the needs of a larger variety of students, with courses as short as
one month well-suited to those already in the work force or supporting their families, to the
longer service-based courses desirable to recent secondary school leavers.
Like the institution and course types, fees vary widely across the courses available to
participants in this program. For courses included in the original list distributed at recruitment
meetings, the TVVP covers all mandatory fees including uniform and registration fees. To
accommodate the training needs of secondary school leavers and at the request of some voucher
winners, the program also allowed students to enroll in more academic technical training
diploma courses (e.g., in computer training) and to cover fees up to the level of the average two
year industrial course, or 35,000 Kenyan Shillings (about US$460).
3.3 Characteristics of Vocational Institutions We administered a set of surveys to vocational training institution administrators and teachers to
collect detailed information on potentially important institution-level characteristics. In
particular, these surveys gathered information on school equipment and facilities, classrooms,
and teacher characteristics, as well as course curricula.
The data suggests that most, but not all, schools offer (mandatory) entrepreneurship
programs, others offer mandatory remedial subjects such as Mathematics and English, and others
encourage their trainees to sit in on some training in closely related fields (e.g., encouraging
plumbers to learn basic welding skills). We further note a few key differences in the educational
and labor market characteristics of teachers in public and private institutions. We find that 92
percent of teachers at public institutions had taken the secondary school exit examination
compared to only 68 percent in private schools. In addition 64 percent of teachers at public
schools had completed college compared to 42 percent in private schools. Both these differences
in teacher education were statistically significant. Public school instructors had close to 4 more
years of teaching experience than private school instructors (approximately a 50% increase and a
statistically significant difference). We do not observe any significant differences in the practical
work experience of teachers in public versus private schools. It should be noted, however, that a
potential weakness of this is survey data is that it does not capture differences in the timing of the
teacher experience in great detail. With rapid technological change, recent practical experience in
12
industry may be a particularly salient dimension of teacher quality, and one which may enhance
the labor market relevance of the training program.
We further explore differences in infrastructure and instructional equipment across
different types of institutions. Overall, we find that private institutions were more likely to have
flush toilets than public schools. We also find that public and private schools were equally likely
to have electricity. If we examine the differences between informal private institutions and
formal private school, we see that formal private schools were more likely to have electricity and
flush toilets and these differences were statistically significant.
We also explore differences in pedagogy between different institutions. Surprisingly,
teachers in public schools devote a greater share of classroom time to practical work, while
teachers in private schools focus relatively more on theory. Consistent with our priors, we find
that formal private institutions spend relatively more time on theory than their informal
counterparts.
Practical experience is extremely important in enabling students to acquire relevant and
employable skills. Overall we do not find any differences in the propensity of vocational training
institutions to organize attachments (or internships). Both private and public schools were
equally likely to organize attachments, as were formal private institutions compared to informal
institutions. However, we do see that public institution courses are more likely to require an
internship or attachment as part of the coursework compared to private schools. Similarly, formal
private institutions were more likely to offer courses that required internships. This finding
probably reflects the differences in course offerings across the different types of institutions,
rather than a systematic difference in policy across them. However, we do find that private
schools were significantly more likely to assist students with job placement compared to their
public counterparts. This placement assistance could have significant implications for successful
employment outcomes, however the efficacy of such programs is currently unknown.
4. Data We utilize three sources of data in this paper. We use the short baseline surveys that were
administered at the recruitment meetings prior to the training period. This baseline data is
supplemented by data from Round 2 of the Kenya Life Panel Survey (KLPS), which was
13
collected between 2007 and 2009.7 Overall, 2705 attended the first recruitment meeting and
2,163 completed the application process (including attending a second meeting) and were
included in the final sample. We collected a short follow up survey to capture information on
take-up of vocational education and also to update contact information of individuals in our
sample. For individuals in training institutions these were conducted during monitoring visits. By
mid-2010, we were able to obtain this basic follow-up information for 91% of the control (non-
voucher winner) sample. We obtain our outcome measures from Round 3 of the KLPS data
(KLPS-3), which was launched in August 2011. The full KLPS sample was randomly divided
into two halves, each designed to be representative of the whole, to be tracked in two separate
“waves” of data collection during the round.8 Wave 1 data collection ended in December 2012,
at which point survey information had been collected for roughly half of the TVVP sample
(1,009 individuals). The tracking rate among TVVP individuals included in Wave 1 data
collection was 87.1%, an extremely high rate for a longitudinal survey endeavor in rural sub-
Saharan Africa. Crucially, there was no significant difference in tracking rates across the voucher
treatment and control groups.
In what follows, we present preliminary impacts of the TVVP. These results are
preliminary for two reasons. First, at present we utilize the Wave 1 data only, which represents
approximately half of the TVVP sample. We intend to update this analysis when KLPS-3 Wave
2 data collection ends in mid-2014 in order to explore full-sample results. Furthermore, it should
be noted that TVVP voucher winners who attended vocational training completed their courses
sometime between mid-2009 and early 2011. Thus, some individuals had only been out of
training for a matter of a few months at the time data collection was launched, making the study
of medium term impacts at this time necessarily tentative.
4.1 Characteristics of Participating Individuals Table 1 summarizes the descriptive statistics of the sample prior to TVVP launch. The first thing
to note from this table is that the voucher randomization procedure was successful at creating
similar treatment and control groups. The treatment and control groups were well balanced along
7 See Section 3.1 for a thorough description of the KLPS project. 8 Data collection was designed in this way in order to allow for improvements to the survey and tracking methodologies between waves.
14
most observable dimensions (among all observables presented, only two show differences
statistically significant at the 10% or higher level). This allows us to confidently interpret the
differences between treatment and control outcomes as the causal effect of the vocational
training voucher program.
Column (1) of Table 1 provides a description of the overall sample – a valuable depiction
of individuals interested in receiving vocational training. Of the 2,163 individuals included in the
TVVP, 63% are female. The sample consists of more girls than boys mainly because one of the
two school-based NGO programs from which the KLPS sample was originally drawn (the Girls’
Scholarship Program) targeted only girls.9 Because of the relative size difference between these
two different programs, 70% of TVVP applicants were previously involved in the PSDP, while
only 30% were previously involved in the GSP (results not shown). The mean age at recruitment
in 2008 was 22 years and sampled students ranged in age from 18 to 30.
At the time of project recruitment meetings, most participants lived in Busia District (the
main study district of the PSDP and GSP projects in rural western Kenya), with roughly 30%
living outside of the district and 6% in large cities. This distribution makes sense, especially
given that invitations to recruitment meetings were spread with the assistance of local area
leaders throughout Busia District.
Average academic schooling attainment of individuals in the sample prior to the start of
the program was 8.8 years, but there is a wide range in attainment: 27% of the sample dropped
out before grade 8, 38% terminated schooling upon graduating from primary school, 11% of
individuals attended some secondary school, and 24% completed secondary school. It is telling
that nearly two-thirds of individuals seeking vocational training had received up to a primary
school education. Fewer than 3% were in school at the time of program launch. On average,
program participants had been out of school for nearly 4 years at the launch of the TVVP.
Approximately 13% of the sample had previously been employed. Of these, 30% were
already working in a field in which the project affiliate training centers offer skills training, such
as tailoring, hairdressing, skilled construction or computer services. Other common jobs include
fishing (about 18% of those working) and informal hawking/sales (about 8% of those working). 9As noted previously, the KLPS sample was drawn from the pupil samples for the Primary School Deworming Project (PSDP), a school-based deworming program carried out from 1998-2002 and the Girls Scholarship Program (GSP), a merit-based cash award program for the top performing female grade 6 students carried out in 2001-2002. The programs did not have overlapping samples, as the PSDP was carried out in Budalangi and Funyula divisions of the former Busia District and GSP was carried out in Township, Matayos, Butula and Nambale divisions.
15
The mean monthly salary for respondents who were employed was roughly 1,700 Kenyan
Shillings, or just over US$20.
The vocational training voucher program was designed to be open to students who had
already received some vocational training but wanted to further their skills. Nearly 22% of the
sample had already received some training, primarily through apprenticeships and other informal
training at small private enterprises rather than at the larger public centers.10
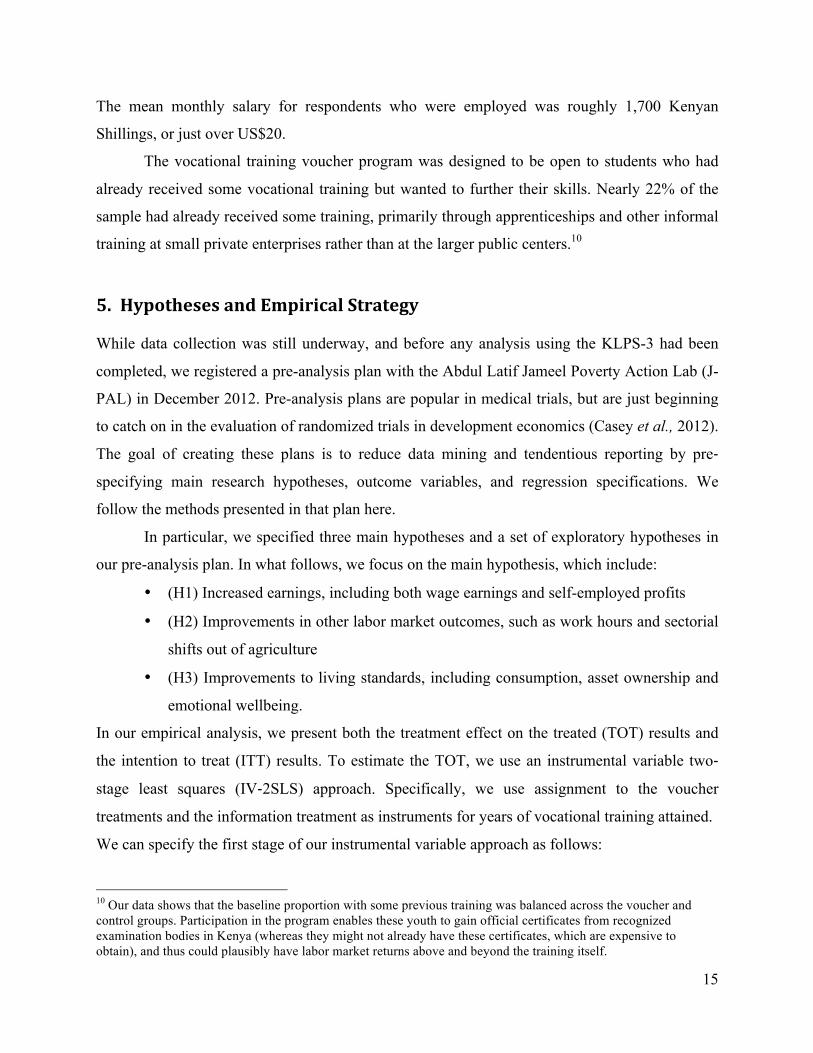
5. Hypotheses and Empirical Strategy
While data collection was still underway, and before any analysis using the KLPS-3 had been
completed, we registered a pre-analysis plan with the Abdul Latif Jameel Poverty Action Lab (J-
PAL) in December 2012. Pre-analysis plans are popular in medical trials, but are just beginning
to catch on in the evaluation of randomized trials in development economics (Casey et al., 2012).
The goal of creating these plans is to reduce data mining and tendentious reporting by pre-‐
specifying main research hypotheses, outcome variables, and regression specifications. We
follow the methods presented in that plan here.
In particular, we specified three main hypotheses and a set of exploratory hypotheses in
our pre-analysis plan. In what follows, we focus on the main hypothesis, which include:
• (H1) Increased earnings, including both wage earnings and self-employed profits
• (H2) Improvements in other labor market outcomes, such as work hours and sectorial
shifts out of agriculture
• (H3) Improvements to living standards, including consumption, asset ownership and
emotional wellbeing.
In our empirical analysis, we present both the treatment effect on the treated (TOT) results and
the intention to treat (ITT) results. To estimate the TOT, we use an instrumental variable two-‐
stage least squares (IV-‐2SLS) approach. Specifically, we use assignment to the voucher
treatments and the information treatment as instruments for years of vocational training attained.
We can specify the first stage of our instrumental variable approach as follows:
10 Our data shows that the baseline proportion with some previous training was balanced across the voucher and control groups. Participation in the program enables these youth to gain official certificates from recognized examination bodies in Kenya (whereas they might not already have these certificates, which are expensive to obtain), and thus could plausibly have labor market returns above and beyond the training itself.
16
𝑉𝑜𝑐𝐸𝑑! = 𝛼! + 𝛼! ∗ 𝐴𝑛𝑦𝑉𝑜𝑢𝑐ℎ𝑒𝑟! + 𝛼! ∗ 𝑈𝑉𝑜𝑢𝑐ℎ𝑒𝑟! + 𝛼! ∗ 𝐼𝑛𝑓𝑜𝑇𝑟𝑒𝑎𝑡! + 𝛼! ∗
(𝐴𝑛𝑦𝑉𝑜𝑢𝑐ℎ𝑒𝑟! ×𝐼𝑛𝑓𝑜𝑇𝑟𝑒𝑎𝑡!)+ 𝛼! ∗ (𝑈𝑉𝑜𝑢𝑐ℎ𝑒𝑟! ×𝐼𝑛𝑓𝑜𝑇𝑟𝑒𝑎𝑡!)+𝑊!!𝛾 + η! (1)
where 𝑉𝑜𝑐𝐸𝑑! is the measure of individual vocational education (i.e., years of training
completed, as above), InfoTreat is an indicator for receiving information about the potential
labor market returns to vocational education and 𝑊! is a vector of covariates. AnyVoucher and
UVoucher are indicators for winning any type of voucher and winning an unrestricted (public or
private) voucher respectively. Following Bruhn and McKenzie (2009), W contains the vector X
of characteristics used for stratification during the randomization, namely: the individual’s
original project participation (in PSDP or GSP), their gender, and their preferred training course.
Course preference consists of six indicator variables for the major occupational groups, namely,
(i) construction and related trades, (ii) textiles and tailoring, (iii) mechanics and driving, (iv)
beauty, (v) computers/secretarial/business, and (vi) other. (As is standard, the “(vi) other”
category indicator will be excluded from the regression to avoid collinearity issues.) W also
contains the following additional individual characteristics: age (in 2008), school attainment (by
2008, baseline), an indicator for any prior enrollment in vocational education (at baseline), stated
preference for a public versus a private training institution (at baseline), distance to closest
vocational education institution11, distance to closest private vocational education institution, and
11 We have not yet constructed these “distance to vocational education institution” variables. We plan to choose the functional form of these variables based on their predictive power in the first stage regression. Possible functional forms, beyond this simple linear functional form mentioned here, including higher order polynomials of distance, or indicator variables for the presence of an institution within a certain distance. We are also investigating the feasibility in our data of constructing these distances from the respondent’s home; if this is not feasible (due to missing residential GPS data), we will likely instead use the distance from the centroid of their sublocation of residence. A further issue pertains to the GPS location for vocational training institutions. We have very extensive data on these locations within Busia County but limited data for Nairobi, Kisumu, and several other locations where our subjects live. There thus are likely to be a non-trivial number of respondents with missing distance information. We will
17
indicators for treatment status in the earlier PSDP and GSP programs. We can then specify our
second stage as follows:
𝑦! = 𝛽! + 𝛽! ∗ 𝑉𝑜𝑐𝐸𝑑! +𝑊!′𝜑 + ε! (2)
where we instrument for VocEd using the first stage specified in equation (1). Assignment to
voucher treatment must satisfy several conditions to be a valid instrument for vocational training,
including the exogeneity and the relevance of the instrument. Exogeneity is satisfied by the
“successful” randomization of subjects into the treatment and control groups, in terms of balance
along observable characteristics, which we demonstrated in Table 1. Regarding “relevance”,
there are a number of compelling reasons to believe that a vocational education tuition voucher
should increase enrollment. Most obviously, eliminating or dramatically reducing the cost of
vocational education will increase demand through price effects. Subsidies may ease credit
constraints that prevent enrollment or lead to dropout prior to completion; enable youth to enroll
in higher quality institutions, including those that offer preparation for official certification
exams (note that the payment of certification exam fees was typically covered by the TVVP
program); and allow students to spend more time studying, rather than working to cover their
tuition payments. The TOT might differ from the intention-‐to-‐treat (ITT) effect because the
TVVP experiment did not have perfect compliance: in preliminary analysis, we found that 26%
of individuals offered a voucher did not take it up, and roughly 4% of individuals in the control
group completed some vocational training. Thus, we also present reduced-‐form estimates (i.e.,
differences between those who were offered a voucher and those who were not), which is
equivalent to the ITT estimate.
5. Technical and Vocational Vouchers Program Results
5.1 Baseline School and Course Preferences
likely include an additional indicator variable for “missing distance data” into the vector W (and set the distance measures to the average for individuals with missing data). If these data constraints mean that it is ultimately not possible to construct a reasonable measure of distance from respondents’ residence to vocational training institutions, then we will exclude these distance variables from the vector W entirely.
18
In TVVP recruitment meetings (after the information intervention but prior to the voucher
lottery), surveys were undertaken to elicit information on the preferences of each participant
under the two voucher treatment scenarios (i.e., if he/she were to receive an unrestricted voucher
or a public-only voucher). We collected information on preferred training center and course, as
well as the reasons for choosing this combination. Overall, applicants showed a moderate
preference for public training centers (56% preferred public, 44% preferred private) as their first
choice. Such preferences did not vary at statistically significant levels across gender, level of
education completed, or by previous vocational training. However, individuals at or below
median age (21 years old) were more likely to prefer public institutions than their older peers
(59% versus 53%), and those who had been out of school 3 years or less were more likely to
prefer public institutions than those who had been out of school longer (58% versus 54%).
Previous participants of the GSP were much more likely than those of the PSDP to prefer public
institutions (66% to 52%). Individuals living in or near Busia District (thus, primarily in rural
areas) at the time of program meetings were substantially more likely to prefer a public training
institution than those living outside of Busia (56% to 47%, respectively). Furthermore, those
living in a city were much more likely to prefer a private institution (56% of city dwellers
preferred private, versus only 43% of non-city dwellers).
In terms of industry of the course preferred, the largest number of participants hoped to
attend training for either tailoring/dressmaking (33%) or driving/mechanic (25%). Other popular
broad occupation groups include hairdressing (13%), skilled construction (12%) and
computer/secretarial work (10%). Table 2 summarizes the breakdown of broad occupation of
interest for various subgroups of TVVP participants. The demand for tailoring/dressmaking,
beauty and computer/secretarial courses is driven primarily by females, while the demand for
vehicle-related and skilled construction courses is driven by males.12 The distribution of course
preferences is fairly similar across individuals aged above and below the median, and across
location of residence. In terms of education level attained, preferences are similar for those who
attained less than a secondary degree, while those with a secondary degree are much more likely
to apply for a program in computer/secretarial services. There do not appear to be substantial
12 There also appear to be some differences in the distribution of preferences between individuals previously participating in the PSDP and individuals previously participating in the GSP, though this is likely due to the gender component of the scholarship intervention (and indeed, preferences of former GSP participants closely mirror those of women in the sample as a whole; results not shown).
19
differences in terms of years since last in school, whether the individual has previously attended
any vocational training, or whether or not they are currently working.
5.2 Program Take-‐up Program take-up rates illustrate strong participant interest in the TVVP. Of the 1,055 individuals
offered a voucher, 781 youth (74%) attended a training program for at least one term since
program launch in early 2009. Perhaps surprisingly, there are no statistically significant
differences in take-up across gender, age group (above and at/below median age), years since last
in school (above or at/below median), or previous vocational training, although voucher winners
who reported being employed at the time of the TVVP informational meetings were less likely to
use their voucher (by 4.5 percentage points, s.e. 2.6; results not shown).
There are, however, statistically significant differences in the take-up rate between
individuals who were awarded the restricted (government only) vouchers and those who were
awarded unrestricted vouchers. Specifically, 79% of unrestricted voucher recipients attended
vocational training at some point after January 2009 while only 69% of public-only recipients
attended for at least one term. Furthermore, the finding that individuals employed at the start of
the TVVP were less likely to take-up is driven by those who received restricted vouchers (results
not shown). This is sensible since any expansion in training options should be associated with
higher take-up, by leading to the possibility of better trainee-institution matches.
Within their institutions of choice, individuals enrolled in a range of different courses.
The majority (78%) of voucher winners chose courses that lasted 2 years or more (at least 6
school terms), while roughly 20% of voucher winners chose courses that lasted at most 1 year.
Table 3 shows the overall course selection by voucher winners. The most popular courses by
enrollment among voucher winners were Tailoring (39%), Motor Vehicle Mechanic (20%),
Hairdressing and Beauty (9%), Driving (7%) and Masonry (7%). The most popular courses for
male voucher winners were Motor Vehicle Mechanic (40%), Driving (17%) and Masonry (16%),
while the most popular courses for females were Tailoring (59%), Hairdressing and Beauty
(14%) and Secretarial and Computing (5%).
The project received an official decline of interest from 46 treatment students (4% of
those awarded a voucher). Of those who gave a specific reason, 23% had enrolled in an academic
college (including teachers’ colleges, academic technical colleges, and private diploma courses),
20
17% enrolled in a four-year university, 15% enrolled in secondary or advanced-level secondary
school in Kenya or Uganda, and 3% returned to primary school. Aside from academic schooling
options, 12% cited family care needs, 9% distance to available training centers, and 9% work
responsibilities. Only 6% expressed dissatisfaction with the courses on offer, as expected since
this is a sample of individuals that had shown genuine initial interest in vocational education by
attending TVVP recruitment meetings in the first place.
Fewer than 4% of the control group sample, or 41 individuals, were reported to have
enrolled in some type of vocational schooling. Of these, just over one-third enrolled in
institutions participating in the TVVP, while the remaining individuals enrolled in
apprenticeship-type training with smaller private enterprises. Approximately 2% of the control
group was attending a secondary school or other academic institution, 19% were working and the
remaining 67% for whom we have data were “farming” (which typically means performing
subsistence agriculture for one’s own household) or “just at home”.
5.3 Educational Attainment We use the KLPS-3 Wave 1 data (described in more detail in Section 4.6 below) to examine the
impact of the TVVP on years of vocational education completed. While previous analysis
examined initial program take-up, we can compare the differences in educational attainment
across treatment and control groups. This analysis also serves as the first-stage in a standard
econometric model that estimates the Mincerian returns to (vocational) education (Equation 1).
The results are shown in Table 4. Individuals who were awarded a voucher completed 0.6
years more of vocational education than their counterparts in the control group. As control group
individuals attained 0.36 years of vocational education, these estimates suggest that the vouchers
led to a 166% increase in vocational educational attainment. This strong statistically significant
effect of the vouchers on vocational educational attainment suggests that the price of vocational
training, possibly coupled with credit constraints, are a major impediment to vocational
education access.
While our previous analysis of the differences between restricted and unrestricted
vouchers suggested that take up rates were higher among individuals with unrestricted vouchers,
the results in Table 4 are seemingly inconsistent with these earlier findings. Although statistically
insignificant, the estimates suggest that unrestricted voucher winners acquired less years of
21
education relative to those who were restricted to public institutions. This pattern is driven in part
by the diversity of courses offered by private institutions in terms of both content and duration of
course. As public institutions typically offered longer courses, the differences in the estimates
are driven in part by the course length that individuals had access to.
5.4 The Information Intervention and the Demand for Vocational Training As described above, females and males in the sample listed quite disparate course preferences,
conforming to traditional gender patterns in Kenya. Men expressed their preference for male-
dominated courses such as motor vehicle mechanics or driving, while women expressed their
preference for traditionally female-dominated courses such as tailoring or hairdressing. Only 9%
of women preferred a male-dominated course while 3% of men preferred a female-dominated
course (mainly tailoring).
Our data revealed the large information gaps that existed in the sample at the start of the
program. On average both men and women appear to have had somewhat optimistic perceptions
about the returns to vocational training: they believed that the average returns were 61%
compared to an estimated Mincerian return (using the KLPS data) of 37%.13 Sample individuals
were also mistaken about the highest earning trades. Individuals believed tailoring and
mechanics were the highest earning trades for women and men respectively. However, our data
showed that the most lucrative trades were actually hairdressing for women and tailoring for
men. Given these apparent baseline misperceptions about returns to vocational training, the
provision of additional information could potentially have had meaningful consequences on
individual educational choices.
Despite the information constraints, the estimates in Table 4 show that the information
treatment did not have a statistically significant effect on educational attainment. The negative
(but insignificant) coefficients on the information treatment variables suggest that the
information depressed the demand for education. Since individuals had overly optimistic
expectations of vocational training, this negative coefficient could reflect the effect of updated
beliefs on the demand for vocational training. We will explore these patterns in more depth upon
completion of KLPS Round 3 data collection.
13 One important caveat is that the Mincerian returns estimated from the KLPS data likely suffer from some selection bias, and thus are not always a reliable benchmark, as discussed in section 3.1 above.
22
To supplement this analysis we can examine the impact of the information treatment on
initial take-up decisions. According to Table 5, the information intervention did not significantly
affect individual decisions to apply to the TVVP (Column 1), nor did it affect enrollment for
voucher winners (Column 2). However, the intervention did have a significant impact on females
preferring and enrolling in male-dominated courses (Column 1, Tables 6 and 7). In fact, females
exposed to the information intervention were almost 9 percentage points more likely to express a
preference for a male-dominated course, and 5 percentage points more likely to actually enroll in
one. Younger and more educated females were especially likely to prefer for male-dominated
fields.
The information treatment also made respondents more likely to express a preference for
a government (public) training institution (Table 6, Column 2), perhaps in part because these
institutions’ industrial trade and construction courses are traditionally male-dominated. Males
and younger individuals also preferred government institutions, probably due to the increased
availability of courses such as motor vehicle mechanics in government schools relative to private
schools.
5.5 Distance and the Demand for Vocational Education Distance to school is often cited as a major barrier to educational enrollment and attainment. This
notion has been corroborated by research such as Duflo (2001), which showed that reducing the
distance to school through school construction led to increased schooling attainment in
Indonesia. On average approximately 23% of individuals were within three kilometers of either a
public or private vocational institution at baseline, while only 6% were within one kilometer of a
vocational school. We exploit the baseline variation in individual distance to vocational centers
to examine the interaction of distance, vouchers (or price) and information on the demand for
vocational training. This exercise will provide policymakers with a clearer understanding of the
role of distance in facilitating or impeding the demand for vocational training.
Our data shows that the median distance to nearest public school was approximately 5
kilometers, which was statistically indistinguishable from the median distance to the nearest
private school. While these distances were similar, those individuals with unrestricted vouchers
had access to both private and public schools, thereby increasing the schooling options (or
accessibility). Figure 2 shows that unrestricted voucher winners could attend approximately six
23
schools within a 10 kilometer radius compared to only two schools for public voucher winners.
This increased accessibility could partly explain the gap in take-up rates between vouchers types.
We formally explore the role of distance in the demand for vocational training in Table 8.
Overall the results show that voucher winners who were closer to private schools were more
likely to take up training compared to winners who were further away. As Column (4) shows,
this effect was mainly driven by the increased enrollment of unrestricted voucher winners who
were closer to private schools. These unrestricted vouchers winners individuals who were within
3 kilometers of a private school were 14 percentage points more likely to attend vocational
training compared to individuals who were further away. This effect is approximately one-fifth
the size of the estimated impact of an unrestricted voucher on enrollment. We do not observe
other statistically significant interactions between distance and vouchers or distance and
information. Overall these results suggest that physical and financial access to private schools
have strong and significant impacts on the enrollment decisions of individuals in the program.
This could partly reflect the increased course availability and flexibility available to those with
unrestricted vouchers (Figure 2), or a reflection of a better idiosyncratic match between students
and private schools.
5. 6 Analysis of Short Term Labor Market Impacts 5.6.1 Sector Shifts and Hours Worked
We examine the impact of the vouchers on the work sector and labor supply of individuals in our
sample. Overall we do not find evidence that the program increased the probability of
employment. Examining the extensive margin we do not find a significant increase in the
probability of “not being idle”. We also do not see a significant decrease in the probability of our
broad measure unemployment (which we define as working zero hours in self or wage
employment and looking for a job). Surprisingly we do not find any evidence that the program
led to a shift out of agriculture. Contrary to our expectations, we actually found a positive (but
insignificant) relationship in both the reduced form and the IV between the program and working
in agriculture. We also find suggestive evidence of shifts away from wage or self-employment,
perhaps into agriculture. While we do not find any program impacts on the probability of
undertaking household chores, we do find that the program led to a statistically significant
increase in the hours of chores (i.e. the intensive margin). We also do not see any significant

24
change in the labor supply of individuals in our sample. However, we find that the program led
to a decrease in the probability of full time employment.
5.6.2 Earnings
We examine the impact of the program on earnings in Table 10. Overall we find limited
evidence on program impacts on earnings. We find negative (but insignificant) relationships
between the program and earnings, both in the reduced form estimates and in the IV
specifications using years of vocational education as the independent variable of interest in Panel
A, B and D. These negative relationships could reflect the opportunity costs of training, where
the control group initially benefits from the extra potential (or actual) experience relative to the
treatment group who are just entering the labor market. Standard models of human capital would
predict that while the initial earnings differences between the treatment and control groups would
be small (or even negative), these earnings differences between the groups would grow over time
as the returns to education were realized. Since many individuals had just completed training at
the time of the survey, it is likely that the Wave 2 data and future rounds of KLPS data would
yield very different results. It is also likely that these results are driven by investment outlays that
have not realized returns. Since our sample had just completed training, they may have invested
in starting their businesses. This could temporarily reduce the profits that we measured but lead
to higher profits in the future.
Panel C examines the impact of the program on wage earnings. While we do not find a
statistically significant impact of the program on wage earnings for the full sample, we do find
that the program led to increases in wage earnings for individuals that worked for a wage (i.e.
individuals with positive wage earnings and positive hours in the wage work sector). Focusing
on the log wage specifications, our reduced form estimates show that the wages for individuals
assigned to treatment and worked in wage sector rose by between 26 to 29 log points (see Figure
4 for the changes in the distribution of wages). The corresponding IV estimates show that the
Mincerian rate of return was between 34 and 46 percent for an additional year of vocational
education, which is a very high rate of return.
5.6.3 Other Impacts
25
We examine the impact of the program on other impacts such as migration and consumption in
Table 11. Panel A displays the results on various consumption and well-being measures. We
collect simple well-being indicators such as number of meals and asset ownership for the whole
sample. However, we only collect information on consumption expenditures for a smaller
randomly chosen subset of our sample (146 out of our Wave 1 sample of approximately 1,000).
Overall, we do not find significant improvements in consumption or well-being due to the
program, although the coefficients are consistently positive (but insignificant). Panel B reports
the results from a broad measure of migration. Program beneficiaries may be more likely to
move to urban areas as they offer better labor market opportunities. While admittedly a course
measure of migration, we do not find any increase in the likelihood of urban residence as a result
of the program. Once again this result may be due to the timing of the KLPS-3 survey relative to
the completion of training. These migrations patterns could change in the future.
5.6.4 Job Search
We explore the impact of the program on the job search behavior between the treatment and
control groups in Table 12. We do not find any statistically significant differences in the
probability of looking for a job or in the job search intensity (in terms of hours) between the
treatment and control groups. In addition, when we examine the reasons for not searching for a
job (for those not searching), we do not see any significant differences with the exception of a
greater reported illness rate among voucher winners.
6. Discussion The evidence shown in this paper suggests that vouchers are a potentially effective way
of encouraging investment in vocational education in Kenya. The results show that individuals
who were awarded a voucher were able to acquire more vocational education, consistent with the
notion that fees and credit constrains limit educational investments in this environment. We
found no evidence of sectorial shifts away from agriculture, improvements in well-being and
migration due to the program. We also found limited evidence on earnings, where we only see
statistically significant increases in wages among wage earners.
There are two major limitations of our study thus far. First, as we have only completed
half the follow-up survey we do not currently have the statistical power to explore our full set of
26
hypotheses including the potential differences in the returns between private and public
schooling and other heterogeneity analyses. Using the initial enrollment data, we did observe that
individuals who were awarded an unrestricted voucher had higher take up rates compared to
those awarded a restricted (public institution only) voucher. These take up differences may be
driven by the greater ability of unrestricted voucher winners to find a program that better suits
their needs. Our data suggest that private institutions may provide more flexible and relevant
training, thus individuals who have access to them may be able to better customize their training
programs. We plan to fully explore these issues with the full KLPS-3 data. Second, the timing of
the KLPS-3 follow up was potentially too close to the completion of training. Since the returns to
education investments may not accrue in the short-run, our ability to document labor market
outcomes from the program may be limited. This will partly be remedied by the Wave 2 (second
half) of the KLPS-3 data. We also plan to conduct another long-run follow-up survey (KLPS-4)
in 2016/17.
The scarcity of start-up capital may also potentially dampen the ability of program
beneficiaries to reap the benefits of their training. Our data show that 75 percent of those not in
self-employment report that the lack of capital is the main impediment to them starting a
business. The complementarity between human and financial capital may be one reason for the
dramatic program effects found in Blattman et al (2013). We will explore this possibility in more
detail in future work by overlaying a start-up capital grant intervention on top of this current
program.
7. References Adams, Arvil V. June 2001. “Assessment of the Jua Kali Pilot Voucher Program.” World Bank,
Washington, D.C. Angrist, Joshua, Guido Imbens and Don Ruben (1996). "Identification of Causal Effects Using
Instrumental Variables." Journal of the American Statistical Association, 91(434), 444-455. Angrist, Joshua, Eric Bettinger, and Michael Kremer (2006). “Long-Term Consequences of
Secondary School Vouchers: Evidence from Administrative Records in Colombia.” American Economic Review, 96(3), 847-862.
Angrist, Joshua, Eric Bettinger, Erik Bloom, Elizabeth King and Michael Kremer (2002).
“Vouchers for Private Schooling in Colombia: Evidence from a Randomized Natural Experiment.” American Economic Review, 92(5), 1535-1558.
27
Attanasio, Orazio, Adriana Kugler and Costas Meghir (2011). "Subsidizing Vocational Training
for Disadvantaged Youth in Colombia: Evidence from a Randomized Trial.” American Economic Journal: Applied Economics, 3(3), 188-220.
Bettinger, Eric, Michael Kremer and Juan Saavedra (2007). “How do Vouchers Work? Evidence
from Colombia.” Presentation at the World Bank, June 7. Bettinger, Eric, Michael Kremer and Juan Saavedra (2010). “Are Education Vouchers Only
Redistributive?” Economic Journal,120(546), 204-228. Card, David, Pablo Ibarraran, Ferdinando Regalia, David Rosas-Shady and Yuri Soares (2011).
“The Labor Market Impacts of Youth Training in the Dominican Republic.” Journal of Labor Economics, 29(2), 267-300
Duflo, Esther (2001). “Schooling and Labor Market Consequences of School Construction in
Indonesia: Evidence from an Unusual Policy Experiment.” American Economic Review, 91(4), 795-813.
Epple, Dennis and Richard Romano (1998). “Competition between Private and Public Schools,
Vouchers, and Peer-Group Effects.” The American Economic Review, 88(1), 33-62. Friedman, Milton (1962). Capitalism and Freedom. Chicago: University of Chicago Press. Hanushek, Eric, Victor Lavy and Kohtaro Hitomi (2008). "Do Students Care about School
Quality? Determinants of Dropout Behavior in Developing Countries," Journal of Human Capital, 2(1), 69-105.
Hoxby, Caroline (2003). “School Choice and School Productivity. Could School Choice Be A
Tide That Lifts All Boats?” in C.M. Hoxby (Ed.), The Economics of School Choice. Chicago: University of Chicago Press.
Jensen, Robert (2010). “The (Perceived) Returns to Education and the Demand for Schooling.”
Quarterly Journal of Economics, 125(2), 515-548. Johanson, Richard and Arvil V. Adams (2004). Skills Development in Sub-Saharan Africa.
World Bank, Washington DC Jovanovic, Boyan (1979). “Firm-specific Capital and Turnover.” The Journal of Political
Economy, 87(6), 1246-1260. King, Kenneth and Chris Martin (2002). “The Vocational School Fallacy Revisited: Education,
Aspiration and Work in Ghana 1959-2000.” International Journal of Education Development, 22(1), 5-26.
28
Kremer, Michael, Edward Miguel and Rebecca Thornton (2009). “Incentives to Learn.” Review of Economics and Statistics, 91(3), 437-456.
Ladd, Helen (2002). “School Vouchers: A Critical View.” The Journal of Economic
Perspectives, 16(4), 3-24. Lai, Fang, Elisabeth Sadoulet, and Alain de Janvry (2009). "The adverse effects of parents'
school selection errors on academic achievement: Evidence from the Beijing open enrollment program." Economics of Education Review 28(4): 485-496.
Miguel, Edward and Michael Kremer (2004). “Worms: Identifying Impacts on Education and
Health in the Presence of Treatment Externalities.” Econometrica, 72(1), 159-217. Nishimura, M. and Orodho, J. (1999). Education, Vocational Training and Employment:
Designing Projects that Link Education and Vocational Training and Employment in Kenya. JICA, Nairobi.
West, Edwin (1997). “Education Vouchers in Principle and Practice: A Survey.” World Bank
Research Observer, 12(1), 83-103. World Bank (2004). “Strengthening the Foundation of Education and Training in Kenya:
Opportunities and Challenges in Primary and General Secondary Education” Report No. 28064-KE. Washington DC.
World Bank. (2007) World Development Report 2007. Washington DC. World Bank (2008) Kenya Poverty and Inequality Assessment. Washington DC World Bank (2009). Youth and Employment in Africa – The Potential, the Problem, the Promise.
Washington, DC.
Randomization Process for Vocational Education Project in KenyaRandomization Process for Vocational Education Project in KenyaRandomization Process for Vocational Education Project in Kenya
Individuals Stratified into 36 Groups
Gender → PSDP or GSP → Information Treatment Group → Preferred Industry
1. M * PSDP * Info * Construction
2. M * PSDP * Info * Textiles
3. M * PSDP * Info * Mechanics
4. M * PSDP * Info * Beauty
5. M * PSDP * Info * Computers
6. M * PSDP * Info * Other
7. M * PSDP * No Info * Construction
8. M * PSDP * No Info * Textiles
9. M * PSDP * No Info * Mechanics
10. M * PSDP * No Info * Beauty
11. M * PSDP * No Info * Computers
12. M * PSDP * No Info * Other
13. F * PSDP * Info * Construction
14. F * PSDP * Info * Textiles
15. F * PSDP * Info * Mechanics
16. F * PSDP * Info * Beauty
17. F * PSDP * Info * Computers
18. F * PSDP * Info * Other
19. F * PSDP * No Info * Construction
20. F * PSDP * No Info * Textiles
21. F * PSDP * No Info * Mechanics
22. F * PSDP * No Info * Beauty
23. F * PSDP * No Info * Computers
24. F * PSDP * No Info * Other
25. F * GSP * Info * Construction
26. F * GSP * Info * Textiles
27. F * GSP * Info * Mechanics
28. F * GSP * Info * Beauty
29. F * GSP * Info * Computers
30. F * GSP * Info * Other
31. F * GSP * No Info * Construction
32. F * GSP * No Info * Textiles
33. F * GSP * No Info * Mechanics
34. F * GSP * No Info * Beauty
35. F * GSP * No Info * Computers
36. F * GSP * No Info * Other
Randomization Occurred
Within Each Group
♦ 25% or 526 individuals
received unrestricted
vouchers
♦ 25% or 529 individuals
received vouchers valid only
for public institutions
♦ 50% or 1,108 individuals did
not receive vouchers
2,163
individuals attended the
second meeting.
Each brought a letter of support and
preferences for both voucher types.
2,705
attended one of the 70 introductory
meetings in sub‐locations.
Project introduced, survey of expected earnings
beliefs w/ and w/o VocEd conducted, and list of
public and private VocEd institutions distributed.
35 of the 70 meetings were randomly given the
information treatment.
10,767
young adults, who had
either participated in
the PSDP in 1998 or GSP in 2001,
received invitations to attend an
informational meeting.
Figure 2. Summary of Voucher Design
Voucher Type Public-Only Unrestricted
Expenses Covered Tuition, Materials, Uniform, Trade Test Fees
Tuition, Materials, Uniform, Trade Test Fees
Expenses Not Covered Board, Lunch, Transport Board, Lunch, TransportVoucher Amount (Mean) in Kshs 21,297 19,814Vocher Amount (Median) in Kshs 21,200 18,000Out-of-Pocket Costs (Mean) in Kshs 3,054 2,414Out-of-Pocket Costs (Median) in Kshs 0 0Voucher Percent of Total (Mean) 87.5% 89.1%Voucher Percent of Total Cost (Median) 100% 100%Course Duration (3 Month Terms) 5.96 4.5910-km Institution Density (Mean) 2.1 6.110-km Institution Density (Median) 2 610-km Unique Course Offerings (Mean) 9.2 14.810-km Unique Course Offerings (Median) 11 13
Figure 3. Information Intervention Handouts/Posters
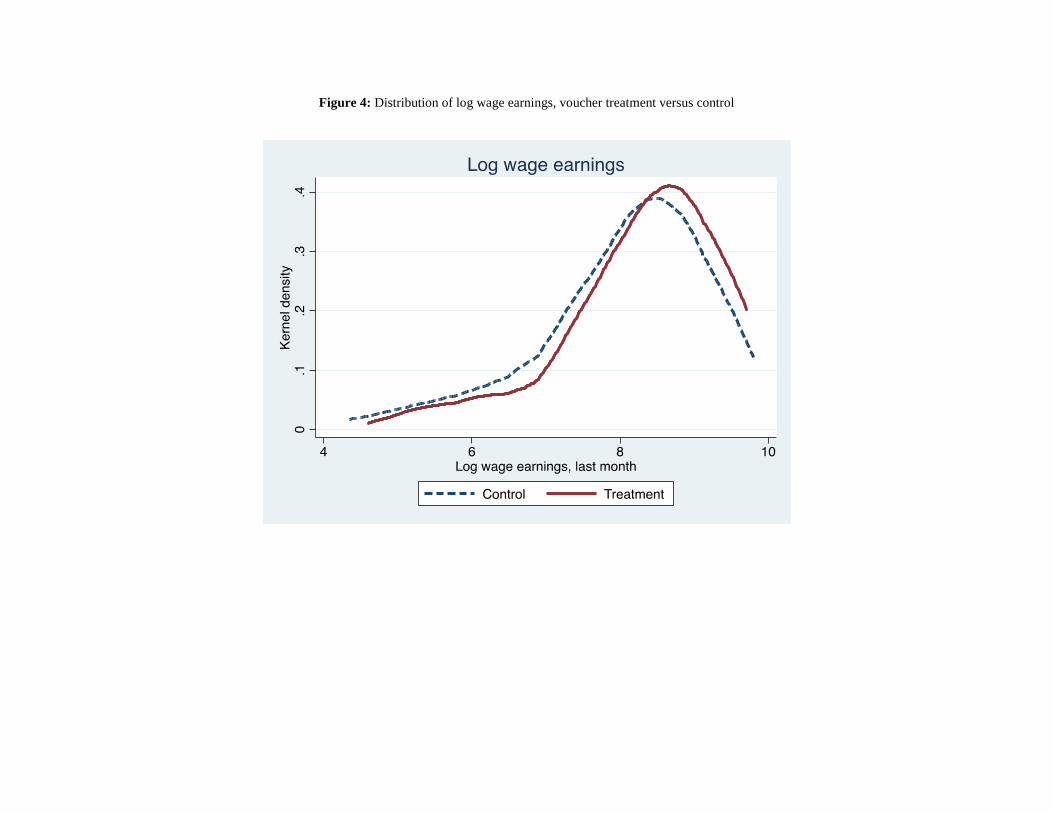
Figure 4: Distribution of log wage earnings, voucher treatment versus control
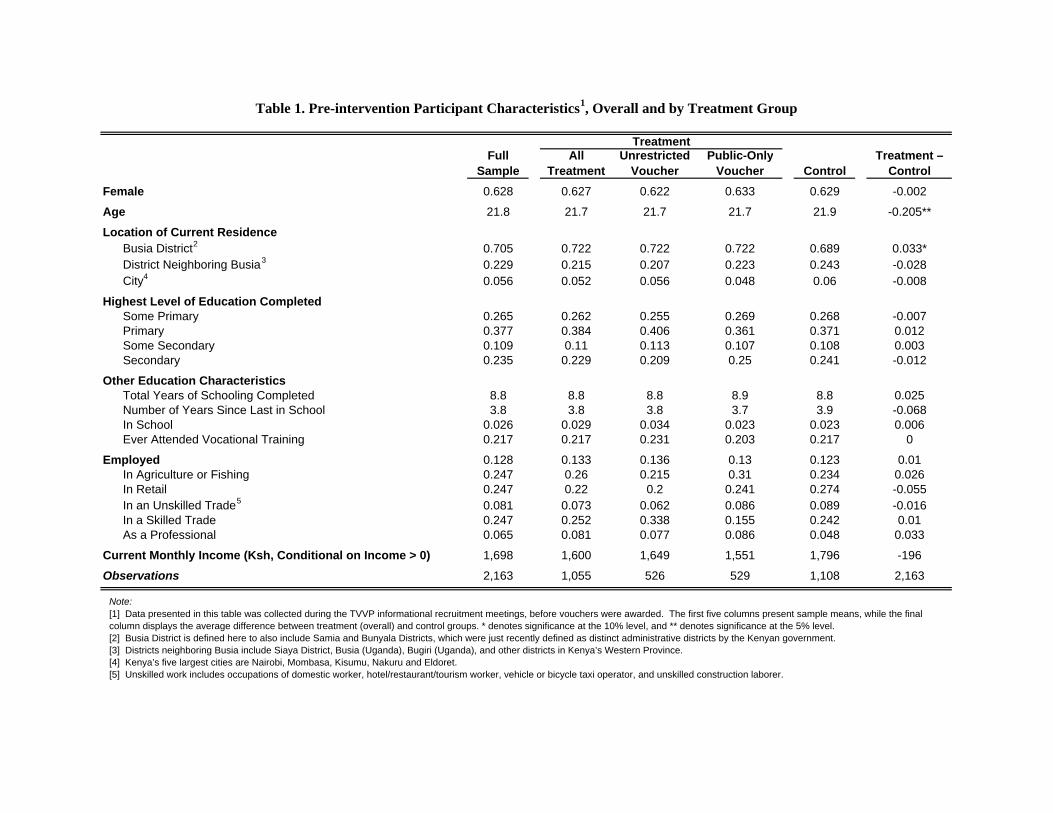
Table 1. Pre-intervention Participant Characteristics1, Overall and by Treatment Group
TreatmentFull
SampleAll
TreatmentUnrestricted
VoucherPublic-Only
Voucher ControlTreatment –
ControlFemale 0.628 0.627 0.622 0.633 0.629 -0.002
Age 21.8 21.7 21.7 21.7 21.9 -0.205**
Location of Current ResidenceBusia District2 0.705 0.722 0.722 0.722 0.689 0.033*District Neighboring Busia3 0.229 0.215 0.207 0.223 0.243 -0.028City4 0.056 0.052 0.056 0.048 0.06 -0.008
Highest Level of Education CompletedSome Primary 0.265 0.262 0.255 0.269 0.268 -0.007Primary 0.377 0.384 0.406 0.361 0.371 0.012Some Secondary 0.109 0.11 0.113 0.107 0.108 0.003Secondary 0.235 0.229 0.209 0.25 0.241 -0.012
Other Education CharacteristicsTotal Years of Schooling Completed 8.8 8.8 8.8 8.9 8.8 0.025Number of Years Since Last in School 3.8 3.8 3.8 3.7 3.9 -0.068In School 0.026 0.029 0.034 0.023 0.023 0.006Ever Attended Vocational Training 0.217 0.217 0.231 0.203 0.217 0
Employed 0.128 0.133 0.136 0.13 0.123 0.01In Agriculture or Fishing 0.247 0.26 0.215 0.31 0.234 0.026In Retail 0.247 0.22 0.2 0.241 0.274 -0.055In an Unskilled Trade5 0.081 0.073 0.062 0.086 0.089 -0.016In a Skilled Trade 0.247 0.252 0.338 0.155 0.242 0.01As a Professional 0.065 0.081 0.077 0.086 0.048 0.033
Current Monthly Income (Ksh, Conditional on Income > 0) 1,698 1,600 1,649 1,551 1,796 -196
Observations 2,163 1,055 526 529 1,108 2,163
Note: [1] Data presented in this table was collected during the TVVP informational recruitment meetings, before vouchers were awarded. The first five columns present sample means, while the finalcolumn displays the average difference between treatment (overall) and control groups. * denotes significance at the 10% level, and ** denotes significance at the 5% level.[2] Busia District is defined here to also include Samia and Bunyala Districts, which were just recently defined as distinct administrative districts by the Kenyan government. [3] Districts neighboring Busia include Siaya District, Busia (Uganda), Bugiri (Uganda), and other districts in Kenya’s Western Province.[4] Kenya’s five largest cities are Nairobi, Mombasa, Kisumu, Nakuru and Eldoret.[5] Unskilled work includes occupations of domestic worker, hotel/restaurant/tourism worker, vehicle or bicycle taxi operator, and unskilled construction laborer.
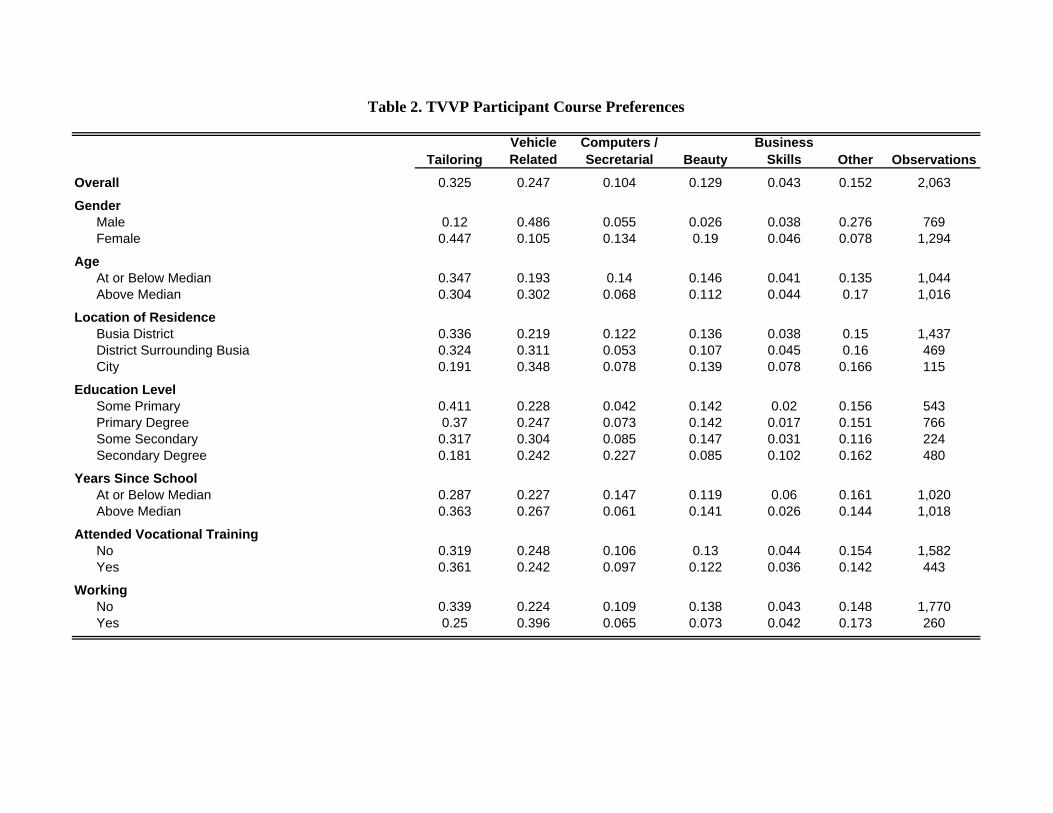
Table 2. TVVP Participant Course Preferences
TailoringVehicleRelated
Computers / Secretarial Beauty
BusinessSkills Other Observations
Overall 0.325 0.247 0.104 0.129 0.043 0.152 2,063
GenderMale 0.12 0.486 0.055 0.026 0.038 0.276 769Female 0.447 0.105 0.134 0.19 0.046 0.078 1,294
AgeAt or Below Median 0.347 0.193 0.14 0.146 0.041 0.135 1,044Above Median 0.304 0.302 0.068 0.112 0.044 0.17 1,016
Location of ResidenceBusia District 0.336 0.219 0.122 0.136 0.038 0.15 1,437District Surrounding Busia 0.324 0.311 0.053 0.107 0.045 0.16 469City 0.191 0.348 0.078 0.139 0.078 0.166 115
Education LevelSome Primary 0.411 0.228 0.042 0.142 0.02 0.156 543Primary Degree 0.37 0.247 0.073 0.142 0.017 0.151 766Some Secondary 0.317 0.304 0.085 0.147 0.031 0.116 224Secondary Degree 0.181 0.242 0.227 0.085 0.102 0.162 480
Years Since SchoolAt or Below Median 0.287 0.227 0.147 0.119 0.06 0.161 1,020Above Median 0.363 0.267 0.061 0.141 0.026 0.144 1,018
Attended Vocational TrainingNo 0.319 0.248 0.106 0.13 0.044 0.154 1,582Yes 0.361 0.242 0.097 0.122 0.036 0.142 443
WorkingNo 0.339 0.224 0.109 0.138 0.043 0.148 1,770Yes 0.25 0.396 0.065 0.073 0.042 0.173 260
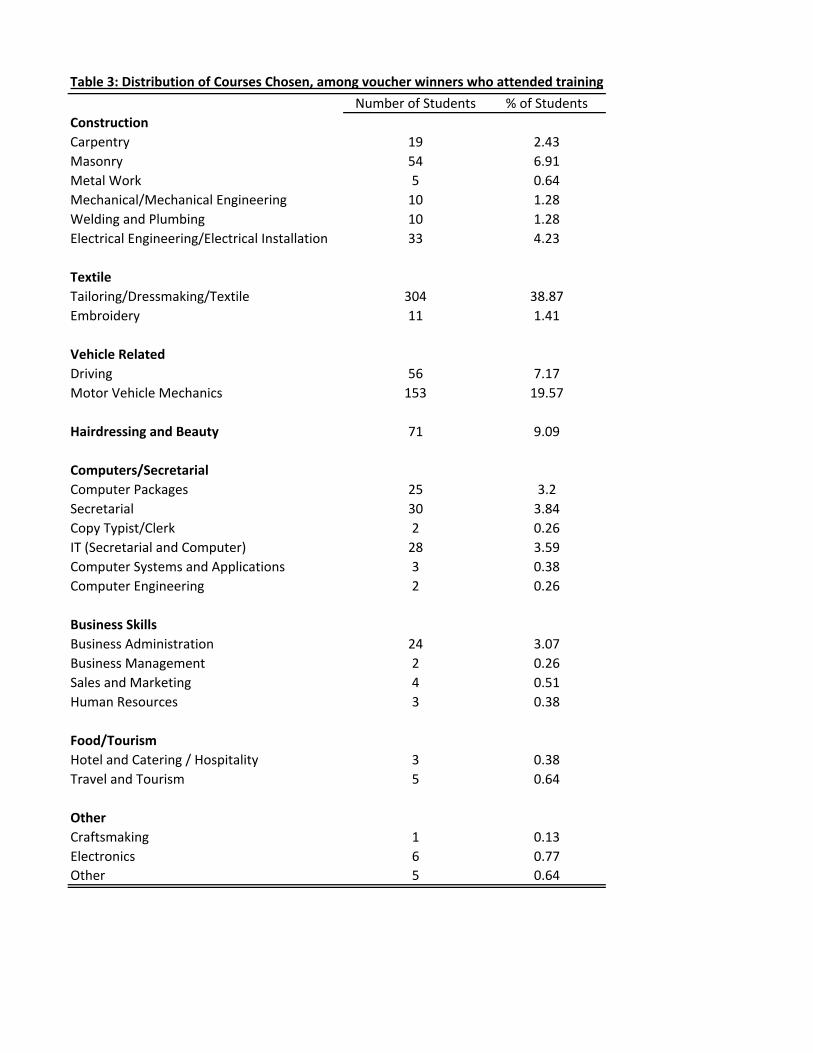
Table 3: Distribution of Courses Chosen, among voucher winners who attended training
Number of Students % of StudentsConstructionCarpentry 19 2.43Masonry 54 6.91Metal Work 5 0.64Mechanical/Mechanical Engineering 10 1.28Welding and Plumbing 10 1.28Electrical Engineering/Electrical Installation 33 4.23
TextileTailoring/Dressmaking/Textile 304 38.87Embroidery 11 1.41
Vehicle RelatedDriving 56 7.17Motor Vehicle Mechanics 153 19.57
Hairdressing and Beauty 71 9.09
Computers/SecretarialComputer Packages 25 3.2Secretarial 30 3.84Copy Typist/Clerk 2 0.26IT (Secretarial and Computer) 28 3.59Computer Systems and Applications 3 0.38Computer Engineering 2 0.26
Business SkillsBusiness Administration 24 3.07Business Management 2 0.26Sales and Marketing 4 0.51Human Resources 3 0.38
Food/TourismHotel and Catering / Hospitality 3 0.38Travel and Tourism 5 0.64
OtherCraftsmaking 1 0.13Electronics 6 0.77Other 5 0.64
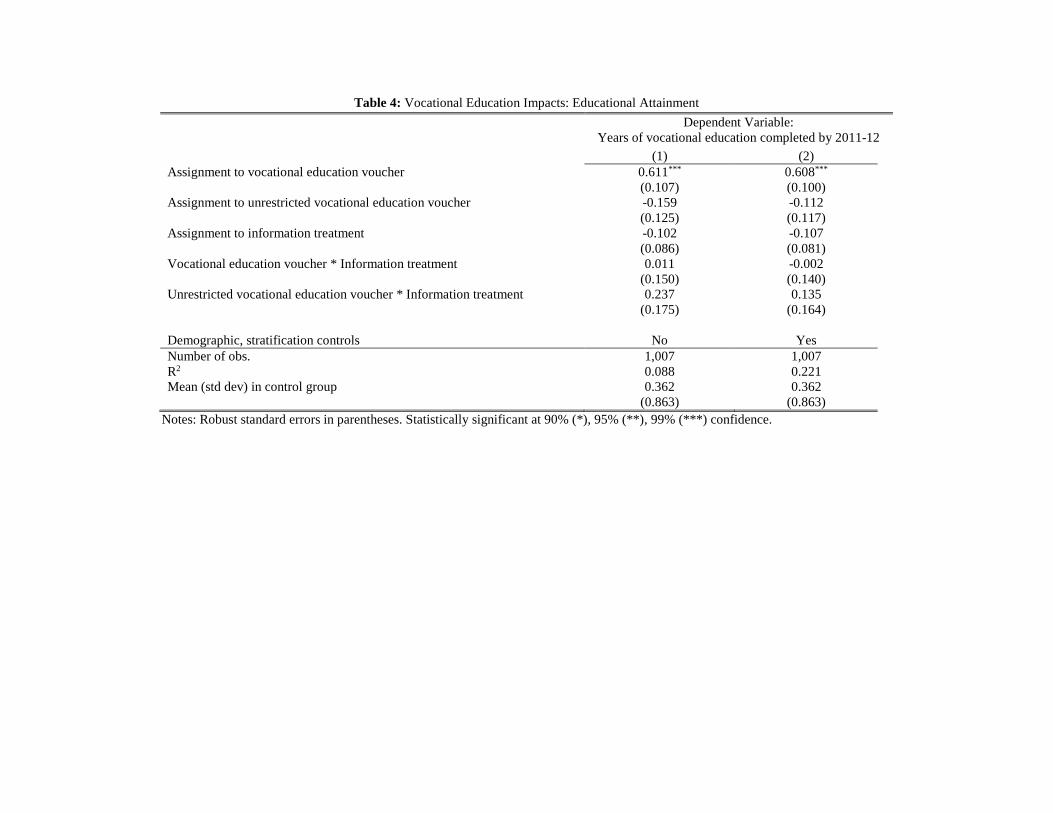
Table 4: Vocational Education Impacts: Educational Attainment Dependent Variable:
Years of vocational education completed by 2011-12 (1) (2)
Assignment to vocational education voucher 0.611*** (0.107)
0.608*** (0.100)
Assignment to unrestricted vocational education voucher -0.159 (0.125)
-0.112 (0.117)
Assignment to information treatment -0.102 (0.086)
-0.107 (0.081)
Vocational education voucher * Information treatment 0.011 (0.150)
-0.002 (0.140)
Unrestricted vocational education voucher * Information treatment 0.237 (0.175)
0.135 (0.164)
Demographic, stratification controls No Yes Number of obs. 1,007 1,007 R2 0.088 0.221 Mean (std dev) in control group 0.362
(0.863) 0.362
(0.863) Notes: Robust standard errors in parentheses. Statistically significant at 90% (*), 95% (**), 99% (***) confidence.
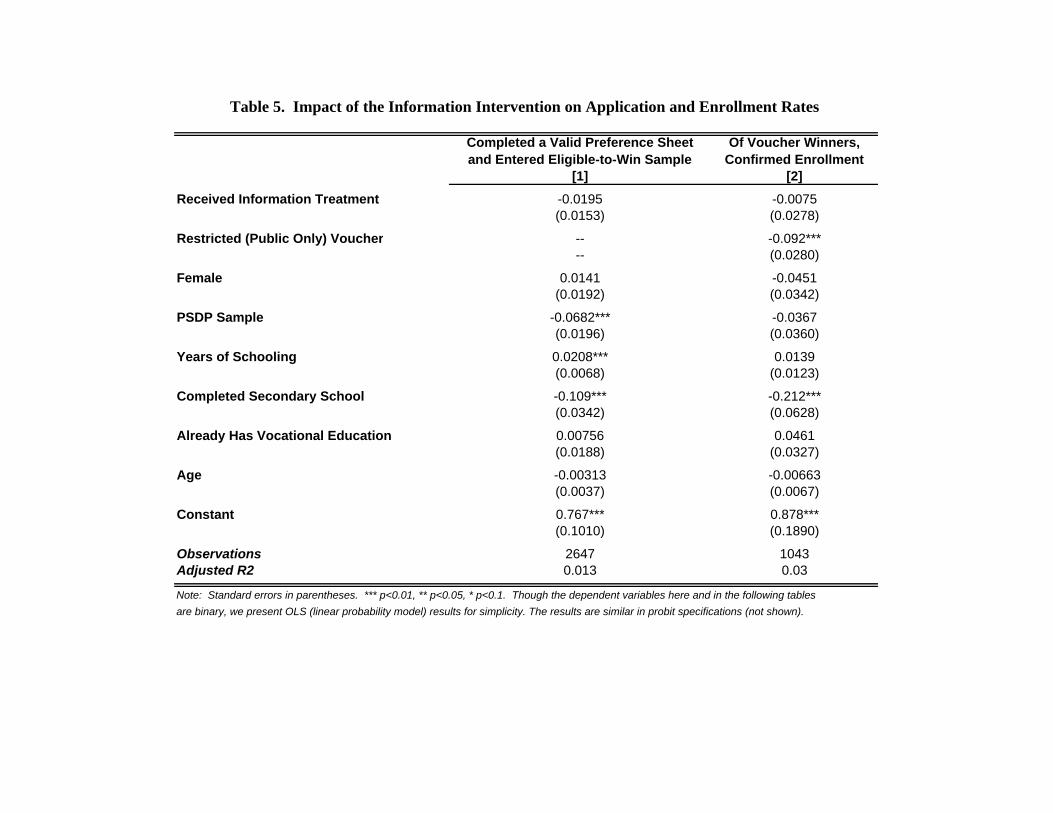
Table 5. Impact of the Information Intervention on Application and Enrollment Rates
Completed a Valid Preference Sheet and Entered Eligible-to-Win Sample
Of Voucher Winners, Confirmed Enrollment
[1] [2]
Received Information Treatment -0.0195 -0.0075(0.0153) (0.0278)
Restricted (Public Only) Voucher -- -0.092***-- (0.0280)
Female 0.0141 -0.0451(0.0192) (0.0342)
PSDP Sample -0.0682*** -0.0367(0.0196) (0.0360)
Years of Schooling 0.0208*** 0.0139(0.0068) (0.0123)
Completed Secondary School -0.109*** -0.212***(0.0342) (0.0628)
Already Has Vocational Education 0.00756 0.0461(0.0188) (0.0327)
Age -0.00313 -0.00663(0.0037) (0.0067)
Constant 0.767*** 0.878***(0.1010) (0.1890)
Observations 2647 1043Adjusted R2 0.013 0.03
Note: Standard errors in parentheses. *** p<0.01, ** p<0.05, * p<0.1. Though the dependent variables here and in the following tablesare binary, we present OLS (linear probability model) results for simplicity. The results are similar in probit specifications (not shown).
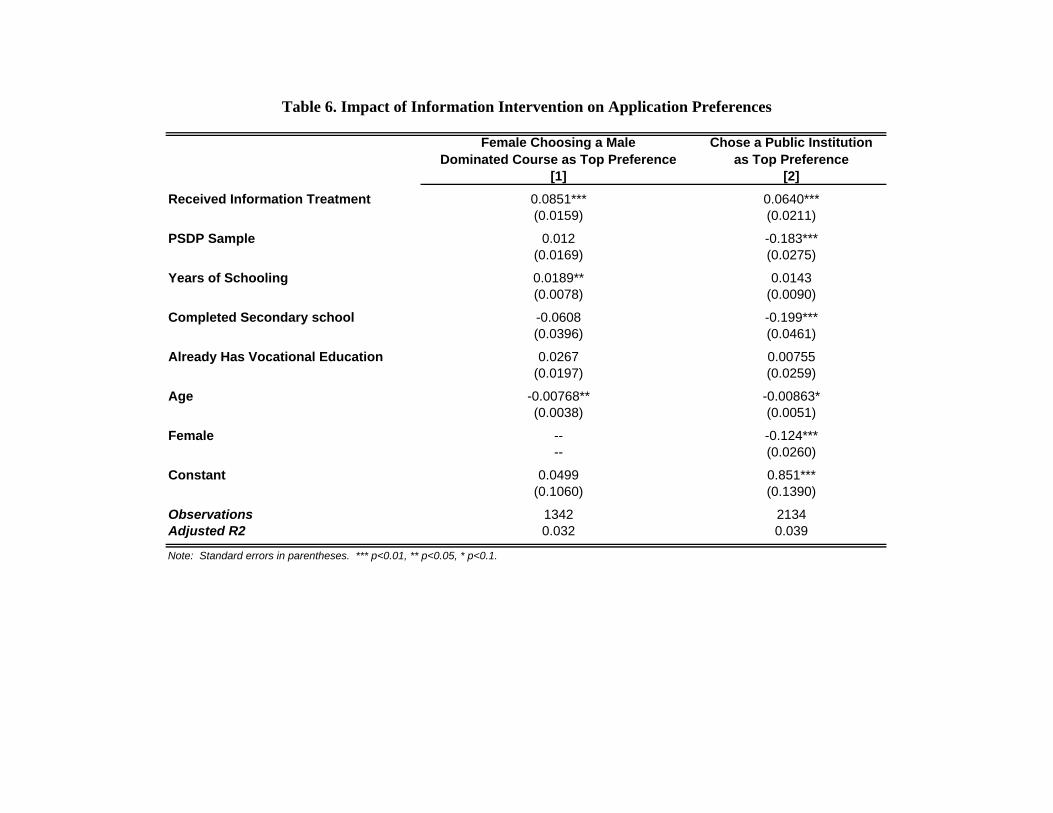
Table 6. Impact of Information Intervention on Application Preferences
Female Choosing a Male Dominated Course as Top Preference
Chose a Public Institution as Top Preference
[1] [2]
Received Information Treatment 0.0851*** 0.0640***(0.0159) (0.0211)
PSDP Sample 0.012 -0.183***(0.0169) (0.0275)
Years of Schooling 0.0189** 0.0143(0.0078) (0.0090)
Completed Secondary school -0.0608 -0.199***(0.0396) (0.0461)
Already Has Vocational Education 0.0267 0.00755(0.0197) (0.0259)
Age -0.00768** -0.00863*(0.0038) (0.0051)
Female -- -0.124***-- (0.0260)
Constant 0.0499 0.851***(0.1060) (0.1390)
Observations 1342 2134Adjusted R2 0.032 0.039
Note: Standard errors in parentheses. *** p<0.01, ** p<0.05, * p<0.1.
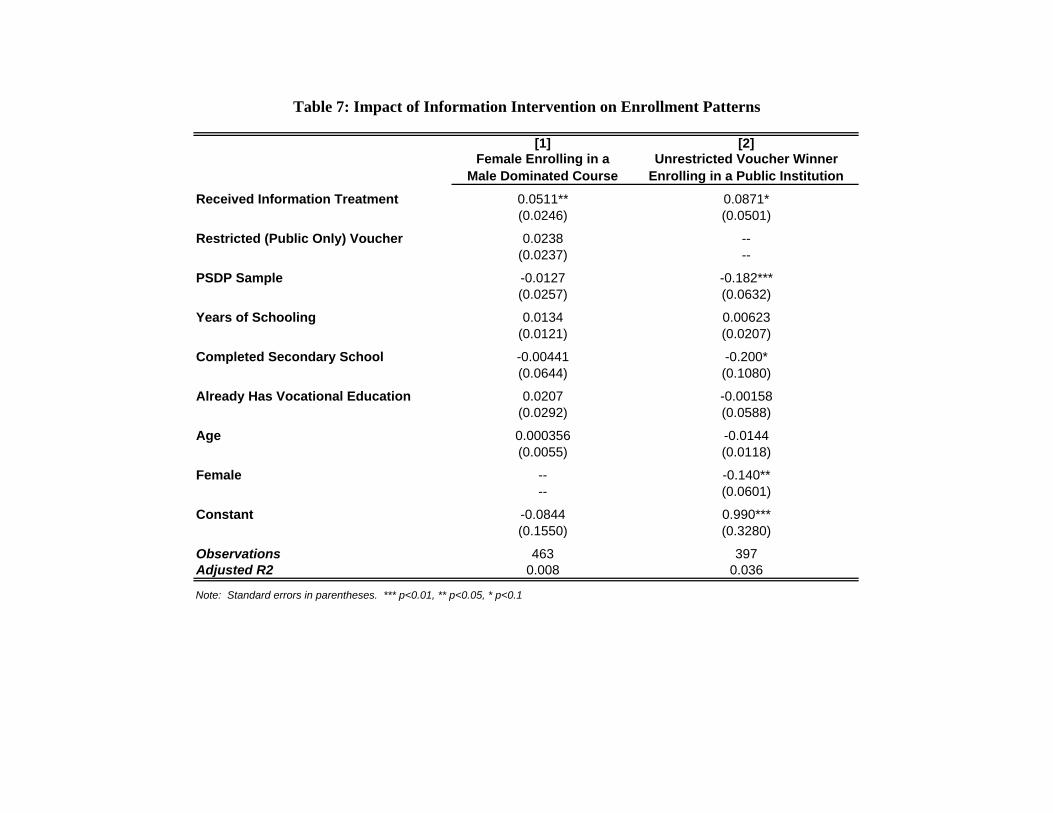
Table 7: Impact of Information Intervention on Enrollment Patterns
[1] [2]Female Enrolling in a
Male Dominated CourseUnrestricted Voucher Winner
Enrolling in a Public Institution
Received Information Treatment 0.0511** 0.0871*(0.0246) (0.0501)
Restricted (Public Only) Voucher 0.0238 --(0.0237) --
PSDP Sample -0.0127 -0.182***(0.0257) (0.0632)
Years of Schooling 0.0134 0.00623(0.0121) (0.0207)
Completed Secondary School -0.00441 -0.200*(0.0644) (0.1080)
Already Has Vocational Education 0.0207 -0.00158(0.0292) (0.0588)
Age 0.000356 -0.0144(0.0055) (0.0118)
Female -- -0.140**-- (0.0601)
Constant -0.0844 0.990***(0.1550) (0.3280)
Observations 463 397Adjusted R2 0.008 0.036
Note: Standard errors in parentheses. *** p<0.01, ** p<0.05, * p<0.1
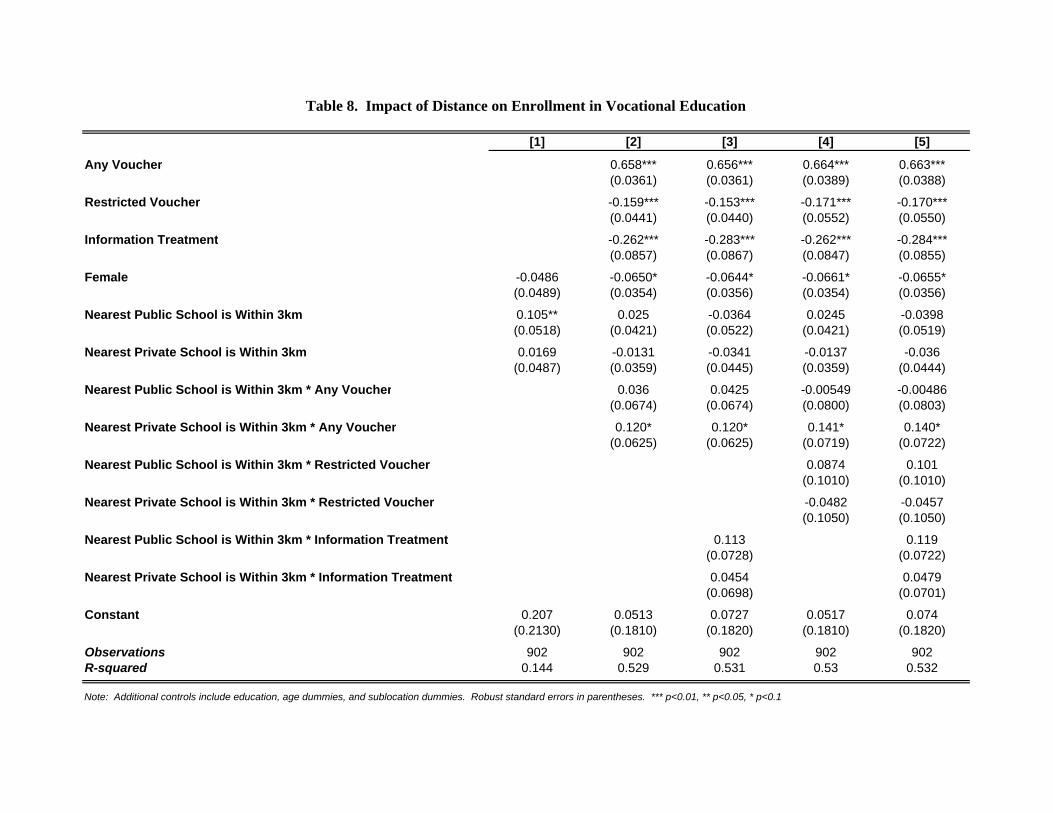
Table 8. Impact of Distance on Enrollment in Vocational Education
[1] [2] [3] [4] [5]
Any Voucher 0.658*** 0.656*** 0.664*** 0.663***(0.0361) (0.0361) (0.0389) (0.0388)
Restricted Voucher -0.159*** -0.153*** -0.171*** -0.170***(0.0441) (0.0440) (0.0552) (0.0550)
Information Treatment -0.262*** -0.283*** -0.262*** -0.284***(0.0857) (0.0867) (0.0847) (0.0855)
Female -0.0486 -0.0650* -0.0644* -0.0661* -0.0655*(0.0489) (0.0354) (0.0356) (0.0354) (0.0356)
Nearest Public School is Within 3km 0.105** 0.025 -0.0364 0.0245 -0.0398(0.0518) (0.0421) (0.0522) (0.0421) (0.0519)
Nearest Private School is Within 3km 0.0169 -0.0131 -0.0341 -0.0137 -0.036(0.0487) (0.0359) (0.0445) (0.0359) (0.0444)
Nearest Public School is Within 3km * Any Voucher 0.036 0.0425 -0.00549 -0.00486(0.0674) (0.0674) (0.0800) (0.0803)
Nearest Private School is Within 3km * Any Voucher 0.120* 0.120* 0.141* 0.140*(0.0625) (0.0625) (0.0719) (0.0722)
Nearest Public School is Within 3km * Restricted Voucher 0.0874 0.101(0.1010) (0.1010)
Nearest Private School is Within 3km * Restricted Voucher -0.0482 -0.0457(0.1050) (0.1050)
Nearest Public School is Within 3km * Information Treatment 0.113 0.119(0.0728) (0.0722)
Nearest Private School is Within 3km * Information Treatment 0.0454 0.0479(0.0698) (0.0701)
Constant 0.207 0.0513 0.0727 0.0517 0.074(0.2130) (0.1810) (0.1820) (0.1810) (0.1820)
Observations 902 902 902 902 902R-squared 0.144 0.529 0.531 0.53 0.532
Note: Additional controls include education, age dummies, and sublocation dummies. Robust standard errors in parentheses. *** p<0.01, ** p<0.05, * p<0.1
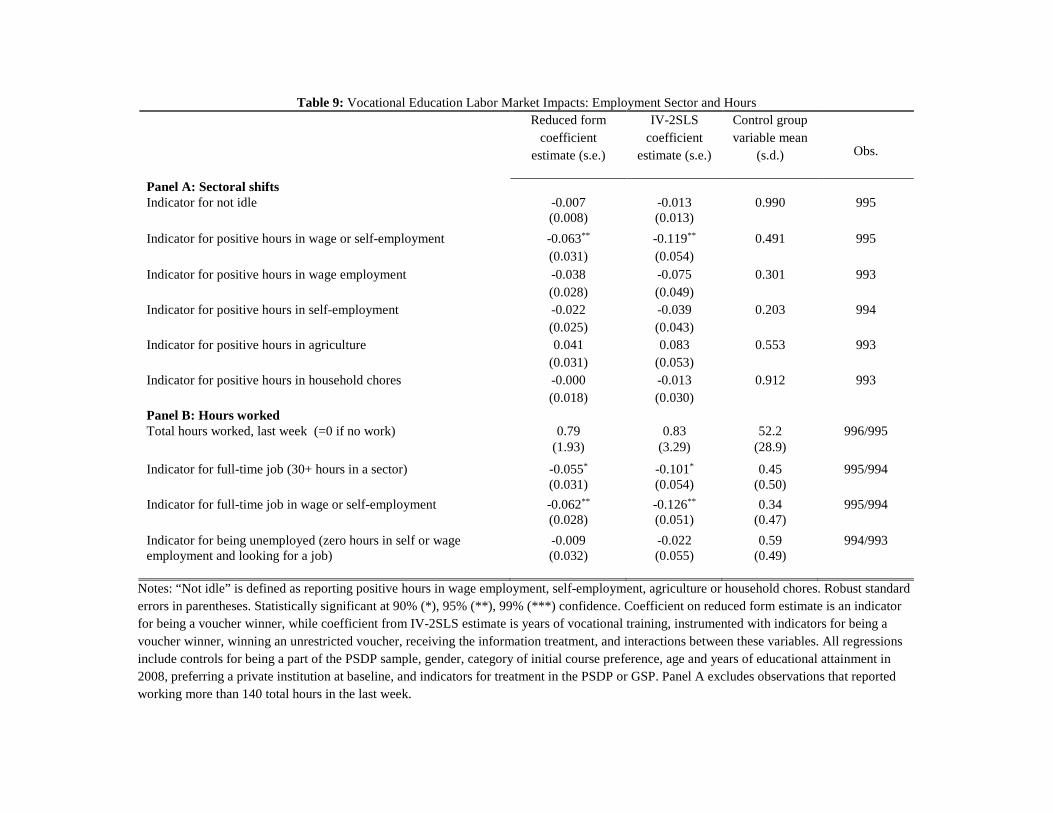
Table 9: Vocational Education Labor Market Impacts: Employment Sector and Hours
Reduced form coefficient
estimate (s.e.)
IV-2SLS coefficient
estimate (s.e.)
Control group variable mean
(s.d.)
Obs.
Panel A: Sectoral shifts Indicator for not idle -0.007
(0.008) -0.013 (0.013)
0.990
995
Indicator for positive hours in wage or self-employment -0.063** (0.031)
-0.119** (0.054)
0.491 995
Indicator for positive hours in wage employment -0.038 (0.028)
-0.075 (0.049)
0.301 993
Indicator for positive hours in self-employment -0.022 (0.025)
-0.039 (0.043)
0.203 994
Indicator for positive hours in agriculture 0.041 (0.031)
0.083 (0.053)
0.553 993
Indicator for positive hours in household chores -0.000 (0.018)
-0.013 (0.030)
0.912 993
Panel B: Hours worked Total hours worked, last week (=0 if no work) 0.79 0.83 52.2 996/995 (1.93) (3.29) (28.9)
Indicator for full-time job (30+ hours in a sector) -0.055*
(0.031) -0.101*
(0.054) 0.45
(0.50) 995/994
Indicator for full-time job in wage or self-employment -0.062**
(0.028) -0.126**
(0.051) 0.34
(0.47) 995/994
Indicator for being unemployed (zero hours in self or wage employment and looking for a job)
-0.009 (0.032)
-0.022 (0.055)
0.59 (0.49)
994/993
Notes: “Not idle” is defined as reporting positive hours in wage employment, self-employment, agriculture or household chores. Robust standard errors in parentheses. Statistically significant at 90% (*), 95% (**), 99% (***) confidence. Coefficient on reduced form estimate is an indicator for being a voucher winner, while coefficient from IV-2SLS estimate is years of vocational training, instrumented with indicators for being a voucher winner, winning an unrestricted voucher, receiving the information treatment, and interactions between these variables. All regressions include controls for being a part of the PSDP sample, gender, category of initial course preference, age and years of educational attainment in 2008, preferring a private institution at baseline, and indicators for treatment in the PSDP or GSP. Panel A excludes observations that reported working more than 140 total hours in the last week.
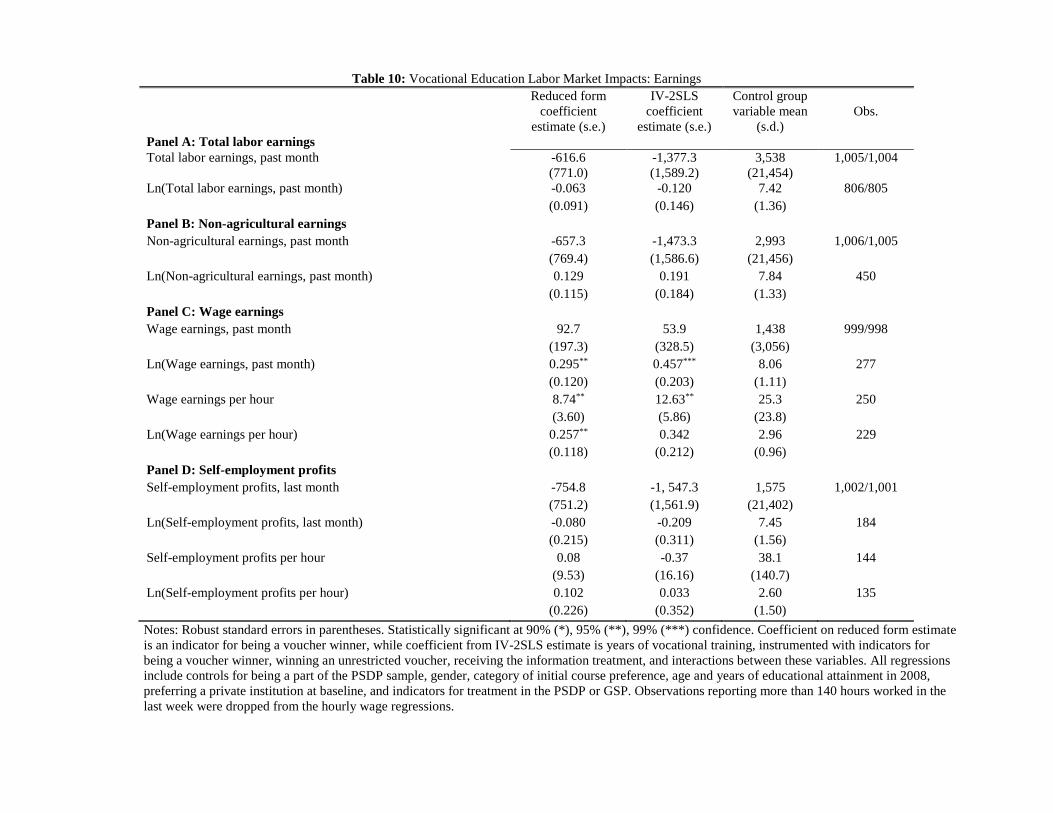
Table 10: Vocational Education Labor Market Impacts: Earnings
Panel A: Total labor earnings
Reduced form coefficient
estimate (s.e.)
IV-2SLS coefficient
estimate (s.e.)
Control group variable mean
(s.d.)
Obs.
Total labor earnings, past month -616.6 (771.0)
-1,377.3 (1,589.2)
3,538 (21,454)
1,005/1,004
Ln(Total labor earnings, past month) -0.063 -0.120 7.42 806/805 (0.091) (0.146) (1.36) Panel B: Non-agricultural earnings Non-agricultural earnings, past month -657.3 -1,473.3 2,993 1,006/1,005 (769.4) (1,586.6) (21,456) Ln(Non-agricultural earnings, past month) 0.129
(0.115) 0.191
(0.184) 7.84
(1.33) 450
Panel C: Wage earnings Wage earnings, past month 92.7 53.9 1,438 999/998 Ln(Wage earnings, past month)
(197.3) 0.295**
(328.5) 0.457***
(3,056) 8.06
277
(0.120) (0.203) (1.11) Wage earnings per hour 8.74** 12.63** 25.3 250 (3.60) (5.86) (23.8) Ln(Wage earnings per hour) 0.257**
(0.118) 0.342
(0.212) 2.96
(0.96) 229
Panel D: Self-employment profits Self-employment profits, last month -754.8
(751.2) -1, 547.3 (1,561.9)
1,575 (21,402)
1,002/1,001
Ln(Self-employment profits, last month) -0.080 (0.215)
-0.209 (0.311)
7.45 (1.56)
184
Self-employment profits per hour 0.08 (9.53)
-0.37 (16.16)
38.1 (140.7)
144
Ln(Self-employment profits per hour) 0.102 0.033 2.60 135 (0.226) (0.352) (1.50) Notes: Robust standard errors in parentheses. Statistically significant at 90% (*), 95% (**), 99% (***) confidence. Coefficient on reduced form estimate is an indicator for being a voucher winner, while coefficient from IV-2SLS estimate is years of vocational training, instrumented with indicators for being a voucher winner, winning an unrestricted voucher, receiving the information treatment, and interactions between these variables. All regressions include controls for being a part of the PSDP sample, gender, category of initial course preference, age and years of educational attainment in 2008, preferring a private institution at baseline, and indicators for treatment in the PSDP or GSP. Observations reporting more than 140 hours worked in the last week were dropped from the hourly wage regressions.
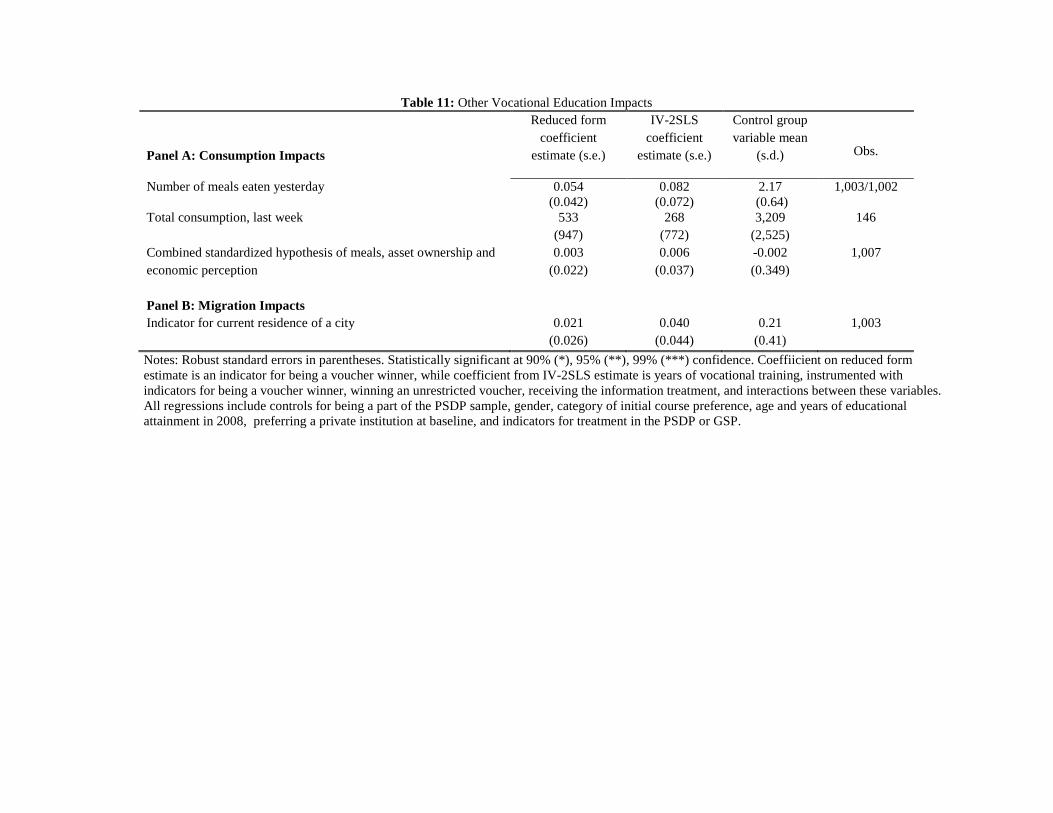
Table 11: Other Vocational Education Impacts
Panel A: Consumption Impacts
Reduced form coefficient
estimate (s.e.)
IV-2SLS coefficient
estimate (s.e.)
Control group variable mean
(s.d.)
Obs.
Number of meals eaten yesterday 0.054 (0.042)
0.082 (0.072)
2.17 (0.64)
1,003/1,002
Total consumption, last week 533 268 3,209 146 Combined standardized hypothesis of meals, asset ownership and economic perception Panel B: Migration Impacts
(947) 0.003
(0.022)
(772) 0.006
(0.037)
(2,525) -0.002 (0.349)
1,007
Indicator for current residence of a city 0.021 (0.026)
0.040 (0.044)
0.21 (0.41)
1,003
Notes: Robust standard errors in parentheses. Statistically significant at 90% (*), 95% (**), 99% (***) confidence. Coeffiicient on reduced form estimate is an indicator for being a voucher winner, while coefficient from IV-2SLS estimate is years of vocational training, instrumented with indicators for being a voucher winner, winning an unrestricted voucher, receiving the information treatment, and interactions between these variables. All regressions include controls for being a part of the PSDP sample, gender, category of initial course preference, age and years of educational attainment in 2008, preferring a private institution at baseline, and indicators for treatment in the PSDP or GSP.
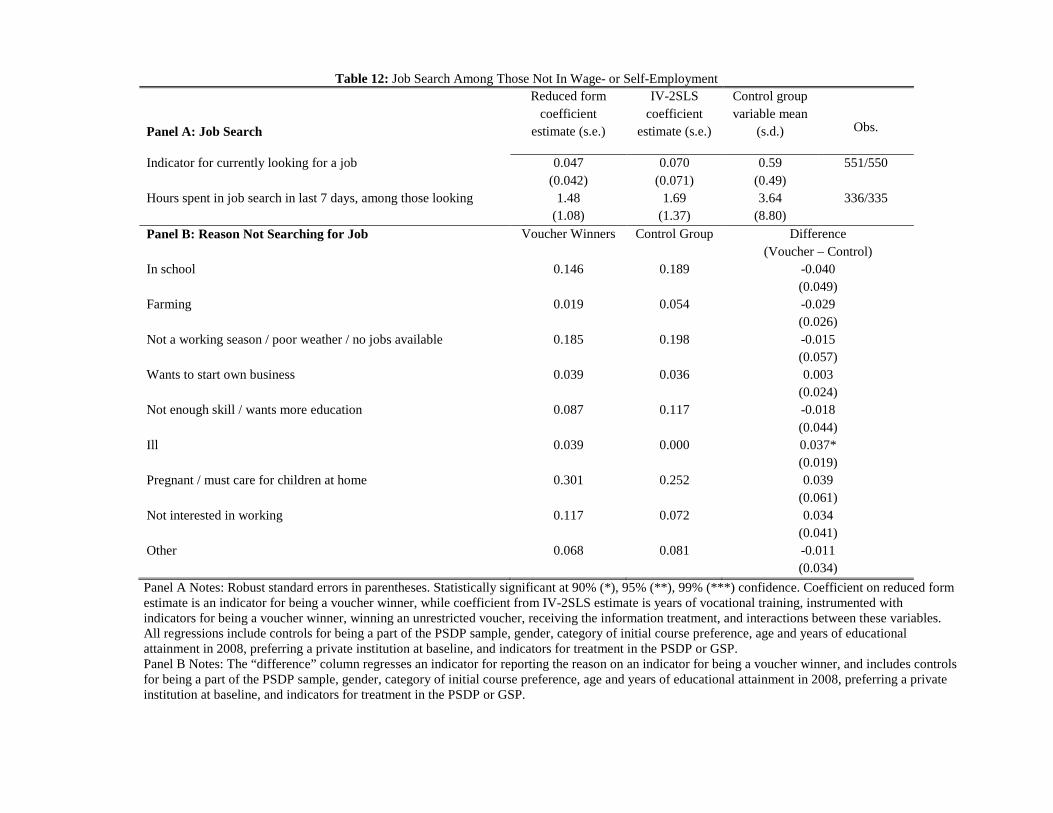
Table 12: Job Search Among Those Not In Wage- or Self-Employment
Panel A: Job Search
Reduced form coefficient
estimate (s.e.)
IV-2SLS coefficient
estimate (s.e.)
Control group variable mean
(s.d.)
Obs.
Indicator for currently looking for a job 0.047 (0.042)
0.070 (0.071)
0.59 (0.49)
551/550
Hours spent in job search in last 7 days, among those looking
1.48 (1.08)
1.69 (1.37)
3.64 (8.80)
336/335
Panel B: Reason Not Searching for Job Voucher Winners Control Group Difference (Voucher – Control)
In school 0.146 0.189 -0.040 (0.049)
Farming 0.019 0.054 -0.029 (0.026)
Not a working season / poor weather / no jobs available 0.185 0.198 -0.015 (0.057)
Wants to start own business 0.039 0.036 0.003 (0.024)
Not enough skill / wants more education 0.087 0.117 -0.018 (0.044)
Ill 0.039 0.000 0.037* (0.019)
Pregnant / must care for children at home 0.301 0.252 0.039 (0.061)
Not interested in working 0.117 0.072 0.034 (0.041)
Other 0.068 0.081 -0.011 (0.034)
Panel A Notes: Robust standard errors in parentheses. Statistically significant at 90% (*), 95% (**), 99% (***) confidence. Coefficient on reduced form estimate is an indicator for being a voucher winner, while coefficient from IV-2SLS estimate is years of vocational training, instrumented with indicators for being a voucher winner, winning an unrestricted voucher, receiving the information treatment, and interactions between these variables. All regressions include controls for being a part of the PSDP sample, gender, category of initial course preference, age and years of educational attainment in 2008, preferring a private institution at baseline, and indicators for treatment in the PSDP or GSP. Panel B Notes: The “difference” column regresses an indicator for reporting the reason on an indicator for being a voucher winner, and includes controls for being a part of the PSDP sample, gender, category of initial course preference, age and years of educational attainment in 2008, preferring a private institution at baseline, and indicators for treatment in the PSDP or GSP.