Embed Size (px)
Citation preview
Cop
yrig
ht ©
by
Pear
son
Educ
atio
n, In
c. o
r its
aff
iliat
es. A
ll Ri
ghts
Res
erve
d.
Vocabulary
Review
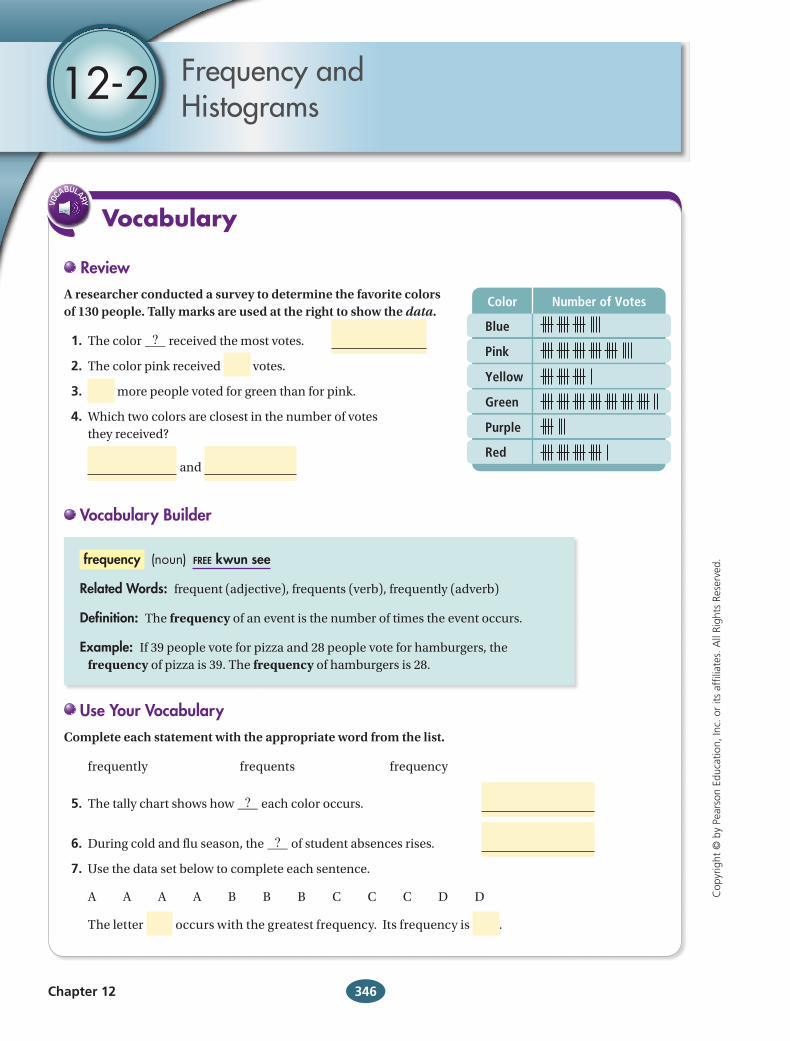
Color Number of Votes
Blue
Pink
Yellow
Green
Purple
Red
HSM11_A1MC_1202_T91452
Chapter 12 346
12-2 Frequency and Histograms
A researcher conducted a survey to determine the favorite colors of 130 people. Tally marks are used at the right to show the data.
1. The color 9 received the most votes.
2. The color pink received votes.
3. more people voted for green than for pink.
4. Which two colors are closest in the number of votes they received?
and
Vocabulary Builder
frequency (noun) free kwun see
Related Words: frequent (adjective), frequents (verb), frequently (adverb)
Definition: The frequency of an event is the number of times the event occurs.
Example: If 39 people vote for pizza and 28 people vote for hamburgers, the frequency of pizza is 39. The frequency of hamburgers is 28.
Use Your Vocabulary
Complete each statement with the appropriate word from the list.
frequently frequents frequency
5. The tally chart shows how 9 each color occurs.
6. During cold and flu season, the 9 of student absences rises.
7. Use the data set below to complete each sentence.
A A A A B B B C C C D D
The letter occurs with the greatest frequency. Its frequency is .
HSM12A1MC_1202.indd 346 3/18/11 5:27:28 PM
Cop
yrig
ht ©
by
Pear
son
Educ
atio
n, In
c. o
r its
aff
iliat
es. A
ll Ri
ghts
Res
erve
d.
Problem 2
Problem 1
HSM11_A1MC_1202_T91453
Interval
1–5
6–
11–
16–
Frequency
347 Lesson 12-2
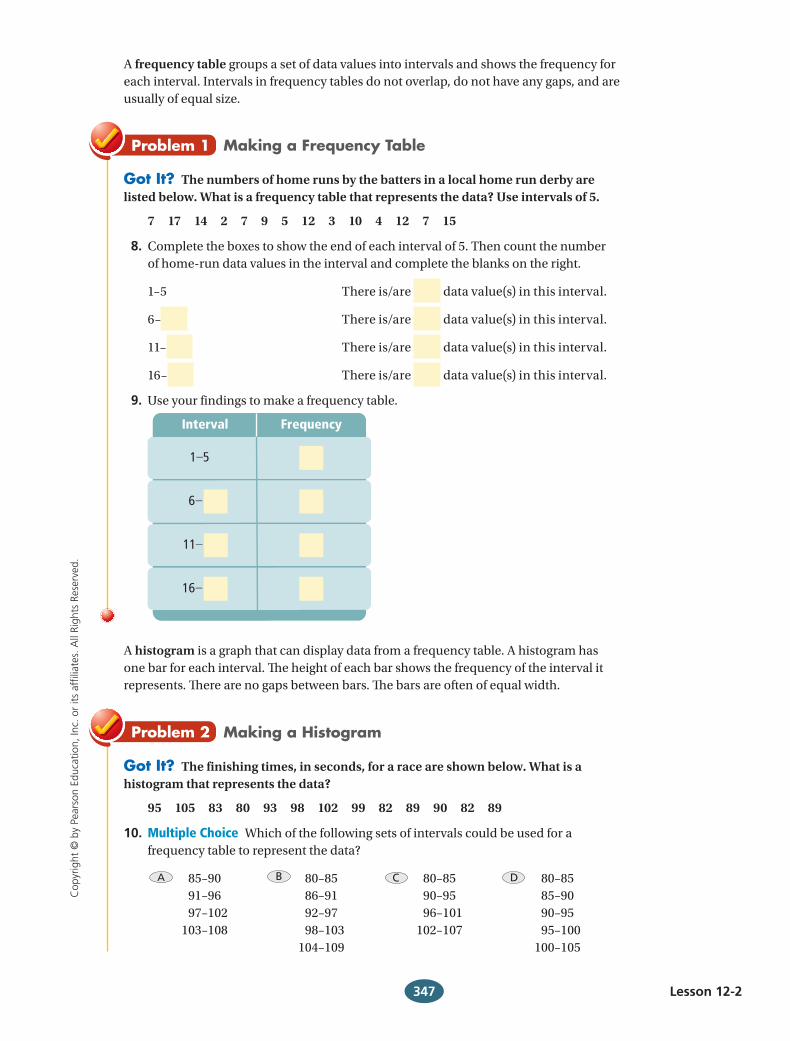
Making a Frequency Table
Got It? The numbers of home runs by the batters in a local home run derby are listed below. What is a frequency table that represents the data? Use intervals of 5.
7 17 14 2 7 9 5 12 3 10 4 12 7 15
8. Complete the boxes to show the end of each interval of 5. Then count the number of home-run data values in the interval and complete the blanks on the right.
1–5 There is/are data value(s) in this interval.
6– There is/are data value(s) in this interval.
11– There is/are data value(s) in this interval.
16– There is/are data value(s) in this interval.
9. Use your findings to make a frequency table.
A histogram is a graph that can display data from a frequency table. A histogram has one bar for each interval. The height of each bar shows the frequency of the interval it represents. There are no gaps between bars. The bars are often of equal width.
Making a Histogram
Got It? The finishing times, in seconds, for a race are shown below. What is a histogram that represents the data?
95 105 83 80 93 98 102 99 82 89 90 82 89
10. Multiple Choice Which of the following sets of intervals could be used for a frequency table to represent the data?
85–90 91–96 97–102103–108
80–85 86–91 92–97 98–103104–109
80–85 90–95 96–101102–107
80–85 85–90 90–95 95–100100–105
A frequency table groups a set of data values into intervals and shows the frequency for each interval. Intervals in frequency tables do not overlap, do not have any gaps, and are usually of equal size.
HSM12A1MC_1202.indd 347 3/18/11 5:27:58 PM
Cop
yrig
ht ©
by
Pear
son
Educ
atio
n, In
c. o
r its
aff
iliat
es. A
ll Ri
ghts
Res
erve
d.
Problem 3
HSM11_A1MC_1202_T91454
Time (s)
–
–
–
–
–
Frequency
Freq
uency
HSM11_A1MC_1202_T91455
Race Times
HSM11_A1MC_1202_T91456
Freq
uenc
y
Dollars Spent
Cost of Lunch
1–5
6–10
11–15
16–20
1
2
3
4
HSM11_A1MC_1202_T91457
Freq
uenc
y
Dollars Spent
Cost of Lunch
1–5
6–10
11–15
16–20
1
2
3
4
Freq
uenc
y
Dollars Spent
HSM11_A1MC_1202_T91458
Cost of Lunch
1–5
6–10
11–15
16–20
1
2
3
4
Chapter 12 348
11. Use your answer from Exercise 10 12. Draw a histogram on the axes provided. to make a frequency table.
You can describe a histogram by its shape.
• If the bars are roughly the same height, the histogram has a uniform shape.
• If you can draw a vertical line that divides a histogram into two parts that are close to mirror images, then the histogram has a symmetric shape.
• If the histogram has one peak that is not in the center, the histogram has a skewed shape.
Interpreting Histograms
Got It? The following set of data shows the numbers of dollars Jay spent on lunch over the last two weeks. Make a histogram of the data. Is the histogram uniform, symmetric, or skewed?
17 1 4 11 14 14 5 16 6 5 9 10 13 9
13. Cross out the histograms that do NOT represent the data.
14. Circle the word that best describes the histogram you did not cross out in Exercise 13.
uniform symmetric skewed
HSM12A1MC_1202.indd 348 3/18/11 5:28:32 PM
Cop
yrig
ht ©
by
Pear
son
Educ
atio
n, In
c. o
r its
aff
iliat
es. A
ll Ri
ghts
Res
erve
d.
Math Success
Now Iget it!
Need toreview
0 2 4 6 8 10
Lesson Check
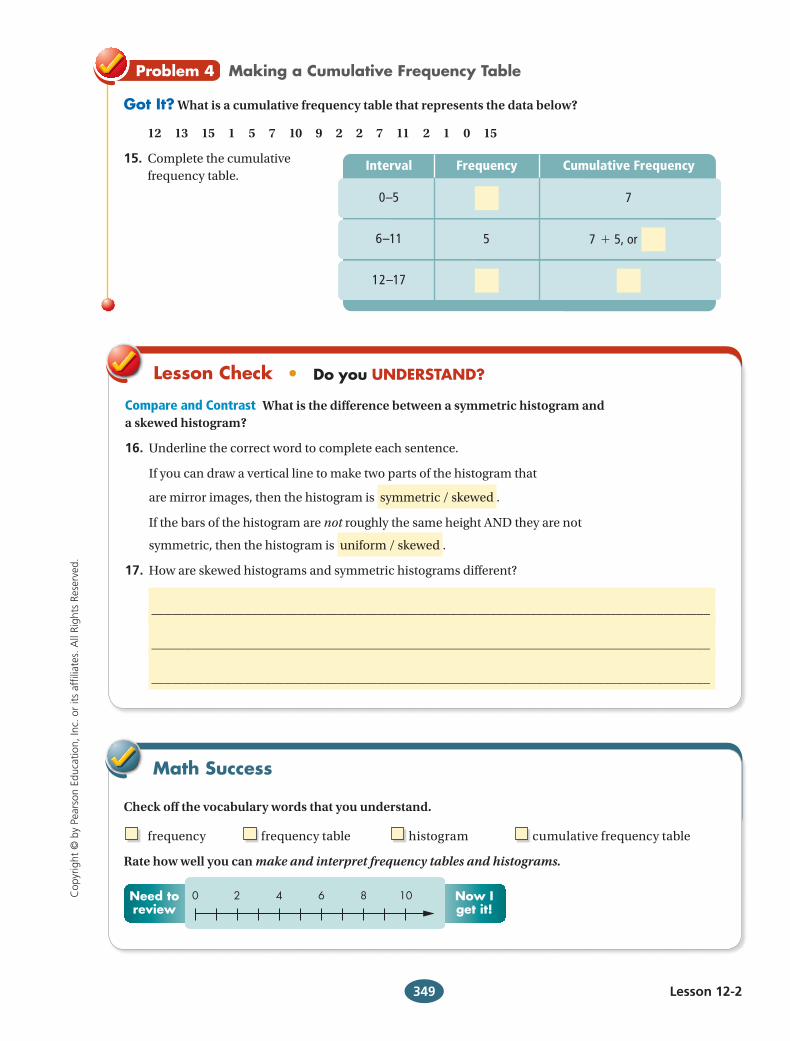
Problem 4
HSM11_A1MC_1202_T91459
Interval Frequency Cumulative Frequency
0–5
6–11 7 + 5, or5
7
12–17
349 Lesson 12-2
Check off the vocabulary words that you understand.
frequency frequency table histogram cumulative frequency table
Rate how well you can make and interpret frequency tables and histograms.
• Do you UNDERSTAND?
Compare and Contrast What is the difference between a symmetric histogram and a skewed histogram?
16. Underline the correct word to complete each sentence.
If you can draw a vertical line to make two parts of the histogram that
are mirror images, then the histogram is symmetric / skewed .
If the bars of the histogram are not roughly the same height AND they are not
symmetric, then the histogram is uniform / skewed .
17. How are skewed histograms and symmetric histograms different?
____________________________________________________________________________________
____________________________________________________________________________________
____________________________________________________________________________________
Making a Cumulative Frequency Table
Got It? What is a cumulative frequency table that represents the data below?
12 13 15 1 5 7 10 9 2 2 7 11 2 1 0 15
15. Complete the cumulative frequency table.
HSM12A1MC_1202.indd 349 3/18/11 5:29:05 PM