Embed Size (px)
Citation preview
Vlerick Policy Paper Series
No. 7
The Future of Access to Innovative Medicines in Cancer Therapy:
Towards Conditional Dialogue Fostering Affordable Therapeutic
Innovation
September 2016
Walter Van Dyck
Jacques De Grève
Rik Schots
Ahmad Awada
Tine Geldof
2
The Future of Access to Innovative Medicines in Cancer Therapy:
Towards Conditional Dialogue Fostering Affordable Therapeutic
Innovation
Vlerick Policy Paper Series
September 2016
This paper is endorsed by:
the Belgian Society for Medical Oncology
the Belgian Haematological Society
the College of Oncology
3
Table of Content
Acronyms and Abbreviations ................................................................................... 5
Acknowledgements ................................................................................................ 7
Foreword.............................................................................................................. 8
Executive Summary ............................................................................................... 9
1. Introduction .................................................................................................. 12
2. The Burden of Cancer in Belgium – Epidemiology............................................... 14
2.1 Incidence ................................................................................................... 16
2.2 Mortality .................................................................................................... 18
2.3 Evolution of Cancer Incidence, 2004-2013 ..................................................... 19
2.4 Evolution of Cancer Mortality, 2004-2012 ...................................................... 20
2.5 Projection 2025 .......................................................................................... 21
2.6 Survival ..................................................................................................... 21
2.7 The Belgian Cancer Registry ......................................................................... 23
2.8 Epidemiological Conclusions ......................................................................... 25
2.9 Recommendations ....................................................................................... 25
3. Future Developments in Oncological Medical Innovation ..................................... 26
3.1 Driving forces of oncological medical innovation .............................................. 26
3.2 The evolutionary nature of anti-cancer drug development ................................ 28
3.3 Cancer treatment R&D races too much in overlapping domains ......................... 30
3.4 Cancer research is expensive ....................................................................... 32
3.5 The difficulty of assessing value in oncology ................................................... 33
3.6 Towards precision medicine .......................................................................... 34
3.7 Conclusions ................................................................................................ 35
4. Funding of Access to Therapeutic Innovation in Oncology ................................... 36
4.1 A 2020 Oncology Horizon Scan ..................................................................... 37
Fit with the 2015 Minister’s Growth Pact ........................................................... 41
4.2 A first role of competition in a Conditional Dialogue between Payers and Industry42
4.3 Recommendations ....................................................................................... 43
5. The Need for Early Involvement in Adaptive Pathways-enabled Medicines
Development ...................................................................................................... 44
5.1 Stimulating research into areas of unmet need ............................................... 45
5.2 Towards open collaborative Adaptive Pathways and Adaptive Licensing ............. 46
4
5.3 Recommendations ....................................................................................... 47
6. Accelerating Access to Affordable Innovative Medicines in Oncology ..................... 49
6.1 Dealing with unsustainable prices in oncology ................................................. 51
6.2 Negotiating following value-based principles pricing ........................................ 54
6.3 Pricing based on comparative effectiveness .................................................... 56
Superior comparable effectiveness ................................................................... 56
Comparable comparative effectiveness ............................................................. 57
Still insufficient comparable comparative effectiveness ....................................... 58
6.5 Multi-indication pricing ................................................................................ 59
6.6 Recommendations ....................................................................................... 60
7. Building a Learning Healthcare System in Oncology ........................................... 62
7.1 Operating the Oncology Healthcare Learning System ....................................... 63
Towards a conditional approval and pricing & reimbursement process .................. 63
Registries-based or science-based research? ..................................................... 64
7.2 Towards Dynamic Pricing ............................................................................. 65
7.3 Towards an outcome-based healthcare learning system ................................... 66
The need for cancer networks and a Trusted Third Party ..................................... 68
7.4 Recommendations ....................................................................................... 69
8. Conclusions and Recommendations .................................................................. 70
Summary Recommendations .............................................................................. 71
Acting with foresight ...................................................................................... 71
Early dialogue between manufacturer and payer ................................................ 71
An integrated foresight, access & pricing system ............................................... 72
Value-based and competition-based pricing ...................................................... 72
Founded on an outcome-based disease-centric healthcare learning system ........... 73
References ......................................................................................................... 74
Appendix I: Assumptions for the 2020 Budget Projection ......................................... 80
Appendix II: Overview of Innovative Cancer Treatments reimbursed in Belgium in 2016
......................................................................................................................... 85
5
Acronyms and Abbreviations
BCR Belgian Cancer Registry
BIA Budget Impact Analysis
CAGR Compound Annual Growth Rate
CAR Chimeric Antigen Receptor
CED Coverage with Evidence Development
CIVARS Chapter IV Agreement Requesting System
CRM/CTG Commission Remboursement des Médicaments/Commissie Terugbetaling
Geneesmiddelen
DALY Disability-Adjusted Life Year
DDD Defined Daily Dose
HER Electronic Health Record
EMA European Medicines Agency
EPD Electronisch Patiënten Dossier
ETA/ETR Early Temporary Access / Reimbursement
ERP External Reference Pricing
ESMO-MCBS European Society for Medical Oncology Magnitude of Clinical Benefit Scale
ESR European Standard Rate
FAMP Federal Agency for Medicines and Health Products
GP General Practitioner
GDP Gross Domestic Product
HTA Health Technology Assessment
IARC International Agency for Research on Cancer
ICER Incremental Cost Effectiveness Ratio
IMA-AIM Intermutualistic Agency (Belgian association amongst sick funds)
ISPOR International Society for Pharmacoeconomics and Outcomes research
MCDA Multi Criterion Decision Analysis
MCDD Multi Criterion Decision Deliberation
MEA Market Entry Agreement
MOC Multidisciplinary Oncological Consult
NHB Net Health Benefit
6
NIHDI Belgian National Institute for Health and Disability Insurance
(NIHDI/RIZIV/INAMI)
OS Overall Survival
PASS/PAES Post-authorization Safety and Effectiveness Studies
PFS Progression Free Survival
PFP Pay For Performance
PMx Personalized Medicines
QALY Quality Adjusted Life Year
PASS/PAES Post Authorization Safety and Effectiveness Studies
PBA Performance Based Agreement
RCT Randomized Clinical Trial
RR Response Rate
RSR Relative Survival Rate
RWE Real World Evidence
STAMP Safe and Timely Access to Medicines
TTP Trusted Third Party
WTP Willingness To Pay
WSR World Standardised Incidence Rates
7
Acknowledgements
Having been established in the field of financial services, this paper is the first issue of the
Vlerick Policy Paper Series to appear in the domain of healthcare policy.
Chosen themes, scientific and technical data, expressed viewpoints and policy
recommendations are under the full responsibility of the authors only. Only the authors
are responsible for possible errors or omissions1.
The authors want to acknowledge and sincerely thank Dr. Liesbeth Van Eycken, Director
of the Belgian Cancer Registry for her major contribution and recommendations related to
disease epidemiology and data registration made in the second chapter of this report.
Furthermore, the author’s viewpoints did benefit greatly from the personal insights
gathered from a distinguished list of experts, and also collected during the Vlerick HMC
Workshop on Real World Evidence held in February 2016 in Brussels and the KCE-ZIN Drug
Pricing Scenarios Project workshops held in April-May 2016 in Amsterdam.
In this respect, we are particularly grateful to:
Lieven Annemans (Health Economics, UGent), Francis Arickx (NIHDI, Brussel), Peter Bach
(Memorial Sloan Kettering Cancer Centre, New York), Katelijne De Nys (CTG/KU Leuven),
Ri De Ridder (NIHDI, Brussels), Joeri Guillaume (IMA-AIM, Brussels), Ansgar Hebborn
(Roche, Basel Switzerland), Yves Horsmans (CTG, UCL Hepathology), Isabelle Huys
(pharmaceutical faculty KU Leuven), Panos Kanavos (London School of Economics Health,
London), Marc Peeters (UZA, Antwerpen), Steven Simoens (Pharmacoeconomics, KU
Leuven), Françoise Stryckmans (pharma.be, Brussels), Mark Trusheim (MIT, Boston
Massachusetts), Anouk Waeytens (NIHDI, Brussels), Entela Xoxi (AIFA, Milano).
1 The authors or the organisations they represent received no grants or payments related to this work. Vlerick Business School only was the recipient of an unconditional grant from Roche to logistically support its Healthcare Management Centre.
8
Foreword
Cancer as a therapeutic domain has been and still is largely underserved compared to
other domains. This leaves many cancer patients ultimately with unresolved high medical
needs. In recent years an acceleration in therapeutic innovation is creating high hopes.
Especially (but not only) novel immunotherapies as a new modality in addition to
chemotherapy, hormonal therapies and targeted agents are literally shaking up
longstanding treatment algorithms and their promising broad applicability will create a
tsunami effect of opportunities for patients but also a challenge for payers. In contrast to
earlier innovations which were often directed at specific cancer (sub)populations, these
treatments represent cancer-wide innovation. Not only the broad applicability, but also the
high success rate of the ongoing clinical trials are changing variables in previously
elaborated predictive budget models.
With prices listed there is a strong perception that budgetary impact for payers will be
unprecedented and unaffordable in current prospects.
In the current work we have attempted to estimate these adapted budgetary prospects
taking into account all major identifiable variables and secondly we have pondered on how
the affordability could be realized at a societal level and without introducing any financial
burden on the individual patient level.
We have done this work in collaboration between medical and economical expertise.
We believe that the coming innovations can be affordable pending recognition of an
objective need for a (reasonable) budgetary increase for cancer medicines, the medicine
domain with the greatest ongoing innovation wave and adaptations in the interaction
between pharma and payers in letting market forces regulate prices more than today. We
believe that contrary to current thinking, this can be implemented, maybe at the expense
of me-too and futile developments but without jeopardizing true innovation.
The authors
9
Executive Summary
Cancer represents the second highest cause of disease burden on Belgian society for the
foreseeable future. In the field of oncology, next to advances in molecular biology,
bioinformatics or diagnostic imaging, surgical interventions, radiotherapy and drug-based
therapies are the health technologies used to save or extend patient life or to improve its
quality.
Belgium’s total healthcare spend as a percentage of GDP is commensurate with its
economic productivity or societal wealth. Total drug spend and growth rates are in line
with the other European developed health care markets (EU-18), all providing universal
care and facing similar funding constraints of budgets under continued austerity. However,
its proportional spend on drug-based therapeutic technology compared to disease burden
in Oncology is below average and below other therapeutic areas. Still, Belgium is among
the leading countries in survival rates for most prominent cancers.
Until 2013 this historical underspending was caused by the innovative drug-based cancer
therapy pipeline essentially being flat due to late-stage development failure. Now, as
evidenced in this study the last years the world is experiencing a surge in –expensive–
innovative targeted therapies and in particular immunotherapies now rapidly becoming
accessible. In contrast to earlier developments these latter therapies are characterised by
a highly successful and accelerated clinical development. Following our horizon scanning
results, by 2020 innovative drug-based cancer treatments will represent more than 70%
of the total cancer drug budget in Belgium and all cancer drugs will consume a quarter of
the total pharmaceutical specialties budget projected to be then around €4.6 billion. To
fund the projected 2016 – 2020 oncology innovation pipeline, given the fixed
pharmaceutical specialties budget annual growth rates agreed upon with industry in the
Minister’s Summer 2015 Growth Pact, the agreed upon budget is in line with the needs for
innovation until 2017. However, it will be exceeded in 2018 when then starting to be
confronted with a significant raise in budgetary needs caused by a pipeline of innovative
therapies becoming accessible to the patient.
As a result, given their high-cost nature and amplified by the more general applicability of
immunotherapies across a broad range of indications this will severely stress the Belgian
pharmaceutical specialties budget for the years to come. Hence, we believe that health
care policy and the payer decision making process needs to be adapted to ensure that
patients can have optimal access to the upcoming innovations without any social
discrimination while at the same time the affordability of our healthcare system in the long
run should be guaranteed.
To do so, we will argue that the future of access to innovative medicine-based therapies
is about society engaging into a ‘conditional’ dialogue’ with the innovative
biopharmaceutical industry, centred on competition and being rewarded for therapeutic
innovation. Society engaging into a conditional dialogue acknowledges that industry has
an obligation to satisfy shareholder expected return whilst engaging in high-risk research
but also the corporate social responsibility to serve the public good to make people better
on conditions society can afford.
10
In this paradigm, the dialogue between payer and manufacturer is initiated conditional on
the acclaimed high potential level of therapeutic innovation and continued conditional on
clinical and real-world outcome delivered fighting unmet medical need. Hence, lower levels
of ‘me-too’ therapeutic innovation will face more competition in market access and
reimbursement decision processes. Higher levels of therapeutic innovation, potentially
offering ‘breakthrough’ medical benefits can be reviewed at an accelerated pace and be
conditionally accepted on the market until real-world evidence gathered confirms up-front
claimed performance, after which market access and a fixed price can be assumed for a
set time period. For incumbent therapies being superseded by novel therapies delivering
better real world outcome the dialogue is stopped and the product is eventually de-
reimbursed.
The implementation of a conditional dialogue between society and the innovative medical
industry hinges on five principles; (1) acting with foresight, (2) early dialogue between
manufacturer and payer, (3) an integrated foresight, access & pricing system, (4) value-
based and competition-based market access, and be (5) founded on an outcome-based
disease-centric healthcare learning system.
Acting with foresight implies installing a longer-term agreement between the payer and
industry to become an institutionalised part of a systematic horizon scanning system. The
latter system, starting from the unmet patient needs is able to confront demand and supply
of innovative medical technology over a sufficiently long time horizon. This will enable
timely health budget prioritization and early identification of promising candidate
therapies. Given that constrained health budgets call for making –often hard– budget
allocation choices, this principle, together with the implementation of a disease-centric
outcome-based healthcare learning system should be given the highest priority.
The first while providing the priority areas of unmet need on which to focus early dialogue
between manufacturer and payer accelerating access to potentially promising innovation.
And for being the foundation of a value-based and competition-based pricing system to be
implemented that could curb excessive cost while still incentivising innovation. Value-
based competitive pricing uses principles of competition between similar innovative drugs
and dynamic outcome-based pricing to conditionally provide continued access and
reimbursement for drug-based cancer therapies i.e. rewarding comparative effectiveness
as shown in real life. Disease-centric registries allow for competitive comparison of cost-
effectiveness of various treatment strategies.
The authors are convinced that moving towards a more competitive pricing system for
market access even for innovative drugs will not endanger innovation, but rather foster
the initiation of true innovation. More specifically, previous pharmaceconomic research
shows that the use of price competition (in overcrowded on-patent areas) and R&D
competition (in areas with high breakthrough potential) promoted respectively by payers
and investors has a positive downward effect on novel therapy price, on the speed with
which novel therapies are discovered in domains of high unmet medical need, and on
avoiding monopolistic therapy markets.
11
In conclusion, sustainably providing patients with socially equitable access to the
delivering drug-based cancer treatment pipeline in these times of austerity calls for health
budget prioritization and competitive real outcome-based prices at a level society can
afford. A conditional dialogue between society and the innovative biopharmaceutical
industry is a prerequisite and a guarantee to make this happen.
12
1. Introduction
Cancer represents the second highest cause of disease burden on Belgian society for the
foreseeable future. In the field of oncology, next to advances in molecular biology,
bioinformatics or diagnostic imaging, surgical interventions, radiotherapy and drug-based
therapies are the health technologies used to save or extend patient life or to improve its
quality (Adams, Bessant, & Phelps, 2006).
Belgium’s total healthcare spend as a percentage of GDP is commensurate with its
economic productivity or societal wealth. Its proportional spend on drug-based therapeutic
technology compared to disease burden in Oncology is below average while keeping total
drug spend and growth rates in line with the other European developed health care
markets (EU-18), all providing universal care and facing similar funding constraints of
budgets under continued austerity. Belgium is among the leading countries in survival
rates for most prominent cancers.
While this provides apparent evidence for the cost-effectiveness of present Belgian
healthcare policy governing the use of oncological medicines-based therapy, its robustness
against future shocks caused by an extremely promising pipeline of breakthrough
innovative but expensive drug-based targeted and immunotherapies now materializing
and becoming accessible to the patient, remains to be proven.
In this Policy Paper we will argue that the future of access to innovative medicine-based
therapies is about society engaging into a ‘conditional’ dialogue with the innovative
biopharmaceutical industry, centred on therapeutic innovation and competition.
First, we provide an overview of the epidemiological trends in the field of cancer and
discuss the present and suggested future role of the Belgian Cancer Registry in
understanding and managing cancer. Then, we present an overview of the evolutions in
drug-based therapeutic innovation, which is essential to understand the regulatory
innovation and health policy changes needed to manage for affordable access to these
innovative medicines in a sustainable way i.e. preserving the biopharmaceutical industry’s
potential for future innovation.
Second, taking as a basis the budgetary needs following from the pipeline of emerging
innovative targeted therapies and immunotherapies we confront this with the Minister of
Health and Wellbeing’s Pact for Growth convened with the biopharmaceutical industry in
Summer 2015. Here, it will be argued that such a dialogue with industry will have to be
institutionalized into a future horizon scanning system incorporating a transversal
budgeting system for health budgets.
Then, in the following chapters we take the medicinal innovation and access process as
the basis to discuss how the conditional dialogue between institutional parties and
innovative biopharmaceutical industry could be shaped to ultimately bring safe and
affordable medicines that respond to patient’s unmet needs and respect the current social
equality of access to anticancer drugs in Belgium.
The implementation of a conditional dialogue between society and the innovative medical
industry hinges on five principles; (1) acting with foresight, (2) early dialogue between
13
manufacturer and payer, (3) an integrated foresight, access & pricing system, (4) value-
based and competition-based market access, and be (5) founded on an outcome-based
disease-centric healthcare learning system.
Doing so, the conditional dialogue will ensure expedited affordable access to and foster
future therapeutic innovation while guaranteeing value-based prices for new
pharmaceuticals.
We conclude each Chapter of this Policy Paper with a set of recommendations for health
policy makers, healthcare providers and health services, and industry alike.
For summary conclusions and an overview of all recommendations made by this study to
implement a conditional dialogue paradigm between society and industry the reader is
referred to the last Chapter.
14
2. The Burden of Cancer in Belgium – Epidemiology
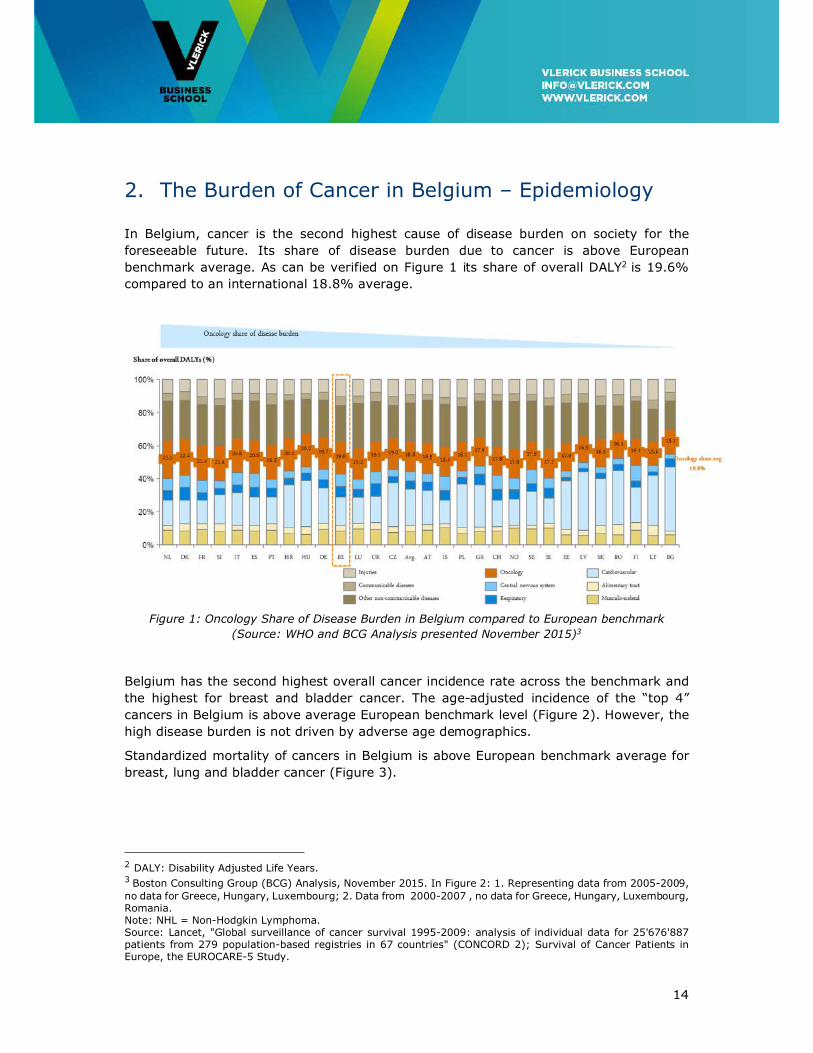
In Belgium, cancer is the second highest cause of disease burden on society for the
foreseeable future. Its share of disease burden due to cancer is above European
benchmark average. As can be verified on Figure 1 its share of overall DALY2 is 19.6%
compared to an international 18.8% average.
Figure 1: Oncology Share of Disease Burden in Belgium compared to European benchmark
(Source: WHO and BCG Analysis presented November 2015)3
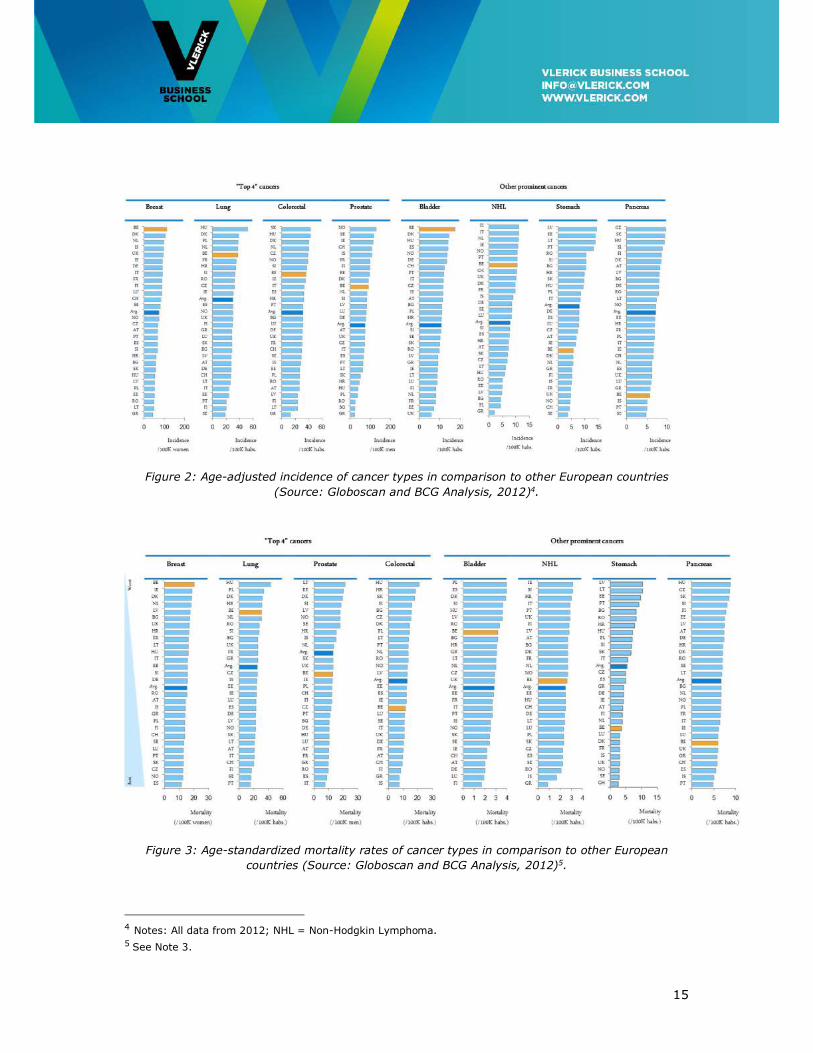
Belgium has the second highest overall cancer incidence rate across the benchmark and
the highest for breast and bladder cancer. The age-adjusted incidence of the “top 4”
cancers in Belgium is above average European benchmark level (Figure 2). However, the
high disease burden is not driven by adverse age demographics.
Standardized mortality of cancers in Belgium is above European benchmark average for
breast, lung and bladder cancer (Figure 3).
2 DALY: Disability Adjusted Life Years. 3 Boston Consulting Group (BCG) Analysis, November 2015. In Figure 2: 1. Representing data from 2005-2009, no data for Greece, Hungary, Luxembourg; 2. Data from 2000-2007 , no data for Greece, Hungary, Luxembourg, Romania. Note: NHL = Non-Hodgkin Lymphoma. Source: Lancet, "Global surveillance of cancer survival 1995-2009: analysis of individual data for 25'676'887 patients from 279 population-based registries in 67 countries" (CONCORD 2); Survival of Cancer Patients in Europe, the EUROCARE-5 Study.
15
Figure 2: Age-adjusted incidence of cancer types in comparison to other European countries
(Source: Globoscan and BCG Analysis, 2012)4.
Figure 3: Age-standardized mortality rates of cancer types in comparison to other European
countries (Source: Globoscan and BCG Analysis, 2012)5.
4 Notes: All data from 2012; NHL = Non-Hodgkin Lymphoma. 5 See Note 3.
16
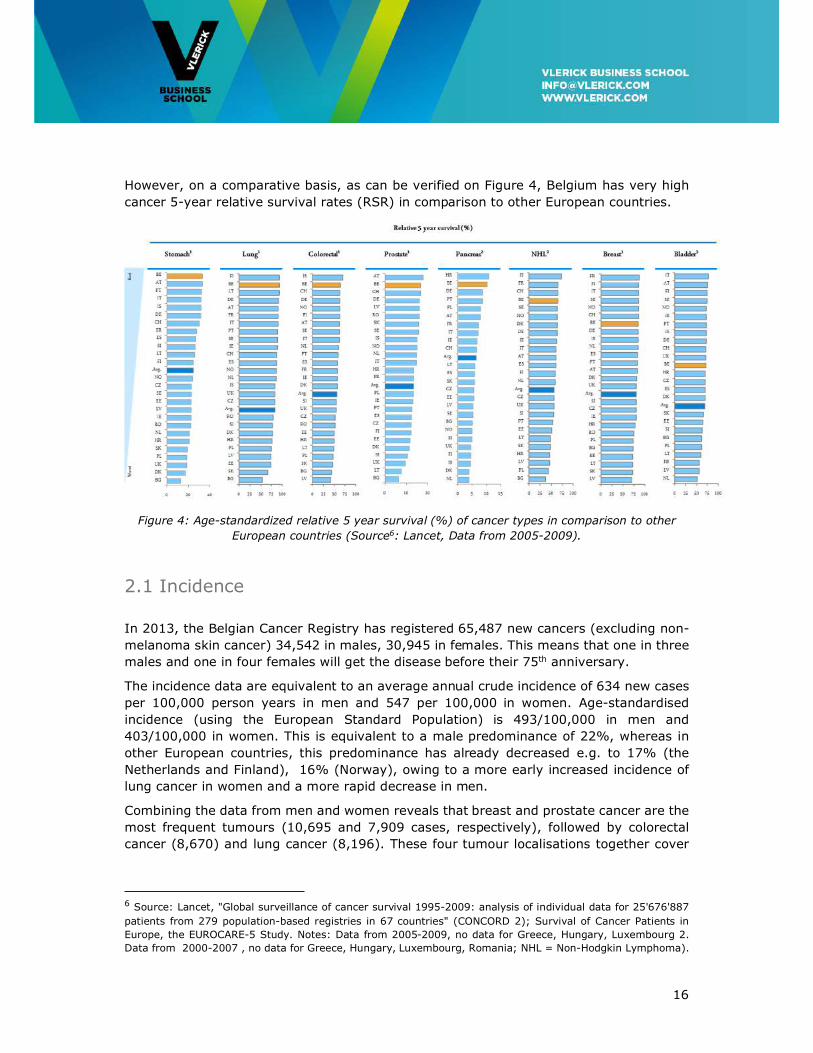
However, on a comparative basis, as can be verified on Figure 4, Belgium has very high
cancer 5-year relative survival rates (RSR) in comparison to other European countries.
Figure 4: Age-standardized relative 5 year survival (%) of cancer types in comparison to other
European countries (Source6: Lancet, Data from 2005-2009).
2.1 Incidence
In 2013, the Belgian Cancer Registry has registered 65,487 new cancers (excluding non-
melanoma skin cancer) 34,542 in males, 30,945 in females. This means that one in three
males and one in four females will get the disease before their 75th anniversary.
The incidence data are equivalent to an average annual crude incidence of 634 new cases
per 100,000 person years in men and 547 per 100,000 in women. Age-standardised
incidence (using the European Standard Population) is 493/100,000 in men and
403/100,000 in women. This is equivalent to a male predominance of 22%, whereas in
other European countries, this predominance has already decreased e.g. to 17% (the
Netherlands and Finland), 16% (Norway), owing to a more early increased incidence of
lung cancer in women and a more rapid decrease in men.
Combining the data from men and women reveals that breast and prostate cancer are the
most frequent tumours (10,695 and 7,909 cases, respectively), followed by colorectal
cancer (8,670) and lung cancer (8,196). These four tumour localisations together cover
6 Source: Lancet, "Global surveillance of cancer survival 1995-2009: analysis of individual data for 25'676'887
patients from 279 population-based registries in 67 countries" (CONCORD 2); Survival of Cancer Patients in
Europe, the EUROCARE-5 Study. Notes: Data from 2005-2009, no data for Greece, Hungary, Luxembourg 2.
Data from 2000-2007 , no data for Greece, Hungary, Luxembourg, Romania; NHL = Non-Hodgkin Lymphoma).
17
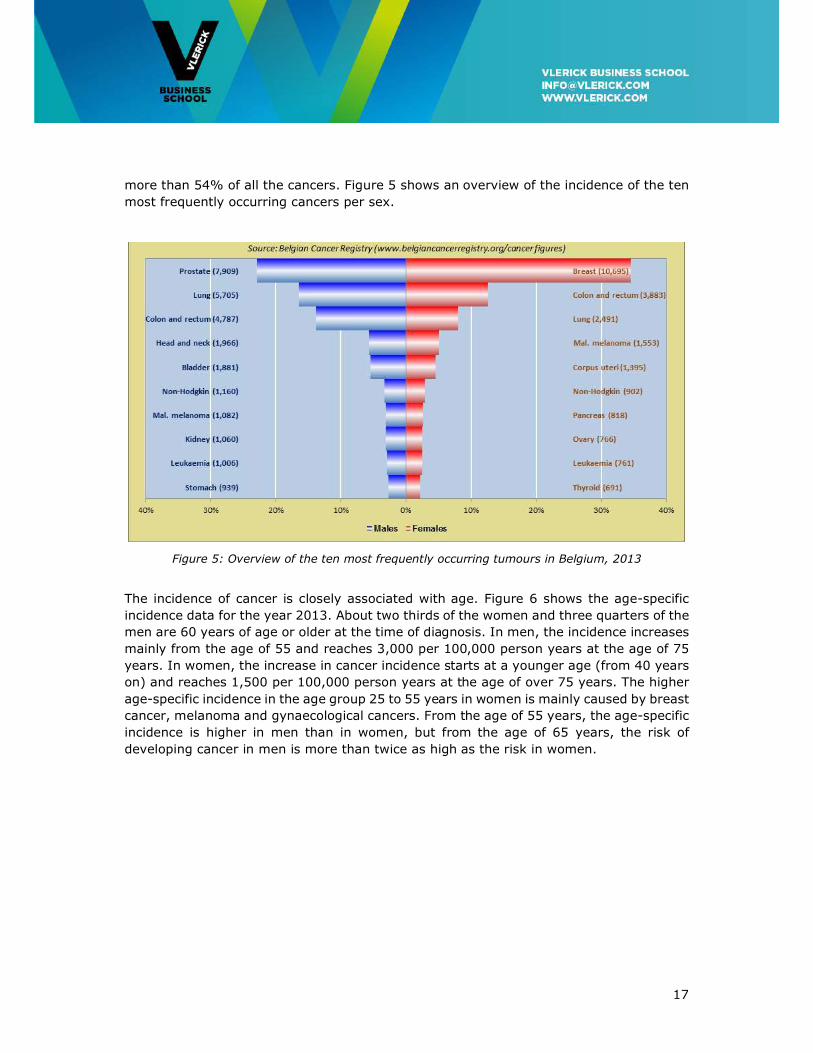
more than 54% of all the cancers. Figure 5 shows an overview of the incidence of the ten
most frequently occurring cancers per sex.
Figure 5: Overview of the ten most frequently occurring tumours in Belgium, 2013
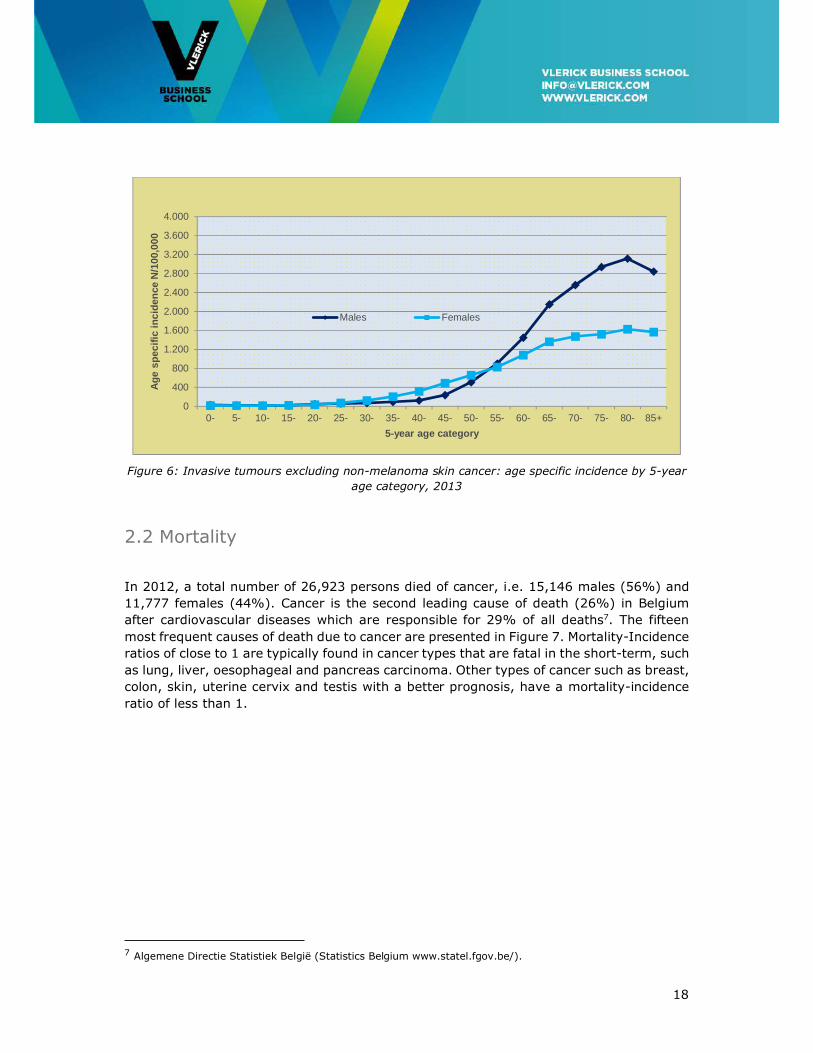
The incidence of cancer is closely associated with age. Figure 6 shows the age-specific
incidence data for the year 2013. About two thirds of the women and three quarters of the
men are 60 years of age or older at the time of diagnosis. In men, the incidence increases
mainly from the age of 55 and reaches 3,000 per 100,000 person years at the age of 75
years. In women, the increase in cancer incidence starts at a younger age (from 40 years
on) and reaches 1,500 per 100,000 person years at the age of over 75 years. The higher
age-specific incidence in the age group 25 to 55 years in women is mainly caused by breast
cancer, melanoma and gynaecological cancers. From the age of 55 years, the age-specific
incidence is higher in men than in women, but from the age of 65 years, the risk of
developing cancer in men is more than twice as high as the risk in women.
18
Figure 6: Invasive tumours excluding non-melanoma skin cancer: age specific incidence by 5-year
age category, 2013
2.2 Mortality
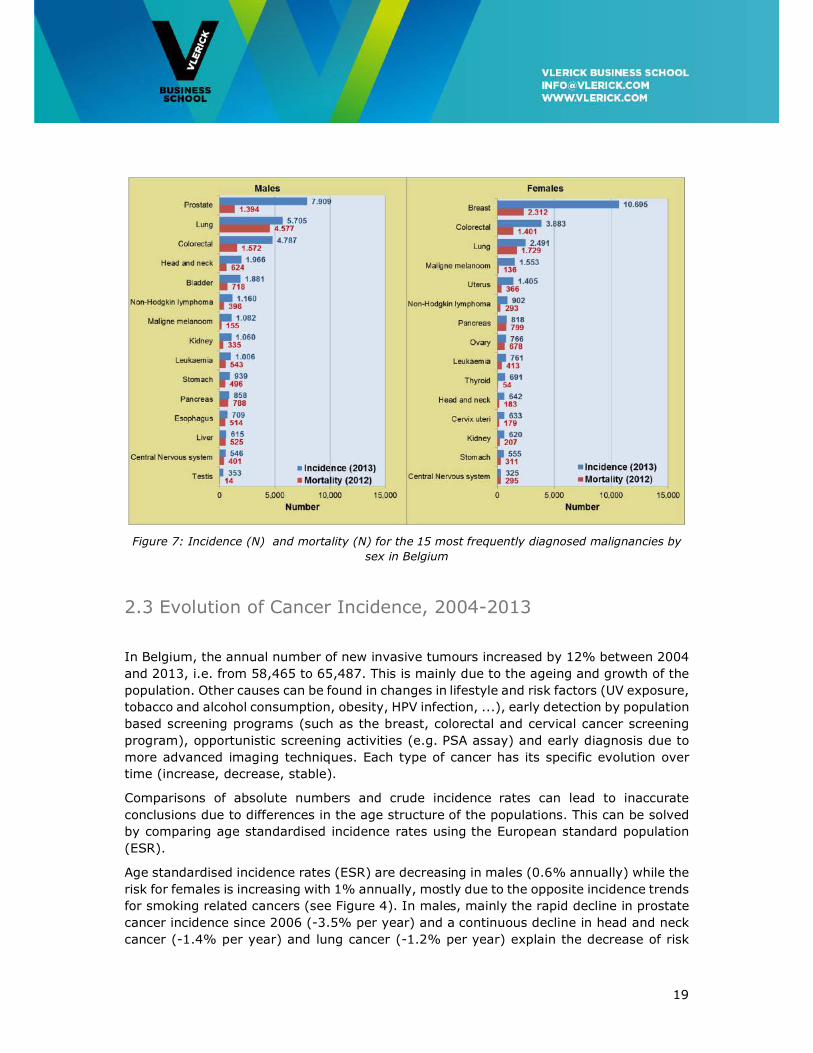
In 2012, a total number of 26,923 persons died of cancer, i.e. 15,146 males (56%) and
11,777 females (44%). Cancer is the second leading cause of death (26%) in Belgium
after cardiovascular diseases which are responsible for 29% of all deaths7. The fifteen
most frequent causes of death due to cancer are presented in Figure 7. Mortality-Incidence
ratios of close to 1 are typically found in cancer types that are fatal in the short-term, such
as lung, liver, oesophageal and pancreas carcinoma. Other types of cancer such as breast,
colon, skin, uterine cervix and testis with a better prognosis, have a mortality-incidence
ratio of less than 1.
7 Algemene Directie Statistiek België (Statistics Belgium www.statel.fgov.be/).
0
400
800
1.200
1.600
2.000
2.400
2.800
3.200
3.600
4.000
0- 5- 10- 15- 20- 25- 30- 35- 40- 45- 50- 55- 60- 65- 70- 75- 80- 85+
Ag
e sp
ecif
ic in
cid
ence
N/1
00,0
00
5-year age category
Males Females
19
Figure 7: Incidence (N) and mortality (N) for the 15 most frequently diagnosed malignancies by
sex in Belgium
2.3 Evolution of Cancer Incidence, 2004-2013
In Belgium, the annual number of new invasive tumours increased by 12% between 2004
and 2013, i.e. from 58,465 to 65,487. This is mainly due to the ageing and growth of the
population. Other causes can be found in changes in lifestyle and risk factors (UV exposure,
tobacco and alcohol consumption, obesity, HPV infection, ...), early detection by population
based screening programs (such as the breast, colorectal and cervical cancer screening
program), opportunistic screening activities (e.g. PSA assay) and early diagnosis due to
more advanced imaging techniques. Each type of cancer has its specific evolution over
time (increase, decrease, stable).
Comparisons of absolute numbers and crude incidence rates can lead to inaccurate
conclusions due to differences in the age structure of the populations. This can be solved
by comparing age standardised incidence rates using the European standard population
(ESR).
Age standardised incidence rates (ESR) are decreasing in males (0.6% annually) while the
risk for females is increasing with 1% annually, mostly due to the opposite incidence trends
for smoking related cancers (see Figure 4). In males, mainly the rapid decline in prostate
cancer incidence since 2006 (-3.5% per year) and a continuous decline in head and neck
cancer (-1.4% per year) and lung cancer (-1.2% per year) explain the decrease of risk
20
over time. Cancer incidence in females increases by 1% per year due to the growing
incidence rate of tobacco related cancers (especially lung cancer and head and neck
cancer). Women started smoking later than men and its impact is now being felt in the
figures. The average latency between cigarette smoking and lung cancer is about 30 years
(Weiss, 1997).
2.4 Evolution of Cancer Mortality, 2004-2012
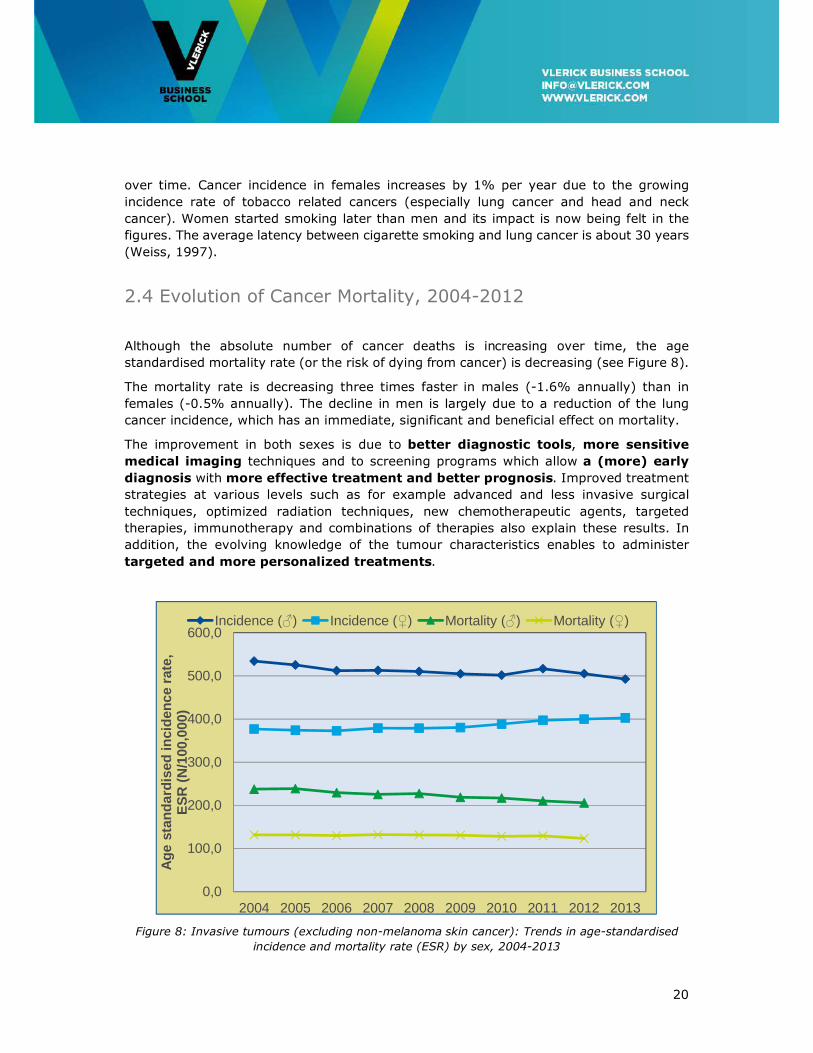
Although the absolute number of cancer deaths is increasing over time, the age
standardised mortality rate (or the risk of dying from cancer) is decreasing (see Figure 8).
The mortality rate is decreasing three times faster in males (-1.6% annually) than in
females (-0.5% annually). The decline in men is largely due to a reduction of the lung
cancer incidence, which has an immediate, significant and beneficial effect on mortality.
The improvement in both sexes is due to better diagnostic tools, more sensitive
medical imaging techniques and to screening programs which allow a (more) early
diagnosis with more effective treatment and better prognosis. Improved treatment
strategies at various levels such as for example advanced and less invasive surgical
techniques, optimized radiation techniques, new chemotherapeutic agents, targeted
therapies, immunotherapy and combinations of therapies also explain these results. In
addition, the evolving knowledge of the tumour characteristics enables to administer
targeted and more personalized treatments.
Figure 8: Invasive tumours (excluding non-melanoma skin cancer): Trends in age-standardised
incidence and mortality rate (ESR) by sex, 2004-2013
0,0
100,0
200,0
300,0
400,0
500,0
600,0
2004 2005 2006 2007 2008 2009 2010 2011 2012 2013
Ag
e st
and
ard
ised
inci
den
ce r
ate,
E
SR
(N
/100
,000
)
Incidence (♂) Incidence (♀) Mortality (♂) Mortality (♀)
21
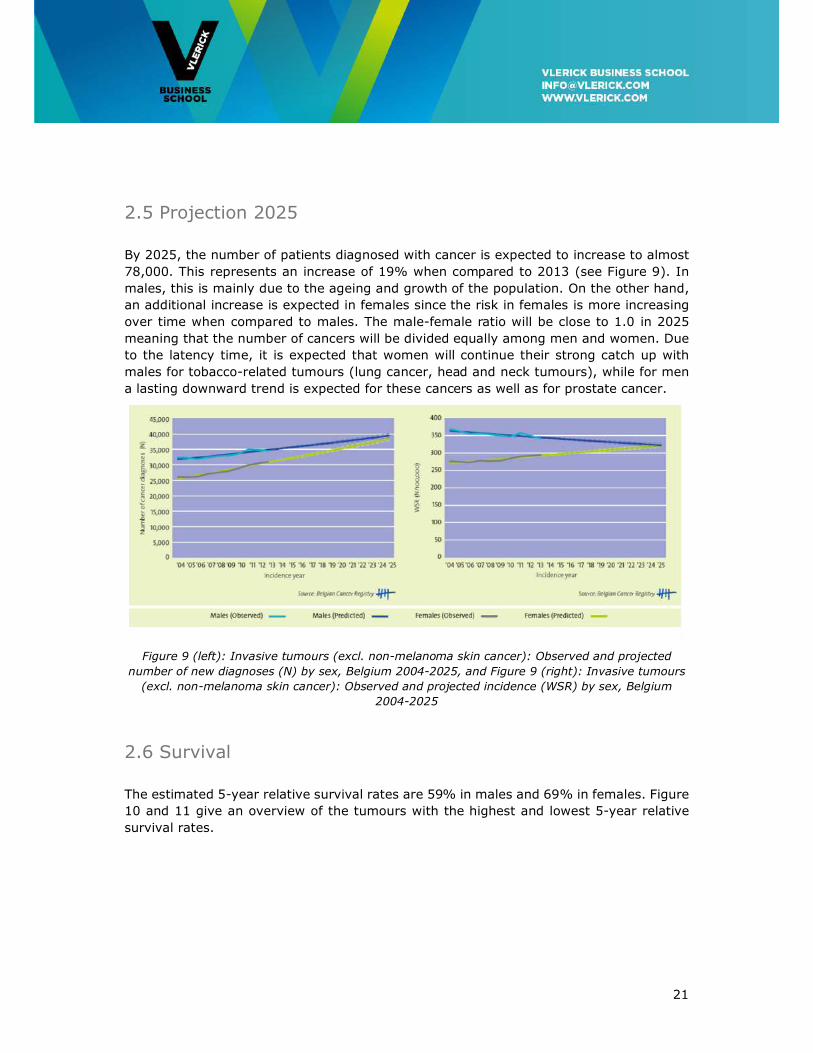
2.5 Projection 2025
By 2025, the number of patients diagnosed with cancer is expected to increase to almost
78,000. This represents an increase of 19% when compared to 2013 (see Figure 9). In
males, this is mainly due to the ageing and growth of the population. On the other hand,
an additional increase is expected in females since the risk in females is more increasing
over time when compared to males. The male-female ratio will be close to 1.0 in 2025
meaning that the number of cancers will be divided equally among men and women. Due
to the latency time, it is expected that women will continue their strong catch up with
males for tobacco-related tumours (lung cancer, head and neck tumours), while for men
a lasting downward trend is expected for these cancers as well as for prostate cancer.
Figure 9 (left): Invasive tumours (excl. non-melanoma skin cancer): Observed and projected
number of new diagnoses (N) by sex, Belgium 2004-2025, and Figure 9 (right): Invasive tumours
(excl. non-melanoma skin cancer): Observed and projected incidence (WSR) by sex, Belgium
2004-2025
2.6 Survival
The estimated 5-year relative survival rates are 59% in males and 69% in females. Figure
10 and 11 give an overview of the tumours with the highest and lowest 5-year relative
survival rates.
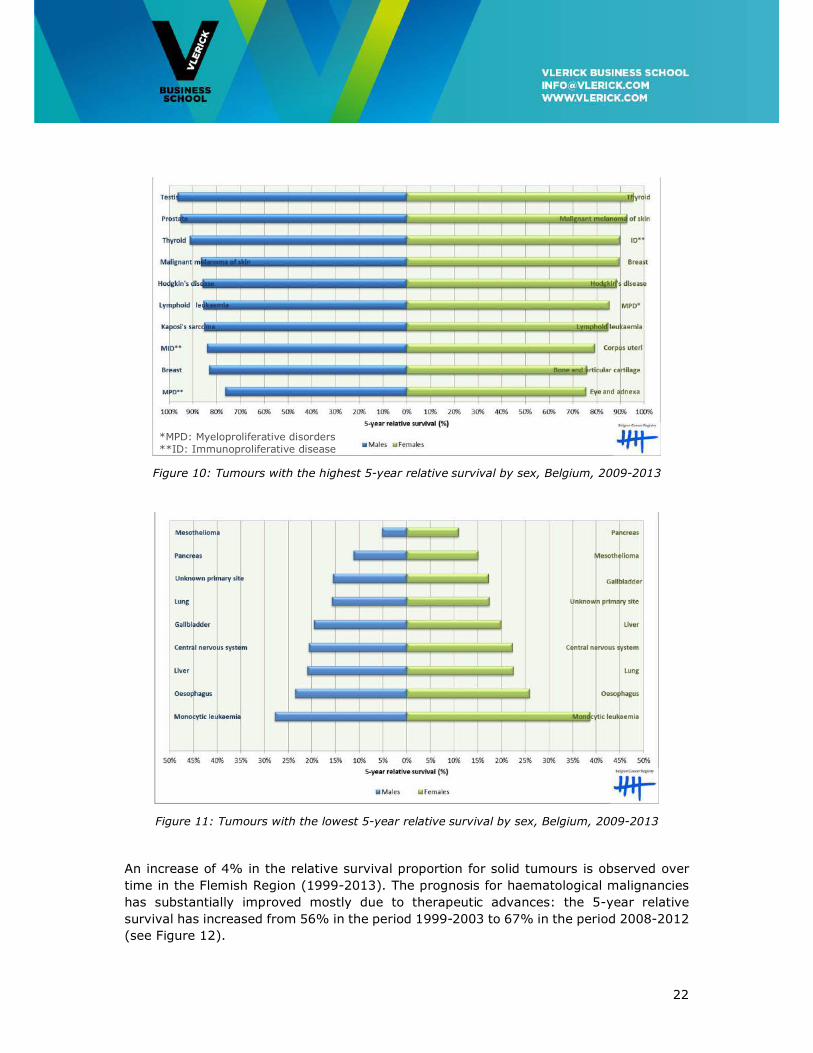
22
Figure 10: Tumours with the highest 5-year relative survival by sex, Belgium, 2009-2013
Figure 11: Tumours with the lowest 5-year relative survival by sex, Belgium, 2009-2013
An increase of 4% in the relative survival proportion for solid tumours is observed over
time in the Flemish Region (1999-2013). The prognosis for haematological malignancies
has substantially improved mostly due to therapeutic advances: the 5-year relative
survival has increased from 56% in the period 1999-2003 to 67% in the period 2008-2012
(see Figure 12).
*MPD: Myeloproliferative disorders **ID: Immunoproliferative disease
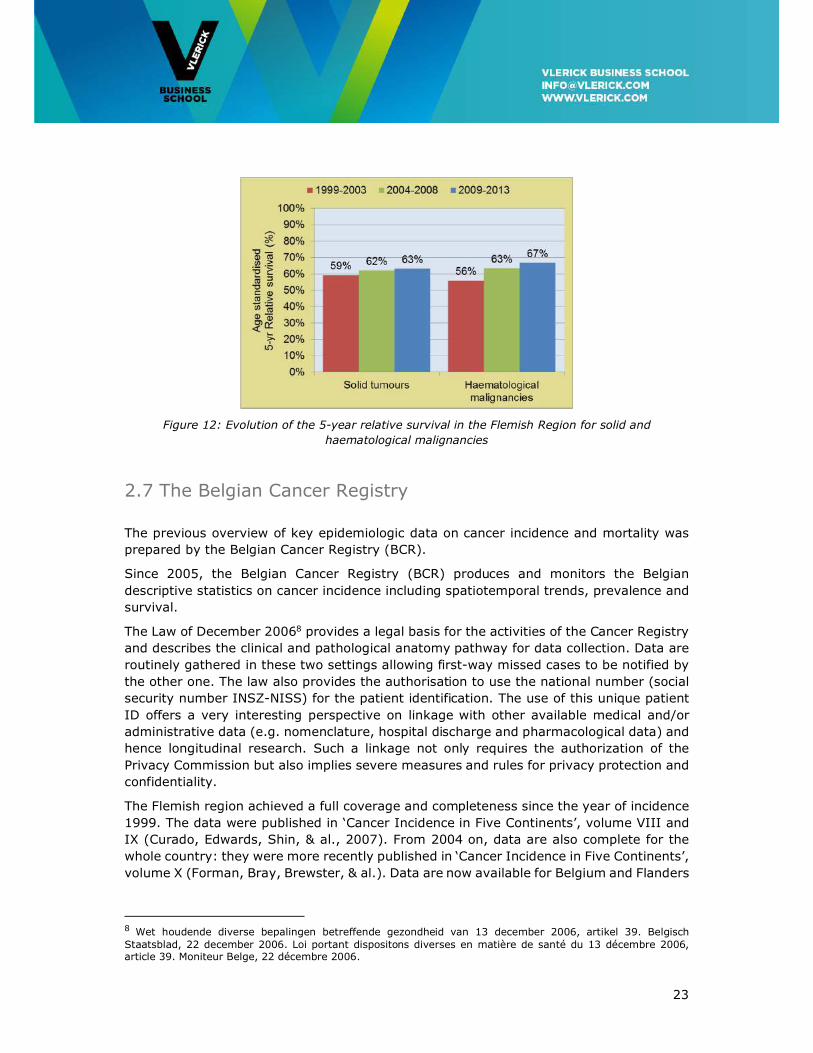
23
Figure 12: Evolution of the 5-year relative survival in the Flemish Region for solid and
haematological malignancies
2.7 The Belgian Cancer Registry
The previous overview of key epidemiologic data on cancer incidence and mortality was
prepared by the Belgian Cancer Registry (BCR).
Since 2005, the Belgian Cancer Registry (BCR) produces and monitors the Belgian
descriptive statistics on cancer incidence including spatiotemporal trends, prevalence and
survival.
The Law of December 20068 provides a legal basis for the activities of the Cancer Registry
and describes the clinical and pathological anatomy pathway for data collection. Data are
routinely gathered in these two settings allowing first-way missed cases to be notified by
the other one. The law also provides the authorisation to use the national number (social
security number INSZ-NISS) for the patient identification. The use of this unique patient
ID offers a very interesting perspective on linkage with other available medical and/or
administrative data (e.g. nomenclature, hospital discharge and pharmacological data) and
hence longitudinal research. Such a linkage not only requires the authorization of the
Privacy Commission but also implies severe measures and rules for privacy protection and
confidentiality.
The Flemish region achieved a full coverage and completeness since the year of incidence
1999. The data were published in ‘Cancer Incidence in Five Continents’, volume VIII and
IX (Curado, Edwards, Shin, & al., 2007). From 2004 on, data are also complete for the
whole country: they were more recently published in ‘Cancer Incidence in Five Continents’,
volume X (Forman, Bray, Brewster, & al.). Data are now available for Belgium and Flanders
8 Wet houdende diverse bepalingen betreffende gezondheid van 13 december 2006, artikel 39. Belgisch Staatsblad, 22 december 2006. Loi portant dispositons diverses en matière de santé du 13 décembre 2006, article 39. Moniteur Belge, 22 décembre 2006.
24
for 10 (2004-2013), respectively 15 consecutive incidence years9. Cancer incidence data
2014 will be made available as from October 2016.
A first survival report (diagnoses 2004-2008) for Belgium and the three regions was
published in December 201210, followed by a specific booklet in 2013 on incidence and
survival of Childhood Cancer (period 2004-2009)11 and haematological malignancies in
2015 (period 2004-2012). In June 2014, a prevalence report (1, 5, 10, 15 and 20 years)
was made available for the first time12.
In a European and International context, the Belgian Cancer Registry participates in the
European network of Cancer Registries, Eurocare, Rarecarenet, Cancer Incidence in Five
Continents (IARC) and the Concord study.
The progress made during the last years, is clearly related to the legislation activities, new
initiatives on clinical registration in the Flemish, Brussels and Walloon hospitals, and the
sustained registration efforts of the data managers, physicians, oncologists and
pathologists from the oncological care programs.
Although the figures represent a very important output of a cancer registry, this
achievement can only be considered as a first deliverable in a multi-step process. Cancer
registries indeed see their role more and more extended in cancer control (Armstrong,
1992). The creation of a Belgian comprehensive information data base does not only aim
to produce the classic descriptive epidemiologic parameters (such as incidence,
prevalence, survival and mortality) but also to evaluate the real world outcome and quality
of life of cancer patients through the systematic analysis of evidence-based interventions
in prevention, early diagnosis, (new) treatment (strategies), and palliative care. Quality
of care studies indeed should result in optimizing treatment strategies, reducing variability
in treatment and ultimately improving the prognosis and quality of life of cancer patients.
These studies frequently focus on process, structure and outcome parameters.
The BCR is increasingly involved in these studies through data obtained by linkage of the
cancer registry with administrative data bases. The availability of these data led to
participation in a number of KCE reports on quality indicators in oncology (breast,
oesophageal, stomach and lung cancer), the Vlaams Indicatoren Project (VIP)13. These
collaborations resulted in individual feedback reports from the BCR to all Belgian hospitals
involved in cancer diagnosis and treatment.
Sometimes, more detailed and clinically up to date information on prognostic and
predictive variables, diagnostic procedures, biomarkers, treatment patterns and follow up
is necessary in order to analyse, evaluate and monitor real world (and population based)
medical practice and outcome (e.g. evaluation of new reimbursement strategies for new
drugs). Possible solutions would be prospective cancer registration through extension of
the Multidisciplinary Team Meeting form with a well-defined, relevant set of supplementary
9 Cancer Burden in Belgium, 2013, Belgian Cancer Registry, Brussels, 2015. 10 Cancer Survival in Belgium 2004-2008, Belgian Cancer Registry, Brussels, 2012. 11 Cancer in Children and Adolescents 2004-2009, Belgian Cancer Registry, Brussels, 2013. 12 Cancer Prevalence in Belgium 2010, Belgian Cancer Registry, Brussels 2014. 13 Vlaams Indicatorenproject: breast, rectum and prostate cancer and the Walloon and Brussels Hospital Quality Indicators initiative (BCR-Stichting tegen Kanker/Fondation contre le Cancer: breast, rectum and prostate cancer).

25
variables. There is also a clear need for a standardized synoptic reporting system for the
pathology protocols to make relevant pathologic and genetic characteristics of the tumour
more available for research.
It remains an important challenge to make use of information technology as much as
possible and to avoid overlapping registration efforts.
2.8 Epidemiological Conclusions
One man in three and one woman in four will develop cancer before their 75th anniversary.
Every year, there are more than 65.400 new cancer diagnoses in Belgium.
Breast and prostate cancer are the most frequent tumours, followed by colorectal cancer
and lung cancer. These four tumour localisations together cover more than 54% of all the
cancers.
In 2012, a total number of 26,923 persons died of cancer in Belgium, i.e. 15,146 males
(56%) and 11,777 females (44%). Cancer is the second leading cause of death (26%)
after cardiovascular diseases.
The 5-year estimated relative survival rates are 59% in males and 69% in females (period
2009-2013).
An increase of 4% in the relative survival proportion for solid tumours is observed over
time in the Flemish Region (1999-2013). The prognosis for haematological malignancies
has substantially improved: the 5-year relative survival has increased from 56% in the
period 1999-2003 to 67% in the period 2008-2012.
By 2025, the number of patients diagnosed with cancer is expected to increase to almost
78,000. This represents an increase of 19% when compared to 2013.
By 2025, the male-female ratio will be close to 1.0 in 2025 meaning that the number of
cancers will be divided equally among men and women.
2.9 Recommendations
• The BCR should be involved in prospective cancer registration through extension of the
Multidisciplinary Oncology Team Meeting form with a well-defined, relevant set of
supplementary variables.
• A standardized synoptic reporting system should be set up for the pathology protocols
to make relevant pathologic and genetic characteristics of the tumour more available
for research.
• Information technology should be used to a maximal extent and to avoid overlapping
registration efforts.
26
3. Future Developments in Oncological Medical Innovation
Cancer often remains an incurable disease and survival is to a large extent determined by
the cancer type. The 5-year age-adjusted relative survival rate (RSR) for all cancers taken
together is around 60% with less than 5% improvement over the past decade. Some
cancers such as prostate cancer, breast cancer and lymphomas are highly curable because
they are often detected in a localized stage and cured by surgery and/or radiotherapy and
adjuvant systemic treatments or because of effective systemic treatment of more
advanced disease. On the other hand, figures remain most dramatic for lung cancer where
the 5-year RSR is between 15 and 25% depending on age category. It is clear that in
many cancers an unmet medical need persists either for the primary treatment (e.g. lung
cancer, pancreatic cancer) or for more advanced stages of the disease (metastatic cancer).
Future improvement in fighting cancer will depend on progress at several levels of care:
prevention, screening programs for early detection and drug development.
3.1 Driving forces of oncological medical innovation
Medical innovation in cancer treatment has evolved from classical chemotherapy to so
called “targeted therapy” using drugs able to target the tumour cell specifically or its
microenvironment. Examples are targeting oncogene products such as the BCR-ABL kinase
by tyrosine kinase inhibitors, targeting intracellular pathways involved in oncogenesis such
as the NFKappa-B pathway by proteasome inhibitors, or HER signalling pathways in breast
and lung cancer. The tumour microenvironment (cancer cell niche, cytokine pathways,
vascularisation) can be targeted by immunomodulatory drugs or angiogenesis inhibitors.
Medical innovation is based on the expanding knowledge and understanding of cancer
biology. The basic concept is to identify biological, often molecular, biomarkers involved
in the oncogenic process and then to target these markers by more or less specific drugs.
Precision medicine and personalized therapy based on targeting mutations of tumours in
individual patients are increasingly introduced. Also, immunotherapy has emerged as an
almost universal approach in cancer treatment including the use of monoclonal antibodies
targeting cancer cells and checkpoint inhibitors allowing to reverse cancer-induced cellular
immune paresis. Targeted therapy including immunotherapy is likely to change therapeutic
paradigms in oncology as illustrated by progress in some cancers but somewhat more
pronounced in haematological malignancies. Hematologic malignancies represent 10% of
all malignancies in the Western world and over the past decade an almost 10%
improvement of the RSR, from 57 to 66%, has been observed. This is to a large extent
the result of medical innovation: tyrosine kinase inhibitors (chronic myeloid leukaemia),
anti-CD20 antibodies (B cell lymphoma and leukaemia), proteasome inhibitors (myeloma)
and immunomodulating agents (myeloma, lymphoma).
There are currently 18 targeted treatments accessible in Belgium. A very promising clinical
development pipeline is becoming accessible in the 2016 – 2020 horizon (Figure11). Also,
whilst advances in genomics and cell biology have led to ever more selective therapeutics,
27
for some pathologies combinations have been shown to be beneficial in tumour treatment.
Therefore, targeted therapies are now or will be given in combination with other drugs,
addressing multiple pathways in tumours hence potentially leading to substantial increases
in overall survival. As an example, the addition of pertuzumab to trastuzumab and
docetaxel in HER2-positive metastatic breast cancer led to a significant increase of 15.7
months in median overall survival as compared with addition of placebo (56.5 months
versus 40.8 months) (Swain et al., 2015). This survival improvement is unprecedented
among studies of metastatic breast cancer. However, these combinations also lead to
increased total prices and to potentially higher side effects.
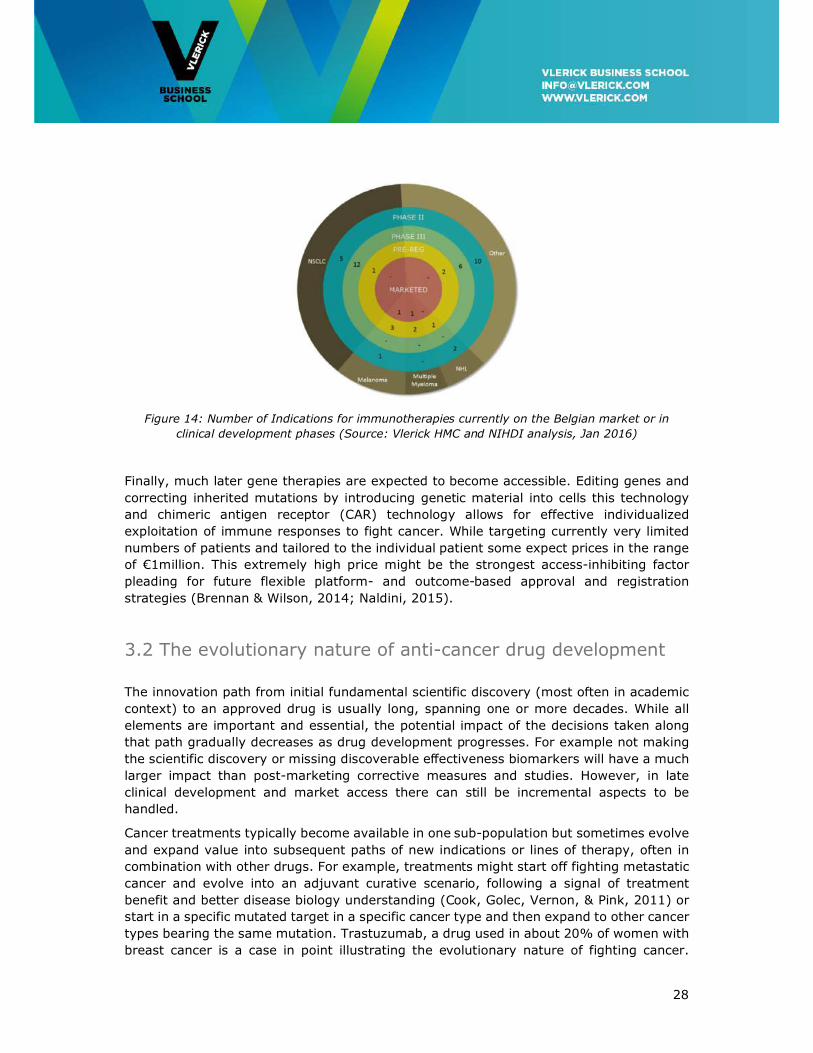
Immunotherapies are the latest cancer treatments now becoming accessible to patients
holding the promise of improved survival. They make highly effective use of the patient’s
own anticancer immune response enabling effective cell killing. What makes many of the
recent immune-oncology therapies wanted is their demonstrated anti-tumour effects
potentially translating into long-term survival. A total of 45 indications are presently in the
pipeline, with non-small cell lung cancer and melanoma the most competitively crowded
indications. Two immunotherapies are currently accessible to patients in Belgium (Figures
13-14).
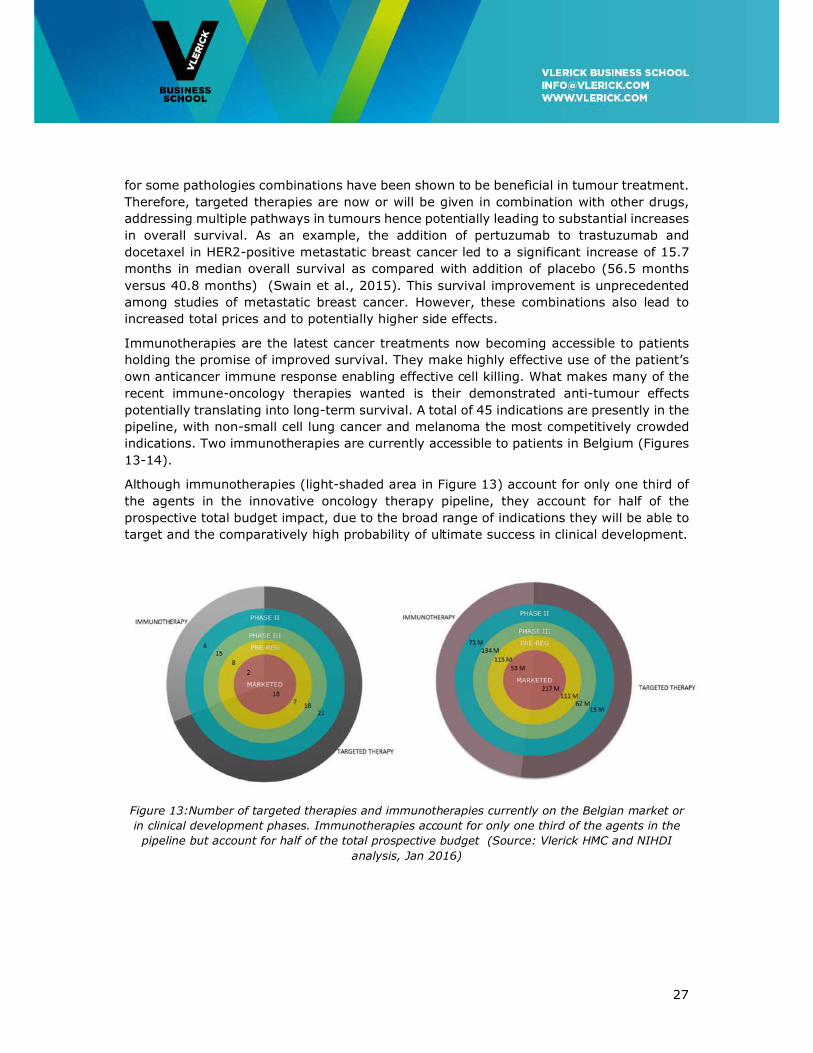
Although immunotherapies (light-shaded area in Figure 13) account for only one third of
the agents in the innovative oncology therapy pipeline, they account for half of the
prospective total budget impact, due to the broad range of indications they will be able to
target and the comparatively high probability of ultimate success in clinical development.
Figure 13:Number of targeted therapies and immunotherapies currently on the Belgian market or
in clinical development phases. Immunotherapies account for only one third of the agents in the
pipeline but account for half of the total prospective budget (Source: Vlerick HMC and NIHDI
analysis, Jan 2016)
28
Figure 14: Number of Indications for immunotherapies currently on the Belgian market or in
clinical development phases (Source: Vlerick HMC and NIHDI analysis, Jan 2016)
Finally, much later gene therapies are expected to become accessible. Editing genes and
correcting inherited mutations by introducing genetic material into cells this technology
and chimeric antigen receptor (CAR) technology allows for effective individualized
exploitation of immune responses to fight cancer. While targeting currently very limited
numbers of patients and tailored to the individual patient some expect prices in the range
of €1million. This extremely high price might be the strongest access-inhibiting factor
pleading for future flexible platform- and outcome-based approval and registration
strategies (Brennan & Wilson, 2014; Naldini, 2015).
3.2 The evolutionary nature of anti-cancer drug development
The innovation path from initial fundamental scientific discovery (most often in academic
context) to an approved drug is usually long, spanning one or more decades. While all
elements are important and essential, the potential impact of the decisions taken along
that path gradually decreases as drug development progresses. For example not making
the scientific discovery or missing discoverable effectiveness biomarkers will have a much
larger impact than post-marketing corrective measures and studies. However, in late
clinical development and market access there can still be incremental aspects to be
handled.
Cancer treatments typically become available in one sub-population but sometimes evolve
and expand value into subsequent paths of new indications or lines of therapy, often in
combination with other drugs. For example, treatments might start off fighting metastatic
cancer and evolve into an adjuvant curative scenario, following a signal of treatment
benefit and better disease biology understanding (Cook, Golec, Vernon, & Pink, 2011) or
start in a specific mutated target in a specific cancer type and then expand to other cancer
types bearing the same mutation. Trastuzumab, a drug used in about 20% of women with
breast cancer is a case in point illustrating the evolutionary nature of fighting cancer.
29
Granted US market approval in 1998 for metastatic breast cancer it was granted access
for adjuvant treatment of early breast cancer in 2006. Initial projections showed that by
2016 the annual volume of patients receiving adjuvant treatment would be more than
three times higher than the volume of metastatic cancer patients, which in turn and over
time would also lower the incidence of these latter patients (Garrison, 2010). Trastuzumab
also expanded to a subtype of gastric cancer. Another example is lenalidomide in multiple
myeloma. It was developed around 2005 initially as the successor of thalidomide in
relapsed and refractory multiple myeloma leading to 11 months progression-free survival
in this relatively small subset of patients. Today it has become established as first-line
treatment in more than two-thirds of the newly diagnosed myeloma population leading to
a time to next treatment of 39 months. In the meantime, lenalidomide has maintained its
position in combinations for the relapsed and refractory myeloma setting. These examples
show that the clinical and economic value of cancer treatment can expand dramatically
over time following an evolutionary pathway. For example, Precision Belgium is a BSMO
initiative that aims at expanding genotype-based targeted cancer treatments beyond the
strict registered disease associated contexts. An example is afatinib, a pan-HER inhibitor
approved for EGFR mutated lung cancer that will be explored in EGFR, HER and HER3
mutant cancers of any type.
Pathways will include newer combinations of targeted treatments and immunotherapies.
Taking the trastuzumab example further, in 2013 it was combined with pertuzumab in
addition to taxanes for treating HER2-positive metastatic or locally recurrent unresectable
breast cancer (Swain et al., 2015; Swain et al., 2013). Adding to the complexity,
combinations can and will be produced by several manufacturers leading to co-opetition14
with manufacturers possibly jointly developing and marketing combinations in one
indication whilst competing in other indications.
Typically, medical and economic value expansion beyond an initial approved indication
sets out in six possible paths; use in different disease stages, use in different treatment
lines or stage, use in different treatment regimen, orphan designations, move into patient
sub-populations for whom the drug works better, and use in new administration routes
(Réjon-Parrilla et al., 2014).
Each step made represents progress in cancer treatment and in oncology researchers’
disease understanding with successes and failures in clinical trials providing clues for the
best next steps. The addition of all these small steps potentially leads to substantial gains
in survival (Paddock et al., 2015).
From a pharmacoeconomic point of view, this evolutionary nature of cancer treatment
development pleads for a dynamic model of net economic value estimation. In this model,
net economic value is estimated using cumulative numbers for the medical and economical
value generated over the whole product life cycle. This instead of the presently widely
used static method evaluating one new product for one specific indication at the time
(Garrison, 2010; Garrison & Veenstra, 2009).
14 Co-opetition is the combined and simultaneous use of competition and strategic collaboration of two companies with each other.
30
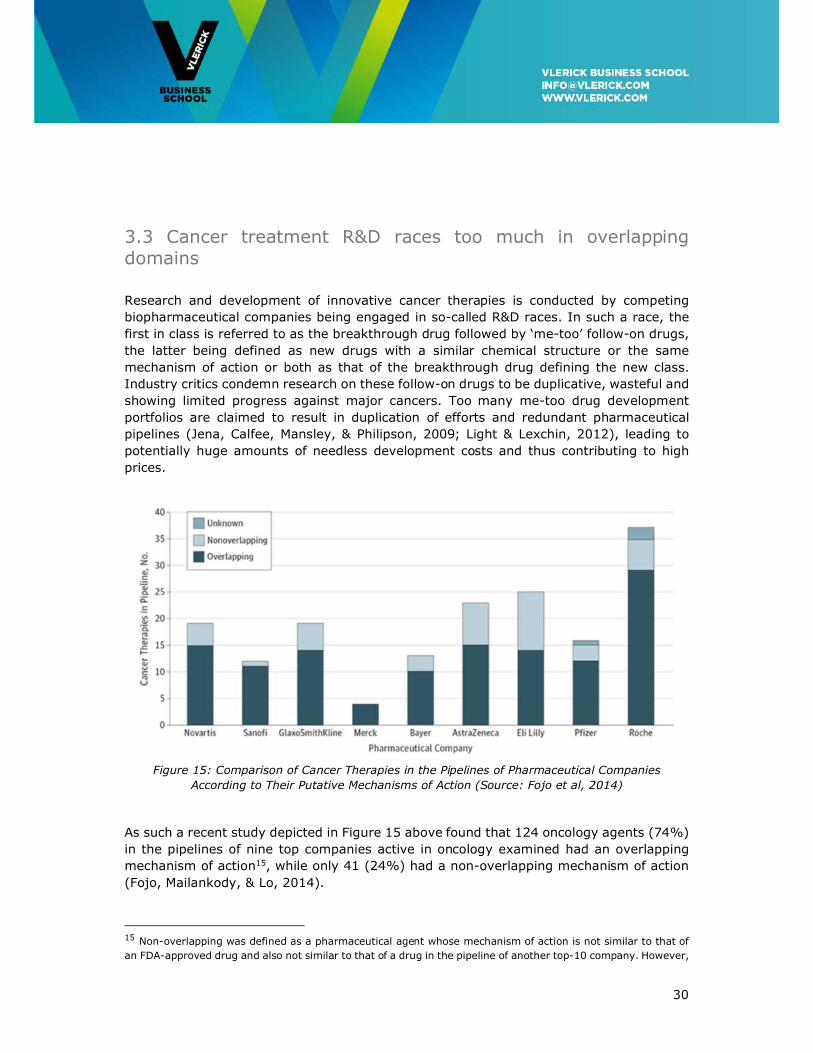
3.3 Cancer treatment R&D races too much in overlapping domains
Research and development of innovative cancer therapies is conducted by competing
biopharmaceutical companies being engaged in so-called R&D races. In such a race, the
first in class is referred to as the breakthrough drug followed by ‘me-too’ follow-on drugs,
the latter being defined as new drugs with a similar chemical structure or the same
mechanism of action or both as that of the breakthrough drug defining the new class.
Industry critics condemn research on these follow-on drugs to be duplicative, wasteful and
showing limited progress against major cancers. Too many me-too drug development
portfolios are claimed to result in duplication of efforts and redundant pharmaceutical
pipelines (Jena, Calfee, Mansley, & Philipson, 2009; Light & Lexchin, 2012), leading to
potentially huge amounts of needless development costs and thus contributing to high
prices.
Figure 15: Comparison of Cancer Therapies in the Pipelines of Pharmaceutical Companies
According to Their Putative Mechanisms of Action (Source: Fojo et al, 2014)
As such a recent study depicted in Figure 15 above found that 124 oncology agents (74%)
in the pipelines of nine top companies active in oncology examined had an overlapping
mechanism of action15, while only 41 (24%) had a non-overlapping mechanism of action
(Fojo, Mailankody, & Lo, 2014).
15 Non-overlapping was defined as a pharmaceutical agent whose mechanism of action is not similar to that of
an FDA-approved drug and also not similar to that of a drug in the pipeline of another top-10 company. However,
31
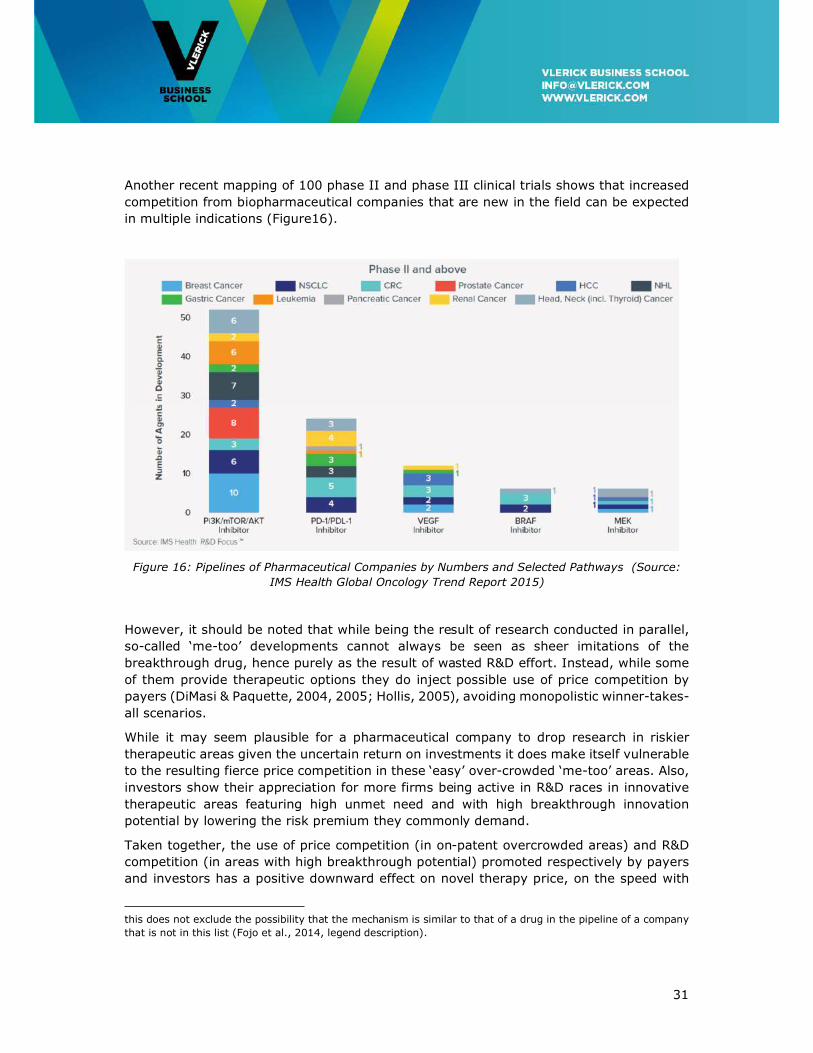
Another recent mapping of 100 phase II and phase III clinical trials shows that increased
competition from biopharmaceutical companies that are new in the field can be expected
in multiple indications (Figure16).
Figure 16: Pipelines of Pharmaceutical Companies by Numbers and Selected Pathways (Source:
IMS Health Global Oncology Trend Report 2015)
However, it should be noted that while being the result of research conducted in parallel,
so-called ‘me-too’ developments cannot always be seen as sheer imitations of the
breakthrough drug, hence purely as the result of wasted R&D effort. Instead, while some
of them provide therapeutic options they do inject possible use of price competition by
payers (DiMasi & Paquette, 2004, 2005; Hollis, 2005), avoiding monopolistic winner-takes-
all scenarios.
While it may seem plausible for a pharmaceutical company to drop research in riskier
therapeutic areas given the uncertain return on investments it does make itself vulnerable
to the resulting fierce price competition in these ‘easy’ over-crowded ‘me-too’ areas. Also,
investors show their appreciation for more firms being active in R&D races in innovative
therapeutic areas featuring high unmet need and with high breakthrough innovation
potential by lowering the risk premium they commonly demand.
Taken together, the use of price competition (in on-patent overcrowded areas) and R&D
competition (in areas with high breakthrough potential) promoted respectively by payers
and investors has a positive downward effect on novel therapy price, on the speed with
this does not exclude the possibility that the mechanism is similar to that of a drug in the pipeline of a company
that is not in this list (Fojo et al., 2014, legend description).
32
which novel therapies are discovered in domains of high unmet medical need, and on
avoiding monopolistic therapy markets (Pammolli, 2011).
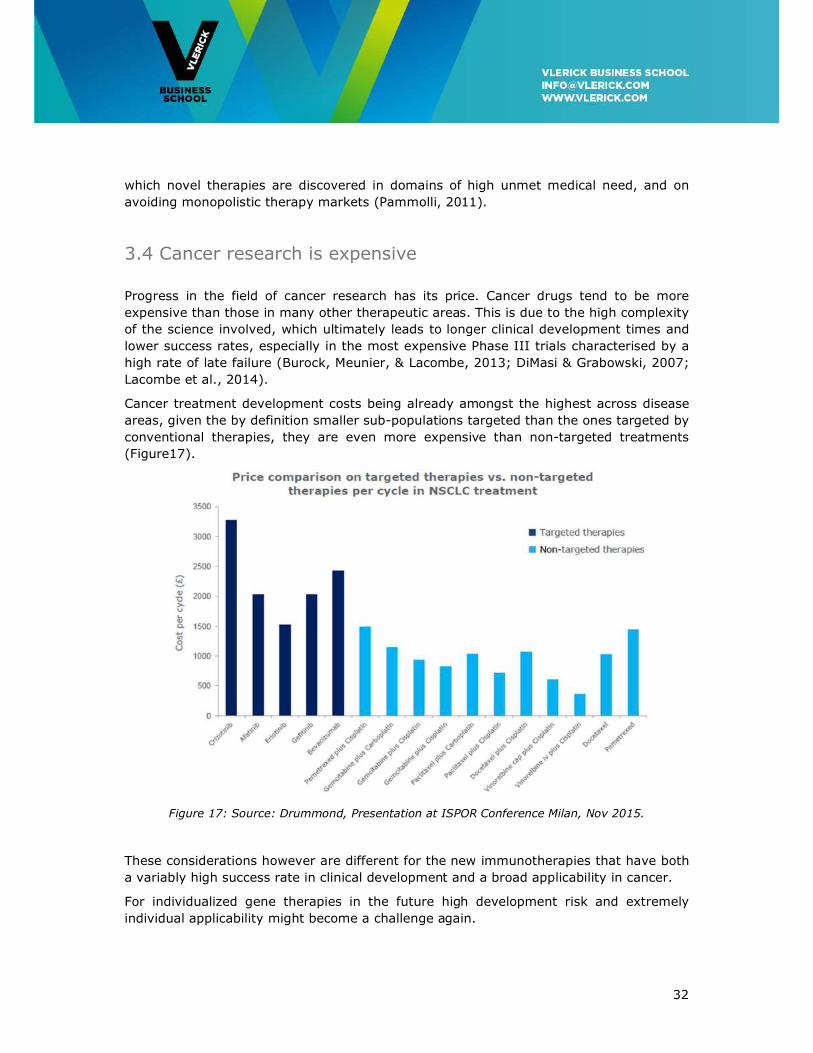
3.4 Cancer research is expensive
Progress in the field of cancer research has its price. Cancer drugs tend to be more
expensive than those in many other therapeutic areas. This is due to the high complexity
of the science involved, which ultimately leads to longer clinical development times and
lower success rates, especially in the most expensive Phase III trials characterised by a
high rate of late failure (Burock, Meunier, & Lacombe, 2013; DiMasi & Grabowski, 2007;
Lacombe et al., 2014).
Cancer treatment development costs being already amongst the highest across disease
areas, given the by definition smaller sub-populations targeted than the ones targeted by
conventional therapies, they are even more expensive than non-targeted treatments
(Figure17).
Figure 17: Source: Drummond, Presentation at ISPOR Conference Milan, Nov 2015.
These considerations however are different for the new immunotherapies that have both
a variably high success rate in clinical development and a broad applicability in cancer.
For individualized gene therapies in the future high development risk and extremely
individual applicability might become a challenge again.
33
Although a higher payer willingness to pay is observed as compared to other therapeutic
areas (Seabury, Goldman, Maclean, Penrod, & Lakdawalla, 2012), health technology
assessment organizations faced with –often far too– high incremental cost effectiveness
ratios (ICER) 16 are ‘struggling with cancer’s “exceptionalism”’ (Neumann, Bliss, &
Chambers, 2012).
The effectiveness of the most recent immunotherapies and their high subjective
tolerability, which in contrast to small sub-population targeted therapies and even most
chemotherapies are potentially applicable to a wide range of patient (sub)-populations,
together with an ageing population is worrying payers worldwide faced with a too high
burden on healthcare budgets.
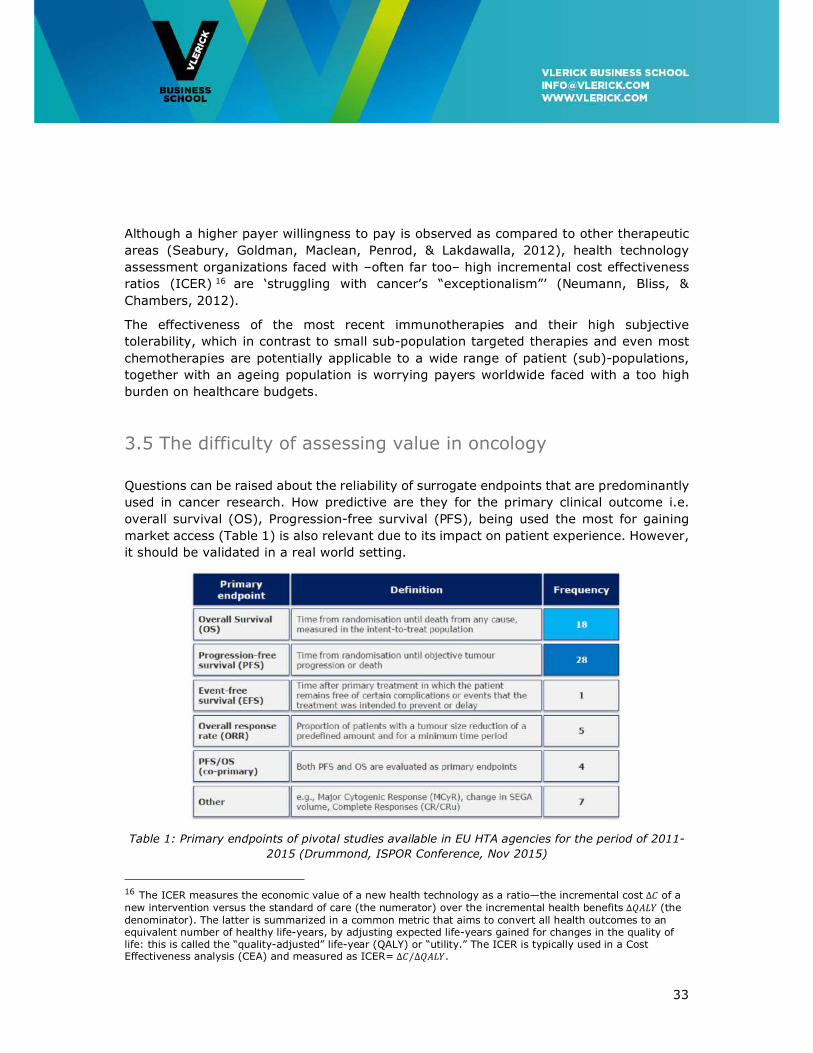
3.5 The difficulty of assessing value in oncology
Questions can be raised about the reliability of surrogate endpoints that are predominantly
used in cancer research. How predictive are they for the primary clinical outcome i.e.
overall survival (OS), Progression-free survival (PFS), being used the most for gaining
market access (Table 1) is also relevant due to its impact on patient experience. However,
it should be validated in a real world setting.
Table 1: Primary endpoints of pivotal studies available in EU HTA agencies for the period of 2011-
2015 (Drummond, ISPOR Conference, Nov 2015)
16 The ICER measures the economic value of a new health technology as a ratio—the incremental cost ∆� of a new intervention versus the standard of care (the numerator) over the incremental health benefits ∆���� (the denominator). The latter is summarized in a common metric that aims to convert all health outcomes to an equivalent number of healthy life-years, by adjusting expected life-years gained for changes in the quality of life: this is called the “quality-adjusted” life-year (QALY) or “utility.” The ICER is typically used in a Cost Effectiveness analysis (CEA) and measured as ICER= ∆� ∆����⁄ .
34
Given the poor results of FDA-approved results in the real clinical world, in a recent study
analysing 5 years (2011 – 2015) of drug approvals on the basis of surrogate end points
and their subsequent overall survival, the authors argued for a timeline for drugs approved
on the basis of a surrogate endpoint to prove their effectiveness. Based on a median
follow-up of 4.4 years of 36 drugs, of which 19 were approved based on response rates
(RR) and 17 based on progression-free survival (PFS), 18 failed to show any improvement
on OS and 13 had no result, only 5 demonstrated improvement in OS in randomized clinical
trials (Kim & Prasad, 2015). In the future additional surrogate endpoints such as pCR after
neoadjuvant therapy in breast cancer should be further considered (Wang-Lopez et al.,
2015).
Overall survival as a decision endpoint is acceptable in cancers or cancer stages or specific
cancer lines of treatment that currently have a bad prognosis. In other cancers such as
early breast cancers this endpoint is so distant that awaiting this evidence will delay access
of patients to innovative treatments for many years.
However considering the above, decisions based on surrogate endpoint should be
temporary until the final endpoint, overall survival, can be assessed.
The inherent conflict between a need for early access to medicines that are likely (by a
strong surrogate endpoint) to improve outcome and the long interval needed to assess
survival impact could in some cases be solved by granting temporary and reversible
market access conditioned on subsequent demonstration of survival benefit.
Reimbursement authorities could even invoke the uncertainties to negotiate significantly
lower pricing.
3.6 Towards precision medicine
Following Jameson and Longo (2015) we define precision medicine as ‘treatments targeted
to the needs of individual patients on the basis of genetic, biomarker, phenotypic, or
psychosocial characteristics that distinguish a given patient from other patients with
similar clinical presentations’. This with the goal to improve clinical outcomes for individual
patients whilst minimizing exposure to potentially toxic and costly therapies for those less
likely to have a response to a particular treatment (Jameson & Longo, 2015).
In the treatment of cancer, testing for genomic abnormalities (germline or somatic) has
truly transformed the field. As an example, in lung cancer, traditional anatomic and
histological criteria-based classification is being augmented by molecular testing of genetic
markers like EGFR, MET, ROS, and ALK done by specific diagnostic tests leading to more
specific use and fewer side effects of targeted treatments. Also, these diagnostic
technologies are not only used for properly targeting personalized medicine usage, but
also more and more for screening, monitoring and treatment optimization (Schneider et
al., 2012).
The convergence of biomedical technologies like genetics, epigenetics, proteomics and
metabolomics and diagnostic and imaging technology turns medical science more and
35
more into an information science. Now, precision medicine can be exercised based on
patient data captured in the precision medicine ecosystem built on biobanks and the
patient’s unique electronic health record (EHR) to which patients, clinicians, researchers
and clinical laboratories have portal-based access to design and implement actionable
treatment strategies (Aronson & Rehm, 2015; Jameson & Longo, 2015).
3.7 Conclusions
Therapeutic innovation in cancer treatment is an evolutionary process where each –
predominantly incremental, not radical– novel therapy builds on previous discoveries to
gradually close the gap to a full cure. Therefore, access and pricing discussed later should
be seen in this light; a drug candidate offering marginal improvement in a metastatic
setting might later offer real breakthrough survival or enhanced quality of life potential in
adjuvant settings. So, for each access and pricing decision made after the initial decision
health payers need to take into account the additional value created by a therapy over its
entire life cycle.
Cancer treatments are developed in a step-wise process targeting predominantly
overcrowded but also high medical need therapeutic areas with a therapeutic void. Health
policy should stimulate industry conducting research into the latter high-risk areas
representing highest unmet medical need for society, whilst discouraging research into
overcrowded areas. One of the tools at the payers’ disposal is the reimbursement decision.
To have this high impact a European or global cooperation is needed as it is unlikely that
measures taken at the Belgian level could have repercussions on early development
choices.
Given the difficulty assessing medical added value of cancer treatments, access pathways
should be made flexible and conditional upon proven performance in clinical studies, but
also modulated by results obtained in the real world. Regulatory access and
reimbursement procedures should be adapted to this latter thinking.
Regulatory access and reimbursement processes for cancer treatments should cater for
the trend towards combination therapies and drug-diagnostic solutions used to enable
personalized medicine.
Innovative pricing approaches are certainly to be recommended for combinations of
targeted therapies and certainly for future gene therapies to eventually become broadly
accessible.
36
4. Funding of Access to Therapeutic Innovation in Oncology
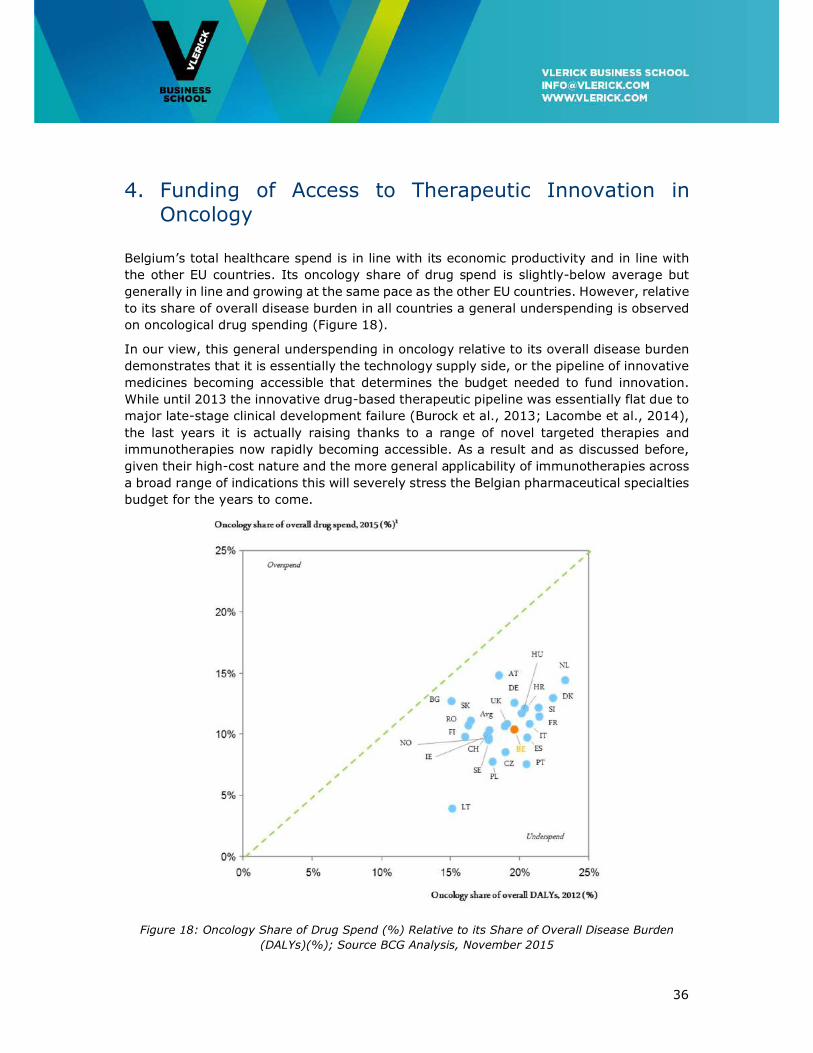
Belgium’s total healthcare spend is in line with its economic productivity and in line with
the other EU countries. Its oncology share of drug spend is slightly-below average but
generally in line and growing at the same pace as the other EU countries. However, relative
to its share of overall disease burden in all countries a general underspending is observed
on oncological drug spending (Figure 18).
In our view, this general underspending in oncology relative to its overall disease burden
demonstrates that it is essentially the technology supply side, or the pipeline of innovative
medicines becoming accessible that determines the budget needed to fund innovation.
While until 2013 the innovative drug-based therapeutic pipeline was essentially flat due to
major late-stage clinical development failure (Burock et al., 2013; Lacombe et al., 2014),
the last years it is actually raising thanks to a range of novel targeted therapies and
immunotherapies now rapidly becoming accessible. As a result and as discussed before,
given their high-cost nature and the more general applicability of immunotherapies across
a broad range of indications this will severely stress the Belgian pharmaceutical specialties
budget for the years to come.
Figure 18: Oncology Share of Drug Spend (%) Relative to its Share of Overall Disease Burden
(DALYs)(%); Source BCG Analysis, November 2015
37
Better prevention and prediction, the latter enabled by population stratification initiated at
General Practitioner level potentially modulating treatment for high- and low-risk cases
could, later in the more costly phases of the disease pathway lead to easing the pressure
on several health budgets provided the necessary investments in point-of-care diagnostics
at primary care level are made (Van Dyck et al., 2012). Also, national screening programs
(e.g. breast cancer and colon cancer) in collaboration with the GP level can be very
successful for early detection and lead to substantial cost-savings on the long term. In
addition genetic testing for high risk genes could also avoid costly diseases.
However, next to prevention, prediction and early detection other health policy and
budgetary measures will have to be taken to fund the emerging innovative oncological
treatment pipeline and to keep the pharmaceutical specialties budget under control.
4.1 A 2020 Oncology Horizon Scan
The present Belgian budgeting system provides a systematic one-year forecast of
pharmaceutical specialties expenditure. Although budget projection accuracy is rather high
we do consider a one year-only planning horizon to be too short-sighted to detect longer
term surges (or drops) in drug-based therapeutic innovation as seen now in the present
day case of oncology. Also, budgeting for innovation in diagnostics is not covered at
present.
Instead, to increase horizon scanning robustness and reliability, a pharmaceutical
specialties and diagnostics pipeline should be constructed on an international, possibly
European level. Also, the horizon scan time laps should be fixed at 5 year instead of shorter
periods. This is caused by the fact that in the pharmaceutical industry the time to get
certainty about projected probability of access is too long. Especially now in the oncology
case we described here before where the majority of the pipeline is now in Phase II and
hence still featuring low access probability and being separated 3 to 5 years from market
access.
The 2020 Oncology Horizon scan in Figure 19 below plots projected budget need from the
therapeutic innovation pipeline, defined here as all targeted therapies and
immunotherapies accessible to the Belgian healthcare system, as described in further
detail in Appendix 2.
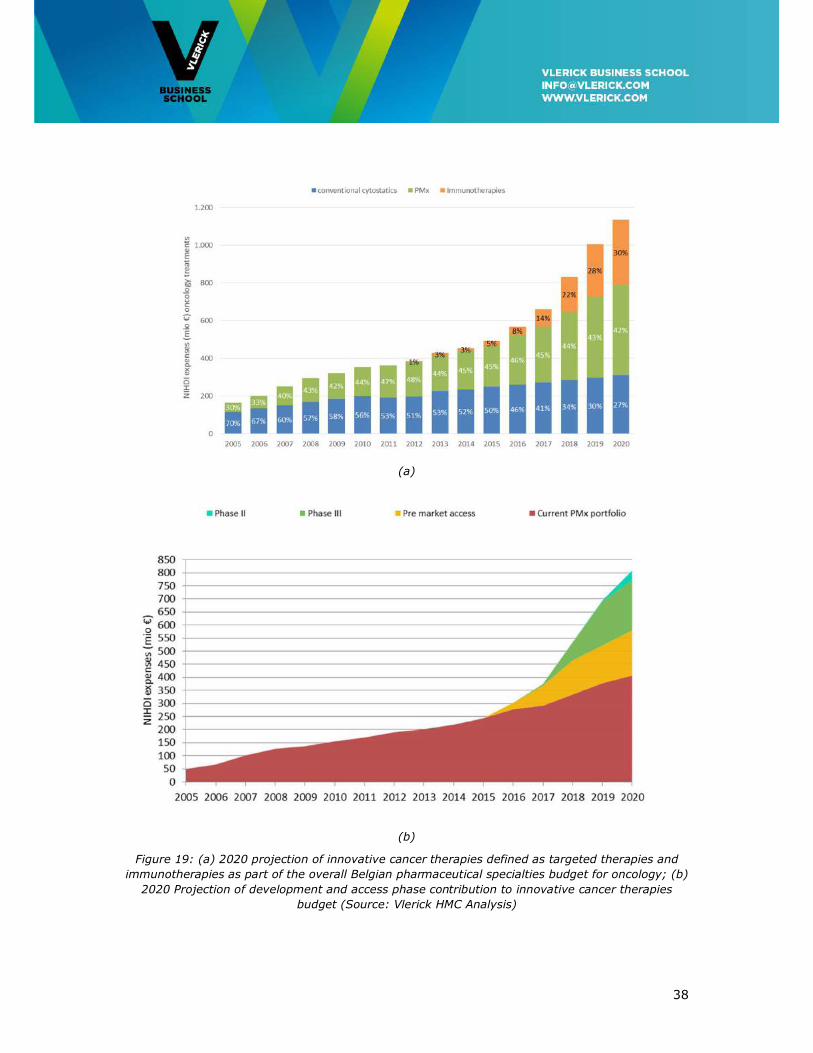
Over the full 5-year horizon the budget needed for oncology will more than double from
the present €491M to over one billion Euros in 2020 (Table 2). By 2020, the budget needed
for innovative targeted and immunotherapies (see Appendix 2 for definition) will amount
to €825 M, then representing 72% instead of the present 50% of the total oncology drug
budget.
38
(a)
(b)
Figure 19: (a) 2020 projection of innovative cancer therapies defined as targeted therapies and
immunotherapies as part of the overall Belgian pharmaceutical specialties budget for oncology; (b)
2020 Projection of development and access phase contribution to innovative cancer therapies
budget (Source: Vlerick HMC Analysis)
39
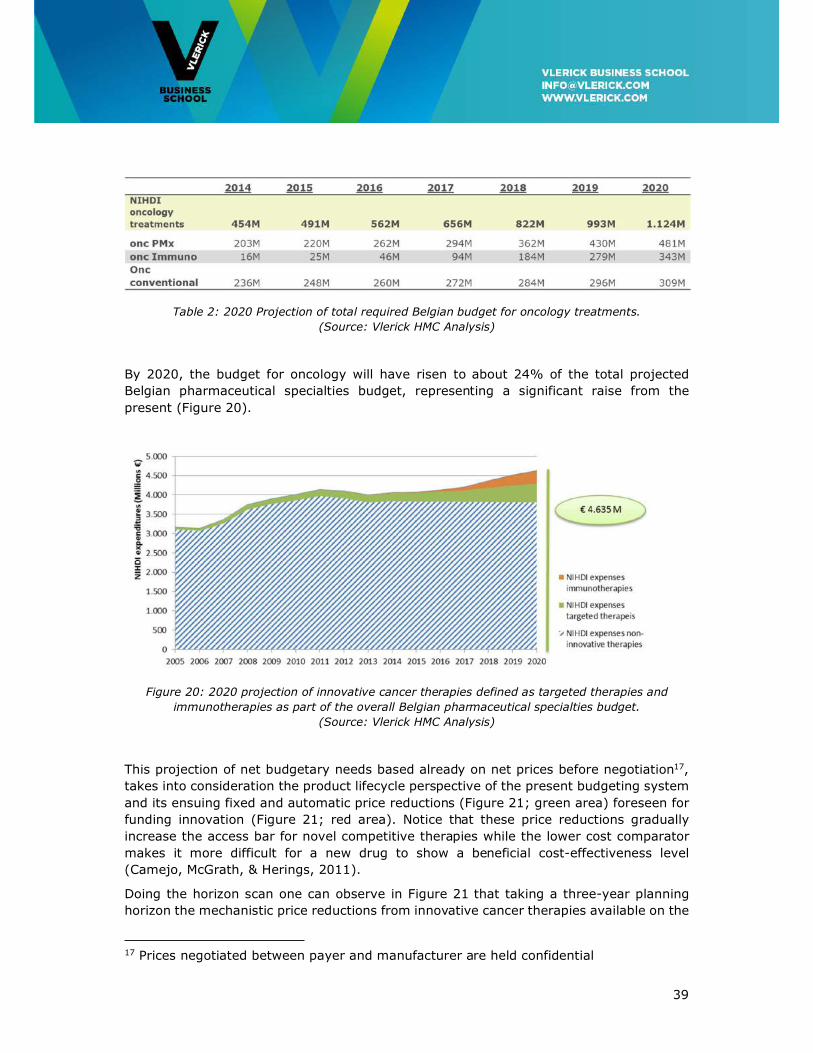
Table 2: 2020 Projection of total required Belgian budget for oncology treatments.
(Source: Vlerick HMC Analysis)
By 2020, the budget for oncology will have risen to about 24% of the total projected
Belgian pharmaceutical specialties budget, representing a significant raise from the
present (Figure 20).
Figure 20: 2020 projection of innovative cancer therapies defined as targeted therapies and
immunotherapies as part of the overall Belgian pharmaceutical specialties budget.
(Source: Vlerick HMC Analysis)
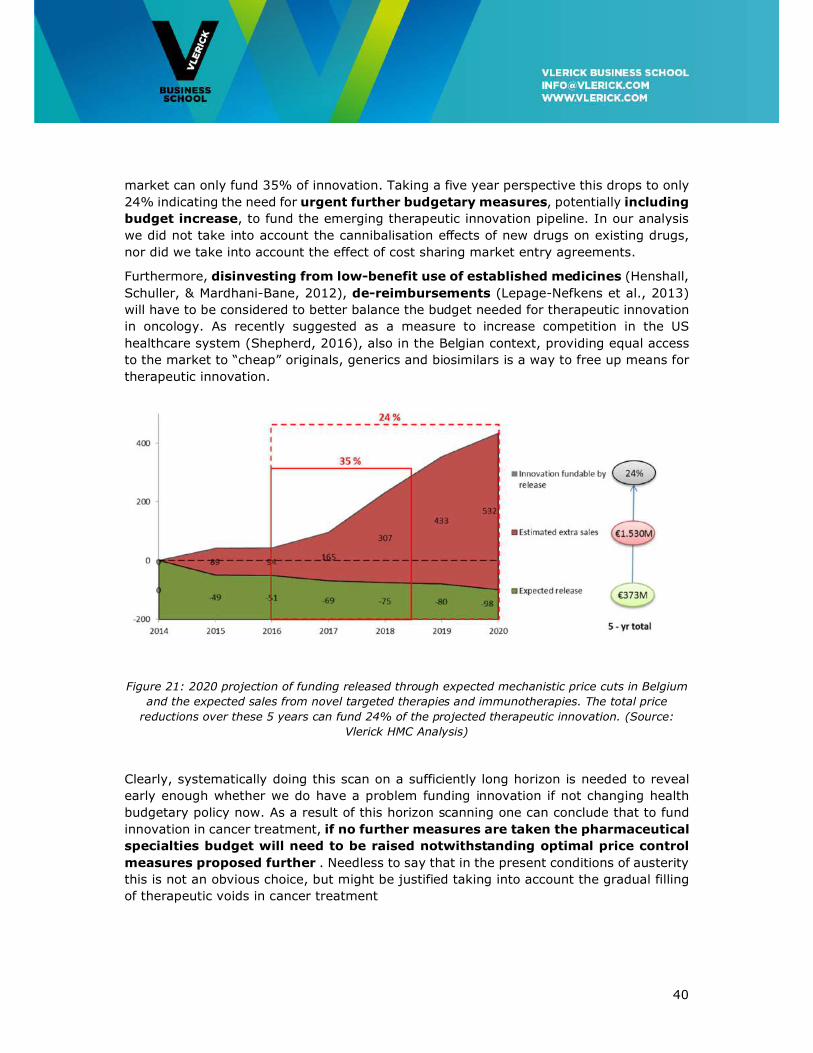
This projection of net budgetary needs based already on net prices before negotiation17,
takes into consideration the product lifecycle perspective of the present budgeting system
and its ensuing fixed and automatic price reductions (Figure 21; green area) foreseen for
funding innovation (Figure 21; red area). Notice that these price reductions gradually
increase the access bar for novel competitive therapies while the lower cost comparator
makes it more difficult for a new drug to show a beneficial cost-effectiveness level
(Camejo, McGrath, & Herings, 2011).
Doing the horizon scan one can observe in Figure 21 that taking a three-year planning
horizon the mechanistic price reductions from innovative cancer therapies available on the
17 Prices negotiated between payer and manufacturer are held confidential
40
market can only fund 35% of innovation. Taking a five year perspective this drops to only
24% indicating the need for urgent further budgetary measures, potentially including
budget increase, to fund the emerging therapeutic innovation pipeline. In our analysis
we did not take into account the cannibalisation effects of new drugs on existing drugs,
nor did we take into account the effect of cost sharing market entry agreements.
Furthermore, disinvesting from low-benefit use of established medicines (Henshall,
Schuller, & Mardhani-Bane, 2012), de-reimbursements (Lepage-Nefkens et al., 2013)
will have to be considered to better balance the budget needed for therapeutic innovation
in oncology. As recently suggested as a measure to increase competition in the US
healthcare system (Shepherd, 2016), also in the Belgian context, providing equal access
to the market to “cheap” originals, generics and biosimilars is a way to free up means for
therapeutic innovation.
Figure 21: 2020 projection of funding released through expected mechanistic price cuts in Belgium
and the expected sales from novel targeted therapies and immunotherapies. The total price
reductions over these 5 years can fund 24% of the projected therapeutic innovation. (Source:
Vlerick HMC Analysis)
Clearly, systematically doing this scan on a sufficiently long horizon is needed to reveal
early enough whether we do have a problem funding innovation if not changing health
budgetary policy now. As a result of this horizon scanning one can conclude that to fund
innovation in cancer treatment, if no further measures are taken the pharmaceutical
specialties budget will need to be raised notwithstanding optimal price control
measures proposed further . Needless to say that in the present conditions of austerity
this is not an obvious choice, but might be justified taking into account the gradual filling
of therapeutic voids in cancer treatment
41
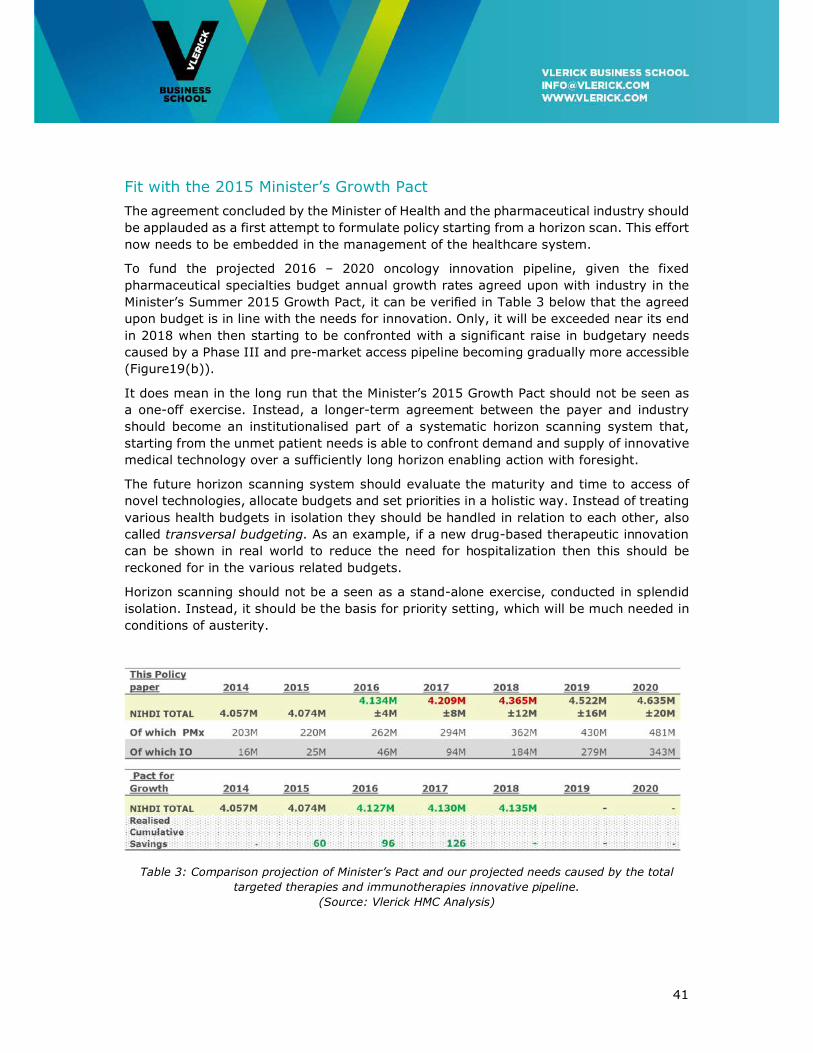
Fit with the 2015 Minister’s Growth Pact
The agreement concluded by the Minister of Health and the pharmaceutical industry should
be applauded as a first attempt to formulate policy starting from a horizon scan. This effort
now needs to be embedded in the management of the healthcare system.
To fund the projected 2016 – 2020 oncology innovation pipeline, given the fixed
pharmaceutical specialties budget annual growth rates agreed upon with industry in the
Minister’s Summer 2015 Growth Pact, it can be verified in Table 3 below that the agreed
upon budget is in line with the needs for innovation. Only, it will be exceeded near its end
in 2018 when then starting to be confronted with a significant raise in budgetary needs
caused by a Phase III and pre-market access pipeline becoming gradually more accessible
(Figure19(b)).
It does mean in the long run that the Minister’s 2015 Growth Pact should not be seen as
a one-off exercise. Instead, a longer-term agreement between the payer and industry
should become an institutionalised part of a systematic horizon scanning system that,
starting from the unmet patient needs is able to confront demand and supply of innovative
medical technology over a sufficiently long horizon enabling action with foresight.
The future horizon scanning system should evaluate the maturity and time to access of
novel technologies, allocate budgets and set priorities in a holistic way. Instead of treating
various health budgets in isolation they should be handled in relation to each other, also
called transversal budgeting. As an example, if a new drug-based therapeutic innovation
can be shown in real world to reduce the need for hospitalization then this should be
reckoned for in the various related budgets.
Horizon scanning should not be a seen as a stand-alone exercise, conducted in splendid
isolation. Instead, it should be the basis for priority setting, which will be much needed in
conditions of austerity.
Table 3: Comparison projection of Minister’s Pact and our projected needs caused by the total
targeted therapies and immunotherapies innovative pipeline.
(Source: Vlerick HMC Analysis)
42
4.2 A first role of competition in a Conditional Dialogue between Payers and Industry
From the future developments in oncological medical innovation described in the previous
Chapter followed by the budgetary discussion above we conclude so far that health policy
innovation is needed to match the supply and demand of technological innovation with
constrained pharmaceutical specialties budgets and that competition can play a defining
role in managing this matching process.
As discussed before, health policy innovation should be geared to avoid biopharmaceutical
me-too innovation behaviour and stimulate R&D races for breakthrough innovation in
domains of high unmet medical need by making use of respectively price and R&D
competition. This has been shown to have a downward pressure on me-too prices whilst
still having a positive effect on the speed with which new therapies at a price premium are
discovered. Hence, making use of price and R&D competition a better match is made
between supply and demand for innovative medical technology.
From this Chapter it should have become clear that acting with sufficient foresight is
essential to capture potential future needs for innovative medical technology, which should
be funded to maximum extent by savings from increased competition amongst and from
generics and biosimilars. Also, de-reimbursements resulting from novel therapeutics
successfully competing with and hence replacing less cost-effective incumbent therapies
should free up resources for medical innovation.
These are the first elements of a paradigm, a way of working between society and the
innovative pharmaceutical industry we would define as a ‘Conditional Dialogue’, centred
on competition and rewarding true therapeutic innovation. Society engaging into a
conditional dialogue acknowledges that industry has an obligation to satisfy shareholder
expected return whilst engaging in high-risk research but also the corporate social
responsibility to serve the public good to make people better on conditions society can
afford. This aims for a win-win outcome with a positive return on investment for pharma
at prices society considers to be fair and affordable.
From a health budget perspective the conditional dialogue can be defined to be successful
to the extent it can avoid a budget raise needed to match supply and demand of innovative
medical technology.
In the following Chapters we will discuss subsequent elements constituting the conditional
dialogue between society and industry.
43
4.3 Recommendations
To sustainably match the demand and need for innovative medicines a pharmaceutical
specialties budgeting system should be based on resolving unmet needs and responding
to societal preferences, specifying societal urgency.
• To capture the scientific evolution of the oncology treatment pipeline a 5-year
rolling (i.e. updated every year) forecast should be conducted by NHIDI in
collaboration with the pharmaceutical industry. Ideally this is conducted on an
international or European level.
• Conducted at national level only, a horizon scanning transversal budgeting system
is used as input to a 5-year rolling (i.e. yearly-adjusted) budget forecast exercise.
• Savings considered within a transversal budgeting system take into account
product life cycle-based adaptations to prices and de-reimbursement of actual
medications.
• The use of cheap medicines should be promoted to release means for funding
innovation.
• Implementation of strategies to obtain the lowest price possible also for innovative
treatments, with an emphasis on me-too innovation.
• Budget spill-overs, calculated from budget impact analysis (BIA), are taken into
account releasing cross-budget lines means for innovation, leading to better use of
scarce resources. The transversal system takes into consideration spill-overs from
surgery, radiotherapy, and hospitalisation.
• Transparency on budget allocation should be well managed toward public opinion
and societal expectations. However, it should not be the basis for setting
expectations towards patient populations.
44
5. The Need for Early Involvement in Adaptive Pathways-enabled Medicines Development
Payers and regulators should foster industry research into novel oncological therapies
responding to areas of unmet medical need and simultaneously raise the bar for me-too
innovation. Unmet medical need means a ‘condition for which there exists no satisfactory
methods of diagnosis, prevention or treatment in the Community or, even if such a method
exists, that the medicinal product concerned will be of major therapeutic advantage to
those affected’18. An example of unmet medical need is pancreatic cancer for which a
solution is lacking. Or, one can have an innovative solution available like an
immunotherapy but access is lacking if the regulatory system is too stringent.
It should be noted that in the present access system initiative to introduce new therapies
is heavily tilted towards industry. In our view, it is society’s duty to restore that balance
and indicate to industry which medical, therapeutic and societal needs are most wanted.
A horizon scanning system matching unmet need with the present status of the scientific
pipeline can serve such a purpose but needs to be built. This way the health priorities and
long-term goals of the country are matched with the potential offered by the cancer
treatment pipeline.
It is important that the perspectives of all health stakeholders are taken into account to
perform this horizon scan. Collection of evidence-based information from medical
oncologists, industrial and academic clinicians, patients and payers should be the
foundation for the system. In practice this could be a task of the Cancer Centre involving
all stakeholders and in cooperation with a European level to carry enough weight.
One could for example lead to commissioning academia/industry in developing novel
therapies in a particular high need situation such as pancreatic cancer. An historic example
is the path that led to the development of paclitaxel in the 1980-90’s (DeFuria & Horovitz,
1993), still a very valuable drug in an array of cancers that even expanded further in
recent years.
Second, there is growing patient demand for timely access to novel therapies while “the
safest drug that no one can afford or that arrives too late is of no benefit to a patient”
(Eichler et al., 2015). Although met by some with scepticism stating that fast market
access has led to an estimated 35% increase in safety warnings and substantial numbers
of black-box warnings and even market withdrawals (Cassie et al., 2014; Naci, Carter, &
Mossialos, 2015), an adaptive development and licensing paradigm seems to be the way
forward for payers and regulators to improve access to promising therapies (Eichler et al.,
2015; Eichler et al., 2012). Care should be taken that further trial commitments are
effectively complied with which has been problematic in the past.
Third, both national and international publicly funded pragmatic and practice-oriented
clinical trials could be the answer for research questions that are unlikely to be answered
by medical manufacturers. This could be research into older often cheap medicines outside
the innovative cancer treatment field, that no longer can be patented but that may be
18 Commission Regulation (EC) No. 507/2006, Article 11, Paragraph 2.
45
instrumental fighting its causes such as alcohol abuse (FlemishCancerLeague, 2013).
Therefore, the recommendations of the related KCE Report 246Cs (Neyt, Christiaens,
Demotes, & Hulstaert, 2015) are supported. The questions put in such trials and the trial
methodology should be carefully picked as the past has shown that academia is often
unable to complete phase III trials in a reasonable timespan, so answers might come late
or not at all.
Finally, acknowledging the need to concentrate expertise there should be less treatment
centres with more patients or adequate supported networking to expose patients to the
highest expertise possible and enhance recruitment in clinical trials. The nodes in these
networks should be able to follow easier procedures, make use of simplified recruitment
facilitated by interconnected patient registers and databases.
There’s a need for clarification of the standard of care cost as compared to the extra
hospital cost for patients recruited in a RCT (Randomized Clinical Trial). There’s a need for
a standard contract and fee structure.
As a general rule, to ensure efficient data collection whilst managing data and analysis
quality it is recommended to decentralize screening in peripheral hospitals and GP
practices but to centralize experimental treatments. In this respect, MOCs between
institutions are part of network creation.
5.1 Stimulating research into areas of unmet need
Stimulating research into areas of unmet need starts with horizon scanning serving as an
early warning system to policy makers identifying the pipeline of promising health
technologies becoming available. On the other hand, capturing domains of unmet need
using more inclusive processes involving patient communities and a broad range of health
stakeholders seems to be the best way forward to prioritize attention for appropriate
decision making and resource allocation supporting promising industry research (Mattison,
2013; Murphy, Packer, Stevens, & Simpson, 2007). Involving the patient in the decision-
making process increases transparency and societal buy-in to health policy. Also, it
provides insight in their driving rationales, ethical considerations and fundamental trade-
offs made (Cleemput et al., 2014). The conceptual framework to assess the value of cancer
treatment recently developed by ASCO and ESMO was designed to also be used to facilitate
physician – patient discussion on the personalized treatment to be followed (Cherny et al.,
2015; Schnipper et al., 2015). It needs to be further evaluated but should be applauded
as an initiative while promoting patient engagement in her/his treatment process.
In 2014, in an effort to align this supply and demand for innovative medical technology
the unmet medical need (UMN) process was implemented in Belgium providing early
temporary access (ETA) and reimbursement (ETR) to promising medicines that however
are not accessible yet following the normal regulatory pathway. This program is not very
successful for oncology and should be amended.
At this moment, to be implementable in practice a prioritization system for unmet need
should be worked out in detail. Disease burden might be a good starting point. As such
cancer would feature higher on the priority list than diabetes. However, in our view this
46
should not be confounded with quality of treatment. As an example, we do not believe
that a PFS-only oncology treatment should be compared with enhanced glycaemia control
in diabetes. Both treatments should be compared with other candidate therapies in their
own domains for prioritization.
Finally, based upon this prioritization and starting from Phase I early scientific advice on
development plans, regulatory support and early health technology assessment (HTA)
advice should be provided to promising medicines in development in industry, providing
them with an ‘early access’ label. In this sense the Safe and Timely Access to Medicines
(STAMP) PRIME project conducted by the Federal Agency for Medicines and Health
Products (FAMP) is supported. It can be used by industry innovators for early market
assessment and economic evaluation and for investigating pricing and reimbursement
scenarios connected to clinical development (IJzerman & Steuten, 2011). The goal of such
scientific advice process should be to collaboratively (payer/regulator – manufacturer)
getting agreement on what constitutes innovation and getting clear on which target to aim
for; which value expansion to be expected, which could lead to more positive HTA
decisions.
Finally, for payers, being involved early in clinical development also prepares them well
for subsequent price negotiations preceding market access (Pham et al., 2014).
Concluding, early dialogue between innovating manufacturers, regulators, and HTA/payers
integrating scientific and HTA advice avoids being involved only in late, hence marginal
therapy development. This would lead to more positive market authorization decisions in
areas of high unmet medical need.
5.2 Towards open collaborative Adaptive Pathways and Adaptive Licensing
The core paradigm in oncology drug development needs to be changed to be built on early
patient stratification (Biankin, Piantadosi, & Hollingworth, 2015). To do so, open (i.e.
across organisations and companies) registries-based patient recruitment for clinical
studies should be stimulated to answer the recruitment challenges in stratified medicine.
An appropriate legal framework is needed for bio-banking to stimulate research and
innovation in advanced medicinal products.
Also, to cater for the high uncertainty the process should follow an adaptive pathway
making therapy development and market authorization an iterative process that
progressively provides access to patients integrated with adaptive pricing.
Furthermore, Belgium should be further seen as a Reference Member State for clinical
trials oncology and be recognized as “preferential reporter member state” as from 2016.
It should maintain its position for Phase I Clinical Trials.
Science-industry involvement should be organised on an international level. Belgium
should participate more in these international collaborations. HOVON and EORTC academic
trials are a good example of this.
47
Finally, all clinical results (RCT and RWE (Real World Evidence)) should be published on a
centralised portal reporting in advance conflicts of interest following the ‘only once’
principle and connected in a EU context. In this respect, the national clinical trial site that
facilitates the access to such information could be a major help (e.g. cancertrials.be
organized by the BSMO) (Awada et al., 2013).
The more recent Precision Belgium initiative for off-label genotype-matched treatments
also works in that direction including a centralized database.
5.3 Recommendations
Oncological research needs fast-track approvals for potential breakthrough medicines,
more pre-competitive collaboration, patient pooling of data and an adaptive medicinal
development process that seamlessly transits from clinical studies showing efficacy to real
world evidence-based studies testing for (cost-)effectiveness in the real world. More
specifically;
• Open registries-based patient recruitment for clinical studies should be stimulated to
answer the recruitment challenges in stratified oncological medicine.
• An appropriate legal framework is needed for biobanking to stimulate research and
innovation in advanced medicinal products.
• To cater for the high uncertainty therapy development and market authorization should
be made an iterative ‘adaptive’ process that progressively provides access to patients
conditional upon performance and integrated with adaptive pricing reflecting the real-
time level of evidence.
• Initiatives increasing early payer and HTA advice involvement in clinical development
decision making should be stimulated. Early advice is scientific in nature and hence
dealing with concerns on comparators and endpoints (binding advice), pragmatic (i.e.
better attuned to real-life evidence) trials not being too selective in study populations.
• Current Art 81, 81bis and ETA/ETR unmet need initiatives should be improved
providing early access and early visibility on the most value-adding medical technology
innovation.
• Early dialogue should also be clear on the unmet clinical need and its implications for
further development and on the link to post-marketing evidence generation.
• To accelerate medical progress, incentives should be created to allow research
institutions to access data and samples to identify better biomarkers for better patient
selection. It is crucial therefore that tissue banks and data collected in pharma
sponsored studies be opened to academic investigators.
• Need for clarification of the standard of care cost as compared to the extra hospital
cost for patients recruited in a RCT. There’s a need for a standard contract and fee
structure.
48
• Fund both national and international publicly funded pragmatic and practice-oriented
clinical trials to answer specific clinical effectiveness and cost-effectiveness questions
that are unlikely to be answered by medical manufacturers. The recommendations of
the related KCE Report 246Cs (Neyt et al., 2015) are supported.
• Science-industry involvement should be organised on international level. Belgium
should participate more in these international collaborations and should be promoted
as a preferred state for conducting Phase I clinical trials.
• Acknowledging the need for less experimental treatment centres with more patients;
easier procedures, simplification of recruitment (connections registers and database).
• Recommendation to decentralize screening but centralize experimental treatment.
Proposition for MOCs between institutions (part of network creation).
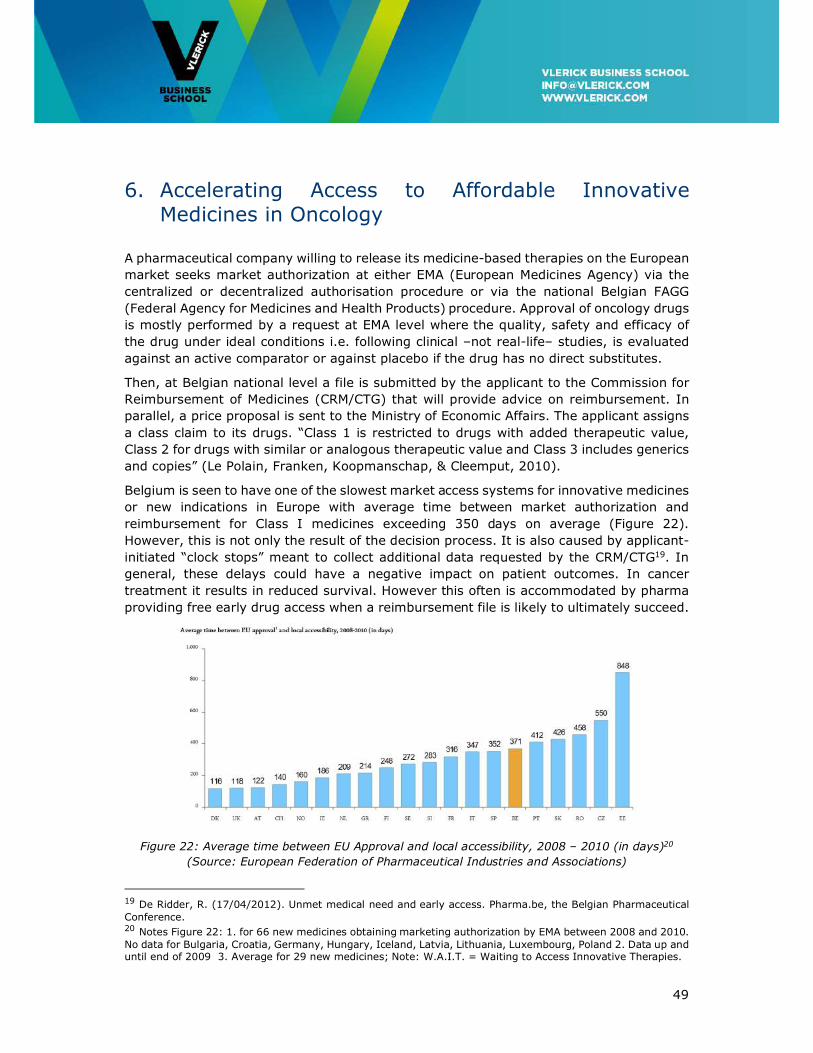
49
6. Accelerating Access to Affordable Innovative Medicines in Oncology
A pharmaceutical company willing to release its medicine-based therapies on the European
market seeks market authorization at either EMA (European Medicines Agency) via the
centralized or decentralized authorisation procedure or via the national Belgian FAGG
(Federal Agency for Medicines and Health Products) procedure. Approval of oncology drugs
is mostly performed by a request at EMA level where the quality, safety and efficacy of
the drug under ideal conditions i.e. following clinical –not real-life– studies, is evaluated
against an active comparator or against placebo if the drug has no direct substitutes.
Then, at Belgian national level a file is submitted by the applicant to the Commission for
Reimbursement of Medicines (CRM/CTG) that will provide advice on reimbursement. In
parallel, a price proposal is sent to the Ministry of Economic Affairs. The applicant assigns
a class claim to its drugs. “Class 1 is restricted to drugs with added therapeutic value,
Class 2 for drugs with similar or analogous therapeutic value and Class 3 includes generics
and copies” (Le Polain, Franken, Koopmanschap, & Cleemput, 2010).
Belgium is seen to have one of the slowest market access systems for innovative medicines
or new indications in Europe with average time between market authorization and
reimbursement for Class I medicines exceeding 350 days on average (Figure 22).
However, this is not only the result of the decision process. It is also caused by applicant-
initiated “clock stops” meant to collect additional data requested by the CRM/CTG19. In
general, these delays could have a negative impact on patient outcomes. In cancer
treatment it results in reduced survival. However this often is accommodated by pharma
providing free early drug access when a reimbursement file is likely to ultimately succeed.
Figure 22: Average time between EU Approval and local accessibility, 2008 – 2010 (in days)20
(Source: European Federation of Pharmaceutical Industries and Associations)
19 De Ridder, R. (17/04/2012). Unmet medical need and early access. Pharma.be, the Belgian Pharmaceutical Conference. 20 Notes Figure 22: 1. for 66 new medicines obtaining marketing authorization by EMA between 2008 and 2010. No data for Bulgaria, Croatia, Germany, Hungary, Iceland, Latvia, Lithuania, Luxembourg, Poland 2. Data up and until end of 2009 3. Average for 29 new medicines; Note: W.A.I.T. = Waiting to Access Innovative Therapies.
50
The decision taken to establish in Belgium the specialised CRM/CTG committee for the
assessment and appraisal of new drug proposals was and still is well received by all health
players involved. Although the drug pricing and reimbursement procedure followed is clear
to all parties, with enforced deadlines –Belgium having to accept the company-stated price
if not handled within 180 days– it still has one of the longest real observed timelines in
Europe. We and many others would want to see that Belgian national access to
therapeutic innovation should be granted at the same time as market approval
at EMA level. This could be on conditional and reversible terms pending a definitive
decision.
In its novel therapy appraisal the CRM/CTG, as in other European countries has the added
therapeutic value i.e. efficacy, effectiveness, safety and side-effects, ease of use and
comfort prevailing in its evaluation made. Next to these criteria, pricing, budget impact,
cost-effectiveness and therapeutic importance in the light of unmet medical need are also
taken into consideration. As in most of the other European countries (Le Polain et al.,
2010), all of these criteria are used to formulate a binary access decision (Class 1-3
granted) in a multiple criterion decision deliberation (MCDD) based on a holistic
consideration of the criteria, rather than being the result of an explicit hierarchy or formal
weighing of the criteria in a multiple criterion decision analysis (MCDA).
Although having cost-effectiveness as one of the appraisal criteria, as in most other
European countries, with the exception of the UK and Sweden, it is not formally used as a
threshold in the pricing decision (Caro et al., 2010). So novel therapy added value,
although influencing the price negotiated, is actually decoupled from pricing.
Belgium applies elements of value-based pricing but does not have it integrated in its
pricing & reimbursement system where for all medicines external reference pricing (ERP),
widely used in Europe, is used as supportive information, calculating a benchmark price
as the average of a basket of 24 countries, (Bouvy & Vogler, 2013), more specifically for
Belgium 6 countries. This ERP system also implies that Belgium, as a small country
referenced by countries with larger markets it is especially vulnerable to launch sequence
strategies used by pharmaceutical companies to delay or avoid launching new drugs in
markets with potential lower prices. For example, following Rémuzat (2015) ‘there is
evidence that pharmaceutical companies systematically delayed dossier submission in
Belgium in order to avoid the Belgian price, usually not in the highest EU range’. Industry
analysis conducted by pharma.be contradicts this.
Finally, a critique of the current reimbursement system is that patients are not
systematically involved in CRM/CTG decision-making. It is claimed that, although not
necessarily being versed in medicinal science patients can and should have a voice related
to the ethics of decision-making (Cleemput et al., 2014; FlemishCancerLeague, 2013).
Also, further research in close collaboration with patients should be conducted to better
understand the behavioural and societal aspects of the patient in her/his caregiver
environment. However, being the first stakeholder most intimately involved in the ultimate
decision, in our opinion they should not be consulted related to individual therapy access
files. Still, during the treatment process patients should be actively involved to understand
to a maximum extent the most relevant treatment benefits, and the trade-offs between
51
benefits and harms. They could also be involved in post-marketing real-world studies
including patient preference measurements.
Concluding, although the Belgian pricing & reimbursement decision-making process was
innovative at its creation it is in need now of an overhaul following three proposed key
principles. First, actions should be taken to improve access timing in line with EMA
market authorization. In this context and given the evolution towards a drug-diagnostic
nature of targeted therapy solutions the market access and pricing & reimbursement
process should be organised for simultaneous evaluation of diagnostic and targeted drug
so that a belated access decision of one component of a solution cannot stall the other
one, as suggested in Van Dyck & Geldof (2015). Second, in an effort to enhance
transparency of pricing decision making, a shift is needed from the presently used external
reference pricing system towards a value-based pricing policy as the basis for value-
for-money competitive payer-manufacturer negotiations. Value-based prices for
innovative agents should reward therapeutic innovation. But also, if properly designed a
value-based pricing system can be used by the payer to tilt the negotiation power balance
into its favour when being confronted with prices set by global biopharmaceutical
manufacturers. Finally, third, pricing and access decisions for novel therapeutics should
be made flexible and contingent upon the risk they represent to society and their outcome
proven in the real world. Therefore, access and pricing decisions taken in the CRM/CTG
should be made less rigid and revisable in the light of new evidence at the initiative
of any of the stakeholders represented in the CTG/CRM. For example this could be
competition-based pricing when innovative me-too drugs are subsequently becoming
available (next section). Doing so, as further explained in the next Chapter, they should
evolve following novel therapy real world evidence built up in a coverage with evidence
development (CED) or a pay-for-performance (PFP) scheme.
6.1 Dealing with unsustainable prices in oncology
The trend of unaffordable oncological drug prices are source of controversy world-wide
bringing in the question of fairness of cancer drug pricing, particularly in the US where
there’s a feeling that drug pricing has become more to do with ‘what the market can bear’
(Kantarjian & Rajkumar, 2015) rather than being oriented on the value therapeutic
innovation brings to the healthcare system and the patient in particular.
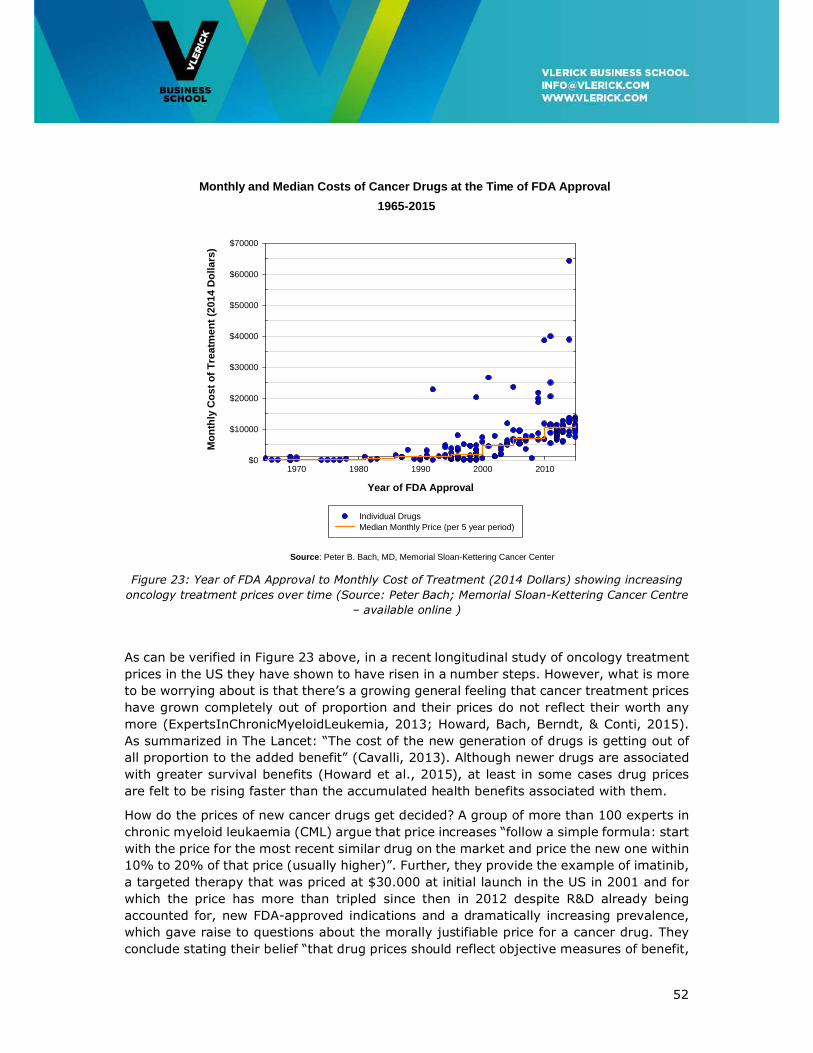
52
Figure 23: Year of FDA Approval to Monthly Cost of Treatment (2014 Dollars) showing increasing
oncology treatment prices over time (Source: Peter Bach; Memorial Sloan-Kettering Cancer Centre
– available online )
As can be verified in Figure 23 above, in a recent longitudinal study of oncology treatment
prices in the US they have shown to have risen in a number steps. However, what is more
to be worrying about is that there’s a growing general feeling that cancer treatment prices
have grown completely out of proportion and their prices do not reflect their worth any
more (ExpertsInChronicMyeloidLeukemia, 2013; Howard, Bach, Berndt, & Conti, 2015).
As summarized in The Lancet: “The cost of the new generation of drugs is getting out of
all proportion to the added benefit” (Cavalli, 2013). Although newer drugs are associated
with greater survival benefits (Howard et al., 2015), at least in some cases drug prices
are felt to be rising faster than the accumulated health benefits associated with them.
How do the prices of new cancer drugs get decided? A group of more than 100 experts in
chronic myeloid leukaemia (CML) argue that price increases “follow a simple formula: start
with the price for the most recent similar drug on the market and price the new one within
10% to 20% of that price (usually higher)”. Further, they provide the example of imatinib,
a targeted therapy that was priced at $30.000 at initial launch in the US in 2001 and for
which the price has more than tripled since then in 2012 despite R&D already being
accounted for, new FDA-approved indications and a dramatically increasing prevalence,
which gave raise to questions about the morally justifiable price for a cancer drug. They
conclude stating their belief “that drug prices should reflect objective measures of benefit,
Monthly and Median Costs of Cancer Drugs at the Time of FDA Approval
1965-2015
Year of FDA Approval
1970 1980 1990 2000 2010
Mo
nth
ly C
ost
of
Tre
atm
ent
(201
4 D
olla
rs)
$0
$10000
$20000
$30000
$40000
$50000
$60000
$70000
Individual Drugs Median Monthly Price (per 5 year period)
Source: Peter B. Bach, MD, Memorial Sloan-Kettering Cancer Center
53
but also should not exceed values that harm our patients and societies”
(ExpertsInChronicMyeloidLeukemia, 2013). They further propose a dialogue involving all
parties to curb the situation.
Now, the problem of disproportional rising of drug prices is not confined to the US, but
initial undisputed price setting in the US seems often to be at the root of the global
problem. Drug pricing being a global process (Danzon, Towse, & Mestre-Ferrandiz, 2015)
delivering affordable cancer care in high-income countries like in Europe has also become
seen to be a burden stressing health budgets. While in the US the non-ability of payers
to negotiate is probably one of the main drivers of high prices, in particular in
Europe with its public payer systems more and more interacting with industry there’s a
feeling that value-based approaches, having suitable clinical research and integrated early
health economic studies, not accepting substandard evidence and an informed transparent
regulatory system can bend the cost curve and deliver fair prices for real value offered by
therapeutic innovation (Sullivan et al., 2011).
Therefore, inspired by thirty years of health payers documented efforts to get drug prices
under control (Leopold, Chambers, & Wagner, 2016; Sullivan et al., 2011), a range of
market access agreements used across Europe (Jaroslawski & Toumi, 2011), and the
nature of anti-cancer drug innovation as specified in Chapter 3 above, we propose a
conditional dialogue to be arranged between health payers and the innovative
biopharmaceutical industry. This should allow pharmaceutical innovators to formulate a
basis of reimbursement that leads to a positive return on investment whilst being mindful
of physicians’, patients’ and payers’ norms of fairness in pricing.
Now, medicines pricing conducted by pharmaceutical companies is a global approach that
follows Ramsey optimal pricing. Following this logic ‘charging different prices in different
markets based on willingness and ability to pay is economically rational and efficient in
the sense of minimizing welfare loss resulting from monopoly’ (Danzon & Towse, 2003).
This way richer countries contribute more to finance global R&D than poorer countries that
are given access to the novel medicine but at an affordable price.
In Belgium, shaped in the CRM/CTG and taking maximal patient value for money as a
decision criterion this conditional dialogue could operate following a set of pricing methods
that fill in the key principles of the conditional dialogue proposed before as the basis for a
redesigned reimbursement system that is centred on competition and rewarding true
innovation.
The high prices of cancer treatment should more and more lead to negotiations based on
value-based principles. The evolutionary nature of cancer drug development pleads for the
use of dynamic lifecycle pricing and multi-indication pricing. The difficulty of assessing
value in oncology using overall survival (OS) has led to the use of surrogate endpoints like
progression-free survival (PFS) being used instead. However, both clinicians and
regulators are concerned about real world effectiveness and cost-effectiveness of these
PFS-based market approvals. This will necessarily lead to therapy pricing being in the
future more and more outcome-based, based on comparative effectiveness –rather than
on efficacy alone-, and leading to risk-based payment models and coverage with evidence
development.
54
We discuss each in turn below. Dynamic lifecycle pricing, outcome-based, risk-based
payment models, and coverage with evidence development will be dealt with in the next
Chapter.
Excluded from the following is the use of insurance-based models to pay for high-cost
therapies, making continued payment contingent upon improved patient health as
measured using biomarkers (Brennan & Wilson, 2014; Naldini, 2015). Also, platform-
based approval and registration strategies for individual patient-targeted gene and cell
therapies ‘as is the case for the transfer of T-cell antigen receptor genes that target tumour
neoantigens into autologous T cells of people with cancer’ (Naldini, 2015), will not be
further elaborated here but could be the subject of further work.
6.2 Negotiating following value-based principles pricing
Instead of or in addition to external reference pricing (ERP) widely used in Europe today,
pricing following value-based principles should be the basis for negotiations between payer
and manufacturer. The major argument against ERP is that it does not reflect the
willingness to pay of a country. Instead, it merely aligns its prices to a basket of prices
which lead to convergence but not necessarily to price a country can afford or is willing to
pay (Bouvy & Vogler, 2013). It limits a country’s freedom to accept a price that is
commensurate its national health system.
Negotiating following value-based principles represents an approach to pricing that takes
the basic principle of value-based pricing but which is more in line with the reality of
present decision-making and the potential of the decision-making methods used today.
Similar to the latter value-based pricing concept the quoted price in the negotiation should
be based on an evidence-based scientific assessment of cost and clinically-proven benefits
of the new technology (Claxton, Sculpher, & Carroll, 2011; Danzon et al., 2015). However,
the disputable nature of the explicit or implicit ICER21 threshold used in the method
(Cleemput, Neyt, Thiry, De Laet, & Leys, 2011; Ubel, Hirth, & Chernew, 2003) lead us to
only use the evidence-base principle of the approach. Also, with ICERs frequently
exceeding the £20-£30K threshold the introduction of the Cancer Drug Fund in the UK
shows that appraisals using a CE threshold might ‘not always be appropriate for oncology
treatments’ (Réjon-Parrilla et al., 2014). And finally, from a recent review QALYs were
reported to be limited in their ability to capture the value of health gains (Garau et al.,
2011).
Instead, pricing following value-based principles leads to a commercial agreement
between payer and manufacturer for a health solution –the latter while potentially a
combination of drugs or a targeted treatment-diagnostic combination (Van Den Bulcke et
al., 2015) – rewarding effect on patient population outcome and health system efficiency.
21 The ICER measures the economic value of a new health technology as a ratio—the incremental cost ∆� of a new intervention versus the standard of care (the numerator) over the incremental health benefits ∆���� (the denominator). The latter is summarized in a common metric that aims to convert all health outcomes to an equivalent number of healthy life-years, by adjusting expected life-years gained for changes in the quality of
55
This in contrast to pricing based on manufacturer input-related factors such as out-of-
pocket development costs, costs of failure and required shareholder returns, which only
lead to controversy on methodology and assumptions used (DiMasi, Hansen, & Grabowski,
2005; Light & Warburton, 2005a; Light & Warburton, 2005b; Paul et al., 2010).
So, in this method, value is accounted for but it is not immediately tied to what a health
payer is willing to pay for an incremental health benefit through the upfront defined
threshold. It requires value judgment from the CRM/CTG experts on the clinical benefits
and healthcare system costs realized as compared to the best present standard of care.
Pricing following value-based principles can evolve to become value-based differential
pricing if one is prepared to assign a willingness-to-pay level to an incremental health
benefit. An example in which this could be applied is the new immunotherapies having
high upfront likelihood of benefit in melanoma and low in breast cancer. The recent
introduction of mandatory baseline e-health registration of high-priced treatments makes
such an organ-based categorization of drug use possible. Now, for solid cancers the
European Society for Medical Oncology Magnitude of Clinical Benefit Scale (ESMO-MCBS)
could be used as a standardized approach to derive a relative categorization of the clinically
meaningful benefit to be expected from an oncological curative or non-curative treatment,
as derived from comparative outcome studies, most commonly Phase III RCTs. Its use is
recommended because not consistently using such a standardized approach might lead to
overstating benefits potentially causing harm to the credibility of cancer research and,
most importantly, to the patient who might become the victim of inappropriate hype or
disproportionate expectations (Cherny et al., 2015).
However, the ESMO-MCBS although claimed to be an unbiased tool it is uniquely based on
randomized clinical trial data, hence on clinical efficacy data excluding real-world
effectiveness evidence. When the full benefit of a treatment can only be seen by looking
beyond the period of trial, as in immuno-oncological treatments where a significant portion
of the patients remain alive at the end of the trial, the tool in its present form will not
rightly assess therapy benefits. Second, in its current form it cannot distinguish between
a given clinical benefit in two different cancers affecting different populations. And finally,
while not evaluating economic benefits or costs, in its current form it cannot be used
directly to evaluate the impact on economic value or pricing. However, it could be used as
basis though for such a system. But this would need to be further researched.
As depicted in Figure 24, following ESMO-MCBS a medicine that would fall into the A or B
categories for curative treatments and the 4 or 5 categories for non-curative treatments
are marked following this method to show substantial improvement in clinical benefit.
However, this does not automatically mean they are also of high value, which depends on
the price one needs to pay for them. In value-based principles pricing it can be one of the
most important criteria used in the judgment when determining the price one is willing to
pay.
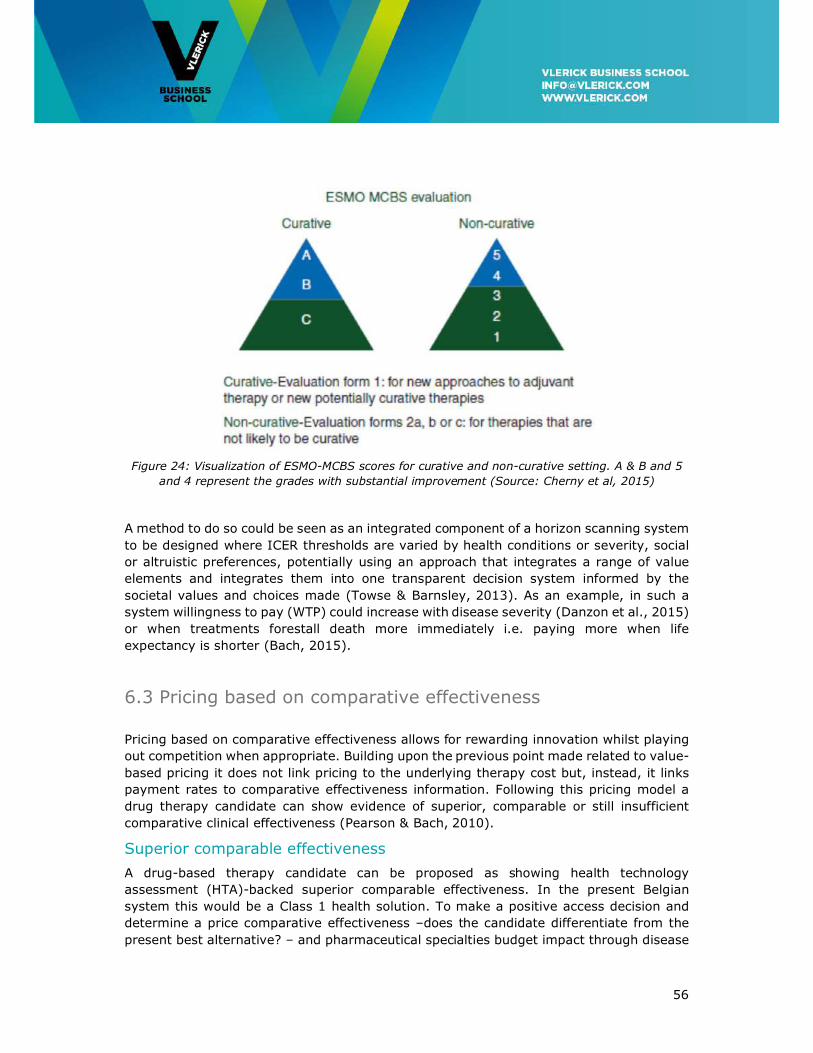
56
Figure 24: Visualization of ESMO-MCBS scores for curative and non-curative setting. A & B and 5
and 4 represent the grades with substantial improvement (Source: Cherny et al, 2015)
A method to do so could be seen as an integrated component of a horizon scanning system
to be designed where ICER thresholds are varied by health conditions or severity, social
or altruistic preferences, potentially using an approach that integrates a range of value
elements and integrates them into one transparent decision system informed by the
societal values and choices made (Towse & Barnsley, 2013). As an example, in such a
system willingness to pay (WTP) could increase with disease severity (Danzon et al., 2015)
or when treatments forestall death more immediately i.e. paying more when life
expectancy is shorter (Bach, 2015).
6.3 Pricing based on comparative effectiveness
Pricing based on comparative effectiveness allows for rewarding innovation whilst playing
out competition when appropriate. Building upon the previous point made related to value-
based pricing it does not link pricing to the underlying therapy cost but, instead, it links
payment rates to comparative effectiveness information. Following this pricing model a
drug therapy candidate can show evidence of superior, comparable or still insufficient
comparative clinical effectiveness (Pearson & Bach, 2010).
Superior comparable effectiveness
A drug-based therapy candidate can be proposed as showing health technology
assessment (HTA)-backed superior comparable effectiveness. In the present Belgian
system this would be a Class 1 health solution. To make a positive access decision and
determine a price comparative effectiveness –does the candidate differentiate from the
present best alternative? – and pharmaceutical specialties budget impact through disease
57
prevalence should be considered, not a marginal measure such as cost-effectiveness. If
the therapy is judged to be superior on effect and its required budget fits the budget
constraints foreseen for this type of technology as derived from horizon scanning, then a
positive decision should be taken, regardless of cost-effectiveness levels. Budget impact
can be limited by price negotiation with the manufacturer and by restricting use.
As an example, pertuzumab, trastuzumab, docetaxel (THP) combination therapy targeting
overexpression of the human epidermal growth factor receptor 2 (HER2/neu) occurring in
20-25% of breast cancer patients, is showing low probability of cost-effectiveness, even
at willingness to pay (WTP) levels well above commonly accepted thresholds (Durkee et
al., 2016).
However, clinical evidence showed high improved progression free survival and significant
improvement of overall survival in a metastatic setting. With ICERs varying between $47K
per QALY gained when almost given for free and nearing $500K per QALY gained when
paid for, the probability of getting access could rightfully be judged to be extremely low if
only judged on this criterion. Considering budget impact, widespread use of this regimen
in the US population with metastatic disease would cost $3.71 billion. Also considering
indirect costs this would rise to $5.14 billion. However, this should be seen in the context
of a US cancer-related budget of $207 billion by 2020. So, here we have a case of a
therapy being highly effective, not cost-effective but affordable provided upfront a societal
choice has been made to tackle this disease with priority, presenting an opportunity cost
to other treatment candidates if a budget is constrained, within the context of horizon
scanning.
Moreover, a Canadian CEA showed that the addition of pertuzumab was cost-effective in
the neoadjuvant (=before definitive surgery) treatment of HER2-positive early breast
cancer (Attard et al., 2015), while no impact on survival has been shown (yet). This again
shows the limitations of the ICER and demonstrates that a broad perspective, which goes
beyond the application of an ICER-only determined threshold, should be used when
evaluating drugs for advanced cancer (see section 3.4).
Therefore, access and pricing & reimbursement decision-making should be connected to
each other and not be seen in isolation, as currently in use. Doing so, the ICER can be
used as the connector, as a basis for (1) price setting following value-based differential
pricing principles (Danzon et al., 2015) and possibly corrected as specified in section 6.2
above, and (2) to determine health budget as a result of a systematic horizon scanning
exercise, modulated by unmet need and budget impact.
Comparable comparative effectiveness
If the drug solution candidate is judged by oncological experts of the CRM/CTG to be
comparable to the first-in-line therapy then therapeutic competition can be used to set a
price. This would apply to the Belgian Class 2 candidates. Instead of demanding HTA, a
therapeutic reference price would be given that maximally equals the present standard of
care solution within the therapeutic cluster.
58
Given the R&D race character novel therapies become sequentially accessible in a
therapeutic class. Downward pressure exerted on prices can be maximized by allowing
prices for newcomers to be maximally equal to the lowest price of all presently available
alternatives within the therapeutic class. Then, at regular intervals, based on real world
evidence built up in disease registries, NIHDI could stimulate voluntarist behaviour of
physicians by providing scientific advice informing them about the –then– best cost-
effective therapies. This way, manufacturers choosing to be active in ‘me-too’ zones are
incentivized to capture more market share by being motivated to lower their price. For a
me-too drug moreover a maximum price could be set that is systematically lower by a
certain percentage than the first-in class drug.
Oncologists would then still preserve freedom of prescription if a particular drug would be
more suitable for a particular patient, but counting on their social education and conscience
for choosing in general the cheaper drug.
However, the R&D race character of cancer research signals the importance of estimating
likeliness of new and established drugs in the cluster and the difficulty for CRM/CTG
experts to judge the comparative difference of the likely sequence of drugs becoming
accessible. Taking lung cancer as an example, there are several drug candidates targeting
the same cancer causing mechanism, called the ALK rearrangement. Key first line
indications are occupied by Pfizer’s Xalkori and second line by Novartis’ Zykadia. Of course
only 3 to 8% are driven by this ALK mechanism and the high number of candidates in
human trials is probably explained by the high price potential of this domain, even knowing
that in the US only a few thousand patients will suffer from it. So what would happen with
the new candidates? In the negotiation the manufacturer will rightfully try to find
unoccupied therapeutic space by proposing a Class 1 innovative agent proposed to be
more effective or better tolerated than the present best in the cluster. In any case the
patient/society wins by the competition. Or by getting access to a better treatment option
if judged to be a Class 1 compound. Or by having access to a potentially cheaper
alternative to best in class if judged to be Class 2.
Still insufficient comparable comparative effectiveness
Candidate compounds fit this category if the evidence presented to the CRM/CTG does not
allow the innovative therapy to be classified as being comparable, superior or even inferior
to the present treatments in the therapeutic cluster. In this case ‘dynamic pricing’ would
be used where for a period of three years real world evidence would be collected and a
price would be agreed upon which, while still showing uncertain performance, is
substantially lower than the actual price that could be received after this initial ‘learning’
period. To accelerate access this period could already start one year before EMA approval.
In the present Belgian system this description would fit the Art. 81 and ETA/ETR regulation.
Products that are qualified for this categorization are orphan medicines, Class 1 drugs or
products for which reimbursement for a new indication (with a therapeutic or social need)
is asked, and for products for which the reference product is reimbursed under “T”, which
means after a contract is signed between the pharmaceutical company and the social
security. According to Art. 81 (February 2010) and Art. 81bis (July 2014) of the Belgian
law, the Minister may allow the negotiation of a reimbursement contract for drugs, which
possibly can fulfil the criteria of being an ‘unmet medical need’, for which there was no
59
definitive motivated proposal formulated by the CRM within the fixed deadline of 150 days
due to clinical or budgetary uncertainty. This contract can be proposed on the initiative of
the company itself (Art. 81) or by the CRM/CTG (Art. 81bis). The timings of the
negotiations for reimbursement are prolonged with a maximum of 120 days. The
agreement is formed between the pharmaceutical company and NIHDI, with consent of
the Minister of Social Affairs and the Minister of Budget, and results in the possibility of a
temporary (maximum three years) reimbursement of the product. The agreement
determines the price and reimbursement level of the product under contract and might
obligate the pharmaceutical company to make a financial commitment for limiting the
NIHDI expenses (e.g. repaying part of the expenses of the product, lowering the
reimbursement level of other products of the company, etc.). Data are usually collected
during this temporary period to re-evaluate the therapeutic efficiency, the cost-efficiency
and the budget impact.
6.5 Multi-indication pricing
As stipulated before and depicted in Figure 25 below, many medicines currently available
in oncology and many more in the pipeline will be effective in multiple indications (Aitken,
Blansett, & Mawrie, 2015). Medical value delivered is likely to be different across these
indications. However, in the present uniform pricing system this does not correctly reflect
value which might hamper access or stifle innovation. Knowing that more than 50 per cent
of major cancer medicines marketed in 2014 were for multiple indications and that by
2020 this share is estimated at 75 per cent (Mestre-Ferrandiz, Towse, Dellamano, &
Pistollato, 2015) this is a problem to be dealt with.
Multi-indication differential pricing is preferred to the use of a single uniform price across
indications while if a single price is based on a higher value indication it would be too high
for lower value uses/indications potentially leading to restricted access while judged cost-
effective. If a single price is based on a lower value indication it could discourage
manufacturers to conduct research into areas that then might lead to insufficient return
on investment, which would stifle innovation in areas of high unmet need (Chapman &
Karlsberg Schaffer, 2015; Mestre-Ferrandiz et al., 2015; Pearson, Dreitlein, & Henshall,
2016).
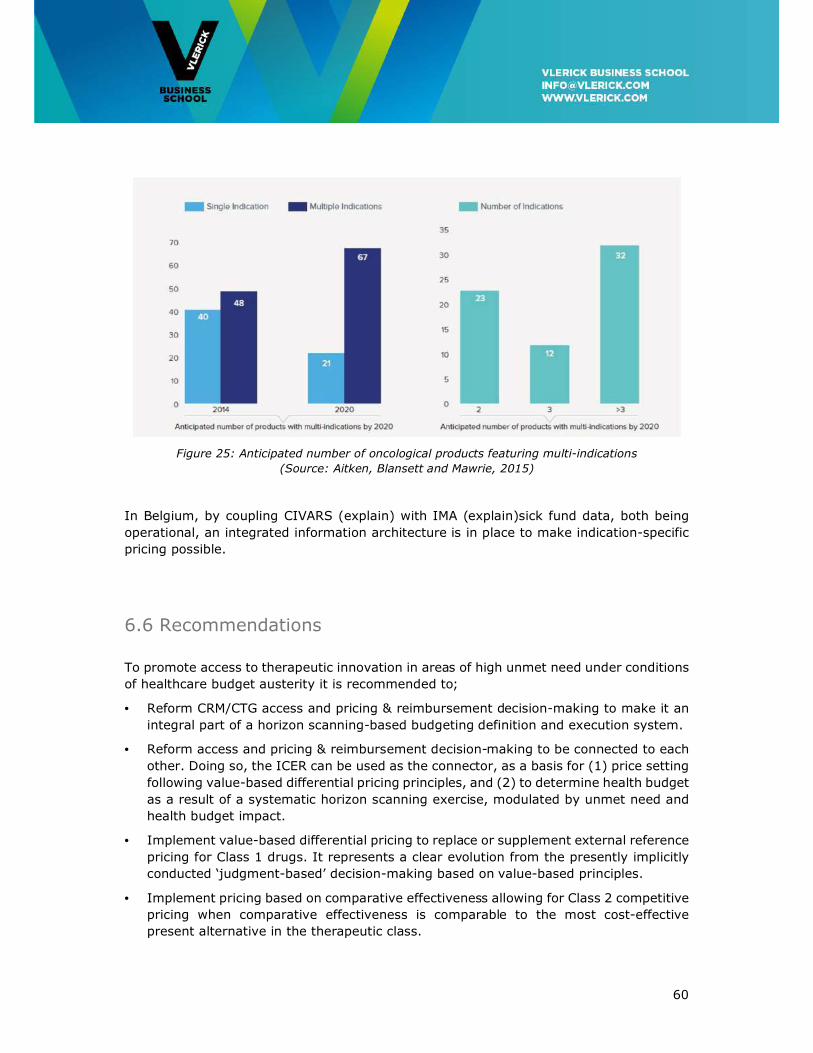
60
Figure 25: Anticipated number of oncological products featuring multi-indications
(Source: Aitken, Blansett and Mawrie, 2015)
In Belgium, by coupling CIVARS (explain) with IMA (explain)sick fund data, both being
operational, an integrated information architecture is in place to make indication-specific
pricing possible.
6.6 Recommendations
To promote access to therapeutic innovation in areas of high unmet need under conditions
of healthcare budget austerity it is recommended to;
• Reform CRM/CTG access and pricing & reimbursement decision-making to make it an
integral part of a horizon scanning-based budgeting definition and execution system.
• Reform access and pricing & reimbursement decision-making to be connected to each
other. Doing so, the ICER can be used as the connector, as a basis for (1) price setting
following value-based differential pricing principles, and (2) to determine health budget
as a result of a systematic horizon scanning exercise, modulated by unmet need and
health budget impact.
• Implement value-based differential pricing to replace or supplement external reference
pricing for Class 1 drugs. It represents a clear evolution from the presently implicitly
conducted ‘judgment-based’ decision-making based on value-based principles.
• Implement pricing based on comparative effectiveness allowing for Class 2 competitive
pricing when comparative effectiveness is comparable to the most cost-effective
present alternative in the therapeutic class.
61
• Implement for all Classes dynamic pricing conditional upon comparative effectiveness
to replace ‘one-off’ pricing at launch.
• Organize for real world evidence collection to support outcome-based and multi-
indication pricing
• Start a longitudinal study evaluating cost containment policy effectiveness. In other
words: whether the proposed competitive pricing mechanism is strong enough to have
a downward effect on drug-based therapy prices.
• Start a study to see how the ESMO-MCBS can be used to evaluate clinical value of
novel medicines and to inform health policy decisions as in which early development
to stimulate.
62
7. Building a Learning Healthcare System in Oncology
Today, in most European drug-based therapy development and patient access pathways
an essentially linear process of discovery and clinical development is followed by the
manufacturer, culminating in a dossier submission to the regulators and payers. It is
concluded by a binary approval/no-approval Market Authorization decision being granted
at one moment in time after which the actual usage starts.
Pressurized by patients and physicians demanding early this linear process is gradually
being replaced by a flexible, evolutionary version. The need for the new adaptive model is
exacerbated by the arrival of targeted therapies and immunotherapies typically delivered
in domains of high unmet medical need and small-size patient groups.
It should be understood that while randomized clinical trials are considered the gold
standard, they may not always be possible as in areas where no or few treatment options
exist. Also, RCTs might be challenged given the highly selective nature of included
patients, excluding the ‘average’ patient seen in practice. Lung cancer trials might provide
an example for this where ‘heavier’ patients might be seen in practice than in trials. Then,
additional evidence collected in Phase IV and non-interventional studies in the real-world
environment is a necessity.
In this now called ‘adaptive pathway’ process (Eichler et al., 2015; Eichler et al., 2012)
the drug candidate progresses in the pathway from lab to patient conditional upon
observed sufficient level and reduction of uncertainty on clinical effectiveness and cost-
effectiveness. In essence, novel drug evaluation and progression to market access and
usage becomes an ‘end-to-end’ continuum where clinical efficacy, safety and side-effects
and preliminary healthcare system cost knowledge of the drug candidate accumulated in
clinical development is gradually converted into real-world effectiveness, cost-
effectiveness and value-in-use knowledge in a set of ‘adaptive licensing’ steps, which are
granted conditionally upon delivery of ever deeper scientific evidence of ‘real-world’ drug
therapy performance i.e. in standard clinical practice.
Adaptive licensing pushes the initial market license upstream right after phase II. Then,
real world evidence (RWE) is gathered and monitored in a patient registry under a risk-
based market entry agreement (MEA) concluded with the manufacturer aiming to show
positive benefit-risk and added value in a specified patient sub-population, probably the
one with the highest unmet medical need. Subsequently, in a longitudinal approach RWE
can be further gathered to confirm, review, reject or extend initial authorization and
gradually expanding into other subpopulations, further reducing uncertainty. Clearly, this
flexible early access approach can only be initiated in domains of unmet need where
society judges the immediate availability of the drug to outweigh the inherent residual risk
of an expedited approval. It should be noted though that some would still call this approach
‘regulatory enthusiasm for faster market access’ only to the benefit of industry (Naci et
al., 2015).
Eventually, the gathering of real world evidence will result in healthcare evolving to
become a continuously learning system built on clinical care and real world patient
evidence feeding back into research (Aronson & Rehm, 2015; Biankin et al., 2015). As an
63
example, if patient registry-based information can be aggregated to disease registries they
could inform future pharmaceutical discovery of high risk population profiles, in advance
of any symptoms and predict disease onset or generate research questions leading to
novel therapies based on real world insights.
As a general rule, real world evidence collection systems should be disease-centric rather
than being drug product-centric. This will enable comprehensive views of patient’s disease
journeys but also inform and facilitate therapeutic reference pricing and competitive price
negotiations as specified before.
7.1 Operating the Oncology Healthcare Learning System
The following would be mostly applicable to new treatments that have an indication of a
high therapeutic impact in a high medical need area and concern rarer indications in which
large-scale evidence gathering is either impossible in a reasonable timeframe. To make
the adaptive pathway approach work in practice a learning system should be built and
operated requiring (1) a conditional approval and pricing & reimbursement process, (2)
patient registries or observational studies collecting information on patient experiences
and routine clinical practice, and (3) a set of RCT-based post-authorization safety and
effectiveness studies (PASS/PAES) conducted by manufacturers to monitor the life cycle
of their innovative therapies brought to the patient.
Towards a conditional approval and pricing & reimbursement process
Following an adaptive licensing process the innovating manufacturer would initially
conduct some small (while often orphan designations) conventional RCTs. If successful
and based upon this succinct information an initial market approval may be granted (A1
in Figure 26). Subsequent uncontrolled observational studies then aim to show treatment
outcome based on real world evidence (e.g. mortality, time to event) and safety (e.g.
incidence of life-threatening adverse effects) collected in a patient registry to remain above
a pre-agreed threshold, which is a point estimate and interval obtained from the initial
RCTs, and prior obtained outcome knowledge of best supportive care. Conditional upon
positive results subsequent approval could be granted (A2 in Figure 26) providing the
conditions to a full license (Eichler et al., 2012).
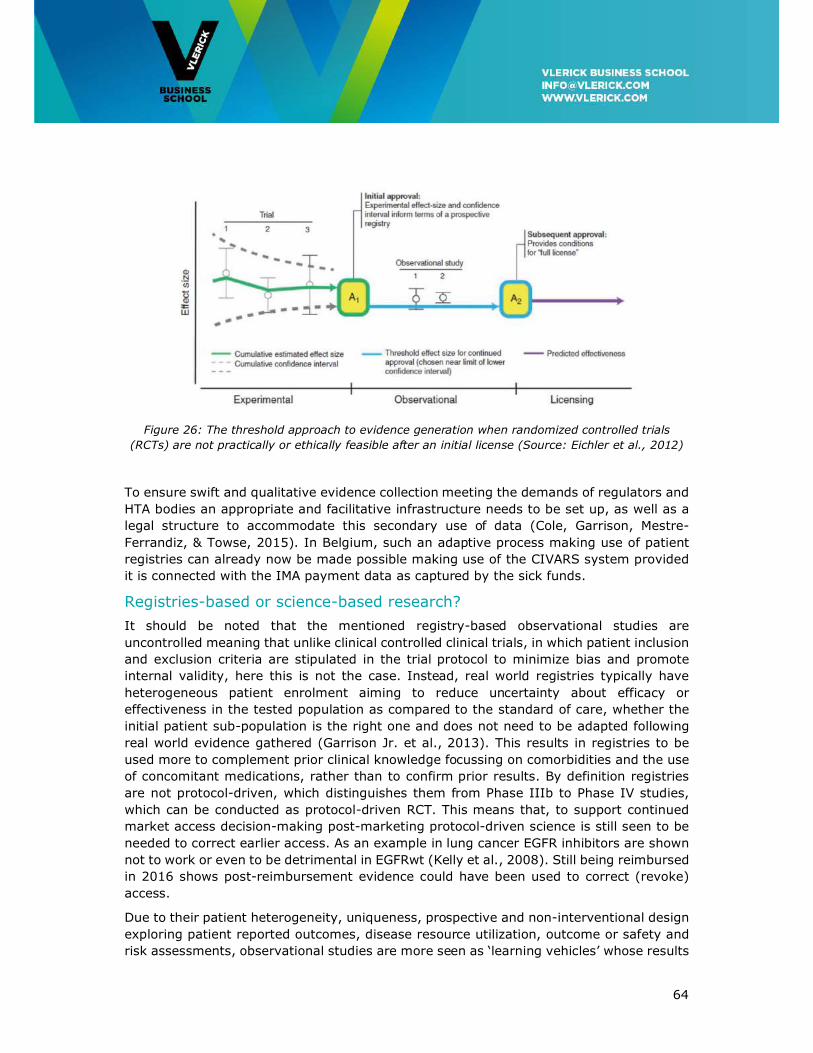
64
Figure 26: The threshold approach to evidence generation when randomized controlled trials
(RCTs) are not practically or ethically feasible after an initial license (Source: Eichler et al., 2012)
To ensure swift and qualitative evidence collection meeting the demands of regulators and
HTA bodies an appropriate and facilitative infrastructure needs to be set up, as well as a
legal structure to accommodate this secondary use of data (Cole, Garrison, Mestre-
Ferrandiz, & Towse, 2015). In Belgium, such an adaptive process making use of patient
registries can already now be made possible making use of the CIVARS system provided
it is connected with the IMA payment data as captured by the sick funds.
Registries-based or science-based research?
It should be noted that the mentioned registry-based observational studies are
uncontrolled meaning that unlike clinical controlled clinical trials, in which patient inclusion
and exclusion criteria are stipulated in the trial protocol to minimize bias and promote
internal validity, here this is not the case. Instead, real world registries typically have
heterogeneous patient enrolment aiming to reduce uncertainty about efficacy or
effectiveness in the tested population as compared to the standard of care, whether the
initial patient sub-population is the right one and does not need to be adapted following
real world evidence gathered (Garrison Jr. et al., 2013). This results in registries to be
used more to complement prior clinical knowledge focussing on comorbidities and the use
of concomitant medications, rather than to confirm prior results. By definition registries
are not protocol-driven, which distinguishes them from Phase IIIb to Phase IV studies,
which can be conducted as protocol-driven RCT. This means that, to support continued
market access decision-making post-marketing protocol-driven science is still seen to be
needed to correct earlier access. As an example in lung cancer EGFR inhibitors are shown
not to work or even to be detrimental in EGFRwt (Kelly et al., 2008). Still being reimbursed
in 2016 shows post-reimbursement evidence could have been used to correct (revoke)
access.
Due to their patient heterogeneity, uniqueness, prospective and non-interventional design
exploring patient reported outcomes, disease resource utilization, outcome or safety and
risk assessments, observational studies are more seen as ‘learning vehicles’ whose results
65
are seen by many not to weigh up against protocol-steered prospective post-marketing
trials. Leading to additional expenses on the manufacturer and an unwarranted burden on
oncologists and sometimes even patients they are not generally seen to add value.
With European regulators following the FDA Breakthrough Designation logic, hence
becoming more ‘AL in thinking’ and HTA/payers moving in the opposite direction becoming
ever more rigid on evidence expectations, challenges are raised for manufacturers and
treating physicians alike. All too often expectations for post-launch value assessments are
unrealistic, often based on misconceptions about clinical research methodology. Also,
multiple single registries capturing data for one company, one product, and one payer are
costly to implement from a financial and workload perspective and do not contribute
efficiently to public health knowledge. It is rather seen as a post-launch industry
investment dominated by the needs of disconnected payer and regulator requests rather
than by a programme to increase value of using new medicines.
7.2 Towards Dynamic Pricing
Payer – regulator interaction following this adaptive process should be brought in line with
pricing. This can be organised around the concept of dynamic pricing in which pricing is
synchronized with the conditional approval process thus mimicking its adaptive nature. As
depicted in Figure 27 below the value-based price can be modulated by the life cycle phase.
Dynamic pricing could also bring more sophistication in HTA studies looking when it is
desirable to publicly fund or reimburse a drug. As mentioned before, the relative
therapeutic value of a cancer treatment is likely to change over time. Being brought first
to patients suffering from advanced-stage disease, their net health benefit may be
marginal or low as compared to the standard of care. However, considering the
evolutionary nature of drug development the NHB (Net Health Benefit) can be considerably
higher when introduced later in an adjuvant or curative setting, or in when limited to a
biomarker-specified patient sub-population.
For this to happen the price of the drug along its life cycle should not be static as defined
at launch. Instead, from pre-launch to discontinuation it should be made dynamic following
its evolving cost-effectiveness profile, adapted to new medical information coming in
including competitive newcomers, and following a potentially new place in the medication-
based treatment spectrum (Pistollato, 2015; Schnipper et al., 2015). But more
importantly, it would bring more fairness to pricing, both from a payer and from a
manufacturer point of view.
As an example depicted in Figure 26 above, entering the first experimental phase of the
process entails a drug being conditionally used. As long as its value is under assessment
it seems fair that the price is substantially lower than the one eventually obtained at
market approval.
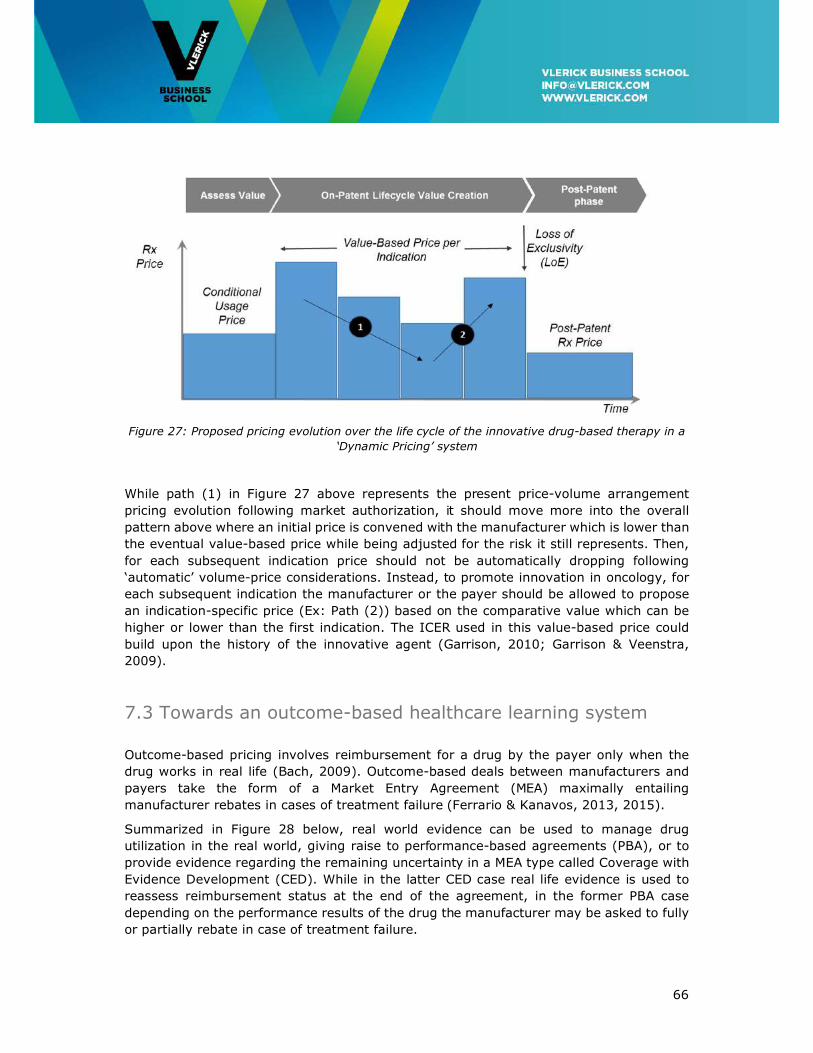
66
Figure 27: Proposed pricing evolution over the life cycle of the innovative drug-based therapy in a
‘Dynamic Pricing’ system
While path (1) in Figure 27 above represents the present price-volume arrangement
pricing evolution following market authorization, it should move more into the overall
pattern above where an initial price is convened with the manufacturer which is lower than
the eventual value-based price while being adjusted for the risk it still represents. Then,
for each subsequent indication price should not be automatically dropping following
‘automatic’ volume-price considerations. Instead, to promote innovation in oncology, for
each subsequent indication the manufacturer or the payer should be allowed to propose
an indication-specific price (Ex: Path (2)) based on the comparative value which can be
higher or lower than the first indication. The ICER used in this value-based price could
build upon the history of the innovative agent (Garrison, 2010; Garrison & Veenstra,
2009).
7.3 Towards an outcome-based healthcare learning system
Outcome-based pricing involves reimbursement for a drug by the payer only when the
drug works in real life (Bach, 2009). Outcome-based deals between manufacturers and
payers take the form of a Market Entry Agreement (MEA) maximally entailing
manufacturer rebates in cases of treatment failure (Ferrario & Kanavos, 2013, 2015).
Summarized in Figure 28 below, real world evidence can be used to manage drug
utilization in the real world, giving raise to performance-based agreements (PBA), or to
provide evidence regarding the remaining uncertainty in a MEA type called Coverage with
Evidence Development (CED). While in the latter CED case real life evidence is used to
reassess reimbursement status at the end of the agreement, in the former PBA case
depending on the performance results of the drug the manufacturer may be asked to fully
or partially rebate in case of treatment failure.
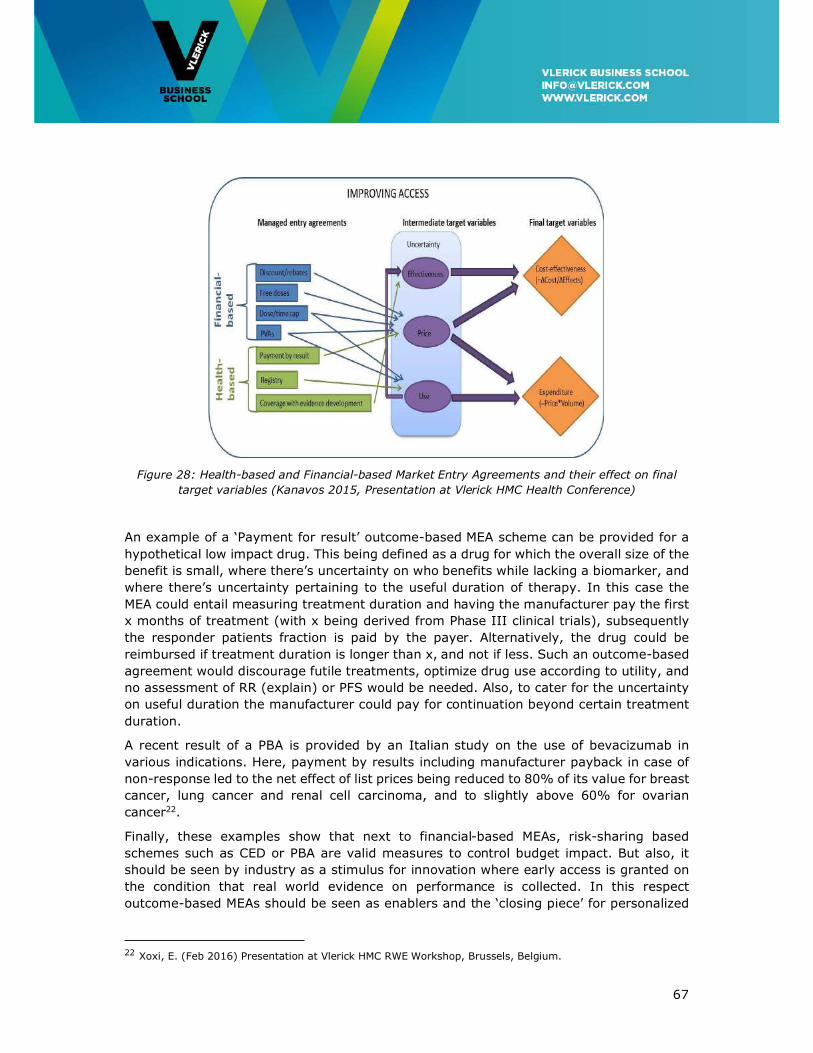
67
Figure 28: Health-based and Financial-based Market Entry Agreements and their effect on final
target variables (Kanavos 2015, Presentation at Vlerick HMC Health Conference)
An example of a ‘Payment for result’ outcome-based MEA scheme can be provided for a
hypothetical low impact drug. This being defined as a drug for which the overall size of the
benefit is small, where there’s uncertainty on who benefits while lacking a biomarker, and
where there’s uncertainty pertaining to the useful duration of therapy. In this case the
MEA could entail measuring treatment duration and having the manufacturer pay the first
x months of treatment (with x being derived from Phase III clinical trials), subsequently
the responder patients fraction is paid by the payer. Alternatively, the drug could be
reimbursed if treatment duration is longer than x, and not if less. Such an outcome-based
agreement would discourage futile treatments, optimize drug use according to utility, and
no assessment of RR (explain) or PFS would be needed. Also, to cater for the uncertainty
on useful duration the manufacturer could pay for continuation beyond certain treatment
duration.
A recent result of a PBA is provided by an Italian study on the use of bevacizumab in
various indications. Here, payment by results including manufacturer payback in case of
non-response led to the net effect of list prices being reduced to 80% of its value for breast
cancer, lung cancer and renal cell carcinoma, and to slightly above 60% for ovarian
cancer22.
Finally, these examples show that next to financial-based MEAs, risk-sharing based
schemes such as CED or PBA are valid measures to control budget impact. But also, it
should be seen by industry as a stimulus for innovation where early access is granted on
the condition that real world evidence on performance is collected. In this respect
outcome-based MEAs should be seen as enablers and the ‘closing piece’ for personalized
22 Xoxi, E. (Feb 2016) Presentation at Vlerick HMC RWE Workshop, Brussels, Belgium.
68
medicine; the more measurable the results of a candidate treatment, the higher its market
potential and stronger the incentive to do research (Jameson & Longo, 2015).
The need for cancer networks and a Trusted Third Party
To make the outcome-based learning healthcare system work in oncology implies that a
number of important components need to be developed. Among these are a more
detailed registration of cancer cases, not only at diagnosis but also at later stages of
the disease, at times of relapse or when a treatment line is abandoned or changed. In fact
the clinical course of cancer patients should be mapped from the start until cure or
treatment failure and death. This will require more elaborated e-communication
between healthcare providers and authorities, within the framework of e-health for
example. These components are required to evaluate the clinical efficacy of potentially
innovative therapies. In view of the diversity of the oncology field, many parameters are
needed to be registered and are depended on the specific cancer subtype. The scientific
organisations such as the Belgian Haematology Society and the Belgian Society of
Medical Oncology and others should be involved in the design of the specific cancer tracks
to be followed. Before such a comprehensive scheme could be implemented it would be
necessary to align hospital EPD’s so that automatic data capture by e-health would be
possible. Otherwise the additional burden on already heavily challenged oncologists would
be unacceptable.
A trusted third party (TTP) such as the Belgian Cancer Registry should be involved to
collect, analyse and report the data. Advantages of such an approach include its objectivity
and representativeness –as compared to RWE collection being organised by
manufacturers-, and potential for national standardisation leading to higher data quality,
speed of analysis and centralized build-up of expertise. However, the TTP should be given
the legal means to stimulate filling of the registries by all contributing parties like
physicians and manufacturers.
On the other hand, the oncology field needs to better organize in order to efficiently
capture all the data. Centralizing treatment will only be acceptable for rare/complex
cancers. Centralizing diagnosis and therapeutic strategy will be more practicable and
should be organized in well-designed cancer networks between hospitals. High-quality
registration, comprehensive follow-up and data reporting to the Cancer Registry could be
functions related to these cancer networks. These networks can be submitted to quality
control mechanisms for conditioned governmental financial support. The Italian experience
having implemented an integrated monitoring process and exchange of data between
pharmacist, clinician and patients under control of the regulatory authority governed by
law may serve as inspiration in this matter (Xoxi, Tomino, de Nigro, & Pani, 2012).
69
7.4 Recommendations
Main points:
• Real world evidence collection systems should be disease-centric rather than being
drug product-centric. This will enable comprehensive views of patient’s disease
journeys but also inform and facilitate therapeutic reference pricing and competitive
price negotiations as specified before.
• A more detailed registration of cancer cases is needed, not only at diagnosis but also
at later stages of the disease, at times of relapse or when a treatment line is abandoned
or changed. In fact the clinical course of cancer patients should be mapped from the
start until cure or treatment failure and death.
• Promote use of drug monitoring registries supporting capture of drug utilisation data,
dynamic pricing and outcome-based market entry agreements (MEA) for innovative
medicines in areas of high unmet need.
• Set up patient registries that account for the evolution in patient population and
treatment strategies over their lifetime this way enabling cost-effectiveness
calculations of medicines relative to alternative treatments.
• Centralize diagnosis and therapeutic strategy setting organized in well-designed cancer
networks between hospitals.
• Stimulate the use of coverage with evidence development (CED) by assigning a role of
trusted third party (TTP). The Belgian Cancer Registry could take up such a role
assuring anonymised capture of real world evidence as opposed to clinical evidence.
• Ensure minimal or preferably no additional administrative burden for healthcare
professionals to promote uptake and ensure sustainability of CED systems by
automatic capturing of data from aligned hospital EPD’s.
• Have a standardized e-approach for automatic data capturing across the Belgian
healthcare landscape, which is currently highly fragmented.
70
8. Conclusions and Recommendations
The conclusion of this White Paper is that a conditional dialogue is needed between society
and the pharmaceutical industry. This should aim for a win-win outcome –positive return
on investment for pharma and prices society considers to be fair and affordable. This
dialogue is not a one/off conducted when submitting a dossier to get market access.
Instead, it runs throughout the entire life cycle of a medicine, from the R&D phase through
to launch and during actual market usage.
Success of this conditional dialogue hinges on a performant horizon scanning system.
Scientific research drives the supply of technologies and medicines. If policy makers and
payers want to determine a realistic budget, they need to know what therapies will become
available in the pipeline and confront this with the unmet medical need. To be robust, this
horizon scanning should be done on an international or European level and involving payer,
patient and industry insights.
A successful conditional dialogue also requires early scientific advice to steer and stimulate
R&D and innovation in areas of unmet needs, e.g. lung cancer for which the 5-year age-
adjusted relative survival rate is only between 15% and 25%, depending on age category.
A horizon scanning system that matches the pipeline of promising therapies with the
identified unmet needs should form the basis for priority-setting. All health system
stakeholders, including patients should be involved in this process.
For the conditional dialogue to work, the present pricing system should evolve to become
a value-based transparent and integrated approval and pricing system that actually
rewards innovation in areas of unmet needs. A medicine’s pricing should reflect whether
it meets an unmet need, in which case it can be higher, or whether it’s essentially just a
me-too product, in which case competitive pricing should be used. Oncologists should be
more educated about the societal budgetary constraints and accept that affordability
should be prioritized over minor not essential differences between similar durgs. Value-
based pricing that rewards innovation also gives more negotiating power to the payer and
to society. The question is how much do we as a society want to pay for an improved
health benefit? This willingness to pay should be higher for an unmet need.
Finally, this conditional dialogue should be supported by performant post-launch systems
to collect real-world evidence in order to set up a learning healthcare system. A system is
needed to gather real-world evidence to monitor the performance of a drug after its launch
and to intervene if necessary. Gathering evidence in the real world is far from obvious,
though, because it’s an uncontrolled environment, with lots of confounding factors. But
it’s a must. It also allows pharmaceutical companies to learn and adapt their products to
patients’ most pressing needs. And logically, a medicine’s reimbursement should be made
conditional on its performance, built up over its life-cycle.
Sustainably providing patients with access to the delivering drug-based cancer treatment
pipeline in these times of austerity calls for health budget prioritization and competitive
real outcome-based price setting at a level society can afford. A conditional dialogue
between society and the innovative biopharmaceutical industry is a prerequisite and a
guarantee to make this happen.
71
Summary Recommendations
The conditional dialogue between society and the innovative medical industry should be
based on five principles; (1) acting with foresight, (2) early dialogue between
manufacturer and payer, (3) an integrated foresight, access & pricing system, (4) value-
based and competition-based pricing, and be (5) founded on an outcome-based disease-
centric healthcare learning system.
Acting with foresight
• To capture the scientific evolution of the oncology treatment pipeline a 5-year rolling
(i.e. updated every year) forecast should be conducted by NHIDI in collaboration with
the pharmaceutical industry. Ideally this is conducted on an international or European
level.
• Conducted at national level only, a horizon scanning transversal budgeting system is
used as input to a 5-year rolling (i.e. yearly-adjusted) budget forecast exercise.
• Savings considered within a transversal budgeting system take into account product
life cycle-based adaptations to prices and de-reimbursement of actual medications.
• The use of cheap medicines should be promoted to release means for funding
innovation.
• Implementation of strategies to obtain the lowest price possible also for innovative
treatments, with an emphasis on me-too innovation.
• Budget spill-overs, calculated from budget impact analysis (BIA), are taken into
account releasing cross-budget lines means for innovation, leading to better use of
scarce resources. The transversal system takes into consideration spill-overs from
surgery, radiotherapy, and hospitalisation.
• Transparency on budget allocation should be well managed toward public opinion and
societal expectations. However, it should not be the basis for setting expectations
towards patient populations.
Early dialogue between manufacturer and payer
• Open registries-based patient recruitment for clinical studies should be stimulated to
answer the recruitment challenges in stratified oncological medicine.
• An appropriate legal framework is needed for biobanking to stimulate research and
innovation in advanced medicinal products.
• To cater for the high uncertainty therapy development and market authorization should
be made an iterative ‘adaptive’ process that progressively provides access to patients
conditional upon performance and integrated with adaptive pricing.
• Initiatives increasing early payer and HTA advice involvement in clinical development
decision making should be stimulated. Early advice is scientific in nature and hence
72
dealing with concerns on comparators and end points, pragmatic (i.e. better attuned
to real-life evidence) trials not being too selective in study populations.
• Current Art 81, 81bis and ETA/ETR unmet need initiatives should be improved
providing early access and early visibility on the most value-adding medical technology
innovation.
• Early dialogue should also be clear on the unmet clinical need and its implications for
further development and on the link to post-marketing evidence generation.
• To accelerate medical progress, incentives should be created to allow research
institutions to access data and samples to identify better biomarkers for better patient
selection.
• Need for clarification of the standard of care cost as compared to the extra hospital
cost for patients recruited in a RCT. There’s a need for a standard contract and fee
structure.
• Fund both national and international publicly funded pragmatic and practice-oriented
clinical trials to answer specific clinical effectiveness and cost-effectiveness questions
that are unlikely to be answered by medical manufacturers. The recommendations of
the related KCE Report 246Cs (Neyt et al., 2015) are supported.
• Science-industry involvement should be organised on international level. Belgium
should participate more in these international collaborations and should be promoted
as a preferred state for conducting Phase I clinical trials.
• Acknowledging the need for less experimental centres with more patients; easier
procedures, simplification of recruitment (connections registers and database).
• Recommendation to decentralize screening but centralize experimental treatment.
Proposition for MOCs between institutions (part of network creation).
An integrated foresight, access & pricing system
• Reform CRM/CTG access and pricing & reimbursement decision-making to make it an
integral part of a horizon scanning-based budgeting definition and execution system.
• Reform access and pricing & reimbursement decision-making to be connected to each
other. Doing so, the ICER can be used as the connector, as a basis for (1) price setting
following value-based differential pricing principles, and (2) to determine health budget
as a result of a systematic horizon scanning exercise, modulated by unmet need and
health budget impact.
Value-based and competition-based pricing
• Implement value-based differential pricing to replace or supplement external reference
pricing for Class 1 drugs. It represents a clear evolution from the presently implicitly
conducted ‘judgment-based’ decision-making based on value-based principles.
73
• Implement pricing based on comparative effectiveness allowing for Class 2 competitive
pricing when comparative effectiveness is comparable to the most cost-effective
present alternative in the therapeutic class.
• Implement for all Classes dynamic pricing conditional upon comparative effectiveness
to replace ‘one-off’ pricing at launch.
• Organize for real world evidence collection to support outcome-based and multi-
indication pricing
• Start a longitudinal study evaluating cost containment policy effectiveness. In other
words; whether the proposed competitive pricing mechanism is strong enough to have
a downward effect on drug-based therapy prices.
• Start a study to see how the ESMO-MCBS can be used to evaluate clinical value of
novel medicines and to inform health policy decisions as in which early development
to stimulate.
Founded on an outcome-based disease-centric healthcare learning system
• Real world evidence collection systems should be disease-centric rather than being
drug product-centric. This will enable comprehensive views of patient’s disease
journeys but also inform and facilitate therapeutic reference pricing and competitive
price negotiations as specified before.
• A more detailed registration of cancer cases is needed, not only at diagnosis but also
at later stages of the disease, at times of relapse or when a treatment line is abandoned
or changed. In fact the clinical course of cancer patients should be mapped from the
start until cure or treatment failure and death.
• Promote use of drug monitoring registries supporting automatic capture of drug
utilisation data, dynamic pricing and outcome-based market entry agreements (MEA)
for innovative medicines in areas of high unmet need.
• Set up patient registries that account for the evolution in patient population and
treatment strategies over their lifetime this way enabling cost-effectiveness
calculations of medicines relative to alternative treatments.
• Centralize diagnosis and therapeutic strategy setting organized in well-designed cancer
networks between hospitals.
• Stimulate the use of coverage with evidence development (CED) by assigning a role of
trusted third party (TTP). The Belgian Cancer Registry could take up such a role
assuring anonymised capture of real world evidence as opposed to clinical evidence.
• Have a standardized e-approach to collecting data across the Belgian healthcare
landscape, which is currently highly fragmented.
• Ensure minimal or preferably no additional administrative burden for healthcare
professionals to promote uptake and ensure sustainability of CED systems by
automatic capturing of data from aligned hospital EPD’s.
74
References
Adams, R., Bessant, J., & Phelps, R. 2006. Innovation management measurement: A review. International Journal of Management Reviews, 8(1): 21-47.
Aitken, M., Blansett, L., & Mawrie, R. 2015. Developments in cancer treatments, market dynamics, patient access and value, Global Oncology Trend Report 2015. Parsippany, NJ: The IMS Institute for Healthcare Informatics.
Armstrong, B. K. 1992. The role of the cancer registry in cancer control. Cancer Causes
Control, 3: 569-579. Aronson, S. J., & Rehm, H. L. 2015. Building the foundation for genomics in precision
medicine. Nature, 526(15 October): 336-342. Attard, C. L., Pepper, A. N., Brown, S. T., Thompson, M. F., Thuresson, P. O., Yunger, S.,
Dent, S., Paterson, A. H., & Wells, G. A. 2015. Cost-effectiveness analysis of neoadjuvant pertuzumab and trastuzumab therapy for locally advanced, inflammatory, or early HER2-positive breast cancer in Canada. Journal of Medical
Economics, 18(3): 173-188. Awada, A., Annemans, L., Broeckx, D., Pauwels, P., Simoens, S., Van Belle, S., Van
Cutsem, E., Van Hoof, E., & De Grève, J. 2013. Stratified medicine: A call for action. Belgian Journal of Medical Oncology, 7: 15-19.
Bach, P. B. 2009. Limits on Medicare's Ability to Control Rising Spending on Cancer Drugs. New England Journal of Medicine, 360(6): 626-633.
Bach, P. B. 2015. Walking the tightrope between treatment efficacy and price. Journal of
Clinical Oncology, 34(9): 889-890. BCG. 2014. The innovation dilema in healthcare: How Belgium can simultaneously contain
costs and improve quality standards, White Paper. Biankin, A. V., Piantadosi, S., & Hollingworth, S. J. 2015. Patient-centric trials for
therapeutic development in precision oncology. Nature, 526(15 October): 361-370.
Bouvy, J., & Vogler, S. 2013. Priority Medicines for Europe and the World "A Public Health Approach to Innovation" - Update on 2004 Background Paper 8.3 Pricing and Reimbursement Policies: Impacts on Innovation. Utrecht: Winter Meeting of the Utrecht WHO Collaborating Centre for Pharmacoepidemiology and Pharmaceutical Policy Analysis.
Brennan, T. A., & Wilson, J. M. 2014. The special case of gene therapy pricing. Nature
Biotechnology, 32(9): 874-876. Burock, S., Meunier, F., & Lacombe, D. 2013. How can innovative forms of clinical research
contribute to deliver affordable cancer care in an evolving health care environment? European Journal of Cancer, 49: 2777-2783.
Camejo, R. R., McGrath, C., & Herings, R. 2011. A dynamic perspective on pharmaceutical competition, drug development and cost effectiveness. Health Policy, 100: 18-24.
Caro, J. J., Nord, E., Siebert, U., McGuire, A., McGregor, M., Henry, D., De Pouvourville, G., Atella, V., & Kolominsky-Rabas, P. 2010. The effciency frontier approach to economic evaluation off health-care interventions. Health Economics, 19: 1117-1127.
Cassie, F., Himmelstein, D. U., Woolhandler, S., Bor, D. H., Wolfe, S. M., Heymann, O., Zallman, L., & Lasser, K. E. 2014. Era of faster FDA drug approval has also seen increased black-box warnings and market withdrawals. Health Affairs, 3333(8): 1453-1459.
75
Cavalli, F. 2013. An appeal to world leaders: Stop cancer now. The Lancet, 381(9865): 425-426.
Chapman, A., & Karlsberg Schaffer, S. 2015. Assessing the Use of Multi-indication Medicines: a Review of Current Data Capabilities in the UK. london: Office of Health Economics.
Cherny, N. I., Sullivan, R., Dafni, U., Kerst, J. M., Sobrero, A., Zielinski, C., de Vries, E. G. E., & Piccart, M. J. 2015. A standardised, generic, validated approach to stratify the magnitude of clinical benefit that can be anticipated from anti-cancer therapies: The European Society for Medical Oncology Magnitude of Clinical Benefit Scale (ESMO MCBS). Annals of Oncology, 26: 1547-1573.
Claxton, K., Sculpher, M., & Carroll, S. 2011. Value-based pricing for pharmaceuticals: Its role, specification and prospects in a newly devolved NHS., CHE Research Paper
60.
Cleemput, I., Devriese, S., Kohn, L., Devos, C., Van Til, J., Groothuis-Oudshoorn, K., Vandekerckhove, P., & Van De Voorde, C. 2014. Hoe de voorkeur van de bevolking meenemen in de beslissing tot terugbetaling van een nieuwe behandeling?, KCE
Report 234A. Brussels: KCE, Belgium. Cleemput, I., Neyt, M., Thiry, N., De Laet, C., & Leys, M. 2011. Using threshold values for
cost per quality-adjusted life-year gained in healthcare decisions. International
Journal of Technology Assessment in Health Care, 27(1): 71-76. Cole, A., Garrison, L., Mestre-Ferrandiz, J., & Towse, A. 2015. Data Governance
Arrangements for Real-World Evidence: Office of Health Economics. Cook, J. P., Golec, J. H., Vernon, J. A., & Pink, G. H. 2011. Real option value and path
dependence in oncology innovation. International Journal of the Economics of
Business, 18(2): 225-238. Curado, M. P., Edwards, B., Shin, H. R., & al., e. 2007. Cancer Incidence in Five
Continents Vol IX. Lyon: IARC Scientific Publications No. 160 (http://ci5.iarc.fr/CI5i-ix/vol9/I_25.pdf).
Danzon, P. M., & Towse, A. 2003. Differential pricing for pharmaceuticals: Reconciling access, R&D and patents. International Journal of Health Care Finance and
Economics, 3: 183-205. Danzon, P. M., Towse, A., & Mestre-Ferrandiz, J. 2015. Value-based differential pricing:
Efficient prices for drugs in a global context. Health Economics, 24: 294-301. DeFuria, M. D., & Horovitz, Z. 1993. Taxol commercial supply strategy. J Natl Cancer
Inst, 15: 195-198. DiMasi, J. A., & Grabowski, H. G. 2007. Economics of new oncology drug development.
Journal of Clinical Oncology, 25(2): 209-216. DiMasi, J. A., Hansen, R. W., & Grabowski, H. G. 2005. Setting the record straight on
setting the record straight: Response to the Light and Warburton rejoinder. Journal of Health Economics, 24: 1049-1053.
DiMasi, J. A., & Paquette, C. 2004. The economics of follow-on drug research and development: trends in entry rates and the timing of development. Pharmacoeconomics, 22(Suppl 2): 1-14.
DiMasi, J. A., & Paquette, C. 2005. The economics of follow-on drug research and development: Trends in entry rates and the timing of development - The authors' reply. Pharmacoeconomics, 23(12): 1193-1202.
Durkee, B. Y., Qian, Y., Pollom, E. L., King, M. T., Dudley, S. A., Shaffer, Jenny L. , Chang, D. T., Gibbs, I. C., Goldhaber-Fiebert, J. D., & Horst, K. C. 2016. Cost-Effectiveness of Pertuzumab in Human Epidermal Growth Factor Receptor 2–Positive Metastatic Breast Cancer. Journal of Clinical Oncology, 34(9): 902-909.
76
Eichler, H.-G., Baird, L. G., Barker, R., Bloechl-Daum, B., Borlum-Kristensen, F., Brown, J., Chua, R., Del Signore, S., Dugan, U., Ferguson, J., Garner, S., Goettsch, W., Haigh, J., Honig, P., Hoos, A., Huckle, P., Kondo, T., Le Cam, Y., Leufkens, H., Lim, R., Longson, C., Lumpkin, M., Maraganore, J., O’Rourke, B., Oye, K., Pezalla, E., Pignatti, F., Raine, J., Rasi, G., Salmonson, T., Samaha, D., Schneeweiss, S., Siviero, P. D., Skinner, M., Teagarden, J. R., Tominaga, T., Trusheim, M. R., Tunis, S., Unger, T. F., Vamvakas, S., & Hirsch, G. 2015. From Adaptive Licensing to Adaptive Pathways: Delivering a Flexible Life-Span Approach to Bring New Drugs to Patients. Clinical Pharmacology & Therapeutics, 97(3): 234-246.
Eichler, H.-G., Oye, K., Baird, L. G., Abadie, E., Brown, J., Drum, C. L., Ferguson, J., Garner, S., Honig, P., Hukkelhoven, M., Lim, J. C. W., Lumpkin, M. M., Neil, G., O'Rourke, B., Pezalla, E., Shoda, D., Seyfert-Margolis, V., Sigal, E. V., Sobotka, J., Tan, D., Unger, T. F., & Hirsch, G. 2012. Adaptive licensing: Taking the next step in the evolution of drug approval. Nature, 91(3): 426-437.
ExpertsInChronicMyeloidLeukemia. 2013. The price of drugs for chronic myeloid leukemia (CML) is a reflection of the unsustainable prices of cancer drugs: from the perspective of a large group of CML experts. Blood, 121(22): 4439-4442.
Ferrario, A., & Kanavos, P. 2013. Managed entry agreements for pharmaceuticals: The European experience, EmiNet Report. London: London School of Economics and Political Science.
Ferrario, A., & Kanavos, P. 2015. Dealing with uncertainty and high prices of new medicines: A comparative analysis of the use of managed entry agreements in Belgium, England, the Netherlands and Sweden Social Science & Medicine(124): 39-47.
FlemishCancerLeague. 2013. How can cancer treatment remain affordable? Recommendations for an accessible and sustainable high quality cancer care. Brussels: Flemish Cancer League. Think tank affordability of the cancer treatment.
Fojo, T., Mailankody, S., & Lo, A. 2014. Unintended consequences of expensive cancer therapeutics - The pursuit of marginal indications and a me-too mentality yhat stifles innovation and creativity. The John Conley Lecture JAMA Otolaryngol Head
Neck Surg, 140(12): 1225-1236. Forman, D., Bray, F., Brewster, D. H., & al., e. Cancer Incidence in Five Continents,
Vol. X (http://ci5.iarc.fr) Lyon: IARC. Garau, M., Shah, K. K., Mason, A. R., Wang, Q., Towse, A., & Drummond, M. F. 2011.
Using QALYs in cancer: A review of the methodological limitations. Pharmacoeconomics, 29(8): 673-685.
Garrison Jr., L. P., Towse, A., Briggs, A., de Pouvourville, G., Grueger, J., Mohr, P. E., Severens, H., Siviero, P., & Sleeper, M. 2013. Performance-Based Risk-Sharing Arrangements—Good Practices for Design, Implementation, and Evaluation: Report of the ISPOR Good Practices for Performance-Based Risk-Sharing Arrangements Task Force. Value In Health, 16: 703-719.
Garrison, L. 2010. Rewarding Value Creation to Promote Innovation in Oncology: The Importance of Considering the Global Product Life Cycle. The Oncologist, 15(Supplement 1): 49-57.
Garrison, L. P., & Veenstra, D. L. 2009. The Economic Value of Innovative Treatments over the Product Life Cycle: The Case of Targeted Trastuzumab Therapy for Breast Cancer. Value In Health, 12(8): 1118-1123.
Hamermesh, R., Selby, N., & Andrews, F. 2013. Companion Diagnostics: Uncertainties for approval and reimbursement.: Harvard Business School.
Henshall, C., Schuller, T., & Mardhani-Bane, L. 2012. Using health technology assessment to support optimal use of technologies in current practice: The callenge of
77
"disinvestment". International Journal of Technology Assessment in Health
Care, 28(3): 203-210. Hollis, A. 2005. Comment on "The economics of follow-on drug research and development:
Trends in entry rates and the timing of development. Pharmacoeconomics, 23(12): 1187-1192.
Howard, D. H., Bach, P. B., Berndt, E. R., & Conti, R. M. 2015. Pricing in the Market for Anticancer Drugs. Journal of Economic Perspectives, 29(1): 139-162.
IJzerman, M. J., & Steuten, L. M. G. 2011. Early assessment of medical technologies to inform product development and market access. Applied Health Economics and
Health Policy, 9(5): 331-347. Jameson, J. L., & Longo, D. L. 2015. Precision Medicine — Personalized, Problematic, and
Promising. New England Journal of Medicine, 372(23): 2229-2234. Jaroslawski, S., & Toumi, M. 2011. Market access agreements for pharmaceuticals in
Europe: diversity of approaches and underlying concepts. BMC Health Services
Research, 11: 259. Jena, A. B., Calfee, J. E., Mansley, E. C., & Philipson, T. J. 2009. 'Me-Too' innovation in
pharmaceutical markets. Forum for Health Economics & Policy, 12(1): 1-19. Kantarjian, H., & Rajkumar, S. V. 2015. Why Are Cancer Drugs So Expensive in the United
States, and What Are the Solutions? Mayo Clinic Proceedings, 90(4): 500-504. Kelly, K., Chansky, K., Gaspar, L. E., Albain, K. S., Jett, J., Ung, Y. C., Lau, D. H. M.,
Crowley, J. J., & Gandara, D. R. 2008. Phase III Trial of Maintenance Gefitinib or Placebo After Concurrent Chemoradiotherapy and Docetaxel Consolidation in Inoperable Stage III Non–Small-Cell Lung Cancer: SWOG S0023. Journal of
Clinical Oncology, 26(15): 2450-2456. Kim, C., & Prasad, V. 2015. Cancer Drugs Approved on the Basis of a Surrogate End Point
and Subsequent Overall Survival: An Analysis of 5 Years of US Food and Drug Administration Approvals JAMA Internal Medicine, 175(12): 1992-1994.
Lacombe, D., Tejpar, S., Salgado, R., Cardoso, F., Golfinopoulos, V., Aust, D., Folprecht, G., Roth, A., & Stupp, R. 2014. European perspectives for effective cancer drug development. Nature Reviews Clinical Oncology, 11: 492-498.
Le Polain, M., Franken, M., Koopmanschap, M., & Cleemput, I. 2010. Drug reimbursement systems: International comparison and policy recommendations, KCE Report
147A. Brussels: Belgian Health Care Knowledge Centre. Leopold, C., Chambers, J. D., & Wagner, A. K. 2016. DECISION-MAKER COMMENTARY:
Thirty Years of Media Coverage on High Drug Prices in the United States—A Never-Ending Story or a Time for Change? Value In Health, 19: 14-16.
Lepage-Nefkens, I., Gerkens, S., Vinck, I., Piérart, J., Hulstaert, F., & Farfan-Portet, M.-I. 2013. Barrières en drijfveren voor de opname van biosimilaire geneesmiddelen in België. Health Services Research (HSR) (KCE Reports No. 199A, .K ed. Brussel: Federaal Kenniscentrum voor de Gezondheidszorg (KCE).
Light, D., & Lexchin, J. 2012. Pharmaceutical research and development: What do we get for all that money? British Medical Journal, 344: e4348.
Light, D. W., & Warburton, R. 2005a. Extraordinary claims require extraordinary evidence: comment. Journal of Health Economics, 24: 1030-1033.
Light, D. W., & Warburton, R. 2005b. Setting the record straight in reply by DiMasi, Hansen and Grabowski. Journal of Health Economics, 24: 1045-1048.
Mattison, N. 2013. The challenges and economics of drug development in 2022, Proceedings of the Office of Health Economics 50th Anniversary
Conference 8 October 2012. London: Office of Health Economics.
78
Mestre-Ferrandiz, J., Towse, A., Dellamano, R., & Pistollato, M. 2015. Multi-indication Pricing: Pros, Cons and Applicability to the UK, Office of Health Economics
Research Seminar Briefing 56. London: Office of Health Economics. Murphy, K., Packer, C., Stevens, A., & Simpson, S. 2007. Effective early warning systems
for new and emerging health technologies: developing an evaluation framework and an assessment of current systems. International Journal of Technology
Assessment in Health Care, 23: 324-330. Naci, H., Carter, A. W., & Mossialos, E. 2015. Why the drug development pipeline is not
delivering better medicines. British Medical Journal, 351(ISSN 1756-1833). Naldini, L. 2015. Gene therapy returns to centre stage. Nature, 526(15 October): 351-
360. Neumann, P. J., Bliss, S. K., & Chambers, J. D. 2012. Therapies for advanced cancers pose
a special challenge for Health Technology Assessment organizations in many countries. Health Affairs, 31(4): 700-708.
Neyt, M., Christiaens, T., Demotes, J., & Hulstaert, F. 2015. Publicly funded practice-oriented clinical trials, KCE Report 246Cs. Brussels: Belgian Health Care Knowledge Centre.
Paddock, S., Brum, L., Sorrow, K., Thomas, S., Spence, S., Maulbecker-Armstrong, C., Goodman, C., Peake, M., McVie, G., Geipel, G., & Li, R. 2015. PACE Continuous Innovation Indicators—a novel tool to measure progress in cancer treatments. Ecancermedicalscience, 9(498): doi: 10.3332/ecancer.2015.3498.
Pammolli. 2011. The productivity crisis in pharmaceutical R&D. Nature Reviews Drug Discovery.
Paul, S. M., Mytelka, D. S., Dunwiddie, C. T., Persinger, C. C., Munos, B. H., Lindborg, S. R., & Schacht, A. L. 2010. How to improve R&D productivity: The pharmaceutical industry’s grand challenge. Nature Reviews Drug Discovery, Advance Online Publication.
Pearson, S. D., & Bach, P. B. 2010. How Medicare Could Use Comparative Effectiveness Research In Deciding On New Coverage And Reimbursement. Health Affairs, 29(10): 1796-1804.
Pearson, S. D., Dreitlein, B., & Henshall, C. 2016. Indication-specific pricing of pharmaceuticals in the United Staes health care system: A report from the December 2015 ICER Membership Policy Summit: Institute for Clinical and Economic Review.
Pham, B., Tu, H. A. T., Han, D., Pechlivanoglou, P., Miller, F., Rac, V., Chin, W., Tricco, A. C., Paulden, M., Bielecki, J., & Krahn, M. 2014. Early economic evaluation of emerging health technologies: protocol of a systematic review. Systematic
Reviews, 3(81). Pistollato, M. 2015. Incorporating life-cycle price modelling into pharmaceutical cost-
effectiveness evaluations, Research Paper 15/02. London: Office of Health Economics.
Réjon-Parrilla, J. C., Hernandez-Villafuerte, K., Shah, K., Mestre-Ferrandiz, J., Garrison, L., & Towse, A. 2014. The expanding value footprint of oncology treatments. London: Office of Health Economics.
Rémuzat, C., Urbinati, D., Mzoughi, O., El Hammi, E., Belgaied, W., & Toumi, M. 2015. Overview of external reference pricing systems in Europe. Journal of Market
Access & Health Policy, 3: 27675. Schneider, J. E., Sidhu, M. K., Doucet, C., Kiss, N., Ohsfeldt, R. L., & Chalfin, D. 2012.
Economics of cancer biomarkers. Personalized Medicine, 9(8): 829-837. Schnipper, L. E., Davidson, N. E., Wollins, D. S., Tyne, C., Blayney, D. W., Blum, D.,
Dicker, A. P., Ganz, P. A., Hoverman, J. R., Langdon, R., Lyman, G. H., Meropol,
79
N. J., Mulvey, T., Newcomer, L., Peppercorn, J., Polite, B., Raghavan, D., Rossi, G., Saltz, L., Schrag, D., Smith, T. J., Yu, P. P., Hudis, C. A., & Schilsky, R. L. 2015. American Society of Clinical Oncology Statement: A Conceptual Framework to Assess the Value of Cancer Treatment Options. Journal of Clinical
Oncology(JCO.2015.61.6706). Seabury, S. A., Goldman, D. P., Maclean, J. R., Penrod, J. R., & Lakdawalla, D. N. 2012.
Patients value metastatic cancer therapy more highly than is typically shown through traditional estimates. Health Affairs, 31(4): 691-699.
Shepherd, J. 2016. The prescription for rising drug prices: Competition or price controls?, Legal Studies Research Paper Series. Resarch Paper No 16-403: Emory Law.
Sullivan, R., Peppercorn, J., Sikora, K., Zalcberg, J., Meropol, N. J., Amir, E., Boyle, P., Autier, P., Tannock, I., Fojo, T., Siderov, J., & ... 2011. Delivering affordable cancer care in high-income countries. The Lancet Oncology Commission, 12(September/October): 933-.
Swain, S. M., Baselga, J., Kim, S.-B., Ro, J., Semiglazov, V., Campone, M., Ciruelos, E., Ferrero, J.-M., Schneeweiss, A., Heeson, S., Clark, E., Ross, G., Benyunes, M. C., & Cortés, J. 2015. Pertuzumab, Trastuzumab, and Docetaxel in HER2-Positive Metastatic Breast Cancer. New England Journal of Medicine, 372(8): 724-734.
Swain, S. M., Kim, S.-B., Cortés, J., Semiglazov, V., Campone, M., Ciruelos, E., Ferrero, J.-M., Schneeweiss, A., Knott, A., Clark, E., Ross, G., Benyunes, M. C., & Baselga, J. 2013. Pertuzumab, trastuzumab, and docetaxel for HER2-positive metastatic breast cancer (CLEOPATRA study): Overall survival results from a randomised, double-blind placebo-controlled, phase 3 study Lancet Oncology, 14(6): 461-471.
Towse, A., & Barnsley, P. 2013. Approaches to identifying, measuring, and aggregating elements of value. International Journal of Technology Assessment in Health
Care, 29(4): 360-364. Ubel, P., Hirth, R. A., & Chernew, M. E. 2003. What is the price of life and why doesn't it
increase at the rate of inflation? Archives of Internal Medicine, 163(14): 1637-1641.
Van Den Bulcke, M., San Miguel, L., Salgado, R., De Quecker, E., De Schutter, H., Waeytens, A., Van den Berghe, P., Tejpar, s., Van Houdt, J., Van Laere, S., Maes, B., & Hulstaert, F. 2015. Next generation sequencing gene panels for targeted therapy in oncology and haemato-oncology, KCE Report 240 - Health
Technology Assessment. Brussels: Belgian Health Care Knowledge Center. Van Dyck, W., Gassull, D., Vértes, G., Jain, P., Palaniappan, M., Tambuyzer, E., Hudson,
R., & Moran, N. 2012. Unlocking the value of personalised healthcare in Europe - breast cancer stratification. Health Policy and Technology, 1(2): 63-68.
Van Dyck, W., & Geldof, T. 2015. The Oncology horizon scanning project:, Vlerick HMC
Report 2015-1. Brussels: Vlerick Health Care Management Centre. Wang-Lopez, Q., Chalabi, N., Abrial, C., Radosevic-Robin, N., Durando, X., Mouret-
Reynier, M. A., Benmammar, K. E., Kullab, S., Bahadoor, M., Chollet, P., Penault-Llorca, F., & Nabholtz, J. M. 2015. Can pathologic complete response (pCR) be used as a surrogate marker of survival after neoadjuvant therapy for breast cancer? . Crit Rev Oncol Hematol., 95(1): :88-104.
Weiss, W. 1997. Cigarette smoking and lung cancer trends. A light at the end of the tunnel? . Chest., 111(5): 1414-1416.
Xoxi, E., Tomino, C., de Nigro, L., & Pani, L. 2012. The Italian post-marketing registries. Pharmaceutical Programming, 5(1&2): 57-60.
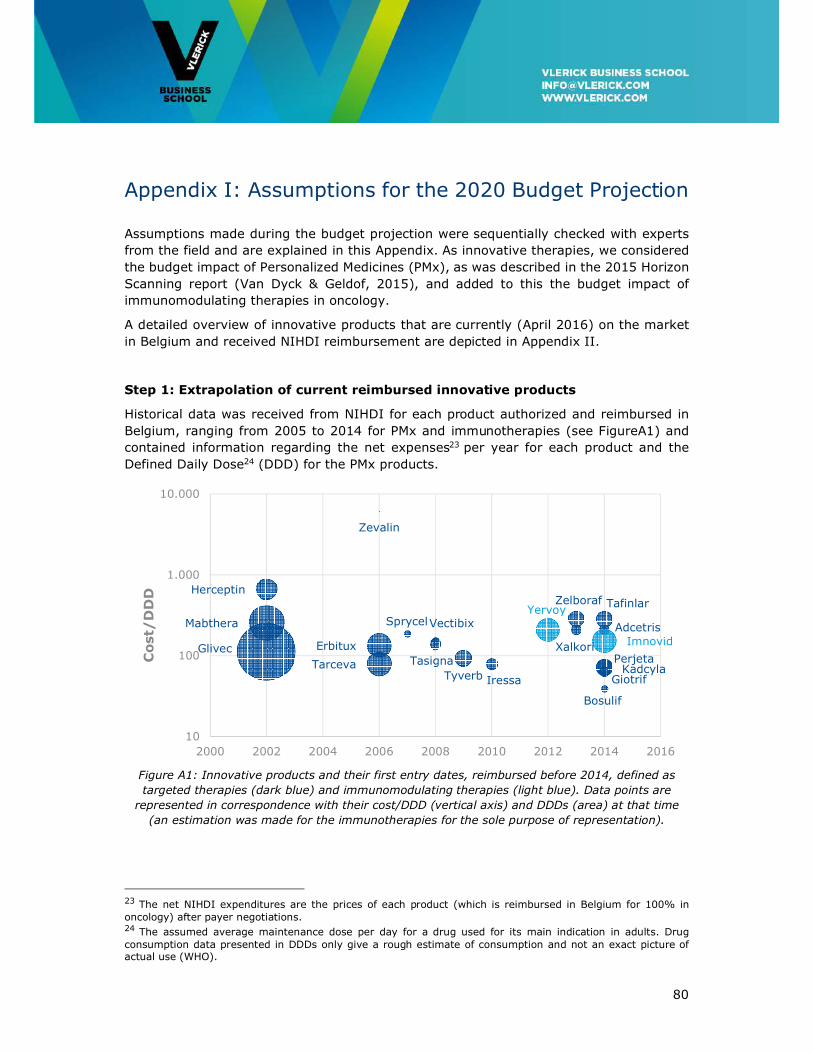
80
Appendix I: Assumptions for the 2020 Budget Projection
Assumptions made during the budget projection were sequentially checked with experts
from the field and are explained in this Appendix. As innovative therapies, we considered
the budget impact of Personalized Medicines (PMx), as was described in the 2015 Horizon
Scanning report (Van Dyck & Geldof, 2015), and added to this the budget impact of
immunomodulating therapies in oncology.
A detailed overview of innovative products that are currently (April 2016) on the market
in Belgium and received NIHDI reimbursement are depicted in Appendix II.
Step 1: Extrapolation of current reimbursed innovative products
Historical data was received from NIHDI for each product authorized and reimbursed in
Belgium, ranging from 2005 to 2014 for PMx and immunotherapies (see FigureA1) and
contained information regarding the net expenses23 per year for each product and the
Defined Daily Dose24 (DDD) for the PMx products.
Figure A1: Innovative products and their first entry dates, reimbursed before 2014, defined as
targeted therapies (dark blue) and immunomodulating therapies (light blue). Data points are
represented in correspondence with their cost/DDD (vertical axis) and DDDs (area) at that time
(an estimation was made for the immunotherapies for the sole purpose of representation).
23 The net NIHDI expenditures are the prices of each product (which is reimbursed in Belgium for 100% in oncology) after payer negotiations. 24 The assumed average maintenance dose per day for a drug used for its main indication in adults. Drug consumption data presented in DDDs only give a rough estimate of consumption and not an exact picture of actual use (WHO).
Herceptin
Glivec
Mabthera
Zevalin
Erbitux
Tarceva
Sprycel
Tasigna
Vectibix
Tyverb Iressa
Zelboraf
XalkoriPerjeta
Bosulif
Tafinlar
GiotrifKadcyla
Adcetris
Yervoy
Imnovid
10
100
1.000
10.000
2000 2002 2004 2006 2008 2010 2012 2014 2016
Cost/
DD
D
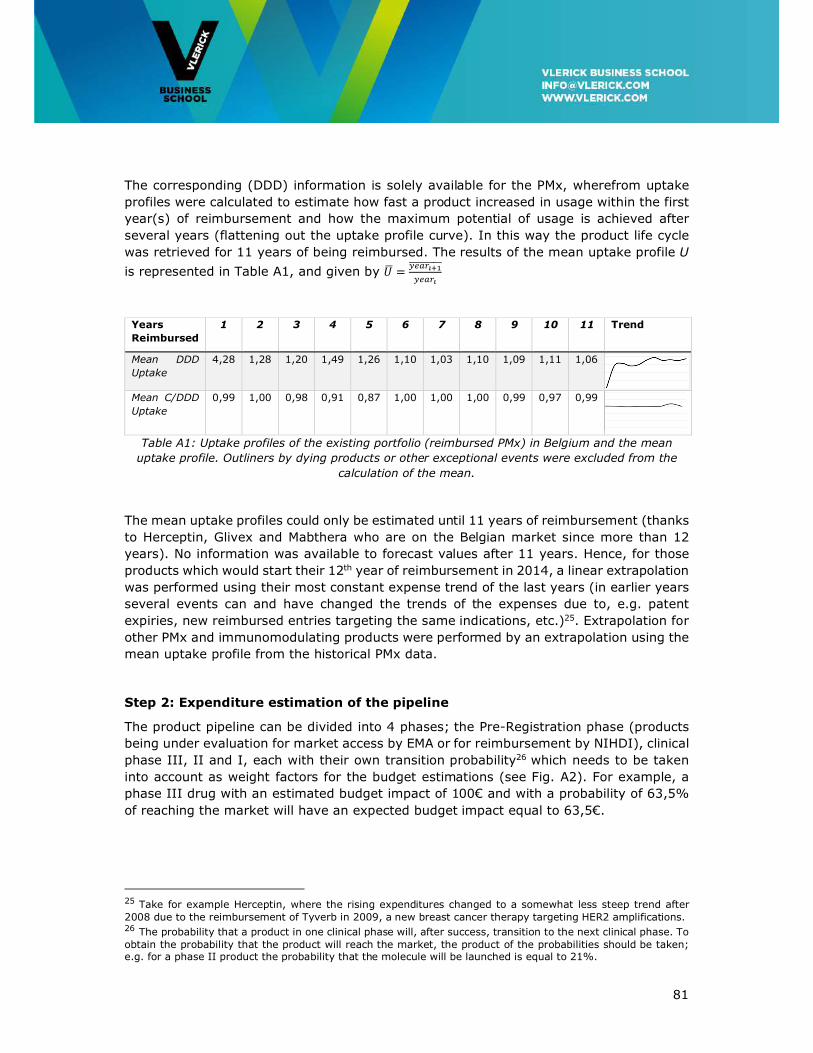
81
The corresponding (DDD) information is solely available for the PMx, wherefrom uptake
profiles were calculated to estimate how fast a product increased in usage within the first
year(s) of reimbursement and how the maximum potential of usage is achieved after
several years (flattening out the uptake profile curve). In this way the product life cycle
was retrieved for 11 years of being reimbursed. The results of the mean uptake profile U
is represented in Table A1, and given by � �� ������ ����������
Years
Reimbursed
1 2 3 4 5 6 7 8 9 10 11 Trend
Mean DDD
Uptake
4,28 1,28 1,20 1,49 1,26 1,10 1,03 1,10 1,09 1,11 1,06
Mean C/DDD
Uptake
0,99 1,00 0,98 0,91 0,87 1,00 1,00 1,00 0,99 0,97 0,99
Table A1: Uptake profiles of the existing portfolio (reimbursed PMx) in Belgium and the mean
uptake profile. Outliners by dying products or other exceptional events were excluded from the
calculation of the mean.
The mean uptake profiles could only be estimated until 11 years of reimbursement (thanks
to Herceptin, Glivex and Mabthera who are on the Belgian market since more than 12
years). No information was available to forecast values after 11 years. Hence, for those
products which would start their 12th year of reimbursement in 2014, a linear extrapolation
was performed using their most constant expense trend of the last years (in earlier years
several events can and have changed the trends of the expenses due to, e.g. patent
expiries, new reimbursed entries targeting the same indications, etc.)25. Extrapolation for
other PMx and immunomodulating products were performed by an extrapolation using the
mean uptake profile from the historical PMx data.
Step 2: Expenditure estimation of the pipeline
The product pipeline can be divided into 4 phases; the Pre-Registration phase (products
being under evaluation for market access by EMA or for reimbursement by NIHDI), clinical
phase III, II and I, each with their own transition probability26 which needs to be taken
into account as weight factors for the budget estimations (see Fig. A2). For example, a
phase III drug with an estimated budget impact of 100€ and with a probability of 63,5%
of reaching the market will have an expected budget impact equal to 63,5€.
25 Take for example Herceptin, where the rising expenditures changed to a somewhat less steep trend after 2008 due to the reimbursement of Tyverb in 2009, a new breast cancer therapy targeting HER2 amplifications. 26 The probability that a product in one clinical phase will, after success, transition to the next clinical phase. To obtain the probability that the product will reach the market, the product of the probabilities should be taken; e.g. for a phase II product the probability that the molecule will be launched is equal to 21%.
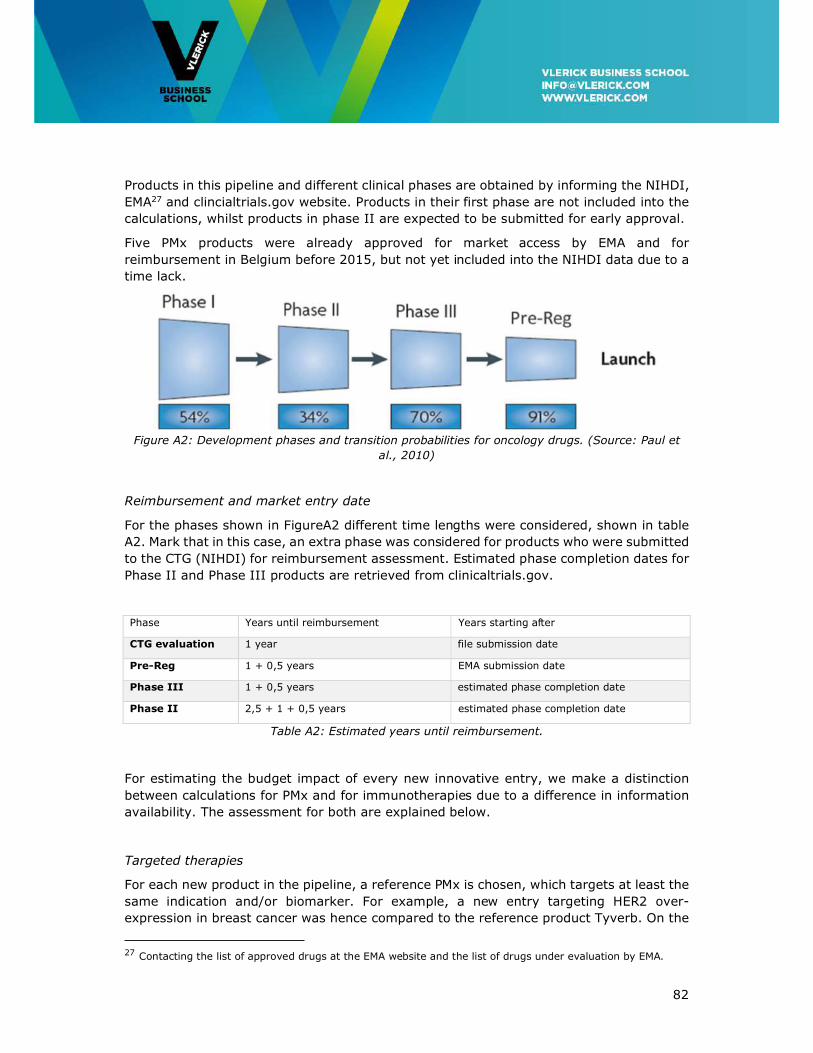
82
Products in this pipeline and different clinical phases are obtained by informing the NIHDI,
EMA27 and clincialtrials.gov website. Products in their first phase are not included into the
calculations, whilst products in phase II are expected to be submitted for early approval.
Five PMx products were already approved for market access by EMA and for
reimbursement in Belgium before 2015, but not yet included into the NIHDI data due to a
time lack.
Figure A2: Development phases and transition probabilities for oncology drugs. (Source: Paul et
al., 2010)
Reimbursement and market entry date
For the phases shown in FigureA2 different time lengths were considered, shown in table
A2. Mark that in this case, an extra phase was considered for products who were submitted
to the CTG (NIHDI) for reimbursement assessment. Estimated phase completion dates for
Phase II and Phase III products are retrieved from clinicaltrials.gov.
Phase Years until reimbursement Years starting after
CTG evaluation 1 year file submission date
Pre-Reg 1 + 0,5 years EMA submission date
Phase III 1 + 0,5 years estimated phase completion date
Phase II 2,5 + 1 + 0,5 years estimated phase completion date
Table A2: Estimated years until reimbursement.
For estimating the budget impact of every new innovative entry, we make a distinction
between calculations for PMx and for immunotherapies due to a difference in information
availability. The assessment for both are explained below.
Targeted therapies
For each new product in the pipeline, a reference PMx is chosen, which targets at least the
same indication and/or biomarker. For example, a new entry targeting HER2 over-
expression in breast cancer was hence compared to the reference product Tyverb. On the
27 Contacting the list of approved drugs at the EMA website and the list of drugs under evaluation by EMA.
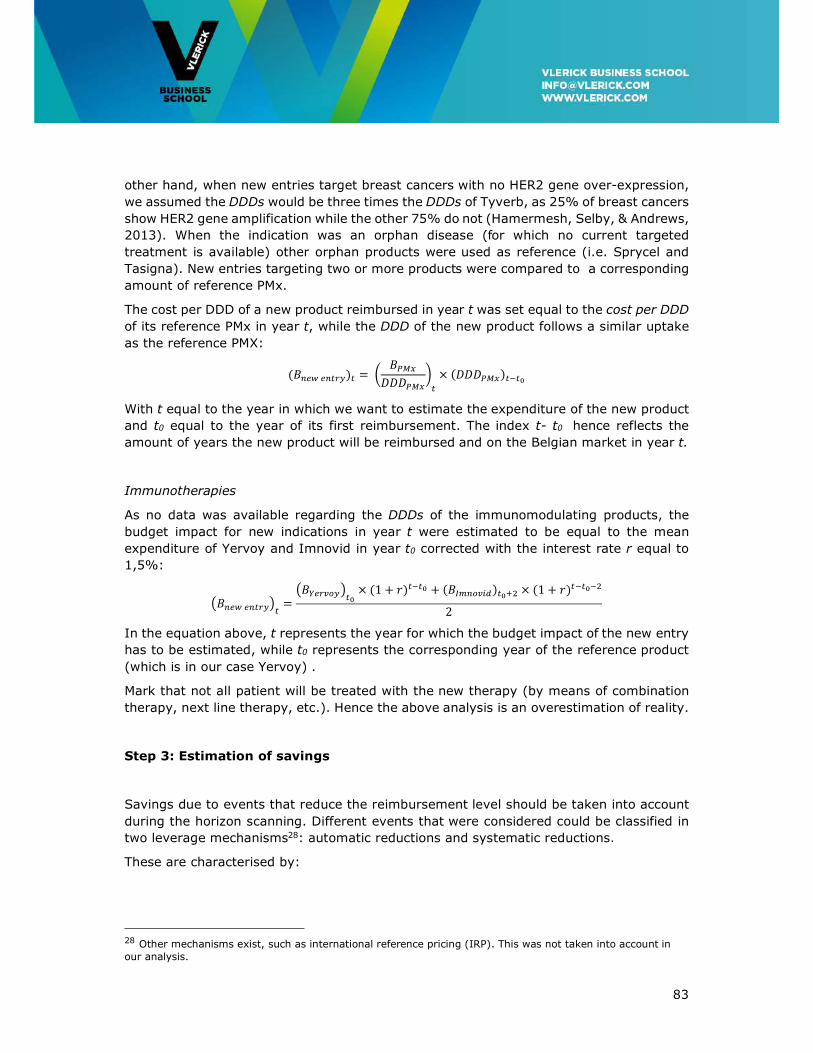
83
other hand, when new entries target breast cancers with no HER2 gene over-expression,
we assumed the DDDs would be three times the DDDs of Tyverb, as 25% of breast cancers
show HER2 gene amplification while the other 75% do not (Hamermesh, Selby, & Andrews,
2013). When the indication was an orphan disease (for which no current targeted
treatment is available) other orphan products were used as reference (i.e. Sprycel and
Tasigna). New entries targeting two or more products were compared to a corresponding
amount of reference PMx.
The cost per DDD of a new product reimbursed in year t was set equal to the cost per DDD
of its reference PMx in year t, while the DDD of the new product follows a similar uptake
as the reference PMX:
(���������)� � ������������
× (������)�!�"
With t equal to the year in which we want to estimate the expenditure of the new product
and t0 equal to the year of its first reimbursement. The index t- t0 hence reflects the
amount of years the new product will be reimbursed and on the Belgian market in year t.
Immunotherapies
As no data was available regarding the DDDs of the immunomodulating products, the
budget impact for new indications in year t were estimated to be equal to the mean
expenditure of Yervoy and Imnovid in year t0 corrected with the interest rate r equal to
1,5%:
#���������$� #�%��&'�$�" × (1 + *)
�!�" + (�+,�'&-.)�"/0 × (1 + *)�!�"!02
In the equation above, t represents the year for which the budget impact of the new entry
has to be estimated, while t0 represents the corresponding year of the reference product
(which is in our case Yervoy) .
Mark that not all patient will be treated with the new therapy (by means of combination
therapy, next line therapy, etc.). Hence the above analysis is an overestimation of reality.
Step 3: Estimation of savings
Savings due to events that reduce the reimbursement level should be taken into account
during the horizon scanning. Different events that were considered could be classified in
two leverage mechanisms28: automatic reductions and systematic reductions.
These are characterised by:
28 Other mechanisms exist, such as international reference pricing (IRP). This was not taken into account in our analysis.
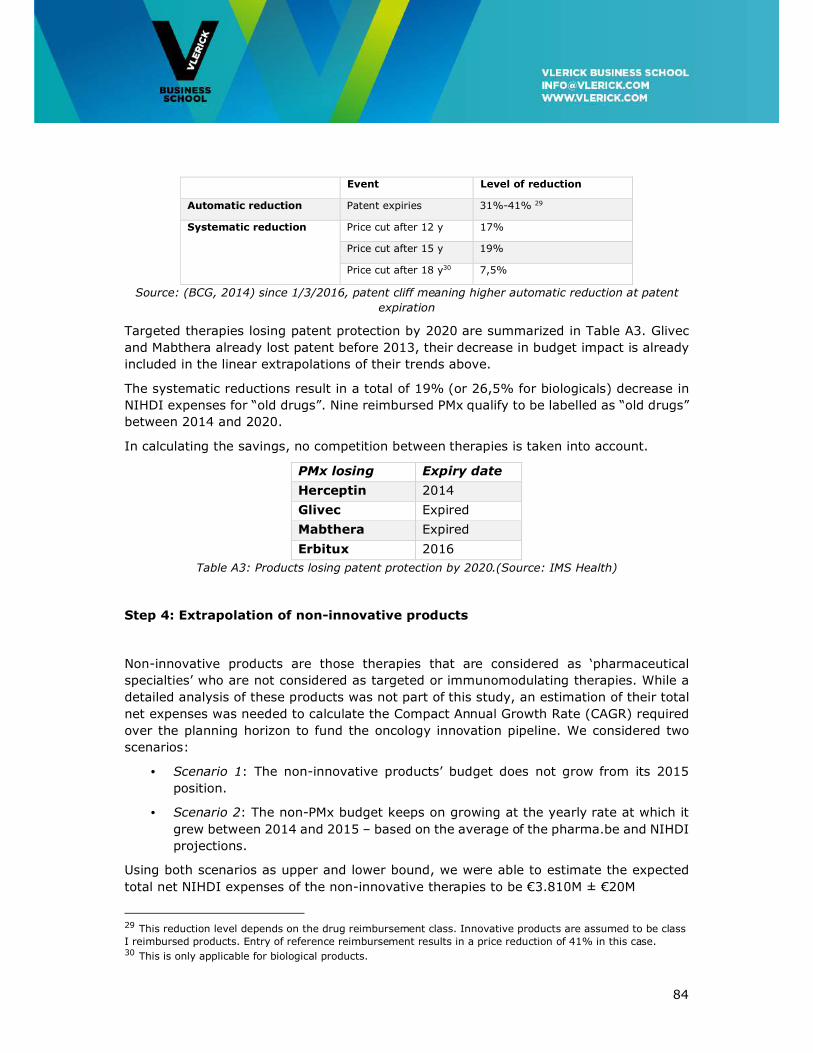
84
Event Level of reduction
Automatic reduction Patent expiries 31%-41% 29
Systematic reduction Price cut after 12 y 17%
Price cut after 15 y 19%
Price cut after 18 y30 7,5%
Source: (BCG, 2014) since 1/3/2016, patent cliff meaning higher automatic reduction at patent
expiration
Targeted therapies losing patent protection by 2020 are summarized in Table A3. Glivec
and Mabthera already lost patent before 2013, their decrease in budget impact is already
included in the linear extrapolations of their trends above.
The systematic reductions result in a total of 19% (or 26,5% for biologicals) decrease in
NIHDI expenses for “old drugs”. Nine reimbursed PMx qualify to be labelled as “old drugs”
between 2014 and 2020.
In calculating the savings, no competition between therapies is taken into account.
PMx losing
patent
Expiry date
(EU) Herceptin 2014
Glivec Expired
Mabthera Expired
Erbitux 2016
Table A3: Products losing patent protection by 2020.(Source: IMS Health)
Step 4: Extrapolation of non-innovative products
Non-innovative products are those therapies that are considered as ‘pharmaceutical
specialties’ who are not considered as targeted or immunomodulating therapies. While a
detailed analysis of these products was not part of this study, an estimation of their total
net expenses was needed to calculate the Compact Annual Growth Rate (CAGR) required
over the planning horizon to fund the oncology innovation pipeline. We considered two
scenarios:
• Scenario 1: The non-innovative products’ budget does not grow from its 2015
position.
• Scenario 2: The non-PMx budget keeps on growing at the yearly rate at which it
grew between 2014 and 2015 – based on the average of the pharma.be and NIHDI
projections.
Using both scenarios as upper and lower bound, we were able to estimate the expected
total net NIHDI expenses of the non-innovative therapies to be €3.810M ± €20M
29 This reduction level depends on the drug reimbursement class. Innovative products are assumed to be class I reimbursed products. Entry of reference reimbursement results in a price reduction of 41% in this case. 30 This is only applicable for biological products.
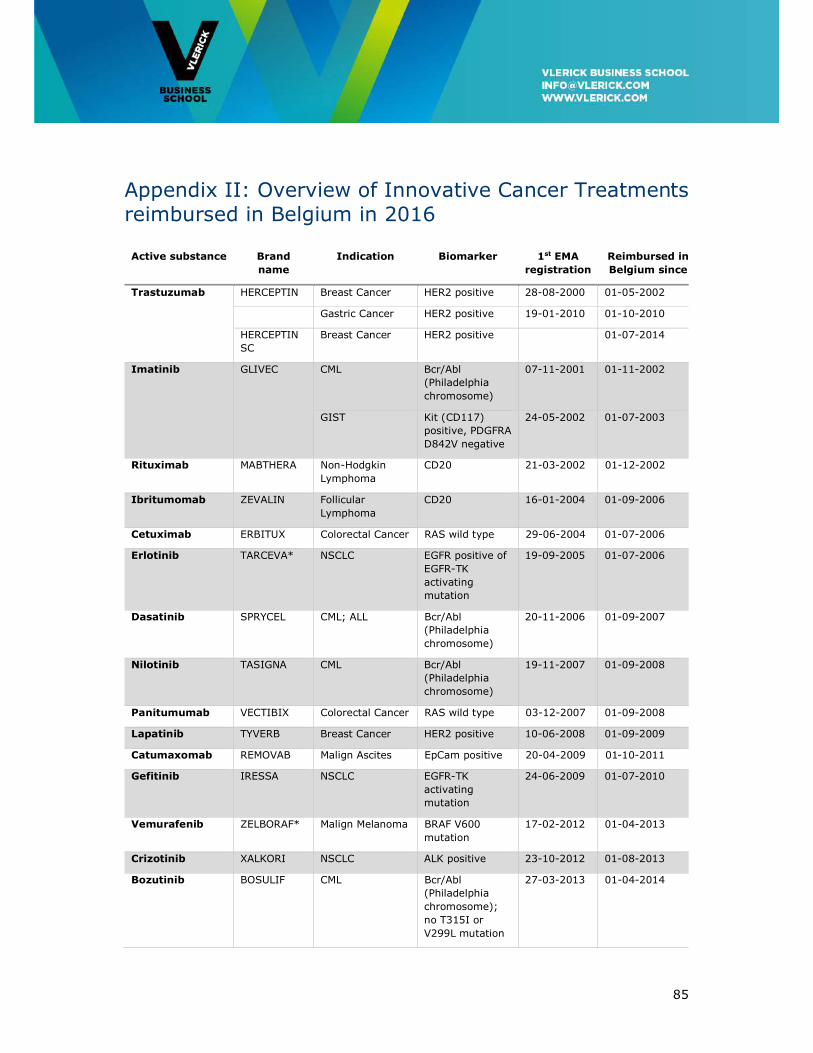
85
Appendix II: Overview of Innovative Cancer Treatments reimbursed in Belgium in 2016
Active substance Brand
name
Indication Biomarker 1st EMA
registration
Reimbursed in
Belgium since
Trastuzumab HERCEPTIN Breast Cancer HER2 positive 28-08-2000 01-05-2002
Gastric Cancer HER2 positive 19-01-2010 01-10-2010
HERCEPTIN
SC
Breast Cancer HER2 positive 01-07-2014
Imatinib GLIVEC CML Bcr/Abl
(Philadelphia
chromosome)
07-11-2001 01-11-2002
GIST Kit (CD117)
positive, PDGFRA
D842V negative
24-05-2002 01-07-2003
Rituximab MABTHERA Non-Hodgkin
Lymphoma
CD20 21-03-2002 01-12-2002
Ibritumomab ZEVALIN Follicular
Lymphoma
CD20 16-01-2004 01-09-2006
Cetuximab ERBITUX Colorectal Cancer RAS wild type 29-06-2004 01-07-2006
Erlotinib TARCEVA* NSCLC EGFR positive of
EGFR-TK
activating
mutation
19-09-2005 01-07-2006
Dasatinib SPRYCEL CML; ALL Bcr/Abl
(Philadelphia
chromosome)
20-11-2006 01-09-2007
Nilotinib TASIGNA CML Bcr/Abl
(Philadelphia
chromosome)
19-11-2007 01-09-2008
Panitumumab VECTIBIX Colorectal Cancer RAS wild type 03-12-2007 01-09-2008
Lapatinib TYVERB Breast Cancer HER2 positive 10-06-2008 01-09-2009
Catumaxomab REMOVAB Malign Ascites EpCam positive 20-04-2009 01-10-2011
Gefitinib IRESSA NSCLC EGFR-TK
activating
mutation
24-06-2009 01-07-2010
Vemurafenib ZELBORAF* Malign Melanoma BRAF V600
mutation
17-02-2012 01-04-2013
Crizotinib XALKORI NSCLC ALK positive 23-10-2012 01-08-2013
Bozutinib BOSULIF CML Bcr/Abl
(Philadelphia
chromosome);
no T315I or
V299L mutation
27-03-2013 01-04-2014
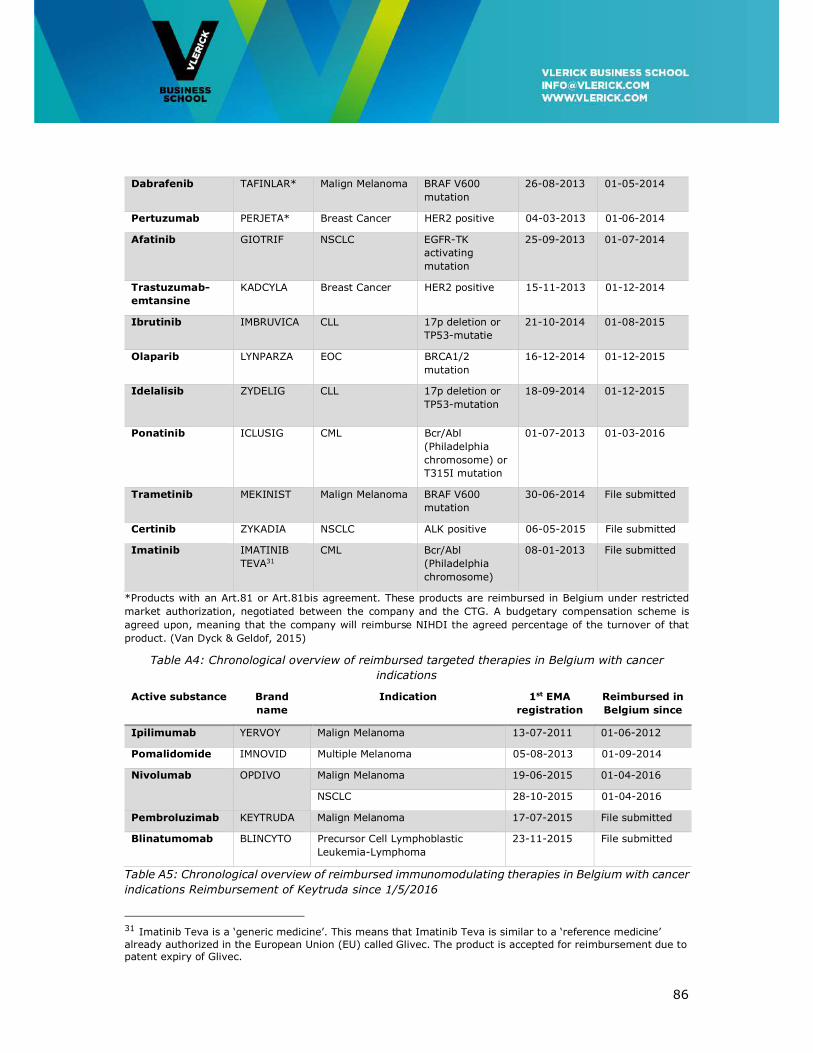
86
Dabrafenib TAFINLAR* Malign Melanoma BRAF V600
mutation
26-08-2013 01-05-2014
Pertuzumab PERJETA* Breast Cancer HER2 positive 04-03-2013 01-06-2014
Afatinib GIOTRIF NSCLC EGFR-TK
activating
mutation
25-09-2013 01-07-2014
Trastuzumab-
emtansine
KADCYLA Breast Cancer HER2 positive 15-11-2013 01-12-2014
Ibrutinib IMBRUVICA CLL 17p deletion or
TP53-mutatie
21-10-2014 01-08-2015
Olaparib LYNPARZA EOC BRCA1/2
mutation
16-12-2014 01-12-2015
Idelalisib ZYDELIG CLL 17p deletion or
TP53-mutation
18-09-2014 01-12-2015
Ponatinib ICLUSIG CML Bcr/Abl
(Philadelphia
chromosome) or
T315I mutation
01-07-2013 01-03-2016
Trametinib MEKINIST Malign Melanoma BRAF V600
mutation
30-06-2014 File submitted
Certinib ZYKADIA NSCLC ALK positive 06-05-2015 File submitted
Imatinib IMATINIB
TEVA31
CML Bcr/Abl
(Philadelphia
chromosome)
08-01-2013 File submitted
*Products with an Art.81 or Art.81bis agreement. These products are reimbursed in Belgium under restricted
market authorization, negotiated between the company and the CTG. A budgetary compensation scheme is
agreed upon, meaning that the company will reimburse NIHDI the agreed percentage of the turnover of that
product. (Van Dyck & Geldof, 2015)
Table A4: Chronological overview of reimbursed targeted therapies in Belgium with cancer
indications
Active substance Brand
name
Indication 1st EMA
registration
Reimbursed in
Belgium since
Ipilimumab YERVOY Malign Melanoma 13-07-2011 01-06-2012
Pomalidomide IMNOVID Multiple Melanoma 05-08-2013 01-09-2014
Nivolumab OPDIVO Malign Melanoma 19-06-2015 01-04-2016
NSCLC 28-10-2015 01-04-2016
Pembroluzimab KEYTRUDA Malign Melanoma 17-07-2015 File submitted
Blinatumomab BLINCYTO Precursor Cell Lymphoblastic
Leukemia-Lymphoma
23-11-2015 File submitted
Table A5: Chronological overview of reimbursed immunomodulating therapies in Belgium with cancer
indications Reimbursement of Keytruda since 1/5/2016
31 Imatinib Teva is a ‘generic medicine’. This means that Imatinib Teva is similar to a ‘reference medicine’ already authorized in the European Union (EU) called Glivec. The product is accepted for reimbursement due to patent expiry of Glivec.