Embed Size (px)
Citation preview

North Atlantic warming, disappearing sea ice and winter cooling
Vladimir A. Alexeev, International Arctic Research Center, UAF
with contributions from V. Ivanov, R. Kwok, I.Ezau,
J.Cohen, J.Furtado, M.Barlow

Like us on Facebook

Geography of IARC schools
Fairbanks, AK
Toolik Lake, AK Barrow, AK McCarthy, AK
Fedorovskoe, Russia Arc�c Ocean Bellingshausen,
Antarc�ca
First summer school, July 2003

Geography of IARC schools
Map with locations of summer schools (red markers) and (incomplete!) locations of origins of attending students (blue markers).

2010: King George Island, Bellingshausen sta�on
in collabora�on with APECS, RAE, RAS, AWI, AARI, IAP

Scope
Focus on the Arc�c (and sub-‐polar regions) Climate system perspec�ve
Depending on loca�on, some�mes more focus on one of the components Students get involved in hands-‐on ac�vi�es
(seeing is believing)

Communications report card, 2013 (Lindsay B)
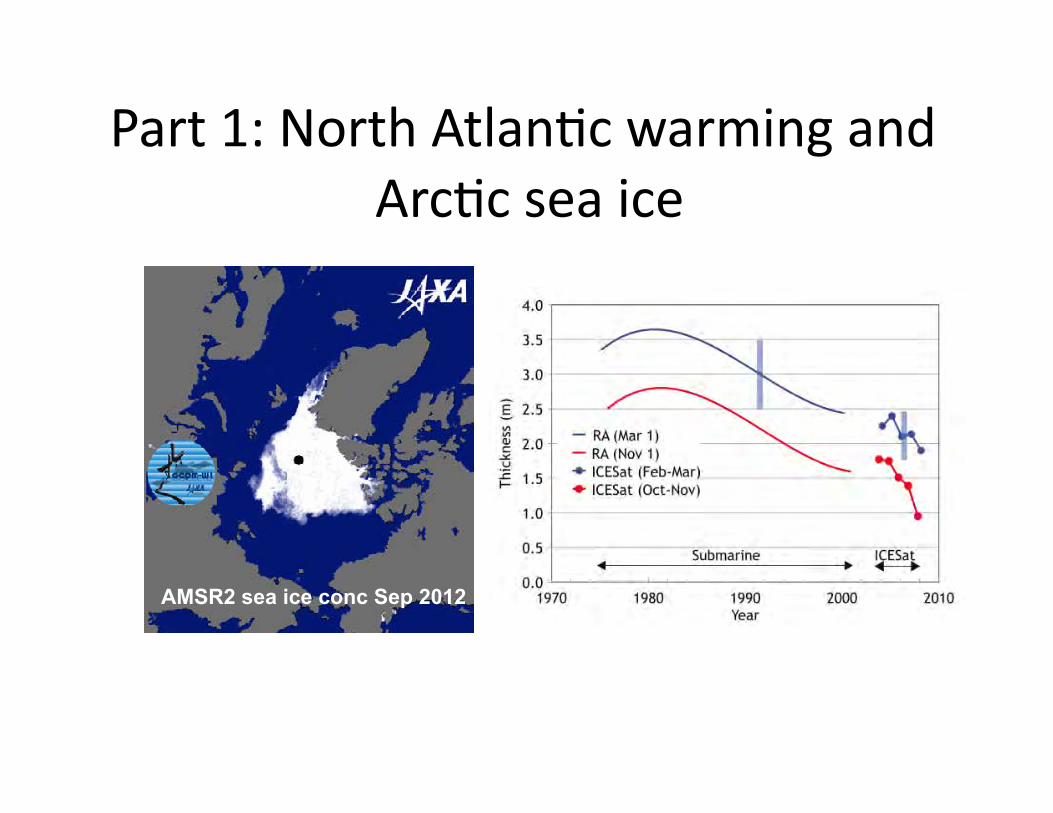
Part 1: North Atlan�c warming and Arc�c sea ice
AMSR2 sea ice conc Sep 2012

Sea ice extent
ocean heat content (delayed freeze up)
Surface-based mechanisms are the most likely contributors to the recent Arctic warming in the summer and fall

Atlantic Water in the Arctic Ocean


Fate of Early 2000s Century Arctic Warm Water Pulse
By I.Polyakov, V.Alexeev, I.Ashik, S. Bacon, A.Beszczynska-Möller, E.Carmack, I.Dmitrenko, L.Fortier, J.-C.Gascard, E.Hansen, J.Hölemann, V.Ivanov, T.Kikuchi, S.Kirillov, Y-D.Lenn, F.A.McLaughlin, J.Piechura, I.Repina, L.Timokhov, W.Walczowski , and R.Woodgate
Bull. Of the Amer Met Soc, 2011

AW significantly contributes to thinning of ice
Polyakov, Timokhov, Alexeev, Ivanov … JPO 2010

Water temperature (ºC) distribution, Laptev Sea, Sep 2013
At cross-slope section along 90ºE)
Thick (up to 50 m) warm surface layer, which almost merges with intermediate Atlantic water layer

http://www.ijis.iarc.uaf.edu
Atlantic Water and arctic sea ice. Winter
Alexeev et al, 2013, submitted
March 2012

Sea ice, February 2, 2014
http://www.ijis.iarc.uaf.edu

North Atlantic SST

Scoresby, W. 1820. An account of the Arctic regions with a history and description of the Northern whale fishery, (PhD Thesis by S.H.Teigen)

2004 2008
Fraction of multi-year ice
1
0
0 100 200 300 400 500
5 4 3 2 1 0 -1 -2
2004 2006 2008
Alexeev et al, 2013
AW temperature. Fram Strait and Svalbard

March-April 2005
March-April 2006
February-March 2008
Winter sea ice thickness. Atlantic sector
Thinning of ice is local Alexeev et al, 2013

Ice thickness and motion vectors, ICESat Ivanov et al, 2012, Alexeev et al 2013
Meridional wind
DLW (contours) snow anomalies Feb-Mar2008
Ice concentration anomaly
0
0.2
0.4
0.6
2004 2005 2006 2007 2008
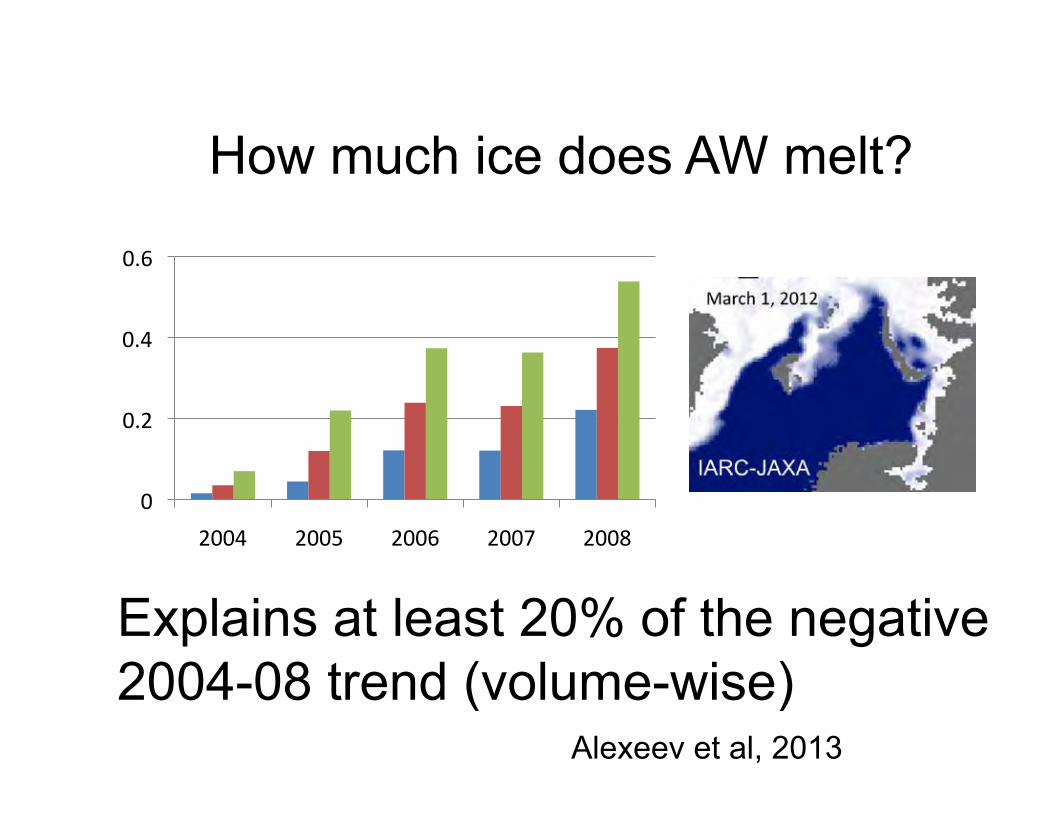
How much ice does AW melt?
Explains at least 20% of the negative 2004-08 trend (volume-wise)
Alexeev et al, 2013
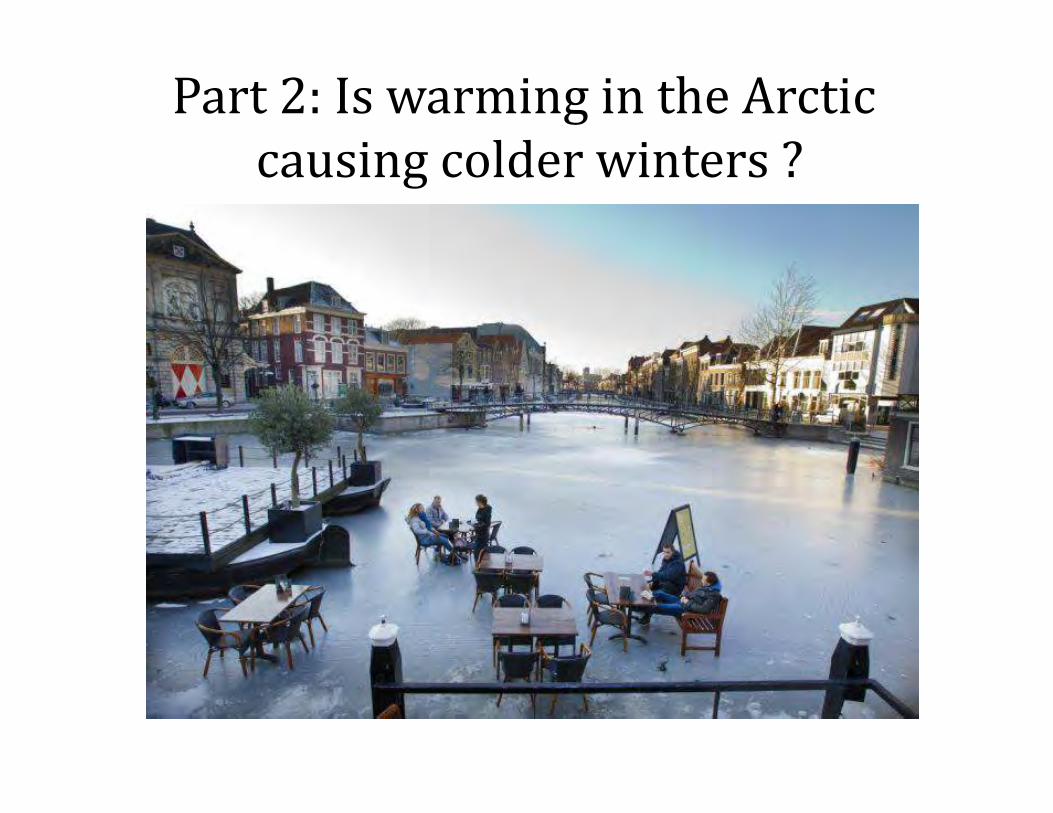
Part 2: Is warming in the Arctic causing colder winters ?
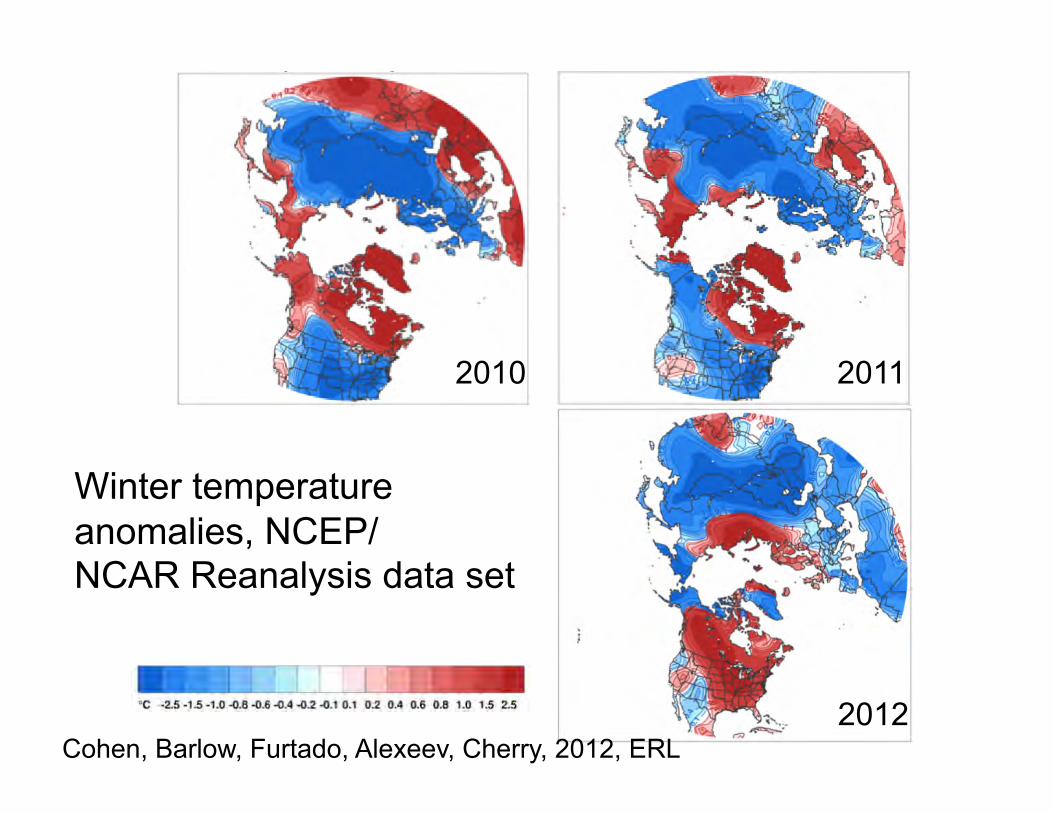
Winter temperature anomalies, NCEP/ NCAR Reanalysis data set
2010 2011
2012 Cohen, Barlow, Furtado, Alexeev, Cherry, 2012, ERL

% %
%%%
% %
%%%
% %
%%%
% %
%%%
DJF Trend = 0.07°C/10 yr
MAM Trend = 0.39°C/10 yr**
JJA Trend = 0.38°C/10 yr**
SON Trend = 0.49°C/10 yr**
1990 1995 2000 2005 2010
Time - [year]
[°C
]
0
1
2
0
1
2
0
1
2
0
1
2
[°C
]
[°C]
[°C]
**p < 0.01
!"#$%&! !"'$%&! !!($%&! !!!$%!! !!($%)! !"'$%)! !"#$% !
!!*$%+!
!!($%+!
!!,$%+!!"#$%&'(&)*+,)&$%)&-.$/0123 45056
##
!"#$%&! !"'$%&! !!($%&! !!!$%!! !!($%)! !"'$%)! !"#$% !
!!*$%+!
!!($%+!
!!,$%+!!"!#$%&'%()*+(%#$(%,-#./012 34/45
##
!"#$%&! !"'$%&! !!($%&! !!!$%!! !!($%)! !"'$%)! !"#$% !
!!*$%+!
!!($%+!
!!,$%+!!!"#$%&'%()*+(%#$(%,-#./012 34/45
##
!"#$%&! !"'$%&! !!($%&! !!!$%!! !!($%)! !"'$%)! !"#$% !
!!*$%+!
!!($%+!
!!,$%+!!"#$%&'(&)*+,)&$%)&-.$/0123 45056
##
!!!!!
!!!
!!
!!
!!
!!!
!!!!!
!!!!!
!!!
!!!
!!!
!!!
$$
$
$ $
0 1-1
[°C per 10 years]
(a) (b)
(c)
(d)
(e)
Northern Hemisphere Land Temperatures 1987-2010
Data: CRU temperature Alexeev et al, 2012, Clim Change; Cohen et al, 2012, ERL

Arctic Trends 1988-2010
2
% %
%%
%
% %
%
#
% %
%%%
6
7
# # # # # #
% %
%%
%
% %
%%
A
B
C
D
E
0
1
-1
[°C
]
0.35
0.45
0.25
[Frac. Area]
12
8
[106 km
2]
7
6
[kg
m-2
]
2
0
-2
[std
]
1990 1995 2000 2005 2010Time - [year]
5
JAS Arctic-MeanTemperature Anomaly
September ArcticSea Ice Coverage
Fall Arctic-Mean Lower Tropospheric Moisture
October EurasianSnow Cover
DJF AO Index
Trend = 0.44°C/10 yr**
Trend = -0.05/10 yr**
Trend = 1.46x10⁶ km2/10 yr**Trend = -0.29x10⁶ km2/10 yr**
Trend = 0.54 kg m-2/10 yr**
Trend = -1.0 std/10 yr** ** p < 0.01
Obs
CMIP5 Ens Mean
Warming Arctic
Less sea ice
More atmospheric moisture
Increasing snow cover
Decreasing Arctic Oscillation trend
Alexeev et al, 2005, Clim Dyn; Cohen et al, 2012, ERL
!"#$%&'$()*+,$-./00 12.23
!"#$%&'(%)*+' ,
!
"
!
Negative Phase of the Arctic Oscillation
[hPa]
!
"
#
$
#
"
!
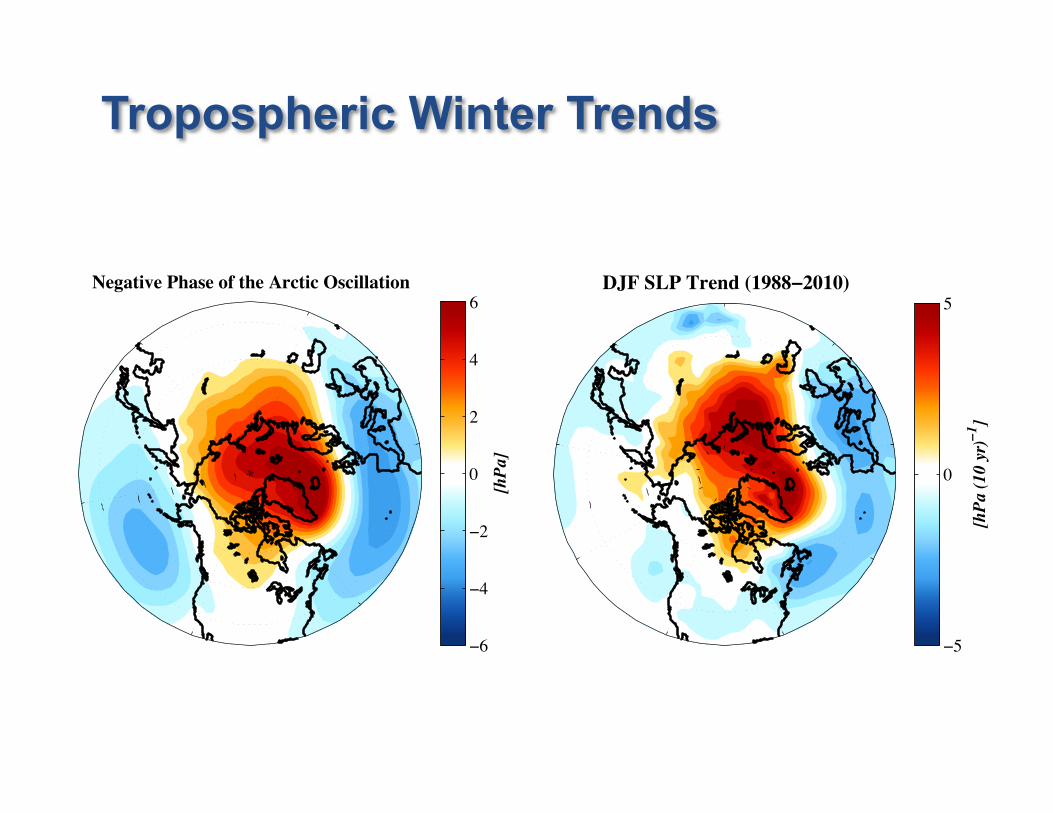
Tropospheric Winter Trends

Trend in SLP and zonal wind at 10m (ERA-Interim)
!"#$%&'$()*+,$-./00 12.23
!"#$%&'(%)*+' ,
!
"
!U 10m

Temp 100mb
Geop hgt 100mb
Changes in the stratosphere
Alexeev, Ezau, Polyakov, Byam, Sorokina, 2012


Barotropic vor�city equa�on
Resonance:
ψs ≈ ψ0 /(U −Us)s ,
Francis, Vavrus, 2013

Z250, Jan2014 -‐ climate
Note: weakening of the gradient (warmer Arctic)

Z500 trend 1988-‐2013

Z500 and T850, January
Climate 2014

ECMWF maps, Feb 2, 2014


Changes in January surface air temperature. The Arctic becomes warmer by up to 40°° C but the latitudinal belt south of 60°°N over land becomes colder by up to 8°°C. Newson 1973;
Nature, 241, 39-40
One of the first UKMO GCM sensitivity experiments with polar ice replaced by water at 0°°C

Description of the Numerical Model
- Upper mixed layer ocean coupled to a full 3D atmospheric GCM
- Seasonal cycle - Albedo feedbacks intentionally omitted
(no snow, ice) - Land points have 10 times lower thermal
inertia than the ocean

Warm Arc�c – Cold Con�nents (‘wet’ con�nents, no albedo feebacks)
‘Reduced’ sea ice – increased heat content before cold season ‘Ghost forcing’ added to Barents and Chukchi seas in summer
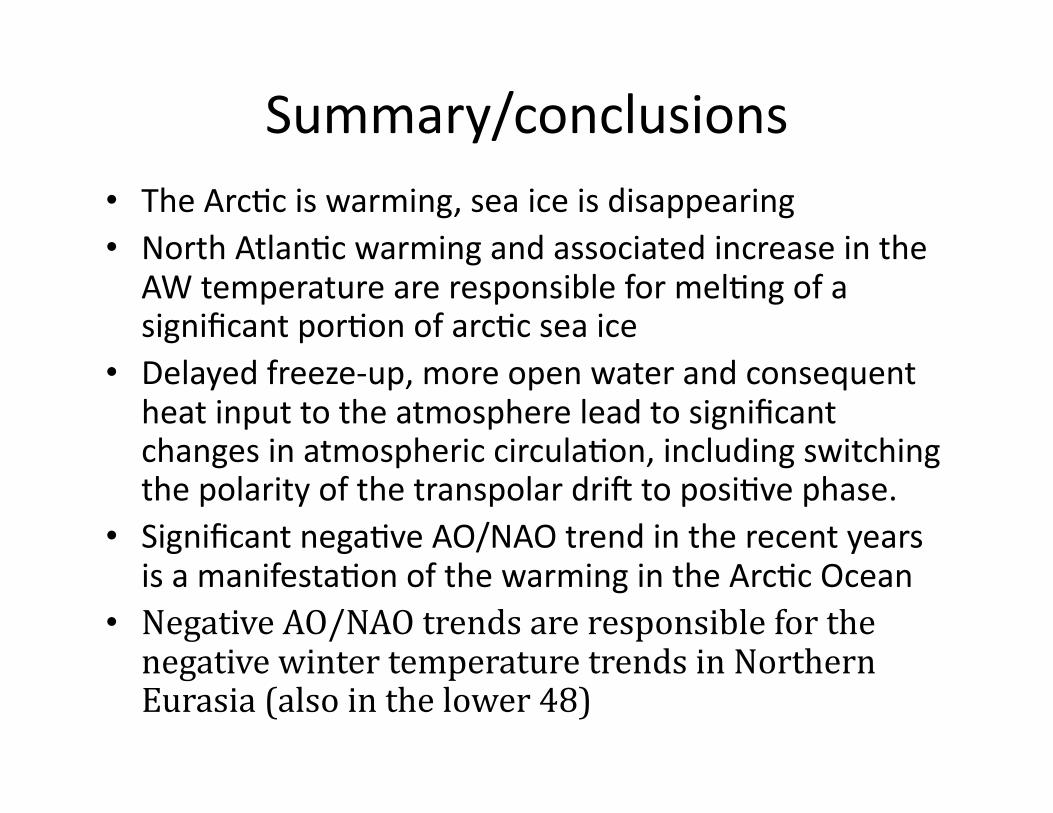
Summary/conclusions The Arc�c is warming, sea ice is disappearing North Atlan�c warming and associated increase in the
AW temperature are responsible for mel�ng of a significant por�on of arc�c sea ice
Delayed freeze-‐up, more open water and consequent heat input to the atmosphere lead to significant changes in atmospheric circula�on, including switching the polarity of the transpolar dri� to posi�ve phase.
Significant nega�ve AO/NAO trend in the recent years is a manifesta�on of the warming in the Arc�c Ocean
Negative AO/NAO trends are responsible for the negative winter temperature trends in Northern Eurasia (also in the lower 48)


![Rule Responder Nccu Taipei Mar2008 Talk [Compatibility Mode]](https://img.pdfslide.us/doc/110x75/544230c3afaf9feb098b4598/rule-responder-nccu-taipei-mar2008-talk-compatibility-mode.jpg)